Exhibit 99.1
PRESENTATION TO
TRIDENT SECURITIES
by
FIRST COMMUNITY BANCSHARES, INC.
September 12, 2003
We appreciate this opportunity to present First Community Bancshares, Inc. to Trident Securities, Inc. I have provided you with a handout today which embodies our PowerPoint presentation. We would like to start today with a company overview.
SLIDE – CAUTIONERY STATEMENT
SLIDE – COMPANY OVERVIEW
First Community Bancshares, Inc. is a $1.7 billion financial services holding company. In addition, it also maintains a trust division with assets under management of approximately $.5 billion at market value. Currently, the Company is focused on three states within the southeast region. This includes the states of Virginia, West Virginia and North Carolina. We consider ourselves a fast growth, high performance company and one in which is intensely focused on achievement of its financial goals. We think this has been an important part of our success over recent years and has resulted in the attainment of goals year in and year out. The Company has been included as a component of the Russell 3000 Index for approximately one and a half years. First Community Bancshares, Inc. is a Nasdaq National Market listed company, having moved from the SmallCap Market in April of 2003. The Company is currently traded under the symbol “FCBC.”
We are very proud that First Community Bancshares, Inc. has been included among the top 100 banks in the nation in three of the last four years. In 2000 and 2001, First Community Bancshares was distinguished as a top 100 bank as recorded by the ABA Banking Journal. Again in 2003, First Community Bancshares achieved a top 100 ranking in the US Banker Top 100 survey with the rank of number 69. Giving consideration to the pending merger of BB&T and First Virginia Banks, First Community Bancshares, Inc. is reported as the largest bank holding company headquartered in the State of Virginia. First Community Bancshares has a long heritage dating back to 1874 with a 129-year history. We currently operate under a one national bank charter with 60 operating locations in Virginia, West Virginia and North Carolina. Ten of those operating locations
are represented by retail mortgage offices operating under the name of United First Mortgage, Inc. with corporate offices in Richmond, Virginia. United First Mortgage also operates a wholesale mortgage division which is focused principally on the northeastern United States, mostly the Boston, Massachusetts area, and in northern Virginia. You have already been introduced to executive management team this morning. I would like to add that represented among executive management is over 100 years of combined management experience with most of that experience in the community banking arena. We would also point out that First Community Bancshares employs 13 area chief executive officers (CEOs) within the banking divisions. Each of these CEOs has local decision making authority and it is this autonomy which we believe sets First Community Bancshares apart from other community banking organizations. The entire First Community Bancshares, Inc. team is grounded in community banking but is supplemented with big bank experience, particularly in the operations and credit services areas.
SLIDE – FCBI FINANCIAL GROUP
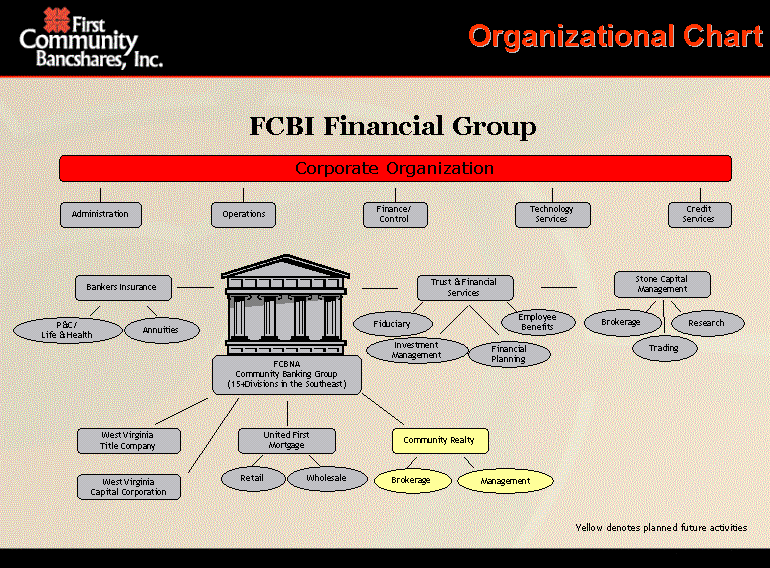
The organizational chart for First Community Bancshares as comprehended within our Strategic Plan looks something like this. The FCBI financial group is led by a strong central corporate organization which provides administration, operations, finance and control, technology services, and credit services to the core community banking group and other financial services divisions of First Community Bancshares, Inc. Pictured in the center of the chart with the large icon is the community banking group which is presently comprised of 13 banking divisions with plans to grow to 15 or more divisions within the southeast within our five-year planning horizon. This core community banking group is supplemented by other business units which provide ancillary financial services including insurance, trust and financial services, wealth management, mortgage title services, and secondary market mortgage services under the name of United First Mortgage, Inc. Pictured in yellow is the community realty icon which represents possible future services. As you probably know, the legislative environment today does not allow for the offering of these services within our financial group, however, we are confident that future developments will allow expansion into this financially related area.
SLIDE – MARKET POSITION
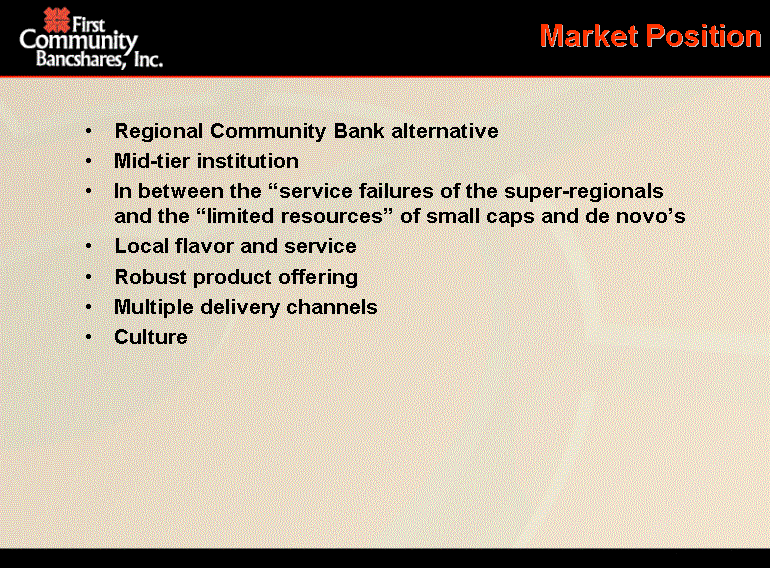
When we talk about the market position for First Community Bancshares, Inc., we see ourselves as a regional community bank alternative. The Company is what we consider a mid-tier institution and is positioned in between the service failures of the super
regionals and the limited resources of small caps and de novos. We think this places the Company in a unique position to garner new business from both larger and smaller institutions due to our ability to provide service with local flavor and on a personalized basis. The Company boasts a robust product offering which includes multiple delivery channels and we also operate within a strong corporate culture which is focused on personalized service in a client relationship mode. Our culture also emphasizes the empowerment of people to execute and provide superior customer service. Philosophically, the Company is grounded in community banking and a personalized approach to the delivery of financial services. As I mentioned earlier, we are relationship oriented versus a transactional approach to banking, deposit and credit services. We know that we must provide friendly courteous service and our approach is to do this in the local communities with people you know. We want and need to be the alternative to the big bank 1-800 approach to banking. Again, local decision-making is a very important part of our Company. We employ banking and financial professionals who are able to deliver and make decisions on a local basis which are so important to our client base. We know that people are the source of our success and our human resource approach and compensation systems are designed to emphasize this most important resource of our Company. People throughout the organization are empowered to make the decisions which impact their local operations and are encouraged, indeed compelled to make these local decisions.
SLIDE – DIFFERENTIATING FACTORS
Other differentiating factors for our organization – again, we are a true community banking organization with local authority and decision making and that local decision making extends to loan decisioning, pricing, budget allocations, and human resources, to name but a few. We do maintain a strong but de-emphasized central organization – we have flexible central processing which includes imaged check operations and cd rom statement delivery. We have historically delivered a very desirable efficiency ratio in the 48% to 50% range. Both management and employees in general are focused on our financial goals and we are a leader in margin maintenance. We offer a wide range of services from commercial to retail, punctuated by our strong retail product set includingJust FreeChecking, Internet Banking, Bill Pay, along with our commercial services including on-line Treasury Management.
SLIDE – GROWTH STRATEGY
Moving on to our growth strategy which is embodied within our recently updated Strategic Plan, we expect our growth will be driven by acquisition, the opening of loan production offices and, on a limited basis, some de novo branch operations. We believe that we have strong capabilities in M&A and the profitable assimilation of merger targets. Our five year growth target is set at $4 billion. This comprehends growth of $2.3 billion through the end of the planning horizon at December 31, 2007. Primary growth targets are in Eastern Virginia, Hampton Roads and the Central Piedmont area in North Carolina. Our most recent acquisition was The CommonWealth Bank in Richmond, Virginia. CommonWealth brought us four branches within the Richmond/Metro market and total assets of approximately $150 million. This represents our first major move into Eastern Virginia and that affiliation is off to an excellent start. The transaction was consummated on June 6th and, by July 14th, the data conversion and assimilation of the bank into the organization was complete.
We have also recently opened three new branches in the Winston-Salem area. Actually two of these branches are currently open and a third is under development. These are de novo operations and we have great expectations for this new Winston-Salem market. We understand that this is a well-banked, highly competitive market, but again, we believe that our community bank alternative approach to the market, critical mass and robust product offering with the delivery by local financial professionals will help to ensure our relative success within the Winston-Salem market. Other areas of interest for the Company lie along the I-64 and I-81 corridors in Virginia, as well as the I-77 and I-40 Interstate corridors in North Carolina. Points of interest along these interstate corridors include Charlottesville Virginia, Roanoke, Virginia and the Lake Norman area in North Carolina. These are in addition to our principal areas of interest in Eastern Virginia, Hampton Roads, Winston-Salem, Charlotte and possibly the Raleigh/Durham Research Triangle area in North Carolina. We would like to emphasize that our interest in these areas in Virginia and North Carolina do not suggest that we will ignore our West Virginia legacy markets. These are strong markets which have been very important to us over the years and which we believe will provide the earnings engine to enable us to continue our expansion into Virginia and North Carolina.
SLIDE – GROWTH STRATEGY CONTINUED
Continuing with our growth strategy, we do plan to build and consolidate wealth management and mortgage services through continued acquisitions and consolidation. We will also be expanding insurance services and adding full service investment brokerage services through strategic partnerships and acquisitions. Some specific targets within our growth strategy and our 2007 Strategic Plan include plans to build the North Carolina franchise to approximately $1 billion by the close of 2007. We also plan to build our Eastern Virginia operations to approximately $1.4 billion, and again that is principally along that I-64 corridor from Richmond to Hampton Roads. We will also be considering fill-in acquisitions and growth opportunities within West Virginia and our current Southwest Virginia markets with planned growth to the $1.2 billion range within those regions combined.
SLIDE – FRANCHISE MAP
This next graphic illustrates our projected First Community Bancshares, Inc. franchise through the year 2007. We’ve pictured some of the major cities within the three-state region which we have targeted. Of course, our corporate headquarters are in Bluefield, Virginia and, bringing in the red dots, we illustrate our current First Community Bank branches and our loan production offices. The addition of the yellow triangles illustrate current United First Mortgage retail offices and finally bringing in the green dots we illustrate potential future First Community Bank branch or loan production offices.
SLIDE – M&A DISCIPLINE
I would like to point out that the geographic location of these offices are not precise and these do not represent the exact location of planned future offices but merely illustrate the planned dispersion of our branch and operating network through the year 2007. The number and location of these offices obviously will be dictated by the availability of bank and branch acquisitions and the evaluation of opportunities for the location of loan production offices. I would like to discuss our M&A discipline; I believe that this is something that is important to understand. Currently, we believe that our ideal acquisition is in the $100 million to $300 million range. These are transactions which we feel would be most efficient for our organization. Obviously as we continue to grow, we will move toward the top end of that range and that will be necessary, to some degree, to achieve our growth objectives embodied within our Strategic Plan. We have imposed upon ourselves certain flexible criteria as we evaluate M&A targets. We currently utilize an 11 filter process which incorporates various financial criteria for the identification and evaluation of possible merger candidates. In this process, we seek to limit dilution in any merger transaction to a maximum of 3% in year 1 with maximum projected cost savings
at 20%. In year 2, our expectations are that we would be at or near breakeven based upon our pro forma analysis and, finally in year 3, we would be seeking full recovery of dilution from any merger transaction. Obviously, the appropriate opportunity could cause us to deviate some degree from these dilution criteria.
Our plan is to enhance our financial leverage through cash and stock transactions where possible and we also plan obviously to maintain the Company within the bounds of the well-capitalized levels for regulatory capital purposes. One additional criteria that we look at is the limit of purchase intangibles to 35% to 40% of common equity. We do believe that there is a level at which the market begins to scrutinize the level of intangibles and currently we are focused on the 35% to 40% limit. As we continue in the post-pooling environment, we will evaluate this limit and adjust accordingly as we see the market’s response to the addition of purchase intangibles on balance sheets of financial organizations.
SLIDE �� FINANCIAL OBJECTIVES
Our financial objectives within our Strategic Plan are clear – it is our expectation that we will maintain a Return on Equity at or above 17% and our plan is to grow our Earnings Per Share (EPS) in the 8% to 10% range annually. We do hope to achieve a minimum EPS growth of 7% with the idea that we can grow EPS in the 8% to 10% range. As in the past, we do expect to maintain our overall financial performance in the top 25% of our national peers and, if in fact we are able to achieve our growth objectives outlined within the Strategic Plan, we expect that market capitalization will grow to approximately $875 million. That is, of course, based upon prevailing price multiples for financial institutions. Again, emphasizing our strong efficiency ratio, we expect that this can be maintained in the 48% to 50% range.
SLIDE – KEY FINANCIAL DATA
As John has shared with you, our Company culture is based upon strong and improving financial performance. Beginning with net income, First Community (FCB) improved by 12% during 2001 versus 2000. 2002 was even better, with a 29% improvement in net income, year over year. We are projecting another double-digit (11%) improvement in net income for the current year.
Our diluted earnings per share (EPS) show an 8% improvement in 2001 over 2000, followed by a 29% improvement in 2002. We are projecting an additional 11% increase in EPS for 2003, based upon the annualized June 30 figures.
Also, as John indicated, we pride ourselves in the maintenance of a very strong net interest margin (NIM). Over the 3 1/2 year period ending June 30, 2003, our NIM has
never been less than 4.50% for any reporting period. The most recent quarter shows FCB NIM at 4.54%, which is roughly 50 basis points better than the peer group average.
Non-interest income over the same 3 1/2 year timeframe has also shown steady improvement as a percentage of operating revenue, reaching its pinnacle of 29.4% at June 30, 2003.
Although showing a slight, but gradual increase, our efficiency ratio stood at 49.20% for the most recent quarter versus the peer group average of 61.45%.
With our modest increase in the capital to assets ratio, we show the ability for future growth (M&A) despite the rapid growth we’ve already experienced since December 31, 2000 (approximately $500 million).
SLIDE –TOTAL DELINQUENCY
The next slide shows the four year trend of declining delinquencies. Starting in 1999, the percentage of total delinquencies to loans stood at 2.12%. The improvement from year end 1999 through the midpoint of 2003 is a direct result of a $2.6 million reduction in delinquent loans coupled with loan growth of $400 million dollars, which translates into a 98 basis point reduction in total delinquencies.
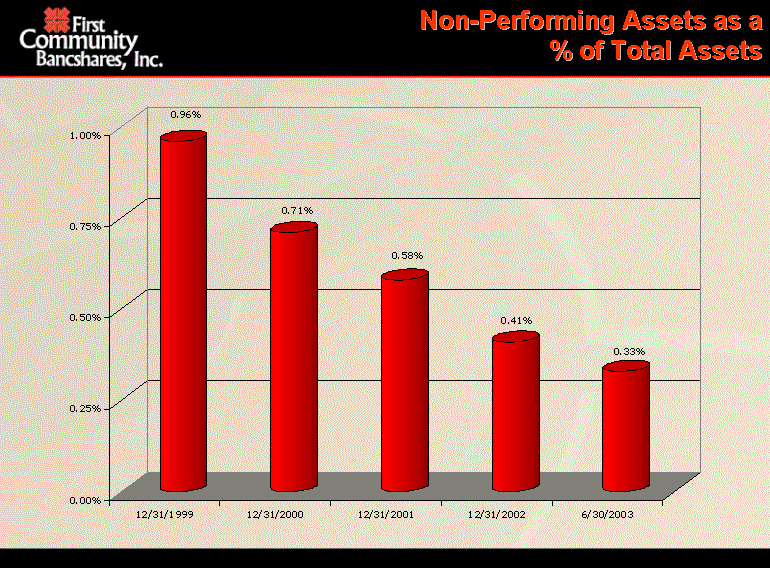
SLIDE – NON-PERFORMING ASSETS AS A % OF TOTAL ASSETS
Further evidence of the improving asset quality is shown in the next slide on non-performing assets improving from the year end 1999 level of 96 basis points to the June 30, 2003 level of 33 basis points.
SLIDE – COVERAGE RATIO FOR NON-PERFORMING LOANS
Moving to the next slide, we can see additional evidence of continued asset quality improvement, reflected in the June 30th coverage ratio of 596.54%. The June, 2003, addition of CommonWealth Bank’s $122 million in loans to the loan portfolio, with its accompanying loan loss reserve of $1.2 million with no identified problem loans contributed to the improved coverage.
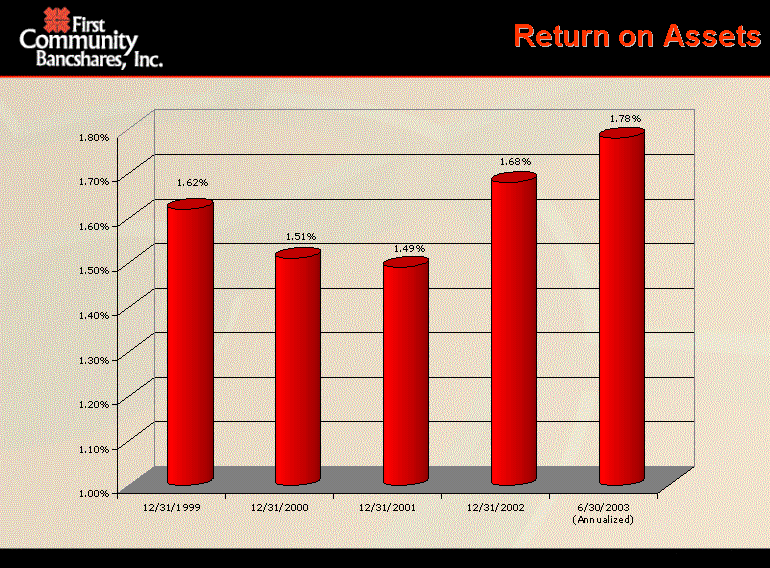
SLIDE – RETURN ON ASSETS
The next slide showing Return on Assets reflects another area of continued improvement for the Company. In 1999, the Company experienced a $1.8 million recovery of a previous charge-off. When excluding this recovery, earnings from recurring operations of $17.16 million in the year 2000, improved by 9% compared to the $15.75 million in 1999. In 2001 the Company continued to benefit from earnings growth, with net income increasing to $19.13 million. Although the Company continued to generate improving net income from operations in both 2000 and 2001, the substantial growth of $390 million in assets over the course of those two years caused ROA to remain relatively stable as shown on the slide. 2002 ROA substantially improved as a direct result of declining cost of funds coupled with the Company’s ability to maintain desired levels of asset yield while total assets remained relatively unchanged. The Company’s ROA has continued to benefit from these factors in the first half of 2003.
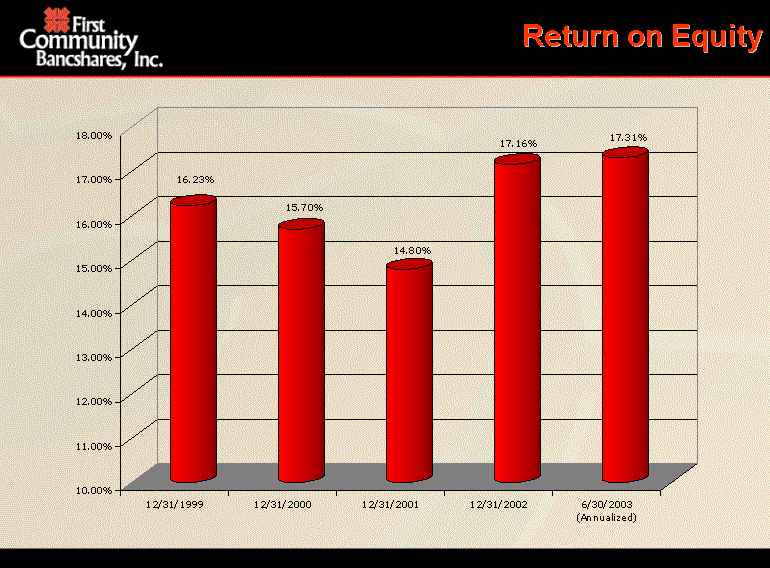
SLIDE – RETURN ON EQUITY
The next slide shows the four and one-half year historical performance of ROE. At June 30, 2003, ROE was at 17.31%, versus 2002 year end ROE of 17.16%. 2002 was a banner year for the Company from several perspectives, including ROE. The improving trend line was due to several factors, including a full year’s contribution from three divested BB&T branches, acquired in the fourth quarter of 2001 in Eastern Virginia; continued loan growth coupled with margin maintenance; continued increases in non-interest income attributed to the service charge structure (also a positive impact on ROA); and continued contributions from all recent M&A activity (Citizens-Southern Bank, Monroe Financial, BB&T Branches and The CommonWealth Bank).
SLIDE – COMPARABLE GROUP ANALYSIS
The final slide is inserted here to compare the performance of First Community Bancshares, Inc. to that of financially related holding companies of similar asset size located throughout the mid-Atlantic region. Focusing on the average results for the comparable group, it is clear that FCB’s $1.70 Billion in Total Assets is very near to the group median of $1.72 Billion. The Tangible Equity to Tangible Asset ratio is indicative of the company’s leveraged position. As previously discussed, the ROA and ROE are among the best in the group, ranking second and third, respectively. The Price to Tangible Book ratio reflects the market’s view of the value of the stock, despite the intangibles carried on the balance sheet. Both historical and forward-looking price to earnings ratios forecast potential appreciation for the price of the stock, when compared to the median for the
comparable group. The market cap for the stock has grown $128.7 million for the first 6 months of 2003 reflecting the continuing demand for the stock.
SLIDE – STOCK PERFORMANCE
The Stock Performance slide clearly demonstrates the benefit of all of the efforts that have brought the Company to the present. Since March of 2002, the Company has distributed two 10% stock dividends, paid quarterly cash dividends on market value at an annualized yield of 2.7% or better, obtained a listing on the Nasdaq National Market, continued to add accretive M&A transactions, while the stock has not surprisingly appreciated more than 49%.

| Presentation to Trident Securities |
| Cautionary Statement This presentation may include forward-looking statements. These forward-looking statements are based on current expectations that involve risks, uncertainties, and assumptions. Should one or more of these risks or uncertainties materialize, or should underlying assumptions prove incorrect, actual results may differ materially. Furthermore, this presentation embodies elements of the company's strategic plan and significant objectives set forth therein, which are based upon underlying financial assumptions, plans and strategies, which may not come to fruition due to change in direction or inability to execute the plan as outlined. |

| First Community Bancshares, Inc. Mission Statement Mission Statement Mission Statement First Community Bank... Offers competitive products and impeccable service while building relationships and proving our value everyday as our customers' First Financial Resource. |
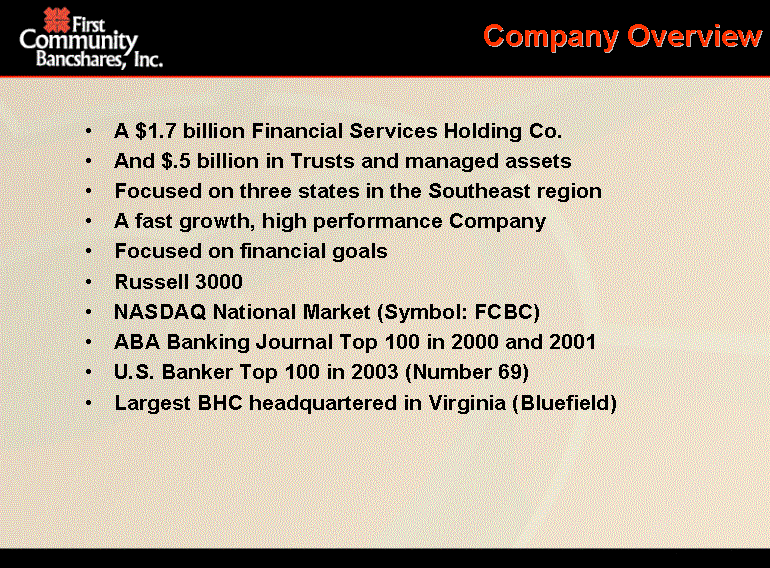
| A $1.7 billion Financial Services Holding Co. And $.5 billion in Trusts and managed assets Focused on three states in the Southeast region A fast growth, high performance Company Focused on financial goals Russell 3000 NASDAQ National Market (Symbol: FCBC) ABA Banking Journal Top 100 in 2000 and 2001 U.S. Banker Top 100 in 2003 (Number 69) Largest BHC headquartered in Virginia (Bluefield) Company Overview |
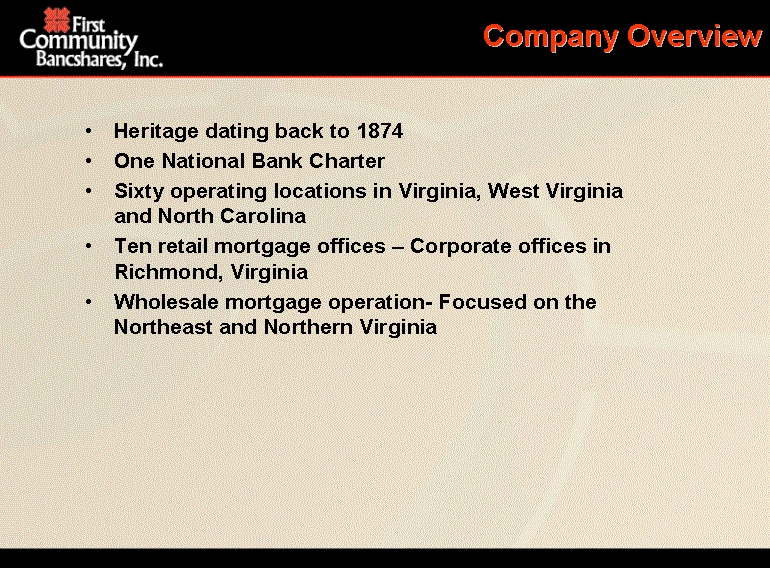
| Heritage dating back to 1874 One National Bank Charter Sixty operating locations in Virginia, West Virginia and North Carolina Ten retail mortgage offices - Corporate offices in Richmond, Virginia Wholesale mortgage operation- Focused on the Northeast and Northern Virginia Company Overview |
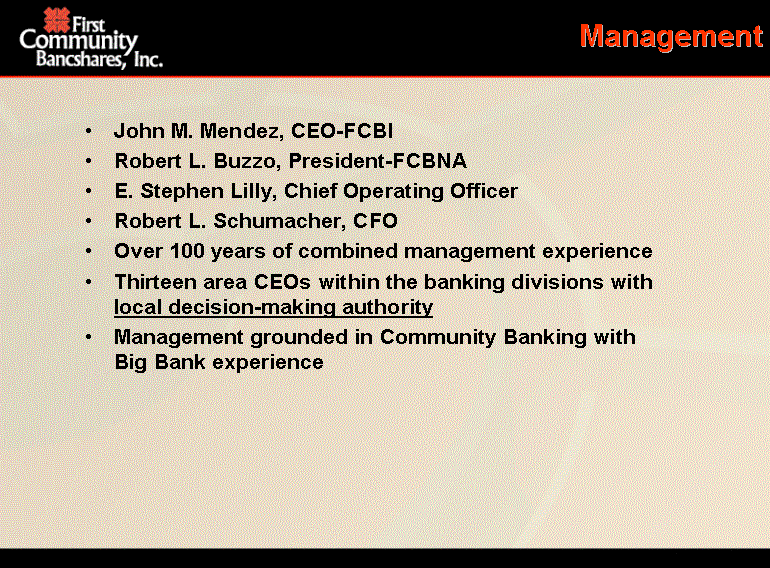
| John M. Mendez, CEO-FCBI Robert L. Buzzo, President-FCBNA E. Stephen Lilly, Chief Operating Officer Robert L. Schumacher, CFO Over 100 years of combined management experience Thirteen area CEOs within the banking divisions with local decision-making authority Management grounded in Community Banking with Big Bank experience Management |
| Corporate Organization Administration Operations Finance/ Control Technology Services Credit Services Bankers Insurance Annuities Stone Capital Management Research Brokerage Trading FCBNA Community Banking Group (15+Divisions in the Southeast) United First Mortgage Wholesale Retail Community Realty Management Brokerage Employee Benefits Trust & Financial Services Fiduciary Investment Management Financial Planning FCBI Financial Group P&C/ Life & Health Organizational Chart West Virginia Title Company West Virginia Capital Corporation Yellow denotes planned future activities |
| Regional Community Bank alternative Mid-tier institution In between the "service failures of the super-regionals and the "limited resources" of small caps and de novo's Local flavor and service Robust product offering Multiple delivery channels Culture Market Position |
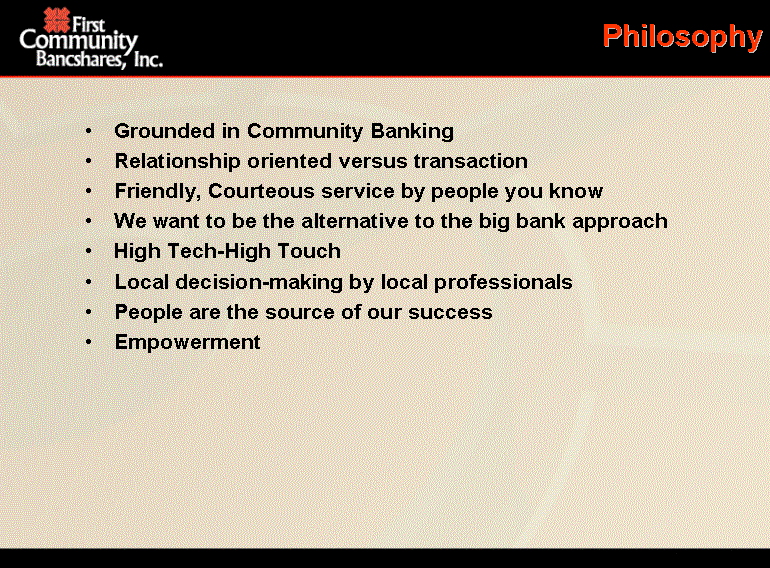
| Grounded in Community Banking Relationship oriented versus transaction Friendly, Courteous service by people you know We want to be the alternative to the big bank approach High Tech-High Touch Local decision-making by local professionals People are the source of our success Empowerment Philosophy |

| True Community Banking organization True Local Authority & Decision-Making (Loans, Pricing, Budget Allocations) Strong, but de-emphasized central organization Flexible central processing/Imaged Checking Operation/CD-ROM statement delivery Efficiency ratio: historically 48% to 50% Management and employee focus on financial goals Leader in Margin maintenance Wide range of services- commercial to retail Strong retail product set (Just Free Checking, Internet banking, bill pay, treasury management services) Differentiating Factors |
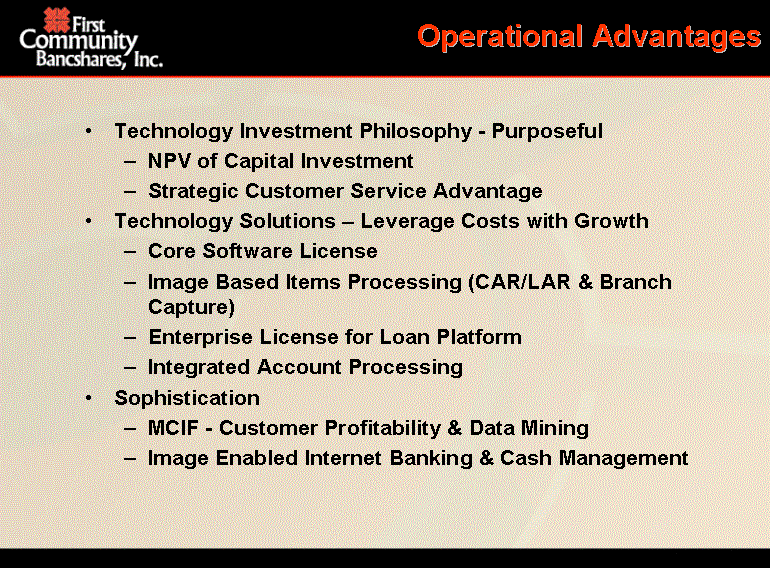
| Operational Advantages Technology Investment Philosophy - Purposeful NPV of Capital Investment Strategic Customer Service Advantage Technology Solutions - Leverage Costs with Growth Core Software License Image Based Items Processing (CAR/LAR & Branch Capture) Enterprise License for Loan Platform Integrated Account Processing Sophistication MCIF - Customer Profitability & Data Mining Image Enabled Internet Banking & Cash Management |
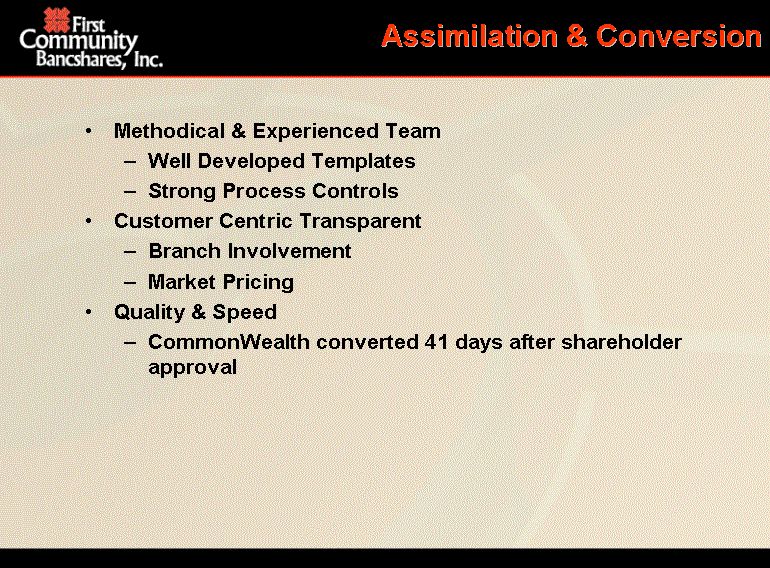
| Assimilation & Conversion Methodical & Experienced Team Well Developed Templates Strong Process Controls Customer Centric Transparent Branch Involvement Market Pricing Quality & Speed CommonWealth converted 41 days after shareholder approval |
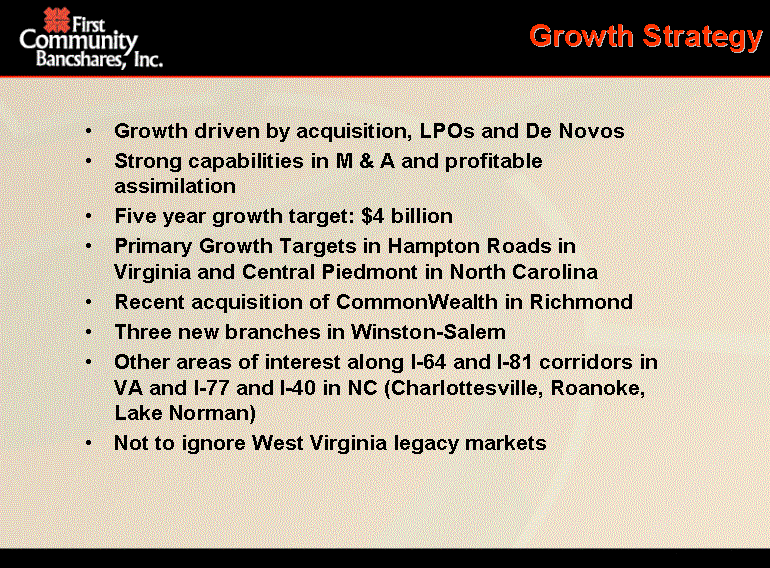
| Growth driven by acquisition, LPOs and De Novos Strong capabilities in M & A and profitable assimilation Five year growth target: $4 billion Primary Growth Targets in Hampton Roads in Virginia and Central Piedmont in North Carolina Recent acquisition of CommonWealth in Richmond Three new branches in Winston-Salem Other areas of interest along I-64 and I-81 corridors in VA and I-77 and I-40 in NC (Charlottesville, Roanoke, Lake Norman) Not to ignore West Virginia legacy markets Growth Strategy |
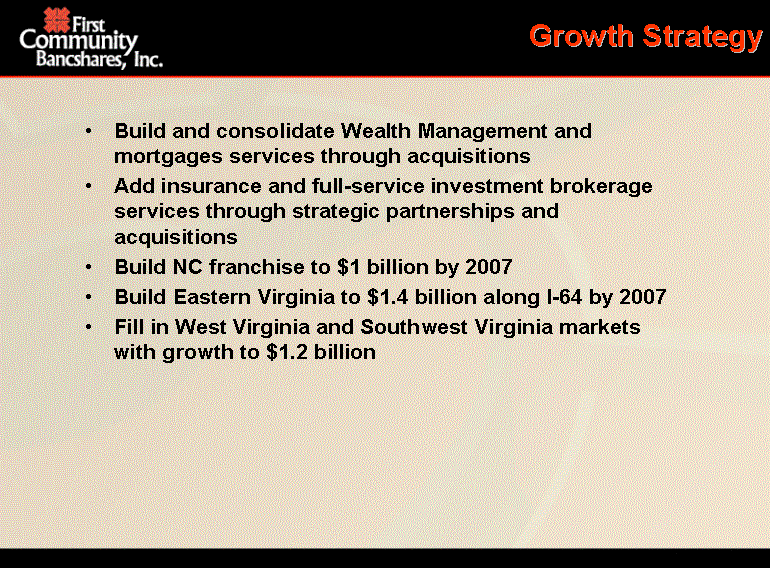
| Build and consolidate Wealth Management and mortgages services through acquisitions Add insurance and full-service investment brokerage services through strategic partnerships and acquisitions Build NC franchise to $1 billion by 2007 Build Eastern Virginia to $1.4 billion along I-64 by 2007 Fill in West Virginia and Southwest Virginia markets with growth to $1.2 billion Growth Strategy |

| Projected FCBI Franchise (2007) Richmond Winston-Salem Norfolk Charlottesville Roanoke Charlotte Raleigh Morgantown Charleston FCBC Headquarters Current FCB Branch/LPO UFM Office Potential Future FCB Branch/LPO Greensboro Cornelius Virginia Beach Chesapeake |
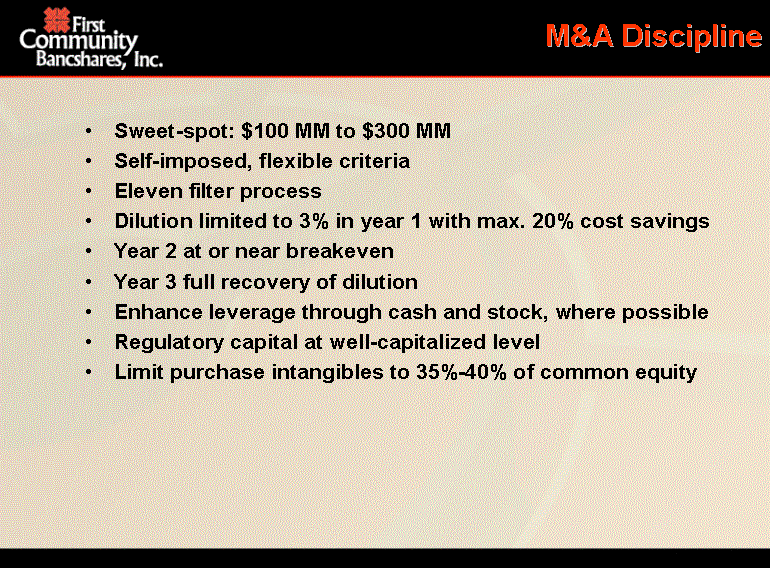
| Sweet-spot: $100 MM to $300 MM Self-imposed, flexible criteria Eleven filter process Dilution limited to 3% in year 1 with max. 20% cost savings Year 2 at or near breakeven Year 3 full recovery of dilution Enhance leverage through cash and stock, where possible Regulatory capital at well-capitalized level Limit purchase intangibles to 35%-40% of common equity M&A Discipline |

| Maintain Return on Equity at or above 17% Grow diluted EPS 8% to 10% annually Minimum EPS growth of 7% Maintain overall financial performance in the top 25% of national peers Grow market capitalization to $875 million Maintain efficiency ratio of 48%-50% Financial Objectives |
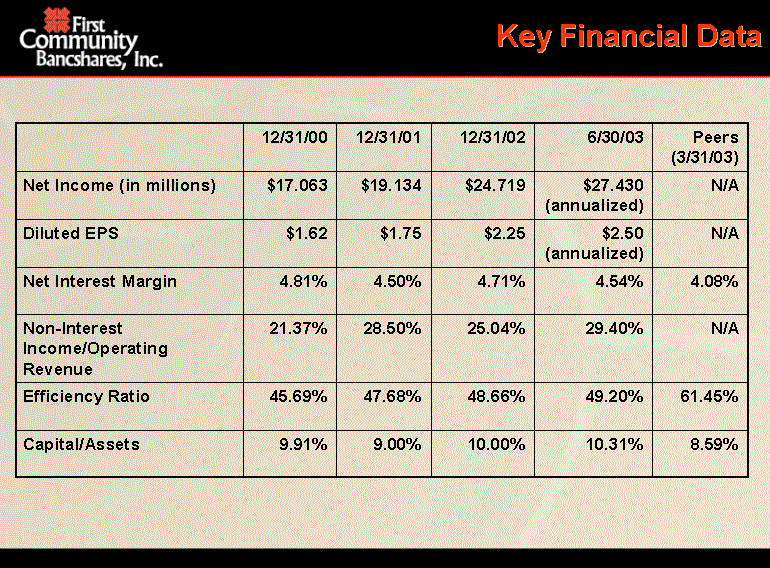
| Key Financial Data 12/31/00 12/31/01 12/31/02 6/30/03 Peers (3/31/03) Net Income (in millions) $17.063 $19.134 $24.719 $27.430 (annualized) N/A Diluted EPS $1.62 $1.75 $2.25 $2.50 (annualized) N/A Net Interest Margin 4.81% 4.50% 4.71% 4.54% 4.08% Non-Interest Income/Operating Revenue 21.37% 28.50% 25.04% 29.40% N/A Efficiency Ratio 45.69% 47.68% 48.66% 49.20% 61.45% Capital/Assets 9.91% 9.00% 10.00% 10.31% 8.59% |
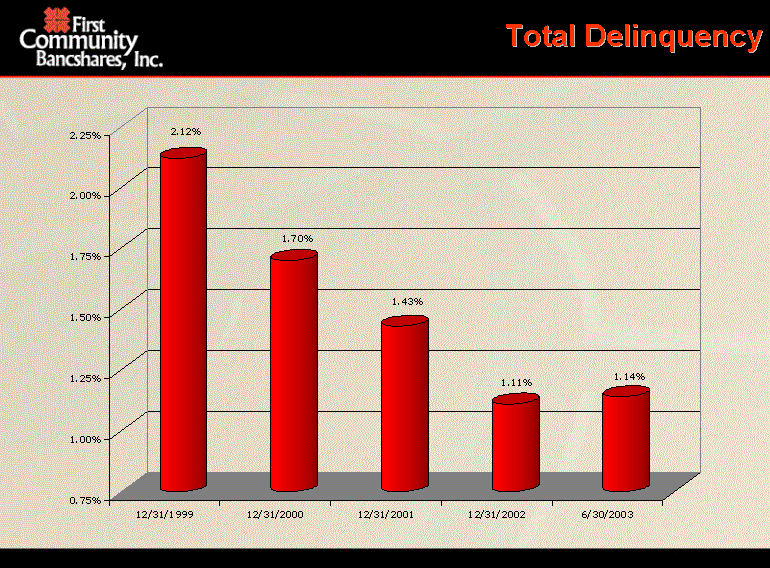
| Total Delinquency Total Delinquency |
| Non-Performing Assets as a % of Total Assets % of Total Assets % of Total Assets |

| Coverage Ratio for Non-Performing Loans Non-Performing Loans Non-Performing Loans |
| Return on Assets Return on Assets |
| Return on Equity Return on Equity |

| Comparable Group Analysis Total Assets ($) Tangible Equity/ Tangible Assets (%) LTM ROAA (%) LTM ROAE (%) Price/ Tangible BV (%) Price/ LTM EPS (x) Price/ Est. EPS (X) Market Cap. ($) First Community Bancshares, Inc. 1,700.3 7.99 1.71 16.86 314.30 15.68 14.68 416.5 Harleysville National Corp. 2,406.1 9.30 1.41 16.42 256.78 17.36 - 574.6 Sandy Spring Bancorp Inc. 2,367.4 7.20 1.50 19.29 308.03 15.58 17.14 520.7 Sterling Financial Corp. 2,220.3 8.71 1.25 13.71 237.25 17.13 16.60 455.2 City Holding Co. 1,983.3 8.70 2.00 23.89 336.29 14.87 13.70 578.4 Community Banks Inc. 1,842.7 7.59 1.16 14.99 221.09 16.29 15.66 308.7 Univest Corp. of Pennsylvania 1,524.7 7.38 1.64 16.29 269.45 13.96 - 297.6 First Bancorp 1,325.8 7.65 1.50 14.39 284.72 15.23 - 280.9 Royal Bancshares of PA 1,195.8 10.95 1.56 14.28 230.83 17.53 16.31 302.3 Union Bankshares Corp. 1,188.0 9.16 1.48 15.39 217.62 14.55 14.35 235.7 Omega Financial Corp. 1,170.7 14.07 1.57 10.94 174.48 17.06 18.68 287.5 Average 1,722.5 9.07 1.51 15.96 253.65 15.96 16.06 384.2 Data as of or for the Period Ending June 30, 2003 Pricing Data as of September 2, 2003 Dollar Values in Millions Data Source: SNL Financial Data as of or for the Period Ending June 30, 2003 Pricing Data as of September 2, 2003 Dollar Values in Millions Data Source: SNL Financial Data as of or for the Period Ending June 30, 2003 Pricing Data as of September 2, 2003 Dollar Values in Millions Data Source: SNL Financial Data as of or for the Period Ending June 30, 2003 Pricing Data as of September 2, 2003 Dollar Values in Millions Data Source: SNL Financial Data as of or for the Period Ending June 30, 2003 Pricing Data as of September 2, 2003 Dollar Values in Millions Data Source: SNL Financial Data as of or for the Period Ending June 30, 2003 Pricing Data as of September 2, 2003 Dollar Values in Millions Data Source: SNL Financial Data as of or for the Period Ending June 30, 2003 Pricing Data as of September 2, 2003 Dollar Values in Millions Data Source: SNL Financial Data as of or for the Period Ending June 30, 2003 Pricing Data as of September 2, 2003 Dollar Values in Millions Data Source: SNL Financial Data as of or for the Period Ending June 30, 2003 Pricing Data as of September 2, 2003 Dollar Values in Millions Data Source: SNL Financial |

| Stock Performance Stock Performance |