Exhibit 99.1
Stockholder Remarks
April 26, 2005
Welcome
Good afternoon and welcome again to the 2005 annual meeting of stockholders.
Introductions
Before we begin our report this afternoon I have a couple of introductions. Among our guests with us today we have our audit engagement manger Theresa Lipscomb and Senior Advisor, Paul Arbogast. Theresa is with our Independent Public Accounting firm, Ernst & Young in the Charleston WV office. We welcome both of you. We have a new engagement Partner for the ensuing year, Dana Radcliffe, unfortunately she had a conflicting meeting and could not be with us today. Dana will be leading the audit engagement this year and she follows John Gianola who has been our engagement partner for the last five years. In accordance with SEC regulations and NASDA listing rules engagement partners must rotate off the engagement every five years. We have enjoyed working with John and we look forward to working with Dana and Theresa and the rest of the continuing members of the engagement team.
We have number of our senior mangers with us today and we have also have with us the members of our 2005 Class of the Leadership Collaborative. This is new program for our company this year. This group represents a segment of the promising young talent we have throughout the organization. Throughout 2005 they will be participating in a number of developmental programs and challenges designed to identify leadership potential and cultivate future leadership within the company. I won’t introduce them individually, but I would like to welcome them to our meeting today and congratulate them all on their selection for participation in this new and unique program. It is considered quite an honor to be asked to participate.
Highlights for 2004
Let me begin by my report this afternoon with a review of some of the highlights for 2004. One of the most significant events and one of the most fruitful was our venture into our fourth state. In March 2004 we were fortunate to have the opportunity to add the state of Tennessee to our list of markets served. This transaction, and our relationship with People’s Community Bank, is just over one year old now and we are very pleased with the cultural fit and contribution on the part of our new Tennessee branches. In its first year of operation the Tennessee group has been very active in the production of new retail and commercial credit and continues to build strong customer relationships in and around the East Tennessee market area. People’s also made a positive contribution to financial results in 2004 with divisional pre-tax income contribution of $1 million and an estimated accretive impact on earnings per share of $.05 per share. We are pleased not only with the financial contribution but also with the very nice strategic and cultural fit with our existing company.
New Offices
In 2004 we continued progress on another important element of our strategic plan which involves the establishment of new banking centers and commercial loan offices in select markets to lead the growth of the company in high growth markets. In 2004 we saw significant progress in our newly opened Winston-Salem branches. We have added staffing to better support our growth in
this new market for our company and in February of last year we opened two commercial loan offices in Charlotte and Mount Airy, North Carolina to broaden the reach and speed the growth of this new Piedmont Division. At present, the Piedmont Region reports total assets of over $60 million. And after just over one year of operations we are beginning to see signs of profitability from this newest division.
We also opened commercial loan offices in Norfolk and Blacksburg Virginia and in Bridgeport West Virginia. These offices are in their early stages of development, but again we are seeing success in penetrating these new markets and the huge potential that they hold for growth in asset portfolios and eventually in gaining additional deposit funding and new customer relationships throughout these new markets with their robust economic bases and strong customer demographics.
In-Market Development
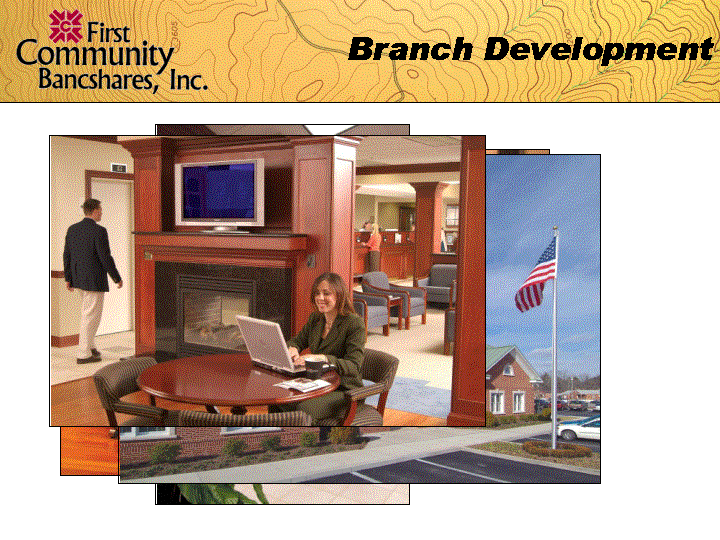
Our branch development work is not limited to new markets. We are also building and relocating branches to enhance our legacy markets and to improve the customer experience. Our most recent example is the development of the Stafford Commons branch in Princeton West Virginia. This state of the art branch combines convenience, comfort and expanded services in a uniquely warm and casual environment. This branch includes new features such as our financial center with casual seating, coffee bar, wireless internet connection and plasma screen for conducting personal banking business and keeping up to date with financial news. The branch also features trust offices and wealth management and brokerage offices of Stone Capital Management. Our next planned in-market expansion is in the Raleigh county area where we will be building an expansion office to better serve the entire Raleigh county market.
Sale of Mortgage Subsidiary
Significant among the events of 2004 was the sale of our Richmond mortgage company. UFM had been a contributing segment for our company until the shift in the interest rate environment in early 2004. The mortgage segment contributed not only segment earnings, but also provided net interest revenues derived from the significant volume of warehoused loans. In 2004 we began to evaluate the potential effects of rising interest rates on that line of business as well as other challenges to the mortgage industry and our mortgage company in particular. That led us to the decision to divest this subsidiary. While this was a difficult decision and one which led to the elimination of a line of business, it was critical to our ability to re-focus the company on the growth opportunities of the community banking segment. And for that reason we count the completion of this restructuring as one of our significant strategic events of 2004.
Sarbanes/Oxley Internal Control Certification
By this time I am sure that everyone is aware of the sweeping impact which has been felt by corporate America as well as the investment community from the Sarbanes-Oxley Act of 2002. This act which was designed to enhance investor confidence in public companies and generally improve corporate governance and accountability has been fully enacted. One of the most significant provisions of the Sarbanes/Oxley Act, in terms of scope and effort, is known as Section 404. This section of the act requires all public companies to conduct an assessment of Internal Controls over Financial Reporting and requires executive management’s assertion as to the effectiveness of the company’s system of Internal Controls. As an accelerated filer, First Community was required to comply with these new provisions for the 2004 fiscal year. In our 2004 10-K we presented our report on Internal Controls which we found to be effective for 2004. This was a major project for our company and one which consumed thousands of man hours and a great deal of resources. We are proud that we have been able to count ourselves among the ranks of certifying companies who have passed this rigorous test of operating and financial controls. Since the inception of the 404 Internal Control study in late 2003, we have expended over
$700,000 in this process and consumed many man-hours of effort by our Internal Audit Department, our management and the entire staff. This substantial effort and investment by our company will hopefully be rewarded through continued confidence in our company and our financial reporting. In future years we will continue to study and certify our systems of Internal Controls based on the foundation built in 2004 and leveraging the costs invested in this project over the past year. There will be some level of continuing cost as well as opportunity costs as we operate in a new environment which demands greater attention to the documentation of systems and controls and a heightened awareness of the cost of failing to meet these stringent new standards.
Vision/Breakaway Performance
For years now, the C in our logo has stood for Community. And while community is indeed important to us, today we view the C as a symbol of our Customer focus. In 2004 we initiated a series of programs, under the heading of Customer Engagement, designed to improve service and the customer experience. As a regional financial services company we must distinguish ourselves as a uniquely superior provider. Community banking is at our core and we deliver these services through locally operated offices with support from a customer transparent central organization. We are focused on one-to-one personal service and we assign relationship managers whose job is to ascertain the varied financial needs of our clients and customers throughout the broad spectrum of financial services offered by our company. Through superior service and focus on our financial performance we hope to achieve “Breakaway Performance” or a level of Performance which transcends the customary standards for quality service, efficiency and effectiveness. Our customer engagement project, our leadership collaborative and a range of training and development programs are underway to lead us to this new level of service and performance.
Financial Results for 2004
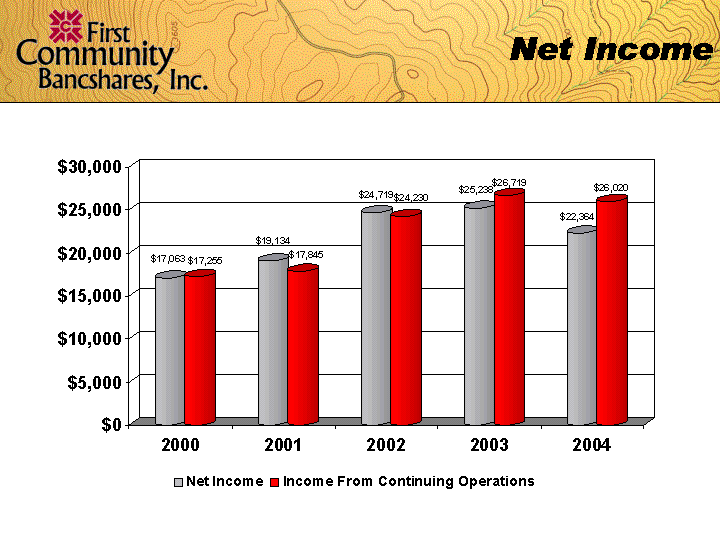
Turning now to the financial results for 2004, in the next slide we illustrate net income and income from continuing operations for the most recent year. While net income is down from the preceding year, we are pleased that we were able to report solid earnings from Continuing Operations. Net income for 2004 was $22.4 million. Earnings from continuing operations were significantly higher at $26 million. Net Income for 2004 includes the negative effects of the operations and disposal of the mortgage company. The decision to dispose of the mortgage operation in the second quarter was the first step in stabilizing our operating results and re-focusing the company on its core banking business. Since the disposal of the investment in UFM in August of 2004 we have reported solid third and fourth quarter operating results.Net income for the third quarter rose to $6.4 million and included a small after-tax gain on the sale of the mortgage division. We followed in the fourth quarter with net income of $6.1 million, which is representative of the historically strong results for our Company. Now with the negative effects of the mortgage business behind us we look forward to 2005 with anticipation of a return to our characteristic strong financial performance.
Growth in Assets/Asset Growth Rate
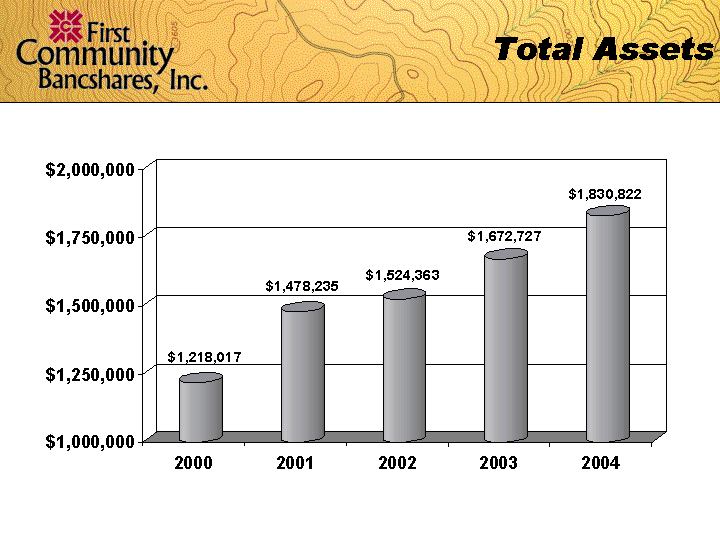
For the 2004 fiscal year we achieved 9.5% total asset growth with year end assets of $1.83 billion, up from $1.67 billion at year end 2003. For the last five year period we have achieved total growth of $613 million or 50% total growth for a five year compound annual growth rate of just over 10%. Clearly we are making progress toward our growth targets and we are seeing a continuation of that growth pattern through the first quarter of 2005 with an annualized growth rate of 12.4%.
Regional Growth-De Novo Offices
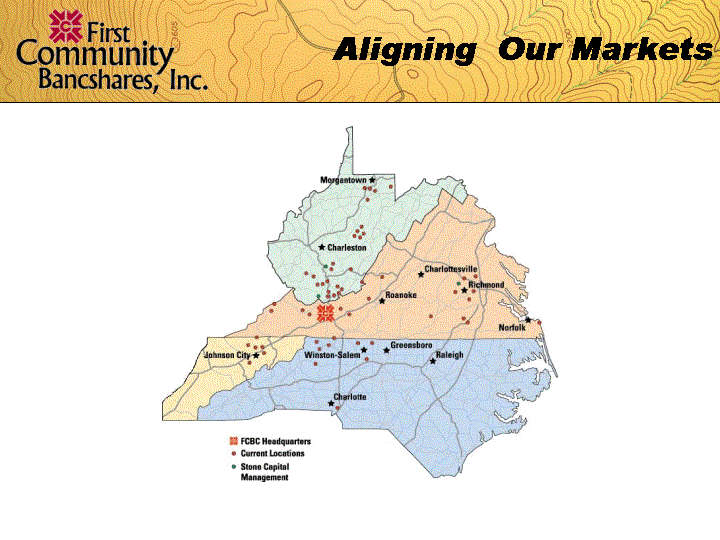
We continue to make steady progress on the growth goals and other initiatives established in our five-year plan. In 2004 we were able to open new commercial loan offices in Charlotte and Mount Airy North Carolina. The offices augment the De Novo offices in Winston-Salem opened in the second and third quarters of 2003. All of these offices comprise the new Piedmont Region of First Community Bank and hold great potential for continued growth in Central North Carolina.
Other Commercial Loan offices were opened in 2004 to lead our growth in new markets. In the first quarter of 2004 we opened our first office in Norfolk Virginia. We are very interested in the Hampton Roads region. This MSA is home to $1.4 million residents with a median annual income of $55,000. Total deposits for the market exceed $16 billion and it is home to a number of fortune 500 companies and the many support industries which provide needed services and business partnerships and according to Moody’s Fall 2002 quarterly, the Norfolk metro area tied for second place as the best overall commercial real estate market in the country. Obviously we believe the development of our network in this region could provide tremendous opportunities for our company.
We also opened commercial loan offices in Blacksburg Virginia and in Bridgeport West Virginia. These are satellite offices for existing West Virginia divisions and are part of our effort to grow those banking divisions and leverage existing resources.
Expanded Services
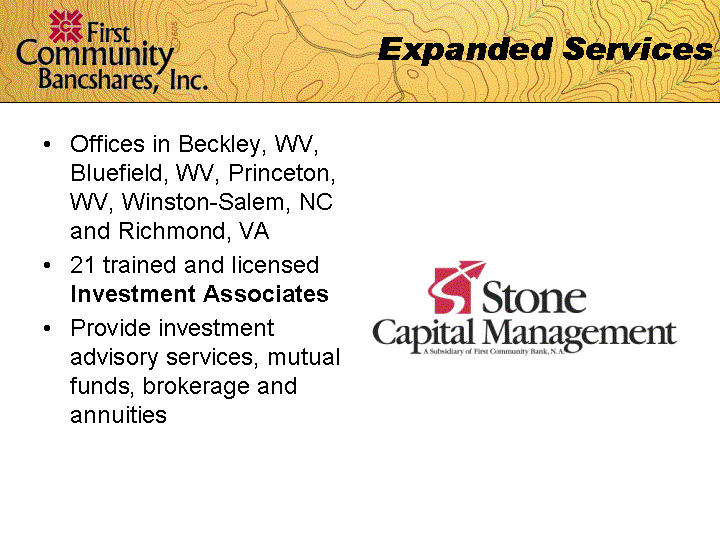
We also made progress on the expansion of services in 2004 as we added Stone Capital Wealth Management representatives in Bluefield, Princeton Winston-Salem and Richmond. We also trained and licensed 21 Investment Associates throughout the bank branch network. These Investment Consultants and Associates are now at work providing Investment Advisory services and access to mutual funds, brokerage accounts and annuities for customers to provide for financial needs beyond the traditional banking investment products and services.
Market Valuation
Looking for a moment at our stock performance, we closed the year with a nice increase in market value. That increase is reflected in this five year summary of Total Return which includes market appreciation and reinvested dividends. As you can see, our five year total return of 189% compares favorably with our peer group which shows a total return of 188%. However, when you compare with the overall performance of the broad market over the five year period, as measured by the S&P 500, we significantly outperformed the broad market returns.
Since the close of the fiscal year we have seen a pretty tough equity market as investors struggle with the potential effects of rising interest rates and the continued climb in oil prices. These factors among others have driven the market down in recent months and unfortunately financial stocks and First Community Bancshares have move downward accordingly. We believe that the market valuations for financial stocks could return to more reasonable levels as the Federal Reserve closes in on its target for “neutrality”.
In recent weeks we have seen stocks sell-off on the release of data raising questions of economic strength and with a re-emergence of inflation fears. Nervousness about earnings reports has also added to investor consternation as we saw some early earnings misses by Ford and IBM. Banks and financial stocks have generally delivered, with most reporting companies hitting or exceeding consensus earnings estimates. Hopefully, we will see a return to better valuations and improvement in this bearish sentiment as we proceed through first quarter
earnings season and as the market internalizes the new interest rate environment for financial stocks which, all in all, seem to be fairing pretty well in terms of reported earnings for the first quarter of 2005.
Going back to the market comparisons and looking at comparative stock prices for FCBC, the Dow Jones index and the Nasdaq index, we see that First Community significantly outperformed the two leading indexes through year end 2004 and despite our precipitous drop in price in the first quarter of 2005 we continue to significantly outperform those indexes with a positive 93% price change for First Community versus 6% and 21% declines for the Dow and Nasdaq, respectively.
With the recent price change for our stock we are presently trading at a price-earnings multiple of 12.6 times. This compares with the SNL Bank Index at 15.6 times and the Nasdaq Bank Index at 15.7 times and suggests that, with sustained financial performance and an equalization in P/E multiples, First Community could see significant price recovery as the market itself improves and better rewards the financial sector and other interest sensitive stocks.
Fundamentals
In the mean time we will continue to focus on the fundamentals of our company’s performance to assure that we are positioned to take advantage of improving market multiples, if and when they occur. These fundamentals include core earnings, dividends, asset growth, asset quality and capital retention. We believe we display strong fundamentals in these areas as illustrated in this next series of slides.
Over recent quarters we have shown a distinct improving trend in Net Income as we emerged from the mortgage business and re-focused on the community banking segment. Net income improved in the third and fourth quarters after throwing off the effects of the mortgage operations.
Dividendsto FCBI shareholders have increased in each of the last 20 years bringing the current annualized dividend to $1.02 per share. On today’s market value that represents a 3.6% dividend yield and one of the strongest, if not the strongest among our peers which averaged close to 1%.
Asset quality
Asset quality remained quite good in 2004 and continued a four year trend of improvement in quality measures. The provision for loan losses was down 22% on the basis of improved risk factors and a 51% reduction in the ratio of net charge-offs from the preceding year. Total non-performing assets ended the year at $6.6 million. While the absolute dollars were up $1.5 million from the preceding year, the percentage of non-performing assets to total loans and OREO remained constant at .5%. The current dollar level of non-performing assets is down significantly from the $9 million level in 2000 and on a percentage basis, is reduced by more than half. The Allowance for loan losses remained strong with a 3.16 coverage of non-performing loans. This of course, is a function of a strong reserve and recognition of specific allowances for losses with early risk identification.
Our Capital measures likewise remain strong with all regulatory measures within the “Well Capitalized “ category”. Our capital position and earnings retention provide further leverage opportunities as we consider our future growth plans.
Closing
As you can see, recent results and existing fundamentals for the company remain strong. This combined with our growth plan, we believe, provide the backdrop for a continued bright future for First Community Bancshares. As always we appreciate your support as stockholders and particularly your attendance here today. We look forward to speaking with you individually following our business meeting and hope that each of you can remain for the reception which follows. Thank you again and I look forward to speaking with you following the meeting.
| 2004 Annual Meeting of Shareholders |

| Growth & Development Acquired People's Community Bank of Johnson City, TN on April 1, 2004 6 commercial banking offices Total assets of $170 million Operating as People's Community Bank, a division of First Community Bank, N. A. |
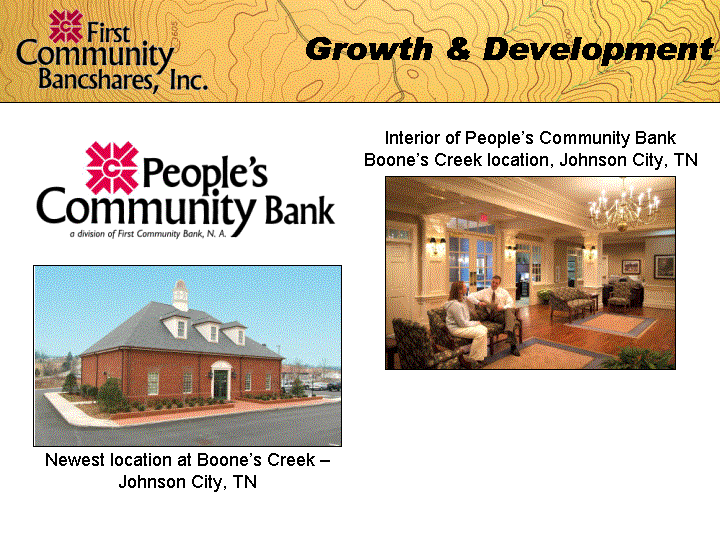
| Newest location at Boone's Creek - Johnson City, TN Interior of People's Community Bank Boone's Creek location, Johnson City, TN Growth & Development |
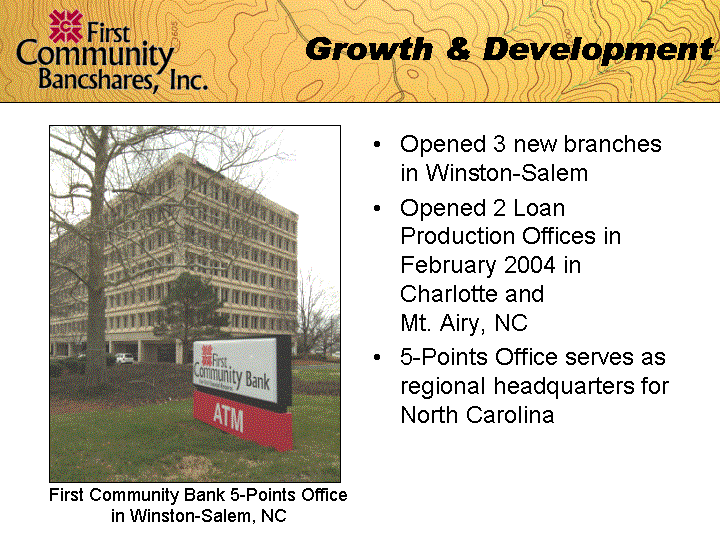
| First Community Bank 5-Points Office in Winston-Salem, NC Growth & Development Opened 3 new branches in Winston-Salem Opened 2 Loan Production Offices in February 2004 in Charlotte and Mt. Airy, NC 5-Points Office serves as regional headquarters for North Carolina |

| North Carolina Charlotte, NC Mt. Airy, NC West Virginia Bridgeport, WV Virginia Norfolk, VA Blacksburg, VA De Novo & Commercial Loan Offices |
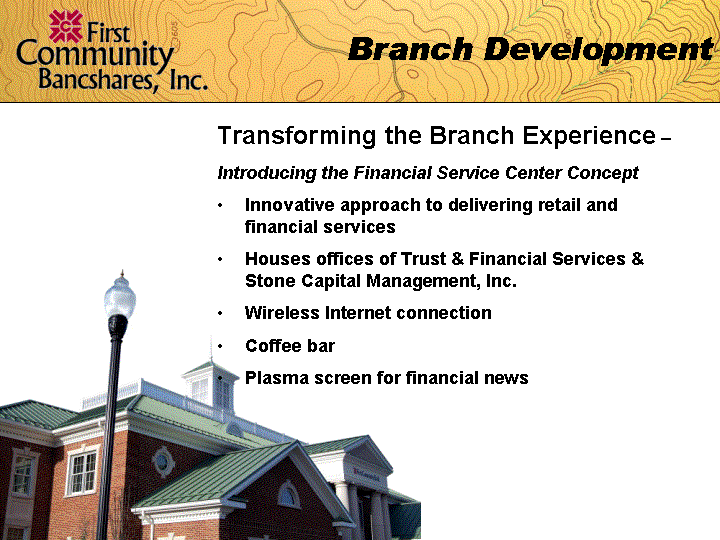
| Transforming the Branch Experience - Introducing the Financial Service Center Concept Innovative approach to delivering retail and financial services Houses offices of Trust & Financial Services & Stone Capital Management, Inc. Wireless Internet connection Coffee bar Plasma screen for financial news Branch Development |
| Sarbanes/Oxley- Internal Control Act designed to enhance investor confidence Section 404-assessment of Internal Controls Internal controls report submitted in 2004 Major project with thousands of man hours Costs over $700,000 |
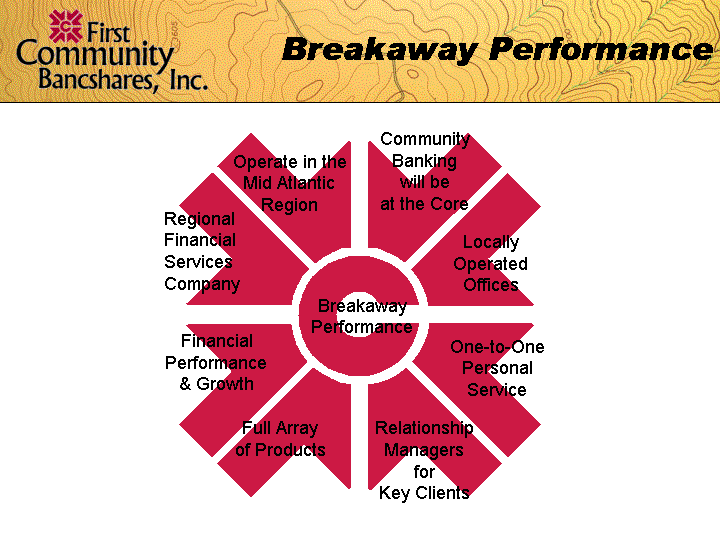
| Breakaway Performance Regional Financial Services Company Community Banking will be at the Core Operate in the Mid Atlantic Region One-to-One Personal Service Full Array of Products Locally Operated Offices Relationship Managers for Key Clients Financial Performance & Growth Breakaway Performance |
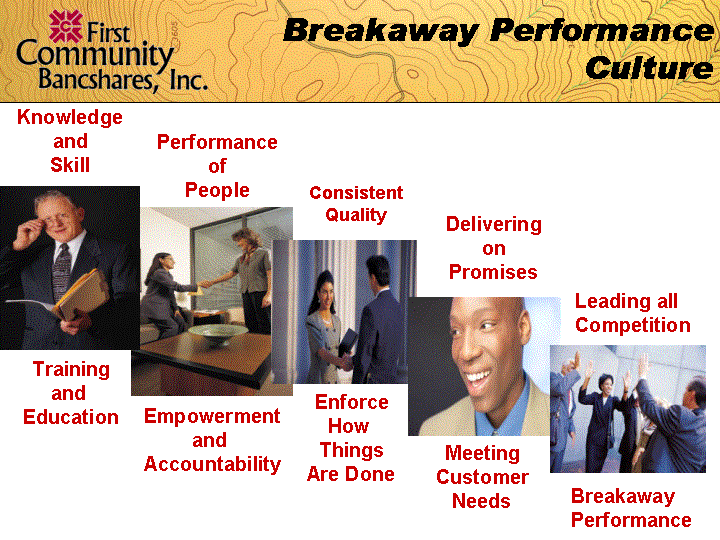
| Breakaway Performance Culture Consistent Quality Knowledge and Skill Performance of People Delivering on Promises Breakaway Performance Training and Education Enforce How Things Are Done Empowerment and Accountability Meeting Customer Needs Leading all Competition |
| 2000 2001 2002 2003 2004 Net Income 17063 19134 24719 25238 22364 Income From Continuing Operations 17255 17845 24230 26719 26020 Net Income |
| 2000 2001 2002 2003 2004 Total Assets 1218017 1478235 1524363 1672727 1830822 Total Assets |
| Aligning Our Markets Aligning Our Markets |
| Expanded Services Offices in Beckley, WV, Bluefield, WV, Princeton, WV, Winston-Salem, NC and Richmond, VA 21 trained and licensed Investment Associates Provide investment advisory services, mutual funds, brokerage and annuities |
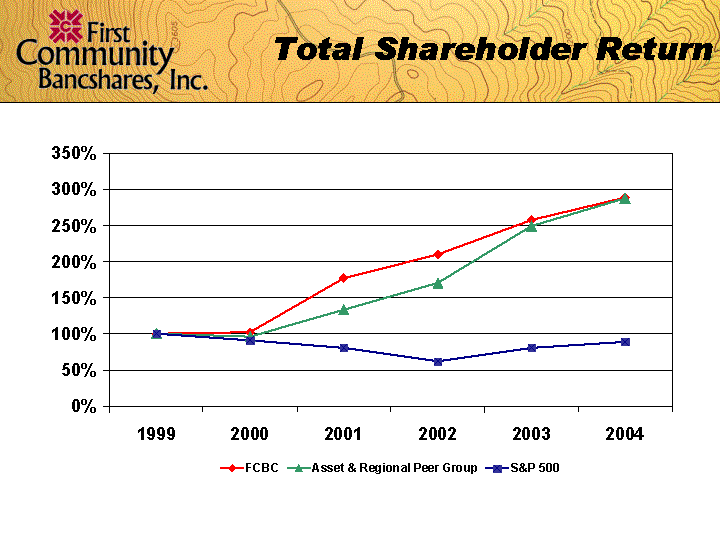
| Total Shareholder Return 1999 2000 2001 2002 2003 2004 FCBC 1 1.03 1.77 2.1072 2.5734 2.889 Asset & Regional Peer Group 1 0.9647 1.3345 1.709 2.4947 2.8796 S&P 500 1 0.912 0.8042 0.6264 0.8062 0.8947 |
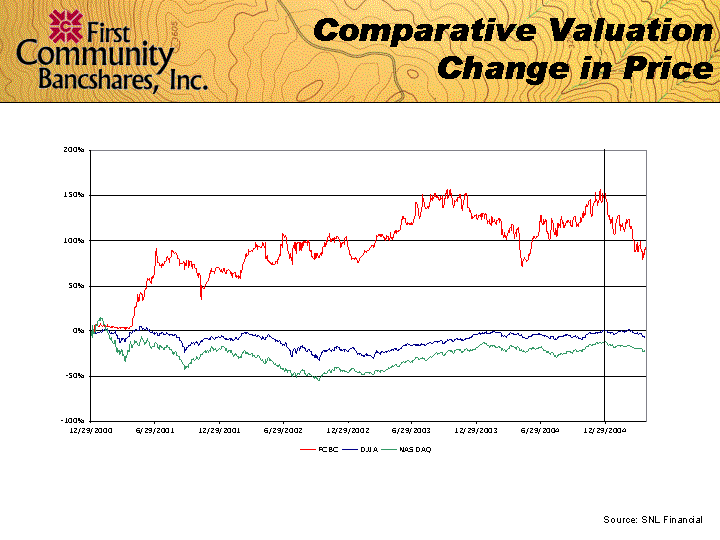
| Comparative Valuation Change in Price Source: SNL Financial |
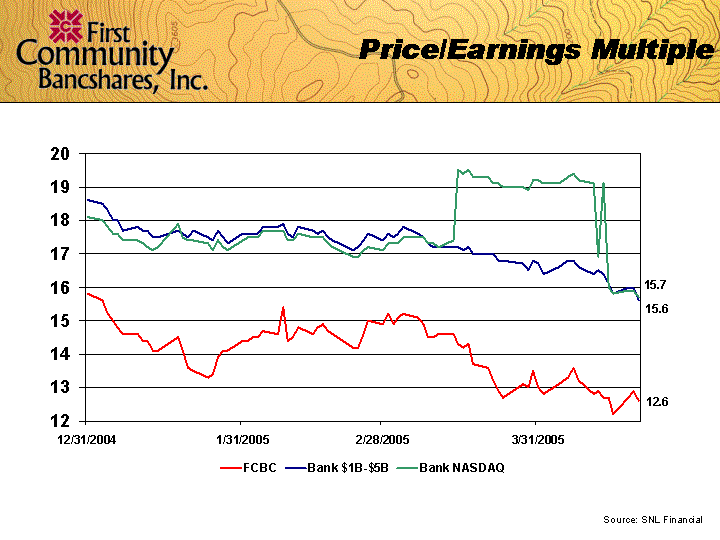
| Price/Earnings Multiple Pricing Date 12/31/2004 1/3/2005 1/4/2005 1/5/2005 1/6/2005 1/7/2005 1/10/2005 1/11/2005 1/12/2005 1/13/2005 1/14/2005 1/18/2005 1/19/2005 1/20/2005 1/21/2005 1/24/2005 1/25/2005 1/26/2005 1/27/2005 1/28/2005 1/31/2005 2/1/2005 2/2/2005 2/3/2005 2/4/2005 2/7/2005 2/8/2005 2/9/2005 2/10/2005 2/11/2005 2/14/2005 2/15/2005 2/16/2005 2/17/2005 2/18/2005 2/22/2005 2/23/2005 2/24/2005 2/25/2005 2/28/2005 3/1/2005 3/2/2005 3/3/2005 3/4/2005 3/7/2005 3/8/2005 3/9/2005 3/10/2005 3/11/2005 3/14/2005 3/15/2005 3/16/2005 3/17/2005 3/18/2005 3/21/2005 3/22/2005 3/23/2005 3/24/2005 3/28/2005 3/29/2005 3/30/2005 3/31/2005 4/1/2005 4/4/2005 4/5/2005 4/6/2005 4/7/2005 4/8/2005 4/11/2005 4/12/2005 4/13/2005 4/14/2005 4/15/2005 4/18/2005 4/19/2005 4/20/2005 FCBC 15.8 15.6 15.2 15 14.8 14.6 14.6 14.4 14.4 14.1 14.1 14.5 14.1 13.6 13.5 13.3 13.4 13.9 14.1 14.1 14.4 14.4 14.5 14.5 14.7 14.6 15.4 14.4 14.5 14.8 14.6 14.8 14.9 14.7 14.6 14.2 14.2 14.6 15 14.9 15.2 14.9 15.1 15.2 15.1 14.9 14.5 14.5 14.6 14.6 14.3 14.2 14.3 13.7 13.6 13.2 12.9 12.7 13.1 13 13.5 13 12.8 13.1 13.2 13.3 13.6 13.2 12.8 12.9 12.7 12.7 12.2 12.7 12.9 12.6 Bank $1B-$5B 18.6 18.5 18.3 18 18 17.7 17.8 17.7 17.7 17.5 17.5 17.7 17.6 17.5 17.7 17.5 17.4 17.7 17.5 17.3 17.6 17.6 17.6 17.6 17.8 17.8 17.9 17.6 17.5 17.8 17.7 17.6 17.7 17.5 17.4 17.1 17.2 17.4 17.6 17.4 17.6 17.5 17.6 17.8 17.6 17.5 17.3 17.2 17.2 17.2 17.2 17.1 17.2 17 17 17 16.8 16.8 16.7 16.5 16.8 16.7 16.4 16.6 16.7 16.8 16.8 16.6 16.4 16.5 16.4 16.1 15.8 16 16 15.6 Bank NASDAQ 18.1 18 17.8 17.6 17.6 17.4 17.4 17.3 17.2 17.1 17.2 17.9 17.5 17.4 17.4 17.3 17.1 17.4 17.2 17.1 17.4 17.5 17.5 17.5 17.7 17.7 17.7 17.4 17.4 17.6 17.5 17.5 17.5 17.3 17.2 16.9 16.9 17.1 17.2 17.1 17.3 17.3 17.3 17.5 17.5 17.5 17.3 17.3 17.2 17.4 19.5 19.4 19.5 19.3 19.3 19.1 19.1 19 19 18.9 19.2 19.2 19.1 19.1 19.2 19.3 19.4 19.2 19.1 16.9 19.1 16 15.8 15.9 15.9 15.7 Source: SNL Financial |
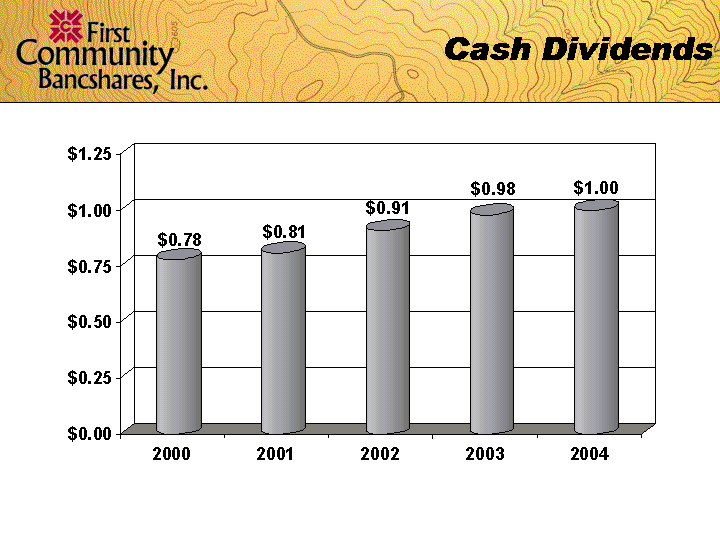
| 2000 2001 2002 2003 2004 0.78 0.81 0.91 0.98 1 Cash Dividends |
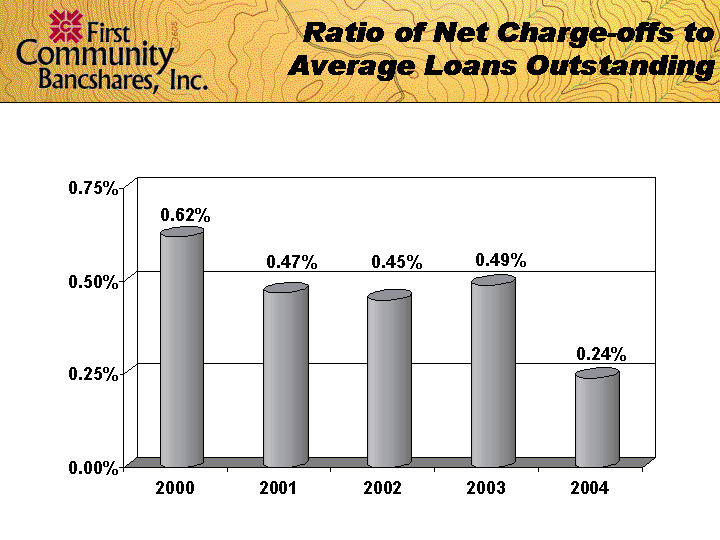
| 2000 2001 2002 2003 2004 6.2000000013148E-03 0.0047 0.0045 0.0049 0.0024 Ratio of Net Charge-offs to Average Loans Outstanding |
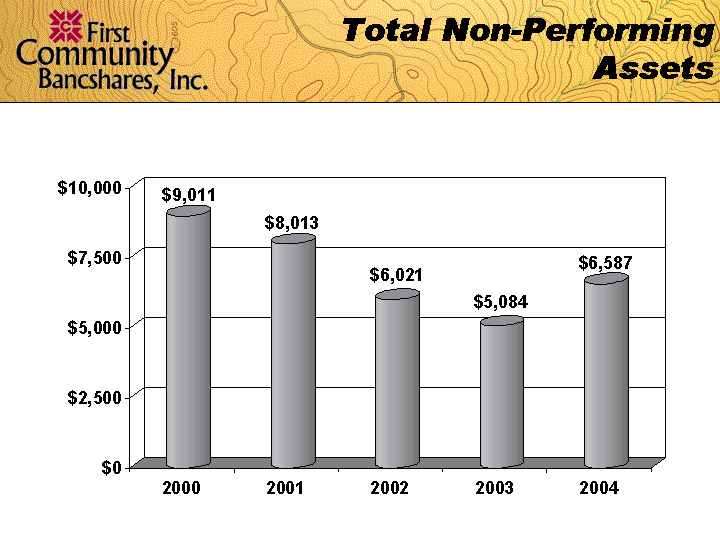
| 2000 2001 2002 2003 2004 9011 8013 6021 5084 6587 Total Non-Performing Assets |

| 2000 2001 2002 2003 2004 0.011 0.009 0.006 0.005 0.005 Non-Performing Assets as a Percentage of Total Loans and Other Real Estate Owned |
| 2004 Annual Meeting of Shareholders |


