NASDAQ: FCBC February 2011 www.fcbinc.com
Forward -Looking Disclosures This presentation may include forward-looking statements. These forward-looking statements are based on current expectations that involve risks, uncertainties and assumptions . Should one or more of these risks or uncertainties materialize or should underlying assumptions prove incorrect, actual results may differ materially . These risks include: changes in business or other market conditions; the timely development, production and acceptance of new products and services; the challenge of managing asset/liability levels; the management of credit risk and interest rate risk; the difficult y of keeping expense growth at modest levels while increasin g revenues; and other risks detailed from time to time in the Company’s Securities and Exchange Commission reports, including but not limited to the Annual Report on Form 10-K for the most recent year ended. Pursuant to the Private Securities Litigation Reform Act of 1995, the Company does not undertake to update forward -looking statements contained within this presentation.
First Community Bancshares Overview
Investment Highlights A $2.2 billion VA, WV, NC and TN branch franchise – 138 years of continuous operation – Strong history of core earnings and dividend payments – Robust market share in legacy markets and attractive expansion into growth markets – Positioned as regional consolidator – Legacy markets benefit from both economic stability and limited real estate price volatility Strong culture of management and employee ownershi p – Established and experienced management team with average tenure of 17 years – Insider ownership of 7% True retail franchise generating low cost core deposits – Over 117,650 customer accounts with Q4 2010 average cost of all funds of 1.39%, below peer average of 1.43%
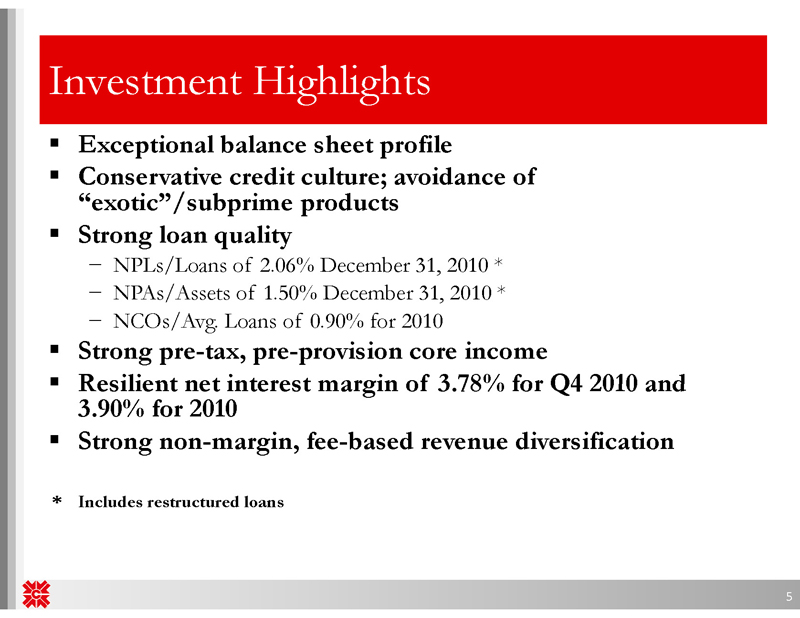
Investment Highlights Exceptional balance sheet profile Conservative credit culture; avoidance of “exotic”/subprime products Strong loan quality NPLs/Loans of 2.06% December 31, 2010 * NPAs/Assets of 1.50% December 31, 2010 * NCOs/Avg . Loans of 0.90% for 2010 Strong pre-tax, pre-provision core income Resilient net interest margin of 3.78% for Q4 2010 and 3.90% for 2010 Strong non-margin, fee-based revenue diversification * Includes restructured loans
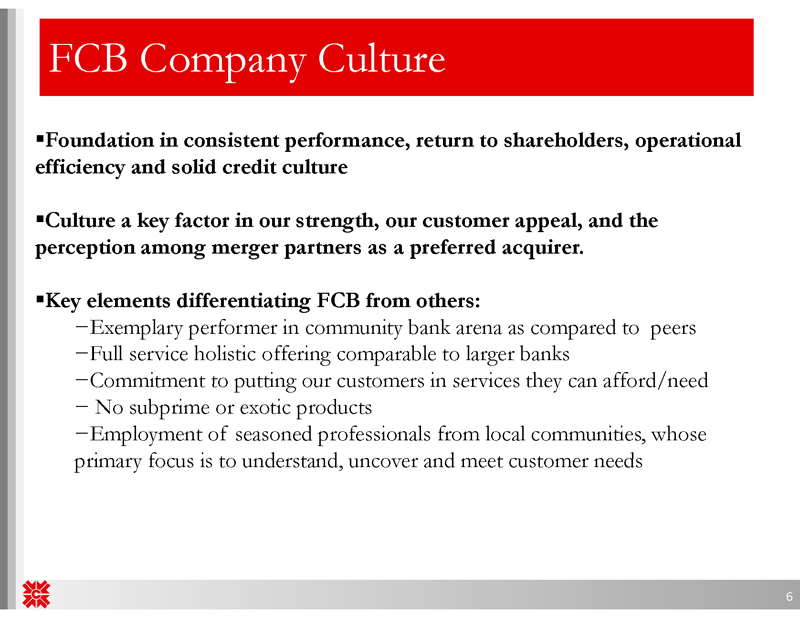
FCB Company Culture Foundation in consistent performance, return to shareholders, operational efficiency and solid credit culture Culture a key factor in our strength, our customer appeal, and the perception among merger partners as a preferred acquirer . Key elements differentiatin g FCB from others: Exemplary performer in community bank arena as compared to peers Full service holistic offering comparable to larger banks Commitment to putting our customers in services they can afford/need No subprime or exotic products Employment of seasoned professionals from local communities, whose primary focus is to understand , uncover and meet customer needs

Current Franchise Overview: Branch Map 68 locations across five states (Virginia, West Virginia, North Carolina, Tennessee and South Carolina ) Attractive mix of urban growth and stable suburban legacy markets Full service, offering financial partnership with our customers Strong growth from organic and acquisition strategies 10.3% 10-year asset CAGR Expanding wealth and insurance lines of business Unique and attractive financial alternative between small community banks with limited services and impersonal regional and national banks Attract new deposit relationships from big bank fallout and weakened players Legacy Markets
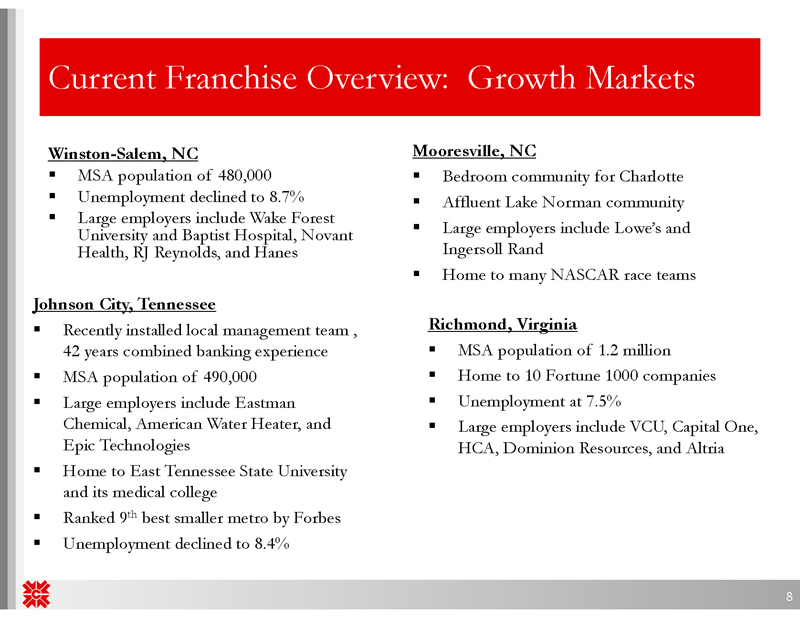
Current Franchise Overview: Growth Markets Winston -Salem, NC Mooresville , NC MSA population of 480,000 Bedroom community for Charlotte Unemployment declined to 8.7% Affluent Lake Norman community Large employers include Wake Forest University and Baptist Hospital , Novant Large employers include Lowe’s and Health, RJ Reynolds, and Hanes Ingersoll Rand Home to many NASCAR race teams Johnson City, Tennessee Recently installed local management team , Richmond, Virginia 42 years combined banking experience MSA population of 1.2 million MSA population of 490,000 Home to 10 Fortune 1000 companies Large employers include Eastman Unemployment at 7.5% Chemical, American Water Heater, and Large employers include VCU, Capital One, Epic Technologies HCA, Dominion Resources, and Altria Home to East Tennessee State University and its medical college Ranked 9th best smaller metro by Forbes Unemployment declined to 8.4%
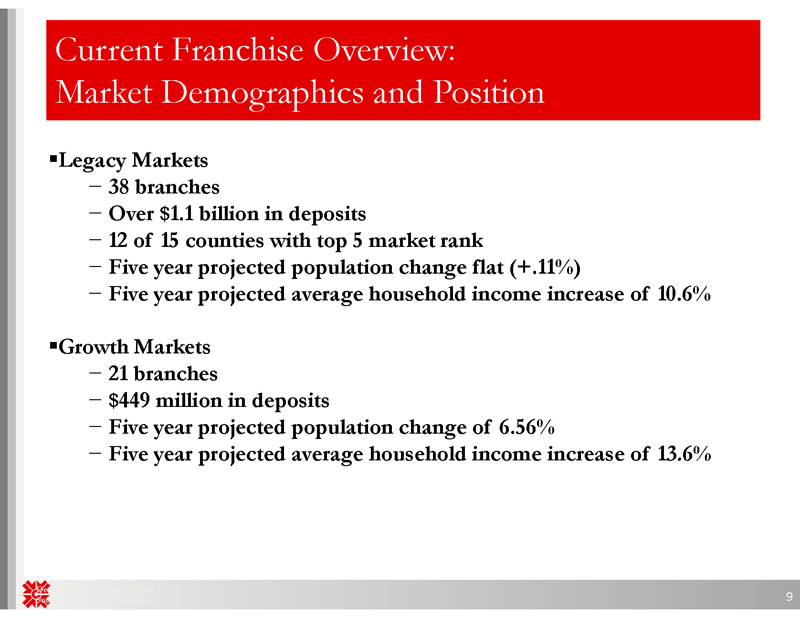
Current Franchise Overview: Market Demograp hics and Position Legacy Markets 38 branches Over $1.1 billion in deposits 12 of 15 counties with top 5 market rank Five year projected population change flat (+.11%) Five year projected average household income increase of 10.6% Growth Markets 21 branches $449 million in deposits Five year projected population change of 6.56% Five year projected average household income increase of 13.6%
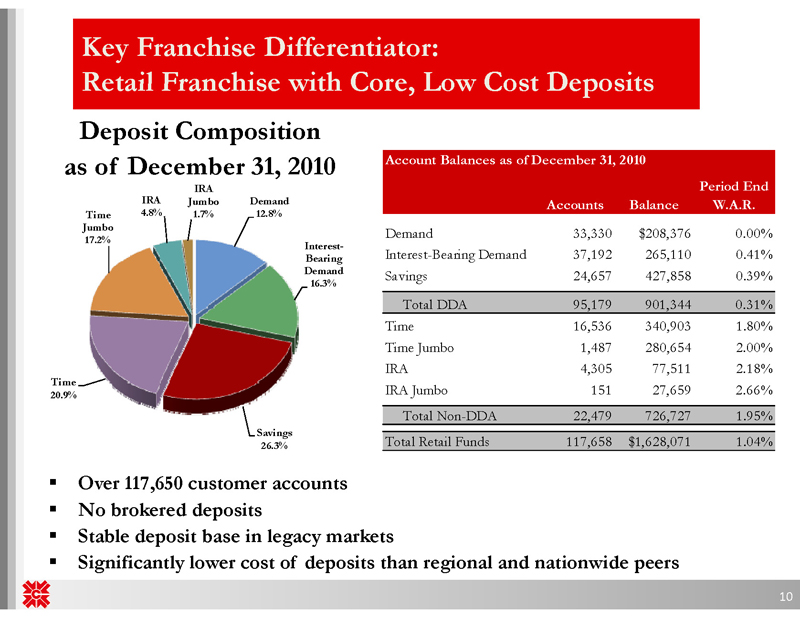
Key Franchise Differentiator: Retail Franchise with Core, Low Cost Deposits Deposit Composition as of December 31, 2010 IRA IRA Jumbo Demand Time 4.8% 1.7% 12.8% Jumbo 17.2% Interest -Bearing Demand 16.3% Time 20.9% Savings 26.3% Account Balances as of December 31, 2010 Period End Accounts Balance W.A.R. Demand 33,330 $208,376 0.00% Interest-Bearing Demand 37,192 265,110 0.41% Savings 24,657 427,858 0.39% Total DDA 95,179 901,344 0.31% Time 16,536 340,903 1.80% Time Jumbo 1,487 280,654 2.00% IRA 4,305 77,511 2.18% IRA Jumbo 151 27,659 2.66% Total Non-DDA 22,479 726,727 1.95% Total Retail Funds 117,658 $1,628,071 1.04% Over 117,650 customer accounts No brokered deposits Stable deposit base in legacy markets Significantly lower cost of deposits than regional and nationwide peers

Strategic Priorities Substantial growth opportunity Targeted strategic bank acquisitions Fill in primary markets Attractive price levels FDIC-assisted transactions Possible larger transactions Primary and secondary markets Build presence in mid-Atlantic region Capitalize on in-market transactions Enhance marketing capabilities Continue diversification of revenues Acquisition of insurance agencies Populate primary markets Achieve greater integration with bank services Build wealth management organically Build premier financial services firm Capability with community bank flavor Refine, integrate, and polish service levels and processes Enhance customer solutions capability
FDIC Opportunities Objectives – One or more transactions within our primary or secondary markets – Lead growth / improve market presence – Accretion to EPS Planning and Process – Developed integration plan using internal and external resources – Participated in multiple due diligence sessions and submitted one non-winning bid Five-state field of opportunity – Able to cast a wide net for strategic and fill-in acquisitions
FDIC Opportunities Why will we be successful? – Strong partner, appealing philosophy & culture – Well-suited geographically – History as an integrator – Completed 25 deals in 27 years – Two healthy bank transactions in the last 25 months – High number of emerging opportunities
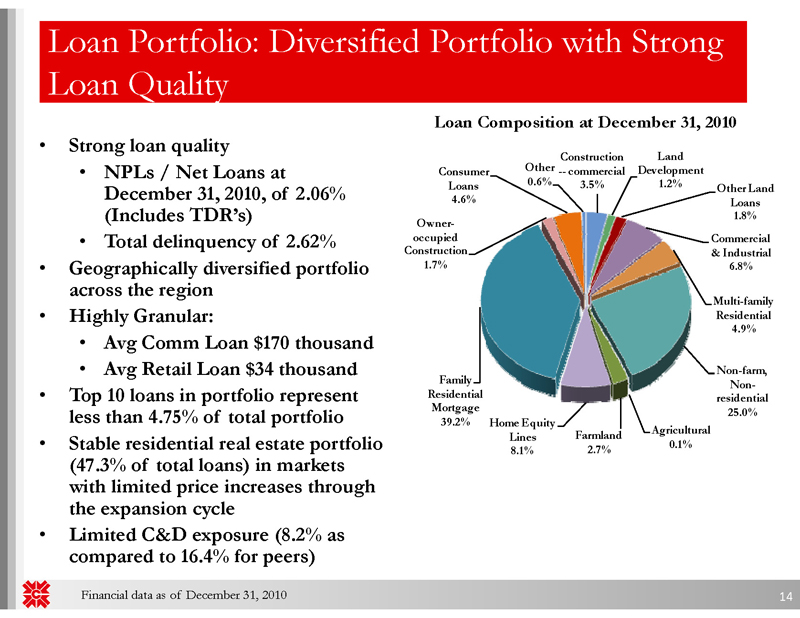
Loan Portfolio: Diversified Portfolio with Strong Loan Quality • Strong loan quality • NPLs / Net Loans at December 31, 2010, of 2.06% (Includes TDR’s) • Total delinquency of 2.62% • Geographically diversified portfolio across the region • Highly Granular: • Avg Comm Loan $170 thousand • Avg Retail Loan $34 thousand • Top 10 loans in portfolio represent less than 4.75% of total portfolio • Stable residential real estate portfolio (47.3% of total loans) in markets with limited price increases through the expansion cycle • Limited C&D exposure (8.2% as compared to 16.4% for peers) Financial data as of December 31, 2010 Loan Composition at December 31, 2010 Construction Land Consumer Other -- commercial Development Loans 0.6% 3.5% 1.2% Other Land 4.6% Loans 1.8% Owner-occupied Commercial Construction & Industrial 1.7% 6.8% Multi-family Residential 4.9% Non-farm, Family Non-Residential residential Mortgage 25.0% 39.2% Home Equity Agricultural Lines Farmland 0.1% 8.1% 2.7%
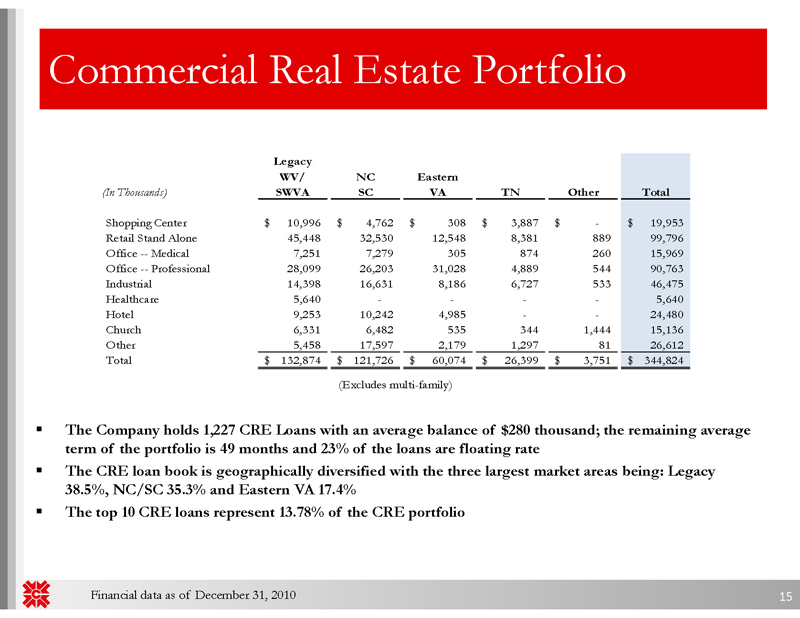
Commercial Real Estate Portfolio Legacy WV/ NC Eastern (In Thousands) SWVA SC VA TN Other Total Shopping Center $ 10,996 $ 4,762 $ 308 $ 3,887 $ - $ 19,953 Retail Stand Alone 45,448 32,530 12,548 8,381 889 99,796 Office -- Medical 7,251 7,279 305 874 260 15,969 Office -- Professional 28,099 26,203 31,028 4,889 544 90,763 Industrial 14,398 16,631 8,186 6,727 533 46,475 Healthcare 5,640 - - - - 5,640 Hotel 9,253 10,242 4,985 - - 24,480 Church 6,331 6,482 535 344 1,444 15,136 Other 5,458 17,597 2,179 1,297 81 26,612 Total $ 132,874 $ 121,726 $ 60,074 $ 26,399 $ 3,751 $ 344,824 (Excludes multi-family) The Company holds 1,227 CRE Loans with an average balance of $280 thousand; the remaining average term of the portfolio is 49 months and 23% of the loans are floating rate The CRE loan book is geographically diversified with the three largest market areas being: Legacy 38.5%, NC/SC 35.3% and Eastern VA 17.4% The top 10 CRE loans represent 13.78% of the CRE portfolio
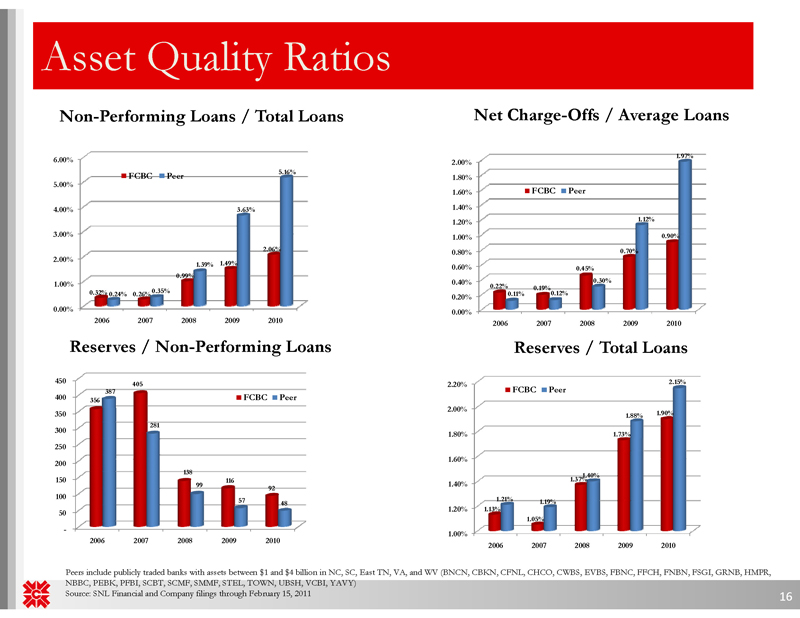
Asset Quality Ratios Non -Performing Loans / Total Loans Net Charge -Offs / Average Loans 1.97% 6.00% 2.00% FCBC Peer 5.16% 1.80% 5.00% 1.60% FCBC Peer 4.00% 3.63% 1.40% 1.20% 1.12% 3.00% 1.00% 0.90% 2.06% 0.80% 0.70% 2.00% 1.39% 1.49% 0.60% 0.45% 0.99% 0.40% 0.30% 1.00% 0.22% 0.19% 0.32% 0.35% 0.11% 0.12% 0.24% 0.26% 0.20% 0.00% 0.00% 2006 2007 2008 2009 2010 2006 2007 2008 2009 2010 Reserves / Non -Performing Loans Reserves / Total Loans 450 405 2.15% 2.20% 387 FCBC Peer 400 356 FCBC Peer 2.00% 350 1.88% 1.90% 281 300 1.80% 1.73% 250 1.60% 200 138 1.40% 150 116 1.37% 99 1.40% 92 100 1.21% 57 48 1.19% 1.20% 1.13% 50 1.05% -1.00% 2006 2007 2008 2009 2010 2006 2007 2008 2009 2010 Peers include publicly traded banks with assets between $1 and $4 billion in NC, SC, East TN, VA, and WV (BNCN, CBKN, CFNL, CHCO, CWBS, EVBS, FBNC, FFCH, FNBN, FSGI, GRNB, HMPR, NBBC, PEBK, PFBI, SCBT, SCMF, SMMF, STEL, TOWN, UBSH, VCBI, YAVY) Source: SNL Financial and Company filings through February 15, 2011
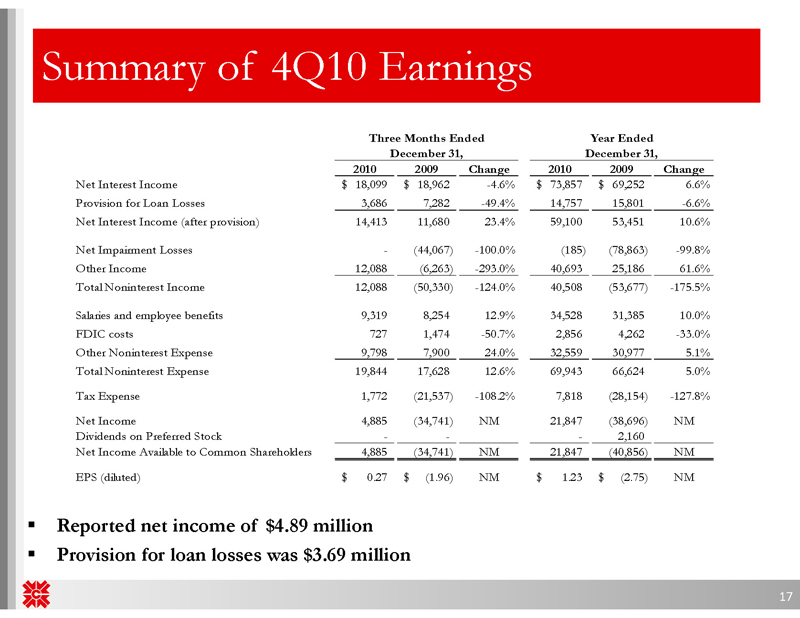
Summar y of 4Q10 Earnings Three Months Ended Year Ended December 31, December 31, 2010 2009 Change 2010 2009 Change Net Interest Income $ 18,099 $ 18,962 -4.6% $ 73,857 $ 69,252 6.6% Provision for Loan Losses 3,686 7,282 -49.4% 14,757 15,801 -6.6% Net Interest Income (after provision) 14,413 11,680 23.4% 59,100 53,451 10.6% Net Impairment Losses - (44,067) -100.0% (185) (78,863) -99.8% Other Income 12,088 (6,263) -293.0% 40,693 25,186 61.6% Total Noninterest Income 12,088 (50,330) -124.0% 40,508 (53,677) -175.5% Salaries and employee benefits 9,319 8,254 12.9% 34,528 31,385 10.0% FDIC costs 727 1,474 -50.7% 2,856 4,262 -33.0% Other Noninterest Expense 9,798 7,900 24.0% 32,559 30,977 5.1% Total Noninterest Expense 19,844 17,628 12.6% 69,943 66,624 5.0% Tax Expense 1,772 (21,537) -108.2% 7,818 (28,154) -127.8% Net Income 4,885 (34,741) NM 21,847 (38,696) NM Dividends on Preferred Stock - - - 2,160 Net Income Available to Common Shareholders 4,885 (34,741) NM 21,847 (40,856) NM EPS (diluted) $ 0.27 $ (1.96) NM $ 1.23 $ (2.75) NM Reported net income of $4.89 million Provision for loan losses was $3.69 million
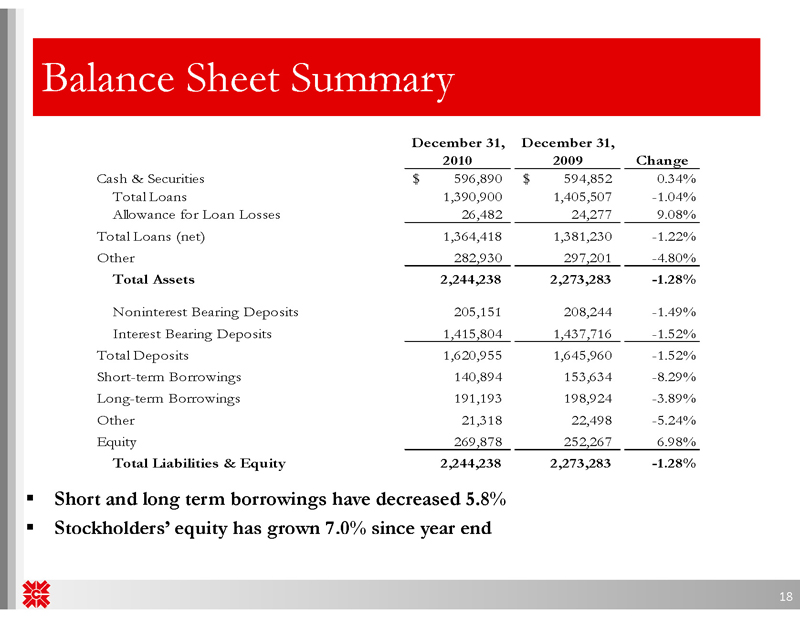
Balance Sheet Summary December 31, December 31, 2010 2009 Change Cash & Securities $ 596,890 $ 594,852 0.34% Total Loans 1,390,900 1,405,507 -1.04% Allowance for Loan Losses 26,482 24,277 9.08% Total Loans (net) 1,364,418 1,381,230 -1.22% Other 282,930 297,201 -4.80% Total Assets 2,244,238 2,273,283 -1.28% Noninterest Bearing Deposits 205,151 208,244 -1.49% Interest Bearing Deposits 1,415,804 1,437,716 -1.52% Total Deposits 1,620,955 1,645,960 -1.52% Short-term Borrowin gs 140,894 153,634 -8.29% Long-term Borrowings 191,193 198,924 -3.89% Other 21,318 22,498 -5.24% Equity 269,878 252,267 6.98% Total Liabilities & Equity 2,244,238 2,273,283 -1.28% Short and long term borrowings have decreased 5.8% Stockholders’ equity has grown 7.0% since year end

Financial Performance Highlights: Efficiency , Cost of Funds, Net Interest Margin 69.74% 70% FCBC Peer 66.49% 65.58% 65% Efficiency 62.20% 62.20% 61.90% 60% 59.23% 59.21% 55% 51.30% 51.40% 50% Cost of Funds 2006 2007 2008 2009 2010 Net Interest Margin 3.46% 3.50% 4.50% FCBC Peer 3.14% 4.29% 3.25% FCBC Peer 4.22% 2.93% 4.25% 3.00% 2.85% 4.06% 2.75% 2.75% 4.00% 3.90% 3.88% 2.46% 3.80% 2.50% 3.74% 3.75% 3.64% 2.25% 3.61% 2.08% 1.97% 2.00% 3.50% 3.38% 1.75% 1.56% 1.50% 3.25% 1.50% 1.25% 3.00% 2006 2007 2008 2009 2010 2006 2007 2008 2009 2010 Peers include publicly traded banks with assets between $1 and $4 billion in NC, SC, East TN, VA, and WV (BNCN, CBKN, CFNL, CHCO, CWBS, EVBS, FBNC, FFCH, FNBN, FSGI, GRNB, HMPR, NBBC, PEBK, PFBI, SCBT, SCMF, SMMF, STEL, TOWN, UBSH, VCBI, YAVY) Source: SNL Financial and Company filings through February 15, 2011
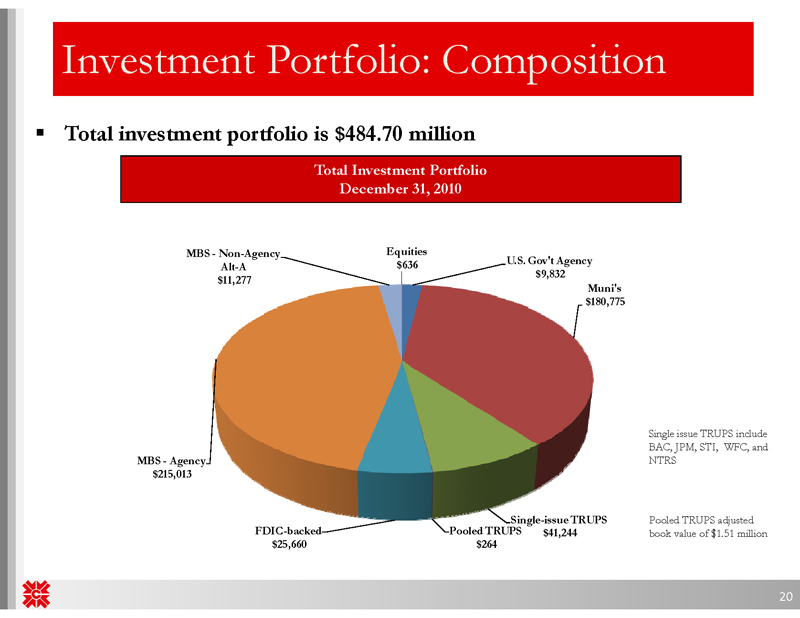
Investment Portfolio: Composition Total investment portfolio is $484.70 million Total Investment Portfolio December 31, 2010 Single issue TRUPS include BAC, JPM, STI, WFC, and NTRS Pooled TRUPS adjusted book value of $1.51 million MBS - Non-Agency Equities $636 U.S. Gov't Agency Alt-A $9,832 $11,277 Muni's $180,775 MBS - Agency $215,013 Single-issue TRUPS FDIC-backed Pooled TRUPS $41,244 $25,660 $264
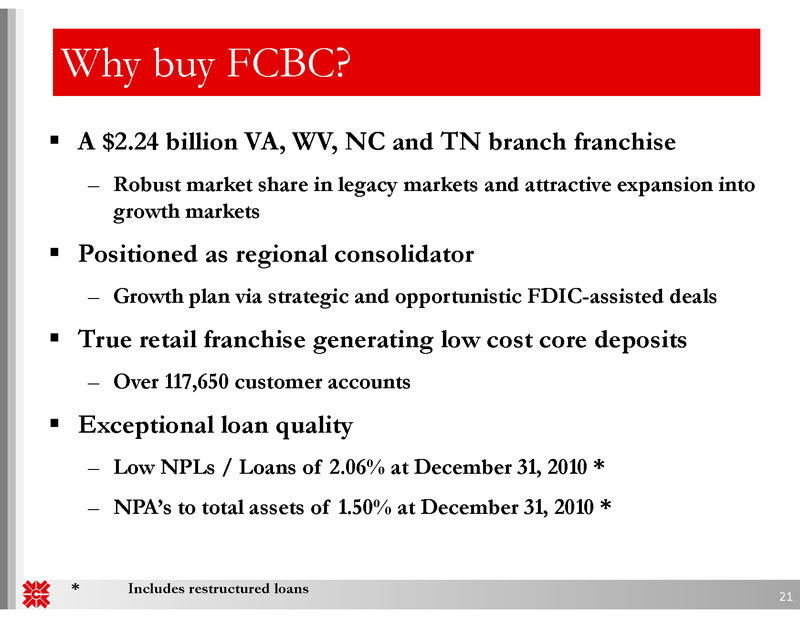
Why buy FCBC? A $2.24 billion VA, WV, NC and TN branch franchise – Robust market share in legacy markets and attractive expansion into growth markets Positioned as regional consolidator – Growth plan via strategic and opportunistic FDIC-assisted deals True retail franchise generating low cost core deposits – Over 117,650 customer accounts Exceptional loan quality – Low NPLs / Loans of 2.06% at December 31, 2010 * – NPA’s to total assets of 1.50% at December 31, 2010 *
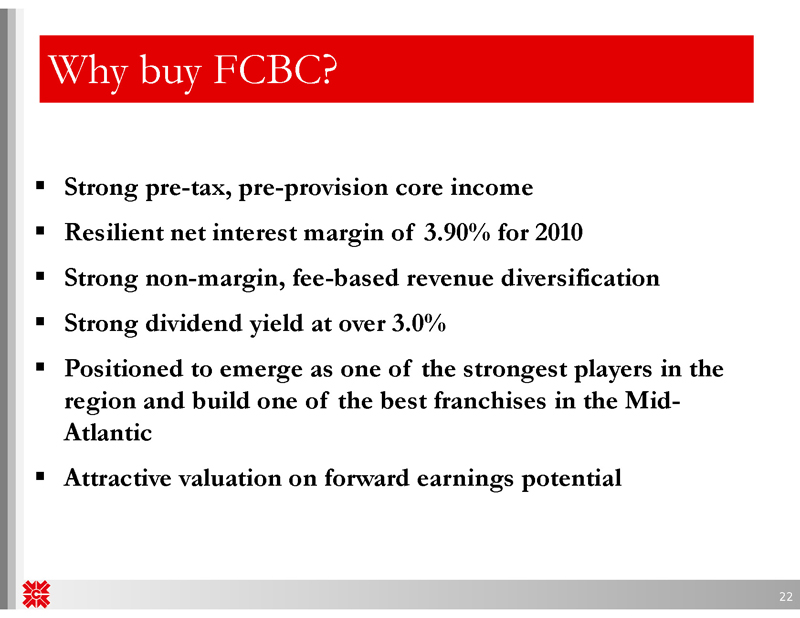
Why buy FCBC? Strong pre-tax, pre-provision core income Resilient net interest margin of 3.90% for 2010 Strong non-margin, fee-based revenue diversification Strong dividend yield at over 3.0% Positioned to emerge as one of the strongest players in the region and build one of the best franchises in the Mid-Atlantic Attractive valuation on forward earnings potential
Supplemental Information
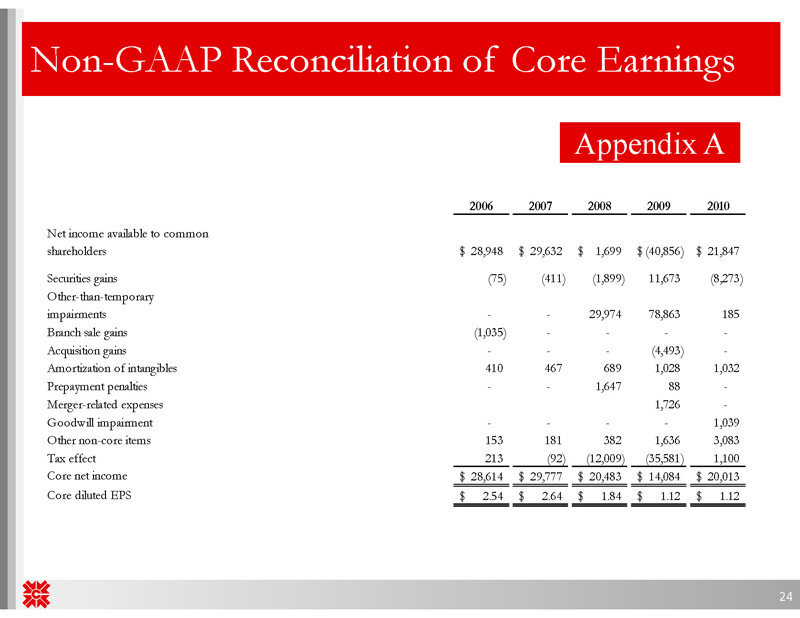
Non-GAAP Reconciliation of Core Earnings Appendix A 2006 2007 2008 2009 2010 Net income available to common shareholders $ 28,948 $ 29,632 $ 1,699 $ (40,856) $ 21,847 Securities gains (75) (411) (1,899) 11,673 (8,273) Other-than-temporary impairments - - 29,974 78,863 185 Branch sale gains (1,035) - - - -Acquisition gains - - - (4,493) -Amortization of intangibles 410 467 689 1,028 1,032 Prepaymen t penalties - - 1,647 88 -Merger-related expenses 1,726 -Goodwill impairment - - - - 1,039 Other non-core items 153 181 382 1,636 3,083 Tax effect 213 (92) (12,009) (35,581) 1,100 Core net income $ 28,614 $ 29,777 $ 20,483 $ 14,084 $ 20,013 Core diluted EPS $ 2.54 $ 2.64 $ 1.84 $ 1.12 $ 1.12

Non-accrual Loans by State Appendix B West North South Virginia Virginia Carolina Tennessee Carolina Other Total (In thousands) Construction -- commercial $ 23 $ - $ 262 $ - $ - $ - $ 285 Land development - - 50 - - - 50 Other land loans 321 - 363 - - - 684 Commercial & Industrial 3,492 38 264 131 - - 3,925 Multi-family residential - - 2,463 - - - 2,463 Non-farm, non-residential 336 739 1,976 1,619 - - 4,670 Agricultural - - - - - - -Farmland - - - - - - -Home equity lines 126 56 686 - - - 868 Family residential mortgage 1,421 1,296 3,526 121 - - 6,364 Owner-occupied construction - - 6 - - - 6 Consumer 19 52 28 - - - 99 Total $ 5,738 $ 2,181 $ 9,624 $ 1,871 $ - $ - $ 19,414
Contact Information First Community Bancshares, Inc. NASDAQ: FCBC One Community Place Bluefield, VA 24605 For More Information Contact: David D. Brown Chief Financial Officer First Community Bancshares, Inc. (276) 326-9000