
1 Keefe, Bruyette & Woods Community Bank Investor Conference July 2013 www.fcbinc.com
First Community Bancshares 2 Nasdaq : FCBC
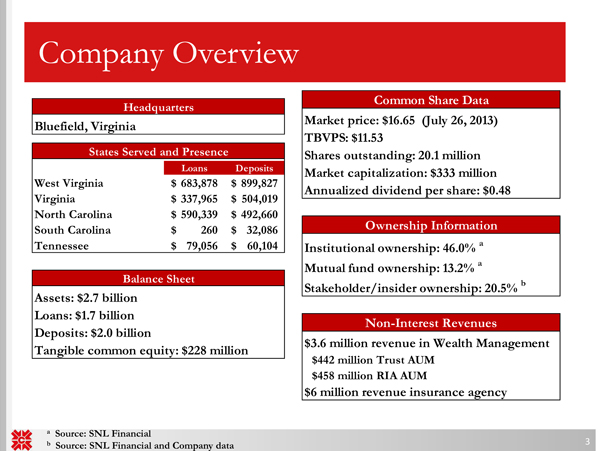
Company Overview 3 a Source : SNL Financial b Source: SNL Financial and Company data Bluefield, Virginia Loans Deposits West Virginia 683,878$ 899,827$ Virginia 337,965$ 504,019$ North Carolina 590,339$ 492,660$ South Carolina 260$ 32,086$ Tennessee 79,056$ 60,104$ Assets: $2.7 billion Loans: $1.7 billion Deposits: $2.0 billion Tangible common equity: $228 million Headquarters Balance Sheet States Served and Presence Market price: $16.65 (July 26, 2013) TBVPS: $11.53 Shares outstanding: 20.1 million Market capitalization: $333 million Annualized dividend per share: $0.48 Institutional ownership: 46.0% a Mutual fund ownership: 13.2% a Stakeholder/insider ownership: 20.5% b $3.6 million revenue in Wealth Management $442 million Trust AUM $458 million RIA AUM $6 million revenue insurance agency Common Share Data Ownership Information Non-Interest Revenues
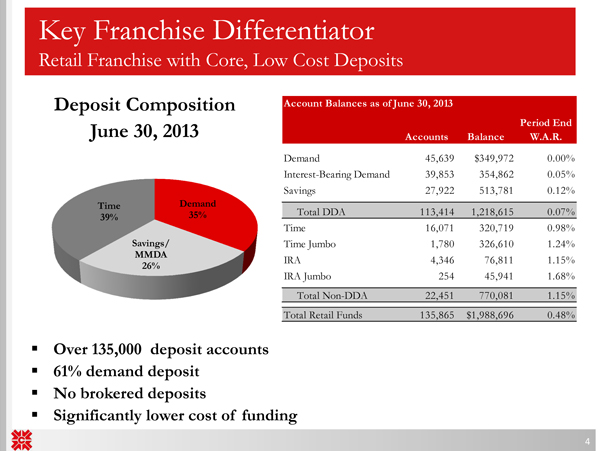
Deposit Composition June 30, 2013 Key Franchise Differentiator Retail Franchise with Core, Low Cost Deposits ▪ Over 135,000 deposit accounts ▪ 61% demand deposit ▪ No brokered deposits ▪ Significantly lower cost of funding Account Balances as of June 30, 2013 Accounts Balance Period End W.A.R. Demand 45,639 $349,972 0.00% Interest-Bearing Demand 39,853 354,862 0.05% Savings 27,922 513,781 0.12% Total DDA 113,414 1,218,615 0.07% Time 16,071 320,719 0.98% Time Jumbo 1,780 326,610 1.24% IRA 4,346 76,811 1.15% IRA Jumbo 254 45,941 1.68% Total Non-DDA 22,451 770,081 1.15% Total Retail Funds 135,865 $1,988,696 0.48% 4 Demand 35% Savings/ MMDA 26% Time 39%
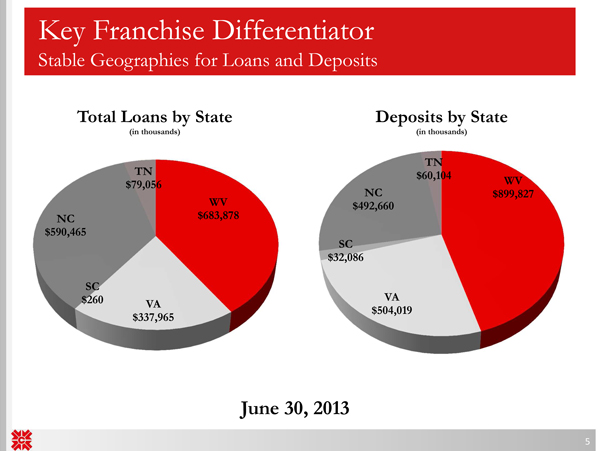
Key Franchise Differentiator Stable Geographies for Loans and Deposits 5 June 30, 2013 WV $899,827 VA $504,019 SC $32,086 NC $492,660 TN $60,104 Deposits by State (in thousands) WV $683,878 VA $337,965 SC $260 NC $590,465 TN $79,056 Total Loans by State (in thousands)
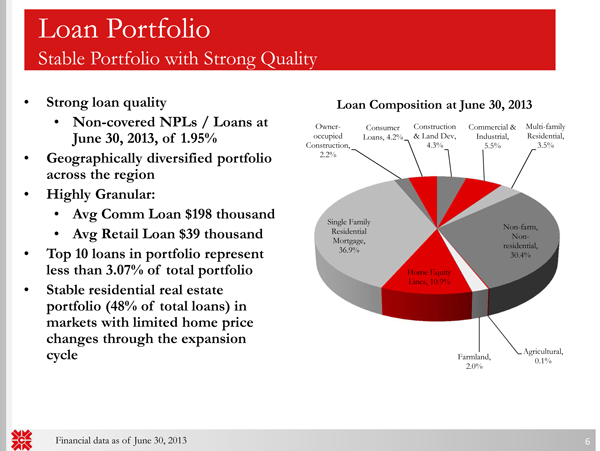
Loan Portfolio Stable Portfolio with Strong Quality • Strong loan quality • Non - covered NPLs / Loans at June 30, 2013, of 1.95% • Geographically diversified portfolio across the region • Highly Granular: • Avg Comm Loan $198 thousand • Avg Retail Loan $39 thousand • Top 10 loans in portfolio represent less than 3.07% of total portfolio • Stable residential real estate portfolio (48% of total loans) in markets with limited home price changes through the expansion cycle Loan Composition at June 30, 2013 Financial data as of June 30, 2013 6 Construction & Land Dev, 4.3% Commercial & Industrial, 5.5% Multi - family Residential, 3.5% Non - farm, Non - residential, 30.4% Agricultural, 0.1% Farmland, 2.0% Home Equity Lines, 10.9% Single Family Residential Mortgage, 36.9% Owner - occupied Construction, 2.2% Consumer Loans, 4.2%
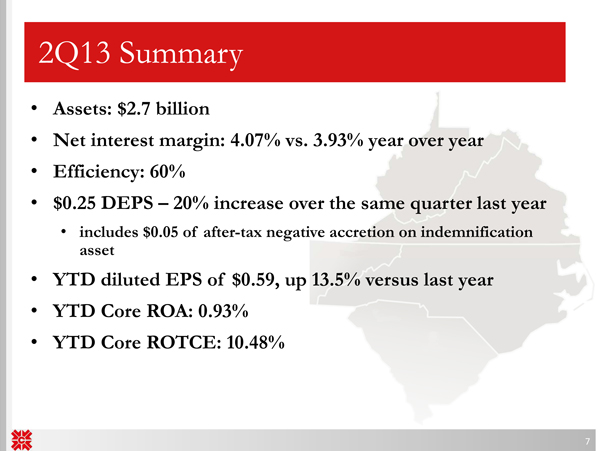
2Q13 Summary • Assets: $2.7 billion • Net interest margin: 4.07% vs. 3.93% year over year • E fficiency: 60% • $0.25 DEPS – 20% increase over the same quarter last year • includes $0.05 of after - tax negative accretion on indemnification asset • YTD diluted EPS of $0.59, up 13.5% versus last year • YTD Core ROA: 0.93% • YTD Core ROTCE : 10.48 % 7
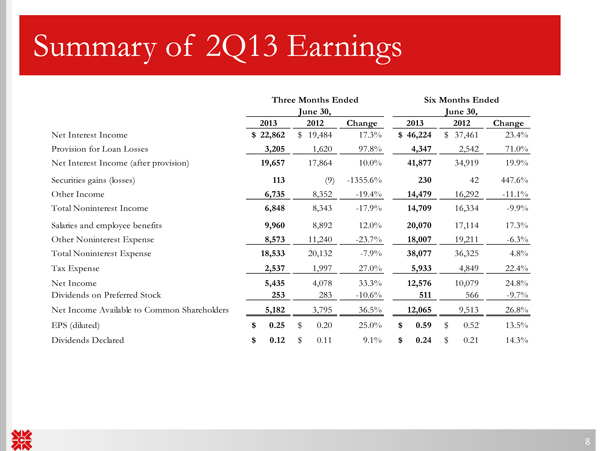
Summary of 2Q13 Earnings Three Months Ended Six Months Ended June 30, June 30, 2013 2012 Change 2013 2012 Change Net Interest Income 22,862$ 19,484$ 17.3% 46,224$ 37,461$ 23.4% Provision for Loan Losses 3,205 1,620 97.8% 4,347 2,542 71.0% Net Interest Income (after provision) 19,657 17,864 10.0% 41,877 34,919 19.9% Securities gains (losses) 113 (9) -1355.6% 230 42 447.6% Other Income 6,735 8,352 -19.4% 14,479 16,292 -11.1% Total Noninterest Income 6,848 8,343 -17.9% 14,709 16,334 -9.9% Salaries and employee benefits 9,960 8,892 12.0% 20,070 17,114 17.3% Other Noninterest Expense 8,573 11,240 -23.7% 18,007 19,211 -6.3% Total Noninterest Expense 18,533 20,132 -7.9% 38,077 36,325 4.8% Tax Expense 2,537 1,997 27.0% 5,933 4,849 22.4% Net Income 5,435 4,078 33.3% 12,576 10,079 24.8% Dividends on Preferred Stock 253 283 -10.6% 511 566 -9.7% Net Income Available to Common Shareholders 5,182 3,795 36.5% 12,065 9,513 26.8% EPS (diluted) 0.25$ 0.20$ 25.0% 0.59$ 0.52$ 13.5% Dividends Declared 0.12$ 0.11$ 9.1% 0.24$ 0.21$ 14.3% 8
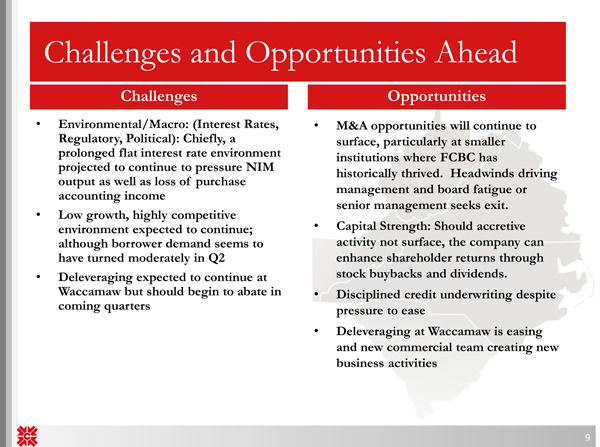
Challenges and Opportunities Ahead • Environmental/Macro: (Interest Rates, Regulatory, Political): Chiefly, a prolonged flat interest rate environment projected to continue to pressure NIM output as well as loss of purchase accounting income • Low growth, highly competitive environment expected to continue; although borrower demand seems to have turned moderately in Q2 • Deleveraging expected to continue at Waccamaw but should begin to abate in coming quarters 9 • M&A opportunities will continue to surface, particularly at smaller institutions where FCBC has historically thrived. Headwinds driving management and board fatigue or senior management seeks exit. • Capital Strength: Should accretive activity not surface, the company can enhance shareholder returns through stock buybacks and dividends . • Disciplined credit underwriting despite pressure to ease • Deleveraging at Waccamaw is easing and new commercial team creating new business activities Challenges Opportunities
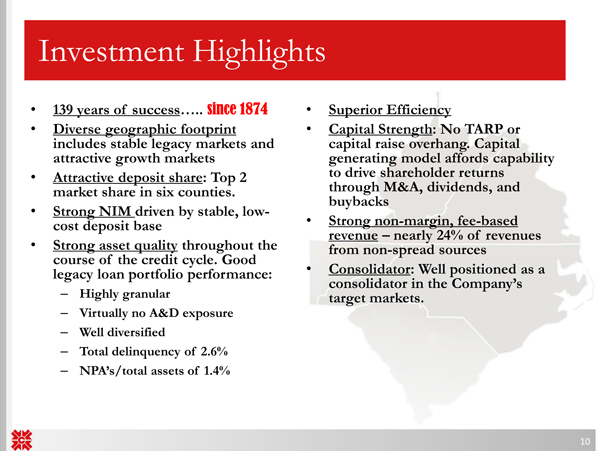
Investment Highlights • 139 years of success ….. since 1874 • Diverse geographic footprint includes stable legacy markets and attractive growth markets • Attractive deposit share : Top 2 market share in six counties. • Strong NIM driven by s table , low - cost deposit base • Strong asset quality throughout the course of the credit cycle. Good legacy loan portfolio performance: – Highly granular – Virtually no A&D exposure – Well diversified – Total delinquency of 2.6% – NPA’s/total assets of 1.4% 10 • Superior Efficiency • Capital Strength : No TARP or capital raise overhang. Capital generating model affords capability to drive shareholder returns through M&A, dividends , and buybacks • Strong non - margin, fee - based revenue – nearly 24% of revenues from non - spread sources • Consolidator : Well positioned as a consolidator in the Company’s target markets .
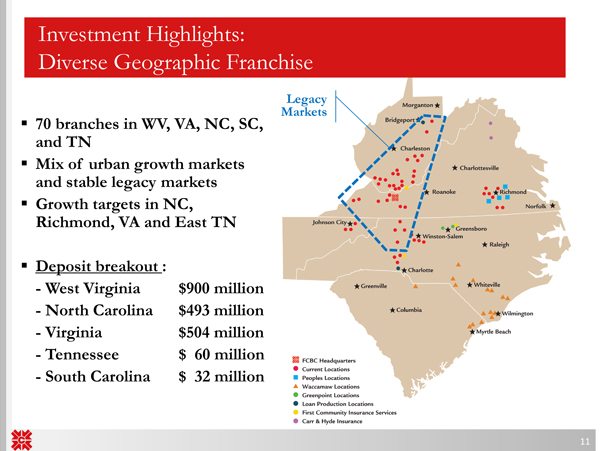
▪ 70 branches in WV, VA, NC, SC, and TN ▪ Mix of urban growth markets and stable legacy markets ▪ Growth targets in NC, Richmond, VA and East TN ▪ Deposit breakout : - West Virginia $900 million - North Carolina $493 million - Virginia $504 million - Tennessee $ 60 million - South Carolina $ 32 million Investment Highlights: Diverse Geographic Franchise Legacy Markets 11
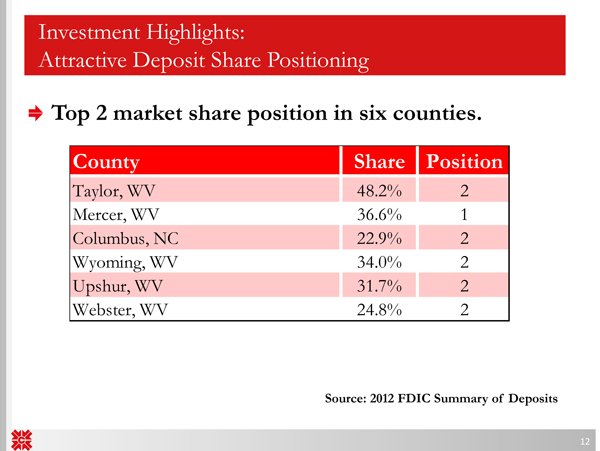
Investment Highlights: Attractive Deposit Share Positioning 12 Source: 2012 FDIC Summary of Deposits County Share Position Taylor, WV 48.2% 2 Mercer, WV 36.6% 1 Columbus, NC 22.9% 2 Wyoming, WV 34.0% 2 Upshur, WV 31.7% 2 Webster, WV 24.8% 2 Top 2 market share position in six counties.
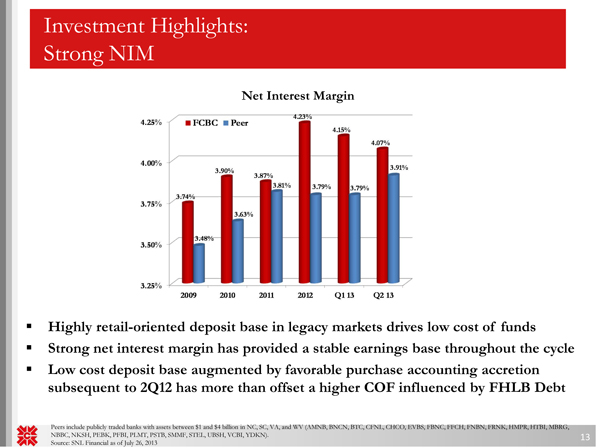
Investment Highlights: Strong NIM Peers include publicly traded banks with assets between $1 and $4 billion in NC, SC, VA, and WV (AMNB, BNCN, BTC, CFNL, CHCO, EVBS , FBNC, FFCH, FNBN, FRNK, HMPR, HTBI, MBRG, NBBC, NKSH, PEBK, PFBI, PLMT, PSTB, SMMF , STEL, UBSH, VCBI, YDKN). Source: SNL Financial as of July 26, 2013 13 ▪ Highly retail - oriented deposit base in legacy markets drives low cost of funds ▪ Strong net interest margin has provided a stable earnings base throughout the cycle ▪ Low cost d eposit b ase augmented by favorable purchase a ccounting accretion subsequent to 2Q12 has m ore than offset a higher COF influenced by FHLB Debt 3.25% 3.50% 3.75% 4.00% 4.25% 2009 2010 2011 2012 Q1 13 Q2 13 3.74% 3.90% 3.87% 4.23% 4.15% 4.07% 3.48% 3.63% 3.81% 3.79% 3.79% 3.91% FCBC Peer Net Interest Margin
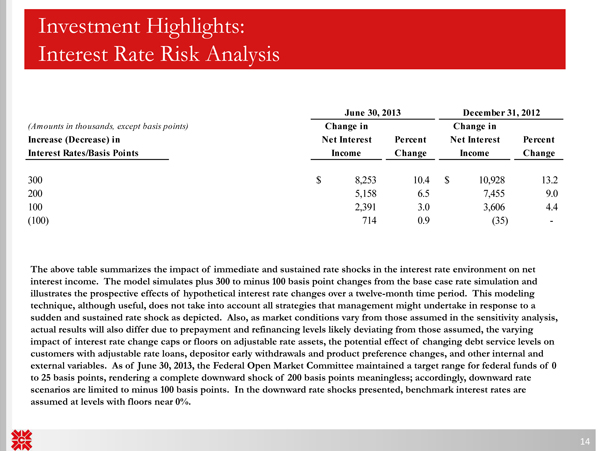
Investment Highlights: Interest Rate Risk Analysis 14 The above table summarizes the impact of immediate and sustained rate shocks in the interest rate environment on net interest income . The model simulates plus 300 to minus 100 basis point changes from the base case rate simulation and illustrates the prospective effects of hypothetical interest rate changes over a twelve - month time period . This modeling technique, although useful, does not take into account all strategies that management might undertake in response to a sudden and sustained rate shock as depicted . Also, as market conditions vary from those assumed in the sensitivity analysis, actual results will also differ due to prepayment and refinancing levels likely deviating from those assumed, the varying impact of interest rate change caps or floors on adjustable rate assets, the potential effect of changing debt service levels on customers with adjustable rate loans, depositor early withdrawals and product preference changes, and other internal and external variables. As of June 30, 2013, the Federal Open Market Committee maintained a target range for federal funds of 0 to 25 basis points, rendering a complete downward shock of 200 basis points meaningless; accordingly, downward rate scenarios are limited to minus 100 basis points . In the downward rate shocks presented, benchmark interest rates are assumed at levels with floors near 0%. June 30, 2013 December 31, 2012 (Amounts in thousands, except basis points) Change in Change in Increase (Decrease) in Net Interest Percent Net Interest Percent Interest Rates/Basis Points Income Change Income Change 300 8,253$ 10.4 10,928$ 13.2 200 5,158 6.5 7,455 9.0 100 2,391 3.0 3,606 4.4 (100) 714 0.9 (35) -
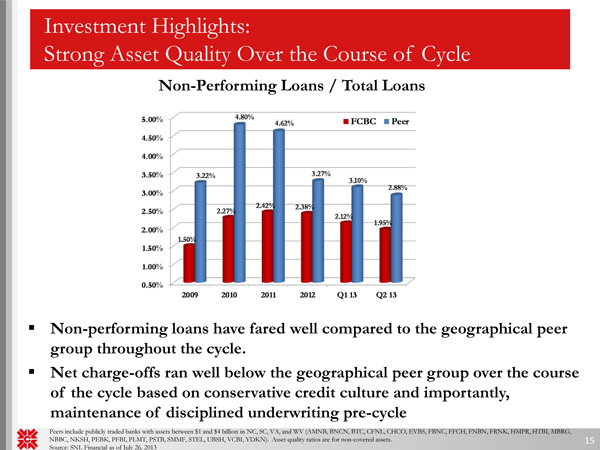
0.50% 1.00% 1.50% 2.00% 2.50% 3.00% 3.50% 4.00% 4.50% 5.00% 2009 2010 2011 2012 Q1 13 Q2 13 1.50% 2.27% 2.42% 2.38% 2.12% 1.95% 3.22% 4.80% 4.62% 3.27% 3.10% 2.88% FCBC Peer Investment Points: Quality Ratios Non - Performing Loans / Total Loans Peers include publicly traded banks with assets between $1 and $4 billion in NC, SC, VA , and WV (AMNB, BNCN , BTC, CFNL , CHCO, EVBS , FBNC, FFCH, FNBN, FRNK, HMPR , HTBI, MBRG, NBBC , NKSH, PEBK , PFBI , PLMT, PSTB, SMMF , STEL , UBSH, VCBI, YDKN). Asset quality ratios are for non - covered assets. Source: SNL Financial as of July 26, 2013 15 ▪ Non - performing loans have fared well compared to the geographical peer group throughout the cycle. ▪ Net charge - offs ran well below the geographical peer group over the course of the cycle based on conservative credit culture and importantly, maintenance of disciplined underwriting pre - cycle Investment Highlights: Strong Asset Quality Over the Course of Cycle
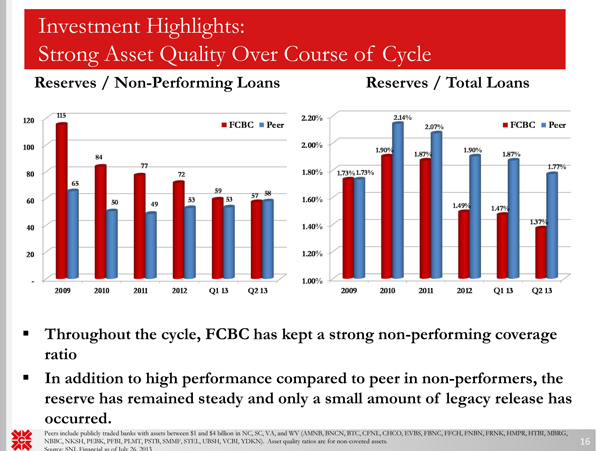
Reserves / Non - Performing Loans Reserves / Total Loans Peers include publicly traded banks with assets between $1 and $4 billion in NC, SC, VA, and WV (AMNB, BNCN, BTC, CFNL, CHCO, EVBS , FBNC, FFCH, FNBN, FRNK, HMPR, HTBI, MBRG, NBBC, NKSH, PEBK, PFBI, PLMT, PSTB , SMMF, STEL, UBSH, VCBI, YDKN). Asset quality ratios are for non - covered assets. Source: SNL Financial as of July 26, 2013 - 20 40 60 80 100 120 2009 2010 2011 2012 Q1 13 Q2 13 115 84 77 72 59 57 65 50 49 53 53 58 FCBC Peer 16 1.00% 1.20% 1.40% 1.60% 1.80% 2.00% 2.20% 2009 2010 2011 2012 Q1 13 Q2 13 1.73% 1.90% 1.87% 1.49% 1.47% 1.37% 1.73% 2.14% 2.07% 1.90% 1.87% 1.77% FCBC Peer ▪ Throughout the cycle, FCBC has kept a strong non - performing coverage ratio ▪ In addition to high performance compared to peer in non - performers, the reserve has remained steady and only a small amount of legacy release has occurred. Investment Highlights: Strong Asset Quality Over Course of Cycle
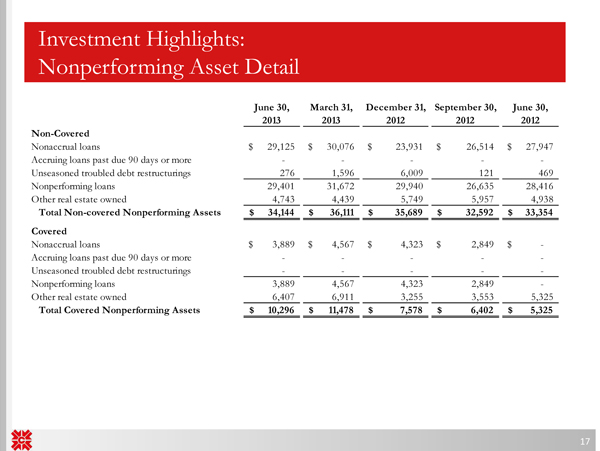
Investment Highlights: Nonperforming Asset Detail 17 June 30, March 31, December 31, September 30, June 30, 2013 2013 2012 2012 2012 Non-Covered Nonaccrual loans 29,125$ 30,076$ 23,931$ 26,514$ 27,947$ Accruing loans past due 90 days or more - - - - - Unseasoned troubled debt restructurings 276 1,596 6,009 121 469 Nonperforming loans 29,401 31,672 29,940 26,635 28,416 Other real estate owned 4,743 4,439 5,749 5,957 4,938 Total Non-covered Nonperforming Assets 34,144$ 36,111$ 35,689$ 32,592$ 33,354$ Covered Nonaccrual loans 3,889$ 4,567$ 4,323$ 2,849$ -$ Accruing loans past due 90 days or more - - - - - Unseasoned troubled debt restructurings - - - - - Nonperforming loans 3,889 4,567 4,323 2,849 - Other real estate owned 6,407 6,911 3,255 3,553 5,325 Total Covered Nonperforming Assets 10,296$ 11,478$ 7,578$ 6,402$ 5,325$
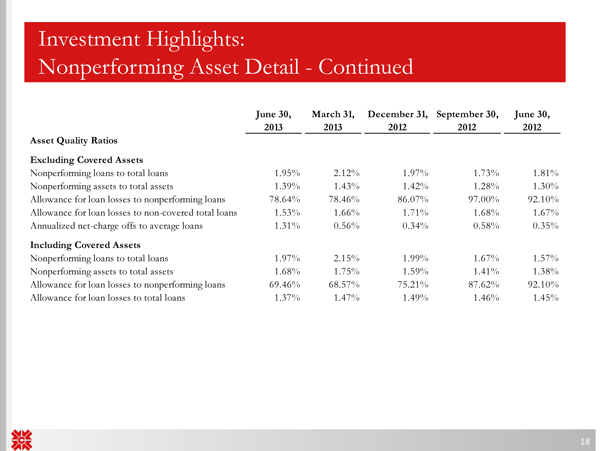
Investment Highlights: Nonperforming Asset Detail - Continued 18 June 30, March 31, December 31, September 30, June 30, 2013 2013 2012 2012 2012 Asset Quality Ratios Excluding Covered Assets Nonperforming loans to total loans 1.95% 2.12% 1.97% 1.73% 1.81% Nonperforming assets to total assets 1.39% 1.43% 1.42% 1.28% 1.30% Allowance for loan losses to nonperforming loans 78.64% 78.46% 86.07% 97.00% 92.10% Allowance for loan losses to non-covered total loans 1.53% 1.66% 1.71% 1.68% 1.67% Annualized net-charge offs to average loans 1.31% 0.56% 0.34% 0.58% 0.35% Including Covered Assets Nonperforming loans to total loans 1.97% 2.15% 1.99% 1.67% 1.57% Nonperforming assets to total assets 1.68% 1.75% 1.59% 1.41% 1.38% Allowance for loan losses to nonperforming loans 69.46% 68.57% 75.21% 87.62% 92.10% Allowance for loan losses to total loans 1.37% 1.47% 1.49% 1.46% 1.45%
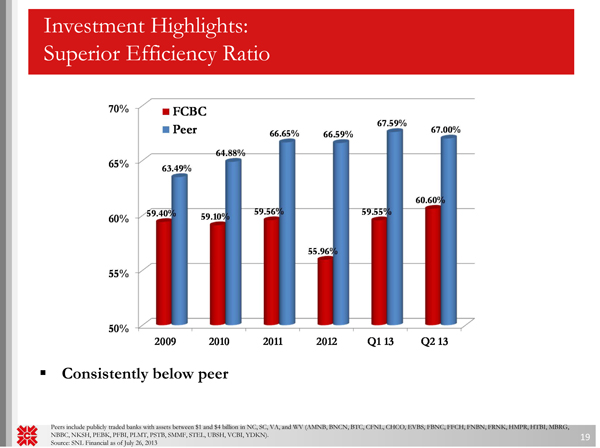
50% 55% 60% 65% 70% 2009 2010 2011 2012 Q1 13 Q2 13 59.40% 59.10% 59.56% 55.96% 59.55% 60.60% 63.49% 64.88% 66.65% 66.59% 67.59% 67.00% FCBC Peer Peers include publicly traded banks with assets between $1 and $4 billion in NC, SC, VA, and WV (AMNB, BNCN, BTC, CFNL, CHCO, EVBS , FBNC, FFCH, FNBN, FRNK, HMPR, HTBI, MBRG, NBBC, NKSH, PEBK, PFBI, PLMT, PSTB , SMMF, STEL, UBSH, VCBI, YDKN). Source : SNL Financial as of July 26, 2013 19 ▪ Consistently below peer Investment Highlights: Superior Efficiency Ratio
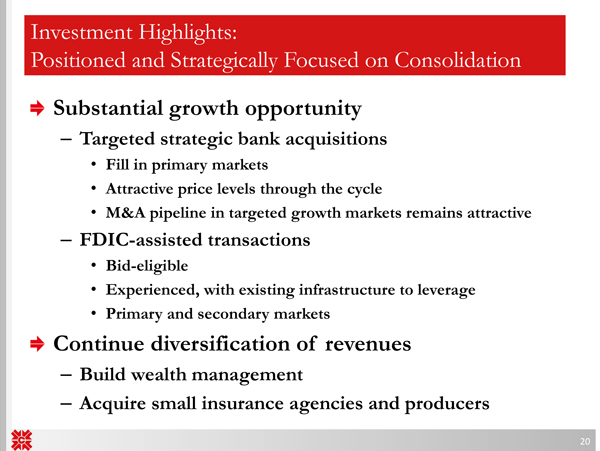
Investment Highlights: Positioned and Strategically Focused on Consolidation Substantial growth opportunity – Targeted strategic bank acquisitions • Fill in primary markets • Attractive price levels through the cycle • M&A pipeline in targeted growth markets remains attractive – FDIC - assisted transactions • Bid - eligible • Experienced, with existing infrastructure to leverage • Primary and secondary markets Continue diversification of revenues – Build wealth management – Acquire small insurance agencies and producers 20

Peoples Bank of Virginia Transaction Rationale □ In - market acquisition consistent with FCBC’s Merger & Acquisition strategy □ Created 10 th largest Virginia - based bank by deposits in the Richmond market □ Strong cultural fit 21 Strategic Rationale Financially Attractive Low Risk Profile □ Exceeded Merger & Acquisition performance targets □ Immediately accretive to EPS □ Modest tangible book value dilution with earnback period of 3 – 4 years □ Significant expense synergies □ Post - closing consolidated capital and liquidity ratios remained strong □ Comprehensive due diligence completed including rigorous review of loan and OREO portfolios □ Conservative credit mark
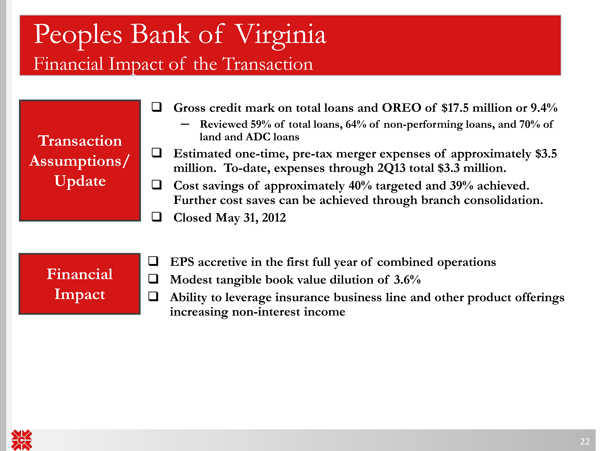
Peoples Bank of Virginia Financial Impact of the Transaction 22 Transaction Assumptions/ Update Financial Impact □ EPS accretive in the first full year of combined operations □ Modest tangible book value dilution of 3.6% □ Ability to leverage insurance business line and other product offerings increasing non - interest income □ Gross credit mark on total loans and OREO of $17.5 million or 9.4% ─ Reviewed 59% of total loans, 64% of non - performing loans, and 70% of land and ADC loans □ Estimated one - time, pre - tax merger expenses of approximately $3.5 million. To - date, expenses through 2Q13 total $3.3 million. □ Cost savings of approximately 40% targeted and 39% achieved. Further cost saves can be achieved through branch consolidation. □ Closed May 31, 2012

Peoples Bank of Virginia Summary 23 □ Transaction drives EPS growth and shareholder value for both FCBC and Peoples shareholders □ Manageable transaction size and strong pro forma capital ratios allow for future opportunities □ O rganic growth opportunities in the Richmond market remain attractive □ Low - risk structure □ Comprehensive due diligence □ Strong cultural fit □ Additional product capabilities with a good opportunity for business and retail products □ Materially enhances retail network in targeted west Henrico and Chesterfield Counties
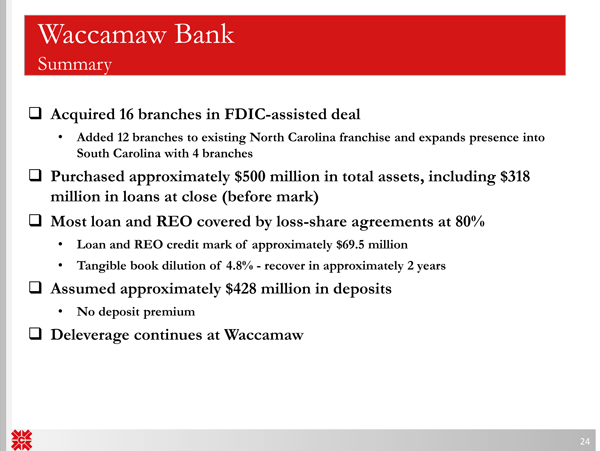
Waccamaw Bank Summary 24 □ Acquired 16 branches in FDIC - assisted deal • Added 12 branches to existing North Carolina franchise and expands presence into South Carolina with 4 branches □ Purchased approximately $500 million in total assets, including $318 million in loans at close (before mark) □ Most loan and REO covered by loss - share agreements at 80% • Loan and REO credit mark of approximately $69.5 million • Tangible book dilution of 4.8% - recover in approximately 2 years □ Assumed approximately $428 million in deposits • No deposit premium □ Deleverage continues at Waccamaw

25 □ Consistent with our acquisition strategy □ Extends footprint to a target growth market □ Significantly accretive to core earnings per share □ Deployed excess capital – No raise necessary □ Reasonable tangible book value dilution (4.8%) – Earnback dilution in approximately 2 years □ Strong IRR in excess of 15% □ Low - risk transaction due to FDIC loss coverage □ Financially attractive even under stress case modeling scenarios Waccamaw Bank Strategically and Financially Compelling
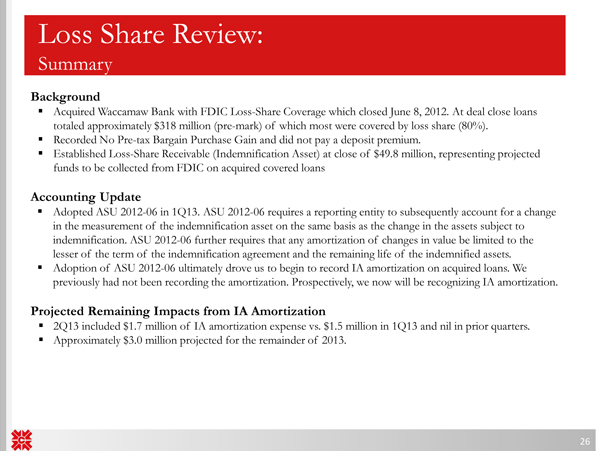
Background ▪ Acquired Waccamaw Bank with FDIC Loss - Share Coverage which closed June 8, 2012. At deal close loans totaled approximately $318 million (pre - mark) of which most were covered by loss share (80%). ▪ Recorded No Pre - tax Bargain Purchase Gain and did not pay a deposit premium. ▪ Established Loss - Share Receivable (Indemnification Asset) a t close of $49.8 million, representing projected funds to be collected from FDIC on acquired covered loans Accounting Update ▪ Adopted ASU 2012 - 06 in 1Q13. ASU 2012 - 06 requires a reporting entity to subsequently account for a change in the measurement of the indemnification asset on the same basis as the change in the assets subject to indemnification. ASU 2012 - 06 further requires that any amortization of changes in value be limited to the lesser of the term of the indemnification agreement and the remaining life of the indemnified assets . ▪ Adoption of ASU 2012 - 06 ultimately drove us to begin to record IA amortization on acquired loans. We previously had not been recording the amortization. Prospectively, we now will be recognizing IA amortization. Projected Remaining Impacts from IA Amortization ▪ 2Q13 included $ 1.7 million of IA amortization expense vs. $1.5 million in 1Q13 and nil in prior quarters . ▪ Approximately $3.0 million projected for the remainder of 2013. Loss Share Review: Summary 26
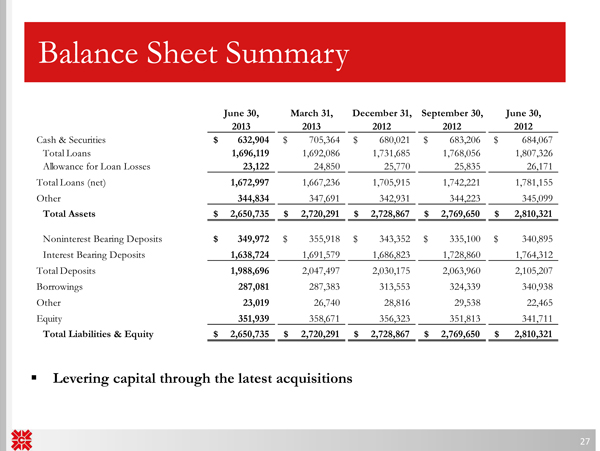
Balance Sheet Summary ▪ Levering capital through the latest acquisitions 27 June 30, March 31, December 31, September 30, June 30, 2013 2013 2012 2012 2012 Cash & Securities 632,904$ 705,364$ 680,021$ 683,206$ 684,067$ Total Loans 1,696,119 1,692,086 1,731,685 1,768,056 1,807,326 Allowance for Loan Losses 23,122 24,850 25,770 25,835 26,171 Total Loans (net) 1,672,997 1,667,236 1,705,915 1,742,221 1,781,155 Other 344,834 347,691 342,931 344,223 345,099 Total Assets 2,650,735$ 2,720,291$ 2,728,867$ 2,769,650$ 2,810,321$ Noninterest Bearing Deposits 349,972$ 355,918$ 343,352$ 335,100$ 340,895$ Interest Bearing Deposits 1,638,724 1,691,579 1,686,823 1,728,860 1,764,312 Total Deposits 1,988,696 2,047,497 2,030,175 2,063,960 2,105,207 Borrowings 287,081 287,383 313,553 324,339 340,938 Other 23,019 26,740 28,816 29,538 22,465 Equity 351,939 358,671 356,323 351,813 341,711 Total Liabilities & Equity 2,650,735$ 2,720,291$ 2,728,867$ 2,769,650$ 2,810,321$
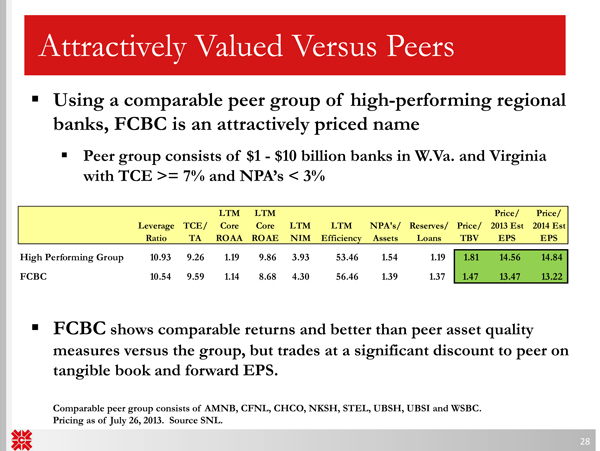
Attractively Valued Versus Peers 28 ▪ Using a comparable peer group of high - performing regional banks, FCBC is an attractively priced name ▪ Peer group consists of $1 - $10 billion banks in W.Va. and Virginia with TCE >= 7% and NPA’s < 3% ▪ FCBC shows comparable returns and better than peer asset quality measures versus the group, but trades at a significant discount to peer on tangible book and forward EPS. Comparable peer group consists of AMNB, CFNL , CHCO , NKSH, STEL , UBSH, UBSI and WSBC. Pricing as of July 26, 2013. Source SNL. LTM LTM Price/ Price/ Leverage TCE/ Core Core LTM LTM NPA's/ Reserves/ Price/ 2013 Est 2014 Est Ratio TA ROAA ROAE NIM Efficiency Assets Loans TBV EPS EPS High Performing Group 10.93 9.26 1.19 9.86 3.93 53.46 1.54 1.19 1.81 14.56 14.84 FCBC 10.54 9.59 1.14 8.68 4.30 56.46 1.39 1.37 1.47 13.47 13.22
▪ Strong pre - tax, pre - provision core income ▪ Favorable NIM ▪ Solid Credit ▪ Capital Strength ▪ Non - margin , fee - based revenue diversification ▪ Strong dividend yield of nearly 3% ▪ Positioned and capable to emerge as one of the strongest players in the region and build one of the best franchises in the Mid - Atlantic ▪ Attractive valuation on forward earnings potential ▪ Attractively valued vs. peers Why buy FCBC? 29
Forward - Looking Disclosures This presentation may include forward - looking statements. These forward - looking statements are based on current expectations that involve risks, uncertainties and assumptions. Should one or more of these risks or uncertainties materialize or should underlying assumptions prove incorrect, actual results may differ materially. These risks include: changes in business or other market conditions; the timely development, production and acceptance of new products and services; the challenge of managing asset/liability levels; the management of credit risk and interest rate risk; the difficulty of keeping expense growth at modest levels while increasing revenues; and other risks detailed from time to time in the Company’s Securities and Exchange Commission reports, including but not limited to the Annual Report on Form 10 - K for the most recent year ended. Pursuant to the Private Securities Litigation Reform Act of 1995, the Company does not undertake to update forward - looking statements contained within this presentation. 30

Contact Information First Community Bancshares, Inc. NASDAQ: FCBC One Community Place Bluefield, VA 24605 For More Information Contact: David D. Brown Chief Financial Officer First Community Bancshares, Inc. (276) 326 - 9000 31