
Third Quarter 2019 Earnings Conference Call October 29, 2019
Safe Harbor and Non-GAAP Financial Measures Note Regarding Forward-Looking Statements: Certain statements and information included in this news release are “forward-looking statements” under the Federal Private Securities Litigation Reform Act of 1995, including our forecast, outlook, expectations regarding market trends and economic environment; our financial condition; our fleet growth; performance in our product lines and segments; the strength of our contractual sales pipeline; projections related to customer retention; demand, utilization and pricing in our commercial rental business; demand, sales and pricing in used vehicle sales; used vehicle inventory levels; residual values and depreciation expense; our ability to meet our expectations of wholesale and retail sales mix; return on capital spread; operating cash flow; free cash flow; capital expenditures; leverage; our ability to make investments in and obtain our projected benefits from sales, marketing, IT, e-commerce and new product initiatives; costs of implementing our ERP system; the impact and adequacy of steps we have taken to address our cost structure; our ability to implement our asset management strategy to right size the rental fleet; our ability to successfully implement our maintenance cost-savings initiatives; our ability to gain market acceptance of our new products and services; and the impact of adoption of the lease accounting standard on our earnings, financial position, cash flow, leverage and the demand for our products and services. Our forward-looking statements also include our estimates of the impact of our changes to residual value estimates on earnings and depreciation expense. The expected impact of the change in residual value estimates is based on our current assessment of the residual values and useful lives of revenue-earning equipment based on multi-year trends and our outlook for the expected near-term used vehicle market. Our assessment is subject to risks, uncertainties, and assumptions as to future events that may not prove to be accurate. Factors that could cause actual results related to vehicle residual values to materially differ from estimates include, but are not limited to, changes in supply and demand, competitor pricing, regulatory requirements, driver shortages, requirements and preferences, as well as changes in underlying assumption factors. All of our forward-looking statements should be evaluated with consideration given to the many risks and uncertainties inherent in our business that could cause actual results and events to differ materially from those in the forward-looking statements. Important factors that could cause such differences include, among others, our ability to adapt to changing market conditions, lower than expected contractual sales, decreases in commercial rental demand or utilization or poor acceptance of rental pricing, worsening of market demand for or excess supply of used vehicles impacting current and/or estimated pricing and our anticipated proportion of retail versus wholesale sales, lack of customer demand for our services, higher than expected maintenance costs, lower than expected benefits from our cost-savings initiatives, lower than expected benefits from our sales, marketing and new product initiatives, higher than expected costs related to our ERP implementation, setbacks or uncertainty in the economic market, or in our ability to grow and retain profitable customer accounts, implementation or enforcement of regulations, decreases in freight demand or volumes, poor operational execution including with respect to new accounts and product launches, our difficulty in obtaining adequate profit margins for our services, our inability to maintain current pricing levels due to soft economic conditions, business interruptions or expenditures due to labor disputes, severe weather or natural occurrences, competition from other service providers and new entrants, lower than anticipated customer retention levels, loss of key customers, driver and technician shortages resulting in higher procurement costs and turnover rates, higher than expected bad debt reserves or write-offs, changes in customers' business environments that will limit their ability to commit to long-term vehicle leases, a decrease in credit ratings, increased debt costs, adequacy of accounting estimates, higher than expected reserves and accruals particularly with respect to pension, taxes, depreciation, insurance and revenue, impact of changes in our residual value estimates and accounting policies, including our depreciation policy, the sudden or unusual changes in fuel prices, unanticipated currency exchange rate fluctuations, our ability to manage our cost structure, and the risks described in our filings with the Securities and Exchange Commission (SEC). The risks included here are not exhaustive. New risks emerge from time to time and it is not possible for management to predict all such risk factors or to assess the impact of such risks on our business. Accordingly, we undertake no obligation to publicly update or revise any forward-looking statements, whether as a result of new information, future events, or otherwise. Note Regarding Non-GAAP Financial Measures: This news release includes certain non-GAAP financial measures as defined under SEC rules, including: Comparable Earnings Measures, including comparable earnings from continuing operations, comparable earnings per share from continuing operations, comparable earnings before income tax, comparable earnings before interest, income tax, depreciation and amortization, and comparable effective income tax rate. Additionally, our adjusted return on average capital (ROC) and adjusted return on capital spread (ROC spread) measures are calculated based on comparable earnings items. Operating Revenue Measures, including operating revenue for Ryder and its business segments, and segment EBT as a percentage of operating revenue. Cash Flow Measures, including total cash generated and free cash flow. Debt Measures, including total obligations and total obligations to equity. Refer to Appendix - Non-GAAP Financial Measures for reconciliations of the non-GAAP financial measures contained in this presentation to the nearest GAAP measure. Additional information regarding non-GAAP financial measures as required by Regulation G and Item 10(e) of Regulation S-K can be found in our most recent Form 10-K, Form 10-Q, and our Form 8-K filed with the SEC as of the date of this presentation, which are available at http://investors.ryder.com. All amounts subsequent to January 1, 2018 amounts have been recast to reflect the impact of the lease accounting standard, ASU 2016-02, Leases. Amounts throughout the presentation may not be additive due to rounding. ©2019 Ryder System ,Inc. 2 All Rights Reserved

Contents • Residual Value Estimate Change • Third Quarter 2019 Results Overview • EPS Forecast • Q & A ©2019 Ryder System ,Inc. 3 All Rights Reserved
Overview • Ryder’s value proposition remains strong and is driven by long-term outsourcing trends in the large transportation and logistics markets • 2019-20 earnings expected to be negatively impacted by used vehicle market downturn and residual value estimate change • Returns expected to organically improve as: • depreciation impact from accounting residual value estimate change declines for the power vehicle fleet as of 3Q19 • majority of remaining underperforming leases exit the fleet • Focused on accelerating initiatives to improve ROC through continued higher ChoiceLease pricing, cost reduction actions, used vehicle sales initiatives, addressing lower returning accounts/assets, and reinvesting in higher return business Ryder remains a market leader with a strong financial position ©2019 Ryder System ,Inc. 4 All Rights Reserved
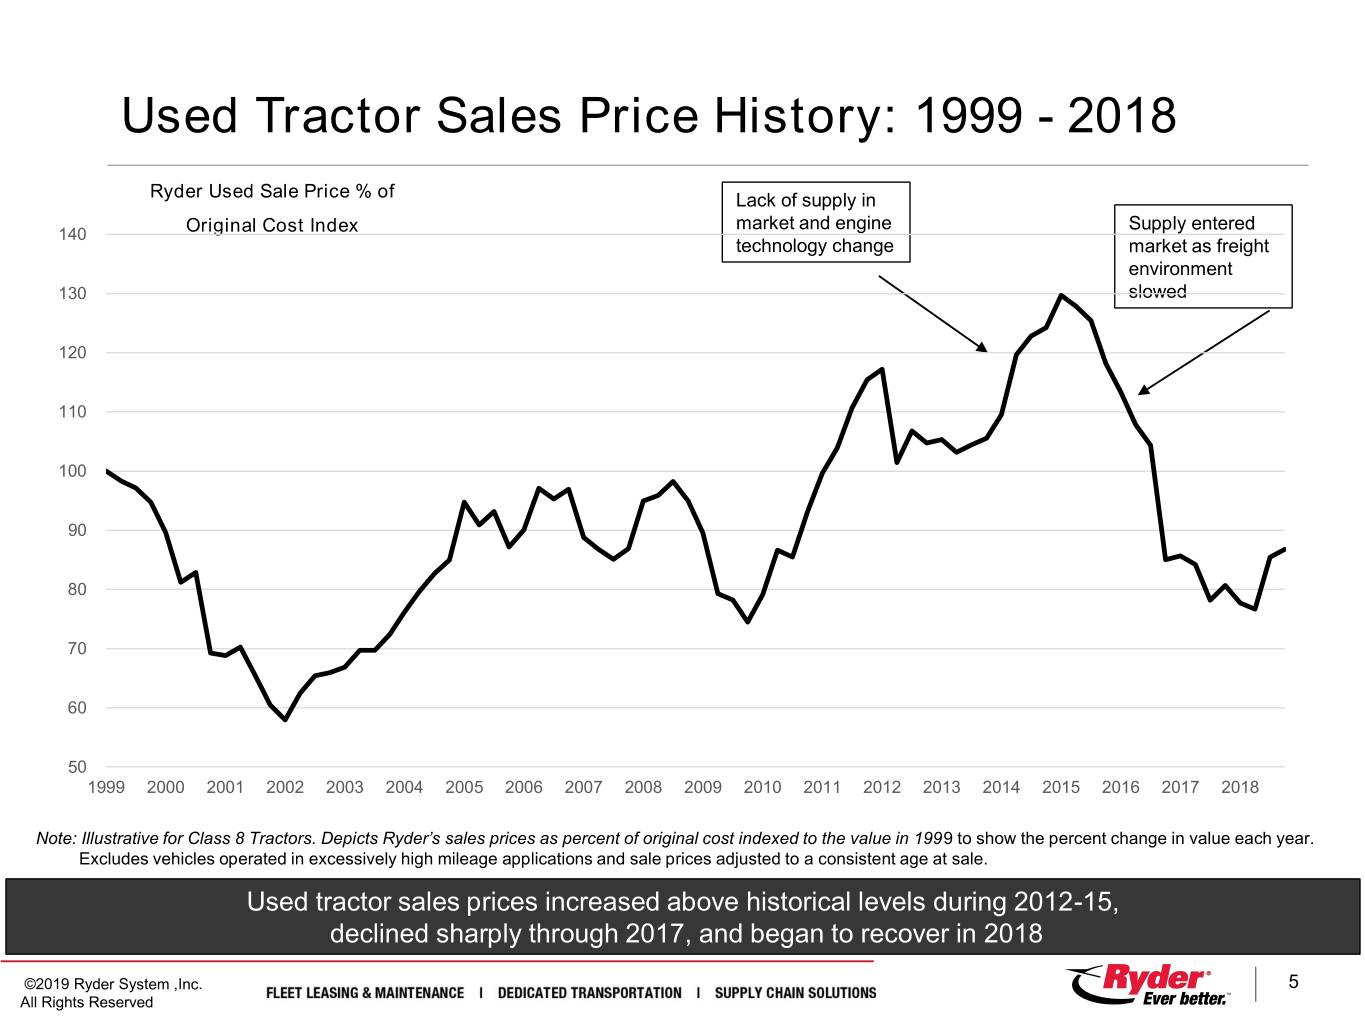
Used Tractor Sales Price History: 1999 - 2018 Ryder Used Sale Price % of Lack of supply in market and engine Supply entered 140 Original Cost Index technology change market as freight environment 130 slowed 120 110 100 90 80 70 60 50 1999 2000 2001 2002 2003 2004 2005 2006 2007 2008 2009 2010 2011 2012 2013 2014 2015 2016 2017 2018 Note: Illustrative for Class 8 Tractors. Depicts Ryder’s sales prices as percent of original cost indexed to the value in 1999 to show the percent change in value each year. Excludes vehicles operated in excessively high mileage applications and sale prices adjusted to a consistent age at sale. Used tractor sales prices increased above historical levels during 2012-15, declined sharply through 2017, and began to recover in 2018 ©2019 Ryder System ,Inc. 5 All Rights Reserved

Used Tractor Market Conditions Began To Soften In June 2019 - Conditions Worsened In 3Q19 With Expectations For Further Near-Term Decline Ryder Used Sale Price % of Original Cost Index 90 140 130 120 110 100 80 90 80 70 60 50 3Q19 2013 1999 2000 2001 2002 2003 2004 2005 2006 2007 2008 2009 2010 2011 2012 2014 2015 2016 2017 2018 2019 70 4Q17 1Q18 2Q18 3Q18 4Q18 1Q19 2Q19 3Q19 Note: Illustrative for Class 8 Tractors. Depicts Ryder’s sales prices as percent of original cost indexed to the value in 1999 to show the percent change in value each year. Excludes vehicles operated in excessively high mileage applications and sale prices adjusted to a consistent age at sale. Most recent decline in used vehicle prices triggered re-evaluation of residual value estimates ©2019 Ryder System ,Inc. 6 All Rights Reserved

Residual Value Estimates and Depreciation • Residual values and useful lives of revenue earning equipment are reviewed at least annually • Three components of Ryder’s depreciation: • Policy Depreciation – estimated residuals established on each vehicle to set depreciation expense over the vehicles useful life – long-term view • Accelerated Depreciation – additional depreciation may be recorded as a vehicle nears the end of its useful life if its anticipated market value is below the estimated residual value (established through policy depreciation) at disposition – near-term view • Valuation Adjustments – additional negative adjustments recorded upon a vehicle reaching our used truck centers, only if its anticipated market value is below the estimated residual value ©2019 Ryder System ,Inc. 7 All Rights Reserved
3Q19 Residual Value Estimate Changes 1) Policy Depreciation: For vehicles expected to be sold starting in late 2021, reduced long-term estimate of residual values to reflect more recent multi-year trends (which exclude 2015 peak) and include outlook 2) Accelerated Depreciation: For vehicles expected to be sold by late 2021, reduced estimated residual values below policy depreciation residual level to reflect expected near-term used vehicle market downturn and increased wholesaling activity Reduced accounting residuals for tractors and, to a lesser extent, trucks to reflect recent market conditions and updated outlook See Appendix: Vehicle Depreciation for more information on our depreciation policies ©2019 Ryder System ,Inc. 8 All Rights Reserved
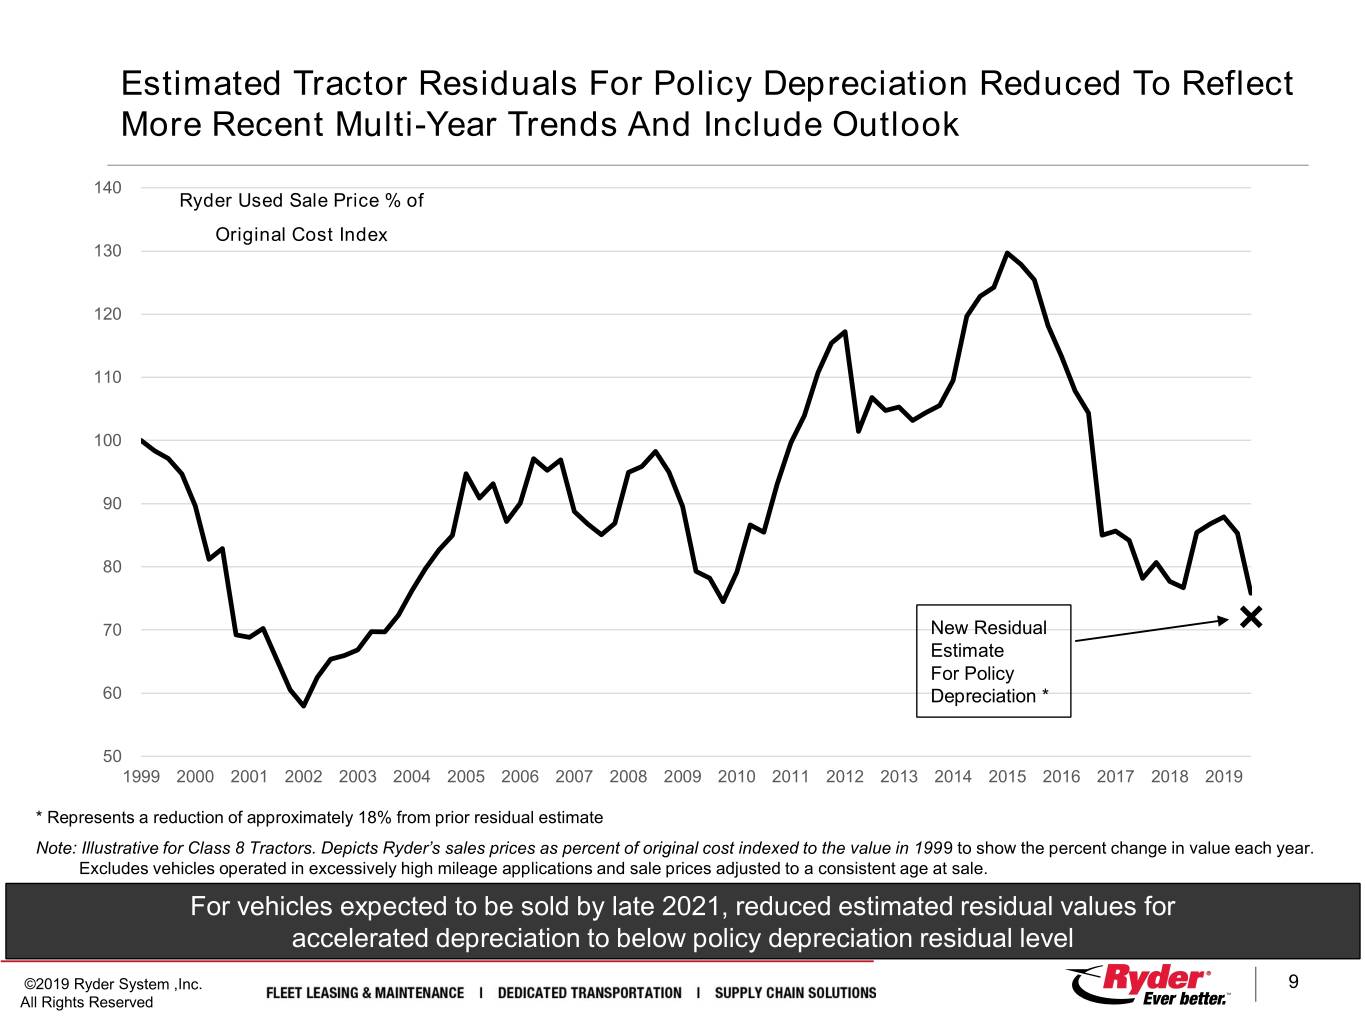
Estimated Tractor Residuals For Policy Depreciation Reduced To Reflect More Recent Multi-Year Trends And Include Outlook 140 Ryder Used Sale Price % of Original Cost Index 130 120 110 100 90 80 70 New Residual Estimate For Policy 60 Depreciation * 50 1999 2000 2001 2002 2003 2004 2005 2006 2007 2008 2009 2010 2011 2012 2013 2014 2015 2016 2017 2018 2019 * Represents a reduction of approximately 18% from prior residual estimate Note: Illustrative for Class 8 Tractors. Depicts Ryder’s sales prices as percent of original cost indexed to the value in 1999 to show the percent change in value each year. Excludes vehicles operated in excessively high mileage applications and sale prices adjusted to a consistent age at sale. For vehicles expected to be sold by late 2021, reduced estimated residual values for accelerated depreciation to below policy depreciation residual level ©2019 Ryder System ,Inc. 9 All Rights Reserved
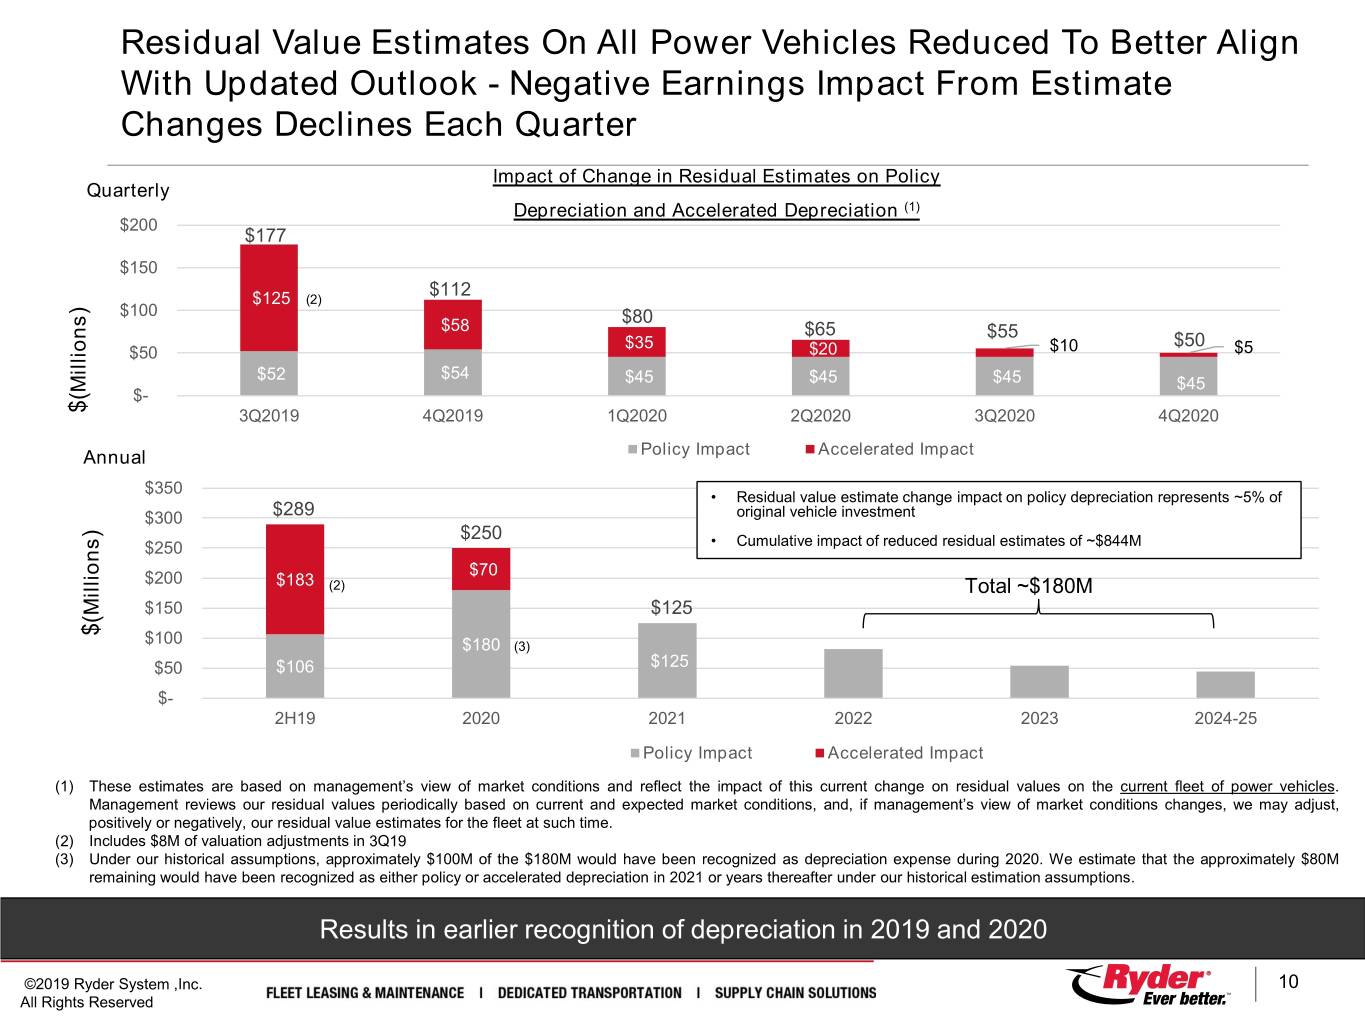
Residual Value Estimates On All Power Vehicles Reduced To Better Align With Updated Outlook - Negative Earnings Impact From Estimate Changes Declines Each Quarter Impact of Change in Residual Estimates on Policy Quarterly Depreciation and Accelerated Depreciation (1) $200 $177 $150 $112 $125 (2) ) $100 $80 $58 $65 $55 $35 $50 $50 $20 $10 $5 $52 $54 $45 $45 $45 Millions $45 $- $( 3Q2019 4Q2019 1Q2020 2Q2020 3Q2020 4Q2020 Annual Policy Impact Accelerated Impact $350 • Residual value estimate change impact on policy depreciation represents ~5% of $300 $289 original vehicle investment ) $250 $250 • Cumulative impact of reduced residual estimates of ~$844M $200 $70 $183 (2) Total ~$180M Millions $150 $125 $( $100 $180 (3) $50 $106 $125 $- 2H19 2020 2021 2022 2023 2024-25 Policy Impact Accelerated Impact (1) These estimates are based on management’s view of market conditions and reflect the impact of this current change on residual values on the current fleet of power vehicles. Management reviews our residual values periodically based on current and expected market conditions, and, if management’s view of market conditions changes, we may adjust, positively or negatively, our residual value estimates for the fleet at such time. (2) Includes $8M of valuation adjustments in 3Q19 (3) Under our historical assumptions, approximately $100M of the $180M would have been recognized as depreciation expense during 2020. We estimate that the approximately $80M remaining would have been recognized as either policy or accelerated depreciation in 2021 or years thereafter under our historical estimation assumptions. Results in earlier recognition of depreciation in 2019 and 2020 ©2019 Ryder System ,Inc. 10 All Rights Reserved
Key ROC Improvement Actions Improve returns through pricing actions: Increased lease rates 1 on all power vehicles by reducing priced residual assumptions beginning in late 2017 – tractor priced residuals are now at historically low levels; pricing optimization continues ©2019 Ryder System ,Inc. 11 All Rights Reserved

Pricing Actions Taken To Improve ChoiceLease Returns Projected Performance by Year (reflects updated residual value estimates) 2012 Below Target For leases signed prior to 2014, we expect returns Drives majority of accelerated depreciation below our target levels due to higher than priced - impacts P&L through 2020 2013 Below Target maintenance costs on new engine technology and now lower than priced residual assumptions 2014 At Target Above Target For leases signed in 2014-17, we expect returns at or 2015 above our target levels due to better than priced maintenance costs more than offsetting lower than 2016 Above Target priced residual assumptions 2017 Above Target For leases signed after 2017, we expect returns above Tractor priced 2018 Above Target our target levels due to better than priced residuals are now at maintenance and overhead costs, and reduced pricing historically low levels; residual assumptions pricing optimization Above Target continues 2019 Pricing and cost actions have improved actual and expected returns for leases signed beginning in 2014. Returns are expected to organically improve as the lease portfolio turns over and underperforming leases (signed prior to 2014) exit the fleet. ©2019 Ryder System ,Inc. 12 All Rights Reserved
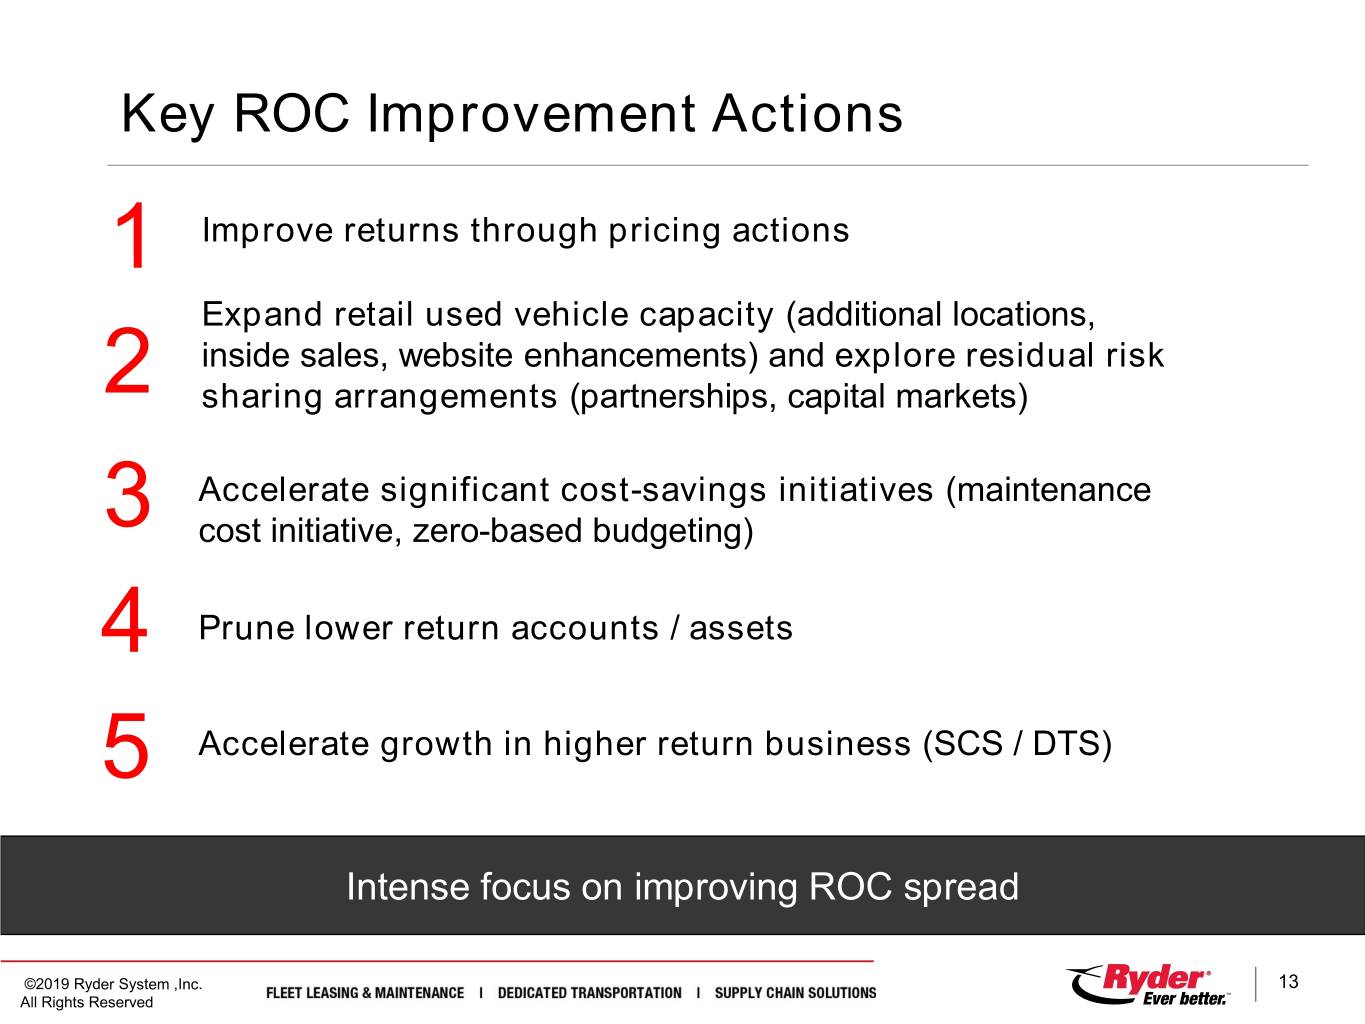
Key ROC Improvement Actions 1 Improve returns through pricing actions Expand retail used vehicle capacity (additional locations, inside sales, website enhancements) and explore residual risk 2 sharing arrangements (partnerships, capital markets) Accelerate significant cost-savings initiatives (maintenance 3 cost initiative, zero-based budgeting) 4 Prune lower return accounts / assets 5 Accelerate growth in higher return business (SCS / DTS) Intense focus on improving ROC spread ©2019 Ryder System ,Inc. 13 All Rights Reserved
Contents • Residual Value Estimate Change • Third Quarter 2019 Results Overview • EPS Forecast • Q & A ©2019 Ryder System ,Inc. 14 All Rights Reserved
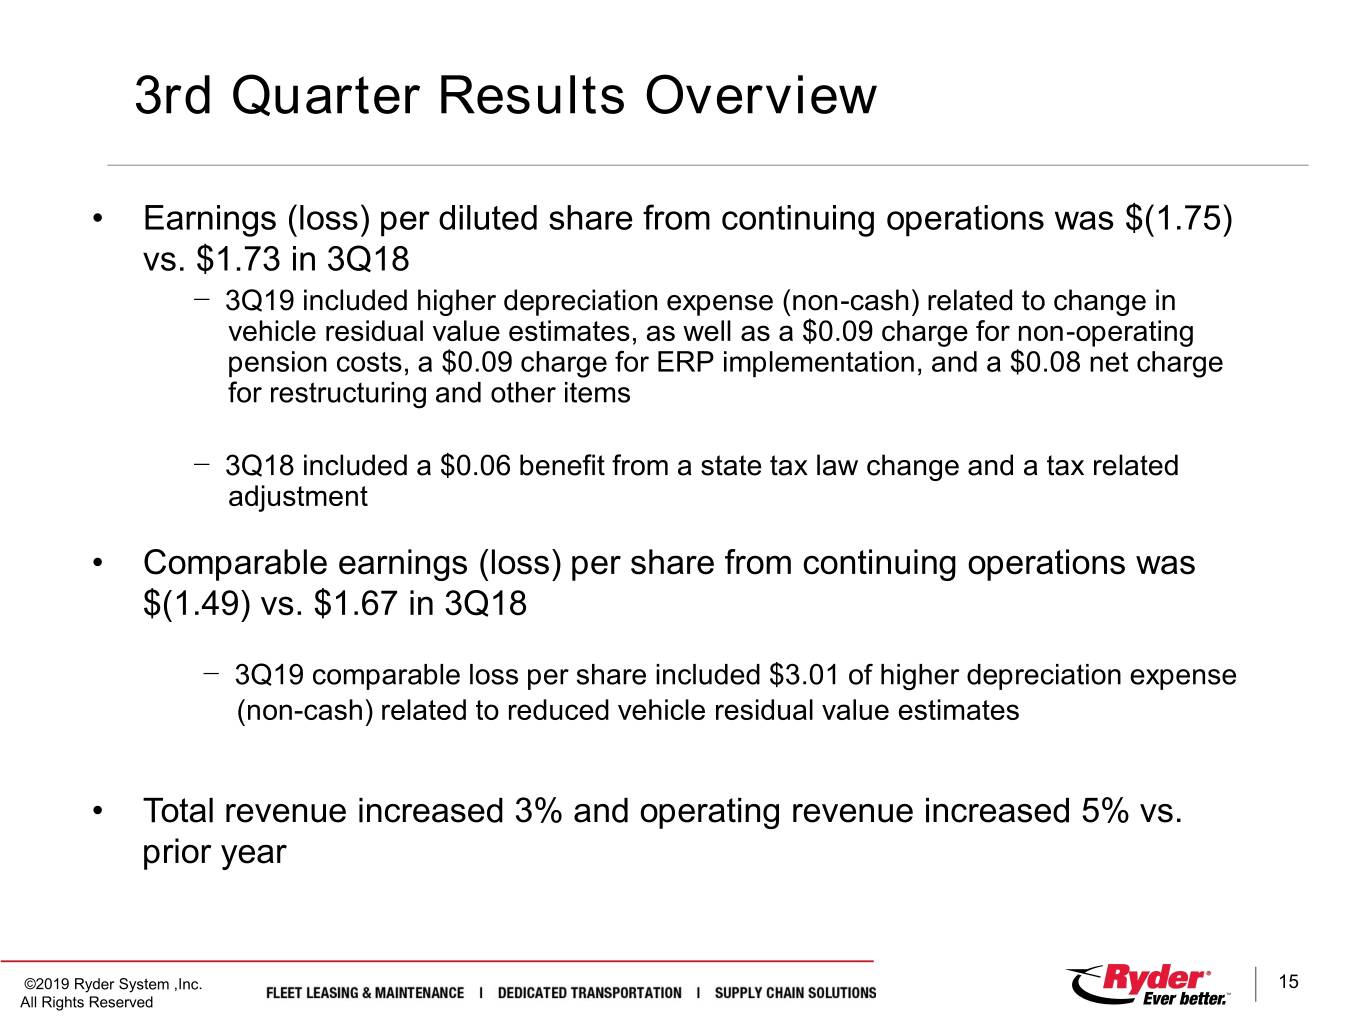
3rd Quarter Results Overview • Earnings (loss) per diluted share from continuing operations was $(1.75) vs. $1.73 in 3Q18 — 3Q19 included higher depreciation expense (non-cash) related to change in vehicle residual value estimates, as well as a $0.09 charge for non-operating pension costs, a $0.09 charge for ERP implementation, and a $0.08 net charge for restructuring and other items — 3Q18 included a $0.06 benefit from a state tax law change and a tax related adjustment • Comparable earnings (loss) per share from continuing operations was $(1.49) vs. $1.67 in 3Q18 — 3Q19 comparable loss per share included $3.01 of higher depreciation expense (non-cash) related to reduced vehicle residual value estimates • Total revenue increased 3% and operating revenue increased 5% vs. prior year ©2019 Ryder System ,Inc. 15 All Rights Reserved
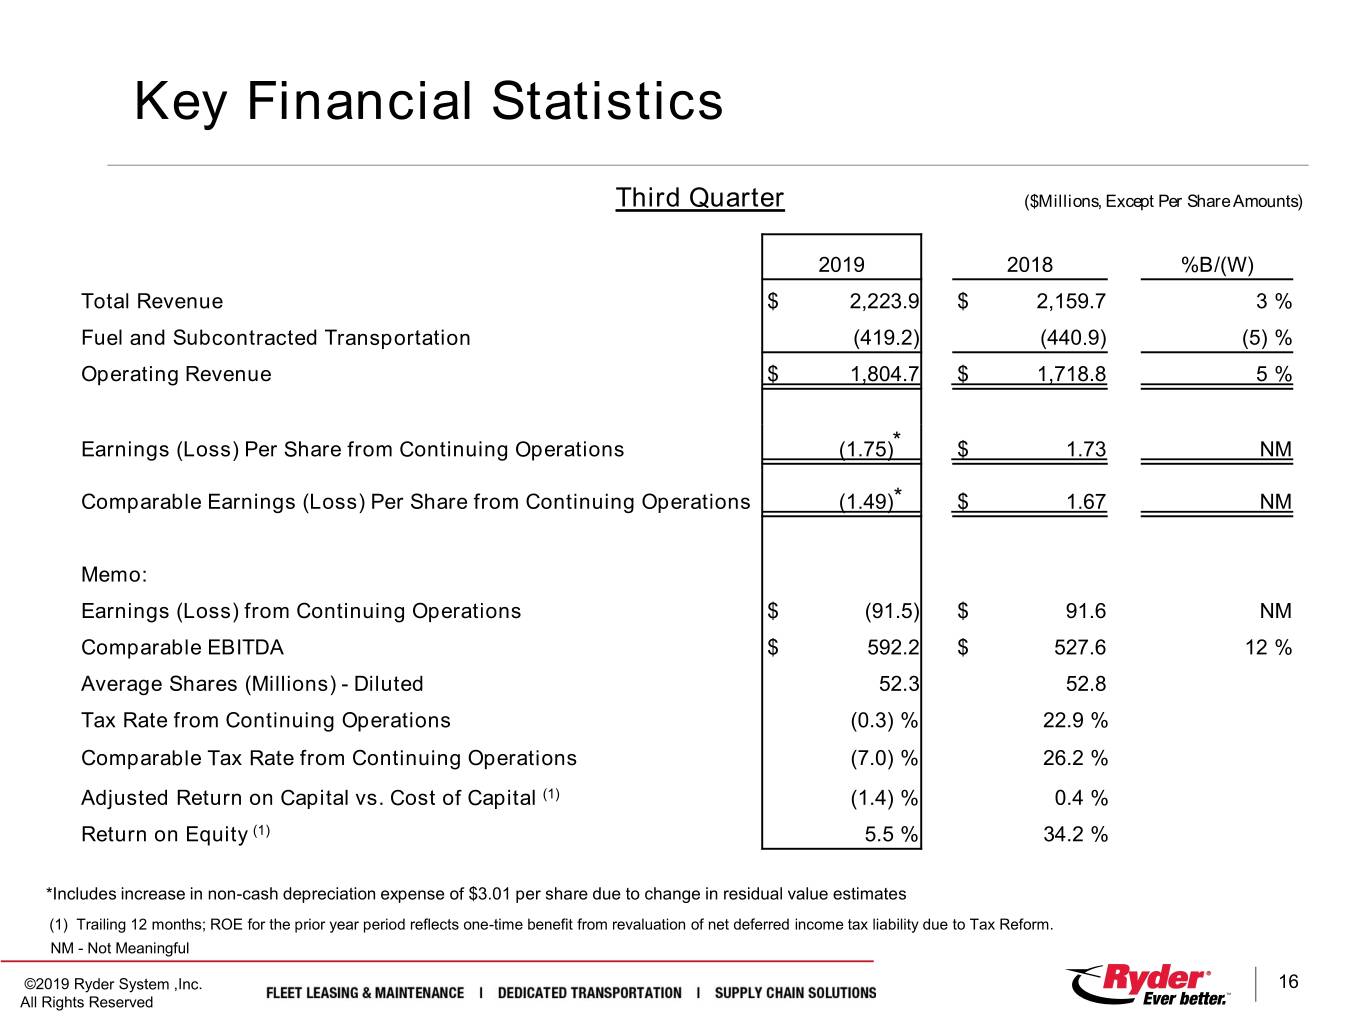
Key Financial Statistics Third Quarter ($Millions, Except Per Share Amounts) 2019 2018 %B/(W) Total Revenue $ 2,223.9 $ 2,159.7 3 % Fuel and Subcontracted Transportation (419.2) (440.9) (5) % Operating Revenue $ 1,804.7 $ 1,718.8 5 % Earnings (Loss) Per Share from Continuing Operations (1.75)* $ 1.73 NM Comparable Earnings (Loss) Per Share from Continuing Operations (1.49)* $ 1.67 NM Memo: Earnings (Loss) from Continuing Operations $ (91.5) $ 91.6 NM Comparable EBITDA $ 592.2 $ 527.6 12 % Average Shares (Millions) - Diluted 52.3 52.8 Tax Rate from Continuing Operations (0.3) % 22.9 % Comparable Tax Rate from Continuing Operations (7.0) % 26.2 % Adjusted Return on Capital vs. Cost of Capital (1) (1.4) % 0.4 % Return on Equity (1) 5.5 % 34.2 % *Includes increase in non-cash depreciation expense of $3.01 per share due to change in residual value estimates (1) Trailing 12 months; ROE for the prior year period reflects one-time benefit from revaluation of net deferred income tax liability due to Tax Reform. NM - Not Meaningful ©2019 Ryder System ,Inc. 16 All Rights Reserved
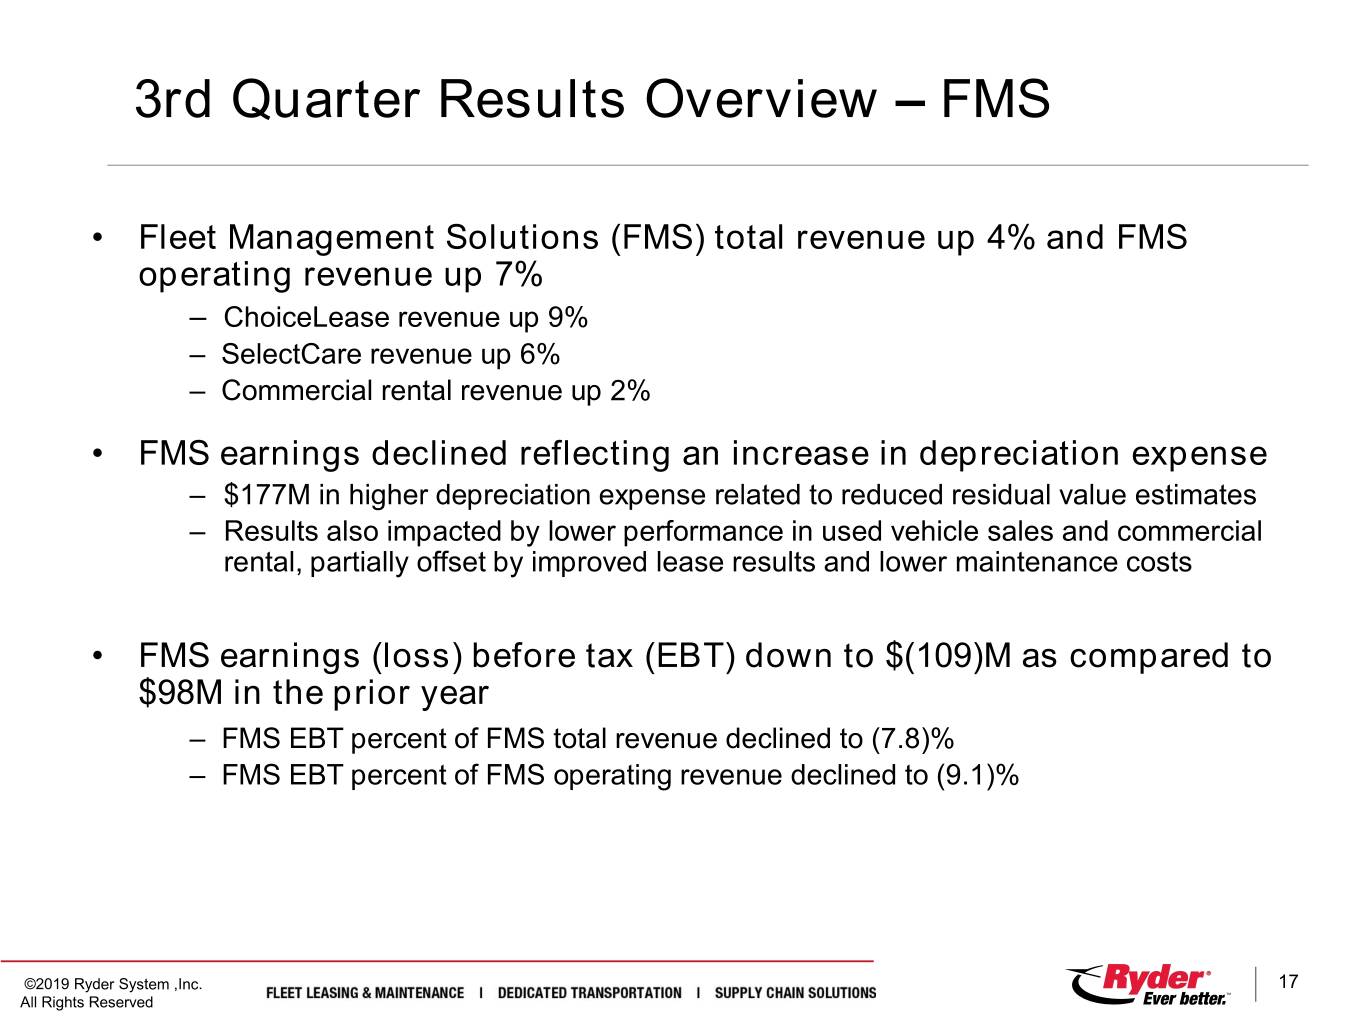
3rd Quarter Results Overview – FMS • Fleet Management Solutions (FMS) total revenue up 4% and FMS operating revenue up 7% – ChoiceLease revenue up 9% – SelectCare revenue up 6% – Commercial rental revenue up 2% • FMS earnings declined reflecting an increase in depreciation expense – $177M in higher depreciation expense related to reduced residual value estimates – Results also impacted by lower performance in used vehicle sales and commercial rental, partially offset by improved lease results and lower maintenance costs • FMS earnings (loss) before tax (EBT) down to $(109)M as compared to $98M in the prior year – FMS EBT percent of FMS total revenue declined to (7.8)% – FMS EBT percent of FMS operating revenue declined to (9.1)% ©2019 Ryder System ,Inc. 17 All Rights Reserved
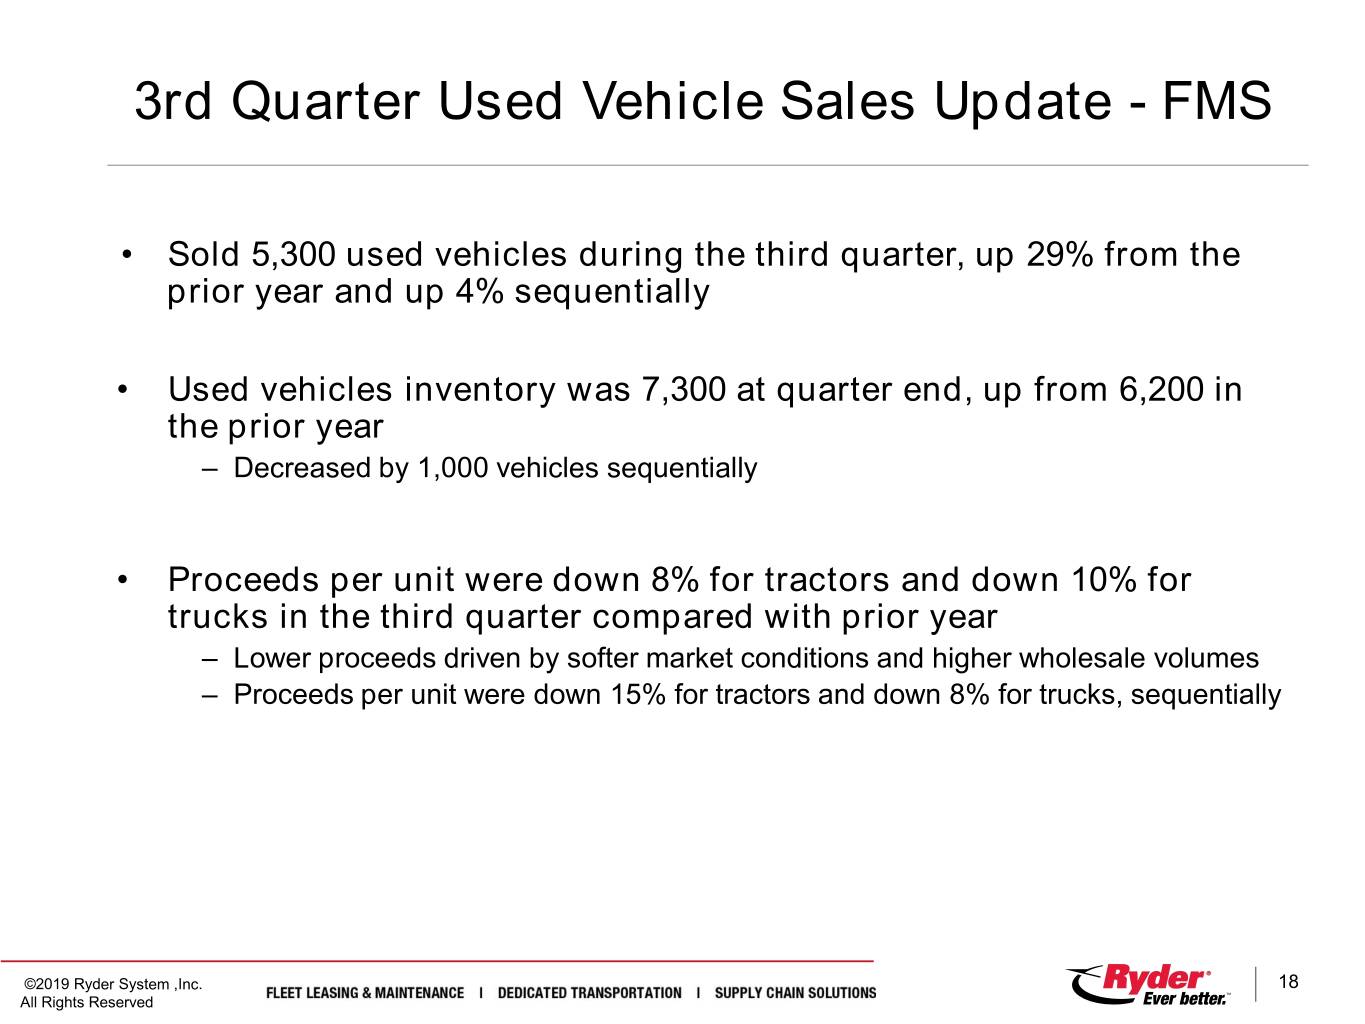
3rd Quarter Used Vehicle Sales Update - FMS • Sold 5,300 used vehicles during the third quarter, up 29% from the prior year and up 4% sequentially • Used vehicles inventory was 7,300 at quarter end, up from 6,200 in the prior year – Decreased by 1,000 vehicles sequentially • Proceeds per unit were down 8% for tractors and down 10% for trucks in the third quarter compared with prior year – Lower proceeds driven by softer market conditions and higher wholesale volumes – Proceeds per unit were down 15% for tractors and down 8% for trucks, sequentially ©2019 Ryder System ,Inc. 18 All Rights Reserved
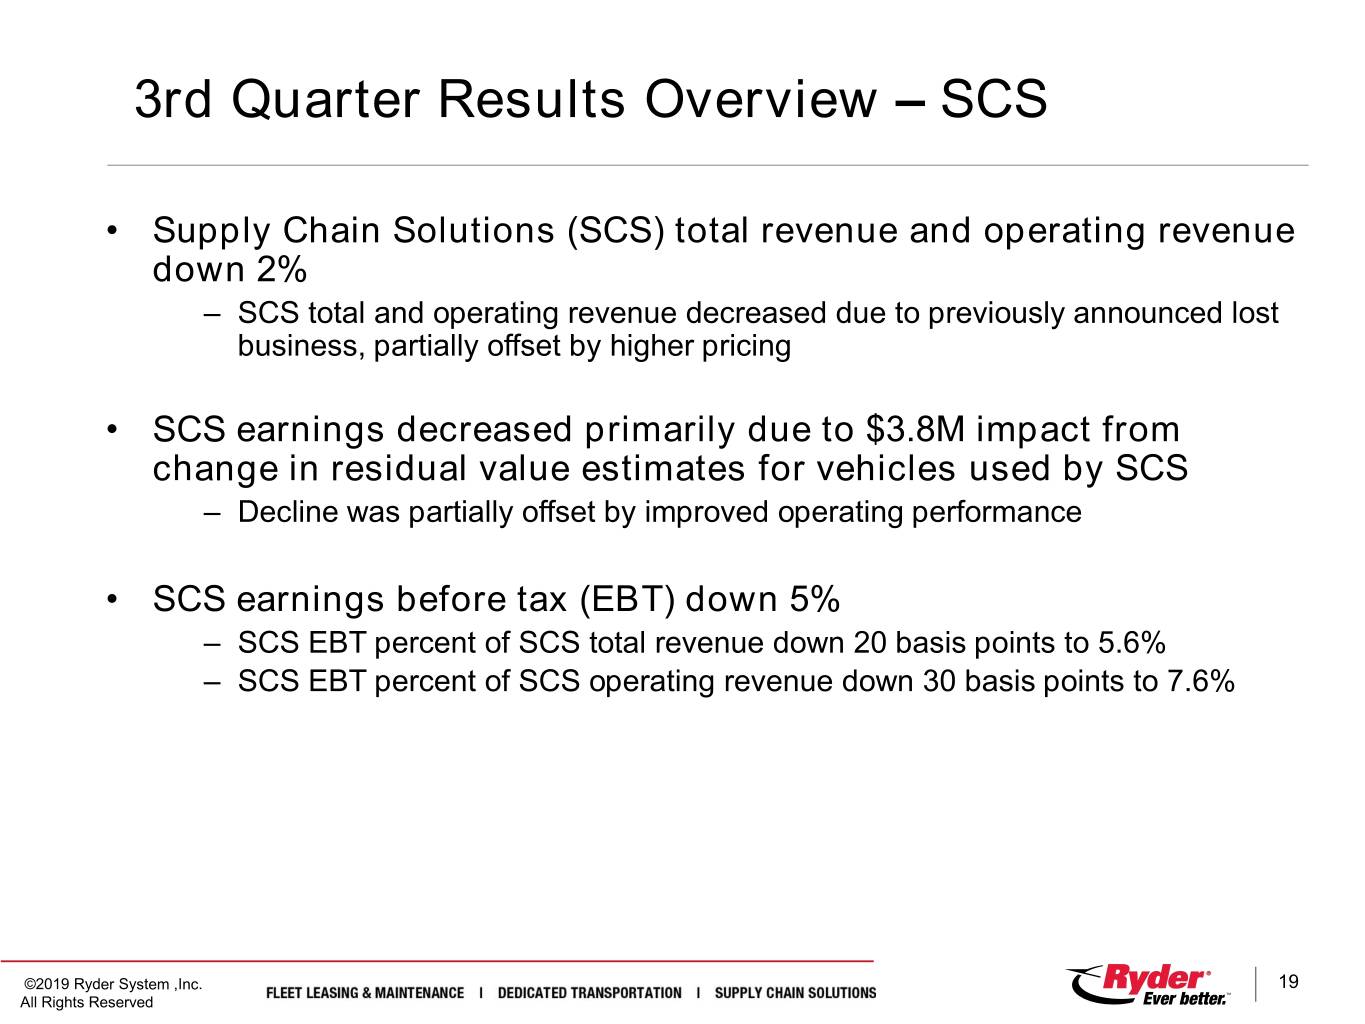
3rd Quarter Results Overview – SCS • Supply Chain Solutions (SCS) total revenue and operating revenue down 2% – SCS total and operating revenue decreased due to previously announced lost business, partially offset by higher pricing • SCS earnings decreased primarily due to $3.8M impact from change in residual value estimates for vehicles used by SCS – Decline was partially offset by improved operating performance • SCS earnings before tax (EBT) down 5% – SCS EBT percent of SCS total revenue down 20 basis points to 5.6% – SCS EBT percent of SCS operating revenue down 30 basis points to 7.6% ©2019 Ryder System ,Inc. 19 All Rights Reserved
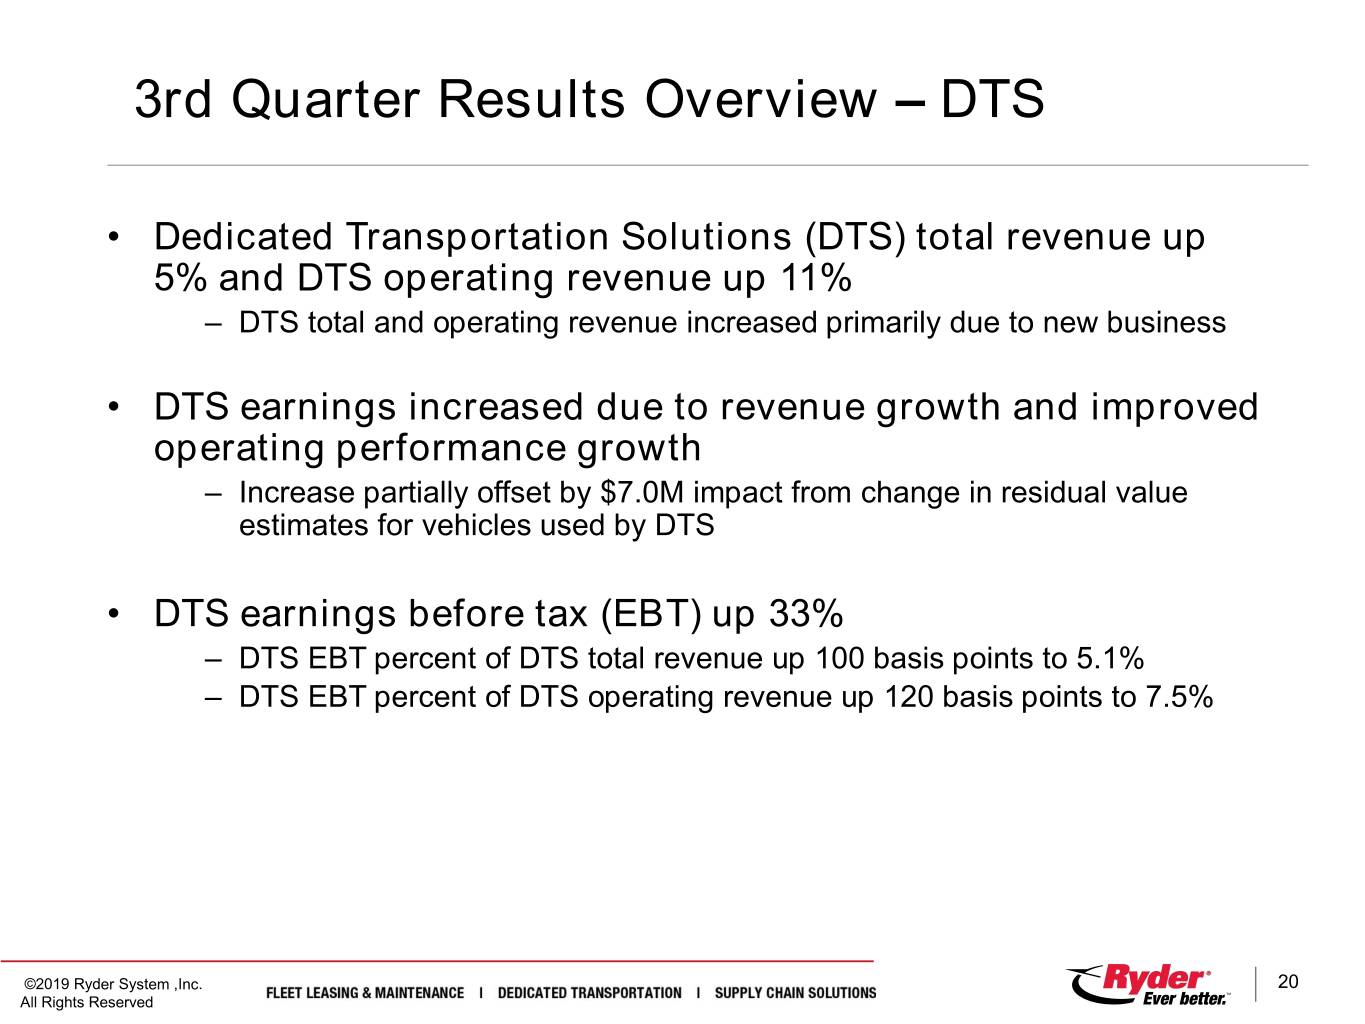
3rd Quarter Results Overview – DTS • Dedicated Transportation Solutions (DTS) total revenue up 5% and DTS operating revenue up 11% – DTS total and operating revenue increased primarily due to new business • DTS earnings increased due to revenue growth and improved operating performance growth – Increase partially offset by $7.0M impact from change in residual value estimates for vehicles used by DTS • DTS earnings before tax (EBT) up 33% – DTS EBT percent of DTS total revenue up 100 basis points to 5.1% – DTS EBT percent of DTS operating revenue up 120 basis points to 7.5% ©2019 Ryder System ,Inc. 20 All Rights Reserved
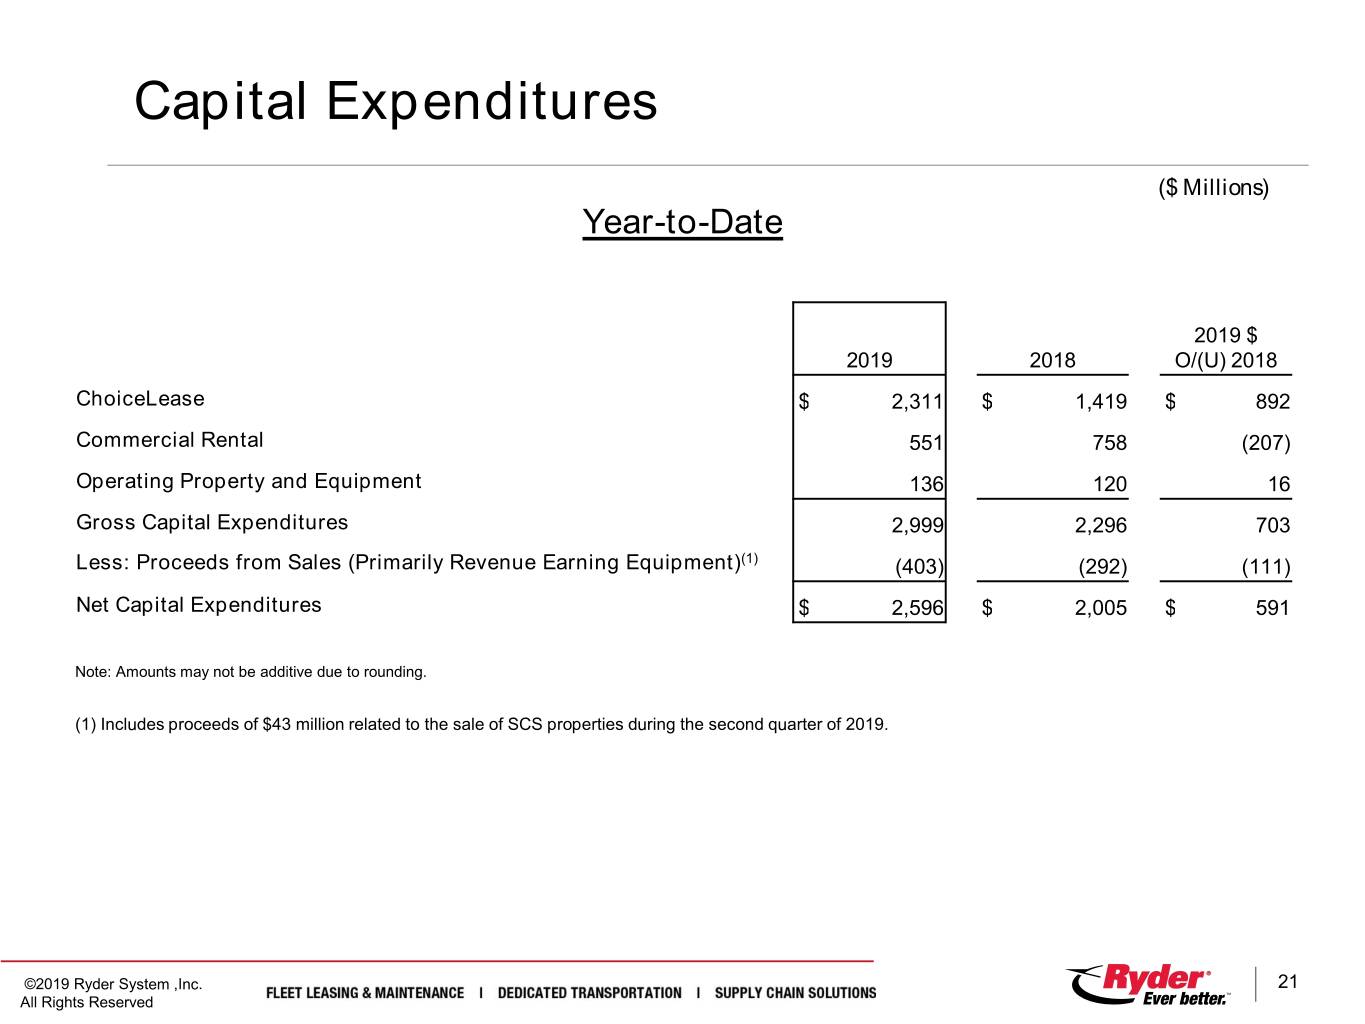
Capital Expenditures ($ Millions) Year-to-Date 2019 $ 2019 2018 O/(U) 2018 ChoiceLease $ 2,311 $ 1,419 $ 892 Commercial Rental 551 758 (207) Operating Property and Equipment 136 120 16 Gross Capital Expenditures 2,999 2,296 703 Less: Proceeds from Sales (Primarily Revenue Earning Equipment)(1) (403) (292) (111) Net Capital Expenditures $ 2,596 $ 2,005 $ 591 Note: Amounts may not be additive due to rounding. (1) Includes proceeds of $43 million related to the sale of SCS properties during the second quarter of 2019. ©2019 Ryder System ,Inc. 21 All Rights Reserved
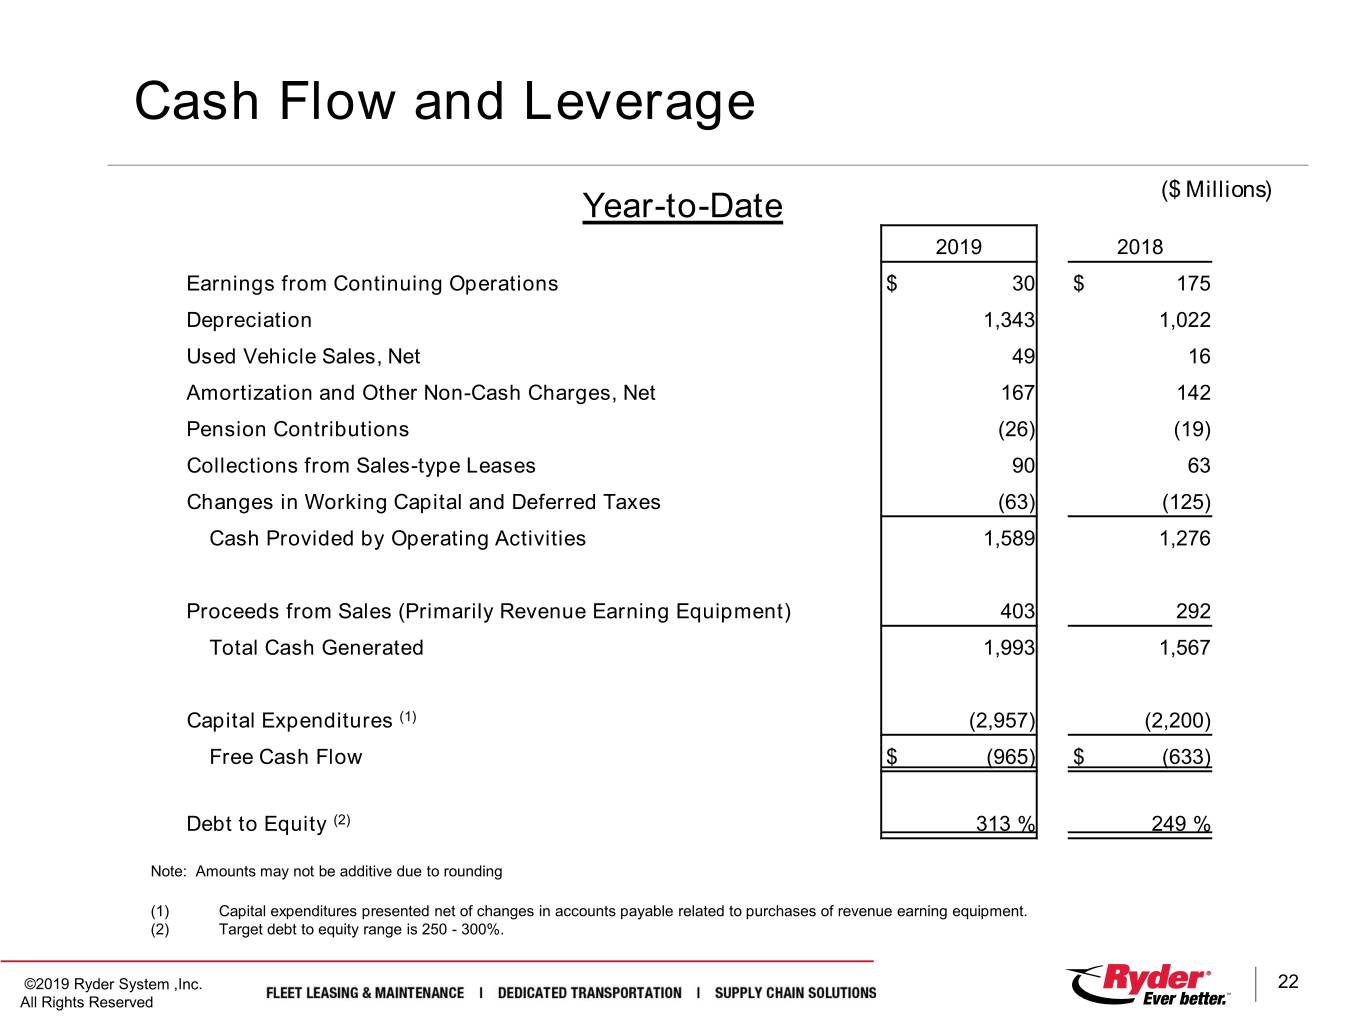
Cash Flow and Leverage Year-to-Date ($ Millions) 2019 2018 Earnings from Continuing Operations $ 30 $ 175 Depreciation 1,343 1,022 Used Vehicle Sales, Net 49 16 Amortization and Other Non-Cash Charges, Net 167 142 Pension Contributions (26) (19) Collections from Sales-type Leases 90 63 Changes in Working Capital and Deferred Taxes (63) (125) Cash Provided by Operating Activities 1,589 1,276 Proceeds from Sales (Primarily Revenue Earning Equipment) 403 292 Total Cash Generated 1,993 1,567 Capital Expenditures (1) (2,957) (2,200) Free Cash Flow $ (965) $ (633) Debt to Equity (2) 313 % 249 % Note: Amounts may not be additive due to rounding (1) Capital expenditures presented net of changes in accounts payable related to purchases of revenue earning equipment. (2) Target debt to equity range is 250 - 300%. ©2019 Ryder System ,Inc. 22 All Rights Reserved
Contents • Residual Value Estimate Change • Third Quarter 2019 Results Overview • EPS Forecast • Q & A ©2019 Ryder System ,Inc. 23 All Rights Reserved

EPS Forecast – Continuing Operations ($ Earnings Per Share) • Reducing our full year GAAP EPS forecast to $0.20 to $0.30 and full year Comparable EPS forecast to $1.00 to $1.10, primarily reflecting the impact from a change in residual value estimates • Current forecast is as follows: Fourth Quarter 2019 Full Year 2019 EPS Forecast ($0.36) to ($0.26) $0.20 to $0.30 Comparable EPS Forecast ($0.03) to $0.07 $1.00 to $1.10 Fourth Quarter 2018 * Full Year 2018 * EPS $2.13 $5.44 Comparable EPS $1.88 $5.97 (*) These amounts have been recast to reflect the impact of the lease accounting standard. Fourth quarter comparisons include a negative $0.16 to negative $0.21 year-over-year impact from lease accounting, reflecting an estimated negative $0.08 to negative $0.13 impact in the fourth quarter of 2019 compared to a $0.08 benefit in the prior year. The negative impact from lease accounting in 2019 reflects an expected decline in lease fleet age. The full year 2019 impact from lease accounting is now expected to reduce earnings per share by approximately $0.05 to $0.10 as compared to the prior accounting method. ©2019 Ryder System ,Inc. 24 All Rights Reserved
Contents • Residual Value Estimate Change • Third Quarter 2019 Results Overview • EPS Forecast • Q & A ©2019 Ryder System ,Inc. 25 All Rights Reserved
Q&A ©2019 Ryder System ,Inc. 26 All Rights Reserved
Appendix Residual Value Estimate Change Overview Three-Year Financial Targets Business Segment Detail Central Support Services Lease Accounting Impact on EPS Balance Sheet Adjusted Return on Capital Spread Financial Indicators Forecast Asset Management Non-GAAP Financial Measures & Reconciliations ©2019 Ryder System ,Inc. 27 All Rights Reserved

Vehicle Depreciation • We periodically review and adjust, as appropriate, the residual values of revenue earning equipment taking into account, among other factors, historical market price changes, current and expected future market price trends, expected lives of vehicles, and expected sales in the wholesale and retail markets. Refer to Form 10-Q for additional detail. • Three components of Ryder’s depreciation: • Policy Depreciation – estimated residuals established on each vehicle to set depreciation expense over the vehicles useful life – long-term view • Accelerated Depreciation – additional depreciation may be recorded as a vehicle nears the end of its useful life if its anticipated market value is below the estimated residual value (established through policy depreciation) at disposition – near-term view • Valuation Adjustments – additional negative adjustments recorded upon a vehicle reaching our used truck centers, only if anticipated market value is below the estimated residual value • A decline in market used vehicle pricing from 2015 peak levels resulted in sales prices dropping below estimated accounting residual values, thereby triggering accelerated depreciation, policy depreciation and valuation adjustments • Although realized market values remained below estimated accounting residual values during 2018 and 1H19, market values were improving • However, pricing began to decline in June 2019 and worsened in 3Q19. The changes triggered a re-evaluation of residual value estimates in the third quarter. ©2019 Ryder System ,Inc. 28 All Rights Reserved

Residual Value Assessment 3Q19 Assessment • Evaluated current conditions and near-term outlook for used vehicle pricing ‒ used vehicle prices expected to continue to decline in the near-term, particularly for tractors • Evaluated our long-term view of residual value estimates including future expected market impacts ‒ a prolonged decline in residuals versus 2015 peak is now expected ‒ we believe more recent sales prices of used vehicles are more indicative of our long-term view of residuals vs. prior estimates Residual value estimates were reduced based on current and expected market conditions and an assessment of the inputs used for estimation ©2019 Ryder System ,Inc. 29 All Rights Reserved

Estimate Change and Expected P&L Impact Reduced residual value estimates effective 7/1/19 for all power vehicles with the largest impact on tractors • Change to residual estimates impacted by depreciation policy (applied to vehicles expected to be sold starting in late 2021) ‒ reducing long-term residual values to reflect recent and expected market conditions • Change residual estimates impacted by accelerated depreciation (applied to vehicles expected to be sold by late 2021) ‒ reducing residual values to near-term outlook for used vehicle pricing levels ‒ adjust retail/wholesale mix to reflect expectations for increased wholesaling activity Increased depreciation expense resulting from the change in residual value estimates has the largest negative earnings impact in 3Q19, with declining impacts thereafter, for power vehicle fleet as of 3Q19 Reduced residual estimates intended to align with recent and expected market conditions ©2019 Ryder System ,Inc. 30 All Rights Reserved
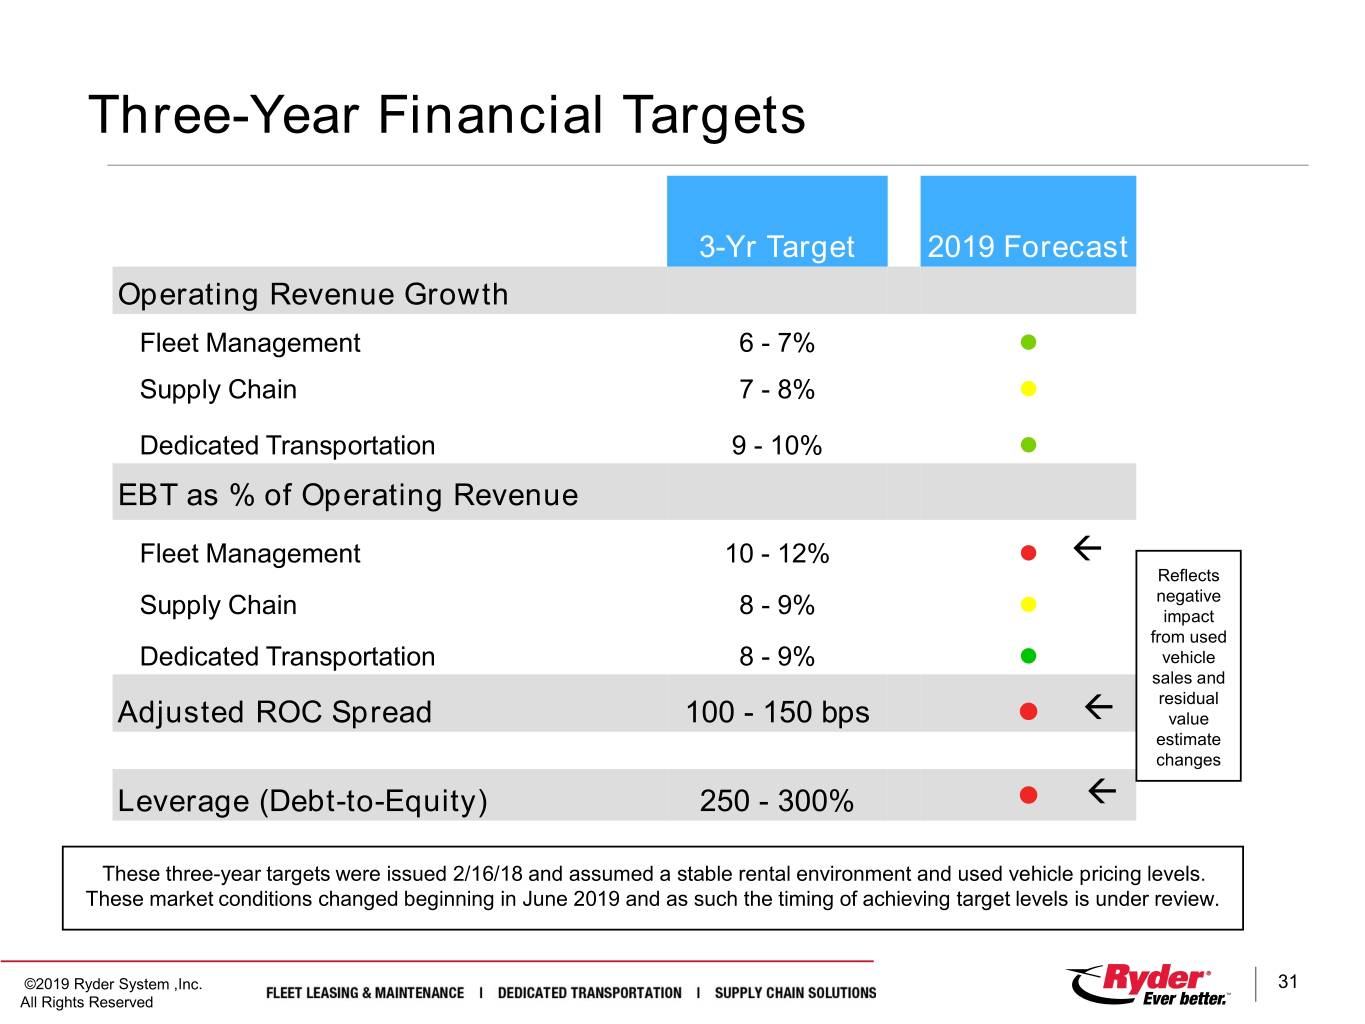
Three-Year Financial Targets 3-Yr Target 2019 Forecast Operating Revenue Growth Fleet Management 6 - 7% l Supply Chain 7 - 8% l Dedicated Transportation 9 - 10% l EBT as % of Operating Revenue Fleet Management 10 - 12% l Reflects negative Supply Chain 8 - 9% l impact from used Dedicated Transportation 8 - 9% l vehicle sales and residual Adjusted ROC Spread 100 - 150 bps l value estimate changes Leverage (Debt-to-Equity) 250 - 300% l These three-year targets were issued 2/16/18 and assumed a stable rental environment and used vehicle pricing levels. These market conditions changed beginning in June 2019 and as such the timing of achieving target levels is under review. ©2019 Ryder System ,Inc. 31 All Rights Reserved
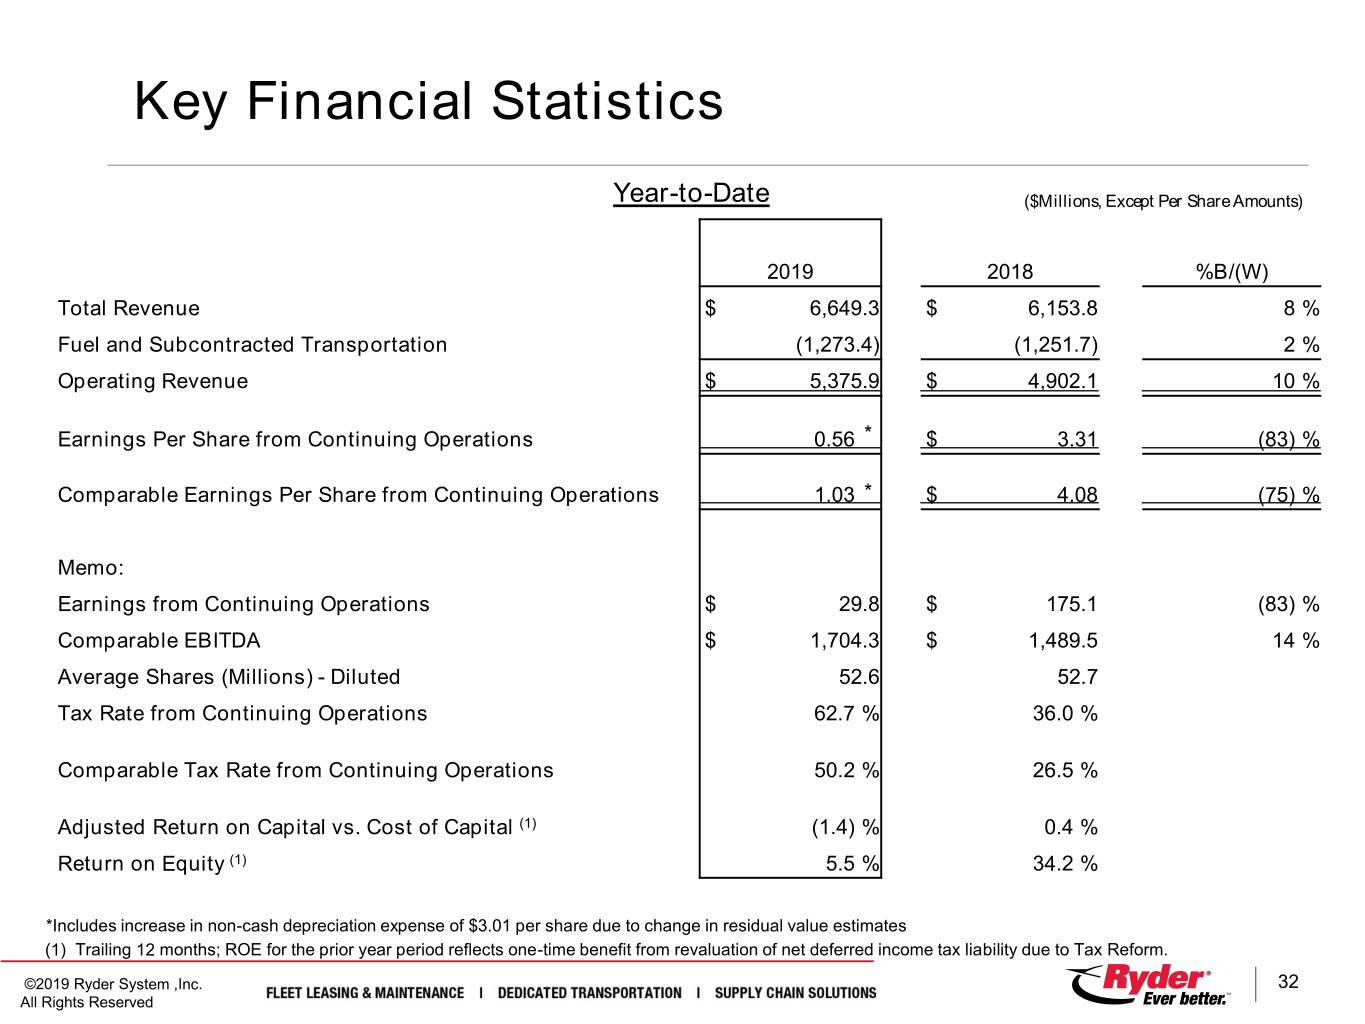
Key Financial Statistics Year-to-Date ($Millions, Except Per Share Amounts) 2019 2018 %B/(W) Total Revenue $ 6,649.3 $ 6,153.8 8 % Fuel and Subcontracted Transportation (1,273.4) (1,251.7) 2 % Operating Revenue $ 5,375.9 $ 4,902.1 10 % Earnings Per Share from Continuing Operations 0.56 * $ 3.31 (83) % Comparable Earnings Per Share from Continuing Operations 1.03 * $ 4.08 (75) % Memo: Earnings from Continuing Operations $ 29.8 $ 175.1 (83) % Comparable EBITDA $ 1,704.3 $ 1,489.5 14 % Average Shares (Millions) - Diluted 52.6 52.7 Tax Rate from Continuing Operations 62.7 % 36.0 % Comparable Tax Rate from Continuing Operations 50.2 % 26.5 % Adjusted Return on Capital vs. Cost of Capital (1) (1.4) % 0.4 % Return on Equity (1) 5.5 % 34.2 % *Includes increase in non-cash depreciation expense of $3.01 per share due to change in residual value estimates (1) Trailing 12 months; ROE for the prior year period reflects one-time benefit from revaluation of net deferred income tax liability due to Tax Reform. ©2019 Ryder System ,Inc. 32 All Rights Reserved
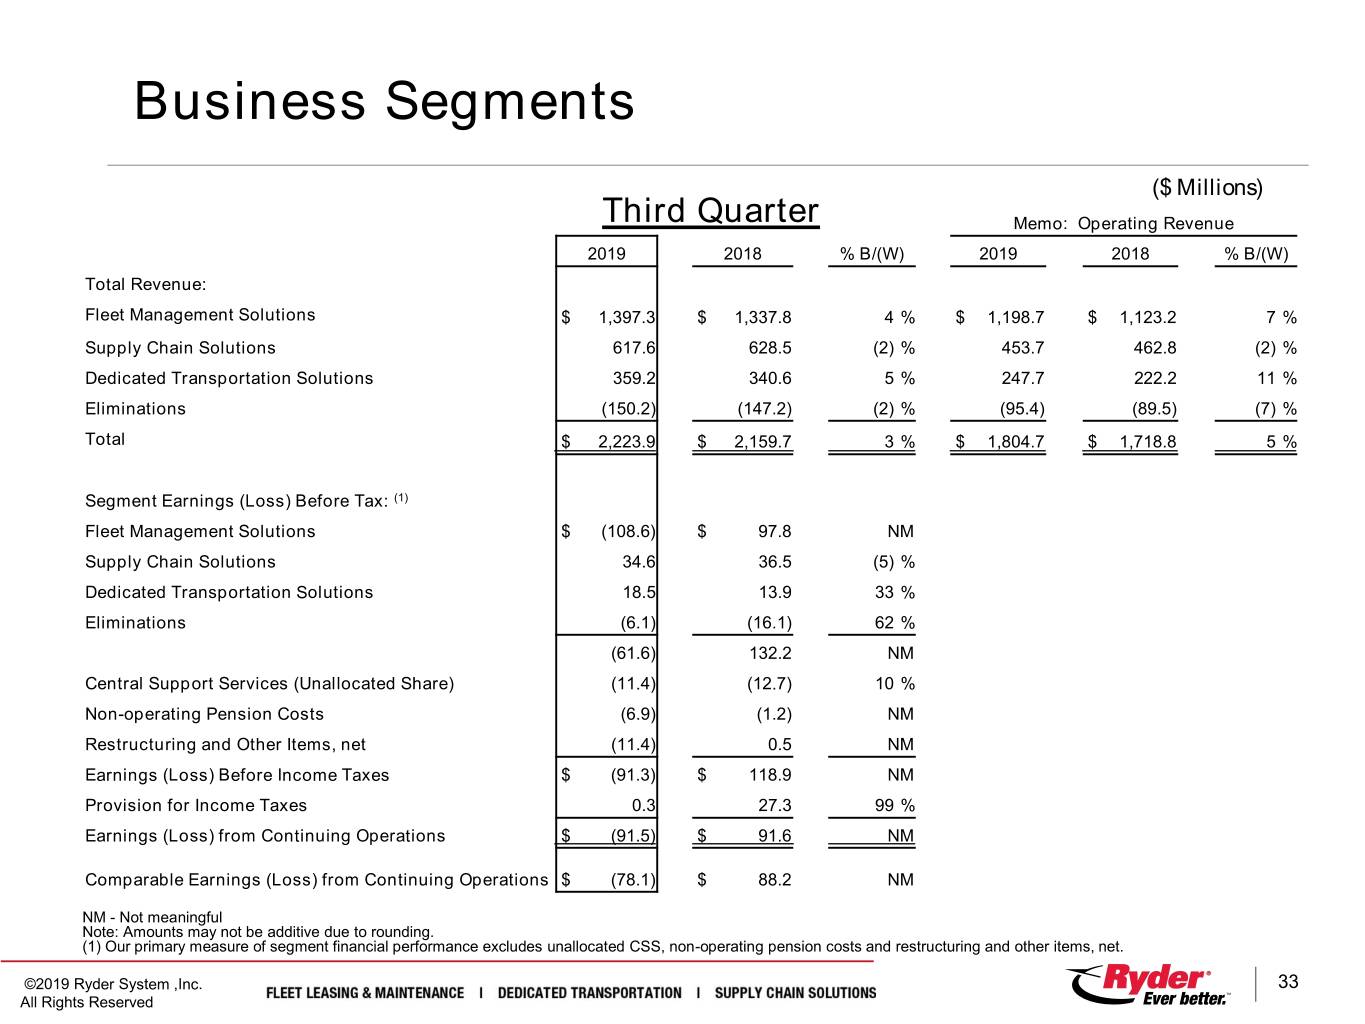
Business Segments ($ Millions) Third Quarter Memo: Operating Revenue 2019 2018 % B/(W) 2019 2018 % B/(W) Total Revenue: Fleet Management Solutions $ 1,397.3 $ 1,337.8 4 % $ 1,198.7 $ 1,123.2 7 % Supply Chain Solutions 617.6 628.5 (2) % 453.7 462.8 (2) % Dedicated Transportation Solutions 359.2 340.6 5 % 247.7 222.2 11 % Eliminations (150.2) (147.2) (2) % (95.4) (89.5) (7) % Total $ 2,223.9 $ 2,159.7 3 % $ 1,804.7 $ 1,718.8 5 % Segment Earnings (Loss) Before Tax: (1) Fleet Management Solutions $ (108.6) $ 97.8 NM Supply Chain Solutions 34.6 36.5 (5) % Dedicated Transportation Solutions 18.5 13.9 33 % Eliminations (6.1) (16.1) 62 % (61.6) 132.2 NM Central Support Services (Unallocated Share) (11.4) (12.7) 10 % Non-operating Pension Costs (6.9) (1.2) NM Restructuring and Other Items, net (11.4) 0.5 NM Earnings (Loss) Before Income Taxes $ (91.3) $ 118.9 NM Provision for Income Taxes 0.3 27.3 99 % Earnings (Loss) from Continuing Operations $ (91.5) $ 91.6 NM Comparable Earnings (Loss) from Continuing Operations $ (78.1) $ 88.2 NM NM - Not meaningful Note: Amounts may not be additive due to rounding. (1) Our primary measure of segment financial performance excludes unallocated CSS, non-operating pension costs and restructuring and other items, net. ©2019 Ryder System ,Inc. 33 All Rights Reserved

Business Segments ($ Millions) Year-to-Date Memo: Operating Revenue 2019 2018 % B/(W) 2019 2018 % B/(W) Total Revenue: Fleet Management Solutions $ 4,139.9 $ 3,876.6 7 % $ 3,520.9 $ 3,243.0 9 % Supply Chain Solutions 1,902.6 1,727.8 10 % 1,413.6 1,275.7 11 % Dedicated Transportation Services 1,071.1 970.2 10 % 731.4 637.5 15 % Eliminations (464.3) (420.7) (10) % (290.0) (254.0) (14) % Total $ 6,649.3 $ 6,153.8 8 % $ 5,375.9 $ 4,902.1 10 % Segment Earnings (Loss) Before Tax: (1) Fleet Management Solutions $ 10.1 228.7 (96) % Supply Chain Solutions 112.7 98.9 14 % Dedicated Transportation Services 63.0 45.4 39 % Eliminations (42.6) (44.6) 5 % 143.2 328.4 (56) % Central Support Services (Unallocated Share) (34.5) (34.3) — % Non-operating Pension Costs (20.1) (3.2) NM Restructuring and Other Items, net (8.8) (17.3) 50 % Earnings Before Income Taxes $ 80.0 $ 273.5 (71) % Provision for Income Taxes 50.2 98.4 49 % Earnings from Continuing Operations $ 29.8 $ 175.1 (83) % Comparable Earnings (Loss) from Continuing Operations $ 54.2 $ 216.1 (75) % NM - Not meaningful Note: Amounts may not be additive due to rounding. (1) Our primary measure of segment financial performance excludes unallocated CSS, non-operating pension costs and restructuring and other items, net. ©2019 Ryder System ,Inc. 34 All Rights Reserved

Fleet Management Solutions (FMS) ($ Millions) Third Quarter Revenue 2019 2018 % B/(W) ChoiceLease $ 779.8 $ 718.0 9 % SelectCare 133.4 125.9 6 % Commercial Rental 263.0 257.9 2 % Other 22.5 21.5 4 % FMS Operating Revenue 1,198.7 1,123.2 7 % Fuel Services Revenue 198.7 214.5 (7) % FMS Total Revenue $ 1,397.3 $ 1,337.8 4 % FMS Earnings (Loss) Before Tax FMS Earnings (Loss) Before Tax (EBT) $ (108.6) * $ 97.8 NM FMS EBT as a % of FMS Total Revenue (7.8) % 7.3 % FMS EBT as a % of FMS Operating Revenue (9.1) % 8.7 % NM - Not meaningful Note: Amounts may not be additive due to rounding. * 2019 FMS EBT includes a $177M impact from higher depreciation due to change in residual value estimates ©2019 Ryder System ,Inc. 35 All Rights Reserved
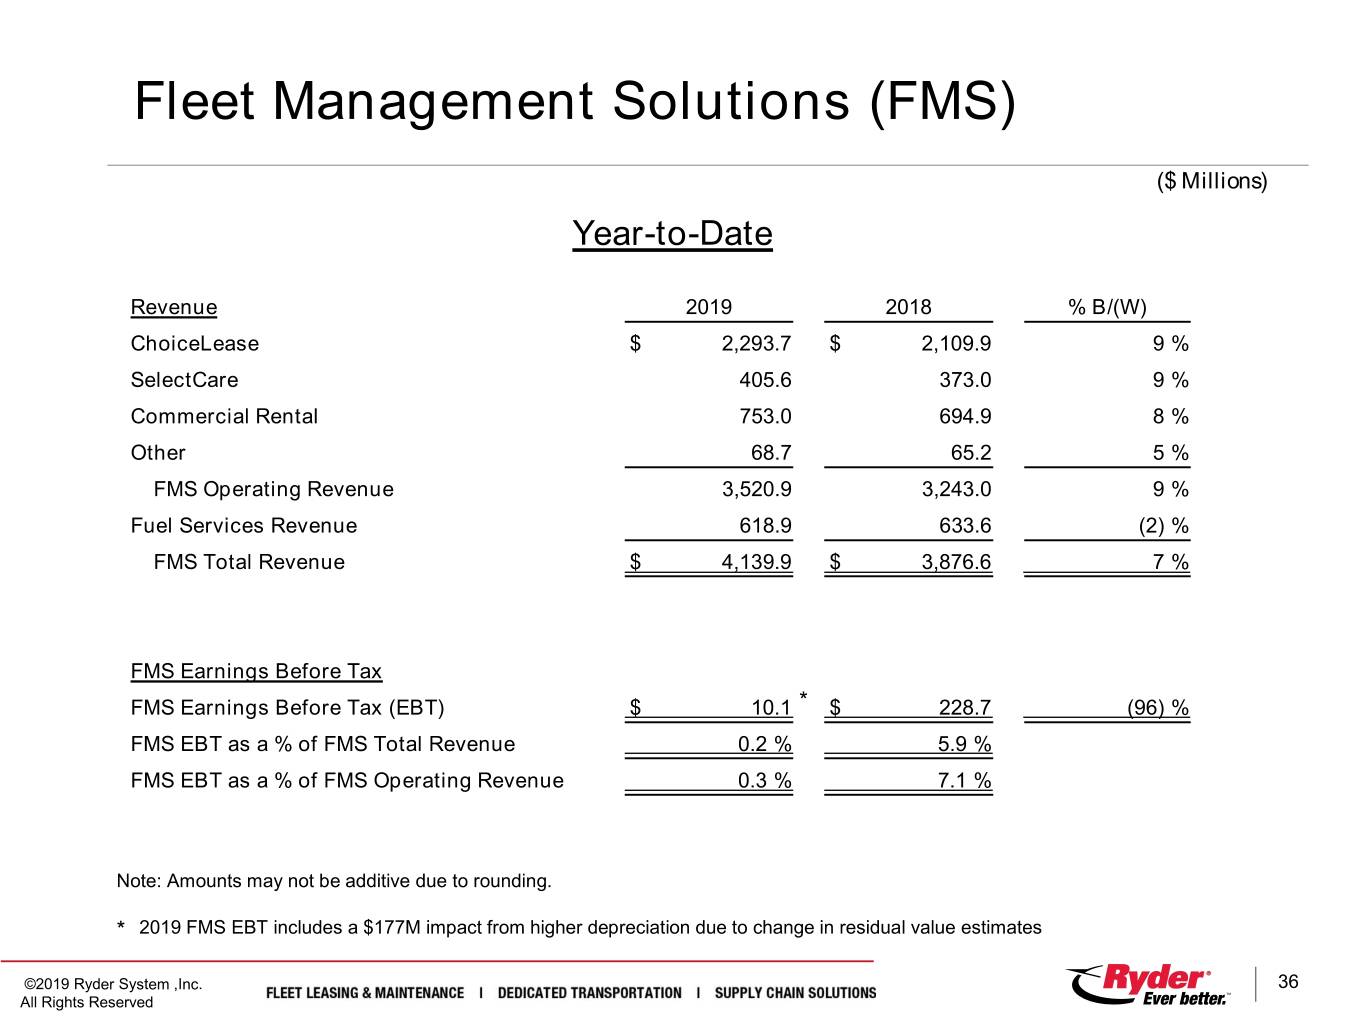
Fleet Management Solutions (FMS) ($ Millions) Year-to-Date Revenue 2019 2018 % B/(W) ChoiceLease $ 2,293.7 $ 2,109.9 9 % SelectCare 405.6 373.0 9 % Commercial Rental 753.0 694.9 8 % Other 68.7 65.2 5 % FMS Operating Revenue 3,520.9 3,243.0 9 % Fuel Services Revenue 618.9 633.6 (2) % FMS Total Revenue $ 4,139.9 $ 3,876.6 7 % FMS Earnings Before Tax FMS Earnings Before Tax (EBT) $ 10.1 * $ 228.7 (96) % FMS EBT as a % of FMS Total Revenue 0.2 % 5.9 % FMS EBT as a % of FMS Operating Revenue 0.3 % 7.1 % Note: Amounts may not be additive due to rounding. * 2019 FMS EBT includes a $177M impact from higher depreciation due to change in residual value estimates ©2019 Ryder System ,Inc. 36 All Rights Reserved
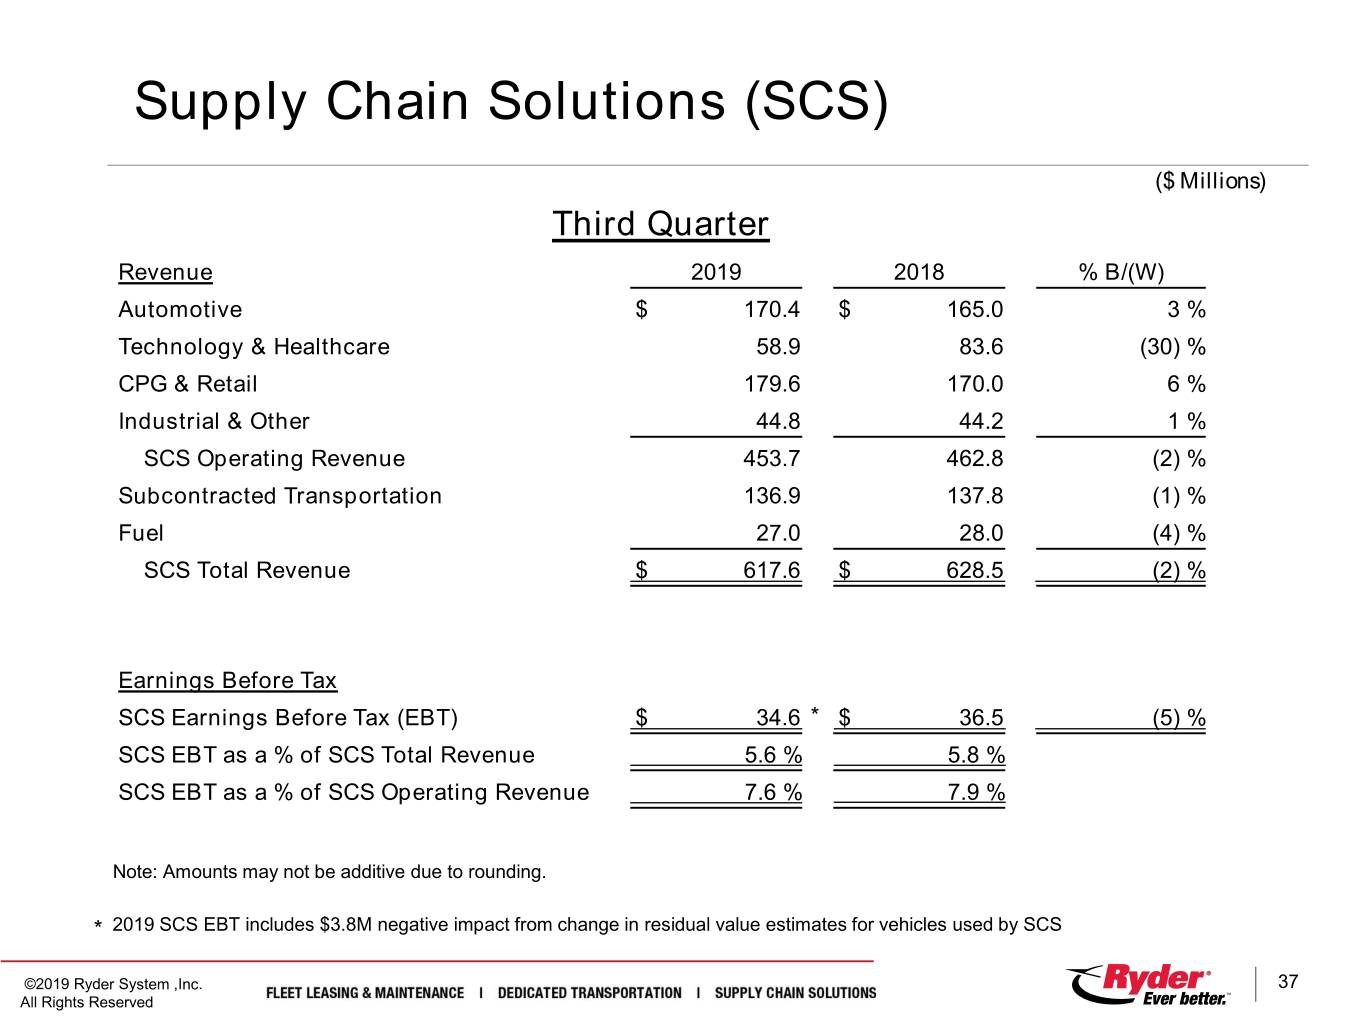
Supply Chain Solutions (SCS) ($ Millions) Third Quarter Revenue 2019 2018 % B/(W) Automotive $ 170.4 $ 165.0 3 % Technology & Healthcare 58.9 83.6 (30) % CPG & Retail 179.6 170.0 6 % Industrial & Other 44.8 44.2 1 % SCS Operating Revenue 453.7 462.8 (2) % Subcontracted Transportation 136.9 137.8 (1) % Fuel 27.0 28.0 (4) % SCS Total Revenue $ 617.6 $ 628.5 (2) % Earnings Before Tax SCS Earnings Before Tax (EBT) $ 34.6 * $ 36.5 (5) % SCS EBT as a % of SCS Total Revenue 5.6 % 5.8 % SCS EBT as a % of SCS Operating Revenue 7.6 % 7.9 % Note: Amounts may not be additive due to rounding. * 2019 SCS EBT includes $3.8M negative impact from change in residual value estimates for vehicles used by SCS ©2019 Ryder System ,Inc. 37 All Rights Reserved
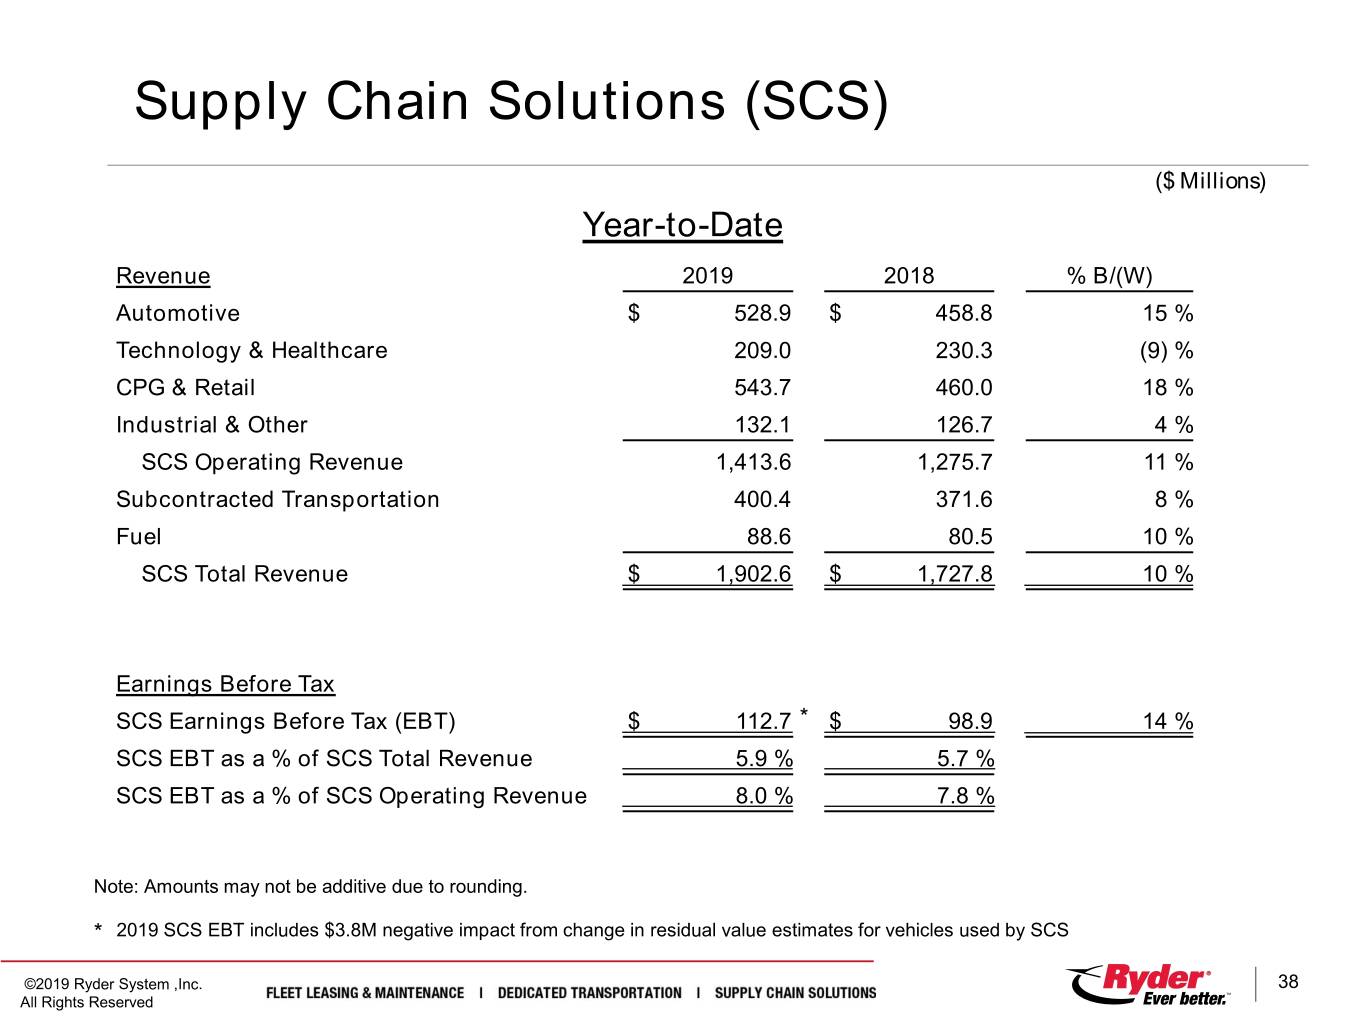
Supply Chain Solutions (SCS) ($ Millions) Year-to-Date Revenue 2019 2018 % B/(W) Automotive $ 528.9 $ 458.8 15 % Technology & Healthcare 209.0 230.3 (9) % CPG & Retail 543.7 460.0 18 % Industrial & Other 132.1 126.7 4 % SCS Operating Revenue 1,413.6 1,275.7 11 % Subcontracted Transportation 400.4 371.6 8 % Fuel 88.6 80.5 10 % SCS Total Revenue $ 1,902.6 $ 1,727.8 10 % Earnings Before Tax SCS Earnings Before Tax (EBT) $ 112.7 * $ 98.9 14 % SCS EBT as a % of SCS Total Revenue 5.9 % 5.7 % SCS EBT as a % of SCS Operating Revenue 8.0 % 7.8 % Note: Amounts may not be additive due to rounding. * 2019 SCS EBT includes $3.8M negative impact from change in residual value estimates for vehicles used by SCS ©2019 Ryder System ,Inc. 38 All Rights Reserved
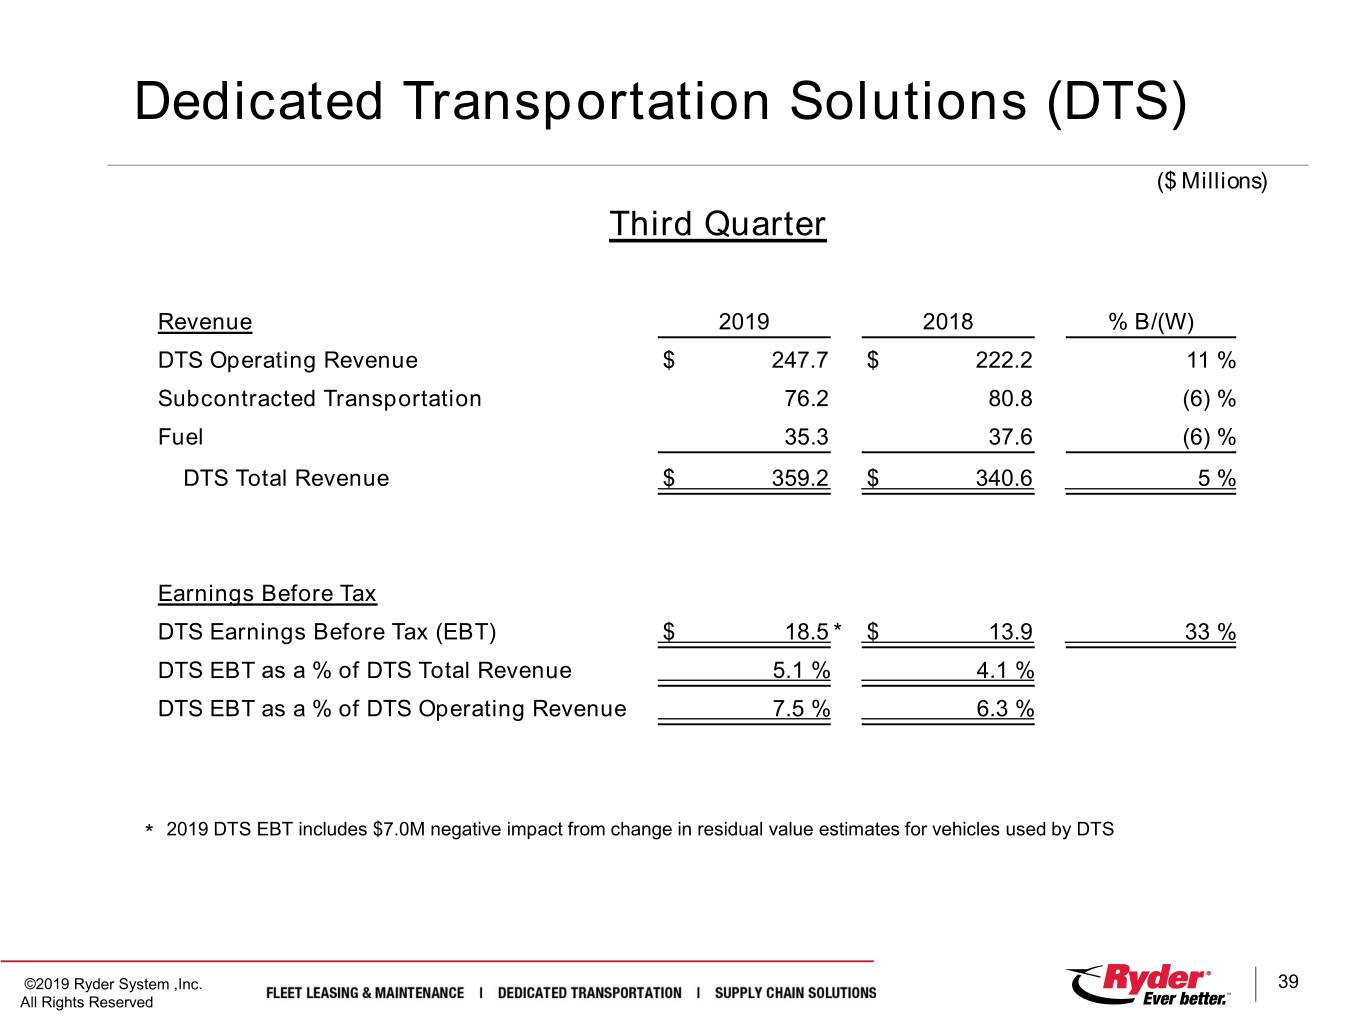
Dedicated Transportation Solutions (DTS) ($ Millions) Third Quarter Revenue 2019 2018 % B/(W) DTS Operating Revenue $ 247.7 $ 222.2 11 % Subcontracted Transportation 76.2 80.8 (6) % Fuel 35.3 37.6 (6) % DTS Total Revenue $ 359.2 $ 340.6 5 % Earnings Before Tax DTS Earnings Before Tax (EBT) $ 18.5 * $ 13.9 33 % DTS EBT as a % of DTS Total Revenue 5.1 % 4.1 % DTS EBT as a % of DTS Operating Revenue 7.5 % 6.3 % * 2019 DTS EBT includes $7.0M negative impact from change in residual value estimates for vehicles used by DTS ©2019 Ryder System ,Inc. 39 All Rights Reserved

Dedicated Transportation Solutions (DTS) ($ Millions) Year-to-Date Revenue 2019 2018 % B/(W) DTS Operating Revenue $ 731.4 $ 637.5 15 % Subcontracted Transportation 229.9 224.8 2 % Fuel 109.8 107.9 2 % DTS Total Revenue $ 1,071.1 $ 970.2 10 % Earnings Before Tax DTS Earnings Before Tax (EBT) $ 63.0 * $ 45.4 39 % DTS EBT as a % of DTS Total Revenue 5.9 % 4.7 % DTS EBT as a % of DTS Operating Revenue 8.6 % 7.1 % * DTS EBT includes $7.0M negative impact from change in residual value estimates for vehicles used by DTS ©2019 Ryder System ,Inc. 40 All Rights Reserved

Central Support Services (CSS) ($ Millions) Third Quarter 2019 2018 % B/(W) Allocated CSS Costs $ 59.8 $ 57.3 (4) % Unallocated CSS Costs 11.4 12.7 10 % Total CSS Costs $ 71.2 $ 70.0 (2) % Year-to-Date 2019 2018 % B/(W) Allocated CSS Costs $ 179.9 $ 164.7 (9) % Unallocated CSS Costs 34.5 34.3 (1) % Total CSS Costs $ 214.4 $ 199.1 (8) % Note: Amounts may not be additive due to rounding. ©2019 Ryder System ,Inc. 41 All Rights Reserved
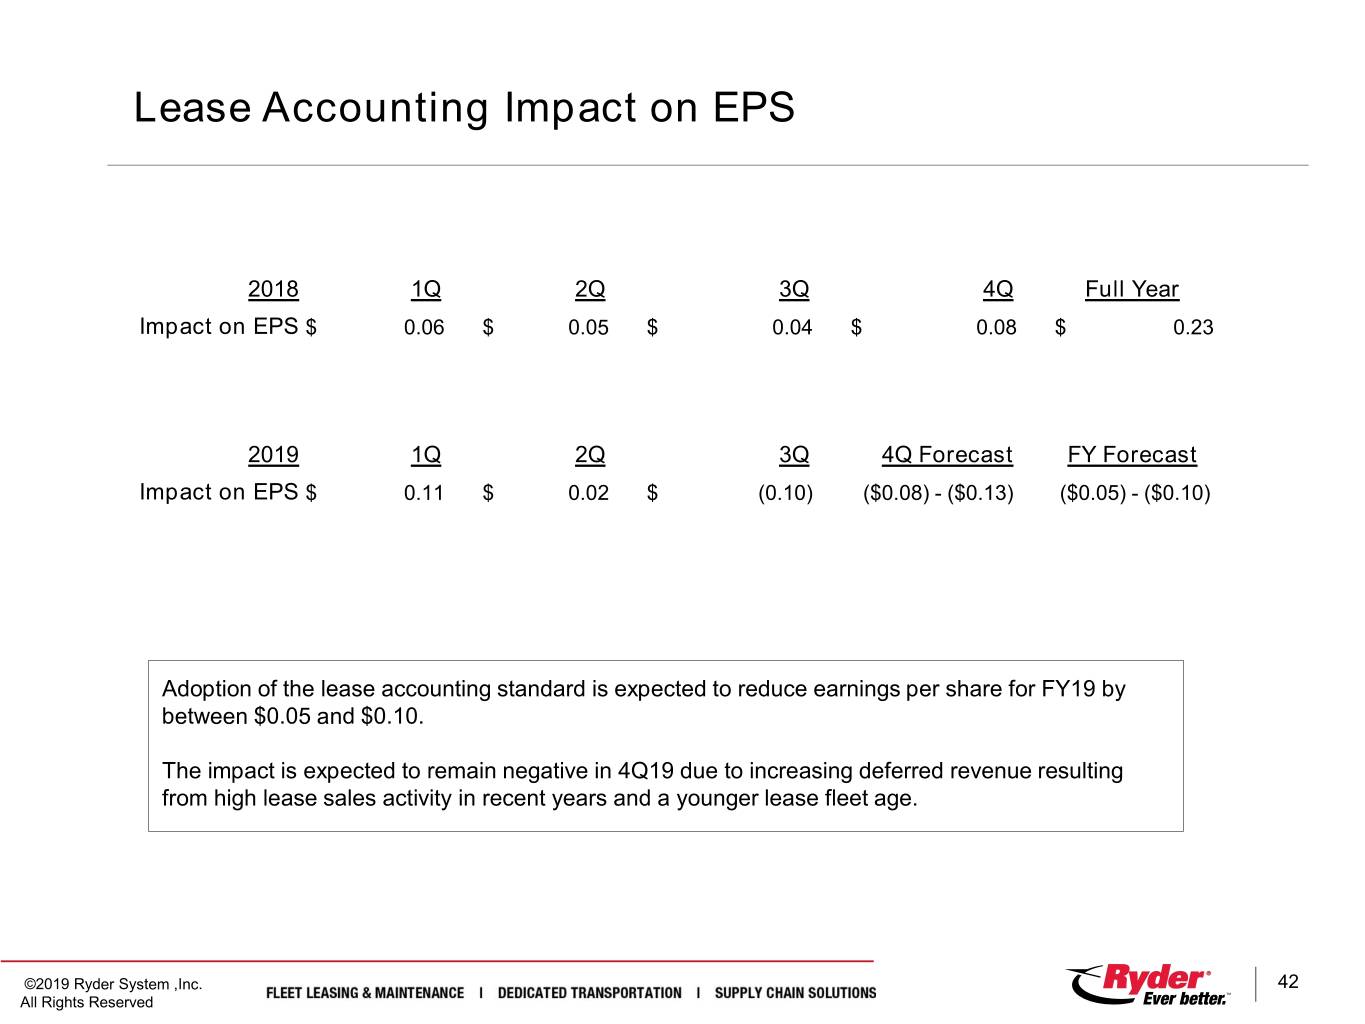
Lease Accounting Impact on EPS 2018 1Q 2Q 3Q 4Q Full Year Impact on EPS $ 0.06 $ 0.05 $ 0.04 $ 0.08 $ 0.23 2019 1Q 2Q 3Q 4Q Forecast FY Forecast Impact on EPS $ 0.11 $ 0.02 $ (0.10) ($0.08) - ($0.13) ($0.05) - ($0.10) Adoption of the lease accounting standard is expected to reduce earnings per share for FY19 by between $0.05 and $0.10. The impact is expected to remain negative in 4Q19 due to increasing deferred revenue resulting from high lease sales activity in recent years and a younger lease fleet age. ©2019 Ryder System ,Inc. 42 All Rights Reserved
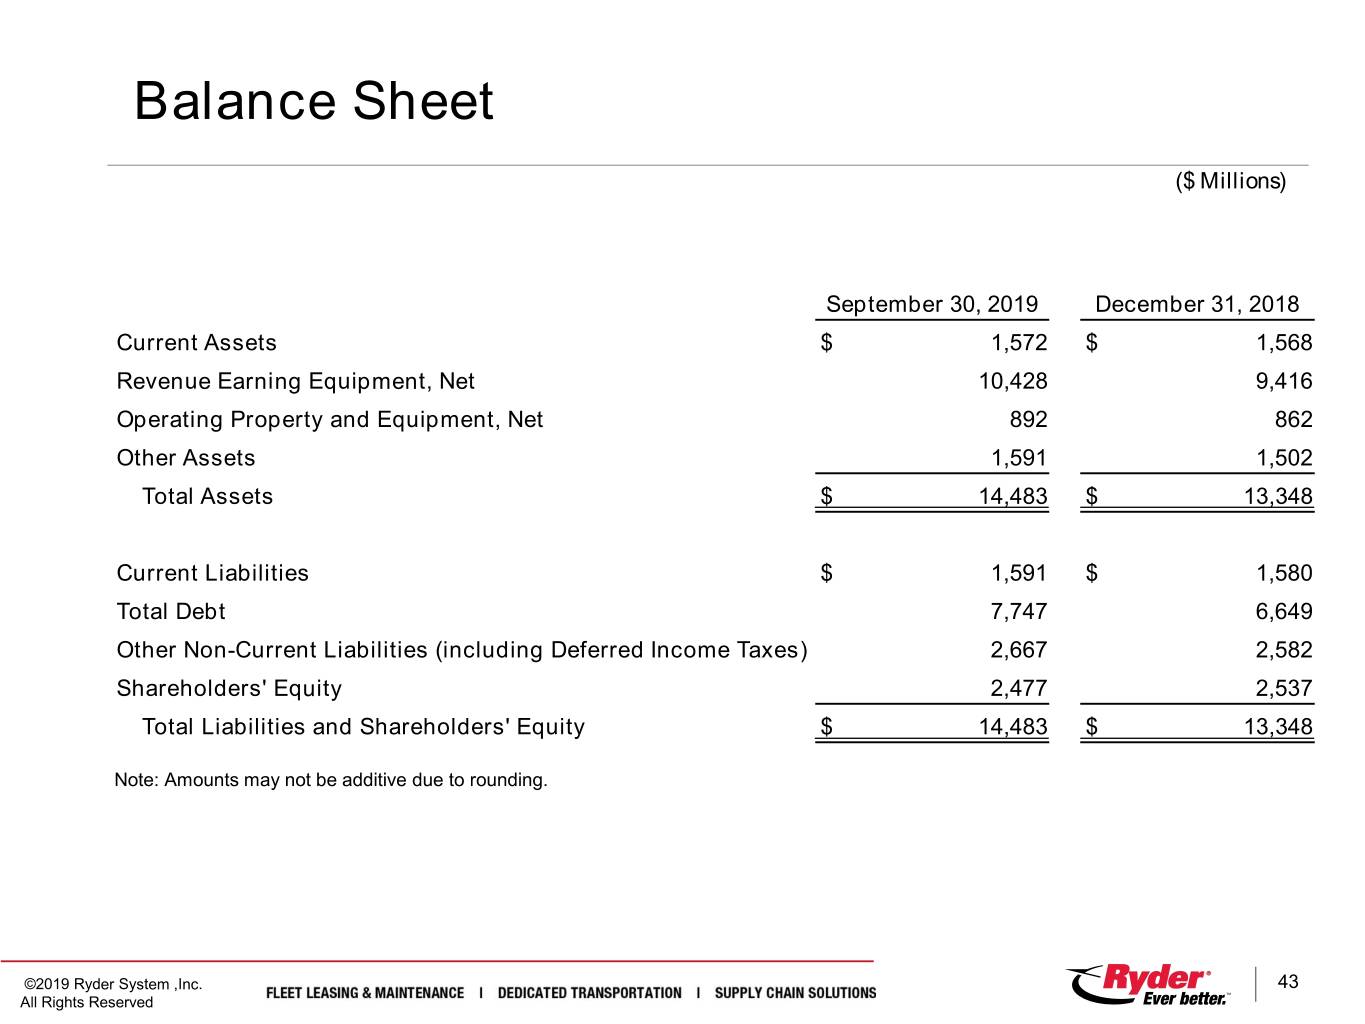
Balance Sheet ($ Millions) September 30, 2019 December 31, 2018 Current Assets $ 1,572 $ 1,568 Revenue Earning Equipment, Net 10,428 9,416 Operating Property and Equipment, Net 892 862 Other Assets 1,591 1,502 Total Assets $ 14,483 $ 13,348 Current Liabilities $ 1,591 $ 1,580 Total Debt 7,747 6,649 Other Non-Current Liabilities (including Deferred Income Taxes) 2,667 2,582 Shareholders' Equity 2,477 2,537 Total Liabilities and Shareholders' Equity $ 14,483 $ 13,348 Note: Amounts may not be additive due to rounding. ©2019 Ryder System ,Inc. 43 All Rights Reserved
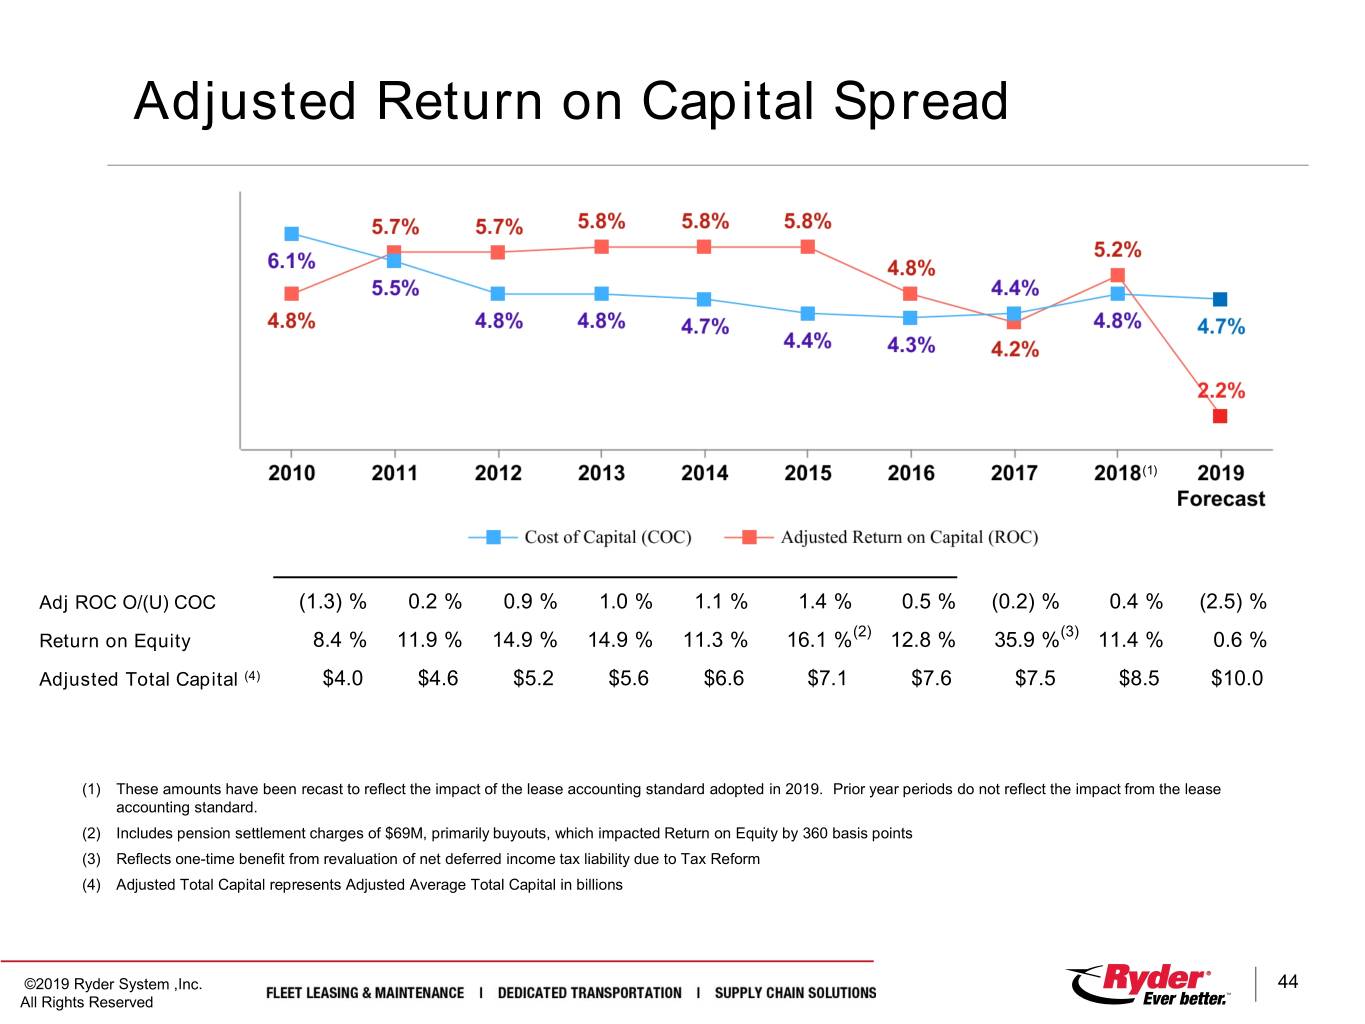
Adjusted Return on Capital Spread (1) Adj ROC O/(U) COC (1.3) % 0.2 % 0.9 % 1.0 % 1.1 % 1.4 % 0.5 % (0.2) % 0.4 % (2.5) % (2) (3) Return on Equity 8.4 % 11.9 % 14.9 % 14.9 % 11.3 % 16.1 % 12.8 % 35.9 % 11.4 % 0.6 % Adjusted Total Capital (4) $4.0 $4.6 $5.2 $5.6 $6.6 $7.1 $7.6 $7.5 $8.5 $10.0 (1) These amounts have been recast to reflect the impact of the lease accounting standard adopted in 2019. Prior year periods do not reflect the impact from the lease accounting standard. (2) Includes pension settlement charges of $69M, primarily buyouts, which impacted Return on Equity by 360 basis points (3) Reflects one-time benefit from revaluation of net deferred income tax liability due to Tax Reform (4) Adjusted Total Capital represents Adjusted Average Total Capital in billions ©2019 Ryder System ,Inc. 44 All Rights Reserved
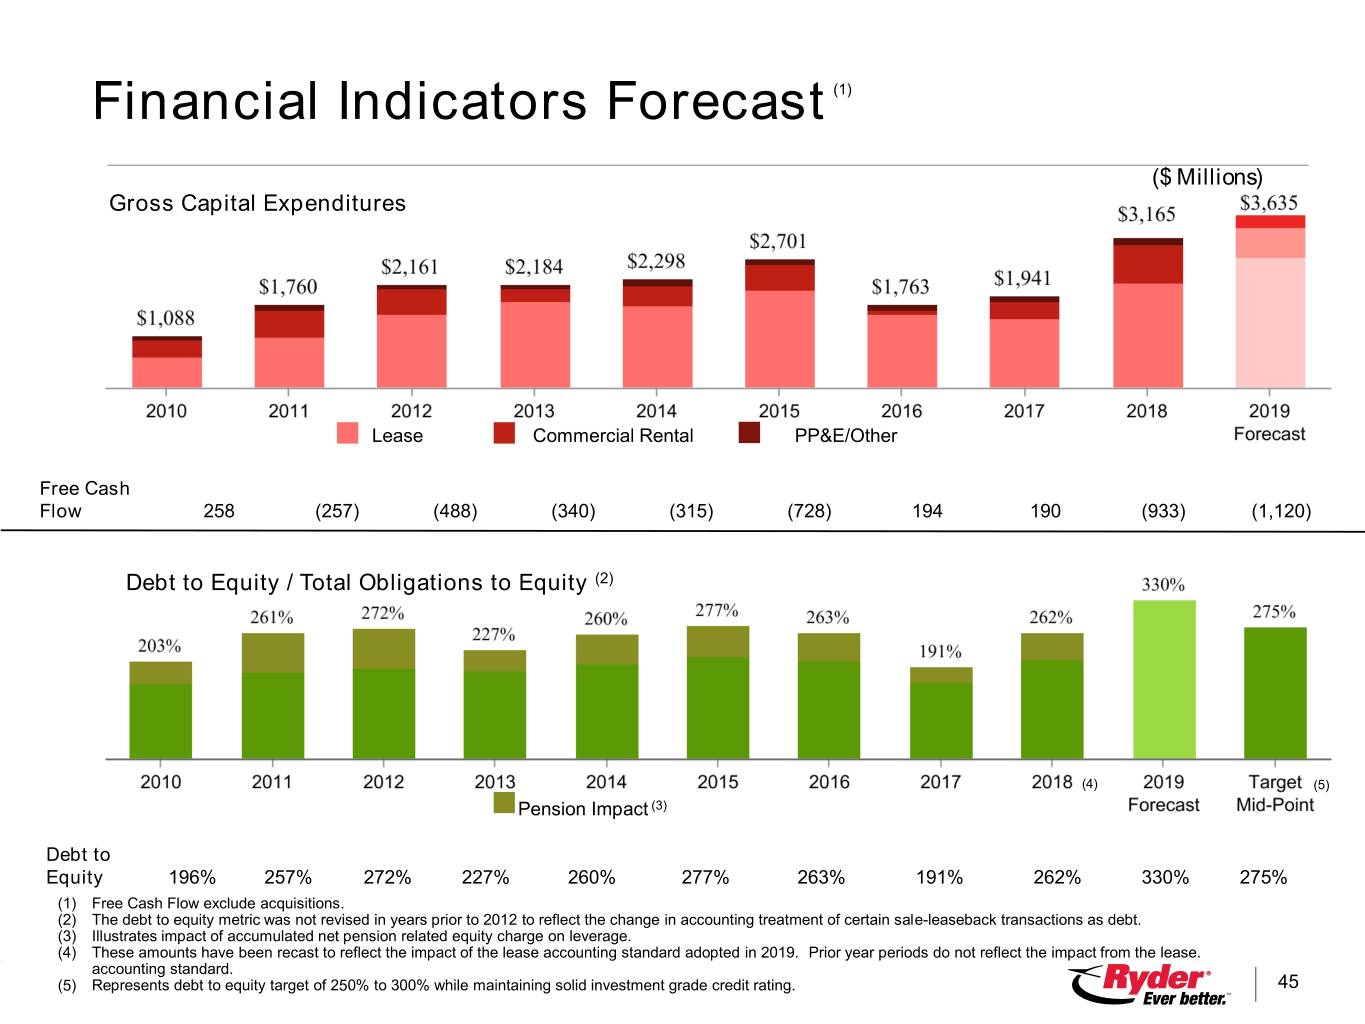
Financial Indicators Forecast (1) ($ Millions) Gross Capital Expenditures Lease Commercial Rental PP&E/Other Free Cash Flow 258 (257) (488) (340) (315) (728) 194 190 (933) (1,120) Debt to Equity / Total Obligations to Equity (2) (4) (5) Pension Impact (3) Debt to Equity 196% 257% 272% 227% 260% 277% 263% 191% 262% 330% 275% (1) Free Cash Flow exclude acquisitions. (2) The debt to equity metric was not revised in years prior to 2012 to reflect the change in accounting treatment of certain sale-leaseback transactions as debt. (3) Illustrates impact of accumulated net pension related equity charge on leverage. (4) These amounts have been recast to reflect the impact of the lease accounting standard adopted in 2019. Prior year periods do not reflect the impact from the lease. accounting standard. ©2019(5) RyderRepresents System ,Inc.debt to equity target of 250% to 300% while maintaining solid investment grade credit rating. 45 All Rights Reserved
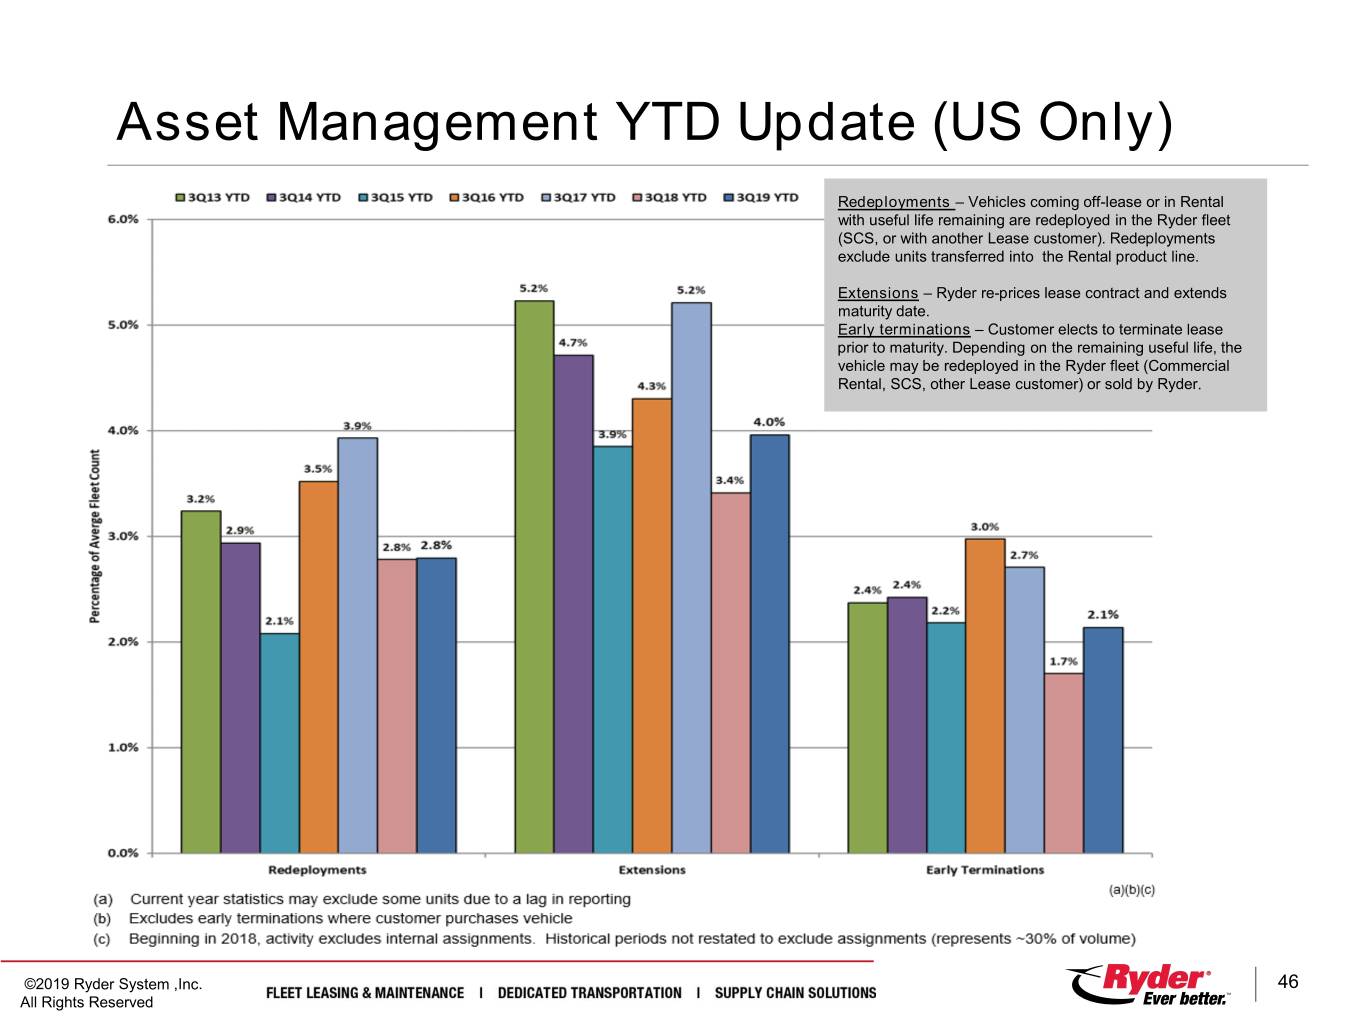
Asset Management YTD Update (US Only) Redeployments – Vehicles coming off-lease or in Rental with useful life remaining are redeployed in the Ryder fleet (SCS, or with another Lease customer). Redeployments exclude units transferred into the Rental product line. Extensions – Ryder re-prices lease contract and extends maturity date. Early terminations – Customer elects to terminate lease prior to maturity. Depending on the remaining useful life, the vehicle may be redeployed in the Ryder fleet (Commercial Rental, SCS, other Lease customer) or sold by Ryder. ©2019 Ryder System ,Inc. 46 All Rights Reserved

Non-GAAP Financial Measures This presentation includes “non-GAAP financial measures” as defined by SEC rules. As required by SEC rules, we provide a reconciliation of each non-GAAP financial measure to the most comparable GAAP measure. Non-GAAP financial measures should be considered in addition to, but not as a substitute for or superior to, other measures of financial performance prepared in accordance with GAAP. Specifically, the following non-GAAP financial measures are included in this presentation: Reconciliation & Additional Information Presented Non-GAAP Financial Measure Comparable GAAP Measure on Slide Titled Operating Revenue Measures: Operating Revenue Total Revenue Key Financial Statistics FMS Operating Revenue, DTS Operating Revenue and SCS FMS Total Revenue, DTS Total Revenue and SCS Total Revenue Fleet Management Solutions (FMS), Dedicated Transportation Operating Revenue Solutions (DTS) and Supply Chain Solutions (SCS) FMS EBT as a % of FMS Operating Revenue, DTS EBT as a % of FMS EBT as a % of FMS Total Revenue, DTS EBT as a % of DTS Fleet Management Solutions (FMS), Dedicated Transportation DTS Operating Revenue, and SCS EBT as a % of SCS Operating Total Revenue, and SCS EBT as a % of SCS Total Revenue Solutions (DTS) and Supply Chain Solutions (SCS) Revenue Comparable Earnings Measures: Comparable Earnings (Loss) and Comparable EPS Earnings (Loss) and EPS from Continuing Operations Earnings (Loss) and EPS from Continuing Operations Reconciliation Comparable EPS Forecast EPS Forecast from Continuing Operations EPS Forecast – Continuing Operations Comparable Earnings (Loss) Before Income Tax and Comparable Tax Earnings (Loss) Before Income Tax and Tax Rate Earnings (Loss) Before Income Tax and Tax Rate from Rate Continuing Operations Reconciliation Adjusted Return on Capital (ROC) and Adjusted ROC Spread Not Applicable. However, non-GAAP elements of the calculation Adjusted Return on Capital Reconciliation have been reconciled to the corresponding GAAP measures. A numerical reconciliation of net earnings to adjusted net earnings and average total debt and average shareholders' equity to adjusted average total capital is provided. Comparable Earnings (Loss) Before Interest, Taxes, Depreciation and Earnings (Loss) from Continuing Operations Comparable EBITDA Reconciliation Amortization Cash Flow Measures: Total Cash Generated and Free Cash Flow Cash Provided by Operating Activities Cash Flow Reconciliation Debt Measures: Total Obligations and Total Obligations to Equity Balance Sheet Debt and Debt to Equity Debt to Equity Reconciliation ©2019 Ryder System ,Inc. 47 All Rights Reserved
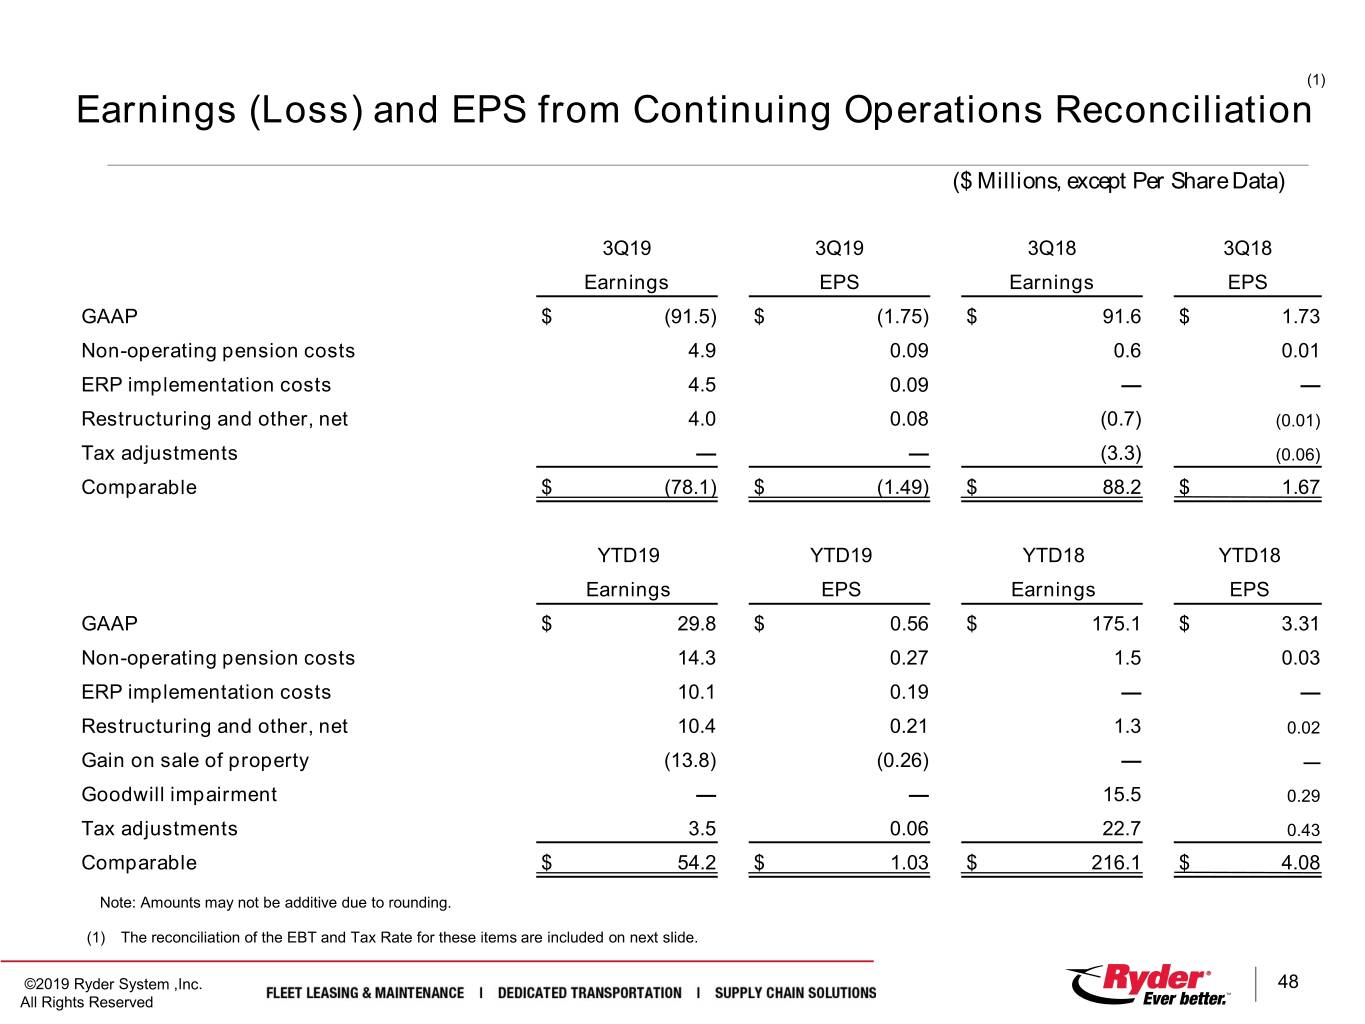
(1) Earnings (Loss) and EPS from Continuing Operations Reconciliation ($ Millions, except Per Share Data) 3Q19 3Q19 3Q18 3Q18 Earnings EPS Earnings EPS GAAP $ (91.5) $ (1.75) $ 91.6 $ 1.73 Non-operating pension costs 4.9 0.09 0.6 0.01 ERP implementation costs 4.5 0.09 — — Restructuring and other, net 4.0 0.08 (0.7) (0.01) Tax adjustments — — (3.3) (0.06) Comparable $ (78.1) $ (1.49) $ 88.2 $ 1.67 YTD19 YTD19 YTD18 YTD18 Earnings EPS Earnings EPS GAAP $ 29.8 $ 0.56 $ 175.1 $ 3.31 Non-operating pension costs 14.3 0.27 1.5 0.03 ERP implementation costs 10.1 0.19 — — Restructuring and other, net 10.4 0.21 1.3 0.02 Gain on sale of property (13.8) (0.26) — — Goodwill impairment — — 15.5 0.29 Tax adjustments 3.5 0.06 22.7 0.43 Comparable $ 54.2 $ 1.03 $ 216.1 $ 4.08 Note: Amounts may not be additive due to rounding. (1) The reconciliation of the EBT and Tax Rate for these items are included on next slide. ©2019 Ryder System ,Inc. 48 All Rights Reserved
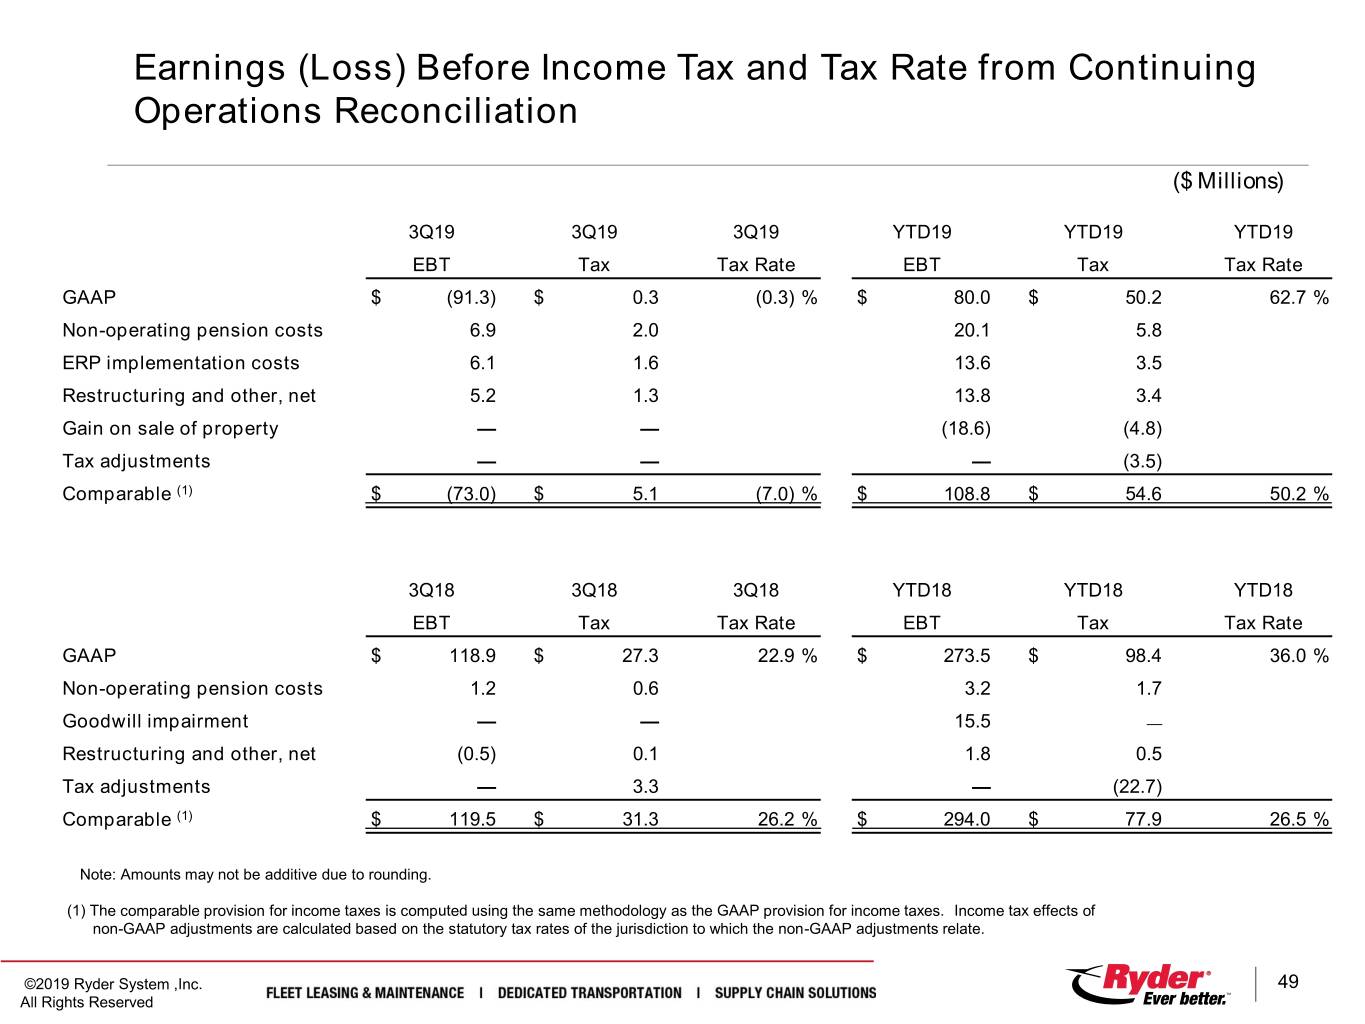
Earnings (Loss) Before Income Tax and Tax Rate from Continuing Operations Reconciliation ($ Millions) 3Q19 3Q19 3Q19 YTD19 YTD19 YTD19 EBT Tax Tax Rate EBT Tax Tax Rate GAAP $ (91.3) $ 0.3 (0.3) % $ 80.0 $ 50.2 62.7 % Non-operating pension costs 6.9 2.0 20.1 5.8 ERP implementation costs 6.1 1.6 13.6 3.5 Restructuring and other, net 5.2 1.3 13.8 3.4 Gain on sale of property — — (18.6) (4.8) Tax adjustments — — — (3.5) Comparable (1) $ (73.0) $ 5.1 (7.0) % $ 108.8 $ 54.6 50.2 % 3Q18 3Q18 3Q18 YTD18 YTD18 YTD18 EBT Tax Tax Rate EBT Tax Tax Rate GAAP $ 118.9 $ 27.3 22.9 % $ 273.5 $ 98.4 36.0 % Non-operating pension costs 1.2 0.6 3.2 1.7 Goodwill impairment — — 15.5 — Restructuring and other, net (0.5) 0.1 1.8 0.5 Tax adjustments — 3.3 — (22.7) Comparable (1) $ 119.5 $ 31.3 26.2 % $ 294.0 $ 77.9 26.5 % Note: Amounts may not be additive due to rounding. (1) The comparable provision for income taxes is computed using the same methodology as the GAAP provision for income taxes. Income tax effects of non-GAAP adjustments are calculated based on the statutory tax rates of the jurisdiction to which the non-GAAP adjustments relate. ©2019 Ryder System ,Inc. 49 All Rights Reserved
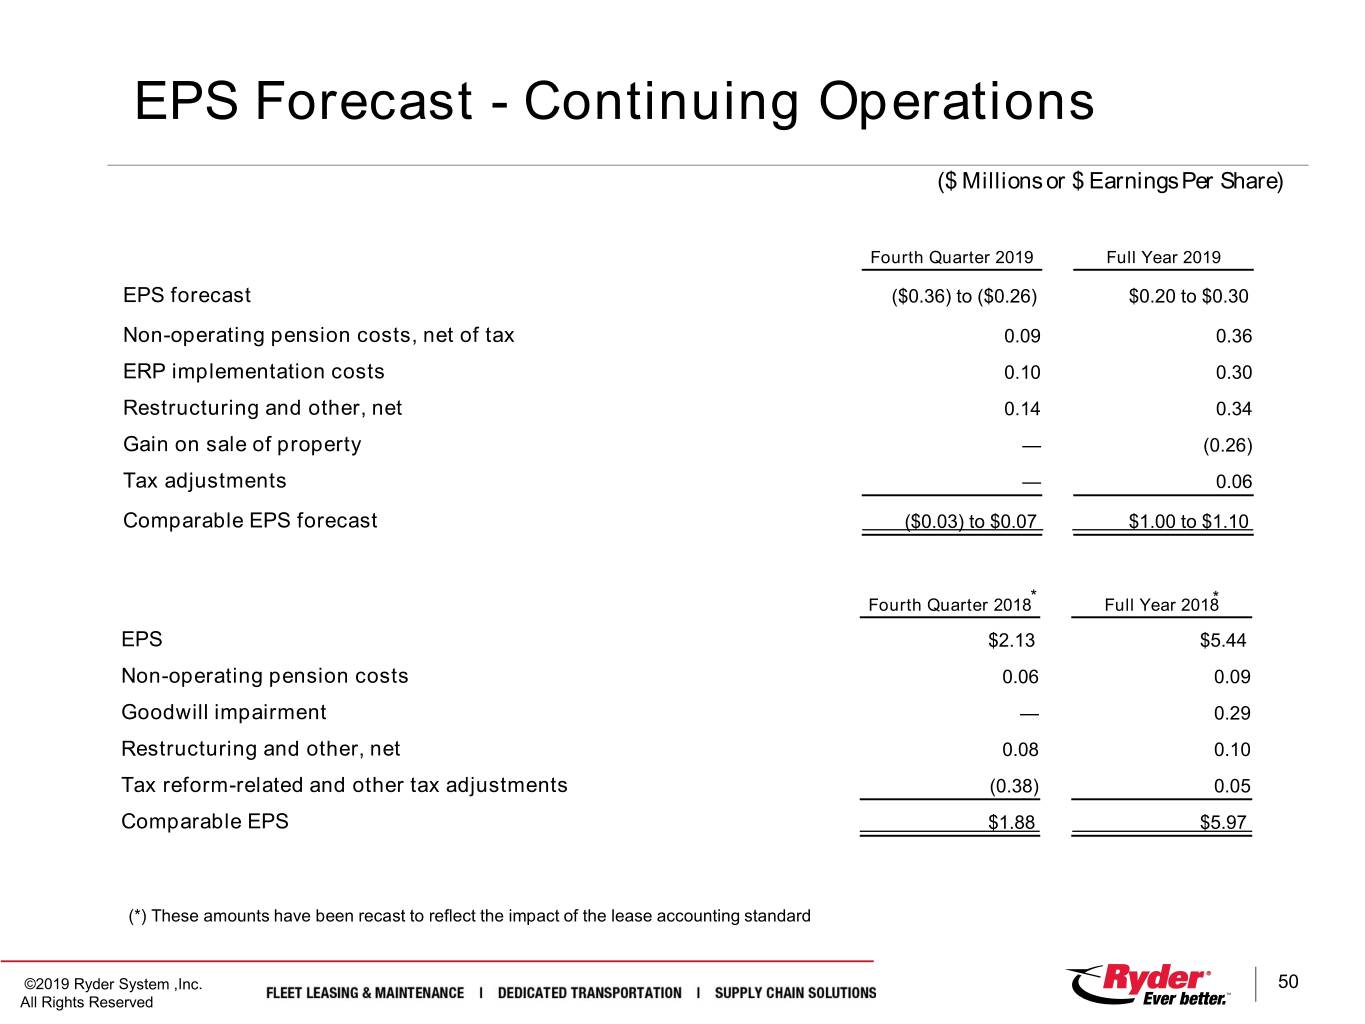
EPS Forecast - Continuing Operations ($ Millions or $ Earnings Per Share) Fourth Quarter 2019 Full Year 2019 EPS forecast ($0.36) to ($0.26) $0.20 to $0.30 Non-operating pension costs, net of tax 0.09 0.36 ERP implementation costs 0.10 0.30 Restructuring and other, net 0.14 0.34 Gain on sale of property — (0.26) Tax adjustments — 0.06 Comparable EPS forecast ($0.03) to $0.07 $1.00 to $1.10 * Fourth Quarter 2018 Full Year 2018* EPS $2.13 $5.44 Non-operating pension costs 0.06 0.09 Goodwill impairment — 0.29 Restructuring and other, net 0.08 0.10 Tax reform-related and other tax adjustments (0.38) 0.05 Comparable EPS $1.88 $5.97 (*) These amounts have been recast to reflect the impact of the lease accounting standard ©2019 Ryder System ,Inc. 50 All Rights Reserved
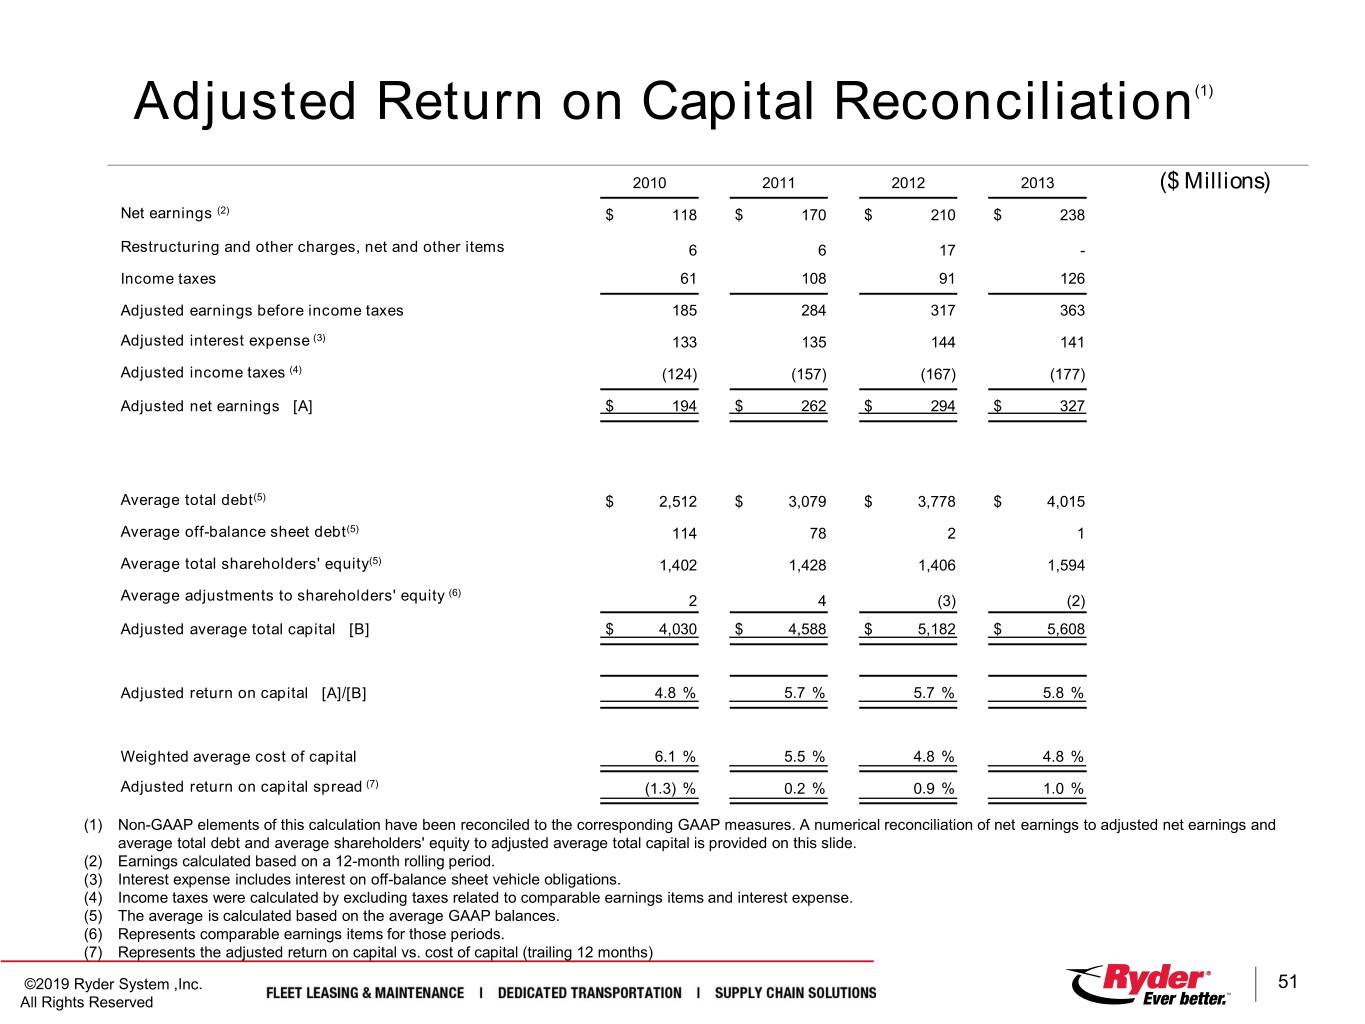
Adjusted Return on Capital Reconciliation(1) 2010 2011 2012 2013 ($ Millions) Net earnings (2) $ 118 $ 170 $ 210 $ 238 Restructuring and other charges, net and other items 6 6 17 - Income taxes 61 108 91 126 Adjusted earnings before income taxes 185 284 317 363 Adjusted interest expense (3) 133 135 144 141 Adjusted income taxes (4) (124) (157) (167) (177) Adjusted net earnings [A] $ 194 $ 262 $ 294 $ 327 Average total debt(5) $ 2,512 $ 3,079 $ 3,778 $ 4,015 Average off-balance sheet debt(5) 114 78 2 1 Average total shareholders' equity(5) 1,402 1,428 1,406 1,594 (6) Average adjustments to shareholders' equity 2 4 (3) (2) Adjusted average total capital [B] $ 4,030 $ 4,588 $ 5,182 $ 5,608 Adjusted return on capital [A]/[B] 4.8 % 5.7 % 5.7 % 5.8 % Weighted average cost of capital 6.1 % 5.5 % 4.8 % 4.8 % Adjusted return on capital spread (7) (1.3) % 0.2 % 0.9 % 1.0 % (1) Non-GAAP elements of this calculation have been reconciled to the corresponding GAAP measures. A numerical reconciliation of net earnings to adjusted net earnings and average total debt and average shareholders' equity to adjusted average total capital is provided on this slide. (2) Earnings calculated based on a 12-month rolling period. (3) Interest expense includes interest on off-balance sheet vehicle obligations. (4) Income taxes were calculated by excluding taxes related to comparable earnings items and interest expense. (5) The average is calculated based on the average GAAP balances. (6) Represents comparable earnings items for those periods. (7) Represents the adjusted return on capital vs. cost of capital (trailing 12 months) ©2019 Ryder System ,Inc. 51 All Rights Reserved
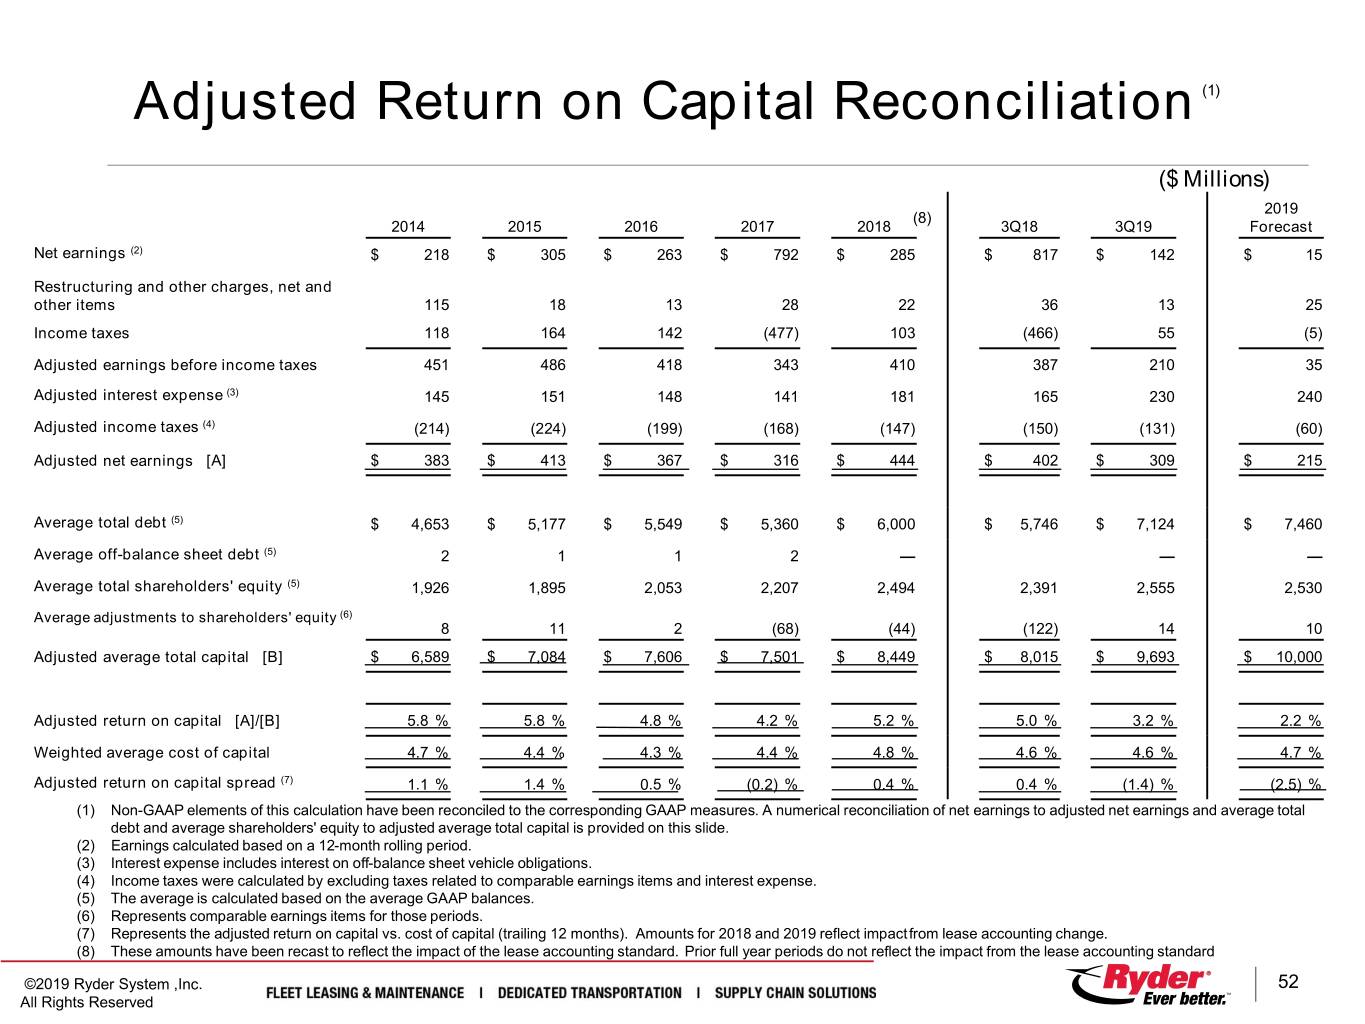
Adjusted Return on Capital Reconciliation (1) ($ Millions) 2019 (8) 2014 2015 2016 2017 2018 3Q18 3Q19 Forecast Net earnings (2) $ 218 $ 305 $ 263 $ 792 $ 285 $ 817 $ 142 $ 15 Restructuring and other charges, net and other items 115 18 13 28 22 36 13 25 Income taxes 118 164 142 (477) 103 (466) 55 (5) Adjusted earnings before income taxes 451 486 418 343 410 387 210 35 Adjusted interest expense (3) 145 151 148 141 181 165 230 240 Adjusted income taxes (4) (214) (224) (199) (168) (147) (150) (131) (60) Adjusted net earnings [A] $ 383 $ 413 $ 367 $ 316 $ 444 $ 402 $ 309 $ 215 Average total debt (5) $ 4,653 $ 5,177 $ 5,549 $ 5,360 $ 6,000 $ 5,746 $ 7,124 $ 7,460 Average off-balance sheet debt (5) 2 1 1 2 — — — Average total shareholders' equity (5) 1,926 1,895 2,053 2,207 2,494 2,391 2,555 2,530 Average adjustments to shareholders' equity (6) 8 11 2 (68) (44) (122) 14 10 Adjusted average total capital [B] $ 6,589 $ 7,084 $ 7,606 $ 7,501 $ 8,449 $ 8,015 $ 9,693 $ 10,000 Adjusted return on capital [A]/[B] 5.8 % 5.8 % 4.8 % 4.2 % 5.2 % 5.0 % 3.2 % 2.2 % Weighted average cost of capital 4.7 % 4.4 % 4.3 % 4.4 % 4.8 % 4.6 % 4.6 % 4.7 % Adjusted return on capital spread (7) 1.1 % 1.4 % 0.5 % (0.2) % 0.4 % 0.4 % (1.4) % (2.5) % (1) Non-GAAP elements of this calculation have been reconciled to the corresponding GAAP measures. A numerical reconciliation of net earnings to adjusted net earnings and average total debt and average shareholders' equity to adjusted average total capital is provided on this slide. (2) Earnings calculated based on a 12-month rolling period. (3) Interest expense includes interest on off-balance sheet vehicle obligations. (4) Income taxes were calculated by excluding taxes related to comparable earnings items and interest expense. (5) The average is calculated based on the average GAAP balances. (6) Represents comparable earnings items for those periods. (7) Represents the adjusted return on capital vs. cost of capital (trailing 12 months). Amounts for 2018 and 2019 reflect impactfrom lease accounting change. (8) These amounts have been recast to reflect the impact of the lease accounting standard. Prior full year periods do not reflect the impact from the lease accounting standard ©2019 Ryder System ,Inc. 52 All Rights Reserved
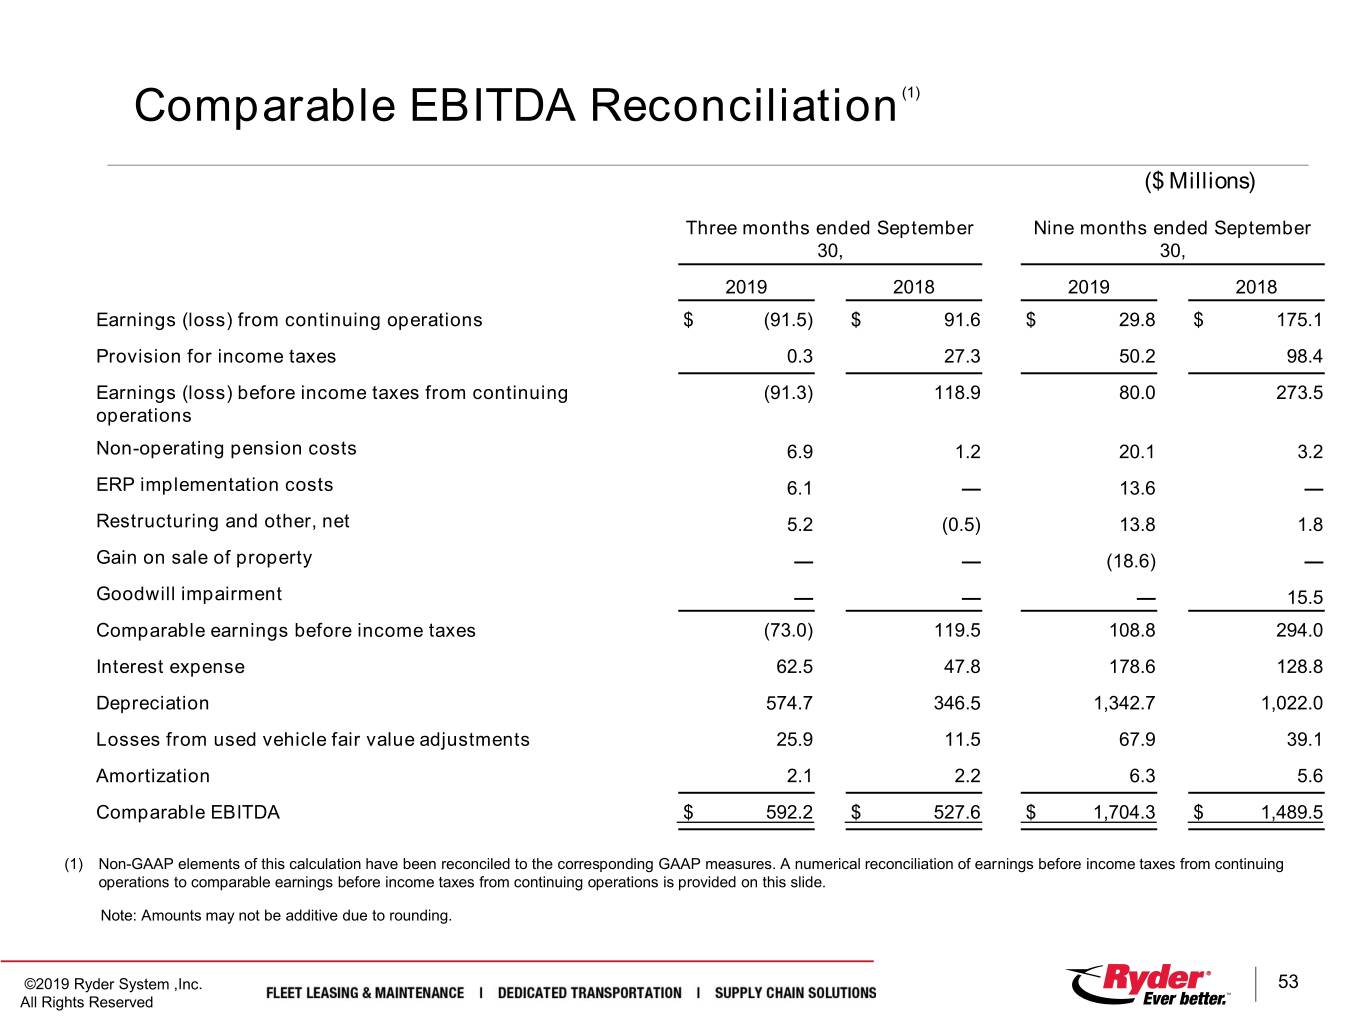
Comparable EBITDA Reconciliation(1) ($ Millions) Three months ended September Nine months ended September 30, 30, 2019 2018 2019 2018 Earnings (loss) from continuing operations $ (91.5) $ 91.6 $ 29.8 $ 175.1 Provision for income taxes 0.3 27.3 50.2 98.4 Earnings (loss) before income taxes from continuing (91.3) 118.9 80.0 273.5 operations Non-operating pension costs 6.9 1.2 20.1 3.2 ERP implementation costs 6.1 — 13.6 — Restructuring and other, net 5.2 (0.5) 13.8 1.8 Gain on sale of property — — (18.6) — Goodwill impairment — — — 15.5 Comparable earnings before income taxes (73.0) 119.5 108.8 294.0 Interest expense 62.5 47.8 178.6 128.8 Depreciation 574.7 346.5 1,342.7 1,022.0 Losses from used vehicle fair value adjustments 25.9 11.5 67.9 39.1 Amortization 2.1 2.2 6.3 5.6 Comparable EBITDA $ 592.2 $ 527.6 $ 1,704.3 $ 1,489.5 (1) Non-GAAP elements of this calculation have been reconciled to the corresponding GAAP measures. A numerical reconciliation of earnings before income taxes from continuing operations to comparable earnings before income taxes from continuing operations is provided on this slide. Note: Amounts may not be additive due to rounding. ©2019 Ryder System ,Inc. 53 All Rights Reserved
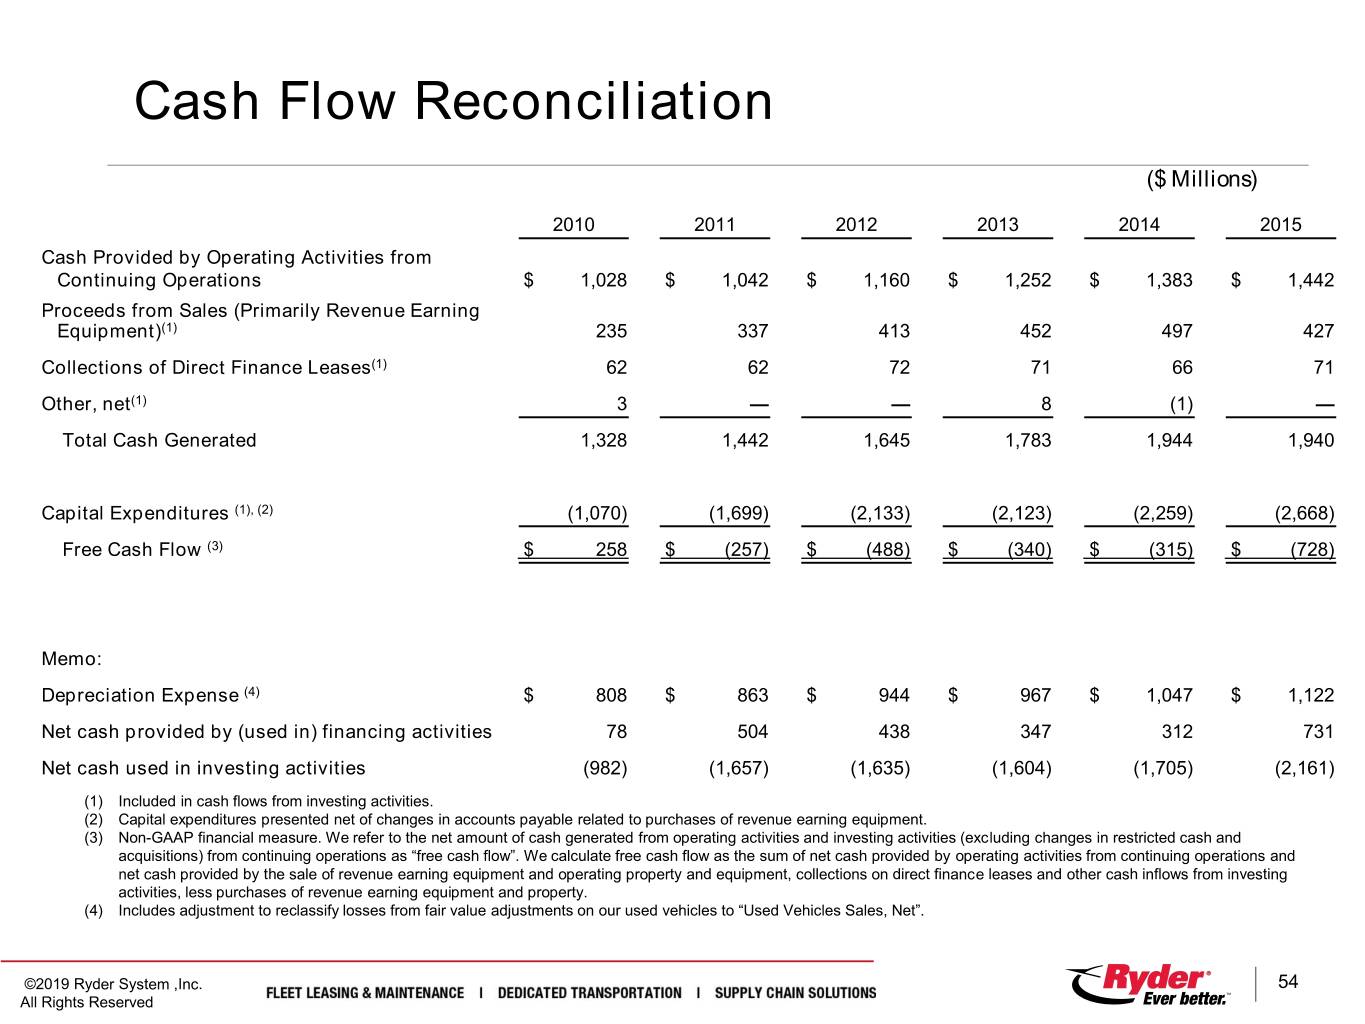
Cash Flow Reconciliation ($ Millions) 2010 2011 2012 2013 2014 2015 Cash Provided by Operating Activities from Continuing Operations $ 1,028 $ 1,042 $ 1,160 $ 1,252 $ 1,383 $ 1,442 Proceeds from Sales (Primarily Revenue Earning Equipment)(1) 235 337 413 452 497 427 Collections of Direct Finance Leases(1) 62 62 72 71 66 71 Other, net(1) 3 — — 8 (1) — Total Cash Generated 1,328 1,442 1,645 1,783 1,944 1,940 Capital Expenditures (1), (2) (1,070) (1,699) (2,133) (2,123) (2,259) (2,668) Free Cash Flow (3) $ 258 $ (257) $ (488) $ (340) $ (315) $ (728) Memo: Depreciation Expense (4) $ 808 $ 863 $ 944 $ 967 $ 1,047 $ 1,122 Net cash provided by (used in) financing activities 78 504 438 347 312 731 Net cash used in investing activities (982) (1,657) (1,635) (1,604) (1,705) (2,161) (1) Included in cash flows from investing activities. (2) Capital expenditures presented net of changes in accounts payable related to purchases of revenue earning equipment. (3) Non-GAAP financial measure. We refer to the net amount of cash generated from operating activities and investing activities (excluding changes in restricted cash and acquisitions) from continuing operations as “free cash flow”. We calculate free cash flow as the sum of net cash provided by operating activities from continuing operations and net cash provided by the sale of revenue earning equipment and operating property and equipment, collections on direct finance leases and other cash inflows from investing activities, less purchases of revenue earning equipment and property. (4) Includes adjustment to reclassify losses from fair value adjustments on our used vehicles to “Used Vehicles Sales, Net”. ©2019 Ryder System ,Inc. 54 All Rights Reserved
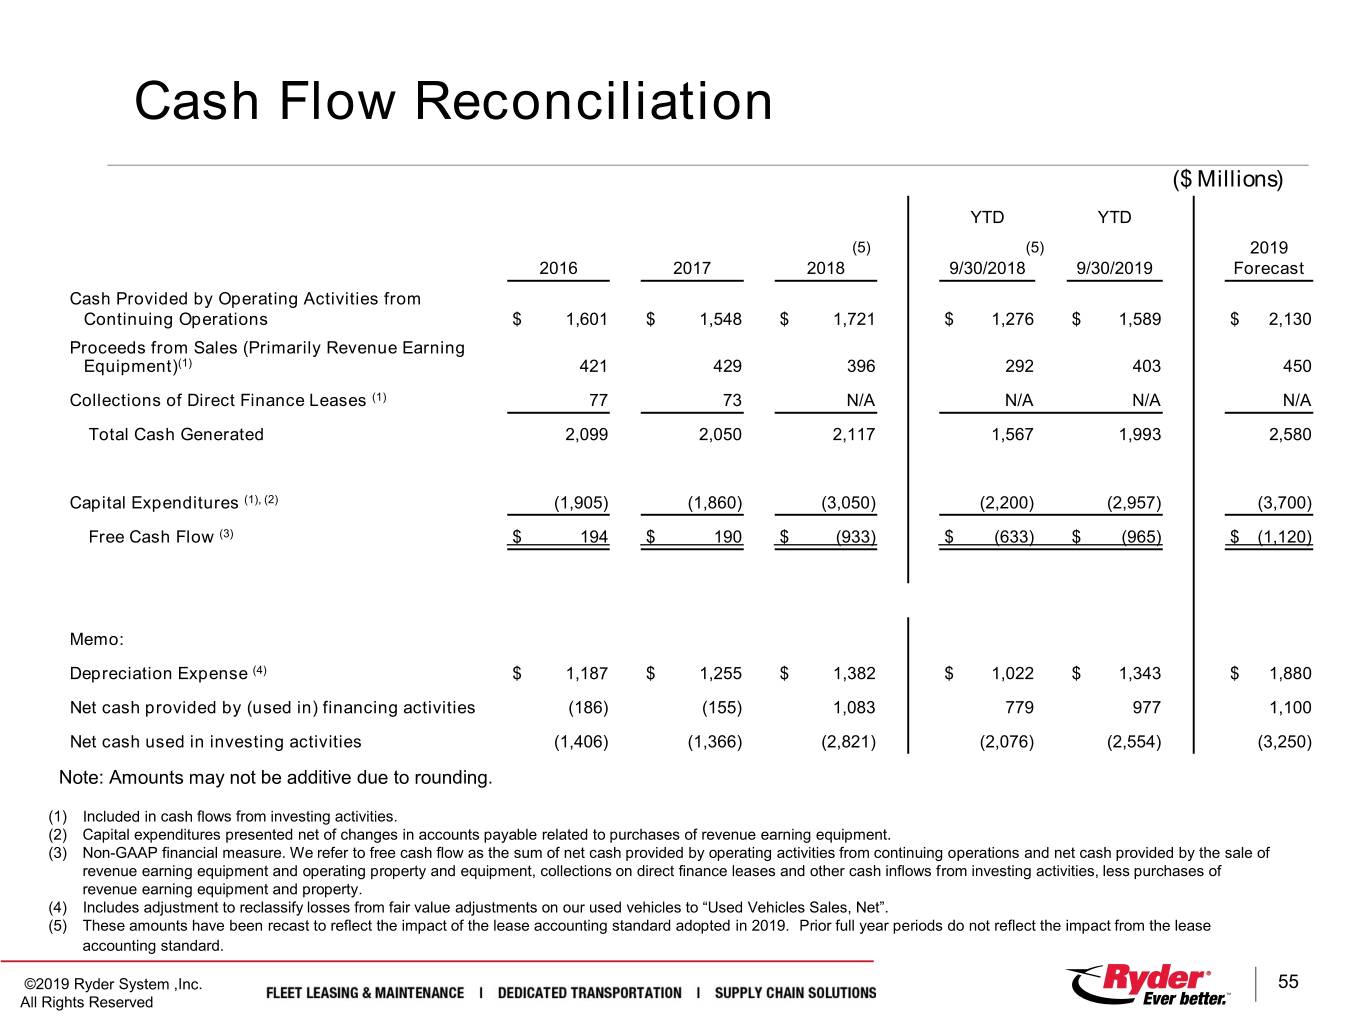
Cash Flow Reconciliation ($ Millions) YTD YTD (5) (5) 2019 2016 2017 2018 9/30/2018 9/30/2019 Forecast Cash Provided by Operating Activities from Continuing Operations $ 1,601 $ 1,548 $ 1,721 $ 1,276 $ 1,589 $ 2,130 Proceeds from Sales (Primarily Revenue Earning Equipment)(1) 421 429 396 292 403 450 Collections of Direct Finance Leases (1) 77 73 N/A N/A N/A N/A Total Cash Generated 2,099 2,050 2,117 1,567 1,993 2,580 Capital Expenditures (1), (2) (1,905) (1,860) (3,050) (2,200) (2,957) (3,700) Free Cash Flow (3) $ 194 $ 190 $ (933) $ (633) $ (965) $ (1,120) Memo: Depreciation Expense (4) $ 1,187 $ 1,255 $ 1,382 $ 1,022 $ 1,343 $ 1,880 Net cash provided by (used in) financing activities (186) (155) 1,083 779 977 1,100 Net cash used in investing activities (1,406) (1,366) (2,821) (2,076) (2,554) (3,250) Note: Amounts may not be additive due to rounding. (1) Included in cash flows from investing activities. (2) Capital expenditures presented net of changes in accounts payable related to purchases of revenue earning equipment. (3) Non-GAAP financial measure. We refer to free cash flow as the sum of net cash provided by operating activities from continuing operations and net cash provided by the sale of revenue earning equipment and operating property and equipment, collections on direct finance leases and other cash inflows from investing activities, less purchases of revenue earning equipment and property. (4) Includes adjustment to reclassify losses from fair value adjustments on our used vehicles to “Used Vehicles Sales, Net”. (5) These amounts have been recast to reflect the impact of the lease accounting standard adopted in 2019. Prior full year periods do not reflect the impact from the lease accounting standard. ©2019 Ryder System ,Inc. 55 All Rights Reserved
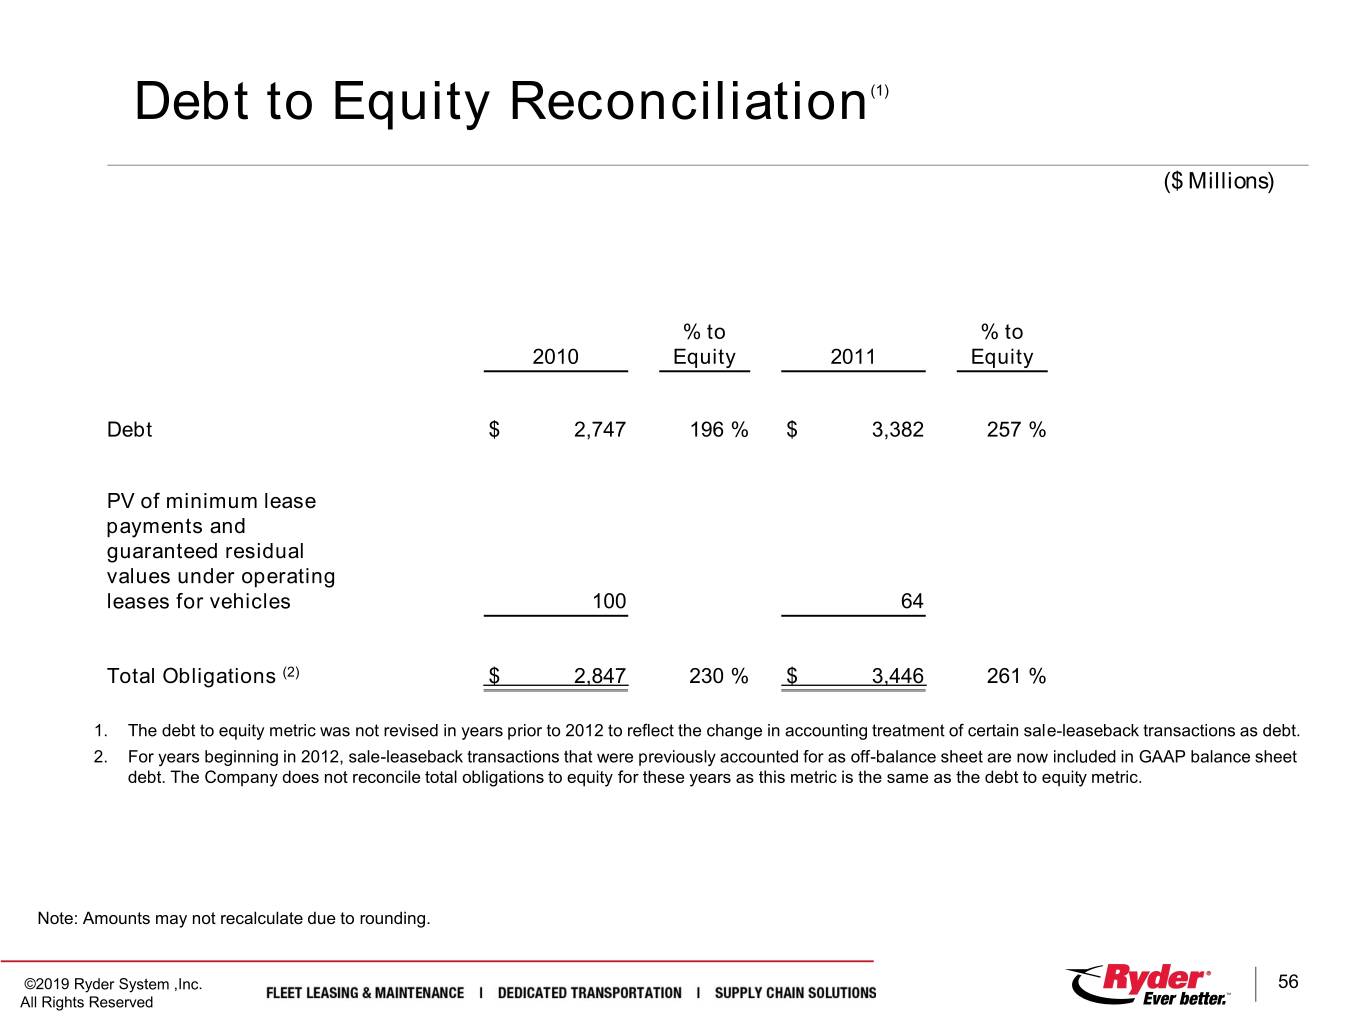
Debt to Equity Reconciliation(1) ($ Millions) % to % to 2010 Equity 2011 Equity Debt $ 2,747 196 % $ 3,382 257 % PV of minimum lease payments and guaranteed residual values under operating leases for vehicles 100 64 Total Obligations (2) $ 2,847 230 % $ 3,446 261 % 1. The debt to equity metric was not revised in years prior to 2012 to reflect the change in accounting treatment of certain sale-leaseback transactions as debt. 2. For years beginning in 2012, sale-leaseback transactions that were previously accounted for as off-balance sheet are now included in GAAP balance sheet debt. The Company does not reconcile total obligations to equity for these years as this metric is the same as the debt to equity metric. Note: Amounts may not recalculate due to rounding. ©2019 Ryder System ,Inc. 56 All Rights Reserved

©2019 Ryder System ,Inc. All Rights Reserved


