Free signup for more
- Track your favorite companies
- Receive email alerts for new filings
- Personalized dashboard of news and more
- Access all data and search results
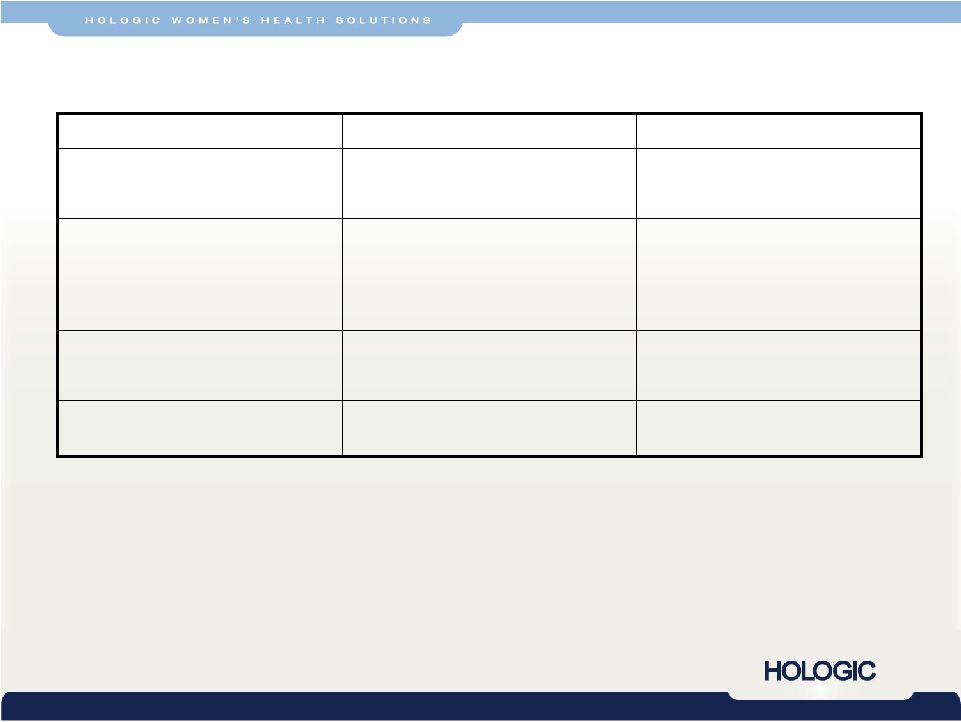
Filing tables
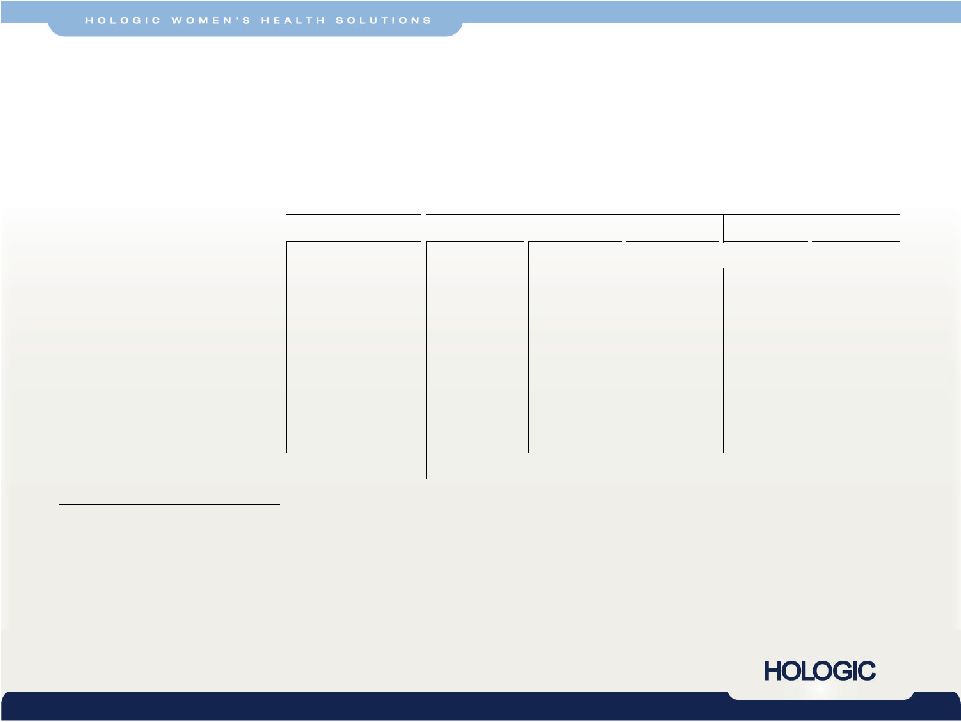
Filing exhibits
- 8-K Current report
- 10.1 Form of Stock Option Award Agreement
- 10.2 Form of Restricted Stock Unit Award Agreement
- 10.3 Hologic, Inc. 2009 Short-term Incentive Plan
- 10.4 Form of Amendment to Amended and Restated Change of Control Agreements
- 10.5 Form of Senior Vice President Change of Control Agreement
- 99.2 Transcript of Conference Call Held November 11, 2008 by Hologic, Inc
- 99.3 Investor Presentation Released November 11, 2008 by Hologic, Inc
Related financial report
HOLX similar filings
- 2 Feb 09 Hologic Announces First Quarter
- 12 Jan 09 Hologic to Provide Business Update at Investor Meeting
- 12 Dec 08 Departure of Directors or Principal Officers
- 17 Nov 08 Results of Operations and Financial Condition
- 12 Nov 08 Hologic Announces Fourth Quarter
- 23 Sep 08 Amendments to Articles of Incorporation or Bylaws
- 31 Jul 08 Hologic Announces Third Quarter
Filing view
External links