 Presentation to Lenders July 23, 2013 Exhibit 99.1 |
 Forward-Looking Statements 2 This presentation contains forward-looking information that involves risks and uncertainties, including statements about the Company’s plans, objectives, expectations and intentions. Such statements include, without limitation: financial or other information included herein based upon or otherwise incorporating judgments or estimates relating to future performance, events or expectations; the Company's positioning, resources, capabilities, and expectations for product sales and/or future growth; the anticipated timing of any governmental or regulatory approvals or clearances. These forward-looking statements are based upon assumptions made by the Company as of the date hereof and are subject to known and unknown risks and uncertainties that could cause actual results to differ materially from those anticipated. Risks and uncertainties that could adversely affect the Company’s business and prospects, and otherwise cause actual results to differ materially from those anticipated, include without limitation: the ability of the Company to successfully manage ongoing organizational changes, including the ability of the Company to attract, motivate and retain key employees; U.S., European and general worldwide economic conditions and related uncertainties; the Company’s reliance on third- party reimbursement policies to support the sales and market acceptance of its products, including the possible adverse impact of government regulation and changes in the availability and amount of reimbursement and uncertainties for new products or product enhancements; uncertainties regarding the recently enacted or future healthcare reform legislation, including associated tax provisions, or budget reduction or other cost containment efforts; changes in guidelines, recommendations and studies published by various organizations that could affect the use of the Company’s products; uncertainties inherent in the development of new products and the enhancement of existing products, including FDA approval and/or clearance and other regulatory risks, technical risks, cost overruns and delays; the risk that products may contain undetected errors or defects or otherwise not perform as anticipated; risks associated with acquisitions, including without limitation, the Company’s ability to successfully integrate acquired businesses, the risks that the acquired businesses may not operate as effectively and efficiently as expected even if otherwise successfully integrated, the risks that acquisitions may involve unexpected costs or unexpected liabilities, including the risks and challenges associated with the Company’s recent acquisition of Gen-Probe and operations in China; the risks of conducting business internationally, including the effect of exchange rate fluctuations on those operations; manufacturing risks, including the Company’s reliance on a single or limited source of supply for key components, and the need to comply with especially high standards for the manufacture of many of its products; the Company’s ability to predict accurately the demand for its products, and products under development, and to develop strategies to address its markets successfully; the early stage of market development for certain of the Company’s products; the Company’s leverage risks, including the Company’s obligation to meet payment obligations and financial covenants associated with its debt; risks related to the use and protection of intellectual property; expenses, uncertainties and potential liabilities relating to litigation, including, without limitation, commercial, intellectual property, employment and product liability litigation; technical innovations that could render products marketed or under development by the Company obsolete; competition; and the Company’s ability to attract and retain qualified personnel. The risks included above are not exhaustive. Other factors that could adversely affect the company's business and prospects are described in the filings made by the Company with the SEC. The Company expressly disclaims any obligation or undertaking to release publicly any updates or revisions to any such statements presented herein to reflect any change in expectations or any change in events, conditions or circumstances on which any such statements are based. Hologic, Affirm, APTIMA, C-View, Cervista, Dimensions, Gen-Probe, Invader, MyoSure, NovaSure, PANTHER, PROCLEIX, Prodesse ProGastro SSCS, ThinPrep, TIGRIS and TMA and associated logos, as may be used throughout this presentation, are trademarks and/or registered trademarks of Hologic, Inc. and/or its subsidiaries in the United States and/or other countries. |
 Third Quarter Fiscal 2013 Preliminary Financial Information The preliminary financial information presented in this presentation represents estimates only, as the Company has not completed its financial statements for its third quarter ended June 29, 2013 and its independent auditor has not completed its review thereof. Actual results, therefore, may differ materially from those estimated. At this preliminary stage, the Company does not have the financial data available to estimate its earnings calculated in accordance with Generally Accepted Accounting Principles (GAAP). GAAP earnings per share (EPS) may be affected by changes in ongoing assumptions and judgments and may also be affected by nonrecurring, unusual or unanticipated charges, expenses or gains, all of which are excluded in the calculation of non-GAAP adjusted EPS as defined in an addendum to this presentation. A GAAP to non-GAAP reconciliation will be provided in Hologic’s third quarter fiscal 2013 operating results announcement on August 5, 2013. 3 |
 Hologic, Inc. ("Hologic" or "the Company") (NASDAQ: HOLX) is a leading developer, manufacturer and supplier of premium diagnostics products, medical imaging systems and surgical products, with an emphasis on serving the healthcare needs of women Hologic has continued to demonstrate strong financial performance Transaction Overview See Third Quarter Fiscal 2013 Preliminary Financial Information on page 3 See the definition of non-GAAP financial measures and the reconciliation of GAAP to non-GAAP in the Appendix. 4 Hologic is seeking to reprice its Term Loan B pricing In conjunction with the repricing, the Company is seeking an amendment to increase its dividend / share repurchase capacity — For the quarter ended June 29, 2013, the Company expects to report revenues of approximately $626 million and non-GAAP adjusted earnings per share of $0.38 — For the quarter ended March 30, 2013, the Company generated $619.1 million of non-GAAP revenue, $93.8 million of non-GAAP net income and $211.8 million of EBITDA. The Company's GAAP revenue and GAAP net loss for the same period were $612.7 million and $51.1 million, respectively — As of March 30, 2013, Hologic had total secured leverage of 2.5x and net total leverage of 4.9x 1 2 1 2 |
 Pro Forma Capitalization 5 Amounts as of March 30, 2013 ($ in millions) Current Pro Forma Amount Amount Leverage Maturity Put Date Cash $ 745 $ 545 Revolver ($300mm) - - 0.0 x Aug-17 Term Loan A 969 969 1.0 x Aug-17 Extant Term Loan B 1,479 - 1.0 x Aug-19 New Term Loan B - 1,279 2.3 x Aug-19 Total Secured Debt $ 2,447 $ 2,247 2.3 x Senior Unsecured Notes 1,000 1,000 3.3 x Total Guaranteed Debt $ 3,447 $ 3,247 3.3 x 2.00% Convertible Sr. Notes 1 389 389 3.7 x Dec-37 Dec-13 2.00% Exchange Convertible Sr. Notes 2 384 384 4.1 x Dec-37 Dec-16 2.00% Exchange Convertible Sr. Notes 3 462 462 4.6 x Mar-42 Mar-18 2.00% Exchange Convertible Sr. Notes 4 323 323 4.9 x Sep-43 Dec-17 Total Debt $ 5,005 $ 4,805 4.9 x Net Debt (5) $ 4,755 $ 4,555 4.7 x LTM 03/30/2013 Consolidated Adjusted EBITDA (6) $ 975.5 Source: Public filings. ¹ Principal amount is $405 million. Principal amount listed net of the unamortized discount. Conversion price of approximately $38.59 per share. ² Principal amount is $450 million. Principal amount listed net of the unamortized discount. Conversion price of approximately $23.03 per share. ³ Principal amount is $500 million. Principal amount listed net of the unamortized discount. Conversion price of approximately $31.18 per share. 4 Principal amount is $370 million. Principal amount listed net of the unamortized discount. Conversion price of approximately $38.59 per share. 5 Debt net of $250 million of cash as permitted by Credit Agreement for covenant compliance. 6 As defined in the Credit Agreement. Includes an increase to the Company’s non-GAAP Adjusted EBITDA of $160.4 million, as calculated pursuant to the terms of the Credit Agreement, to reflect the Company's acquisition of Gen-Probe and certain other adjustments. |
 Consolidated Non-GAAP Q2’13 Revenues of $619.1M (unaudited)* Consumables/Service ~81% Capital Equipment ~19% Total Revenues by Business Segment *Q2’13 GAAP revenues were as follows: Total: $612.7M; Diagnostics: $296.5M; Consumables: $402.0M. See the definition of non-GAAP financial measures and the reconciliation of GAAP to non-GAAP in the Appendix. Total Diagnostics $302.9M* 49% Breast Health $220.1M 35% GYN Surgical $73.7M 12% Skeletal Health $22.4M 4% 6 66% Consumables 15% Service 19% Capital Equipment |
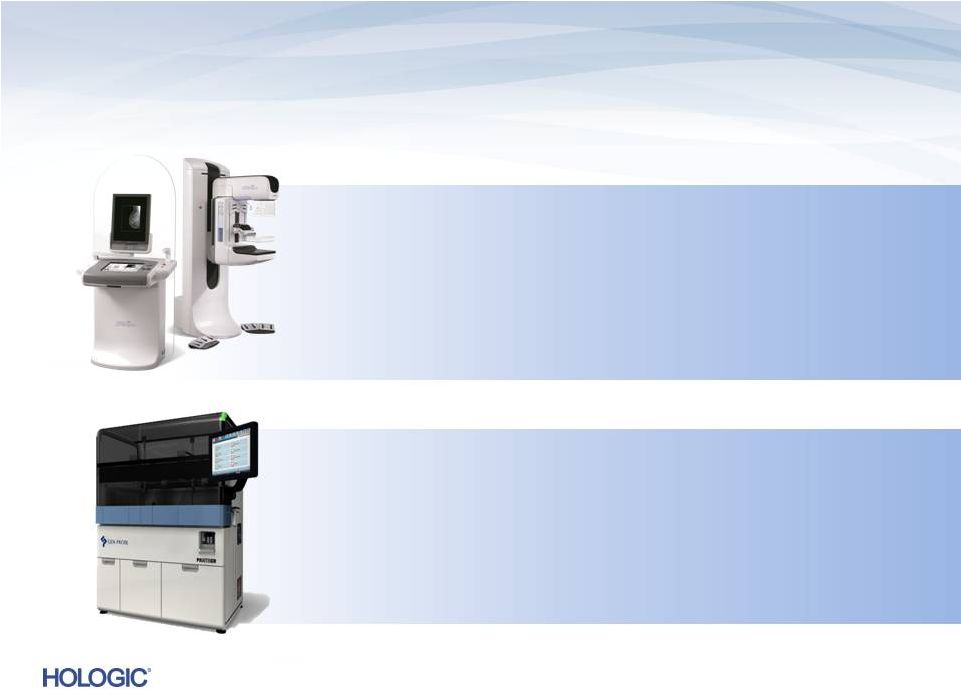 • Early stage of a promising replacement cycle with technology superior to 2D digital • Recent peer-reviewed publications further support adoption • Ability to offer class-leading automation to low- and medium-volume labs • Extends molecular diagnostics into hospital labs, the fastest-growing market segment • Menu expansion on the horizon to further sustain growth Two Exciting New Product Cycles are Just Beginning Dimensions 3D Breast Tomosynthesis PANTHER System 7 |
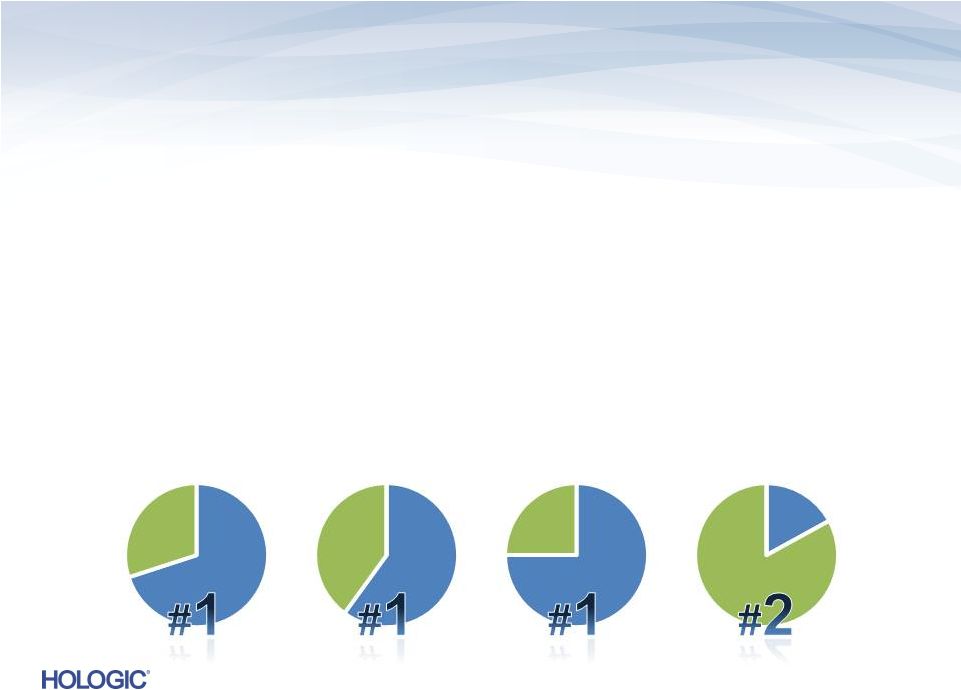 Diagnostics – Leadership in Cytology and Molecular Diagnostics • Premier automated solutions • Proprietary chemistries: TMA (Transcription-mediated amplification) and Invader • Extending leadership from cytology into molecular via Gen-Probe acquisition • Validated by #1 or #2 U.S. market share in key segments* SHARE * Hologic Estimates 2012 Cervical Cytology CT/NG Testing Blood Screening HPV Testing 8 |
 Comprehensive Cervical Cancer Screening Solution 9 • The only FDA approved complete cervical cancer screening solution to include liquid-based cytology + HPV (high-risk and genotyping) • All from our ThinPrep vial, the gold standard in cervical cytology • Thoughtfully designed HPV products designed to detect disease by focusing on genes that matter most: • Both APTIMA and Cervista meet the specific needs of our customers through greater testing alternatives |
 • APTIMA Combo 2 assay remains a growth driver • < 40% of sexually active women aged 25 and under in the U.S. are screened for chlamydia and gonorrhea • Improved compliance and international expansion opportunities • APTIMA Trichomonas experiencing rapid adoption • Trichomonas vaginalis is the most common curable STD • First FDA-cleared nucleic acid amplified test • Recently cleared for use on PANTHER System • Menu expansion on the PANTHER is key • HPV and genotyping expected by calendar year-end 2013 10 All APTIMA assays able to test from ThinPrep vial Flagship Brand in STD Testing |
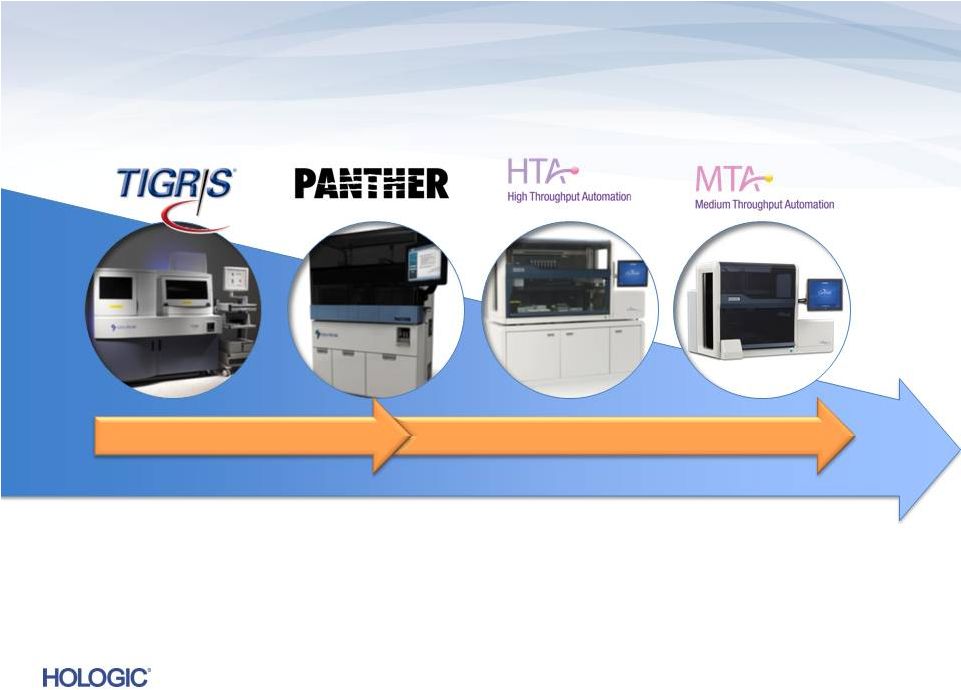 Broad Portfolio of MDx Instrumentation Uniquely Positioned in Molecular Diagnostics • Already leading in high-volume setting • Ability to capitalize on lab decentralization trend with introduction of PANTHER • Proprietary chemistries, TMA and INVADER, offer further differentiation and flexibility 11 V o l u m e Reference Labs Reference Labs Hospital Labs Hospital Labs |
 Integrated Sales Organization with a Clear Strategy Combined Sales Call Point Drive Test Utilization Drive Compliance Communicate Guidelines Portfolio of Products Combined Company Menu HPV - APTIMA - Cervista - Genotyping CT/NG Trichomonas ThinPrep & Imaging fFn 12 Molecular Lab Cytology Lab Physician |
 Our Lab Partners 13 The value of a Hologic partnership to our Lab Partners: • • • Grow revenue Increase operational effectiveness Provide patients and clinicians with leading women's health diagnostic solutions |
 Breast Health – Mammography Leader in Breast Cancer Screening & Diagnosis • Market leadership: ~65% of current U.S. installed base, ~40% OUS • Approximate $4 billion addressable U.S. market • Strong competitive advantages of 3D Dimensions Clinical superiority to 2D First-to-market with no U.S. competition • Substantial replacement cycle expected Robust Service Offering • Recurring revenue stream driven by system placements 14 |
 15 Advancing Breast Cancer Screening |
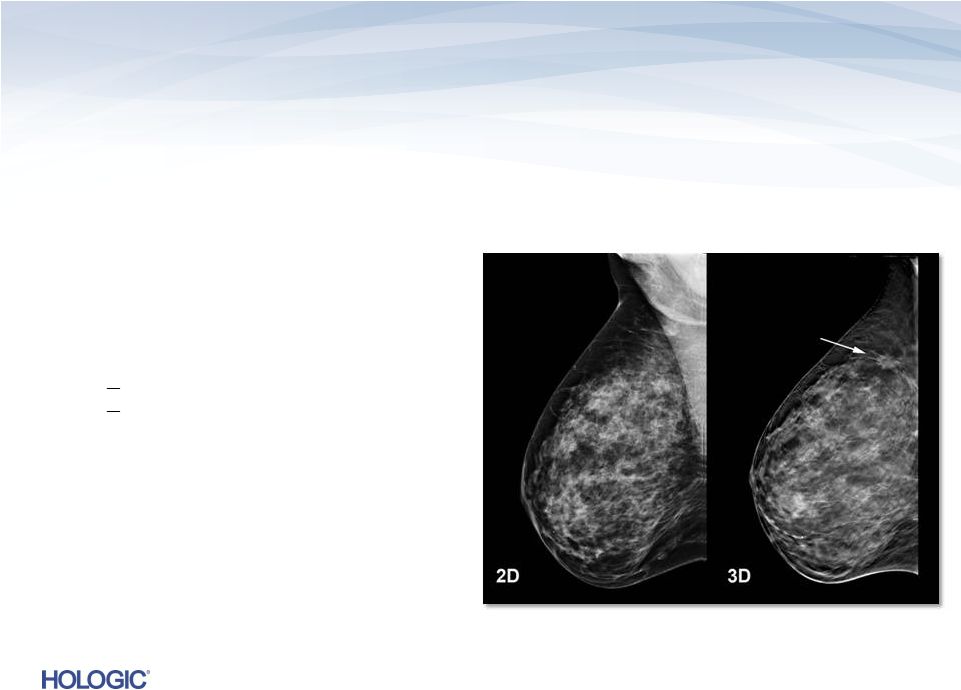
 3D Dimensions Tomosynthesis Tomosynthesis…uptake ahead of expectations • U.S. installed base of ~11,000 digital systems – potential for conversion to Tomo • Met initial 2-year unit installation goal in U.S. and the goal is to more than double installed base during FY’13 Superior Next-Generation Digital Mammography Superiority over 2D Digital Mammography Improved Tissue Visualization and Detection Lower Recall Rates 16 |
 Tomosynthesis Clinical Efficacy 17 Oslo Tomosynthesis Screening Trial reported breast cancer screening with Hologic Tomosynthesis significantly improves cancer detection 1. Skaane P. et. al. Comparison of Digital Mammography Alone and Digital Mammography Plus Tomosynthesis in a Population-based Screening Program. Radiology. 2013 Jan 7 [Epub ahead of print]. 2. Philpotts L. et al. Initial Experience With Digital Breast Tomosynthesis in Screening Mammography. Presented at the ARRS 2012, Scientific Session 22 - Breast Imaging: Screening/Emerging Technologies. 3. Destounis S. et al. Experience with Combination 2D/3D Breast Tomosynthesis vs FFDM in the Screening Environment. Radiological Society of North America annual meeting. Chicago, Il, 2012. • All age groups and breast densities reported to benefit from the addition of Hologic Tomosynthesis screening • Body of clinical evidence continuing to grow in invasive cancer detection 40% overall in cancer detection 27% Compared to 2D, U.S. sites report a significant reduction in recalls with Hologic Tomosynthesis 20-40% reduction in recall rates (based on site practices) 2-3 1 1 |
 Tomosynthesis + C-View 2D: A superior mammography exam 1 • Less patient dose through reduced x-ray exposures • Greater patient comfort via fast, 4 second scan time • Heightened detail from tomosynthesis images • Superior performance compared to traditional 2D alone 1. Compared to 2D alone. FDA PMA submission P080003/S001. 18 |
 MyoSure a Growth Driver in GYN Surgical 19 MyoSure Hysteroscopic Tissue Removal System Complemented by a portfolio of surgical instruments addressing unmet needs in women’s health on a global basis • Including NovaSure, the market leader in treating abnormal uterine bleeding with ~60% share in the U.S. • Minimally-invasive technology to remove fibroids and polyps • Dynamic technology in early stages of adoption • Potential $300-400 million annual opportunity in the U.S. • Product line extensions offer flexibility to spur further adoption |
 Q2 FY 2013 Overview Key Performance Metrics Key Performance Metrics Q2 FY 2013 Q2 FY 2013 Revenues* GAAP revenues of $612.7 million and non-GAAP revenues of $619.1 million • Non-GAAP revenues up $147.9 million, or 31.4%, vs. Q2’12 1 • Non-GAAP revenues down $25.5 million, or 4.0%, vs. Q1’13 Net Income* GAAP net loss of $51.1 million and non-GAAP net income of $93.8 million • Non-GAAP net income up $7.0 million, or 8.1%, vs. Q2’12 • Non-GAAP net income down $7.9 million, or 7.8%, vs. Q1’13 Adjusted EBITDA* $211.8 million • Up $54.4 million, or 34.5%, vs. Q2’12 • Down $15.7 million, or 6.9%, vs. Q1’13 On a constant currency basis, total revenues would have increased to $613.0M*, or 30.1% (non-GAAP revenues would have increased to $619.5M*, or 31.5%), compared to Q2’12. The constant currency revenue amount for Q2’13 is a non-GAAP number that reflects what revenues in that quarter would have been had the Company applied the foreign currency exchange rates it used for determining its revenues in Q2’12. 20 Quarter Ended March 30, 2013 (unaudited) Quarter Ended March 30, 2013 (unaudited) 1 * See the definition of the non-GAAP financial measures and the reconciliation of those measures to the comparable GAAP financial measures in the Appendix. |
 Q2 FY 2013 Summary • Sale of LIFECODES business unit for approximately $85 million in cash, adjusted for working capital items, with the opportunity to earn a contingent payment of $10 million • Successful transaction retiring $370 million, 2.00% Convertible Senior Notes due 2037 in exchange for issuance of $370 million, 2.00% Convertible Senior Notes due 2043 which, among other things, extended the first put date by four years to December 2017 • Successful repricing of the Term Loan A and Revolver under the Credit Agreement resulting in a 100 basis point reduction in the interest rates on each of these loans 21 Financing Activities Financing Activities |
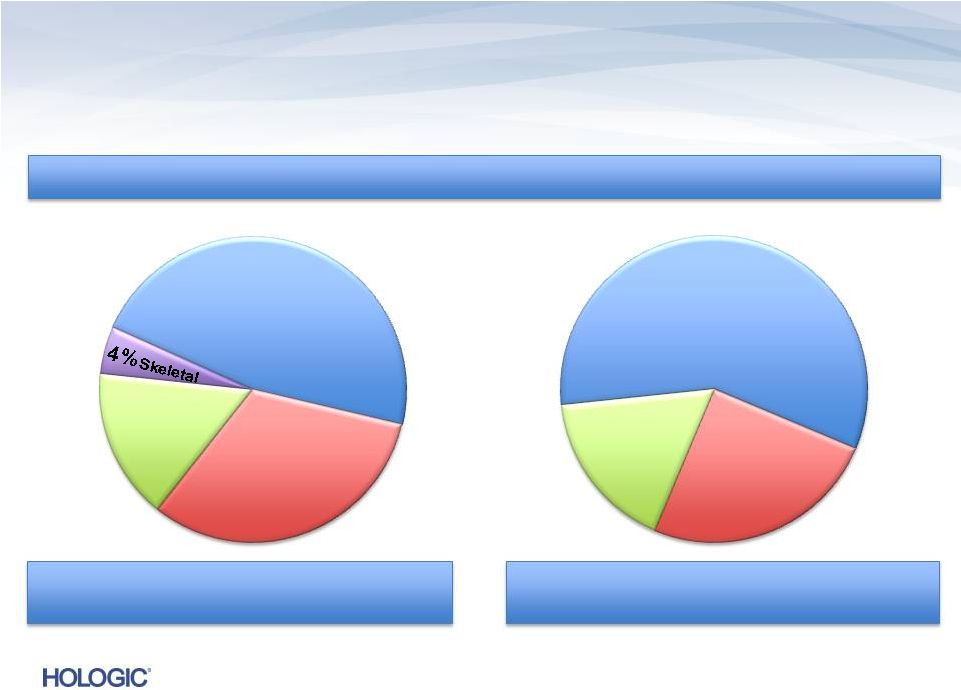 Breakdown of consolidated Non-GAAP Q2’13 Revenues of $619.1M (unaudited)* Breakdown of consolidated Non-GAAP Q2’13 Revenues of $619.1M (unaudited)* U.S. Revenues ~ 75% U.S. Revenues ~ 75% International Revenues ~ 25% International Revenues ~ 25% 19% Capital Equipment 66% Consumables 12% GYN Surgical 49% Diagnostics 35% Breast Health 15% Service Business Segments Disposables/Service ~ 81% Disposables/Service ~ 81% Capital Equipment ~ 19% Capital Equipment ~ 19% 22 * Q2’13 GAAP revenues were as follows: Total: $612.7M; Diagnostics: $296.5M; Consumables: $402.0 See the definition of non-GAAP financial measures and the reconciliation of GAAP to non-GAAP in the Appendix. |
 Q2 FY 2013 Diagnostics Summary • Continued #1 U.S. market share for ThinPrep • Continued #1 U.S. market share for APTIMA Combo 2 for CT/GC • Continued #1 U.S. market share for PROCLEIX in blood screening • Continued competitive wins for ThinPrep, HPV and CT/GC • PANTHER launch progressing smoothly with positive early traction • Sale of the Company’s LIFECODES business to Immucor, Inc. for approximately $85 million in cash, with the opportunity to earn a contingent payment of $10 million • FDA clearance of APTIMA Trichomonas vaginalis Assay for use on our fully-automated PANTHER System • FDA clearance of Prodesse ProGastro SSCS assay for gastroenteritis • Canadian regulatory approval of APTIMA HPV and APTIMA HPV 16 18/45 genotype assays and Netherland regulatory approval for HPV for cervical cancer screening 23 Diagnostics Diagnostics |
 • Continued #1 U.S. market share for digital mammography placements in the U.S. • Successfully met two-year unit tomosynthesis goal by end of Q2’13 and the goal is to more than double year-over-year placements in Fiscal 2013 • Record biopsy sales both in the U.S. and internationally with overall double-digit year- over-year sales growth • Double-digit year-over-year service revenue growth • FDA clearance of Hologic’s 3D tomosynthesis Affirm breast biopsy guidance system • FDA clearance of Hologic’s contrast-enhanced digital mammography • Oslo study published in print edition of Radiology, reporting the addition of the Company’s 3D mammography screening technology to a 2D breast screening exam significantly increased cancer detection while reducing the number of false positives • New study published online by European Radiology, supporting the use of Hologic’s 3D mammography screening technology in combination with 2D using independent double reading with arbitration • Acceptance in American Journal of Roentgenology and a second in Radiology of papers, both presented at RSNA in 2012, reporting the results of U.S. studies using Hologic’s 3D mammography with positive results 24 Q2 FY 2013 Breast Health Summary Breast Health Breast Health |
 • #1 share for MyoSure in the U.S. hysteroscopic morcellation market • Continued #1 market share for NovaSure in the GEA (Global Endometrial Ablation) market • Strong quarter for MyoSure with double-digit sequential and year-over-year growth • Growing demand for new MyoSure XL and MyoSure Lite products • SFDA approval of MyoSure in China 25 Q2 FY 2013 GYN Surgical Summary GYN Surgical GYN Surgical |
 Amendment Overview Hologic is seeking to reprice its Term Loan B The amendment would also expand the Company’s general basket for Restricted Junior Payments to $250mm and increase the total net leverage threshold for accessing the excess cash flow builder component from 3.5x to 4.0x In addition, the Company will be making a $200mm permanent pay-down of the Term Loan B in connection with the repricing 26 — The Term Loan B will be reduced from $1,478.8mm to $1,278.8mm |
 |
 Reconciliation of GAAP to Non-GAAP (unaudited) In thousands, except earnings per share In thousands, except earnings per share In thousands, except earnings per share Continued on next page 28 Three Months Ended Three Months Ended March 30, 2013 March 30, 2013 March 24, 2012 March 24, 2012 December 29, 2012 December 29, 2012 REVENUES GAAP revenues $612,663 - $631,362 Net adjustments primarily related to Novartis collaboration 6,429 - 13,275 Non-GAAP revenues $619,092 $619,092 $- $644,637 $644,637 EARNINGS PER SHARE GAAP (loss) earnings per share- Diluted $(0.19) $(0.15) $0.01 Adjustments to net (loss) income (as detailed below) 0.54 0.48 0.37 Non-GAAP earnings per share- Diluted $0.35 $0.35 $0.33 $0.38 $0.38 GROSS MARGINS GAAP gross margins $279,326 $226,110 $281,673 Adjustments: Net adjustments to revenues 6,429 - 13,275 Amortization of intangible assets 75,733 44,341 75,287 Fair value write-up of acquired inventory sold 22,521 - 29,876 Fair value adjustment to depreciation expense 1,791 - 1,797 Adiana closure charges - 17,945 - Acquisition and integration-related costs 1,466 50 1,141 Non-GAAP gross margins $387,266 $387,266 $288,446 $403,049 $403,049 GROSS MARGIN PERCENTAGE GAAP gross margin percentage 45.6% 48.0% 44.6% Impact of adjustments above 17.0 13.2 17.9 Non-GAAP gross margin percentage 62.6% 62.6% 61.2% 62.5% 62.5% $- |
 Reconciliation of GAAP to Non-GAAP (unaudited) 29 OPERATING EXPENSES GAAP operating expenses $273,784 $215,976 $218,444 Adjustments: Amortization of intangible assets (28,667) (16,629) (28,526) Contingent consideration (30,187) (61,309) (39,526) Acquisition and integration-related costs (5,965) (599) (4,380) Restructuring and divestiture charges (12,462) (783) (3,933) Gain on sale of intellectual property, net - 12,424 53,884 Fair value adjustment to depreciation expense (1,398) - (892) Other (charges) gains (122) (440) 3,200 Non-GAAP operating expenses INTEREST EXPENSE GAAP interest expense $76,049 $28,512 $72,081 Adjustment for certain non-cash interest expense relating to convertible notes (13,621) (17,946) (15,644) Debt transaction and other costs (6,414) (171) - Non -GAAP interest expense PRE-TAX INCOME GAAP pre-tax loss $(73,748) $(58,608) $(7,353) Adjustments to pre-tax loss as detailed above 206,776 147,789 157,193 Debt extinguishment loss 3,247 42,347 - Other gains (losses) 1,733 - (167) Non -GAAP pre-tax income NET INCOME GAAP net (loss) income $(51,104) $(40,273) $3,118 Adjustments to pre-tax (loss) income as detailed above 211,756 190,136 157,026 Income tax effect of reconciling items (66,807) (63,055) (58,366) Non- GAAP adjusted net income EBITDA Non -GAAP net income $93,845 $86,808 $101,778 Interest expense, net, not adjusted above 55,807 9,805 56,177 Provision for income taxes 44,163 44,720 47,895 Depreciation expense, not adjusted above 17,963 16,071 21,653 EBITDA $198,271 $148,640 $194,983 $56,014 $10,395 $56,437 $138,008 $131,528 $149,673 $93,845 $86,808 $101,778 $211,778 $157,404 $227,503 In thousands, except earnings per share In thousands, except earnings per share March 24, 2012 Three Months Ended March 30, 2013 December 29, 2012 |
 Use of Non-GAAP Financial Measures Hologic has presented the following non-GAAP financial measures in this presentation: revenues; gross margins; operating expenses; operating income; interest expense; pre-tax income; net income; EPS; and EBITDA. Hologic defines its non-GAAP revenues to primarily include contingent revenue earned under the Novartis collaboration post-acquisition which was eliminated under purchase accounting. Hologic defines EBITDA as its non-GAAP net income plus net interest expense, net, income taxes, and depreciation and amortization expense included in its non-GAAP net income. Hologic defines its non-GAAP gross margins, operating expenses, operating income, interest expense, pre-tax income and EPS to exclude, as applicable: (i) the amortization of intangible assets; (ii) acquisition-related charges and effects, such as charges for contingent consideration (comprised of (a) adjustments for changes in the fair value of the contingent consideration liabilities initially recorded as part of the purchase price of an acquisition as required by GAAP, and (b) contingent consideration that is tied to continuing employment of the former shareholders and employees which is recorded as compensation expense), transaction costs, integration costs including retention, and credits and/or charges associated with the write-up of acquired inventory and fixed assets to fair value, and the effect of a reduction in revenue related to contingent revenue under the Novartis collaboration, described above; (iii) non-cash interest expense related to amortization of the debt discount for convertible debt securities; (iv) restructuring and divestiture charges; (v) non-cash extinguishment losses and debt transaction costs; (vi) litigation settlement charges (benefits); (vii) other-than-temporary impairment losses on investments; and (viii) other one-time, nonrecurring, unusual or infrequent charges, expenses or gains that may not be indicative of Hologic’s core business results; and to include income taxes related to such adjustments. Hologic believes the use of non-GAAP net revenues is useful to investors as it eliminates certain effects of purchase accounting on its recognition of revenue. Hologic believes the use of non-GAAP net income is useful to investors by eliminating certain of the more significant effects of its acquisitions and related activities, non-cash charges resulting from the application of GAAP to convertible debt instruments with cash settlement features, charges related to debt extinguishment losses, investment impairments, litigation settlements, and restructuring and divestiture initiatives. These non-GAAP measures also reflect how Hologic manages its businesses internally. In addition to the adjustments set forth in the calculation of Hologic’s non-GAAP net income and non-GAAP EPS, its non-GAAP EBITDA eliminates the effects of financing, income taxes and the accounting effects of capital spending. As with the items eliminated in its calculation of non-GAAP net income, these items may vary for different companies for reasons unrelated to the overall operating performance of a company’s business. When analyzing Hologic’s operating performance, investors should not consider these non-GAAP financial measures as a substitute for net income prepared in accordance with GAAP. 30 |