UNITED STATES
SECURITIES AND EXCHANGE COMMISSION
Washington, D.C. 20549
FORM 10Q
(Mark One)
x QUARTERLY REPORT PURSUANT TO SECTION 13 OR 15(d) OF THE SECURITIES EXCHANGE ACT OF 1934
For the quarterly period ended March 31, 2002
OR
¨ TRANSITION REPORT PURSUANT TO SECTION 13 OR 15(d) OF THE SECURITIES EXCHANGE ACT OF 1934
For the transition period from __________ to ___________
Commission file number 0-18312
VARCO INTERNATIONAL, INC.
(Exact name of registrant as specified in its charter)
Delaware | | 76-0252850 |
(State or other jurisdiction of | | (I.R.S. Employer |
incorporation or organization) | | Identification No.) |
2000 W. Sam Houston Parkway South, Suite 1700 Houston, Texas | | 77042 |
(Address of principal executive offices) | | (Zip Code) |
(281) 953-2200
(Registrant’s telephone number, including area code)
None
(Former name, former address and former fiscal year, if changed since last report)
Indicate by check mark whether the registrant (1) has filed all reports required to be filed by Section 13 or 15(d) of the Securities Exchange Act of 1934 during the preceding 12 months (or for such shorter period that the registrant was required to file such reports), and (2) has been subject to such filing requirements for the past 90 days.
YES x NO ¨
The Registrant had 96,492,436 shares of common stock outstanding as of April 26, 2002.
VARCO INTERNATIONAL, INC.
INDEX
| | | | | Page No.
|
| | | Part I—FINANCIAL INFORMATION | | |
| Item 1. | | | | |
|
| | | | | 2 |
|
| | | | | 3 |
|
| | | | | 4 |
|
| | | | | 5-10 |
|
| Item 2. | | | | 11-14 |
|
| Item 3 | | | | 14 |
|
| | | Part II—OTHER INFORMATION | | |
|
| | 15 |
|
| | 16-19 |
PART I—FINANCIAL INFORMATION
Item 1. Financial Statements 1
VARCO INTERNATIONAL, INC.
CONSOLIDATED BALANCE SHEETS
| | | March 31, 2002
| | | December 31, 2001
| |
| | | (Unaudited) | | | | |
| | | (in thousands) | |
ASSETS
| | | |
| Current assets: | | | | | | | | |
| Cash and cash equivalents | | $ | 54,707 | | | $ | 57,499 | |
| Accounts receivable, net | | | 324,195 | | | | 342,036 | |
| Inventory, net | | | 255,794 | | | | 229,678 | |
| Deferred tax assets | | | 6,539 | | | | 6,618 | |
| Prepaid expenses and other | | | 28,331 | | | | 27,374 | |
| | |
|
|
| |
|
|
|
| Total current assets | | | 669,566 | | | | 663,205 | |
| | |
|
|
| |
|
|
|
| Net property and equipment | | | 399,861 | | | | 400,416 | |
| Identified intangibles, net | | | 30,324 | | | | 30,722 | |
| Goodwill, net | | | 330,383 | | | | 325,135 | |
| Other assets, net | | | 11,904 | | | | 9,632 | |
| | |
|
|
| |
|
|
|
| Total assets | | $ | 1,442,038 | | | $ | 1,429,110 | |
| | |
|
|
| |
|
|
|
|
LIABILITIES AND EQUITY
| | | | | | | | |
| Current liabilities: | | | | | | | | |
| Accounts payable | | $ | 106,091 | | | $ | 102,559 | |
| Accrued liabilities | | | 99,678 | | | | 102,315 | |
| Income taxes payable | | | 23,819 | | | | 27,652 | |
| Current portion of long-term debt and short-term borrowings | | | 6,226 | | | | 7,077 | |
| | |
|
|
| |
|
|
|
| Total current liabilities | | | 235,814 | | | | 239,603 | |
| Long-term debt | | | 314,005 | | | | 315,537 | |
| Pension liabilities and post-retirement obligations | | | 24,573 | | | | 25,834 | |
| Deferred taxes payable | | | 17,974 | | | | 18,604 | |
| Other liabilities | | | 1,315 | | | | 1,218 | |
| | |
|
|
| |
|
|
|
| Total liabilities | | | 593,681 | | | | 600,796 | |
| | |
|
|
| |
|
|
|
| Common stockholders’ equity: | | | | | | | | |
| Common stock, $.01 par value, 200,000,000 shares authorized, 97,668,921 shares issued and 96,244,221 shares outstanding (97,402,339 shares issued and 95,977,639 shares outstanding at December 31, 2001) | | | 977 | | | | 974 | |
| Paid in capital | | | 516,863 | | | | 514,137 | |
| Retained earnings | | | 366,710 | | | | 347,548 | |
| Accumulated other comprehensive loss | | | (20,863 | ) | | | (19,015 | ) |
| Less: treasury stock at cost (1,424,700 shares) | | | (15,330 | ) | | | (15,330 | ) |
| | |
|
|
| |
|
|
|
| Total common stockholders’ equity | | | 848,357 | | | | 828,314 | |
| | |
|
|
| |
|
|
|
| Total liabilities and equity | | $ | 1,442,038 | | | $ | 1,429,110 | |
| | |
|
|
| |
|
|
|
2
VARCO INTERNATIONAL, INC. UNAUDITED CONSOLIDATED STATEMENTS OF INCOME
| | | Three Months Ended March 31, | |
| | | 2002
| | | 2001
| |
| | | (in thousands, except share and per share data) | |
|
| Revenue | | $ | 315,783 | | | $ | 274,213 | |
| Costs and expenses: | | | | | | | | |
| Cost of services and products sold | | | 223,428 | | | | 193,230 | |
| Goodwill amortization | | | — | | | | 2,460 | |
| Selling, general and administrative | | | 37,965 | | | | 31,987 | |
| Research and engineering costs | | | 12,781 | | | | 9,892 | |
| Merger, transaction and litigation costs | | | 2,829 | | | | — | |
| | |
|
|
| |
|
|
|
| Total costs and expenses | | | 277,003 | | | | 237,569 | |
| | |
|
|
| |
|
|
|
| Operating profit | | | 38,780 | | | | 36,644 | |
| Other expense (income): | | | | | | | | |
| Interest expense | | | 6,068 | | | | 3,789 | |
| Interest income | | | (151 | ) | | | (28 | ) |
| Other, net | | | 2,447 | | | | 1,004 | |
| | |
|
|
| |
|
|
|
| Income before income taxes | | | 30,416 | | | | 31,879 | |
| Provision for income taxes | | | 11,254 | | | | 12,752 | |
| | |
|
|
| |
|
|
|
| Net income | | $ | 19,162 | | | $ | 19,127 | |
| | |
|
|
| |
|
|
|
| Earnings per common share: | | | | | | | | |
| Basic earnings per common share | | $ | 0.20 | | | $ | 0.20 | |
| | |
|
|
| |
|
|
|
| Dilutive earnings per common share | | $ | 0.20 | | | $ | 0.20 | |
| | |
|
|
| |
|
|
|
| Weighted average number of common shares outstanding: | | | | | | | | |
| Basic | | | 96,137,535 | | | | 95,338,404 | |
| | |
|
|
| |
|
|
|
| Dilutive | | | 96,841,252 | | | | 96,613,309 | |
| | |
|
|
| |
|
|
|
See notes to unaudited consolidated financial statements.
3
VARCO INTERNATIONAL, INC. UNAUDITED CONSOLIDATED STATEMENTS OF CASH FLOWS
| | | Three Months Ended March 31, | |
| | | 2002
| | | 2001
| |
| | | (in thousands) | |
| Cash flows from operating activities: | | | | | | | | |
| Net income | | $ | 19,162 | | | $ | 19,127 | |
| Adjustments to reconcile net income to net cash provided by operating activities: | | | | | | | | |
| Depreciation and amortization | | | 14,712 | | | | 15,407 | |
| Other non-cash charges, net | | | 6,427 | | | | 3,603 | |
| Changes in assets and liabilities, net of effects from acquisitions: | | | | | | | | |
| Accounts receivable | | | 17,598 | | | | (1,859 | ) |
| Inventory | | | (29,283 | ) | | | (17,175 | ) |
| Other current assets | | | (929 | ) | | | (3,700 | ) |
| Accounts payable and accrued liabilities | | | (2,549 | ) | | | 5,163 | |
| Income taxes payable | | | (3,140 | ) | | | 10,274 | |
| | |
|
|
| |
|
|
|
| Net cash provided by operating activities | | | 21,998 | | | | 30,840 | |
| | |
|
|
| |
|
|
|
| Cash flows used for investing activities: | | | | | | | | |
| Capital expenditures | | | (13,705 | ) | | | (13,208 | ) |
| Business acquisitions, net of cash acquired | | | (6,814 | ) | | | (81,595 | ) |
| Other | | | (2,058 | ) | | | (1,637 | ) |
| | |
|
|
| |
|
|
|
| Net cash used for investing activities | | | (22,577 | ) | | | (96,440 | ) |
| | |
|
|
| |
|
|
|
| Cash flows provided by (used for) financing activities: | | | | | | | | |
| Borrowings under financing agreements | | | — | | | | 89,072 | |
| Principal payments under financing agreements | | | (4,083 | ) | | | (23,337 | ) |
| Proceeds from sale of common stock, net | | | 1,870 | | | | 7,259 | |
| | |
|
|
| |
|
|
|
| Net cash provided by (used for) financing activities | | | (2,213 | ) | | | 72,994 | |
| | |
|
|
| |
|
|
|
| Net increase (decrease) in cash and cash equivalents | | | (2,792 | ) | | | 7,394 | |
| Cash and cash equivalents: | | | | | | | | |
| Beginning of period | | | 57,499 | | | | 12,176 | |
| | |
|
|
| |
|
|
|
| End of period | | $ | 54,707 | | | $ | 19,570 | |
| | |
|
|
| |
|
|
|
| Supplemental disclosure of cash flow information: | | | | | | | | |
| Cash paid during the three month period for: | | | | | | | | |
| Interest | | $ | 4,186 | | | $ | 4,514 | |
| | |
|
|
| |
|
|
|
| Taxes | | $ | 14,621 | | | $ | 6,292 | |
| | |
|
|
| |
|
|
|
See notes to unaudited consolidated financial statements.
4
VARCO INTERNATIONAL, INC. Notes to Unaudited Consolidated Financial Statements
For the Three Months Ended March 31 2002 and 2001
and as of December 31, 2001
1. Organization and Basis of Presentation of Interim Consolidated Financial Statements
The accompanying unaudited consolidated financial statements of the Company and its wholly-owned subsidiaries have been prepared pursuant to the rules and regulations of the Securities and Exchange Commission. Certain information in footnote disclosures normally included in financial statements prepared in accordance with accounting principles generally accepted in the United States have been condensed or omitted pursuant to these rules and regulations. The unaudited consolidated financial statements included in this report reflect all the adjustments, consisting of normal recurring accruals, which the Company considers necessary for a fair presentation of the results of operations for the interim periods covered and for the financial condition of the Company at the date of the interim balance sheet. Results for the interim periods are not necessarily indicative of results for the year.
The financial statements included in this report should be read in conjunction with the Company’s 2001 audited consolidated financial statements and accompanying notes included in the Company’s 2001 Form 10-K, filed under the Securities Exchange Act of 1934, as amended.
2. Acquisitions
The Company completed one acquisition of a business and one asset purchase in the three months ended March 31, 2002. The combined purchase price for these acquisitions was approximately $7,985,000, including notes issued of $1,300,000.
3. Inventory
At March 31, 2002 and December 31, 2001, inventories consisted of the following (in thousands):
| | | March 31, 2002
| | | December 31, 2001
| |
| Raw materials | | $ | 89,138 | | | $ | 89,477 | |
| Work in process | | | 69,037 | | | | 56,785 | |
| Finished goods | | | 113,476 | | | | 97,090 | |
| Excess of current cost over LIFO value | | | (15,857 | ) | | | (13,674 | ) |
| | |
|
|
| |
|
|
|
| Inventory, net | | $ | 255,794 | | | $ | 229,678 | |
| | |
|
|
| |
|
|
|
4. Comprehensive Income
Comprehensive income for the three months ended March 31, 2002 and 2001 was as follows (in thousands):
| | | Three Months Ended March 31,
| |
| | | 2002
| | | 2001
| |
| Comprehensive income: | | | | | | | | |
| Net income | | $ | 19,162 | | | $ | 19,127 | |
| Cumulative translation adjustment | | | (1,848 | ) | | | (1,359 | ) |
| | |
|
|
| |
|
|
|
| Total comprehensive income | | $ | 17,314 | | | $ | 17,768 | |
| | |
|
|
| |
|
|
|
5
5. Business Segments
The Company is organized based on the products and services it offers: Drilling Equipment Sales, Tubular Services, Drilling Services, and Coiled Tubing & Wireline Products.
Drilling Equipment Sales: This segment manufactures and sells integrated systems and equipment for rotating and handling pipe on a drilling rig; a complete line of conventional drilling rig tools and equipment, including pipe handling tools, hoisting equipment and rotary equipment; pressure control and motion compensation equipment; and flow devices. Customers include major oil and gas companies and drilling contractors.
Tubular Services: This segment provides internal coating products and services; inspection and quality assurance services for tubular goods; and fiberglass tubulars. Additionally, Tubular Services includes the sale and rental of proprietary equipment used to inspect tubular products at steel mills. Tubular Services also provides technical inspection services and quality assurance services for in-service pipelines used to transport oil and gas. Customers include major oil and gas companies, independent producers, national oil companies, drilling contractors, oilfield supply stores, major pipeline operators, and steel mills.
Drilling Services: This segment consists of the sale and rental of technical equipment used in, and the provision of services related to, the separation of drill cuttings (solids) from fluids used in the oil and gas drilling processes, and the sale of computer based drilling information and control systems, as well as conventional drilling rig instrumentation. The Drilling Services business serves the oilfield drilling markets of North America, Latin America, Europe, Africa, the Middle East, and the Far East. Customers include major oil and gas companies, independent producers, national oil companies and drilling contractors.
Coiled Tubing & Wireline Products: This segment consists of the sale of highly-engineered coiled tubing equipment, related pressure control equipment, pressure pumping, wireline equipment and related tools to companies engaged in providing oil and gas well drilling, and completion and remediation services. Customers include major oil and gas coiled tubing service companies, as well as national oil companies.
The Company evaluates the performance of its operating segments at the operating profit level which consists of income before interest expense (income), other expense (income), nonrecurring items and income taxes. Intersegment sales and transfers are not significant.
Summarized information for the Company’s reportable segments is contained in the following table. Other operating profit (loss) includes corporate expenses and certain goodwill and identified intangible amortization not allocated to product lines. Operating profit excludes merger, transaction and litigation costs of $2,829,000 in the three months ended March 31, 2002.
6
| | | Three Months Ended March 31, | |
| | | 2002
| | | 2001
| |
| | | (in thousands) | |
Revenue: | | | | | | | | |
| Drilling Equipment Sales | | $ | 117,257 | | | $ | 67,538 | |
| Tubular Services | | | 75,039 | | | | 88,968 | |
| Drilling Services | | | 71,252 | | | | 76,638 | |
| Coiled Tubing & Wireline Products | | | 52,235 | | | | 41,069 | |
| | |
|
|
| |
|
|
|
| Total | | $ | 315,783 | | | $ | 274,213 | |
| | |
|
|
| |
|
|
|
|
Operating Profit: | | | | | | | | |
| Drilling Equipment Sales | | $ | 17,901 | | | $ | 3,304 | |
| Tubular Services | | | 10,448 | | | | 18,353 | |
| Drilling Services | | | 15,137 | | | | 17,742 | |
| Coiled Tubing & Wireline Products | | | 9,597 | | | | 9,053 | |
| Other | | | (11,474 | ) | | | (11,808 | ) |
| | |
|
|
| |
|
|
|
| Total | | $ | 41,609 | | | $ | 36,644 | |
| | |
|
|
| |
|
|
|
6. Unaudited Condensed Consolidating Financial Information
On January 30, 2002, the Company entered into a new credit agreement with a syndicate of banks that provided up to $125.0 million of funds under a revolving credit facility. The facility expires on January 30, 2005. The facility is secured by guarantees of material U.S. subsidiaries. The interest rate on the borrowed portion of the revolver is based on the Company’s rating by S&P and Moody’s which at the time of the agreement resulted in an interest rate of LIBOR + 0.625% or the prime rate. Commitment fees range from 0.1% to 0.25% depending on the Company rating.
On May 1, 2001, the Company issued $200.0 million of 7 ¼% Senior Notes due 2011 (“2011 Notes”). The 2011 Notes are fully and unconditionally guaranteed, on a joint and several basis, by certain wholly-owned subsidiaries of the Company. Each of the guarantees is an unsecured obligation of the guarantor and rankspari passuwith the guarantees provided by and the obligations of such guarantor subsidiaries under the Senior Credit Agreement and the Company’s 7 ½% Senior Notes due 2008 and with all existing and future unsecured indebtedness of such guarantor for borrowed money that is not, by its terms, expressly subordinated in right of payment to such guarantee. A portion of the net proceeds from the issuance of the 2011 Notes was used by the Company to repay the revolving indebtedness outstanding under the Senior Credit Agreement. The remaining net proceeds are being used for general corporate purposes, including working capital, capital expenditures and acquisitions of businesses.
On February 25, 1998, the Company issued $100 million of 7 1/2% Senior Notes due 2008 (“2008 Notes”). The 2008 Notes are fully and unconditionally guaranteed, on a joint and several basis, by certain wholly-owned subsidiaries of the Company. Each of the guarantees is an unsecured obligation of the guarantor and rankspari passu with the guarantees provided by and the obligations of such guarantor subsidiaries under the Senior Credit Agreement and the 2011 Notes, and with all existing and future unsecured indebtedness of such guarantor for borrowed money that is not, by its terms, expressly subordinated in right of payment to such guarantee.
The following condensed consolidating balance sheet as of March 31, 2002 and related condensed consolidating statements of income and cash flows for the three months ended March 31, 2002 should be read in conjunction with the notes to these unaudited consolidated financial statements.
7
VARCO INTERNATIONAL, INC.
Notes to Unaudited Consolidated Financial Statements (cont’d)
6. Unaudited Condensed Consolidating Financial Information (cont’d)
Balance Sheet
| | | March 31, 2002
| |
| | | Varco International Inc.
| | | Guarantor Subsidiaries
| | Non-Guarantor Subsidiaries
| | | Eliminations
| | | Consolidated
| |
| | | | | | | | (in thousands) | | | | | | | |
ASSETS | | | | | | | | | | | | | | | | | | | |
|
| Current assets: | | | | | | | | | | | | | | | | | | | |
| Cash and cash equivalents | | $ | 7,123 | | | $ | 17,218 | | $ | 30,366 | | | $ | — | | | $ | 54,707 | |
| Accounts receivable, net | | | 271,648 | | | | 482,193 | | | 612,887 | | | | (1,042,533 | ) | | | 324,195 | |
| Inventory, net | | | — | | | | 185,139 | | | 70,655 | | | | — | | | | 255,794 | |
| Other current assets | | | — | | | | 25,118 | | | 9,752 | | | | — | | | | 34,870 | |
| | |
|
|
| |
|
| |
|
|
| |
|
|
| |
|
|
|
| Total current assets | | | 278,771 | | | | 709,668 | | | 723,660 | | | | (1,042,533 | ) | | | 669,566 | |
|
| Investment in subsidiaries | | | 1,005,698 | | | | 472,209 | | | — | | | | (1,477,907 | ) | | | — | |
| Property and equipment, net | | | — | | | | 266,635 | | | 133,226 | | | | — | | | | 399,861 | |
| Identified intangibles, net | | | — | | | | 29,029 | | | 1,295 | | | | — | | | | 30,324 | |
| Goodwill, net | | | — | | | | 192,822 | | | 137,561 | | | | — | | | | 330,383 | |
| Other assets, net | | | 5,747 | | | | 3,350 | | | 2,807 | | | | — | | | | 11,904 | |
| | |
|
|
| |
|
| |
|
|
| |
|
|
| |
|
|
|
| Total assets | | $ | 1,290,216 | | | $ | 1,673,713 | | $ | 998,549 | | | $ | (2,520,440 | ) | | $ | 1,442,038 | |
| | |
|
|
| |
|
| |
|
|
| |
|
|
| |
|
|
|
|
LIABILITIES AND EQUITY | | | | | | | | | | | | | | | | | | | |
|
| Current liabilities: | | | | | | | | | | | | | | | | | | | |
| Accounts payable | | $ | 117,995 | | | $ | 580,597 | | $ | 450,032 | | | $ | (1,042,533 | ) | | $ | 106,091 | |
| Accrued liabilities | | | 7,002 | | | | 56,433 | | | 36,243 | | | | — | | | | 99,678 | |
| Income taxes payable | | | — | | | | 10,908 | | | 12,911 | | | | — | | | | 23,819 | |
| Current portion of long-term debt | | | — | | | | 2,738 | | | 3,488 | | | | — | | | | 6,226 | |
| | |
|
|
| |
|
| |
|
|
| |
|
|
| |
|
|
|
| Total current liabilities | | | 124,997 | | | | 650,676 | | | 502,674 | | | | (1,042,533 | ) | | | 235,814 | |
|
| Long-term debt | | | 300,638 | | | | 7,749 | | | 5,618 | | | | — | | | | 314,005 | |
| Pension liabilities | | | 16,224 | | | | — | | | 8,349 | | | | — | | | | 24,573 | |
| Deferred taxes payable | | | — | | | | 9,590 | | | 8,384 | | | | — | | | | 17,974 | |
| Other liabilities | | | — | | | | — | | | 1,315 | | | | — | | | | 1,315 | |
| | |
|
|
| |
|
| |
|
|
| |
|
|
| |
|
|
|
| Total liabilities | | | 441,859 | | | | 668,015 | | | 526,340 | | | | (1,042,533 | ) | | | 593,681 | |
|
| Common stockholders’ equity: | | | | | | | | | | | | | | | | | | | |
| Common stock | | | 977 | | | | — | | | — | | | | — | | | | 977 | |
| Paid in capital | | | 516,863 | | | | 576,678 | | | 246,625 | | | | (823,303 | ) | | | 516,863 | |
| Retained earnings | | | 366,710 | | | | 429,020 | | | 246,447 | | | | (675,467 | ) | | | 366,710 | |
| Accumulated other comprehensive loss | | | (20,863 | ) | | | — | | | (20,863 | ) | | | 20,863 | | | | (20,863 | ) |
| Treasury Stock | | | (15,330 | ) | | | — | | | — | | | | — | | | | (15,330 | ) |
| | |
|
|
| |
|
| |
|
|
| |
|
|
| |
|
|
|
| Total common stockholders’ equity | | | 848,357 | | | | 1,005,698 | | | 472,209 | | | | (1,477,907 | ) | | | 848,357 | |
| | |
|
|
| |
|
| |
|
|
| |
|
|
| |
|
|
|
| Total liabilities and equity | | $ | 1,290,216 | | | $ | 1,673,713 | | $ | 998,549 | | | $ | (2,520,440 | ) | | $ | 1,442,038 | |
| | |
|
|
| |
|
| |
|
|
| |
|
|
| |
|
|
|
8
VARCO INTERNATIONAL, INC.
Notes to Unaudited Consolidated Financial Statements (cont’d)
6. Unaudited Condensed Consolidating Financial Information (cont’d)
Statement of Income
| | | Three Months Ended March 31, 2002
|
| | | Varco International, Inc.
| | | Guarantor Subsidiaries
| | Non-Guarantor Subsidiaries
| | Eliminations
| | | Consolidated
|
| | | (in thousands) |
| Revenue | | $ | — | | | $ | 228,423 | | $ | 131,311 | | $ | (43,951 | ) | | $ | 315,783 |
| Operating costs | | | (1,180 | ) | | | 216,266 | | | 105,868 | | | (43,951 | ) | | | 277,003 |
| | |
|
|
| |
|
| |
|
| |
|
|
| |
|
|
| Operating profit | | | 1,180 | | | | 12,157 | | | 25,443 | | | — | | | | 38,780 |
| Other expense | | | 372 | | | | 392 | | | 1,532 | | | — | | | | 2,296 |
| Interest expense | | | 5,517 | | | | 173 | | | 378 | | | — | | | | 6,068 |
| | |
|
|
| |
|
| |
|
| |
|
|
| |
|
|
| Income (loss) before taxes | | | (4,709 | ) | | | 11,592 | | | 23,533 | | | — | | | | 30,416 |
| Provision for taxes | | | — | | | | 2,958 | | | 8,296 | | | — | | | | 11,254 |
| Equity in net income of subsidiaries | | | 23,871 | | | | 15,237 | | | — | | | (39,108 | ) | | | — |
| | |
|
|
| |
|
| |
|
| |
|
|
| |
|
|
| Net income | | $ | 19,162 | | | $ | 23,871 | | $ | 15,237 | | $ | (39,108 | ) | | $ | 19,162 |
| | |
|
|
| |
|
| |
|
| |
|
|
| |
|
|
9
VARCO INTERNATIONAL, INC.
Notes to Unaudited Consolidated Financial Statements (cont’d)
6. Unaudited Condensed Consolidating Financial Information (cont’d)
Statement of Cash Flows
| | | Three Months Ended March 31, 2002
|
| | | Varco International, Inc.
| | Guarantor Subsidiaries
| | Non-Guarantor Subsidiaries
| | Eliminations
| | Consolidated
|
| | | (in thousands) |
| Net cash provided by (used for) operating activities | | $(305) | | $ 2,293 | | $ 20,010 | | $— | | $ 21,998 |
| Net cash used for investing activities: | | | | | | | | | | |
| Capital expenditures | | — | | (10,589) | | (3,116) | | — | | (13,705) |
| Business acquisitions, net of cash acquired | | — | | | | (6,814) | | — | | (6,814) |
| Other | | — | | — | | (2,058) | | — | | (2,058) |
| | |
| |
| |
| |
| |
|
| Net cash used for investing activities | | — | | (10,589) | | (11,988) | | — | | (22,577) |
| Cash flows provided by (used for) financing activities: | | | | | | | | | | |
| Net payments under financing agreements | | (4) | | 377 | | (4,456) | | — | | (4,083) |
| Net proceeds from sale of common stock | | 1,870 | | — | | — | | — | | 1,870 |
| | |
| |
| |
| |
| |
|
| Net cash provided by (used for) financing activities | | 1,866 | | 377 | | (4,456) | | — | | (2,213) |
| | |
| |
| |
| |
| |
|
| Net increase in cash and cash | | | | | | | | | | |
| equivalents | | 1,561 | | (7,919) | | 3,566 | | — | | (2,792) |
| Beginning of period | | 5,562 | | 25,137 | | 26,800 | | — | | 57,499 |
| | |
| |
| |
| |
| |
|
| End of period | | $7,123 | | $17,218 | | $ 30,366 | | $— | | $ 54,707 |
| | |
| |
| |
| |
| |
|
7. New Accounting Standards
In June 2001, the Financial Accounting Standards Board issued Statement of Financial Accounting Standards No. 142, “Goodwill and Other Intangible Assets”(SFAS 142), effective for fiscal years beginning after December 15, 2001. Under SFAS 142, intangible assets deemed to have indefinite lives (including goodwill) will no longer be amortized but will be subject to annual impairment tests in accordance with the Statements. Other intangible assets will continue to be amortized over their useful lives.
The Company adopted the new rules on accounting for goodwill and other intangible assets beginning in the first quarter of 2002. If SFAS 142 had been adopted in the first quarter 2001, net income and dilutive earnings per share would have been $21,587,000 and $0.22 respectively for the three months ended March 31, 2001. The Company performed the first of the required impairment tests of goodwill and indefinite lived intangible assets and has determined that the effect of these tests has no material impact on the earnings and financial position of the Company.
In August 2001, the Financial Accounting Standards Board issued statement of Financial Accounting Standard No 143, “Accounting for Asset Retirement Obligations,” (SFAS 143). SFAS 143 requires a company to recognize a liability associated with a legal obligation to retire or remove any tangible long-lived assets. The new statement is effective beginning in 2003 and the Company is currently evaluating if it will have a material impact on its financial position or results of operations.
In October 2001, the Financial Accounting Standards Board issued Statement of Financial Accounting Standard No. 144, “Accounting for the Impairment or Disposal of Long-Lived Assets” (SFAS 144). This new statement supercedes FASB statement No. 121, “Accounting for the Impairment of Long-Lived Assets and for long-lived assets to be disposed of (SFAS 121), however, it retains the fundamental provisions of long-lived assets to be “held and used.” The new statement provides implementation guidelines and was effective for the Company beginning in 2002. SFAS 144 did not have a material effect on the Company’s financial position or results of operations.
10
Item 2. Management’s Discussion and Analysis of Results of Operations and Financial Condition
General Operating Environment Overview
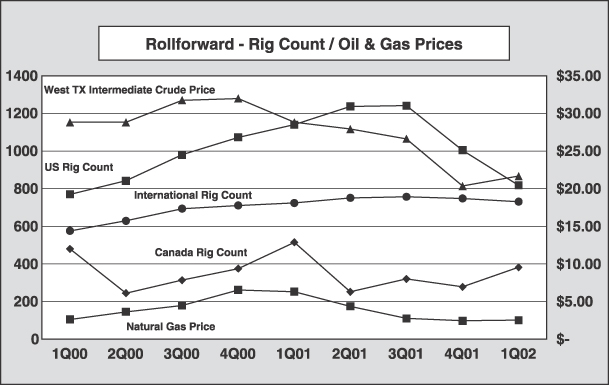
Despite a 19% (from 2,379 to 1,931) and 28% (from 1,140 to 818) decline in average worldwide and U.S. drilling activity, respectively, a 25% (from $28.81 to $21.67) decline in the average price of West Texas Intermediate Crude per barrel, and a 60% (from $6.31 mbtu to $2.53 mbtu) decline in natural gas prices in the first quarter of 2002 compared to the first quarter of 2001, the Company’s revenue and operating profit improved in the first quarter of 2002 compared to the first quarter of 2001. Revenue and operating profit increased by $41.6 million (15%) and $5.0 million (14%) (excluding merger, transaction, and litigation costs), respectively, primarily due to seventeen acquisitions made in 2001 and the first quarter of 2002, and to an increase in the Company’s Drilling Equipment Sales revenue as the result of capital equipment shipments in the first quarter of 2002 which were related to orders received in 2001. The Company’s services businesses were adversely impacted by the recent downturn in oil and gas drilling activity and the corresponding drop in oil and gas prices. The Company’s Tubular Services revenue declined 16% and the Drilling Services revenue declined 7%. Excluding the impact from acquisitions, the decline in Tubular Services and Drilling Services revenue would have been 20% and 12%, respectively. The recent downturn is expected to continue to have an adverse effect on the Company’s services business through the second quarter of 2002. Similar to the first quarter of 2002, the decline in revenue is expected to be partially offset by an increase in revenue from Drilling Equipment Sales, which continues to work off backlog built up in the last upturn in the industry during 2001.
The following graph details U.S., Canada, and International rig activity, West Texas Intermediate Oil and natural gas prices for the past two years on a quarterly basis:
Sources: Rig count—Baker Hughes Incorporated (“BHI”).
West TX Intermediate Crude Price and Natural Gas Price—U.S. Department of Energy (Energy Information Administration).
11
Results of Operations
Three Months Ended March 31, 2002 and 2001
Revenue. Revenue was $315.8 million for the first quarter of 2002, an increase of $41.6 million (or 15%) compared to the first quarter of 2001. The increase was due primarily to an increase in revenue related to the Company’s 17 acquisitions in 2001 and the first quarter of 2002, and an increase in revenue from Drilling Equipment Sales due to the shipment of capital equipment ordered during the most recent industry upturn in 2001. The following table summarizes revenue by segment.
| | | Three Months Ended March 31, |
| | | 2002
| | 2001
|
| | | (in thousands) |
Revenue: | | | | | | |
| Drilling Equipment Sales | | $ | 117,257 | | $ | 67,538 |
| Tubular Services | | | 75,039 | | | 88,968 |
| Drilling Services | | | 71,252 | | | 76,638 |
| Coiled Tubing & Wireline Products | | | 52,235 | | | 41,069 |
| | |
|
| |
|
|
| Total | | $ | 315,783 | | $ | 274,213 |
| | |
|
| |
|
|
Drilling Equipment Sales revenue was $117.3 million for the first quarter of 2002, an increase of $49.7 million (or 74%) compared to the first quarter of 2001. New orders for the three months ended March 31, 2002 were $103.0 million compared to $115.0 for the same period of 2001, while backlog at March 31, 2002 was $237.3 million compared to $139.9 million at March 31, 2001. The increase in revenue and backlog was a result of increased order activity in 2001 compared to 2000 as a result of higher rig activity in 2001 than 2000. During the first quarter of 2002, the Company shipped 23 top drive units compared to 9 top drive units in the first quarter of 2001. In addition, Drilling Equipment Sales revenue increased as a result of greater spare parts sales and service revenue.
Tubular Services revenue was $75.0 million for the first quarter of 2002, a decrease of $13.9 million (or 16%) compared to the first quarter of 2001. The decrease was due primarily to a decline in North America drilling rig activity as evidenced by a 27% decline in oil and gas drilling activity in the first quarter of 2002 compared to the first quarter of 2001. The Company’s inspection, coating, and fiberglass operations declined $3.7 million (11%), $7.6 million (34%), and $3.4 million (14%), respectively, as a result of lower North America and Worldwide drilling activity. An increase in pipeline inspection revenue in the first quarter of 2002 over the first quarter of 2001 slightly offset these declines.
Drilling Service revenue was $71.3 million for the first quarter of 2002, a decrease of $5.4 million (7%) compared to the first quarter of 2001. The decrease in revenue was due to the decline in North America and worldwide drilling activity. The decrease was mainly due to a $6.8 million (12%) decline in solids control revenue. Solids control revenue was down in both North and South America and offset slightly by increases in Europe, Middle East, and Far East markets. The Company’s instrumentation business was up $1.4 million mainly as the result of the acquisition of instrumentation businesses in the U.S. and Canada in 2001.
Coiled Tubing and Wireline Products revenue was $52.2 million for the first quarter of 2002, an increase of $11.2 million (27%) compared to the first quarter of 2001. The increase was due primarily to the Company’s acquisitions of Bradon Industries Ltd. in Canada, Albin’s Enterprises, Inc. in Oklahoma, and Elmar Services Ltd. in the UK in 2001. Excluding the impact from these acquisitions, revenue was down approximately $0.8 million from the first quarter of 2001. Backlog for this segment was at $63.4 million at March 31, 2002 compared to $54.0 million at March 31, 2001.
Gross Profit. Gross profit was $92.4 million (29.2% of revenue) in the first quarter of 2002, an increase of $11.4 million (14%) compared to the first quarter of 2001 of $81.0 million (29.5% of revenue and excluding goodwill
12
amortization). The improvement in the 2002 gross profit dollars was due to the higher revenue discussed above. The slight decrease in gross profit percentage was due mainly to a change in revenue mix, with a larger percent of the business consisting of lower margin business.
Selling, General, and Administrative Costs. Selling, general, and administrative costs were $38.0 million in the first quarter of 2002, an increase of $6.0 million (19%) over the first quarter of 2001. The increase was due to the 17 acquisitions completed in 2001 and the first quarter of 2002, and an increase in Drilling Equipment revenue in the first quarter of 2002 compared to the first quarter of 2001.
Research and Engineering Costs. Research and engineering costs was $12.8 million in the first quarter of 2002 compared to $9.9 million for the same period of 2001. The increase was due to acquisitions in 2001 and 2002, greater engineering costs related to the Drilling Equipment operations and new product development efforts in Tubular Services.
Merger, Transaction and Litigation Costs. Merger, transaction and litigation costs were $2.8 million in the first quarter of 2002. The reorganization costs consisted of early termination of employment agreements for several senior executives arising out of the 2000 merger between Varco and Tuboscope.
Operating Profit. Operating profit was $38.8 million for the first quarter of 2002 compared to $36.6 million in the same period of 2001. The increase in operating profit is due to the factors discussed above.
Interest Expense.Interest expense was $6.1 million and $3.8 million for the three months ending March 31, 2002 and 2001. The increases in interest expense were due to the greater average outstanding debt balances as a result of the $200.0 million Senior Notes issued in the second quarter of 2001.
Other Expense (Income). Other expense includes interest income, foreign exchange, and other expense (income). Net other expense was $2.3 million and $1.0 million for the three months ended March 31, 2002 and 2001, respectively. The increase in other expense in 2002 was primarily due to greater foreign exchange losses in Argentina as a result of the devaluation of the Argentina peso in the first quarter of 2002.
Provision for Income Taxes. The Company’s effective tax rate for the first quarter of 2002 and 2001 was 37% and 40%, respectively. These rates are higher than the domestic rate of 35%, due to charges not allowed under domestic and foreign jurisdictions related to goodwill amortization and foreign earnings subject to tax rates differing from domestic rates.
Net Income. Net income for the first quarter of 2002 and 2001 was $19.2 million and $19.1, respectively. The improvement in the first quarter of 2002 was due to the factors discussed above.
Financial Condition and Liquidity
March 31, 2002
For the three months ended March 31, 2002, cash provided by operating activities was $22.0 million compared to $30.8 million for the three months ended March 31, 2001. Cash was provided by operations in 2002 through net income of $19.2 million, non-cash charges of $21.1 million, and a decrease in accounts receivable of $17.6 million. These items were partially offset by an increase in inventory of $29.3 million, a decrease in accounts payable and accrued liabilities of $2.5 million, and a decrease in income taxes payable of $3.1 million. Accounts receivable decreased $17.6 million during the first quarter of 2002 due to lower revenue (down $46.5 million) in the first quarter of 2002 compared to the fourth quarter of 2001. The increase in inventory was related primarily to the construction of equipment for sales related to the Drilling Equipment Sales operation. The decrease in accounts payable and accrued liabilities was related to employee incentive bonus payments in the first quarter of 2002. Income taxes payable were down due to first quarter tax payments.
For the three months ended March 31, 2002, the Company used $22.6 million for investing activities compared to $96.4 million for the same period of 2001. The Company used $6.8 million to acquire two separate businesses in the first quarter of 2002 (see Note 2 of Notes to Unaudited Consolidated Financial Statements). Capital spending of $13.7 million was related primarily to a thermal
13
desorption unit for rental, Top Drive rental units, and additional equipment for the Company’s Solids Control operations.
For the three months ended March 31, 2002, the Company used $2.2 million for financing activities. Cash used consisted of principal debt payments of $4.1 million, net of proceeds from the sale of stock of $1.9 million.
At March 31, 2002, the Company had cash and cash equivalents of $54.7 million, and current and long-term debt of $320.2 million. At December 31, 2001 the Company had cash and cash equivalents of $57.5 million, and current and long-term debt of $322.6 million. The Company’s outstanding debt at March 31, 2002 consisted of $201.5 million of 7.25% Senior Notes due 2011, $99.2 million of 7.5% Senior Notes due 2008, and other debt of $19.5 million.
On January 30, 2002, the Company entered into a new credit agreement with a syndicate of banks that provided up to $125.0 million of funds under a new revolving credit facility. In addition, the Company also obtained a swingline facility that provided up to $5.0 million of funds. At March 31, 2002, there were $124.5 million of funds available under the revolving credit facility and $4.4 million of funds available under the swing line facility with $0.5 million and $0.6 million being used for letters of credit, respectively.
The Company believes that its March 31, 2002 cash and cash equivalents, its credit facility, and cash flow from operations will be sufficient to meet its capital expenditures and its operating cash needs for the foreseeable future.
Forward Looking Statements
This Quarterly Report on Form 10-Q contains forward-looking statements within the meaning of Section 27A of the Securities Act of 1933 and Section 21E of the Securities Exchange Act of 1934. The forward-looking statements are those that do not state historical facts and are inherently subject to risk and uncertainties. The forward-looking statements contained herein are based on current expectations and entail various risks and uncertainties that could cause actual results to differ materially from those projected in the forward-looking statements. Such risks and uncertainties include, among others, the cyclical nature of the oilfield services industry, general economic and political conditions (including the uncertainties resulting from the September 11, 2001 terrorist attacks in New York City, Washington, D.C. and related events), risks associated with growth through acquisitions and other factors discussed in the Company’s Annual Report on Form 10-K for the year ended December 31, 2001 under the caption “Factors Affecting Future Operating Results.” In addition, the Company’s backlog is based upon anticipated revenues from customer orders that the Company believes are firm. In accordance with industry practice, orders or commitments to purchase the Company’s products generally can be cancelled by customers at any time. In addition, orders and commitments are sometimes modified before or during manufacturing of the products. The level of backlog at any particular time is not necessarily indicative of the future operating performance of the Company.
Item 3. Quantitative & Qualitative Disclosure About Market Risk
The Company does not believe it has a material exposure to market risk. The Company has historically managed its exposure to interest rate changes by using a combination of fixed rate debt, variable rate debt, and interest swap and collar agreements in its total debt portfolio. As of March 31, 2001, the Company had no interest rate swap agreements outstanding. At March 31, 2001, the Company had $320.2 million of outstanding debt. Fixed rate debt included $201.5 million of the 2011 Notes at a fixed interest rate of 7¼% and $99.2 million of the 2008 Notes at a fixed interest rate of 7 ½%. With respect to foreign currency fluctuations, the Company uses natural hedges to minimize the effect of rate fluctuations. When natural hedges are not sufficient, generally it is the Company’s policy to enter into forward foreign exchange contracts to hedge significant transactions for periods consistent with the underlying risk. The Company had no forward foreign exchange contracts outstanding at March 31, 2001. The Company does not enter into foreign currency or interest rate transactions for speculative purposes.
14
Pursuant to the requirements of the Securities Exchange Act of 1934, the registrant has duly caused this report to be signed on its behalf by the undersigned thereunto duly authorized.
| | | VARCO INTERNATIONAL, INC. |
| | | (Registrant) |
|
Date: May 8, 2002 | | /s/ Joseph C. Winkler
|
| | | Joseph C. Winkler |
| | | Executive Vice President, Chief Financial Officer |
| | | and Treasurer (Duly Authorized Officer, |
| | | Principal Financial and Accounting Officer) |
15
Exhibit No.
| | Description
| | Note No.
|
|
| 3.1 | | Third Amended and Restated Certificate of Incorporation, dated May 30, 2000. | | (Note 1) |
|
| 3.2 | | Third Amended and Restated Bylaws. | | (Note 1) |
|
| 3.3 | | Certificate of Designations of Series A Junior Participating Preferred Stock, dated November 30, 2000. | | (Note 1) |
|
| 4.1 | | Rights Agreement, dated as of November 29, 2000, by and between the Company and Chase Mellon Shareholder Services, L.L.C., as Rights Agent, which includes the form of Certificate of Designations of the Series A Junior Participating Preferred Stock of Varco International, Inc. as Exhibit A, the form of Right Certificate as Exhibit B, and the Summary of Rights to Purchase Preferred Shares as Exhibit C. | | (Note 1) |
|
| 4.2 | | Registration Rights Agreement dated May 13, 1988 among the Company, Brentwood Associates, Hub Associates IV, L.P. and the investors listed therein. | | (Note 2) |
|
| 4.3 | | Purchase Agreement dated as of October 1, 1991 between the Company and Baker Hughes Incorporated regarding certain registration rights. | | (Note 3) |
|
| 4.4 | | Registration Rights Agreement dated April 24, 1996 among the Company, SCF III, L.P., D.O.S. Partners L.P., Panmell (Holdings), Ltd. and Zink Industries Limited. | | (Note 9) |
|
| 4.5 | | Registration Rights Agreement dated March 7, 1997 among the Company and certain stockholders of Fiber Glass Systems, Inc. | | (Note 10) |
|
| 4.6 | | Indenture, dated as of February 25, 1998, between the Company, the Guarantors named therein and The Bank of New York Trust Company of Florida as trustee, relating to $100,000,000 aggregate principal amount of 7 ½% Senior Notes due 2008; Specimen Certificate of 7 ½% Senior Notes due 2008 (private notes); and Specimen Certificate of 7 ½% Senior Notes due 2008 (exchange notes). | | (Note 11) |
|
| 4.8 | | Indenture, dated as of May 1, 2001, among the Company, the Guarantors named therein and The Bank of New York, as trustee, relating to $200,000,000 aggregate principal amount of 7¼% Senior Notes due 2011; Specimen Certificate of 7 ¼% Senior Notes due 2011 (private notes); Specimen Certificate of 7 ¼% Senior Notes due 2011 (exchange notes) | | (Note 27) |
|
| 10.1 | | Credit Agreement, dated as of January 30, 2002, among Varco International, Inc., as the Borrower, Wells Fargo Bank Texas, National Association, as Administrative Agent, Bank One, NA, as Syndication Agent, Credit Suisse First Boston, Cayman Islands Branch, as Documentation Agent, and the other Banks a party thereto. | | (Note 13) |
|
| 10.2* | | Deferred Compensation Plan dated November 14, 1994; Amendment thereto dated May 11, 1998. | | (Note 12) |
|
| 10.3* | | Amended and Restated 1996 Equity Participation Plan. | | (Note 1) |
|
| 10.3.1* | | Form of Non-qualified Stock Option Agreement for Employees and Consultants; Form of Non-qualified Stock Option Agreement for Independent Directors. | | (Note 13) |
|
| 10.4* | | DOS Ltd. 1993 Stock Option Plan; Form of D.O.S. Ltd. Non-Statutory Stock Option Agreement. | | (Note 8) |
|
| 10.5* | | Amended and Restated Stock Option Plan for Key Employees of Tuboscope Vetco International Corporation; Form of Revised Incentive Stock Option Agreement; and Form of Revised Non-Qualified Stock Option Agreement. | | (Note 4) |
|
| 10.6* | | Stock Option Plan for Non-Employee Directors; Amendment to Stock Option Plan for Non–Employee Directors; and Form of Stock Option Agreement. | | (Note 5) |
16
Exhibit No.
| | Description
| | Note No.
|
|
| 10.7* | | Varco International, Inc. Supplemental Executive Retirement Plan | | (Note 21) |
|
| 10.7.1* | | Amendment to Varco International, Inc. Supplemental Executive Retirement Plan | | (Note 23) |
|
| 10.7.2* | | Second Amendment to Varco International, Inc. Supplemental Executive Retirement Plan | | (Note 24) |
|
| 10.8 | | Lease dated March 7, 1985, as amended | | (Note 15) |
|
| 10.8.1 | | Agreement dated as of January 1, 1982, with respect to Lease included as Exhibit 10.8 hereof | | (Note 16) |
|
| 10.8.2 | | Agreement dated as of January 1, 1984, with respect to Lease included as Exhibit 10.8 hereto | | (Note 17) |
|
| 10.8.3 | | Agreement dated as of February 8, 1985, with respect to Lease included as Exhibit 10.8 hereto | | (Note 17) |
|
| 10.8.4 | | Agreement dated as of April 12, 1985, with respect to Lease included as Exhibit 10.8 hereto | | (Note 18) |
|
| 10.8.5 | | Amendment dated as of January 11, 1996, with respect to Lease included as Exhibit 10.8 hereto | | (Note 22) |
|
| 10.9 | | Standard Industrial Lease-Net dated September 29, 1988 for the premises at 743 N. Eckhoff, Orange, California | | (Note 19) |
|
| 10.9.1 | | First amendment dated as of January 11, 1996 to Lease included as Exhibit 10.9 hereto | | (Note 22) |
|
| 10.10* | | The Varco International, Inc. 1990 Stock Option Plan, as amended | | (Note 20) |
|
| 10.10.1* | | Amendments to the Varco International, Inc. 1990 Stock Option Plan | | (Note 25) |
|
| 10.11* | | Varco International, Inc. 1994 Directors’ Stock Option Plan | | (Note 22) |
|
| 10.11.1* | | Amendment to Varco International, Inc. 1994 Directors’ Stock Option Plan | | (Note 24) |
|
| 10.12* | | The Varco International, Inc. Deferred Compensation Plan. | | (Note 25) |
|
| 10.13 | | Master Leasing Agreement, dated December 18, 1995 between the Company and Heller Financial Leasing, Inc. | | (Note 6) |
|
| 10.14* | | Form of Executive Agreement of certain members of senior management | | (Note 14) |
|
| 10.14.1* | | Form of First Amendment to Executive Agreements | | (Note 14) |
|
| 10.15* | | Executive Agreement of John F. Lauletta | | (Note 14) |
|
| 10.16* | | Executive Agreement of Joseph C. Winkler | | (Note 14) |
|
| 10.17* | | Executive Agreement of George Boyadjieff | | (Note 26) |
|
| 10.18* | | Executive Agreement of Michael W. Sutherlin | | (Note 26) |
|
| 10.19* | | Form of Indemnity Agreement | | (Note 14) |
17
Exhibit No.
| | Description
| | Note No.
|
| * Management contract, compensation plan or arrangement. | | |
|
| Note 1 | | Incorporated by reference to the Company’s Annual Report on Form 10-K for the fiscal year ended December 31, 2000. | | |
|
| Note 2 | | Incorporated by reference to the Company’s Registration Statement on Form S-1 (No. 33-31102). | | |
|
| Note 3 | | Incorporated by reference to the Company’s Registration Statement on Form S-1 (No. 33-43525). | | |
|
| Note 4 | | Incorporated by reference to the Company’s Registration Statement on Form S-8 (No. 33-72150). | | |
|
| Note 5 | | Incorporated by reference to the Company’s Registration Statement on Form S-8 (No. 33-72072). | | |
|
| Note 6 | | Incorporated by reference to the Company’s Annual Report on Form 10-K for the fiscal year ended December 31, 1995. | | |
|
| Note 7 | | Incorporated by reference to the Company’s Registration Statement on Form S-8 (No. 333-05233). | | |
|
| Note 8 | | Incorporated by reference to the Company’s Registration Statement on Form S-8 (No. 333-05237). | | |
|
| Note 9 | | Incorporated by reference to the Company’s Current Report on Form 8-K filed on January 16, 1996. | | |
|
| Note 10 | | Incorporated by reference to the Company’s Current Report on 8-K filed on March 19, 1997, as amended by Amendment No. 1 filed on May 7, 1997. | | |
|
| Note 11 | | Incorporated by reference to the Company’s Registration Statement on Form S-4 (No. 333-51115). | | |
|
| Note 12 | | Incorporated by reference to the Company’s Quarterly Report on Form 10-Q for the quarter ended June 30, 1998. | | |
|
| Note 13 | | Incorporated by reference to the Company’s Annual Report on Form 10-K for the fiscal year ended December 31, 2001. | | |
|
| Note 14 | | Incorporated by reference to the Company’s Registration Statement of Form S-4 (333-34582) | | |
|
| Note 15 | | Incorporated by reference to Varco’s Annual Report on Form 10-K for the year ended December 31, 1981. | | |
|
| Note 16 | | Incorporated by reference to Varco’s Annual Report on Form 10-K for the fiscal year ended December 31, 1982. | | |
|
| Note 17 | | Incorporated by reference to Varco’s Annual Report on Form 10-K for the fiscal year ended December 31, 1984. | | |
18
|
| Note 18 | | Incorporated by reference to Varco’s Quarterly Report on Form 10-Q for the fiscal quarter ended June 30, 1985. | | |
|
| Note 19 | | Incorporated by reference to Varco’s Annual Report on Form 10-K for the fiscal year ended December 31, 1988. | | |
|
| Note 20 | | Incorporated by reference to Varco’s Registration Statement on Form S-8, Registration No. 333-21681. | | |
|
| Note 21 | | Incorporated by reference to Varco’s Annual Report on Form 10-K for the fiscal year ended December 31, 1992. | | |
|
| Note 22 | | Incorporated by reference to Varco’s Annual Report on Form 10-K for the fiscal year ended December 31, 1995. | | |
|
| Note 23 | | Incorporated by reference to Varco’s Annual Report on Form 10-K for the fiscal year ended December 31, 1996. | | |
|
| Note 24 | | Incorporated by reference to Varco’s Annual Report on Form 10-K for the fiscal year ended December 31, 1997. | | |
|
| Note 25 | | Incorporated by reference to Varco’s Annual Report on Form 10-K for the year ended December 31, 1999. | | |
|
| Note 26 | | Incorporated by reference to Varco’s Annual Report on Form 10-K/A for the year ended December 31, 1999. | | |
|
| Note 27 | | Incorporated by reference to Varco’s Registration Statement on Form S-4 filed on June 29, 2001 (No. 333-64226). | | |
19