SECURITIES AND EXCHANGE COMMISSION
Washington D.C. 20549
FORM 10-K/A
(Amendment No. 1)
(Mark One)
| x | ANNUAL REPORT PURSUANT TO SECTION 13 OR 15(d) OF THE SECURITIES EXCHANGE ACT OF 1934 (FEE REQUIRED) |
For the fiscal year ended December 31, 2001
OR
| ¨ | TRANSITION REPORT PURSUANT TO SECTION 13 OR 15(d) OF THE SECURITIES EXCHANGE ACT OF 1934 (NO FEE REQUIRED) |
For the transition period from to
VARCO INTERNATIONAL, INC.
(Exact name of registrant as specified in its charter)
Delaware (State or other jurisdiction of incorporation or organization) | 001-13309 (Commission File No.) | 76-0252850 (I.R.S. Employer Identification No.) |
One BriarLake Plaza, 2000 W. Sam Houston Pkwy South, Suite 1700, Houston, TX (Address of principal executive offices) | 77042 (Zip Code) |
Registrant’s telephone number, including area code: (281) 953-2200
Securities registered pursuant to Section 12(b) of the Act:
Title of each class | Name of each exchange on which registered | |
Common stock, $.01 par value Preferred Share Purchase Rights | New York Stock Exchange New York Stock Exchange |
Securities registered pursuant to Section 12(g) of the Act:
None
Indicate by check mark whether the registrant (1) has filed all reports required to be filed by Section 13 or 15(d) of the Securities Exchange Act of 1934 during the preceding 12 months (or for such shorter period that the registrant was required to file such reports) and (2) has been subject to such filing requirements for the past 90 days. Yes x No ¨
The aggregate market value of the voting stock held by non-affiliates of the registrant as of February 22, 2002, was $1,319,902,784 based on the closing sales price of such stock on such date.
Indicate by check mark if disclosure of delinquent filers pursuant to Item 405 of Regulation S-K is not contained herein, and will not be contained, to the best of registrant’s knowledge, in definitive proxy or information statements incorporated by reference in Part III of this Form 10-K or any amendment to this Form 10-K. ¨
The number of shares outstanding of the registrant’s common stock as of February 22, 2002, was 96,049,170.
DOCUMENTS INCORPORATED BY REFERENCE
Portions of the registrant’s Proxy Statement for its 2002 Annual Meeting are incorporated by this reference into Part III, as set forth herein.
ITEM 1. BUSINESS
General
Varco International, Inc. (the “Company”) is a leading provider of highly engineered drilling and well-servicing equipment, products and services to the world’s oil and gas industry. The Company is a leading manufacturer and supplier of innovative drilling systems and rig instrumentation; oilfield tubular inspections and internal tubular coating techniques; drill cuttings separation, management and disposal systems and services; and coiled tubing and pressure control equipment for land and offshore drilling and well stimulation operations. The Company also provides in-service pipeline inspections, manufactures high pressure fiberglass tubulars, and sells and rents advanced in-line inspection equipment to makers of oil country tubular goods. The Company has a long tradition of pioneering many drilling and production innovations which have steadily improved the efficiency, safety, cost and environmental impact of petroleum operations.
The Company is engaged in the design, manufacture, sale and rental of drilling and well-remediation equipment, and provides technical services around the world, with operations spanning six continents, 49 countries and every major oilfield market in the world. The Company underwent a significant transformation in May 2000 when Varco International, Inc., a California corporation (“Varco”), merged into Tuboscope Inc. (“Tuboscope”) (the “Merger”). The Merger has been accounted for as a pooling of interests, and unless otherwise indicated, the financial, historical and other information included herein is for the combined company. The Company’s common stock is traded on the New York Stock Exchange under the symbol “VRC.” The Company operates through four business groups: Drilling Equipment Sales, Tubular Services, Drilling Services, and Coiled Tubing & Wireline Products.
The Drilling Equipment Sales group manufactures and sells integrated systems and equipment for rotating and handling pipe on offshore and land drilling rigs; a complete line of conventional drilling rig tools and equipment, including pipe handling tools, hoisting equipment and rotary equipment; pressure control and motion compensation equipment; derricks and rig substructures; and flow devices. Customers include major oil and gas companies, independent producers, national oil companies, oilfield supply stores, and onshore and offshore drilling contractors.
The Tubular Services group provides internal coating products and services, inspection and quality assurance services for oil country tubular goods, including drillpipe, production tubulars and flowlines. Additionally, this group includes the sale and rental of proprietary equipment used to inspect tubular products at steel mills, and the design, manufacture and sale of corrosion-resistant high pressure fiberglass tubular goods. The Tubular Services group also provides technical inspection services and quality assurance services for in-service pipelines used to transport oil and gas. Customers include major oil and gas companies, independent producers, national oil companies, drilling contractors, oilfield supply stores, industrial plant operators and steel mills.
The Drilling Services group sells and rents technical equipment used in, and provides services related to, the separation and management of drill cuttings (solids) from fluids used in the oil and gas drilling processes (Solids Control). The Drilling Services group also includes the sale and rental of data collection and monitoring systems used to manage the drilling process on site (Rig Instrumentation). Customers include major oil and gas companies, independent producers, national oil companies and drilling contractors.
The Coiled Tubing & Wireline Products group designs, manufactures, and sells highly-engineered coiled tubing and related equipment, related pressure control equipment, pressure pumping, wireline and related tools to companies engaged in providing oil and gas well drilling, completion and remediation services. Customers include major oil and gas coiled tubing service companies, as well as major oil companies and independent producers.
1
The following table sets forth the contribution to the Company’s total revenues of its four operating groups:
Years Ended December 31, | |||||||||
2001 | 2000 | 1999 | |||||||
(in thousands) | |||||||||
Drilling Equipment Sales | $ | 395,550 | $ | 283,360 | $ | 504,245 | |||
Tubular Services |
| 352,624 |
| 248,099 |
| 194,929 | |||
Drilling Services |
| 314,272 |
| 250,229 |
| 202,518 | |||
Coiled Tubing & Wireline Products |
| 205,363 |
| 84,927 |
| 74,156 | |||
Total | $ | 1,267,809 | $ | 866,615 | $ | 975,848 | |||
Influence of Oil and Gas Activity Levels on the Company’s Business
The oil and gas industry in which the Company participates has historically experienced significant volatility. Demand for the Company’s services and products depends primarily upon the general level of activity in the oil and gas industry worldwide, including the number of drilling rigs in operation, the number of oil and gas wells being drilled, the depth and drilling conditions of these wells, the volume of production, the number of well completions and the level of well workover activity. Oil and gas activity is heavily influenced by, among other factors, oil and gas prices worldwide. High levels of drilling and well-remediation activity spur direct demand for the Company’s products and services used to drill and remediate oil and gas wells, particularly in Tubular Services and Drilling Services. Additionally, high levels of oil and gas activity increase cash flows for drilling contractors and well-remediation oilfield service contractors to reinvest in capital equipment which the Company sells through its Drilling Equipment Sales and Coiled Tubing & Wireline Products groups.
Drilling and workover activity can fluctuate significantly in a short period of time, particularly in the United States and Canada. The willingness of oil and gas operators to make capital expenditures to explore for and produce oil and natural gas will continue to be influenced by numerous factors over which the Company has no control, including: the ability of the members of the Organization of Petroleum Exporting Countries to maintain oil price stability through voluntary production limits of oil; the level of oil production by non-OPEC countries; worldwide demand for oil; the supply and demand for natural gas; general economic and political conditions; costs of exploration and production; and the availability of new leases and concessions and governmental regulations regarding, among other things, environmental protection, taxation, price controls and product allocations.
Low petroleum prices adversely affected the Company’s business in the second half of 1998 and throughout 1999 as drilling and well remediation activity declined. The Company’s overall revenues grew in 1998, but declined steadily through 1999 and 2000 as the Company completed orders for Drilling Equipment Sales placed in 1997 and early 1998. Strengthening oil and gas prices in late 1999 and 2000 led to recoveries in the Company’s Tubular Services and Drilling Services groups as drilling and well remediation activity rose during the period. Drilling Equipment Sales and Coiled Tubing & Wireline Products revenues began to rise in late 2000 as drilling contractors and well service companies began to invest in new capital equipment following the higher levels of oilfield activity in 2000. Drilling activity began to decline in mid-2001 due to lower oil and gas prices. The Company’s Drilling Services and Tubular Services revenue began to decline in late 2001, and backlog levels for the Company’s Drilling Equipment Sales and Coiled Tubing Wireline Products divisions also began to decline in late 2001, as a result.
The Drilling Process
Oil and gas wells are usually drilled by a drilling rig using a bit attached to the end of drill stem made up of 30-foot joints of drill pipe. Using the conventional rotary drilling method, the drill stem is turned from the rotary table (the revolving or spinning section of the floor) of the drilling rig by torque applied to the “kelly” (a square or hexagonal section of pipe located at the top of the drill stem) by means of the master bushing and kelly
2
bushing. A kelly bushing is an adapter that connects the kelly to the rotary table, which in turn provides rotating force that rotates the drill pipe. A master bushing is a general purpose adapter that connects the rotary table to a range of types of bushings, including kelly bushings. A master bushing is used when a number of different bushings are required during the drilling process.During the drilling process heavy fluids (“drilling muds”) are pumped down through the drill stem and forced out through the bit. The drilling mud returns to the surface through the hole area surrounding the drill stem, carrying with it the cuttings drilled out by other specialized equipment. The cuttings are removed from the mud by a solids control system which can include shakers, centrifuges and the like and disposed of in an environmentally sound manner. The solids control system permits the mud to be continuously recirculated back into the hole. The drilling mud also serves to contain pressure surges of gas, oil or water (“kicks”) that may intrude into the borehole from the formation. Corrosive fluids may be in the formation or in materials used in the drilling process. Accordingly, it is prudent for operators to protect the expensive drill stem from such corrosive fluids, and to inspect and assess the integrity of the drill pipe from time to time.
As the hole depth increases, the kelly must be removed frequently so that additional 30-foot joints of pipe can be added to the drill stem, which through this process may be assembled into lengths in excess of six miles. When the bit becomes dull, the entire drill stem is pulled out of the hole and disassembled, the disconnected sections of pipe are set aside or “racked,” the old bit is replaced and the drill stem is reassembled and lowered back into the hole (a process called “tripping”). During drilling and tripping operations, tool joints must be screwed together and tightened (“spun in” and “made up”), and loosened and unscrewed (“broken out” and “spun out”). When the hole has reached certain depths, all of the drill pipe is pulled out of the hole and larger diameter pipe known as casing is lowered into the hole and cemented in place in order to protect against collapse and contamination of the hole. The integrity of the casing is typically assessed before it is lowered into the hole.
The raising and lowering of the drill stem while drilling or tripping, and the lowering of casing into the wellbore (the open hole of the well), are accomplished with the rig’s hoisting system. A conventional hoisting system is a block and tackle mechanism, and the drilling rig’s derrick must have sufficient structural integrity to support the entire weight of the drill stem or casing string.
During the drilling process it is possible for formation fluids, such as natural gas, water or oil, to get into the wellbore, creating additional pressure which, if not controlled, could lead to a “blowout” of the well. A blowout is an uncontrolled flow of fluids into the well or to the surface of the well. To prevent blowouts, a series of high-pressure valves known as blowout preventers (“BOPs”) are positioned at the top of the well and, when activated, form pressure tight seals which prevent the escape of fluids. When closed, conventional BOPs prevent normal rig operations and are activated only if drilling mud and normal well control procedures cannot safely contain the pressure. BOPs have been designed to contain pressure of up to 15,000 psi.
After the well has reached its total depth and the final section of casing has been set, the drilling rig is moved off of the well and the well is prepared to begin producing oil or gas in a process known as “well completion.” Well completion usually involves running production tubing concentrically in the casing. Due to the corrosive nature of many produced fluids, this production tubing is often coated, or constructed of corrosion resistant composite materials. From time to time, a producing well may undergo workover procedures to extend its life and increase its production rate. Frequently coiled tubing units or wireline units are used to accomplish certain formation stimulations or well completions. Coiled tubing is a recent advancement in petroleum technology consisting of a continuous length of reeled tubing which can be injected concentrically into the production tubing all the way to the bottom of most wells. It permits many operations to be performed without disassembling the production tubing, and without curtailing the production of the well. Wireline winch units are devices which utilize single-strand or multistrand wires used for well-intervention operations, such as lowering tools and transmitting data.
Drilling Equipment Sales Group
The Company has a long tradition of pioneering innovations such as the top drive and automatic pipe handling systems which improve the efficiency, safety, and cost of drilling operations. The Drilling Equipment
3
Sales group designs, manufactures and sells a wide variety of top drives (discussed below), automated pipe racking systems, motion compensation systems, rig controls, BOPs, handling tools, drawworks (a device used to raise and lower the drill pipe), risers, rotary tables, and other drilling equipment for both the onshore and offshore markets, and is a leader in the development of innovative drilling systems. A riser is a steel conduit used in offshore drilling that runs from the drilling rig on the water’s surface to the seafloor, allowing drill pipe and other tools to be passed through it to the well. Based on its supply of drilling equipment for most of the newly-constructed harsh environment offshore drilling rigs over the past few years, the Company believes it is the worldwide market leader in several of these product categories. During 2001, the Company also emphasized the land rig market and as a result saw a larger portion of its drilling equipment sales business related to onshore drilling rigs. The Drilling Equipment Sales group sells directly to drilling contractors and oil companies. Demand for its products, several of which are described below, is strongly dependent upon capital spending plans by oil and gas companies and drilling contractors.
Top Drives. The Top Drive Drilling System (“TDS”), originally introduced by Varco in 1982, significantly alters the traditional drilling process. Using the TDS, the drill stem is rotated from its top, rather than by the aforementioned rotary table, by means of a large electric motor. This motor is affixed to rails installed in the derrick and traverses from near the top of the derrick to the rig floor as the drill stem penetrates the earth. Therefore, the TDS eliminates the use of the conventional rotary table for drilling. Components of the TDS also are used to connect additional lengths of pipe to the drill stem during drilling operations.
The TDS combines elements of pipe handling tools, as well as hoisting and rotary equipment, in a single system. During drilling operations, elements of the TDS perform functions such as spinning-in and making-up tool joints. It also incorporates a drill pipe elevator, providing the capability to maneuver a stand of pipe into position to be added to the drill string when drilling, or to hold and hoist the entire drill stem. Drilling with a TDS provides several advantages over conventional drilling. It enables drilling with three joints of drill pipe, often reducing by two-thirds the time spent in making connections of drill pipe. In addition, it facilitates “horizontal” and “extended reach” drilling (the practice of drilling wells which deviate substantially from vertical) by providing the ability to rotate the pipe as it is removed from, or replaced into, the hole, thus reducing friction and the incidence of pipe sticking. This can often dramatically reduce drilling “trouble costs”. Trouble costs are costs incurred as a result of unanticipated complications while drilling a well. These costs are often referred to as contingency costs during the planning phase of a well. The TDS also increases the safety of drilling operations.
The TDS has demonstrated substantial economic advantages. Users of the system report reductions in drilling time ranging up to 40%. By facilitating extended reach drilling, the TDS increases the area which can be drilled from a given location, such as a fixed platform or man-made island. Thus, the production from a given reservoir of oil can be increased, and the number of costly fixed platforms required to develop the field can be minimized. The TDS has evolved continuously since its initial introduction. Today, the Company’s top drive product line includes several models, each designed to satisfy specific customer requirements.
Pipe Racking Systems. Pipe racking systems are used to handle drill pipe, casing, tubing and other types of pipe (collectively, “tubulars”) on a drilling rig. Vertical pipe racking systems move drill pipe and casing between the well and a storage (“racking”) area on the rig floor. Horizontal racking systems are used to handle tubulars while stored horizontally (for example, on the pipe deck of an offshore rig) and transport it up to the rig floor and raise it to a vertical position from which it may be passed to a vertical racking system.
Mechanical vertical pipe racking systems greatly reduce the manual effort involved in pipe handling. The Pipe Handling Machine (“PHM”), introduced by Varco in 1985, provides a fully automated mechanism for handling and racking of drill pipe and drill collars during drilling and tripping operations. It incorporates the spinning and torquing functions of the Automated Roughneck with the automatic hoisting and racking of disconnected joints of pipe. These functions are integrated via computer controlled sequencing, and the Pipe Handling Machine is operated by a person in an environmentally secure cabin. The Automated Roughneck is an automated microprocessor-controlled version of the Iron Roughneck, which was originally introduced by Varco
4
in 1976. An Iron Roughneck is an automated device that makes pipe connections on the rig floor and requires less direct involvement of rig floor personnel in potentially dangerous operations.
Vertical pipe racking systems are used predominantly on offshore rigs and are found on almost all floating rigs. Horizontal pipe racking systems were introduced by Varco in 1993. They include the Pipe Deck Machine (“PDM”), which is used to manipulate and move tubulars while stored in a horizontal position; the Pipe Transfer Conveyor (“PTC”), which transports sections of pipe to the rig floor; and a Pickup Laydown System (“PLS”), which raises the pipe to a vertical position for transfer to a vertical racking system. These components may be employed separately, or incorporated together to form a complete horizontal racking system, known as the Pipe Transfer System (“PTS”).
Hoisting systems are used to raise or lower the drill stem while drilling or tripping, and to lower casing into the wellbore. During 1999, Varco introduced its first “Automated Hoisting System” (“AHS”), which uses an AC-powered motor and a braking system that offers precise proportional control. The AHS automates the repetitive hoisting and drilling operations through the user-friendly, touch-screen Electronic Driller interface. The AHS is smaller and lighter than conventional hoisting systems. The Company received its first order for an AHS in 2000 and delivered the first AHS in 2001.
Blow-out Preventers. BOPs are devices used to seal the space (“annulus”) between the drill pipe and the borehole to prevent an uncontrolled flow of formation fluids and gases. The Drilling Equipment Sales group manufactures three types of BOPs under the Shaffer brandname. Ram and annular BOPs are back-up devices and are activated only if other techniques for controlling pressure in the wellbore are inadequate. When closed, these devices prevent normal rig operations. Ram BOPs seal the wellbore by hydraulically closing rams (thick heavy blocks of steel) against each other across the wellbore. Specially designed packers seal around specific sizes of pipe in the wellbore, shear pipe in the wellbore or close off an open hole. Annular BOPs seal the wellbore by hydraulically closing a rubber packing unit around the drill pipe or kelly or by sealing against itself if nothing is in the hole. The rotating BOP allows operators to drill or strip into or out of the well at low pressures without interrupting normal operations.
Varco expanded its BOP line in 1995 with the introduction of a system for achieving Pressure Control While Drilling (PCWD®). This new BOP allows normal drilling operations to proceed while controlling pressures up to 2,000 psi, and will operate as a normal spherical BOP at pressures up to 5,000 psi.
In 1998 Varco introduced the NXT® ram type BOP which eliminates door bolts, providing weight and space savings. Its unique features make subsea operation more efficient through faster ram configuration changes without tripping the BOP stack.
The Company sells conventional BOP control systems under the registered trademark Koomey®. The Koomey control system is hydraulically activated and is used to operate BOPs and associated valves remotely for both land systems and offshore systems. With the recent increase in deep-water drilling depths, traditional hydraulic control systems are inadequate to activate BOPs, which rest on the ocean floor and may be 5,000 feet or more below the surface. In 1997, Varco introduced the IVth Generation MUX, an electronic control system designed specifically for deep-water applications. In 2001, the Company acquired technology from Maris International related to a continuous circulation device the Company hopes to commercialize.
Motion Compensation Systems. The Drilling Equipment Sales group sells motion compensation equipment under the registered trademark Rucker™. Motion compensation equipment stabilizes the bit on the bottom of the hole, increasing drilling effectiveness of floating offshore rigs by compensating for wave and wind action. This group also manufactures tensioners, which provide continuous reliable axial tension to the marine riser pipe (larger diameter pipe which connects floating drilling rigs to the well on the ocean floor) and guide lines on floating drilling rigs, tension leg platforms and jack-up rigs. A jack-up rig is a self-contained combination drilling rig and floating barge, fitted with long support legs that can be raised or lowered independently of each other. An
5
important product extension in 1996 was the Riser Recoil System, which provides a safe disconnect when the floating rig encounters an unanticipated need to leave location.
Pipe Handling Tools. The Company’s pipe handling tools are designed to enhance the safety, efficiency and reliability of pipe handling operations. Many of these tools have provided innovative methods of performing the designated task through mechanization of functions previously performed manually. The Drilling Equipment Sales group manufactures various tools used to grip, hold, raise, and lower pipe, and in the making up and breaking out of drill pipe, workstrings, casing and production tubulars including spinning wrenches, manual tongs, torque wrenches and kelly spinners. The spinning wrench is a tool used to screw together and unscrew joints of drill pipe. Manual tongs are used to make up or break out tool joints, while the torque wrench is a hydraulically powered device which performs this function with enhanced safety and precision. The kelly spinner is a pneumatically or hydraulically powered tool used to connect and disconnect the kelly to and from the drill stem as additional lengths of pipe are added while drilling.
The Drilling Equipment Sales group also manufactures other tools used in various pipe handling functions. Slips are gripping devices which hold pipe or casing in suspension while in the hole, and they may be either manual, spring or hydraulically operated. Other products, which include safety clamps, casing bushings and casing bowls, are used to hold and guide drill pipe or casing while in the hole. Safety clamps prevent tool strings from being dropped down the well accidentally if the devices securing the string lose their grip. A casing bushing is an adapter used in the rotary table when casing is being inserted into the well to ensure that the casing is centered in the hole, which is critical to the well being cemented properly. A casing bowl secures and seals the upper end of the casing.
Rotary Equipment. Rotary equipment products consist of kelly bushings and master bushings. The kelly bushing applies torque to the kelly to rotate the drill stem and fits in the master bushing which is turned by the rotary table on the floor of the rig. The Drilling Equipment Sales group produces kelly bushings and master bushings for most sizes of kellys and makes of rotary tables.
In 1998, Varco introduced the Rotary Support Table for use on rigs with Top Drive Drilling Systems. The Rotary Support Table is used in concert with the TDS to completely eliminate the need for the larger conventional rotary table.
Rig Controls. Drilling consoles, and recently, the V-ICIS™, are typically sold as an integral part of a new rig, or as a major upgrade component for an existing rig. In the United States and Canada, most other drilling instrumentation products are usually rented to the drilling contractor or oil company when necessary, and are therefore not permanently installed on the rig. The Company rents this type of equipment within its Drilling Services group. Internationally, nearly all instrumentation equipment is sold to the rig owner and becomes a permanent part of the drilling rig.
A significant portion of the sales of Drilling Equipment Sales group is in spare and replacement parts. The Company conducts Drilling Equipment manufacturing operations at facilities across North America and Europe, and maintains sales and service offices in most major oilfield markets. The Company expanded its market presence in Norway when it acquired its agent, Scana IOS Desco AS, in December 2000.
Derricks and substructures. The Company began offering design, fabrication and repair services for derricks and substructures through its acquisition of Morinoak International Ltd. in September 2001. Through Morinoak International, the Company operates engineering and fabrication facilities in Great Yarmouth, England and Aberdeen, Scotland. Morinoak’s service offerings include modification of existing drilling rigs to accept top drives and pipe handling equipment. It also refurbishes, repairs and fabricates structural components from both land and offshore rigs.
The products of the Drilling Equipment Sales group are sold in highly competitive markets and its sales and earnings can be affected by competitive actions such as price changes, new product development or improved
6
availability and delivery. The group’s primary competitors are Hydralift AS, a Norwegian company, National-Oilwell, Inc., Cooper Cameron Corporation, Hydril Company, Stewart and Stevenson Service, Inc., DenCon Oil Tools, Weatherford International, Inc., Aker Maritime AS, Tesco Corporation, and Canrig, a division of Nabors Industries.
Tubular Services Group
The Company is a leading provider of a variety of tubular services to oil and gas producers, drilling contractors, well-remediation contractors, pipeline operators, and tubular manufacturers and distributors. The Tubular Services group provides tubular inspection services for drillpipe, casing, production tubing, and line pipe at drilling and workover rig locations, at pipe yards owned by its customers, at steel mills and processing facilities manufacturing tubular goods, and at pipe yard facilities which it owns. This group also provides for the internal coating of tubular goods at coating plants worldwide, including a plant opened in Navasota, Texas in 1998, and through licensees in certain locations. The Company operated 11 tubular coating plants worldwide in 2001, and opened a twelth coating plant in the Far East in early 2002. The Company believes it is the leading provider of oil country tubular goods inspection and internal tubular coating services worldwide. Additionally, the Company designs, manufactures and sells high pressure fiberglass tubulars for use in corrosive applications. The Tubular Services group also provides in-place inspection of oil, gas and product transmission pipelines through its application of instrumented survey tools (“smart pigs”) which it engineers, manufactures and operates.
The Company’s customers rely on tubular inspection services to avoid failure of tubing, casing, flowlines, pipelines and drillpipe. Such tubular failures are expensive and in some cases catastrophic. The Company’s customers rely on internal coatings of tubular goods to prolong the useful lives of tubulars and to increase the volumetric throughput of in-service tubular goods. The Company’s customers sometimes use fiberglass tubulars in lieu of conventional steel tubulars, due to the corrosion-resistant properties of fiberglass. Tubular inspection and coating services, and fiberglass tubulars, are used most frequently in operations in high-temperature, deep, corrosive oil and gas environments. In selecting a provider of tubular inspection and tubular coating services, oil and gas operators consider such factors as reputation, experience, technology of products offered, reliability and price. Following its December 2000 acquisition of the assets of Smith Fiberglass Products and its 2001 acquisition of the assets of Fibercast, the Company believes it is now the largest provider of fiberglass tubulars to oilfield applications worldwide.
Tubular Corrosion Control. The Company develops, manufactures and applies its proprietary tubular coatings, known as Tube-Kote® coatings, to new and used tubulars. Tubular coatings help prevent corrosion of tubulars by providing a tough plastic shield to isolate steel from corrosive oilfield fluids such as CO2, H2S and brine. Delaying or preventing corrosion extends the life of existing tubulars, reduces the frequency of well remediation and reduces expensive interruptions in production for oil and gas producers. In addition, coatings are designed to increase the fluid flow rate through tubulars by decreasing or eliminating paraffin and scale build-up, which can reduce or block oil flow in producing wells. The smooth inner surfaces of coated tubulars often increase the fluid through-put on certain high-rate oil and gas wells.
The Company has a history of introducing new coating products that are custom-engineered to address increasingly corrosive environments encountered in oil and gas drilling and production operations. In 1998, the Company introduced TK®Liner, a fiberglass liner product which offers the strength of steel tubing and the corrosion resistance of fiberglass, and which supplements its traditional plastic coating lines. The Company’s reputation for supplying quality internal coatings is an important factor in its business, since the failure of coatings can lead to expensive production delays and premature tubular failure.
In 1997, the Company acquired Fiber Glass Systems, a leading provider of high pressure fiberglass tubulars used in oilfield applications. Fiber Glass Systems has manufactured fiberglass pipe since 1968 under the name “Star®,” and was the first manufacturer of high-pressure fiberglass pipe to be licensed by the API in 1992. The
7
Company acquired two fiberglass tubing manufacturing facilities in the U.S. and one in China from A.O. Smith in December 2000 and acquired another U.S. fiberglass tubing manufacturing facility from Fibercast in July 2001, which significantly expanded its manufacturing capabilities and product lines. Like coated tubulars, fiberglass pipe is used to guard against corrosive fluids produced in the oilfield and for use in other corrosive industrial applications.
Tubular Inspection. Newly manufactured pipe sometimes contains serious defects that are not detected at the mill. In addition, pipe can be damaged in transit and during handling prior to use at the well site. As a result, exploration and production companies often have new tubulars inspected before they are placed in service to reduce the risk of tubular failures during drilling, completion, or production of oil and gas wells. Used tubulars are inspected by the Company to detect service-induced flaws after the tubulars are removed from operation. Used drill pipe and used tubing inspection programs allow operators to replace defective lengths, thereby prolonging the life of the remaining pipe and saving the customer the cost of unnecessary tubular replacements and expenses related to tubular failures.
The Tubular Services group’s tubular inspection services employ all major non-destructive inspection techniques, including electromagnetic, ultrasonic, magnetic flux leakage and gamma ray. These inspection services are provided both by mobile units which work at the wellhead as used tubing is removed from a well, and at fixed site tubular inspection locations. The group provides an ultrasonic inspection service for detecting potential fatigue cracks in the end area of used drill pipe, the portion of the pipe that traditionally has been the most difficult to inspect. Tubular inspection facilities also offer a wide range of related services, such as API thread inspection, ring and plug gauging, and a complete line of reclamation services necessary to return tubulars to useful service, including tubular cleaning and straightening, hydrostatic testing and re-threading.
In 1998, the Company acquired three tubular services businesses to enhance its competitive positions in Norway, Egypt, and the west coast of the United States. Additionally, these acquisitions provided opportunities to achieve consolidation cost savings. In 1999, the Company completed acquisitions of Geo-Ray Oilfield Inspections Ltd. in Canada, and the tubular services business of AGR Services AS in Floro, Norway. In 2001, it acquired the assets of Servizi Ispettiv, a small tubular services business in Italy, and in early 2002, it acquired the assets of A&A Tubular Inspection in California.
In addition to its new and used tubular inspection and reclamation services, the Company also offers a comprehensive proprietary tubular inventory management system (TDSTM) which permits the real-time tracking of customer’s tubular inventories within the Company’s facilities. The system permits customers to remotely access and monitor tubular inspection and coating progress.
The Company has pioneered many tubular inspection technologies used in the oilfield, and continues to expand its product offering through innovation and acquisition. In 1996, the Company installed its first proprietary high-speed full-body ultrasonic tubular inspection unit (Truscope®). The new service provides 100% ultrasonic coverage of tubulars at a rate of up to 200 feet per minute. In 1997, the Company began offering a proprietary, patented external tubular connection integrity test, the ISO-Gator,TM for use at the rig site. The technology was obtained through the Company’s acquisition of the operating assets of Gator Hawk, Inc. In 1998, the Company introduced a new coiled tubing inspection service with its electromagnetic CT Scope®.
Mill Systems and Sales. The Company engineers and fabricates inspection equipment for steel mills, which it sells and rents. The equipment is operated by steel mills and is used for quality control purposes to detect transverse, longitudinal and three-dimensional defects in the pipe during the high-speed manufacturing process. Each piece of mill inspection equipment is designed to customer specifications and is installed and serviced by the Company. Since 1962, the Company has installed more than 80 units worldwide, in most major steel mills. Equipment is manufactured at the Company’s Houston, Texas and Celle, Germany facilities. Revenue for Mill Systems and Sales fluctuates significantly from year to year due to the timing of negotiating large domestic and export sales contracts, arranging financing and manufacturing equipment.
8
Pipeline Inspection. In-place inspection services for oil and gas pipelines identify anomalies in the pipelines without removing or dismantling the pipelines or stopping the product flow, giving customers a convenient and cost-effective method of identifying potential defects in pipelines. The Tubular Services group inspects pipelines by launching a sophisticated survey instrument into the pipeline. Propelled by the product flow, the instrument uses electromagnetics, ultrasonics, and mechanical measurements received on digital and analog media to monitor the severity and location of internal and external pitting-type corrosion as well as other mechanical anomalies in the pipeline, providing a basis for evaluation and repair by the customer. Once the test is complete, the survey instrument is returned to the Company, refurbished and used for future pipeline inspections.
Management believes the major competitive factors for Pipeline Services are reputation for quality, service, reliability of obtaining a successful survey on the first run, product technology, price, and technical support on survey interpretation. Demand for the Company’s pipeline services is somewhat dependent on commodity prices, which affects funds available for discretionary pipeline inspection and maintenance expenditures by many pipeline operators. This dependence is most pronounced in international markets. Additionally, significant consolidation in the pipeline industry has caused many pipeline operators to defer inspections in recent years as they re-evaluate their pipeline maintenance programs following mergers and acquisitions. Management believes there are growth opportunities for the Company’s Pipeline Services due to the aging of the worldwide pipeline network, and construction of new pipelines. U.S. regulatory inspection requirements and an extensive pipeline infrastructure in Eastern Europe are additional industry factors expected to contribute to the growth of the Company’s Pipeline Services. Catastrophic pipeline failures in the U.S. in recent years have prompted regulators to require more stringent pipeline inspection, which may increase the demand for pipeline inspection services. Additionally, management believes that the Company’s new digital TruRes® inspection technology and other new software and survey products will provide growth opportunities. The TruRes® technology applies advanced digital computer technology and other advancements within the body of the inspection tool to provide greater measurement sampling density and pipe-body coverage. In 2001, the Company acquired certain assets of Geodz, Inc., a software engineering firm, to enhance its pipeline position survey software.
The Tubular Services group’s customers include almost all major oil and gas companies, large and small independent producers, national oil companies, drilling contractors, oilfield supply stores, pipeline operators and steel mills. The Company’s competitors in Tubular Services include, among others, ICO Inc., Ameron International Corp, Pipeline Integrity International Ltd., and ShawCor Ltd. In addition, the Tubular Services group competes with a number of smaller regional competitors in tubular inspection. Certain foreign jurisdictions and government-owned petroleum companies located in some of the countries in which this group operates have adopted policies or regulations which may give local nationals in these countries certain competitive advantages. Within the Company’s corrosion control products, certain substitutes such as non-metallic tubulars, inhibitors, corrosion resistant alloys, cathodic protection systems, and non-metallic liner systems also compete with the Company’s products.
Drilling Services Group
The Company’s Drilling Services group is engaged in the provision of highly-engineered equipment, products and services which separate and manage drill cuttings produced by the drilling process (“Solids Control Services”). Drill cuttings are usually contaminated with petroleum or drilling fluids, and must be disposed of in an environmentally sound manner. Additionally, efficient separation of drill cuttings enhances the drilling effectiveness of the drilling fluids for re-use. The Company believes it’s Brandt® business is the market leader in the provision of solids control services to the oil and gas drilling industry worldwide. The Drilling Services group also rents and sells proprietary drilling rig instrumentation packages which monitor various processes throughout the drilling operation, under the name MD/Totco. The group’s rig instrumentation packages collect and analyze data through both analog and digital media, enabling rig personnel to maintain safe and efficient drilling operations. The Company believes it is the largest provider of drilling rig instrumentation packages worldwide.
Solids Control. The Drilling Services group uses a variety of technologies to separate drill cuttings from drilling fluid, and to further transport, dry and refine drill cuttings for safe disposal. The Company believes the
9
regulatory and industry trends towards minimizing the environmental impact of drilling operations in a number of environmentally sensitive oil and gas producing regions will lead to greater demand for solids control products and closed loop drilling systems. A closed loop drilling system is a solids control system in which the drilling mud is reconditioned and recycled throughout the drilling process on the rig itself. The Company further believes the trend towards more technically complex drilling, including highly deviated directional wells and slim-hole completions, will favorably impact the demand for solid controls technology because of its ability to reduce costly downhole problems. As environmental constraints are increased and as awareness of environmental protection grows, the Company believes that its drill cuttings separation and treating processes will find increased demand.
The Company has a history of introducing new solids control products and services obtained both through its internal development and through acquiring or licensing technologies from others. The Company acquired the Gumbo Chain from Nu-Tec, Inc. in 1997, a product to remove sticky shale or “gumbo,” which is encountered in certain geologic environments, from drilling fluid. In 1998, the Company initiated operations with a proprietary unit which removes hydrocarbons from drill cuttings using heat, a process called “Thermal Desorption”. The processed cuttings are rendered inert and can be disposed of with minimal environmental impact. The Company commenced operation of a second drill cuttings thermal desorption unit in the first quarter of 1999 and expects to commence operations on its third unit in 2002. The Company began offering the VSM 300 shale shaker, a high performance, high priced machine, in 1996. A shale shaker is the primary device on an oil rig for removing drill solids from drilling mud. The VSM 300 was the first shale shaker which offered a balanced elliptical vibratory motion, which improves cuttings conveyance and reduces oil on cuttings. The Company also introduced its new Cobra® shale shaker in 1998. The Cobra® has a small footprint and a lightweight design, and is priced to compete in the more price-sensitive segment of the market. The Company began offering the King Cobra shale shaker in 1999. The King Cobra is approximately one third larger than the Cobra Shaker, and also targets the price sensitive segment of the drilling market. The Company acquired M.S.D. Inc. in 1998 in order to enhance its cuttings slurrification and injection capabilities. In 1999, the Company acquired Manufacturas Rowi, C.A. (Rowica), a Venezuelan solids control company, and the solids control assets of Newpark Resources, Inc. (“Newpark”). In early 2001, the Company acquired certain assets of Angelle Construction, Inc. to enhance its cuttings transport business.
The Drilling Services group manufactures conventional and linear motion shale shakers, high speed and conventional centrifuges, screens, desanders (which remove large drill solids from drilling mud), desilters (which remove small drill solids from drilling mud), degassers (which remove air and gasses from drilling mud) and closed loop drilling fluids systems at its facilities in Conroe, Texas; Houston, Texas; and Aberdeen, Scotland. The group markets solids control equipment under the Brandt® brand name. For the year ended December 31, 2001, approximately 42% of the Drilling Services group’s solids control equipment revenue was generated from the sale of solids control equipment and inventory, and approximately 58% of such revenue was generated from rentals and services.
In 1999, the Company entered into an alliance agreement with Newpark under which the Company, subject to certain conditions, became the exclusive provider of Solids Control Products and Services to Newpark in the United States. The alliance agreement further provides that Newpark, subject to certain conditions, is the exclusive provider of oilfield waste services to the Company in the Gulf Coast market.
Drilling Rig Instrumentation. The Drilling Services group’s rig instrumentation systems provide drilling rig operators real time measurement and monitoring of critical parameters required to improve rig safety and efficiency. Systems are typically comprised of several sensors placed throughout the rig to measure parameters such as weight on bit, hookload, standpipe pressures, mud pump strokes, drilling mud levels, torque, and others, all networked back to a central command station for review, recording and interpretation. Additionally, the rig instrumentation packages typically provide multiple CRT screens around the rig for various rig personnel to perform individual jobs more effectively, and cameras for certain areas to permit remote monitoring. The Company offers proprietary touch-screen displays, interpretive software, and data archival and retrieval
10
capabilities. In 1999, the Company introduced its RigSense™ product, which combines leading hardware and software technologies into an integrated drilling rig package. It recently completed a successful test to permit access of drilling data from offsite locations, which will enable company personnel to monitor drilling operations from an office environment, through a secure link. In 2001, the Company completed the acquisitions of Chimo Equipment Ltd. in Canada; Alberta Instruments Ltd. in Canada; Adair Supply & Rentals, Inc. in Corpus Christi, TX; and Wagner Instrumentation Inc. in Houston, TX; which were all engaged in drilling rig instrumentation business.
The group’s customers for Drilling Services include almost all major oil and gas companies, large and small independent producers, national oil companies, and drilling contractors. Competitors in Drilling Services include Smith International (“SWACO”); Derrick Manufacturing Corp.; Oil Tools Pte. Ltd; National Oilwell Inc.; Petron Industries, Inc.; Epoch, a division of Nabors Industries; Pason Systems, Inc., a Canadian company and a number of regional competitors. The Company’s Drilling Services group operates in highly competitive markets. Management believes that on-site service is becoming an increasingly important competitive element in the Drilling Services market. Management believes that, in addition to on-site services, the principal competitive factors affecting its Drilling Services business are performance, quality, reputation, customer service, product availability, breadth of product line and price.
Coiled Tubing & Wireline Products Group
The Company’s Coiled Tubing & Wireline Products group sells capital equipment and consumables to most of the major oilfield coiled tubing and wireline remediation and drilling service providers. The Company believes it is the world’s leading designer and manufacturer of coiled tubing units, coiled tubing pressure control equipment and wireline pressure control equipment and one of the leading manufacturers of wireline units used in oil and gas well remediation, completion and drilling operations. The Company, through its January 2001 acquisition of Quality Tubing, Inc., also manufactures steel coiled tubing used by well remediation contractors and oil and gas producers. The Company believes it is the second largest producer of coiled tubing worldwide. Demand for the group’s Coiled Tubing & Wireline Products is strongly dependent upon the capital spending plans of coiled tubing and wireline service companies, and the general level of well remediation activity.
Coiled Tubing Products. Coiled tubing consists of flexible steel tubing manufactured in a continuous string and spooled on a reel. It can extend several thousand feet in length and is run in and out of the wellbore at a high rate of speed by a hydraulically operated coiled tubing unit. A coiled tubing unit is typically mounted on a truck or skid (steel frames on which portable equipment is mounted to facilitate handling with cranes or flatbed trucks) and consists of a hydraulically operated tubing reel or drum, an injector head which pushes or pulls the tubing in or out of the wellbore, and various power and control systems. Coiled tubing is typically used with sophisticated pressure control equipment which permits the operator to continue to safely produce the well. The Coiled Tubing and Wireline Products group manufactures and sells both coiled tubing units and the ancillary pressure control equipment used in these operations.
Coiled tubing provides a number of significant functional advantages over the principal alternatives of conventional drillpipe and workover pipe. Coiled tubing allows faster “tripping,” since the coiled tubing can be reeled very quickly on and off a drum and in and out of a wellbore. In addition, the small size of the coiled tubing unit compared to an average workover rig reduces preparation time at the well site. Coiled tubing permits a variety of workover and other operations to be performed without having to pull the existing production tubing from the well and allows ease of operation in horizontal or highly deviated wells. Thus, operations using coiled tubing can be performed much more quickly and, in many instances, at a significantly lower cost. Finally, use of coiled tubing generally allows continuous production of the well, eliminating the need to temporarily stop the flow of hydrocarbons. As a result, the economics of a workover are improved because the well can continue to produce hydrocarbons and thus produce revenues while the well treatments are occurring. Continuous production also reduces the risk of formation damage which can occur when the flow of fluids is stopped or isolated.
11
Currently, most coiled tubing units are used in well remediation and completion applications. The Company believes that advances in the manufacturing process of coiled tubing, tubing fatigue protection and the capability to manufacture larger diameter and increased wall thickness coiled tubing strings have resulted in increased uses and applications for coiled tubing products. For example, well operators are now using coiled tubing in drilling applications such as slim hole reentries of existing wells. The Company engineered and manufactured the first coiled tubing units built specifically for coiled tubing drilling in 1996.
There are certain limitations to the use of coiled tubing. Coiled tubing generally is made of high strength, alloy steel which wears down or fatigues over time as a result of internal pressure, acidic operating environments and normal bending cycles. Thus, operators must carefully monitor the use of the tubing. In addition, coiled tubing will buckle if the weight of the coiled tubing being conveyed in the wall becomes too great or if the tube becomes inhibited by some obstacle or irregularity in the wellbore. Buckling has not proven to be a significant obstacle in most well remediation applications, and the Company believes it will become less of an issue as a result of the availability of stronger and larger diameter coiled tubing.
Generally, the Coiled Tubing & Wireline Products group supplies customers with the equipment and components necessary to use coiled tubing, which the customers typically purchase separately. The group’s coiled tubing product line consists of coiled tubing units, coiled tubing and wireline pressure control equipment, wireline units, pressure pumping equipment, snubbing units (which are units that force tubulars into a well when pressure is contained within the wellbore), nitrogen pumping equipment and cementing, stimulation and blending equipment. The group markets its coiled tubing equipment under the Hydra Rig® brand name primarily to providers of coiled tubing drilling and workover services. The Company’s primary coiled tubing unit production facilities are located at its Hydra Rig facility in Fort Worth, Texas. In addition, the group markets coiled tubing pressure control equipment under the Texas Oil Tools® brand name and manufactures this equipment at its facility in Conroe, Texas. The Company’s 2001 acquisition of Bradon Industries added a significant manufacturing plant in Canada, where it sells equipment now under the brand name Hydra Rig Canada. It also added additional nitrogen-pumping products and technologies through its 2001 acquisition of Albin’s Enterprises in Duncan, Oklahoma. Additionally, the Company began offering its “TEM™” cementing equipment and fabricating nitrogen pumping units in Tulsa, Oklahoma, in December 1997, when it acquired Tulsa Equipment Manufacturing Company.
Wireline Products. Through its 1996 acquisitions of SSR (International) Ltd. and Pressure Control Engineering Ltd., its 1998 acquisition of Hydrolex and Eastern Oil Tools Pte. Ltd, and its 2001 acquisition of Elmar Services, Ltd., the Company believes that it has assembled one of the leading positions in the wireline unit and pressure control manufacturing business, expanded its offering of downhole coiled tubing tools and added manufacturing facilities in Poole and Aberdeen, in the United Kingdom; Perth, Australia; and Singapore.
The Company’s acquisition of Eastern Oil Tools Pte. Ltd. in June, 1998 and Elmar Services Ltd. in August, 2001 also added perforating guns to its offering of products. Additionally, the Company acquired Weston Oilfield Engineering Limited in Norwich, United Kingdom, in December 1998, which strengthened its coiled tubing unit refurbishing, servicing and spare parts business, as well as added new cryogenic nitrogen technologies.
The Company has a history of engineering new technologies and products for its Coiled Tubing & Wireline Products markets. It recently introduced the DSH “Sidedoor” Stripper/Packer, which allows packer and bushing replacement while the operator has coiled tubing in the wellbore, and the CT Slimhole BHA Jetting Tool Assembly, a small diameter jetting tool which can traverse small diameter well completion configurations.
The Company’s customers for Coiled Tubing & Wireline Products include almost all major oil and gas coiled tubing service companies, as well as major oil companies, national oil companies, and small independents. Competitors in Coiled Tubing & Pressure Control Products include Stewart & Stevenson Inc., Precision Tube Technology, Maritime Hydraulics AS, ASEP, National Oilwell Inc. and several smaller competitors.
12
2001 Acquisitions
In 2001, the Company made the following acquisitions and related transactions:
Entity/Assets/Technology | Form | Product Line | Date of Transactions | |||
Quality Tubing Inc. | Stock Purchase | Coiled Tubing & Wireline Products | January 2001 | |||
Angelle Construction Services, Inc. | Asset Purchase | Drilling Services | February 2001 | |||
Servizi Ispettivi | Asset Purchase | Tubular Services | March 2001 | |||
Chimo Equipment Ltd. | Stock Purchase | Drilling Services | March 2001 | |||
Bradon Industries Group | Stock Purchase | Coiled Tubing & Wireline Products | March 2001 | |||
GeoDZ, Inc. | Asset Purchase | Tubular Services | April 2001 | |||
Albin’s Enterprise, Inc. | Stock Purchase | Coiled Tubing & Wireline Products | May 2001 | |||
Alberta Insturment Ltd. | Stock Purchase | Drilling Services | May 2001 | |||
Maris International | Technology License | Drilling Equipment Sales | July 2001 | |||
Fibercast Inc. | Asset Purchase | Tubular Services | July 2001 | |||
Elmar Services Limited | Stock Purchase | Coiled Tubing & Wireline Products | August 2001 | |||
Wagner Instrumentation 2000, Inc. | Stock Purchase | Drilling Services | August 2001 | |||
Morinoak International Limited | Stock Purchase | Drilling Equipment Sales | September 2001 | |||
Adair Supply & Rentals | Asset Purchase | Drilling Services | October 2001 | |||
ITM | Asset Purchase | Tubular Services | October 2001 |
Quality Tubing Inc. was acquired for an aggregate cash purchase price of approximately $55,020,000. The remaining fourteen acquisitions were purchased for an aggregate price of $99,044,000, consisting of cash of $90,397,000 and notes and accrued payables of $8,647,000.
Seasonal Nature of the Company’s Business
Historically, the level of the Company’s business has followed seasonal trends to some degree, which are described below.
In past years, the Company’s Tubular Services and Drilling Services businesses in the United States realized lower activity levels during the first quarter of the calendar year due to delays in the approval of drilling budgets and weather restrictions. The Company’s tubular inspection, tubular coating, solids control, and rig instrumentation businesses in Canada typically realized high first quarter activity levels as operators took advantage of the winter freeze to help gain access to remote drilling and production areas, and then declined during the second quarter due to warmer weather conditions which resulted in thawing, softer ground, difficulty accessing drill sites, and road bans that curtailed drilling activity. In past years, Tubular Services activity in both the United States and Canada increased during the third quarter and then peaked in the fourth quarter as operators spent the remaining drilling and/or production capital budgets for the year.
The pipeline inspection portion of Tubular Services has typically experienced reduced activity during the first quarter of the calendar year. The high winter demand for gas and petroleum products in the northern states and the consequent curtailment of pipeline maintenance and inspection programs resulted in less opportunity to perform pipeline inspection during this time. During the second quarter, activity has typically begun to increase
13
and normally has continued at relatively stable levels through the end of the year as operators finished scheduled maintenance programs. Mill systems sales and industrial inspection services have had no particular seasonal trend. The timing of mill equipment sales is not easily predictable and, accordingly, revenue tends to fluctuate from quarter to quarter.
In general, Coiled Tubing & Wireline Products have experienced lower revenue in the fourth quarter due to major customers placing orders, based on their budgeting process, in the fourth quarter for delivery during the next three quarters. This process may change in the future as a major customer has changed to a continuous budgeting process and will place orders throughout the year. There can be no guarantees that this trend will continue or that any other customer will change its ordering process.
In general the Drilling Equipment Sales group has not experienced significant seasonal fluctuation. There can be no guarantee that seasonal effects will not influence future drilling equipment sales.
The Company anticipates that these seasonal trends will continue. However, there can be no guarantee that spending by the Company’s customers will continue or that other customers will remain the same as in prior years.
Marketing & Distribution Network
The Company’s products are marketed through a sales organization and a network of agents and distributors, which spans 49 countries.
The Company’s Drilling Equipment Sales customers include private and government-owned oil companies, drilling contractors, drilling rig manufacturers, rental tool companies, and supply companies, which supply oilfield products to the end users of the Company’s products.
Drilling Equipment, such as the Automated Roughneck, Top Drive Drilling System, pipe racking systems, and pressure control and motion compensation equipment, as well as the Varco integrated control and information systems (“V-ICIS”), represent significant capital expenditures and are usually sold directly to an oil company, drilling contractor or rig builder. Other drilling equipment products may be sold through supply stores or directly to government-owned oil companies or drilling contractors.
The Company’s Tubular Services customers include major and independent oil and gas companies, national oil companies, oilfield equipment and product distributors and manufacturers, drilling and workover contractors, oilfield service companies, pipeline operators, steel mills, and other industrial companies. Certain tubular inspection and tubular coating products and services often are incorporated as a part of a tubular package sold by tubular supply stores to end users. Tubular Services primarily has direct operations in the international marketplace, but operates through agents in certain markets.
The Company’s Drilling Services customers are predominantly major and independent oil and gas companies, national oil companies and drilling contractors. The Drilling Services group operates sales and distribution facilities at strategic locations worldwide to service areas with high drilling activity. The Company’s worldwide Solids Control and Instrumentation sales employees are complemented by service and engineering facilities which provide specialty repair and maintenance services to customers.
The Company’s Coiled Tubing and Wireline Products are primarily sold directly to end users through a worldwide Coiled Tubing and Wireline Products sales organization. The Company also has in place certain exclusive alliances with major oilfield service companies to provide pressure control equipment.
The Company’s foreign operations, which include significant operations in Canada, Europe, the Far East, the Middle East and Latin America, are subject to the risks normally associated with conducting business in foreign countries, including uncertain political and economic environments, which may limit or disrupt markets, restrict the movement of funds or result in the deprivation of contract rights or the taking of property without fair
14
compensation. Government-owned petroleum companies located in some of the countries in which the Company operates have adopted policies (or are subject to governmental policies) giving preference to the purchase of goods and services from companies that are majority-owned by local nationals. As a result of such policies, the Company relies on joint ventures, license arrangements and other business combinations with local nationals in these countries. In addition, political considerations may disrupt the commercial relationship between the Company and such government-owned petroleum companies. Although the Company has not experienced any significant problems in foreign countries arising from nationalistic policies, political instability, economic instability or currency restrictions, there can be no assurance that such a problem will not arise in the future. See Note 12 of the Notes to the Consolidated Financial Statements for information regarding geographic revenue information.
Research and New Product Development and Intellectual Property
The Company believes that it is a leader in the development of new technology and equipment to enhance the safety and productivity of the drilling and the well stimulation process and that its sales and earnings have been dependent, in part, upon the successful introduction of new or improved products. Additionally, the Company believes that its strong market position in its major businesses is enhanced by its leading technologies and reputation for innovation and expertise. Through its internal development programs and certain acquisitions, the Company has assembled an extensive array of technologies protected by a substantial number of trade and service marks, patents, trade secrets, and other proprietary rights.
As of December 31, 2001, the Company held a substantial number of United States patents and had patent applications pending. Expiration dates of such patents range from 2002 to 2019. As of such date, the Company also had foreign patents and patent applications pending relating to inventions covered by the United States patents. Additionally, the Company maintains a substantial number of trade and service marks and maintains a number of trade secrets.
Although the Company believes that this intellectual property has value, competitive products with different designs have been successfully developed and marketed by others. The Company considers the quality and timely delivery of its products, the service it provides to its customers and the technical knowledge and skills of its personnel to be more important than its intellectual property in its ability to compete. While the Company stresses the importance of its research and development programs, the expense and market uncertainties associated with the development and successful introduction of new products are such that there can be no assurance that the Company will realize future revenues from new products.
Engineering and Manufacturing
The manufacturing processes for the Company’s products generally consist of machining, welding and fabrication, heat treating, assembly of manufactured and purchased components and testing. Most equipment is manufactured primarily from alloy steel, and the availability of alloy steel castings, forgings, purchased components and bar stock is critical to the production and timing of shipments. Within the Drilling Equipment Sales group, automated Roughnecks, Top Drive Drilling Systems, and pipe handling systems are manufactured in Orange, California; pressure control and motion compensation equipment, riser pipe and riser tensioners are manufactured at facilities in Houston, Texas; rotating and handling tools are manufactured at the Company’s facilities in Etten-Leur, the Netherlands, and Mexicali, Mexico; and derricks and structural rig components are manufactured in Aberdeen, Scotland and Great Yarmouth, England.
The Company’s Drilling Services group manufactures or assembles the equipment and products which it rents and sells to customers, and which it uses in providing solids control. In addition to producing new solids control and instrumentation equipment and products, Drilling Services also produces spare parts for sale. Drilling Services manufactures screens used in its solids control operations and for sale to others at its New Iberia, Louisiana; Conroe, Texas; Leduc, Alberta; and Couva, Trinidad facilities; manufactures solids control equipment at its facilities in Houston, Conroe, and Aberdeen; and manufactures instrumentation equipment at its Cedar Park, Texas facility.
15
The Tubular Services group manufactures tubular inspection equipment and instrumented pipeline inspection tools at its Houston, Texas facility for resale, and renovates and repairs equipment at its manufacturing facilities in Houston, Texas; Conroe, Texas; Bordon, England; Celle, Germany; Nisku, Alberta and Aberdeen, Scotland. Fiber glass tubulars and fittings are manufactured at its San Antonio, Texas; Big Spring, Texas; Little Rock, Arkansas; Tulsa, Oklahoma and Wichita, Kansas, Harbin, China facilities, while tubular coatings are manufactured in its Houston, Texas facility, or through restricted sale agreements with third party manufacturers.
The Coiled Tubing and Wireline Products group manufactures coiled tubing units, wireline units, pressure pumping equipment, pressure control equipment and perforating guns at its Fort Worth, Texas; Conroe, Texas; Duncan, Oklahoma; Tulsa, Oklahoma; Calgary, Canada; Aberdeen, Scotland; Singapore; Perth, Australia; and Poole, England facilities.
Certain of the Company’s manufacturing facilities and certain of the Company’s products have various certifications, including, ISO 9001, API and ASME.
Raw Materials
The Company believes that materials and components used in its servicing and manufacturing operations and purchased for sales are readily available at competitive prices from numerous sources.
Backlog
Sales of the Company’s products are made on the basis of written purchase orders or contracts and, consistent with industry practice, by e-mail, fax, letter or oral commitment later confirmed by a written order. In accordance with industry practice, orders and commitments generally can be cancelled by customers at any time. However, the Company is generally entitled to cancellation fees for expenses and costs incurred prior to the cancellation of orders. In addition, orders and commitments are sometimes modified before or during manufacture of the products. The Company’s backlog is based upon anticipated revenues from customer orders that the Company believes are firm. The level of backlog at any particular time is not necessarily indicative of the future operating performance of the Company.
Backlog at December 31, 2001, 2000, and 1999 was as follows (in thousands):
December 31, | |||||||||
2001 | 2000 | 1999 | |||||||
Drilling Equipment Sales | $ | 251,531 | $ | 88,055 | $ | 55,734 | |||
Coiled Tubing & Wireline Products |
| 55,864 |
| 61,200 |
| 17,946 | |||
Total | $ | 307,395 | $ | 149,255 | $ | 73,680 | |||
The Company expects that most of the backlog will be shipped by December 31, 2002.
Environmental Matters
The Company’s manufacturing processes and its inspection, coating and solids control services routinely involve the handling and disposal of chemical substances and waste materials, some of which may be considered to be hazardous wastes. These potential hazardous wastes result primarily from the manufacturing and testing processes and the use of mineral spirits to clean pipe threads during the tubular inspection process and from the coating process, and the handling of and, in normal cases, the disposal of drilling fluids and cuttings on behalf of the drillers and/or producers.
The Company’s operations are subject to numerous local, state and federal laws and regulations, including the regulations promulgated by the Occupational Safety and Health Administration, the United States
16
Environmental Protection Agency (EPA), the Nuclear Regulatory Commission and the United States Department of Transportation. These laws and regulations include the Comprehensive Environmental Response, Compensation, and Liability Act (CERCLA), the Resource Conservation and Recovery Act (RCRA), the Clean Air Act (CAA), the Clean Water Act (CWA), the Superfund Amendments and Reauthorization Act (SARA) including SARA Title III toxic release reporting, the Safe Drinking Water Act (SDWA) and the Toxic Substance Control Act (TSCA). Management believes that the Company is in substantial compliance with these laws and regulations, and that the compliance and remedial action costs associated with these laws and regulations have not had a material adverse effect on its results of operations, financial condition or competitive position, to date.
The Company cannot predict the effect on it of new laws and regulations with respect to radioactive hazardous wastes caused by naturally occurring radioactive materials or with respect to other environmental matters. Circumstances or developments which are not currently known as well as the future cost of compliance with environmental laws and regulations could be substantial and could have a material adverse effect on the results of operations and financial condition of the Company.
CERCLA imposes liability, without regard to fault or the legality of the original conduct, for the releases of hazardous substances into the environment. Persons subject to CERCLA include the owner and operator of the disposal site or sites where the release occurred and companies that generated, disposed or arranged for the disposal of the hazardous wastes found at the site. Persons who are responsible for releases of hazardous substances under CERCLA may be subject to joint and several liability for the costs of cleaning up the resulting contamination and for damages to natural resources. It is not uncommon for neighboring landowners and other third parties to file claims for personal injury and property damage allegedly caused by the hazardous substances released into the environment.
Certain third-party owned disposal facilities used by the Company or its subsidiaries have been investigated under state and federal Superfund statutes, and the Company is currently named as a potentially responsible party for cleanup at three such sites. Although the Company’s level of involvement varies at each site, in general, the Company is one of numerous parties named and will be obligated to pay an allocated share of the cleanup costs. While it is not feasible to predict the outcome of these matters with certainty, management is of the opinion that their ultimate resolution should not result in material costs to the Company or otherwise materially and adversely affect the Company’s operations or financial position.
Pursuant to an agreement executed as part of the acquisition of the Company in 1988 from Minstar Inc. (“Minstar”), Minstar has agreed, subject to certain limitations concerning the time for submitting claims and the amount of losses to be covered as described below, to indemnify the Company with respect to all losses, liabilities, damages and expenses incurred in connection with, arising out of or resulting from the production, use, generation, emission, storage, treatment, transportation, disposal or other handling or disposition or migration of any kind of any toxic or hazardous wastes at any time prior to the closing of the 1988 acquisition date. Claims for indemnification were required to be made before May 13, 1992. Minstar is obligated to indemnify the Company for the first $1 million of losses incurred by the Company and fifty percent of losses in excess of $2 million. The Company is solely responsible for the second $1 million of losses incurred and fifty percent of losses in excess of $2 million. See “Item 3—Legal Proceedings” for a description of the indemnity to be provided by Minstar with respect to actions, suits, litigation, proceedings or governmental investigations which may also apply to certain environmental matters.
Employees
At December 31, 2001, the Company had a total of 8,651 employees (of which 1,175 were temporary employees). The Company considers its relations with its employees to be excellent and has never suffered a work stoppage or interruption due to a labor dispute.
17
ITEM 2. PROPERTIES
The following is a description of the Company’s major facilities:
Location | Description | Size (Approximate Square Feet) | Owned/Leased | Lease Termination Date | ||||
North America: | ||||||||
U.S.: | ||||||||
Kenai, Alaska | Inspection Facility (Lower Shop) | 12,000 on 10 Acres | Owned | |||||
Inspection Facility (Upper Shop) | 14,400 on 11 Acres | Leased | 06/30/03 | |||||
North Slope (Deadhorse) Alaska | Inspection, Repair & Service Center | 18,400 on 5.25 Acres | Building Owned* | 02/13/18 | ||||
Little Rock, Arkansas | Fiberglass Tubular Manufacturing Plant, R&D Lab, Administrative Offices | 262,784 on 44 Acres | Leased | 10/01/09 | ||||
Fiberglass Tubular Manufacturing Plant | 45,000 | Leased | Mo. to Mo. | |||||
Bakersfield, California | Downing St. Solids Control Facility | 7,200 on 6 Acres | Owned | |||||
Downing Street Inspection & Storage | 8,690 on 6.67 Acres | Leased | Mo. to Mo. | |||||
Fairhaven Ave. Offices & Warehouse | 13,400 on 5.14 Acres | Building Owned* | 06/02/03 | |||||
Wear St. Inspection Reclamation Yard | 5 Acres | Leased | 06/02/03 | |||||
Orange, California | Administrative Offices—743 N. Eckhoff | 35,000 | Leased | 12/31/05 | ||||
Manufacturing & Office Facility 759 N. Eckhoff | 126,000 | Owned | ||||||
Office Facility — 721 N. Eckhoff | 10,000 | Leased | 5/31/08 | |||||
Santa Paula, California | Inspection & Reclamation Facility | 8,000 on 12 Acres | Owned | |||||
Wichita, Kansas | Fiberglass Tubular Manufacturing Plant | 129,746 on 15 Acres | Owned | |||||
Amelia, Louisiana | Coating Plant, Inspection & Storage Facilities | 102,000 on 90 Acres | Building Owned* | 05/30/06 | ||||
Belle Chasse, Louisiana | Inspection & Storage Facilities | 22,500 on 4 Acres | Leased | 02/28/02 | ||||
Evangeline, Louisiana | Solids Control Office & Rework Facility | 20,000 on 4 Acres | Owned | |||||
Harvey, Louisiana | Coating Plant & Inspection Facility | 53,000 on 7 Acres | Owned & Leased | 09/30/04 | ||||
Lafayette, Louisiana | Highway 90 East Complex: Solids Control Service Facility, Warehouse & Administrative Offices | 12,075 on .98 Acres | Owned | |||||
Highway 90 East Complex: Systems Service Facility, Warehouse & Distribution Center | 13,450 | Leased | 11/30/07 | |||||
Solids Control Office & Warehouse Facility | 20,000 on 2 Acres | Leased | 02/01/03 | |||||
Lake Arthur, Louisiana | Solids Control Service & Rework Facility | 7,800 on 5 Acres | Leased | 12/06 | ||||
Morgan City, Louisiana | Inspection Facility | 42,400 on 3 Acres | Building Owned* | Mo. to Mo. | ||||
New Iberia, Louisiana | Solids Control Manufacturing & Warehouse Facility | 25,500 on 3.4 Acres | Owned | |||||
Laurel, Mississippi | Inspection & Storage Facilities | 13,000 on 4 Acres | Leased | 12/14/03 | ||||
Hobbs, New Mexico | Inspection Facility | 7,866 on .31 Acres | Owned | |||||
Duncan, Oklahoma | Nitrogen Units Manufacturing Facility, Warehouse & Offices | 67,600 on 13.28 Acres | Owned | |||||
Edmond, Oklahoma | Coating Plant | 40,000 on 19 Acres | Owned |
18
Location | Description | Size (Approximate Square Feet) | Owned/Leased | Lease Termination Date | ||||
Oklahoma City, Oklahoma | Inspection Facility | 6,000 on 5 Acres | Owned | |||||
Sand Springs, Oklahoma | Fiberglass Tubular Manufacturing Plant | 189,173 on 6.5 Acres | Owned | |||||
Tulsa, Oklahoma | Nitrogen Units & Pump Manufacturing Facility, Warehouse & Offices | 40,700 on 4.47 Acres | Leased | 12/31/02 | ||||
Big Spring, Texas | Fiberglass Tubular Manufacturing Plant & Administrative Offices | 36,669 on 12 Acres | Owned | |||||
Cedar Park, Texas | Instrumentation Manufacturing Facility, Administrative & Sales Offices | 205,000 on 40 Acres | Owned | |||||
Conroe, Texas | Solids Control & Pressure Control Manufacturing Facility, Warehouse, Administrative & Sales Offices & Engineering Labs | 160,000 on 30.49 Acres | Owned | |||||
Corpus Christi, Texas | Inspection Facility | 20,800 on 4 Acres | Owned | |||||
Fort Worth, Texas | Coiled Tubing Manufacturing Facility, Warehouse, Administrative & Sales Offices | 75,200 on 9.67 Acres | Owned | |||||
Houston, Texas | Holmes Road Complex: Manufacturing, Warehouse, Corporate Offices, Coating Manufacturing Plant & Pipeline Services | 300,000 on 50 Acres | Owned | |||||
Engineering/Technical Research Center | 76,000 on 6 Acres | Owned | ||||||
Highway 90: Coating Plant | 83,000 on 43 Acres | Leased | 07/31/11 | |||||
Shaffer, MDT, BJ, & Systems Facility 12950 West Little York Sales/ Service/ Repair/Manufacturing | 619,000 on 34 Acres | Owned | ||||||
Sheldon Road Complex: Administrative Offices, Inspection & Storage Facilities | 137,000 on 94 Acres | Land Owned** | 12/29/03 | |||||
Brandt/Southwest Complex: Manufacturing & Remanufacturing Facility, Administrative & Sales Offices | 40,700 on 4.47 Acres | Leased | 10/31/02 | |||||
Hardy Road Complex: Inspection Facility, Manufacturing Warehouse, Administrative Offices & Engineering | 19,734 on 14 Acres | Owned | ||||||
Solids Control Service & Rework Facility 12249 FM 529 | 16,875 on 1.2 Acres | Leased | 02/28/03 | |||||
QT Manufacturing Facility, Administrative & Sales Offices | 80,000 on 11 Acres | Owned | ||||||
Instrumentation Manufacturing Facility | Leased | 10/03 | ||||||
Corporate Administrative Office | 14,500 in Office Tower | Leased | 08/31/11 | |||||
Kilgore, Texas | Inspection Facility | 21,000 on 4 Acres | Owned | |||||
Midland, Texas | Coating Plant, Reclamation Facility & Technical Service Building | 87,000 on 25 Acres | Owned | |||||
Navasota, Texas | Coating Plant | 65,000 | Building Owned* | 06/30/13 | ||||
Odessa, Texas | Inspection Pipe Storage Yard & Ancillary Service Facility | 12,000 on 23.2 Acres | Leased | 04/30/16 | ||||
MDT Sales & Service Facility | 8,000 on 1.5 Acres | Owned |
19
Location | Description | Size (Approximate Square Feet) | Owned/Leased | Lease Termination Date | ||||
San Antonio, Texas | Fiberglass Tubular Manufacturing Plant, R & D Lab, Administrative Offices | 76,529 on 19.57 Acres | Owned | |||||
Snyder, Texas | Inspection Facility | 3,200 on .55 Acres | Owned | |||||
Casper, Wyoming | Inspection Facility | 91,720 on 29 Acres | Owned | |||||
Evanston, Wyoming | Inspection Facility and Pipe Storage Yard | 11,000 on 18 Acres | Building Owned* | Mo. to Mo. | ||||
Canada: | ||||||||
Bonnyville, Alberta | Solids Control & Pipe Reclamation Facility | 13,500 on 3 Acres | Leased | 10/14/04 | ||||
Brooks, Alberta | Inspection Reclamation Facility | 8,000 on .25 Acres | Leased | 12/31/04 | ||||
Calgary, Alberta | Inspection Office & Warehouse | 6,400 on .63 Acres | Owned | |||||
Varco Sales Offices | 7,758 in Office Tower | Leased | 03/28/06 | |||||
Coiled Tubing Manufacturing Facility, Administrative & Sales Offices | 48,040 on 2.52 Acres | Owned | ||||||
Instrumentation Offices & Warehouse | 14,103 | Leased | 07/31/02 | |||||
Drayton Valley, Alberta | Inspection Office & Warehouse | 6,640 on 1 Acre | Leased | 07/14/05 | ||||
Edmonton, Alberta | Tubular & Pressure Control Shop | 8,100 on .5 Acres | Leased | 04/04 | ||||
Instrumentation Office Warehouse | 6,330 on .79 Acres | Owned | ||||||
Grande Prairie, Alberta | Solids Control & Inspection Warehouse Facility | 8,300 on 1.5 Acres | Leased | 08/31/03 | ||||
Instrumentation Shop | 6,400 | Leased | 06/30/03 | |||||
Leduc, Alberta | Solids Control Equipment Rental & Services Facility | 41,340 on 9.36Acres | Owned | |||||
MDT, Shaffer & Systems Service & Warehouse Facility | 22,690 on 4.6 Acres | Owned | ||||||
Lloydminister, Alberta | Inspection Office, Warehouse & Yard | 8,750 on 10 Acres | Leased | 04/30/05 | ||||
Nisku, Alberta | Coating Plant, Inspection Facility | 114,000 on 30 Acres | Owned | |||||
Inspection Facility & Yard | 10,000 on 22.23 Acres | Owned | ||||||
Pipeline Services Facility | 11,500 on 2.8 Acres | Owned | ||||||
Shop & Maintenance, Administrative & Sales Offices | 10,000 on 2 Acres | Leased | 10/01/02 | |||||
Instrumentation Assembly Shop | 24,725 on 3.1 Acres | Owned | ||||||
Provost, Alberta | Inspection, Cleaning, Threading Repair Facility | 8,750 on .18 Acres | Leased | 11/30/03 | ||||
Red Deer, Alberta | Inspection Office & Shop | 14,800 on 15 Acres | Leased | 02/09/04 | ||||
Slave Lake, Alberta | Inspection Office & Shop | 1,500 on 1 Acre | Leased | 06/30/02 | ||||
Estevan, Saskatchewan | Solids Control Rental Facility | 4,320 on 1.92 Acres | Leased | 11/30/03 | ||||
International: | ||||||||
Latin America: | ||||||||
Argentina: | ||||||||
Comodoro Rivadavi, Chubut State | Reclamation & Inspection Facility | 18,800 on1.6 Acres | Leased | 07/31/02 | ||||
Los Perales, Santa Cruz State | Tubing & Sucker Rod Inspection Yard | 700 on 2.47 Acres | Leased | 12/31/03 | ||||
Plaza Huincul, Neuquen State | Reclamation & Inspection Facility | 2,000 on 2.3 Acres | Leased | 12/31/03 |
20
Location | Description | Size (Approximate Square Feet) | Owned/Leased | Lease Termination Date | ||||
Bolivia: | ||||||||
Santa Cruz de La Sierra, Andres Ibanez State | Pipe & Solids Control Yard, Warehouse, & Office | 18,000 on 1.72 Acres | Leased | 10/01/04 | ||||
Brazil | ||||||||
Macae, Brazil | Inspection Facility & Solids Control Yard | 4.94 Acres | Leased | 06/30/07 | ||||
Colombia: | ||||||||
Neiva, Columbia | Solids Control Yard & Warehouse | 53,820 | Leased | 03/15/02 | ||||
Yopal, Colombia | Solids Control Warehouse, Storage | 68,890 on 3.75 Acres | Leased | 09/30/01 | ||||
Equador: | ||||||||
Coca | Solids Control Warehouse & Service Facility | 6,500 | Leased | Mo. to Mo. | ||||
Coca | Inspection Office, Warehouse & Service Facility | 10,000 | Leased | Mo. to Mo. | ||||
Quito | Solids Control & Inspection Office | 1,500 | Leased | 08/31/04 | ||||
Peru: | ||||||||
Iquitos, Maynas | Solids Control Office & Warehouse | 9,187 | Leased | 08/19/02 | ||||
Trinidad: | ||||||||
Couva, Trinidad | Screens Manufacturing Facility | 8,073 on .5 Acres | Leased | 03/05 | ||||
San Fernand, Trinidad | Solids Control Sales & Service Facility | 7,000 on .28 Acres | Leased | 03/05 | ||||
Venezuela: | ||||||||
Anaco, Venezuela | Solids Control Facility | 1 Acre | Owned | |||||
Inspection Facility | 600 on 2.5 Acres | Leased | Mo. to Mo. | |||||
Ciudad Ojeda, Venezuala | Solids Control Facility | 1.5 Acres | Leased | 07/02 | ||||
La Candelaria, Venezuela | Waste Management Facility | 14.8 Acres | Owned | |||||
La Canada, Venezuela | Undeveloped Land For Waste Management | 27.9 Acres | Owned | |||||
Maracaibo, Venezuela | Solids Control Facility | 25,000 on 1 Acre | Owned | |||||
San Diego Cabrutica, Venezuela | Solids Control Facility | 1.5 Acres | Leased | 04/30/03 | ||||
Tia Juana, Venezuela | Inspection Facility | 1.5 Acres | Leased | 04/30/04 | ||||
Far East: | ||||||||
Australia: | ||||||||
Perth, Western Australia | Coiled Tubing & Wireline Products | 11,860 | Leased | 04/30/02 | ||||
China: | ||||||||
Harbin, People’s Republic of China | Fiberglass Tubular Manufacturing Plant | 35,000 | Leased | 12/31/05 | ||||
Singapore: | ||||||||
Singapore | Systems Offices, Service & Distribution Facility | 43,529 on 1.2 Acres | Owned | |||||
Tuas, Singapore | Coating Plant & Inspection Facility | 50,644 on 8 Acres | Building Owned* | 06/09 | ||||
Tuas, Singapore | Coiled Tubing & Wireline Products Manufacturing & Administrative Facility | 35,300 on 1.5 Acres | Building Owned* | 04/15/14 |
21
Location | Description | Size (Approximate Square Feet) | Owned/Leased | Lease Termination Date | ||||
Europe: | ||||||||
France: | ||||||||
Berlaimont, France | Coating Plant | 44,000 on 16 Acres | Owned | |||||
Germany: | ||||||||
Celle, Germany | Inspection Facility, Administrative & Engineering Offices | 43,560 on 12 Acres | Building Owned* | 2049 | ||||
Gladbeck, Germany | Coating Plant | 25,635 on 4 Acres | Owned | |||||
Netherlands: | ||||||||
Coevorden, Netherlands | Inspection Reclamation & Repair Facility | 53,361 on 2 Acres | Leased | 12/04 | ||||
Etten-Leur, Netherlands | BJ Mfg. Plant/Sales | 75,000 on 6 Acres | Owned | |||||
Norway: | ||||||||
Agotnes, Norway | Inspection/Cleaning Hall | 7,000 on 1 Acre | Building Owned* | 07/26/04 | ||||
Floro, Norway | Inspection/Cleaning Hall | 10,000 on 1 Acre | Building Owned* | 03/11/06 | ||||
Kristiansund, Norway | Inspection/Cleaning Hall | 14,000 on 1 Acre | Leased | 08/01/11 | ||||
Stavanger, Norway | Inspection/Cleaning Hall | 16,000 on 1 Acre | Leased | 06/30/05 | ||||
Drilling Equipment Work Shop Warehouse & Customer Service Center | 41,333 on .42 Acres | Leased | 06/01/06 | |||||
Drilling Equipment & Solids Control Administrative & Sales | 7,535 | Leased | 04/15/04 | |||||
United Kingdom: | ||||||||
Bordon, England | Pipeline Services Center | 12,000 on .75 Acres | Building Owned* | 2082 | ||||
Dorset, England | Coiled Tubing & Pressure Control Manufacturing, Administrative & Sales | 16,140 on .58 Acres | Leased | 2015 | ||||
Great Yarmouth, England | Coiled Tubing & Nitrogen Units Manufacturing, Administrative & Sales | 29,000 on 1.7 Acres | Leased | 08/22/11 | ||||
Derrick Manufacturing Facilities, Administrative, & Sales | 46,208 on 2.57 Acres | Leased | 12/03 | |||||
Derrick Manufacturing Facilities, Administrative, & Sales | 21,162 on 1,323 Acres | Owned | ||||||
Aberdeen, Scotland | Inspection Facility, Coating Plant, Manufacturing, Administrative & Sales | 45,209 on 10 Acres | Owned | |||||
Solids Control Manufacturing Facility Assembly, Administrative, Sales | 71,200 on 6.25 Acres | Leased | 2004 | |||||
Coiled Tubing & Pressure Control Manufacturing, Administrative & Sales | 26,000 on 1.65 Acres | Owned | ||||||
Derrick Manufacturing Facilities, Administrative & Sales | 10,126 on .53 Acres | Leased | 05/10 | |||||
Tubular & Pressure Control Manufacturing, Administrative & Sales | 85,152 on 7.1 Acres | Leased | 08/31/19 | |||||
QT Coiled Tubing Service Center | 27,600 on 2 Acres | Leased | 10/16/02 | |||||
Badentoy, Scotland | Systems & Shaffer Sales, Service & Distribution Facility | 63,000 on 6 Acres | Owned | |||||
Montrose, Scotland | Forties Road Systems Service Center & Office Facility | 34,000 on 3 Acres | Owned |
22
Location | Description | Size (Approximate Square Feet) | Owned/Leased | Lease Termination Date | ||||
Middle East: | ||||||||
Saudi Arabia: | ||||||||
Al Khobar, Saudi Arabia | Reclamation, Inspection Facility & Offices | 340,203 on 8 Acres | Leased | 12/31/02 | ||||
United Arab Emirates: | ||||||||
Jebel Ali, Dubai | Tubular & Pressure Control Manufacturing, Administrative & Sales | 12,400 on .55 Acres | Leased | 03/17/02 |
| * | Building owned subject to a ground lease. |
| ** | Land leased to building owner under a 99 year lease. |
The Company owns undeveloped acreage next to several of its facilities, including over 100 acres of undeveloped property located in Houston, Texas. Machinery, equipment, buildings, and other facilities owned and leased are considered by management to be adequately maintained and adequate for the Company’s operations.
ITEM 3. LEGAL PROCEEDINGS
The following discussion contains forward-looking statements within the meaning of Section 27A of the Securities Act of 1933 and Section 21E of the Securities Exchange Act of 1934. These statements relate to the Company’s legal proceedings described below. Litigation is inherently uncertain and may result in adverse rulings or decisions. Additionally, the Company may enter into settlements or be subject to judgments which may, individually or in the aggregate, have a material adverse effect on the Company’s results of operations. Accordingly, actual results could differ materially from those projected in the forward-looking statements.
The Company is involved in numerous legal proceedings which arise in the ordinary course of its business. The Company is unable to predict the outcome of these proceedings; however, management believes that none of these legal proceedings will have a material adverse effect on the results of operations or financial condition of the Company. Notwithstanding the foregoing, there can be no absolute assurance that the indemnity from Minstar discussed below or the Company’s insurance coverage will be sufficient to protect the Company from incurring substantial liability as a result of these proceedings.
The Company has been party to two lawsuits that allege wrongful death or injury of former employees resulting from exposure to silica and silica dust during employment with the Company, both of which have been settled. These settlements have been made on the Company’s behalf by the Company’s and Minstar’s insurance carriers without financial loss to the Company. The Company is aware of the possibility that suits may be brought against it by other former employees alleging exposure to silica and silica dust during their employment with the Company. These suits may involve claims for wrongful death under a theory of gross negligence and claims for punitive damages, the amounts of which could be substantial but cannot be predicted. Additionally, the Company has been sued in the past for claims arising out of allegations of exposure to silica, asbestos, benzene and certain other substances alleged to have been used primarily during its processes in the 1960s, 1970s, and early 1980s. The Company believes that, based upon insurance and indemnification from Minstar, any such potential claims, if asserted, would not have a material adverse effect on the Company’s results of operations or financial condition.
Pursuant to an agreement executed in connection with the acquisition of the Company in 1988, Minstar agreed to hold the Company harmless from and against any and all losses, liabilities, damages, deficiencies and expenses (in excess of $1.5 million in the aggregate) arising out of product and/or general liability claims arising out of occurrences on or prior to the closing of the acquisition. In addition, Minstar agreed to hold the Company harmless from any and all losses, liabilities and damages, deficiencies and expenses related to any action, suit, litigation, proceeding or governmental investigation existing or pending on or prior to the closing of the acquisition. Minstar’s obligations to indemnify the Company are subject to limitations concerning the time for submitting claims and the amount of losses to be covered. There is a dispute with Minstar concerning whether the indemnification referenced above is applicable only if the claim is the type that would be covered by a product or general liability insurance policy.
23
The Company firmly maintains that all suits or claims are the responsibility of Minstar when the event giving rise to liability occurred prior to the closing of the acquisition. No assurance can be given, however, that Minstar will not contest responsibility for future suits, including those filed under theories of gross negligence. Management believes that Minstar is responsible for indemnifying it with respect to all of the aforementioned lawsuits subject in certain instances to the $1.5 million basket. In addition, while management believes certain liability arising from certain of the above described suits will be covered by insurance, such suits may be subject to a reservation of rights and the coverage could be contested by the carriers providing such insurance.
The Company has settled the litigation styled Derrick Manufacturing Corporation vs. Advanced Wirecloth, Inc., Environmental Procedures, Inc. dba SWECO Oilfield Services et al (Civil Action No. 942417) in the United States District Court for the Southern District of Texas, Houston Division, which was a consolidated action with Civil Action No. 95-3653. All claims related to this litigation were settled including, among other things (1) infringement of United States Patent Nos. 4,575,421, 5,417,858, 5,417,859, 5,720,881 and 5,783,077, (2) trademark infringement, (3) unfair competition, (4) false patent marking of products, (5) false advertising under Section 43(a) of the Lanham Act, and (6) violation of Texas’ Anti-Dilution Act. The specific terms of this settlement are covered by agreements of confidentiality and certain provisions may still be the subject of the protective order issued by the Court. The Company believes that it has indemnity coverage from certain of its insurance carriers for certain of the alleged claims, and also believes its cost of defending this action are covered by insurance. However, this suit is the subject of reservation of rights by certain carriers and coverage could be contested by carriers providing such insurance. The Company is currently aggressively pursuing its claims for costs of defense and indemnity. For additional information regarding this litigation, see “Management’s Discussion and Analysis of Results of Operation and Financial Condition—Merger, Transactions, and Litigation Costs” and Note 14 of the Notes to the Consolidated Financial Statements.
ITEM 4. SUBMISSION OF MATTERS TO A VOTE OF SECURITY HOLDERS
No matters were submitted to a vote of stockholders during the fourth quarter of 2001.
24
PART II
ITEM 5. MARKETS FOR REGISTRANT’S COMMON EQUITY STOCK AND RELATED STOCKHOLDER MATTERS
The Company’s common stock is traded on the New York Stock Exchange (NYSE) under the symbol “VRC”. The following table sets forth, for the calendar periods indicated, the range of high and low closing prices for the common stock, as reported by the NYSE:
2001 | 2000 | |||||||
High | Low | High | Low | |||||
1st Quarter | 24.70 | 17.88 | 19.56 | 12.50 | ||||
2nd Quarter | 24.70 | 18.40 | 24.88 | 14.20 | ||||
3rd Quarter | 18.75 | 10.92 | 22.95 | 17.00 | ||||
4th Quarter | 16.20 | 11.65 | 21.75 | 15.33 | ||||
The closing price of the Company’s common stock on February 22, 2002 was $15.40. The approximate number of stockholders of record on February 22, 2002 was 1,332.
Holders of the Company’s Common Stock are entitled to such dividends as may be declared from time to time by the Company’s Board of Directors out of funds legally available therefore. The Company has not declared or paid any dividends on its common stock since its inception and does not currently plan to declare or pay any dividends.
25
ITEM 6. SELECTED FINANCIAL DATA
The information below is presented in order to highlight significant trends in the Company’s results from operations and financial condition.
Years Ended December 31, | ||||||||||||||||||||
2001 | 2000 | 1999 | 1998 | 1997 | ||||||||||||||||
(Dollars in thousands, except ratio and per share data) | ||||||||||||||||||||
Statement of Income Data: | ||||||||||||||||||||
Revenue | $ | 1,267,809 |
| $ | 866,615 |
| $ | 975,848 |
| $ | 1,307,681 |
| $ | 1,070,318 |
| |||||
Operating profit(1) |
| 158,126 |
|
| 60,911 |
|
| 67,348 |
|
| 179,062 |
|
| 180,412 |
| |||||
Net income(2) | $ | 82,968 |
| $ | 21,055 |
| $ | 29,809 |
| $ | 102,283 |
| $ | 102,979 |
| |||||
Basic earnings per common share(2) | $ | 0.87 |
| $ | 0.23 |
| $ | 0.33 |
| $ | 1.13 |
| $ | 1.16 |
| |||||
Dilutive earnings per common share(2) | $ | 0.86 |
| $ | 0.22 |
| $ | 0.32 |
| $ | 1.09 |
| $ | 1.10 |
| |||||
Other Data: | ||||||||||||||||||||
Net cash provided by operating activities | $ | 83,995 |
| $ | 81,787 |
| $ | 119,064 |
| $ | 93,949 |
| $ | 135,094 |
| |||||
Cash flows used for investing activities | $ | (211,126 | ) | $ | (64,872 | ) | $ | (43,638 | ) | $ | (112,909 | ) | $ | (118,344 | ) | |||||
Cash flows provided by (used for) financing activities | $ | 173,118 |
| $ | (86,718 | ) | $ | (29,891 | ) | $ | 4,671 |
| $ | 19,533 |
| |||||
Earnings per common share before goodwill amortization | $ | 0.97 |
| $ | 0.31 |
| $ | 0.41 |
| $ | 1.18 |
| $ | 1.18 |
| |||||
EBITDA(3) | $ | 238,271 |
| $ | 144,217 |
| $ | 134,016 |
| $ | 239,685 |
| $ | 222,865 |
| |||||
Ratio of EBITDA to interest expense(4) |
| 10.2x |
|
| 7.7x |
|
| 6.7x |
|
| 11.6x |
|
| 12.3x |
| |||||
Ratio of earnings to fixed charges(5) |
| 5.6x |
|
| 3.1x |
|
| 3.0x |
|
| 7.2x |
|
| 8.1x |
| |||||
Depreciation and amortization | $ | 67,900 |
| $ | 56,518 |
| $ | 57,180 |
| $ | 52,972 |
| $ | 43,081 |
| |||||
Capital expenditures | $ | 65,834 |
| $ | 45,463 |
| $ | 30,729 |
| $ | 78,356 |
| $ | 81,805 |
| |||||
Balance Sheet Data (end of period): | ||||||||||||||||||||
Working capital | $ | 423,602 |
| $ | 263,378 |
| $ | 310,175 |
| $ | 290,398 |
| $ | 218,771 |
| |||||
Total assets |
| 1,429,110 |
|
| 1,076,982 |
|
| 1,131,313 |
|
| 1,259,092 |
|
| 1,157,296 |
| |||||
Total debt |
| 322,614 |
|
| 136,507 |
|
| 233,335 |
|
| 260,692 |
|
| 237,897 |
| |||||
Common stockholders’ equity |
| 828,314 |
|
| 731,983 |
|
| 694,245 |
|
| 658,441 |
|
| 553,232 |
| |||||
| (1) | The 1998 operating profit includes $1.5 million write-off of rental equipment and $0.9 million allowance for abandoned leases and other obligations. Excluding these charges, operating profit was $187.6 million. The 1999 operating profit includes $7.8 million of transaction costs and write-offs associated with the terminated Newpark merger. Excluding these costs, operating profit was $75.2 million. The 2000 operating profit includes $9.7 million of financial advisor fees, $4.3 million of compensation costs, $5.1 million to fully vest employees participating in the Executive Stock Match program, $3.5 million in equipment rationalization charges and $3.9 million of other transaction costs associated with the Varco Merger. Excluding these costs, operating profit was $87.5 million. The 2001 operating profit includes $16.5 million of litigation costs. Excluding these costs, operating profit was $174.6 million. |
| (2) | The Company adopted Statement of Financial Accounting Standards No. 142, “Goodwill and Other Intangible Assets” (SFAS 142), effective January 1, 2002. The effects of not amortizing goodwill and other intangible assets in periods prior to the adoption of SFAS 142 would have resulted in net income of $93.4 million, $29.5 million, $38.2 million, $110.0 million and $110.5 million for the years ended December 31, 2001, 2000, 1999, 1998 and 1997, respectively; basic earnings per common share of $.98, $.32, $.42, $1.21 and $1.24 for the years ended December 31, 2001, 2000, 1999, 1998 and 1997, respectively; and diluted earnings per common share of $.97, $.31, $.41, $1.18 and $1.18 for the years ended December 31, 2001, 2000, 1999, 1998 and 1997, respectively. |
| (3) | “EBITDA” means earnings before interest, taxes, depreciation, amortization, and extraordinary items and should not be considered as an alternative to net income or any other generally accepted accounting |
26
principles measure of performance as an indicator of the Company’s operating performance or as a measure of liquidity. The Company believes EBITDA is a widely accepted financial indicator of a company’s ability to service debt. |
| (4) | Ratio of EBITDA to interest expense represents an industry ratio that provides an investor with information as to the Company’s current ability to meet its interest costs. |
| (5) | For the purpose of this calculation, “earnings” consist of net income (loss) before income taxes, extraordinary items, and fixed charges. “Fixed charges” consist of interest expense and amortization of debt discount and related expenses believed by management to be representative of the interest factor thereon. |
27
ITEM 7. MANAGEMENT’S DISCUSSION AND ANALYSIS OF RESULTS OF OPERATIONS AND
FINANCIAL CONDITION
General
Business Combination—Merger
On May 30, 2000, the stockholders of Tuboscope Inc. (the “Company”) and Varco International, Inc. (“Varco”) approved the merger (the “Merger”) of Varco into the Company through an exchange of .7125 shares of the Company’s stock for each share of Varco. In connection with the Merger, the Company changed its name to Varco International, Inc. and its New York Stock Exchange (NYSE) symbol from “TBI” to “VRC”.
The Merger has been accounted for as a pooling of interests and accordingly all prior periods consolidated financial statements have been restated to include the combined results of operations and financial condition. The following management’s discussion and analysis of results of operations and financial condition is based upon such combined results.
The Company is organized based on the products and services it offers. In connection with the Merger, the Company reorganized into four principal business segments: Drilling Equipment Sales, Tubular Services, Drilling Services, and Coiled Tubing & Wireline Products. See Note 12 of Notes to the Consolidated Financial Statements.
Operating Environment Overview
The Company’s results are dependent on the level of worldwide oil and gas drilling and production activity, the prices of oil and gas, capital spending by other oilfield service companies and drilling contractors, pipeline maintenance and construction activity, and worldwide oil and gas inventory levels. Key industry indicators for the past three years include the following:
2001* | 2000* | 1999* | % 2001 v 2000 | % 2000 v 1999 | |||||||||||
Rig Activity: | |||||||||||||||
U.S. |
| 1,155 |
| 916 |
| 623 | 26.1 | % | 47.0 | % | |||||
Canada |
| 342 |
| 353 |
| 246 | (3.1 | %) | 43.5 | % | |||||
International |
| 745 |
| 652 |
| 588 | 14.3 | % | 10.9 | % | |||||
Worldwide |
| 2,242 |
| 1,921 |
| 1,457 | 16.7 | % | 31.8 | % | |||||
Workover Rig Activity: | |||||||||||||||
U.S. |
| 1,211 |
| 1,056 |
| 835 | 14.7 | % | 26.5 | % | |||||
Canada |
| 342 |
| 342 |
| 253 | — |
| 35.2 | % | |||||
North America |
| 1,553 |
| 1,398 |
| 1,088 | 11.1 | % | 28.5 | % | |||||
West Texas Intermediate Crude prices (per barrel) | $ | 25.93 | $ | 30.34 | $ | 19.20 | (14.5 | %) | 58.0 | % | |||||
Natural Gas Prices ($/mbtu) | $ | 3.97 | $ | 4.32 | $ | 2.33 | (8.1 | %) | 85.4 | % | |||||
| * | Averages for the years indicated. The source for rig activity information was Baker Hughes Incorporated (“BHI”), and the source for oil and gas prices was Department of Energy, Energy Information Administration (www.eia.doe.gov) for 2000 forward and The Wall Street Journal for 1999. |
Oil prices remained strong during the first three quarters of 2001, averaging $27.78 per barrel of West Texas Intermediate Crude during that time period. While each of the first three quarters of 2001 resulted in a sequential decline in the price of West Texas Intermediate Crude, the most significant quarterly decline in 2001 oil prices occurred in the fourth quarter which dropped 24% from the average price in the third quarter of 2001. Natural gas
28
prices in 2001, however, began to decline in the second quarter of 2001 (off 31% from the first quarter 2001) and continued to drop in the third and fourth quarter of 2001. The decline in oil and gas prices was the result of a weakening worldwide economy during the second half of 2001.
The strong oil prices for the majority of 2001 led to an increase in rig activity in the U.S. (26% increase) and international (14% increase) markets. The improvements in rig activity had a significant impact on the Company’s results of operations as operating profit (excluding merger, transaction, and litigation costs) was up 100% in 2001 compared to 2000, increasing from $87.5 million to $174.6 million. The increase in activity levels combined with 15 acquisitions in 2001 favorably impacted all four of the Company’s main business segments as 2001 revenue was up 40%, 42%, 26%, and 142% over 2000 revenue in the Drilling Equipment Sales, Tubular Services, Drilling Services, and Coiled Tubing & Wireline Products business segments, respectively.
The Company has executed acquisitions over the past few years as part of its growth strategy. The Company seeks, where possible, to effect consolidation cost savings by integrating acquired businesses with its own. As a consequence, the financial results of acquired businesses may not be separable from the Company’s existing businesses, and therefore may not be readily measurable. Accordingly, the impact of acquisitions on the Company’s overall financial results are difficult to measure. Where the Company provides estimates of incremental revenue and operating profit from acquired businesses, these estimates are based upon management’s judgment.
The following table details the U.S., Canada, and International rig activity and West Texas Intermediate Oil prices for the past three years on a quarterly basis:
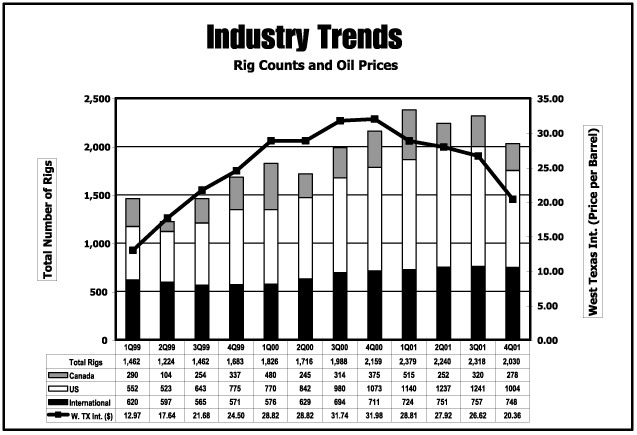
Source: Rig count: BHI
West Texas Intermediate Crude Price: Department of Energy, Energy Information Administration (www.eia.doe.gov) for 2000 forward and The Wall Street Journal for 1999.
29
U.S. Rig activity at February 15, 2002 was 815, a decrease of 8.1% from 887 at December 28, 2001. Compared to February 16, 2001, U.S. rig activity has declined by 28.9%. These declines are forecasted to continue in the first half of 2002, which is expected to have an adverse impact on the Company’s operations, during the first half of 2002, especially in the Tubular Services and Drilling Services business segments.
Results of Operations
Year Ended December 31, 2001 vs Year Ended December 31, 2000
Revenue. Revenue for the year ended December 31, 2001 was $1,267.8 million, an increase of $401.2 million, or 46.3%, from revenue of $866.6 million for the year December 31, 2000. There were three main factors related to the increase in revenue: the worldwide increase in rig activity (especially in the U.S.); 15 acquisitions completed in 2001 and two acquisitions completed in December 2000; and the 2001 shipment of several large drilling equipment orders which were originally ordered in 2000. U.S. Inspection, Coating, and Solids Control revenue was up $38.6 million in 2001 primarily as a result of the 26% increase in U.S. rig activity in 2001 over 2000 discussed above. Management believes that acquisitions completed in 2001 and December 2000 contributed approximately $162.2 million of the increase. In addition, the shipment of approximately $44.6 million of major product shipment in 2001 contributed further to the increase. Additional increases are discussed in further detail below by product line.
The following table summarizes the Company’s revenue by operating segment in 2001, 2000, and 1999 (in thousands):
2001 | 2000 | 1999 | |||||||
Drilling Equipment Sales | $ | 395,550 | $ | 283,360 | $ | 504,245 | |||
Tubular Services |
| 352,624 |
| 248,099 |
| 194,929 | |||
Drilling Services |
| 314,272 |
| 250,229 |
| 202,518 | |||
Coiled Tubing & Wireline Products |
| 205,363 |
| 84,927 |
| 74,156 | |||
$ | 1,267,809 | $ | 866,615 | $ | 975,848 | ||||
Revenue from the Company’s Drilling Equipment Sales in 2001 was $395.6 million, an increase of $112.2 million (39.6%) compared to 2000. This increase was due primarily to the 2001 shipment of several large orders placed in 2000. The 2001 results included $27.9 million of revenue related to the projects for Maersk (Hyundai Heavy Industries). In addition, 2001 results included a record year for shipment of top drive systems, as 59 were shipped. New orders for 2001 were $545.9 million, an increase of $230.2 million (72.9%) over 2000. Backlog at December 31, 2001 for the Drilling Equipment Sales group was $251.5 million, an increase of 185.5% over December 31, 2000 backlog of $88.1 million. The increase in orders and backlog was due to an increase in 2001 drilling activity, the receipt of several large rig orders, and a record number of orders for top drive systems. However, backlog at December 31, 2001 was actually down from backlog at September 30, 2001 of $274.3 million (8.3%). The recent decline in backlog was reflective of the declining market activity in the fourth quarter of 2001. In accordance with industry practice, orders and commitments generally are cancellable by customers at any time.
Revenue from the Company’s Tubular Services was $352.6 million in 2001, an increase of $104.5 million (42.1%) over 2000 results. U.S. inspection and coating revenue increased $25.4 million (30%) over 2000 results due to increased U.S. rig activity. Also, the Company’s Eastern Hemisphere inspection and coating revenue increased by $13.7 million due to the increase in international activity. In addition, this segment’s fiberglass tubular operations revenue was up $59.7 million due to greater activity levels and the impact of acquisitions completed late in 2000 and in July of 2001. Revenue from the Company’s pipeline inspection operation increased by $6.7 million due to greater demand for pipeline inspection in the U.S.
30
Drilling Services revenue was $314.3 million in 2001, an increase of $64.0 million (25.6%) over 2000 results. U.S. Solids Control revenue increased $13.2 million (43%) in 2001 compared to 2000 due to a strong U.S. market. In addition, the Company benefited from strong markets and revenue growth in Latin America (up $10.4 million) and the Eastern Hemisphere (up $33.8 million). Also, the Company’s instrumentation business increased $20.4 primarily due to two acquisitions in Canada in 2001.
Coiled Tubing and Wireline Products revenue was $205.4 million in 2001, an increase of $120.4 million (141.8%) over 2000 results. The increase was mainly due to the 2001 acquisitions of four Coiled Tubing and Wireline Products companies and greater sales of coiled tubing units and pressure control equipment. The 2001 acquisitions included Quality Tubing (January 2001), Bradon Industries Ltd. (March 2001), Albin’s Enterprises, Inc. (May 2001), and Elmar Services Ltd. (August 2001). Management estimates that these four acquisitions contributed approximately $74.0 million of revenue in 2001 with Quality Tubing contributing approximately $42.8 million of revenue in 2001. The remaining $46.4 million increase was due primarily to greater sales of coiled tubing units and pressure control equipment in 2001 compared to 2000. Backlog for this segment was at $55.9 million at December 31, 2001 compared to $61.2 million at December 31, 2000, a decline of 8.7% and an additional indication of the recent decline in the market.
Gross Profit. Gross profit was $373.5 million (29.5% of revenue) in 2001 compared to $239.6 million (27.6% of revenue) in 2000. The increase in gross profit dollars was due to the greater revenue in 2001 discussed above. The increase in gross profit percentages was due to strong operating leverage in Tubular Services, Drilling Services, and Coiled Tubing and Wireline Products. These strong operating leverages more than offset lower margins from the Drilling Equipment Sales group which was caused by higher engineering costs on certain large sales of drilling equipment units in 2001.
Selling, General, and Administrative Costs. Selling, general, and administrative costs were $152.3 million in 2001, an increase of $32.3 million (27%) over 2000 costs of $119.9 million. Approximately $16.6 million of the increase was due to the 15 acquisitions completed in 2001 and two acquisitions in December 2000. The remaining $15.7 million increase was due primarily to the non-acquisition related growth in revenue in 2001 over 2000. As a percent of revenue, selling, general, and administrative costs were 12.0% of revenue in 2001 compared to 13.8% of revenue in 2000.
Research and Engineering Costs. Research and engineering costs was $46.6 million in 2001, an increase of $14.5 million (45%) compared to 2000 results. Management estimates that the 15 acquisitions completed in 2001 and two acquisitions completed in December 2000 represented $1.2 million of the increase. The majority of the remaining increase was due primarily to greater costs in the Drilling Equipment Sales group.
Merger, Transaction, and Litigation Costs. Merger, transaction, and litigation costs were $16.5 million and $26.6 million for the years ended December 31, 2001 and 2000, respectively. During the second quarter of 2001, the Company engaged in a court ordered mediation and as a result recorded a $16.5 million charge concerning a patent litigation matter, which has subsequently been settled (see Item III Legal Proceedings). The 2000 merger and transaction costs included financial advisor fees, full vesting of executive stock matching awards and employment retirement benefits, equipment rationalization write-offs, certain costs related to employment contracts, legal, accounting, and printing costs associated with the Merger.
Operating Profit. Operating profit was $158.1 million for 2001 compared to $60.9 million for 2000. Excluding merger, transaction, and litigation costs, operating profit as a percentage of revenue was 13.8% in 2001 compared to 10.1% in 2000. The improvement in both operating profit dollars and percentages was due to greater revenue and a favorable product mix in 2001 compared to 2000.
Interest Expense. Interest expense was $21.8 million in 2001 compared to $15.3 million in 2000. The increase in interest expense was due to greater average outstanding debt balances as a result of the $200.0 million Senior Notes issued in the second quarter of 2001.
31
Other Expense (Income). Other expense includes interest income, foreign exchange losses and gains, and other expense (income). Net other expense was $4.3 million in 2001 compared to other income of $0.2 million in 2000. The increase in other expense was due mainly to the permanent impairment of an investment and lower interest income related to less excess cash on hand in 2001 than 2000.
Provision for Income Taxes. The Company recorded a tax provision of $49.1 million (37.2% of pre-tax income) and $24.8 million (54.1% of pre-tax income) for the years ended December 31, 2001 and 2000, respectively. These tax provisions were higher than the domestic tax rate of 35%, due to deductions not allowed under domestic and foreign jurisdictions related to merger and transaction costs, and goodwill amortization and to foreign earnings subject to tax rates differing from domestic rates.
Net Income. Net income was $83.0 million and $21.1 million for 2001 and 2000, respectively. The increase in net income was due to the factors discussed above.
Year Ended December 31, 2000 vs Year End December 31, 1999
Revenue. Revenue for the year ended December 31, 2000 was $866.6 million, a decrease of $109.2 million from the year ended December 31, 1999. The decrease was due to a $220.9 million decline in revenue for Drilling Equipment Sales, which reported revenue of $504.2 million in 1999. The decline in Drilling Equipment Sales was a result of a strong 1999, which included the shipment of orders placed during the last new rig construction cycle in 1997 and the first half 1998. This decline was partially offset by increased revenue in Tubular Services, Drilling Services, and Coiled Tubing and Wireline Products, which benefited from the upturn in the oil and gas industry discussed above.
Revenue from the Company’s Drilling Equipment Sales in 2000 was $283.4 million, a decline of $220.9 million (43.8%) compared to 1999 due to lower orders in 1999 which resulted in a decline in 2000 shipments of equipment for upgrading, conversion, and new construction of offshore drilling rigs, particularly floating rigs that are capable of drilling in water depths exceeding 3,000 feet. However, new orders for 2000 increased $75.9 million (31.5%) over 1999. Backlog at December 31, 2000 for Drilling Equipment Sales was $88.1 million, an increase of $32.3 million (58.0%) compared to $55.7 million at December 31, 1999. The increase in new orders and backlog was due to an increase in worldwide drilling activity, and the receipt of a $25 million order from Maersk. In accordance with industry practice, orders and commitments generally are cancelable by customers at any time.
Revenue from the Company’s Tubular Services was $248.1 million in 2000, an increase of $53.2 million (27.3%) over 1999 results. The increase reflected the change in North America rig activity, which was up 46.0% in 2000 over 1999. The majority of the revenue increase was attributable to North America inspection and coating revenue which was up $33.3 million (46.8%) in 2000 over 1999. Also, this segment’s fiberglass tubular operations approximately doubled in 2000 compared to 1999 (up $15.4 million). Eastern Hemisphere operations, which include Europe, Middle East, Africa, and Far East operations, increased over the prior year as result of greater coating operations in the European and Far East coating plants and greater European inspection revenue.
Drilling Services revenue was $250.2 million, an increase of $47.7 million (23.6%) over 1999 results. The increase in North America rig activity also had a favorable impact on the Company’s Drilling Services revenue, as the majority of the revenue increase was in the North America rental and services business for both the segment’s Solids Control and Instrumentation operations. Latin America revenue was also strong as Solids Control revenue in that area increased 59.4% from $40.9 million in 1999.
Coiled Tubing and Wireline Products revenue was $84.9 million, an increase of $10.8 million (14.5%) compared to 1999 revenue of $74.2 million. The increase was primarily attributable to greater sales of coiled tubing pressure equipment for 2000 compared to 1999. Backlog for this segment was at $61.2 million at December 31, 2000, an increase of 241.9% over December 31, 1999 backlog of $17.9 million.
32
Gross Profit. Gross profit was $239.6 million (27.6% of revenue) in 2000 compared to $250.5 million (25.7% of revenue) in 1999. Gross profit dollars were down due to lower revenue in 2000. The increase in gross profit percentages was due to strong operating leverage in Tubular Services, Drilling Services, and Coiled Tubing and Wireline products. Cost reductions implemented in the Drilling Equipment Sales product group in 2000 offset some of the impact that the decline in revenue had on gross profit percents.
Selling, General, and Administrative Costs. Selling, general, and administrative costs were $119.9 million in 2000, a decrease of $15.3 million (11.3%) compared to 1999 results. Selling, general, and administrative costs were down primarily in Drilling Equipment Sales in 2000 compared to 1999 as a result of lower revenue. In addition, the Company incurred severance costs throughout 1999 in response to market conditions, which did not repeat in 2000.
Research and Engineering Costs. Research and engineering costs were $32.1 million in 2000, a decrease of $8.0 million (19.9%) compared to 1999 results. The decrease in research and engineering costs is due to reduced engineering resources in Drilling Equipment Sales group in response to the decline in new orders.
Transaction Costs and Write-Offs. Transaction costs and write-offs were $26.6 million and $7.8 million for December 31, 2000 and 1999, respectively. The 2000 merger and transaction costs included cash and non-cash transaction costs. Cash costs included financial advisor fees of $9.7 million, compensation costs of $4.3 million, and other costs, including legal, accounting and printing costs of $3.9 million. Non-cash transaction costs included $5.1 million to fully vest employees participating in the Executive Stock Match Program and $3.5 million of equipment rationalization write-offs. The 1999 transaction costs consisted of the cost of the cancelled merger with Newpark Resources, Inc. (“Newpark”).
Operating Profit. Operating profit was $60.9 million for 2000 compared to $67.3 million for 1999. Excluding merger and transaction costs, operating profit percent was 10.1% of revenue in 2000 compared to 7.7% of revenue in 1999. The improvement was due to greater gross profit margins as a result of product mix, lower selling, general, and administrative costs, and lower research and engineering costs as discussed above.
Interest Expense. Interest expense was $15.3 million and $18.9 million for the years ended December 31, 2000 and 1999. The decrease was due to the reduction of debt in the second quarter of 2000, as cash from Varco was applied to reduce debt upon completion of the Merger.
Other Expense (Income). Other income includes interest income, foreign exchange losses (gains), and other expense (income), which resulted in income of $0.2 million in 2000 compared to income of $1.6 million in 1999. The decline in other income was primarily due to foreign exchange losses in 2000 of $1.1 million compared to a foreign exchange gain in 1999 of $0.5 million.
Provision for Income Taxes. The Company recorded a tax provision of $24.8 million (54.1% of pre-tax income) and $20.3 million (40.5% of pre-tax income) for 2000 and 1999, respectively. These tax provisions were higher than expected, based on a domestic tax rate of 35%, due to deductions not allowed under domestic and foreign jurisdictions related to merger and transaction costs, and goodwill amortization and to foreign earnings subject to tax rates differing from domestic rates.
Net Income. Net income was $21.1 million and $29.8 million for 2000 and 1999, respectively. The decline in net income was due to the factors discussed above.
Financial Condition and Liquidity
At December 31, 2001, the Company had cash and cash equivalents of $57.5 million, and current and long-term debt of $322.6 million. At December 31, 2000, cash and cash equivalents were $12.2 million, and current and long-term debt was $136.5 million. The increase in current and long-term debt in 2001 was due primarily to
33
cash paid, notes assumed, and notes issued totaling $168.2 million related to 15 business asset and technology acquisitions in 2001, and the issue on May 1, 2001 of $200.0 million of 7 1/4% Senior Notes due 2011. The Company’s outstanding debt at December 31, 2001 consisted of $201.5 million (net of discounts) of the 2011 Notes, $99.1 million (net of discounts) of 2008 Notes, and $22.0 million of other debt.
For the fiscal year ended December 31, 2001, cash provided by operating activities was $84.0 million compared to $81.8 million for 2000. Cash was provided by operations primarily through net income of $83.0 million plus non-cash charges of $78.0 million. These items were offset to some extent by an increase in accounts receivable of $51.9 million, an increase in inventory of $60.9 million, and an increase in prepaid expenses and other assets of $9.5 million. Accounts payable, accrued liabilities, and other increased by $20.0 million and income taxes payable increased by $25.4 million. The increase in receivables was directly related to a $116.6 million increase in revenue in the fourth quarter of 2001 compared to the same quarter of 2000. Days sales outstanding decreased from 98.7 days at December 31, 2000 to 86.9 days at December 31, 2001. Inventory increased due to an increase in work-in-process as the December 31, 2001 backlog for the Drilling Equipment Sales segment increased $163.5 million from December 31, 2000 to December 31, 2001. The increase in prepaid expenses and other assets was due to an increase in prepaid insurance, taxes, and deferred costs on drilling equipment projects. The increase in accounts payable, accrued liabilities, and other was due to increased vendor payables and accruals associated with increased operations and greater accrued interest associated with higher outstanding debt balances. The increase in income taxes payable was due to greater pre-tax profit in the fourth quarter of 2001 than the fourth quarter of 2000.
For the fiscal year ended December 31, 2001, cash used for investing activities was $212.9 million compared to $64.9 million for the same period of 2000. The Company used approximately $146.0 million of cash to acquire fifteen separate businesses/asset acquisitions during 2001. See Note 3 of Notes to the Consolidated Financial Statements. Capital spending of $65.8 million was related primarily to capital additions for the strong North America market in the Tubular Services and Drilling Services product segments.
For the fiscal year ended December 31, 2001, the Company generated $174.9 million of cash from financing activities compared to cash used of $86.7 million in 2000. Cash generated consisted of net borrowings of $164.8 million (primarily from the $200.0 million bonds described in Note 8 to Notes to the Financial Statements) and proceeds from the sale of stock of $10.1 million.
On January 30, 2002 the Company entered into a new credit agreement with a syndicate of banks that provided up to $125.0 million of funds under a revolving credit facility. The facility expires on January 30, 2005. The facility is secured by guarantees of material U.S. subsidiaries. The interest rate on the borrowed portion of the revolver is based on the Company’s rating by S&P and Moody’s which at the time of the agreement resulted in an interest rate of Libor + 0.625% or the prime rate. Commitment fees range from 0.1% to 0.25% depending on the Company rating.
The Company believes that its December 31, 2001 cash and cash equivalents, its new credit facility, and cash flow from operations will be sufficient to meet its capital expenditures and its operating cash needs for the foreseeable future.
34
A summary of the Company’s outstanding contractual obligations at December 31, 2001 is as follows (in thousands):
Payments Due by Period | |||||||||||||||
Total | Less than 1 Year | 1-3 Years | 4-5 years | After 5 years | |||||||||||
Long Term Debt | $ | 322,614 | $ | 7,077 | $ | 11,372 | $ | 3,237 | $ | 300,928 | |||||
Operating Leases |
| 82,887 |
| 20,193 |
| 26,019 |
| 12,696 |
| 23,979 | |||||
Total contractual obligations | $ | 405,501 | $ | 27,270 | $ | 37,391 | $ | 15,933 | $ | 324,907 | |||||
Standby Letters of Credit | $ | 13,963 | $ | 7,283 | $ | 3,389 | $ | 3,291 | $ | — | |||||
Critical Accounting Policies and Estimates
In preparing the financial statements, we make assumptions, estimates and judgments that affect the amounts reported. We periodically evaluate our estimates and judgments related to bad debts and inventory obsolescence; impairments of long-lived assets, including goodwill and our reserves for product warranty claims. Note 2 to the consolidated financial statements contains the accounting policies governing each of these matters. Our estimates are based on historical experience and on our future expectations that are believed to be reasonable; the combination of these factors forms the basis for making judgments about the carrying values of assets and liabilities that are not readily apparent from other sources. Actual results are likely to differ from our current estimates and those differences may be material.
Reserves for bad debts are determined on a specific identification basis when we believe that the required payment of specific amounts owed to us is not probable. Substantially all of our revenues come from international oil companies and government-owned or government-controlled oil companies and we have receivables in many foreign jurisdictions. If, due to changes in worldwide oil and gas drilling activity or changes in economic conditions in foreign jurisdictions, our customers were unable to repay these receivables, additional allowances would be required.
Reserves for inventory obsolescence are determined based on our historical usage of inventory on-hand as well as our future expectations related to our substantial installed base and the development of new products. Changes in worldwide oil and gas drilling activity and the development of new technologies associated with the drilling industry could require additional allowances to reduce the value of inventory to the lower of its cost or net realizable value.
Accruals for warranty claims are provided based on historical experience at the time of sale. Product warranties generally cover periods from one to three years. Our accruals for warranty claims are affected by the size of our installed base of products currently under warranty, as well as new products delivered to the market. Periodically, as actual experience proves different from historical estimates, additional provisions are required.
The determination of impairment on long-lived assets, including goodwill, is conducted as indicators of impairment are present. If such indicators were present, the determination of the amount of impairment would be based on our judgments as to the future operating cash flows to be generated from these assets throughout their estimated useful lives. Our industry is highly cyclical and our estimates of the period over which future cash flows will be generated, as well as the predictability of these cash flows, can have a significant impact on the carrying value of these assets and, in periods of prolonged down cycles may result in impairment charges.
Factors Affecting Future Operating Results
This Annual Report contains forward-looking statements within the meaning of Section 27A of the Securities Act of 1933 and Section 21E of the Securities Exchange Act of 1934. The forward looking statements
35
are those that do not state historical facts and are inherently subject to risk and uncertainties. The forward-looking statements contained herein are based on current expectations and entail various risks and uncertainties that could cause actual results to differ materially from those projected in the forward-looking statements. Such risks and uncertainties are set forth below.
The oil and gas industry in which the Company participates historically has experienced significant volatility. Demand for the Company’s services and products depends primarily upon the number of oil and gas wells being drilled, the depth and drilling conditions of such wells, the volume of production, the number of well completions, the capital expenditures of other oilfield service companies and drilling contractors, the level of pipeline construction and maintenance expenditures, and the level of workover activity. Drilling and workover activity can fluctuate significantly in a short period of time, particularly in the United States and Canada.
The willingness of oil and gas operators to make capital expenditures for the exploration and production of oil and natural gas will continue to be influenced by numerous factors over which the Company has no control, including the prevailing and expected market prices for oil and natural gas. Such prices are impacted by, among other factors, the ability of the members of the Organization of Petroleum Exporting Countries (“OPEC”) to maintain price stability through voluntary production limits, the level of production of non-OPEC countries, worldwide demand for oil and gas, general economic and political conditions, costs of exploration and production, availability of new leases and concessions, and governmental regulations regarding, among other things, environmental protection, taxation, price controls and product allocations. No assurance can be given as to the level of future oil and gas industry activity or demand for the Company’s services and products.
The Company’s foreign operations, which include significant operations in Canada, Europe, the Far East, the Middle East and Latin America, are subject to the risks normally associated with conducting business in foreign countries, including uncertain political and economic environments, which may limit or disrupt markets, restrict the movement of funds or result in the deprivation of contract rights or the taking of property without fair compensation. Government-owned petroleum companies located in some of the countries in which the Company operates have adopted policies (or are subject to governmental policies) giving preference to the purchase of goods and services from companies that are majority-owned by local nationals. As a result of such policies, the Company relies on joint ventures, license arrangements and other business combinations with local nationals in these countries. In addition, political considerations may disrupt the commercial relationship between the Company and such government-owned petroleum companies. Although the Company has not experienced any significant problems in foreign countries arising from nationalistic policies, political instability, economic instability or currency restrictions, there can be no assurance that such a problem will not arise in the future.
The Company’s solids control, inspection and coating services routinely involve the handling of waste materials, some of which may be considered to be hazardous wastes. The Company is subject to numerous local, state and federal laws and regulations concerning the containment and disposal of materials, pursuant to which the Company has been required to incur compliance and clean-up costs, which were not substantial in 2001, 2000, and 1999. Compliance with environmental laws and regulations due to currently unknown circumstances or developments, however, could result in substantial costs and have a material adverse effect on the Company’s results of operations and financial condition.
A significant portion of the Company’s recent growth in revenues and profitability has been the result of its aggressive acquisition program. The Company’s future operating results will be impacted by the Company’s ability to identify additional attractive acquisition opportunities, consummate such acquisitions on favorable terms and successfully integrate the operations of the acquired businesses with those of the Company.
ITEM 7A. QUANTITATIVE & QUALITATIVE DISCLOSURE ABOUT MARKET RISK
The Company does not believe it has a material exposure to market risk. The Company has historically managed its exposure to interest changes by using a combination of fixed rate debt, variable rate debt, interest
36
swap and collar agreements in its total debt portfolio. As of December 31, 2001, the Company had no interest rate swap or collar agreements outstanding. At December 31, 2001, the Company had $322.6 million of outstanding debt. Fixed rate debt included $201.5 million of Senior Notes (net of discounts) at a fixed rate of 7 1/4% and $99.1 million of Senior Notes (net of discounts) at a fixed interest rate of 7 1/2%. With respect to foreign currency fluctuations, the Company uses natural hedges to minimize the effect of rate fluctuations. When natural hedges are not sufficient, generally it is the Company’s policy to enter into forward foreign exchange contracts to hedge significant transactions for periods consistent with the underlying risk. The Company had no forward foreign exchange contracts outstanding at December 31, 2001. The Company does not enter into foreign currency or interest rate transactions for speculative purposes.
ITEM 8. FINANCIAL STATEMENTS AND SUPPLEMENTARY DATA
The financial statements of the Company and subsidiaries required to be included in this Item 8 are set forth in Item 14 of this Report.
ITEM 9. CHANGES IN AND DISAGREEMENTS WITH ACCOUNTANTS ON ACCOUNTING AND
FINANCIAL DISCLOSURES
None.
37
PART III
ITEM 10. DIRECTORS AND EXECUTIVE OFFICERS OF THE REGISTRANT
Directors
The following persons serve as are our directors as of March 22, 2002:
Name | Age | Position with the Company | ||
George Boyadjieff | 63 | Chairman of the Board, Chief Executive Officer and Chief Technology Officer | ||
John F. Lauletta | 57 | Director, President and Chief Operating Officer | ||
George S. Dotson | 61 | Director | ||
Andre R. Horn | 73 | Director | ||
Richard A. Kertson | 62 | Director | ||
Eric L. Mattson | 50 | Director | ||
L.E. Simmons | 55 | Director | ||
Jeffery A. Smisek | 47 | Director | ||
Douglas E. Swanson | 63 | Director | ||
Eugene R. White | 70 | Director | ||
James D. Woods | 70 | Director |
Set forth below are descriptions of the backgrounds of the nominees and their principal occupations for at least the past five years and their public-company directorship positions as of March 22, 2002.
George Boyadjieff. Mr. Boyadjieff has been our Chairman of the Board and Chief Executive Officer since May 2000 and our Chief Technology Officer since May 2001. He served as a director of Varco from 1976 until May 2000. Mr. Boyadjieff was Chief Executive Officer of Varco from April 1991 and Chairman from May 1998 until May 2000 when he assumed his current positions. He served as President of Varco from 1981 until February 2000 and as Chief Operating Officer from June 1979 until April 1991. Prior to 1981, Mr. Boyadjieff was Senior Vice President-Operations and was first employed by Varco in 1969.
John F. Lauletta. Mr. Lauletta has been our President and served on our Board of Directors since April 1996 and has been our Chief Operating Officer since May 2000. From April 1996 until May 2000, Mr. Lauletta was our Chief Executive Officer. From 1993 until April 1996, Mr. Lauletta was the President and Chief Executive Officer of D.O.S., Ltd. From 1973 until 1993, Mr. Lauletta was with Baker Hughes Incorporated, a provider of products and services to the oil, gas and process industries, holding several executive positions, including President of Exlog/TOTCO, President of Milpark Drilling Fluids and Vice President of Baker Hughes INTEQ.
George S. Dotson. Mr. Dotson served as a director of Varco from February 1997 until May 2000, when he became a member of our Board of Directors. He is a director and Vice President of Helmerich & Payne, Inc. and is President of its subsidiary, Helmerich & Payne International Drilling Co., an owner-operator of drilling rigs, providing drilling services to both the land and offshore oil and gas drilling industry. Mr. Dotson has held these positions since 1977. He is also a director of Atwood Oceanics, Inc., an international off-shore drilling company.
Andre R. Horn. Mr. Horn served as a director of Varco from July 1987 until May 2000, when he became a member of our Board of Directors. He retired from Joy Manufacturing Co. in 1985, where he served as a director and Chairman of the Board. Mr. Horn was Chairman of the Board of Needham & Co., Inc., investment bankers, from 1985 until 1991. He is also a director of REMEC, Inc., a designer and manufacturer of high-frequency subsystems and components used in wireless communications and in defense electronics applications.
38
Richard A. Kertson. Mr. Kertson has served on our Board of Directors since August 2000. Mr. Kertson was Vice President-Finance and Chief Financial Officer of Varco from May 1984 until his retirement in February 2000. Mr. Kertson had been Controller of Varco Oil Tools from January 1982 until May 1984 and joined Varco in October 1975 as Director of Management Information Services.
Eric L. Mattson. Mr. Mattson has served on our Board of Directors since January 1994. Mr. Mattson has been the Chief Financial Officer of Netrail, Inc., a private Internet backbone and broadband service provider, since September 1999. Netrail filed for Chapter 11 Bankruptcy protection in the Northern Georgia district of the United States Bankruptcy Court in July 2001. Mr. Mattson currently serves as the Chief Financial Officer and the primary representative for Netrail in connection with finalization of Netrail’s bankruptcy proceedings. From July 1993 until May 1999, Mr. Mattson served as Senior Vice President and Chief Financial Officer of Baker Hughes Incorporated. For more than five years prior to 1993, Mr. Mattson was Vice President and Treasurer of Baker Hughes. Baker Hughes is a provider of products and services to the oil, gas and process industries.
L.E. Simmons. Mr. Simmons has served on our Board of Directors since April 1996 and was Chairman of our Board from April 1996 until May 2000. Mr. Simmons has served for more than five years as President and a director of SCF Partners, L.P., which serves as the general partner for various investment limited partnerships. Mr. Simmons is also a director of Zions Bancorporation, a multi-bank holding company, and Chairman of the Board of Oil States International, Inc., a provider of oil and gas drilling services.
Douglas E. Swanson. Mr. Swanson has served on our Board of Directors since October 1997. He has been President, Chief Executive Officer, and a director of Oil States International, Inc., a provider of oil and gas drilling services since January 2000. Mr. Swanson was the President, Chief Executive Officer and Chairman of the Board of Cliffs Drilling Company from 1992 to July 1999. From 1978 to 1992, Mr. Swanson was an Executive Vice President of Cliffs Drilling Company, an international offshore and land contract drilling company.
Jeffery A. Smisek. Mr. Smisek has served on our Board of Directors since February 1998. Mr. Smisek has been Executive Vice President—Corporate of Continental Airlines, Inc. since May 2001. From November 1996 to May 2001, Mr. Smisek was Executive Vice President, General Counsel and Secretary of Continental Airlines. Prior to that he served as Senior Vice President, General Counsel and Secretary. Prior to joining Continental Airlines in 1995, Mr. Smisek was a partner of Vinson & Elkins L.L.P., a law firm, for more than five years.
Eugene R. White. Mr. White served as a director of Varco from October 1990 until May 2000, when he became a member of our Board of Directors. He served as the Vice Chairman of Amdahl Corporation, a provider of mainframe computers and storage products, from 1987 to 1992, as Chairman of the Board from 1979 to 1987. Mr. White was Deputy Chairman of the Board, President and Chief Executive Officer of Amdahl Corporation from 1974 to 1979. He is also a director of Needham & Co., investment bankers, and Nextest Systems Corp., which is engaged in the business of automatic test equipment for the semiconductor industry.
James D. Woods. Mr. Woods served as a director of Varco from 1988 until May 2000 when he became a member of our Board of Directors. Mr. Woods is the Chairman Emeritus and retired Chief Executive Officer of Baker Hughes Incorporated. Mr. Woods was Chief Executive Officer of Baker Hughes from April 1987 and Chairman from January 1989, in each case until January 1998. Mr. Woods is also a director of United States Energy Co. (USEC), ESCO Technologies, a supplier of engineered filtration precuts to the process, healthcare and transportation markets, Integrated Electrical Services, a national provider of electrical services, and OMI Corporation, a bulk shipping company providing seaborne transportation services primarily of crude oil and refined petroleum products.
We are not aware of any family relationships between any of the foregoing directors or between any director and any executive officer.
39
Executive Officers
The following persons serve as our executive officers as of March 22, 2002:
Name | Age | Position with Company | ||
George Boyadjieff | 63 | Chairman of the Board, Chief Executive Officer and Chief Technology Officer | ||
John F. Lauletta | 57 | Director, President and Chief Operating Officer | ||
Joseph C. Winkler | 50 | Executive Vice President, Chief Financial Officer, Treasurer and President—Varco Drilling Equipment Group | ||
James F. Maroney, III | 50 | Vice President, Secretary and General Counsel | ||
Kenneth L. Nibling | 51 | Vice President—Human Resources and Administration | ||
Haynes B. Smith, III | 50 | President—Varco Services Group | ||
Clay C. Williams | 39 | Vice President—Corporate Development |
Set forth below are descriptions of the backgrounds of the executive officers and their principal occupations for at least the past five years. For a description of the backgrounds of Messrs. Boyadjieff and Lauletta, see “Election of Directors,” above. Michael W. Sutherlin, our former Group President, Products ceased serving as an executive officer as of February 7, 2002, in connection with his termination of employment to be effective in May 2002.
Joseph C. Winkler. Mr. Winkler has served as our Executive Vice President, Chief Financial Officer and Treasurer since April 1996 and since February 2002 he has served as President-Varco Drilling Equipment Group. From 1993 to April 1996, Mr. Winkler served as the Chief Financial Officer of D.O.S., Ltd. Prior to joining D.O.S., Ltd., he was Chief Financial Officer of Baker Hughes INTEQ and served in a similar role for various companies owned by Baker Hughes Incorporated including Eastman/Teleco and Milpark Drilling Fluids. For ten years prior to joining Baker Hughes, Mr. Winkler held the position of Chief Financial Officer of an independent oil and gas producer.
James F. Maroney, III. Mr. Maroney has served as our Vice President since May 1991, Secretary since January 1991 and General Counsel since November 1989. Mr. Maroney was our Assistant Secretary from December 1989 to January 1991. He was Associate General Counsel and Head of Litigation for TransAmerican Natural Gas Corporation, a gas production company, from 1987 to 1989. From 1985 to 1987, Mr. Maroney was in a private law practice specializing in commercial litigation.
Kenneth L. Nibling. Mr. Nibling has served as our Vice President-Human Resources and Administration since December 1991. From July 1988 to November 1991, Mr. Nibling was Director of Human Resources for Union Texas Petroleum Corp., an international exploration and production company. From January 1984 to July 1988, Mr. Nibling was Manager, Compensation and Employment for Louisiana Land and Exploration Company now a subsidiary of Burlington Resources, a crude oil and natural gas production company.
Haynes B. Smith, III. Mr. Smith has served as our President-Varco Services Group since May 2000. From July 1996 to May 2000, Mr. Smith was Vice President-Western Hemisphere Operations. From May 1991 to July 1996, Mr. Smith served as our Vice President and General Manager of Inspection Services. From 1989 to May 1991, Mr. Smith was our Northeast Zone Manager. From June 1972 to 1989, Mr. Smith held various sales and managerial positions with us and AMF Tuboscope Inc.
Clay C. Williams. Mr. Williams has been our Vice President-Corporate Development since February 2001 and from February 1997 until June 2000. From April 1999 to January 2001, he was Vice-President of Pipeline-Services for the Company. From April 1996 to February 1997, Mr. Williams was our Director of Corporate
40
Development. From March 1996 to April 1996, Mr. Williams was Director of Corporate Development of Drexel. Mr. Williams was an associate at SCF Partners, L.P. from January 1994 to March 1996. From July 1992 to December 1993, Mr. Williams was a graduate student at the University of Texas business school. Mr. Williams was an engineer for Shell Oil Company from 1985 to 1992.
We are not aware of any family relationships between any of the foregoing executive officers or between any executive officer and any director.
There is hereby incorporated herein by reference the information appearing under the caption “Compliance with Section 16(A) of the Securities Exchange Act of 1934” of the registrant’s definitive Proxy Statement for its 2002 Annual Meeting to be filed with the Commission on or before April 30, 2002.
ITEM 11. EXECUTIVE COMPENSATION
There is hereby incorporated herein by reference the information appearing under the caption “Executive Compensation” of the registrant’s definitive Proxy Statement for its 2002 Annual Meeting to be filed with the Commission on or before April 30, 2002.
ITEM 12. SECURITY OWNERSHIP OF CERTAIN BENEFICIAL OWNERS AND MANAGEMENT
There is hereby incorporated herein by reference the information appearing under the caption “Security Ownership of Certain Beneficial Owners and Management” of the registrant’s definitive Proxy Statement for its 2002 Annual Meeting to be filed with the Commission on or before April 30, 2002.
ITEM 13. CERTAIN RELATIONSHIPS AND RELATED TRANSACTIONS
None.
41
PART IV
ITEM 14. EXHIBITS, FINANCIAL STATEMENT SCHEDULES AND REPORTS ON FORM 8-K
(a)(1) Financial Statements of the Company
Page | ||
Report of Independent Auditors | F-1 | |
Consolidated Balance Sheets at December 31, 2001 and 2000 | F-2 | |
Consolidated Statements of Income for the years ended December 31, 2001, 2000, and 1999 | F-3 | |
Consolidated Statements of Common Stockholders’ Equity and Comprehensive Income for the years ended December 31, 2001, 2000, and 1999, | F-4 | |
Consolidated Statements of Cash Flows for the years ended December 31, 2001, 2000, and 1999 | F-5 | |
Notes to Consolidated Financial Statements | F-6 – F-31 |
(2) Financial Statement Schedules:
The information under the following captions is filed as part of this Report:
Schedule I Parent Company Only Condensed Balance Sheets | S-1 | |
Schedule I Parent Company Only Condensed Statements of Income | S-2 | |
Schedule I Parent Company Only Condensed Statements of Cash Flows | S-3 | |
Schedule I Parent Company Only Notes to Condensed Financial Statements | S-4 | |
Schedule II Valuation and Qualifying Accounts | S-5 |
All other schedules for which provision is made in the applicable accounting regulations of the Securities and Exchange Commission are not required under the related instructions or are inapplicable and therefore have been omitted or the information is presented in the consolidated financial statements or related notes.
(3) The list of exhibits contained in the Index to Exhibits are filed as part of this Report—Page 38.
(b) Reports on Form 8-K
There were no reports on Form 8-K filed in the fourth quarter of 2001.
42
EXHIBIT INDEX
Exhibit No. | Description | Note No. | ||
3.1 | Third Amended and Restated Certificate of Incorporation, dated May 30, 2000. | (Note 1) | ||
3.2 | Third Amended and Restated Bylaws. | (Note 1) | ||
3.3 | Certificate of Designations of Series A Junior Participating Preferred Stock, dated November 30, 2000. | (Note 1) | ||
4.1 | Rights Agreement, dated as of November 29, 2000, by and between the Company and Chase Mellon Shareholder Services, L.L.C., as Rights Agent, which includes the form of Certificate of Designations of the Series A Junior Participating Preferred Stock of Varco International, Inc. as Exhibit A, the form of Right Certificate as Exhibit B, and the Summary of Rights to Purchase Preferred Shares as Exhibit C. | (Note 1) | ||
4.2 | Registration Rights Agreement dated May 13, 1988 among the Company, Brentwood Associates, Hub Associates IV, L.P. and the investors listed therein. | (Note 2) | ||
4.3 | Purchase Agreement dated as of October 1, 1991 between the Company and Baker Hughes Incorporated regarding certain registration rights. | (Note 3) | ||
4.4 | Registration Rights Agreement dated April 24, 1996 among the Company, SCF III, L.P., D.O.S. Partners L.P., Panmell (Holdings), Ltd. and Zink Industries Limited. | (Note 9) | ||
4.5 | Registration Rights Agreement dated March 7, 1997 among the Company and certain stockholders of Fiber Glass Systems, Inc. | (Note 10) | ||
4.6 | Indenture, dated as of February 25, 1998, between the Company, the Guarantors named therein and The Bank of New York Trust Company of Florida as trustee, relating to $100,000,000 aggregate principal amount of 7 1/2% Senior Notes due 2008; Specimen Certificate of 7 1/2% Senior Notes due 2008 (private notes); and Specimen Certificate of 7 1/2% Senior Notes due 2008 (exchange notes). | (Note 11) | ||
4.8 | Indenture, dated as of May 1, 2001, among the Company, the Guarantors named therein and The Bank of New York, as trustee, relating to $200,000,000 aggregate principal amount of 7 1/4% Senior Notes due 2011; Specimen Certificate of 7 1/4% Senior Notes due 2011 (private notes); Specimen Certificate of 7 1/4% Senior Notes due 2011 (exchange notes) | (Note 27) | ||
10.1†† | Credit Agreement, dated as of January 30, 2002, among Varco International, Inc., as the Borrower, Wells Fargo Bank Texas, National Association, as Administrative Agent, Bank One, NA, as Syndication Agent, Credit Suisse First Boston, Cayman Islands Branch, as Documentation Agent, and the other Banks a party thereto. | |||
10.2* | Deferred Compensation Plan dated November 14, 1994; Amendment thereto dated May 11, 1998. | (Note 12) | ||
10.3* | Amended and Restated 1996 Equity Participation Plan | (Note 1) | ||
10.3.1*†† | Form of Non-qualified Stock Option Agreement for Employees and Consultants; Form of Non-qualified Stock Option Agreement for Independent Directors. | |||
10.4* | DOS Ltd. 1993 Stock Option Plan; Form of D.O.S. Ltd. Non-Statutory Stock Option Agreement. | (Note 8) | ||
10.5* | Amended and Restated Stock Option Plan for Key Employees of Tuboscope Vetco International Corporation; Form of Revised Incentive Stock Option Agreement; and Form of Revised Non-Qualified Stock Option Agreement. | (Note 4) | ||
10.6* | Stock Option Plan for Non-Employee Directors; Amendment to Stock Option Plan for Non-Employee Directors; and Form of Stock Option Agreement. | (Note 5) |
43
Exhibit No. | Description | Note No. | ||
10.7* | Varco International, Inc. Supplemental Executive Retirement Plan | (Note 21) | ||
10.7.1* | Amendment to Varco International, Inc. Supplemental Executive Retirement Plan | (Note 23) | ||
10.7.2* | Second Amendment to Varco International, Inc. Supplemental Executive Retirement Plan | (Note 24) | ||
10.8 | Lease dated March 7, 1985, as amended | (Note 15) | ||
10.8.1 | Agreement dated as of January 1, 1982, with respect to Lease included as Exhibit 10.8 hereof | (Note 16) | ||
10.8.2 | Agreement dated as of January 1, 1984, with respect to Lease included as Exhibit 10.8 hereto | (Note 17) | ||
10.8.3 | Agreement dated as of February 8, 1985, with respect to Lease included as Exhibit 10.8 hereto | (Note 17) | ||
10.8.4 | Agreement dated as of April 12, 1985, with respect to Lease included as Exhibit 10.8 hereto | (Note 18) | ||
10.8.5 | Amendment dated as of January 11, 1996, with respect to Lease included as Exhibit 10.8 hereto | (Note 22) | ||
10.9 | Standard Industrial Lease-Net dated September 29, 1988 for the premises at 743 N. Eckhoff, Orange, California | (Note 19) | ||
10.9.1 | First amendment dated as of January 11, 1996 to Lease included as Exhibit 10.9 hereto | (Note 22) | ||
10.10* | The Varco International, Inc. 1990 Stock Option Plan, as amended | (Note 20) | ||
10.10.1* | Amendments to the Varco International, Inc. 1990 Stock Option Plan | (Note 25) | ||
10.11* | Varco International, Inc. 1994 Directors’ Stock Option Plan | (Note 22) | ||
10.11.1* | Amendment to Varco International, Inc. 1994 Directors’ Stock Option Plan | (Note 24) | ||
10.12* | The Varco International, Inc. Deferred Compensation Plan. | (Note 25) | ||
10.13 | Master Leasing Agreement, dated December 18, 1995 between the Company and Heller Financial Leasing, Inc. | (Note 6) | ||
10.14* | Form of Executive Agreement of certain members of senior management | (Note 14) | ||
10.14.1* | Form of First Amendment to Executive Agreements | (Note 14) | ||
10.15* | Executive Agreement of John F. Lauletta | (Note 14) | ||
10.16* | Executive Agreement of Joseph C. Winkler | (Note 14) | ||
10.17* | Executive Agreement of George Boyadjieff | (Note 26) | ||
10.18* | Executive Agreement of Michael W. Sutherlin | (Note 26) | ||
10.19* | Form of Indemnity Agreement | (Note 14) | ||
2†† | Subsidiaries | |||
23 | Consent of Independent Auditors |
For purposes of this list of exhibits and the notes below, the term “Company” refers to the registrant, Varco International, Inc., a Delaware corporation formerly known as Tuboscope Inc., and the term “Varco” refers to Varco International, Inc., a California corporation which merged with and into the registrant in June 2000.
| * | Management contract, compensation plan or arrangement. |
| †† | Previously filed with Varco’s original Annual Report on Form 10-K for the year ended December 31, 2001. |
44
Note 1 | Incorporated by reference to the Company’s Annual Report on Form 10-K for the fiscal year ended December 31, 2000. | |
Note 2 | Incorporated by reference to the Company’s Registration Statement on Form S-1 (No. 33-31102). | |
Note 3 | Incorporated by reference to the Company’s Registration Statement on Form S-1 (No. 33-43525). | |
Note 4 | Incorporated by reference to the Company’s Registration Statement on Form S-8 (No. 33-72150). | |
Note 5 | Incorporated by reference to the Company’s Registration Statement on Form S-8 (No. 33-72072). | |
Note 6 | Incorporated by reference to the Company’s Annual Report on Form 10-K for the fiscal year ended December 31, 1995. | |
Note 7 | Incorporated by reference to the Company’s Registration Statement on Form S-8 (No. 333-05233). | |
Note 8 | Incorporated by reference to the Company’s Registration Statement on Form S-8 (No. 333-05237). | |
Note 9 | Incorporated by reference to the Company’s Current Report on Form 8-K filed on January 16, 1996. | |
Note 10 | Incorporated by reference to the Company’s Current Report on 8-K filed on March 19, 1997, as amended by Amendment No. 1 filed on May 7, 1997. | |
Note 11 | Incorporated by reference to the Company’s Registration Statement on Form S-4 (No. 333-51115). | |
Note 12 | Incorporated by reference to the Company’s Quarterly Report on Form 10-Q for the quarter ended June 30, 1998. | |
Note 13 | Incorporated by reference to the Company’s Annual Report on Form 10-K for the fiscal year ended December 31, 1998. | |
Note 14 | Incorporated by reference to the Company’s Registration Statement of Form S-4 (333-34582) | |
Note 15 | Incorporated by reference to Varco’s Annual Report on Form 10-K for the year ended December 31, 1981. | |
Note 16 | Incorporated by reference to Varco’s Annual Report on Form 10-K for the fiscal year ended December 31, 1982. | |
Note 17 | Incorporated by reference to Varco’s Annual Report on Form 10-K for the fiscal year ended December 31, 1984. | |
Note 18 | Incorporated by reference to Varco’s Quarterly Report on Form 10-Q for the fiscal quarter ended June 30, 1985. | |
Note 19 | Incorporated by reference to Varco’s Annual Report on Form 10-K for the fiscal year ended December 31, 1988. | |
Note 20 | Incorporated by reference to Varco’s Registration Statement on Form S-8, Registration No. 333-21681. | |
Note 21 | Incorporated by reference to Varco’s Annual Report on Form 10-K for the fiscal year ended December 31, 1992. | |
Note 22 | Incorporated by reference to Varco’s Annual Report on Form 10-K for the fiscal year ended December 31, 1995. | |
Note 23 | Incorporated by reference to Varco’s Annual Report on Form 10-K for the fiscal year ended December 31, 1996. | |
Note 24 | Incorporated by reference to Varco’s Annual Report on Form 10-K for the fiscal year ended December 31, 1997. | |
Note 25 | Incorporated by reference to Varco’s Annual Report on Form 10-K for the year ended December 31, 1999. | |
Note 26 | Incorporated by reference to Varco’s Annual Report on Form 10-K/A for the year ended December 31, 1999. | |
Note 27 | Incorporated by reference to Varco’s Registration Statement on Form S-4 filed on June 29, 2001 (No. 333-64226). |
45
SIGNATURES
Pursuant to the requirements of Section 13 or 15 (d) of the Securities Exchange Act of 1934, the registrant has duly caused this report to be signed on its behalf by the undersigned, thereunto duly authorized.
VARCO INTERNATIONAL, INC. | ||||||||
Dated: February 25, 2003 | By: | /s/ JOHN F. LAULETTA | ||||||
John F. Lauletta Chief Executive Officer and President | ||||||||
46
CERTIFICATIONS
I, John F. Lauletta, certify that:
1. I have reviewed this annual report on Form 10-K/A of Varco International, Inc.;
2. Based on my knowledge, this annual report does not contain any untrue statement of a material fact or omit to state a material fact necessary to make the statements made, in light of the circumstances under which such statements were made, not misleading with respect to the period covered by this annual report;
3. Based on my knowledge, the financial statements, and other financial information included in this annual report, fairly present in all material respects the financial condition, results of operations and cash flows of the registrant as of, and for, the periods presented in this annual report;
Dated: February25, 2003 | /s/ JOHN F. LAULETTA | |
John F. Lauletta Chief Executive Officer and President |
I, Clay C. Williams, certify that:
1. I have reviewed this annual report on Form 10-K/A of Varco International, Inc.;
2. Based on my knowledge, this annual report does not contain any untrue statement of a material fact or omit to state a material fact necessary to make the statements made, in light of the circumstances under which such statements were made, not misleading with respect to the period covered by this annual report;
3. Based on my knowledge, the financial statements, and other financial information included in this annual report, fairly present in all material respects the financial condition, results of operations and cash flows of the registrant as of, and for, the periods presented in this annual report;
Dated: February25, 2003 | /s/ CLAY C. WILLIAMS | |
Clay C. Williams Vice President and Chief Financial Officer |
REPORT OF INDEPENDENT AUDITORS
The Board of Directors and Stockholders
Varco International, Inc.
We have audited the accompanying consolidated balance sheets of Varco International, Inc. as of December 31, 2001 and 2000 and the related consolidated statements of income, common stockholders’ equity and comprehensive income, and cash flows for each of the three years in the period ended December 31, 2001. Our audits also included the financial statement schedules listed in the Index at Item 14(a). These financial statements and schedules are the responsibility of the Company’s management. Our responsibility is to express an opinion on these financial statements and schedules based on our audits.
We conducted our audits in accordance with auditing standards generally accepted in the United States. Those standards require that we plan and perform the audit to obtain reasonable assurance about whether the financial statements are free of material misstatement. An audit includes examining, on a test basis, evidence supporting the amounts and disclosures in the financial statements. An audit also includes assessing the accounting principles used and significant estimates made by management, as well as evaluating the overall financial statement presentation. We believe that our audits provide a reasonable basis for our opinion.
In our opinion, the consolidated financial statements referred to above present fairly, in all material respects, the consolidated financial position of Varco International, Inc. at December 31, 2001 and 2000, and the consolidated results of its income and its cash flows for each of the three years in the period ended December 31, 2001, in conformity with accounting principles generally accepted in the United States. Also, in our opinion, the related financial statement schedules, when considered in relation to the basic financial statements taken as a whole, present fairly in all material respects the information set forth therein.
ERNST & YOUNG LLP
Houston, Texas
January 31, 2002
F-1
VARCO INTERNATIONAL, INC.
CONSOLIDATED BALANCE SHEETS
December 31, 2001 | December 31, 2000 | |||||||
(in thousands) | ||||||||
ASSETS | ||||||||
Current assets: | ||||||||
Cash and cash equivalents | $ | 57,499 |
| $ | 12,176 |
| ||
Accounts receivable, net |
| 342,036 |
|
| 269,393 |
| ||
Inventory, net |
| 229,678 |
|
| 152,350 |
| ||
Deferred tax assets |
| 6,618 |
|
| 4,889 |
| ||
Prepaid expenses and other |
| 27,374 |
|
| 16,898 |
| ||
Total current assets |
| 663,205 |
|
| 455,706 |
| ||
Property and equipment, net |
| 400,416 |
|
| 343,673 |
| ||
Identified intangibles, net |
| 30,722 |
|
| 26,062 |
| ||
Goodwill, net |
| 325,135 |
|
| 238,641 |
| ||
Other assets, net |
| 9,632 |
|
| 12,900 |
| ||
Total assets | $ | 1,429,110 |
| $ | 1,076,982 |
| ||
LIABILITIES AND EQUITY | ||||||||
Current liabilities: | ||||||||
Accounts payable | $ | 102,559 |
| $ | 66,182 |
| ||
Accrued liabilities |
| 102,315 |
|
| 91,423 |
| ||
Income taxes payable |
| 27,652 |
|
| 4,376 |
| ||
Current portion of long-term debt and short-term borrowings |
| 7,077 |
|
| 30,347 |
| ||
Total current liabilities |
| 239,603 |
|
| 192,328 |
| ||
Long-term debt |
| 315,537 |
|
| 106,160 |
| ||
Pension liabilities and post-retirement obligations |
| 25,834 |
|
| 24,556 |
| ||
Deferred taxes payable |
| 18,604 |
|
| 20,867 |
| ||
Other liabilities |
| 1,218 |
|
| 1,088 |
| ||
Total liabilities |
| 600,796 |
|
| 344,999 |
| ||
Common stockholders’ equity: | ||||||||
Common stock, $.01 par value, 200,000,000 shares authorized, 97,402,339 shares issued and 95,977,639 shares outstanding at December 31, 2001 (96,245,849 shares issued and 94,821,149 shares outstanding at December 31, 2000) |
| 974 |
|
| 962 |
| ||
Paid in capital |
| 514,137 |
|
| 498,692 |
| ||
Retained earnings |
| 347,548 |
|
| 264,580 |
| ||
Accumulated other comprehensive loss |
| (19,015 | ) |
| (16,921 | ) | ||
Less: treasury stock at cost (1,424,700 shares) |
| (15,330 | ) |
| (15,330 | ) | ||
Total common stockholders’ equity |
| 828,314 |
|
| 731,983 |
| ||
Total liabilities and equity | $ | 1,429,110 |
| $ | 1,076,982 |
| ||
See accompanying notes.
F-2
VARCO INTERNATIONAL, INC.
CONSOLIDATED STATEMENTS OF INCOME
Years Ended December 31, | ||||||||||||
2001 | 2000 | 1999 | ||||||||||
(in thousands, except for common shares and per share data) | ||||||||||||
Revenue: | ||||||||||||
Sales | $ | 751,284 |
| $ | 463,556 |
| $ | 708,587 |
| |||
Services and rentals |
| 516,525 |
|
| 403,059 |
|
| 267,261 |
| |||
Total |
| 1,267,809 |
|
| 866,615 |
|
| 975,848 |
| |||
Cost and expenses: | ||||||||||||
Cost of sales |
| 488,558 |
|
| 296,955 |
|
| 491,481 |
| |||
Cost of services and rentals |
| 395,257 |
|
| 321,647 |
|
| 225,436 |
| |||
Amortization of goodwill |
| 10,457 |
|
| 8,444 |
|
| 8,431 |
| |||
Selling, general and administrative |
| 152,276 |
|
| 119,942 |
|
| 135,195 |
| |||
Research and engineering costs |
| 46,635 |
|
| 32,146 |
|
| 40,149 |
| |||
Merger, transaction, and litigation costs |
| 16,500 |
|
| 26,570 |
|
| 7,808 |
| |||
Total |
| 1,109,683 |
|
| 805,704 |
|
| 908,500 |
| |||
Operating profit |
| 158,126 |
|
| 60,911 |
|
| 67,348 |
| |||
Other expense (income): | ||||||||||||
Interest expense |
| 21,776 |
|
| 15,282 |
|
| 18,926 |
| |||
Interest income |
| (2,145 | ) |
| (3,374 | ) |
| (2,694 | ) | |||
Foreign exchange loss (gain) |
| (71 | ) |
| 1,134 |
|
| (473 | ) | |||
Other |
| 6,471 |
|
| 2,022 |
|
| 1,527 |
| |||
Income before income taxes |
| 132,095 |
|
| 45,847 |
|
| 50,062 |
| |||
Provision for income taxes |
| 49,127 |
|
| 24,792 |
|
| 20,253 |
| |||
Net income | $ | 82,968 |
| $ | 21,055 |
| $ | 29,809 |
| |||
Earnings per common share: | ||||||||||||
Basic earnings per common share | $ | 0.87 |
| $ | 0.23 |
| $ | 0.33 |
| |||
Dilutive earnings per common share | $ | 0.86 |
| $ | 0.22 |
| $ | 0.32 |
| |||
Weighted average number of common shares outstanding: | ||||||||||||
Basic |
| 95,732,897 |
|
| 92,773,815 |
|
| 90,659,770 |
| |||
Dilutive |
| 96,675,294 |
|
| 95,355,904 |
|
| 92,693,264 |
| |||
See accompanying notes.
F-3
VARCO INTERNATONAL, INC.
CONSOLIDATED STATEMENTS OF COMMON STOCKHOLDERS’ EQUITY AND COMPREHENSIVE INCOME
Shares Outstanding | Common Stock $.01 Par Value | Paid in Capital | Retained Earnings | Accumulated Other Comprehensive Income (loss) | Treasury Stock | Total Common Stockholders’ Equity | ||||||||||||||||||
(in thousands) | ||||||||||||||||||||||||
Balance at December 31, 1998 | 90,150 | $ | 917 | $ | 466,302 |
| $ | 213,716 | $ | (7,164 | ) | $ | (15,330 | ) | $ | 658,441 |
| |||||||
1999 Comprehensive income: | ||||||||||||||||||||||||
Net income | — |
| — |
| — |
|
| 29,809 |
| — |
|
| — |
|
| 29,809 |
| |||||||
Foreign currency translation adjustment | — |
| — |
| — |
|
| — |
| (3,487 | ) |
| — |
|
| (3,487 | ) | |||||||
Unrealized gains on investments | — |
| — |
| — |
|
| — |
| 41 |
|
| — |
|
| 41 |
| |||||||
1999 Comprehensive income | — |
| — |
| — |
|
| 29,809 |
| (3,446 | ) |
| — |
|
| 26,363 |
| |||||||
Common stock issued | 1,028 |
| 9 |
| 8,595 |
|
| — |
| — |
|
| — |
|
| 8,604 |
| |||||||
Tax benefit of options exercised | — |
| — |
| 837 |
|
| — |
| — |
|
| — |
|
| 837 |
| |||||||
Balance at December 31, 1999 | 91,178 |
| 926 |
| 475,734 |
|
| 243,525 |
| (10,610 | ) |
| (15,330 | ) |
| 694,245 |
| |||||||
2000 Comprehensive income: | ||||||||||||||||||||||||
Net income | — |
| — |
| — |
|
| 21,055 |
| — |
|
| — |
|
| 21,055 |
| |||||||
Foreign currency translation adjustment | — |
| — |
| — |
|
| — |
| (6,311 | ) |
| — |
|
| (6,311 | ) | |||||||
2000 Comprehensive income | — |
| — |
| — |
|
| 21,055 |
| (6,311 | ) |
| — |
|
| 14,744 |
| |||||||
Common stock issued | 1,297 |
| 13 |
| 12,212 |
|
| — |
| — |
|
| — |
|
| 12,225 |
| |||||||
Common stock issued executive match program | 323 |
| 3 |
| 6,428 |
|
| — |
| — |
|
| — |
|
| 6,431 |
| |||||||
Conversion of stock warrants | 2,023 |
| 20 |
| (20 | ) |
| — |
| — |
|
| — |
|
| — |
| |||||||
Tax benefit of options exercised | — |
| — |
| 4,338 |
|
| — |
| — |
|
| — |
|
| 4,338 |
| |||||||
Balance at December 31, 2000 | 94,821 |
| 962 |
| 498,692 |
|
| 264,580 |
| (16,921 | ) |
| (15,330 | ) |
| 731,983 |
| |||||||
2001 Comprehensive income: | ||||||||||||||||||||||||
Net income | — |
| — |
| — |
|
| 82,968 |
| — |
|
| — |
|
| 82,968 |
| |||||||
Foreign currency translation adjustment | — |
| — |
| — |
|
| — |
| (2,094 | ) |
| — |
|
| (2,094 | ) | |||||||
2001 Comprehensive income | — |
| — |
| — |
|
| 82,968 |
| (2,094 | ) |
| — |
|
| 80,874 |
| |||||||
Common stock issued | 1,101 |
| 11 |
| 10,806 |
|
| — |
| — |
|
| — |
|
| 10,817 |
| |||||||
Common stock issued in exchange for convertible debt | 56 |
| 1 |
| 833 |
|
| — |
| — |
|
| — |
|
| 834 |
| |||||||
Tax benefit of options exercised | — |
| — |
| 3,806 |
|
| — |
| — |
|
| — |
|
| 3,806 |
| |||||||
Balance at December 31, 2001 | 95,978 | $ | 974 | $ | 514,137 |
| $ | 347,548 | $ | (19,015 | ) | $ | (15,330 | ) | $ | 828,314 |
| |||||||
See accompanying notes.
F-4
VARCO INTERNATIONAL, INC.
CONSOLIDATED STATEMENTS OF CASH FLOWS
Years Ended December 31, | ||||||||||||
2001 | 2000 | 1999 | ||||||||||
(in thousands) | ||||||||||||
Cash flows from operating activities: | ||||||||||||
Net income | $ | 82,968 |
| $ | 21,055 |
| $ | 29,809 |
| |||
Adjustments to reconcile net income to net cash provided by operating activities: | ||||||||||||
Depreciation and amortization |
| 67,900 |
|
| 56,518 |
|
| 57,180 |
| |||
Non-cash merger and transaction costs |
| — |
|
| 12,101 |
|
| — |
| |||
Provision for losses on accounts receivable |
| 6,326 |
|
| 4,895 |
|
| 2,148 |
| |||
Provision for losses on inventory |
| 9,507 |
|
| 5,772 |
|
| 4,279 |
| |||
Provision (benefit) for deferred taxes |
| (8,146 | ) |
| 5,826 |
|
| 2,244 |
| |||
Write off investments |
| 1,986 |
|
| — |
|
| 4,279 |
| |||
Stock compensation |
| — |
|
| 2,176 |
|
| 2,209 |
| |||
Other non-cash charges |
| 408 |
|
| (352 | ) |
| 269 |
| |||
Changes in current assets and liabilities, net of effects from acquisitions: | ||||||||||||
Accounts receivable |
| (51,872 | ) |
| (15,904 | ) |
| 50,722 |
| |||
Inventory |
| (60,914 | ) |
| (9,852 | ) |
| 100,230 |
| |||
Prepaid expenses and other assets |
| (9,520 | ) |
| 481 |
|
| 2,104 |
| |||
Accounts payable, accrued liabilities and other |
| 19,954 |
|
| (6,552 | ) |
| (124,416 | ) | |||
Income taxes payable |
| 25,398 |
|
| 5,623 |
|
| (7,914 | ) | |||
Net cash provided by operating activities |
| 83,995 |
|
| 81,787 |
|
| 119,064 |
| |||
Cash flows used for investing activities: | ||||||||||||
Capital expenditures |
| (65,834 | ) |
| (45,463 | ) |
| (30,729 | ) | |||
Proceeds from the sale of fixed assets |
| 461 |
|
| 2,094 |
|
| — |
| |||
Business acquisitions, net of cash acquired |
| (145,953 | ) |
| (21,685 | ) |
| (13,120 | ) | |||
Other |
| 200 |
|
| 182 |
|
| 211 |
| |||
Net cash used for investing activities |
| (211,126 | ) |
| (64,872 | ) |
| (43,638 | ) | |||
Cash flows provided by (used for) financing activities: | ||||||||||||
Borrowings under financing agreements, net |
| 302,600 |
|
| 16,953 |
|
| 55,192 |
| |||
Principal payments under financing agreements |
| (137,832 | ) |
| (113,720 | ) |
| (90,708 | ) | |||
Debt issue costs |
| (1,782 | ) |
| — |
|
| — |
| |||
Proceeds from sale of common stock, net |
| 10,132 |
|
| 10,049 |
|
| 5,625 |
| |||
Net cash provided by (used for) financing activities |
| 173,118 |
|
| (86,718 | ) |
| (29,891 | ) | |||
Effect of exchange rate changes on cash |
| (664 | ) |
| (1,138 | ) |
| (291 | ) | |||
Net increase (decrease) in cash and cash equivalents |
| 45,323 |
|
| (70,941 | ) |
| 45,244 |
| |||
Cash and cash equivalents: | ||||||||||||
Beginning of period |
| 12,176 |
|
| 83,117 |
|
| 37,873 |
| |||
End of period | $ | 57,499 |
| $ | 12,176 |
| $ | 83,117 |
| |||
Supplemental disclosure of cash information: | ||||||||||||
Cash paid during the year for: | ||||||||||||
Interest | $ | 19,350 |
| $ | 17,473 |
| $ | 20,302 |
| |||
Taxes | $ | 31,740 |
| $ | 12,643 |
| $ | 25,389 |
| |||
See accompanying notes.
F-5
VARCO INTERNATIONAL, INC.
NOTES TO CONSOLIDATED FINANCIAL STATEMENTS
1. Basis of Presentation
Consolidation
The accompanying consolidated financial statements include the accounts of the Company and its wholly-owned subsidiaries. All intercompany accounts and transactions have been eliminated.
Merger
On May 30, 2000, the Company completed a merger with Varco International, Inc., a California corporation (“Varco”), by exchanging 46.8 million shares of its common stock for all of the common stock of Varco (the “Merger”). Each share of Varco’s stock was exchanged for .7125 of one share of the Company’s common stock. In addition, outstanding Varco stock options were converted at the same exchange ratio into options to acquire approximately 2.2 million shares of the Company’s common stock. In connection with the merger, the Company changed its name to Varco International, Inc., and its New York Stock Exchange (NYSE) symbol from “TBI” to “VRC”.
The Merger was accounted for as a pooling of interests and accordingly, all prior period consolidated financial statements were restated to include the combined results of operations, financial condition and cash flows of Varco.
Revenues and net income, before merger and transaction costs, related to the Merger of the separate companies prior to the completion of the Merger on May 30, 2000, were as follows (in thousands):
2000 | 1999 | ||||||
Revenues: | |||||||
Tuboscope | $ | 224,730 | $ | 385,474 |
| ||
Varco |
| 184,866 |
| 590,374 |
| ||
Total | $ | 409,596 | $ | 975,848 |
| ||
Net income before merger & transaction costs related to the merger: | |||||||
Tuboscope | $ | 5,838 | $ | (7,156 | ) | ||
Varco |
| 10,106 |
| 36,965 |
| ||
Total | $ | 15,944 | $ | 29,809 |
| ||
In connection with the Merger, the Company incurred $26,570,000 of transaction costs in the twelve months ended December 31, 2000. Cash and accrued cash transaction costs included financial advisor fees of $9,714,000, compensation costs of $4,308,000 and other costs, including legal, accounting and printing costs of $3,948,000. Non-cash transaction costs included $5,072,000 to fully vest employees participating in the Executive Stock Match Program and $3,528,000 of equipment rationalization write-offs.
As a result of the Merger, certain executives and key employees of the Company may, upon termination of their employment, be entitled to enhanced severance benefits pursuant to their severance agreements with the Company. It is not possible to estimate the number of executives or key employees who may voluntarily or involuntarily terminate their employment with the Company; accordingly, no amounts have been provided for such payments. The maximum amount that would be paid pursuant to all such severance agreements is approximately $16,800,000.
There were no material transactions between the Company and Varco prior to the Merger. The effects of conforming Varco’s accounting policies to those of the Company were not material.
F-6
VARCO INTERNATIONAL, INC.
NOTES TO CONSOLIDATED FINANCIAL STATEMENTS—(Continued)
Nature of Business and Risk Factors
The Merger created one of the world’s leading drilling equipment and services company. The combined company carries market leadership positions in each of its four principal business segments: Drilling Equipment Sales, Tubular Services, Drilling Services and Coiled Tubing and Wireline Products. The Company provides its customers with the most comprehensive range of drilling rig equipment and services and tubular services in the industry. A more detailed description of products and services is provided in Note 12Business Segments and Foreign Operations.
The Company’s overall results depend largely on the level of worldwide oil drilling and production activity, the prices of oil and gas, and worldwide oil and gas inventory levels. Demand for the Company’s Drilling Equipment Sales is largely dependent on the level of offshore drilling activity. Demand for the Company’s Tubular Services is based on the relatively low cost of its services compared to the costs to a customer of a failure or interruption in service. Demand for the Company’s Drilling Services is due to the reduction of drilling costs in land and offshore drilling operations, and its ability to help minimize the environmental impact of drilling operations. Demand for the Company’s Coiled Tubing & Wireline equipment is due to the economic benefits Coiled Tubing equipment provides in oil and gas workover operations versus conventional techniques, including quicker service time, and the continuous production of the well.
The Company operates in over 49 countries around the world. Its revenues are geographically concentrated in North America (50%), Latin America (13%), Europe, Africa, and the Middle East (27%), and the Far East (8%). As a result of its international presence, the Company’s operations are subject to the risks normally associated with conducting businesses in foreign countries, including uncertain political and economic environments, which may limit or disrupt markets, restrict the movement of funds or result in the deprivation of contract rights or the taking of property without compensation. In addition, the Company has significant customer concentrations in the Middle East, Latin America and the Far East whose spending can be volatile based on oil price changes, the political environment and delays in the government budget. Adverse changes in individual circumstances can have a significant negative impact on the financial performance of the Company.
2. Summary of Significant Accounting Policies
Revenue Recognition
The Company’s products and services are generally sold based upon purchase orders or contracts with the customer that include fixed or determinable prices and that do not include right of return or other similar provisions or other significant post delivery obligations. The Company records revenue at the time its manufacturing process is complete, the customer has been provided with all proper inspection and other required documentation, title and risk of loss has passed to the customer and when collectibility is reasonably assured. The Company also recognizes revenue on bill-and-hold transactions where the product has been completed and is ready to be shipped, however at the customer’s request, the Company is storing the product on the customers’ behalf for a brief period of time, typically less than one year. Customer advances or deposits are deferred and recognized as revenue when the Company has completed all of its performance obligations related to the sale. The Company also recognizes revenue as services are performed.
Cash and Cash Equivalents
The Company considers all highly liquid investments with a maturity of three months or less to be cash equivalents.
F-7
VARCO INTERNATIONAL, INC.
NOTES TO CONSOLIDATED FINANCIAL STATEMENTS—(Continued)
Financial Instruments and Concentrations of Credit Risk
The carrying amounts of financial instruments including cash and cash equivalents, short-term investments, accounts receivable and accounts payable approximated fair value because of the relatively short maturity of these instruments. The carrying value of debt approximated fair values as of December 31, 2001 and 2000 except for the Company’s $100,000,000 7 1/2% Senior Notes due 2008, and $200,000,000 7 1/4% Senior Notes due 2011. Based on information provided by a national brokerage company, the $100 million Senior Notes were valued at $103,030,000 and $95,369,000 at December 31, 2001 and 2000, and the $200 million Senior Notes were valued at $199,960,000 at December 31, 2001.
Substantially all of the Company’s accounts receivable are due from customers in the oil and gas industry, both in the United States and internationally. The Company performs periodic credit evaluations of its customers and generally does not require collateral. In certain circumstances, the Company requires letters of credit to further insure credit worthiness.
Reserve for bad debts are determined on a specific identification basis when we believe that the required payment of specific amounts owed to us is not probable. Accounts receivable are net of allowances for doubtful accounts of approximately $11,517,000 and $10,199,000 at December 31, 2001 and 2000, respectively.
Inventory
Inventories are stated at the lower of cost or market. The Company determines the cost of inventories using the last-in, first-out (“LIFO”) method for its Drilling Equipment Sales inventory and the weighted average method for other inventory. Reserves for inventory obsolescence are determined based on our historical usage of inventory on-hand as well as our future expectations related to our substantial installed base and the development of new products. Inventory is net of our reserve of excess and obsolete inventory of approximately $31,028,000 and $23,333,000 at December 31, 2001 and 2000, respectively.
Property and equipment
Property and equipment is stated at cost, net of accumulated depreciation. Depreciation is computed using the straight-line method over the estimated useful lives for financial reporting purposes and generally by the accelerated or modified accelerated costs recovery systems for income tax reporting purposes. Estimated useful lives are 30 years for buildings and 5-12 years for machinery and equipment. The cost of repairs and maintenance is charged to income as incurred. Major repairs and improvements are capitalized and depreciated over the remaining useful life of the asset. The depreciation of fixed assets recorded under capital lease agreements is included in depreciation expense. Property and equipment depreciation expense was $53,781,000, $44,789,000, and $45,387,000, for the years ended December 31, 2001, 2000, and 1999, respectively.
Identified intangibles
Identified intangibles are being amortized on a straight-line basis, over estimated useful lives between 5 and 40 years, and are presented net of accumulated amortization of approximately $26,369,000 and $23,544,000 at December 31, 2001 and 2000, respectively. Identified intangibles consist primarily of technology, patents, trademarks, license agreements, existing service contracts and covenants not to compete.
Goodwill
Goodwill represents the excess of the purchase price over the fair market value of the net assets acquired. Such excess costs are being amortized on a straight-line basis over lives ranging from 10-40 years depending on
F-8
VARCO INTERNATIONAL, INC.
NOTES TO CONSOLIDATED FINANCIAL STATEMENTS—(Continued)
the estimated economic life. Accumulated amortization at December 31, 2001 and 2000 was approximately $55,361,000, and $44,904,000, respectively. On an annual basis, the Company estimates the future estimated undiscounted cash flows of the business to which goodwill related in order to determine that the carrying value of the goodwill had not been impaired.
Impairment of Long-Lived Assets
Impairment losses are recorded on long-lived assets used in operations when indicators of impairment are present and the undiscounted cash flows estimated to be generated by those assets are less than the assets’ carrying amount. Long-lived assets expected to be disposed of, including excess equipment and production facilities held for sale, are stated at their estimated fair value less cost to sell.
Warranty Accruals
Accruals for warranty claims are provided based on historical experience at the time of sale. Product warranties generally cover periods from one to three years. Our accruals for warranty claims are affected by the size of our installed base of products currently under warranty, as well as new products delivered to the market.
Environmental Liabilities
When environmental assessments or remediations are probable and the costs can be reasonable estimated, remediation liabilities are recorded on an undiscounted basis and are adjusted as further information develops or circumstances change.
Income taxes
The liability method is used to account for income taxes. Deferred tax assets and liabilities are determined based on differences between financial reporting and tax bases of assets and liabilities and are measured using the enacted tax rates and laws that will be in effect when the differences are expected to reverse. Valuation allowances are established when necessary to reduce deferred tax assets to amounts which are more likely than not to be realized. The provision for income taxes is the tax payable or refundable for the period plus or minus the change during the period in deferred tax assets and liabilities.
Derivative financial instruments
In June 1998, the Financial Accounting Standards Board issued Statement No. 133, “Accounting for Derivative Instruments and Hedging Activities” (SFAS 133). As amended SFAS 133 establishes accounting and reporting standards for derivative instruments, including certain derivative instruments embedded in other contracts and for hedging activities. This statement requires that an entity recognize all derivatives as either assets or liabilities in the statement of financial position and measure those instruments at fair value. This statement was adopted effective January 1, 2001 and did not have a material impact on the Company’s financial position or results of operations.
Foreign exchange rates
Revenue and expenses for foreign operations have been translated into U.S. dollars using average exchange rates and reflect currency exchange gains and losses resulting from transactions conducted in other than functional currencies.
F-9
VARCO INTERNATIONAL, INC.
NOTES TO CONSOLIDATED FINANCIAL STATEMENTS—(Continued)
The assets and liabilities of certain foreign subsidiaries are translated at current exchange rates and the related translation adjustments are recorded directly in stockholders’ equity. For subsidiaries which operate in countries which have highly inflationary economies, certain assets are translated at historical exchange rates and all translation adjustments are reflected in the statements of income.
Stock based compensation
The Company accounts for stock option grants to employees in accordance with the intrinsic value method.
Earnings per common share
Basic earnings per common share is computed by dividing net income by the weighted-average number of common shares outstanding for the period. The Company’s diluted earnings per common share is calculated by adjusting net income for after-tax interest expense on convertible debt and dividing that number by the weighted average number of common shares outstanding plus shares which would be assumed outstanding after conversion of convertible debt, vested stock options and outstanding stock warrants under the treasury stock method.
The following table sets forth the computation of basic and dilutive earnings per share (net income in thousands):
Years Ended December 31, | |||||||||
2001 | 2000 | 1999 | |||||||
Numerator: | |||||||||
Net income | $ | 82,968 | $ | 21,055 | $ | 29,809 | |||
Denominator: | |||||||||
Basic—weighted average common shares outstanding |
| 95,732,897 |
| 92,773,815 |
| 90,659,770 | |||
Dilutive effect of: | |||||||||
Employee stock options |
| 897,953 |
| 1,411,582 |
| 1,187,776 | |||
Stock Warrants |
| — |
| 1,009,687 |
| 624,741 | |||
Executive Stock Match Program |
| — |
| 83,042 |
| 204,310 | |||
Convertible Note |
| 44,444 |
| 77,778 |
| 16,667 | |||
Dilutive outstanding shares |
| 96,675,294 |
| 95,355,904 |
| 92,693,264 | |||
Basic earnings per share | $ | 0.87 | $ | 0.23 | $ | 0.33 | |||
Dilutive earnings per share | $ | 0.86 | $ | 0.22 | $ | 0.32 | |||
Use of estimates in the preparation of financial statements
The consolidated financial statements and related notes, which have been prepared in conformity with generally accepted accounting principles, require the use of management estimates. Actual results could differ from these estimates.
Reclassification
Certain amounts in the 2000 and 1999 financial statements have been reclassified to conform with current year classifications.
F-10
VARCO INTERNATIONAL, INC.
NOTES TO CONSOLIDATED FINANCIAL STATEMENTS—(Continued)
New Accounting Standards
In June 2001, the Financial Accounting Standards Board issued Statements of Financial Accounting Standards No. 141, “Business Combinations” (SFAS 141), and No. 142, “Goodwill and Other Intangible Assets” (SFAS 142), effective for fiscal years beginning after December 15, 2001. Under SFAS 141 all business combinations initiated after June 30, 2001 were accounted for under the purchase method of accounting. Under SFAS 142, intangible assets deemed to have indefinite lives (including goodwill) will no longer be amortized but will be subject to annual impairment tests in accordance with the Statements. Accordingly, the Company did not amortize any goodwill purchased after June 30, 2001. Other intangible assets will continue to be amortized over their useful lives.
The Company will apply the new rules on accounting for goodwill and other intangible assets beginning in the first quarter of 2002. Application of the nonamortization provisions of SFAS 142 is expected to result in an increase in net income of approximately $10,500,000 per year (or $0.11 per share). Based on preliminary tests, the Company does not expect the adoption of SFAS 142 to have a material effect on the Company’s financial position or results of operations.
The effects of not amortizing goodwill and other intangible assets in periods prior to adoption of SFAS 142 follows (in millions, except per share data):
Year ended December 31, | |||||||||
2001 | 2000 | 1999 | |||||||
Net income as reported | $ | 82,968 | $ | 21,055 | $ | 29,809 | |||
Add: Amortization of goodwill |
| 10,457 |
| 8,444 |
| 8,431 | |||
Net income as adjusted | $ | 93,425 | $ | 29,499 | $ | 38,240 | |||
Basic earnings per common share as reported | $ | .87 | $ | .23 | $ | .33 | |||
Add: Amortization of goodwill |
| .11 |
| .09 |
| .09 | |||
Basic earnings per common share as adjusted | $ | .98 | $ | .32 | $ | .42 | |||
Diluted earnings per common share as reported | $ | .86 | $ | .22 | $ | .32 | |||
Add: Amortization of goodwill |
| .11 |
| .09 |
| .09 | |||
Diluted earnings per common share as adjusted | $ | .97 | $ | .31 | $ | .41 | |||
In August 2001, the Financial Accounting Standards Board issued statement of Financial Accounting Standard No 143, “Accounting for Asset Retirement Obligations,” (SFAS 143). SFAS 143 requires a company to recognize a liability associated with a legal obligation to retire or remove any tangible long-lived assets. The new statement is effective beginning in 2003 and the Company is currently evaluating if it will have a material impact on its financial position or results of operations.
In October 2001, the Financial Accounting Standards Board issued Statement of Financial Accounting Standard No. 144, “Accounting for the Impairment or Disposal of Long-Lived Assets” (SFAS 144). This new statement supercedes FASB statement No. 121, “Accounting for the Impairment of Long-Lived Assets and for long-lived assets to be disposed of (SFAS 121), however, it retains the fundamental provisions of long-lived assets to be “held and used.” The new statement provides implementation guidelines and will be effective for the Company in 2002. SFAS 144 is not expected to have a material effect on the Company’s financial position or results of operations, but it is expected to effect certain of the Company’s accounting policies.
F-11
VARCO INTERNATIONAL, INC.
NOTES TO CONSOLIDATED FINANCIAL STATEMENTS—(Continued)
3. Acquisitions
Fiscal 2001
In January, 2001, the Company acquired Quality Tubing Inc., a manufacturer of coiled tubing which is used in conjunction with specialized equipment manufactured by the Company to remediate and drill oil and gas wells for an aggregate cash purchase price of approximately $55,020,000. This acquisition complements Varco’s comprehensive offering of coiled tubing technology, combining coiled tubing with the equipment required to run it.
The Company also completed seven additional acquisitions, six asset purchases, and one technology license acquisition for an aggregate purchase price of $99,044,000 consisting of cash of $90,397,000 and notes and accrued payables of $8,647,000. These acquisitions included:
| · | Chimo Equipment Ltd., a Canadian provider of rig instrumentation equipment and services. |
| · | Albin’s Enterprises Inc., an Oklahoma based designer, manufacturer, rebuilder, and refurbisher of high-pressure nitrogen pumping units and related equipment. |
| · | Fibercast, an Oklahoma based fiberglass tubing manufacturer. |
| · | Elmar Services Limited, an Aberdeen based designer and manufacturer of wireline pressure control equipment for servicing oil and gas wells. |
| · | Morinoak International Limited, a supplier of derricks, substructures and structural drilling rig components based in England. |
The following table summarizes the estimated fair values of the assets acquired and liabilities assumed at the date of acquisition of the 2001 acquisitions:
Quality Tubing | All Other Acquisitions | Total | |||||||
Current assets | $ | 15,377 | $ | 41,200 | $ | 56,577 | |||
Property, plant and equipment |
| 8,049 |
| 33,494 |
| 41,543 | |||
Intangible assets |
| 146 |
| 7,398 |
| 7,544 | |||
Goodwill |
| 40,639 |
| 57,228 |
| 97,867 | |||
Total assets acquired |
| 64,211 |
| 139,320 |
| 203,531 | |||
Current liabilities |
| 7,291 |
| 32,948 |
| 40,239 | |||
Long term debt |
| 1,107 |
| 10,711 |
| 11,818 | |||
Other liabilities |
| 793 |
| 2,680 |
| 3,473 | |||
Total liabilities |
| 9,191 |
| 46,339 |
| 55,530 | |||
Net assets acquired | $ | 55,020 | $ | 92,981 | $ | 148,001 | |||
The following table summarizes goodwill additions for 2001 acquisitions by business segment:
2001 | |||
Drilling Equipment Sales | $ | 10,118 | |
Tubular Services |
| 651 | |
Drilling Services |
| 11,923 | |
Coiled Tubing & Wireline |
| 75,175 | |
Total goodwill acquired | $ | 97,867 | |
F-12
VARCO INTERNATIONAL, INC.
NOTES TO CONSOLIDATED FINANCIAL STATEMENTS—(Continued)
Fiscal 2000
The Company completed two acquisitions and one asset purchase for an aggregate purchase price of $24,106,000 consisting of cash of $21,685,000 and accrued cash payments of $2,421,000.
Fiscal 1999
The Company completed three acquisitions and one asset purchase for an aggregate purchase price of $20,149,000 consisting of cash of $12,099,000, notes payable of $638,000, and capital lease obligations assumed of $7,412,000.
Each of the acquisitions were accounted for using the purchase method of accounting and, accordingly, the results of operations of each business is included in the consolidated results of operations from the date of acquisition. A summary of the acquisitions follows (in thousands):
2001 | 2000 | 1999 | ||||||||||
Fair value of assets acquired | $ | 201,483 |
| $ | 26,045 |
| $ | 21,327 |
| |||
Cash paid |
| (145,953 | ) |
| (21,685 | ) |
| (13,120 | ) | |||
Liabilities assumed and debt issued | $ | 55,530 |
| $ | 4,360 |
| $ | 8,207 |
| |||
Excess purchase price over fair value of assets acquired | $ | 97,867 |
| $ | 5,175 |
| $ | 2,434 |
| |||
Cash paid in 2001 and 1999 includes $536,000 and $1,021,000 for 2000 and 1998 acquisitions, respectively.
The following unaudited pro forma information presents a summary of the consolidated results of operations of the Company as if these acquisitions had occurred at the beginning of 2000. The pro forma information includes certain adjustments which give effect to amortization of goodwill, interest expense on acquisition debt and other adjustments, together with related income tax effects. The pro forma financial information is not necessarily indicative of the results of operations as they would have been had the transactions been effected at the beginning of 2000.
2001 | 2000 | |||||
Revenue | $ | 1,320,748 | $ | 1,034,656 | ||
Net income | $ | 83,427 | $ | 21,774 | ||
Dilutive earnings per common share | $ | .86 | $ | .23 | ||
4. Inventory
At December 31, inventories consist of the following (in thousands):
2001 | 2000 | |||||||
Raw materials | $ | 89,477 |
| $ | 66,138 |
| ||
Work in progress |
| 56,785 |
|
| 35,445 |
| ||
Finished goods |
| 97,090 |
|
| 63,665 |
| ||
Excess of current cost over LIFO value |
| (13,674 | ) |
| (12,898 | ) | ||
Inventory, net | $ | 229,678 |
| $ | 152,350 |
| ||
F-13
VARCO INTERNATIONAL, INC.
NOTES TO CONSOLIDATED FINANCIAL STATEMENTS—(Continued)
5. Property, plant and equipment
At December 31, property, plant, and equipment consist of the following (in thousands):
2001 | 2000 | |||||||
Land and buildings | $ | 138,330 |
| $ | 128,991 |
| ||
Operating equipment |
| 353,548 |
|
| 295,067 |
| ||
Rental equipment |
| 198,169 |
|
| 154,000 |
| ||
| 690,047 |
|
| 578,058 |
| |||
Less accumulated depreciation |
| (289,631 | ) |
| (234,385 | ) | ||
$ | 400,416 |
| $ | 343,673 |
| |||
6. Accrued Liabilities
At December 31, accrued liabilities consist of the following (in thousands):
2001 | 2000 | |||||
Compensation | $ | 26,279 | $ | 28,862 | ||
Warranty |
| 8,037 |
| 6,012 | ||
Interest |
| 6,674 |
| 3,278 | ||
Taxes (non income) |
| 7,666 |
| 5,569 | ||
Insurance |
| 8,211 |
| 6,617 | ||
Other |
| 45,448 |
| 41,085 | ||
$ | 102,315 | $ | 91,423 | |||
7. Income Taxes
The components of income before income taxes consist of the following (in thousands):
2001 | 2000 | 1999 | |||||||
U.S. | $ | 59,866 | $ | 8,390 | $ | 33,099 | |||
Foreign |
| 72,229 |
| 37,457 |
| 16,963 | |||
$ | 132,095 | $ | 45,847 | $ | 50,062 | ||||
Such income is inclusive of various intercorporate eliminations of income or expense items, such as royalties, interest and similar items that are taxable or deductible in the respective locations. Such income is also inclusive of export sales by U.S. locations. Therefore, the relationship of domestic and foreign taxes to reported U.S. and foreign income is not representative of actual effective tax rates.
The provision (benefit) for income taxes consists of the following at December 31 (in thousands):
2001 | 2000 | 1999 | |||||||||
Current provision: | |||||||||||
U.S. | $ | 27,809 |
| $ | 3,346 | $ | 2,549 |
| |||
Foreign |
| 29,464 |
|
| 15,612 |
| 14,928 |
| |||
Total current provision |
| 57,273 |
|
| 18,958 |
| 17,477 |
| |||
Deferred provision (benefit): | |||||||||||
U.S. |
| (3,162 | ) |
| 5,045 |
| 8,744 |
| |||
Foreign |
| (4,984 | ) |
| 789 |
| (5,968 | ) | |||
Total deferred provision (benefit) |
| (8,146 | ) |
| 5,834 |
| 2,776 |
| |||
Total provision | $ | 49,127 |
| $ | 24,792 | $ | 20,253 |
| |||
F-14
VARCO INTERNATIONAL, INC.
NOTES TO CONSOLIDATED FINANCIAL STATEMENTS—(Continued)
The reconciliation of the expected to the computed tax provision (benefit) is as follows at December 31 (in thousands):
2001 | 2000 | 1999 | ||||||||||
Tax expense at federal statutory rate | $ | 46,232 |
| $ | 16,046 |
| $ | 17,522 |
| |||
Incremental effect of foreign operations |
| 4,446 |
|
| 1,892 |
|
| 695 |
| |||
Nondeductible goodwill amortization and merger related costs |
| 1,621 |
|
| 8,906 |
|
| 3,280 |
| |||
State income taxes, net of federal benefit |
| — |
|
| 488 |
|
| 612 |
| |||
FSC benefit |
| (3,490 | ) |
| (940 | ) |
| (676 | ) | |||
Change in valuation allowance |
| — |
|
| (271 | ) |
| — |
| |||
Other, net |
| 318 |
|
| (1,329 | ) |
| (1,180 | ) | |||
$ | 49,127 |
| $ | 24,792 |
| $ | 20,253 |
| ||||
Significant components of the Company’s deferred tax liabilities and assets as of December 31, are as follows (in thousands):
2001 | 2000 | |||||||
Gross deferred tax assets: | ||||||||
Receivables | $ | 1,492 |
| $ | 2,106 |
| ||
U.S. and foreign net operating losses |
| 1,708 |
|
| 1,910 |
| ||
Accrued liabilities and other reserves |
| 2,565 |
|
| 6,466 |
| ||
Inventory reserves and intercompany profit elimination |
| 8,019 |
|
| 3,635 |
| ||
Tax credit carry forwards |
| 6,576 |
|
| 2,368 |
| ||
Post retirement benefit obligation |
| 5,099 |
|
| 3,967 |
| ||
Subtotal gross deferred tax assets |
| 25,459 |
|
| 20,452 |
| ||
Valuation allowance |
| (913 | ) |
| (967 | ) | ||
Net deferred tax assets |
| 24,546 |
|
| 19,485 |
| ||
Gross deferred tax liabilities: | ||||||||
Property and equipment |
| 26,606 |
|
| 25,339 |
| ||
Intangible assets |
| 2,615 |
|
| 2,094 |
| ||
Reserve for unremitted foreign earnings |
| 6,500 |
|
| 6,500 |
| ||
All other |
| 811 |
|
| 1,530 |
| ||
Gross deferred tax liabilities |
| 36,532 |
|
| 35,463 |
| ||
Total net deferred tax liability | $ | 11,986 |
| $ | 15,978 |
| ||
The total net deferred tax liability at December 31, 2001 is comprised of $6,618,000 of net current tax assets and $18,604,000 net noncurrent deferred tax liabilities.
The Company has made provision for additional taxes on the anticipated repatriation of certain earnings from its foreign subsidiaries. Undistributed earnings of its foreign subsidiaries in excess of the amount already provided is considered permanently reinvested. It is not practical to determine the amount of federal income taxes, if any, that might become due in the event that the balance of such earnings were to be distributed.
At December 31, 2001 the Company has approximately $6,268,000 of foreign net operating loss carryforwards, the majority of which have an indefinite life. The Company has a valuation allowance of $913,000 against these net operating losses as the Company believes that the corresponding deferred tax asset
F-15
VARCO INTERNATIONAL, INC.
NOTES TO CONSOLIDATED FINANCIAL STATEMENTS—(Continued)
may not be fully realizable. The change in valuation allowance from 2000 to 2001 was primarily due to the expiration of net operating losses associated with the allowances. In addition, the Company has foreign tax credit carryforwards of $6,576,000 which will begin to expire in 2003.
The Company is currently engaged in tax audits and appeals in various tax jurisdictions. The years covered by each audit or appeal vary considerably among legal entities. Assessments, if any, are not expected to have a material adverse effect on the financial statements.
8. Long-term Debt
At December 31, long-term debt consists of the following:
2001 | 2000 | |||||
(in thousands) | ||||||
$200,000,000 Senior Subordinated Notes, interest at 7.25% payable semiannually, principal due on May 1, 2011 | $ | 201,524 | $ | — | ||
$100,000,000 Senior Subordinated Notes, interest at 7.5% payable semiannually, principal due on February 15, 2008 |
| 99,118 |
| 100,000 | ||
$130,000,000 Term Notes payable to lenders, interest at 7.825% at December 31, 2000 |
| — |
| 26,832 | ||
Other |
| 21,972 |
| 9,675 | ||
Total debt |
| 322,614 |
| 136,507 | ||
Less: Current maturities |
| 7,077 |
| 30,347 | ||
Long-term debt | $ | 315,537 | $ | 106,160 | ||
Principal payments of long-term debt for years subsequent to 2002 are as follows (in thousands):
2003 | $ | 6,123 | |
2004 |
| 5,249 | |
2005 |
| 1,790 | |
2006 |
| 1,447 | |
Thereafter |
| 300,928 | |
$ | 315,537 | ||
Senior Subordinated Notes
On February 25, 1998, the Company issued $100,000,000 of 7 1/2% Senior Notes due 2008 (“2008 Notes”). On May 1, 2001, the Company issued $200,000,000 7 1/4% Senior Notes due 2011 (“2011 Notes”). The 2008 Notes and 2011 Notes are fully and unconditionally guaranteed, on a joint and several basis, by certain direct wholly-owned subsidiaries of the Company (collectively “Guarantor Subsidiaries” and individually “Guarantor”). Each of the guarantees is an unsecured obligation of the Guarantor and rankspari passuwith the guarantees provided by and the obligations of such Guarantor Subsidiaries under the Credit Agreement and with all existing and future unsecured indebtedness of such Guarantor for borrowed money that is not, by its terms, expressly subordinated in right of payment to such guarantee.
Senior Credit Agreement
In 1996, the Company entered into a Senior Credit Agreement (the “Credit Agreement”) with a group of lenders which rankspari passu with all existing and future senior unsecured obligations of the Company. The Credit Agreement provides for a $130,000,000 advance/term loan facility (the “term loan facility”), a
F-16
VARCO INTERNATIONAL, INC.
NOTES TO CONSOLIDATED FINANCIAL STATEMENTS—(Continued)
$100,000,000 revolving credit facility (the “revolving facility”), and a $5,000,000 agent swingline facility (the “swingline facility”). At December 31, 2001, the Company paid the remaining balance for the term loan facility. The revolving facility and swingline facility expired in August 2001.
New Revolver Facility
On January 30, 2002, the Company entered into a new credit agreement with a syndicate of banks that provided up to $125.0 million of funds under a revolving credit facility. The facility expires on January 30, 2005. The facility is secured by guarantees of material U.S. subsidiaries. The interest rate on the borrowed portion of the revolver is based on the Company’s rating by S&P and Moody’s which at the time of the agreement resulted in an interest rate of LIBOR + 0.625% or the prime rate. Commitment fees range from 0.1% to 0.25% depending on the Company rating.
Other
Based upon information obtained from a national brokerage company at December 31, 2001, the fair value of the 2008 Notes was approximately $103,030,000, and the fair value of the 2011 Notes was $199,960,000. The carrying value of the Company’s other debt, approximates its fair value. Other debt includes $8,208,583 in promissory notes due to former owners of businesses acquired who remain employed by the Company.
At December 31, 2001, the Company had outstanding letters of credit of $13,963,000.
9. Retirement and other Benefit Plans
During the periods reported, substantially all the Company’s U.S. employees were covered by defined contribution retirement plans. The Company also has a deferred compensation plan for its highly compensated employees to permit retirement contributions in excess of the statutory limits. Employees may voluntarily contribute up to 15% of compensation, as defined, to these plans. The participants’ contributions were matched by the Company up to a maximum of 4% of compensation or at the discretion of the Board of Directors, a percentage of net income. Participants are permitted to invest in a Company stock fund under these plans. Under these plans, Company contributions were approximately $5,014,378, $4,721,000, and $6,846,000 in 2001, 2000, and 1999, respectively.
For certain executives, the Company has a supplemental defined benefits plan providing retirement and death benefits. The plan is unfunded and the net pension liability was $6,211,550 and $5,917,432 at December 31, 2001 and 2000, respectively. As a result of the Merger, all participants became fully vested with full service credit until age 65. In 2001, the plan was amended to include current executive officers of the Company. Expense under the plan was $430,294, $1,949,000, and $770,000 in 2001, 2000, and 1999, respectively.
For certain former employees who retired prior to December 31, 1993, healthcare and life insurance benefits are provided through insurance companies. In 1993, the Company adopted FASB Statement No 106, “Accounting for Postretirement Benefits Other Than Pensions.” The transition obligation is being amortized over 20 years. In 2001, the plan was amended to cover current executive officers of the Company upon their retirement.
The assumed weighted-average annual rate of increase in the per capita cost of covered benefits is 12.0% for 2001 and is assumed to decrease gradually to 5.0% for 2010 and remain at that level thereafter. The health care cost trend rate assumption has a significant effect on the amounts reported. For example, increasing the assumed health care cost trend rates by one percentage point in each year would increase the accumulated postretirement benefit obligation as of December 31, 2001, by $964,000 and the aggregate of the service and interest cost components of net periodic postretirement benefit cost for 2001 by $58,000.
F-17
VARCO INTERNATIONAL, INC.
NOTES TO CONSOLIDATED FINANCIAL STATEMENTS—(Continued)
The weighted-average discount rate used in determining the accumulated postretirement benefit obligation was 7.25% at December 31, 2001 and December 31, 2000.
Net periodic postretirement benefit cost includes the following components (in thousands):
2001 | 2000 | 1999 | ||||||||||
Interest cost | $ | 701 |
| $ | 733 |
| $ | 669 |
| |||
Amortization of transition obligation |
| 763 |
|
| 763 |
|
| 763 |
| |||
Amortization of gain |
| (485 | ) |
| (471 | ) |
| (534 | ) | |||
$ | 979 |
| $ | 1,025 |
| $ | 898 |
| ||||
The following table sets forth the change in benefit obligation of the Company’s retirement benefit plan (in thousands):
2001 | 2000 | |||||||
Benefit obligation at beginning of year | $ | 10,134 |
| $ | 10,634 |
| ||
Interest cost |
| 701 |
|
| 733 |
| ||
Benefits paid |
| (932 | ) |
| (908 | ) | ||
Actuarial loss (gain) |
| 1,108 |
|
| (325 | ) | ||
Benefit obligation at end of year | $ | 11,011 |
| $ | 10,134 |
| ||
Funded status | $ | (11,011 | ) | $ | (10,134 | ) | ||
Unrecognized actuarial (gain) |
| (4,564 | ) |
| (6,158 | ) | ||
Unrecognized transition obligation |
| 8,380 |
|
| 9,143 |
| ||
Accrued postretirement benefit obligation | $ | (7,195 | ) | $ | (7,149 | ) | ||
The Company has two defined benefit pension plans covering substantially all full-time employees in Germany. Plan benefits are based on years of service and employee compensation for the last three years of service. The plans are unfunded and benefit payments are made directly by the Company. Pension expense includes the following components for the fiscal years ending December 31 (in thousands):
2001 | 2000 | 1999 | ||||||||||
Service cost | $ | 204 |
| $ | 186 |
| $ | 202 |
| |||
Interest cost |
| 567 |
|
| 529 |
|
| 557 |
| |||
Net amortization |
| (350 | ) |
| (352 | ) |
| (352 | ) | |||
Pension expense | $ | 421 |
| $ | 363 |
| $ | 407 |
| |||
F-18
VARCO INTERNATIONAL, INC.
NOTES TO CONSOLIDATED FINANCIAL STATEMENTS—(Continued)
The following table sets forth the amounts recognized in the Company’s consolidated balance sheets and reconciles the projected benefit obligation from the beginning of the year to the end of the year (in thousands):
2001 | 2000 | |||||||
Projected benefit obligation at beginning of year | $ | 7,543 |
| $ | 7,950 |
| ||
Service cost |
| 204 |
|
| 186 |
| ||
Interest cost |
| 567 |
|
| 529 |
| ||
Benefits paid |
| (211 | ) |
| (197 | ) | ||
Exchange rate change |
| 2 |
|
| (925 | ) | ||
Projected benefit obligation at the end of the year |
| 8,105 |
|
| 7,543 |
| ||
Unrecognized net gain |
| 203 |
|
| 553 |
| ||
Pension liability |
| 8,308 |
|
| 8,096 |
| ||
Less—amount included in current liabilities |
| 211 |
|
| 197 |
| ||
Noncurrent portion of pension liability | $ | 8,097 |
| $ | 7,899 |
| ||
The rate of increase in future compensation levels used in determining the projected benefit obligations was 2% for December 31, 2001, 2000, and 1999. The discount rate was 7% for December 31, 2001, 2000, and 1999. The unrecognized net gain from the change in projected compensation levels is being amortized over ten years.
10. Common Stockholders’ Equity
In 2000, the Board of Directors and stockholders approved an amendment to the amended and restated 1996 Equity Participation Plan increasing the number of authorized shares of common stock to be granted to officers, key employees of the Company, and non-employee members of the Board of Directors from 3,450,000 to 7,650,000 shares. Options granted under the plan to key employees are generally exercisable in installments over three years starting one year from the date of grant and expire ten years from the date of grant. Options granted under the plan to non-employee members of the Board of Directors are exercisable in installments over four year periods starting one year from the date of grant and expire ten years from the date of grant. In connection with the Merger, options outstanding under previous plans will maintain the terms under which the options were granted. These terms allow options granted to key employees and non-employee directors to be exercisable in installments from one to five years starting one year from the date of grant and expire ten years from the date of grant.
The following summarizes options activity:
Years Ended December 31, | ||||||||||||
2001 | 2000 | 1999 | ||||||||||
Shares under option at beginning of year |
| 4,520,618 |
|
| 5,068,068 |
|
| 3,582,989 |
| |||
Granted |
| 1,176,241 |
|
| 687,443 |
|
| 2,100,112 |
| |||
Cancelled |
| (125,958 | ) |
| (182,918 | ) |
| (114,288 | ) | |||
Exercised |
| (837,032 | ) |
| (1,051,975 | ) |
| (500,745 | ) | |||
Shares under option at end of year |
| 4,733,869 |
|
| 4,520,618 |
|
| 5,068,068 |
| |||
Average price of outstanding options | $ | 14.47 |
| $ | 11.88 |
| $ | 8.05 |
| |||
Exercisable at end of year |
| 2,766,843 |
|
| 3,087,409 |
|
| 2,123,147 |
| |||
F-19
VARCO INTERNATIONAL, INC.
NOTES TO CONSOLIDATED FINANCIAL STATEMENTS—(Continued)
The following summarizes information about stock options outstanding as of December 31, 2001:
Range of Exercise Price | Weighted-Avg. Remaining Contractual Life | Options Outstanding | Options Exercisable | |||||||||
Shares | Weighted-Avg. Exercise Price | Shares | Weighted-Avg. Exercise Price | |||||||||
$ 3.21 to $ 7.5625 | 4.99 | 1,651,454 | $ | 6.62 | 1,492,361 | $ | 6.52 | |||||
11.10 to 18.21 | 6.80 | 1,441,716 |
| 14.83 | 836,890 |
| 14.99 | |||||
20.00 to 32.55 | 8.21 | 1,640,699 |
| 22.06 | 437,592 |
| 24.17 | |||||
Totals | 6.66 | 4,733,869 | $ | 14.47 | 2,766,843 | $ | 11.87 | |||||
For options granted during 2001, 2000, and 1999, the weighted-average fair value at date of grant was $13.37, $6.35, and $3.61 per option, respectively. Assuming that the Company had accounted for its stock-based employee compensations plans using the alternative fair value method, the Company’s pro forma net income would have been $76,703,000, $16,275,000 and $25,249,000 and pro forma dilutive earnings per share would have been $0.79, $0.17, and $0.27 for 2001, 2000, and 1999, respectively.
The fair value of each option grant was estimated on the date of grant using a Black Scholes option pricing model with the following assumptions for 2001, 2000, and 1999, respectively; risk free interest rates of 5.5%; expected lives of contracts of 3 to 10 years; and volatility of 52.6 percent, 52.9 percent, and 54.8 percent.
The Employee Stock Purchase Plan permits eligible employees to purchase common stock at a price equal to 85% of its fair market value at the lesser of the beginning or end of a six-month plan period. During the fiscal year ended December 31, 2001, the Company sold 229,397 shares under this plan.
During 1998, the Board of Directors authorized the repurchase, at management’s discretion, of $20,000,000 of the Company’s common stock. Under this program, the Company repurchased 1,424,700 shares at a cost of $15,330,000 during 1998.
Stockholder Rights Plan
During 2000, the Company adopted a stockholder rights plan (“Rights Plan”). As part of the Rights Plan, the Company’s Board of Directors declared a dividend distribution of one preferred stock purchase right (“Right”) for each share of the Company’s Common Stock outstanding on December 4, 2000 and each new share issued subsequently.
The rights will become exercisable, with certain exceptions, upon the earlier to occur of (i) ten days following the announcement that a person or group has acquired or obtained the right to acquire beneficial ownership of 15% or more of the Company’s Common Stock, or (ii) ten days following the announcement or commencement of a tender offer which would result in a person or group beneficially owning 15% or more of the Company’s Common Stock.
Once exercisable, each Right will entitle its holder to purchase from the Company one one-hundredth of a share of a new series of the Company’s Preferred Stock at a price of $75.00. If a person or group (other than L.E. Simmons and his affiliates) acquires beneficial ownership of 15% or more of the Company’s outstanding Common Stock, each Right, once exercisable and excluding any Rights held by the acquiring person or group, will entitle its holder to purchase shares of Common Stock of the Company having a market value of two times the then current exercise price of the Right. In addition, if at any time after such an acquisition, the Company is acquired in a merger or other business combination transaction or 50% or more of its consolidated assets or
F-20
VARCO INTERNATIONAL, INC.
NOTES TO CONSOLIDATED FINANCIAL STATEMENTS—(Continued)
earning power are sold, each outstanding Right, once exercisable and excluding any Rights held by the acquiring person or group, will entitle its holder to purchase shares of Common Stock of the acquiring company having a market value of two times the then current exercise price of the Right.
Following the acquisition by a person or group of beneficial ownership of 15% or more of the Company’s Common Stock and prior to an acquisition of the Company in a merger or other business combination transaction, a sale of 50% or more of the Company’s consolidated assets or earning power or an acquisition of 50% or more of the Common Stock, the Board of Directors may exchange the Rights (other than rights held by the acquiring person or group), in whole or in part, at an exchange ratio of one share of Common Stock per Right.
Prior to the acquisition by a person or group of beneficial ownership of 15% or more of the Common Stock, the Rights are subject to redemption at the option of the Board of Directors at a price of $0.01 per Right. The Rights currently trade with the Company’s Common Stock, have no voting or dividend rights and expire on December 4, 2010.
11. Commitments and Contingencies
The Company is subject to legal proceedings for events which arise in the ordinary course of its business. In the opinion of management, the ultimate disposition of these matters will not have a material effect on the results of operations or financial position of the Company.
The Company leases certain facilities and equipment under operating leases that expire at various dates through 2049. These leases generally contain renewal options and require the lessee to pay maintenance, insurance, taxes and other operating expenses in addition to the minimum annual rentals. Rental expense related to operating leases approximated $31,210,000, $29,159,000, and $27,146,000 in 2001, 2000, and 1999, respectively.
Future minimum lease commitments under noncancellable operating leases with initial or remaining terms of one year or more at December 31, 2001 are payable as follows (in thousands):
2002 | $ | 20,193 | |
2003 |
| 15,276 | |
2004 |
| 10,743 | |
2005 |
| 7,700 | |
2006 |
| 4,996 | |
Thereafter |
| 23,979 | |
Total future lease commitments | $ | 82,887 | |
12. Business Segments And Foreign Operations
The Company is organized based on the products and services it offers. In connection with the Merger, the Company reorganized into four principal business segments: Drilling Equipment Sales, Tubular Services, Drilling Services, and Coiled Tubing & Wireline Products.
Drilling Equipment Sales: This segment manufactures and sells integrated systems and equipment for rotating and handling pipe on a drilling rig; a complete line of conventional drilling rig tools and equipment,
F-21
VARCO INTERNATIONAL, INC.
NOTES TO CONSOLIDATED FINANCIAL STATEMENTS—(Continued)
including pipe handling tools, hoisting equipment and rotary equipment; pressure control and motion compensation equipment; and flow devices. Customers include major oil and gas companies and drilling contractors.
Tubular Services: This segment provides internal coating products and services, inspection and quality assurance services for tubular goods and fiberglass tubulars. Additionally, Tubular Services includes the sale and rental of proprietary equipment used to inspect tubular products at steel mills. Tubular Services also provides technical inspection services and quality assurance services for in-service pipelines used to transport oil and gas. Customers include major oil and gas companies, independent producers, national oil companies, drilling contractors, oilfield supply stores and steel mills.
Drilling Services: This segment consists of the sale and rental of technical equipment used in, and the provision of services related to, the separation of drill cuttings (solids) from fluids used in the oil and gas drilling processes, and the sale of computer based drilling information and control systems, as well as conventional drilling rig instrumentation. The Drilling Services business serves the oilfield drilling markets of North America,
Latin America, Europe, Africa, the Middle East and the Far East. Customers include major oil and gas companies, independent producers, national oil companies and drilling contractors.
Coiled Tubing & Wireline Products: This segment consists of the sale of highly-engineered coiled tubing equipment, related pressure control equipment, pressure pumping, wireline and related tools to companies engaged in providing oil and gas well drilling, completion and remediation services. Customers include major oil and gas coiled tubing service companies, as well as major oil companies and large independents.
The accounting policies of the segments are the same as those described in Note 2 to the consolidated financial statements. The Company evaluates the performance of its operating segments at the operating profit level which consists of income before interest expense (income), other expense (income), nonrecurring items and income taxes. Intersegment sales and transfers are not significant.
Summarized information for the Company’s reportable segments is contained in the following table. Other Unallocated includes corporate related expenses and certain goodwill and identified intangible amortization not allocated to product lines. Operating profit excludes litigation costs of $16,500,000, merger and transaction costs of $26,570,000 associated with the Merger, and $7,808,000 associated with the terminated Newpark merger and the related alliance agreement in 2001, 2000, and 1999, respectively.
Drilling Equipment Sales | Tubular Services | Drilling Services | Coiled Tubing & Wireline Products | Other Unallocated | Total | ||||||||||||||
(in thousands) | |||||||||||||||||||
2001 | |||||||||||||||||||
Revenue | $ | 395,550 | $ | 352,624 | $ | 314,272 | $ | 205,363 | $ | — |
| $ | 1,267,809 | ||||||
Operating profit |
| 39,162 |
| 67,740 |
| 70,502 |
| 44,902 |
| (47,680 | ) |
| 174,626 | ||||||
Total assets |
| 324,741 |
| 366,390 |
| 442,018 |
| 253,246 |
| 42,715 |
|
| 1,429,110 | ||||||
Capital expenditures |
| 13,992 |
| 12,645 |
| 34,248 |
| 3,408 |
| 1,541 |
|
| 65,834 | ||||||
Depreciation and amortization |
| 16,168 |
| 15,783 |
| 21,791 |
| 4,623 |
| 9,535 |
|
| 67,900 | ||||||
2000 | |||||||||||||||||||
Revenue | $ | 283,360 | $ | 248,099 | $ | 250,229 | $ | 84,927 | $ | — |
| $ | 866,615 | ||||||
Operating profit |
| 30,193 |
| 39,666 |
| 39,673 |
| 13,895 |
| (35,946 | ) |
| 87,481 | ||||||
Total assets |
| 223,369 |
| 336,243 |
| 391,310 |
| 106,675 |
| 19,385 |
|
| 1,076,982 | ||||||
Capital expenditures |
| 9,750 |
| 11,178 |
| 22,413 |
| 999 |
| 1,123 |
|
| 45,463 | ||||||
Depreciation and amortization |
| 14,966 |
| 13,221 |
| 20,345 |
| 1,722 |
| 6,264 |
|
| 56,518 | ||||||
F-22
VARCO INTERNATIONAL, INC.
NOTES TO CONSOLIDATED FINANCIAL STATEMENTS—(Continued)
Drilling Equipment Sales | Tubular Services | Drilling Services | Coiled Tubing & Wireline Products | Other Unallocated | Total | ||||||||||||||
(in thousands) | |||||||||||||||||||
1999 | |||||||||||||||||||
Revenue | $ | 504,245 | $ | 194,929 | $ | 202,518 | $ | 74,156 | $ | — |
| $ | 975,848 | ||||||
Operating profit |
| 77,662 |
| 21,076 |
| 8,547 |
| 7,084 |
| (39,213 | ) |
| 75,156 | ||||||
Total assets |
| 254,534 |
| 300,672 |
| 378,053 |
| 92,148 |
| 105,906 |
|
| 1,131,313 | ||||||
Capital expenditures |
| 10,488 |
| 4,046 |
| 13,047 |
| 1,645 |
| 1,503 |
|
| 30,729 | ||||||
Depreciation and amortization |
| 15,904 |
| 14,565 |
| 18,018 |
| 2,186 |
| 6,507 |
|
| 57,180 | ||||||
The following table represents revenues by country or geographic region based on the location of the use of the product or service:
2001 | 2000 | 1999 | |||||||
(in thousands) | |||||||||
U.S. | $ | 527,060 | $ | 351,252 | $ | 448,950 | |||
Canada |
| 102,817 |
| 66,916 |
| 50,915 | |||
Latin America |
| 167,253 |
| 140,589 |
| 104,416 | |||
United Kingdom |
| 86,163 |
| 55,056 |
| 58,797 | |||
Other Europe |
| 153,916 |
| 89,781 |
| 139,752 | |||
Far East |
| 100,274 |
| 75,330 |
| 91,064 | |||
Other |
| 130,326 |
| 87,691 |
| 81,954 | |||
Total | $ | 1,267,809 | $ | 866,615 | $ | 975,848 | |||
The following table represents the net book value of property and equipment based on the location of the assets:
2001 | 2000 | 1999 | |||||||
(in thousands) | |||||||||
U.S. | $ | 224,118 | $ | 195,695 | $ | 192,995 | |||
Latin America |
| 48,468 |
| 47,368 |
| 43,205 | |||
Canada |
| 43,006 |
| 25,886 |
| 25,799 | |||
United Kingdom |
| 48,226 |
| 38,983 |
| 40,110 | |||
Netherlands |
| 9,278 |
| 9,842 |
| 11,345 | |||
Other Europe |
| 12,491 |
| 13,014 |
| 11,853 | |||
Far East |
| 13,213 |
| 11,966 |
| 11,958 | |||
Middle East |
| 1,616 |
| 919 |
| 1,999 | |||
Total | $ | 400,416 | $ | 343,673 | $ | 339,264 | |||
13. CONDENSED CONSOLIDATING FINANCIAL INFORMATION
On May 1, 2001, the Company issued $200.0 million of 7 1/4% Senior Notes due 2011 (“2011 Notes”). The 2011 Notes are fully and unconditionally guaranteed, on a joint and several basis, by certain wholly-owned subsidiaries of the Company. Each of the guarantees is an unsecured obligation of the guarantor and rankspari passuwith the guarantees provided by and the obligations of such guarantor subsidiaries under the Senior Credit Agreement and the Company’s 2008 Notes and with all existing and future unsecured indebtedness of such guarantor for borrowed money that is not, by its terms, expressly subordinated in right of payment to such
F-23
VARCO INTERNATIONAL, INC.
NOTES TO CONSOLIDATED FINANCIAL STATEMENTS—(Continued)
guarantee. A portion of the net proceeds from the issuance of the 2011 Notes was used by the Company to repay the revolving indebtedness outstanding under the Senior Credit Agreement. The remaining net proceeds are being used for general corporate purposes, including working capital, capital expenditures and acquisitions of businesses.
On February 25, 1998, the Company issued $100 million of 7 1/2% Senior Notes due 2008 (“2008 Notes”). The 2008 Notes are fully and unconditionally guaranteed, on a joint and several basis, by certain wholly-owned subsidiaries of the Company. Each of the guarantees is an unsecured obligation of the guarantor and rankspari passu with the guarantees provided by and the obligations of such guarantor subsidiaries under the Senior Credit Agreement and the 2011 Notes, and with all existing and future unsecured indebtedness of such guarantor for borrowed money that is not, by its terms, expressly subordinated in right of payment to such guarantee.
The following condensed consolidating balance sheets as of December 31, 2001 and 2000 and the related condensed consolidating statements of income and cash flows for each of the three years in the period ended December 31, 2001 should be read in conjunction with the notes to these consolidated financial statements.
F-24
VARCO INTERNATIONAL, INC.
NOTES TO CONSOLIDATED FINANCIAL STATEMENTS—(Continued)
Year Ended December 31, 2001 | |||||||||||||||||||
Varco International, Inc. | Guarantor Subsidiaries | Non- Guarantor Subsidiaries | Eliminations | Consolidated | |||||||||||||||
(In thousands) | |||||||||||||||||||
CONDENSED CONSOLIDATING BALANCE SHEET | |||||||||||||||||||
Current assets: | |||||||||||||||||||
Cash and cash equivalents | $ | 5,562 |
| $ | 25,137 | $ | 26,800 |
| $ | — |
| $ | 57,499 |
| |||||
Accounts receivable, net |
| 274,127 |
|
| 609,398 |
| 883,931 |
|
| (1,425,420 | ) |
| 342,036 |
| |||||
Inventory, net |
| — |
|
| 167,157 |
| 62,521 |
|
| — |
|
| 229,678 |
| |||||
Other current assets |
| — |
|
| 27,516 |
| 6,476 |
|
| — |
|
| 33,992 |
| |||||
Total current assets |
| 279,689 |
|
| 829,208 |
| 979,728 |
|
| (1,425,420 | ) |
| 663,205 |
| |||||
Investment in subsidiaries |
| 984,501 |
|
| 456,972 |
| — |
|
| (1,441,473 | ) |
| — |
| |||||
Property and equipment, net |
| — |
|
| 267,819 |
| 132,597 |
|
| — |
|
| 400,416 |
| |||||
Identifiable intangibles, net |
| — |
|
| 29,586 |
| 1,136 |
|
| — |
|
| 30,722 |
| |||||
Goodwill, net |
| — |
|
| 192,822 |
| 132,313 |
|
| — |
|
| 325,135 |
| |||||
Other assets, net |
| 5,420 |
|
| 3,386 |
| 826 |
|
| — |
|
| 9,632 |
| |||||
Total assets | $ | 1,269,610 |
| $ | 1,779,793 | $ | 1,246,600 |
| $ | (2,866,893 | ) | $ | 1,429,110 |
| |||||
Current liabilities: | |||||||||||||||||||
Accounts payable | $ | 117,995 |
| $ | 697,155 | $ | 712,829 |
| $ | (1,425,420 | ) | $ | 102,559 |
| |||||
Accrued liabilities |
| 5,255 |
|
| 61,694 |
| 35,366 |
|
| — |
|
| 102,315 |
| |||||
Income taxes |
| — |
|
| 16,716 |
| 10,936 |
|
| — |
|
| 27,652 |
| |||||
Current portion of long-term debt |
| — |
|
| 3,058 |
| 4,019 |
|
| — |
|
| 7,077 |
| |||||
Total current liabilities |
| 123,250 |
|
| 778,623 |
| 763,150 |
|
| (1,425,420 | ) |
| 239,603 |
| |||||
Long-term debt |
| 300,642 |
|
| 7,362 |
| 7,533 |
|
| — |
|
| 315,537 |
| |||||
Pension liabilities |
| 17,404 |
|
| — |
| 8,430 |
|
| — |
|
| 25,834 |
| |||||
Deferred taxes payable |
| — |
|
| 9,307 |
| 9,297 |
|
| — |
|
| 18,604 |
| |||||
Other liabilities |
| — |
|
| — |
| 1,218 |
|
| — |
|
| 1,218 |
| |||||
Total liabilities |
| 441,296 |
|
| 795,292 |
| 789,628 |
|
| (1,425,420 | ) |
| 600,796 |
| |||||
Common stock |
| 974 |
|
| — |
| — |
|
| — |
|
| 974 |
| |||||
Paid in capital |
| 514,137 |
|
| 579,352 |
| 244,777 |
|
| (824,129 | ) |
| 514,137 |
| |||||
Retained earnings |
| 347,548 |
|
| 405,149 |
| 231,210 |
|
| (636,359 | ) |
| 347,548 |
| |||||
Cumulative translation adjustment |
| (19,015 | ) |
| — |
| (19,015 | ) |
| 19,015 |
|
| (19,015 | ) | |||||
Treasury stock |
| (15,330 | ) |
| — |
| — |
|
| — |
|
| (15,330 | ) | |||||
Total common stockholders’ equity |
| 828,314 |
|
| 984,501 |
| 456,972 |
|
| (1,441,473 | ) |
| 828,314 |
| |||||
Total liabilities and equity | $ | 1,269,610 |
| $ | 1,779,793 | $ | 1,246,600 |
| $ | (2,866,893 | ) | $ | 1,429,110 |
| |||||
| �� | |||||||||||||||||||
F-25
VARCO INTERNATIONAL, INC.
NOTES TO CONSOLIDATED FINANCIAL STATEMENTS—(Continued)
Year Ended December 31, 2000 | ||||||||||||||||||||
Varco International, Inc. | Guarantor Subsidiaries | Non- Guarantor Subsidiaries | Eliminations | Consolidated | ||||||||||||||||
(In thousands) | ||||||||||||||||||||
CONDENSED CONSOLIDATING BALANCE SHEET | ||||||||||||||||||||
Current assets: | ||||||||||||||||||||
Cash and cash equivalents | $ | — |
| $ | (2,729 | ) | $ | 14,905 |
| $ | — |
| $ | 12,176 |
| |||||
Accounts receivable, net |
| 224,554 |
|
| 375,505 |
|
| 361,106 |
|
| (691,772 | ) |
| 269,393 |
| |||||
Inventory, net |
| — |
|
| 118,552 |
|
| 33,798 |
|
| — |
|
| 152,350 |
| |||||
Other current assets |
| 1,174 |
|
| 13,823 |
|
| 6,790 |
|
| — |
|
| 21,787 |
| |||||
Total current assets |
| 225,728 |
|
| 505,151 |
|
| 416,599 |
|
| (691,772 | ) |
| 455,706 |
| |||||
Investment in subsidiaries |
| 736,507 |
|
| 357,804 |
|
| — |
|
| (1,094,311 | ) |
| — |
| |||||
Property and equipment, net |
| — |
|
| 229,557 |
|
| 114,116 |
|
| — |
|
| 343,673 |
| |||||
Identifiable intangibles, net |
| — |
|
| 26,062 |
|
| — |
|
| — |
|
| 26,062 |
| |||||
Goodwill, net |
| — |
|
| 124,489 |
|
| 114,152 |
|
| — |
|
| 238,641 |
| |||||
Other assets, net |
| — |
|
| 11,379 |
|
| 1,521 |
|
| — |
|
| 12,900 |
| |||||
Total assets | $ | 962,235 |
| $ | 1,254,442 |
| $ | 646,388 |
| $ | (1,786,083 | ) | $ | 1,076,982 |
| |||||
Current liabilities: | ||||||||||||||||||||
Accounts payable | $ | 101,330 |
| $ | 415,795 |
| $ | 240,829 |
| $ | (691,772 | ) | $ | 66,182 |
| |||||
Accrued liabilities |
| 3,117 |
|
| 65,732 |
|
| 22,574 |
|
| — |
|
| 91,423 |
| |||||
Income taxes |
| — |
|
| (1,673 | ) |
| 6,049 |
|
| — |
|
| 4,376 |
| |||||
Current portion of long-term debt |
| 26,832 |
|
| 3,014 |
|
| 501 |
|
| — |
|
| 30,347 |
| |||||
Total current liabilities |
| 131,279 |
|
| 482,868 |
|
| 269,953 |
|
| (691,772 | ) |
| 192,328 |
| |||||
Long-term debt |
| 98,973 |
|
| 7,018 |
|
| 169 |
|
| — |
|
| 106,160 |
| |||||
Pension liabilities |
| — |
|
| 14,085 |
|
| 7,899 |
|
| — |
|
| 21,984 |
| |||||
Deferred taxes payable |
| — |
|
| 11,410 |
|
| 9,457 |
|
| — |
|
| 20,867 |
| |||||
Other liabilities |
| — |
|
| 2,554 |
|
| 1,106 |
|
| — |
|
| 3,660 |
| |||||
Total liabilities |
| 230,252 |
|
| 517,935 |
|
| 288,584 |
|
| (691,772 | ) |
| 344,999 |
| |||||
Common stock |
| 962 |
|
| — |
|
| — |
|
| — |
|
| 962 |
| |||||
Paid in capital |
| 498,692 |
|
| 434,976 |
|
| 205,747 |
|
| (640,723 | ) |
| 498,692 |
| |||||
Retained earnings |
| 264,580 |
|
| 301,531 |
|
| 168,978 |
|
| (470,509 | ) |
| 264,580 |
| |||||
Cumulative translation adjustment |
| (16,921 | ) |
| — |
|
| (16,921 | ) |
| 16,921 |
|
| (16,921 | ) | |||||
Treasury stock |
| (15,330 | ) |
| — |
|
| — |
|
| — |
|
| (15,330 | ) | |||||
Total common stockholders’ equity |
| 731,983 |
|
| 736,507 |
|
| 357,804 |
|
| (1,094,311 | ) |
| 731,983 |
| |||||
Total liabilities and equity | $ | 962,235 |
| $ | 1,254,442 |
| $ | 646,388 |
| $ | (1,786,083 | ) | $ | 1,076,982 |
| |||||
F-26
VARCO INTERNATIONAL, INC.
NOTES TO CONSOLIDATED FINANCIAL STATEMENTS—(Continued)
Year Ended December 31, 2001 | |||||||||||||||||||
Varco International, Inc. | Guarantor Subsidiaries | Non-Guarantor Subsidiaries | Eliminations | Consolidated | |||||||||||||||
(In thousands) | |||||||||||||||||||
CONDENSED CONSOLIDATING STATEMENT OF INCOME | |||||||||||||||||||
Revenue | $ | — |
| $ | 943,231 | $ | 485,548 |
| $ | (160,970 | ) | $ | 1,267,809 |
| |||||
Cost of sales |
| — |
|
| 700,382 |
| 344,403 |
|
| (160,970 | ) |
| 883,815 |
| |||||
Amortization of goodwill |
| — |
|
| 5,348 |
| 5,109 |
|
| — |
|
| 10,457 |
| |||||
Selling, general and administrative |
| — |
|
| 110,710 |
| 41,566 |
|
| — |
|
| 152,276 |
| |||||
Research and engineering costs |
| — |
|
| 41,362 |
| 5,273 |
|
| — |
|
| 46,635 |
| |||||
Merger, transaction, and litigation costs |
| — |
|
| 16,500 |
| — |
|
| — |
|
| 16,500 |
| |||||
Total costs |
| — |
|
| 874,302 |
| 396,351 |
|
| (160,970 | ) |
| 1,109,683 |
| |||||
Operating profit |
| — |
|
| 68,929 |
| 89,197 |
|
| — |
|
| 158,126 |
| |||||
Other expenses |
| 926 |
|
| 1,947 |
| 1,382 |
|
| — |
|
| 4,255 |
| |||||
Interest expense |
| 19,724 |
|
| 949 |
| 1,103 |
|
| — |
|
| 21,776 |
| |||||
Income (loss) before income taxes |
| (20,650 | ) |
| 66,033 |
| 86,712 |
|
| — |
|
| 132,095 |
| |||||
Provision for income taxes |
| — |
|
| 24,647 |
| 24,480 |
|
| — |
|
| 49,127 |
| |||||
Equity in net income of subsidiaries |
| 103,618 |
|
| 62,232 |
| — |
|
| (165,850 | ) |
| — |
| |||||
Net income | $ | 82,968 |
| $ | 103,618 | $ | 62,232 |
| $ | (165,850 | ) | $ | 82,968 |
| |||||
Year Ended December 31, 2000 | |||||||||||||||||||
Varco International, Inc. | Guarantor Subsidiaries | Non-Guarantor Subsidiaries | Eliminations | Consolidated | |||||||||||||||
(In thousands) | |||||||||||||||||||
CONDENSED CONSOLIDATING STATEMENT OF INCOME | |||||||||||||||||||
Revenue | $ | — |
| $ | 599,683 | $ | 377,444 |
| $ | (110,512 | ) | $ | 866,615 |
| |||||
Cost of sales |
| — |
|
| 464,424 |
| 254,988 |
|
| (100,810 | ) |
| 618,602 |
| |||||
Amortization of goodwill |
| — |
|
| 3,980 |
| 4,464 |
|
| — |
|
| 8,444 |
| |||||
Selling, general and administrative |
| — |
|
| 69,816 |
| 50,126 |
|
| — |
|
| 119,942 |
| |||||
Research and engineering costs |
| — |
|
| 27,707 |
| 4,439 |
|
| — |
|
| 32,146 |
| |||||
Merger, transaction, and litigation costs |
| — |
|
| 23,875 |
| 2,695 |
|
| — |
|
| 26,570 |
| |||||
Total costs |
| — |
|
| 589,802 |
| 316,712 |
|
| (100,810 | ) |
| 805,704 |
| |||||
Operating profit |
| — |
|
| 9,881 |
| 60,732 |
|
| (9,702 | ) |
| 60,911 |
| |||||
Other expenses (income) |
| 5,785 |
|
| 4,017 |
| (318 | ) |
| (9,702 | ) |
| (218 | ) | |||||
Interest expense |
| 13,333 |
|
| 1,437 |
| 512 |
|
| — |
|
| 15,282 |
| |||||
Income (loss) before income taxes |
| (19,118 | ) |
| 4,427 |
| 60,538 |
|
| — |
|
| 45,847 |
| |||||
Provision for income taxes |
| — |
|
| 8,391 |
| 16,401 |
|
| — |
|
| 24,792 |
| |||||
Equity in net income of subsidiaries |
| 40,173 |
|
| 44,137 |
| — |
|
| (84,310 | ) |
| — |
| |||||
Net income | $ | 21,055 |
| $ | 40,173 | $ | 44,137 |
| $ | (84,310 | ) | $ | 21,055 |
| |||||
F-27
VARCO INTERNATIONAL, INC.
NOTES TO CONSOLIDATED FINANCIAL STATEMENTS—(Continued)
Year Ended December 31, 1999 | ||||||||||||||||||||
Varco International, Inc. | Guarantor Subsidiaries | Non-Guarantor Subsidiaries | Eliminations | Consolidated | ||||||||||||||||
(In thousands) | ||||||||||||||||||||
CONDENSED CONSOLIDATING STATEMENT OF INCOME | ||||||||||||||||||||
Revenue | $ | — |
| $ | 687,049 |
| $ | 386,462 |
| $ | (97,663 | ) | $ | 975,848 |
| |||||
Cost of sales |
| — |
|
| 555,032 |
|
| 259,548 |
|
| (97,663 | ) |
| 716,917 |
| |||||
Amortization of goodwill |
| — |
|
| 3,980 |
|
| 4,451 |
|
| — |
|
| 8,431 |
| |||||
Selling, general and administrative |
| — |
|
| 67,924 |
|
| 67,271 |
|
| — |
|
| 135,195 |
| |||||
Research and engineering costs |
| — |
|
| 38,888 |
|
| 1,261 |
|
| — |
|
| 40,149 |
| |||||
Merger, transaction, and litigation costs |
| — |
|
| 1,037 |
|
| 6,771 |
|
| — |
|
| 7,808 |
| |||||
Total costs |
| — |
|
| 666,861 |
|
| 339,302 |
|
| (97,663 | ) |
| 908,500 |
| |||||
Operating profit |
| — |
|
| 20,188 |
|
| 47,160 |
|
| — |
|
| 67,348 |
| |||||
Other expenses (income) |
| 568 |
|
| (1,150 | ) |
| (1,058 | ) |
| — |
|
| (1,640 | ) | |||||
Interest expense |
| 16,691 |
|
| 1,605 |
|
| 630 |
|
| — |
|
| 18,926 |
| |||||
Income (loss) before income taxes |
| (17,259 | ) |
| 19,733 |
|
| 47,588 |
|
| — |
|
| 50,062 |
| |||||
Provision for income taxes |
| — |
|
| 11,292 |
|
| 8,961 |
|
| — |
|
| 20,253 |
| |||||
Equity in net income of subsidiaries |
| 47,068 |
|
| 38,627 |
|
| — |
|
| (85,695 | ) |
| — |
| |||||
Net income | $ | 29,809 |
| $ | 47,068 |
| $ | 38,627 |
| $ | (85,695 | ) | $ | 29,809 |
| |||||
Year Ended December 31, 2001 | ||||||||||||||||||||
Varco International, Inc. | Guarantor Subsidiaries | Non- Guarantor Subsidiaries | Eliminations | Consolidated | ||||||||||||||||
(In thousands) | ||||||||||||||||||||
CONDENSED CONSOLIDATING STATEMENT OF CASH FLOWS | ||||||||||||||||||||
Net cash provided by (used for) operating activities | $ | (38,262 | ) | $ | 196,610 |
| $ | 70,023 |
| $ | (144,376 | ) | $ | 83,995 |
| |||||
Net cash provided by (used for) investing activities: | ||||||||||||||||||||
Capital expenditures |
| — |
|
| (38,566 | ) |
| (27,268 | ) |
| — |
|
| (65,834 | ) | |||||
Business acquisitions, net of cash acquired |
| — |
|
| (109,290 | ) |
| (36,663 | ) |
| — |
|
| (145,953 | ) | |||||
Investments in subsidiaries |
| (144,376 | ) |
| — |
|
| — |
|
| 144,376 |
|
| — |
| |||||
Other |
| — |
|
| — |
|
| (1,121 | ) |
| — |
|
| (1,121 | ) | |||||
Net cash provided by (used for) investing activities |
| (144,376 | ) |
| (147,856 | ) |
| (65,052 | ) |
| 144,376 |
|
| (212,908 | ) | |||||
Net cash provided by (used for) financing activities: | ||||||||||||||||||||
Net payments under financing agreements |
| 178,068 |
|
| (20,888 | ) |
| 7,588 |
|
| — |
|
| 164,768 |
| |||||
Net proceeds from sale of common stock |
| 10,132 |
|
| — |
|
| — |
|
| — |
|
| 10,132 |
| |||||
Net cash provided by (used for) financing activities |
| 188,200 |
|
| (20,888 | ) |
| 7,588 |
|
| — |
|
| 174,900 |
| |||||
Effect of exchange rate changes on cash |
| — |
|
| — |
|
| (664 | ) |
| — |
|
| (664 | ) | |||||
Net increase in cash and cash equivalents |
| 5,562 |
|
| 27,866 |
|
| 11,895 |
|
| — |
|
| 45,323 |
| |||||
Cash and cash equivalents: | ||||||||||||||||||||
Beginning of period |
| — |
|
| (2,729 | ) |
| 14,905 |
|
| — |
|
| 12,176 |
| |||||
End of period | $ | 5,562 |
| $ | 25,137 |
| $ | 26,800 |
| $ | — |
| $ | 57,499 |
| |||||
F-28
VARCO INTERNATIONAL, INC.
NOTES TO CONSOLIDATED FINANCIAL STATEMENTS—(Continued)
Year Ended December 31, 2000 | ||||||||||||||||||||
Varco International, Inc. | Guarantor Subsidiaries | Non- Guarantor Subsidiaries | Eliminations | Consolidated | ||||||||||||||||
(In thousands) | ||||||||||||||||||||
CONDENSED CONSOLIDATING STATEMENT OF CASH FLOWS | ||||||||||||||||||||
Net cash provided by (used for) operating activities | $ | 55,689 |
| $ | (26,395 | ) | $ | 37,231 |
| $ | 15,262 |
| $ | 81,787 |
| |||||
Net cash provided by (used for) investing activities: | ||||||||||||||||||||
Capital expenditures |
| — |
|
| (21,420 | ) |
| (24,043 | ) |
| — |
|
| (45,463 | ) | |||||
Business acquisitions, net of cash acquired |
| — |
|
| (15,423 | ) |
| (6,262 | ) |
| — |
|
| (21,685 | ) | |||||
Investments in subsidiaries |
| 15,262 |
|
| — |
|
| — |
|
| (15,262 | ) |
| — |
| |||||
Other |
| — |
|
| — |
|
| 2,276 |
|
| — |
|
| 2,276 |
| |||||
Net cash provided by (used for) investing activities |
| 15,262 |
|
| (36,843 | ) |
| (28,029 | ) |
| (15,262 | ) |
| (64,872 | ) | |||||
Net cash used for financing activities: | ||||||||||||||||||||
Net payments under financing agreements |
| (81,000 | ) |
| (13,935 | ) |
| (1,832 | ) |
| — |
|
| (96,767 | ) | |||||
Net proceeds from sale of common stock |
| 10,049 |
|
| — |
|
| — |
|
| — |
|
| 10,049 |
| |||||
Net cash used for financing activities |
| (70,951 | ) |
| (13,935 | ) |
| (1,832 | ) |
| — |
|
| (86,718 | ) | |||||
Effect of exchange rate changes on cash |
| — |
|
| — |
|
| (1,138 | ) |
| — |
|
| (1,138 | ) | |||||
Net increase (decrease) in cash and cash equivalents |
| — |
|
| (77,173 | ) |
| 6,232 |
|
| — |
|
| (70,941 | ) | |||||
Cash and cash equivalents: | ||||||||||||||||||||
Beginning of period |
| — |
|
| 74,444 |
|
| 8,673 |
|
| — |
|
| 83,117 |
| |||||
End of period | $ | — |
| $ | (2,729 | ) | $ | 14,905 |
| $ | — |
| $ | 12,176 |
| |||||
F-29
VARCO INTERNATIONAL, INC.
NOTES TO CONSOLIDATED FINANCIAL STATEMENTS—(Continued)
Year Ended December 31, 1999 | ||||||||||||||||||||
Varco International, Inc. | Guarantor Subsidiaries | Non- Guarantor Subsidiaries | Eliminations | Consolidated | ||||||||||||||||
(In thousands) | ||||||||||||||||||||
CONDENSED CONSOLIDATING STATEMENT OF CASH FLOWS | ||||||||||||||||||||
Net cash provided by (used in) operating activities | $ | (5,229 | ) | $ | 95,125 |
| $ | 10,145 |
| $ | 19,023 |
| $ | 119,064 |
| |||||
Net cash provided by (used for) investing activities: | ||||||||||||||||||||
Capital expenditures |
| — |
|
| (19,704 | ) |
| (11,025 | ) |
| — |
|
| (30,729 | ) | |||||
Business acquisitions, net of cash acquired |
| — |
|
| (11,373 | ) |
| (1,747 | ) |
| — |
|
| (13,120 | ) | |||||
Investments in subsidiaries |
| 19,023 |
|
| — |
|
| — |
|
| (19,023 | ) |
| — |
| |||||
Other |
| — |
|
| 211 |
|
| — |
|
| — |
|
| 211 |
| |||||
Net cash provided by (used for) investing activities |
| 19,023 |
|
| (30,866 | ) |
| (12,772 | ) |
| (19,023 | ) |
| (43,638 | ) | |||||
Net cash used for financing activities: | ||||||||||||||||||||
Net payments under financing agreements |
| (19,419 | ) |
| (14,429 | ) |
| (1,668 | ) |
| — |
|
| (35,516 | ) | |||||
Net proceeds from sale of common stock |
| 5,625 |
|
| — |
|
| — |
|
| — |
|
| 5,625 |
| |||||
Net cash used for financing activities |
| (13,794 | ) |
| (14,429 | ) |
| (1,668 | ) |
| — |
|
| (29,891 | ) | |||||
Effect of exchange rate changes on cash |
| — |
|
| — |
|
| (291 | ) |
| — |
|
| (291 | ) | |||||
Net increase (decrease) in cash and cash equivalents |
| — |
|
| 49,830 |
|
| (4,586 | ) |
| — |
|
| 45,244 |
| |||||
Cash and cash equivalents: | ||||||||||||||||||||
Beginning of period |
| — |
|
| 24,614 |
|
| 13,259 |
|
| — |
|
| 37,873 |
| |||||
End of period | $ | — |
| $ | 74,444 |
| $ | 8,673 |
| $ | — |
| $ | 83,117 |
| |||||
F-30
VARCO INTERNATIONAL, INC.
NOTES TO CONSOLIDATED FINANCIAL STATEMENTS—(Continued)
14. Quarterly Financial Information (Unaudited)
Summarized quarterly financial information for 2001, 2000, and 1999 is as follows:
Revenue | Operating Profit (Loss) | Net Income (Loss) | Basic Earnings (Loss) Per Common Share | Dilutive Earnings (Loss) Per Common Share | |||||||||||||||
(In thousands, except for share data) | |||||||||||||||||||
2001 | |||||||||||||||||||
First Quarter | $ | 274,213 | $ | 36,644 |
| $ | 19,127 |
| $ | 0.20 |
| $ | 0.20 |
| |||||
Second Quarter |
| 303,875 |
| 25,940 |
|
| 11,747 |
|
| 0.12 |
|
| 0.12 |
| |||||
Third Quarter |
| 327,472 |
| 46,334 |
|
| 24,898 |
|
| 0.26 |
|
| 0.26 |
| |||||
Fourth Quarter |
| 362,249 |
| 49,208 |
|
| 27,196 |
|
| 0.28 |
|
| 0.28 |
| |||||
Total Year | $ | 1,267,809 | $ | 158,126 |
| $ | 82,968 |
| $ | 0.87 |
| $ | 0.86 |
| |||||
2000 | �� | ||||||||||||||||||
First Quarter | $ | 203,775 | $ | 18,602 |
| $ | 8,768 |
| $ | 0.10 |
| $ | 0.09 |
| |||||
Second Quarter |
| 205,821 |
| (7,233 | ) |
| (12,593 | ) |
| (0.14 | ) |
| (0.14 | ) | |||||
Third Quarter |
| 211,393 |
| 21,141 |
|
| 10,815 |
|
| 0.12 |
|
| 0.11 |
| |||||
Fourth Quarter |
| 245,626 |
| 28,401 |
|
| 14,065 |
|
| 0.15 |
|
| 0.15 |
| |||||
Total Year | $ | 866,615 | $ | 60,911 |
| $ | 21,055 |
| $ | 0.23 |
| $ | 0.22 |
| |||||
1999 | |||||||||||||||||||
First Quarter | $ | 247,095 | $ | 22,197 |
| $ | 12,039 |
| $ | 0.13 |
| $ | 0.13 |
| |||||
Second Quarter |
| 248,084 |
| 19,609 |
|
| 9,689 |
|
| 0.11 |
|
| 0.10 |
| |||||
Third Quarter |
| 235,710 |
| 19,071 |
|
| 8,823 |
|
| 0.10 |
|
| 0.09 |
| |||||
Fourth Quarter |
| 244,959 |
| 6,471 |
|
| (742 | ) |
| (0.01 | ) |
| (0.01 | ) | |||||
Total Year | $ | 975,848 | $ | 67,348 |
| $ | 29,809 |
| $ | 0.33 |
| $ | 0.32 |
| |||||
During the second quarter of 2001, the Company engaged in a court ordered mediation and as a result recorded a $16,500,000 charge concerning a patent litigation matter, which has subsequently been settled. In connection with the Merger in 2000, the Company incurred $26,570,000 of transaction costs during the following quarters of 2000: $23,596,000 (second quarter), $1,164,000 (third quarter), and $1,810,000 (fourth quarter). During the fourth quarter of 1999, the Company and Newpark Resources Inc. (“Newpark”) announced that they had jointly elected to form operational alliances in key market areas rather than proceed with the proposed merger which was agreed to in June 1999. Transaction costs and write-offs of $7,808,000 were incurred in the fourth quarter of 1999 related to costs associated with the proposed Newpark merger and the write-off of the Company’s investment in its disposal business which the Company exited as part of its alliance agreement with Newpark.
The Company adopted Statement of Financial Accounting Standards No. 142, “Goodwill and Other Intangible Assets” (SFAS 142), effective January 1, 2002. The effects of not amortizing goodwill and other intangible assets in periods prior to the adoption of SFAS 142 would have resulted in an increase in quarterly net income of approximately $2.6 million ($.03 per share) in 2001 and approximately $2.1 million ($.02 per share) in both 2000 and 1999.
F-31
SCHEDULE I
VARCO INTERNATIONAL, INC.
CONDENSED FINANCIAL INFORMATION OF REGISTRANT
CONSOLIDATED BALANCE SHEETS
(Parent Company Only)
December 31, 2001 and 2000
December 31, 2001 | December 31, 2000 | |||||||
(in thousands) | ||||||||
ASSETS | ||||||||
Cash and cash equivalents | $ | 5,562 |
| $ | — |
| ||
Amounts due from affiliates |
| 272,851 |
|
| 222,267 |
| ||
Accounts receivable |
| 1,276 |
|
| 2,287 |
| ||
Other assets |
| 5,420 |
|
| 1,174 |
| ||
Investment in subsidiaries |
| 984,501 |
|
| 736,507 |
| ||
Total assets | $ | 1,269,610 |
| $ | 962,235 |
| ||
LIABILITIES AND EQUITY | ||||||||
Amounts due to affiliates | $ | 117,995 |
| $ | 101,330 |
| ||
Interest payable |
| 5,255 |
|
| 3,117 |
| ||
Pension liabilities and post retirement obligations |
| 17,404 |
|
| — |
| ||
Notes payable |
| 300,642 |
|
| 125,805 |
| ||
Common stockholders’ equity: | ||||||||
Common stock, $.01 par value 200,000,000 shares authorized, 97,402,339 shares issued and 95,927,639 shares outstanding (96,245,849 shares issued and 94,821,149 outstanding at December 31, 2000) |
| 974 |
|
| 962 |
| ||
Paid-in capital |
| 514,137 |
|
| 498,692 |
| ||
Retained earnings |
| 347,548 |
|
| 264,580 |
| ||
Cumulative translation adjustment |
| (19,015 | ) |
| (16,921 | ) | ||
Less: treasury stock at cost (1,424,700 shares) |
| (15,330 | ) |
| (15,330 | ) | ||
Total common stockholders’ equity |
| 828,314 |
|
| 731,983 |
| ||
Total liabilities and equity | $ | 1,269,610 |
| $ | 962,235 |
| ||
See notes to condensed financial statements.
S-1
SCHEDULE I
VARCO INTERNATIONAL, INC.
CONDENSED FINANCIAL INFORMATION OF REGISTRANT
CONDENSED STATEMENTS OF INCOME
(Parent Company Only)
Years ended December 31, 2001, 2000, 1999
Years Ended December 31, | ||||||||||||
2001 | 2000 | 1999 | ||||||||||
(in thousands) | ||||||||||||
Equity in net earnings of subsidiaries | $ | 103,618 |
| $ | 40,173 |
| $ | 47,068 |
| |||
Interest expense |
| (19,724 | ) |
| (13,333 | ) |
| (16,691 | ) | |||
Other |
| (926 | ) |
| (5,785 | ) |
| (568 | ) | |||
Net income | $ | 82,968 |
| $ | 21,055 |
| $ | 29,809 |
| |||
See notes to condensed financial statements.
S-2
SCHEDULE I
VARCO INTERNATIONAL, INC.
CONDENSED FINANCIAL INFORMATION OF REGISTRANT
CONDENSED STATEMENTS OF CASH FLOWS
(Parent Company Only)
Years ended December 31, 2001, 2000, 1999
Years Ended December 31, | ||||||||||||
2001 | 2000 | 1999 | ||||||||||
(in thousands) | ||||||||||||
Cash flows from operating activities: | ||||||||||||
Net income | $ | 82,968 |
| $ | 21,055 |
| $ | 29,809 |
| |||
Adjustments to reconcile net income to net cash provided by (used for) operating activities: | ||||||||||||
Equity in net earnings of subsidiaries |
| (103,618 | ) |
| (40,173 | ) |
| (47,068 | ) | |||
Changes in current assets and liabilities: | ||||||||||||
Accounts receivable |
| 1,011 |
|
| (2,265 | ) |
| (22 | ) | |||
Income tax receivable |
| — |
|
| — |
|
| 3,154 |
| |||
Other assets |
| (4,246 | ) |
| — |
|
| — |
| |||
Pension liabilities and post-retirement obligations |
| 17,404 |
|
| — |
|
| — |
| |||
Interest payable |
| 2,138 |
|
| (2,050 | ) |
| (1,075 | ) | |||
Amounts due from (to) affiliates, net |
| (33,919 | ) |
| 79,122 |
|
| 9,973 |
| |||
Net cash provided by (used for) operating activities |
| (38,262 | ) |
| 55,689 |
|
| (5,229 | ) | |||
Cash flows provided by (used for) investing activities: | ||||||||||||
Investment in subsidiaries |
| (144,376 | ) |
| 15,262 |
|
| 19,023 |
| |||
Cash flows provided by (used for) financing activities: | ||||||||||||
Borrowings (payments) under financing agreements, net |
| 174,837 |
|
| (88,055 | ) |
| (18,655 | ) | |||
Other |
| 3,231 |
|
| 7,055 |
|
| (764 | ) | |||
Proceeds from sale of common stock |
| 10,132 |
|
| 10,049 |
|
| 5,625 |
| |||
Net cash provided by (used for) financing activities |
| 188,200 |
|
| (70,951 | ) |
| (13,794 | ) | |||
Net change in cash and cash equivalents |
| 5,562 |
|
| — |
|
| — |
| |||
Beginning of the year |
| — |
|
| — |
|
| — |
| |||
End of year | $ | 5,562 |
| $ | — |
| $ | — |
| |||
See notes to condensed financial statements.
S-3
SCHEDULE I
VARCO INTERNATIONAL, INC.
CONDENSED FINANCIAL INFORMATION OF REGISTRANT
NOTES TO CONDENSED FINANCIAL STATEMENTS
December 31, 2001, 2000, 1999
For information concerning restrictions pertaining to the common stock and commitments and contingencies, see Notes 10 and 11 of notes to consolidated financial statements of Varco International, Inc.
S-4
SCHEDULE II
VARCO INTERNATIONAL, INC.
VALUATION AND QUALIFYING ACCOUNTS
Years ended December 31, 2001, 2000, 1999
Balance Beginning of Year | Additions (Deductions) Charged to Costs and Expenses | Charge offs and Other | Balance End of Year | |||||||||||
(in thousands) | ||||||||||||||
Allowance for doubtful accounts: | ||||||||||||||
2001 | $ | 10,199 | $ | 6,326 |
| $ | (5,008 | ) | $ | 11,517 | ||||
2000 | $ | 8,373 | $ | 4,895 |
| $ | (3,069 | ) | $ | 10,199 | ||||
1999 | $ | 8,293 | $ | 2,148 |
| $ | (2,068 | ) | $ | 8,373 | ||||
Allowance for excess and obsolete inventory reserves (excludes Lifo): | ||||||||||||||
2001 | $ | 23,333 | $ | 9,507 |
| $ | (1,812 | ) | $ | 31,028 | ||||
2000 | $ | 26,933 | $ | 5,772 |
| $ | (9,372 | ) | $ | 23,333 | ||||
1999 | $ | 37,148 | $ | 6,868 |
| $ | (17,083 | ) | $ | 26,933 | ||||
Valuation allowance for deferred tax assets: | ||||||||||||||
2001 | $ | 967 | $ | — |
| $ | (54 | ) | $ | 913 | ||||
2000 | $ | 1,238 | $ | (271 | ) | $ | — |
| $ | 967 | ||||
1999 | $ | 2,208 | $ | — |
| $ | (970 | ) | $ | 1,238 | ||||
S-5