Exhibit 99
First InterstateBancSystem
Reaching New Heights
To our shareholders,
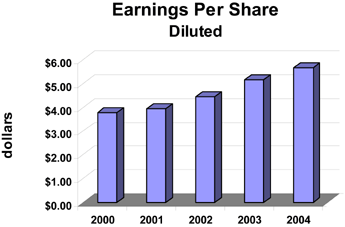
We are pleased to announce First Interstate BancSystem has achieved record earnings for the 16th consecutive year. The company earned $45,421,000 in 2004, an 11% increase over last year’s earnings of $40,752,000. Diluted earnings per share were also a record $5.68, up $.53 from last year. Return on average common equity in 2004 was 15.75%, compared to 15.79% in 2003. Our efficiency ratio improved to 64.68%, down from 65.43% in 2003.
Annual
Net interest income of $150,419,000 increased $9,775,000 over 2003, the increase driven mostly by balance sheet growth. Loans grew by $184,610,000, or 7%, while deposits grew $164,960,000, or 5%. The net interest margin of 4.34% was 3 basis points lower than 2003. Although short term rates began to increase in the second half of 2004, a flattening yield curve places pressure on maintaining net interest margin.
Total noninterest income for 2004 was $1,104,000 higher than 2003 despite a $6,961,000 reduction in fee revenue from residential real estate loans. The reduction of residential real estate loan fee revenue was replaced in 2004 by increased revenue in deposit fees, overdraft charges, data processing, investment management services and loan servicing fees. In addition to fee income growth, noninterest income also increased $1,690,000 due to the sale of the Cut Bank branch in July 2004.
Total noninterest expense of $143,592,000 was $5,667,000 higher than 2003. Excluding the effect of trust preferred issuance costs and mortgage servicing impairments totaling $2,950,000 in 2003, total noninterest expense for 2004 increased $8,617,000 over 2003. Of that increase, $3,973,000 occurred in salary and benefits expense and $3,084,000 in occupancy, furniture and equipment expense.
Fourth Quarter
Earnings of $12,045,000 in the fourth quarter were the highest fourth quarter results in company history. Earnings were $2,195,000, or 22%, higher than fourth quarter 2003. Earnings per common share of $1.49 were up $.25 from last year. Return on average common equity of 15.70% was up 122 basis points from the comparable quarter last year. The efficiency ratio was 66.10%, a 157 basis point improvement over 2003.
Net interest income was $2,592,000 higher in the fourth quarter of 2004. This was primarily the result of balance sheet growth. Average loans grew $141,277,000, or 6%, while average deposits grew $177,919,000, or 6%. Net interest margin of 4.30% declined 4 basis points over fourth quarter 2003. The provision for loan losses decreased approximately $1,000,000 for the quarter (and for the year) due to lower levels of non-performing loans, net charge-offs and internally classified loans.
Noninterest income of $17,638,000 was $1,029,000 higher than fourth quarter 2003. With the exception of residential real estate loan fee revenue which decreased $368,000, the increase was comprised of increased fee revenue from the same categories as previously mentioned in the annual analysis of noninterest income.
Noninterest expenses increased $1,616,000 or, 4%, over fourth quarter 2003. Salary and benefits accounted for $774,000 of this increase and occupancy, furniture and equipment accounted for $1,175,000.
On January 12th, 2005, the company paid a $.42 dividend per common share. Effective with the dividend to be paid April 2005, the company has increased its dividend to $.48 per share to reflect increased earnings.
This past year has been another record breaker for First Interstate BancSystem, not only a record in terms of earnings, but also in asset size, surpassing $4 Billion; just three years ago we celebrated passing the $3 Billion threshold. Faced with the challenges of a low interest rate environment, our talented team of employees, officers and directors led the company to another year of improved returns for all our stakeholders.
 |  | |
| Lyle R. Knight | Terrill R. Moore | |
| President | Chief Financial Officer | |
| Chief Executive Officer |
Financial Highlights
Three Months ended December 31
| (unaudited) | 2004 | 2003 | % Change | |||||||||
| (in thousands except per share data) | ||||||||||||
OPERATING RESULTS | ||||||||||||
| Net income | $ | 12,045 | $ | 9,850 | 22.3 | % | ||||||
| Diluted earnings per share | 1.49 | 1.24 | 20.2 | % | ||||||||
| Dividends per share | 0.42 | 0.34 | 23.5 | % | ||||||||
PERIOD END BALANCES | ||||||||||||
| Assets | 4,217,293 | 3,879,744 | 8.7 | % | ||||||||
| Loans | 2,739,509 | 2,554,899 | 7.2 | % | ||||||||
| Investment Securities | 867,315 | 799,587 | 8.5 | % | ||||||||
| Deposits | 3,321,681 | 3,156,721 | 5.2 | % | ||||||||
| Common Stockholders’ Equity | 308,326 | 274,226 | 12.4 | % | ||||||||
| Common Shares Outstanding | 7,970 | 7,913 | 0.7 | % | ||||||||
QUARTERLY AVERAGES | ||||||||||||
| Assets | 4,186,552 | 3,869,925 | 8.2 | % | ||||||||
| Loans | 2,690,004 | 2,548,727 | 5.5 | % | ||||||||
| Investment Securities | 854,795 | 793,005 | 7.8 | % | ||||||||
| Deposits | 3,309,524 | 3,131,605 | 5.7 | % | ||||||||
| Common Stockholders’ Equity | 305,179 | 269,955 | 13.0 | % | ||||||||
| Common Shares Outstanding | 7,978 | 7,913 | 0.8 | % | ||||||||
Fourth Quarter 2004
Fourth Quarter 2004
Condensed Consolidated Statements of Income
| Three Months Ended | Twelve Months Ended | |||||||||||||||
| December 31 | December 31 | |||||||||||||||
| (unaudited) | 2004 | 2003 | 2004 | 2003 | ||||||||||||
| (in thousands, except per share data) | ||||||||||||||||
| Total interest income | $ | 51,084 | $ | 47,559 | $ | 192,840 | $ | 189,258 | ||||||||
| Total interest expense | 11,755 | 10,822 | 42,421 | 48,614 | ||||||||||||
| Net interest income | 39,329 | 36,737 | 150,419 | 140,644 | ||||||||||||
| Provision for loan losses | 1,387 | 2,430 | 8,733 | 9,852 | ||||||||||||
| Net interest income after provision for loan losses | 37,942 | 34,307 | 141,686 | 130,792 | ||||||||||||
| Noninterest income | 17,638 | 16,609 | 71,256 | 70,152 | ||||||||||||
| Noninterest expense | 37,715 | 36,099 | 143,592 | 137,925 | ||||||||||||
| Income before taxes | 17,865 | 14,817 | 69,350 | 63,019 | ||||||||||||
| Incometaxes | 5,820 | 4,967 | 23,929 | 22,267 | ||||||||||||
Net income | $ | 12,045 | $ | 9,850 | $ | 45,421 | $ | 40,752 | ||||||||
COMMON SHARE DATA: | ||||||||||||||||
| Diluted EPS | 1.49 | 1.24 | 5.68 | 5.15 | ||||||||||||
| Dividends | 0.42 | 0.34 | 1.56 | 1.32 | ||||||||||||
| Book value | 38.68 | 34.66 | ||||||||||||||
| Tangible book value | 33.99 | 29.90 | ||||||||||||||
| Appraised value | 63.00 | 51.00 | ||||||||||||||
Selected Ratios
| Three Months Ended | Twelve Months Ended | |||||||||||||||
| December 31 | December 31 | |||||||||||||||
| (unaudited) | 2004 | 2003 | 2004 | 2003 | ||||||||||||
PERFORMANCE | ||||||||||||||||
| Return on avg common equity | 15.70 | % | 14.48 | % | 15.75 | % | 15.79 | % | ||||||||
| Return on avg common equity excl. market adj of securities | 15.67 | % | 14.41 | % | 15.64 | % | 15.87 | % | ||||||||
| Return on avg assets | 1.14 | % | 1.01 | % | 1.14 | % | 1.09 | % | ||||||||
| Net interest margin, FTE | 4.30 | % | 4.34 | % | 4.34 | % | 4.37 | % | ||||||||
| Efficiency ratio | 66.10 | % | 67.67 | % | 64.68 | % | 65.43 | % | ||||||||
CREDIT QUALITY (Period End) | ||||||||||||||||
| Provision for loan losses to average loans | 0.33 | % | 0.40 | % | ||||||||||||
| Net charge offs to average loans | 0.21 | % | 0.31 | % | ||||||||||||
| Allowance for loan losses to loans | 1.54 | % | 1.52 | % | ||||||||||||
| Allowance for loan losses to non-accruing loans | 239.85 | % | 160.60 | % | ||||||||||||
| CAPITAL ADEQUACY & LIQUIDITY | ||||||||||||||||
| Leverage capital ratio | 7.49 | % | 7.13 | % | ||||||||||||
| Avg loans to avg deposits | 82.27 | % | 81.24 | % | ||||||||||||
Condensed Consolidated Balance Sheet
| December 31 | ||||||||
| (unaudited) | 2004 | 2003 | ||||||
| (In thousands) | ||||||||
ASSETS | ||||||||
| Cash and due from banks | $ | 235,251 | $ | 214,529 | ||||
| Federal funds sold | 37,590 | 66,455 | ||||||
| Interest bearing deposits | 83,067 | 458 | ||||||
| Investment securities | 867,315 | 799,587 | ||||||
| Loans | 2,739,509 | 2,554,899 | ||||||
| Less: allowance for loan losses | 42,141 | 38,940 | ||||||
| Net loans | 2,697,368 | 2,515,959 | ||||||
| Premises & equipment, net | 121,928 | 112,441 | ||||||
| Accrued interest receivable | 20,569 | 19,411 | ||||||
| Goodwill and core deposit intangibles | 39,607 | 41,064 | ||||||
| Mortgage servicing rights | 17,624 | 14,405 | ||||||
| Bank owned life insurance | 60,645 | 58,704 | ||||||
| Other assets | 36,329 | 36,731 | ||||||
Total Assets | $ | 4,217,293 | $ | 3,879,744 | ||||
LIABILITIES AND STOCKHOLDERS’ EQUITY | ||||||||
| Deposits | $ | 3,321,681 | $ | 3,156,721 | ||||
| Securities sold under repurchase agreements | 449,699 | 323,406 | ||||||
| Other liabilities | 26,428 | 29,426 | ||||||
| Other borrowed funds | 7,995 | 7,137 | ||||||
| Long — term debt | 61,926 | 47,590 | ||||||
| Subordinated debenture | 41,238 | 41,238 | ||||||
Total Liabilities | 3,908,967 | 3,605,518 | ||||||
| Common stockholders’ equity | 308,326 | 274,226 | ||||||
Total Liabilities and Stockholders’ Equity | $ | 4,217,293 | $ | 3,879,744 | ||||
First InterstateBancSystem
P.O. Box 30918oBillings, Montana 59116o (406) 255-5390
www.firstinterstatebank.com