EXHIBIT 99
 | First InterstateBancSystem Across Montana and Wyoming |
To our shareholders,
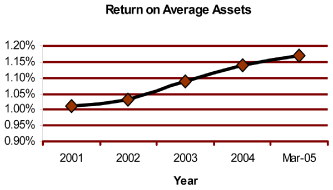
First Interstate BancSystem reported first quarter 2005 net income of $11,959,000, or $1.48 per diluted share, compared to $9,718,000 or $1.22 per diluted share in first quarter 2004. Earnings are slightly less than fourth quarter 2004, however, they are the highest first quarter earnings reported in Company history. Return on average equity (ROAE) was 15.53% in first quarter 2005 compared to 14.16% last year, return on average assets (ROAA) was 1.17% versus 1.01%, and efficiency ratio was 64.67% versus 67.16%.
Net interest income of $39,333,000 in first quarter 2005 was $2,850,000 more than first quarter 2004. The net interest margin of 4.39% decreased 1 basis point from the same period last year. Compared to fourth quarter 2004, the net interest margin increased 9 basis points. First quarter 2005 average loans grew $182,206,000, or 7%, while quarterly average deposits grew $143,810,000, or 5%, over the same period last year. Improved credit quality also contributed to the earnings growth in first quarter 2005. The provision for loan loss of $1,625,000 was $793,000, or 33%, lower than first quarter 2004.
Noninterest income of $16,949,000 was $467,000 or 3% higher than first quarter 2004. Income from the origination and sale of residential real estate loans increased $56,000, or 3%, more than first quarter 2004. Additional components of the increase year over year were technology services revenue, debit card income and insurance commission increases of $446,000, $299,000 and $162,000, respectively. Partially offsetting the income increases, a $692,000 loss on the sale of securities was recorded in first quarter 2005. Approximately $46,000,000 of U.S. agency securities were sold and replaced with higher yielding securities which should enhance future portfolio yields.
Noninterest expense was $827,000, or 2%, higher than the comparable quarter in 2004. The increase compared to first quarter 2004 can be attributed to increases in salary and benefits of $1,338,000 and furniture, equipment and occupancy of $1,065,000. In first quarter 2005, we also recorded a $463,000 mortgage servicing impairment reversal compared to a $1,029,000 impairment expense for the first quarter of 2004. Without the effect of mortgage servicing impairment, noninterest expense would have been $2,319,000, or 6.7% higher than last year.
During first quarter 2005, we announced our intent to discontinue operation of our banking facilities at Wal-Mart locations. A loss of $366,000 was recorded relating to costs associated with physically removing
operations from the Wal-Mart facilities. The decision to exit the Wal-Mart locations was strategic and is expected to better serve our Company, and you as shareholders, in the future.
On April 8, 2005, the Company paid a $.48 dividend per common share.
First quarter 2005 saw continued growth of our core business and improving financial results. In order to meet the challenging future, our employees, directors and officers need to continue their dedication to improving efficiency and serving our customers.
 |  | |
| Lyle R. Knight | Terrill R. Moore | |
| President | Chief Financial Officer | |
| Chief Executive Officer |
Financial Highlights
Three Months Ended March 31
| (unaudited) | 2005 | 2004 | % Change | |||||||||
| (in thousands, except per share data) | ||||||||||||
OPERATING RESULTS | ||||||||||||
| Net income | $ | 11,959 | $ | 9,718 | 23.1 | % | ||||||
| Diluted earnings per share | 1.48 | 1.22 | 21.3 | % | ||||||||
| Dividends per share | 0.48 | 0.34 | 41.2 | % | ||||||||
PERIOD END BALANCES | ||||||||||||
| Assets | 4,201,211 | 3,883,535 | 8.2 | % | ||||||||
| Loans | 2,769,056 | 2,568,944 | 7.8 | % | ||||||||
| Investment Securities | 834,941 | 807,011 | 3.5 | % | ||||||||
| Deposits | 3,272,388 | 3,137,336 | 4.3 | % | ||||||||
| Common Stockholders’ Equity | 310,951 | 283,971 | 9.5 | % | ||||||||
| Common Shares Outstanding | 7,980 | 7,897 | 1.1 | % | ||||||||
QUARTERLY AVERAGES | ||||||||||||
| Assets | 4,160,025 | 3,851,059 | 8.0 | % | ||||||||
| Loans | 2,740,492 | 2,558,286 | 7.1 | % | ||||||||
| Investment Securities | 859,152 | 798,187 | 7.6 | % | ||||||||
| Deposits | 3,250,507 | 3,106,697 | 4.6 | % | ||||||||
| Common Stockholders’ Equity | 312,227 | 276,100 | 13.1 | % | ||||||||
| Common Shares Outstanding | 7,970 | 7,908 | 0.8 | % | ||||||||
First Quarter 2005
First Quarter 2005
Condensed Consolidated Statements of Income
| Three Months Ended | ||||||||
| March 31 | ||||||||
| (unaudited) | 2005 | 2004 | ||||||
| (in thousands, except per share data) | ||||||||
| Total interest income | $ | 51,967 | $ | 46,567 | ||||
| Total interest expense | 12,634 | 10,084 | ||||||
| Net interest income | 39,333 | 36,483 | ||||||
| Provision for loan losses | 1,625 | 2,418 | ||||||
| Net interest income after provision for loan losses | 37,708 | 34,065 | ||||||
| Noninterest income | 16,949 | 16,482 | ||||||
| Noninterest expense | 36,396 | 35,569 | ||||||
| Income before taxes | 18,261 | 14,978 | ||||||
| Income taxes | 6,302 | 5,260 | ||||||
Net income | $ | 11,959 | $ | 9,718 | ||||
COMMON SHARE DATA: | ||||||||
| Diluted EPS | 1.48 | 1.22 | ||||||
| Dividends | .48 | .34 | ||||||
| Book value | 39.02 | 35.96 | ||||||
| Tangible book value | 34.33 | 31.20 | ||||||
| Appraised value | * | 52.50 | ||||||
*Currently not available, $63.00 as of December 31, 2004
Selected Ratios
| Three Months Ended | ||||||||
| March 31 | ||||||||
| (unaudited) | 2005 | 2004 | ||||||
PERFORMANCE | ||||||||
| Return on avg common equity | 15.53 | % | 14.16 | % | ||||
| Return on avg common equity excl. market adj of securities | 15.43 | % | 14.07 | % | ||||
| Return on avg assets | 1.17 | % | 1.01 | % | ||||
| Net interest margin, FTE | 4.39 | % | 4.40 | % | ||||
| Efficiency ratio | 64.67 | % | 67.16 | % | ||||
CREDIT QUALITY (Period End) | ||||||||
| Annualized provision for loan losses to average loans | 0.24 | % | 0.38 | % | ||||
| Annualized net charge offs to average loans | 0.16 | % | 0.21 | % | ||||
| Allowance for loan losses to loans | 1.54 | % | 1.56 | % | ||||
| Allowance for loan losses to non-accruing loans | 263.51 | % | 155.24 | % | ||||
CAPITAL ADEQUACY & LIQUIDITY | ||||||||
| Leverage capital ratio | 7.67 | % | 7.30 | % | ||||
| Avg loans to avg deposits | 84.31 | % | 82.35 | % | ||||
It’s our home too
Condensed Consolidated Balance Sheet
| March 31 | ||||||||
| (unaudited) | 2005 | 2004 | ||||||
| (In thousands) | ||||||||
ASSETS | ||||||||
| Cash and due from banks | $ | 184,559 | $ | 204,541 | ||||
| Federal funds sold | 121,890 | 58,140 | ||||||
| Interest bearing deposits | 31,158 | 325 | ||||||
| Investment securities | 834,941 | 807,011 | ||||||
| Loans | 2,769,056 | 2,568,944 | ||||||
| Less: allowance for loan losses | 42,660 | 39,998 | ||||||
| Net loans | 2,726,396 | 2,528,946 | ||||||
| Premises & equipment, net | 119,181 | 116,314 | ||||||
| Accrued interest receivable | 22,109 | 19,112 | ||||||
| Goodwill and core deposit intangibles | 39,354 | 40,780 | ||||||
| Mortgage servicing rights | 18,275 | 14,164 | ||||||
| Company owned life insurance | 61,066 | 52,611 | ||||||
| Other assets | 42,282 | 41,591 | ||||||
Total Assets | $ | 4,201,211 | $ | 3,883,535 | ||||
LIABILITIES AND STOCKHOLDERS’ EQUITY | ||||||||
| Deposits | $ | 3,272,388 | $ | 3,137,336 | ||||
| Securities sold under repurchase agreements | 478,448 | 336,043 | ||||||
| Other liabilities | 34,142 | 30,689 | ||||||
| Other borrowed funds | 4,001 | 7,399 | ||||||
| Long-term debt | 60,043 | 46,859 | ||||||
| Subordinated debenture | 41,238 | 41,238 | ||||||
Total Liabilities | 3,890,260 | 3,599,564 | ||||||
| Common stockholders’ equity | 310,951 | 283,971 | ||||||
Total Liabilities and Stockholders’ Equity | $ | 4,201,211 | $ | 3,883,535 | ||||
First InterstateBancSystem
P.O. Box 30918 • Billings, Montana 59116•(406) 255-5390
www.firstinterstatebank.com