Exhibit 99

To our shareholders,
First Interstate BancSystem is pleased to report first quarter 2009 net income to common shareholders of $15,844,000, or $1.98 per share, compared to $17,307,000, or $2.14 per share, in first quarter 2008. Return on average common equity was 13.09% in first quarter 2009, as compared to 15.82% in first quarter 2008 and return on average assets was 1.02% versus 1.20%.
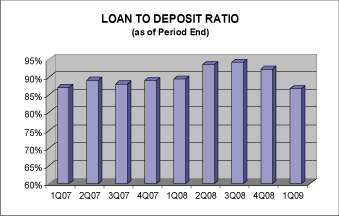
During first quarter 2009, we successfully focused on balancing internal growth to improve our liquidity position. Deposits increased $275,388,000, or 5.3%, from December 31, 2008 to March 31, 2009. However, low loan demand resulted in a $47,132,000, or 1.0%, decrease in loans during the same period. Our loan to deposit ratio decreased to 87% as of March 31, 2009 from 92% as of December 31, 2008.
Net interest income increased 4.0% to $59,063,000 for first quarter 2009, compared to the same period in 2008. Our first quarter 2009 net interest margin ratio of 4.12% remained stable compared to 4.13% for fourth quarter 2008 but decreased 17 basis points from 4.29% in first quarter 2008. Interest free and low-cost funding sources, including demand deposits, federal funds purchased and short-term borrowings comprised a smaller percentage of our funding base during first quarter 2009 compared to first quarter 2008.
During first quarter 2009, we recorded provisions for loan losses of $9,600,000, compared to $20,036,000 in fourth quarter 2008 and $2,363,000 in first quarter 2008. Provisions for loan losses reflect our assessment of the estimated effects of current economic conditions on our loan portfolio. Recessionary factors resulted in deterioration of credit quality in 2009 and 2008. Our non-performing assets grew to $122,300,000 as of March 31, 2009, from $96,947,000 as of December 31, 2008 and $58,921,000 as of March 31, 2008, primarily due to increases in non-performing real estate development loans. Loan charge-offs, net of recoveries, totaled $4,693,000 during first quarter 2009 compared to $766,000 during first quarter 2008, with all major loan categories showing increases.
Non-interest income of $25,943,000 for first quarter 2009 decreased 1.6% from the same period in 2008. Increases in income from the origination and sale of residential real estate loans of $6,854,000 during first quarter 2009, as compared to first quarter 2008, were offset by decreases in technology services revenues of $4,350,000 due to the sale of our technology services subsidiary in December 2008. In addition, during first quarter 2008 we recorded one-time gains of $1,620,000 on the mandatory redemption of VISA stock and $1,083,000 from the release of escrow funds related to the December 2006 sale of our interest in iPay Technologies, LLC.
Non-interest expense of $50,175,000 for first quarter 2009 decreased 5.6% from the same period in 2008. Increases in FDIC insurance premiums and mortgage servicing rights amortization expense of $1,646,000 and $1,557,000, respectively, were more than offset by a reversal of impairment of mortgage servicing rights. During first quarter 2009, we reversed previously recorded impairment of $2,847,000, compared to recording additional impairment of $3,552,000 in first quarter 2008. In addition, out-sourced technology services expense increased $1,659,000 during first quarter 2009, as compared to the first and fourth quarters of 2008, primarily due to the sale of our technology services subsidiary in December 2008. Increases in outsourced technology services expense were largely offset by decreases in salaries, wages and employee benefits, occupancy, furniture and equipment and other non-interest expenses.
In response to the current recession and uncertain market conditions, we implemented changes to our capital management practices to ensure our long-term success and conserve capital. On April 7, 2009, we paid a dividend of $.45 per common share, a decrease of $.20 cents per common share from quarterly dividends paid in 2008 and first quarter 2009. In addition, during the first quarter 2009 stock redemption window, we limited repurchases of common stock outside of our 401(k) retirement plan to no more than 500 shares per shareholder requesting a redemption. We continue to evaluate alternative sources of additional capital. On April 13, 2009, we received notification that our application for participation in the TARP Capital Purchase Program was approved. After careful consideration, we have elected not to participate in this capital opportunity.
Financial Highlights
Three Months ended March 31,
Three Months ended March 31,
| (unaudited) | 2009 | 2008 | % Change | |||||||||
| (in thousands except per share data) | ||||||||||||
OPERATING RESULTS | ||||||||||||
| Net income | $ | 16,688 | $ | 18,076 | -7.7 | % | ||||||
| Net income to common stockholders | 15,844 | 17,307 | -8.5 | % | ||||||||
| Diluted earnings per common share | 1.98 | 2.14 | -7.5 | % | ||||||||
| Dividends per common share | 0.65 | 0.65 | 0.0 | % | ||||||||
PERIOD END BALANCES | ||||||||||||
| Assets | 6,722,837 | 6,284,356 | 7.0 | % | ||||||||
| Loans | 4,725,681 | 4,384,346 | 7.8 | % | ||||||||
| Investment securities | 1,047,355 | 1,141,850 | -8.3 | % | ||||||||
| Deposits | 5,449,647 | 4,901,949 | 11.2 | % | ||||||||
| Stockholders’ equity | 548,085 | 504,452 | 8.6 | % | ||||||||
| Common shares outstanding | 7,846 | 7,885 | -0.5 | % | ||||||||
QUARTERLY AVERAGE BALANCES | ||||||||||||
| Assets | 6,604,313 | 6,065,208 | 8.9 | % | ||||||||
| Loans | 4,762,021 | 4,246,302 | 12.1 | % | ||||||||
| Investment securities | 1,033,457 | 1,117,297 | -7.5 | % | ||||||||
| Deposits | 5,253,941 | 4,700,927 | 11.8 | % | ||||||||
| Stockholders’ equity | 540,942 | 485,267 | 11.5 | % | ||||||||
Although we continued to build capital through retention of earnings and managed asset growth during first quarter 2009, our regulatory capital was significantly improved by an amendment to the regulatory capital rules. During first quarter 2009, federal banking regulators amended regulatory capital rules to reduce the amount of goodwill deducted from tier 1 capital by the amount of the associated deferred tax liability. This change increased both our tier 1 and total capital ratios by 1.18% to 9.98% and 11.90%, respectively, as of March 31, 2009.
We are pleased with our progress toward the integration of the acquired First Western Banks with First Interstate Bank. We are on target to combine the banks into one institution by the end of third quarter 2009.
Although we are feeling the impact of the national recession in our home states of Montana, Wyoming and South Dakota, we are fortunate that these states continue to have stronger economic underpinnings than the rest of the nation. We have managed our business with conservative values that have allowed us to avoid many of the serious difficulties experienced by other banks. We remain committed to these values and are confident about our ability to navigate through these uncertain times. This past quarter we challenged management to reduce targeted, controllable non-interest expenses. While we are committed to this expense management initiative, we have not diminished our focus on management succession and employee development.
As we operate within today’s challenging business and economic climate, we are fortunate to have an experienced and dedicated team of employees, officers, directors and shareholders to guide us.
 |  | |
| Lyle R. Knight | Terrill R. Moore | |
| President | Executive Vice President | |
| Chief Executive Officer | Chief Financial Officer |
First Quarter 2009
Condensed Consolidated Statements of Income
| Three Months Ended | ||||||||
| March 31, | ||||||||
| (unaudited) | 2009 | 2008 | ||||||
| (in thousands, except per share data) | ||||||||
| Total interest income | $ | 81,883 | $ | 91,109 | ||||
| Total interest expense | 22,820 | 34,306 | ||||||
| Net interest income | 59,063 | 56,803 | ||||||
| Provision for loan losses | 9,600 | 2,363 | ||||||
| Net interest income after provision for loan losses | 49,463 | 54,440 | ||||||
| Non-interest income | 25,943 | 26,369 | ||||||
| Non-interest expense | 50,175 | 53,155 | ||||||
| Income before taxes | 25,231 | 27,654 | ||||||
| Income taxes | 8,543 | 9,578 | ||||||
| Net income | 16,688 | 18,076 | ||||||
| Less: preferred stock dividends | 844 | 769 | ||||||
Net income to common stockholders | $ | 15,844 | $ | 17,307 | ||||
DATA PER COMMON SHARE: | ||||||||
| Diluted EPS | $ | 1.98 | $ | 2.14 | ||||
| Dividends | 0.65 | 0.65 | ||||||
| Book value | 63.48 | 57.63 | ||||||
| Tangible book value | 36.60 | 30.16 | ||||||
| Appraised value | 74.50 | * | 83.50 | ** | ||||
| * | Based on the latest independent appraised minority share valuation as of December 31, 2008, effective for transactions on or after March 2, 2009. | |
| ** | Based on the latest independent appraised minority share valuation as of December 31, 2007, effective for transactions on or after February 15, 2008. |
Selected Ratios
| Three Months Ended | ||||||||
| March 31, | ||||||||
| (unaudited) | 2009 | 2008 | ||||||
PERFORMANCE | ||||||||
| Return on average common equity | 13.09 | % | 15.82 | % | ||||
| Return on average assets | 1.02 | % | 1.20 | % | ||||
| Net interest margin, FTE | 4.12 | % | 4.29 | % | ||||
| Efficiency ratio | 59.03 | % | 63.91 | % | ||||
CREDIT QUALITY (Period End) | ||||||||
| Annualized provision for loan losses to average loans | 0.82 | % | 0.22 | % | ||||
| Annualized net charge offs to average loans | 0.40 | % | 0.07 | % | ||||
| Allowance for loan losses to loans | 1.95 | % | 1.56 | % | ||||
| Allowance for loan losses to non-accruing loans | 101.51 | % | 134.19 | % | ||||
| Non-accruing loans to total loans | 1.92 | % | 1.16 | % | ||||
CAPITAL ADEQUACY & LIQUIDITY | ||||||||
| Loan to deposit ratio at period end | 86.72 | % | 89.44 | % | ||||
| Total risk based capital ratio | 11.90 | % | 10.35 | % | ||||
| Tier 1 risk based capital ratio | 9.98 | % | 8.39 | % | ||||
| Leverage capital ratio | 8.06 | % | 7.11 | % | ||||
Condensed Consolidated Balance Sheet
| March 31, | ||||||||
| (unaudited) | 2009 | 2008 | ||||||
| (In thousands) | ||||||||
ASSETS | ||||||||
| Cash and due from banks | $ | 266,422 | $ | 231,241 | ||||
| Federal funds sold | 190,368 | 47,018 | ||||||
| Interest bearing deposits | 1,554 | 10,788 | ||||||
| Investment securities | 1,047,355 | 1,141,850 | ||||||
| Loans | 4,725,681 | 4,384,346 | ||||||
| Less: allowance for loan losses | 92,223 | 68,415 | ||||||
| Net loans | 4,633,458 | 4,315,931 | ||||||
| Premises & equipment, net | 184,767 | 163,987 | ||||||
| Accrued interest receivable | 37,076 | 41,736 | ||||||
| Goodwill | 183,673 | 182,794 | ||||||
| Core deposit intangible | 12,147 | 14,604 | ||||||
| Mortgage servicing rights | 14,813 | 18,872 | ||||||
| Company owned life insurance | 69,730 | 67,661 | ||||||
| Other real estate | 18,647 | 874 | ||||||
| Other assets | 62,827 | 47,000 | ||||||
Total Assets | $ | 6,722,837 | $ | 6,284,356 | ||||
LIABILITIES AND STOCKHOLDERS’ EQUITY | ||||||||
| Deposits | $ | 5,449,647 | $ | 4,901,949 | ||||
| Federal funds purchased | — | 39,960 | ||||||
| Securities sold under repurchase agreements | 388,714 | 535,990 | ||||||
| Accrued interest payable | 21,278 | 25,555 | ||||||
| Accounts payable & accrued expenses | 51,233 | 43,210 | ||||||
| Other borrowed funds | 58,169 | 12,030 | ||||||
| Long - term debt | 81,966 | 97,495 | ||||||
| Subordinated debentures | 123,715 | 123,715 | ||||||
Total Liabilities | 6,174,752 | 5,779,904 | ||||||
| Stockholders’ equity | 548,085 | 504,452 | ||||||
Total Liabilities and Stockholders’ Equity | $ | 6,722,837 | $ | 6,284,356 | ||||