UNITED STATES
SECURITIES AND EXCHANGE COMMISSION
Washington, D.C. 20549
FORM N-CSR
CERTIFIED SHAREHOLDER REPORT OF REGISTERED
MANAGEMENT INVESTMENT COMPANIES
Investment Company Act file number | 811-06044 | |||||||
| ||||||||
Morgan Stanley European Equity Fund Inc. | ||||||||
(Exact name of registrant as specified in charter) | ||||||||
| ||||||||
1221 Avenue of the Americas, New York, New York |
| 10020 | ||||||
(Address of principal executive offices) |
| (Zip code) | ||||||
| ||||||||
Ronald E. Robison | ||||||||
(Name and address of agent for service) | ||||||||
| ||||||||
Registrant’s telephone number, including area code: | 212-762-4000 |
| ||||||
| ||||||||
Date of fiscal year end: | October 31, 2006 |
| ||||||
| ||||||||
Date of reporting period: | October 31, 2006 |
| ||||||
Item 1 - Report to Shareholders
Welcome, Shareholder:
In this report, you'll learn about how your investment in Morgan Stanley European Equity Fund Inc. performed during the annual period. We will provide an overview of the market conditions, and discuss some of the factors that affected performance during the reporting period. In addition, this report includes the Fund's financial statements and a list of Fund investments.
This material must be preceded or accompanied by a prospectus for the fund being offered.
Market forecasts provided in this report may not necessarily come to pass. There is no assurance that the Fund will achieve its investment objective. The Fund is subject to market risk, which is the possibility that market values of securities owned by the Fund will decline and, therefore, the value of the Fund's shares may be less than what you paid for them. Accordingly, you can lose money investing in this Fund. Please see the prospectus for more complete information on investment risks.
Fund Report
For the year ended October 31, 2006
| Total Return for the 12 Months Ended October 31, 2006 | |||||||||||||||||||||||
| Class A | Class B | Class C | Class D | Morgan Stanley Capital International (MSCI) Europe Index1 | Lipper European Region Funds Index2 | ||||||||||||||||||
| 28.91 | % | 28.99 | % | 27.85 | % | 29.19 | % | 31.69 | % | 32.54 | % | ||||||||||||
The performance of the Fund's four share classes varies because each has different expenses. The Fund's total returns assume the reinvestment of all distributions but do not reflect the deduction of any applicable sales charges. Such costs would lower performance. See Performance Summary for standardized performance and benchmark information.
Because Class B shares incurred lower expenses under the 12b-1 Plan than did Class A shares for the fiscal period ended October 31, 2006, the total operating expense ratio for Class B shares was lower and, as a result, the performance of Class B shares was higher than that of the Class A shares. There can be no assurance that this will continue to occur in the future as the maximum fees payable by Class B shares under the 12b-1 Plan are higher than those payable by Class A shares.
Market Conditions
During the 12-month reporting period, Europe's economic picture continued to be stable, providing a positive backdrop for European stock markets. In May, concerns about monetary tightening by the U.S. Federal Open Market Committee (the "Fed") caused considerable volatility in markets around the world. However, these fears abated as declining oil prices eased inflation worries and the global economy continued to grow at a respectable pace. The European Central Bank also raised interest rates during the period, but many investors viewed the central bank's actions positively, as evidence that the economy was on strong ground.
On the whole, improving corporate profits and robust European domestic demand contributed to a generally positive environment for European stocks. Corporate earnings have risen but valuations have not yet expanded, providing a relatively attractive opportunity for investors in European stocks. The best performing sectors in the MSCI Europe Index were diversified financials, real estate and utilities. The weakest performers were the energy, software, pharmaceuticals and telecommunication sectors.
Performance Analysis
Morgan Stanley European Equity Fund underperformed the Morgan Stanley Capital International (MSCI) Europe Index and the Lipper European Region Funds Index for the 12 months ended October 31, 2006, assuming no deduction of applicable sales charges.
Although the Fund performed well on an absolute basis for the 12-month period, the Fund lost ground relative to the MSCI Europe Index in several areas. In the food, beverage and tobacco sector, weak stock
2
selection hurt results due to negative company-specific events. Our stock selection in the diversified financials sector turned out to be disadvantageous. The Fund did not own meaningful exposure to securities exchange stocks, which benefited from the robust merger and acquisition activity of the past two years, offsetting the positive performance of the Fund's other holdings in the diversified financials sector. An underweight in the utilities sector, one of the MSCI Europe Index's best performing areas, detracted from the Fund's return, as did an overweight to the lagging telecommunications sector. Although performance in the telecommunications sector improved in the final months of the reporting period, concerns about weakening industry fundamentals dampened the sector's performance earlier in the period.
Nonetheless, relative to the MSCI Europe Index, the Fund benefited from positive performance in other areas. Positive company-specific news in the media sector boosted the Fund's results. Select food and staples retailing holdings also performed well due to growth in the companies' profits. Our stock selection in the technology hardware and the transportation sectors were an additional source of gains for the Fund.
There is no guarantee that any sectors mentioned will continue to perform as discussed herein or that securities in such sectors will be held by the Fund in the future.
3
| TOP 10 HOLDINGS | |||||||
| Royal Dutch Shell PLC (A Shares) | 4.6 | % | |||||
| HSBC Holdings PLC | 4.0 | ||||||
| Novartis AG (Registered Shares) | 3.3 | ||||||
| BNP Paribas | 3.0 | ||||||
| Wolters Kluwer NV (Share Certificates) | 3.0 | ||||||
| Allianz Se (Registered Shares) | 2.6 | ||||||
| Swiss Re (Registered Shares) | 2.4 | ||||||
| Roche Holding AG | 2.4 | ||||||
| Total S.A. | 2.4 | ||||||
| France Telecom S.A. | 2.3 | ||||||
| TOP FIVE COUNTRIES | |||||||
| United Kingdom | 23.7 | % | |||||
| France | 17.0 | ||||||
| Switzerland | 15.9 | ||||||
| Germany | 12.0 | ||||||
| Netherlands | 8.0 | ||||||
Data as of October 31, 2006. Subject to change daily. All percentages for top 10 holdings and top five countries are as a percentage of net assets. These data are provided for informational purposes only and should not be deemed a recommendation to buy or sell the securities mentioned. Morgan Stanley is a full-service securities firm engaged in securities trading and brokerage activities, investment banking, research and analysis, financing and financial advisory services.
Investment Strategy
The Fund will normally invest at least 80 percent of its assets in equity securities issued by issuers located in European countries. A company is considered to be located in Europe if (i) it is organized under the laws of a European country and has a principal office in a European country; (ii) it derives at least 50 percent of its total revenues from businesses in Europe; or (iii) its equity securities are traded principally on a stock exchange in Europe. The principal countries in which the Fund invests are France, the United Kingdom, Germany, the Netherlands, Spain, Sweden, Switzerland and Italy. The Fund may also invest in emerging market countries.
For More Information About Portfolio Holdings
Each Morgan Stanley fund provides a complete schedule of portfolio holdings in its semiannual and annual reports within 60 days of the end of the fund's second and fourth fiscal quarters. The semiannual reports and the annual reports are filed electronically with the Securities and Exchange Commission (SEC) on Form N-CSRS and Form N-CSR, respectively. Morgan Stanley also delivers the semiannual and annual reports to fund shareholders and makes these reports available on its public web site, www.morganstanley.com. Each Morgan Stanley fund also files a complete schedule of portfolio holdings with the SEC for the fund's first and third fiscal quarters on Form N-Q. Morgan Stanley does not deliver the reports for the first and third fiscal
4
quarters to shareholders, nor are the reports posted to the Morgan Stanley public web site. You may, however, obtain the Form N-Q filings (as well as the Form N-CSR and N-CSRS filings) by accessing the SEC's web site, http://www.sec.gov. You may also review and copy them at the SEC's public reference room in Washington, DC. Information on the operation of the SEC's public reference room may be obtained by calling the SEC at (800) SEC-0330. You can also request copies of these materials, upon payment of a duplicating fee, by electronic request at the SEC's e-mail address (publicinfo@sec.gov) or by writing the public reference section of the SEC, Washington, DC 20549-0102.
Proxy Voting Policy and Procedures and Proxy Voting Record
You may obtain a copy of the Fund's Proxy Voting Policy and Procedures without charge, upon request, by calling toll free (800) 869-NEWS or by visiting the Mutual Fund Center on our Web site at www.morganstanley.com. It is also available on the Securities and Exchange Commission's Web site at http://www.sec.gov.
You may obtain information regarding how the Fund voted proxies relating to portfolio securities during the most recent twelve-month period ended June 30 without charge by visiting the Mutual Fund Center on our Web site at www.morganstanley.com. This information is also available on the Securities and Exchange Commission's Web site at http://www.sec.gov.
Householding Notice
To reduce printing and mailing costs, the Fund attempts to eliminate duplicate mailings to the same address. The Fund delivers a single copy of certain shareholder documents, including shareholder reports, prospectuses and proxy materials, to investors with the same last name who reside at the same address. Your participation in this program will continue for an unlimited period of time unless you instruct us otherwise. You can request multiple copies of these documents by calling (800) 350-6414, 8:00 a.m. to 8:00 p.m., ET. Once our Customer Service Center has received your instructions, we will begin sending individual copies for each account within 30 days.
5
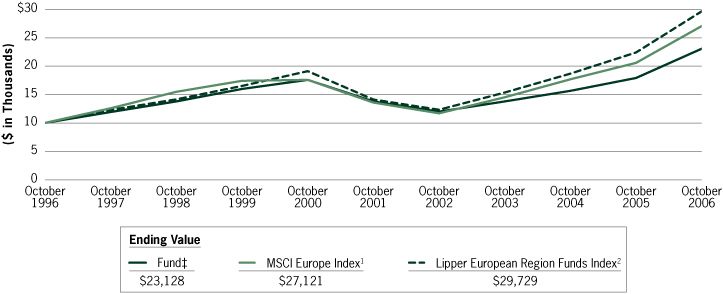
Performance Summary
Performance of a $10,000 Investment—Class B
6
| Average Annual Total Returns—Period Ended October 31, 2006 | |||||||||||||||||||||||||||||||||||
| Symbol | Class A Shares* (since 07/28/97) EUGAX | Class B Shares** (since 06/01/90) EUGBX | Class C Shares† (since 07/28/97) EUGCX | Class D Shares†† (since 07/28/97) EUGDX | |||||||||||||||||||||||||||||||
| 1 Year | 28.91% 22.14 | 3 4 | 28.99% 23.99 | 3 4 | 27.85% 26.85 | 3 4 | 29.19% — | 3 | |||||||||||||||||||||||||||
| 5 Years | 11.09 9.90 | 3 4 | 10.90 10.63 | 3 4 | 10.27 10.27 | 3 4 | 11.36 — | 3 | |||||||||||||||||||||||||||
| 10 Years | — — | 8.75 8.75 | 3 4 | — — | — — | ||||||||||||||||||||||||||||||
| Since Inception | 7.75 7.12 | 3 4 | 10.08 10.08 | 3 4 | 6.93 6.93 | 3 4 | 8.12 — | 3 | |||||||||||||||||||||||||||
Performance data quoted represents past performance, which is no guarantee of future results and current performance may be lower or higher than the figures shown. For most recent month-end performance figures, please visit www.morganstanley.com or speak with your Financial Advisor. Investment returns and principal value will fluctuate and fund shares, when redeemed, may be worth more or less than their original cost. The graph and table do not reflect the deduction of taxes that a shareholder would pay on fund distributions or the redemption of fund shares. Performance for Class A, Class B, Class C, and Class D shares will vary due to differences in sales charges and expenses.
* The maximum front-end sales charge for Class A is 5.25%.
** The maximum contingent deferred sales charge (CDSC) for Class B is 5.0%. The CDSC declines to 0% after six years.
† The maximum contingent deferred sales charge for Class C is 1.0% for shares redeemed within one year of purchase.
†† Class D has no sales charge.
(1) The Morgan Stanley Capital International (MSCI) Europe Index measures the performance for a diverse range of global stock markets within Austria, Belgium, Denmark, Finland, France, Germany, Greece, Ireland, Italy, the Netherlands, Norway, Spain, Sweden, Switzerland, Portugal, and the United Kingdom. The performance of the Index is listed in U.S. dollars and assumes reinvestment of net dividends. "Net dividends" reflects a reduction in dividends after taking into account withholding of taxes by certain foreign countries represented in the Index. Indexes are unmanaged and their returns do not include any sales charges or fees. Such costs would lower performance. It is not possible to invest directly in an index.
(2) The Lipper European Region Funds Index is an equally weighted performance index of the largest qualifying funds (based on net assets) in the Lipper European Region Funds classification. The Index, which is adjusted for capital gains distributions and income dividends, is unmanaged and should not be considered an investment. There are currently 10 funds represented in this Index.
(3) Figure shown assumes reinvestment of all distributions and does not reflect the deduction of any sales charges.
(4) Figure shown assumes reinvestment of all distributions and the deduction of the maximum applicable sales charge. See the Fund's current prospectus for complete details on fees and sales charges.
‡ Ending value assuming a complete redemption on October 31, 2006.
7
Expense Example
As a shareholder of the Fund, you incur two types of costs: (1) transaction costs, including sales charges (loads) on purchase payments and redemption fees; and (2) ongoing costs, including advisory fees; distribution and service (12b-1) fees; and other Fund expenses. This example is intended to help you understand your ongoing costs (in dollars) of investing in the Fund and to compare these costs with the ongoing costs of investing in other mutual funds.
The example is based on an investment of $1,000 invested at the beginning of the period and held for the entire period 05/01/06 – 10/31/06.
Actual Expenses
The first line of the table below provides information about actual account values and actual expenses. You may use the information in this line, together with the amount you invested, to estimate the expenses that you paid over the period. Simply divide your account value by $1,000 (for example, an $8,600 account value divided by $1,000 = 8.6), then multiply the result by the number in the first line under the heading entitled "Expenses Paid During Period" to estimate the expenses you paid on your account during this period.
Hypothetical Example for Comparison Purposes
The second line of the table below provides information about hypothetical expenses based on the Fund's actual expense ratio and an assumed rate of return of 5% per year before expenses, which is not the Fund's actual return. The hypothetical account values and expenses may not be used to estimate the actual ending account balance or expenses you paid for the period. You may use this information to compare the ongoing cost of investing in the Fund and other funds. To do so, compare this 5% hypothetical example with the 5% hypothetical examples that appear in the shareholder reports of the other funds.
Please note that the expenses shown in the table are meant to highlight your ongoing costs only and do not reflect any transactional costs, such as sales charges (loads) and redemption fees. Therefore, the second line of the table is useful in comparing ongoing costs, and will not help you determine the relative total cost of owning different funds. In addition, if these transactional costs were included, your costs would have been higher.
| Beginning Account Value | Ending Account Value | Expenses Paid During Period * | |||||||||||||
| 05/01/06 | 10/31/06 | 05/01/06 – 10/31/06 | |||||||||||||
| Class A | |||||||||||||||
| Actual (6.30% return) | $ | 1,000.00 | $ | 1,063.00 | $ | 7.59 | |||||||||
| Hypothetical (5% annual return before expenses) | $ | 1,000.00 | $ | 1,017.85 | $ | 7.43 | |||||||||
| Class B | |||||||||||||||
| Actual (6.36% return) | $ | 1,000.00 | $ | 1,063.60 | $ | 7.18 | |||||||||
| Hypothetical (5% annual return before expenses) | $ | 1,000.00 | $ | 1,018.25 | $ | 7.02 | |||||||||
| Class C | |||||||||||||||
| Actual (5.89% return) | $ | 1,000.00 | $ | 1,058.90 | $ | 11.47 | |||||||||
| Hypothetical (5% annual return before expenses) | $ | 1,000.00 | $ | 1,014.06 | $ | 11.22 | |||||||||
| Class D | |||||||||||||||
| Actual (6.45% return) | $ | 1,000.00 | $ | 1,064.50 | $ | 6.30 | |||||||||
| Hypothetical (5% annual return before expenses) | $ | 1,000.00 | $ | 1,019.11 | $ | 6.16 | |||||||||
* Expenses are equal to the Fund's annualized expense ratio of 1.46%, 1.38%, 2.21% and 1.21% for Class A, Class B, Class C and Class D shares, respectively, multiplied by the average account value over the period, multiplied by 184/365 (to reflect the one-half year period).
Because Class B shares incurred lower expenses under the 12b-1 Plan than did Class A shares for the six months ended October 31, 2006, the total operating expense ratio for Class B shares was lower, and, as a result, the performance of Class B shares was higher than that of the Class A shares. There can be no assurance that this will continue to occur in the future as the maximum fees payable by Class B shares under the 12b-1 Plan are higher than those payable by Class A shares.
8
Morgan Stanley European Equity Fund Inc.
Portfolio of Investments n October 31, 2006
| NUMBER OF SHARES | VALUE | ||||||||||
| Common Stocks (97.3%) | |||||||||||
| Austria (1.0%) | |||||||||||
| Major Telecommunications | |||||||||||
| 252,898 | Telekom Austria AG | $ | 6,293,594 | ||||||||
| Belgium (2.5%) | |||||||||||
| Chemicals: Specialty | |||||||||||
| 26,828 | Solvay S.A. | 3,471,722 | |||||||||
| Electronic Equipment/ Instruments | |||||||||||
| 217,778 | Agfa Gevaert NV (a) | 5,494,642 | |||||||||
| Other Metals/Minerals | |||||||||||
| 43,152 | Umicore (a) | 6,696,583 | |||||||||
| Total Belgium | 15,662,947 | ||||||||||
| France (17.0%) | |||||||||||
| Construction Materials | |||||||||||
| 96,586 | Lafarge S.A. | 12,979,600 | |||||||||
| Electric Utilities | |||||||||||
| 178,580 | Electricite de France (EDF) | 10,827,709 | |||||||||
| Electrical Products | |||||||||||
| 115,069 | Schneider Electric S.A. | 11,953,676 | |||||||||
| Gas Distributors | |||||||||||
| 273,819 | Gaz de France (GDF) (a) | 11,007,606 | |||||||||
| Integrated Oil | |||||||||||
| 216,671 | Total S.A. (a) | 14,669,149 | |||||||||
| Major Banks | |||||||||||
| 169,996 | BNP Paribas | 18,690,147 | |||||||||
| Major Telecommunications | |||||||||||
| 540,418 | France Telecom S.A. | 14,035,018 | |||||||||
| Motor Vehicles | |||||||||||
| 54,925 | Renault S.A. | 6,424,233 | |||||||||
| Pharmaceuticals: Major | |||||||||||
| 58,688 | Sanofi-Aventis | 4,988,182 | |||||||||
| Total France | 105,575,320 | ||||||||||
| NUMBER OF SHARES | VALUE | ||||||||||
| Germany (12.0%) | |||||||||||
| Industrial Conglomerates | |||||||||||
| 70,842 | MAN AG (a) | $ | 6,296,956 | ||||||||
| 69,200 | Siemens AG (Registered Shares) | 6,226,069 | |||||||||
| 12,523,025 | |||||||||||
| Investment Banks/Brokers | |||||||||||
| 165,978 | AWD Holding AG (a) | 6,079,266 | |||||||||
| Major Banks | |||||||||||
| 244,674 | Commerzbank AG (a) | 8,683,755 | |||||||||
| Medical/Nursing Services | |||||||||||
| 51,179 | Fresenius Medical Care AG & Co. KGaA | 6,827,992 | |||||||||
| Motor Vehicles | |||||||||||
| 176,452 | Bayerische Motoren Werke (BMW) AG | 10,133,462 | |||||||||
| Multi-Line Insurance | |||||||||||
| 86,203 | Allianz SE (Registered Shares) | 15,997,984 | |||||||||
| 85,507 | Muenchener Rueckver AG (Registered Shares) | 13,878,395 | |||||||||
| 29,876,379 | |||||||||||
| Total Germany | 74,123,879 | ||||||||||
| Greece (3.0%) | |||||||||||
| Major Banks | |||||||||||
| 232,398 | National Bank of Greece S.A. | 10,546,610 | |||||||||
| Regional Banks | |||||||||||
| 242,320 | EFG Eurobank Ergasias | 8,059,023 | |||||||||
| Total Greece | 18,605,633 | ||||||||||
| Italy (4.3%) | |||||||||||
| Major Banks | |||||||||||
| 1,021,032 | Banca Intesa SpA | 6,977,785 | |||||||||
| 1,486,739 | Banca Monte dei Paschi di Siena SpA | 9,126,380 | |||||||||
See Notes to Financial Statements
9
Morgan Stanley European Equity Fund Inc.
Portfolio of Investments n October 31, 2006 continued
| NUMBER OF SHARES | VALUE | ||||||||||
| 1,302,476 | UniCredito Italiano SpA | $ | 10,796,118 | ||||||||
| Total Italy | 26,900,283 | ||||||||||
| Netherlands (8.0%) | |||||||||||
| Air Freight/Couriers | |||||||||||
| 243,798 | TNT NV | 9,383,832 | |||||||||
| Financial Conglomerates | |||||||||||
| 147,819 | ING Groep NV (Share Certificates) | 6,547,924 | |||||||||
| Food: Major Diversified | |||||||||||
| 373,853 | Unilever NV (Share Certificates) (a) | 9,217,788 | |||||||||
| Food: Specialty/Candy | |||||||||||
| 127,521 | Royal Numico NV | 5,700,863 | |||||||||
| Publishing: Books/Magazines | |||||||||||
| 678,338 | Wolters Kluwer NV (Share Certificates) | 18,647,069 | |||||||||
| Total Netherlands | 49,497,476 | ||||||||||
| Norway (1.0%) | |||||||||||
| Pulp & Paper | |||||||||||
| 399,576 | Norske Skogindustrier ASA (a) | 6,293,690 | |||||||||
| Spain (4.4%) | |||||||||||
| Major Banks | |||||||||||
| 545,287 | Banco Bilbao Vizcaya Argentaria, S.A. | 13,166,339 | |||||||||
| Major Telecommunications | |||||||||||
| 350,001 | Telefonica S.A. | 6,744,736 | |||||||||
| Tobacco | |||||||||||
| 156,648 | Altadis, S.A. | 7,496,782 | |||||||||
| Total Spain | 27,407,857 | ||||||||||
| Sweden (4.5%) | |||||||||||
| Industrial Machinery | |||||||||||
| 216,653 | Atlas Copco AB (A Shares) (a) | 6,324,891 | |||||||||
| NUMBER OF SHARES | VALUE | ||||||||||
| 915,037 | Sandvik AB | $ | 11,172,729 | ||||||||
| 17,497,620 | |||||||||||
| Telecommunication Equipment | |||||||||||
| 2,760,886 | Telefonaktiebolaget LM Ericsson (B Shares) | 10,466,583 | |||||||||
| Total Sweden | 27,964,203 | ||||||||||
| Switzerland (15.9%) | |||||||||||
| Chemicals: Specialty | |||||||||||
| 104,985 | Ciba Specialty Chemicals AG (Registered Shares) | 6,427,567 | |||||||||
| Food: Major Diversified | |||||||||||
| 27,915 | Nestle S.A. (Registered Shares) | 9,538,411 | |||||||||
| Major Banks | |||||||||||
| 105,608 | Credit Suisse Group (Registered Shares) | 6,368,066 | |||||||||
| Medical Specialties | |||||||||||
| 24,484 | Nobel Biocare Holding AG Bearer | 6,702,687 | |||||||||
| Multi-Line Insurance | |||||||||||
| 26,459 | Zurich Financial Services AG (Registered Shares) | 6,541,359 | |||||||||
| Other Consumer Specialties | |||||||||||
| 259,352 | Compagnie Financiere Richemont AG (Series A) (Units) † | 12,834,150 | |||||||||
| Pharmaceuticals: Major | |||||||||||
| 333,246 | Novartis AG (Registered Shares) | 20,228,391 | |||||||||
| 85,654 | Roche Holding AG | 14,991,860 | |||||||||
| 35,220,251 | |||||||||||
| Property - Casualty Insurers | |||||||||||
| 183,720 | Swiss Re (Registered Shares) | 15,066,281 | |||||||||
| Total Switzerland | 98,698,772 | ||||||||||
See Notes to Financial Statements
10
Morgan Stanley European Equity Fund Inc.
Portfolio of Investments n October 31, 2006 continued
| NUMBER OF SHARES | VALUE | ||||||||||
| United Kingdom (23.7%) | |||||||||||
| Aerospace & Defense | |||||||||||
| 768,036 | Rolls-Royce Group PLC* | $ | 6,881,251 | ||||||||
| 28,186,921 | Rolls-Royce Group PLC (B Shares) | 53,761 | |||||||||
| 6,935,012 | |||||||||||
| Containers/Packaging | |||||||||||
| 615,934 | Rexam PLC | 6,937,022 | |||||||||
| Financial Conglomerates | |||||||||||
| 2,408,948 | Old Mutual Plc | 7,787,824 | |||||||||
| Food Retail | |||||||||||
| 1,558,811 | Morrison (W.M.) Supermarkets PLC | 7,663,217 | |||||||||
| 820,464 | Tesco PLC | 6,157,767 | |||||||||
| 13,820,984 | |||||||||||
| Food: Specialty/Candy | |||||||||||
| 1,152,591 | Cadbury Schweppes PLC | 11,596,227 | |||||||||
| Integrated Oil | |||||||||||
| 830,217 | Royal Dutch Shell PLC (A Shares) | 28,787,537 | |||||||||
| Investment Managers | |||||||||||
| 375,752 | Man Group PLC | 3,497,358 | |||||||||
| Major Banks | |||||||||||
| 1,304,784 | HSBC Holdings PLC | 24,736,828 | |||||||||
| Multi-Line Insurance | |||||||||||
| 434,176 | Aviva PLC | 6,417,805 | |||||||||
| Other Metals/Minerals | |||||||||||
| 137,200 | Anglo American PLC | 6,186,152 | |||||||||
| Pharmaceuticals: Major | |||||||||||
| 96,714 | AstraZeneca PLC | 5,714,652 | |||||||||
| 420,008 | GlaxoSmithKline PLC | 11,215,138 | |||||||||
| 16,929,790 | |||||||||||
| Publishing: Books/Magazines | |||||||||||
| 593,251 | Reed Elsevier PLC | 6,755,101 | |||||||||
| NUMBER OF SHARES | VALUE | ||||||||||
| Tobacco | |||||||||||
| 184,347 | Imperial Tobacco Group PLC | $ | 6,529,305 | ||||||||
| Total United Kingdom | 146,916,945 | ||||||||||
| Total Common Stocks (Cost $464,235,866) | 603,940,599 | ||||||||||
| PRINCIPAL AMOUNT IN THOUSANDS | |||||||||||
| Short-Term Investments (8.6%) | |||||||||||
| Short-Term Debt Securities held as Collateral on Loaned Securities (7.4%) | |||||||||||
| $ | 1,384 | Alliance & Leister Plc. 5.31%, 11/30/07 (b) | 1,383,776 | ||||||||
| 2,768 | Amsouth Bank, 5.30%, 11/13/06 (b) | 2,767,553 | |||||||||
| 275 | Aspen Funding Corp. 5.29%, 11/15/06 | 275,421 | |||||||||
| 692 | Bancaja, 5.37%, 11/30/07 (b) | 691,888 | |||||||||
| Bank of America, | |||||||||||
| 304 | 5.31%, 11/07/06 (b) | 304,432 | |||||||||
| 2,214 | 5.32%, 05/15/07 (b) | 2,214,042 | |||||||||
| 692 | Bank of New York Co., Inc., 5.31%, 11/30/07 (b) | 691,888 | |||||||||
| 1,145 | Barton Capital Corp. 5.30%, 11/08/06 | 1,144,742 | |||||||||
| Bear Stearns, | |||||||||||
| 554 | 5.37%, 03/08/07 (b) | 553,723 | |||||||||
| 830 | 5.37%, 03/12/07 (b) | 830,266 | |||||||||
| 1,384 | 5.36%, 11/30/07 (b) | 1,383,776 | |||||||||
| 1,384 | BNP Paribas Mtn., 5.36%, 11/30/07 (b) | 1,383,776 | |||||||||
| 968 | CIC NY, 5.31%, 09/04/07 (b) | 968,518 | |||||||||
| 1,411 | Dekabank Deutsche Girozentrale, 5.39% 11/30/07 (b) | 1,411,452 | |||||||||
| 3,325 | Deutsche Bank Securities Inc., 5.33%, 11/01/06 | 3,324,698 | |||||||||
See Notes to Financial Statements
11
Morgan Stanley European Equity Fund Inc.
Portfolio of Investments n October 31, 2006 continued
| PRINCIPAL AMOUNT IN THOUSANDS | VALUE | ||||||||||
| $ | 1,383 | Dexia Bank NY, 5.33%, 09/28/07 (b) | $ | 1,383,505 | |||||||
| 1,384 | Five Finance Inc., 5.33%, 11/17/06 (b) | 1,383,802 | |||||||||
| Goldman Sachs Group, Inc. | |||||||||||
| 1,301 | 5.42%, 10/31/07 (b) | 1,300,750 | |||||||||
| 692 | 5.37%, 11/30/07 (b) | 691,888 | |||||||||
| 692 | HSBC Finance Corp., 5.31%, 11/30/07 (b) | 691,888 | |||||||||
| 692 | Liberty Lighthouse US Capital, 5.33%, 02/01/07 (b) | 691,819 | |||||||||
| 415 | Manufacturers and Traders, 5.31%, 12/29/06 (b) | 415,115 | |||||||||
| 727 | Merrill Lynch and Co., 5.35%, 04/26/07 (b) | 727,366 | |||||||||
| Natexis Banques Populaires NY, | |||||||||||
| 692 | 5.35%, 02/28/07 (b) | 691,888 | |||||||||
| 1,384 | 5.34%, 04/05/07 (b) | 1,383,776 | |||||||||
| National City Bank Cleveland, | |||||||||||
| 1,314 | 5.32%, 03/01/07 (b) | 1,314,464 | |||||||||
| 692 | 5.32%, 09/18/07 (b) | 691,836 | |||||||||
| 2,768 | National Rural Utilites Coop., Fin., 5.31%, 11/30/07 (b) | 2,767,553 | |||||||||
| 1,605 | Nationwide Building Society, 5.42%, 10/31/07 (b) | 1,605,181 | |||||||||
| 2,075 | Nordea Bank New York, 5.31%, 05/16/07 (b) | 2,075,587 | |||||||||
| 1,384 | Norinchukin Bank NY, 5.33%, 11/01/06 | 1,383,776 | |||||||||
| 1,102 | Scaldis Capital LLC, 5.29%, 11/07/06 | 1,102,484 | |||||||||
| 1,384 | Skandi New York, 5.31%, 11/30/07 (b) | 1,383,777 | |||||||||
| 1,384 | SLM Corp., 5.32%, 11/30/07 (b) | 1,383,776 | |||||||||
| 969 | Unicredito Italiano Bank (IRE) PLC, 5.33%, 11/30/07 (b) | 968,644 | |||||||||
| Wells Fargo Bank San Franciso N.A., | |||||||||||
| 277 | 5.30%, 12/01/06 (b) | 276,755 | |||||||||
| 2,076 | 5.31%, 12/18/06 (b) | 2,075,633 | |||||||||
| PRINCIPAL AMOUNT IN THOUSANDS | VALUE | ||||||||||
| $ | 470 | World Savings Bank FSB, 5.32% , 10/19/07 (b) | $ | 470,484 | |||||||
| Total Short-Term Debt Securities held as Collateral on Loaned Securities (Cost $46,191,698) | 46,191,698 | ||||||||||
| Repurchase Agreement (1.2%) | |||||||||||
| 7,414 | Joint repurchase agreement account 5.30% due 11/01/06 (dated 10/31/06; proceeds $7,415,092) (c) (Cost $7,414,000) | 7,414,000 | |||||||||
| Total Short-Term Investments (Cost $53,605,698) | 53,605,698 | ||||||||||
| Total Investments (Cost $517,841,564) (d) | 105.9 | % | 657,546,297 | ||||||||
| Liabilities in Excess of Other Assets | (5.9 | ) | (36,643,245 | ) | |||||||
| Net Assets | 100.0 | % | $ | 620,903,052 | |||||||
* Non-income producing security.
† Consists of one or more class of securities traded together as a unit; stocks with attached warrants.
(a) All or a portion of this security was on loan at October 31, 2006.
(b) Variable/Floating Rate Security - interest rate changes on these instruments are based on changes in a designated base rate. The rates shown are those in effect on October 31, 2006.
(c) Collateralized by federal agency and U.S. Treasury obligations.
(d) The aggregate cost for federal income tax purposes is $519,121,865. The aggregate gross unrealized appreciation is $139,233,522 and the aggregate gross unrealized depreciation is $809,090 resulting in net unrealized appreciation of $138,424,432.
See Notes to Financial Statements
12
Morgan Stanley European Equity Fund Inc.
Portfolio of Investments n October 31, 2006 continued
Forward Foreign Currency Contracts Open at October 31, 2006:
| CONTRACTS TO DELIVER | IN EXCHANGE FOR | DELIVERY DATE | UNREALIZED APPRECIATION (DEPRECIATION) | ||||||||||||
| EUR | 3,530,400 | $ | 4,481,952 | 11/01/06 | $ | (23,544 | ) | ||||||||
| $ | 3,527,972 | CHF | 4,413,846 | 11/02/06 | 20,706 | ||||||||||
| EUR | 1,153,674 | $ | 1,464,704 | 11/02/06 | (7,614 | ) | |||||||||
| GBP | 5,831,593 | $ | 11,077,112 | 11/02/06 | (45,487 | ) | |||||||||
| SEK | 5,888,812 | $ | 811,578 | 11/02/06 | (3,189 | ) | |||||||||
| GBP | 106,874 | EUR | 157,411 | 11/08/06 | (2,875 | ) | |||||||||
| Net Unrealized Depreciation | $ | (62,003 | ) | ||||||||||||
Currency Abbreviations:
GBP British Pound.
EUR Euro.
SEK Swedish Krona.
CHF Swiss Franc.
See Notes to Financial Statements
13
Morgan Stanley European Equity Fund Inc.
Summary of Investments n October 31, 2006
| INDUSTRY | VALUE | PERCENT OF NET ASSETS | |||||||||
| Major Banks | $ | 109,092,028 | 17.6 | % | |||||||
| Pharmaceuticals: Major | 57,138,223 | 9.2 | |||||||||
| Collateral on Loaned Securities | 46,191,698 | 7.4 | |||||||||
| Integrated Oil | 43,456,686 | 7.0 | |||||||||
| Multi-Line Insurance | 42,835,543 | 6.9 | |||||||||
| Major Telecommunications | 27,073,348 | 4.4 | |||||||||
| Publishing: Books/ Magazines | 25,402,170 | 4.1 | |||||||||
| Food: Major Diversified | 18,756,199 | 3.0 | |||||||||
| Industrial Machinery | 17,497,620 | 2.8 | |||||||||
| Food: Specialty/Candy | 17,297,090 | 2.8 | |||||||||
| Motor Vehicles | 16,557,695 | 2.7 | |||||||||
| Property - Casualty Insurers | 15,066,281 | 2.4 | |||||||||
| Financial Conglomerates | 14,335,748 | 2.3 | |||||||||
| Tobacco | 14,026,087 | 2.2 | |||||||||
| Food Retail | 13,820,984 | 2.2 | |||||||||
| Construction Materials | 12,979,600 | 2.1 | |||||||||
| Other Metals/Minerals | 12,882,735 | 2.1 | |||||||||
| Other Consumer Specialties | 12,834,150 | 2.1 | |||||||||
| Industrial Conglomerates | 12,523,025 | 2.0 | |||||||||
| Electrical Products | 11,953,676 | 1.9 | |||||||||
| INDUSTRY | VALUE | PERCENT OF NET ASSETS | |||||||||
| Gas Distributors | $ | 11,007,606 | 1.8 | % | |||||||
| Electric Utilities | 10,827,709 | 1.7 | |||||||||
| Telecommunication Equipment | 10,466,583 | 1.7 | |||||||||
| Chemicals: Specialty | 9,899,289 | 1.6 | |||||||||
| Air Freight/Couriers | 9,383,832 | 1.5 | |||||||||
| Regional Banks | 8,059,023 | 1.3 | |||||||||
| Repurchase Agreement | 7,414,000 | 1.2 | |||||||||
| Containers/Packaging | 6,937,022 | 1.1 | |||||||||
| Aerospace & Defense | 6,935,012 | 1.1 | |||||||||
| Medical/Nursing Services | 6,827,992 | 1.1 | |||||||||
| Medical Specialties | 6,702,687 | 1.1 | |||||||||
| Pulp & Paper | 6,293,690 | 1.0 | |||||||||
| Investment Banks/Brokers | 6,079,266 | 1.0 | |||||||||
| Electronic Equipment/ Instruments | 5,494,642 | 0.9 | |||||||||
| Investment Managers | 3,497,358 | 0.6 | |||||||||
| $ | 657,546,297 | * | 105.9 | % | |||||||
* Does not include open forward foreign currency contracts with net unrealized depreciation of $62,003.
See Notes to Financial Statements
14
Morgan Stanley European Equity Fund Inc.
Financial Statements
Statement of Assets and Liabilities
October 31, 2006
| Assets: | |||||||
| Investments in securities, at value (cost $517,841,564) (including $43,984,482 of securities loaned) | $ | 657,546,297 | |||||
| Unrealized appreciation on open forward foreign currency contracts | 20,706 | ||||||
| Cash (including foreign currency valued at $332 with cost of $326) | 401 | ||||||
| Receivable for: | |||||||
| Investments sold | 29,828,514 | ||||||
| Foreign withholding taxes reclaimed | 671,866 | ||||||
| Dividends | 374,331 | ||||||
| Capital stock sold | 271,408 | ||||||
| Interest | 1,092 | ||||||
| Prepaid expenses and other assets | 22,107 | ||||||
| Receivable from affiliate | 203,997 | ||||||
| Total Assets | 688,940,719 | ||||||
| Liabilities: | |||||||
| Unrealized depreciation on open forward foreign currency contracts | 82,709 | ||||||
| Collateral on securities loaned, at value | 46,191,698 | ||||||
| Payable for: | |||||||
| Investments purchased | 20,252,458 | ||||||
| Capital stock redeemed | 531,308 | ||||||
| Investment advisory fee | 463,401 | ||||||
| Distribution fee | 244,114 | ||||||
| Administration fee | 43,071 | ||||||
| Transfer agent fee | 28,887 | ||||||
| Accrued expenses and other payables | 200,021 | ||||||
| Total Liabilities | 68,037,667 | ||||||
| Net Assets | $ | 620,903,052 | |||||
| Composition of Net Assets: | |||||||
| Paid-in-capital | $ | 487,276,798 | |||||
| Net unrealized appreciation | 139,689,414 | ||||||
| Accumulated undistributed net investment income | 6,932,892 | ||||||
| Accumulated net realized loss | (12,996,052 | ) | |||||
| Net Assets | $ | 620,903,052 | |||||
| Class A Shares: | |||||||
| Net Assets | $ | 445,452,750 | |||||
| Shares Outstanding (500,000,000 authorized, $.01 par value) | 20,626,392 | ||||||
| Net Asset Value Per Share | $ | 21.60 | |||||
| Maximum Offering Price Per Share, (net asset value plus 5.54% of net asset value) | $ | 22.79 | |||||
| Class B Shares: | |||||||
| Net Assets | $ | 156,293,686 | |||||
| Shares Outstanding (500,000,000 authorized $.01 par value) | 7,474,693 | ||||||
| Net Asset Value Per Share | $ | 20.91 | |||||
| Class C Shares: | |||||||
| Net Assets | $ | 14,007,648 | |||||
| Shares Outstanding (500,000,000 authorized, $.01 par value) | 676,920 | ||||||
| Net Asset Value Per Share | $ | 20.69 | |||||
| Class D Shares: | |||||||
| Net Assets | $ | 5,148,968 | |||||
| Shares Outstanding (500,000,000 authorized, $.01 par value) | 231,016 | ||||||
| Net Asset Value Per Share | $ | 22.29 | |||||
See Notes to Financial Statements
15
Morgan Stanley European Equity Fund Inc.
Financial Statements continued
Statement of Operations
For the year ended October 31, 2006
| Net Investment Income: | |||||||
| Income | |||||||
| Dividends (net of $1,683,364 foreign withholding tax) | $ | 15,494,417 | |||||
| Interest | 295,005 | ||||||
| Income from securities loaned - net | 3,211 | ||||||
| Total Income | 15,792,633 | ||||||
| Expenses | |||||||
| Investment advisory fee | 5,325,987 | ||||||
| Distribution fee (Class A shares) | 1,056,756 | ||||||
| Distribution fee (Class B shares) | 259,609 | ||||||
| Distribution fee (Class C shares) | 137,228 | ||||||
| Transfer agent fees and expenses | 1,027,464 | ||||||
| Administration fee | 495,218 | ||||||
| Custodian fees | 279,261 | ||||||
| Shareholder reports and notices | 225,300 | ||||||
| Professional fees | 88,251 | ||||||
| Registration fees | 51,145 | ||||||
| Directors' fees and expenses | 13,370 | ||||||
| Other | 61,565 | ||||||
| Total Expenses | 9,021,154 | ||||||
| Less: expense offset | (4,677 | ) | |||||
| Net Expenses | 9,016,477 | ||||||
| Net Investment Income | 6,776,156 | ||||||
| Net Realized and Unrealized Gain: Net Realized Gain on: | |||||||
| Investments | 132,621,853 | ||||||
| Foreign exchange transactions | 178,430 | ||||||
| Net Realized Gain | 132,800,283 | ||||||
| Net Change in Unrealized Appreciation on: | |||||||
| Investments | 17,538,821 | ||||||
| Translation of forward foreign currency contracts, other assets and liabilities denominated in foreign currencies | 8,418 | ||||||
| Net Appreciation | 17,547,239 | ||||||
| Net Gain | 150,347,522 | ||||||
| Net Increase | $ | 157,123,678 | |||||
See Notes to Financial Statements
16
Morgan Stanley European Equity Fund Inc.
Financial Statements continued
Statements of Changes in Net Assets
| FOR THE YEAR ENDED OCTOBER 31, 2006 | FOR THE YEAR ENDED OCTOBER 31, 2005 | ||||||||||
| Increase (Decrease) in Net Assets: | |||||||||||
| Operations: | |||||||||||
| Net investment income | $ | 6,776,156 | $ | 8,485,412 | |||||||
| Net realized gain | 132,800,283 | 99,824,731 | |||||||||
| Net change in unrealized appreciation/depreciation | 17,547,239 | (12,111,936 | ) | ||||||||
| Net Increase | 157,123,678 | 96,198,207 | |||||||||
| Dividends to Shareholders from Net Investment Income: | |||||||||||
| Class A shares | (6,193,173 | ) | (104,311 | ) | |||||||
| Class B shares | (2,623,483 | ) | (6,500,714 | ) | |||||||
| Class C shares | (71,962 | ) | — | ||||||||
| Class D shares | (76,421 | ) | (63,363 | ) | |||||||
| Total Dividends | (8,965,039 | ) | (6,668,388 | ) | |||||||
| Net decrease from capital stock transactions | (141,543,573 | ) | (201,412,654 | ) | |||||||
| Net Increase (Decrease) | 6,615,066 | (111,882,835 | ) | ||||||||
| Net Assets: | |||||||||||
| Beginning of period | 614,287,986 | 726,170,821 | |||||||||
| End of Period (Including accumulated undistributed net investment income of $6,932,892 and $8,943,345, respectively) | $ | 620,903,052 | $ | 614,287,986 | |||||||
See Notes to Financial Statements
17
Morgan Stanley European Equity Fund Inc.
Notes to Financial Statements n October 31, 2006
1. Organization and Accounting Policies
Morgan Stanley European Equity Fund Inc. (the "Fund"), is registered under the Investment Company Act of 1940, as amended (the "Act"), as a diversified, open-end management investment company. The Fund's investment objective is to maximize the capital appreciation of its investments. The Fund was incorporated in Maryland on February 13, 1990 and commenced operations on June 1, 1990. On July 28, 1997, the Fund converted to a multiple class share structure.
The Fund offers Class A shares, Class B shares, Class C shares and Class D shares. The four classes are substantially the same except that most Class A shares are subject to a sales charge imposed at the time of purchase and some Class A shares, and most Class B shares and Class C shares are subject to a contingent deferred sales charge imposed on shares redeemed within eighteen months, six years and one year, respectively. Class D shares are not subject to a sales charge. Additionally, Class A shares, Class B shares and Class C shares incur distribution expenses.
The Fund will assess a 2% redemption fee on Class A shares, Class B shares, Class C shares, and Class D shares, which is paid directly to the Fund, for shares redeemed within thirty days of purchase, subject to certain exceptions. The redemption fee is designed to protect the Fund and its remaining shareholders from the effects of short-term trading.
The following is a summary of significant accounting policies:
A. Valuation of Investments — (1) for equity securities traded on foreign exchanges, the last reported sale price or the latest bid price may be used if there were no sales on a particular day; (2) an equity portfolio security listed or traded on the New York Stock Exchange ("NYSE") or American Stock Exchange or other exchange is valued at its latest sale price prior to the time when assets are valued; if there were no sales that day, the security is valued at the mean between the last reported bid and asked price; (3) an equity portfolio security listed or traded on the Nasdaq is valued at the Nasdaq Official Closing Price; if there were no sales that day, the security is valued at the mean between the last reported bid and asked price; (4) all other portfolio securities for which over-the-counter market quotations are readily available are valued at the mean between the last reported bid and asked price. In cases where a security is traded on more than one exchange, the security is valued on the exchange designated as the primary market; (5) when market quotations are not readily available including circumstances under which Morgan Stanley Investment Advisors Inc. (the "Investment Adviser") or Morgan Stanley Investment Management Limited (the "Sub-Adviser"), an affiliate of the Investment Adviser, determines that the latest sale price, the bid price or the mean between the last reported bid and asked price do not reflect a security's market value, portfolio securities are valued at their fair value as determined in good faith under procedures established by and under the general supervision of the Fund's Directors. Occasionally, developments affecting the closing prices of securities and other assets may occur between the times at which valuations of such securities are determined (that is, close of the foreign market on which the securities trade) and the close of business on the NYSE. If
18
Morgan Stanley European Equity Fund Inc.
Notes to Financial Statements n October 31, 2006 continued
developments occur during such periods that are expected to materially affect the value of such securities, such valuations may be adjusted to reflect the estimated fair value of such securities as of the close of the NYSE, as determined in good faith by the Fund's Directors or by the Investment Adviser and Sub-Adviser using a pricing service and/or procedures approved by the Directors of the Fund; (6) certain portfolio securities may be valued by an outside pricing service approved by the Fund's Directors; and (7) short-term debt securities having a maturity date of more than sixty days at time of purchase are valued on a mark-to-market basis until sixty days prior to maturity and thereafter at amortized cost based on their value on the 61st day. Short-term debt securities having a maturity date of sixty days or less at the time of purchase are valued at amortized cost.
B. Accounting for Investments — Security transactions are accounted for on the trade date (date the order to buy or sell is executed). Realized gains and losses on security transactions are determined by the identified cost method. Dividend income and other distributions are recorded on the ex-dividend date except for certain dividends on foreign securities which are recorded as soon as the Fund is informed after the ex-dividend date. Discounts are accreted and premiums are amortized over the life of the respective securities. Interest income is accrued daily.
C. Repurchase Agreements — Pursuant to an Exemptive Order issued by the Securities and Exchange Commission, the Fund, along with other affiliated entities managed by the Investment Adviser, may transfer uninvested cash balances into one or more joint repurchase agreement accounts. These balances are invested in one or more repurchase agreements and are collateralized by cash, U.S. Treasury or federal agency obligations. The Fund may also invest directly with institutions in repurchase agreements. The Fund's custodian receives the collateral, which is marked-to-market daily to determine that the value of the collateral does not decrease below the repurchase price plus accrued interest.
D. Multiple Class Allocations — Investment income, expenses (other than distribution fees), and realized and unrealized gains and losses are allocated to each class of shares based upon the relative net asset value on the date such items are recognized. Distribution fees are charged directly to the respective class.
E. Foreign Currency Translation and Forward Foreign Currency Contracts — The books and records of the Fund are maintained in U.S. dollars as follows: (1) the foreign currency market value of investment securities, other assets and liabilities and forward foreign currency contracts ("forward contracts") are translated at the exchange rates prevailing at the end of the period; and (2) purchases, sales, income and expenses are translated at the exchange rates prevailing on the respective dates of such transactions. The resultant exchange gains and losses are recorded as realized and unrealized gain/loss on foreign exchange transactions. Pursuant to U.S. federal income tax regulations, certain foreign exchange gains/losses included in realized and unrealized gain/loss are included in or are a reduction of ordinary income for federal income tax purposes. The Fund does not isolate that portion of the results of operations arising as a result of changes in the foreign exchange rates from the changes in the market prices of the securities. Forward contracts are valued daily at the appropriate exchange
19
Morgan Stanley European Equity Fund Inc.
Notes to Financial Statements n October 31, 2006 continued
rates. The resultant unrealized exchange gains and losses are recorded as unrealized foreign currency gain or loss. The Fund records realized gains or losses on delivery of the currency or at the time the forward contract is extinguished (compensated) by entering into a closing transaction prior to delivery.
F. Security Lending — The Fund may lend securities to qualified financial institutions, such as broker-dealers, to earn additional income. Any increase or decrease in the fair value of the securities loaned that might occur and any interest earned or dividends declared on those securities during the term of the loan would remain in the Fund. The Fund receives cash or securities as collateral in an amount equal to or exceeding 100% of the current fair value of the loaned securities. The collateral is marked to market daily, by the securities lending agent, to ensure that a minimum of 100% collateral coverage is maintained.
Based on pre-established guidelines, the securities lending agent invests any cash collateral that is received in high-quality short-term investments. Securities lending income is generated from the earnings on the invested collateral and borrowing fees, less any rebates owed to the borrowers and compensation to the lending agent.
The value of loaned securities and related collateral outstanding at October 31, 2006 are $43,984,482 and $46,191,698, respectively. The Fund has the right under the lending agreement to recover the securities from the borrower on demand.
G. Federal Income Tax Policy — It is the Fund's policy to comply with the requirements of the Internal Revenue Code applicable to regulated investment companies and to distribute substantially all of its taxable income to its shareholders. Accordingly, no federal income tax provision is required.
H. Dividends and Distributions to Shareholders — Dividends and distributions to shareholders are recorded on the ex-dividend date.
I. Use of Estimates — The preparation of financial statements in accordance with generally accepted accounting principles requires management to make estimates and assumptions that affect the reported amounts and disclosures. Actual results could differ from those estimates.
2. Investment Advisory/Administration and Sub-Advisory Agreements
Pursuant to an Investment Advisory Agreement, the Fund pays the Investment Adviser an advisory fee, accrued daily and payable monthly, by applying the annual rates to the net assets of the Fund determined as of the close of each business day: 0.87% to the portion of the daily net assets not exceeding $500 million; 0.82% to the portion of the daily net assets exceeding $500 million but not exceeding $2 billion; 0.77% to the portion of the daily net assets exceeding $2 billion but not exceeding $3 billion; and 0.745% to the portion of the daily net assets in excess of $3 billion.
Pursuant to an Administration Agreement with Morgan Stanley Services Company Inc. (the "Administrator"), an affiliate of the Investment Adviser and Sub-Adviser, the Fund pays an administration fee, accrued daily and payable monthly, by applying the annual rate of 0.08% to the Fund's daily net assets.
20
Morgan Stanley European Equity Fund Inc.
Notes to Financial Statements n October 31, 2006 continued
Under a Sub-Advisory Agreement between the Sub-Adviser and the Investment Adviser, the Sub-Adviser provides the Fund with investment advice and portfolio management relating to the Fund's investments in securities, subject to the overall supervision of the Investment Adviser. As compensation for its services provided pursuant to the Sub-Advisory Agreement, the Investment Adviser paid the Sub-Adviser compensation of $2,509,752 for the year ended October 31, 2006.
3. Plan of Distribution
Shares of the Fund are distributed by Morgan Stanley Distributors Inc. (the "Distributor"), an affiliate of the Investment Adviser, Administrator and Sub-Adviser. The Fund has adopted a Plan of Distribution (the "Plan") pursuant to Rule 12b-1 under the Act. The Plan provides that the Fund will pay the Distributor a fee which is accrued daily and paid monthly at the following annual rates: (i) Class A – up to 0.25% of the average daily net assets of Class A; (ii) Class B – up to 1.0% of the lesser of: (a) the average daily aggregate gross sales of the Class B shares since the inception of the Fund (not including reinvestment of dividend or capital gain distributions) less the average daily aggregate net asset value of the Class B shares redeemed since the Fund's inception upon which a contingent deferred sales charge has been imposed or waived; or (b) the average daily net assets of Class B; and (iii) Class C – up to 1.0% of the average daily net assets of Class C.
In the case of Class B shares, provided that the Plan continues in effect, any cumulative expenses incurred by the Distributor but not yet recovered may be recovered through the payment of future distribution fees from the Fund pursuant to the Plan and contingent deferred sales charges paid by investors upon redemption of Class B shares. Although there is no legal obligation for the Fund to pay expenses incurred in excess of payments made to the Distributor under the Plan and the proceeds of contingent deferred sales charges paid by investors upon redemption of shares, if for any reason the Plan is terminated, the Directors will consider at that time the manner in which to treat such expenses. The Distributor has advised the Fund that there were no such expenses as of October 31, 2006.
For the year ended October 31, 2006, the distribution fee was accrued for Class B at the rate of 0.15% . At October 31, 2006, included in the Statement of Assets and Liabilities is a receivable from affiliate, which represents payments by the Distributor due to the Fund.
In the case of Class A shares and Class C shares, expenses incurred pursuant to the Plan in any calendar year in excess of 0.25% or 1.0% of the average daily net assets of Class A or Class C, respectively, will not be reimbursed by the Fund through payments in any subsequent year, except that expenses representing a gross sales credit to Morgan Stanley Financial Advisors and other authorized financial representatives at the time of sale may be reimbursed in the subsequent calendar year. For the year ended October 31, 2006, the distribution fee was accrued for Class A shares and Class C shares at the annual rate of 0.25% and 1.0%, respectively.
21
Morgan Stanley European Equity Fund Inc.
Notes to Financial Statements n October 31, 2006 continued
The Distributor has informed the Fund that for the year ended October 31, 2006, it received contingent deferred sales charges from certain redemptions of the Fund's Class B shares and Class C shares of $190,904 and $1,323, respectively and received $77,332 in front-end sales charges from sales of the Fund's Class A shares. The respective shareholders pay such charges which are not an expense of the Fund.
4. Security Transactions and Transactions with Affiliates
The cost of purchases and proceeds from sales of portfolio securities, excluding short-term investments, for the year ended October 31, 2006 aggregated $415,092,321 and $573,797,754, respectively.
Morgan Stanley Trust, an affiliate of the Investment Adviser, Administrator, Sub-Adviser and Distributor, is the Fund's transfer agent.
The Fund has an unfunded noncontributory defined benefit pension plan covering certain independent Directors of the Fund who will have served as independent Directors for at least five years at the time of retirement. Benefits under this plan are based on factors which include years of service and compensation. The Directors voted to close the plan to new participants and eliminate the future benefits growth due to increases to compensation after July 31, 2003. Aggregate pension costs for the year ended October 31, 2006 included in Directors' fees and expenses in the Statement of Operations amounted to $5,134. At October 31, 2006, the Fund had an accrued pension liability of $61,209 which is included in accrued expenses in the Statement of Assets and Liabilities.
The Fund has an unfunded Deferred Compensation Plan (the "Compensation Plan") which allows each independent Director to defer payment of all, or a portion, of the fees he or she receives for serving on the Board of Directors. Each eligible Director generally may elect to have the deferred amounts credited with a return equal to the total return on one or more of the Morgan Stanley funds that are offered as investment options under the Compensation Plan. Appreciation/depreciation and distributions received from these investments are recorded with an offsetting increase/decrease in the deferred compensation obligation and do not affect the net asset value of the Fund.
5. Purpose of and Risks Relating to Certain Financial Instruments
The Fund may enter into forward contracts for many purposes, including to facilitate settlement of foreign currency denominated portfolio transactions or to manage foreign currency exposure associated with foreign currency denominated securities.
Forward contracts involve elements of market risk in excess of the amounts reflected in the Statement of Assets and Liabilities. The Fund bears the risk of an unfavorable change in the foreign exchange rates underlying the forward contracts. Risks may also arise upon entering into these contracts from the potential inability of the counterparties to meet the terms of their contracts.
22
Morgan Stanley European Equity Fund Inc.
Notes to Financial Statements n October 31, 2006 continued
The Fund may lend securities to qualified financial institutions, such as broker-dealers, to earn additional income. Risks in securities lending transactions are that a borrower may not provide additional collateral when required or return the securities when due, and that the value of the short-term investments will be less than the amount of cash collateral plus any rebate that is required to be returned to the borrower.
At October 31, 2006, investments in securities of issuers in the United Kingdom and France represented 23.7% and 17.0%, respectively of the Fund's net assets. These investments, as well as other non-U.S. investments, which involve risks and considerations not present with respect to U.S. securities, may be affected by economic or political developments in these regions.
At October 31, 2006, the Fund's cash balance consisted principally of interest bearing deposits with J.P. Morgan Chase, the Fund's custodian.
6. Capital Stock
Transactions in capital stock were as follows:
| FOR THE YEAR ENDED OCTOBER 31, 2006 | FOR THE YEAR ENDED OCTOBER 31, 2005 | ||||||||||||||||||
| SHARES | AMOUNT | SHARES | AMOUNT | ||||||||||||||||
| Sold | 345,179 | $ | 6,878,095 | 192,824 | $ | 3,178,345 | |||||||||||||
| Conversion from Class B | 1,716,459 | 32,882,078 | 26,755,559 | 437,439,478 | |||||||||||||||
| Reinvestment of dividends | 314,610 | 5,556,012 | 5,562 | 91,380 | |||||||||||||||
| Redeemed | (5,697,154 | ) | (109,557,446 | ) | (4,024,683 | ) | (66,671,564 | ) | |||||||||||
| Net increase (decrease) — Class A | (3,320,906 | ) | (64,241,261 | ) | 22,929,262 | 374,037,639 | |||||||||||||
| CLASS B SHARES | |||||||||||||||||||
| Sold | 476,735 | 9,071,767 | 592,949 | 9,365,922 | |||||||||||||||
| Conversion to Class A | (1,773,640 | ) | (32,882,078 | ) | (27,720,983 | ) | (437,439,478 | ) | |||||||||||
| Reinvestment of dividends | 136,657 | 2,335,472 | 369,059 | 5,853,268 | |||||||||||||||
| Redeemed | (2,782,943 | ) | (51,424,445 | ) | (9,205,052 | ) | (145,579,207 | ) | |||||||||||
| Net decrease — Class B | (3,943,191 | ) | (72,899,284 | ) | (35,964,027 | ) | (567,799,495 | ) | |||||||||||
| CLASS C SHARES | |||||||||||||||||||
| Sold | 54,263 | 1,018,358 | 52,225 | 814,864 | |||||||||||||||
| Reinvestment of dividends | 4,053 | 69,024 | — | — | |||||||||||||||
| Redeemed | (234,014 | ) | (4,255,953 | ) | (378,947 | ) | (5,980,841 | ) | |||||||||||
| Net decrease — Class C | (175,698 | ) | (3,168,571 | ) | (326,722 | ) | (5,165,977 | ) | |||||||||||
| CLASS D SHARES | |||||||||||||||||||
| Sold | 58,550 | 1,197,304 | 66,401 | 1,133,714 | |||||||||||||||
| Reinvestment of dividends | 4,059 | 73,825 | 3,455 | 58,396 | |||||||||||||||
| Redeemed | (129,608 | ) | (2,505,586 | ) | (218,157 | ) | (3,676,931 | ) | |||||||||||
| Net decrease — Class D | (66,999 | ) | (1,234,457 | ) | (148,301 | ) | (2,484,821 | ) | |||||||||||
| Net decrease in Fund | (7,506,794 | ) | $ | (141,543,573 | ) | (13,509,788 | ) | $ | (201,412,654 | ) | |||||||||
23
Morgan Stanley European Equity Fund Inc.
Notes to Financial Statements n October 31, 2006 continued
7. Expense Offset
The expense offset represents a reduction of the fees and expenses for interest earned on cash balances maintained by the Fund with the transfer agent.
8. Federal Income Tax Status
The amount of dividends and distributions from net investment income and net realized capital gains are determined in accordance with federal income tax regulations which may differ from generally accepted accounting principles. These "book/tax" differences are either considered temporary or permanent in nature. To the extent these differences are permanent in nature, such amounts are reclassified within the capital accounts based on their federal tax-basis treatment; temporary differences do not require reclassification. Dividends and distributions which exceed net investment income and net realized capital gains for tax purposes are reported as distributions of paid-in-capital.
The tax character of distributions paid was as follows:
| FOR THE YEAR ENDED OCTOBER 31, 2006 | FOR THE YEAR ENDED OCTOBER 31, 2005 | ||||||||||
| Ordinary income | $ | 8,965,039 | $ | 6,668,388 | |||||||
As of October 31, 2006, the tax-basis components of accumulated earnings were as follows:
| Undistributed ordinary income | $ | 6,992,694 | |||||
| Undistributed long-term gains | — | ||||||
| Net accumulated earnings | 6,992,694 | ||||||
| Foreign tax credit pass-through | 1,245,845 | ||||||
| Capital loss carryforward* | (11,715,657 | ) | |||||
| Temporary differences | (1,308,616 | ) | |||||
| Net unrealized appreciation | 138,411,988 | ||||||
| Total accumulated earnings | $ | 133,626,254 | |||||
*During the year ended October 31, 2006, the Fund utilized $130,633,885 of its net capital loss carryforward. As of October 31, 2006, the Fund had a net capital loss carryforward of $11,715,657 which will expire on October 31, 2011 to offset future capital gains to the extent provided by regulations.
As of October 31, 2006, the Fund had temporary book/tax differences primarily attributable to capital loss deferrals on wash sales and foreign tax credit pass-through and permanent book/tax differences attributable to foreign currency gains. To reflect reclassifications arising from the permanent differences, accumulated net realized loss was charged and accumulated undistributed net investment income was credited $178,430.
24
Morgan Stanley European Equity Fund Inc.
Notes to Financial Statements n October 31, 2006 continued
9. Legal Matters
The Investment Adviser, certain affiliates of the Investment Adviser, certain officers of such affiliates and certain investment companies advised by the Investment Adviser or its affiliates, including the Fund, were named as defendants in a consolidated class action. This consolidated action also named as defendants certain individual Trustees and Directors of the Morgan Stanley funds. The consolidated amended complaint, filed in the United States District Court for the Southern District of New York on April 16, 2004, generally alleged that defendants, including the Fund, violated their statutory disclosure obligations and fiduciary duties by failing properly to disclose (i) that the Investment Adviser and certain affiliates of the Investment Adviser allegedly offered economic incentives to brokers and others to recommend the funds advised by the Investment Adviser or its affiliates to investors rather than funds managed by oth er companies, and (ii) that the funds advised by the Investment Adviser or its affiliates, including the Fund, allegedly paid excessive commissions to brokers in return for their alleged efforts to recommend these funds to investors. The complaint sought, among other things, unspecified compensatory damages, rescissionary damages, fees and costs. On July 2, 2004, defendants moved to dismiss the action. On March 9, 2005, plaintiffs filed a Motion for Leave to File a Supplemental Pleading that would, among other things, expand the allegations and alleged class. On April 14, 2006, the Court granted defendants' motion to dismiss in its entirety, with prejudice. Additionally, plaintiffs' Motion for Leave to File a Supplemental Pleading was denied. The time for plaintiffs to appeal the orders granting defendants' motion to dismiss and denying plaintiffs' motion for supplemental pleading has expired. This case is now concluded.
10. New Accounting Pronouncements
In July 2006, the Financial Accounting Standards Board (FASB) issued Interpretation 48, Accounting for Uncertainty in Income Taxes – an interpretation of FASB Statement 109 (FIN 48). FIN 48 clarifies the accounting for income taxes by prescribing the minimum recognition threshold a tax position must meet before being recognized in the financial statements. FIN 48 is effective for fiscal years beginning after December 15, 2006. The Fund will adopt FIN 48 for the fiscal year ending 2008 and the impact to the Fund's financial statements, if any, is currently being assessed.
In addition, in September 2006, Statement of Financial Accounting Standards No. 157, Fair Value Measurements (SFAS 157), was issued and is effective for fiscal years beginning after November 15, 2007. SFAS 157 defines fair value, establishes a framework for measuring fair value and expands disclosures about fair value measurements. Management is currently evaluating the impact the adoption of SFAS 157 will have on the Fund's financial statement disclosures.
25
Morgan Stanley European Equity Fund Inc.
Financial Highlights
Selected ratios and per share data for a share of capital stock outstanding throughout each period:
| FOR THE YEAR ENDED OCTOBER 31 | |||||||||||||||||||||||
| 2006 | 2005 | 2004 | 2003 | 2002 | |||||||||||||||||||
| Class A Shares | |||||||||||||||||||||||
| Selected Per Share Data: | |||||||||||||||||||||||
| Net asset value, beginning of period | $ | 17.01 | $ | 14.99 | $ | 13.30 | $ | 11.51 | $ | 13.35 | |||||||||||||
| Income (loss) from investment operations: | |||||||||||||||||||||||
| Net investment income‡ | 0.21 | 0.19 | 0.11 | 0.12 | 0.06 | ||||||||||||||||||
| Net realized and unrealized gain (loss) | 4.65 | 1.94 | 1.68 | 1.67 | (1.67 | ) | |||||||||||||||||
| Total income (loss) from investment operations | 4.86 | 2.13 | 1.79 | 1.79 | (1.61 | ) | |||||||||||||||||
| Less dividends from net investment income | (0.27 | ) | (0.11 | ) | (0.10 | ) | – | (0.23 | ) | ||||||||||||||
| Net asset value, end of period | $ | 21.60 | $ | 17.01 | $ | 14.99 | $ | 13.30 | $ | 11.51 | |||||||||||||
| Total Return† | 28.91 | % | 14.25 | % | 13.51 | % | 15.55 | % | (12.41 | )% | |||||||||||||
| Ratios to Average Net Assets(1): | |||||||||||||||||||||||
| Total expenses (before expense offset) | 1.47 | % | 1.47 | % | 1.43 | % | 1.45 | % | 1.38 | % | |||||||||||||
| Net investment income | 1.08 | % | 1.16 | % | 0.79 | % | 0.79 | % | 0.41 | % | |||||||||||||
| Supplemental Data: | |||||||||||||||||||||||
| Net assets, end of period, in thousands | $ | 445,453 | $ | 407,446 | $ | 15,265 | $ | 16,612 | $ | 18,294 | |||||||||||||
| Portfolio turnover rate | 68 | % | 64 | % | 89 | % | 89 | % | 51 | % | |||||||||||||
‡ The per share amounts were computed using an average number of shares outstanding during the period.
† Does not reflect the deduction of sales charge. Calculated based on the net asset value as of the last business day of the period.
(1) Reflects overall Fund ratios for investment income and non-class specific expenses.
See Notes to Financial Statements
26
Morgan Stanley European Equity Fund Inc.
Financial Highlights continued
| FOR THE YEAR ENDED OCTOBER 31 | |||||||||||||||||||||||
| 2006 | 2005 | 2004 | 2003 | 2002 | |||||||||||||||||||
| Class B Shares | |||||||||||||||||||||||
| Selected Per Share Data: | |||||||||||||||||||||||
| Net asset value, beginning of period | $ | 16.44 | $ | 14.50 | $ | 12.79 | $ | 11.12 | $ | 12.88 | |||||||||||||
| Income (loss) from for investment operations: | |||||||||||||||||||||||
| Net investment income (loss)‡ | 0.22 | 0.21 | 0.13 | 0.03 | (0.05 | ) | |||||||||||||||||
| Net realized and unrealized gain (loss) | 4.49 | 1.87 | 1.62 | 1.64 | (1.62 | ) | |||||||||||||||||
| Total income (loss) from investment operations | 4.71 | 2.08 | 1.75 | 1.67 | (1.67 | ) | |||||||||||||||||
| Less dividends from net investment income | (0.24 | ) | (0.14 | ) | (0.04 | ) | – | (0.09 | ) | ||||||||||||||
| Net asset value, end of period | $ | 20.91 | $ | 16.44 | $ | 14.50 | $ | 12.79 | $ | 11.12 | |||||||||||||
| Total Return† | 28.99 | % | 14.40 | % | 13.73 | % | 15.02 | % | (13.11 | )% | |||||||||||||
| Ratios to Average Net Assets(1): | |||||||||||||||||||||||
| Total expenses (before expense offset) | 1.37 | % | 1.34 | % | 1.26 | %(2) | 1.94 | %(2) | 2.15 | % | |||||||||||||
| Net investment income (loss) | 1.18 | % | 1.29 | % | 0.96 | %(2) | 0.30 | %(2) | (0.36 | )% | |||||||||||||
| Supplemental Data: | |||||||||||||||||||||||
| Net assets, end of period, in millions | $ | 156 | $ | 188 | $ | 687 | $ | 778 | $ | 870 | |||||||||||||
| Portfolio turnover rate | 68 | % | 64 | % | 89 | % | 89 | % | 51 | % | |||||||||||||
‡ The per share amounts were computed using an average number of shares outstanding during the period.
† Does not reflect the deduction of sales charge. Calculated based on the net asset value as of the last business day of the period.
(1) Reflects overall Fund ratios for investment income and non-class specific expenses.
(2) If the Distributor had not rebated a portion of its fees to the Fund, the expense and net investment income ratios would have been as follows:
| PERIOD ENDED | EXPENSE RATIO | NET INVESTMENT INCOME RATIO | |||||||||
| October 31, 2004 | 1.82 | % | 0.40 | % | |||||||
| October 31, 2003 | 2.20 | 0.04 | |||||||||
See Notes to Financial Statements
27
Morgan Stanley European Equity Fund Inc.
Financial Highlights continued
| FOR THE YEAR ENDED OCTOBER 31 | |||||||||||||||||||||||
| 2006 | 2005 | 2004 | 2003 | 2002 | |||||||||||||||||||
| Class C Shares | |||||||||||||||||||||||
| Selected Per Share Data: | |||||||||||||||||||||||
| Net asset value, beginning of period | $ | 16.27 | $ | 14.35 | $ | 12.74 | $ | 11.11 | $ | 12.85 | |||||||||||||
| Income (loss) from investment operations: | |||||||||||||||||||||||
| Net investment income (loss)‡ | 0.06 | 0.07 | 0.00 | 0.00 | (0.04 | ) | |||||||||||||||||
| Net realized and unrealized gain (loss) | 4.45 | 1.85 | 1.62 | 1.63 | (1.61 | ) | |||||||||||||||||
| Total income (loss) from investment operations | 4.51 | 1.92 | 1.62 | 1.63 | (1.65 | ) | |||||||||||||||||
| Less dividends from net investment income | (0.09 | ) | – | (0.01 | ) | – | (0.09 | ) | |||||||||||||||
| Net asset value, end of period | $ | 20.69 | $ | 16.27 | $ | 14.35 | $ | 12.74 | $ | 11.11 | |||||||||||||
| Total Return† | 27.85 | % | 13.38 | % | 12.72 | % | 14.67 | % | (12.98 | )% | |||||||||||||
| Ratios to Average Net Assets(1): | |||||||||||||||||||||||
| Total expenses (before expense offset) | 2.22 | % | 2.21 | % | 2.19 | % | 2.20 | % | 2.08 | % | |||||||||||||
| Net investment income (loss) | 0.33 | % | 0.42 | % | 0.03 | % | 0.04 | % | (0.29 | )% | |||||||||||||
| Supplemental Data: | |||||||||||||||||||||||
| Net assets, end of period, in thousands | $ | 14,008 | $ | 13,870 | $ | 16,922 | $ | 18,581 | $ | 20,881 | |||||||||||||
| Portfolio turnover rate | 68 | % | 64 | % | 89 | % | 89 | % | 51 | % | |||||||||||||
‡ The per share amounts were computed using an average number of shares outstanding during the period.
† Does not reflect the deduction of sales charge. Calculated based on the net asset value as of the last business day of the period.
(1) Reflects overall Fund ratios for investment income and non-class specific expenses.
See Notes to Financial Statements
28
Morgan Stanley European Equity Fund Inc.
Financial Highlights continued
| FOR THE YEAR ENDED OCTOBER 31 | |||||||||||||||||||||||
| 2006 | 2005 | 2004 | 2003 | 2002 | |||||||||||||||||||
| Class D Shares | |||||||||||||||||||||||
| Selected Per Share Data: | |||||||||||||||||||||||
| Net asset value, beginning of period | $ | 17.53 | $ | 15.45 | $ | 13.70 | $ | 11.83 | $ | 13.73 | |||||||||||||
| Income (loss) from investment operations: | |||||||||||||||||||||||
| Net investment income‡ | 0.26 | 0.24 | 0.20 | 0.13 | 0.09 | ||||||||||||||||||
| Net realized and unrealized gain (loss) | 4.79 | 1.99 | 1.69 | 1.74 | (1.72 | ) | |||||||||||||||||
| Total income (loss) from investment operations | 5.05 | 2.23 | 1.89 | 1.87 | (1.63 | ) | |||||||||||||||||
| Less dividends from net investment income | (0.29 | ) | (0.15 | ) | (0.14 | ) | – | (0.27 | ) | ||||||||||||||
| Net asset value, end of period | $ | 22.29 | $ | 17.53 | $ | 15.45 | $ | 13.70 | $ | 11.83 | |||||||||||||
| Total Return† | 29.19 | % | 14.50 | % | 13.86 | % | 15.81 | % | (12.20 | )% | |||||||||||||
| Ratios to Average Net Assets(1): | |||||||||||||||||||||||
| Total expenses (before expense offset) | 1.22 | % | 1.22 | % | 1.19 | % | 1.20 | % | 1.15 | % | |||||||||||||
| Net investment income | 1.33 | % | 1.41 | % | 1.03 | % | 1.04 | % | 0.64 | % | |||||||||||||
| Supplemental Data: | |||||||||||||||||||||||
| Net assets, end of period, in thousands | $ | 5,149 | $ | 5,225 | $ | 6,896 | $ | 42,454 | $ | 39,716 | |||||||||||||
| Portfolio turnover rate | 68 | % | 64 | % | 89 | % | 89 | % | 51 | % | |||||||||||||
‡ The per share amounts were computed using an average number of shares outstanding during the period.
† Calculated based on the net asset value as of the last business day of the period.
(1) Reflects overall Fund ratios for investment income and non-class specific expenses.
See Notes to Financial Statements
29
Morgan Stanley European Equity Fund Inc.
Report of Independent Registered Public Accounting Firm
To the Shareholders and Board of Directors of
Morgan Stanley European Equity Fund Inc.:
We have audited the accompanying statement of assets and liabilities of Morgan Stanley European Equity Fund Inc. (the "Fund"), including the portfolio of investments, as of October 31, 2006, and the related statements of operations for the year then ended and changes in net assets for each of the two years in the period then ended, and the financial highlights for each of the five years in the period then ended. These financial statements and financial highlights are the responsibility of the Fund's management. Our responsibility is to express an opinion on these financial statements and financial highlights based on our audits.
We conducted our audits in accordance with the standards of the Public Company Accounting Oversight Board (United States). Those standards require that we plan and perform the audit to obtain reasonable assurance about whether the financial statements and financial highlights are free of material misstatement. The Fund is not required to have, nor were we engaged to perform, an audit of its internal control over financial reporting. Our audits included consideration of internal control over financial reporting as a basis for designing audit procedures that are appropriate in the circumstances, but not for the purpose of expressing an opinion on the effectiveness of the Fund's internal control over financial reporting. Accordingly, we express no such opinion. An audit also includes examining, on a test basis, evidence supporting the amounts and disclosures in the financial statements, assessing the accounting principles used and significant estimates made by management, as well as evaluating the overall financial statement presentation. Our procedures included confirmation of securities owned as of October 31, 2006, by correspondence with the custodian and brokers; where replies were not received from brokers, we performed other auditing procedures. We believe that our audits provide a reasonable basis for our opinion.
In our opinion, the financial statements and financial highlights referred to above present fairly, in all material respects, the financial position of Morgan Stanley European Equity Fund Inc. as of October 31, 2006, the results of its operations for the year then ended, the changes in its net assets for each of the two years in the period then ended, and the financial highlights for each of the five years in the period then ended, in conformity with accounting principles generally accepted in the United States of America.
Deloitte & Touche LLP
New York, New York
December 21, 2006
30
Morgan Stanley European Equity Fund Inc.
Results of Special Shareholder Meeting (unaudited)
On August 1, 2006, a Special Meeting of Shareholders of the Fund was scheduled in order to vote on the proposals set forth below. The proposals failed to obtain the necessary quorum in order to hold the meeting, and, therefore, the meeting was adjourned until August 23, 2006 and later adjourned to September 27, 2006, to permit further solicitation of proxies. The meeting was held on September 27, 2006 and the voting results with respect to these proposals were as follows:
(1) Election of Directors:
| For | Withhold | Abstain | BNV* | ||||||||||||||||
| Frank L. Bowman | 16,033,774 | 833,281 | 0 | 0 | |||||||||||||||
| Kathleen A. Dennis | 16,050,407 | 816,648 | 0 | 0 | |||||||||||||||
| James F. Higgins | 16,040,042 | 827,013 | 0 | 0 | |||||||||||||||
| Joseph J. Kearns | 16,045,836 | 821,219 | 0 | 0 | |||||||||||||||
| Michael F. Klein | 16,044,072 | 822,983 | 0 | 0 | |||||||||||||||
| W. Allen Reed | 16,036,497 | 830,558 | 0 | 0 | |||||||||||||||
| Fergus Reid | 16,010,030 | 857,025 | 0 | 0 | |||||||||||||||
(2) Elimination of certain fundamental investment restrictions:
| For | Against | Abstain | BNV* | ||||||||||||||||
| Elimination of the fundamental policy restricting the Fund's ability to pledge assets | 13,538,589 | 823,476 | 708,572 | 1,796,418 | |||||||||||||||
| Elimination of the fundamental policy restricting purchases of securities on margin | 13,603,542 | 828,786 | 638,309 | 1,796,418 | |||||||||||||||
| Elimination of the fundamental policy prohibiting investments in oil, gas, and other types of minerals or mineral leases | 13,726,416 | 717,268 | 626,953 | 1,796,418 | |||||||||||||||
| Elimination of the fundamental policy prohibiting investments for purposes of exercising control | 13,658,962 | 741,294 | 670,381 | 1,796,418 | |||||||||||||||
| Elimination of the fundamental policy regarding investments in unseasoned companies | 13,593,058 | 801,106 | 676,473 | 1,796,418 | |||||||||||||||
(3) Modify certain fundamental investment restrictions:
| For | Against | Abstain | BNV* | ||||||||||||||||
| Modify fundamental policy regarding diversification | 13,719,459 | 715,674 | 635,504 | 1,796,418 | |||||||||||||||
| Modify fundamental policy regarding borrowing money | 13,560,234 | 852,448 | 657,955 | 1,796,418 | |||||||||||||||
| Modify fundamental policy regarding loans | 13,567,997 | 836,867 | 665,773 | 1,796,418 | |||||||||||||||
| Modify fundamental policy regarding investment in commodities, commodity contracts and futures contracts | 13,619,681 | 804,086 | 646,870 | 1,796,418 | |||||||||||||||
| Modify fundamental policy regarding issuance of senior securities | 13,654,942 | 770,279 | 645,416 | 1,796,418 | |||||||||||||||
31
Morgan Stanley European Equity Fund Inc.
Results of Special Shareholder Meeting (unaudited) continued
(4) Reclassify certain fundamental policies as non-fundamental policies:
| For | Against | Abstain | BNV* | ||||||||||||||||
| Reclassification as non-fundamental the fundamental policy regarding the short sale of securities | 13,551,055 | 840,660 | 678,922 | 1,796,418 | |||||||||||||||
| Reclassification as non-fundamental the fundamental policy prohibiting investments in other investment companies | 13,615,209 | 782,656 | 672,772 | 1,796,418 | |||||||||||||||
| Reclassification as non-fundamental the fundamental policy prohibiting or limiting investments in illiquid or restricted securities | 13,561,435 | 803,852 | 705,350 | 1,796,418 | |||||||||||||||
* Broker "non-votes" are shares held in street name for which the broker indicates that instructions have not been received from the beneficial owners or other persons entitled to vote and for which the broker does not have discretionary voting authority.
32
Morgan Stanley European Equity Fund Inc.
Director and Officer Information (unaudited)
Independent Directors:
| Name, Age and Address of Independent Director | Position(s) Held with Registrant | Term of Office and Length of Time Served* | Principal Occupation(s) During Past 5 Years | Number of Portfolios in Fund Complex Overseen by Independent Director** | Other Directorships Held by Independent Director | ||||||||||||||||||
| Frank L. Bowman (61) c/o Kramer Levin Naftalis & Frankel LLP Counsel to the Independent Directors 1177 Avenue of the Americas New York, NY 10036 | Director | Since August 2006 | President and Chief Executive Officer of the Nuclear Energy Institute (policy organization) (since February 2005); Director or Trustee of various Retail Funds and Institutional Funds (since August 2006) formerly variously, Admiral in the U.S. Navy, Director of Naval Nuclear Propulsion Program and Deputy Administrator – Naval Reactors in the National Nuclear Security Administration at the U.S. Department of Energy (1996-2004). Honorary Knight Commander of the Most Excellent Order of the British Empire. | 163 | Director of the National Energy Foundation, the U.S. Energy Association, the American Council for Capital Formation and the Armed Services YMCA of the USA. | ||||||||||||||||||
| Michael Bozic (65) c/o Kramer Levin Naftalis & Frankel LLP Counsel to the Independent Directors 1177 Avenue of the Americas New York, NY 10036 | Director | Since April 1994 | Private investor; Chairperson of the Valuation, Insurance and Compliance Committee (since October 2006); Director or Trustee of the Retail Funds (since April 1994) and the Institutional Funds (since July 2003); formerly Chairperson of the Insurance Committee (July 2006-September 2006); Vice Chairman of Kmart Corporation (December 1998-October 2000), Chairman and Chief Executive Officer of Levitz Furniture Corporation (November 1995-November 1998) and President and Chief Executive Officer of Hills Department Stores (May 1991-July 1995); variously Chairman, Chief Executive Officer, President and Chief Operating Officer (1987-1991) of the Sears Merchandise Group of Sears, Roebuck & Co. | 173 | Director of various business organizations. | ||||||||||||||||||
33
Morgan Stanley European Equity Fund Inc.
Director and Officer Information (unaudited) continued
| Name, Age and Address of Independent Director | Position(s) Held with Registrant | Term of Office and Length of Time Served* | Principal Occupation(s) During Past 5 Years | Number of Portfolios in Fund Complex Overseen by Independent Director** | Other Directorships Held by Independent Director | ||||||||||||||||||
| Kathleen A. Dennis (53) c/o Kramer Levin Naftalis & Frankel LLP Counsel to the Independent Directors 1177 Avenue of the Americas New York, NY 10036 | Director | Since August 2006 | President, Cedarwood Associates (mutual fund consulting) (since July 2006); Chairperson of the Closed-End, Money Market and Alternatives Sub-Committee of the Investment Committee (since October 2006) and Director or Trustee of various Retail Funds and Institutional Funds (since August 2006); formerly, Senior Managing Director of Victory Capital Management (1993-2006). | 163 | None. | ||||||||||||||||||
| Edwin J. Garn (74) 1031 N. Chartwell Court Salt Lake City, UT 84103 | Director | Since January 1993 | Consultant; Director or Trustee of the Retail Funds (since January 1993) and the Institutional Funds (since July 2003); Member of the Utah Regional Advisory Board of Pacific Corp. (utility company); formerly Managing Director of Summit Ventures LLC (lobbying and consulting firm) (2000-2004); United States Senator (R-Utah) (1974-1992) and Chairman, Senate Banking Committee (1980-1986), Mayor of Salt Lake City, Utah (1971-1974), Astronaut, Space Shuttle Discovery (April 12-19, 1985), and Vice Chairman, Huntsman Corporation (chemical company). | 173 | Director of Franklin Covey (time management systems), BMW Bank of North America, Inc. (industrial loan corporation), Escrow Bank USA (industrial loan corporation); United Space Alliance (joint venture between Lockheed Martin and the Boeing Company) and Nuskin Asia Pacific (multilevel marketing); member of the board of various civic and charitable organizations. | ||||||||||||||||||
| Wayne E. Hedien (72) c/o Kramer Levin Naftalis & Frankel LLP Counsel to the Independent Directors 1177 Avenue of the Americas New York, NY 10036 | Director | Since September 1997 | Retired; Director or Trustee of the Retail Funds; (Since September 1997) and the Institutional Funds (since July 2003); formerly associated with the Allstate Companies (1966-1994), most recently as Chairman of The Allstate Corporation (March 1993-December 1994) and Chairman and Chief Executive Officer of its wholly-owned subsidiary, Allstate Insurance Company (July 1989-December 1994). | 173 | Director of The PMI Group Inc. (private mortgage insurance); Trustee and Vice Chairman of The Field Museum of Natural History; director of various other business and charitable organizations. | ||||||||||||||||||
34
Morgan Stanley European Equity Fund Inc.
Director and Officer Information (unaudited) continued
| Name, Age and Address of Independent Director | Position(s) Held with Registrant | Term of Office and Length of Time Served* | Principal Occupation(s) During Past 5 Years | Number of Portfolios in Fund Complex Overseen by Independent Director** | Other Directorships Held by Independent Director | ||||||||||||||||||
| Dr. Manuel H. Johnson (57) c/o Johnson Smick Group, Inc. 888 16th Street, N.W. Suite 740 Washington, D.C. 20006 | Director | Since July 1991 | Senior Partner, Johnson Smick International, Inc., (consulting firm); Chairperson of the Investment Committee (since October 2006) and Director or Trustee of the Retail Funds (since July 1991) and the Institutional Funds (since July 2003); Co-Chairman and a founder of the Group of Seven Council (G7C), an international economic commission; formerly Chairperson of the Audit Committee (July 1991-September 2006); Vice Chairman of the Board of Governors of the Federal Reserve System and Assistant Secretary of the U.S. Treasury. | 173 | Director of NVR, Inc. (home construction); Director of KFX Energy; Director of RBS Greenwich Capital Holdings (financial holding company). | ||||||||||||||||||
| Joseph J. Kearns (64) c/o Kearns & Associates LLC PMB754 23852 Pacific Coast Highway Malibu, CA 90265 | Director | Since July 2003 | President, Kearns & Associates LLC (investment consulting); Chairperson of the Audit Committee (since October 2006) and Director or Trustee of the Retail Funds (since July 2003) and the Institutional Funds (since August 1994); formerly Deputy Chairperson of the Audit Committee (July 2003-September 2006) and Chairperson of the Audit Committee of the Institutional Funds (October 2001-July 2003); formerly CFO of the J. Paul Getty Trust. | 174 | Director of Electro Rent Corporation (equipment leasing), The Ford Family Foundation, and the UCLA Foundation. | ||||||||||||||||||
| Michael F. Klein (47) c/o Kramer Levin Naftalis & Frankel LLP Counsel to the Independent Directors 1177 Avenue of the Americas New York, NY 10036 | Director | Since August 2006 | Chief Operating Officer and Managing Director, Aetos Capital, LLC (since March 2000); Chairman of the Fixed-Income Sub-Committee of the Investment Committee (since October 2006) and Director or Trustee (since August 2006) of various Retail Funds and Institutional Funds; formerly Managing Director, Morgan Stanley & Co. Inc. and Morgan Stanley Dean Witter Investment Management, President, Morgan Stanley Institutional Funds (June 1998-March 2000) and Principal, Morgan Stanley & Co. Inc. and Morgan Stanley Dean Witter Investment Management (August 1997-December 1999). | 163 | Director of certain investment funds managed or sponsored by Aetos Capital LLC. | ||||||||||||||||||
35
Morgan Stanley European Equity Fund Inc.
Director and Officer Information (unaudited) continued
| Name, Age and Address of Independent Director | Position(s) Held with Registrant | Term of Office and Length of Time Served* | Principal Occupation(s) During Past 5 Years | Number of Portfolios in Fund Complex Overseen by Independent Director** | Other Directorships Held by Independent Director | ||||||||||||||||||
| Michael E. Nugent (70) c/o Triumph Capital, L.P. 445 Park Avenue New York, NY 10022 | Chairman of the Board and Director | Chairman of the Board since July 2006 and Director since July 1991 | General Partner of Triumph Capital, L.P., a private investment partnership; Chairman of the Boards of the Retail Funds and Institutional Funds (since July 2006) and Director or Trustee of the Retail Funds (since July 1991) and the Institutional Funds (since July 2001); formerly Chairman of the Insurance Committee (until July 2006); Vice President, Bankers Trust Company and BT Capital Corporation (1984-1988). | 173 | None. | ||||||||||||||||||
| W. Allen Reed (59) c/o Kramer Levin Naftalis & Frankel LLP Counsel to the Independent Directors 1177 Avenue of the Americas New York, NY 10036 | Director | Since August 2006 | Chairperson of the Equity Sub-Commitee of the Investment Committee (since October 2006) and Director or Trustee (since August 2006) of various Retail and Institutional Funds. President and CEO of General Motors Asset Management; formerly Chairman and Chief Executive Officer of the GM Trust Bank and Corporate Vice President of General Motors Corporation (August 1994-December 2005). | 163 | Director of GMAC (financial services), GMAC Insurance Holdings and Temple-Inland Industries (Packaging, Banking and forest products); member of the Board of Executives of the Morgan Stanley Capital International Editorial Board; Director of Legg Mason and Director of various investment fund advisory boards. | ||||||||||||||||||
| Fergus Reid (74) c/o Lumelite Plastics Corporation 85 Charles Colman Blvd. Pawling, NY 12564 | Director | Since July 2003 | Chairman of Lumelite Plastics Corporation; Chairperson of the Governance Committee and Director or Trustee of the Retail Funds (since July 2003) and the Institutional Funds (since June 1992). | 174 | Trustee and Director of certain investment companies in the JPMorgan Funds complex managed by J.P. Morgan Investment Management Inc. | ||||||||||||||||||
36
Morgan Stanley European Equity Fund Inc.
Director and Officer Information (unaudited) continued
Interested Director:
| Name, Age and Address of Interested Director | Position(s) Held with Registrant | Term of Office and Length of Time Served* | Principal Occupation(s) During Past 5 Years | Number of Portfolios in Fund Complex Overseen by Interested Director** | Other Directorships Held by Interested Director | ||||||||||||||||||
| James F. Higgins (58) c/o Morgan Stanley Trust Harborside Financial Center Plaza Two Jersey City, NJ 07311 | Director | Since June 2000 | Director or Trustee of the Retail Funds (since June 2000) and the Institutional Funds (since July 2003); Senior Advisor of Morgan Stanley (since August 2000). | 173 | Director of AXA Financial, Inc. and The Equitable Life Assurance Society of the United States (financial services). | ||||||||||||||||||
* This is the earliest date the Director began serving the funds advised by Morgan Stanley Investment Advisors Inc. (the "Investment Adviser") (the "Retail Funds") or the funds advised by Morgan Stanley Investment Management Inc. and Morgan Stanley AIP GP LP (the "Institutional Funds").
** The Fund Complex includes all open-end and closed-end funds (including all of their portfolios) advised by the Investment Adviser and any funds that have an investment adviser that is an affiliated person of the Investment Adviser (including, but not limited to, Morgan Stanley Investment Management Inc.) as of October 31, 2006.
37
Morgan Stanley European Equity Fund Inc.
Director and Officer Information (unaudited) continued
Executive Officers:
| Name, Age and Address of Executive Officer | Position(s) Held with Registrant | Term of Office and Length of Time Served* | Principal Occupation(s) During Past 5 Years | ||||||||||||
| Ronald E. Robison (67) 1221 Avenue of the Americas New York, NY 10020 | President and Principal Executive Officer | President since September 2005 and Principal Executive Officer since May 2003 | President (since September 2005) and Principal Executive Officer (since May 2003) of funds in the Fund Complex; President (since September 2005) and Principal Executive Officer (since May 2003) of the Van Kampen Funds; Managing Director, Director and/or Officer of the Investment Adviser and various entities affiliated with the Investment Adviser; Director of Morgan Stanley SICAV (since May 2004). Formerly, Executive Vice President (July 2003 to September 2005) of funds in the Fund Complex and the Van Kampen Funds; President and Director of the Institutional Funds (March 2001 to July 2003); Chief Administrative Officer of the Investment Adviser; Chief Administrative Officer of Morgan Stanley Services Company Inc. | ||||||||||||
| J. David Germany (52) Morgan Stanley Investment Management Ltd. 25 Cabot Square Canary Wharf, London United Kingdom E144QA | Vice President | Since February 2006 | Managing Director and (since December 2005) Chief Investment Officer – Global Fixed Income of Morgan Stanley Investment Management; Managing Director and Director of Morgan Stanley Investment Management Limited; Vice President of the Retail and Institutional Funds (since February 2006). | ||||||||||||
| Dennis F. Shea (53) 1221 Avenue of the Americas New York, NY 10020 | Vice President | Since February 2006 | Managing Director and (since February 2006) Chief Investment Officer – Global Equity of Morgan Stanley Investment Management; Vice President of the Retail and Institutional Funds (since February 2006). Formerly, Managing Director and Director of Global Equity Research at Morgan Stanley. | ||||||||||||
| Barry Fink (51) 1221 Avenue of the Americas New York, NY 10020 | Vice President | Since February 1997 | Managing Director of Morgan Stanley Investment Management; Managing Director of the Investment Adviser and various entities affiliated with the Investment Adviser; Vice President of the Retail Funds and (since July 2003) the Institutional Funds. Formerly, Secretary, General Counsel and/or Director of the Investment Adviser and various entities affiliated with the Investment Adviser; Secretary and General Counsel of the Retail Funds. | ||||||||||||
| Amy R. Doberman (44) 1221 Avenue of the Americas New York, NY 10020 | Vice President | Since July 2004 | Managing Director and General Counsel, U.S. Investment Management of Morgan Stanley Investment Management (since July 2004); Vice President of the Retail Funds and the Institutional Funds (since July 2004); Vice President of the Van Kampen Funds (since August 2004); Secretary (since February 2006) and Managing Director (since July 2004) of the Investment Adviser and various entities affiliated with the Investment Adviser. Formerly, Managing Director and General Counsel – Americas, UBS Global Asset Management (July 2000 to July 2004). | ||||||||||||
| Carsten Otto (42) 1221 Avenue of the Americas New York, NY 10020 | Chief Compliance Officer | Since October 2004 | Managing Director and U.S. Director of Compliance for Morgan Stanley Investment Management (since October 2004); Managing Director and Chief Compliance Officer of Morgan Stanley Investment Management. Formerly, Assistant Secretary and Assistant General Counsel of the Retail Funds. | ||||||||||||
| Stefanie V. Chang Yu (39) 1221 Avenue of the Americas New York, NY 10020 | Vice President | Since December1997 | Executive Director of the Investment Adviser and various entities affiliated with the Investment Adviser; Vice President of the Retail Funds (since July 2002) and the Institutional Funds (since December 1997). Formerly, Secretary of various entities affiliated with the Investment Adviser. | ||||||||||||
38
Morgan Stanley European Equity Fund Inc.
Director and Officer Information (unaudited) continued
| Name, Age and Address of Executive Officer | Position(s) Held with Registrant | Term of Office and Length of Time Served* | Principal Occupation(s) During Past 5 Years | ||||||||||||
| Francis J. Smith (41) c/o Morgan Stanley Trust Harborside Financial Center Plaza Two Jersey City, NJ 07311 | Treasurer and Chief Financial Officer | Treasurer since July 2003 and Chief Financial Officer since September 2002 | Executive Director of the Investment Adviser and various entities affiliated with the Investment Adviser; Treasurer and Chief Financial Officer of the Retail Funds (since July 2003). Formerly, Vice President of the Retail Funds (September 2002 to July 2003). | ||||||||||||
| Mary E. Mullin (39) 1221 Avenue of the Americas New York, NY 10020 | Secretary | Since June 1999 | Executive Director of the Investment Adviser and various entities affiliated with the Investment Adviser; Secretary of the Retail Funds (since July 2003) and the Institutional Funds (since June 1999). | ||||||||||||
* This is the earliest date the Officer began serving the Retail Funds or the Institutional Funds.
2006 Federal Tax Notice (unaudited)
Of the amounts paid by the Fund during the fiscal year ended October 31, 2006 that were reported as ordinary dividends, 100% qualified for the lower income tax rate available to individuals under the Jobs and Growth Tax Relief Reconciliation Act of 2003.
Additionally, the Fund has elected, pursuant to section 853 of the Internal Revenue Code, to pass through foreign taxes of $0.04 per share to its shareholders, of which 100% would be allowable as a credit. The Fund generated net foreign source income of $0.29 per share with respect to this election.
39
Directors
Frank L. Bowman
Michael Bozic
Kathleen A. Dennis
Edwin J. Garn
Wayne E. Hedien
James F. Higgins
Dr. Manuel H. Johnson
Joseph J. Kearns
Michael F. Klein
Michael E. Nugent
W. Allen Reed
Fergus Reid
Officers
Michael E. Nugent
Chairman of the Board
Ronald E. Robison
President and Principal Executive Officer
J. David Germany
Vice President
Dennis F. Shea
Vice President
Barry Fink
Vice President
Amy R. Doberman
Vice President
Carsten Otto
Chief Compliance Officer
Stefanie V. Chang Yu
Vice President
Francis J. Smith
Treasurer and Chief Financial Officer
Mary E. Mullin
Secretary
Transfer Agent
Morgan Stanley Trust
Harborside Financial Center, Plaza Two
Jersey City, New Jersey 07311
Independent Registered Public Accounting Firm
Deloitte & Touche LLP
Two World Financial Center
New York, New York 10281
Investment Adviser
Morgan Stanley Investment Advisors Inc.
1221 Avenue of the Americas
New York, New York 10020
Sub-Adviser
Morgan Stanley Investment Management Limited
25 Cabot Square, Canary Wharf
London, United Kingdom E14 4QA
This report is submitted for the general information of the shareholders of the Fund. For more detailed information about the Fund, its fees and expenses and other pertinent information, please read its Prospectus. The Fund's Statement of Additional Information contains additional information about the Fund, including its directors. It is available, without charge, by calling (800) 869-NEWS.
This report is not authorized for distribution to prospective investors in the Fund unless preceded or accompanied by an effective Prospectus. Read the Prospectus carefully before investing.
Investments and services offered through Morgan Stanley DW Inc., member SIPC. Morgan Stanley Distributors Inc., member NASD.
© 2006 Morgan Stanley

RA06-01139P-Y10/06-EUGRPT-ANR
MORGAN STANLEY FUNDS
Morgan Stanley
European Equity Fund
Annual Report
October 31, 2006

Item 2. Code of Ethics.
(a) The Fund has adopted a code of ethics (the “Code of Ethics”) that applies to its principal executive officer, principal financial officer, principal accounting officer or controller, or persons performing similar functions, regardless of whether these individuals are employed by the Fund or a third party.
(b) No information need be disclosed pursuant to this paragraph.
(c) Not applicable.
(d) Not applicable.
(e) Not applicable.
(f)
(1) The Fund’s Code of Ethics is attached hereto as Exhibit 12 A.
(2) Not applicable.
(3) Not applicable.
Item 3. Audit Committee Financial Expert.
The Fund’s Board of Directors has determined that Joseph J. Kearns, an “independent” Directors, is an “audit committee financial expert” serving on its audit committee. Under applicable securities laws, a person who is determined to be an audit committee financial expert will not be deemed an “expert” for any purpose, including without limitation for the purposes of Section 11 of the Securities Act of 1933, as a result of being designated or identified as an audit committee financial expert. The designation or identification of a person as an audit committee financial expert does not impose on such person any duties, obligations, or liabilities that are greater than the duties, obligations, and liabilities imposed on such person as a member of the audit committee and Board of Directors in the absence of such designation or identification
Item 4. Principal Accountant Fees and Services.
(a)(b)(c)(d) and (g). Based on fees billed for the periods shown:
2006
| Registrant |
| Covered Entities(1) |
| |||
Audit Fees |
| $ | 42,100 |
| N/A |
| |
|
|
|
|
|
| ||
Non-Audit Fees |
|
|
|
|
| ||
Audit-Related Fees |
| $ | 531 | (2) | $ | 5,217,590 | (2) |
Tax Fees |
| $ | 6,980 | (3) | $ | 1,472,895 | (4) |
All Other Fees |
| $ | — |
| $ | — |
|
Total Non-Audit Fees |
| $ | 7,511 |
| $ | 6,690,485 |
|
|
|
|
|
|
| ||
Total |
| $ | 49,611 |
| $ | 6,690,485 |
|
2005
| Registrant |
| Covered Entities(1) |
| |||
Audit Fees |
| $ | 40,975 |
| N/A |
| |
|
|
|
|
|
| ||
Non-Audit Fees |
|
|
|
|
| ||
Audit-Related Fees |
| $ | 540 | (2) | $ | 3,215,745 | (2) |
Tax Fees |
| $ | 7,601 | (3) | $ | 24,000 | (4) |
All Other Fees |
| $ | — |
| $ | — |
|
Total Non-Audit Fees |
| $ | 8,141 |
| $ | 3,239,745 |
|
|
|
|
|
|
| ||
Total |
| $ | 49,116 |
| $ | 3,239,745 |
|
N/A- Not applicable, as not required by Item 4.
(1) Covered Entities include the Adviser (excluding sub-advisors) and any entity controlling, controlled by or under common control with the Adviser that provides ongoing services to the Registrant.
(2) Audit-Related Fees represent assurance and related services provided that are reasonably related to the performance of the audit of the financial statements of the Covered Entities’ and funds advised by the Adviser or its affiliates, specifically data verification and agreed-upon procedures related to asset securitizations and agreed-upon procedures engagements.
(3) Tax Fees represent tax compliance, tax planning and tax advice services provided in connection with the preparation and review of the Registrant’s tax returns.
(4) Tax Fees represent tax compliance, tax planning and tax advice services provided in connection with the review of Covered Entities’ tax returns.
(e)(1) The audit committee’s pre-approval policies and procedures are as follows:
APPENDIX A
AUDIT COMMITTEE
AUDIT AND NON-AUDIT SERVICES
PRE-APPROVAL POLICY AND PROCEDURES
OF THE
MORGAN STANLEY RETAIL AND INSTITUTIONAL FUNDS
AS ADOPTED AND AMENDED JULY 23, 2004,(1)
1. Statement of Principles
The Audit Committee of the Board is required to review and, in its sole discretion, pre-approve all Covered Services to be provided by the Independent Auditors to the Fund and Covered Entities in order to assure that services performed by the Independent Auditors do not impair the auditor’s independence from the Fund.
The SEC has issued rules specifying the types of services that an independent auditor may not provide to its audit client, as well as the audit committee’s administration of the engagement of the independent auditor. The SEC’s rules establish two different approaches to pre-approving services, which the SEC considers to be equally valid. Proposed services either: may be pre-approved without consideration of specific case-by-case services by the Audit Committee (“general pre-approval”); or require the specific pre-approval of the Audit Committee or its delegate (“specific pre-approval”). The Audit Committee believes that the combination of these two approaches in this Policy will result in an effective and efficient procedure to pre-approve services performed by the Independent Auditors. As set forth in this Policy, unless a type of service has received general pre-approval, it will require specific pre-approval by the Audit Committee (or by any member of the Audit Committee to which pre-approval authority has been delegated) if it is to be provided by the Independent Auditors. Any proposed services exceeding pre-approved cost levels or budgeted amounts will also require specific pre-approval by the Audit Committee.
The appendices to this Policy describe the Audit, Audit-related, Tax and All Other services that have the general pre-approval of the Audit Committee. The term of any general pre-approval is 12 months from the date of pre-approval, unless the Audit Committee considers and provides a different period and states otherwise. The Audit Committee will annually review and pre-approve the services that may be provided by the Independent Auditors without obtaining specific pre-approval from the Audit Committee. The Audit Committee will add to or subtract from the list of general pre-approved services from time to time, based on subsequent determinations.
(1) This Audit Committee Audit and Non-Audit Services Pre-Approval Policy and Procedures (the “Policy”), adopted as of the date above, supersedes and replaces all prior versions that may have been adopted from time to time.
The purpose of this Policy is to set forth the policy and procedures by which the Audit Committee intends to fulfill its responsibilities. It does not delegate the Audit Committee’s responsibilities to pre-approve services performed by the Independent Auditors to management.
The Fund’s Independent Auditors have reviewed this Policy and believes that implementation of the Policy will not adversely affect the Independent Auditors’ independence.
2. Delegation
As provided in the Act and the SEC’s rules, the Audit Committee may delegate either type of pre-approval authority to one or more of its members. The member to whom such authority is delegated must report, for informational purposes only, any pre-approval decisions to the Audit Committee at its next scheduled meeting.
3. Audit Services
The annual Audit services engagement terms and fees are subject to the specific pre-approval of the Audit Committee. Audit services include the annual financial statement audit and other procedures required to be performed by the Independent Auditors to be able to form an opinion on the Fund’s financial statements. These other procedures include information systems and procedural reviews and testing performed in order to understand and place reliance on the systems of internal control, and consultations relating to the audit. The Audit Committee will approve, if necessary, any changes in terms, conditions and fees resulting from changes in audit scope, Fund structure or other items.
In addition to the annual Audit services engagement approved by the Audit Committee, the Audit Committee may grant general pre-approval to other Audit services, which are those services that only the Independent Auditors reasonably can provide. Other Audit services may include statutory audits and services associated with SEC registration statements (on Forms N-1A, N-2, N-3, N-4, etc.), periodic reports and other documents filed with the SEC or other documents issued in connection with securities offerings.
The Audit Committee has pre-approved the Audit services in Appendix B.1. All other Audit services not listed in Appendix B.1 must be specifically pre-approved by the Audit Committee (or by any member of the Audit Committee to which pre-approval has been delegated).
4. Audit-related Services
Audit-related services are assurance and related services that are reasonably related to the performance of the audit or review of the Fund’s financial statements and, to the extent they are Covered Services, the Covered Entities or that are traditionally performed by the Independent Auditors. Because the Audit Committee believes that the provision of Audit-related services does not impair the independence of the auditor and is consistent with the SEC’s rules on auditor independence, the Audit Committee may grant general pre-approval to Audit-related services. Audit-related services include, among others, accounting consultations related to accounting, financial reporting or disclosure matters
not classified as “Audit services”; assistance with understanding and implementing new accounting and financial reporting guidance from rulemaking authorities; agreed-upon or expanded audit procedures related to accounting and/or billing records required to respond to or comply with financial, accounting or regulatory reporting matters; and assistance with internal control reporting requirements under Forms N-SAR and/or N-CSR.
The Audit Committee has pre-approved the Audit-related services in Appendix B.2. All other Audit-related services not listed in Appendix B.2 must be specifically pre-approved by the Audit Committee (or by any member of the Audit Committee to which pre-approval has been delegated).
5. Tax Services
The Audit Committee believes that the Independent Auditors can provide Tax services to the Fund and, to the extent they are Covered Services, the Covered Entities, such as tax compliance, tax planning and tax advice without impairing the auditor’s independence, and the SEC has stated that the Independent Auditors may provide such services.
Pursuant to the preceding paragraph, the Audit Committee has pre-approved the Tax Services in Appendix B.3. All Tax services in Appendix B.3 must be specifically pre-approved by the Audit Committee (or by any member of the Audit Committee to which pre-approval has been delegated).
6. All Other Services
The Audit Committee believes, based on the SEC’s rules prohibiting the Independent Auditors from providing specific non-audit services, that other types of non-audit services are permitted. Accordingly, the Audit Committee believes it may grant general pre-approval to those permissible non-audit services classified as All Other services that it believes are routine and recurring services, would not impair the independence of the auditor and are consistent with the SEC’s rules on auditor independence.
The Audit Committee has pre-approved the All Other services in Appendix B.4. Permissible All Other services not listed in Appendix B.4 must be specifically pre-approved by the Audit Committee (or by any member of the Audit Committee to which pre-approval has been delegated).
7. Pre-Approval Fee Levels or Budgeted Amounts
Pre-approval fee levels or budgeted amounts for all services to be provided by the Independent Auditors will be established annually by the Audit Committee. Any proposed services exceeding these levels or amounts will require specific pre-approval by the Audit Committee. The Audit Committee is mindful of the overall relationship of fees for audit and non-audit services in determining whether to pre-approve any such services.
8. Procedures
All requests or applications for services to be provided by the Independent Auditors that do not require specific approval by the Audit Committee will be submitted to the Fund’s Chief Financial Officer and must include a detailed description of the services to be
rendered. The Fund’s Chief Financial Officer will determine whether such services are included within the list of services that have received the general pre-approval of the Audit Committee. The Audit Committee will be informed on a timely basis of any such services rendered by the Independent Auditors. Requests or applications to provide services that require specific approval by the Audit Committee will be submitted to the Audit Committee by both the Independent Auditors and the Fund’s Chief Financial Officer, and must include a joint statement as to whether, in their view, the request or application is consistent with the SEC’s rules on auditor independence.
The Audit Committee has designated the Fund’s Chief Financial Officer to monitor the performance of all services provided by the Independent Auditors and to determine whether such services are in compliance with this Policy. The Fund’s Chief Financial Officer will report to the Audit Committee on a periodic basis on the results of its monitoring. Both the Fund’s Chief Financial Officer and management will immediately report to the chairman of the Audit Committee any breach of this Policy that comes to the attention of the Fund’s Chief Financial Officer or any member of management.
9. Additional Requirements
The Audit Committee has determined to take additional measures on an annual basis to meet its responsibility to oversee the work of the Independent Auditors and to assure the auditor’s independence from the Fund, such as reviewing a formal written statement from the Independent Auditors delineating all relationships between the Independent Auditors and the Fund, consistent with Independence Standards Board No. 1, and discussing with the Independent Auditors its methods and procedures for ensuring independence.
10. Covered Entities
Covered Entities include the Fund’s investment adviser(s) and any entity controlling, controlled by or under common control with the Fund’s investment adviser(s) that provides ongoing services to the Fund(s). Beginning with non-audit service contracts entered into on or after May 6, 2003, the Fund’s audit committee must pre-approve non-audit services provided not only to the Fund but also to the Covered Entities if the engagements relate directly to the operations and financial reporting of the Fund. This list of Covered Entities would include:
Morgan Stanley Retail Funds
Morgan Stanley Investment Advisors Inc.
Morgan Stanley & Co. Incorporated
Morgan Stanley DW Inc.
Morgan Stanley Investment Management Inc.
Morgan Stanley Investment Management Limited
Morgan Stanley Investment Management Private Limited
Morgan Stanley Asset & Investment Trust Management Co., Limited
Morgan Stanley Investment Management Company
Van Kampen Asset Management
Morgan Stanley Services Company, Inc.
Morgan Stanley Distributors Inc.
Morgan Stanley Trust FSB
Morgan Stanley Institutional Funds
Morgan Stanley Investment Management Inc.
Morgan Stanley Investment Advisors Inc.
Morgan Stanley Investment Management Limited
Morgan Stanley Investment Management Private Limited
Morgan Stanley Asset & Investment Trust Management Co., Limited
Morgan Stanley Investment Management Company
Morgan Stanley & Co. Incorporated
Morgan Stanley Distribution, Inc.
Morgan Stanley AIP GP LP
Morgan Stanley Alternative Investment Partners LP
(e)(2) Beginning with non-audit service contracts entered into on or after May 6, 2003, the audit committee also is required to pre-approve services to Covered Entities to the extent that the services are determined to have a direct impact on the operations or financial reporting of the Registrant. 100% of such services were pre-approved by the audit committee pursuant to the Audit Committee’s pre-approval policies and procedures (attached hereto).
(f) Not applicable.
(g) See table above.
(h) The audit committee of the Board of Directors has considered whether the provision of services other than audit services performed by the auditors to the Registrant and Covered Entities is compatible with maintaining the auditors’ independence in performing audit services.
Item 5. Audit Committee of Listed Registrants.
(a) The Fund has a separately-designated standing audit committee established in accordance with Section 3(a)(58)(A) of the Exchange Act whose members are: Frank Bowman, Wayne Hedien, Joseph Kearns, Michael Nugent and Allen Reed.
(b) Not applicable.
Item 6. Schedule of Investments
Refer to Item 1.
Item 7. Disclosure of Proxy Voting Policies and Procedures for Closed-End Management Investment Companies.
Applicable only to reports filed by closed-end funds.
Item 8. Portfolio Managers of Closed-End Management Investment Companies
Applicable only to reports filed by closed-end funds.
Item 9. Closed-End Fund Repurchases
Applicable only to reports filed by closed-end funds.
Item 10. Submission of Matters to a Vote of Security Holders
Not applicable.
Item 11. Controls and Procedures
(a) The Fund’s principal executive officer and principal financial officer have concluded that the Fund’s disclosure controls and procedures are sufficient to ensure that information required to be disclosed by the Fund in this Form N-CSR was recorded, processed, summarized and reported within the time periods specified in the Securities and Exchange Commission’s rules and forms, based upon such officers’ evaluation of these controls and procedures as of a date within 90 days of the filing date of the report.
(b) There were no changes in the registrant’s internal control over financial reporting that occurred during the second fiscal quarter of the period covered by this report that has materially affected, or is reasonably likely to materially affect, the registrant’s internal control over financial reporting.
Item 12. Exhibits
(a) The Code of Ethics for Principal Executive and Senior Financial Officers is attached hereto.
(b) A separate certification for each principal executive officer and principal financial officer of the registrant are attached hereto as part of EX-99.CERT.
SIGNATURES
Pursuant to the requirements of the Securities Exchange Act of 1934 and the Investment Company Act of 1940, the registrant has duly caused this report to be signed on its behalf by the undersigned, thereunto duly authorized.
Morgan Stanley European Equity Fund Inc.
/s/ Ronald E. Robison |
|
Ronald E. Robison | |
Principal Executive Officer | |
December 19, 2006 | |
Pursuant to the requirements of the Securities Exchange Act of 1934 and the Investment Company Act of 1940, this report has been signed by the following persons on behalf of the registrant and in the capacities and on the dates indicated.
/s/ Ronald E. Robison |
|
Ronald E. Robison | |
Principal Executive Officer | |
December 19, 2006 | |
/s/ Francis Smith |
|
Francis Smith | |
Principal Financial Officer | |
December 19, 2006 | |