UNITED STATES SECURITIES AND EXCHANGE COMMISSION
Washington, D.C. 20549
Form N-CSR
CERTIFIED SHAREHOLDER REPORT OF REGISTERED
MANAGEMENT INVESTMENT COMPANIES
Investment Company Act File Number: 811-06044
Morgan Stanley Europe Opportunity Fund, Inc.
(Exact Name of Registrant as Specified in Charter)
1585 Broadway, New York, New York 10036
(Address of Principal Executive Offices)
John H. Gernon
1585 Broadway, New York, New York 10036
(Name and Address of Agent for Services)
(212) 762-1886
(Registrant’s Telephone Number)
October 31
Date of Fiscal Year End
October 31, 2024
Date of Reporting Period
Item 1. Reports to Stockholders
(a)
TABLE OF CONTENTS
Morgan Stanley Europe Opportunity Fund, Inc.
Annual Shareholder Report October 31, 2024
This annual shareholder report contains important information about Morgan Stanley Europe Opportunity Fund, Inc. for the period of November 1, 2023 to October 31, 2024. You can find additional information about the Fund at www.morganstanley.com/im/shareholderreports. You can also request this information by contacting us at 1-800-869-6397.
What were the Fund costs for the last year?
(based on a hypothetical $10,000 investment)
| Class Name | Costs of a $10,000 investment | Costs paid as a percentage of a $10,000 investment |
|---|
| Class A | $147 | 1.28% |
How did the Fund perform last year and what affected its performance?
Key contributors to (↑) and detractors from (↓) performance, relative to the MSCI Europe Net Index:
↑ Stock selection and an average overweight in communication services, led by a Swedish audio streaming platform, which was the largest positive contributor in the portfolio.
↑ Stock selection in consumer discretionary, led by a Swiss premium performance sports brand.
↑ No exposure to energy.
↓ An average overweight in consumer discretionary, where an online casino solutions company was the main detractor.
↓ Stock selection in consumer staples, where a leading beauty company was the largest detractor across the portfolio.
↓ Stock selection in health care, where a provider of products and solutions in the aesthetic dentistry market was the main detractor.
Comparison of the change in value of a $10,000 investment for the period indicated.
| | MSCI Europe Net Index |
|---|
| 10/14 | $9,473 | $10,000 |
| 11/14 | $9,689 | $10,266 |
| 12/14 | $9,175 | $9,824 |
| 1/15 | $9,290 | $9,824 |
| 2/15 | $9,826 | $10,440 |
| 3/15 | $9,628 | $10,163 |
| 4/15 | $10,030 | $10,604 |
| 5/15 | $10,092 | $10,522 |
| 6/15 | $9,639 | $10,199 |
| 7/15 | $9,879 | $10,518 |
| 8/15 | $9,170 | $9,769 |
| 9/15 | $8,706 | $9,313 |
| 10/15 | $9,102 | $9,980 |
| 11/15 | $8,920 | $9,797 |
| 12/15 | $8,658 | $9,545 |
| 1/16 | $8,132 | $8,915 |
| 2/16 | $7,951 | $8,756 |
| 3/16 | $8,472 | $9,305 |
| 4/16 | $8,664 | $9,533 |
| 5/16 | $8,669 | $9,477 |
| 6/16 | $8,313 | $9,055 |
| 7/16 | $8,504 | $9,434 |
| 8/16 | $8,462 | $9,462 |
| 9/16 | $8,510 | $9,544 |
| 10/16 | $8,180 | $9,234 |
| 11/16 | $7,994 | $9,033 |
| 12/16 | $8,400 | $9,506 |
| 1/17 | $8,509 | $9,704 |
| 2/17 | $8,628 | $9,819 |
| 3/17 | $9,064 | $10,214 |
| 4/17 | $9,477 | $10,574 |
| 5/17 | $9,901 | $11,087 |
| 6/17 | $9,782 | $10,966 |
| 7/17 | $9,874 | $11,293 |
| 8/17 | $9,901 | $11,300 |
| 9/17 | $10,054 | $11,673 |
| 10/17 | $10,206 | $11,728 |
| 11/17 | $10,103 | $11,754 |
| 12/17 | $10,307 | $11,931 |
| 1/18 | $10,838 | $12,576 |
| 2/18 | $10,126 | $11,836 |
| 3/18 | $10,137 | $11,694 |
| 4/18 | $10,148 | $12,018 |
| 5/18 | $10,280 | $11,623 |
| 6/18 | $10,340 | $11,545 |
| 7/18 | $10,674 | $11,929 |
| 8/18 | $10,586 | $11,596 |
| 9/18 | $10,394 | $11,638 |
| 10/18 | $9,579 | $10,749 |
| 11/18 | $9,355 | $10,649 |
| 12/18 | $8,936 | $10,157 |
| 1/19 | $9,299 | $10,827 |
| 2/19 | $9,701 | $11,190 |
| 3/19 | $9,998 | $11,259 |
| 4/19 | $10,224 | $11,661 |
| 5/19 | $9,888 | $11,022 |
| 6/19 | $10,537 | $11,763 |
| 7/19 | $10,433 | $11,535 |
| 8/19 | $10,295 | $11,245 |
| 9/19 | $10,383 | $11,551 |
| 10/19 | $10,812 | $11,921 |
| 11/19 | $10,983 | $12,100 |
| 12/19 | $11,336 | $12,572 |
| 1/20 | $11,280 | $12,256 |
| 2/20 | $10,695 | $11,119 |
| 3/20 | $9,672 | $9,513 |
| 4/20 | $10,553 | $10,077 |
| 5/20 | $11,666 | $10,536 |
| 6/20 | $12,609 | $10,965 |
| 7/20 | $13,449 | $11,386 |
| 8/20 | $14,119 | $11,855 |
| 9/20 | $14,227 | $11,460 |
| 10/20 | $14,000 | $10,813 |
| 11/20 | $15,846 | $12,653 |
| 12/20 | $17,584 | $13,249 |
| 1/21 | $17,044 | $13,057 |
| 2/21 | $17,909 | $13,376 |
| 3/21 | $17,651 | $13,789 |
| 4/21 | $19,069 | $14,416 |
| 5/21 | $19,676 | $15,017 |
| 6/21 | $19,909 | $14,812 |
| 7/21 | $20,578 | $15,086 |
| 8/21 | $21,093 | $15,314 |
| 9/21 | $19,682 | $14,583 |
| 10/21 | $20,780 | $15,239 |
| 11/21 | $20,296 | $14,453 |
| 12/21 | $20,282 | $15,408 |
| 1/22 | $17,087 | $14,703 |
| 2/22 | $15,451 | $14,288 |
| 3/22 | $14,965 | $14,273 |
| 4/22 | $13,212 | $13,452 |
| 5/22 | $12,796 | $13,553 |
| 6/22 | $11,309 | $12,205 |
| 7/22 | $12,504 | $12,809 |
| 8/22 | $11,121 | $12,011 |
| 9/22 | $9,641 | $10,966 |
| 10/22 | $10,212 | $11,752 |
| 11/22 | $11,738 | $13,086 |
| 12/22 | $11,225 | $13,088 |
| 1/23 | $12,595 | $14,223 |
| 2/23 | $12,426 | $14,135 |
| 3/23 | $13,725 | $14,470 |
| 4/23 | $14,114 | $15,071 |
| 5/23 | $13,763 | $14,187 |
| 6/23 | $14,523 | $14,866 |
| 7/23 | $14,815 | $15,322 |
| 8/23 | $13,595 | $14,714 |
| 9/23 | $12,478 | $14,129 |
| 10/23 | $11,874 | $13,602 |
| 11/23 | $13,121 | $14,944 |
| 12/23 | $14,004 | $15,691 |
| 1/24 | $14,095 | $15,672 |
| 2/24 | $15,250 | $15,916 |
| 3/24 | $15,406 | $16,511 |
| 4/24 | $14,354 | $16,199 |
| 5/24 | $15,133 | $16,983 |
| 6/24 | $14,724 | $16,602 |
| 7/24 | $14,932 | $16,958 |
| 8/24 | $15,705 | $17,627 |
| 9/24 | $16,140 | $17,695 |
| 10/24 | $15,354 | $16,652 |
Average Annual Total Returns (%)
| AATR | 1 Year | 5 Years | 10 Years |
|---|
| Class A | 29.31% | 7.27% | 4.95% |
| Class A with maximum 5.25% front end sales charge | 22.54% | 6.11% | 4.38% |
| MSCI Europe Net Index | 22.43% | 6.91% | 5.23% |
Performance does not reflect the deduction of taxes that a shareholder would pay on Fund distributions or redemption of Fund shares. Performance assumes that all dividends and distributions, if any, were reinvested. For more recent performance information, visit www.morganstanley.com/im/shareholderreports.
THE FUND'S PAST PERFORMANCE IS NO GUARANTEE OF FUTURE RESULTS.
| Total Net Assets | $119,991,014 |
| # of Portfolio Holdings | 25 |
| Portfolio Turnover Rate | 36% |
| Total Advisory Fees Paid | $803,538 |
What did the Fund invest in?
The following tables reflect what the Fund invested in as of the report date.
Geographic Allocation (% of total investments)
| Value | Value |
|---|
| Germany | 1.5% |
| Poland | 2.3% |
| Sweden | 3.4% |
| Italy | 6.9% |
| Netherlands | 7.6% |
| Switzerland | 11.7% |
| United Kingdom | 12.5% |
| Denmark | 13.1% |
| United States | 18.6% |
| France | 22.4% |
Top Ten Holdings (% of total investments)
| DSV AS | 9.8% |
| Spotify Technology SA | 9.1% |
| Hermes International SCA | 8.2% |
| Moncler SpA | 6.9% |
| Schneider Electric SE | 5.1% |
| London Stock Exchange Group PLC | 5.0% |
| On Holding AG | 4.3% |
| Liberty Media Corp.-Liberty Formula One | 4.2% |
| Adyen NV | 4.0% |
| L'Oreal SA | 3.8% |
| Total | 60.4% |
If you wish to view additional information about the Fund, including the prospectus, statement of additional information, financial statements and holdings, please scan the QR code or visit www.morganstanley.com/im/shareholderreports. For proxy information, please visit www.morganstanley.com/im/en-us/institutional-investor/about-us/proxy-voting/vote-summary-report.desktop.html.
The Funds may deliver a single copy of certain required shareholder documents (including prospectuses, shareholder reports, and proxy materials) to investors with the same last name and the same address. Your participation will continue indefinitely unless you instruct otherwise by calling1-800-869-6397 or by contacting your financial intermediary. Your instruction will typically be effective within 30 days of receipt.
Not FDIC Insured | May Lose Value | No Bank Guarantee
Annual Shareholder Report October 31, 2024
Morgan Stanley Europe Opportunity Fund, Inc.
Annual Shareholder Report October 31, 2024
This annual shareholder report contains important information about Morgan Stanley Europe Opportunity Fund, Inc. for the period of November 1, 2023 to October 31, 2024. You can find additional information about the Fund at www.morganstanley.com/im/shareholderreports. You can also request this information by contacting us at 1-800-869-6397.
What were the Fund costs for the last year?
(based on a hypothetical $10,000 investment)
| Class Name | Costs of a $10,000 investment | Costs paid as a percentage of a $10,000 investment |
|---|
| Class C | $233 | 2.04% |
How did the Fund perform last year and what affected its performance?
Key contributors to (↑) and detractors from (↓) performance, relative to the MSCI Europe Net Index:
↑ Stock selection and an average overweight in communication services, led by a Swedish audio streaming platform, which was the largest positive contributor in the portfolio.
↑ Stock selection in consumer discretionary, led by a Swiss premium performance sports brand.
↑ No exposure to energy.
↓ An average overweight in consumer discretionary, where an online casino solutions company was the main detractor.
↓ Stock selection in consumer staples, where a leading beauty company was the largest detractor across the portfolio.
↓ Stock selection in health care, where a provider of products and solutions in the aesthetic dentistry market was the main detractor.
Comparison of the change in value of a $10,000 investment for the period indicated.
| | MSCI Europe Net Index |
|---|
| 4/15 | $10,000 | $10,000 |
| 5/15 | $10,049 | $10,000 |
| 6/15 | $9,598 | $9,618 |
| 7/15 | $9,826 | $9,918 |
| 8/15 | $9,115 | $9,212 |
| 9/15 | $8,647 | $8,782 |
| 10/15 | $9,039 | $9,411 |
| 11/15 | $8,848 | $9,238 |
| 12/15 | $8,586 | $9,001 |
| 1/16 | $8,060 | $8,407 |
| 2/16 | $7,878 | $8,257 |
| 3/16 | $8,381 | $8,775 |
| 4/16 | $8,570 | $8,989 |
| 5/16 | $8,570 | $8,937 |
| 6/16 | $8,215 | $8,539 |
| 7/16 | $8,392 | $8,897 |
| 8/16 | $8,348 | $8,923 |
| 9/16 | $8,392 | $9,001 |
| 10/16 | $8,060 | $8,707 |
| 11/16 | $7,878 | $8,518 |
| 12/16 | $8,269 | $8,964 |
| 1/17 | $8,370 | $9,151 |
| 2/17 | $8,482 | $9,260 |
| 3/17 | $8,902 | $9,632 |
| 4/17 | $9,306 | $9,972 |
| 5/17 | $9,715 | $10,456 |
| 6/17 | $9,592 | $10,341 |
| 7/17 | $9,676 | $10,650 |
| 8/17 | $9,698 | $10,656 |
| 9/17 | $9,844 | $11,008 |
| 10/17 | $9,978 | $11,060 |
| 11/17 | $9,872 | $11,084 |
| 12/17 | $10,068 | $11,251 |
| 1/18 | $10,584 | $11,859 |
| 2/18 | $9,883 | $11,162 |
| 3/18 | $9,883 | $11,028 |
| 4/18 | $9,889 | $11,333 |
| 5/18 | $10,007 | $10,961 |
| 6/18 | $10,063 | $10,887 |
| 7/18 | $10,376 | $11,250 |
| 8/18 | $10,287 | $10,936 |
| 9/18 | $10,096 | $10,975 |
| 10/18 | $9,300 | $10,137 |
| 11/18 | $9,076 | $10,043 |
| 12/18 | $8,661 | $9,579 |
| 1/19 | $9,014 | $10,210 |
| 2/19 | $9,395 | $10,553 |
| 3/19 | $9,676 | $10,617 |
| 4/19 | $9,889 | $10,997 |
| 5/19 | $9,558 | $10,394 |
| 6/19 | $10,175 | $11,092 |
| 7/19 | $10,074 | $10,878 |
| 8/19 | $9,934 | $10,604 |
| 9/19 | $10,007 | $10,893 |
| 10/19 | $10,421 | $11,242 |
| 11/19 | $10,573 | $11,410 |
| 12/19 | $10,908 | $11,856 |
| 1/20 | $10,844 | $11,558 |
| 2/20 | $10,278 | $10,486 |
| 3/20 | $9,289 | $8,971 |
| 4/20 | $10,127 | $9,503 |
| 5/20 | $11,186 | $9,936 |
| 6/20 | $12,088 | $10,340 |
| 7/20 | $12,880 | $10,737 |
| 8/20 | $13,516 | $11,179 |
| 9/20 | $13,609 | $10,807 |
| 10/20 | $13,383 | $10,197 |
| 11/20 | $15,142 | $11,932 |
| 12/20 | $16,790 | $12,494 |
| 1/21 | $16,262 | $12,313 |
| 2/21 | $17,079 | $12,614 |
| 3/21 | $16,821 | $13,004 |
| 4/21 | $18,159 | $13,595 |
| 5/21 | $18,731 | $14,161 |
| 6/21 | $18,938 | $13,969 |
| 7/21 | $19,560 | $14,227 |
| 8/21 | $20,037 | $14,442 |
| 9/21 | $18,681 | $13,752 |
| 10/21 | $19,717 | $14,371 |
| 11/21 | $19,240 | $13,630 |
| 12/21 | $19,219 | $14,530 |
| 1/22 | $16,180 | $13,865 |
| 2/22 | $14,618 | $13,474 |
| 3/22 | $14,150 | $13,460 |
| 4/22 | $12,481 | $12,686 |
| 5/22 | $12,087 | $12,781 |
| 6/22 | $10,671 | $11,509 |
| 7/22 | $11,793 | $12,079 |
| 8/22 | $10,478 | $11,326 |
| 9/22 | $9,075 | $10,341 |
| 10/22 | $9,609 | $11,083 |
| 11/22 | $11,045 | $12,340 |
| 12/22 | $10,551 | $12,342 |
| 1/23 | $11,826 | $13,413 |
| 2/23 | $11,666 | $13,329 |
| 3/23 | $12,875 | $13,645 |
| 4/23 | $13,236 | $14,212 |
| 5/23 | $12,895 | $13,378 |
| 6/23 | $13,603 | $14,019 |
| 7/23 | $13,863 | $14,449 |
| 8/23 | $12,715 | $13,876 |
| 9/23 | $11,660 | $13,324 |
| 10/23 | $11,092 | $12,827 |
| 11/23 | $12,247 | $14,093 |
| 12/23 | $13,062 | $14,797 |
| 1/24 | $13,142 | $14,779 |
| 2/24 | $14,210 | $15,010 |
| 3/24 | $14,344 | $15,571 |
| 4/24 | $13,356 | $15,276 |
| 5/24 | $14,070 | $16,016 |
| 6/24 | $13,683 | $15,656 |
| 7/24 | $13,870 | $15,992 |
| 8/24 | $14,571 | $16,622 |
| 9/24 | $14,972 | $16,687 |
| 10/24 | $14,231 | $15,703 |
Average Annual Total Returns (%)
| AATR | 1 Year | 5 Years | Since 4/30/15(Inception) |
|---|
| Class C | 28.30% | 6.43% | 3.78% |
| Class C with maximum 1% deferred sales charge | 27.30% | 6.43% | 3.78% |
| MSCI Europe Net Index | 22.43% | 6.91% | 4.86% |
Performance does not reflect the deduction of taxes that a shareholder would pay on Fund distributions or redemption of Fund shares. Performance assumes that all dividends and distributions, if any, were reinvested. For more recent performance information, visit www.morganstanley.com/im/shareholderreports.
THE FUND'S PAST PERFORMANCE IS NO GUARANTEE OF FUTURE RESULTS.
| Total Net Assets | $119,991,014 |
| # of Portfolio Holdings | 25 |
| Portfolio Turnover Rate | 36% |
| Total Advisory Fees Paid | $803,538 |
What did the Fund invest in?
The following tables reflect what the Fund invested in as of the report date.
Geographic Allocation (% of total investments)
| Value | Value |
|---|
| Germany | 1.5% |
| Poland | 2.3% |
| Sweden | 3.4% |
| Italy | 6.9% |
| Netherlands | 7.6% |
| Switzerland | 11.7% |
| United Kingdom | 12.5% |
| Denmark | 13.1% |
| United States | 18.6% |
| France | 22.4% |
Top Ten Holdings (% of total investments)
| DSV AS | 9.8% |
| Spotify Technology SA | 9.1% |
| Hermes International SCA | 8.2% |
| Moncler SpA | 6.9% |
| Schneider Electric SE | 5.1% |
| London Stock Exchange Group PLC | 5.0% |
| On Holding AG | 4.3% |
| Liberty Media Corp.-Liberty Formula One | 4.2% |
| Adyen NV | 4.0% |
| L'Oreal SA | 3.8% |
| Total | 60.4% |
If you wish to view additional information about the Fund, including the prospectus, statement of additional information, financial statements and holdings, please scan the QR code or visit www.morganstanley.com/im/shareholderreports. For proxy information, please visit www.morganstanley.com/im/en-us/institutional-investor/about-us/proxy-voting/vote-summary-report.desktop.html.
The Funds may deliver a single copy of certain required shareholder documents (including prospectuses, shareholder reports, and proxy materials) to investors with the same last name and the same address. Your participation will continue indefinitely unless you instruct otherwise by calling1-800-869-6397 or by contacting your financial intermediary. Your instruction will typically be effective within 30 days of receipt.
Not FDIC Insured | May Lose Value | No Bank Guarantee
Annual Shareholder Report October 31, 2024
Morgan Stanley Europe Opportunity Fund, Inc.
Annual Shareholder Report October 31, 2024
This annual shareholder report contains important information about Morgan Stanley Europe Opportunity Fund, Inc. for the period of November 1, 2023 to October 31, 2024. You can find additional information about the Fund at www.morganstanley.com/im/shareholderreports. You can also request this information by contacting us at 1-800-869-6397.
What were the Fund costs for the last year?
(based on a hypothetical $10,000 investment)
| Class Name | Costs of a $10,000 investment | Costs paid as a percentage of a $10,000 investment |
|---|
| Class I | $108 | 0.94% |
How did the Fund perform last year and what affected its performance?
Key contributors to (↑) and detractors from (↓) performance, relative to the MSCI Europe Net Index:
↑ Stock selection and an average overweight in communication services, led by a Swedish audio streaming platform, which was the largest positive contributor in the portfolio.
↑ Stock selection in consumer discretionary, led by a Swiss premium performance sports brand.
↑ No exposure to energy.
↓ An average overweight in consumer discretionary, where an online casino solutions company was the main detractor.
↓ Stock selection in consumer staples, where a leading beauty company was the largest detractor across the portfolio.
↓ Stock selection in health care, where a provider of products and solutions in the aesthetic dentistry market was the main detractor.
Comparison of the change in value of a $1,000,000 investment for the period indicated.
| | MSCI Europe Net Index |
|---|
| 10/14 | $1,000,000 | $1,000,000 |
| 11/14 | $1,023,422 | $1,026,581 |
| 12/14 | $969,420 | $982,389 |
| 1/15 | $982,148 | $982,354 |
| 2/15 | $1,038,892 | $1,044,031 |
| 3/15 | $1,017,679 | $1,016,296 |
| 4/15 | $1,061,165 | $1,060,417 |
| 5/15 | $1,067,529 | $1,052,245 |
| 6/15 | $1,020,331 | $1,019,915 |
| 7/15 | $1,045,786 | $1,051,771 |
| 8/15 | $971,011 | $976,876 |
| 9/15 | $921,692 | $931,274 |
| 10/15 | $964,117 | $997,956 |
| 11/15 | $945,026 | $979,664 |
| 12/15 | $918,189 | $954,453 |
| 1/16 | $862,870 | $891,539 |
| 2/16 | $843,346 | $875,568 |
| 3/16 | $898,665 | $930,528 |
| 4/16 | $919,274 | $953,260 |
| 5/16 | $920,359 | $947,657 |
| 6/16 | $882,937 | $905,503 |
| 7/16 | $903,004 | $943,414 |
| 8/16 | $899,207 | $946,198 |
| 9/16 | $904,631 | $954,440 |
| 10/16 | $869,378 | $923,355 |
| 11/16 | $850,396 | $903,271 |
| 12/16 | $894,085 | $950,610 |
| 1/17 | $905,791 | $970,356 |
| 2/17 | $919,169 | $981,947 |
| 3/17 | $965,434 | $1,021,380 |
| 4/17 | $1,009,469 | $1,057,443 |
| 5/17 | $1,055,177 | $1,108,720 |
| 6/17 | $1,042,914 | $1,096,611 |
| 7/17 | $1,052,947 | $1,129,349 |
| 8/17 | $1,056,291 | $1,130,006 |
| 9/17 | $1,073,014 | $1,167,292 |
| 10/17 | $1,089,179 | $1,172,781 |
| 11/17 | $1,078,588 | $1,175,361 |
| 12/17 | $1,100,749 | $1,193,083 |
| 1/18 | $1,157,558 | $1,257,564 |
| 2/18 | $1,082,188 | $1,183,647 |
| 3/18 | $1,083,312 | $1,169,404 |
| 4/18 | $1,084,437 | $1,201,763 |
| 5/18 | $1,099,062 | $1,162,307 |
| 6/18 | $1,106,374 | $1,154,518 |
| 7/18 | $1,141,809 | $1,192,948 |
| 8/18 | $1,132,810 | $1,159,629 |
| 9/18 | $1,113,123 | $1,163,759 |
| 10/18 | $1,025,941 | $1,074,945 |
| 11/18 | $1,002,317 | $1,064,930 |
| 12/18 | $957,555 | $1,015,745 |
| 1/19 | $997,335 | $1,082,663 |
| 2/19 | $1,040,524 | $1,119,026 |
| 3/19 | $1,072,348 | $1,125,853 |
| 4/19 | $1,096,784 | $1,166,107 |
| 5/19 | $1,061,551 | $1,102,218 |
| 6/19 | $1,130,881 | $1,176,259 |
| 7/19 | $1,120,652 | $1,153,473 |
| 8/19 | $1,105,877 | $1,124,460 |
| 9/19 | $1,115,538 | $1,155,063 |
| 10/19 | $1,162,137 | $1,192,139 |
| 11/19 | $1,180,322 | $1,209,951 |
| 12/19 | $1,219,101 | $1,257,214 |
| 1/20 | $1,213,232 | $1,225,601 |
| 2/20 | $1,150,428 | $1,111,908 |
| 3/20 | $1,040,668 | $951,322 |
| 4/20 | $1,135,754 | $1,007,746 |
| 5/20 | $1,256,079 | $1,053,639 |
| 6/20 | $1,358,209 | $1,096,485 |
| 7/20 | $1,448,600 | $1,138,619 |
| 8/20 | $1,521,382 | $1,185,466 |
| 9/20 | $1,533,708 | $1,145,965 |
| 10/20 | $1,509,056 | $1,081,337 |
| 11/20 | $1,709,207 | $1,265,308 |
| 12/20 | $1,896,433 | $1,324,870 |
| 1/21 | $1,839,559 | $1,305,683 |
| 2/21 | $1,933,085 | $1,337,604 |
| 3/21 | $1,905,912 | $1,378,927 |
| 4/21 | $2,058,840 | $1,441,589 |
| 5/21 | $2,125,825 | $1,501,678 |
| 6/21 | $2,151,102 | $1,481,249 |
| 7/21 | $2,224,406 | $1,508,632 |
| 8/21 | $2,280,648 | $1,531,431 |
| 9/21 | $2,128,352 | $1,458,257 |
| 10/21 | $2,247,788 | $1,523,943 |
| 11/21 | $2,195,969 | $1,445,344 |
| 12/21 | $2,195,846 | $1,540,797 |
| 1/22 | $1,849,765 | $1,470,293 |
| 2/22 | $1,673,057 | $1,428,771 |
| 3/22 | $1,621,045 | $1,427,290 |
| 4/22 | $1,431,001 | $1,345,204 |
| 5/22 | $1,386,991 | $1,355,267 |
| 6/22 | $1,226,286 | $1,220,452 |
| 7/22 | $1,356,317 | $1,280,858 |
| 8/22 | $1,206,282 | $1,201,063 |
| 9/22 | $1,045,578 | $1,096,615 |
| 10/22 | $1,108,259 | $1,175,210 |
| 11/22 | $1,274,298 | $1,308,601 |
| 12/22 | $1,218,951 | $1,308,764 |
| 1/23 | $1,367,653 | $1,422,296 |
| 2/23 | $1,349,649 | $1,413,475 |
| 3/23 | $1,491,015 | $1,446,981 |
| 4/23 | $1,534,358 | $1,507,079 |
| 5/23 | $1,496,349 | $1,418,662 |
| 6/23 | $1,579,702 | $1,486,604 |
| 7/23 | $1,611,043 | $1,532,190 |
| 8/23 | $1,479,012 | $1,471,408 |
| 9/23 | $1,357,650 | $1,412,940 |
| 10/23 | $1,292,302 | $1,360,178 |
| 11/23 | $1,429,000 | $1,494,418 |
| 12/23 | $1,525,690 | $1,569,073 |
| 1/24 | $1,535,692 | $1,567,237 |
| 2/24 | $1,661,721 | $1,591,635 |
| 3/24 | $1,679,726 | $1,651,130 |
| 4/24 | $1,565,699 | $1,619,862 |
| 5/24 | $1,650,385 | $1,698,323 |
| 6/24 | $1,606,375 | $1,660,167 |
| 7/24 | $1,629,714 | $1,695,813 |
| 8/24 | $1,714,400 | $1,762,663 |
| 9/24 | $1,762,412 | $1,769,467 |
| 10/24 | $1,676,391 | $1,665,212 |
Average Annual Total Returns (%)
| AATR | 1 Year | 5 Years | 10 Years |
|---|
| Class I | 29.72% | 7.60% | 5.30% |
| MSCI Europe Net Index | 22.43% | 6.91% | 5.23% |
Performance does not reflect the deduction of taxes that a shareholder would pay on Fund distributions or redemption of Fund shares. Performance assumes that all dividends and distributions, if any, were reinvested. For more recent performance information, visit www.morganstanley.com/im/shareholderreports.
THE FUND'S PAST PERFORMANCE IS NO GUARANTEE OF FUTURE RESULTS.
| Total Net Assets | $119,991,014 |
| # of Portfolio Holdings | 25 |
| Portfolio Turnover Rate | 36% |
| Total Advisory Fees Paid | $803,538 |
What did the Fund invest in?
The following tables reflect what the Fund invested in as of the report date.
Geographic Allocation (% of total investments)
| Value | Value |
|---|
| Germany | 1.5% |
| Poland | 2.3% |
| Sweden | 3.4% |
| Italy | 6.9% |
| Netherlands | 7.6% |
| Switzerland | 11.7% |
| United Kingdom | 12.5% |
| Denmark | 13.1% |
| United States | 18.6% |
| France | 22.4% |
Top Ten Holdings (% of total investments)
| DSV AS | 9.8% |
| Spotify Technology SA | 9.1% |
| Hermes International SCA | 8.2% |
| Moncler SpA | 6.9% |
| Schneider Electric SE | 5.1% |
| London Stock Exchange Group PLC | 5.0% |
| On Holding AG | 4.3% |
| Liberty Media Corp.-Liberty Formula One | 4.2% |
| Adyen NV | 4.0% |
| L'Oreal SA | 3.8% |
| Total | 60.4% |
If you wish to view additional information about the Fund, including the prospectus, statement of additional information, financial statements and holdings, please scan the QR code or visit www.morganstanley.com/im/shareholderreports. For proxy information, please visit www.morganstanley.com/im/en-us/institutional-investor/about-us/proxy-voting/vote-summary-report.desktop.html.
The Funds may deliver a single copy of certain required shareholder documents (including prospectuses, shareholder reports, and proxy materials) to investors with the same last name and the same address. Your participation will continue indefinitely unless you instruct otherwise by calling1-800-869-6397 or by contacting your financial intermediary. Your instruction will typically be effective within 30 days of receipt.
Not FDIC Insured | May Lose Value | No Bank Guarantee
Annual Shareholder Report October 31, 2024
Morgan Stanley Europe Opportunity Fund, Inc.
Annual Shareholder Report October 31, 2024
This annual shareholder report contains important information about Morgan Stanley Europe Opportunity Fund, Inc. for the period of November 1, 2023 to October 31, 2024. You can find additional information about the Fund at www.morganstanley.com/im/shareholderreports. You can also request this information by contacting us at 1-800-869-6397.
What were the Fund costs for the last year?
(based on a hypothetical $10,000 investment)
| Class Name | Costs of a $10,000 investment | Costs paid as a percentage of a $10,000 investment |
|---|
| Class L | $206 | 1.80% |
How did the Fund perform last year and what affected its performance?
Key contributors to (↑) and detractors from (↓) performance, relative to the MSCI Europe Net Index:
↑ Stock selection and an average overweight in communication services, led by a Swedish audio streaming platform, which was the largest positive contributor in the portfolio.
↑ Stock selection in consumer discretionary, led by a Swiss premium performance sports brand.
↑ No exposure to energy.
↓ An average overweight in consumer discretionary, where an online casino solutions company was the main detractor.
↓ Stock selection in consumer staples, where a leading beauty company was the largest detractor across the portfolio.
↓ Stock selection in health care, where a provider of products and solutions in the aesthetic dentistry market was the main detractor.
Comparison of the change in value of a $10,000 investment for the period indicated.
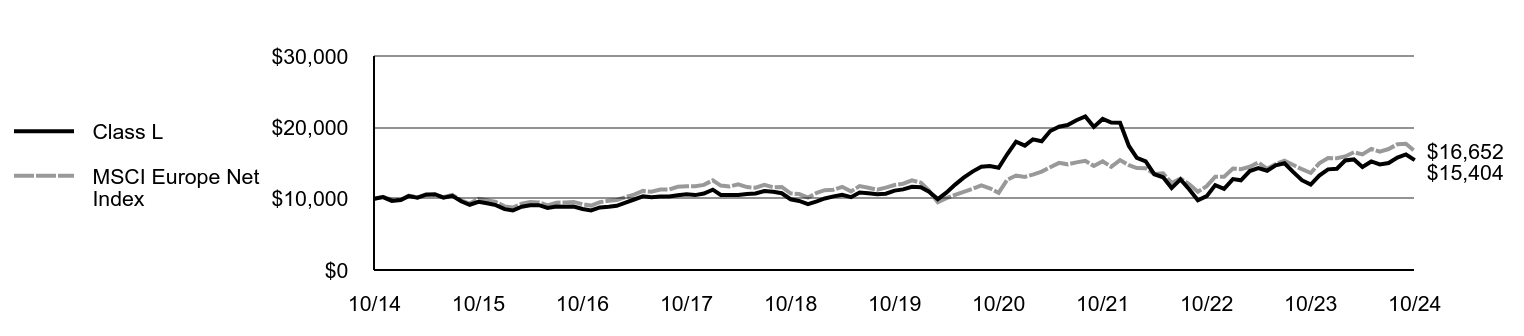
| | MSCI Europe Net Index |
|---|
| 10/14 | $10,000 | $10,000 |
| 11/14 | $10,227 | $10,266 |
| 12/14 | $9,680 | $9,824 |
| 1/15 | $9,801 | $9,824 |
| 2/15 | $10,357 | $10,440 |
| 3/15 | $10,145 | $10,163 |
| 4/15 | $10,564 | $10,604 |
| 5/15 | $10,621 | $10,522 |
| 6/15 | $10,145 | $10,199 |
| 7/15 | $10,392 | $10,518 |
| 8/15 | $9,640 | $9,769 |
| 9/15 | $9,147 | $9,313 |
| 10/15 | $9,560 | $9,980 |
| 11/15 | $9,365 | $9,797 |
| 12/15 | $9,089 | $9,545 |
| 1/16 | $8,536 | $8,915 |
| 2/16 | $8,338 | $8,756 |
| 3/16 | $8,879 | $9,305 |
| 4/16 | $9,077 | $9,533 |
| 5/16 | $9,083 | $9,477 |
| 6/16 | $8,705 | $9,055 |
| 7/16 | $8,897 | $9,434 |
| 8/16 | $8,850 | $9,462 |
| 9/16 | $8,897 | $9,544 |
| 10/16 | $8,548 | $9,234 |
| 11/16 | $8,356 | $9,033 |
| 12/16 | $8,773 | $9,506 |
| 1/17 | $8,880 | $9,704 |
| 2/17 | $9,004 | $9,819 |
| 3/17 | $9,456 | $10,214 |
| 4/17 | $9,883 | $10,574 |
| 5/17 | $10,322 | $11,087 |
| 6/17 | $10,192 | $10,966 |
| 7/17 | $10,287 | $11,293 |
| 8/17 | $10,304 | $11,300 |
| 9/17 | $10,465 | $11,673 |
| 10/17 | $10,613 | $11,728 |
| 11/17 | $10,500 | $11,754 |
| 12/17 | $10,713 | $11,931 |
| 1/18 | $11,260 | $12,576 |
| 2/18 | $10,517 | $11,836 |
| 3/18 | $10,523 | $11,694 |
| 4/18 | $10,523 | $12,018 |
| 5/18 | $10,660 | $11,623 |
| 6/18 | $10,719 | $11,545 |
| 7/18 | $11,058 | $11,929 |
| 8/18 | $10,963 | $11,596 |
| 9/18 | $10,761 | $11,638 |
| 10/18 | $9,917 | $10,749 |
| 11/18 | $9,679 | $10,649 |
| 12/18 | $9,240 | $10,157 |
| 1/19 | $9,615 | $10,827 |
| 2/19 | $10,025 | $11,190 |
| 3/19 | $10,322 | $11,259 |
| 4/19 | $10,554 | $11,661 |
| 5/19 | $10,203 | $11,022 |
| 6/19 | $10,863 | $11,763 |
| 7/19 | $10,756 | $11,535 |
| 8/19 | $10,608 | $11,245 |
| 9/19 | $10,691 | $11,551 |
| 10/19 | $11,131 | $11,921 |
| 11/19 | $11,303 | $12,100 |
| 12/19 | $11,662 | $12,572 |
| 1/20 | $11,595 | $12,256 |
| 2/20 | $10,990 | $11,119 |
| 3/20 | $9,940 | $9,513 |
| 4/20 | $10,838 | $10,077 |
| 5/20 | $11,974 | $10,536 |
| 6/20 | $12,939 | $10,965 |
| 7/20 | $13,794 | $11,386 |
| 8/20 | $14,473 | $11,855 |
| 9/20 | $14,582 | $11,460 |
| 10/20 | $14,338 | $10,813 |
| 11/20 | $16,226 | $12,653 |
| 12/20 | $17,991 | $13,249 |
| 1/21 | $17,435 | $13,057 |
| 2/21 | $18,316 | $13,376 |
| 3/21 | $18,044 | $13,789 |
| 4/21 | $19,476 | $14,416 |
| 5/21 | $20,092 | $15,017 |
| 6/21 | $20,324 | $14,812 |
| 7/21 | $21,000 | $15,086 |
| 8/21 | $21,517 | $15,314 |
| 9/21 | $20,065 | $14,583 |
| 10/21 | $21,179 | $15,239 |
| 11/21 | $20,668 | $14,453 |
| 12/21 | $20,653 | $15,408 |
| 1/22 | $17,388 | $14,703 |
| 2/22 | $15,714 | $14,288 |
| 3/22 | $15,214 | $14,273 |
| 4/22 | $13,426 | $13,452 |
| 5/22 | $13,004 | $13,553 |
| 6/22 | $11,484 | $12,205 |
| 7/22 | $12,695 | $12,809 |
| 8/22 | $11,280 | $12,011 |
| 9/22 | $9,774 | $10,966 |
| 10/22 | $10,351 | $11,752 |
| 11/22 | $11,899 | $13,086 |
| 12/22 | $11,372 | $13,088 |
| 1/23 | $12,751 | $14,223 |
| 2/23 | $12,575 | $14,135 |
| 3/23 | $13,877 | $14,470 |
| 4/23 | $14,271 | $15,071 |
| 5/23 | $13,912 | $14,187 |
| 6/23 | $14,672 | $14,866 |
| 7/23 | $14,961 | $15,322 |
| 8/23 | $13,722 | $14,714 |
| 9/23 | $12,589 | $14,129 |
| 10/23 | $11,970 | $13,602 |
| 11/23 | $13,229 | $14,944 |
| 12/23 | $14,109 | $15,691 |
| 1/24 | $14,194 | $15,672 |
| 2/24 | $15,355 | $15,916 |
| 3/24 | $15,502 | $16,511 |
| 4/24 | $14,440 | $16,199 |
| 5/24 | $15,214 | $16,983 |
| 6/24 | $14,799 | $16,602 |
| 7/24 | $15,003 | $16,958 |
| 8/24 | $15,770 | $17,627 |
| 9/24 | $16,199 | $17,695 |
| 10/24 | $15,404 | $16,652 |
Average Annual Total Returns (%)
| AATR | 1 Year | 5 Years | 10 Years |
|---|
| Class L | 28.69% | 6.71% | 4.42% |
| MSCI Europe Net Index | 22.43% | 6.91% | 5.23% |
Performance does not reflect the deduction of taxes that a shareholder would pay on Fund distributions or redemption of Fund shares. Performance assumes that all dividends and distributions, if any, were reinvested. For more recent performance information, visit www.morganstanley.com/im/shareholderreports.
THE FUND'S PAST PERFORMANCE IS NO GUARANTEE OF FUTURE RESULTS.
| Total Net Assets | $119,991,014 |
| # of Portfolio Holdings | 25 |
| Portfolio Turnover Rate | 36% |
| Total Advisory Fees Paid | $803,538 |
What did the Fund invest in?
The following tables reflect what the Fund invested in as of the report date.
Geographic Allocation (% of total investments)
| Value | Value |
|---|
| Germany | 1.5% |
| Poland | 2.3% |
| Sweden | 3.4% |
| Italy | 6.9% |
| Netherlands | 7.6% |
| Switzerland | 11.7% |
| United Kingdom | 12.5% |
| Denmark | 13.1% |
| United States | 18.6% |
| France | 22.4% |
Top Ten Holdings (% of total investments)
| DSV AS | 9.8% |
| Spotify Technology SA | 9.1% |
| Hermes International SCA | 8.2% |
| Moncler SpA | 6.9% |
| Schneider Electric SE | 5.1% |
| London Stock Exchange Group PLC | 5.0% |
| On Holding AG | 4.3% |
| Liberty Media Corp.-Liberty Formula One | 4.2% |
| Adyen NV | 4.0% |
| L'Oreal SA | 3.8% |
| Total | 60.4% |
If you wish to view additional information about the Fund, including the prospectus, statement of additional information, financial statements and holdings, please scan the QR code or visit www.morganstanley.com/im/shareholderreports. For proxy information, please visit www.morganstanley.com/im/en-us/institutional-investor/about-us/proxy-voting/vote-summary-report.desktop.html.
The Funds may deliver a single copy of certain required shareholder documents (including prospectuses, shareholder reports, and proxy materials) to investors with the same last name and the same address. Your participation will continue indefinitely unless you instruct otherwise by calling1-800-869-6397 or by contacting your financial intermediary. Your instruction will typically be effective within 30 days of receipt.
Not FDIC Insured | May Lose Value | No Bank Guarantee
Annual Shareholder Report October 31, 2024
(b) Not applicable.
Item 2. Code of Ethics
The registrant has adopted a code of ethics (the "Code of Ethics") that applies to its Principal Executive Officer and Principal Financial Officer. The Registrant undertakes to provide a copy of such code of ethics to any person upon request, without charge, by calling 1 (212) 259-1155. The Registrant has not amended the code of ethics as described in Form N-CSR during the period covered by this report. The registrant has not granted any waiver, including an implicit waiver, from a provision of the code of ethics as described in Form N-CSR during the period covered by this report.
Item 3. Audit Committee Financial Expert
The registrant's Board of Directors has determined that Jakki L. Haussler, an “independent” Trustee, is an “audit committee financial expert" serving on its audit committee. Under applicable securities laws, a person who is determined to be an audit committee financial expert will not be deemed an "expert" for any purpose, including without limitation for the purposes of Section 11 of the Securities Act of 1933, as a result of being designated or identified as an audit committee financial expert. The designation or identification of a person as an audit committee financial expert does not impose on such person any duties, obligations, or the liabilities that are greater than the duties, obligations, and liabilities imposed on such person as a member of the audit committee and Board of Directors in the absence of such designation or identification.
Item 4. Principal Accountant Fees and Services
(a) – (d)
The following table presents the aggregate fees billed to the registrant for the registrant’s fiscal years ended October 31, 2023 and October 31, 2024 by the registrant’s principal accountant, Ernst & Young LLP, for professional services rendered for the audit of the registrant’s annual financial statements and fees billed for other services rendered by Ernst & Young LLP during those periods.
2024
| | | Registrant | | | Covered Entities(1) | |
| Audit Fees | | $ | 57,417 | | | $ | N/A | |
| Non-Audit Fees | | | | | | | | |
| Audit Related Fees | | $ | — | (2) | | $ | — | (2) |
| Tax Fees | | $ | — | (3) | | $ | — | (4) |
| All Other Fees | | $ | — | | | $ | 372,395 | (5) |
| Total Non-Audit Fees | | $ | — | | | $ | 372,395 | |
| | | | | | | | | |
| Total | | $ | 57,417 | | | $ | 372,395 | |
2023
| | Registrant | | | Covered Entities(1) | |
| Audit Fees | | $ | 53,826 | | | $ | N/A | |
| Non-Audit Fees | | | | | | | | |
| Audit Related Fees | | $ | — | (2) | | $ | — | (2) |
| Tax Fees | | $ | — | (3) | | $ | — | (4) |
| All Other Fees | | $ | — | | | $ | 1,586,712 | (5) |
| Total Non-Audit Fees | | $ | — | | | $ | 1,586,712 | |
| | | | | | | | | |
| Total | | $ | 53,826 | | | $ | 1,586,712 | |
N/A – Not applicable, as not required by Item 4.
(1) Covered Entities include the Adviser (excluding sub-advisors) and any entity controlling, controlled by or under common control with the Adviser that provides ongoing services to the Registrant.
(2) Audit-Related Fees represent assurance and related services provided that are reasonably related to the performance of the audit of the financial statements of the Covered Entities' and funds advised by the Adviser or its affiliates, specifically data verification and agreed-upon procedures related to asset securitizations and agreed-upon procedures engagements.
(3) Tax Fees represent tax compliance, tax planning and tax advice services provided in connection with the preparation and review of the Registrant’s tax returns.
(4) Tax Fees represent tax compliance, tax planning and tax advice services provided in connection with the review of Covered Entities' tax returns.
(5) The Fees included under “All Other Fees” are for services provided by Ernst & Young LLP related to surprise examinations for certain investment accounts to satisfy SEC Custody Rules and consulting services related to merger integration for sister entity to the Adviser.
(e)(1) The registrant’s audit committee has adopted policies and procedures relating to the pre-approval of services provided by the registrant’s principal accountant (the “Pre-Approval Policies”). The Pre-Approval Policies establish a framework intended to assist the audit committee in the proper discharge of its pre-approval responsibilities. As a general matter, the Pre-Approval Policies (i) specify certain types of audit, audit-related, tax, and other services determined to be pre-approved by the audit committee; and (ii) delineate specific procedures governing the mechanics of the pre-approval process, including the approval and monitoring of audit and non-audit service fees. Unless a service is specifically pre-approved under the Pre-Approval Policies, it must be separately pre-approved by the Audit Committee.
The Pre-Approval Policies and the types of audit and non-audit services pre-approved therein must be reviewed and ratified by the registrant’s audit committee at least annually. The registrant’s audit committee maintains full responsibility for the appointment, compensation, and oversight of the work of the registrant’s principal accountant.
(e)(2) No services described in paragraphs (b)-(d) above were approved by the registrant’s audit committee pursuant to the “de minimis exception” set forth in Rule 2-01 (c)(7)(i)(C) of Regulation S-X.
(f) Not applicable.
(g) See table above.
(h) The registrant’s audit committee has considered whether the provision by the registrant’s principal accountant of non-audit services to the registrant’s investment adviser and any entity controlling, controlled by, or under common control with the adviser that provides ongoing services to the registrant that were not pre-approved pursuant to Rule 2-01(c)(7)(ii) of Regulation S-X is compatible with maintaining the principal accountant’s independence.
(i) Not applicable.
(j) Not applicable.
Item 5. Audit Committee of Listed Registrants
The registrant has a separately-designated standing audit committee established in accordance with Section 3(a)(58)(A) of the Exchange Act whose members are:
Nancy C. Everett, Eddie A. Grier and Jakki L. Haussler.
Item 6. Schedule of Investments
| (a) | Please see schedule of investments contained in the Financial Statements and Financial Highlights included under Item 7 of this Form N-CSR. |
Item 7. Financial Statements and Financial Highlights for Open-End Management Investment Companies

Morgan Stanley
Europe Opportunity Fund, Inc.
Annual Financial Statements and Additional Information
October 31, 2024

Morgan Stanley Europe Opportunity Fund, Inc.
Table of Contents (unaudited)
This material must be preceded or accompanied by a prospectus for the fund being offered.
There is no assurance that the Fund will achieve its investment objective. The Fund is subject to market risk, which is the possibility that market values of securities owned by the Fund will decline and, therefore, the value of the Fund's shares may be less than what you paid for them. Accordingly, you can lose money investing in this Fund. Please see the prospectus for more complete information on investment risks.
2
Morgan Stanley Europe Opportunity Fund, Inc.
Consolidated Portfolio of Investments ◼ October 31, 2024
NUMBER OF
SHARES | |
| | VALUE | |
| | | Common Stocks (94.5%) | |
| | | Denmark (13.1%) | |
| | | Air Freight & Logistics | |
| | 53,800 | | | DSV AS | | $ | 11,777,113 | | |
| | | Pharmaceuticals | |
| | 35,318 | | | Novo Nordisk AS, Class B | | | 3,961,443 | | |
| | | | | Total Denmark | | | 15,738,556 | | |
| | | France (22.4%) | |
| | | Electrical Equipment | |
| | 23,460 | | | Schneider Electric SE | | | 6,077,281 | | |
| | | Hotels, Restaurants & Leisure | |
| | 94,957 | | | Accor SA | | | 4,307,932 | | |
| | | Personal Care Products | |
| | 12,210 | | | L'Oreal SA | | | 4,580,827 | | |
| | | Textiles, Apparel & Luxury
Goods | |
| | 4,297 | | | Hermes International SCA | | | 9,766,010 | | |
| | 3,174 | | | LVMH Moet Hennessy
Louis Vuitton SE | | | 2,112,996 | | |
| | | | 11,879,006 | | |
| | | | | Total France | | | 26,845,046 | | |
| | | Germany (1.5%) | |
| | | Textiles, Apparel & Luxury
Goods | |
| | 37,852 | | | Birkenstock Holding PLC (a) | | | 1,741,192 | | |
| | | Italy (6.9%) | |
| | | Textiles, Apparel & Luxury
Goods | |
| | 149,714 | | | Moncler SpA | | | 8,317,733 | | |
| | | Netherlands (7.5%) | |
| | | Financial Services | |
| | 3,167 | | | Adyen NV (a) | | | 4,838,096 | | |
| | | Semiconductors &
Semiconductor Equipment | |
| | 6,243 | | | ASML Holding NV | | | 4,202,357 | | |
| | | | | Total Netherlands | | | 9,040,453 | | |
NUMBER OF
SHARES | |
| | VALUE | |
| | | Poland (2.3%) | |
| | | Broadline Retail | |
| | 312,998 | | | Allegro.eu SA (a) | | $ | 2,754,234 | | |
| | | Sweden (12.5%) | |
| | | Biotechnology | |
| | 32,260 | | | Vitrolife AB | | | 717,694 | | |
| | | Entertainment | |
| | 28,374 | | | Spotify Technology SA (a) | | | 10,926,827 | | |
| | | Hotels, Restaurants & Leisure | |
| | 35,663 | | | Evolution AB | | | 3,371,823 | | |
| | | | | Total Sweden | | | 15,016,344 | | |
| | | Switzerland (11.7%) | |
| | | Food Products | |
| | 24 | | | Chocoladefabriken Lindt &
Spruengli AG (Registered) | | | 2,795,262 | | |
| | | Health Care Equipment &
Supplies | |
| | 32,557 | | | Straumann Holding
AG (Registered) | | | 4,292,293 | | |
| | | Textiles, Apparel & Luxury
Goods | |
| | 11,960 | | | Cie Financiere Richemont SA,
Class A (Registered) | | | 1,741,380 | | |
| | 109,438 | | | On Holding AG, Class A (a) | | | 5,189,550 | | |
| | | | 6,930,930 | | |
| | | | | Total Switzerland | | | 14,018,485 | | |
| | | United Kingdom (12.4%) | |
| | | Capital Markets | |
| | 44,010 | | | London Stock Exchange
Group PLC | | | 5,964,933 | | |
| | | Financial Services | |
| | 283,437 | | | Wise PLC, Class A (a) | | | 2,585,270 | | |
| | | Hotels, Restaurants & Leisure | |
| | 1,657,438 | | | Deliveroo PLC (a) | | | 2,951,275 | | |
| | | Interactive Media & Services | |
| | 447,434 | | | Rightmove PLC | | | 3,407,014 | | |
| | | | | Total United Kingdom | | | 14,908,492 | | |
See Notes to Consolidated Financial Statements
3
Morgan Stanley Europe Opportunity Fund, Inc.
Consolidated Portfolio of Investments ◼ October 31, 2024 continued
NUMBER OF
SHARES | |
| | VALUE | |
| | | United States (4.2%) | | | |
| | | Entertainment | | | |
| | 63,038 | | | Liberty Media Corp.-Liberty
Formula One, Class C (a) | | $ | 5,032,954 | | |
| | | Total Common Stocks
(Cost $ 78,912,467) | | | 113,413,489 | | |
NUMBER OF
SHARES (000) | |
| |
| |
| | | Short-Term Investment (5.3%) | | | |
| | | Investment Company (5.3%) | | | |
| | 6,318 | | | Morgan Stanley Institutional
Liquidity Funds - Treasury
Securities Portfolio -
Institutional Class, 4.62%
(See Note 6)
(Cost $6,317,714) | | | 6,317,714 | | |
Total Investments
(Cost $85,230,181) (b)(c) | | | 99.8 | % | | | 119,731,203 | | |
Other Assets in Excess of
Liabilities | | | 0.2 | | | | 259,811 | | |
Net Assets | | | 100.0 | % | | $ | 119,991,014 | | |
Country assignments and aggregations are based generally on third party vendor classifications and information, and may be different from the assignments and aggregations under the policies set forth in the Fund's prospectus and/or statement of additional information relating to geographic classifications.
(a) Non-income producing security.
(b) The fair value and percentage of net assets, $90,522,966 and 75.4%, respectively, represent the securities that have been fair valued under the fair valuation policy for international investments as described in Note A-1 within the Notes to Consolidated Financial Statements.
(c) At October 31, 2024, the aggregate cost for federal income tax purposes is $86,046,223. The aggregate gross unrealized appreciation is $36,457,996 and the aggregate gross unrealized depreciation is $2,768,609, resulting in net unrealized appreciation of $33,689,387.
See Notes to Consolidated Financial Statements
4
Morgan Stanley Europe Opportunity Fund, Inc.
Consolidated Portfolio of Investments ◼ October 31, 2024 continued
Consolidated Summary of Investments
(unaudited)
INDUSTRY | | VALUE | | PERCENT OF
TOTAL
INVESTMENTS | |
Textiles, Apparel & Luxury
Goods | | $ | 28,868,861 | | | | 24.1 | % | |
Entertainment | | | 15,959,781 | | | | 13.3 | | |
Air Freight & Logistics | | | 11,777,113 | | | | 9.8 | | |
Hotels, Restaurants &
Leisure | | | 10,631,030 | | | | 8.9 | | |
Financial Services | | | 7,423,366 | | | | 6.2 | | |
Investment Company | | | 6,317,714 | | | | 5.3 | | |
Electrical Equipment | | | 6,077,281 | | | | 5.1 | | |
Capital Markets | | | 5,964,933 | | | | 5.0 | | |
Personal Care Products | | | 4,580,827 | | | | 3.8 | | |
Health Care Equipment &
Supplies | | | 4,292,293 | | | | 3.6 | | |
Semiconductors &
Semiconductor
Equipment | | | 4,202,357 | | | | 3.5 | | |
Pharmaceuticals | | | 3,961,443 | | | | 3.3 | | |
Interactive Media &
Services | | | 3,407,014 | | | | 2.9 | | |
Food Products | | | 2,795,262 | | | | 2.3 | | |
Broadline Retail | | | 2,754,234 | | | | 2.3 | | |
Biotechnology | | | 717,694 | | | | 0.6 | | |
Total Investments | | $ | 119,731,203 | | | | 100.0 | % | |
See Notes to Consolidated Financial Statements
5
Morgan Stanley Europe Opportunity Fund, Inc.
Consolidated Financial Statements
Consolidated Statement of Assets and Liabilities October 31, 2024
Assets: | |
Investments in securities, at value (cost $78,912,467) | | $ | 113,413,489 | | |
Investment in affiliate, at value (cost $6,317,714) | | | 6,317,714 | | |
Total investments in securities, at value (cost $85,230,181) | | | 119,731,203 | | |
Cash (including foreign currency valued at $85,253 with a cost of $85,909) | | | 86,299 | | |
Receivable from Distributor | | | 34,128 | | |
Receivable for: | |
Foreign withholding taxes reclaimed | | | 312,902 | | |
Dividends from affiliate | | | 21,954 | | |
Dividends receivable | | | 8,785 | | |
Capital stock sold | | | 1 | | |
Prepaid expenses and other assets | | | 52,799 | | |
Total Assets | | | 120,248,071 | | |
Liabilities: | |
Payable for: | |
Advisory fee | | | 63,781 | | |
Capital stock redeemed | | | 39,194 | | |
Directors' fees | | | 35,644 | | |
Transfer and sub transfer agency fees | | | 24,684 | | |
Distribution fee | | | 20,736 | | |
Administration fee | | | 8,456 | | |
Accrued expenses and other payables | | | 64,562 | | |
Total Liabilities | | | 257,057 | | |
Net Assets | | $ | 119,991,014 | | |
Composition of Net Assets: | |
Paid-in-Capital | | $ | 136,851,147 | | |
| Total Accumulated Loss | | | (16,860,133 | ) | |
Net Assets | | $ | 119,991,014 | | |
Class A Shares: | |
Net Assets | | $ | 85,448,316 | | |
| Shares Outstanding (500,000,000 shares authorized, $0.01 par value) | | | 3,613,761 | | |
Net Asset Value Per Share | | $ | 23.65 | | |
Maximum Offering Price Per Share,
(net asset value plus 5.54% of net asset value) | | $ | 24.96 | | |
Class L Shares: | |
Net Assets | | $ | 1,221,888 | | |
| Shares Outstanding (500,000,000 shares authorized, $0.01 par value) | | | 55,832 | | |
Net Asset Value Per Share | | $ | 21.89 | | |
Class I Shares: | |
Net Assets | | $ | 31,991,487 | | |
| Shares Outstanding (500,000,000 shares authorized, $0.01 par value) | | | 1,272,389 | | |
Net Asset Value Per Share | | $ | 25.14 | | |
Class C Shares: | |
Net Assets | | $ | 1,329,323 | | |
| Shares Outstanding (500,000,000 shares authorized, $0.01 par value) | | | 62,388 | | |
Net Asset Value Per Share | | $ | 21.31 | | |
See Notes to Consolidated Financial Statements
6
Morgan Stanley Europe Opportunity Fund, Inc.
Consolidated Financial Statements continued
Consolidated Statement of Operations For the year ended October 31, 2024
Net Investment Loss:
Income | |
Dividends (net of $175,270 foreign withholding tax) | | $ | 1,178,483 | | |
Dividends from affiliates (Note 6) | | | 267,754 | | |
Income from securities loaned - net | | | 34,300 | | |
Total Income | | | 1,480,537 | | |
Expenses | |
Advisory fee (Note 3) | | | 1,155,612 | | |
Distribution fee (Class A) (Note 4) | | | 224,565 | | |
Distribution fee (Class L) (Note 4) | | | 9,979 | | |
Distribution fee (Class C) (Note 4) | | | 16,805 | | |
Professional fees | | | 232,247 | | |
Sub transfer agency fees and expenses (Class A) | | | 70,658 | | |
Sub transfer agency fees and expenses (Class L) | | | 950 | | |
Sub transfer agency fees and expenses (Class I) | | | 36,183 | | |
Sub transfer agency fees and expenses (Class C) | | | 1,777 | | |
Administration fee (Note 3) | | | 106,263 | | |
Registration fees | | | 67,901 | | |
Shareholder reports and notices | | | 41,466 | | |
Custodian fees (Note 8) | | | 38,991 | | |
Transfer agency fees and expenses (Class A) (Note 5) | | | 25,213 | | |
Transfer agency fees and expenses (Class L) (Note 5) | | | 3,517 | | |
Transfer agency fees and expenses (Class I) (Note 5) | | | 4,645 | | |
Transfer agency fees and expenses (Class C) (Note 5) | | | 2,732 | | |
Directors' fees and expenses | | | 5,216 | | |
Interest Expenses | | | 28 | | |
Other | | | 28,279 | | |
Total Expenses | | | 2,073,027 | | |
Less: waiver of Advisory fees (Note 3) | | | (281,271 | ) | |
Less: reimbursement of transfer agency and sub transfer agency fees (Note 3) | | | (132,568 | ) | |
Less: reimbursement of class specific expenses (Class A) (Note 3) | | | (24,010 | ) | |
Less: reimbursement of class specific expenses (Class L) (Note 3) | | | (3,137 | ) | |
Less: reimbursement of class specific expenses (Class I) (Note 3) | | | (40,829 | ) | |
Less: reimbursement of class specific expenses (Class C) (Note 3) | | | (2,827 | ) | |
Less: rebate from Morgan Stanley affiliated cash sweep (Note 6) | | | (10,008 | ) | |
Net Expenses | | | 1,578,377 | | |
Net Investment Loss | | | (97,840 | ) | |
Realized and Unrealized Gain (Loss):
Realized Gain on: | |
Investments | | | 1,944,667 | | |
Foreign currency transaction | | | 26,440 | | |
Net Realized Gain | | | 1,971,107 | | |
Change in Unrealized Appreciation (Depreciation) on: | |
Investments | | | 32,491,566 | | |
Foreign currency translation | | | 10,680 | | |
Net Change in Unrealized Appreciation (Depreciation) | | | 32,502,246 | | |
Net Gain | | | 34,473,353 | | |
Net Increase in Net Assets Resulting from Operations | | $ | 34,375,513 | | |
See Notes to Consolidated Financial Statements
7
Morgan Stanley Europe Opportunity Fund, Inc.
Consolidated Financial Statements continued
Consolidated Statements of Changes in Net Assets
| | | FOR THE
YEAR ENDED
OCTOBER 31, 2024 | | FOR THE
YEAR ENDED
OCTOBER 31, 2023 | |
Increase (Decrease) in Net Assets:
Operations: | |
Net investment loss | | $ | (97,840 | ) | | $ | (114,026 | ) | |
Net realized gain (loss) | | | 1,971,107 | | | | (43,290,491 | ) | |
Net change in unrealized appreciation (depreciation) | | | 32,502,246 | | | | 62,751,942 | | |
Net Increase in Net Assets Resulting from Operations | | | 34,375,513 | | | | 19,347,425 | | |
Net decrease from capital stock transactions | | | (36,443,050 | ) | | | (19,547,913 | ) | |
Net Decrease | | | (2,067,537 | ) | | | (200,488 | ) | |
Net Assets: | |
Beginning of period | | | 122,058,551 | | | | 122,259,039 | | |
End of Period | | $ | 119,991,014 | | | $ | 122,058,551 | | |
See Notes to Consolidated Financial Statements
8
Morgan Stanley Europe Opportunity Fund, Inc.
Notes to Consolidated Financial Statements ◼ October 31, 2024
1. Organization and Accounting Policies
Morgan Stanley Europe Opportunity Fund, Inc. (the "Fund") is registered under the Investment Company Act of 1940, as amended (the "Act"), as a diversified, open-end management investment company. The Fund's investment objective is to maximize the capital appreciation of its investments. The Fund was incorporated in Maryland on February 13, 1990 and commenced operations on June 1, 1990. On July 28, 1997, the Fund converted to a multiple class share structure.
The Fund applies investment company accounting and reporting guidance Accounting Standards Codification ("ASC") Topic 946. In the preparation of these financial statements, management has evaluated subsequent events occurring after the date of the Fund's Consolidated Statement of Assets and Liabilities through the date that the financial statements were issued.
The Fund offers Class A shares, Class L shares, Class I shares and Class C shares. Class C shares will automatically convert to Class A shares eight years after the end of the calendar month in which the shares were purchased. The four classes are substantially the same except that most Class A shares are subject to a sales charge imposed at the time of purchase and some Class A shares and most Class C shares are subject to a contingent deferred sales charge imposed on shares redeemed within one year. Class L shares and Class I shares are not subject to a sales charge. Additionally, Class A shares, Class L shares and Class C shares incur distribution expenses.
The Fund suspended offering Class L shares to all investors (April 30, 2015). Class L shareholders of the Fund do not have the option of purchasing additional Class L shares. However, the existing Class L shareholders may invest through reinvestment of dividends and distributions. In addition, Class L shares of the Fund may be exchanged for Class L shares of any Morgan Stanley Multi-Class Fund, even though Class L shares are closed to investors.
The following is a summary of significant accounting policies:
The Fund may invest up to 25% of its total assets in a wholly-owned subsidiary of the Fund organized as a company under the laws of the Cayman Islands, Europe Opportunity Cayman Portfolio, Ltd. (the "Subsidiary"). The Subsidiary may invest in bitcoin indirectly through cash settled futures or indirectly through investments in pooled investment vehicles and exchange-traded products that invest in bitcoin ("bitcoin ETFs"). The Fund is the sole shareholder of the Subsidiary, and it is not currently expected that shares of the Subsidiary will be sold or offered to other investors. The consolidated portfolio of investments and consolidated financial statements include the positions and accounts of the Fund and the Subsidiary. All intercompany accounts and transactions of the Fund and the Subsidiary have been eliminated in consolidation and all accounting policies of the Subsidiary are consistent with those of the Fund. As of October 31, 2024, the Subsidiary represented $0 or 0% of the net assets of the Fund.
9
Morgan Stanley Europe Opportunity Fund, Inc.
Notes to Consolidated Financial Statements ◼ October 31, 2024 continued
Investments in the Subsidiary are expected to provide the Fund with exposure to the commodity markets within the limitations of Subchapter M of the Code and recent Internal Revenue Service ("IRS") revenue rulings, which require that a mutual fund receive no more than ten percent of its gross income from such investments in order to receive favorable tax treatment as a regulated investment company ("RIC"). Tax treatment of the income received from the Subsidiary may potentially be affected by changes in legislation, regulations or other legally binding authority, which could affect the character, timing and amount of the Fund's taxable income and distributions. If such changes occur, the Fund may need to significantly change its investment strategy and recognize unrealized gains in order to remain qualified for taxation as a RIC, which could adversely affect the Fund.
A. Valuation of Investments — (1) An equity portfolio security listed or traded on an exchange is valued at its latest reported sales price (or at the exchange official closing price if such exchange reports an official closing price), and if there were no sales on a given day and if there is no official exchange closing price for that day, the security is valued at the mean between the last reported bid and asked prices if such bid and asked prices are available on the relevant exchanges. If only bid prices are available then the latest bid price may be used. Listed equity securities not traded on the valuation date with no reported bid and asked prices available on the exchange are valued at the mean between the current bid and asked prices obtained from one or more reputable brokers/dealers. In cases where a security is traded on more than one exchange, the security is valued on the exchange designated as the primary market; (2) all other equity portfolio securities for which over-the-counter ("OTC") market quotations are readily available are valued at the latest reported sales price (or at the market official closing price if such market reports an official closing price), and if there was no trading in the security on a given day and if there is no official closing price from relevant markets for that day, the security is valued at the mean between the last reported bid and asked prices if such bid and asked prices are available on the relevant markets. An unlisted equity security that does not trade on the valuation date and for which bid and asked prices from the relevant markets are unavailable is valued at the mean between the current bid and asked prices obtained from one or more reputable brokers/dealers; (3) fixed income securities may be valued by an outside pricing service/vendor approved by the Fund's Board of Directors (the "Directors"). The pricing service/vendor may employ a pricing model that takes into account, among other things, bids, yield spreads and/or other market data and specific security characteristics. If Morgan Stanley Investment Management Inc. (the "Adviser") or Morgan Stanley Investment Management Company ("MSIM Company") (the "Sub-Adviser"), each a wholly-owned subsidiary of Morgan Stanley, determines that the price provided by the outside pricing service/vendor does not reflect the security's fair value or the pricing service/vendor or exchange is unable to provide a price, prices from brokers/dealers may also be utilized. In these circumstances, the value of the security will be the mean of bid and asked prices obtained from reputable brokers/dealers; (4) when market quotations are not readily available, as defined by Rule 2a-5 under the Act, including
10
Morgan Stanley Europe Opportunity Fund, Inc.
Notes to Consolidated Financial Statements ◼ October 31, 2024 continued
circumstances under which the Adviser or Sub-Adviser determines that the closing price, last sale price or the mean between the last reported bid and asked prices are not reflective of a security's market value, portfolio securities are valued at their fair value as determined in good faith under procedures approved by and under the general supervision of the Directors. Each business day, the Fund uses a third-party pricing service approved by the Directors to assist with the valuation of foreign equity securities. Events occurring after the close of trading on foreign exchanges may result in adjustments to the valuation of foreign securities to reflect market trading that occurs after the close of the applicable foreign markets of comparable securities or other instruments that have a strong correlation to the fair-valued securities to more accurately reflect their fair value as of the close of regular trading on the NYSE; (5) foreign exchange transactions ("spot contracts") and foreign exchange forward contracts ("forward contracts") are valued daily using an independent pricing vendor at the spot and forward rates, respectively, as of the close of the NYSE; and (6) investments in mutual funds, including the Morgan Stanley Institutional Liquidity Funds, are valued at the net asset value ("NAV") as of the close of each business day.
In connection with Rule 2a-5 of the Act, the Directors have designated the Fund's Adviser as its valuation designee. The valuation designee has responsibility for determining fair value and to make the actual calculations pursuant to the fair valuation methodologies previously approved by the Directors. Under procedures approved by the Directors, the Fund's Adviser, as valuation designee, has formed a Valuation Committee whose members are approved by the Directors. The Valuation Committee provides administration and oversight of the Fund's valuation policies and procedures, which are reviewed at least annually by the Directors. These procedures allow the Fund to utilize independent pricing services, quotations from securities and financial instrument dealers and other market sources to determine fair value.
B. Accounting for Investments — Security transactions are accounted for on the trade date (date the order to buy or sell is executed). Realized gains and losses on security transactions are determined by the identified cost method. Dividend income and other distributions are recorded on the ex-dividend date (except for certain foreign dividends which may be recorded as soon as the Fund is informed of such dividends) net of applicable withholding taxes. Non-cash dividends received in the form of stock, if any, are recognized on the ex-dividend date and recorded as non-cash dividend income at fair value. Discounts are accreted and premiums are amortized over the life of the respective securities and are included in interest income. Interest income is accrued daily as earned.
C. Multiple Class Allocations — Investment income, realized and unrealized gain (loss) and non-class specific expenses are allocated daily based upon the proportion of net assets of each class. Class specific expenses are borne by the respective share classes and include Distribution, Transfer Agency, Sub Transfer Agency and Co-Transfer Agency fees.
11
Morgan Stanley Europe Opportunity Fund, Inc.
Notes to Consolidated Financial Statements ◼ October 31, 2024 continued
D. Foreign Currency Translation and Foreign Investments — The books and records of the Fund are maintained in U.S. dollars. Foreign currency amounts are translated into U.S. dollars as follows:
— investments, other assets and liabilities at the prevailing rate of exchange on the valuation date;
— investment transactions and investment income at the prevailing rates of exchange on the dates of such transactions.
Although the net assets of the Fund are presented at the foreign exchange rates and market values at the close of the period, the Fund does not isolate that portion of the results of operations arising as a result of changes in the foreign exchange rates from the fluctuations arising from changes in the market prices of securities held at period end. Similarly, the Fund does not isolate the effect of changes in foreign exchange rates from the fluctuations arising from changes in the market prices of securities sold during the period. Accordingly, realized and unrealized foreign currency gains (losses) on investments in securities are included in the reported net realized and unrealized gains (losses) on investment transactions and balances. However, pursuant to U.S. federal income tax regulations, gains and losses from certain foreign currency transactions and the foreign currency portion of gains and losses realized on sales and maturities of foreign denominated debt securities are treated as ordinary income for U.S. federal income tax purposes.
Net realized gains (losses) on foreign currency transactions represent net foreign exchange gains (losses) from foreign currency forward exchange contracts, disposition of foreign currencies, currency gains (losses) realized between the trade and settlement dates on securities transactions, and the difference between the amount of investment income and foreign withholding taxes recorded on the Fund's books and the U.S. dollar equivalent amounts actually received or paid. The change in unrealized currency gains (losses) on foreign currency translations for the period is reflected in the Consolidated Statement of Operations.
E. Securities Lending — The Fund may lend securities to qualified financial institutions, such as broker/dealers, to earn additional income. Any increase or decrease in the fair value of the securities loaned that might occur and any interest earned or dividends declared on those securities during the term of the loan would remain in the Fund. The Fund receives cash or securities as collateral in an amount equal to or exceeding 100% of the current fair value of the loaned securities. The collateral is marked-to-market daily by State Street Bank and Trust Company ("State Street"), the securities lending agent, to ensure that a minimum of 100% collateral coverage is maintained.
Based on pre-established guidelines, the securities lending agent invests any cash collateral that is received in an affiliated money market portfolio and repurchase agreements. Securities lending income is generated from the earnings on the invested collateral and borrowing fees, less any rebates owed to
12
Morgan Stanley Europe Opportunity Fund, Inc.
Notes to Consolidated Financial Statements ◼ October 31, 2024 continued
the borrowers and compensation to the lending agent, and is recorded as "Income from securities loaned — net" in the Fund's Consolidated Statement of Operations.
The Fund has the right under the securities lending agreement to recover the securities from the borrower on demand.
At October 31, 2024, the Fund did not have any outstanding securities on loan.
F. Dividends and Distributions to Shareholders — Dividends and distributions to shareholders are recorded on the ex-dividend date. Dividends from net investment income, if any, are declared and paid annually. Net realized capital gains, if any, are distributed at least annually.
G. Use of Estimates — The preparation of financial statements in accordance with generally accepted accounting principles in the United States ("GAAP") requires management to make estimates and assumptions that affect the reported amounts and disclosures. Actual results could differ from those estimates.
H. Indemnifications — The Fund enters into contracts that contain a variety of indemnification clauses. The Fund's maximum exposure under these arrangements is unknown as this would involve future claims that may be made against the Fund that have not yet occurred.
2. Fair Valuation Measurements
Financial Accounting Standards Board ("FASB") ASC 820, "Fair Value Measurement" ("ASC 820"), defines fair value as the price that would be received to sell an asset or paid to transfer a liability in an orderly transaction between market participants at the measurement date. ASC 820 establishes a three-tier hierarchy to distinguish between (1) inputs that reflect the assumptions market participants would use in valuing an asset or liability developed based on market data obtained from sources independent of the reporting entity (observable inputs); and (2) inputs that reflect the reporting entity's own assumptions about the assumptions market participants would use in valuing an asset or liability developed based on the best information available in the circumstances (unobservable inputs) and to establish classification of fair value measurements for disclosure purposes. Various inputs are used in determining the value of the Fund's investments. The inputs are summarized in the three broad levels listed below:
• Level 1 — unadjusted quoted prices in active markets for identical investments
• Level 2 — other significant observable inputs (including quoted prices for similar investments, interest rates, prepayment speeds, credit risk, etc.)
• Level 3 — significant unobservable inputs including the Fund's own assumptions in determining the fair value of investments. Factors considered in making this determination
13
Morgan Stanley Europe Opportunity Fund, Inc.
Notes to Consolidated Financial Statements ◼ October 31, 2024 continued
may include, but are not limited to, information obtained by contacting the issuer, analysts, or the appropriate stock exchange (for exchange-traded securities), analysis of the issuer's financial statements or other available documents and, if necessary, available information concerning other securities in similar circumstances.
The inputs or methodology used for valuing securities are not necessarily an indication of the risk associated with investing in those securities and the determination of the significance of a particular input to the fair value measurement in its entirety requires judgment and considers factors specific to each security.
The following is a summary of the inputs used to value the Fund's investments as of October 31, 2024:
INVESTMENT TYPE | | LEVEL 1
UNADJUSTED
QUOTED
PRICES | | LEVEL 2
OTHER
SIGNIFICANT
OBSERVABLE
INPUTS | | LEVEL 3
SIGNIFICANT
UNOBSERVABLE
INPUTS | | TOTAL | |
Assets: | |
Common Stocks | |
Air Freight & Logistics | | $ | — | | | $ | 11,777,113 | | | $ | — | | | $ | 11,777,113 | | |
Biotechnology | | | — | | | | 717,694 | | | | — | | | | 717,694 | | |
Broadline Retail | | | — | | | | 2,754,234 | | | | — | | | | 2,754,234 | | |
Capital Markets | | | — | | | | 5,964,933 | | | | — | | | | 5,964,933 | | |
Electrical Equipment | | | — | | | | 6,077,281 | | | | — | | | | 6,077,281 | | |
Entertainment | | | 15,959,781 | | | | — | | | | — | | | | 15,959,781 | | |
Financial Services | | | — | | | | 7,423,366 | | | | — | | | | 7,423,366 | | |
Food Products | | | — | | | | 2,795,262 | | | | — | | | | 2,795,262 | | |
Health Care Equipment & Supplies | | | — | | | | 4,292,293 | | | | — | | | | 4,292,293 | | |
Hotels, Restaurants & Leisure | | | — | | | | 10,631,030 | | | | — | | | | 10,631,030 | | |
Interactive Media & Services | | | — | | | | 3,407,014 | | | | — | | | | 3,407,014 | | |
Personal Care Products | | | — | | | | 4,580,827 | | | | — | | | | 4,580,827 | | |
Pharmaceuticals | | | — | | | | 3,961,443 | | | | — | | | | 3,961,443 | | |
Semiconductors & Semiconductor
Equipment | | | — | | | | 4,202,357 | | | | — | | | | 4,202,357 | | |
Textiles, Apparel & Luxury Goods | | | 6,930,742 | | | | 21,938,119 | | | | — | | | | 28,868,861 | | |
Total Common Stocks | | | 22,890,523 | | | | 90,522,966 | | | | — | | | | 113,413,489 | | |
Short-Term Investment | |
Investment Company | | | 6,317,714 | | | | — | | | | — | | | | 6,317,714 | | |
Total Assets | | $ | 29,208,237 | | | $ | 90,522,966 | | | $ | — | | | $ | 119,731,203 | | |
Transfers between investment levels may occur as the markets fluctuate and/or the availability of data used in an investment's valuation changes.
14
Morgan Stanley Europe Opportunity Fund, Inc.
Notes to Consolidated Financial Statements ◼ October 31, 2024 continued
3. Advisory/Administration and Sub-Advisory Agreements
Pursuant to an Investment Advisory Agreement with the Adviser, the Fund pays an advisory fee, accrued daily and paid monthly, by applying the following annual rates to the net assets of the Fund determined as of the close of each business day: 0.87% to the portion of the daily net assets not exceeding $500 million; 0.82% to the portion of the daily net assets exceeding $500 million but not exceeding $2 billion; 0.77% to the portion of the daily net assets exceeding $2 billion but not exceeding $3 billion; and 0.745% to the portion of the daily net assets exceeding $3 billion. For the year ended October 31, 2024, the advisory fee rate (net of waiver/rebate) was equivalent to an annual effective rate of 0.65% of the Fund's average daily net assets.
The Adviser also serves as the Administrator to the Fund and provides administrative services pursuant to an Administration Agreement for an annual fee, accrued daily and paid monthly, of 0.08% of the Fund's average daily net assets.
Under a Sub-Administration Agreement between the Administrator and State Street, State Street provides certain administrative services to the Fund. For such services, the Administrator pays State Street a portion of the fee the Administrator receives from the Fund.
Under a Sub-Advisory Agreement between the Adviser and the Sub-Adviser, the Sub-Adviser provides the Fund with advisory services, subject to the overall supervision of the Adviser and the Fund's Officers and Directors. The Adviser pays the Sub-Adviser on a monthly basis a portion of the net advisory fees the Adviser receives from the Fund.
The Adviser/Administrator has agreed to reduce its advisory fee, its administration fee and/or reimburse the Fund so that total annual operating expenses, excluding certain investment related expenses, taxes, interest and other extraordinary expenses (including litigation), will not exceed 1.38% for Class A, 1.90% for Class L, 1.05% for Class I and 2.15% for Class C. The fee waivers and/or expense reimbursements will continue for at least one year from the date of the Fund's prospectus or until such time that the Directors act to discontinue all or a portion of such waivers and/or expense reimbursements when they deem such action is appropriate. For the year ended October 31, 2024, $281,271 of advisory fees were waived and $70,803 of other expenses were reimbursed by the Adviser pursuant to this arrangement.
The Adviser provides investment advisory services to the Subsidiary pursuant to the Subsidiary Investment Management Agreement (the "Agreement"). Under the Agreement, the Subsidiary will pay the Adviser at the end of each fiscal quarter, calculated by applying a quarterly rate, based on the annual rate of 0.05%, to the average daily net assets of the Subsidiary.
The Adviser has agreed to waive its advisory fees by the amount of advisory fees it receives from the Subsidiary.
15
Morgan Stanley Europe Opportunity Fund, Inc.
Notes to Consolidated Financial Statements ◼ October 31, 2024 continued
The Adviser agreed to reimburse the Fund for prior years overpayment of transfer agency and sub transfer agency fees. This was reflected as "reimbursement of transfer agency and sub transfer agency fees" in the Consolidated Statement of Operations.
4. Plan of Distribution
Shares of the Fund are distributed by Morgan Stanley Distribution, Inc. (the "Distributor"), an affiliate of the Adviser/Administrator and Sub-Adviser. The Fund has adopted a Plan of Distribution (the "Plan") pursuant to Rule 12b-1 under the Act. The Plan provides that the Fund will pay the Distributor a fee which is accrued daily and paid monthly at the following annual rates: (i) Class A — up to 0.25% of the average daily net assets of Class A shares; (ii) Class L — up to 0.75% of the average daily net assets of Class L shares; and (iii) Class C — up to 1.00% of the average daily net assets of Class C shares.
In the case of Class A shares, Class L shares and Class C shares, expenses incurred pursuant to the Plan in any calendar year in excess of 0.25%, 0.75% and 1.00% of the average daily net assets of Class A shares, Class L shares and Class C shares, respectively, will not be reimbursed by the Fund through payments in any subsequent year, except that expenses representing a gross sales commission credited to Financial Intermediaries at the time of sale may be reimbursed in the subsequent calendar year. For the year ended October 31, 2024, the distribution fee was accrued for Class A shares, Class L shares and Class C shares at the annual rate of 0.25%, 0.75% and 1.00%, respectively.
The Distributor has informed the Fund that for the year ended October 31, 2024, it received contingent deferred sales charges from certain redemptions of the Fund's Class A shares and Class C shares of $624 and $228, respectively, and received $5,229 in front-end sales charges from sales of the Fund's Class A shares. The respective shareholders pay such charges, which are not an expense of the Fund.
5. Dividend Disbursing and Transfer/Co-Transfer Agent
The Fund's dividend disbursing and transfer agent is SS&C Global Investor & Distribution Solutions, Inc. ("SS&C GIDS"). Pursuant to a Transfer Agency Agreement, the Fund pays SS&C GIDS a fee based on the number of classes, accounts and transactions relating to the Fund.
Eaton Vance Management ("EVM"), an affiliate of Morgan Stanley, provides co-transfer agency and related services to the Fund pursuant to a Co-Transfer Agency Services Agreement. For the year ended October 31, 2024, co-transfer agency fees and expenses incurred to EVM, included in "Transfer agent fees and expenses" in the Consolidated Statement of Operations, amounted to $3,831.
16
Morgan Stanley Europe Opportunity Fund, Inc.
Notes to Consolidated Financial Statements ◼ October 31, 2024 continued
6. Security Transactions and Transactions with Affiliates
The cost of purchases and proceeds from sales of investment securities, excluding short-term investments, for the year ended October 31, 2024, aggregated $45,596,428 and $83,821,123, respectively.
The Fund invests in the Institutional Class of the Morgan Stanley Institutional Liquidity Funds — Treasury Securities Portfolio (the "Liquidity Fund"), an open-end management investment company managed by the Adviser, both directly and as a portion of the securities held as collateral on loaned securities. Advisory fees paid by the Fund are reduced by an amount equal to its pro-rata share of the advisory and administration fees paid by the Fund due to its investment in the Liquidity Fund. For the year ended October 31, 2024, advisory fees paid were reduced by $10,008 relating to the Fund's investment in the Liquidity Fund.
A summary of the Fund's transactions in shares of affiliated investments during the year ended October 31, 2024 is as follows:
AFFILIATED
INVESTMENT
COMPANY | | VALUE
OCTOBER 31,
2023 | | PURCHASES
AT COST | | PROCEEDS
FROM SALES | | DIVIDEND
INCOME | | REALIZED
GAIN (LOSS) | | CHANGE IN
UNREALIZED
APPRECIATION
(DEPRECIATION) | | VALUE
OCTOBER 31,
2024 | |
Liquidity Fund | | $ | 6,640,356 | | | $ | 61,823,838 | | | $ | 62,146,480 | | | $ | 267,754 | | | $ | — | | | $ | — | | | $ | 6,317,714 | | |
The Fund has an unfunded noncontributory defined benefit pension plan covering certain independent Directors of the Fund who will have served as independent Directors for at least five years at the time of retirement. Benefits under this plan are based on factors which include years of service and compensation. The Directors voted to close the plan to new participants and eliminate the future benefits growth due to increases to compensation after July 31, 2003. Aggregate pension costs for the year ended October 31, 2024, included in "Directors' fees and expenses" in the Consolidated Statement of Operations amounted to $1,735. At October 31, 2024, the Fund had an accrued pension liability of $35,644, which is reflected as "Directors' fees" in the Consolidated Statement of Assets and Liabilities.
The Fund is permitted to purchase and sell securities ("cross-trade") from and to other Morgan Stanley funds as well as other funds and client accounts for which the Adviser or an affiliate of the Adviser serves as investment adviser, pursuant to procedures approved by the Directors in compliance with Rule 17a-7 under the Act (the "Rule"). Each cross-trade is executed at the current market price in compliance with provisions of the Rule. For the year ended October 31, 2024, the Fund did not engage in any cross-trade transactions.
17
Morgan Stanley Europe Opportunity Fund, Inc.
Notes to Consolidated Financial Statements ◼ October 31, 2024 continued
Each Director receives an annual retainer fee for serving as a Director of the Morgan Stanley Funds. The aggregate compensation paid to each Director is paid by the Morgan Stanley Funds, and is allocated on a pro rata basis among each of the operational funds of the Morgan Stanley Funds based on the relative net assets of each of the funds. The Fund also reimburses such Directors for travel and other out-of-pocket expenses incurred by them in connection with attending such meetings.
The Fund has an unfunded Deferred Compensation Plan (the "Compensation Plan"), which allows each independent Director to defer payment of all, or a portion, of the fees he or she receives for serving on the Board of Directors. Each eligible Director generally may elect to have the deferred amounts credited with a return equal to the total return on one or more of the Morgan Stanley funds that are offered as investment options under the Compensation Plan. Appreciation/depreciation and distributions received from these investments are recorded with an offsetting increase/decrease in the deferred compensation obligation and do not affect the NAV of the Fund.
7. Market Risk and Risks Relating to Certain Financial Instruments
At October 31, 2024, investments in securities of issuers in the France, Denmark and Sweden represented 22.4%, 13.1% and 12.5%, respectively, of the Fund's net assets. These investments, as well as other non-U.S. investments, which involve risks and considerations not present with respect to U.S. securities, may be affected by economic or political developments in these countries.
The Fund may lend securities to qualified financial institutions, such as broker/dealers, to earn additional income. Risks in securities lending transactions are that a borrower may not provide additional collateral when required or return the securities when due, and that the value of the short-term investments will be less than the amount of cash collateral plus any rebate that is required to be returned to the borrower.
Foreign security and currency transactions may involve certain considerations and risks not typically associated with those of U.S. dollar denominated transactions as a result of, among other factors, fluctuations of exchange rates in relation to the U.S. dollar, the possibility of lower levels of governmental supervision and regulation of foreign securities markets and the possibility of political or economic instability.
The Fund may have exposure to bitcoin indirectly through cash settled futures bitcoin exposure or indirectly through bitcoin ETFs. Cryptocurrencies (also referred to as "virtual currencies" and "digital currencies") are digital assets designed to act as a medium of exchange. Although cryptocurrency is an emerging asset class, there are thousands of cryptocurrencies, the most well-known of which is bitcoin. Cryptocurrency facilitates decentralized, peer-to-peer financial exchange and value storage that is used like money, without the oversight of a central authority or banks. The value of cryptocurrency is not
18
Morgan Stanley Europe Opportunity Fund, Inc.
Notes to Consolidated Financial Statements ◼ October 31, 2024 continued
backed by any government, corporation, or other identified body. Similar to fiat currencies (i.e., a currency that is backed by a central bank or a national, supra-national or quasi-national organization), cryptocurrencies are susceptible to theft, loss and destruction. For example, the bitcoin held by bitcoin ETFs (and the Fund's indirect exposure to such bitcoin) is also susceptible to these risks. The value of the bitcoin ETFs investments in cryptocurrency is subject to fluctuations in the value of the cryptocurrency, which have been and may in the future be highly volatile and subject to sharp declines. The value of cryptocurrencies is determined by the supply and demand for cryptocurrency in the global market for the trading of cryptocurrency, which consists primarily of transactions on electronic exchanges. The price of bitcoin could drop precipitously (including to zero) for a variety of reasons, including, but not limited to, regulatory changes, a crisis of confidence, flaw or operational issue in the bitcoin network or a change in user preference to competing cryptocurrencies. The bitcoin ETFs exposure could result in substantial losses to the Fund.
The value of an investment in the Fund is based on the values of the Fund's investments, which change due to economic and other events that affect markets generally, as well as those that affect particular regions, countries, industries, companies or governments. The risks associated with these developments may be magnified if certain social, political, economic and other conditions and events adversely interrupt the global economy and financial markets. Securities in the Fund's portfolio may under perform due to inflation (or expectations for inflation), interest rates, global demand for particular products or resources, natural disasters and extreme weather events, health emergencies (such as epidemics and pandemics), terrorism, regulatory events and governmental or quasi-governmental actions. The occurrence of global events similar to those in recent years, such as terrorist attacks around the world, natural disasters, health emergencies, social and political (including geopolitical) discord and tensions or debt crises and downgrades, among others, may result in market volatility and may have long term effects on both the U.S. and global financial markets. The occurrence of such events may be sudden and unexpected, and it is difficult to predict when similar events affecting the U.S. or global financial markets may occur, the effects that such events may have and the duration of those effects (which may last for extended periods). Any such event(s) could have a significant adverse impact on the value, liquidity and risk profile of the Fund's portfolio, as well as its ability to sell securities and/or meet redemptions. Any such event(s) or similar types of factors and developments may also adversely affect the financial performance of the Fund's investments (and, in turn, the Fund's investment results) and/or negatively impact broad segments of businesses and populations and have a significant and rapid negative impact on the performance of the Fund's investments, and exacerbate preexisting risks to the Fund.
19
Morgan Stanley Europe Opportunity Fund, Inc.
Notes to Consolidated Financial Statements ◼ October 31, 2024 continued
8. Custodian Fees
State Street (the "Custodian") also serves as Custodian for the Fund in accordance with a Custodian Agreement. The Custodian holds cash, securities and other assets of the Fund as required by the Act. Custody fees are payable monthly based on assets held in custody, investment purchases and sales activity and account maintenance fees, plus reimbursement for certain out-of-pocket expenses.
9. Capital Stock
Transactions in capital stock, including direct exchanges pursuant to share class conversions for all periods presented, were as follows:
| | | FOR THE YEAR
ENDED
OCTOBER 31, 2024 | | FOR THE YEAR
ENDED
OCTOBER 31, 2023 | |
| | | SHARES | | AMOUNT | | SHARES | | AMOUNT | |
CLASS A SHARES | |
Sold | | | 22,373 | | | $ | 497,787 | | | | 157,457 | | | $ | 3,273,668 | | |
Redeemed | | | (813,780 | ) | | | (18,373,086 | ) | | | (778,850 | ) | | | (15,391,851 | ) | |
Net decrease — Class A | | | (791,407 | ) | | | (17,875,299 | ) | | | (621,393 | ) | | | (12,118,183 | ) | |
CLASS L SHARES | |
Redeemed | | | (9,830 | ) | | | (211,682 | ) | | | (13,180 | ) | | | (248,819 | ) | |
CLASS I SHARES | |
Sold | | | 547,036 | | | | 13,091,499 | | | | 1,103,919 | | | | 23,376,292 | | |
Redeemed | | | (1,267,926 | ) | | | (30,583,695 | ) | | | (1,514,219 | ) | | | (29,811,192 | ) | |
Net decrease — Class I | | | (720,890 | ) | | | (17,492,196 | ) | | | (410,300 | ) | | | (6,434,900 | ) | |
CLASS C SHARES | |
Sold | | | 2,836 | | | | 56,719 | | | | 25,533 | | | | 476,755 | | |
Redeemed | | | (45,425 | ) | | | (920,592 | ) | | | (67,398 | ) | | | (1,222,766 | ) | |
Net decrease — Class C | | | (42,589 | ) | | | (863,873 | ) | | | (41,865 | ) | | | (746,011 | ) | |
Net decrease in Fund | | | (1,564,716 | ) | | $ | (36,443,050 | ) | | | (1,086,738 | ) | | $ | (19,547,913 | ) | |
10. Federal Income Tax Status
It is the Fund's intention to continue to qualify as a RIC and distribute all of its taxable and tax-exempt income. Accordingly, no provision for federal income taxes is required in the consolidated financial statements.
The Fund may be subject to taxes imposed by countries in which it invests. Such taxes are generally based on income and/or capital gains earned or repatriated. Taxes are accrued based on net investment income, net realized gains and net unrealized appreciation as such income and/or gains are earned. Taxes may also be based on transactions in foreign currency and are accrued based on the value of investments denominated in such currency.
20
Morgan Stanley Europe Opportunity Fund, Inc.
Notes to Consolidated Financial Statements ◼ October 31, 2024 continued
FASB ASC 740-10, "Income Taxes — Overall", sets forth a minimum threshold for consolidated financial statement recognition of the benefit of a tax position taken or expected to be taken in a tax return. Management has concluded there are no significant uncertain tax positions that would require recognition in the consolidated financial statements. If applicable, the Fund recognizes interest accrued related to unrecognized tax benefits in "Interest Expense" and penalties in "Other Expenses" in the Consolidated Statement of Operations. The Fund files tax returns with the U.S. Internal Revenue Service, New York and various states. Generally, each of the tax years in the four-year period ended October 31, 2024 remains subject to examination by taxing authorities.
The tax character of distributions paid may differ from the character of distributions shown for GAAP purposes due to short-term capital gains being treated as ordinary income for tax purposes. There were no distributions paid during fiscal years 2024 and 2023.
The amount and character of income and gains to be distributed are determined in accordance with income tax regulations which may differ from GAAP. These book/tax differences are either considered temporary or permanent in nature.
Temporary differences are attributable to differing book and tax treatments for the timing of the recognition of gains (losses) on certain investment transactions and the timing of the deductibility of certain expenses.
The Fund had no permanent differences causing reclassifications among the components of net assets for the year ended October 31, 2024.
At October 31, 2024, the Fund had no distributable earnings on a tax basis.
At October 31, 2024, the Fund had available for federal income tax purposes unused short-term and long-term capital losses of $12,749,736 and $37,683,568, respectively, that do not have an expiration date.
To the extent that capital loss carryforwards are used to offset any future capital gains realized, no capital gains tax liability will be incurred by the Fund for gains realized and not distributed. To the extent that capital gains are offset, such gains will not be distributed to the shareholders.
Qualified late year losses are capital losses and specified ordinary losses, including currency losses, incurred after October 31 but within the taxable year that, if elected, are deemed to arise on the first day of the Fund's next taxable year. For the year ended October 31, 2024, the Fund intends to defer to November 1, 2024 for U.S. federal income tax purposes the following losses:
QUALIFIED LATE
YEAR ORDINARY
LOSSES | | POST-OCTOBER
CAPITAL LOSSES | |
| $ | 71,784 | | | $ | — | | |
21
Morgan Stanley Europe Opportunity Fund, Inc.
Notes to Consolidated Financial Statements ◼ October 31, 2024 continued
11. Credit Facility
The Fund and other Morgan Stanley funds participated in a $500,000,000 committed, unsecured revolving line of credit facility (the "Facility") with State Street. This Facility is to be used for temporary emergency purposes or funding of shareholder redemption requests. The interest rate for any funds drawn will be based on the federal funds rate or overnight bank funding rate plus a spread. The Facility also has a commitment fee of 0.25% per annum based on the unused portion of the Facility, which is allocated among participating funds based on relative net assets. During the year ended October 31, 2024, the Fund did not have any borrowings under the Facility.
12. Other
At October 31, 2024, the Fund had record owners of 10% or greater. Investment activities of these shareholders could have a material impact on the Fund. The aggregate percentage of such owners was 73.4%.
22
Morgan Stanley Europe Opportunity Fund, Inc.
Consolidated Financial Highlights
Selected ratios and per share data for a share of capital stock outstanding throughout each period:
| | | FOR THE YEAR ENDED OCTOBER 31, | |
| | | 2024 | | 2023 | | 2022 | | 2021 | | 2020(1) | |
Class A Shares | |
Selected Per Share Data: | |
Net asset value, beginning of period | | $ | 18.29 | | | $ | 15.73 | | | $ | 33.87 | | | $ | 24.65 | | | $ | 19.65 | | |
Income (loss) from investment operations: | |
| Net investment loss(2) | | | (0.04 | ) | | | (0.03 | ) | | | (0.14 | ) | | | (0.29 | ) | | | (0.08 | ) | |
Net realized and unrealized gain (loss) | | | 5.40 | | | | 2.59 | | | | (16.21 | ) | | | 11.77 | | | | 5.72 | | |
Total income (loss) from investment operations | | | 5.36 | | | | 2.56 | | | | (16.35 | ) | | | 11.48 | | | | 5.64 | | |
Less distributions from: | |
Net investment income | | | — | | | | — | | | | — | | | | — | | | | (0.12 | ) | |
Net realized gain | | | — | | | | — | | | | (1.79 | ) | | | (2.26 | ) | | | (0.52 | ) | |
Total distributions | | | — | | | | — | | | | (1.79 | ) | | | (2.26 | ) | | | (0.64 | ) | |
Net asset value, end of period | | $ | 23.65 | | | $ | 18.29 | | | $ | 15.73 | | | $ | 33.87 | | | $ | 24.65 | | |
| Total Return(3) | | | 29.31 | %(4) | | | 16.27 | % | | | (50.86 | )% | | | 48.43 | % | | | 29.48 | % | |
Ratios to Average Net Assets: | |
Net expenses | | | 1.28 | %(5)(6)(7) | | | 1.37 | %(6)(7) | | | 1.38 | %(6)(7) | | | 1.38 | %(6)(7) | | | 1.37 | %(6)(7) | |
Net expenses excluding interest expenses | | | 1.28 | %(5)(6)(7) | | | N/A | | | | 1.38 | %(6)(7) | | | N/A | | | | N/A | | |
Net investment loss | | | (0.17 | )%(5)(6)(7) | | | (0.17 | )%(6)(7) | | | (0.61 | )%(6)(7) | | | (0.92 | )%(6)(7) | | | (0.38 | )%(6)(7) | |
Rebate from Morgan Stanley affiliate | | | 0.01 | % | | | 0.01 | % | | | 0.00 | %(8) | | | 0.00 | %(8) | | | 0.01 | % | |
Supplemental Data: | |
Net assets, end of period, in thousands | | $ | 85,448 | | | $ | 80,562 | | | $ | 79,046 | | | $ | 194,355 | | | $ | 116,141 | | |
Portfolio turnover rate | | | 36 | % | | | 29 | % | | | 17 | % | | | 22 | % | | | 85 | % | |
(1) Not consolidated.
(2) The per share amounts were computed using an average number of shares outstanding during the period.
(3) Does not reflect the deduction of sales charge. Calculated based on the net asset value as of the last business day of the period.
(4) Refer to Note 3 in the Notes to Consolidated Financial Statements for discussion of prior period transfer agency and sub transfer agency fees that were reimbursed in the current period. The amount of the reimbursement was immaterial to the total return of Class A shares.
(5) If the Fund had not received the reimbursement of transfer agency and sub transfer agency fees from the Adviser, the net expenses and net investment loss ratios, would have been as follows for Class A shares:
| PERIOD ENDED | | EXPENSE
RATIO | | NET INVESTMENT
LOSS RATIO | |
October 31, 2024 | | | 1.37 | % | | | (0.26 | )% | |
(6) If the Fund had borne all of its expenses that were waived by the Adviser/Administrator, the annualized expense and net investment loss ratios would have been as follows:
| PERIOD ENDED | | EXPENSE
RATIO | | NET INVESTMENT
LOSS RATIO | |
October 31, 2024 | | | 1.62 | % | | | (0.51 | )% | |
October 31, 2023 | | | 1.59 | | | | (0.39 | ) | |
October 31, 2022 | | | 1.53 | | | | (0.76 | ) | |
October 31, 2021 | | | 1.42 | | | | (0.96 | ) | |
October 31, 2020 | | | 1.61 | | | | (0.62 | ) | |
(7) The ratios reflect the rebate of certain Fund expenses in connection with investments in a Morgan Stanley affiliate during the period. The effect of the rebate on the ratios is disclosed in the above table as "Rebate from Morgan Stanley affiliate."
(8) Amount is less than 0.005%.
See Notes to Consolidated Financial Statements
23
Morgan Stanley Europe Opportunity Fund, Inc.
Consolidated Financial Highlights continued
| | | FOR THE YEAR ENDED OCTOBER 31, | |
| | | 2024 | | 2023 | | 2022 | | 2021 | | 2020(1) | |
Class L Shares | |
Selected Per Share Data: | |
Net asset value, beginning of period | | $ | 17.02 | | | $ | 14.71 | | | $ | 31.96 | | | $ | 23.47 | | | $ | 18.72 | | |
Income (loss) from investment operations: | |
| Net investment loss(2) | | | (0.14 | ) | | | (0.13 | ) | | | (0.24 | ) | | | (0.42 | ) | | | (0.18 | ) | |
Net realized and unrealized gain (loss) | | | 5.01 | | | | 2.44 | | | | (15.22 | ) | | | 11.17 | | | | 5.45 | | |
Total income (loss) from investment operations | | | 4.87 | | | | 2.31 | | | | (15.46 | ) | | | 10.75 | | | | 5.27 | | |
Less distributions from: | |
Net investment income | | | — | | | | — | | | | — | | | | — | | | | (0.00 | )(3) | |
Net realized gain | | | — | | | | — | | | | (1.79 | ) | | | (2.26 | ) | | | (0.52 | ) | |
Total distributions | | | — | | | | — | | | | (1.79 | ) | | | (2.26 | ) | | | (0.52 | ) | |
Net asset value, end of period | | $ | 21.89 | | | $ | 17.02 | | | $ | 14.71 | | | $ | 31.96 | | | $ | 23.47 | | |
| Total Return(4) | | | 28.69 | %(5) | | | 15.64 | % | | | (51.12 | )% | | | 47.71 | % | | | 28.81 | % | |
Ratios to Average Net Assets: | |
| Net expenses | | | 1.80 | %(6)(7)(8) | | | 1.89 | %(7)(8) | | | 1.90 | %(7)(8) | | | 1.90 | %(7)(8) | | | 1.89 | %(7)(8) | |
| Net expenses excluding interest expenses | | | 1.80 | %(6)(7)(8) | | | N/A | | | | 1.90 | %(7)(8) | | | N/A | | | | N/A | | |
Net investment loss | | | (0.69 | )%(6)(7)(8) | | | (0.69 | )%(7)(8) | | | (1.11 | )%(7)(8) | | | (1.44 | )%(7)(8) | | | (0.88 | )%(7)(8) | |
Rebate from Morgan Stanley affiliate | | | 0.01 | % | | | 0.01 | % | | | 0.00 | %(9) | | | 0.00 | %(9) | | | 0.01 | % | |
Supplemental Data: | |
Net assets, end of period, in thousands | | $ | 1,222 | | | $ | 1,117 | | | $ | 1,160 | | | $ | 2,777 | | | $ | 2,115 | | |
Portfolio turnover rate | | | 36 | % | | | 29 | % | | | 17 | % | | | 22 | % | | | 85 | % | |
(1) Not consolidated.
(2) The per share amounts were computed using an average number of shares outstanding during the period.
(3) Amount is less than $0.005 per share.
(4) Calculated based on the net asset value as of the last business day of the period.
(5) Refer to Note 3 in the Notes to Consolidated Financial Statements for discussion of prior period transfer agency and sub transfer agency fees that were reimbursed in the current period. The amount of the reimbursement was immaterial to the total return of Class L shares.
| PERIOD ENDED | | EXPENSE
RATIO | | NET INVESTMENT
LOSS RATIO | |
October 31, 2024 | | | 1.89 | % | | | (0.78 | )% | |
(6) If the Fund had not received the reimbursement of transfer agency and sub transfer agency fees from the Adviser, the net expenses and net investment loss ratios, would have been as follows for Class L shares:
| PERIOD ENDED | | EXPENSE
RATIO | | NET INVESTMENT
LOSS RATIO | |
October 31, 2024 | | | 2.35 | % | | | (1.24 | )% | |
October 31, 2023 | | | 2.34 | | | | (1.14 | ) | |
October 31, 2022 | | | 2.15 | | | | (1.36 | ) | |
October 31, 2021 | | | 1.99 | | | | (1.53 | ) | |
October 31, 2020 | | | 2.24 | | | | (1.23 | ) | |
(7) If the Fund had borne all of its expenses that were waived by the Adviser/Administrator, the annualized expense and net investment loss ratios would have been as follows:
(8) The ratios reflect the rebate of certain Fund expenses in connection with investments in a Morgan Stanley affiliate during the period. The effect of the rebate on the ratios is disclosed in the above table as "Rebate from Morgan Stanley affiliate."
(9) Amount is less than 0.005%.
See Notes to Consolidated Financial Statements
24
Morgan Stanley Europe Opportunity Fund, Inc.
Consolidated Financial Highlights continued
| | | FOR THE YEAR ENDED OCTOBER 31, | |
| | | 2024 | | 2023 | | 2022 | | 2021 | | 2020(1) | |
Class I Shares | |
Selected Per Share Data: | |
Net asset value, beginning of period | | $ | 19.38 | | | $ | 16.62 | | | $ | 35.57 | | | $ | 25.71 | | | $ | 20.45 | | |
Income (loss) from investment operations: | |
| Net investment income (loss)(2) | | | 0.04 | | | | 0.03 | | | | (0.09 | ) | | | (0.21 | ) | | | (0.07 | ) | |
Net realized and unrealized gain (loss) | | | 5.72 | | | | 2.73 | | | | (17.07 | ) | | | 12.33 | | | | 6.01 | | |
Total income (loss) from investment operations | | | 5.76 | | | | 2.76 | | | | (17.16 | ) | | | 12.12 | | | | 5.94 | | |
Less distributions from: | |
Net investment income | | | — | | | | — | | | | — | | | | — | | | | (0.16 | ) | |
Net realized gain | | | — | | | | — | | | | (1.79 | ) | | | (2.26 | ) | | | (0.52 | ) | |
Total distributions | | | — | | | | — | | | | (1.79 | ) | | | (2.26 | ) | | | (0.68 | ) | |
Net asset value, end of period | | $ | 25.14 | | | $ | 19.38 | | | $ | 16.62 | | | $ | 35.57 | | | $ | 25.71 | | |
| Total Return(3) | | | 29.72 | %(4) | | | 16.61 | % | | | (50.70 | )% | | | 48.95 | % | | | 29.85 | % | |
Ratios to Average Net Assets: | |
| Net expenses | | | 0.94 | %(5)(6)(7) | | | 1.04 | %(6)(7) | | | 1.05 | %(6)(7) | | | 1.05 | %(6)(7) | | | 1.04 | %(6)(7) | |
| Net expenses excluding interest expenses | | | 0.94 | %(5)(6)(7) | | | N/A | | | | 1.05 | %(6)(7) | | | N/A | | | | N/A | | |
| Net investment income (loss) | | | 0.17 | %(5)(6)(7) | | | 0.16 | %(6)(7) | | | (0.36 | )%(6)(7) | | | (0.62 | )%(6)(7) | | | (0.29 | )%(6)(7) | |
Rebate from Morgan Stanley affiliate | | | 0.01 | % | | | 0.01 | % | | | 0.00 | %(8) | | | 0.00 | %(8) | | | 0.01 | % | |
Supplemental Data: | |
Net assets, end of period, in thousands | | $ | 31,991 | | | $ | 38,636 | | | $ | 39,940 | | | $ | 192,604 | | | $ | 34,053 | | |
Portfolio turnover rate | | | 36 | % | | | 29 | % | | | 17 | % | | | 22 | % | | | 85 | % | |
(1) Not consolidated.
(2) The per share amounts were computed using an average number of shares outstanding during the period.
(3) Calculated based on the net asset value as of the last business day of the period.
(4) Refer to Note 3 in the Notes to Consolidated Financial Statements for discussion of prior period transfer agency and sub transfer agency fees that were reimbursed in the current period. The amount of the reimbursement was immaterial to the total return of Class I shares.
(5) If the Fund had not received the reimbursement of transfer agency and sub transfer agency fees from the Adviser, the net expenses and net investment income ratios, would have been as follows for Class I shares:
| PERIOD ENDED | | EXPENSE
RATIO | | NET INVESTMENT
INCOME RATIO | |
October 31, 2024 | | | 1.04 | % | | | 0.07 | % | |
(6) If the Fund had borne all of its expenses that were waived by the Adviser/Administrator, the annualized expense and net investment loss ratios would have been as follows:
| PERIOD ENDED | | EXPENSE
RATIO | | NET INVESTMENT
LOSS RATIO | |
October 31, 2024 | | | 1.36 | % | | | (0.25 | )% | |
October 31, 2023 | | | 1.33 | | | | (0.13 | ) | |
October 31, 2022 | | | 1.30 | | | | (0.61 | ) | |
October 31, 2021 | | | 1.16 | | | | (0.73 | ) | |
October 31, 2020 | | | 1.40 | | | | (0.65 | ) | |
(7) The ratios reflect the rebate of certain Fund expenses in connection with investments in a Morgan Stanley affiliate during the period. The effect of the rebate on the ratios is disclosed in the above table as "Rebate from Morgan Stanley affiliate."
(8) Amount is less than 0.005%.
See Notes to Consolidated Financial Statements
25
Morgan Stanley Europe Opportunity Fund, Inc.
Consolidated Financial Highlights continued
| | | FOR THE YEAR ENDED OCTOBER 31, | |
| | | 2024 | | 2023 | | 2022 | | 2021 | | 2020(1) | |
Class C Shares | |
Selected Per Share Data: | |
Net asset value, beginning of period | | $ | 16.61 | | | $ | 14.39 | | | $ | 31.39 | | | $ | 23.14 | | | $ | 18.58 | | |
Income (loss) from investment operations: | |
| Net investment loss(2) | | | (0.19 | ) | | | (0.17 | ) | | | (0.29 | ) | | | (0.51 | ) | | | (0.24 | ) | |
Net realized and unrealized gain (loss) | | | 4.89 | | | | 2.39 | | | | (14.92 | ) | | | 11.02 | | | | 5.40 | | |
Total income (loss) from investment operations | | | 4.70 | | | | 2.22 | | | | (15.21 | ) | | | 10.51 | | | | 5.16 | | |
Less distributions from: | |
Net investment income | | | — | | | | — | | | | — | | | | — | | | | (0.08 | ) | |
Net realized gain | | | — | | | | — | | | | (1.79 | ) | | | (2.26 | ) | | | (0.52 | ) | |
Total distributions | | | — | | | | — | | | | (1.79 | ) | | | (2.26 | ) | | | (0.60 | ) | |
Net asset value, end of period | | $ | 21.31 | | | $ | 16.61 | | | $ | 14.39 | | | $ | 31.39 | | | $ | 23.14 | | |
| Total Return(3) | | | 28.30 | %(4) | | | 15.43 | % | | | (51.26 | )% | | | 47.32 | % | | | 28.42 | % | |
Ratios to Average Net Assets: | |
Net expenses | | | 2.04 | %(5)(6)(7) | | | 2.14 | %(6)(7) | | | 2.15 | %(6)(7) | | | 2.15 | %(6)(7) | | | 2.14 | %(6)(7) | |
| Net expenses excluding interest expenses | | | 2.04 | %(5)(6)(7) | | | N/A | | | | 2.15 | %(6)(7) | | | N/A | | | | N/A | | |
Net investment loss | | | (0.92 | )%(5)(6)(7) | | | (0.94 | )%(6)(7) | | | (1.34 | )%(6)(7) | | | (1.72 | )%(6)(7) | | | (1.21 | )%(6)(7) | |
Rebate from Morgan Stanley affiliate | | | 0.01 | % | | | 0.01 | % | | | 0.00 | %(8) | | | 0.00 | %(8) | | | 0.01 | % | |
Supplemental Data: | |
Net assets, end of period, in thousands | | $ | 1,329 | | | $ | 1,743 | | | $ | 2,113 | | | $ | 9,998 | | | $ | 1,559 | | |
Portfolio turnover rate | | | 36 | % | | | 29 | % | | | 17 | % | | | 22 | % | | | 85 | % | |
(1) Not consolidated.
(2) The per share amounts were computed using an average number of shares outstanding during the period.
(3) Does not reflect the deduction of sales charge. Calculated based on the net asset value as of the last business day of the period.
(4) Refer to Note 3 in the Notes to Consolidated Financial Statements for discussion of prior period transfer agency and sub transfer agency fees that were reimbursed in the current period. The amount of the reimbursement was immaterial to the total return of Class C shares.
(5) If the Fund had not received the reimbursement of transfer agency and sub transfer agency fees from the Adviser, the net expenses and net investment loss ratios, would have been as follows for Class C shares:
| PERIOD ENDED | | EXPENSE
RATIO | | NET INVESTMENT
LOSS RATIO | |
October 31, 2024 | | | 2.14 | % | | | (1.02 | )% | |
(6) If the Fund had borne all of its expenses that were waived by the Adviser/Administrator, the annualized expense and net investment loss ratios would have been as follows:
| PERIOD ENDED | | EXPENSE
RATIO | | NET INVESTMENT
LOSS RATIO | |
October 31, 2024 | | | 2.53 | % | | | (1.41 | )% | |
October 31, 2023 | | | 2.42 | | | | (1.22 | ) | |
October 31, 2022 | | | 2.30 | | | | (1.49 | ) | |
October 31, 2021 | | | 2.19 | | | | (1.76 | ) | |
October 31, 2020 | | | 2.67 | | | | (1.74 | ) | |
(7) The ratios reflect the rebate of certain Fund expenses in connection with investments in a Morgan Stanley affiliate during the period. The effect of the rebate on the ratios is disclosed in the above table as "Rebate from Morgan Stanley affiliate."
(8) Amount is less than 0.005%.
See Notes to Consolidated Financial Statements
26
Morgan Stanley Europe Opportunity Fund, Inc.
Report of Independent Registered Public Accounting Firm
To the Shareholders and Board of Directors of
Morgan Stanley Europe Opportunity Fund, Inc.
Opinion on the Financial Statements
We have audited the accompanying consolidated statement of assets and liabilities of Morgan Stanley Europe Opportunity Fund, Inc. (the "Fund"), including the consolidated portfolio of investments, as of October 31, 2024, and the related consolidated statement of operations for the year then ended, the consolidated statements of changes in net assets for each of the two years in the period then ended, the consolidated financial highlights for each of the four years in the period then ended, the financial highlights for the year ended October 31, 2020 and the related notes (collectively referred to as the "financial statements"). In our opinion, the financial statements present fairly, in all material respects, the consolidated financial position of the Fund at October 31, 2024, the consolidated results of its operations for the year then ended, the consolidated changes in its net assets for each of the two years in the period then ended, its consolidated financial highlights for each of the four years in the period then ended and its financial highlights for the year ended October 31, 2020, in conformity with U.S. generally accepted accounting principles.
Basis for Opinion
These financial statements are the responsibility of the Fund's management. Our responsibility is to express an opinion on the Fund's financial statements based on our audits. We are a public accounting firm registered with the Public Company Accounting Oversight Board (United States) ("PCAOB") and are required to be independent with respect to the Fund in accordance with the U.S. federal securities laws and the applicable rules and regulations of the Securities and Exchange Commission and the PCAOB.
We conducted our audits in accordance with the standards of the PCAOB. Those standards require that we plan and perform the audit to obtain reasonable assurance about whether the financial statements are free of material misstatement, whether due to error or fraud. The Fund is not required to have, nor were we engaged to perform, an audit of the Fund's internal control over financial reporting. As part of our audits, we are required to obtain an understanding of internal control over financial reporting but not for the purpose of expressing an opinion on the effectiveness of the Fund's internal control over financial reporting. Accordingly, we express no such opinion.
Our audits included performing procedures to assess the risks of material misstatement of the financial statements, whether due to error or fraud, and performing procedures that respond to those risks. Such procedures included examining, on a test basis, evidence regarding the amounts and disclosures in the financial statements. Our procedures included confirmation of securities owned as of October 31, 2024, by correspondence with the custodian, brokers and others; when replies were not received from brokers and others, we performed other auditing procedures. Our audits also included evaluating the accounting principles used and significant estimates made by management, as well as evaluating the overall presentation of the financial statements. We believe that our audits provide a reasonable basis for our opinion.

We have served as the auditor of one or more Morgan Stanley investment companies since 2000.
Boston, Massachusetts
December 23, 2024
27
Morgan Stanley Europe Opportunity Fund, Inc.
Investment Advisory Agreement Approval (unaudited)
Nature, Extent and Quality of Services
The Board reviewed and considered the nature and extent of the investment advisory services provided by the Adviser under the advisory agreement, including portfolio management, investment research and equity and fixed income securities trading. The Board reviewed similar information and factors regarding the Sub-Adviser, to the extent applicable. The Board also reviewed and considered the nature and extent of the non-advisory, administrative services provided by the Administrator under the administration agreement, including accounting, operations, clerical, bookkeeping, compliance, business management and planning, legal services and the provision of supplies, office space and utilities at the Adviser's expense. The Board also considered the Adviser's investment in personnel and infrastructure that benefits the Fund. (The Adviser, Sub-Adviser and Administrator together are referred to as the "Adviser" and the advisory, sub-advisory and administration agreements together are referred to as the "Management Agreement.") The Board also considered that the Adviser serves a variety of other investment advisory clients and has experience overseeing service providers. The Board also compared the nature of the services provided by the Adviser with similar services provided by non-affiliated advisers as prepared by Broadridge Financial Solutions, Inc. ("Broadridge").
The Board reviewed and considered the qualifications of the portfolio managers, the senior administrative managers and other key personnel of the Adviser who provide the advisory and administrative services to the Fund. The Board determined that the Adviser's portfolio managers and key personnel are well qualified by education and/or training and experience to perform the services in an efficient and professional manner. The Board concluded that the nature and extent of the advisory and administrative services provided were necessary and appropriate for the conduct of the business and investment activities of the Fund and supported its decision to approve the Management Agreement.
Performance, Fees and Expenses of the Fund
The Board reviewed the performance, fees and expenses of the Fund compared to its peers, as prepared by Broadridge, and to appropriate benchmarks where applicable. The Board discussed with the Adviser the performance goals and the actual results achieved in managing the Fund. When considering a fund's performance, the Board and the Adviser place emphasis on trends and longer-term returns (focusing on one-year, three-year and five-year performance, as of December 31, 2023, or since inception, as applicable). When a fund underperforms its benchmark and/or its peer group average, the Board and the Adviser discuss the causes of such underperformance and, where necessary, they discuss specific changes to investment strategy or investment personnel. The Board noted that the Fund's performance was better than its peer group average for the one- and five-year periods but below its peer group average for the three-year period. The Board discussed with the Adviser the level of the advisory and administration fees (together, the "management fee") for this Fund relative to comparable funds and/or other accounts advised by the Adviser and/or compared to its peers as prepared by Broadridge. In addition to the management fee, the Board also reviewed the Fund's total expense ratio.
28
Morgan Stanley Europe Opportunity Fund, Inc.
Investment Advisory Agreement Approval (unaudited) continued
The Board noted that the Fund's actual management fee and total expense ratio were lower than its peer group averages and the contractual management fee was higher than but close to its peer group average. After discussion, the Board concluded that the Fund's performance, management fee and total expense ratio were competitive with its peer group averages.
Economies of Scale
The Board considered the size and growth prospects of the Fund and how that relates to the Fund's total expense ratio and particularly the Fund's management fee rate, which includes breakpoints. In conjunction with its review of the Adviser's profitability, the Board discussed with the Adviser how a change in assets can affect the efficiency or effectiveness of managing the Fund and whether the management fee level is appropriate relative to current and projected asset levels and/or whether the management fee structure reflects economies of scale as asset levels change. The Board has determined that its review of the actual and/or potential economies of scale of the Fund supports its decision to approve the Management Agreement.
Profitability of the Adviser and Affiliates
The Board considered information concerning the costs incurred and profits realized by the Adviser and its affiliates during the last year from their relationship with the Fund and during the last two years from their relationship with the Morgan Stanley Fund Complex and reviewed with the Adviser the cost allocation methodology used to determine the profitability of the Adviser and affiliates. The Board has determined that its review of the analysis of the Adviser's expenses and profitability supports its decision to approve the Management Agreement.
Other Benefits of the Relationship
The Board considered other direct and indirect benefits to the Adviser and/or its affiliates derived from their relationship with the Fund and other funds advised by the Adviser. These benefits may include, among other things, fees for trading, distribution and/or shareholder servicing and for transaction processing and reporting platforms used by securities lending agents, and research received by the Adviser generated from commission dollars spent on funds' portfolio trading. The Board reviewed with the Adviser these arrangements and the reasonableness of the Adviser's costs relative to the services performed. The Board has determined that its review of the other benefits received by the Adviser or its affiliates supports its decision to approve the Management Agreement.
Resources of the Adviser and Historical Relationship Between the Fund and the Adviser
The Board considered whether the Adviser is financially sound and has the resources necessary to perform its obligations under the Management Agreement. The Board also reviewed and considered the historical relationship between the Fund and the Adviser, including the organizational structure of the
29
Morgan Stanley Europe Opportunity Fund, Inc.
Investment Advisory Agreement Approval (unaudited) continued
Adviser, the policies and procedures formulated and adopted by the Adviser for managing the Fund's operations and the Board's confidence in the competence and integrity of the senior managers and key personnel of the Adviser. The Board concluded that the Adviser has the financial resources necessary to fulfill its obligations under the Management Agreement and that it is beneficial for the Fund to continue its relationship with the Adviser.
Other Factors and Current Trends
The Board considered the controls and procedures adopted and implemented by the Adviser and monitored by the Fund's Chief Compliance Officer and concluded that the conduct of business by the Adviser indicates a good faith effort on its part to adhere to high ethical standards in the conduct of the Fund's business.
General Conclusion
After considering and weighing all of the above factors, with various written materials and verbal information presented by the Adviser, the Board concluded that it would be in the best interest of the Fund and its shareholders to approve renewal of the Management Agreement for another year. In reaching this conclusion the Board did not give particular weight to any single piece of information or factor referenced above. The Board considered these factors and information over the course of the year and in numerous meetings, some of which were in executive session with only the independent Board members and their counsel present. It is possible that individual Board members may have weighed these factors, and the information presented, differently in reaching their individual decisions to approve the Management Agreement.
30
This report is submitted for the general information of the shareholders of the Fund. For more detailed information about the Fund, its fees and expenses and other pertinent information, please read its Prospectus. The Fund's Statement of Additional Information contains additional information about the Fund, including its Trustees. It is available, without charge, by calling 1 (800) 869-6397.
This report is not authorized for distribution to prospective investors in the Fund unless preceded or accompanied by an effective Prospectus. Please read the Prospectus carefully before investing.
Morgan Stanley Distribution, Inc., member FINRA.
© 2024 Morgan Stanley

Item 8. Changes in and Disagreements with Accountants for Open-End Management Investment Companies
Not applicable.
Item 9. Proxy Disclosures for Open-End Management Investment Companies
Not applicable.
Item 10. Remuneration Paid to Directors, Officers, and Others of Open-End Management Investment Companies
This information is disclosed as part of the Financial Statements included in Item 7 of this Form N-CSR.
Item 11. Statement Regarding Basis for Approval of Investment Advisory Contract
This information is disclosed as part of the Financial Statements and Additional Information under Item 7 of this Form N-CSR.
Item 12. Disclosure of Proxy Voting Policies and Procedures for Closed-End Management Investment Companies
Not applicable.
Item 13. Portfolio Managers of Closed-End Management Investment Companies
Not applicable.
Item 14. Purchases of Equity Securities by Closed-End Management Investment Company and Affiliated Purchasers
Not applicable.
Item 15. Submission of Matters to a Vote of Security Holders
There have been no material changes to the procedures by which shareholders may recommend nominee to the Fund’s Board of Directors since the Fund last provided disclosure in response to this item.
Item 16. Controls and Procedures
| (a) | It is the conclusion of the registrant’s principal executive officer and principal financial officer that the effectiveness of the registrant’s current disclosure controls and procedures (such disclosure controls and procedures having been evaluated within 90 days of the date of this filing) provide reasonable assurance that the information required to be disclosed by the registrant has been recorded, processed, summarized and reported within the time period specified in the Commission’s rules and forms and that the information required to be disclosed by the registrant has been accumulated and communicated to the registrant’s principal executive officer and principal financial officer in order to allow timely decisions regarding required disclosure. |
| (b) | There have been no changes in the registrant’s internal controls over financial reporting during the period covered by this report that has materially affected, or is reasonably likely to materially affect, the registrant’s internal control over financial reporting. |
Item 17. Disclosure of Securities Lending Activities for Closed-End Management Investment Companies
Not applicable.
Item 18. Recovery of Erroneously Awarded Compensation
Not applicable.
Item 19. Exhibits
Signatures
Pursuant to the requirements of the Securities Exchange Act of 1934 and the Investment Company Act of 1940, the registrant has duly caused this report to be signed on its behalf by the undersigned, thereunto duly authorized.
| Morgan Stanley Europe Opportunity Fund, Inc. | |
| | | |
| By: | /s/ John H. Gernon | |
| | John H. Gernon | |
| | Principal Executive Officer | |
Pursuant to the requirements of the Securities Exchange Act of 1934 and the Investment Company Act of 1940, this report has been signed below by the following persons on behalf of the registrant and in the capacities and on the dates indicated.
| By: | /s/ Francis J. Smith | |
| | Francis J. Smith | |
| | Principal Financial Officer | |
| | | |
| Date: | December 17, 2024 | |
| | | |
| By: | /s/ John H. Gernon | |
| | John H. Gernon | |
| | Principal Executive Officer | |
| | | |
| Date: | December 17, 2024 | |