
ASC 605 to ASC 606 Transition May 10, 2018

Summary
Tyler ASC 606 Adoption Background • Tyler adopted the requirements of ASC 606 effective January 1, 2018 • Full retrospective adoption method (FY16 and FY17 restated) • FY17 has been restated quarterly 3

GAAP Revenue Impact GAAP total revenues ($M) $840.7 $840.9 $756.0 $759.9 FY16 FY17 ASC 605 ASC 606 4
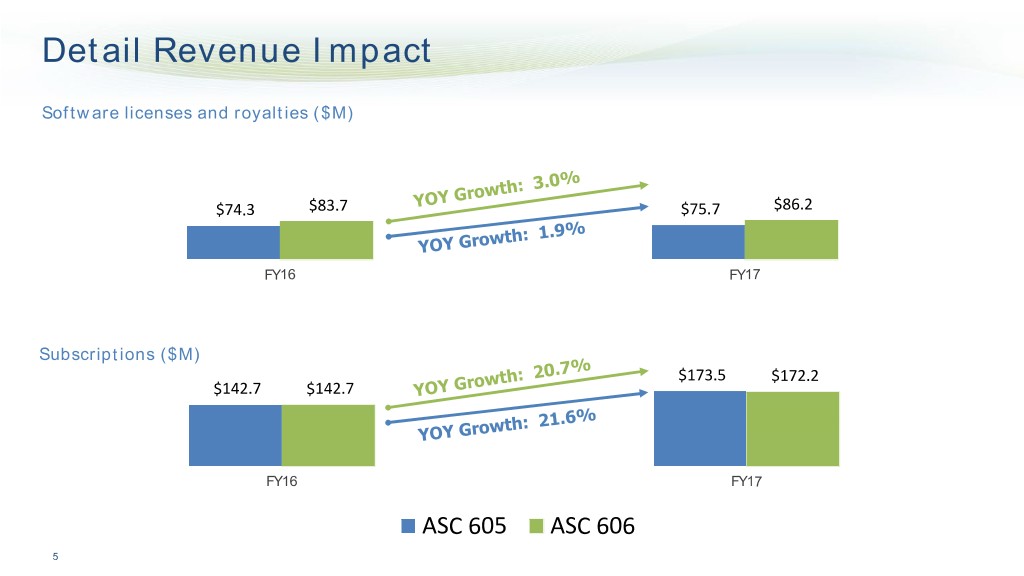
Detail Revenue Impact Software licenses and royalties ($M) $74.3 $83.7 $75.7 $86.2 FY16 FY17 Subscriptions ($M) $173.5 $172.2 $142.7 $142.7 FY16 FY17 ASC 605 ASC 606 5
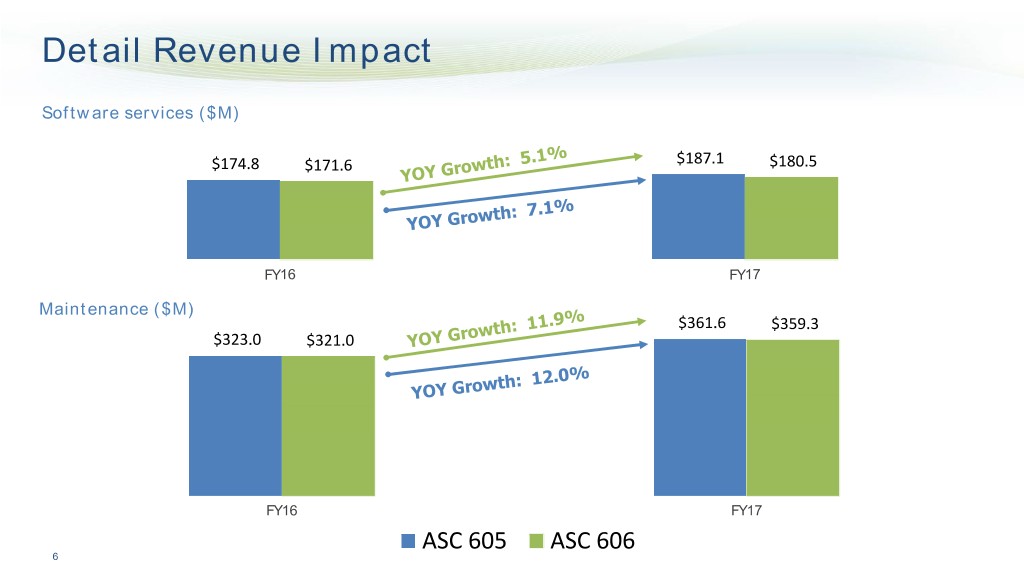
Detail Revenue Impact Software services ($M) $174.8 $171.6 $187.1 $180.5 FY16 FY17 Maintenance ($M) $361.6 $359.3 $323.0 $321.0 FY16 FY17 ASC 605 ASC 606 6
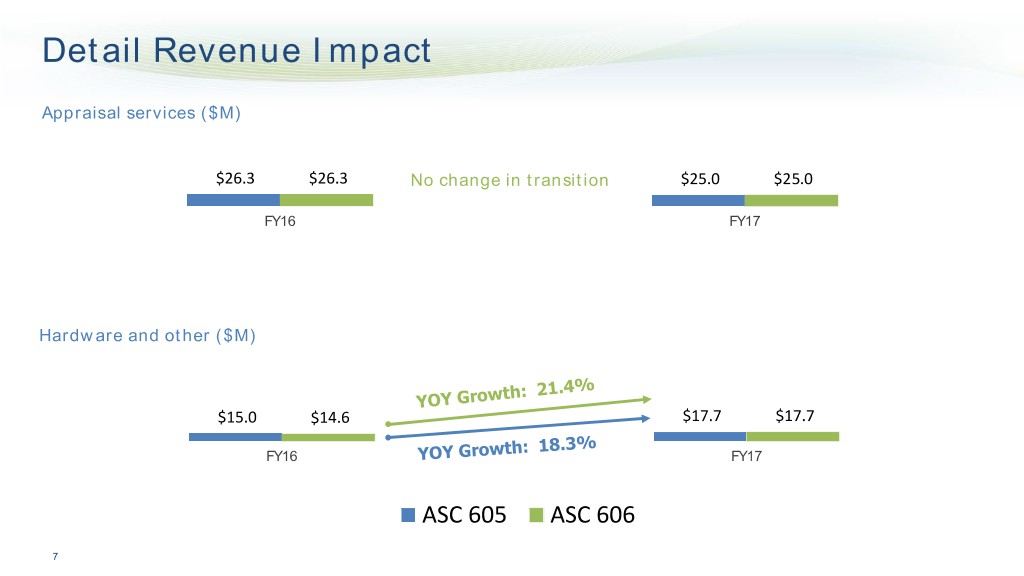
Detail Revenue Impact Appraisal services ($M) $26.3 $26.3 No change in transition $25.0 $25.0 FY16 FY17 Hardware and other ($M) $15.0 $14.6 $17.7 $17.7 FY16 FY17 ASC 605 ASC 606 7
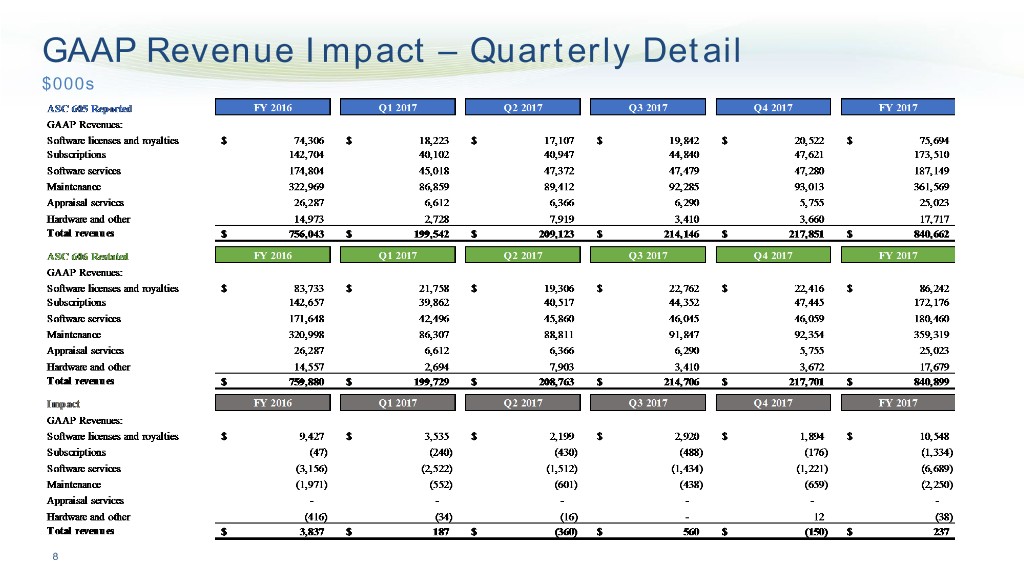
GAAP Revenue Impact – Quarterly Detail $000s 8
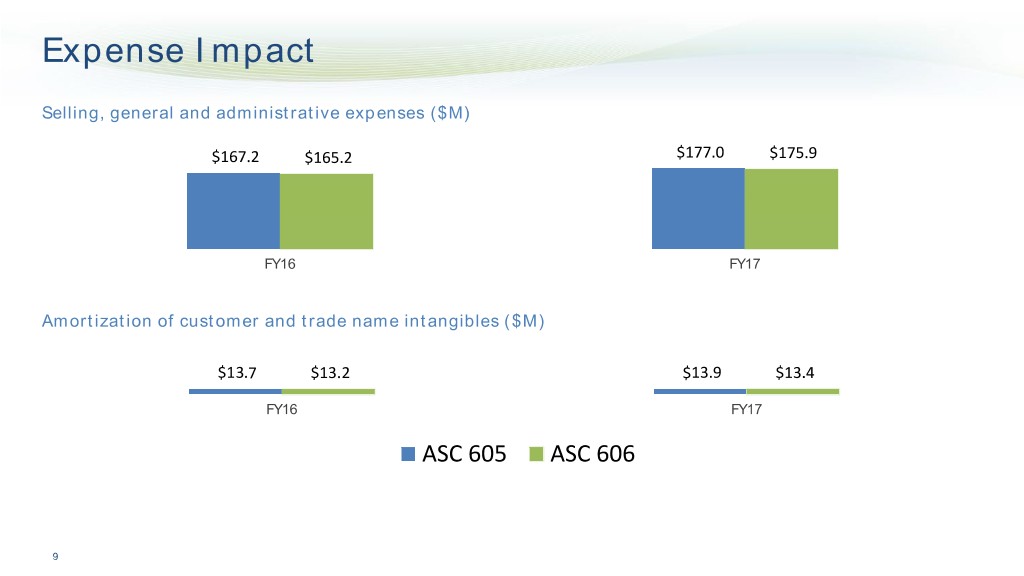
Expense Impact Selling, general and administrative expenses ($M) $167.2 $165.2 $177.0 $175.9 FY16 FY17 Amortization of customer and trade name intangibles ($M) $13.7 $13.2 $13.9 $13.4 FY16 FY17 ASC 605 ASC 606 9

GAAP Gross Profit and Margin Impact GAAP gross profit ($M) $399.1 $399.4 $355.4 $359.2 FY16 FY17 GAAP gross margin 47.0% 47.3% 47.5% 47.5% FY16 FY17 ASC 605 ASC 606 10
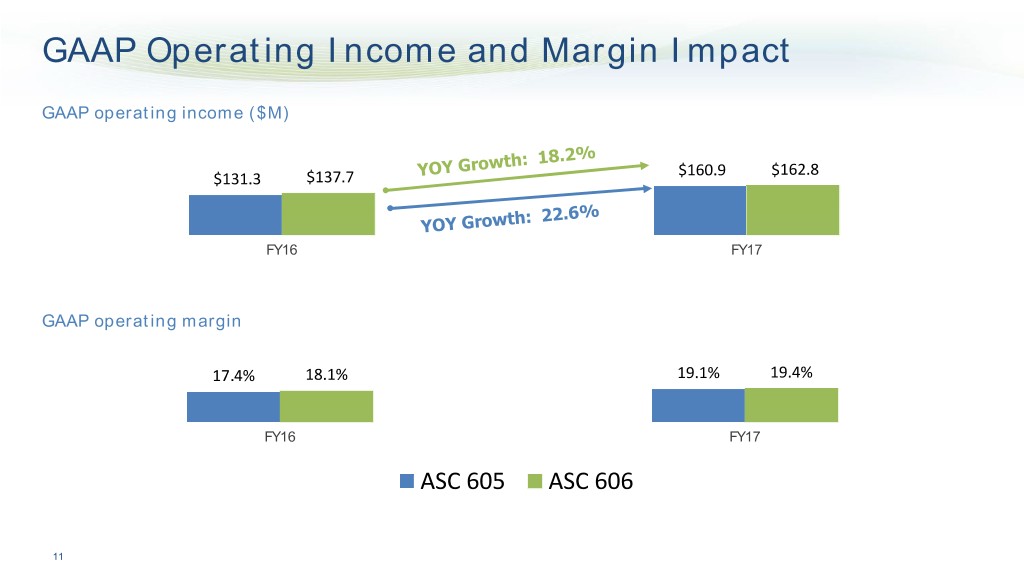
GAAP Operating Income and Margin Impact GAAP operating income ($M) $160.9 $162.8 $131.3 $137.7 FY16 FY17 GAAP operating margin 17.4% 18.1% 19.1% 19.4% FY16 FY17 ASC 605 ASC 606 11
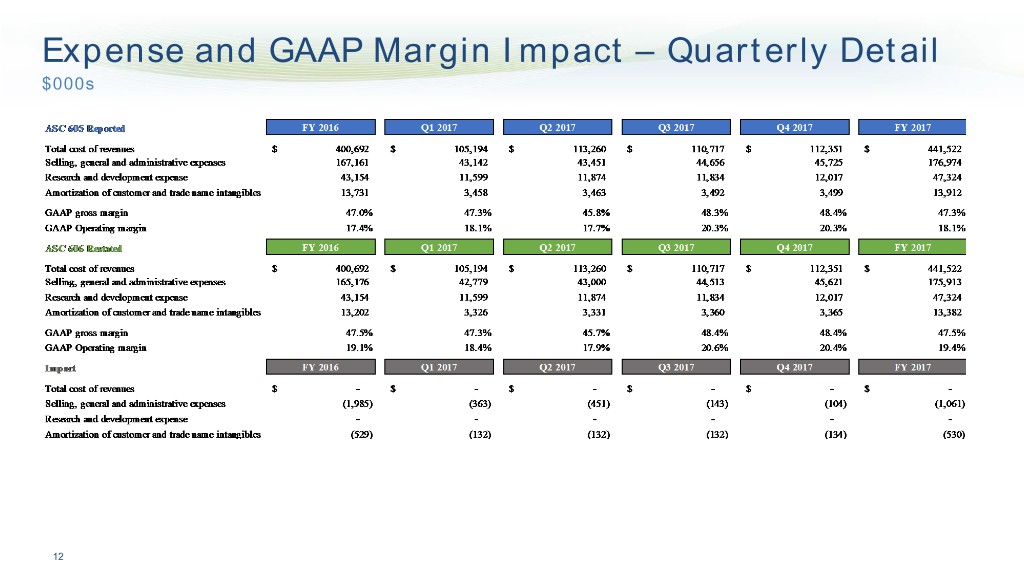
Expense and GAAP Margin Impact – Quarterly Detail $000s 12
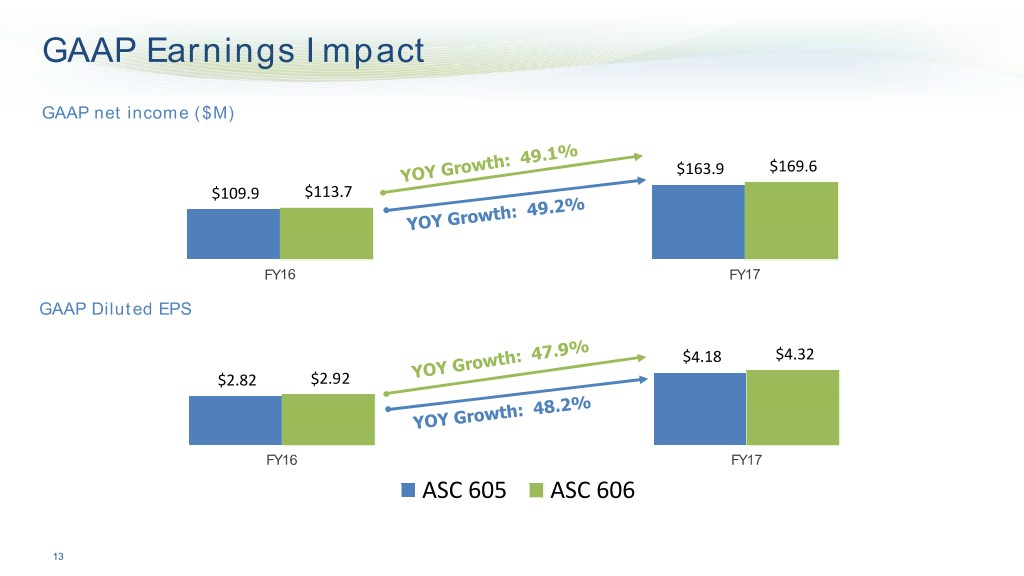
GAAP Earnings Impact GAAP net income ($M) $163.9 $169.6 $109.9 $113.7 FY16 FY17 GAAP Diluted EPS $4.18 $4.32 $2.82 $2.92 FY16 FY17 ASC 605 ASC 606 13
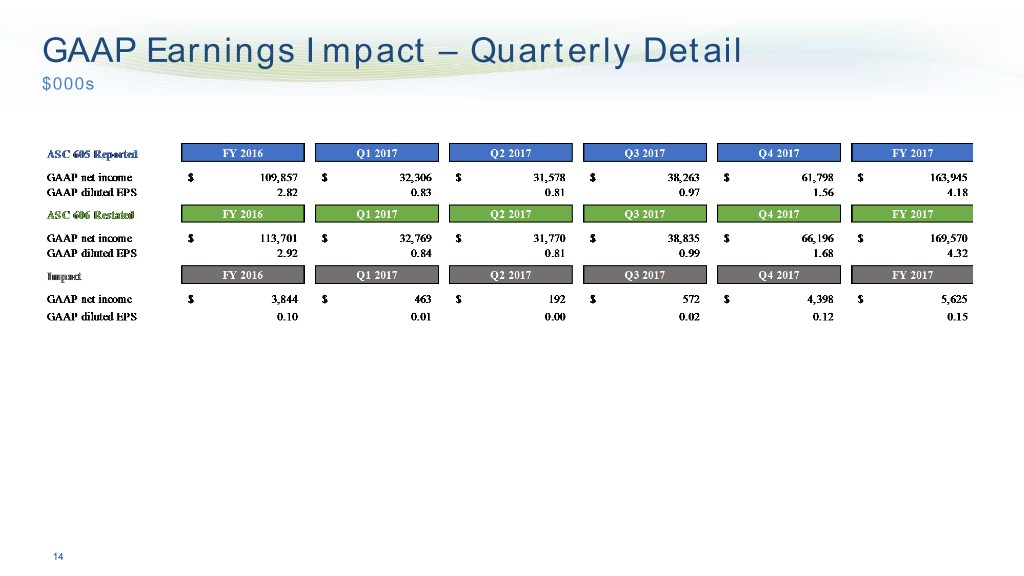
GAAP Earnings Impact – Quarterly Detail $000s 14
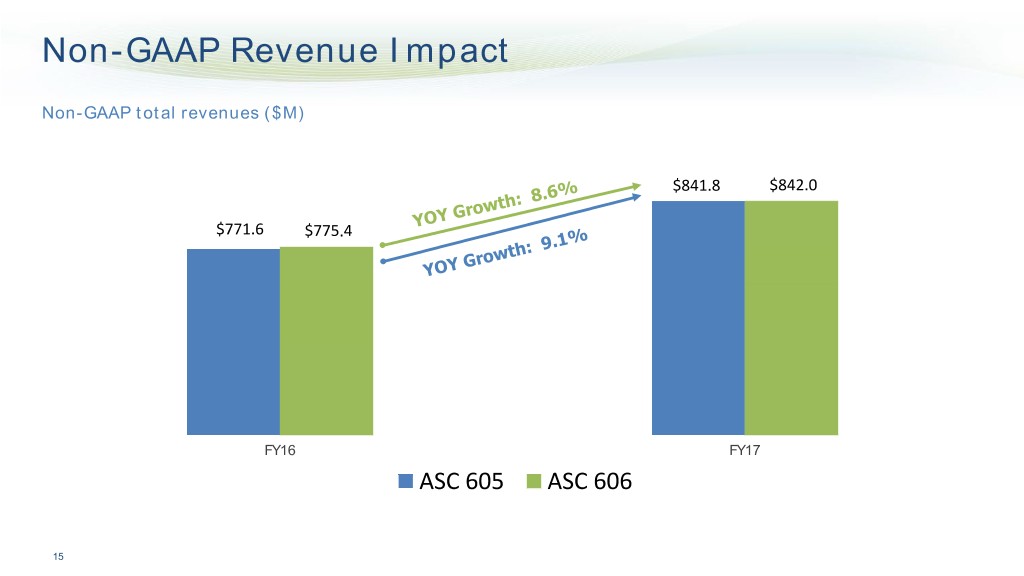
Non-GAAP Revenue Impact Non-GAAP total revenues ($M) $841.8 $842.0 $771.6 $775.4 FY16 FY17 ASC 605 ASC 606 15
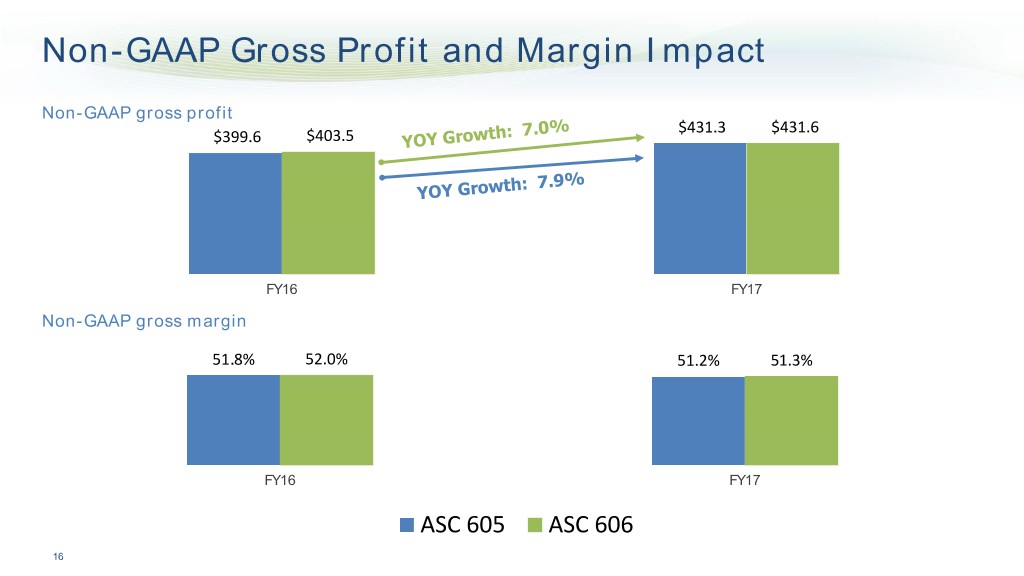
Non-GAAP Gross Profit and Margin Impact Non-GAAP gross profit $431.3 $431.6 $399.6 $403.5 FY16 FY17 Non-GAAP gross margin 51.8% 52.0% 51.2% 51.3% FY16 FY17 ASC 605 ASC 606 16
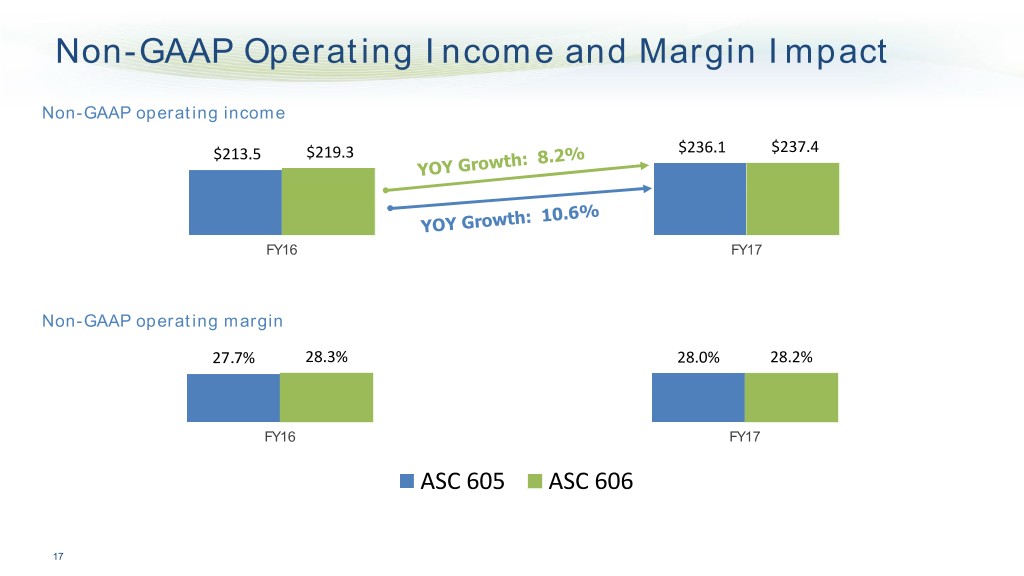
Non-GAAP Operating Income and Margin Impact Non-GAAP operating income $213.5 $219.3 $236.1 $237.4 FY16 FY17 Non-GAAP operating margin 27.7% 28.3% 28.0% 28.2% FY16 FY17 ASC 605 ASC 606 17
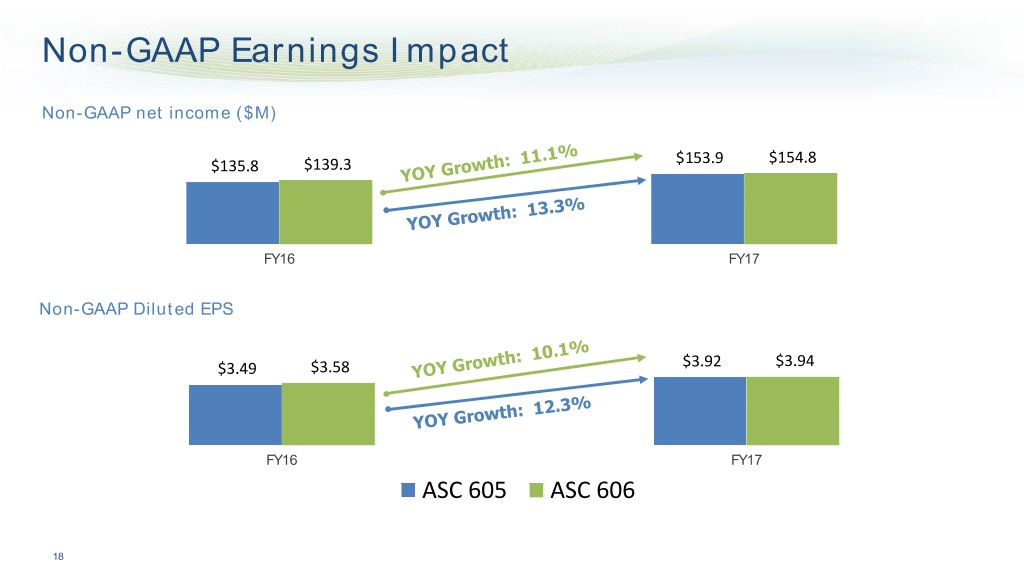
Non-GAAP Earnings Impact Non-GAAP net income ($M) $154.8 $135.8 $139.3 $153.9 FY16 FY17 Non-GAAP Diluted EPS $3.49 $3.58 $3.92 $3.94 FY16 FY17 ASC 605 ASC 606 18
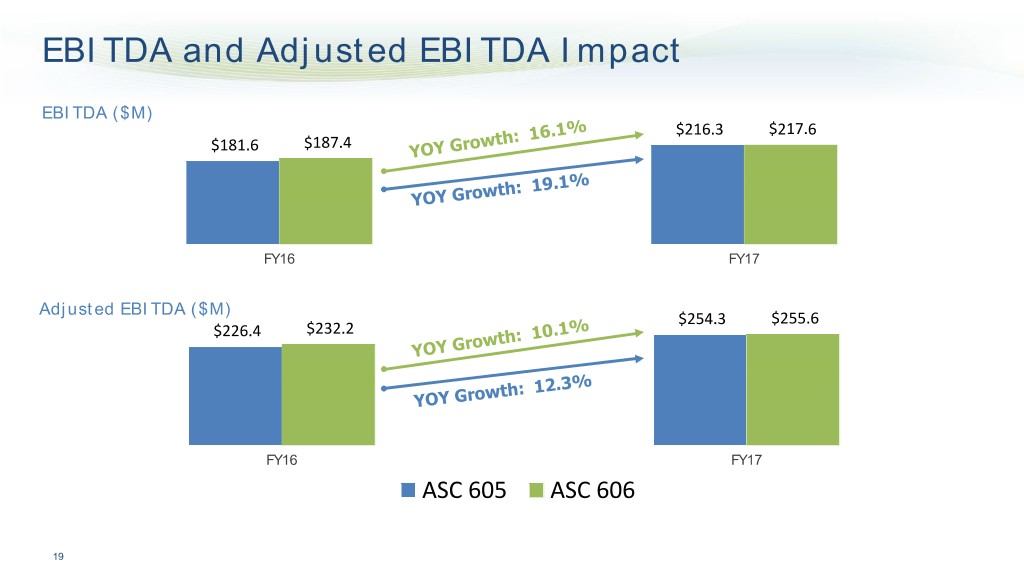
EBITDA and Adjusted EBITDA Impact EBITDA ($M) $216.3 $217.6 $181.6 $187.4 FY16 FY17 Adjusted EBITDA ($M) $254.3 $255.6 $226.4 $232.2 FY16 FY17 ASC 605 ASC 606 19
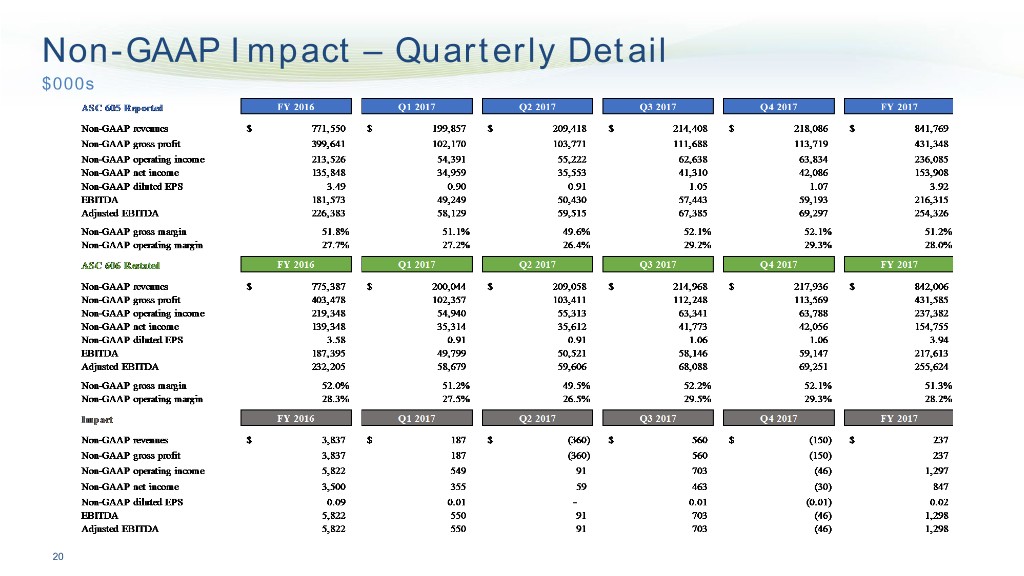
Non-GAAP Impact – Quarterly Detail $000s 20
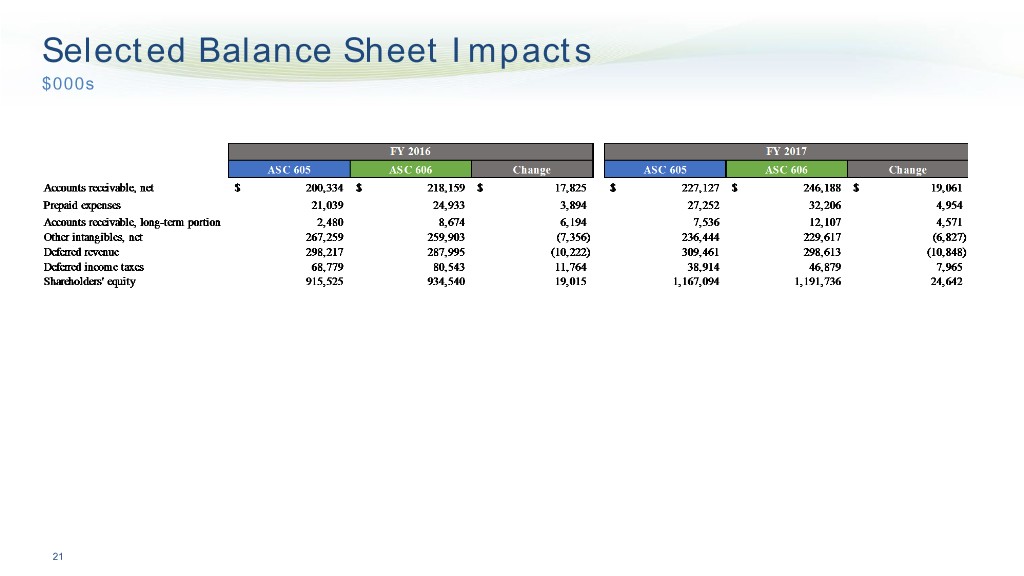
Selected Balance Sheet Impacts $000s 21

No Cash Flow Impact Cash from operations ($M) $191.9 $191.9 $195.8 $195.8 FY16 FY17 Free Cash Flow (ex real estate) ($M) $172.5 $172.5 $173.8 $173.8 FY16 FY17 ASC 605 ASC 606 22

Financial Statements As Reported and As Adjusted

Consolidated Balance Sheets – FY16 and FY17 Tyler Technologies, Inc. Condensed Consolidated Balance Sheets (in thousands) (Unaudited) 24
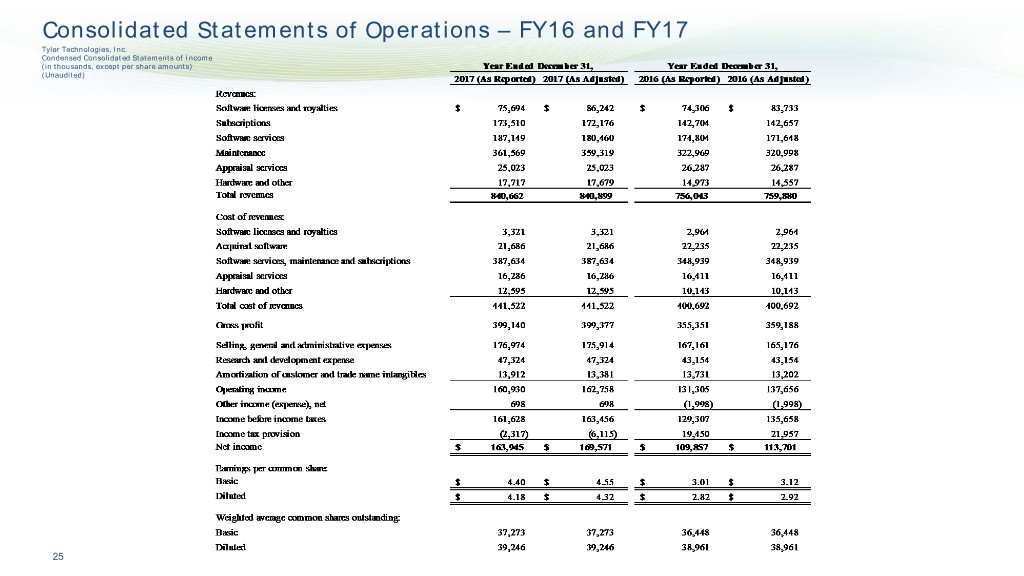
Consolidated Statements of Operations – FY16 and FY17 Tyler Technologies, Inc. Condensed Consolidated Statements of Income (in thousands, except per share amounts) (Unaudited) 25
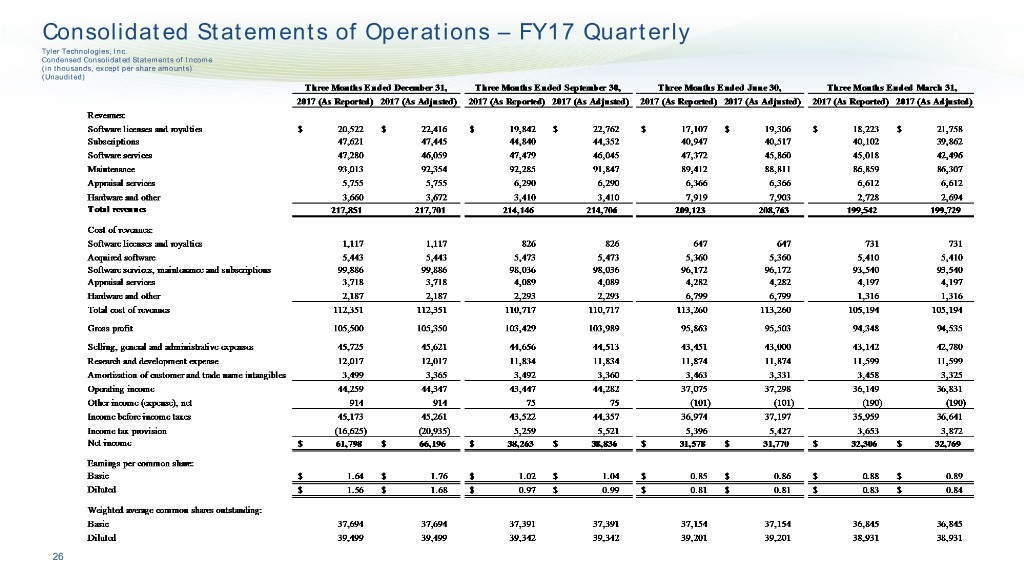
Consolidated Statements of Operations – FY17 Quarterly Tyler Technologies, Inc. Condensed Consolidated Statements of Income (in thousands, except per share amounts) (Unaudited) 26
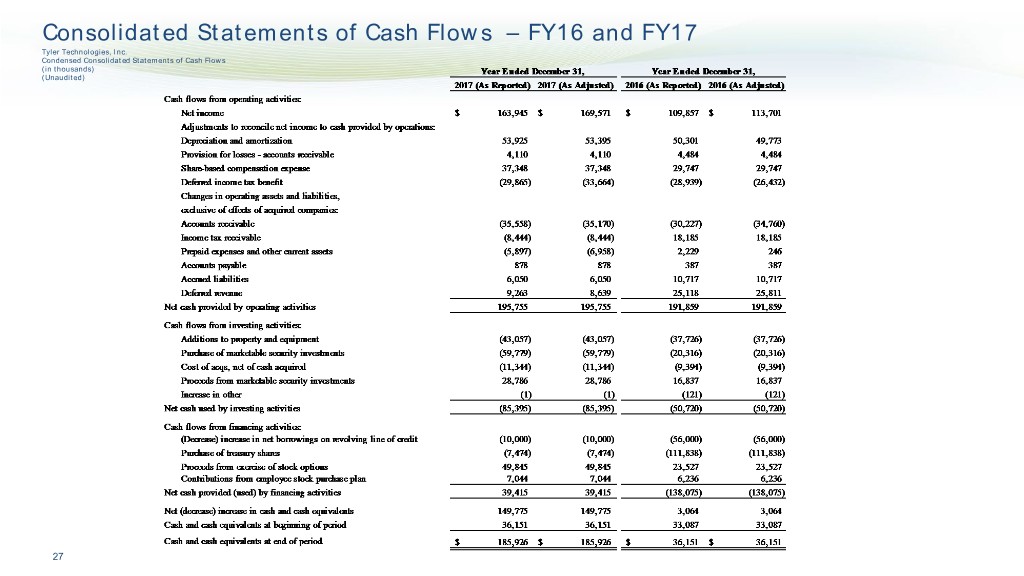
Consolidated Statements of Cash Flows – FY16 and FY17 Tyler Technologies, Inc. Condensed Consolidated Statements of Cash Flows (in thousands) (Unaudited) 27
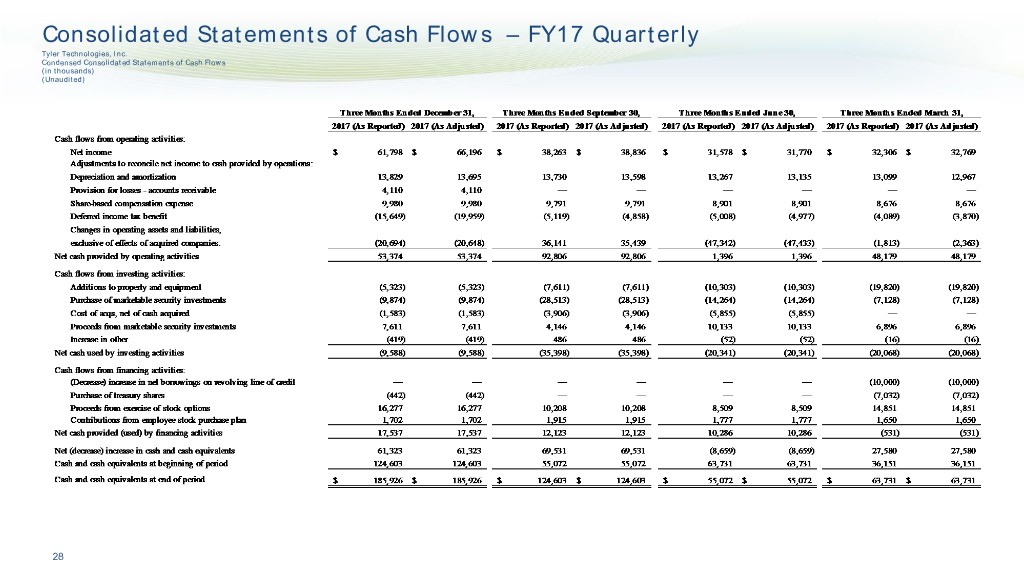
Consolidated Statements of Cash Flows – FY17 Quarterly Tyler Technologies, Inc. Condensed Consolidated Statements of Cash Flows (in thousands) (Unaudited) 28
GAAP to Non-GAAP Reconciliation Tables As Reported and As Adjusted
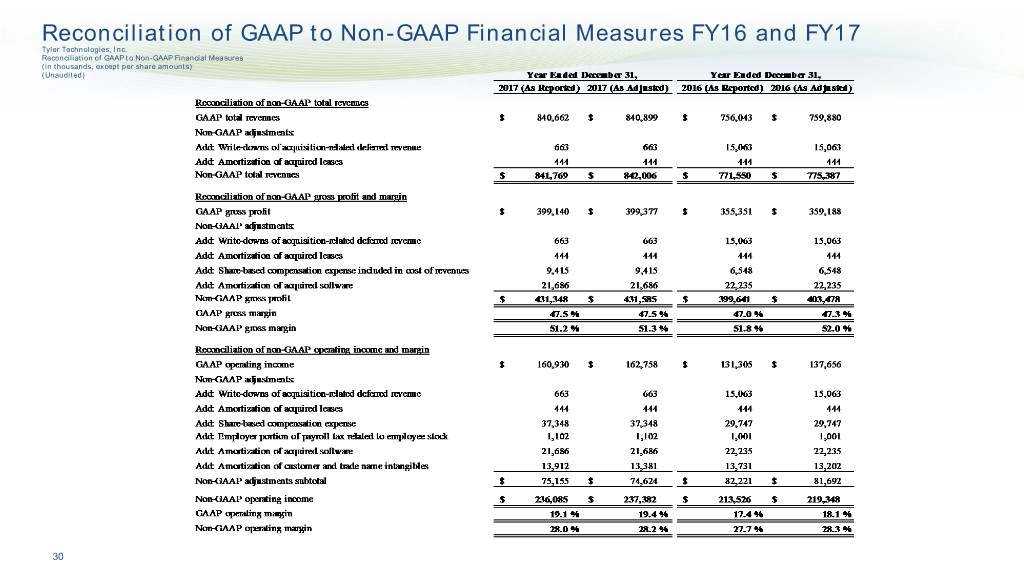
Reconciliation of GAAP to Non-GAAP Financial Measures FY16 and FY17 Tyler Technologies, Inc. Reconciliation of GAAP to Non-GAAP Financial Measures (in thousands, except per share amounts) (Unaudited) 30
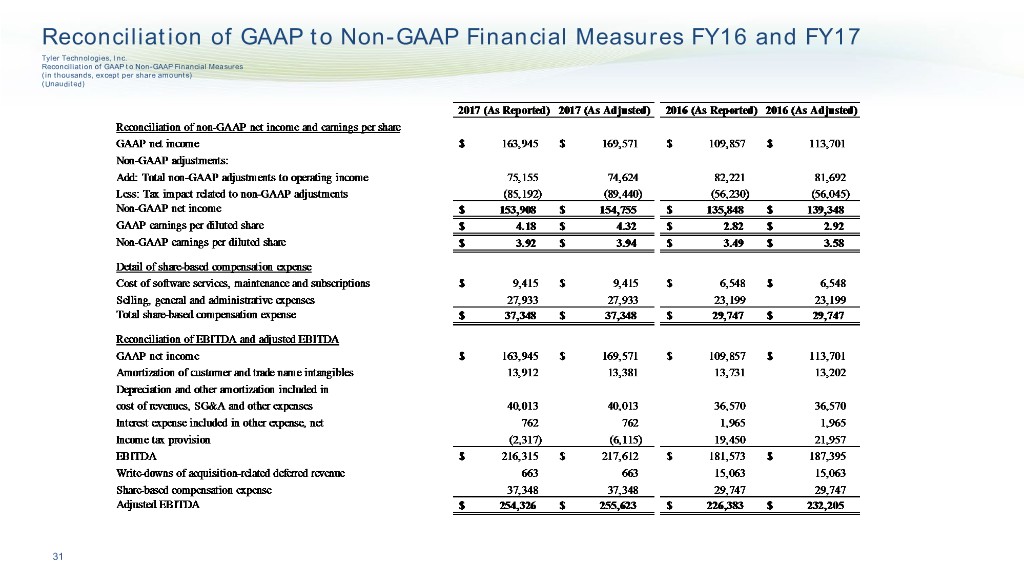
Reconciliation of GAAP to Non-GAAP Financial Measures FY16 and FY17 Tyler Technologies, Inc. Reconciliation of GAAP to Non-GAAP Financial Measures (in thousands, except per share amounts) (Unaudited) 31
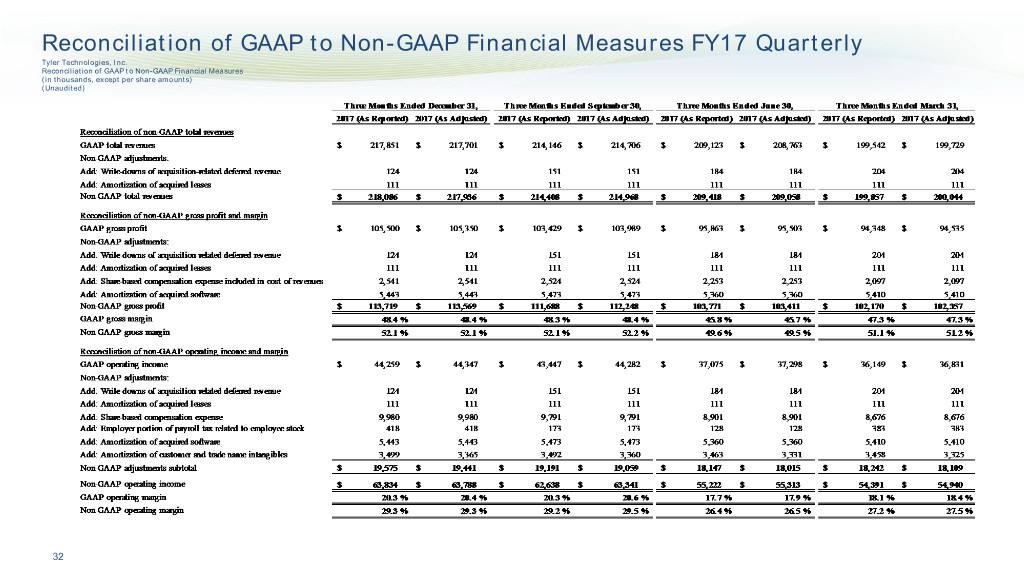
Reconciliation of GAAP to Non-GAAP Financial Measures FY17 Quarterly Tyler Technologies, Inc. Reconciliation of GAAP to Non-GAAP Financial Measures (in thousands, except per share amounts) (Unaudited) 32
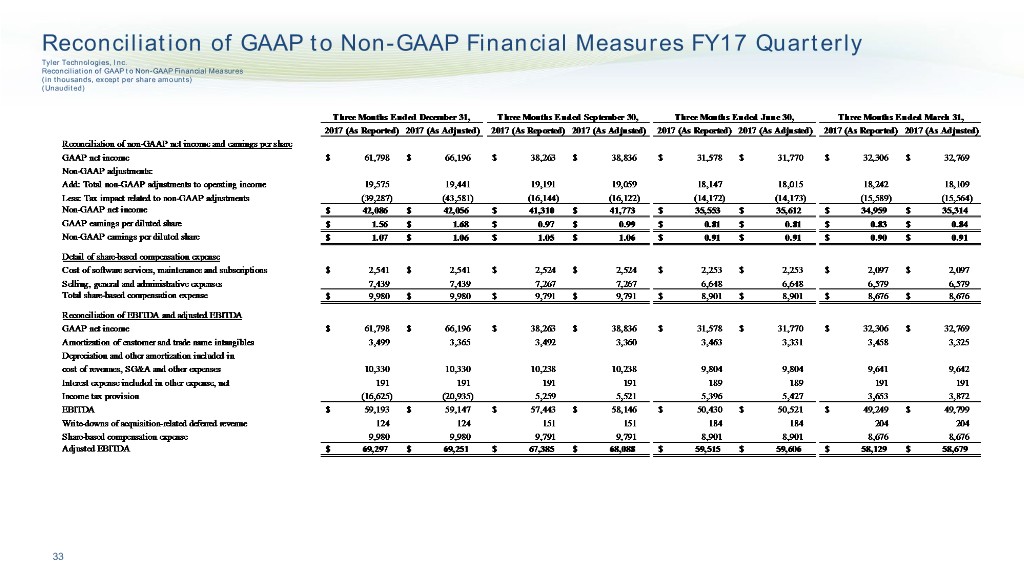
Reconciliation of GAAP to Non-GAAP Financial Measures FY17 Quarterly Tyler Technologies, Inc. Reconciliation of GAAP to Non-GAAP Financial Measures (in thousands, except per share amounts) (Unaudited) 33


