Raymond James 33rd Annual Institutional Investor Conference March 5, 2012

2 Raymond James 33rd Annual Institutional Investor Conference– March 5, 2012 Caution Regarding Forward-Looking Statements This report may contain or incorporate by reference information that includes or is based on forward-looking statements within the meaning of the safe-harbor provisions of the Private Securities Litigation Reform Act of 1995. Forward-looking statements give expectations or forecasts of future events, and can be identified by the fact that they relate to future actions, performance or results rather than strictly to historical or current facts. Any or all forward-looking statements may turn out to be wrong, and, accordingly, readers are cautioned not to place undue reliance on such statements, which speak only as of the date of this report. Forward-looking statements involve a number of risks and uncertainties that are difficult to predict, and are not guarantees of future performance. Among the general factors that could cause actual results to differ materially from estimated results are those listed in periodic reports filed by Kemper with the Securities and Exchange Commission (the "SEC"). No assurances can be given that the results contemplated in any forward-looking statements will be achieved or will be achieved in any particular timetable. Kemper assumes no obligation to publicly correct or update any forward- looking statements as a result of events or developments subsequent to the date of this report. The reader is advised, however, to consult any further disclosures Kemper makes on related subjects in its filings with the SEC. All data in this presentation is as of and for the year ending December 31, 2011 unless otherwise stated.

3 Raymond James 33rd Annual Institutional Investor Conference– March 5, 2012 Kemper Overview Multi-line national insurer • Top 25 personal lines property & casualty writer in United States • Auto, home & basic protection products • Multi-channel distribution network Conservative balance sheet with strong liquidity • $8.1B assets, $2.2B shareholders’ equity, 22% debt-to-capital ratio • 93% of fixed maturity portfolio rated investment grade History of opportunistic acquisitions & successful integrations Experienced management team All data in this presentation is as of and for the year ending December 31, 2011 unless otherwise stated.

4 Raymond James 33rd Annual Institutional Investor Conference– March 5, 2012 Business Profile: Kemper Family of Companies Property & Casualty Insurance $845MM1 statutory surplus Life & Health Insurance $475MM1 statutory surplus Overall Business Preferred Specialty Direct Home Service Companies Reserve National Total employees ~6,500 Distribution Independent agents Independent agents Direct mail, internet, affinity employer sponsored benefit plans Career agents Exclusive independent agents Total distribution relationships ~13,500 Target market Middle to upper middle income Broad-based Broad-based Modest income Modest to middle income; rural Total number of customers ~6MM Primary Offerings Personal lines, auto & homeowners Non-standard auto (personal & commercial) Personal lines, auto & homeowners Life, limited benefit A&H, fire Limited benefit & supplemental A&H 1 P&C includes $14MM from Capitol County Mutual Fire Insurance Company, an affiliated mutual insurance company owned by its policyholders
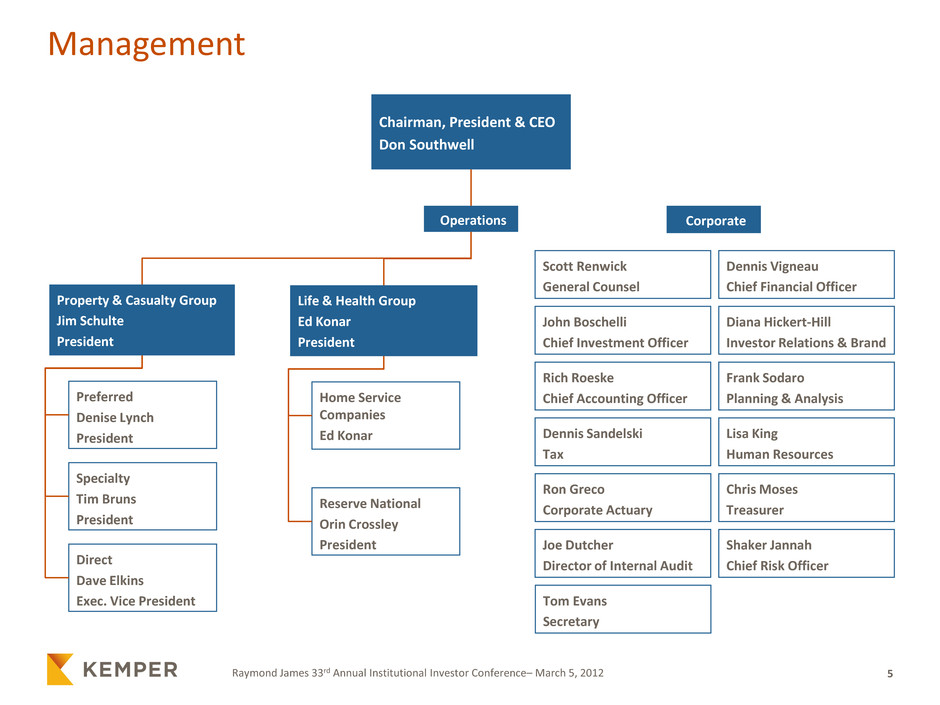
5 Raymond James 33rd Annual Institutional Investor Conference– March 5, 2012 Management Life & Health Group Ed Konar President Property & Casualty Group Jim Schulte President Chairman, President & CEO Don Southwell Corporate Operations Preferred Denise Lynch President Ron Greco Corporate Actuary Scott Renwick General Counsel Specialty Tim Bruns President Direct Dave Elkins Exec. Vice President Home Service Companies Ed Konar Reserve National Orin Crossley President Lisa King Human Resources Dennis Vigneau Chief Financial Officer Chris Moses Treasurer John Boschelli Chief Investment Officer Frank Sodaro Planning & Analysis Joe Dutcher Director of Internal Audit Rich Roeske Chief Accounting Officer Diana Hickert-Hill Investor Relations & Brand Dennis Sandelski Tax Shaker Jannah Chief Risk Officer Tom Evans Secretary

6 Raymond James 33rd Annual Institutional Investor Conference– March 5, 2012 Earned Premiums ($ M M ) Accident & Health Fire & Other Commercial Auto Homeowners 298 Life 397 Personal Auto 1,249 44 162 139 Personal Auto 1,130 Life 395 Homeowners 304 Accident & Health 166 Fire & Other 139 Commercial Auto 40 2010: $2,289MM 2011: $2,174MM ($ M M )
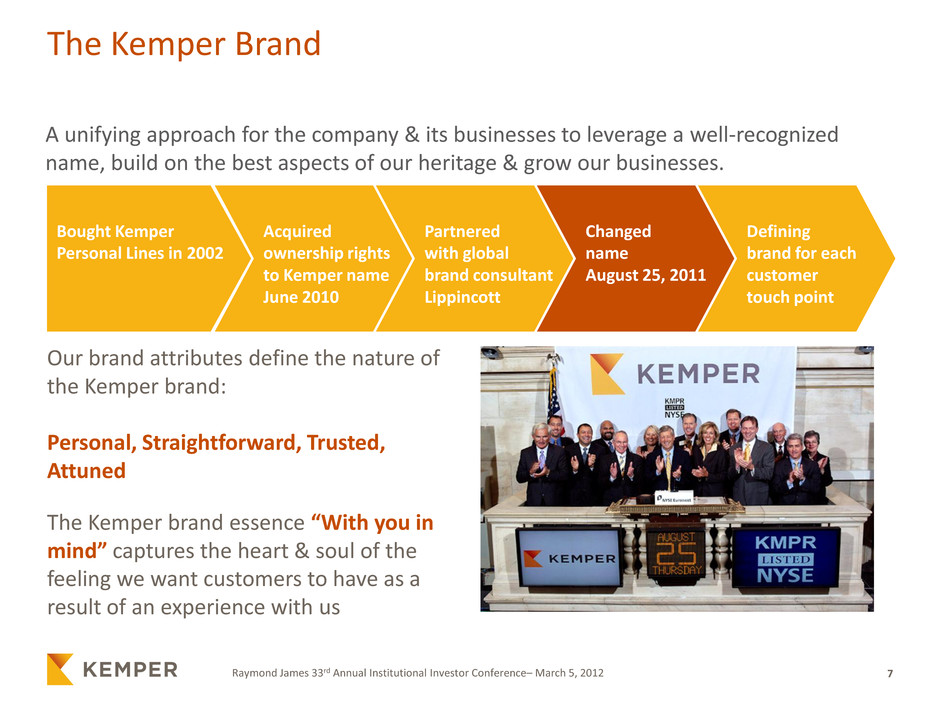
7 Raymond James 33rd Annual Institutional Investor Conference– March 5, 2012 The Kemper Brand A unifying approach for the company & its businesses to leverage a well-recognized name, build on the best aspects of our heritage & grow our businesses. Acquired ownership rights to Kemper name June 2010 Bought Kemper Personal Lines in 2002 Partnered with global brand consultant Lippincott Changed name August 25, 2011 Defining brand for each customer touch point Our brand attributes define the nature of the Kemper brand: Personal, Straightforward, Trusted, Attuned The Kemper brand essence “With you in mind” captures the heart & soul of the feeling we want customers to have as a result of an experience with us
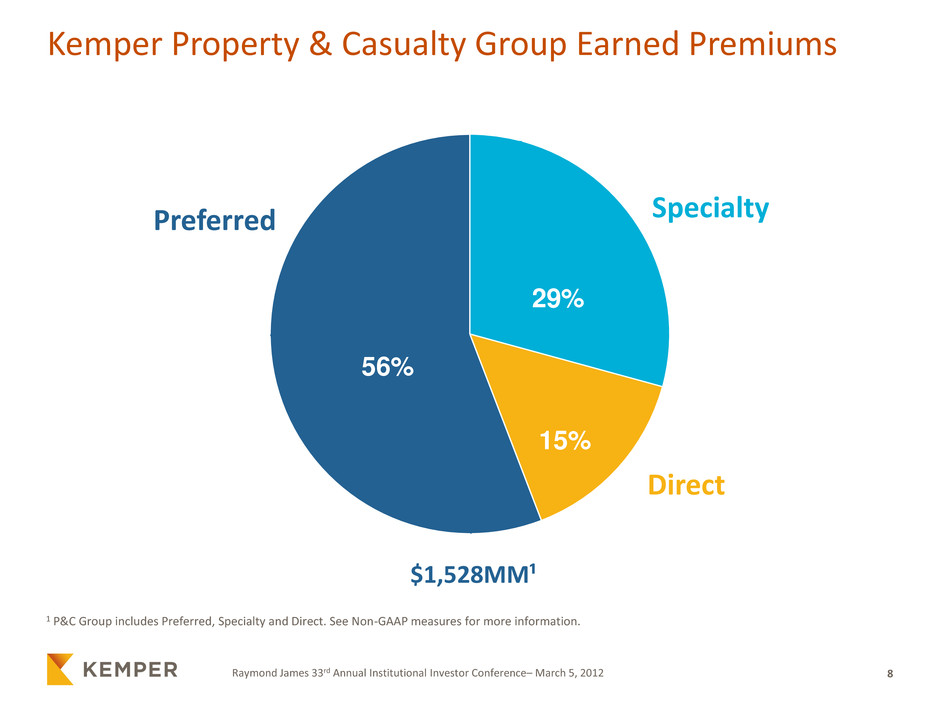
8 Raymond James 33rd Annual Institutional Investor Conference– March 5, 2012 Kemper Property & Casualty Group Earned Premiums 56% 15% 29% $1,528MM¹ 1 P&C Group includes Preferred, Specialty and Direct. See Non-GAAP measures for more information. Specialty Preferred Direct
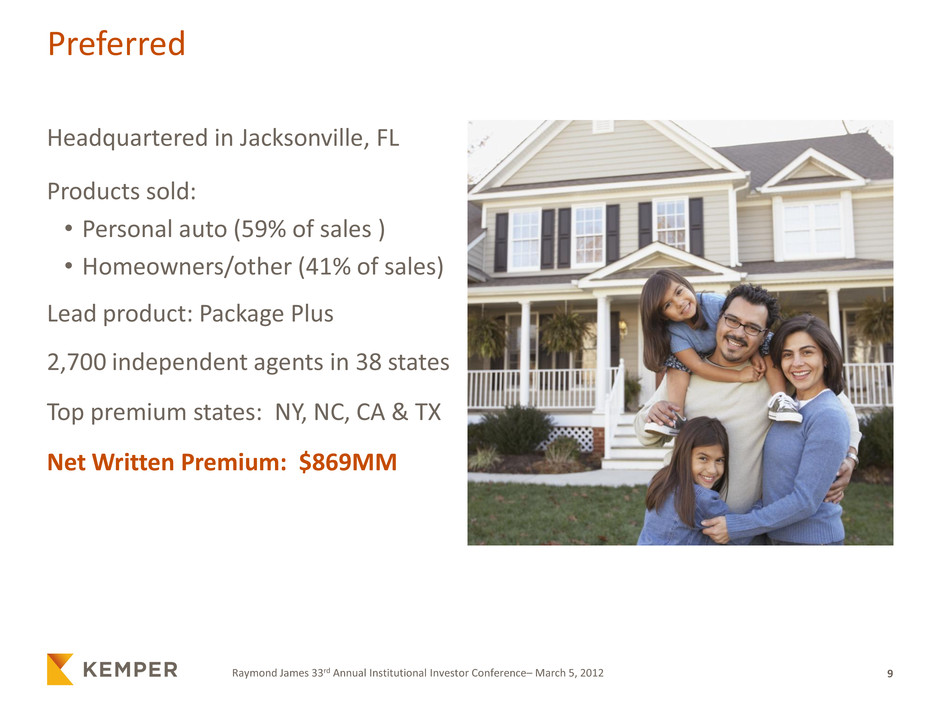
9 Raymond James 33rd Annual Institutional Investor Conference– March 5, 2012 Preferred Headquartered in Jacksonville, FL Products sold: • Personal auto (59% of sales ) • Homeowners/other (41% of sales) Lead product: Package Plus 2,700 independent agents in 38 states Top premium states: NY, NC, CA & TX Net Written Premium: $869MM
10 Raymond James 33rd Annual Institutional Investor Conference– March 5, 2012 Preferred Advantages Strong brand name well-recognized by agents and target market Auto and home package policies specifically designed for target market Proprietary multi-variant pricing model Automation and service built for agency convenience Claims handling focused on high quality customer service, supported by a shared services group

11 Raymond James 33rd Annual Institutional Investor Conference– March 5, 2012 Specialty Headquartered in Dallas, TX Non-standard auto —personal & commercial ~8,000 independent agents in 21 states Target market is top tier of insureds ineligible for Preferred &/or Standard Focused on automation & agent convenience Top premium states: CA & TX Net Written Premium: $438MM

12 Raymond James 33rd Annual Institutional Investor Conference– March 5, 2012 Specialty Advantages Recognized carrier in the non-standard auto market for over 60 years Strong regional presence expandable to more states Point of sale systems designed for ease of placement Proprietary multivariate pricing model Claims handling designed for the unique challenges of non-standard auto, supported by a shared services claims organization

13 Raymond James 33rd Annual Institutional Investor Conference– March 5, 2012 Direct Headquartered in Chicago, IL Direct to consumer auto, homeowners and renters Recent enhancements: • Redesigned customer website • New proprietary product (now active in 14 states) • Expanding social networking insurance platform Focused on margin improvement Net Written Premium: $209MM

14 Raymond James 33rd Annual Institutional Investor Conference– March 5, 2012 Direct Advantages Experienced in the direct, worksite & affinity marketplace Complete on-line life cycle access for ease of doing business • Targeting middle market to standard consumers—renters with above average underwriting characteristics • Partnering with property management companies to provide renters insurance for pre-screened tenants • Customizable product options & cross selling capabilities Leveraging claims and other back office infrastructure
15 Raymond James 33rd Annual Institutional Investor Conference– March 5, 2012 Life & Health Insurance Group ~2,600 career agents Target modest income consumers Basic protection for individuals and families Leading product is ordinary life insurance, including permanent & term insurance No exposure to variable annuities Operate in 25 states 2011 Earned Premiums $511MM ~275 exclusive independent agents Target under-served rural markets Key products include limited benefit medical plans, Medicare Supplement and other supplemental accident & health insurance 2011 Earned Premiums $135MM Reserve National Home Service Companies
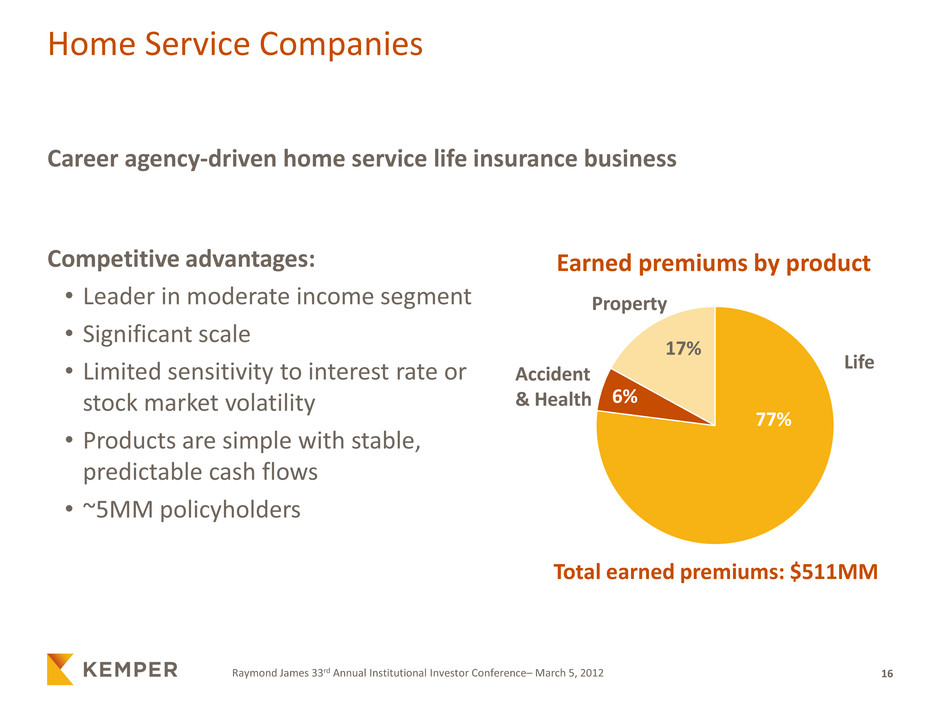
16 Raymond James 33rd Annual Institutional Investor Conference– March 5, 2012 Home Service Companies Career agency-driven home service life insurance business Competitive advantages: • Leader in moderate income segment • Significant scale • Limited sensitivity to interest rate or stock market volatility • Products are simple with stable, predictable cash flows • ~5MM policyholders Earned premiums by product Property Accident & Health Life 17% 6% 77% Total earned premiums: $511MM
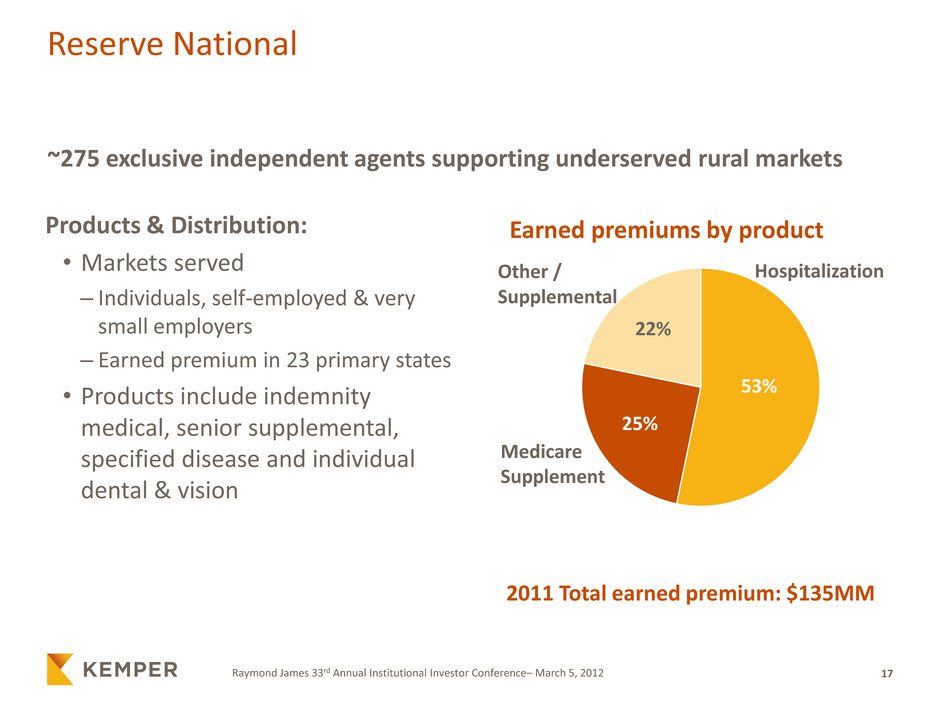
17 Raymond James 33rd Annual Institutional Investor Conference– March 5, 2012 Reserve National ~275 exclusive independent agents supporting underserved rural markets 2011 Total earned premium: $135MM Earned premiums by product Other / Supplemental Medicare Supplement Hospitalization 22% 25% 53% Products & Distribution: • Markets served – Individuals, self-employed & very small employers – Earned premium in 23 primary states • Products include indemnity medical, senior supplemental, specified disease and individual dental & vision
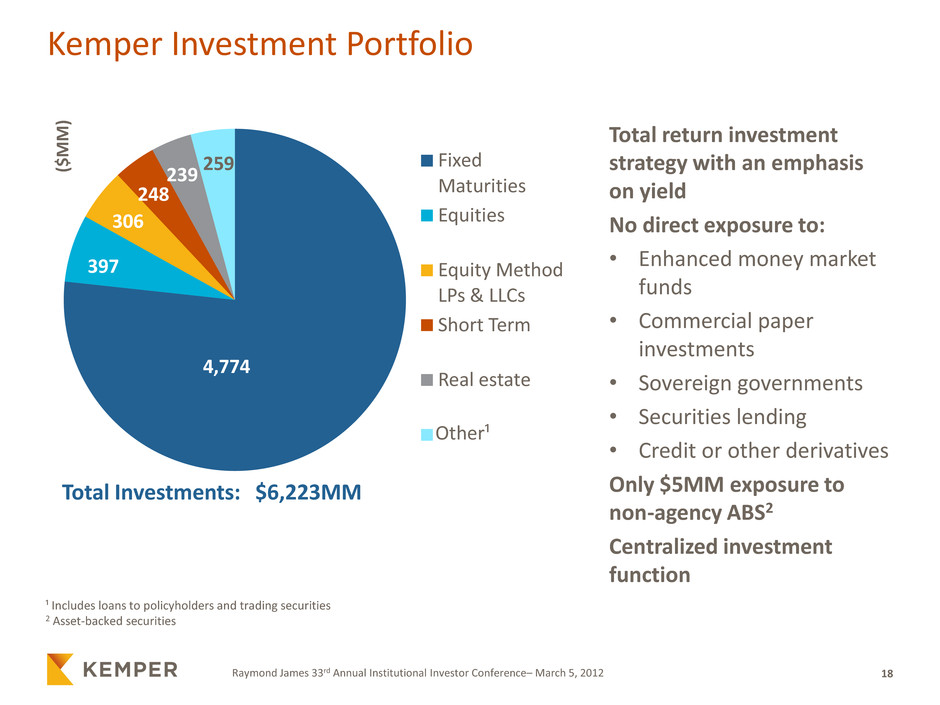
18 Raymond James 33rd Annual Institutional Investor Conference– March 5, 2012 Kemper Investment Portfolio Total return investment strategy with an emphasis on yield No direct exposure to: • Enhanced money market funds • Commercial paper investments • Sovereign governments • Securities lending • Credit or other derivatives Only $5MM exposure to non-agency ABS2 Centralized investment function ¹ Includes loans to policyholders and trading securities 2 Asset-backed securities Fixed Maturities Equities Equity Method LPs & LLCs Short Term Real estate Other1 259 t r¹ 4,774 ($ M M ) 397 306 248 239 Total Investments: $6,223MM
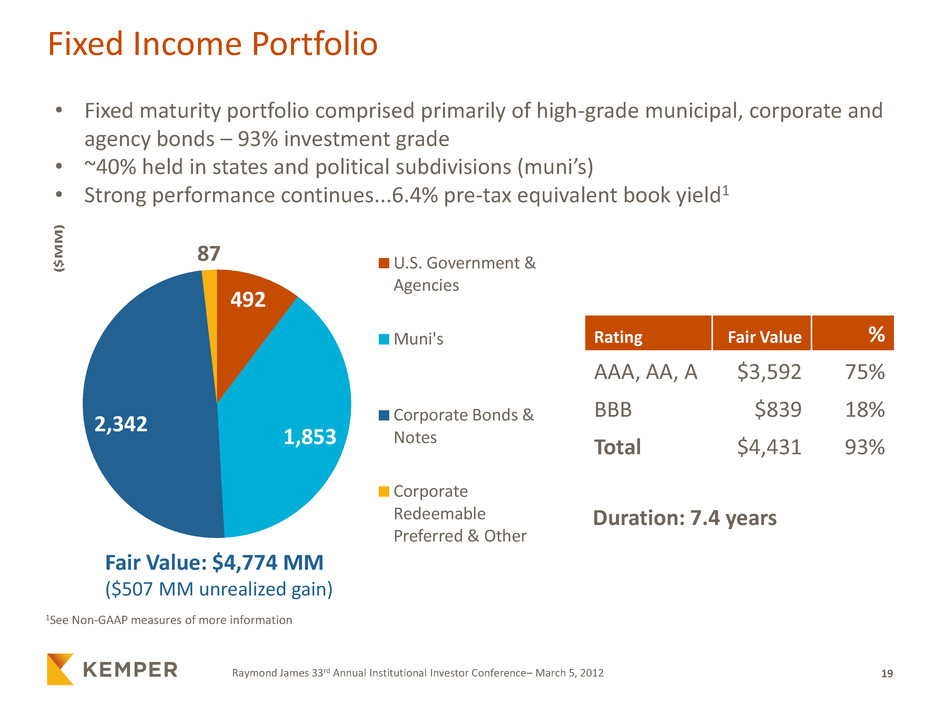
19 Raymond James 33rd Annual Institutional Investor Conference– March 5, 2012 Fixed Income Portfolio 492 1,853 2,342 87 U.S. Government & Agencies Muni's Corporate Bonds & Notes Corporate Redeemable Preferred & Other Fair Value: $4,774 MM ($507 MM unrealized gain) Rating Fair Value % AAA, AA, A $3,592 75% BBB $839 18% Total $4,431 93% • Fixed maturity portfolio comprised primarily of high-grade municipal, corporate and agency bonds – 93% investment grade • ~40% held in states and political subdivisions (muni’s) • Strong performance continues...6.4% pre-tax equivalent book yield1 1See Non-GAAP measures of more information Duration: 7.4 years

Financial Results

21 Raymond James 33rd Annual Institutional Investor Conference– March 5, 2012 (Millions) 2011 2010 Change Revenues: Earned Premiums: Property & Casualty Group¹ 1,528$ 1,645$ -7.1% Focus on preserving margins Life and Health 646 644 0.3% Net Investment Income 298 326 -8.6% Equity method fluctuations Other Income 1 1 0.0% Net Realized Investment Gains 22 26 -15.4% Total Revenues 2,495 2,642 -5.6% Expenses: Incurred Losses and LAE: Property & Casualty Group 1,260 1,241 1.5% 2011 Includes $164MM pre-tax Life and Health 386 406 -4.9% catastrophe losses Insurance Expenses 669 676 -1.0% Write-off of Intangible Assets 13 15 -13.3% 2011 Direct; 2010 Reserve National Interest and Other Expenses 84 68 23.5% Pension and Interest Expenses Total Expenses 2,412 2,406 0.2% Income Tax Benefit (Expense) (12) (67) -82.1% Net Income from Continuing Ops. 71$ 169$ -58.0% Total Net Income 84$ 185$ -54.6% Comments Year Ended Consolidated Results of Operations Kemper Corporation & subsidiaries 1 P&C Group includes Preferred, Specialty and Direct. See Non-GAAP measures for more information.

22 Raymond James 33rd Annual Institutional Investor Conference– March 5, 2012 Consolidated Balance Sheet Kemper Corporation & subsidiaries (Millions) 2011 2010 Change Assets: Cash and Investments: Fixed Maturities at Fair Value $ 4,774 $ 4,475 6.7% Equity Method LLC/LP 306 328 -6.7% Equity Securities 397 551 -27.9% Reduced concentration of Intermec/ETFs Other Investments 498 494 0.8% Cash & Short-term Inv. 499 520 -4.0% Total Cash & Investments 6,474 6,368 1.7% Receivables from Policyholders 379 389 -2.6% Other Receivables 219 555 -60.5% Sold Fireside's active loan portfolio Deferred Acquisition Costs 448 426 5.2% Goodwill 312 312 0.0% Other Assets 254 308 -17.5% Total Assets $ 8,086 $ 8,358 -3.3% Liabilities & Shareholders' Equity: Insurance Reserves $ 4,132 $ 4,182 -1.2% Unearned Premiums 666 679 -1.9% Certificates of Deposits - 321 -100.0% Early redemption of CDs at Fireside Debt 611 610 0.2% Other Liabilities 461 453 1.8% Total Liabilities 5,870 6,245 -6.0% Shareholders' Equity 2,216 2,113 4.9% Total Liabilities & Shareholders' Equity $ 8,086 $ 8,358 -3.3% Comments

23 Raymond James 33rd Annual Institutional Investor Conference– March 5, 2012 0.6 0.6 0.6 1.9 2.1 2.2 2009 2010 2011 Strong Liquidity & Capital Profiles Max ordinary dividend capacity1 (Insurance Companies) ¹ Calculated as the greater of 10% of insurance statutory surplus or insurance statutory net income from the prior year 2 See Non-GAAP measures for more information 2009 2010 2011 ($ M M ) 127 140 185 Net Dividends ($MM) 2009 2010 2011 Insurance Sub 160 79 71 Risk-Based Capital (%) Life & Health 287 377 447 P&C 236 276 281 2.5 2.7 2.8 Shareholders’ Equity Senior Debt 2009 2010 2011 Debt to Total Capital 23% 22% 22% Statutory Interest Coverage² 5X 7X 6X Available Credit Facility ($MM) $245 $245 $245 ($ B ) Balance sheet flexibility improving • Portfolio shifts following the economic crisis reduced overall sensitivity to equity market fluctuations • Liquidity remains high & interest coverage ratios have improved significantly • Well-positioned to fund growth & manage risks

24 Raymond James 33rd Annual Institutional Investor Conference– March 5, 2012 2009 2010 2011 Shareholders’ Equity ¹ Accumulated Other Comprehensive Income 2 $1.76 EPS impact from 2011 catastrophes vs. $0.83 and $0.64 in 2010 and 2009, respectively ³Computed by annualizing 4th quarter dividend and dividing by year-end market price ($ MM ) 1,859 1,918 1,956 2,113 1,958 2,216 2009 2010 2011 BVPS ($) 30.75 34.61 36.78 EPS ($) 2.642 2.982 1.382 Dividend Per Share ($) 1.07 0.88 0.96 Buy Backs ($MM) - 34.4 27.4 Dividend Yield 3.60%³ 3.60% 3.30% Excluding AOCI1 AOCI1
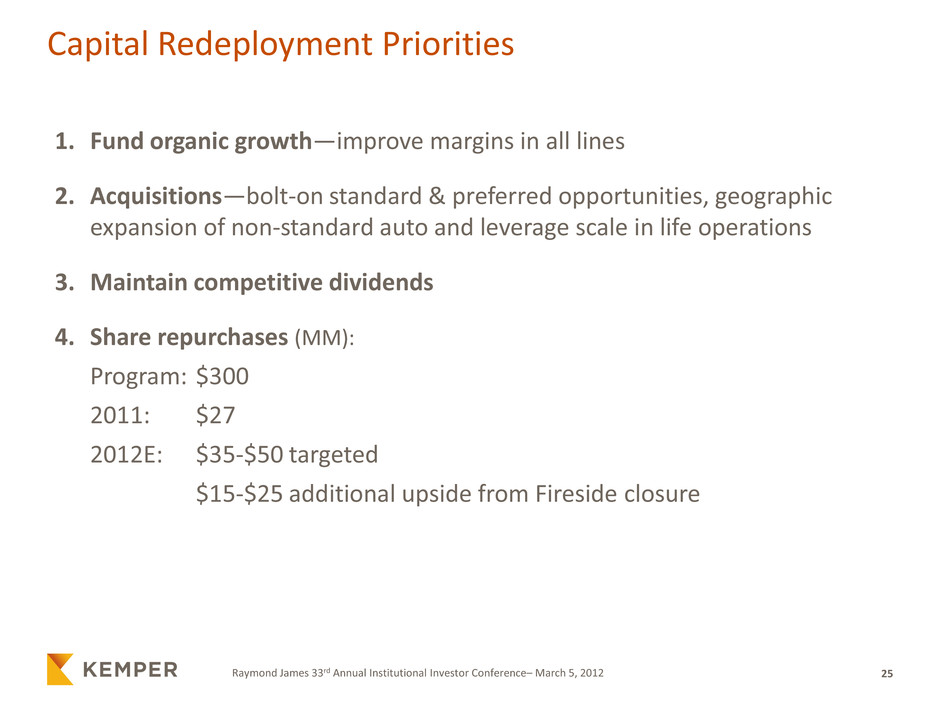
25 Raymond James 33rd Annual Institutional Investor Conference– March 5, 2012 1. Fund organic growth—improve margins in all lines 2. Acquisitions—bolt-on standard & preferred opportunities, geographic expansion of non-standard auto and leverage scale in life operations 3. Maintain competitive dividends 4. Share repurchases (MM): Program: $300 2011: $27 2012E: $35-$50 targeted $15-$25 additional upside from Fireside closure Capital Redeployment Priorities

Operating Results
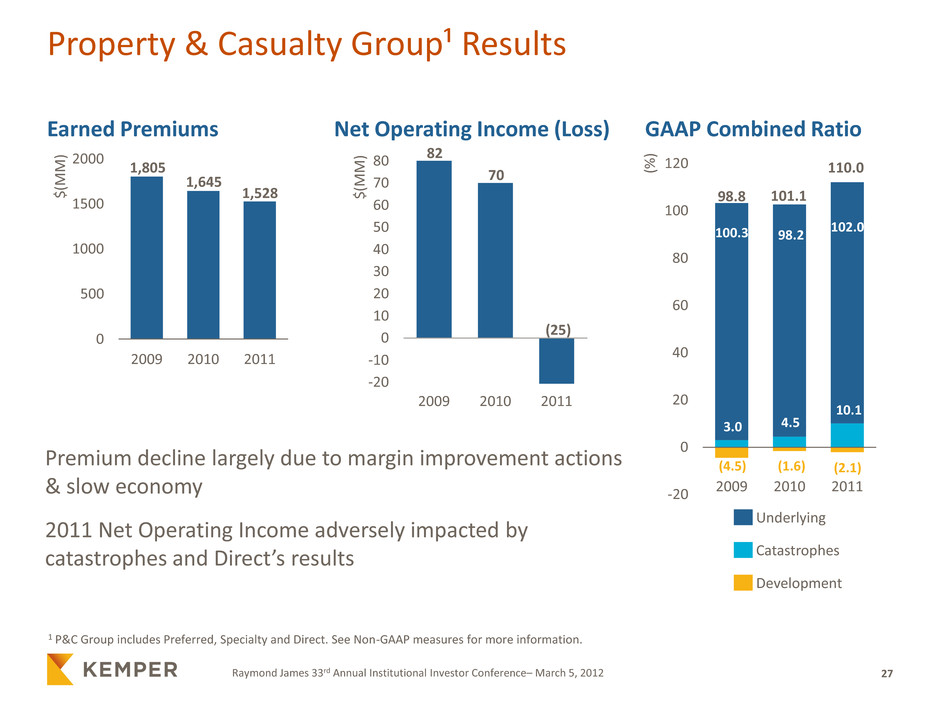
27 Raymond James 33rd Annual Institutional Investor Conference– March 5, 2012 Property & Casualty Group¹ Results Premium decline largely due to margin improvement actions & slow economy 2011 Net Operating Income adversely impacted by catastrophes and Direct’s results Earned Premiums Net Operating Income (Loss) GAAP Combined Ratio 0 500 1000 1500 2000 2009 2010 2011 $( M M ) -20 -10 0 10 20 30 40 50 60 70 80 2009 2010 2011 $( M M ) -20 0 20 40 60 80 100 120 2009 2010 2011 (% ) 1,805 1,645 (25) 82 70 1,528 98.8 101.1 110.0 100.3 98.2 102.0 3.0 4.5 10.1 (4.5) (1.6) (2.1) Underlying Catastrophes Development 1 P&C Group includes Preferred, Specialty and Direct. See Non-GAAP measures for more information.
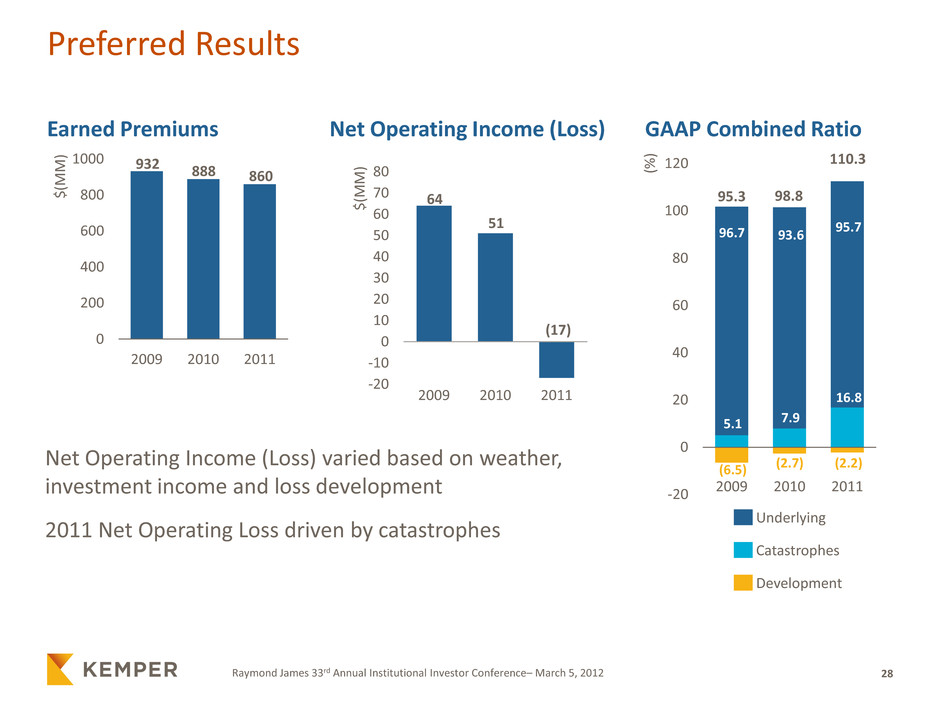
28 Raymond James 33rd Annual Institutional Investor Conference– March 5, 2012 Preferred Results Net Operating Income (Loss) varied based on weather, investment income and loss development 2011 Net Operating Loss driven by catastrophes Earned Premiums Net Operating Income (Loss) GAAP Combined Ratio 0 200 400 600 800 1000 2009 2010 2011 $( M M ) -20 -10 0 10 20 30 40 50 60 70 80 2009 2010 2011 $( M M ) -20 0 20 40 60 80 100 120 2009 2010 2011 (% ) 932 888 (17) 64 51 860 95.3 98.8 110.3 96.7 93.6 95.7 5.1 7.9 16.8 (6.5) (2.7) (2.2) Underlying Catastrophes Development
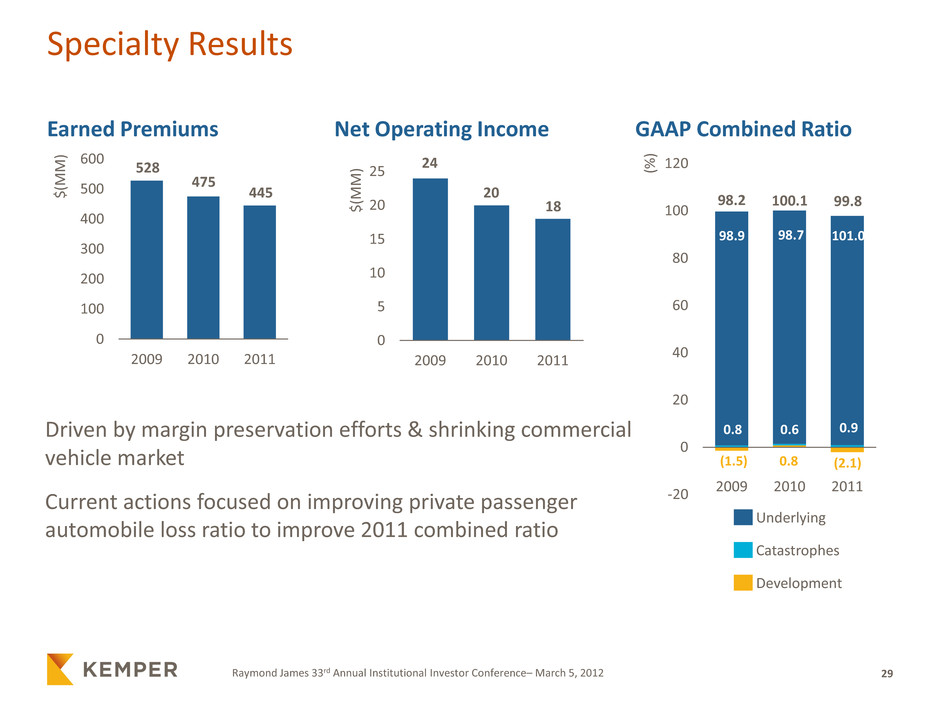
29 Raymond James 33rd Annual Institutional Investor Conference– March 5, 2012 Specialty Results Driven by margin preservation efforts & shrinking commercial vehicle market Current actions focused on improving private passenger automobile loss ratio to improve 2011 combined ratio Earned Premiums Net Operating Income GAAP Combined Ratio 0 100 200 300 400 500 600 2009 2010 2011 $( M M ) 0 5 10 15 20 25 2009 2010 2011 $( M M ) -20 0 20 40 60 80 100 120 2009 2010 2011 (% ) 528 475 18 24 20 445 98.2 100.1 99.8 98.9 98.7 101.0 0.8 0.6 0.9 (1.5) 0.8 (2.1) Underlying Catastrophes Development
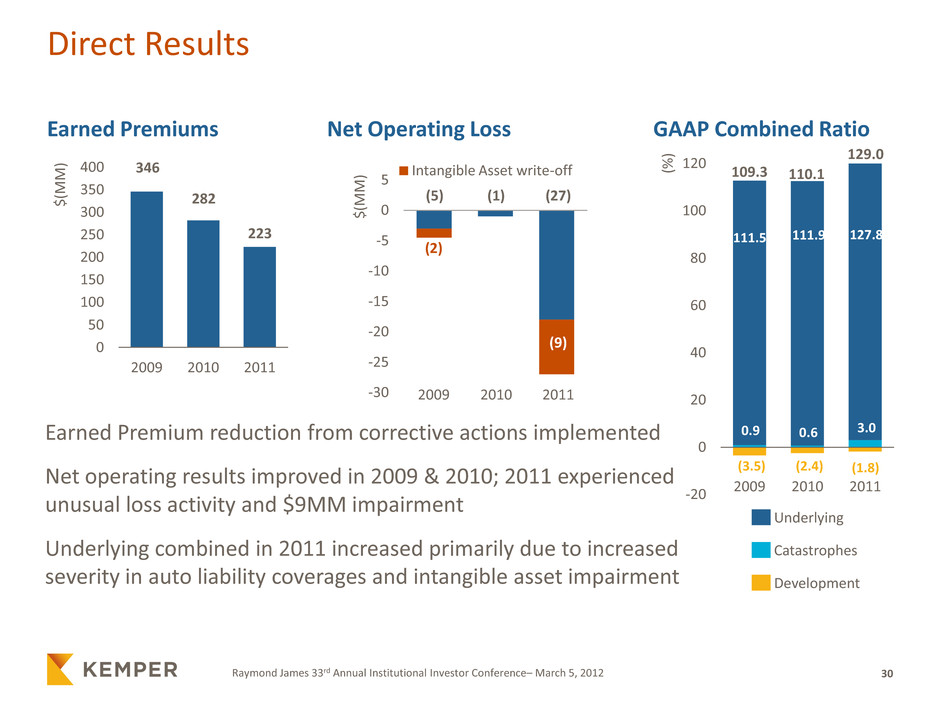
30 Raymond James 33rd Annual Institutional Investor Conference– March 5, 2012 Direct Results Earned Premium reduction from corrective actions implemented Net operating results improved in 2009 & 2010; 2011 experienced unusual loss activity and $9MM impairment Underlying combined in 2011 increased primarily due to increased severity in auto liability coverages and intangible asset impairment Earned Premiums Net Operating Loss GAAP Combined Ratio 0 50 100 150 200 250 300 350 400 2009 2010 2011 $( M M ) -30 -25 -20 -15 -10 -5 0 5 $( M M ) Intangible Asset write-off -20 0 20 40 60 80 100 120 2009 2010 2011 (% ) 346 282 (27) (5) (1) 223 109.3 110.1 129.0 111.5 111.9 127.8 0.9 0.6 3.0 (3.5) (2.4) (1.8) 2009 2010 2011 Underlying Catastrophes Development (9) (2)
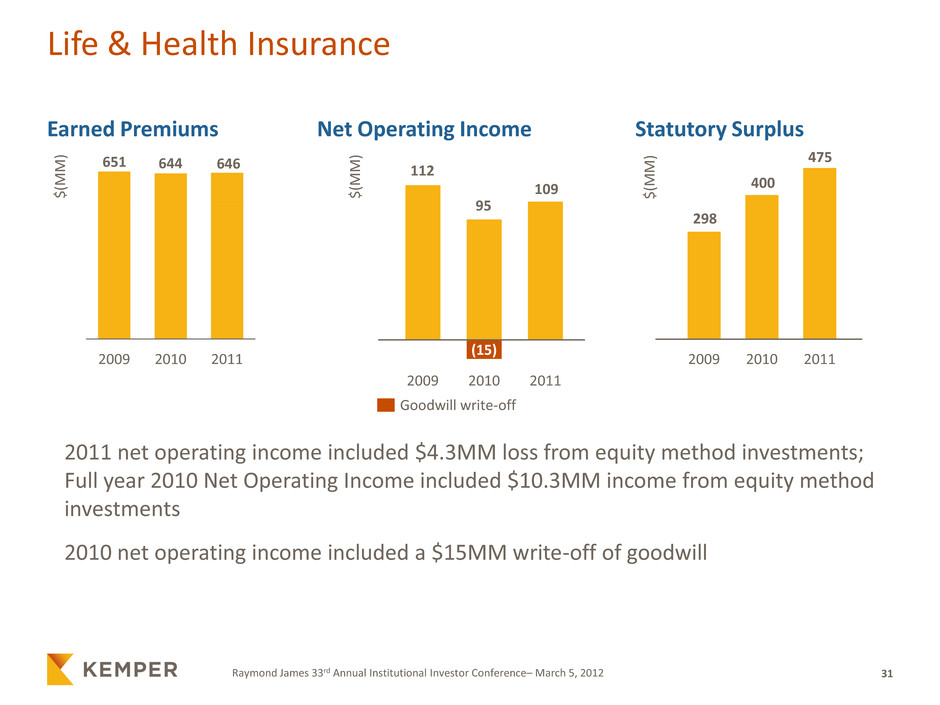
31 Raymond James 33rd Annual Institutional Investor Conference– March 5, 2012 Life & Health Insurance 2011 net operating income included $4.3MM loss from equity method investments; Full year 2010 Net Operating Income included $10.3MM income from equity method investments 2010 net operating income included a $15MM write-off of goodwill Earned Premiums Net Operating Income Statutory Surplus 2009 2010 2011 $( M M ) (15) 2009 2010 2011 $( M M ) 2009 2010 2011 $( M M ) 651 644 646 112 95 109 298 400 475 Goodwill write-off
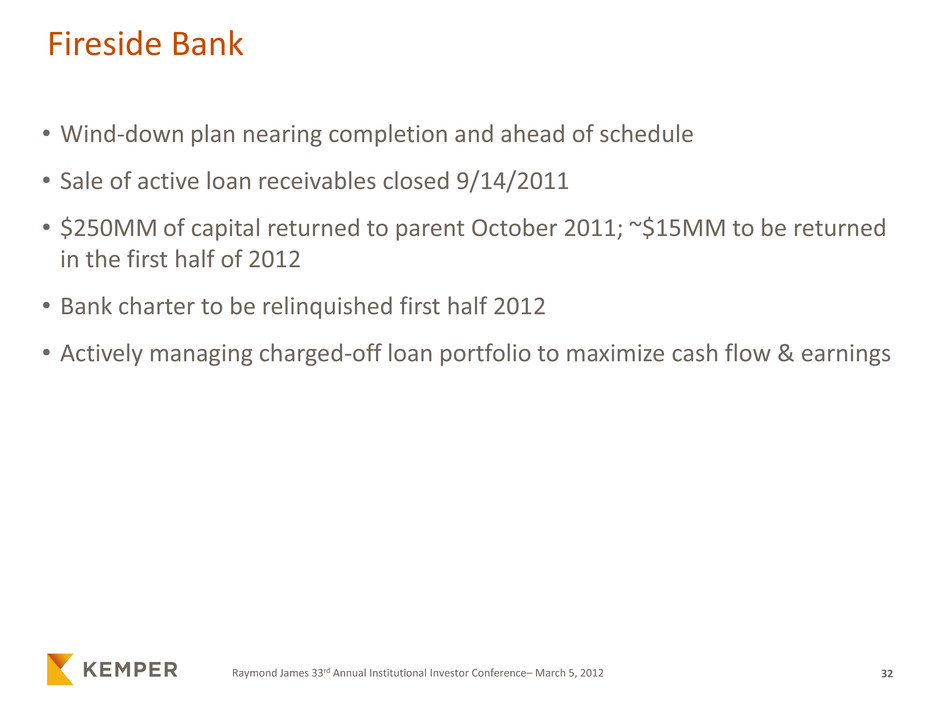
32 Raymond James 33rd Annual Institutional Investor Conference– March 5, 2012 Fireside Bank • Wind-down plan nearing completion and ahead of schedule • Sale of active loan receivables closed 9/14/2011 • $250MM of capital returned to parent October 2011; ~$15MM to be returned in the first half of 2012 • Bank charter to be relinquished first half 2012 • Actively managing charged-off loan portfolio to maximize cash flow & earnings

Appendix
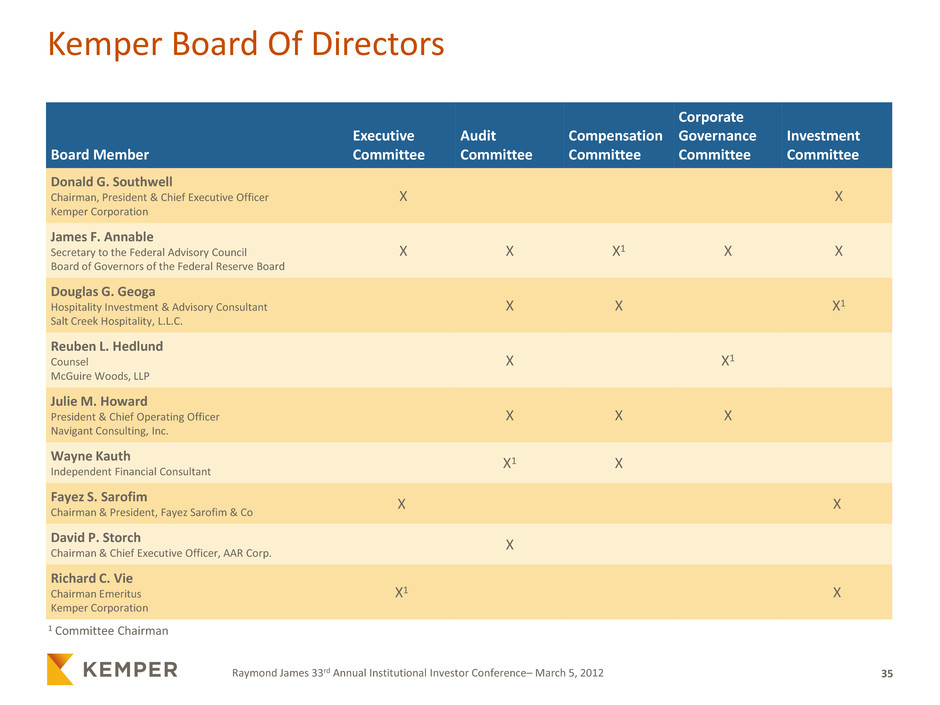
35 Raymond James 33rd Annual Institutional Investor Conference– March 5, 2012 Kemper Board Of Directors Board Member Executive Committee Audit Committee Compensation Committee Corporate Governance Committee Investment Committee Donald G. Southwell Chairman, President & Chief Executive Officer Kemper Corporation X X James F. Annable Secretary to the Federal Advisory Council Board of Governors of the Federal Reserve Board X X X1 X X Douglas G. Geoga Hospitality Investment & Advisory Consultant Salt Creek Hospitality, L.L.C. X X X1 Reuben L. Hedlund Counsel McGuire Woods, LLP X X1 Julie M. Howard President & Chief Operating Officer Navigant Consulting, Inc. X X X Wayne Kauth Independent Financial Consultant X1 X Fayez S. Sarofim Chairman & President, Fayez Sarofim & Co X X David P. Storch Chairman & Chief Executive Officer, AAR Corp. X Richard C. Vie Chairman Emeritus Kemper Corporation X1 X 1 Committee Chairman
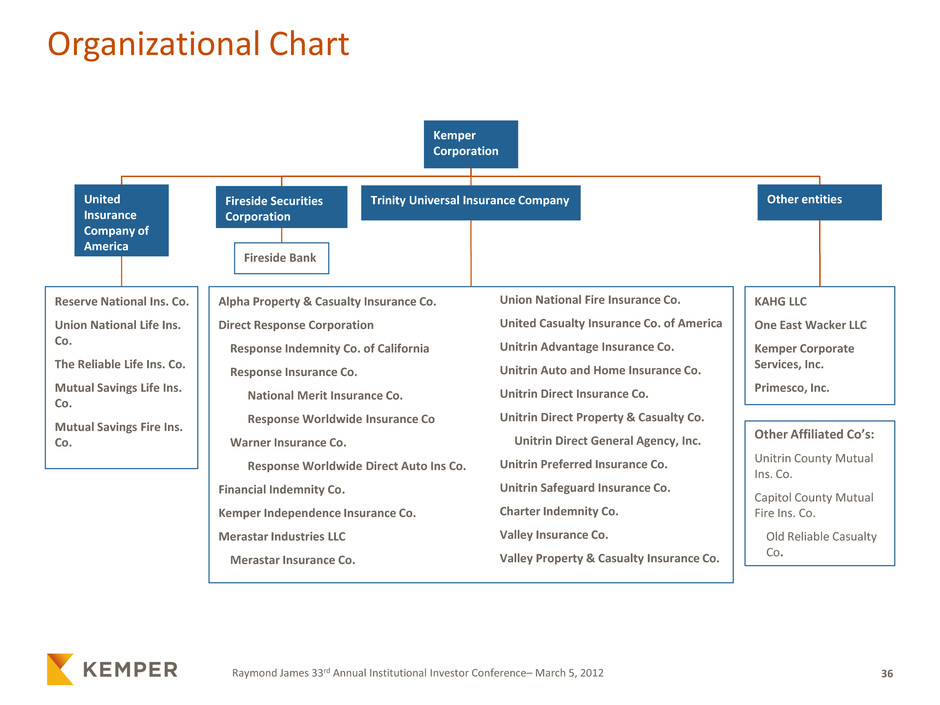
36 Raymond James 33rd Annual Institutional Investor Conference– March 5, 2012 Organizational Chart Reserve National Ins. Co. Union National Life Ins. Co. The Reliable Life Ins. Co. Mutual Savings Life Ins. Co. Mutual Savings Fire Ins. Co. Kemper Corporation Other entities Fireside Securities Corporation Trinity Universal Insurance Company United Insurance Company of America Fireside Bank Alpha Property & Casualty Insurance Co. Direct Response Corporation Response Indemnity Co. of California Response Insurance Co. National Merit Insurance Co. Response Worldwide Insurance Co Warner Insurance Co. Response Worldwide Direct Auto Ins Co. Financial Indemnity Co. Kemper Independence Insurance Co. Merastar Industries LLC Merastar Insurance Co. Union National Fire Insurance Co. United Casualty Insurance Co. of America Unitrin Advantage Insurance Co. Unitrin Auto and Home Insurance Co. Unitrin Direct Insurance Co. Unitrin Direct Property & Casualty Co. Unitrin Direct General Agency, Inc. Unitrin Preferred Insurance Co. Unitrin Safeguard Insurance Co. Charter Indemnity Co. Valley Insurance Co. Valley Property & Casualty Insurance Co. KAHG LLC One East Wacker LLC Kemper Corporate Services, Inc. Primesco, Inc. Other Affiliated Co’s: Unitrin County Mutual Ins. Co. Capitol County Mutual Fire Ins. Co. Old Reliable Casualty Co.
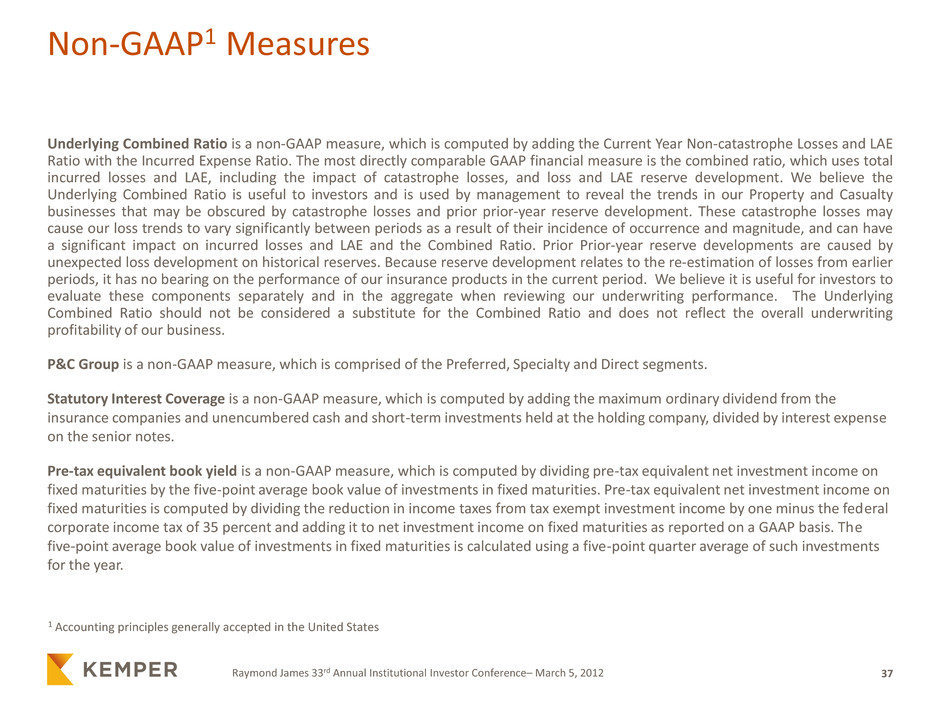
37 Raymond James 33rd Annual Institutional Investor Conference– March 5, 2012 Non-GAAP1 Measures Underlying Combined Ratio is a non-GAAP measure, which is computed by adding the Current Year Non-catastrophe Losses and LAE Ratio with the Incurred Expense Ratio. The most directly comparable GAAP financial measure is the combined ratio, which uses total incurred losses and LAE, including the impact of catastrophe losses, and loss and LAE reserve development. We believe the Underlying Combined Ratio is useful to investors and is used by management to reveal the trends in our Property and Casualty businesses that may be obscured by catastrophe losses and prior prior-year reserve development. These catastrophe losses may cause our loss trends to vary significantly between periods as a result of their incidence of occurrence and magnitude, and can have a significant impact on incurred losses and LAE and the Combined Ratio. Prior Prior-year reserve developments are caused by unexpected loss development on historical reserves. Because reserve development relates to the re-estimation of losses from earlier periods, it has no bearing on the performance of our insurance products in the current period. We believe it is useful for investors to evaluate these components separately and in the aggregate when reviewing our underwriting performance. The Underlying Combined Ratio should not be considered a substitute for the Combined Ratio and does not reflect the overall underwriting profitability of our business. P&C Group is a non-GAAP measure, which is comprised of the Preferred, Specialty and Direct segments. Statutory Interest Coverage is a non-GAAP measure, which is computed by adding the maximum ordinary dividend from the insurance companies and unencumbered cash and short-term investments held at the holding company, divided by interest expense on the senior notes. Pre-tax equivalent book yield is a non-GAAP measure, which is computed by dividing pre-tax equivalent net investment income on fixed maturities by the five-point average book value of investments in fixed maturities. Pre-tax equivalent net investment income on fixed maturities is computed by dividing the reduction in income taxes from tax exempt investment income by one minus the federal corporate income tax of 35 percent and adding it to net investment income on fixed maturities as reported on a GAAP basis. The five-point average book value of investments in fixed maturities is calculated using a five-point quarter average of such investments for the year. 1 Accounting principles generally accepted in the United States


