Fourth Quarter 2020 Earnings

Cautionary Statements Regarding Forward-Looking Information Non-GAAP Financial Measures Preliminary Matters 2

Create Long-Term Shareholder Value Leverage competitive advantages to grow returns and BVPS1 over time ¹ Book value per share 2 Return on equity Sustainable competitive advantages and build core capabilities Growing returns and book value per share over time Diversified sources of earnings; Strong capital/liquidity positions; Disciplined approach to capital management • • • Strategic focus: 3
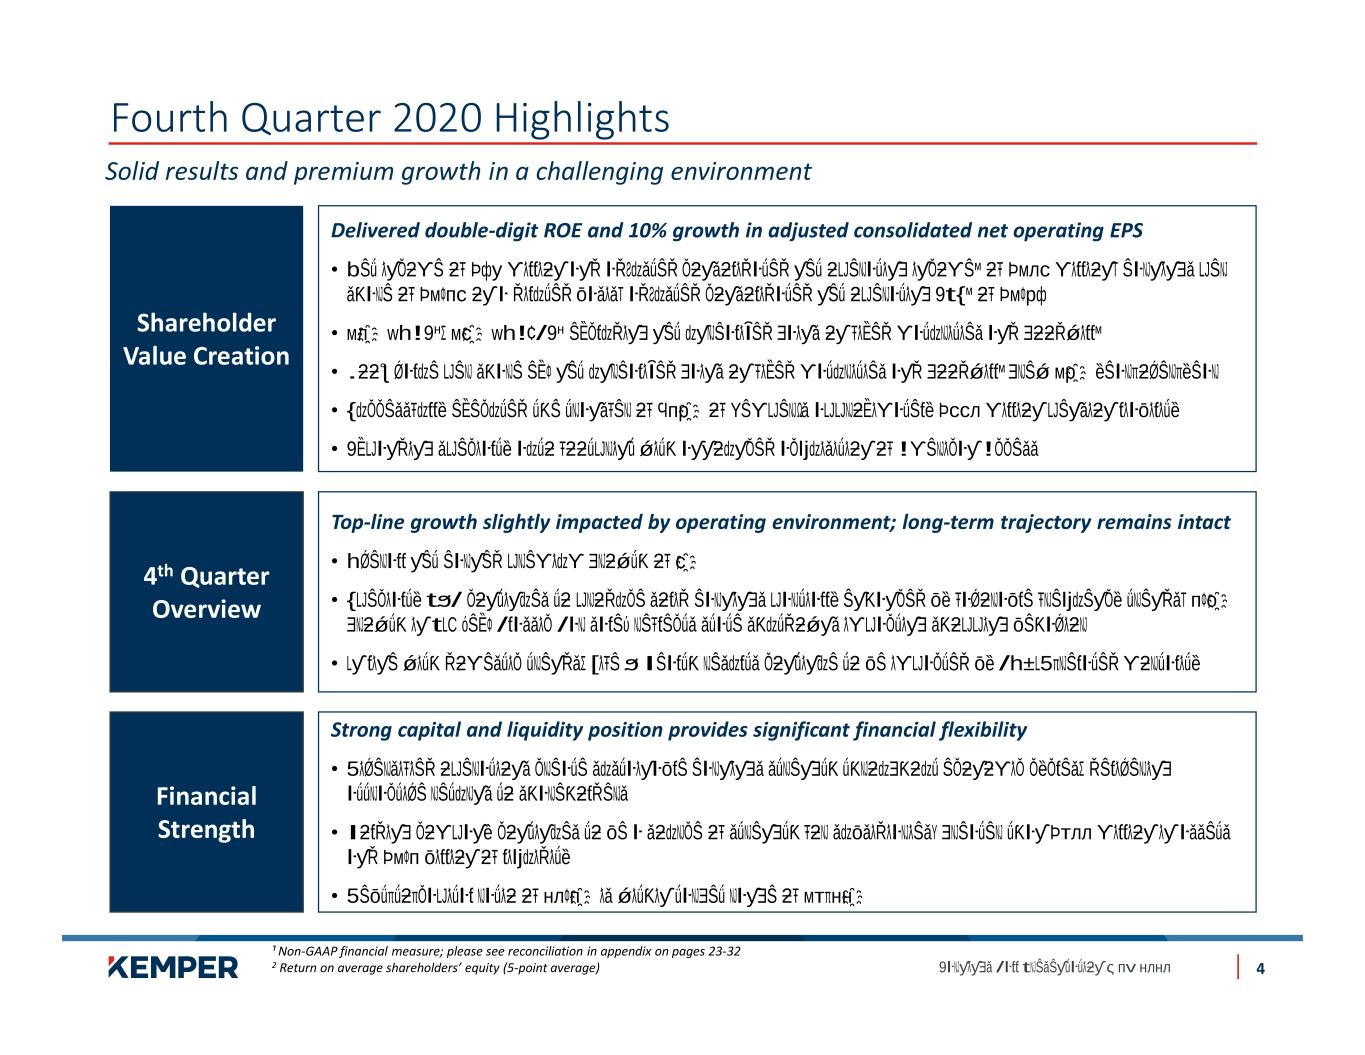
Fourth Quarter 2020 Highlights Solid results and premium growth in a challenging environment Top-line growth slightly impacted by operating environment; long-term trajectory remains intact • • • 4th Quarter Overview Delivered double-digit ROE and 10% growth in adjusted consolidated net operating EPS • • • • • Shareholder Value Creation ¹ Non-GAAP financial measure; please see reconciliation in appendix on pages 23-32 2 Return on average shareholders’ equity (5-point average) Strong capital and liquidity position provides significant financial flexibility • • • Financial Strength 4
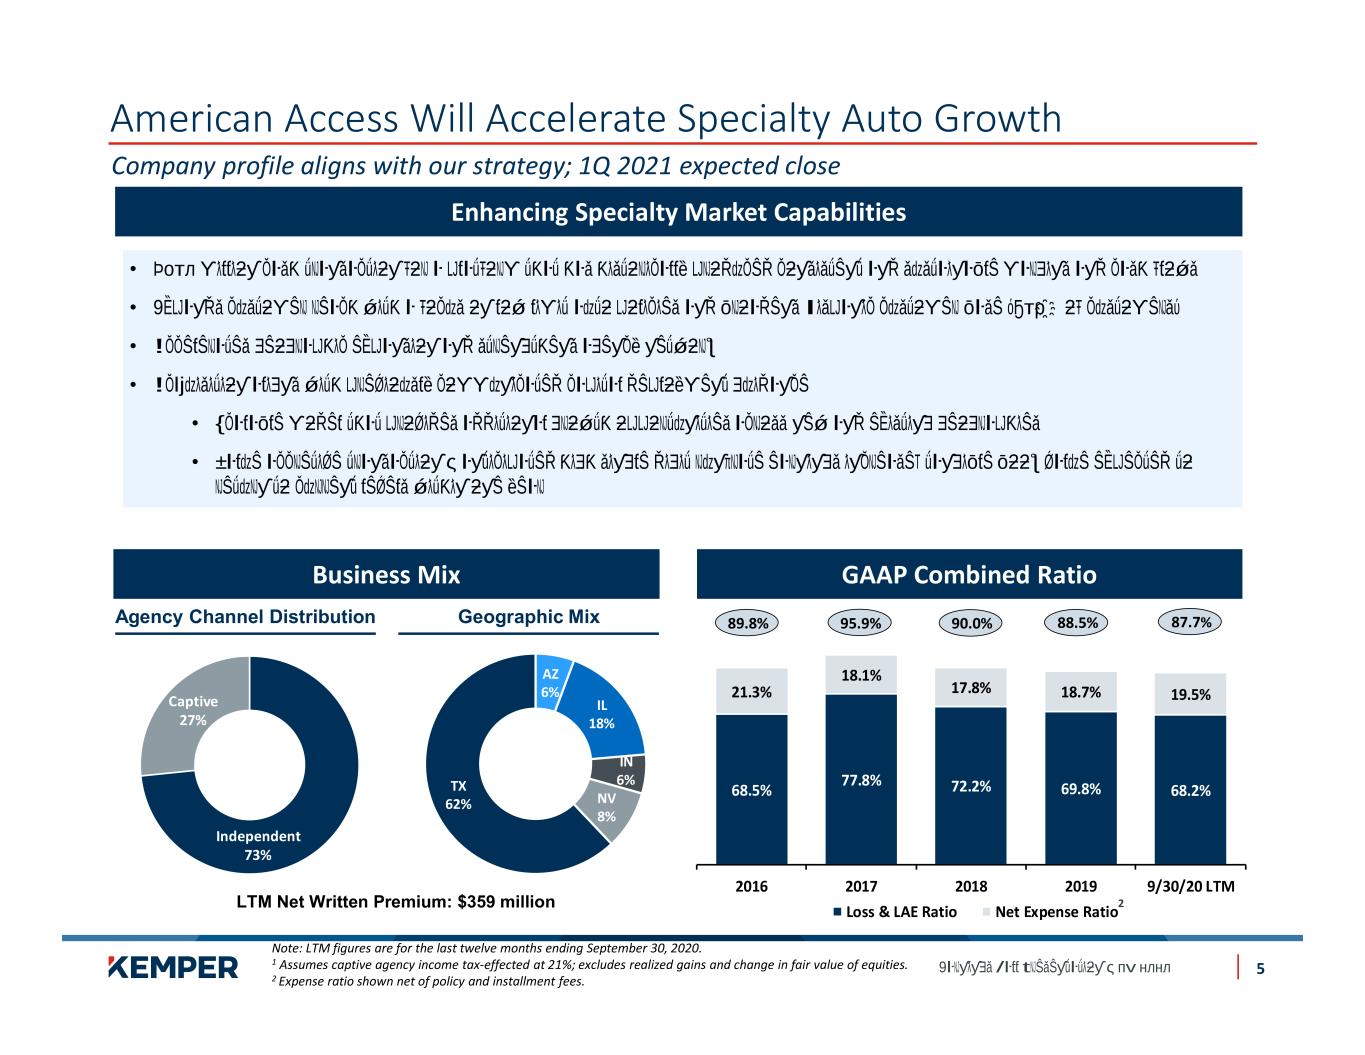
68.5% 77.8% 72.2% 69.8% 68.2% 21.3% 18.1% 17.8% 18.7% 19.5% 2016 2017 2018 2019 9/30/20 LTM Loss & LAE Ratio Net Expense Ratio 89.8% 95.9% 90.0% 88.5% AZ 6% IL 18% IN 6% NV 8% TX 62% GAAP Combined Ratio American Access Will Accelerate Specialty Auto Growth Company profile aligns with our strategy; 1Q 2021 expected close Business Mix Enhancing Specialty Market Capabilities 5 Agency Channel Distribution Geographic Mix LTM Net Written Premium: $359 million 2 • • • • • • Note: LTM figures are for the last twelve months ending September 30, 2020. 1 Assumes captive agency income tax-effected at 21%; excludes realized gains and change in fair value of equities. 2 Expense ratio shown net of policy and installment fees. 87.7% Independent 73% Captive 27%
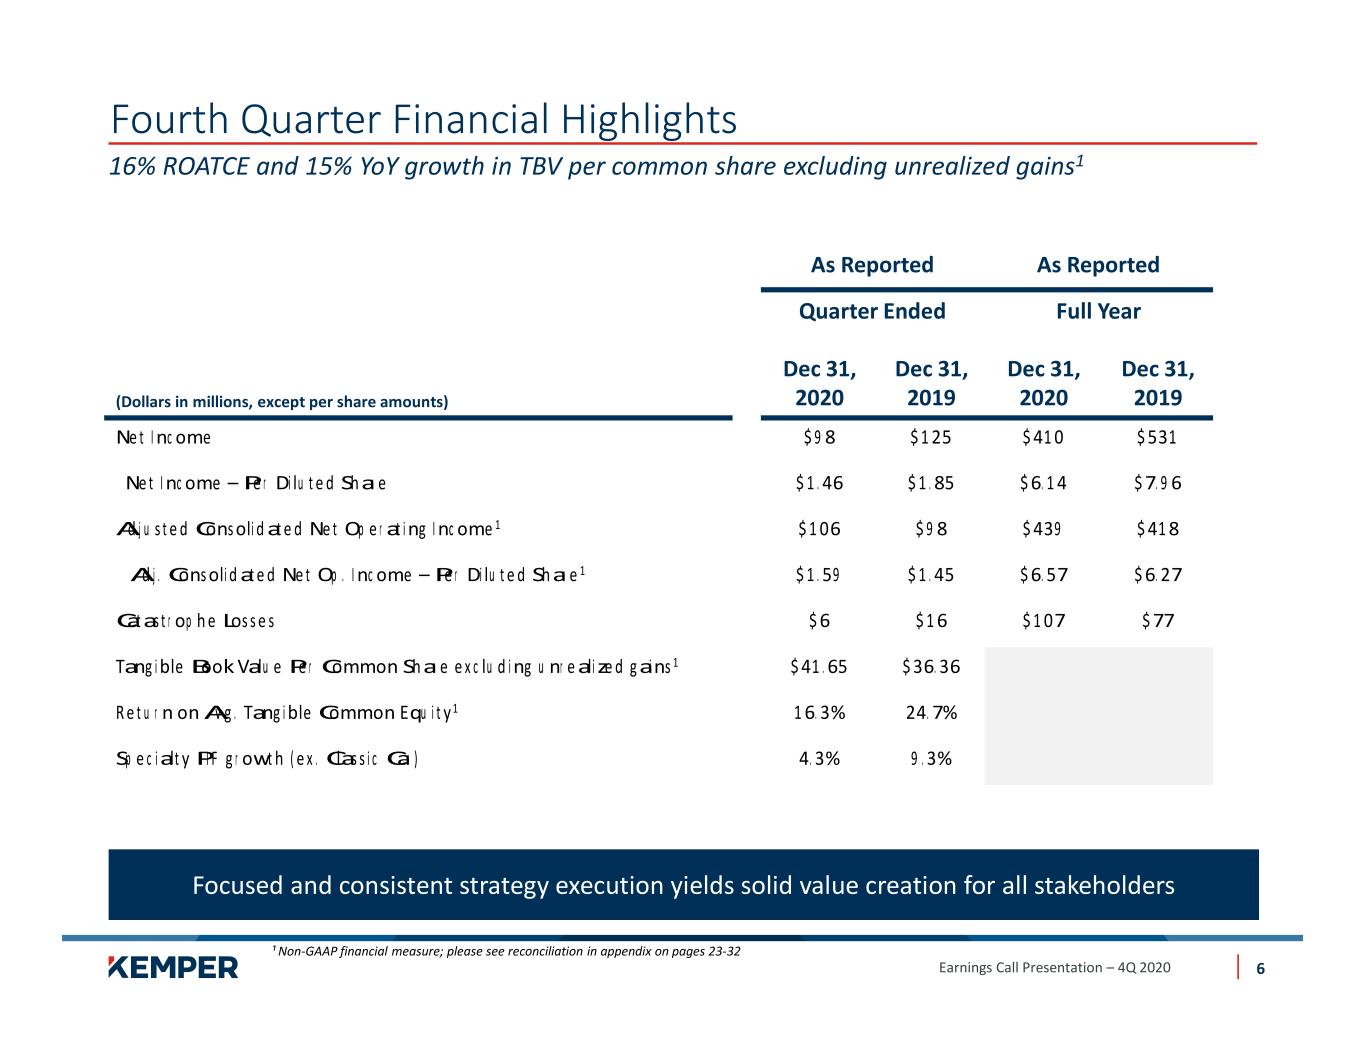
Fourth Quarter Financial Highlights 16% ROATCE and 15% YoY growth in TBV per common share excluding unrealized gains1 As Reported As Reported Quarter Ended Full Year (Dollars in millions, except per share amounts) Dec 31, 2020 Dec 31, 2019 Dec 31, 2020 Dec 31, 2019 6 ¹ Non-GAAP financial measure; please see reconciliation in appendix on pages 23-32
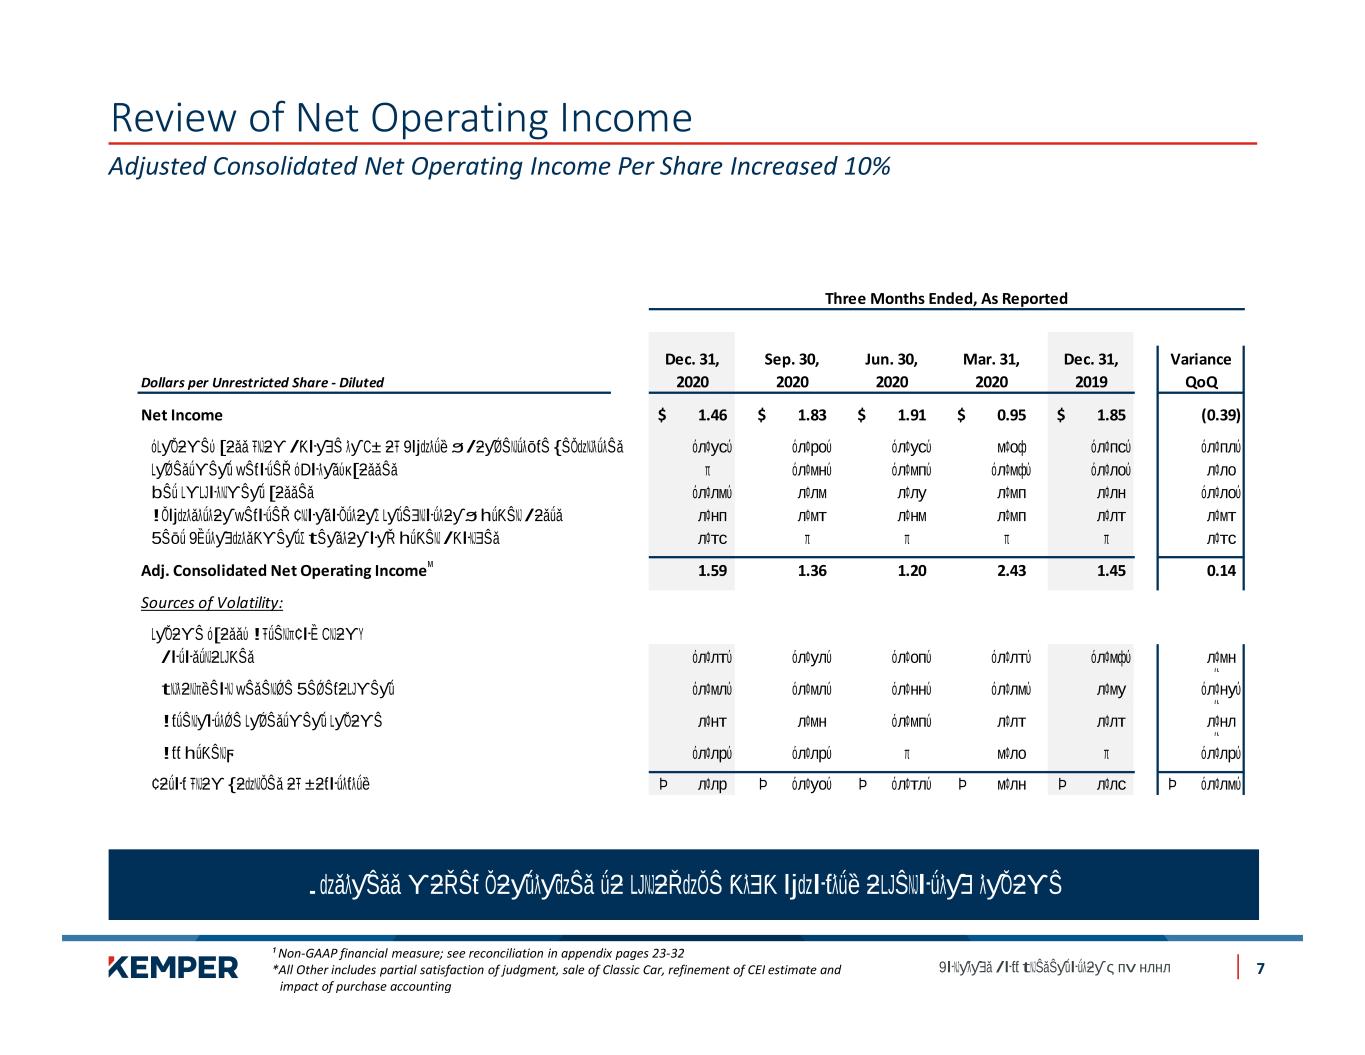
Review of Net Operating Income ¹ Non-GAAP financial measure; see reconciliation in appendix pages 23-32 *All Other includes partial satisfaction of judgment, sale of Classic Car, refinement of CEI estimate and impact of purchase accounting Adjusted Consolidated Net Operating Income Per Share Increased 10% 7 Three Months Ended, As Reported Dec. 31, Sep. 30, Jun. 30, Mar. 31, Dec. 31, Variance Dollars per Unrestricted Share - Diluted 2020 2020 2020 2020 2019 QoQ Net Income 1.46$ 1.83$ 1.91$ 0.95$ 1.85$ (0.39) Adj. Consolidated Net Operating Income 1.59 1.36 1.20 2.43 1.45 0.14 Sources of Volatility:
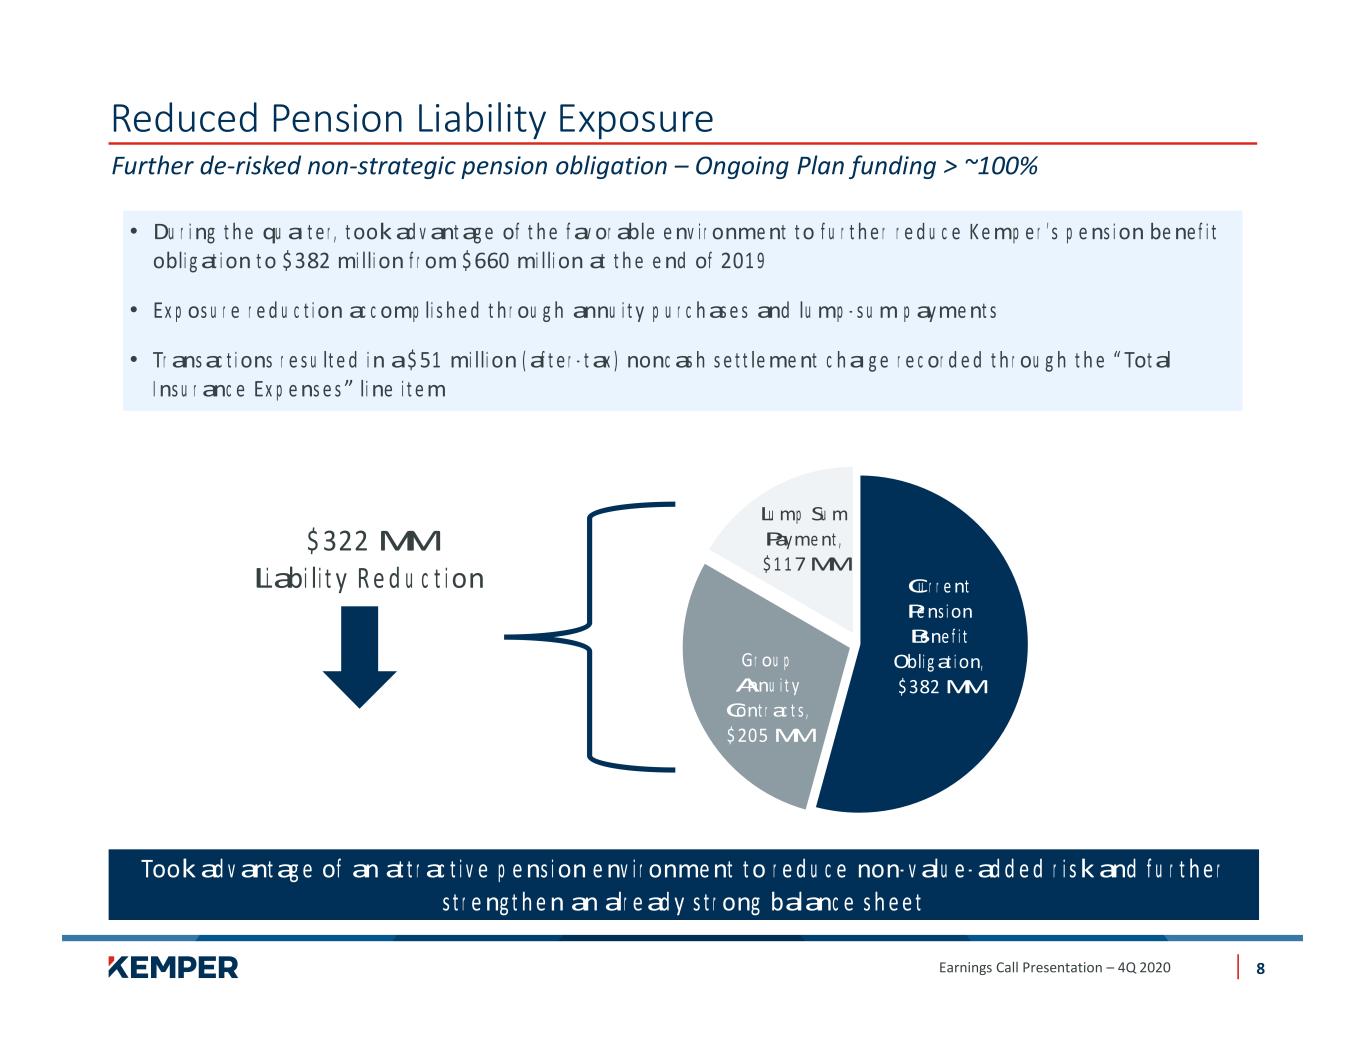
Reduced Pension Liability Exposure Further de-risked non-strategic pension obligation – Ongoing Plan funding > ~100% 8 • • •

Consistent Capital Generation and Attractive Returns Steady growth through various economic cycles Total Adjusted Return of BVPS Ex. Unrealized Gains on Fixed Maturities and Goodwill Return on Shareholders’ Equity 2016 2017 2018 1Q19 2Q19 3Q19 4Q19 1Q20 2Q20 3Q20 4Q20 $33.42$31.21 $31.10 $29.66 $36.46 $38.43 $40.27 $40.70 $44.41 $42.58 $46.76 1.1% 8.0% 11.4% 16.6% 19.9% 20.3% 24.7% 19.5% 18.8% 17.9% 16.3% 0.9% 6.6% 8.3% 11.4% 13.3% 13.1% 16.3% 13.0% 12.8% 12.3% 11.3% 2016 2017 2018 1Q19 2Q19 3Q19 4Q19 1Q20 2Q20 3Q20 4Q20 Growth 58% • • • • ¹ Non-GAAP financial measure; please see reconciliation in appendix on pages 23-32 2 Return on average tangible common equity (rolling 5 point avg.); please see reconciliation in appendix on pages 23-32 3 Return on average shareholder’s equity excluding unrealized gains on fixed maturities (rolling 5 point avg.); please see reconciliation in appendix on pages 22-32 9

27.4% 27.6% 21.9% 23.0% 16.4% 20.4% Debt-to-Capital <30% Strong Balance Sheet with Well-Funded Insurance Entities Significant capital and liquidity positions Debt Cash Flow from Operating Activities Total Capitalization Parent Company Liquidity Risk-Based Capital Ratios $341 $299 $197 $101 $207 $733 $400 $385 $385 $540 $660 $700 (M M ) 375 415 430 410 355 340330 335 290 285 365 330 (% ) $741 $641$582$684 (M M ) $215 $241 $241 $539 $534 $425 $867 10 $1,433

52% 15% 6% 6% 6% 8% 7% Other States/ Munis 63% 30% 5% 2% Diversified & Highly-Rated Portfolio Fixed Maturity Ratings $7.6 Billion A or Higher ≤ CCC B / BB BBB Diversified Portfolio with Consistent Returns Note: Charts may not balance due to rounding ¹ Includes COLI. Please see reconciliation of COLI’s inclusion in net investment income on page 26 2 Equity securities excludes $295 million of Other Equity Interests of LP/LLC’s that have been reclassified into Alternative Investments • • • $88 $80 $80 $81 $81 $6 $6 $(12) $11 $22 Net Investment Income¹ (M M ) $97 $103$92$68$86 Overview Corporates Short-term Alternatives² Equity² U.S. Gov’t Portfolio Composition Pre-Tax Equiv. Annualized Book Yield¹ $10.4 Billion 4.6% 4.1% 3.2% 4.2% 4.7% 0.9% 11

93.1 93.1 88.5 85.4 90.8 92.3 93.1 91.0 88.9 89.4 Underlying Combined Ratio¹ Specialty Property & Casualty Insurance Segment1 Sustainable competitive advantages position Specialty for growth at solid margins Source: Population growth sources include U.S. Census Bureau and The Association Institute ¹ As adjusted for acquisition; see reconciliation on Pages 23-32 2 Non-GAAP financial measure; see reconciliation in appendix on pages 23-32 • • • • (% ) Key Highlights Written Premium Population CAGR State Groupings TTM ($ million) YoY Growth ’16-’19 Est. ’20-’30 12 Key Metrics ($ in millions) 4Q’20 Change to 4Q’19 2 2
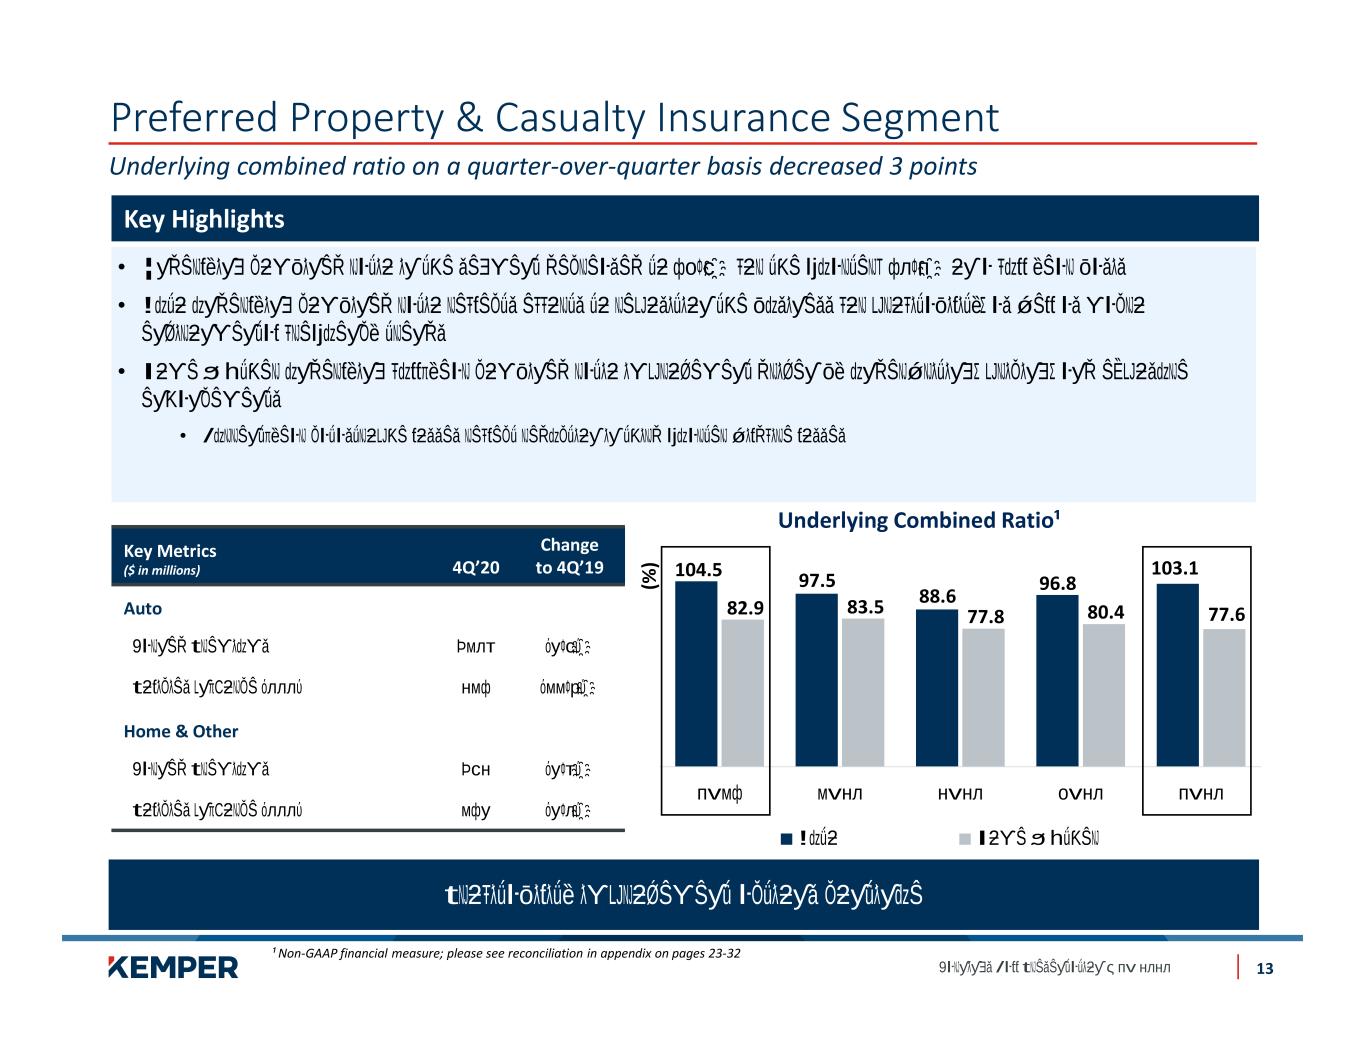
Preferred Property & Casualty Insurance Segment Underlying combined ratio on a quarter-over-quarter basis decreased 3 points Key Highlights 104.5 97.5 88.6 96.8 103.1 82.9 83.5 77.8 80.4 77.6 Underlying Combined Ratio¹ ¹ Non-GAAP financial measure; please see reconciliation in appendix on pages 23-32 • • • • (% ) 13 Key Metrics ($ in millions) 4Q’20 Change to 4Q’19 Auto Home & Other
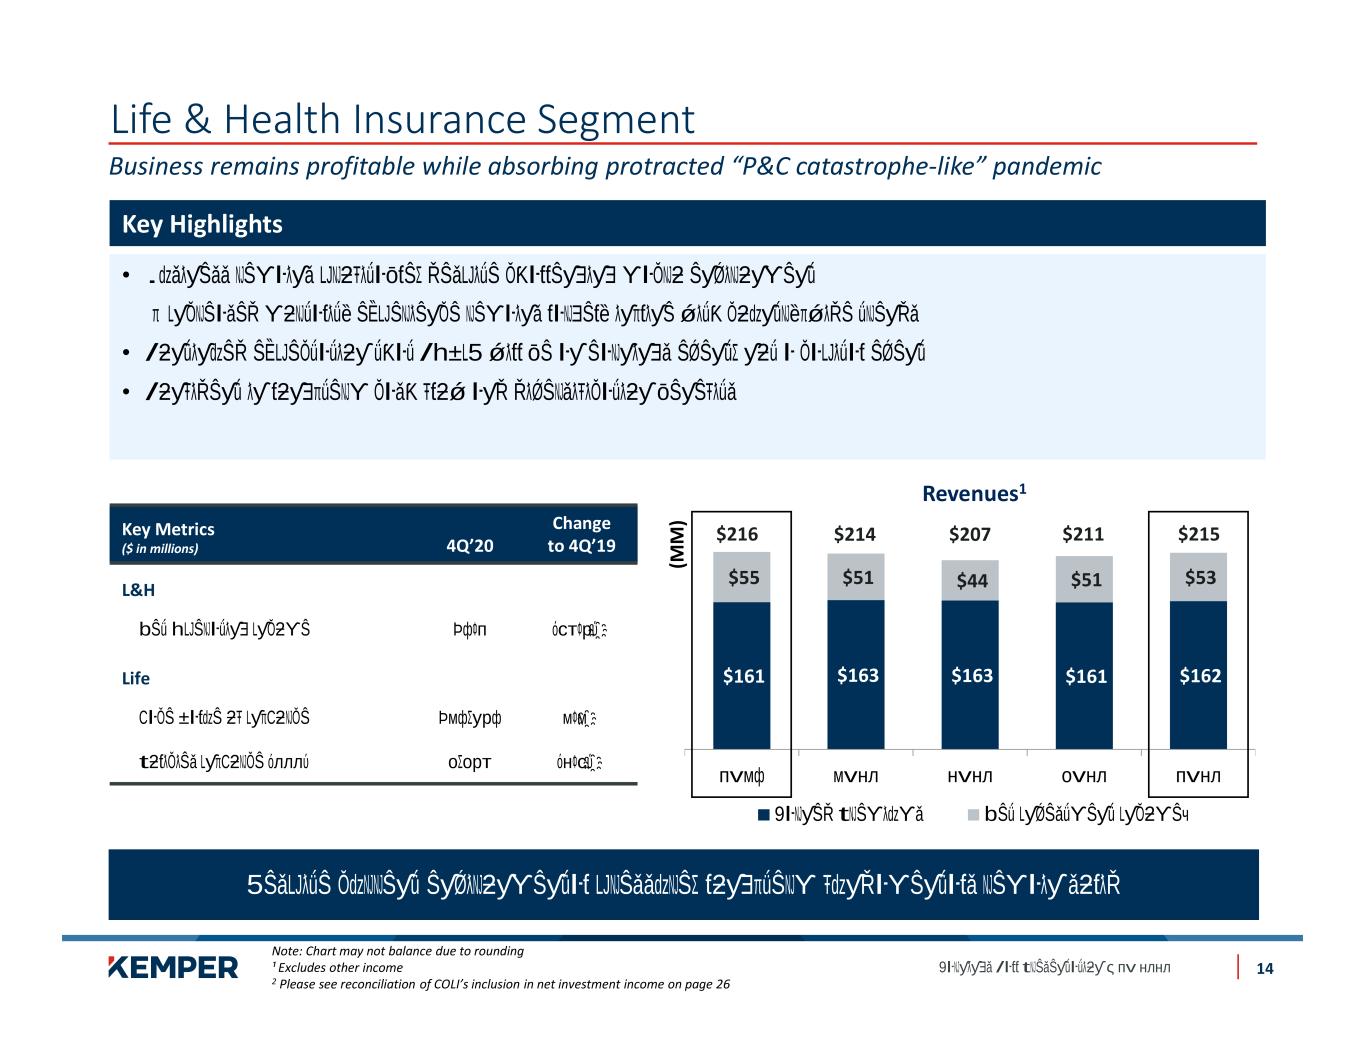
Life & Health Insurance Segment Business remains profitable while absorbing protracted “P&C catastrophe-like” pandemic Note: Chart may not balance due to rounding ¹ Excludes other income 2 Please see reconciliation of COLI’s inclusion in net investment income on page 26 (M M ) • • • Key Highlights $161 $163 $163 $161 $162 $55 $51 $44 $51 $53 Revenues1 $215$207$214$216 $211Key Metrics ($ in millions) 4Q’20 Change to 4Q’19 L&H Life 14

Appendix 15
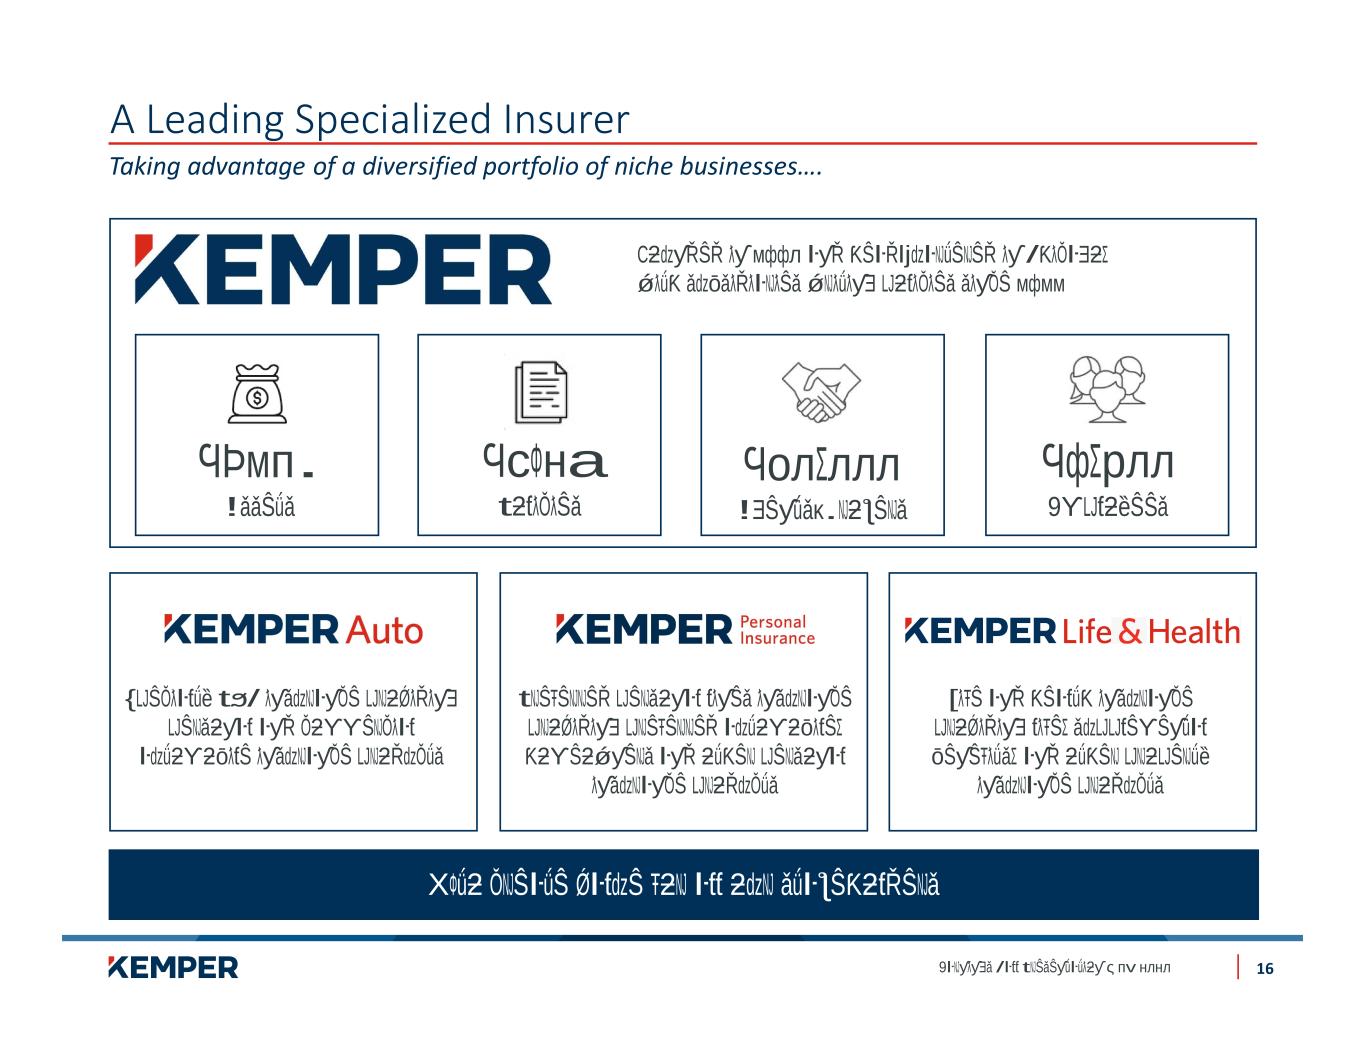
A Leading Specialized Insurer Taking advantage of a diversified portfolio of niche businesses…. 16
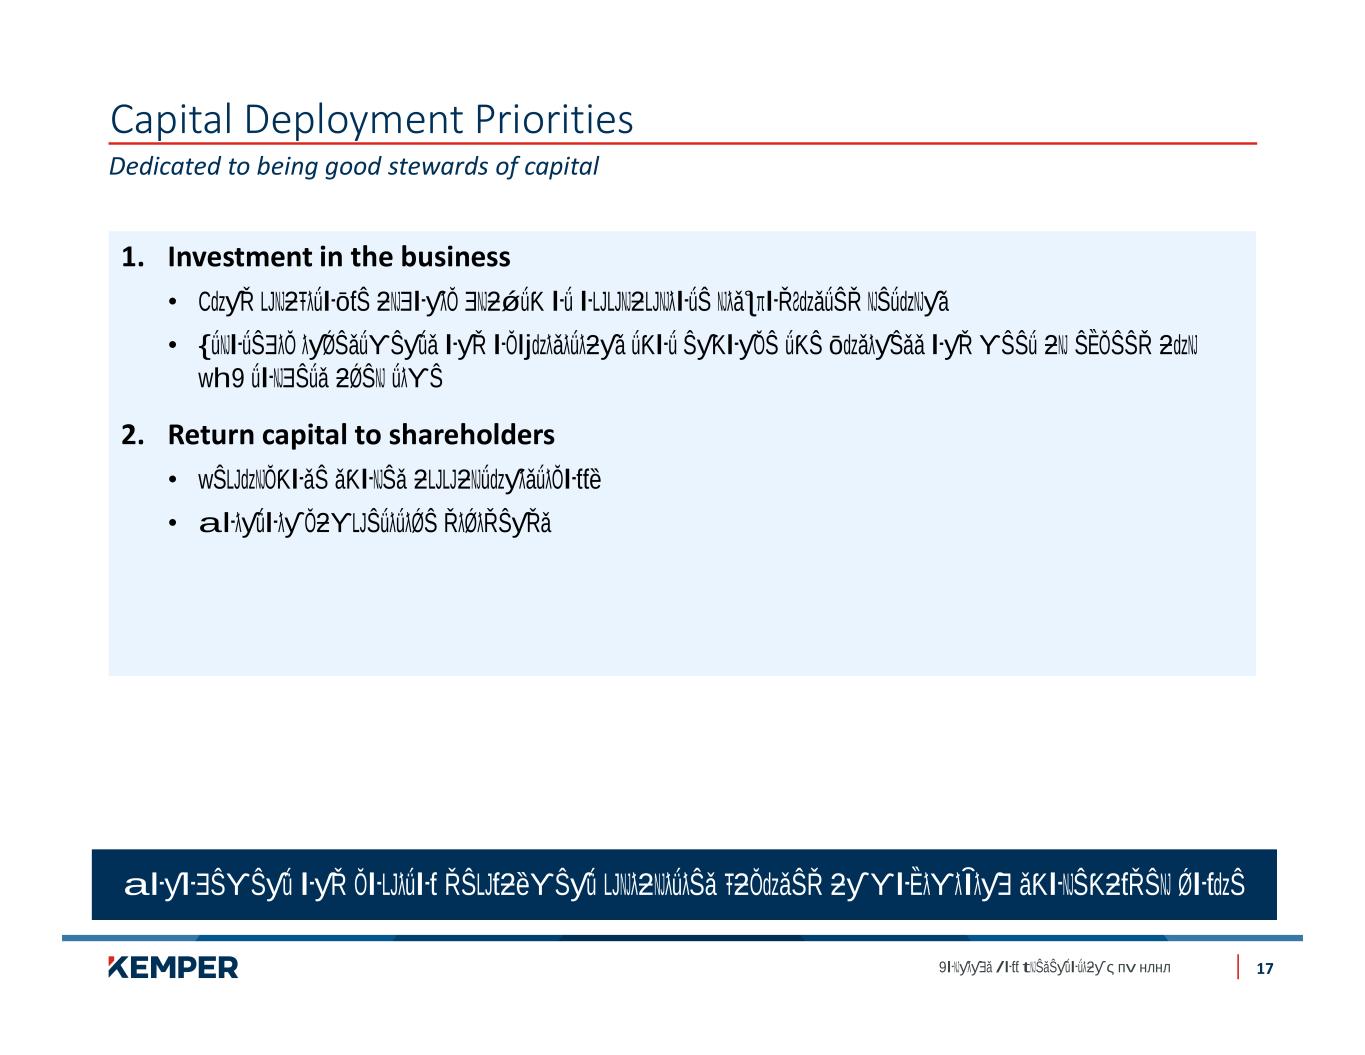
Capital Deployment Priorities Dedicated to being good stewards of capital 1. Investment in the business • • 2. Return capital to shareholders • • 17
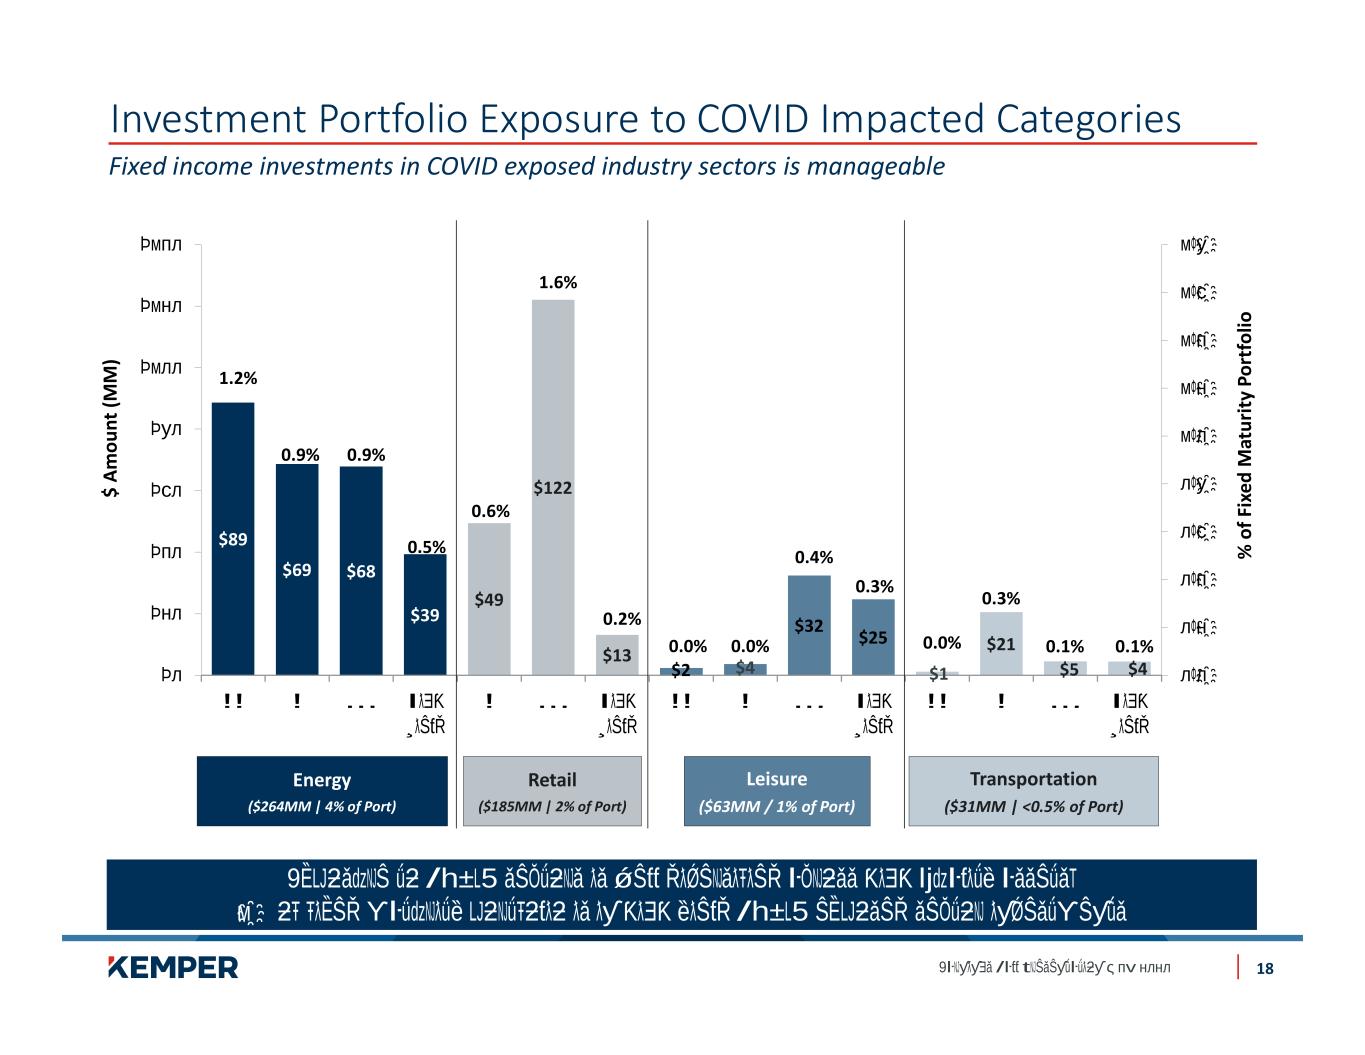
Investment Portfolio Exposure to COVID Impacted Categories 18 $89 $69 $68 $39 $49 $122 $13 $2 $4 $32 $25 $1 $21 $5 $4 1.2% 0.9% 0.9% 0.5% 0.6% 1.6% 0.2% 0.0% 0.0% 0.4% 0.3% 0.0% 0.3% 0.1% 0.1% $ A m ou nt (M M ) % o f F ix ed M at ur it y Po rt fo lio Fixed income investments in COVID exposed industry sectors is manageable Energy ($264MM | 4% of Port) Retail ($185MM | 2% of Port) Leisure ($63MM / 1% of Port) Transportation ($31MM | <0.5% of Port)
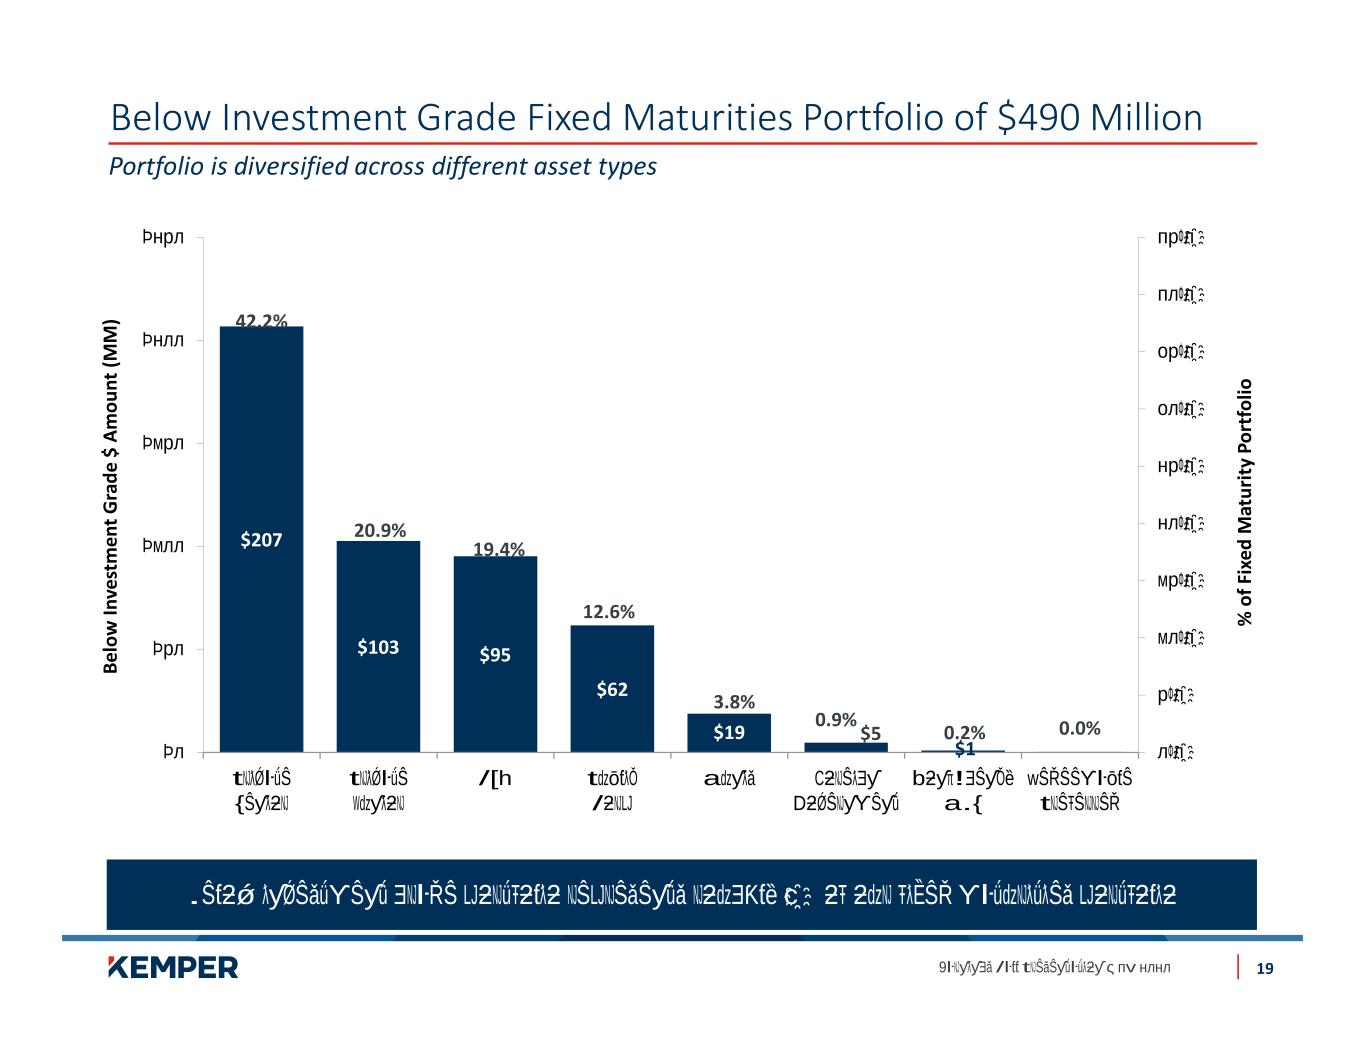
Below Investment Grade Fixed Maturities Portfolio of $490 Million 19 Portfolio is diversified across different asset types $207 $103 $95 $62 $19 $5 $1 $0 42.2% 20.9% 19.4% 12.6% 3.8% 0.9% 0.2% 0.0% B el ow In ve st m en t G ra de $ A m ou nt (M M ) % o f F ix ed M at ur it y Po rt fo lio
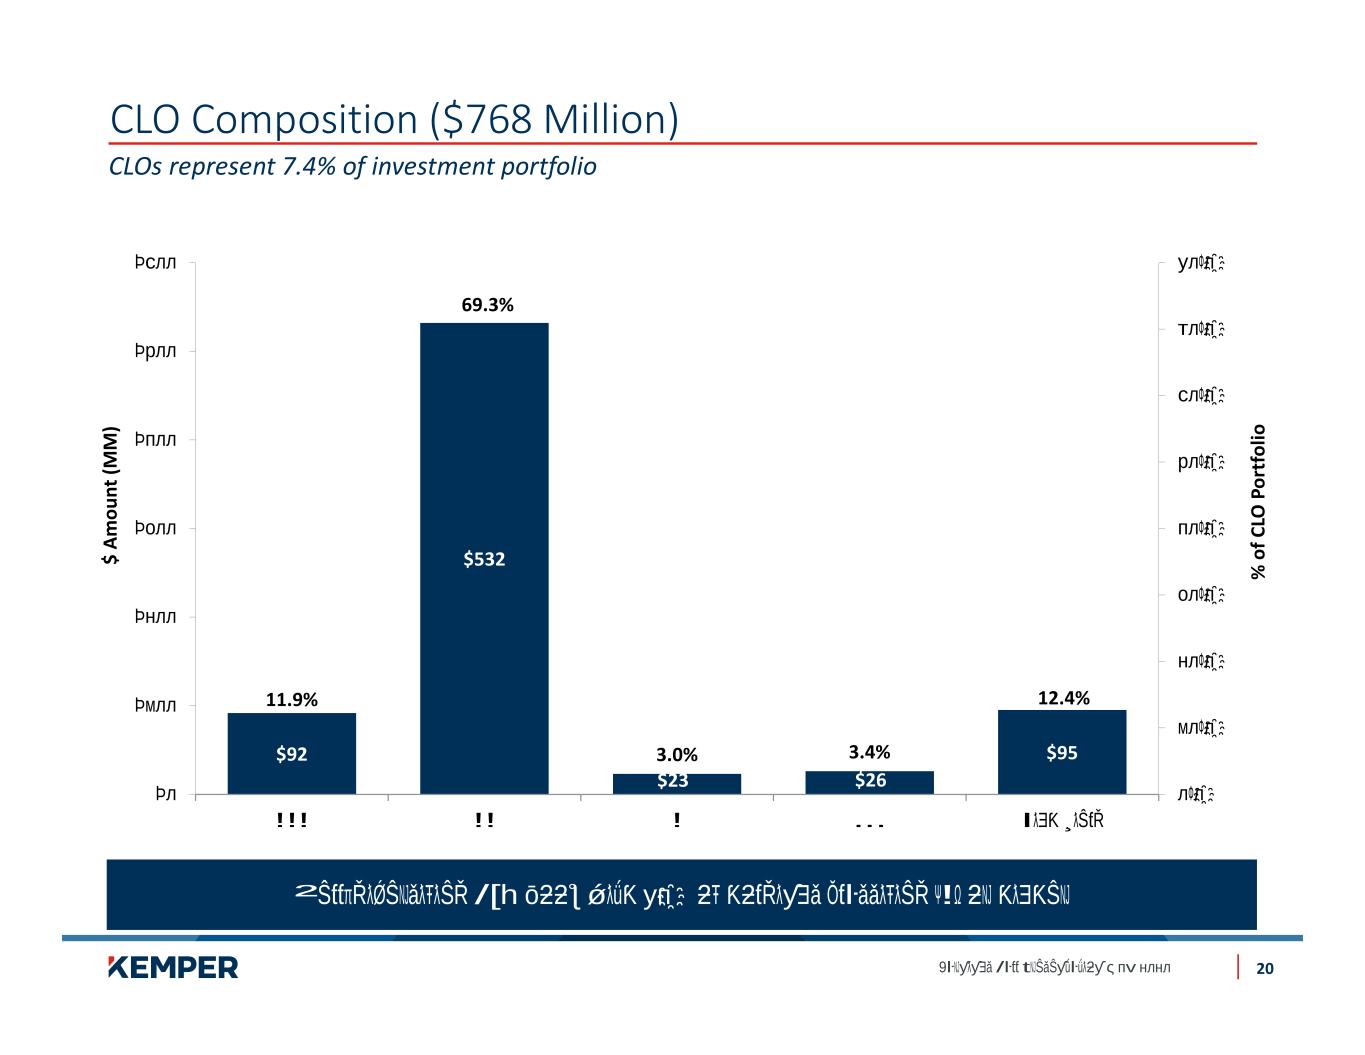
CLO Composition ($768 Million) 20 $92 $532 $23 $26 $95 11.9% 69.3% 3.0% 3.4% 12.4% $ A m ou nt (M M ) % o f C LO P or tf ol io CLOs represent 7.4% of investment portfolio

Alternative Investment Portfolio of $533 Million 21 Portfolio is highly diversified with strategies focused on private credit, private equity and hedge funds $329.6 $110.5 $71.6 $21.3 Private Credit Private Equity Hedge Funds Tax Equity Funds

2021 Reinsurance Program Both programs were renewed with no significant change • • Catastrophe Reinsurance Program (Multi-Year) • • • Aggregate Catastrophe Program 2021 Aggregate Catastrophe Reinsurance Program 22 Retention 3-Year Term Placed 1/1/20 $100M xs $150M 31.67% Placed 3-Year Term Placed 1/1/21 $100M xs $150M 31.67% Placed* 3-Year Term Placed 1/1/20 $100M xs $50M 31.67% Placed 3-Year Term Placed 1/1/21 $100M xs $50M 31.67% Placed* 3-Year Term Placed 1/1/19 $100M xs $50M 31.67% Placed Retention 100% of first $50M Re te n tion 5% of $2 25M xs $ 50 M 3-Year Term Placed 1/1/19 $100M xs $150M 31.67% Placed 1-Year Term Placed 1/1/21 $25M xs $250M 95% Placed *4% was placed on an annual basis through Reinsurance Facilities

Book Value Per Share Excluding Net Unrealized Gains on Fixed Maturities Book Value Per Share Excluding Net Unrealized Gains on Fixed Maturities and Goodwill Non-GAAP Financial Measures 23

Return on Equity Non-GAAP Financial Measures 24
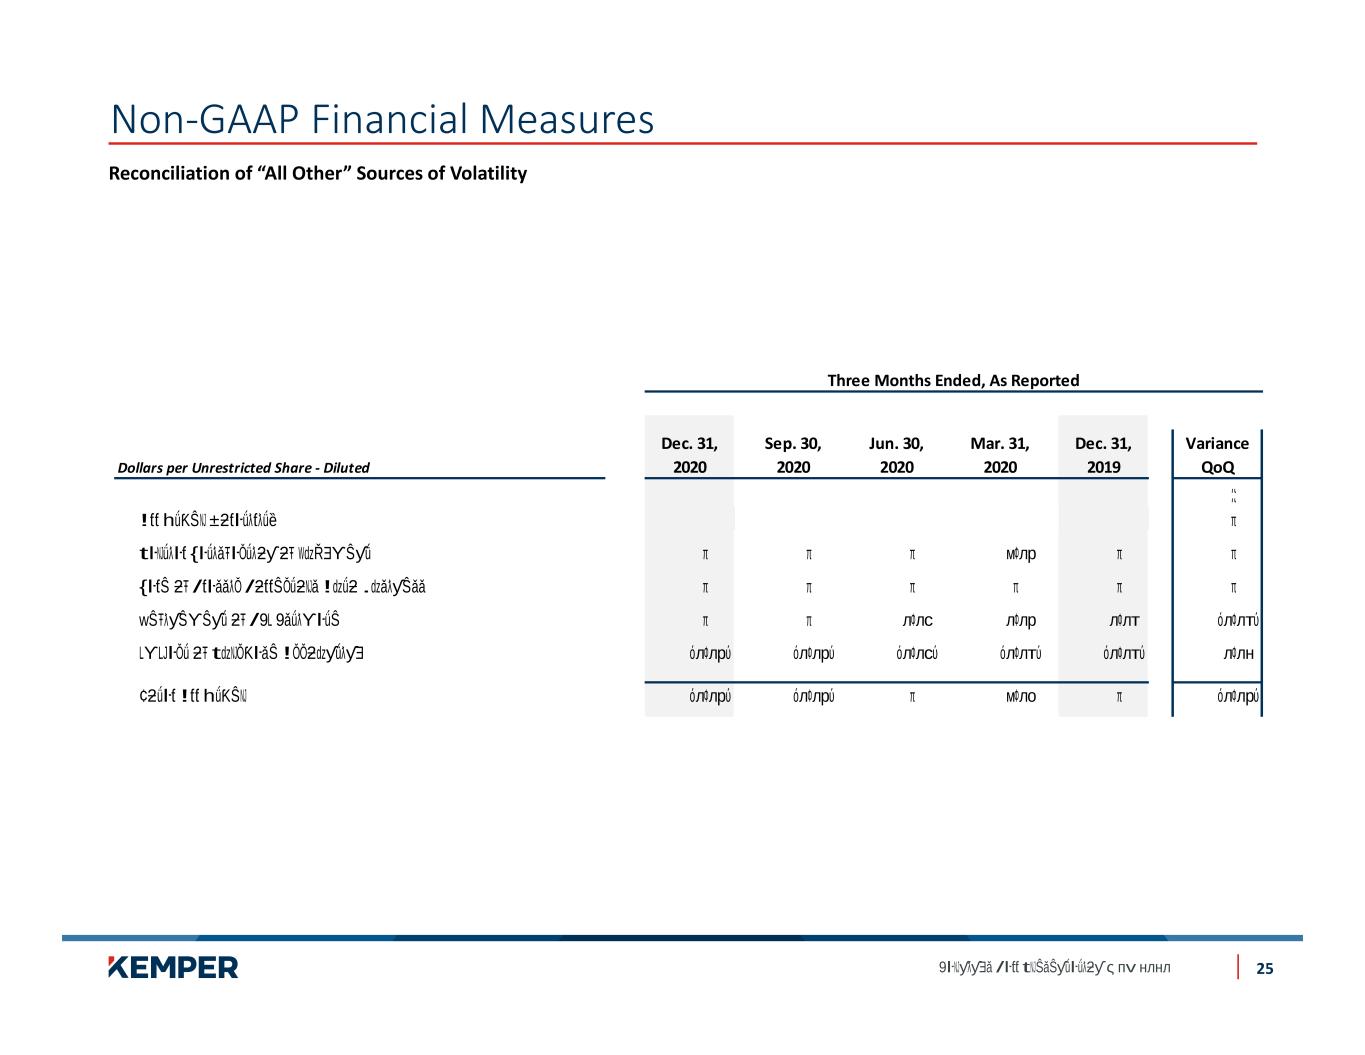
Reconciliation of “All Other” Sources of Volatility Non-GAAP Financial Measures 25 Three Months Ended, As Reported Dec. 31, Sep. 30, Jun. 30, Mar. 31, Dec. 31, Variance Dollars per Unrestricted Share - Diluted 2020 2020 2020 2020 2019 QoQ
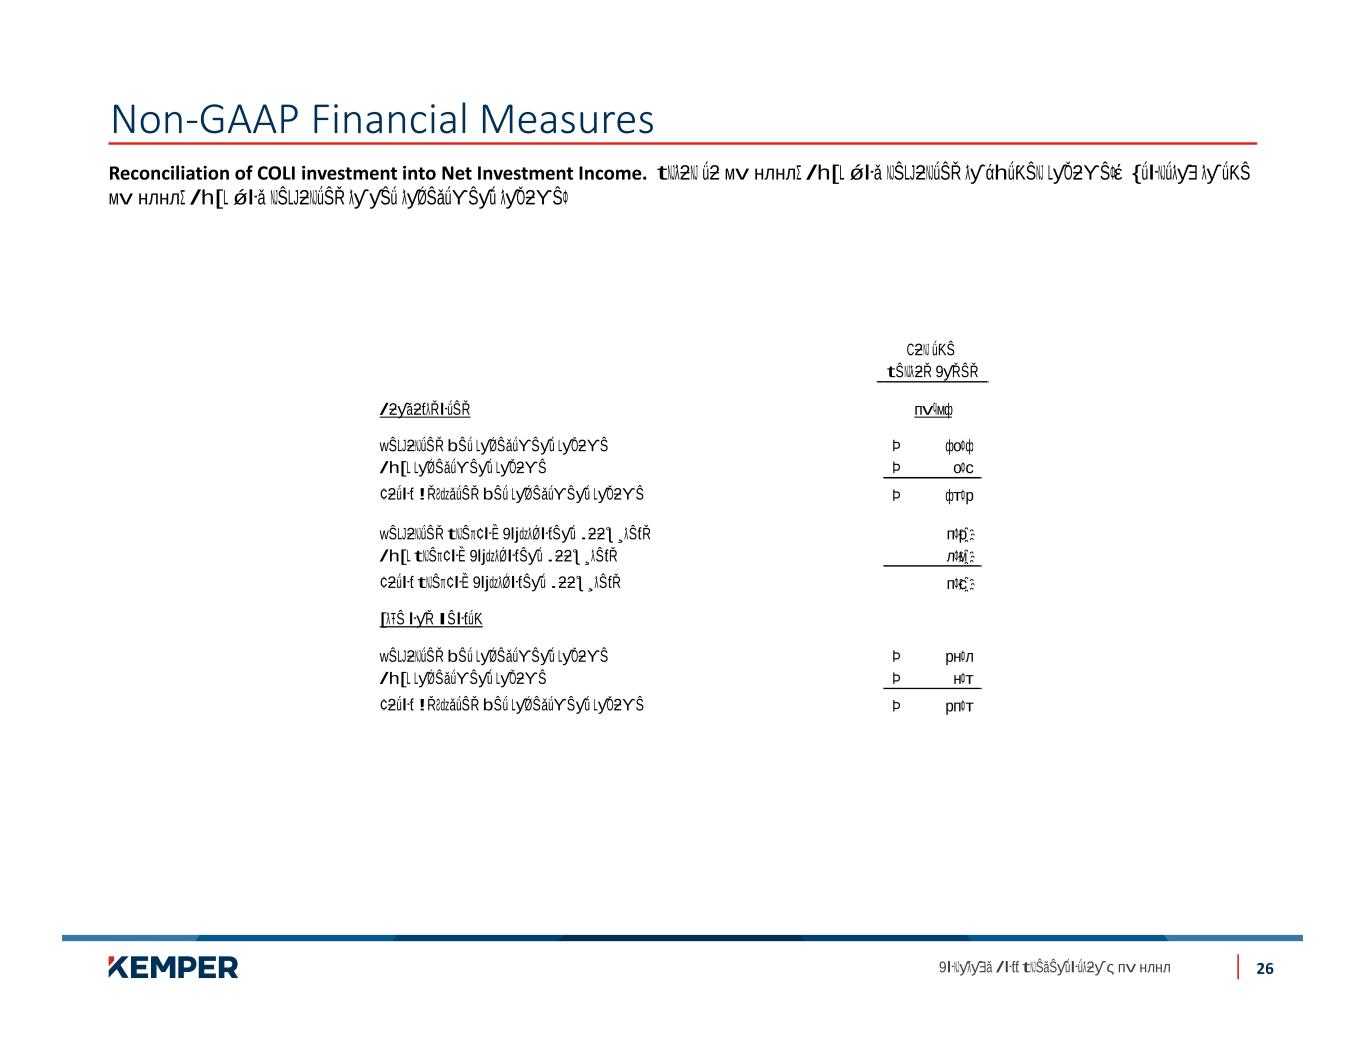
Reconciliation of COLI investment into Net Investment Income. Non-GAAP Financial Measures 26
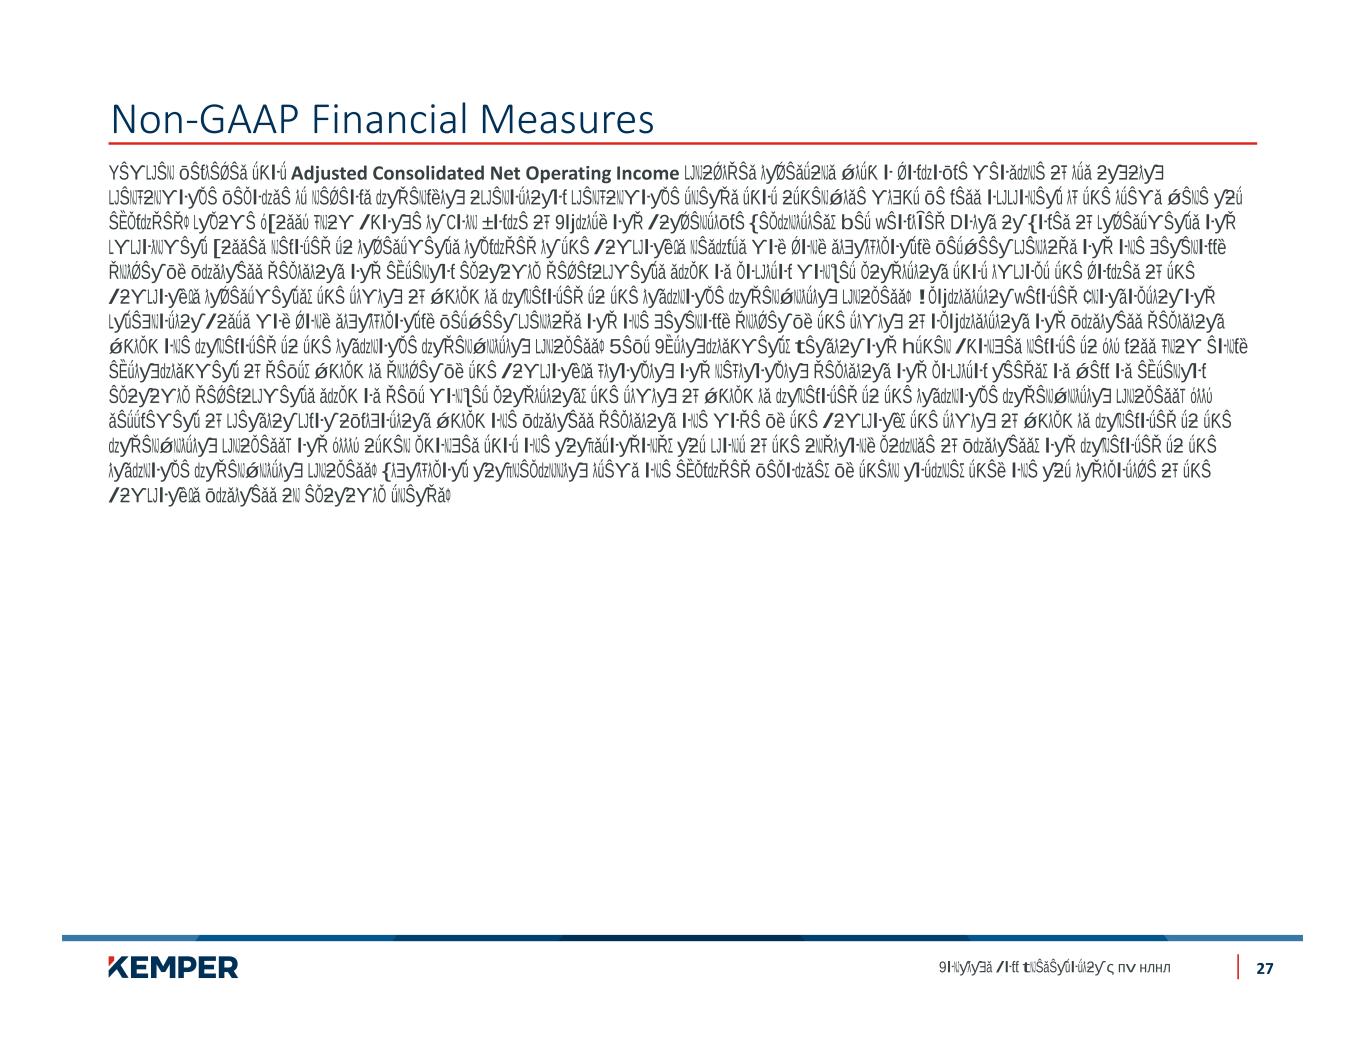
Adjusted Consolidated Net Operating Income Non-GAAP Financial Measures 27
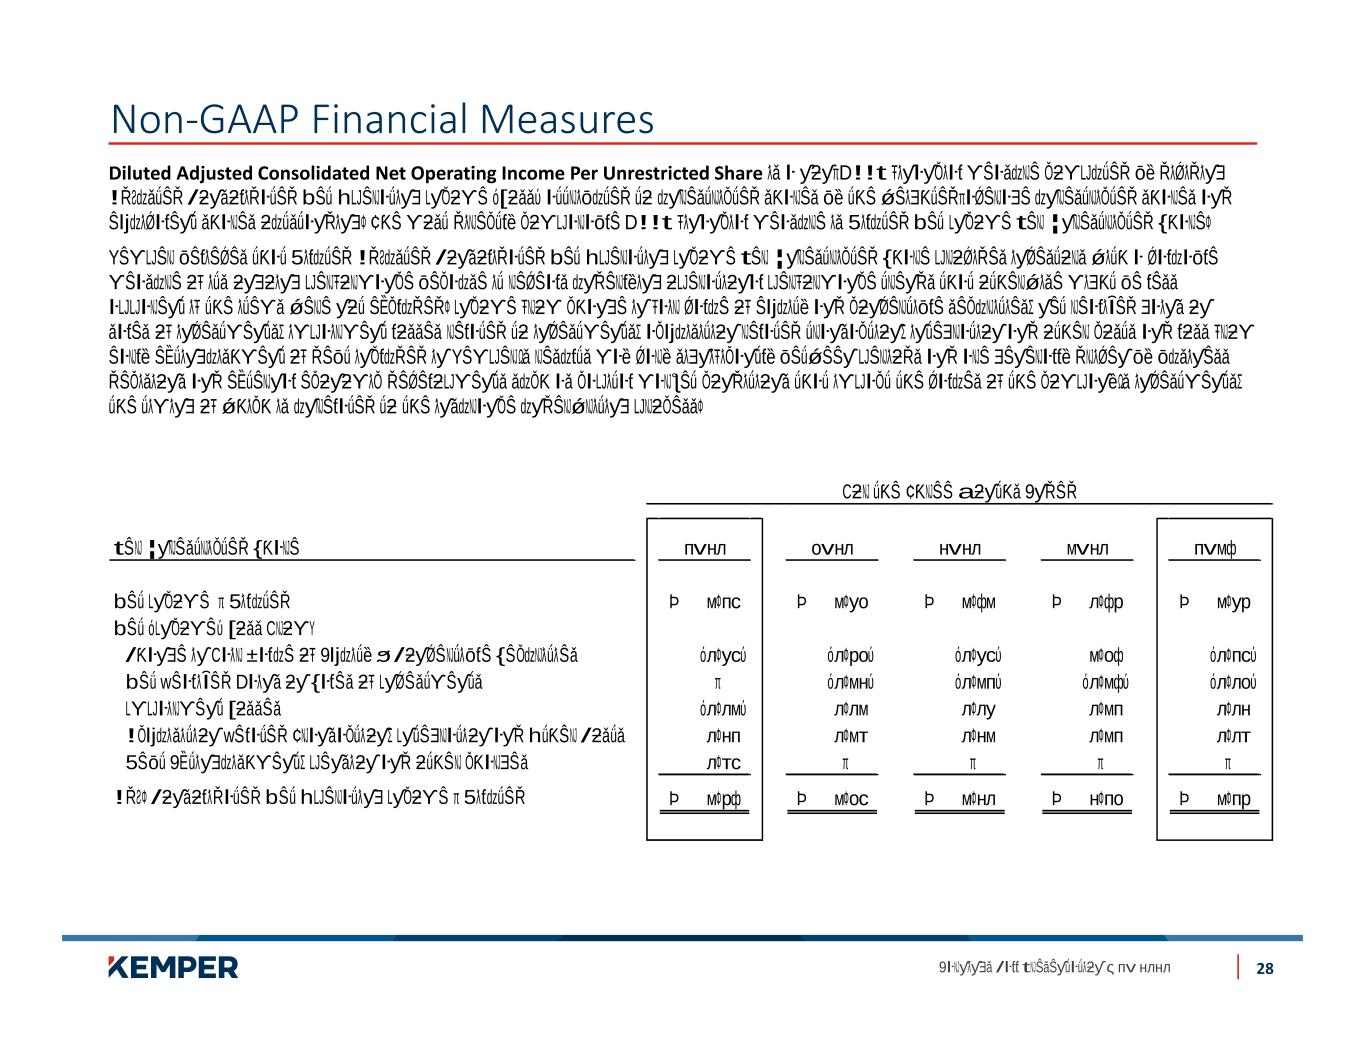
Diluted Adjusted Consolidated Net Operating Income Per Unrestricted Share Non-GAAP Financial Measures 28

Underlying Combined Ratio Non-GAAP Financial Measures 29

Underlying Combined Ratio – Continued Non-GAAP Financial Measures 30 Specialty P&C Insurance Preferred P&C Insurance Preferred Auto Preferred Home & Other
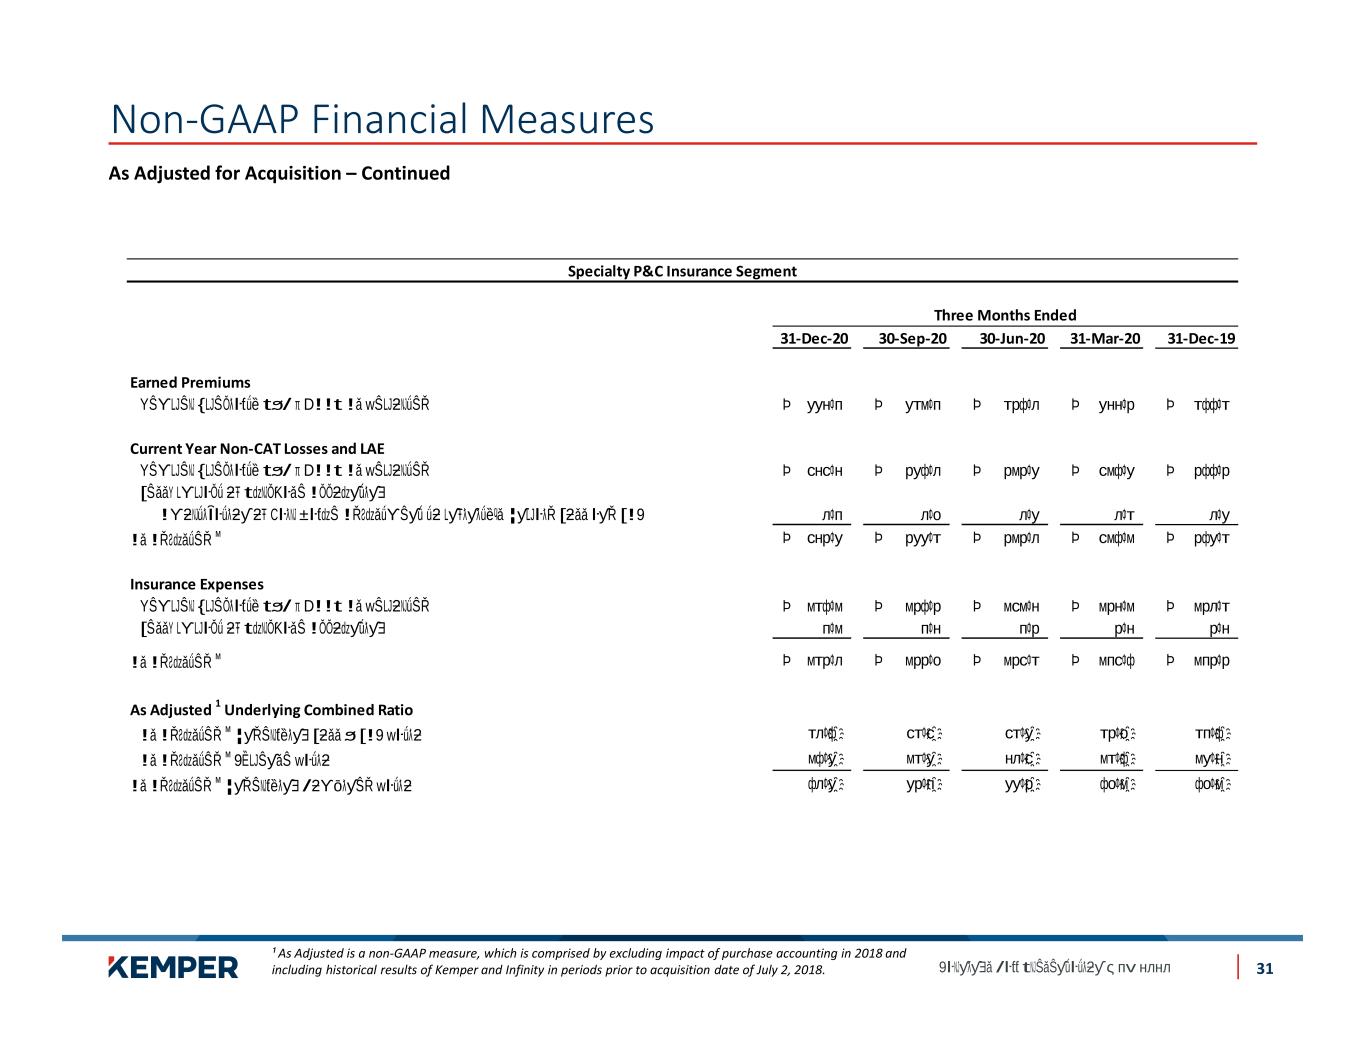
As Adjusted for Acquisition – Continued Non-GAAP Financial Measures ¹ As Adjusted is a non-GAAP measure, which is comprised by excluding impact of purchase accounting in 2018 and including historical results of Kemper and Infinity in periods prior to acquisition date of July 2, 2018. 31 Specialty P&C Insurance Segment 31-Dec-20 30-Sep-20 30-Jun-20 31-Mar-20 31-Dec-19 Earned Premiums Current Year Non-CAT Losses and LAE Insurance Expenses As Adjusted 1 Underlying Combined Ratio Three Months Ended
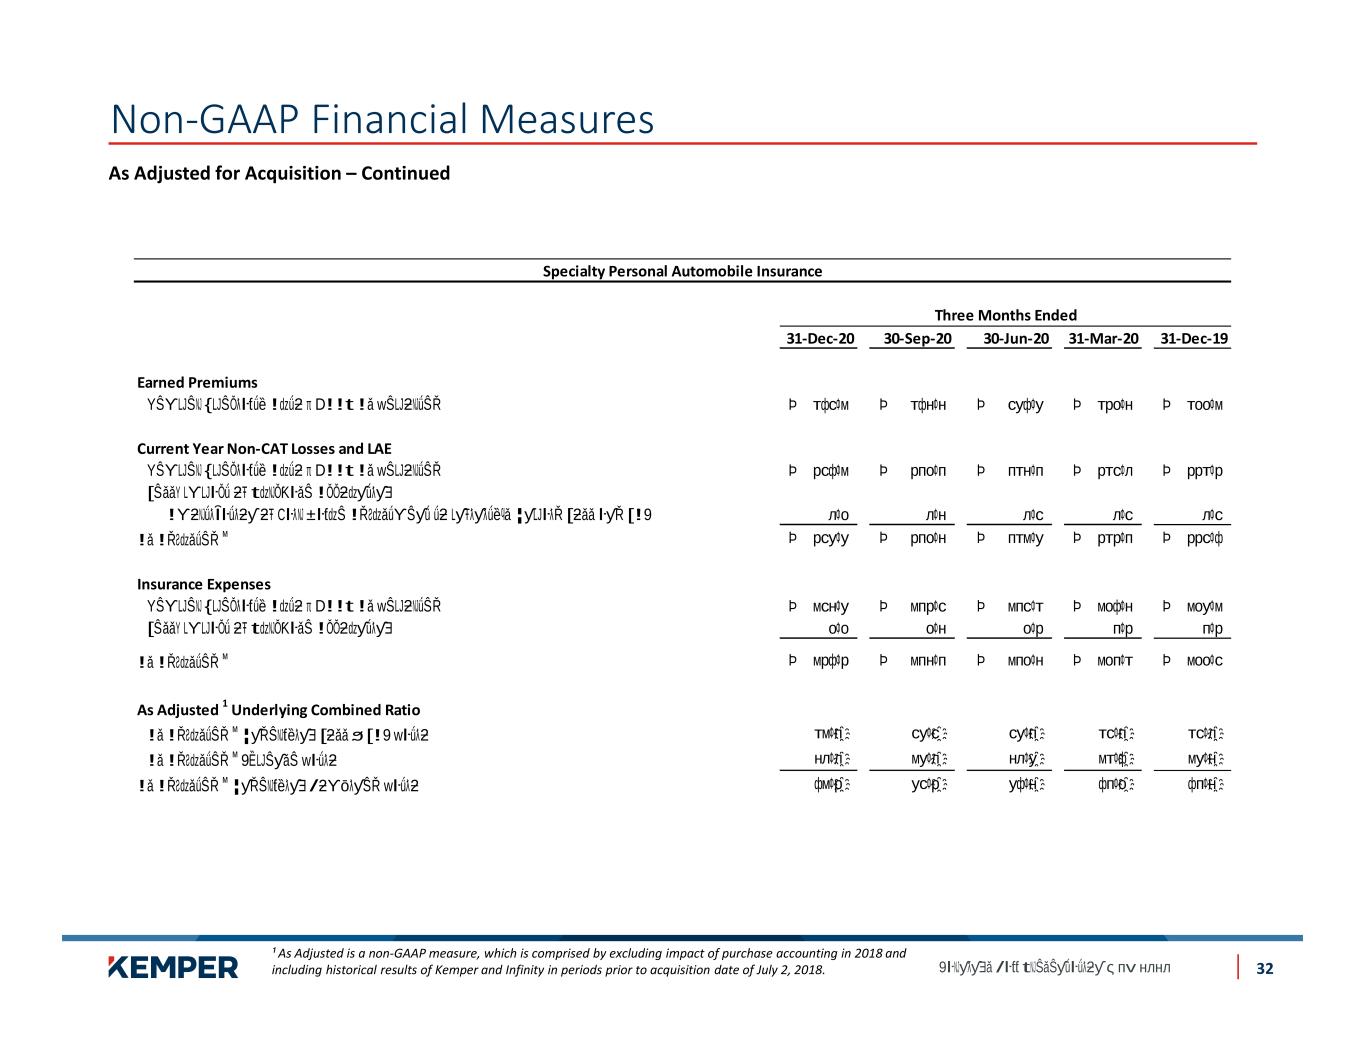
As Adjusted for Acquisition – Continued Non-GAAP Financial Measures ¹ As Adjusted is a non-GAAP measure, which is comprised by excluding impact of purchase accounting in 2018 and including historical results of Kemper and Infinity in periods prior to acquisition date of July 2, 2018. 32 Specialty Personal Automobile Insurance 31-Dec-20 30-Sep-20 30-Jun-20 31-Mar-20 31-Dec-19 Earned Premiums Current Year Non-CAT Losses and LAE Insurance Expenses As Adjusted 1 Underlying Combined Ratio Three Months Ended


