Earnings Call Presentation – 4Q 2020 Fourth Quarter 2020 Earnings February 1, 2021

Earnings Call Presentation – 4Q 2020 Cautionary Statements Regarding Forward-Looking Information This presentation may contain or incorporate by reference information that includes or is based on forward-looking statements within the meaning of the safe-harbor provisions of the Private Securities Litigation Reform Act of 1995. Forward-looking statements give expectations or forecasts of future events and can be identified by the fact that they relate to future actions, performance or results rather than strictly to historical or current facts. Any or all forward-looking statements may turn out to be wrong, and, accordingly, readers are cautioned not to place undue reliance on such statements, which speak only as of the date of this presentation. Forward-looking statements involve a number of risks and uncertainties that are difficult to predict and are not guarantees of future performance. Among the general factors that could cause actual results and financial condition to differ materially from estimated results and financial condition are those factors listed in periodic reports filed by Kemper Corporation with the Securities and Exchange Commission (“SEC”). The COVID-19 outbreak and subsequent global pandemic (“Pandemic”) is an extraordinary event that creates unique uncertainties and risks. Kemper cannot provide any assurances as to the impacts of the Pandemic and related economic conditions on the Company’s operating and financial results. No assurances can be given that the results and financial condition contemplated in any forward-looking statements will be achieved or will be achieved in any particular timetable. Kemper assumes no obligation to publicly correct or update any forward-looking statements as a result of events or developments subsequent to the date of this presentation, including any such statements related to the Pandemic. The reader is advised, however, to consult any further disclosures Kemper makes on related subjects in its filings with the SEC. Non-GAAP Financial Measures This presentation contains non-GAAP financial measures that the company believes are meaningful to investors. Non-GAAP financial measures have been reconciled to the most comparable GAAP financial measure. Preliminary Matters 2
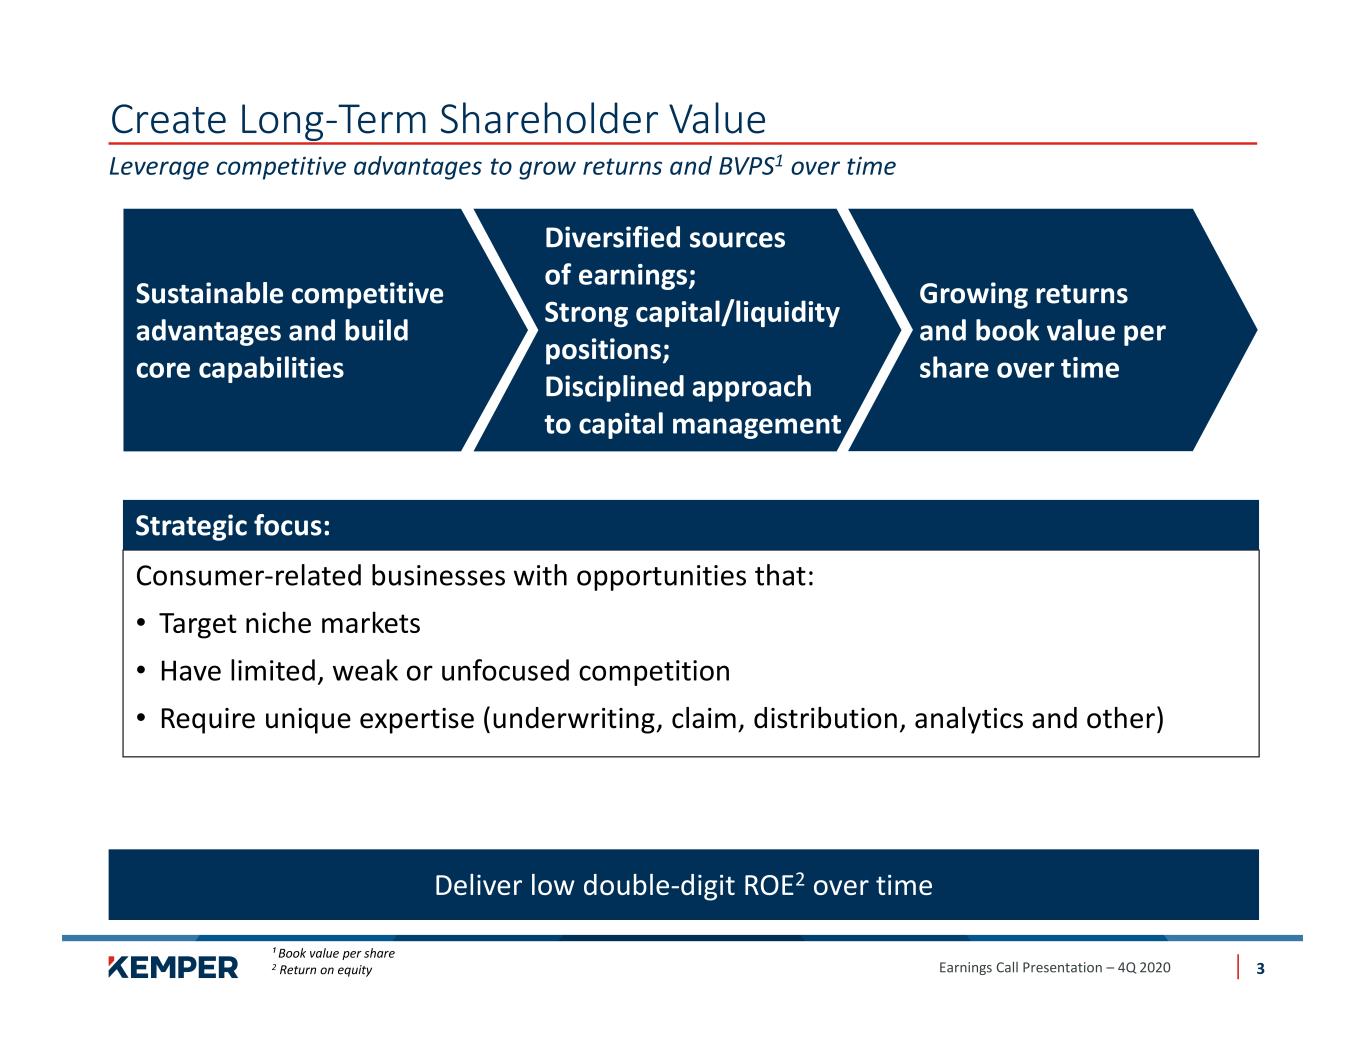
Earnings Call Presentation – 4Q 2020 Deliver low double-digit ROE2 over time Create Long-Term Shareholder Value Leverage competitive advantages to grow returns and BVPS1 over time ¹ Book value per share 2 Return on equity Sustainable competitive advantages and build core capabilities Growing returns and book value per share over time Diversified sources of earnings; Strong capital/liquidity positions; Disciplined approach to capital management Consumer-related businesses with opportunities that: • Target niche markets • Have limited, weak or unfocused competition • Require unique expertise (underwriting, claim, distribution, analytics and other) Strategic focus: 3

Earnings Call Presentation – 4Q 2020 Fourth Quarter 2020 Highlights Solid results and premium growth in a challenging environment Top-line growth slightly impacted by operating environment; long-term trajectory remains intact • Overall net earned premium growth of 6% • Specialty P&C continues to produce solid earnings partially enhanced by favorable frequency trends; 4.3% growth in PIF (ex. Classic Car sale) reflects state shutdowns impacting shopping behavior • In line with domestic trends, Life & Health results continue to be impacted by COVID-related mortality 4th Quarter Overview Delivered double-digit ROE and 10% growth in adjusted consolidated net operating EPS • Net income of $98 million and adjusted consolidated net operating income1 of $106 million; earnings per share of $1.46 on a diluted basis; adjusted consolidated net operating EPS1 of $1.59 • 10% ROAE2, 16% ROATCE2 excluding net unrealized gains on fixed maturities and goodwill1 • Book value per share ex. net unrealized gains on fixed maturities and goodwill1 grew 15% year-over-year • Successfully executed the transfer of ~45% of Kemper’s approximately $660 million pension liability • Expanding specialty auto footprint with announced acquisition of American Access Shareholder Value Creation ¹ Non-GAAP financial measure; please see reconciliation in appendix on pages 23-32 2 Return on average shareholders’ equity (5-point average) Strong capital and liquidity position provides significant financial flexibility • Diversified operations create sustainable earnings strength throughout economic cycles, delivering attractive returns to shareholders • Holding company continues to be a source of strength for subsidiaries: greater than $700 million in assets and $1.4 billion of liquidity • Debt-to-capital ratio of 20.4% is within target range of 17-22% Financial Strength 4

Earnings Call Presentation – 4Q 2020 68.5% 77.8% 72.2% 69.8% 68.2% 21.3% 18.1% 17.8% 18.7% 19.5% 2016 2017 2018 2019 9/30/20 LTM Loss & LAE Ratio Net Expense Ratio 89.8% 95.9% 90.0% 88.5% AZ 6% IL 18% IN 6% NV 8% TX 62% GAAP Combined Ratio American Access Will Accelerate Specialty Auto Growth Company profile aligns with our strategy; 1Q 2021 expected close Business Mix Enhancing Specialty Market Capabilities 5 Agency Channel Distribution Geographic Mix LTM Net Written Premium: $359 million 2 • $370 million cash transaction for a platform that has historically produced consistent and sustainable margins and cash flows • Expands customer reach with a focus on low limit auto policies and broadens Hispanic customer base (>75% of customers) • Accelerates geographic expansion and strengthens agency network • Acquisition aligns with previously communicated capital deployment guidance • Scalable model that provides additional growth opportunities across new and existing geographies • Value accretive transaction – anticipated high single digit run-rate earnings increase; tangible book value expected to return to current levels within one year Note: LTM figures are for the last twelve months ending September 30, 2020. 1 Assumes captive agency income tax-effected at 21%; excludes realized gains and change in fair value of equities. 2 Expense ratio shown net of policy and installment fees. 87.7% Independent 73% Captive 27%

Earnings Call Presentation – 4Q 2020 Focused and consistent strategy execution yields solid value creation for all stakeholders Fourth Quarter Financial Highlights 16% ROATCE and 15% YoY growth in TBV per common share excluding unrealized gains1 As Reported As Reported Quarter Ended Full Year (Dollars in millions, except per share amounts) Dec 31, 2020 Dec 31, 2019 Dec 31, 2020 Dec 31, 2019 Net Income $98 $125 $410 $531 Net Income – Per Diluted Share $1.46 $1.85 $6.14 $7.96 Adjusted Consolidated Net Operating Income1 $106 $98 $439 $418 Adj. Consolidated Net Op. Income – Per Diluted Share1 $1.59 $1.45 $6.57 $6.27 Catastrophe Losses $6 $16 $107 $77 Tangible Book Value Per Common Share excluding unrealized gains1 $41.65 $36.36 Return on Avg. Tangible Common Equity1 16.3% 24.7% Specialty PIF growth (ex. Classic Car) 4.3% 9.3% 6 ¹ Non-GAAP financial measure; please see reconciliation in appendix on pages 23-32

Earnings Call Presentation – 4Q 2020 Business model continues to produce high quality operating income Review of Net Operating Income ¹ Non-GAAP financial measure; see reconciliation in appendix pages 23-32 *All Other includes partial satisfaction of judgment, sale of Classic Car, refinement of CEI estimate and impact of purchase accounting Adjusted Consolidated Net Operating Income Per Share Increased 10% 7 Three Months Ended, As Reported Dec. 31, Sep. 30, Jun. 30, Mar. 31, Dec. 31, Variance Dollars per Unrestricted Share - Diluted 2020 2020 2020 2020 2019 QoQ Net Income 1.46$ 1.83$ 1.91$ 0.95$ 1.85$ (0.39) (Income) Loss from Change in FV of Equity & Convertible Securities (0.86) (0.53) (0.86) 1.39 (0.46) (0.40) Investment Related (Gains)/Losses - (0.12) (0.14) (0.19) (0.03) 0.03 Net Impairment Losses (0.01) 0.01 0.08 0.14 0.02 (0.03) Acquisition Related Transaction, Integration & Other Costs 0.24 0.17 0.21 0.14 0.07 0.17 Debt Extinguishment, Pension and Other Charges 0.76 - - - - 0.76 Adj. Consolidated Net Operating Income1 1.59 1.36 1.20 2.43 1.45 0.14 Sources of Volatility: Income (Loss) After-Tax From: Catastrophes (0.07) (0.80) (0.34) (0.07) (0.19) 0.12 - Prior-year Reserve Development (0.10) (0.10) (0.22) (0.01) 0.18 (0.28) - Alternative Investment Income 0.27 0.12 (0.14) 0.07 0.07 0.20 - All Other* (0.05) (0.05) - 1.03 - (0.05) Total from Sources of Volatility 0.05$ (0.83)$ (0.70)$ 1.02$ 0.06$ (0.01)$

Earnings Call Presentation – 4Q 2020 Reduced Pension Liability Exposure Further de-risked non-strategic pension obligation – Ongoing Plan funding > ~100% 8 • During the quarter, took advantage of the favorable environment to further reduce Kemper’s pension benefit obligation to $382 million from $660 million at the end of 2019 • Exposure reduction accomplished through annuity purchases and lump-sum payments • Transactions resulted in a $51 million (after-tax) noncash settlement charge recorded through the “Total Insurance Expenses” line item Took advantage of an attractive pension environment to reduce non-value-added risk and further strengthen an already strong balance sheet Current Pension Benefit Obligation, $382 MM Group Annuity Contracts, $205 MM Lump Sum Payment, $117 MM $322 MM Liability Reduction
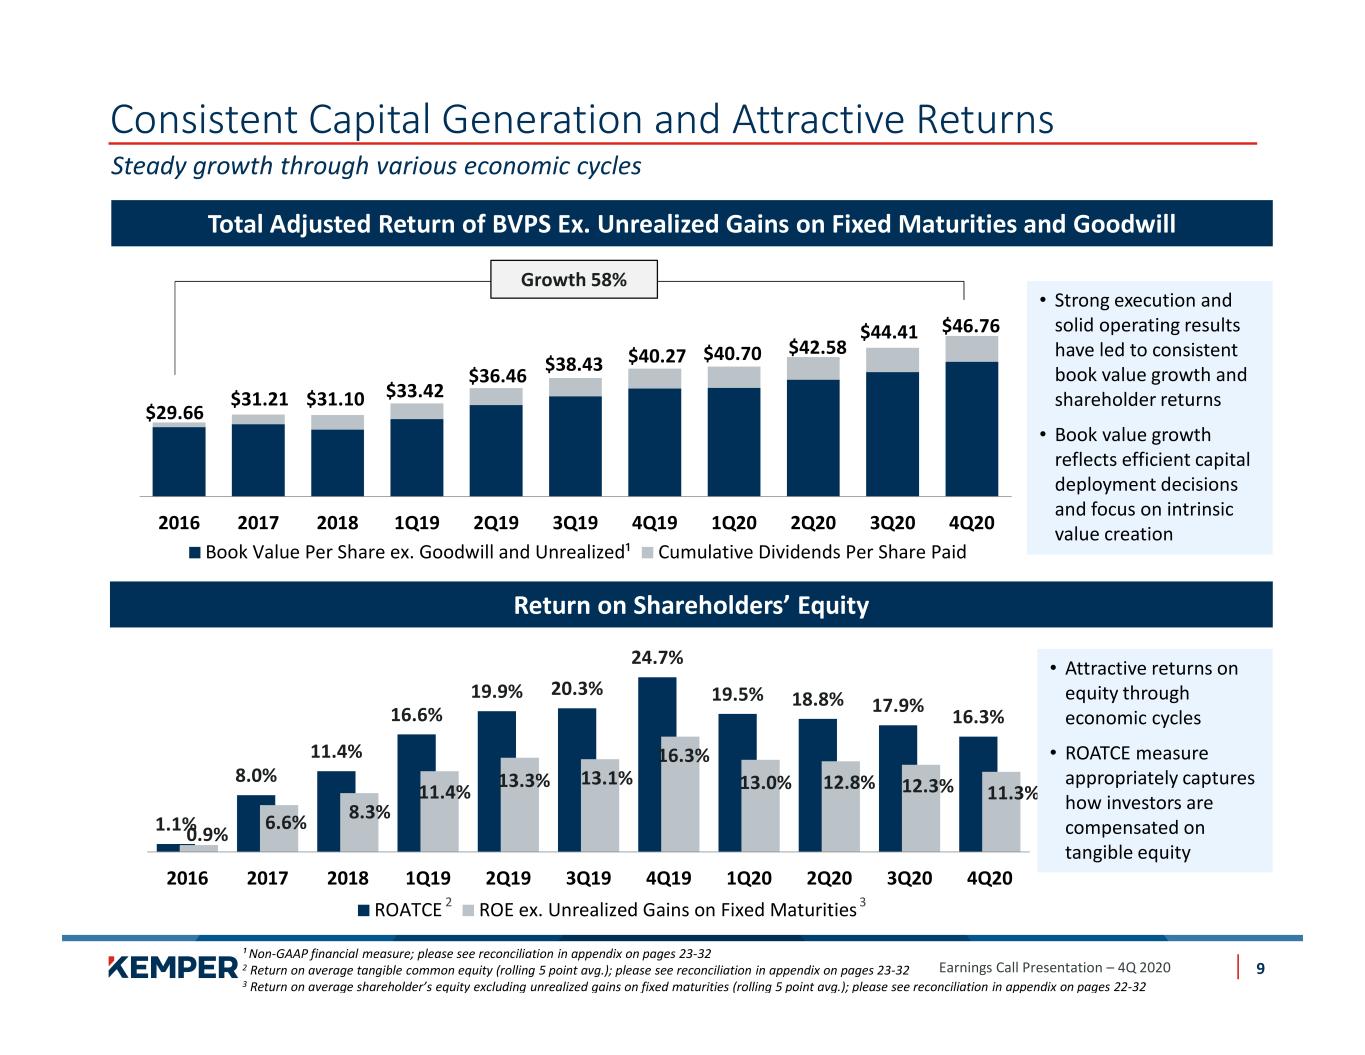
Earnings Call Presentation – 4Q 2020 Consistent Capital Generation and Attractive Returns Steady growth through various economic cycles Total Adjusted Return of BVPS Ex. Unrealized Gains on Fixed Maturities and Goodwill Return on Shareholders’ Equity 2016 2017 2018 1Q19 2Q19 3Q19 4Q19 1Q20 2Q20 3Q20 4Q20 Book Value Per Share ex. Goodwill and Unrealized¹ Cumulative Dividends Per Share Paid $33.42$31.21 $31.10 $29.66 $36.46 $38.43 $40.27 $40.70 $44.41 $42.58 $46.76 1.1% 8.0% 11.4% 16.6% 19.9% 20.3% 24.7% 19.5% 18.8% 17.9% 16.3% 0.9% 6.6% 8.3% 11.4% 13.3% 13.1% 16.3% 13.0% 12.8% 12.3% 11.3% 2016 2017 2018 1Q19 2Q19 3Q19 4Q19 1Q20 2Q20 3Q20 4Q20 ROATCE ROE ex. Unrealized Gains on Fixed Maturities Growth 58% • Strong execution and solid operating results have led to consistent book value growth and shareholder returns • Book value growth reflects efficient capital deployment decisions and focus on intrinsic value creation • Attractive returns on equity through economic cycles • ROATCE measure appropriately captures how investors are compensated on tangible equity ¹ Non-GAAP financial measure; please see reconciliation in appendix on pages 23-32 2 Return on average tangible common equity (rolling 5 point avg.); please see reconciliation in appendix on pages 23-32 3 Return on average shareholder’s equity excluding unrealized gains on fixed maturities (rolling 5 point avg.); please see reconciliation in appendix on pages 22-32 2 3 9
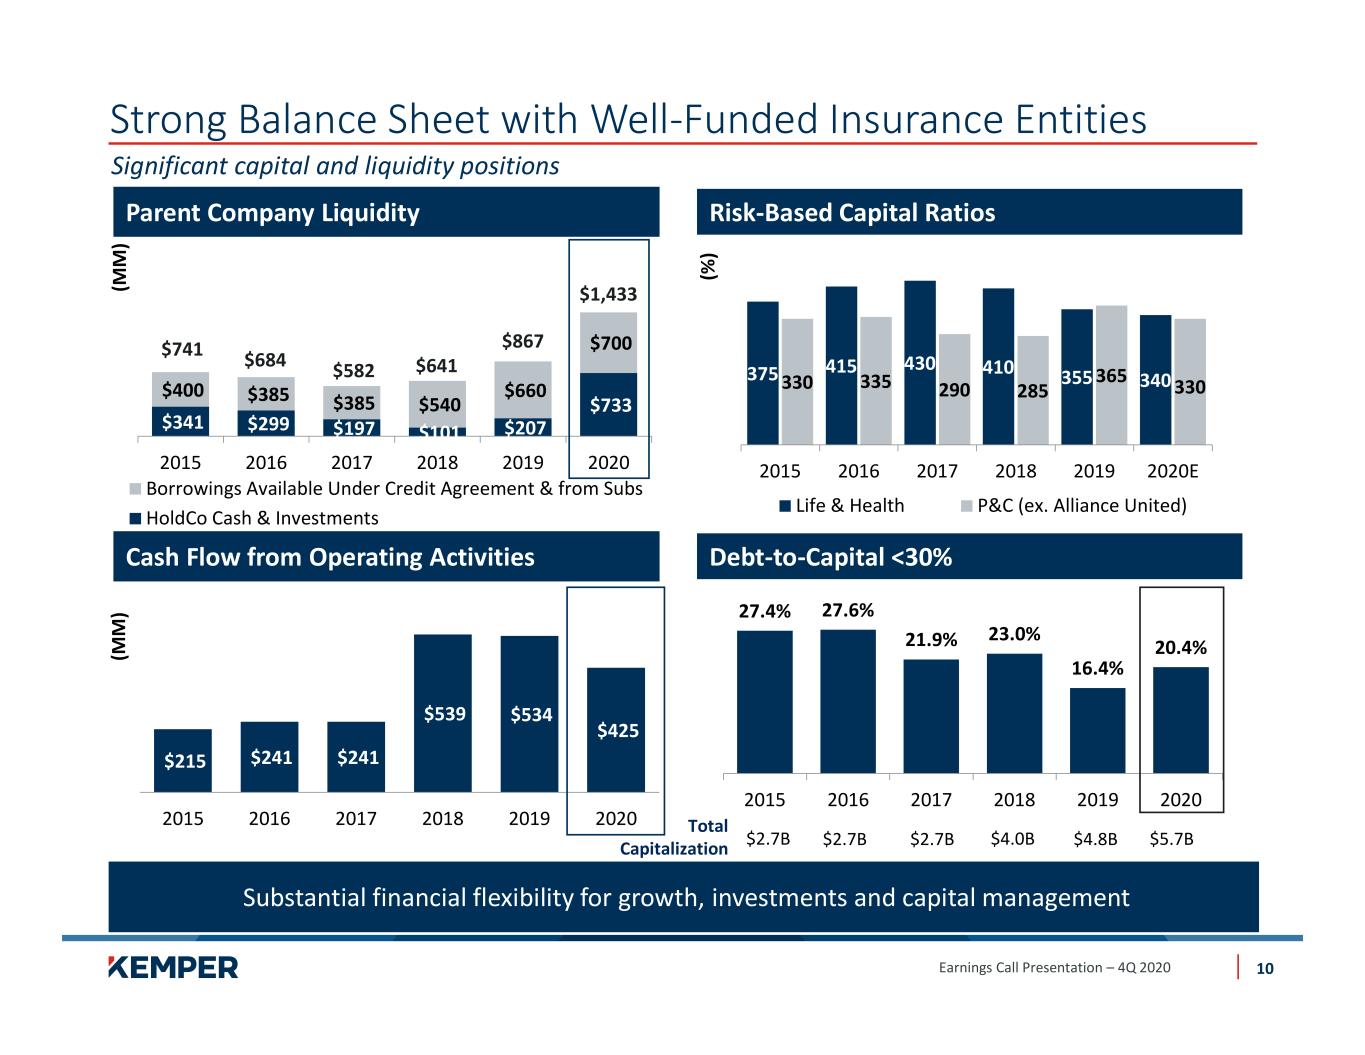
Earnings Call Presentation – 4Q 2020 27.4% 27.6% 21.9% 23.0% 16.4% 20.4% 2015 2016 2017 2018 2019 2020 Debt-to-Capital <30% Strong Balance Sheet with Well-Funded Insurance Entities Significant capital and liquidity positions Debt Cash Flow from Operating Activities $2.7B $4.0B$2.7B$2.7B Total Capitalization Parent Company Liquidity Risk-Based Capital Ratios $341 $299 $197 $101 $207 $733 $400 $385 $385 $540 $660 $700 2015 2016 2017 2018 2019 2020 Borrowings Available Under Credit Agreement & from Subs HoldCo Cash & Investments (M M ) 375 415 430 410 355 340330 335 290 285 365 330 2015 2016 2017 2018 2019 2020E Life & Health P&C (ex. Alliance United) (% ) $741 $641$582$684 (M M ) $215 $241 $241 $539 $534 $425 2015 2016 2017 2018 2019 2020 $867 $4.8B Substantial financial flexibility for growth, investments and capital management $5.7B 10 $1,433

Earnings Call Presentation – 4Q 2020 52% 15% 6% 6% 6% 8% 7% Other States/ Munis 63% 30% 5% 2% Diversified & Highly-Rated Portfolio Fixed Maturity Ratings $7.6 Billion A or Higher ≤ CCC B / BB BBB Diversified Portfolio with Consistent Returns Note: Charts may not balance due to rounding ¹ Includes COLI. Please see reconciliation of COLI’s inclusion in net investment income on page 26 2 Equity securities excludes $295 million of Other Equity Interests of LP/LLC’s that have been reclassified into Alternative Investments • Net investment income and portfolio yield benefitted from strong alternative investment income • Investment portfolio is designed for growth of both income and total return • Investment income supports long-term business objectives $88 $80 $80 $81 $81 $6 $6 $(12) $11 $22 4Q19 1Q20 2Q20 3Q20 4Q20 Core Portfolio Alternative Inv. Portfolio Net Investment Income¹ (M M ) $97 $103$92$68$86 Overview Corporates Short-term Alternatives² Equity² U.S. Gov’t Portfolio Composition Pre-Tax Equiv. Annualized Book Yield¹ $10.4 Billion 4.6% 4.1% 3.2% 4.2% 4.7% 0.9% 4Q19 1Q20 2Q20 3Q20 4Q20 11 Alternatives Impact

Earnings Call Presentation – 4Q 2020 93.1 93.1 88.5 85.4 90.8 92.3 93.1 91.0 88.9 89.4 4Q19 1Q20 2Q20 3Q20 Q420 Underlying Combined Ratio¹ QTD YTD Specialty Property & Casualty Insurance Segment1 Sustainable competitive advantages position Specialty for growth at solid margins Source: Population growth sources include U.S. Census Bureau and The Association Institute ¹ As adjusted for acquisition; see reconciliation on Pages 23-32 2 Non-GAAP financial measure; see reconciliation in appendix on pages 23-32 • 2.5% growth in policies in-force, 4.3% excluding Classic Car, compared to 4Q’19 • COVID-related shutdowns impacted shopping behavior • Earned premiums increased 10%, led by continued growth opportunities in core and emerging geographies • Long-term outlook remains; attractive growth opportunities at solid margins (% ) Key Highlights Strength of franchise continues to create value for our stakeholders Written Premium Population CAGR State Groupings TTM ($ million) YoY Growth ’16-’19 Est. ’20-’30 California $2,050 1.9% 0.3% 0.8% Florida / Texas $853 24.5% 1.3% 1.6% Expansion States $219 24.4% 1.0% 1.1% Other $50 - 0.3% 0.4% Total $3,172 8.4% US 0.6% Hispanic 1.6% 12 Key Metrics ($ in millions) 4Q’20 Change to 4Q’19 Earned Premiums $882 10.3% Underlying Loss & LAE Ratio2 70.9% (400)bps Underlying Expense Ratio2 19.8% 160 bps Policies In-Force (000) 1,866 2.5% Policies In-Force ex. Classic Car (000) 1,858 4.3%

Earnings Call Presentation – 4Q 2020 Preferred Property & Casualty Insurance Segment Underlying combined ratio on a quarter-over-quarter basis decreased 3 points Key Highlights 104.5 97.5 88.6 96.8 103.1 82.9 83.5 77.8 80.4 77.6 4Q19 1Q20 2Q20 3Q20 4Q20 Underlying Combined Ratio¹ Auto Home & Other Profitability improvement actions continue ¹ Non-GAAP financial measure; please see reconciliation in appendix on pages 23-32 • Underlying combined ratio in the segment decreased to 93.6% for the quarter; 90.4% on a full year basis • Auto underlying combined ratio reflects efforts to reposition the business for profitability, as well as macro environmental frequency trends • Home & Other underlying full-year combined ratio improvement driven by underwriting, pricing, and exposure enhancements • Current-year catastrophe losses reflect reduction in third quarter wildfire losses (% ) 13 Key Metrics ($ in millions) 4Q’20 Change to 4Q’19 Auto Earned Premiums $107 (8.6)% Policies In-Force (000) 219 (11.5)% Home & Other Earned Premiums $62 (8.7)% Policies In-Force (000) 198 (8.0)%

Earnings Call Presentation – 4Q 2020 Life & Health Insurance Segment Business remains profitable while absorbing protracted “P&C catastrophe-like” pandemic Note: Chart may not balance due to rounding ¹ Excludes other income 2 Please see reconciliation of COLI’s inclusion in net investment income on page 26 (M M ) • Business remains profitable, despite challenging macro environment - Increased mortality experience remains largely in-line with country-wide trends • Continued expectation that COVID will be an earnings event, not a capital event • Confident in long-term cash flow and diversification benefits Key Highlights $161 $163 $163 $161 $162 $55 $51 $44 $51 $53 4Q19 1Q20 2Q20 3Q20 4Q20 Revenues1 Earned Premiums Net Investment Income² $215$207$214$216 $211 Despite current environmental pressure, long-term fundamentals remain solid Key Metrics ($ in millions) 4Q’20 Change to 4Q’19 L&H Net Operating Income $9.4 (67.5)% Life Face Value of In-Force $19,859 1.1% Policies In-Force (000) 3,357 (2.6)% 14
Earnings Call Presentation – 4Q 2020 Appendix 15

Earnings Call Presentation – 4Q 2020 ….to create value for all our stakeholders A Leading Specialized Insurer Taking advantage of a diversified portfolio of niche businesses…. Founded in 1990 and headquartered in Chicago, with subsidiaries writing policies since 1911 ~6.2M Policies ~30,000 Agents/Brokers ~9,500 Employees Preferred personal lines insurance providing preferred automobile, homeowners and other personal insurance products ~$14B Assets Specialty P&C insurance providing personal and commercial automobile insurance products Life and health insurance providing life, supplemental benefits, and other property insurance products 16

Earnings Call Presentation – 4Q 2020 Capital Deployment Priorities Dedicated to being good stewards of capital Management and capital deployment priorities focused on maximizing shareholder value 1. Investment in the business • Fund profitable organic growth at appropriate risk-adjusted returns • Strategic investments and acquisitions that enhance the business and meet or exceed our ROE targets over time 2. Return capital to shareholders • Repurchase shares opportunistically • Maintain competitive dividends 17
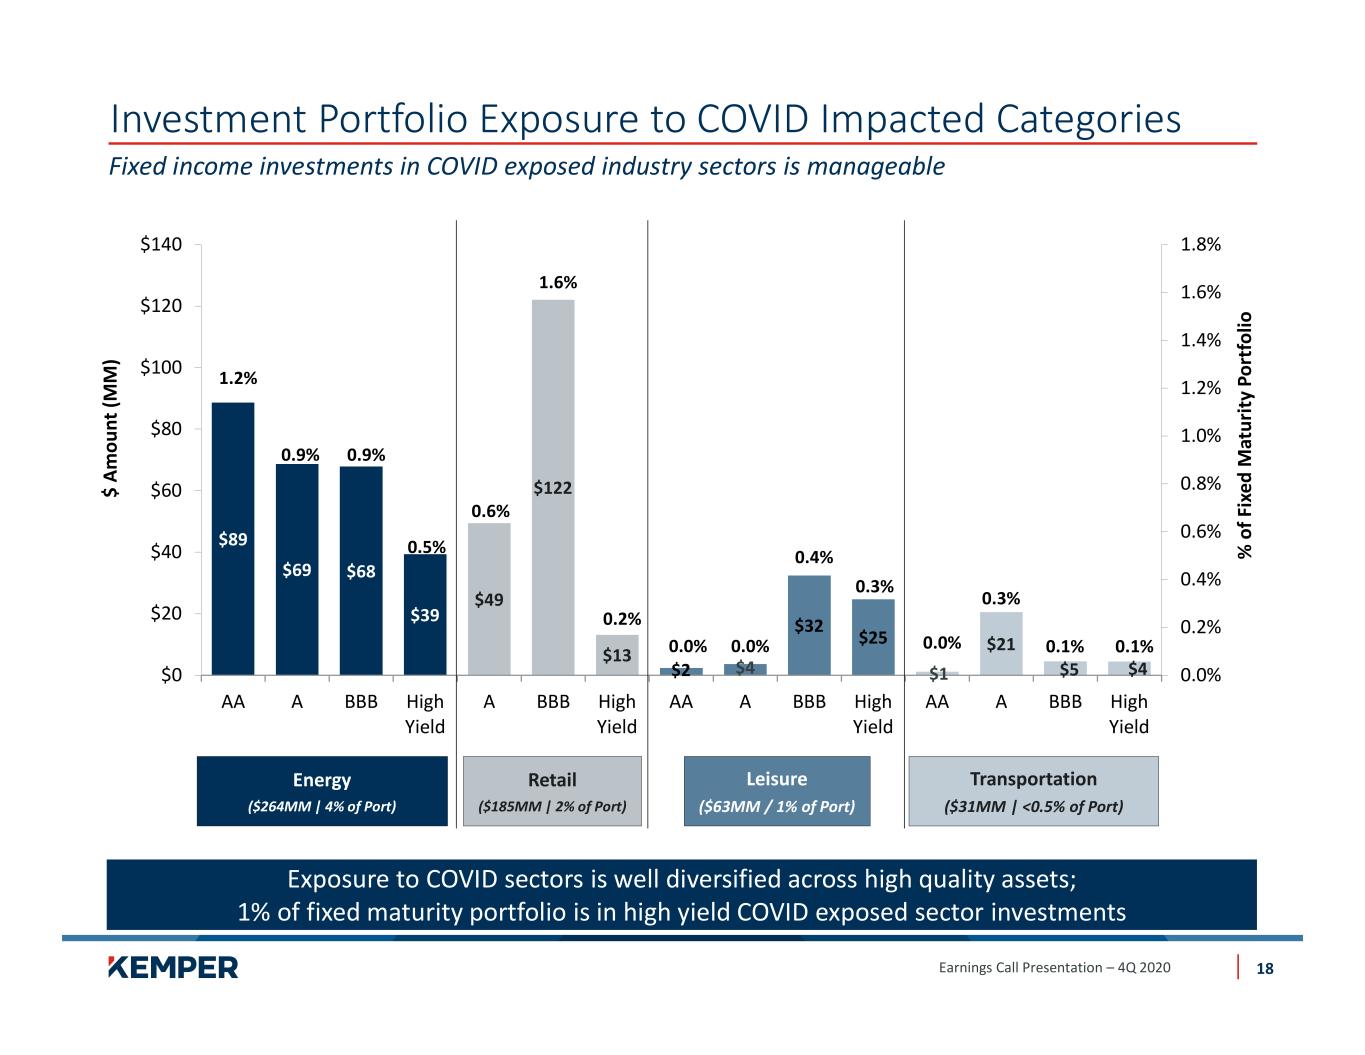
Earnings Call Presentation – 4Q 2020 Investment Portfolio Exposure to COVID Impacted Categories 18 $89 $69 $68 $39 $49 $122 $13 $2 $4 $32 $25 $1 $21 $5 $4 1.2% 0.9% 0.9% 0.5% 0.6% 1.6% 0.2% 0.0% 0.0% 0.4% 0.3% 0.0% 0.3% 0.1% 0.1% 0.0% 0.2% 0.4% 0.6% 0.8% 1.0% 1.2% 1.4% 1.6% 1.8% $0 $20 $40 $60 $80 $100 $120 $140 AA A BBB High Yield A BBB High Yield AA A BBB High Yield AA A BBB High Yield Exposure to COVID sectors is well diversified across high quality assets; 1% of fixed maturity portfolio is in high yield COVID exposed sector investments $ A m ou nt (M M ) % o f F ix ed M at ur it y Po rt fo lio Fixed income investments in COVID exposed industry sectors is manageable Energy ($264MM | 4% of Port) Retail ($185MM | 2% of Port) Leisure ($63MM / 1% of Port) Transportation ($31MM | <0.5% of Port)

Earnings Call Presentation – 4Q 2020 Below Investment Grade Fixed Maturities Portfolio of $490 Million 19 Portfolio is diversified across different asset types Below investment grade portfolio represents roughly 6% of our fixed maturities portfolio $207 $103 $95 $62 $19 $5 $1 $0 42.2% 20.9% 19.4% 12.6% 3.8% 0.9% 0.2% 0.0% 0.0% 5.0% 10.0% 15.0% 20.0% 25.0% 30.0% 35.0% 40.0% 45.0% $0 $50 $100 $150 $200 $250 Private Senior Private Junior CLO Public Corp Munis Foreign Government Non-Agency MBS Redeemable Preferred B el ow In ve st m en t G ra de $ A m ou nt (M M ) % o f F ix ed M at ur it y Po rt fo lio
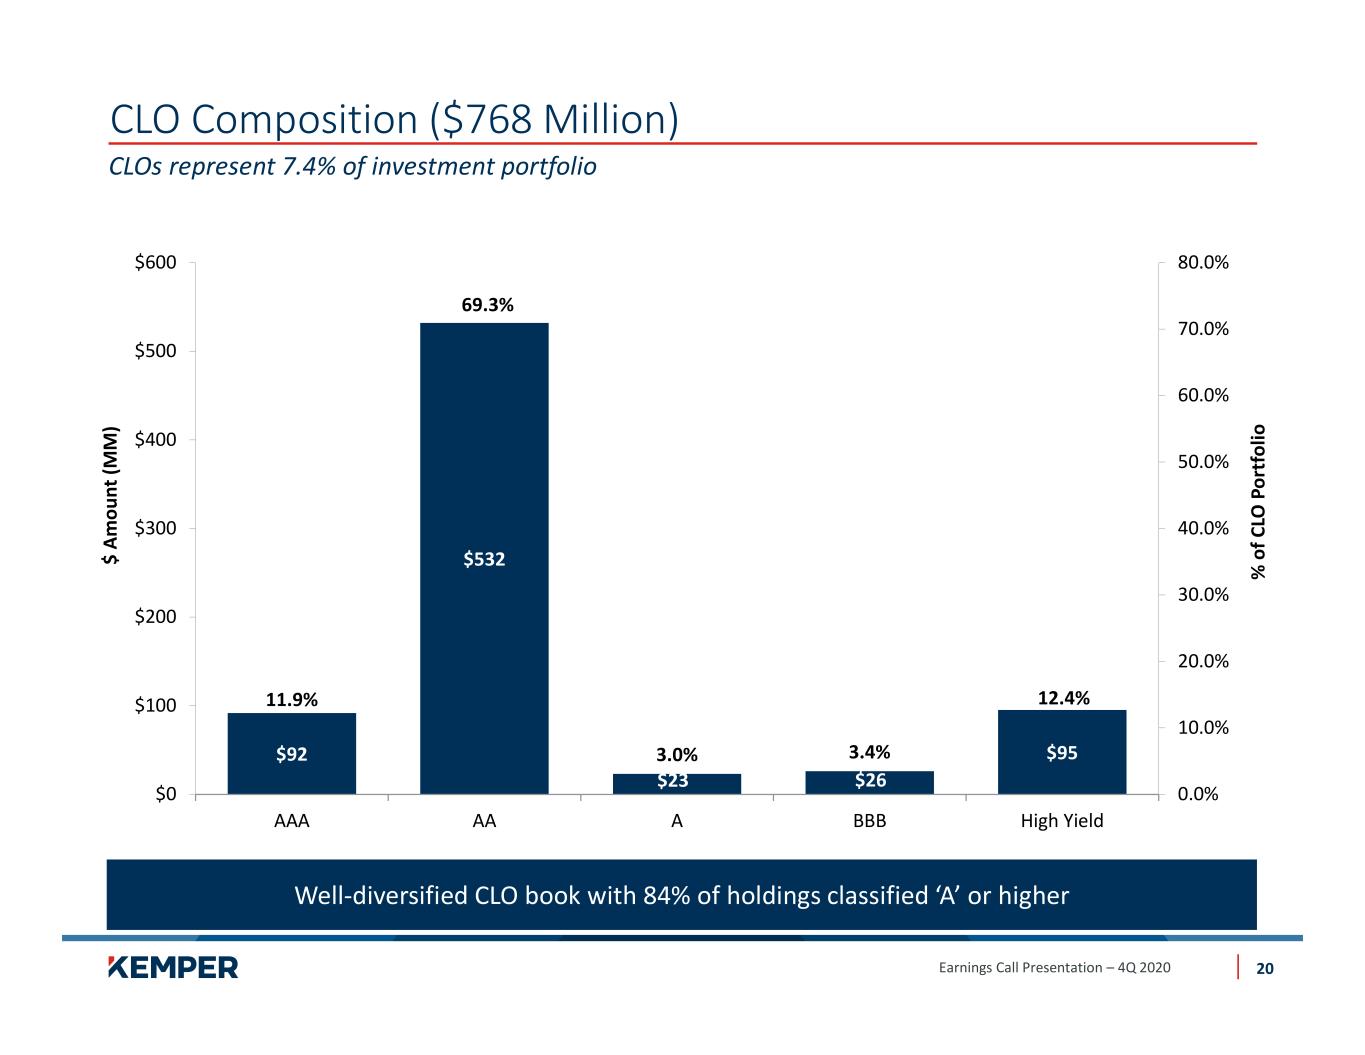
Earnings Call Presentation – 4Q 2020 CLO Composition ($768 Million) 20 $92 $532 $23 $26 $95 11.9% 69.3% 3.0% 3.4% 12.4% 0.0% 10.0% 20.0% 30.0% 40.0% 50.0% 60.0% 70.0% 80.0% $0 $100 $200 $300 $400 $500 $600 AAA AA A BBB High Yield Well-diversified CLO book with 84% of holdings classified ‘A’ or higher $ A m ou nt (M M ) % o f C LO P or tf ol io CLOs represent 7.4% of investment portfolio

Earnings Call Presentation – 4Q 2020 Alternative Investment Portfolio of $533 Million 21 Portfolio is highly diversified with strategies focused on private credit, private equity and hedge funds Alternative investment portfolio is ~5% of total investments and diversified across underlying investment strategies with primary focus on current income generation $329.6 $110.5 $71.6 $21.3 Private Credit Private Equity Hedge Funds Tax Equity Funds Private Credit ~3% of total investments (62% of Alts portfolio) Diversification across date of investment, industry and geography Private Equity ~ 1% of total investments (21% of Alts portfolio) Diversification across date of investment, industry and geography Hedge Funds < 1% of total investments (13% of Alts portfolio) Diversified in strategies with focus on minimum correlation to public markets and additional liquidity relative to Private Credit and Private Equity strategies Tax Equity Funds < 1% of total investments (4% of Alts portfolio)

Earnings Call Presentation – 4Q 2020 2021 Reinsurance Program Both programs were renewed with no significant change • Policy placed at 1/1/21 similar to prior three years • Total coverage: 95% of $225 million excess of $50 million Catastrophe Reinsurance Program (Multi-Year) • Same coverage as 2020 program • Intended to reduce volatility from high- frequency, low severity events • Coverage – $50 million in excess of $60 million – $500k deductible per storm – Perils: All perils, excluding named storms (e.g., hurricanes) and earthquakes – Covered Line: Property, Fire and Dwelling Aggregate Catastrophe Program 2021 Aggregate Catastrophe Reinsurance Program 22 Retention 3-Year Term Placed 1/1/20 $100M xs $150M 31.67% Placed 3-Year Term Placed 1/1/21 $100M xs $150M 31.67% Placed* 3-Year Term Placed 1/1/20 $100M xs $50M 31.67% Placed 3-Year Term Placed 1/1/21 $100M xs $50M 31.67% Placed* 3-Year Term Placed 1/1/19 $100M xs $50M 31.67% Placed Retention 100% of first $50M Re te n tion 5% of $2 25M xs $ 50 M 3-Year Term Placed 1/1/19 $100M xs $150M 31.67% Placed 1-Year Term Placed 1/1/21 $25M xs $250M 95% Placed *4% was placed on an annual basis through Reinsurance Facilities

Earnings Call Presentation – 4Q 2020 Book Value Per Share Excluding Net Unrealized Gains on Fixed Maturities is a ratio that uses a non-GAAP financial measure. It is calculated by dividing shareholders’ equity after excluding the after-tax impact of net unrealized gains on fixed income securities by total Common Shares Issued and Outstanding. Book value per share is the most directly comparable GAAP financial measure. The Company uses the trend in book value per share, excluding the after-tax impact of net unrealized gains on fixed income securities in conjunction with book value per share to identify and analyze the change in net worth attributable to management efforts between periods. The Company believes the non-GAAP financial measure is useful to investors because it eliminates the effect of items that can fluctuate significantly from period to period and are generally driven by economic developments, primarily capital market conditions, the magnitude and timing of which are generally not influenced by management. The Company believes it enhances understanding and comparability of performance by highlighting underlying business activity and profitability drivers. Book Value Per Share Excluding Net Unrealized Gains on Fixed Maturities and Goodwill is a calculation that uses a non-GAAP financial measure. It is calculated by dividing shareholders’ equity after excluding the after-tax impact of net unrealized gains on fixed income securities and goodwill by total Common Shares Issued and Outstanding. Book value per share is the most directly comparable GAAP financial measure. The Company uses the trends in book value per share excluding the after-tax impact of net unrealized gains on fixed income securities and goodwill in conjunction with book value per share to identify and analyze the change in net worth excluding goodwill attributable to management efforts between periods. The Company believes the non-GAAP financial measure is useful to investors because it eliminates the effect of items that can fluctuate significantly from period to period and are generally driven by economic developments, primarily capital market conditions, the magnitude and timing of which are not influenced by management. The Company believes it enhances understanding and comparability of performance by highlighting underlying business activity and profitability drivers. Non-GAAP Financial Measures 23 4Q'20 3Q'20 2Q'20 1Q'20 4Q'19 3Q'19 2Q'19 1Q'19 2018 2017 2016 Book Value Per Share 69.74$ 66.47$ 64.15$ 57.54$ 59.59$ 58.43$ 55.34$ 51.13$ 47.10$ 41.11$ 38.52$ Less: Net Unrealized Gains on Fixed Maturities Per Share (11.07) (9.84) (9.02) (4.01) (6.51) (6.92) (5.52) (3.72) (1.70) (5.54) (3.52) Book Value Per Share Excluding Net Unrealized Gains on Fixed Maturities 58.67$ 56.63$ 55.13$ 53.53$ 53.08$ 51.51$ 49.82$ 47.41$ 45.40$ 35.57$ 35.00$ Less: Goodwill (17.02) (17.03) (17.06) (17.04) (16.72) (16.71) (16.74) (17.12) (17.18) (6.28) (6.30) Book Value Per Share Excluding Net Unrealized Gains on Fixed Maturities and Goodwill 41.65$ 39.60$ 38.07$ 36.49$ 36.36$ 34.80$ 33.08$ 30.29$ 28.22$ 29.29$ 28.70$ For the Periods Ended

Earnings Call Presentation – 4Q 2020 Return on Equity Non-GAAP Financial Measures 24 4Q'20 3Q'20 2Q'20 1Q'20 4Q'19 3Q'19 2Q'19 1Q'19 2018 2017 2016 Rolling 12 Month Return on Average Shareholders' Equity (5 Point Avg) 9.8% 10.8% 11.4% 11.8% 14.8% 12.1% 12.4% 10.8% 7.7% 5.9% 0.8% Less: Net Unrealized Gains on Fixed Maturities 1.5% 1.5% 1.4% 1.2% 1.5% 1.0% 0.9% 0.6% 0.6% 0.7% 0.1% Rolling 12 Month Return on Average Shareholders' Equity Excluding Net Unrealized Gains on Fixed Maturities (5 Point Avg) 11.3% 12.3% 12.8% 13.0% 16.3% 13.1% 13.3% 11.4% 8.3% 6.6% 0.9% Less: Goodwill 5.0% 5.6% 6.0% 6.5% 8.4% 7.2% 6.6% 5.2% 3.1% 1.4% 0.2% Rolling 12 Month Return on Average Shareholders' Equity Excluding Net Unrealized Gains on Fixed Maturities and Goodwill (5 Point Avg) 16.3% 17.9% 18.8% 19.5% 24.7% 20.3% 19.9% 16.6% 11.4% 8.0% 1.1% For the Periods Ended
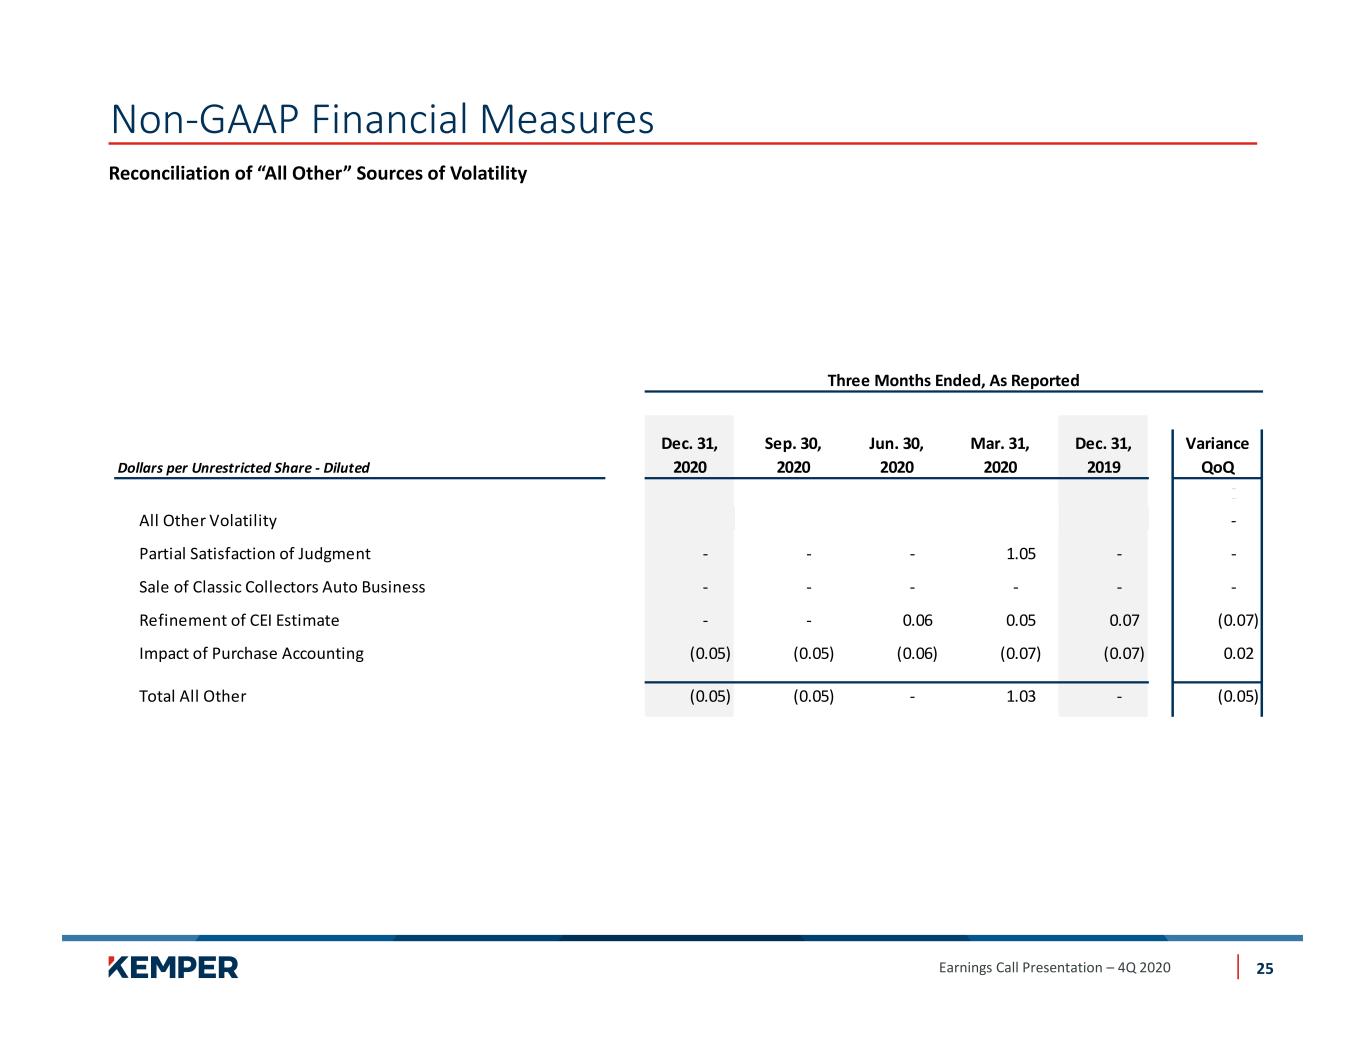
Earnings Call Presentation – 4Q 2020 Reconciliation of “All Other” Sources of Volatility Non-GAAP Financial Measures 25 Three Months Ended, As Reported Dec. 31, Sep. 30, Jun. 30, Mar. 31, Dec. 31, Variance Dollars per Unrestricted Share - Diluted 2020 2020 2020 2020 2019 QoQ - - All Other Volatility - Partial Satisfaction of Judgment - - - 1.05 - - Sale of Classic Collectors Auto Business - - - - - - Refinement of CEI Estimate - - 0.06 0.05 0.07 (0.07) Impact of Purchase Accounting (0.05) (0.05) (0.06) (0.07) (0.07) 0.02 Total All Other (0.05) (0.05) - 1.03 - (0.05)

Earnings Call Presentation – 4Q 2020 Reconciliation of COLI investment into Net Investment Income. Prior to 1Q 2020, COLI was reported in “Other Income.” Starting in the 1Q 2020, COLI was reported in net investment income. Non-GAAP Financial Measures 26 For the Consolidated 4Q'19 Reported Net Investment Income 93.9$ COLI Investment Income 3.6$ Total Adjusted Net Investment Income 97.5$ Reported Pre-Tax Equivalent Book Yield 4.5% COLI Pre-Tax Equivalent Book Yield 0.1% Total Pre-Tax Equivalent Book Yield 4.6% Life and Health Reported Net Investment Income 52.0$ COLI Investment Income 2.7$ Total Adjusted Net Investment Income 54.7$ Period Ended

Earnings Call Presentation – 4Q 2020 Kemper believes that Adjusted Consolidated Net Operating Income provides investors with a valuable measure of its ongoing performance because it reveals underlying operational performance trends that otherwise might be less apparent if the items were not excluded. Income (Loss) from Change in Fair Value of Equity and Convertible Securities, Net Realized Gains on Sales of Investments and Impairment Losses related to investments included in the Company’s results may vary significantly between periods and are generally driven by business decisions and external economic developments such as capital market conditions that impact the values of the Company’s investments, the timing of which is unrelated to the insurance underwriting process. Acquisition Related Transaction and Integration Costs may vary significantly between periods and are generally driven by the timing of acquisitions and business decisions which are unrelated to the insurance underwriting process. Debt Extinguishment, Pension and Other Charges relate to (i) loss from early extinguishment of debt, which is driven by the Company’s financing and refinancing decisions and capital needs, as well as external economic developments such as debt market conditions, the timing of which is unrelated to the insurance underwriting process; (ii) settlement of pension plan obligations which are business decisions are made by the Company, the timing of which is unrelated to the underwriting process; and (iii) other charges that are non-standard, not part of the ordinary course of business, and unrelated to the insurance underwriting process. Significant non-recurring items are excluded because, by their nature, they are not indicative of the Company’s business or economic trends. Non-GAAP Financial Measures 27
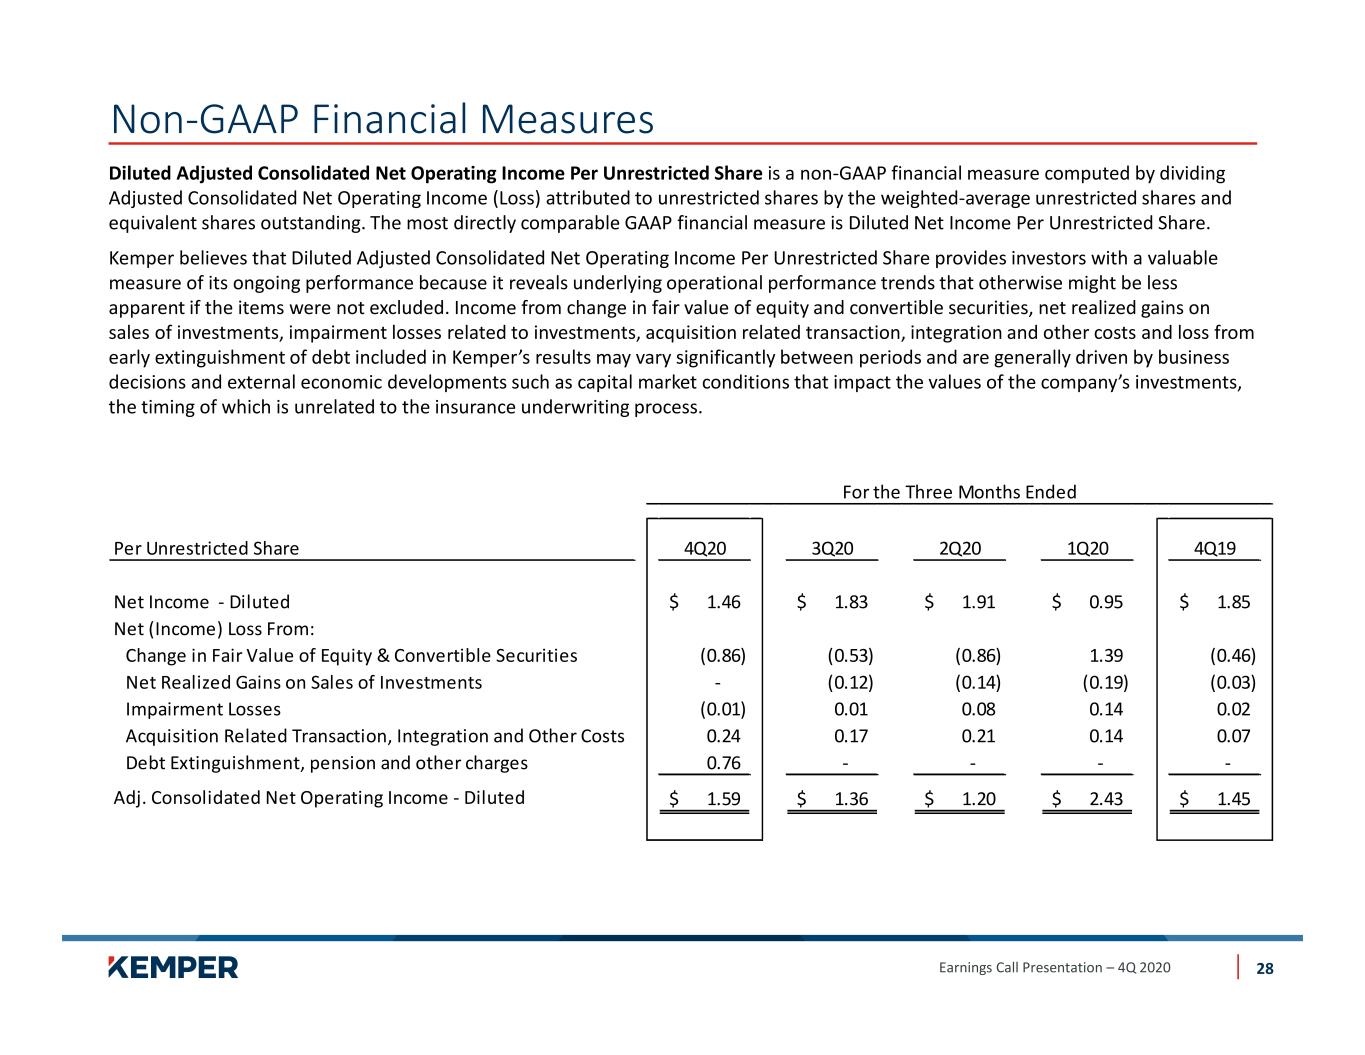
Earnings Call Presentation – 4Q 2020 Diluted Adjusted Consolidated Net Operating Income Per Unrestricted Share is a non-GAAP financial measure computed by dividing Adjusted Consolidated Net Operating Income (Loss) attributed to unrestricted shares by the weighted-average unrestricted shares and equivalent shares outstanding. The most directly comparable GAAP financial measure is Diluted Net Income Per Unrestricted Share. Kemper believes that Diluted Adjusted Consolidated Net Operating Income Per Unrestricted Share provides investors with a valuable measure of its ongoing performance because it reveals underlying operational performance trends that otherwise might be less apparent if the items were not excluded. Income from change in fair value of equity and convertible securities, net realized gains on sales of investments, impairment losses related to investments, acquisition related transaction, integration and other costs and loss from early extinguishment of debt included in Kemper’s results may vary significantly between periods and are generally driven by business decisions and external economic developments such as capital market conditions that impact the values of the company’s investments, the timing of which is unrelated to the insurance underwriting process. Non-GAAP Financial Measures 28 Per Unrestricted Share 4Q20 3Q20 2Q20 1Q20 4Q19 Net Income - Diluted 1.46$ 1.83$ 1.91$ 0.95$ 1.85$ Net (Income) Loss From: Change in Fair Value of Equity & Convertible Securities (0.86) (0.53) (0.86) 1.39 (0.46) Net Realized Gains on Sales of Investments - (0.12) (0.14) (0.19) (0.03) Impairment Losses (0.01) 0.01 0.08 0.14 0.02 Acquisition Related Transaction, Integration and Other Costs 0.24 0.17 0.21 0.14 0.07 Debt Extinguishment, pension and other charges 0.76 - - - - Adj. Consolidated Net Operating Income - Diluted 1.59$ 1.36$ 1.20$ 2.43$ 1.45$ For the Three Months Ended

Earnings Call Presentation – 4Q 2020 Underlying Combined Ratio is a non-GAAP financial measure. It is computed by adding the Current Year Non-catastrophe Losses and LAE Ratio with the Insurance Expense Ratio. The most directly comparable GAAP financial measure is the Combined Ratio, which is computed by adding total incurred losses and LAE, including the impact of catastrophe losses and loss and LAE reserve development from prior years, with the Insurance Expense Ratio. The Company believes the underlying combined ratio is useful to investors and is used by management to reveal the trends in the Company’s property and casualty insurance businesses that may be obscured by catastrophe losses and prior-year reserve development. These catastrophe losses cause loss trends to vary significantly between periods as a result of their incidence of occurrence and magnitude, and can have a significant impact on the combined ratio. Prior-year reserve developments are caused by unexpected loss development on historical reserves. Because reserve development relates to the re-estimation of losses from earlier periods, it has no bearing on the performance of our insurance products in the current period. The Company believes it is useful for investors to evaluate these components separately and in the aggregate when reviewing the Company’s underwriting performance. The underlying combined ratio should not be considered a substitute for the combined ratio and does not reflect the overall underwriting profitability of our business. Non-GAAP Financial Measures 29

Earnings Call Presentation – 4Q 2020 Underlying Combined Ratio – Continued Non-GAAP Financial Measures 30 4Q20 3Q20 2Q20 1Q20 4Q19 Specialty P&C Insurance Combined Ratio as Reported 91.7% 86.3% 91.0% 94.5% 93.8% Current Year Catastrophe Loss and LAE Ratio (0.6%) (0.2%) (0.6%) 0.0% (0.5%) Prior Years Non-Catastrophe Losses and LAE 0.2% (0.2%) (1.3%) (0.6%) 0.5% Prior Years Catastrophe Losses and LAE Ratio 0.0% 0.0% 0.0% 0.0% 0.0% Underlying Combined Ratio 91.3% 85.9% 89.1% 93.9% 93.8% Preferred P&C Insurance Combined Ratio as Reported 96.2% 129.9% 102.2% 92.6% 97.5% Current Year Catastrophe Loss and LAE Ratio 3.1% (35.5%) (12.6%) (2.7%) (6.4%) Prior Years Non-Catastrophe Losses and LAE (5.6%) (3.6%) (5.0%) 1.8% 3.8% Prior Years Catastrophe Losses and LAE Ratio (0.1%) (0.1%) (0.2%) 0.6% 1.7% Underlying Combined Ratio 93.6% 90.7% 84.4% 92.3% 96.6% Preferred Auto Combined Ratio as Reported 112.3% 103.5% 100.1% 99.5% 103.6% Current Year Catastrophe Loss and LAE Ratio (0.4%) (1.6%) (2.0%) (0.2%) (1.3%) Prior Years Non-Catastrophe Losses and LAE (9.2%) (5.3%) (9.8%) (1.9%) 2.4% Prior Years Catastrophe Losses and LAE Ratio 0.4% 0.2% 0.3% 0.1% (0.2%) Underlying Combined Ratio 103.1% 96.8% 88.6% 97.5% 104.5% Preferred Home & Other Combined Ratio as Reported 68.6% 175.6% 105.4% 80.7% 87.0% Current Year Catastrophe Loss and LAE Ratio 9.2% (94.1%) (28.8%) (7.0%) (15.3%) Prior Years Non-Catastrophe Losses and LAE 0.6% (0.6%) 2.3% 8.3% 6.3% Prior Years Catastrophe Losses and LAE Ratio (0.8%) (0.5%) (1.1%) 1.5% 4.9% Underlying Combined Ratio 77.6% 80.4% 77.8% 83.5% 82.9% For the Three Months Ended

Earnings Call Presentation – 4Q 2020 As Adjusted for Acquisition – Continued Non-GAAP Financial Measures ¹ As Adjusted is a non-GAAP measure, which is comprised by excluding impact of purchase accounting in 2018 and including historical results of Kemper and Infinity in periods prior to acquisition date of July 2, 2018. 31 Specialty P&C Insurance Segment 31-Dec-20 30-Sep-20 30-Jun-20 31-Mar-20 31-Dec-19 Earned Premiums Kemper Specialty P&C - GAAP As Reported 882.4$ 871.4$ 759.0$ 822.5$ 799.7$ Current Year Non-CAT Losses and LAE Kemper Specialty P&C - GAAP As Reported 626.2$ 589.0$ 515.8$ 619.8$ 599.5$ Less: Impact of Purchase Accounting Amortization of Fair Value Adjustment to Infinity's Unpaid Loss and LAE 0.4 0.3 0.8 0.7 0.8 As Adjusted 1 625.8$ 588.7$ 515.0$ 619.1$ 598.7$ Insurance Expenses Kemper Specialty P&C - GAAP As Reported 179.1$ 159.5$ 161.2$ 152.1$ 150.7$ Less: Impact of Purchase Accounting 4.1 4.2 4.5 5.2 5.2 As Adjusted 1 175.0$ 155.3$ 156.7$ 146.9$ 145.5$ As Adjusted 1 Underlying Combined Ratio As Adjusted 1 Underlying Loss & LAE Ratio 70.9% 67.6% 67.8% 75.3% 74.9% As Adjusted 1 Expense Ratio 19.8% 17.8% 20.6% 17.9% 18.2% As Adjusted 1 Underlying Combined Ratio 90.8% 85.4% 88.5% 93.1% 93.1% Three Months Ended

Earnings Call Presentation – 4Q 2020 As Adjusted for Acquisition – Continued Non-GAAP Financial Measures ¹ As Adjusted is a non-GAAP measure, which is comprised by excluding impact of purchase accounting in 2018 and including historical results of Kemper and Infinity in periods prior to acquisition date of July 2, 2018. 32 Specialty Personal Automobile Insurance 31-Dec-20 30-Sep-20 30-Jun-20 31-Mar-20 31-Dec-19 Earned Premiums Kemper Specialty Auto - GAAP As Reported 796.1$ 792.2$ 689.8$ 753.2$ 733.1$ Current Year Non-CAT Losses and LAE Kemper Specialty Auto - GAAP As Reported 569.1$ 543.4$ 472.4$ 576.0$ 557.5$ Less: Impact of Purchase Accounting Amortization of Fair Value Adjustment to Infinity's Unpaid Loss and LAE 0.3 0.2 0.6 0.6 0.6 As Adjusted 1 568.8$ 543.2$ 471.8$ 575.4$ 556.9$ Insurance Expenses Kemper Specialty Auto - GAAP As Reported 162.8$ 145.6$ 146.7$ 139.2$ 138.1$ Less: Impact of Purchase Accounting 3.3 3.2 3.5 4.5 4.5 As Adjusted 1 159.5$ 142.4$ 143.2$ 134.7$ 133.6$ As Adjusted 1 Underlying Combined Ratio As Adjusted 1 Underlying Loss & LAE Ratio 71.4% 68.6% 68.4% 76.4% 76.0% As Adjusted 1 Expense Ratio 20.0% 18.0% 20.8% 17.9% 18.2% As Adjusted 1 Underlying Combined Ratio 91.5% 86.5% 89.2% 94.3% 94.2% Three Months Ended


