UNITED STATES
SECURITIES AND EXCHANGE COMMISSION
Washington, D.C. 20549
FORM 10-K
x ANNUAL REPORT PURSUANT TO SECTION 13 OR 15(d) OF THE SECURITIES EXCHANGE ACT OF 1934
For the fiscal year ended December 31, 2006
OR
o TRANSITION REPORT PURSUANT TO SECTION 13 OR 15(d) OF THE SECURITIES EXCHANGE ACT OF 1934
For the transition period from _____ to _____
Commission file number 1-12911
Granite Construction Incorporated
(Exact name of registrant as specified in its charter)
Delaware | 77-0239383 |
(State or other jurisdiction of incorporation or organization) | (I.R.S. Employer Identification Number) |
| | |
585 West Beach Street | |
Watsonville, California | 95076 |
(Address of principal executive offices) | (Zip Code) |
Registrant’s telephone number, including area code: (831) 724-1011
Securities registered pursuant to Section 12(b) of the Act:
Title of each class | Name of each exchange on which registered |
| Common Stock, $0.01 par value | New York Stock Exchange |
Securities registered pursuant to Section 12(g) of the Act: None
Indicate by check mark if the registrant is a well-known seasoned issuer, as defined in Rule 405 of the Securities Act. Yes x No o
Indicate by check mark if the registrant is not required to file reports pursuant to Section 13 or Section 15(d) of the Act. Yes o No x
Indicate by check mark whether the registrant (1) has filed all reports required to be filed by Section 13 or 15(d) of the Securities Exchange Act of 1934 during the preceding 12 months (or for such shorter period that the registrant was required to file such reports), and (2) has been subject to such filing requirements for the past 90 days. Yes x No o
Indicate by check mark if disclosure of delinquent filers pursuant to Item 405 of Regulation S-K is not contained herein, and will not be contained, to the best of registrant’s knowledge, in definitive proxy or information statements incorporated by reference in Part III of this Form 10-K or any amendment to this Form 10-K. o
Indicate by check mark whether the registrant is a large accelerated filer, an accelerated filer, or a non-accelerated filer (as defined by Rule 12b-2 of the Exchange Act).
Large accelerated filer x Accelerated filer o Non-accelerated filer o
Indicate by check mark whether the registrant is a shell company (as defined in Rule 12b-2 of the Exchange Act). Yes o No x
The aggregate market value of voting and non-voting common equity held by non-affiliates of the registrant was approximately $1.6 billion as of June 30, 2006, based upon the average of the bid and asked prices per share of the registrant’s Common Stock as reported on the New York Stock Exchange on such date. Shares of Common Stock held by each executive officer and director and by each person who owns 5% or more of the outstanding Common Stock have been excluded in that such persons may be deemed to be affiliates. This determination of affiliate status is not necessarily a conclusive determination for other purposes.
At February 12, 2007, 41,825,917 shares of Common Stock, par value $0.01, of the registrant were outstanding.
DOCUMENTS INCORPORATED BY REFERENCE
Certain information called for by Part III is incorporated by reference to the definitive Proxy Statement for the Annual Meeting of Shareholders of Granite Construction Incorporated to be held on May 21, 2007, which will be filed with the Securities and Exchange Commission not later than 120 days after December 31, 2006.
FORWARD-LOOKING DISCLOSURE
From time to time, Granite makes certain comments and disclosures in reports and statements, including in this Annual Report on Form 10-K (“Report”), or statements made by its officers or directors that are not based on historical facts and which may be forward-looking in nature. Under the Private Securities Litigation Reform Act of 1995, a “safe harbor” may be provided to us for certain of these forward-looking statements. We wish to caution readers that forward-looking statements are subject to risks regarding future events and the future results of Granite that are based on current expectations, estimates, forecasts, and projections as well as the beliefs and assumptions of Granite’s management. Words such as “outlook,” “believes,” “expects,” “appears,” “may,” “will,” “should,” “anticipates” or the negative thereof or comparable terminology, are intended to identify such forward-looking statements. In addition, other written or oral statements which constitute forward-looking statements have been made and may in the future be made by or on behalf of Granite. These forward-looking statements are estimates reflecting the best judgment of senior management that rely on a number of assumptions concerning future events, many of which are outside of our control, and involve a number of risks and uncertainties that could cause actual results to differ materially from those suggested by the forward-looking statements. Factors that might cause or contribute to such differences include, but are not limited to, those more specifically described in this Report under “Item 1A. Risk Factors.” Granite undertakes no obligation to publicly revise or update any forward-looking statements for any reason. As a result, the reader is cautioned not to rely on these forward-looking statements, which speak only as of the date of this Annual Report on Form 10-K.
Introduction
We were originally incorporated in 1922 as Granite Construction Company. In 1990, Granite Construction Incorporated was incorporated in Delaware as the holding company for Granite Construction Company and its wholly owned subsidiaries. Unless otherwise indicated, the terms “we,” “us,” “our,” “Company” and “Granite” refer to Granite Construction Incorporated and its consolidated subsidiaries.
We are one of the largest heavy civil construction contractors in the United States. We operate nationwide, serving both public and private sector clients. Within the public sector, we primarily concentrate on infrastructure projects, including the construction of roads, highways, bridges, dams, tunnels, canals, mass transit facilities and airport infrastructure. Within the private sector, we perform site preparation and infrastructure services for residential development, commercial and industrial buildings, plants and other facilities. Our diversification in both the public and private sectors and our mix of project types and sizes have contributed to our profitability in various economic environments.
We own and lease substantial aggregate reserves and own a number of construction materials processing plants. We also have one of the largest contractor-owned heavy construction equipment fleets in the United States. We believe that the ownership of these assets enables us to compete more effectively by ensuring availability of these resources at a favorable cost.
Operating Structure
We are currently organized into two operating segments, the Branch Division and the Heavy Construction Division (“HCD”). The Branch Division is comprised of branch offices that serve local markets, while HCD is composed of regional offices and pursues major infrastructure projects throughout the nation. HCD focuses on building larger heavy civil projects with contract durations that are generally greater than two years, while Branch Division projects are typically smaller in size and shorter in duration.
As decentralized profit centers, the branches and HCD regional offices independently estimate, bid and complete contracts. Both divisions are supported by centralized functions, including finance, accounting, tax, human resources, labor relations, safety, legal, risk management, corporate development and information technology. We believe that centralized support for decentralized profit centers results in a more market-responsive business with effective controls and reduced overhead.
On February 14, 2007 we announced an organizational realignment of our business operations which is designed to accommodate growth of our vertically integrated Branch business in the West and improve profitability of our large, complex HCD projects. This realignment will involve realigning our operating divisions geographically into “Granite West” and “Granite East” and is expected to take approximately twelve months to complete.
Granite West will include the operations of our current Branch Division as well as the western portion of our large project business that is currently included in HCD. Granite West will retain our successful decentralized operating structure, with each of its branch locations aligning under one of three operating groups: Northwest, Northern California and Southwest. Each of these newly formed operating groups will report to a Granite West Group Vice President who will oversee three to six branches and will have the responsibility to stimulate strategic thinking and growth in their geographic territory. Among other key benefits, this structure will allow Granite West to utilize its resources and market knowledge to take advantage of the larger projects we expect to be let as a result of healthy funding in the West as well as the recently passed infrastructure funding propositions in California.
Granite East will include the eastern portion of our large project business that is currently included in HCD and will be aligned to focus on enhancing project management oversight and discipline from estimating through execution. Granite East will leverage its resources and core capabilities in areas where it has local knowledge, local relationships and local resources. It will be operated out of three regional offices: the Central Region, based in Dallas, Texas; the Southeast Region, based in Tampa, Florida; and the Northeast Region, based in Tarrytown, New York.
In addition to our two current operating segments, we purchase, develop and sell real estate through our Granite Land Company subsidiary (“GLC”) which also provides real estate services for other Granite operations. GLC’s portfolio of projects includes both commercial and residential development and is geographically diversified throughout the West and Texas. The amount invested by GLC in each project is typically less than $5.0 million and the revenues and operating income of Granite Land Company are not included in either the Branch Division or HCD operating segments.
Information about our business segments is incorporated in Note 16 of the “Notes to the Consolidated Financial Statements.”
Branch Division. In 2006, Branch Division contract revenue and sales of aggregate products was $1.8 billion (62.3% of our total revenue), compared with $1.6 billion (60.3% of our total revenue) in 2005. The Branch Division has both public and private sector clients. Public sector projects include both new construction and improvement of streets, roads, highways and bridges. Major private sector contracts include site preparation for housing and commercial development, including excavation, grading and street paving and installation of curbs, gutters, sidewalks and underground utilities.
The Branch Division currently has 12 branch offices in the western United States with additional satellite operations. Our eight branch offices in California are located in Bakersfield, Fresno (Central Valley), Indio (Southern California), Sacramento (Northern California), Santa Clara (Bay Area), Santa Barbara, Stockton and Watsonville (Monterey Bay Area). Our branch offices outside of California are located in Arizona, Nevada, Utah, and our majority-owned subsidiary Wilder Construction Company (“Wilder”), which has locations in Alaska, Oregon and Washington. Each branch effectively operates as a local or regional construction company and our branch management is encouraged to participate actively in the local community. While individual branch revenues vary from year to year, in 2006 these revenues ranged from $73.3 million to $248.1 million.
As part of our strategy, our branches mine aggregates and operate plants that process aggregates into construction materials for internal use and for sale to others. These activities are integrated into the Branch Division construction business providing both a source of profits and a competitive advantage to our construction business through the readily available supply of materials. We have significant aggregate reserves that we have acquired by ownership in fee or through long-term leases. The amount of aggregate products produced that are used in our construction projects was approximately 42.0% during 2006 and has ranged from 37.0% to 48.0% over the last five years. The remainder is sold to unaffiliated parties and accounted for the following:
| | | | | | | | |
Years Ended December 31, | | 2006 | | 2005 | | 2004 | |
| (in thousands) | | | |
| Material sales to unaffiliated parties | | $ | 410,159 | | $ | | | $ | | |
| Percent of total revenue | | | 13.8 | % | | | % | | | % |
| Percent of Branch Division revenue | | | 22.2 | % | | | % | | | % |
Heavy Construction Division. In 2006, revenue from HCD was $1.1 billion (36.6% of our total revenue), compared with $1.0 billion (39.0% of our total revenue) in 2005. Like the Branch Division, HCD builds infrastructure projects for both public and private sector clients. Its projects have included major highways, large dams, mass transit facilities, bridges, pipelines, canals, tunnels, waterway locks and dams, and airport infrastructure. It also performs activities such as demolition, clearing, large-scale earthwork and grading, dewatering, drainage improvements, structural concrete, rail signalization, and concrete and asphalt paving. HCD projects are usually larger and more complex than those performed by the Branch Division. HCD is working on or has completed projects in 25 states from coast to coast.
HCD currently markets, estimates, bids and provides management oversight of its projects from our Watsonville, California headquarters and its five regional estimating offices in Davis, California; Tampa, Florida; Bloomington, Minnesota; Tarrytown, New York and Lewisville, Texas. HCD has the ability, if needed, to process locally sourced aggregates into construction materials using owned or rented portable crushing, concrete and asphalt processing plants.
HCD participates in joint ventures with other large construction companies. Joint ventures are used for large, technically complex projects, including design/build projects, where it is desirable to share risk and resources. Joint venture partners typically provide independently prepared estimates, shared financing and equipment and often also bring local knowledge and expertise (see “Joint Ventures; Off-Balance-Sheet Arrangements” under “Item 7. Management’s Discussion and Analysis of Financial Condition and Results of Operation”).
Design/build is increasingly being used as a method of project delivery. Unlike traditional projects where owners first hire a design firm or design a project themselves and then put the project out to bid for construction, design/build projects provide the owner with a single point of responsibility and a single contact for both design and construction. HCD’s revenue from design/build projects has grown over the last several years and represented 65.3% of HCD revenue (25.1% of total company revenue) in 2006 and 49.1% of HCD revenue (20.3% of total company revenue) in 2005. Although these projects carry additional risk as compared to traditional bid/build projects, the profit potential can also be higher. We frequently bid design/build projects as a part of a joint venture team.
Business Strategy
Our fundamental objective is to increase long-term shareholder value by focusing on consistent profitability from controlled revenue growth. Shareholder value is measured by the appreciation of the value of our common stock over a period of years as well as a return from dividends. Further, it is a specific measure of our financial success to achieve a return on net assets greater than the cost of capital, creating “Granite Value Added.” We believe that the following are key factors in our ability to achieve this objective:
Employee Development - We believe that our employees are key to the successful implementation of our business strategies. Significant resources are employed to attract, nurture and retain extraordinary talent and fully develop each employee’s capabilities.
Infrastructure Construction Focus - We concentrate our core competencies on this segment of the construction industry, which includes the building of roads, highways, bridges, dams and tunnels, mass transit facilities, railroad infrastructure and underground utilities as well as site preparation. This focus allows us to most effectively utilize our specialized strengths, which include grading, paving and concrete structures.
Ownership of Aggregate Materials and Construction Equipment - We own and lease aggregate reserves and own processing plants that are vertically integrated into our construction operations and we own a large fleet of carefully maintained heavy construction equipment. By ensuring availability of these resources at favorable cost, we believe we have bidding advantages in many of our markets, as well as a reliable source of revenue and income from the sale of construction materials to unaffiliated parties.
Selective Bidding - We focus our resources to bid on jobs that meet our selective bidding criteria, which include analyzing the risk of a potential job in relation to available personnel to estimate and prepare the proposal, degree of competition, experience with the type of work, relationship with the owner, local resources and partnerships, equipment resources, and size and complexity of the job.
Diversification - To mitigate the risks inherent in construction and general economic factors, we pursue projects: (i) in both the public and private sectors; (ii) for a wide range of customers within each sector (from the federal government to small municipalities and from large corporations to individual homeowners); (iii) in diverse geographic markets; (iv) that are design/build, lump sum and fixed unit price; and (v) of various sizes, durations and complexities.
Decentralized Profit Centers - We approach each selected market with a local focus through our decentralized structure. Each of our branches and HCD regional offices are individual profit centers.
Profit-based Incentives - We compensate our profit center managers with base salaries below the median point of salaries for similar positions in the marketplace coupled with a substantial variable cash and restricted stock incentive element based on the annual profit performance of their respective profit centers.
Controlled Expansion - We intend to continue our expansion by selectively adding branches or branch satellite locations in the western United States, exploring opportunities to establish branch-like businesses in other areas of the country through acquisitions, and selectively pursuing major infrastructure projects throughout the nation where we have an established presence. Additionally, we intend to leverage our financial capacity by investing in a limited number of real estate development projects that we believe will provide an acceptable return on our investment.
Accident Prevention - We believe that the prevention of accidents is both a moral obligation and good business. By identifying and concentrating resources to address jobsite hazards, we continually strive to reduce our incident rates and the costs associated with accidents.
Environmental Responsibility - We believe it benefits everyone to maintain environmentally responsible operations. We are committed to effective measures to protect the environment and maintain good community relations. We continually monitor our performance in this area and take our responsibilities to the communities we work in and compliance with government agency requirements seriously.
Quality and High Ethical Standards - We emphasize the importance of performing high quality work and maintaining high ethical standards through an established code of conduct and an effective corporate compliance program.
Customers
We have customers in both the public and private sectors. The Branch Division’s largest volume customer is the California Department of Transportation (“Caltrans”). In 2006, contracts with Caltrans represented 8.3% of our revenue, and total public sector revenue generated in California represented 24.5% of our revenue. Other Branch Division customers include departments of transportation of other states, county and city public works departments, school districts and developers and owners of industrial, commercial and residential sites. HCD’s customers are predominantly in the public sector and currently include the state departments of transportation in a number of states as well as local transit authorities and federal agencies (see “Concentrations” in Note 1 of the “Notes to the Consolidated Financial Statements”).
Backlog
Our backlog includes the total value of awarded contracts that have not been completed, including our proportionate share of unconsolidated joint venture contracts. Our backlog was approximately $2.3 billion at both December 31, 2006 and 2005. Approximately $1.6 billion of the December 31, 2006 backlog is expected to be completed during 2007. With the exception of certain federal government contracts, we include a construction project in our backlog at such time as a contract is awarded and funding is in place. Certain federal government contracts that extend beyond one year are funded on a year-by-year basis. Backlog at December 31, 2006 includes approximately $21.0 million from one federal government project for which the funding has not yet been fully allocated. Substantially all of the contracts in our backlog may be canceled or modified at the election of the customer; however, we have not been materially adversely affected by contract cancellations or modifications in the past (see “Contract Provisions and Subcontracting”). A sizeable percentage of our anticipated contract revenue in any year is not reflected in our backlog at the start of the year due to the short duration of smaller Branch Division projects that are initiated and completed during each year (“turn business”). Backlog by segment is presented in “Backlog” under “Item 7. Management’s Discussion and Analysis of Financial Condition and Results of Operation.”
Equipment and Plants
We own many pieces of equipment, including cranes, bulldozers, barges, backhoes, excavators, scrapers, motor graders, loaders, trucks, pavers and rollers as well as construction materials processing plants. In 2006 and 2005, we spent approximately $91.0 million and $90.6 million, respectively, for construction equipment, plants and vehicles. At December 31, 2006 and 2005, we owned the following construction equipment, plants and vehicles:
| | | | | | | | | |
| December 31, | | | 2006 | | | 2005 | | |
| Heavy construction equipment (units) | | | 2,641 | | | 2,467 | | |
| Trucks, truck-tractors and trailers and vehicles (units) | | | 5,338 | | | 4,958 | | |
| Aggregate crushing plants | | | 55 | | | 50 | | |
| Asphalt concrete plants | | | 53 | | | 56 | | |
| Portland cement concrete batch plants | | | 25 | | | | | |
| Asphalt rubber plants | | | 4 | | | | | |
| Lime slurry plants | | | 9 | | | | | |
We believe that ownership of equipment is generally preferable to leasing because ownership ensures the equipment is available as needed and normally results in lower equipment costs. We attempt to keep our equipment as fully utilized as possible by pooling equipment for use by both the Branch Division and HCD. We regularly lease or rent equipment on a short-term basis to supplement existing equipment and respond to construction activity peaks.
Employees
On December 31, 2006, we employed approximately 2,100 salaried employees, who work in management, estimating and clerical capacities, and 3,100 hourly employees. The total number of hourly personnel employed by us is subject to the volume of construction in progress. During 2006, the number of hourly employees ranged from 3,100 to 7,200 and averaged approximately 5,400. Our wholly owned subsidiaries, Granite Construction Company and Granite Construction Northeast, Inc. (formerly Granite Halmar Construction Company, Inc.) and our majority-owned subsidiary, Wilder Construction Company are parties to craft collective bargaining agreements in many areas in which they work.
We believe our employees are our most valuable resource and that our workforce possesses a strong dedication to and pride in our company. Among salaried and non-union hourly employees, this dedication is reinforced by 17.6% equity ownership through our Employee Stock Ownership Plan, our Profit Sharing and 401k Plan and performance-based incentive compensation arrangements at December 31, 2006. Our managerial and supervisory personnel have an average of approximately 10 years of service with us.
Competition
Factors influencing our competitiveness include price, reputation for quality, the availability of aggregate materials, machinery and equipment, financial strength, knowledge of local markets and conditions, and project management and estimating abilities. Although some of our competitors are larger than us and may possess greater resources, we believe that we compete favorably on the basis of the foregoing factors. Historically, the construction business has not usually required large amounts of capital, particularly for the smaller size construction work pursued by our Branch Division, which can result in relative ease of market entry for companies possessing acceptable qualifications. Branch Division competitors range from small local construction companies to large regional and national construction companies. While the market areas of these competitors overlap with several of the markets served by our branches, few compete in all of our market areas. In addition, most of our branches own and/or have long-term leases on aggregate resources that provide an extra measure of competitive advantage in certain markets. HCD normally competes with large regional and national construction companies, which may or may not be larger than Granite. Although the construction business is highly competitive, we believe we are well positioned to compete effectively in the markets in which we operate.
Contract Provisions and Subcontracting
Our contracts with our customers are primarily either “fixed unit price” or “fixed price.” Under fixed unit price contracts, we are committed to provide materials or services required by a project at fixed unit prices (for example, dollars per cubic yard of concrete poured or cubic yard of earth excavated). While the fixed unit price contract shifts the risk of estimating the quantity of units required for a particular project to the customer, any increase in our unit cost over the expected unit cost in the bid, whether due to inflation, inefficiency, faulty estimates or other factors, is borne by us unless otherwise provided in the contract. Fixed price contracts are priced on a lump-sum basis under which we bear the risk of performing all the work for the specified amount. The percentage of fixed price contracts in our backlog increased from approximately 63.0% at December 31, 2005 to approximately 67.7% at December 31, 2006. Our contracts are generally obtained through competitive bidding in response to advertisements by federal, state and local government agencies and private parties. Less frequently, contracts may be obtained through direct negotiations with private owners. Our contract risk mitigation process includes identifying risks and opportunities during the bidding process, review of bids fitting certain criteria by various levels of management and, in some cases, by the executive committee of our Board of Directors.
There are a number of factors that can create variability in contract performance and results as compared to a project’s original bid. The most significant of these include the completeness and accuracy of the original bid, costs associated with added scope changes, extended overhead due to owner and weather delays, subcontractor performance issues, changes in productivity expectations, site conditions that differ from those assumed in the original bid (to the extent contract remedies are unavailable), the availability and skill level of workers in the geographic location of the project and a change in the availability and proximity of equipment and materials. All of these factors can impose inefficiencies on contract performance, which can drive up costs and lower profits. Conversely, if any of these or other factors are more positive than the assumptions in our bid, project profitability can improve. The ability to realize improvements on project profitability is more limited than the risk of lower profitability. Design/build projects carry other risks such as the risk inherent in estimating quantities and prices before the project design is completed and design error risk, including additional construction costs due to any design errors, liability to the contract owner for the design of the project and right-of-way and permit acquisition costs. Although we manage this additional risk by adding contingencies to our bid amounts, obtaining errors and omissions insurance and obtaining indemnifications from our design consultants where possible, there is no guarantee that these risk management strategies will always be successful.
All state and federal government contracts and most of our other contracts provide for termination of the contract for the convenience of the contract owner, with provisions to pay us for work performed through the date of termination. We have not been materially adversely affected by these provisions in the past. Many of our contracts contain provisions that require us to pay liquidated damages if specified completion schedule requirements are not met and these amounts can be significant.
We act as prime contractor on most of the construction projects we undertake. We accomplish the majority of our projects with our own resources and subcontract specialized activities such as electrical and mechanical work. As prime contractor, we are responsible for the performance of the entire contract, including subcontract work. Thus, we may be subject to increased costs associated with the failure of one or more subcontractors to perform as anticipated. We manage this risk by reviewing the size of the subcontract, the financial stability of the subcontractor and other factors and, based on this review, determine whether to require that the subcontractor furnish a bond or other type of security that guarantees their performance. Disadvantaged business enterprise regulations require us to use our best efforts to subcontract a specified portion of contract work done for governmental agencies to certain types of disadvantaged subcontractors. As with all of our subcontractors, some may not be able to obtain surety bonds or other types of performance security.
Insurance and Bonding
We maintain general and excess liability, construction equipment and workers’ compensation insurance; all in amounts consistent with industry practices.
In connection with our business, we generally are required to provide various types of surety bonds that provide an additional measure of security for our performance under certain public and private sector contracts. Our ability to obtain surety bonds depends upon our capitalization, working capital, past performance, management expertise and external factors, including the capacity of the overall surety market. Surety companies consider such factors in light of the amount of our backlog that we have currently bonded and their current underwriting standards, which may change from time to time. The capacity of the surety market is subject to market-driven fluctuations driven primarily by the level of surety industry losses and the degree of surety market consolidation. When the surety market capacity shrinks it results in higher premiums and increased difficulty obtaining bonding, in particular for larger, more complex projects throughout the market. In order to help mitigate this risk, we employ a co-surety structure involving three sureties. Our majority owned subsidiary, Wilder Construction Company, continues to work with a single surety and obtains surety bonds on a stand alone basis. Although we do not believe that fluctuations in surety market capacity has significantly impacted our ability to grow our business, there is no assurance that it will not significantly impact our ability to obtain new contracts in the future (see “Item 1A. Risk Factors”).
Government and Environmental Regulations
Our operations are subject to compliance with regulatory requirements of federal, state and local government agencies and authorities, including regulations concerning workplace safety, labor relations and disadvantaged businesses. Additionally, all of our operations are subject to various federal, state and local laws and regulations relating to the environment, including those relating to discharges to air, water and land, the handling and disposal of solid and hazardous waste, the handling of underground storage tanks and the cleanup of properties affected by hazardous substances. Certain environmental laws impose substantial penalties for non-compliance and others, such as the federal Comprehensive Environmental Response, Compensation and Liability Act, impose strict, retroactive, joint and several liability upon persons responsible for releases of hazardous substances. We continually evaluate whether we must take additional steps at our locations to ensure compliance with environmental laws. While compliance with applicable regulatory requirements has not materially adversely affected our operations in the past, there can be no assurance that these requirements will not change and that compliance will not adversely affect our operations in the future. In addition, our aggregate materials operations require operating permits granted by governmental agencies. We believe that tighter regulations for the protection of the environment and other factors will make it increasingly difficult to obtain new permits and renewal of existing permits may be subject to more restrictive conditions than currently exist.
The California Air Resources Board has proposed regulations that will require equipment owners to reduce diesel particulate emissions from in-use off-road diesel equipment to meet emission targets proposed for each year from 2009 to 2020. A regulation is anticipated to be approved in 2007. The emission targets that are currently proposed will require California off-road diesel equipment owners to retrofit equipment with diesel particulate filters or replace equipment with new engine technology as it becomes available. This regulation is still in the rule-making process and changes to the regulation may be made prior to its final approval.
As is the case with other companies in the same industry, some of our aggregate products contain varying amounts of crystalline silica, a common mineral. Also, some of our construction and material processing operations release as dust crystalline silica that is in the materials being handled. Excessive, prolonged inhalation of very small-sized particles of crystalline silica has allegedly been associated with respiratory disease (including silicosis). The Mine Safety and Health Administration and the Occupational Safety and Health Administration have established occupational thresholds for crystalline silica exposure as respirable dust. We monitor to verify that our dust control procedures are keeping occupational exposures at or below the requisite thresholds and to verify that respiratory protective equipment is made available when required. We also communicate, through safety information sheets and other means, what we believe to be appropriate warnings and cautions to employees and customers about the risks associated with excessive, prolonged inhalation of mineral dust in general and crystalline silica in particular.
Website Access
Our website address is www.graniteconstruction.com. On our website we make available, free of charge, our annual report on Form 10-K, quarterly reports on Form 10-Q, current reports on Form 8-K, and all amendments to those reports as soon as reasonably practicable after such material is electronically filed with or furnished to the Securities and Exchange Commission (“SEC”). The information on our website is not incorporated into, and is not part of, this report. These reports, and any amendments to them, are also available at the website of the SEC, www.sec.gov.
Set forth below and elsewhere in this Report and in other documents we file with the SEC are various risks and uncertainties that could cause our actual results to differ materially from the results contemplated by the forward-looking statements contained in the Report or otherwise adversely affect our business.
| · | Our success depends on attracting and retaining qualified personnel in a competitive environment. The single largest factor in our ability to profitably execute our work is our ability to attract, develop and retain qualified personnel. Our success in attracting qualified people is dependent on the resources available in individual geographic areas and the impact on the labor supply due to general economic conditions as well as our ability to provide a competitive compensation package and work environment. |
| · | Economic downturns and reductions in government funding could have a negative impact on our business. Significant portions of our revenues are derived from contracts that are funded by federal, state and local government agencies. Our ability to obtain future public sector work at reasonable margins is highly dependent on the amount of work that is available to bid, which is largely a function of the level of government funding available. We also perform commercial and residential site development and other work for customers in the private sector. The availability of this private sector work can be significantly adversely affected by general economic downturns. |
| · | Our fixed price and fixed unit price contracts subject us to the risk of increased project cost. As more fully described under “Contract Provisions and Subcontracting” above, the profitability of our fixed price and fixed unit price contracts can be adversely affected by a number of factors that can cause our actual costs to materially exceed the costs estimated at the time of our original bid. |
| · | Accounting for our revenues and costs involves significant estimates. As further described in “Critical Accounting Estimates” under “Item 7. Management’s Discussion and Analysis of Financial Condition and Results of Operation,” accounting for our contract related revenues and costs, as well as other cost items, requires management to make a variety of significant estimates and assumptions. Although we believe we have sufficient experience and processes to enable us to formulate appropriate assumptions and produce reasonably dependable estimates, these assumptions and estimates may change significantly in the future, and these changes could result in the reversal of previously recognized revenue and profit and have a material adverse effect on our financial position and the results of our operations. |
| · | Many of our contracts have penalties for late completion. In some instances, including many of our fixed price contracts, we guarantee that we will complete a project by a scheduled date. If we subsequently fail to complete the project as scheduled we may be held responsible for cost impacts resulting from any delay, generally in the form of contractually agreed-upon liquidated damages. To the extent that these events occur, the total costs of the project could exceed our original estimates and we could experience reduced profits or, in some cases, a loss for that project. |
| · | Weather can significantly impact our quarterly revenues and profitability. Our ability to perform work is significantly impacted by weather conditions such as precipitation and temperature. Changes in weather conditions can create significant variability in our quarterly revenues and profitability, particularly in the first and fourth quarters of the year. Additionally, delays and other weather impacts may increase a project’s cost and decrease its profitability. |
| · | We work in a highly competitive marketplace. As more fully described under “Competition” above, we have multiple competitors in all of the areas in which we work. During economic down cycles or times of lower government funding for public works projects, competition for the fewer available projects intensifies and this increased competition may result in a decrease in our ability to be competitive at acceptable margins. |
| · | An inability to secure and permit aggregate reserves could negatively impact our future operations and results. Tighter regulations for the protection of the environment and the finite nature of property containing suitable aggregate reserves are making it increasingly challenging and costly to secure and permit aggregate reserves. Although we have thus far been able to secure and permit reserves to support our business, it is likely to become increasingly difficult to do so and there is no assurance that we will be able to secure and permit reserves in the future. |
| · | We are subject to environmental and other regulation. As more fully described under “Government and Environmental Regulations” above, we are subject to a number of federal, state and local laws and regulations relating to the environment, workplace safety and a variety of socioeconomic requirements, the noncompliance of which can result in substantial penalties, termination or suspension of government contracts as well as civil and criminal liability. While compliance with these laws and regulations has not materially adversely affected our operations in the past, there can be no assurance that these requirements will not change and that compliance will not adversely affect our operations in the future. |
| · | Strikes or work stoppages could have a negative impact on our operations and results. We are party to collective bargaining agreements covering a portion of our craft workforce. Although our results and operations have not been significantly impacted by strikes or work stoppages in the past, such labor actions could have a significant impact on our operations if they occur in the future. |
| · | Unavailability of insurance coverage could have a negative impact on our operations and results. We maintain insurance coverage as part of our overall risk management strategy and pursuant to requirements to maintain specific coverage that are contained in our financing agreements and in most of our construction contracts. Although we have been able to obtain insurance coverage to meet our requirements in the past, there is no assurance that such insurance coverage will be available in the future. |
| · | An inability to obtain bonding would have a negative impact on our operations and results. As more fully described in “Insurance and Bonding” above, we generally are required to provide surety bonds securing our performance under the majority of our public and private sector contracts. Our inability to obtain surety bonds in the future would significantly impact our ability to obtain new contracts, which would have a material adverse effect on our business. |
| · | Our joint venture contracts with project owners subject us to joint and several liability. If a joint venture partner fails to perform we could be liable for completion of the entire contract and, if the contract were unprofitable, this could result in a material adverse effect on our financial position, results of operations and cash flows. |
| · | We use certain commodity products that are subject to significant price fluctuations. Diesel fuel, liquid asphalt and other petroleum-based products are used to fuel and lubricate our equipment and fire our asphalt concrete processing plants and also constitute a significant part of the asphalt paving materials that are used in many of our construction projects and sold to outside parties. Although we are partially protected by asphalt or fuel price escalation clauses in some of our contracts, many contracts provide no such protection. We also use cement, steel and other commodities in our construction projects that can be subject to significant price fluctuations. We have not been significantly adversely affected by price fluctuations in the past; however, there is no guarantee that we will not be in the future. |
| · | As a part of our growth strategy we expect to make future acquisitions and acquisitions involve many risks. These risks include difficulties integrating the operations and personnel of the acquired companies, diversion of management’s attention from our ongoing operations, potential difficulties and increased costs associated with completion of any assumed construction projects, insufficient revenues to offset increased expenses associated with acquisitions and the potential loss of key employees or customers of the acquired companies. Acquisitions may also cause us to increase our liabilities, record goodwill or other non-amortizable intangible assets that will be subject to subsequent impairment testing and potential impairment charges and incur amortization expenses related to certain other intangible assets. Failure to manage and successfully integrate acquisitions could harm our business and operating results significantly. |
| | |
| · | Our goodwill may be impaired and result in a charge to income. We have accounted for our past acquisitions using the “purchase” method of accounting. Under the purchase method, we recorded, at fair value, assets acquired and liabilities assumed, and we recorded as goodwill the difference between the cost of acquisitions and the sum of the fair value of tangible and identifiable intangible assets acquired, less liabilities assumed. At December 31, 2006, our goodwill balance was $9.9 million. In accordance with Statement of Financial Accounting Standards No. 142, “Goodwill and Other Intangible Assets,” our recorded goodwill is not amortized but instead is subject to an impairment review on at least an annual basis. In the future, if our goodwill is determined to be impaired, the impairment would result in a charge to income from operations in the year of the impairment with a resulting decrease in our recorded net worth. |
| · | Failure of our subcontractors to perform as anticipated could have a negative impact on our results. As further described under “Contract Provisions and Subcontracting” above, we subcontract a portion of many of our contracts to specialty subcontractors and we are ultimately responsible for the successful completion of their work. Although we seek to require bonding or other forms of guarantees, we are not always successful in obtaining those bonds or guarantees from our higher risk subcontractors, and there is no guarantee that we will not incur a material loss due to subcontractor performance issues. |
| · | We may be unable to identify qualified Disadvantaged Business Enterprise (“DBE”) contractors to perform as subcontractors. Certain of our government agency projects contain minimum DBE participation clauses. If we subsequently fail to complete these projects with the minimum DBE participation we may be held responsible for damages due to breach of contract including restrictions on our ability to bid on future projects and monetary damages. To the extent that these events occur, the total costs of the project could exceed our original estimates and we could experience reduced profits or, in some cases, a loss for that project. |
| · | A significant portion of our revenue is from government funded contracts. Approximately 68% of our consolidated revenue in 2006 was derived from performing contracts funded by federal, state and local government agencies and authorities. These government contracts are subject to specific procurement regulations, contract provisions and a variety of socioeconomic requirements relating to their formation, administration, performance and accounting. Many of these contracts include express or implied certifications of compliance with applicable laws and contract provisions. As a result of our government contracting, claims for civil or criminal fraud may be brought by the government for violations of these regulations, requirements or statutes. We may also be subject to qui tam litigation brought by private individuals on behalf of the government under the Federal Civil False Claims Act, which could include claims for up to treble damages. Further, if we fail to comply with any of these regulations, requirements or statutes, our existing government contracts could be terminated, we could be suspended from government contracting or subcontracting, including federally funded projects at the state level. If our government contracts are terminated for any reason, or if we are suspended from government work, we could suffer a significant reduction in expected revenue. |
| · | Our long-term debt and credit arrangements contain restrictive covenants and failure to meet these covenants could significantly harm our financial condition. Our long-term debt and credit arrangements and related restrictive covenants are more fully described in Note 10 of the “Notes to the Consolidated Financial Statements” included in this report. In most cases, failure to meet the restrictive covenants would result in an immediate repayment of all amounts due and cancellation of open lines of credit. Additionally, failure to meet restrictive covenants related to our debt and credit agreements would trigger cross-default provisions that would cause us to also be in default of our surety agreements. Although we have not had difficulty meeting these covenants in the past, failure to do so in the future could have material adverse effects on our business and financial condition. |
| |
| · | Our backlog is subject to unexpected adjustments and cancellations and could be an uncertain indicator of our future earnings. We cannot guarantee that the revenues projected in our backlog will be realized or, if realized, will result in profits. Projects may remain in our backlog for an extended period of time. In addition, project cancellations or scope adjustments may occur, from time to time, with respect to contracts reflected in our backlog. Backlog reductions can adversely affect the revenue and profit we actually receive from contracts reflected in our backlog. Future project cancellations and scope adjustments could further reduce the dollar amount of our backlog and the revenues and profits that we actually receive. |
The foregoing list is not exhaustive. There can be no assurance that we have correctly identified and appropriately assessed all factors affecting our business or that the publicly available and other information with respect to these matters is complete and correct. Additional risks and uncertainties not presently known to us or that we currently believe to be immaterial also may adversely impact us. These developments could have material adverse effects on our business, financial condition and results of operations. For these reasons, the reader is cautioned not to place undue reliance on our forward-looking statements.
Not applicable.
The following table provides our estimate of certain information about our properties as of December 31, 2006:
| | | | | |
| | Land Area (acres) | Building Square Feet | Permitted Aggregate Reserves (tons) | Unpermitted Aggregate Reserves (tons) |
| Office and shop space (owned and leased) | 1,400 | 1,050,000 | N/A | N/A |
| Owned quarry property | N/A | N/A | 430.0 million | 125.0 million |
| Leased quarry property | N/A | N/A | 355.0 million | 645.0 million |
| Real estate held for sale | 2,800 | 60,000 | N/A | N/A |
Approximately 80% of the office and shop space is used by the Branch Division at their various locations throughout the western United States and the remainder is primarily used by HCD. The quarry property is located at Branch Division locations throughout the western United States. We consider our available and future aggregate reserves adequate to meet our expected operating needs. We pursue a plan of acquiring new sources of aggregate reserves to replenish those depleted and to support future growth with a goal of maintaining approximately thirty years of aggregate reserves at most of our Branch locations.
Eldredge
A $9.3 million judgment was entered in June 2005 against our wholly owned subsidiary Granite Construction Company (“GCCO”) by the District Court Clark County; Nevada, in an action entitled Eldredge vs. Las Vegas Valley Water District, GCCO, et al. The civil lawsuit was initially brought by a former employee of GCCO against the Las Vegas Water District in June 2000. The plaintiff subsequently filed an amended complaint on June 10, 2003, bringing GCCO into the action and seeking compensation in addition to the worker’s compensation payments the employee previously accepted for injuries sustained when a trench collapsed. The jury issued a verdict finding against GCCO on two causes of action, assault and battery and intentional infliction of emotional distress. The judgment awarded damages for past and future lost wages, medical expenses and pain and suffering. After the verdict was issued, the plaintiff filed a motion seeking monetary sanctions against GCCO in the amount of $26.8 million (a multiple of the jury verdict) based on allegations that GCCO and/or its trial counsel improperly withheld and/or attempted to influence testimony in respect to the case.
Pursuant to the parties written agreement to resolve this dispute, on January 11, 2007 the $9.3 million judgment was dismissed with prejudice making the judgment against GCCO null and void and plaintiff’s motion seeking monetary sanctions against GCCO in the amount of $26.8 million (a multiple of the jury verdict) deemed withdrawn with prejudice.
Silica
GCCO is one of approximately 100 to 300 defendants in ten active California Superior Court lawsuits. Of the ten lawsuits, five were filed against GCCO in 2005 and five were filed against GCCO in 2006, in Alameda County (Riley vs. A-1 Aggregates, et al.; Molina vs. A-1 Aggregates, et al.; Dominguez vs. A-1 Aggregates, et al.; Cleveland vs. A. Teichert & Son.; Guido vs. A. Teichert & Son, Inc.; Williams vs. A. Teichert & Son, Inc.; Horne vs. Teichert & Son, Inc.; Harris vs. A-1 Aggregates, et al.; Kammer vs.A-1 Aggregates, et al.; and Solis vs. The 3M Company et al.). Each lawsuit was brought by a single plaintiff who is seeking money damages by way of various causes of action, including strict product and market share liability, and alleges personal injuries caused by exposure to silica products and related materials during the plaintiffs’ use or association with sand blasting or grinding concrete. The plaintiff in each lawsuit has categorized the defendants as equipment defendants, respirator defendants, premises defendants and sand defendants. We have been identified as a sand defendant, meaning a party that manufactured, supplied or distributed silica-containing products. Our preliminary investigation revealed that we have not knowingly sold or distributed abrasive silica sand for sandblasting, and therefore, we believe the probability of these lawsuits resulting in an incurrence of a material liability is remote. We have been dismissed from fourteen other similar lawsuits. In addition, we have been apprised of three complaints that are based on similar allegations of exposure to silica containing products being filed, but not served, against GCCO and more than 100 other defendants in California Superior Court.
Hiawatha Project DBE Issues
The Hiawatha Light Rail Transit (“HLRT”) project was performed by Minnesota Transit Constructors (“MnTC”), a joint venture that consisted of GCCO, and other unrelated companies. GCCO was the managing partner of the joint venture, with a 56.5% interest. The Minnesota Department of Transportation (“MnDOT”) is the contracting agency for this federally funded project. The MnDOT and the U.S. Department of Transportation Office of Inspector General (“OIG”) each conducted a review of the Disadvantaged Business Enterprise (“DBE”) program maintained by MnTC for the HLRT project. In addition, the U.S. Department of Justice (“USDOJ”), is conducting an investigation into compliance issues with respect to MnTC’s DBE Program for the HLRT project. The MnDOT and the OIG (collectively the “Agencies”) have initially identified certain compliance issues in connection with MnTC’s DBE program, and as a result, have determined that MnTC failed to meet the DBE utilization as represented by MnTC. There has been no formal administrative subpoena issued, nor has a civil complaint been filed in connection with the administrative reviews or the investigation. The MnTC is fully cooperating with all of the agencies involved and will be provided an opportunity to informally present its response to the initial determinations of the Agencies as well as the investigation of the USDOJ.
Other
We are a party to a number of other legal proceedings arising in the normal course of business which, from time to time, includes inquiries from public agencies seeking information concerning our compliance with government construction contracting requirements and related laws and regulations. We believe that the nature and number of these proceedings are typical for a construction firm of our size and scope. Our litigation typically involves claims regarding public liability or contract related issues. While management currently believes, after consultation with counsel, that the ultimate outcome of these proceedings, individually and in the aggregate, will not have a material adverse effect on our financial position or overall trends in results of operations or cash flows, litigation is subject to inherent uncertainties. Were an unfavorable ruling to occur, there exists the possibility of a material adverse impact on the results of operations, cash flows and/or financial position for the period in which the ruling occurs. While any one of our pending legal proceedings is subject to early resolution as a result of our ongoing efforts to settle, whether or when any legal proceeding will resolve through settlement is neither predictable nor guaranteed.
We did not submit any matters to a vote of security holders during the fourth quarter of the year ended December 31, 2006.
Executive Officers of the Registrant
Our executive officers are as follows:
| | | |
Name | Age | Position |
| William G. Dorey | 62 | President, Chief Executive Officer and Director |
| Mark E. Boitano | 58 | Executive Vice President and Chief Operating Officer |
| William E. Barton | 62 | Senior Vice President and Chief Financial Officer |
| Michael F. Donnino | 52 | Senior Vice President and Heavy Construction Division Manager |
| James H. Roberts | 50 | Senior Vice President and Branch Division Manager |
Granite Construction Incorporated was incorporated in Delaware in January 1990 as the holding company for Granite Construction Company, which was incorporated in California in 1922. All dates of service for our executive officers include the periods in which they served for Granite Construction Company.
Mr. Dorey has been an employee of Granite since 1968 and has served in various capacities, including President and Chief Executive Officer since January 2004, President and Chief Operating Officer from February 2003 to December 2003, Executive Vice President and Chief Operating Officer from 1998 to February 2003, Senior Vice President and Manager, Branch Division from 1987 to 1998, and Vice President and Assistant Manager, Branch Division from 1983 to 1987. Mr. Dorey has also served as a member of our Board of Directors since January 2004. Mr. Dorey also served as a director of TIC Holdings, Inc. from 1997 to 2002. He received a B.S. degree in Construction Engineering from Arizona State University in 1967.
Mr. Boitano has been an employee of the Company since 1977 and has served in various capacities, including Chief Operating Officer since January 2004 and Executive Vice President since February 2003. He also served as Branch Division Manager from 1998 to January 2004, and Senior Vice President from 1998 to February 2003. In 2001, he became a director of Wilder Construction Company. Mr. Boitano received a B.S. degree in Civil Engineering from Santa Clara University in 1971 and an M.B.A. degree from California State University, Fresno in 1977.
Mr. Barton has been an employee of the Company since 1980 and has served as Senior Vice President and Chief Financial Officer since 1999 and as Vice President and Chief Financial Officer from 1990 to 1999. In 1997, Mr. Barton became a director of TIC Holdings, Inc., and in January 2000 he also became a director of Wilder Construction Company. He received a B.S. degree in Accounting and Finance from San Jose State University in 1967 and an M.B.A. degree from Santa Clara University in 1973.
Mr. Donnino joined Granite in 1977 and has served as Senior Vice President and Heavy Construction Division Manager since January 2005. He served as Vice President and Heavy Construction Division Assistant Manager during 2004, Texas Regional Manager from 2000 to 2003 and Dallas Estimating Office Area Manager from 1991 to 2000. Mr. Donnino received a B.S.C.E. in Structural, Water and Soils Engineering from the University of Minnesota in 1976.
Mr. Roberts joined Granite in 1981 and has served in various capacities, including Senior Vice President and Branch Division Manager since May 2004, Vice President and Assistant Branch Division Manager from 1999 to 2004, Regional Manager of Nevada and Utah Operations from 1995 to 1999 and became a Director of Wilder Construction Company in 2006. He received a B.S.C.E. in 1979 and an M.S.C.E. in 1980 from the University of California, Berkeley, and an M.B.A. from the University of Southern California in 1981.
Item 5. MARKET FOR REGISTRANT’S COMMON EQUITY, RELATED SHAREHOLDER MATTERS AND ISSUER PURCHASES OF EQUITY SECURITIES
Our common stock trades on the New York Stock Exchange under the ticker symbol GVA. See “Quarterly Results” under “Item 7. Management’s Discussion and Analysis of Financial Condition and Results of Operation” for a two-year summary of quarterly dividends and high and low sales prices of our stock.
We have paid quarterly cash dividends since the second quarter of 1990, and we expect to continue to pay quarterly cash dividends. However, declaration and payment of dividends is within the sole discretion of our Board of Directors, subject to limitations imposed by Delaware law and compliance with our credit agreements, and will depend on our earnings, capital requirements, financial condition and such other factors as the Board of Directors deems relevant.
As of February 12, 2007, there were 41,825,917 shares of our common stock outstanding held by 986 shareholders of record.
During the three months ended December 31, 2006, we did not sell any of our equity securities that were not registered under the Securities Act of 1933, as amended. The following table sets forth information regarding the repurchase of shares of our common stock during the three months ended December 31, 2006:
| | | | | | | | | | |
Period | | Total number of shares purchased1 | | Average price paid per share | | Total number of shares purchased as part of publicly announced plans or programs2 | | Approximate dollar value of shares that may yet be purchased under the plans or programs2 | |
| October 1, 2006 through October 31, 2006 | | | - | | | - | | | - | | $ | 22,787,537 | |
| November 1, 2006 through November 30, 2006 | | | - | | | - | | | - | | $ | 22,787,537 | |
| December 1, 2006 through December 31, 2006 | | | 19,512 | | $ | 51.08 | | | - | | $ | 22,787,537 | |
| | | | 19,512 | | $ | 51.08 | | | - | | | | |
1The total number of shares purchased represents shares purchased in connection with employee tax withholding for shares granted under our Amended and Restated 1999 Equity Incentive Plan.
2On October 16, 2002, we publicly announced that our Board of Directors had authorized us to repurchase up to $25.0 million worth of shares of our common stock at management’s discretion on the open market or in privately negotiated block purchases, exclusive of repurchases related to employee benefit plans.
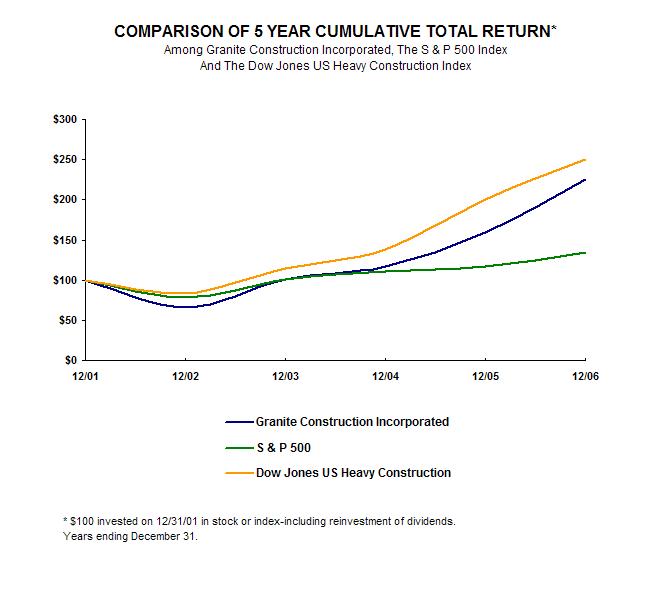
Performance Graph
The following graph compares the cumulative 5-year cumulative total return to shareholders on Granite Construction Incorporated’s common stock relative to the cumulative total returns of the S&P 500 index and the Dow Jones US Heavy Construction index. The Dow Jones US Heavy Construction index includes the following companies: EMCOR Group Inc., Fluor Corp., Granite Construction Inc., Insituform Technologies Inc., Jacobs Engineering Group Inc., McDermott International Inc., Quanta Services Inc. and Shaw Group Inc. An investment of $100 (with reinvestment of all dividends) is assumed to have been made in our common stock and in each of the indexes on December 31, 2001 and its relative performance is tracked through December 31, 2006.
The comparisons in the graph below are based on historical data and are not intended to forecast the possible future performance of our common stock.
| | | | | | | | | | | | | | |
| | | 2001 | | 2002 | | 2003 | | 2004 | | 2005 | | 2006 | |
| Granite Construction Incorporated | | $ | 100 | | $ | 65.43 | | $ | 101.27 | | $ | 116.72 | | $ | 159.63 | | $ | 225.54 | |
| S & P 500 | | | 100 | | | 77.90 | | | 100.24 | | | 111.15 | | | 116.61 | | | 135.03 | |
| Dow Jones US Heavy Construction | | | 100 | | | 83.87 | | | 114.41 | | | 138.74 | | | 200.48 | | | 250.08 | |
The selected consolidated operations data for 2006, 2005 and 2004 and consolidated balance sheet data as of December 31, 2006 and 2005 set forth below have been derived from our audited consolidated financial statements included herein, and are qualified by reference to those consolidated financial statements. The selected consolidated operations data for 2002 and 2003 and the consolidated balance sheet data as of December 31, 2002, 2003 and 2004 have been derived from our audited consolidated financial statements not included herein. These historical results are not necessarily indicative of the results of operations to be expected for any future period.
| | |
Selected Consolidated Financial Data | |
Years Ended December 31, | | 2006 | | 2005 | | 2004* | | 2003 | | 2002 | |
Operating Summary | | (In Thousands, Except Per Share Data) | |
| Revenue | | $ | 2,969,604 | | $ | 2,641,352 | | $ | 2,136,212 | | $ | 1,844,491 | | $ | 1,764,742 | |
| Gross profit | | | 295,720 | | | 319,372 | | | 222,021 | | | 226,450 | | | 224,584 | |
| As a percent of revenue | | | 10.0 | | | 12.1 | | | 10.4 | | | 12.3 | | | 12.7 | |
| General and administrative expenses | | | 204,281 | | | 183,392 | | | 157,035 | | | 151,879 | | | 146,467 | |
| As a percent of revenue | | | 6.9 | | | 6.9 | | | 7.4 | | | 8.2 | | | 8.3 | |
| Provision for (reversal of) legal judgment | | | (4,800 | ) | | 9,300 | | | - | | | - | | | - | |
| Goodwill impairment charge** | | | 18,011 | | | - | | | - | | | - | | | - | |
| Net income | | | 80,509 | | | 83,150 | | | 57,007 | | | 60,504 | | | 49,279 | |
| As a percent of revenue | | | 2.7 | | | 3.1 | | | 2.7 | | | 3.3 | | | 2.8 | |
| Net income per share: | | | | | | | | | | | | | | | | |
| Basic | | $ | 1.97 | | $ | 2.05 | | $ | 1.41 | | $ | 1.51 | | $ | 1.23 | |
| Diluted | | | 1.94 | | | 2.02 | | | 1.39 | | | 1.48 | | | 1.21 | |
| Weighted average shares of common stock: | | | | | | | | | | | | | | | | |
| Basic | | | 40,874 | | | 40,614 | | | 40,390 | | | 40,175 | | | 40,016 | |
| Diluted | | | 41,471 | | | 41,249 | | | 41,031 | | | 40,808 | | | 40,723 | |
Balance Sheet | | | | | | | | | | | | | | | | |
| Total assets | | $ | 1,632,838 | | $ | 1,472,230 | | $ | 1,277,954 | | $ | 1,060,410 | | $ | 983,819 | |
| Cash, cash equivalents and marketable securities | | | 394,878 | | | 301,381 | | | 277,692 | | | 201,985 | | | 182,694 | |
| Working capital | | | 319,762 | | | 367,801 | | | 355,927 | | | 274,947 | | | 220,396 | |
| Current maturities of long-term debt | | | 28,660 | | | 26,888 | | | 15,861 | | | 8,182 | | | 8,640 | |
| Long-term debt | | | 78,576 | | | 124,415 | | | 148,503 | | | 126,708 | | | 132,380 | |
| Other long-term liabilities | | | 58,419 | | | 46,556 | | | 40,641 | | | 29,938 | | | 13,742 | |
| Shareholders’ equity | | | 694,544 | | | 621,560 | | | 550,474 | | | 504,891 | | | 454,869 | |
| Book value per share | | | 16.60 | | | 14.91 | | | 13.23 | | | 12.16 | | | 11.03 | |
| Dividends per share | | | 0.40 | | | 0.40 | | | 0.40 | | | 0.40 | | | 0.32 | |
| Common shares outstanding | | | 41,834 | | | 41,682 | | | 41,612 | | | 41,528 | | | 41,257 | |
| Backlog | | $ | 2,256,587 | | $ | 2,331,540 | | $ | 2,437,994 | | $ | 1,985,788 | | $ | 1,856,451 | |
* Effective January 1, 2004, we adopted Financial Accounting Standards Board Interpretation No. 46 (revised December 2003) “Consolidation of Variable Interest Entities” (see Note 5 of the “Notes to the Consolidated Financial Statements”).
**During the year ended December 31, 2006 we recorded a goodwill impairment charge of approximately $18.0 million related to our Granite Northeast operation in New York (see Note 8 of the “Notes to the Consolidated Financial Statements”).
General
We are one of the largest heavy civil contractors in the United States as well as one of the largest construction materials production companies in the Western United States. We are engaged in the construction of highways, dams, airport infrastructure, mass transit facilities and other infrastructure-related projects. We have offices in Alaska, Arizona, California, Florida, Minnesota, Nevada, New York, Oregon, Texas, Utah and Washington. Our business involves two operating segments: the Branch Division and the Heavy Construction Division.
Our contracts are obtained primarily through competitive bidding in response to advertisements by federal, state and local agencies and private parties and to a lesser extent through negotiation with private parties. Our bidding activity is affected by such factors as backlog, current utilization of equipment and other resources, ability to obtain necessary surety bonds and competitive considerations. Bidding activity, backlog and revenue resulting from the award of new contracts may vary significantly from period to period.
The two primary economic drivers of our business are (1) federal, state and local public funding levels and (2) the overall health of the economy, both nationally and locally. The level of demand for our services will have a direct correlation to these drivers. For example, a weak economy will generally result in a reduced demand for construction in the private sector. This reduced demand increases competition for fewer private sector projects and will ultimately also increase competition in the public sector as companies migrate from bidding on scarce private sector work to projects in the public sector. Greater competition can reduce revenue growth and/or increase pressure on gross profit margins. A weak economy also tends to produce less tax revenue, thereby decreasing the funds available for spending on public infrastructure improvements. There are funding sources that have been specifically earmarked for infrastructure spending, such as gasoline taxes, which are not necessarily directly impacted by a weak economy. However, even these funds can be temporarily at risk as state and local governments struggle to balance their budgets. Conversely, higher public funding and/or a robust economy will increase demand for our services and provide opportunities for revenue growth and margin improvement.
Our general and administrative costs include salaries and related expenses, incentive compensation, discretionary profit sharing and other variable compensation, as well as other overhead costs to support our overall business. In general, these costs will increase in response to the growth and the related increased complexity of our business. These costs may also vary depending on the number of projects in process in a particular area and the corresponding level of estimating activity. For example, as large projects are completed or if the level of work slows down in a particular area, we will often re-assign project employees to estimating and bidding activities until another project gets underway, temporarily moving their salaries and related costs from cost of revenue to general and administrative expense. Additionally, our compensation strategy for selected management personnel is to rely heavily on a variable cash and restricted stock performance-based incentive element. The cash portion of these incentives is expensed when earned while the restricted stock portion is expensed over the vesting period of the stock (generally five years). Depending on the mix of cash and restricted stock, these incentives can have the effect of increasing general and administrative expenses in very profitable years and decreasing expenses in less profitable years.
Current Year Overview
| | | | |
| Comparative Financial Summary | | | | | | | |
Years ended December 31, | | 2006 | | 2005 | | 2004 | |
| (in thousands) | | | |
| Total revenue | | $ | 2,969,604 | | $ | 2,641,352 | | $ | | |
| Gross profit | | | 295,720 | | | | | | | |
| General and administrative expenses | | | 204,281 | | | | | | | |
| Provision for (reversal of) legal judgment | | | (4,800 | ) | | | | | - | |
| Goodwill impairment charge | | | 18,011 | | | - | | | - | |
| Gain on sale of property and equipment | | | 10,408 | | | | | | | |
| Operating income | | | 88,636 | | | | | | | |
| Net income | | | 80,509 | | | | | | | |
Our results of operations for the year ended December 31, 2006 reflect increased operating income from our Branch Division compared with the corresponding period in 2005, which was primarily driven by the strong economy in the West and the ability to work well into the fourth quarter due to mild weather conditions. The Branch Division’s 2006 operating results also include the results of the fourth quarter settlement and partial reversal of a provision related to an unfavorable legal judgment previously recorded in 2005. These improved results were offset by an operating loss in our Heavy Construction Division due primarily to additional costs recorded as a result of changes in the estimates of the cost to complete certain projects and a goodwill impairment charge of approximately $18.0 million related to our Granite Northeast operation in New York. Operating income for the year ended December 31, 2006 includes approximately $17.9 million related to sales of certain real estate development assets by our Granite Land Company subsidiary (approximately $10.2 million net of our minority partners’ share). Additionally, our net income for the year ended December 31, 2006 reflects an increase in non-operating income of approximately $17.0 million due primarily to higher interest income in 2006.
Critical Accounting Estimates
The preparation of financial statements in conformity with accounting principles generally accepted in the United States of America requires management to make estimates and assumptions that affect the reported amounts of assets and liabilities and disclosure of contingent assets and liabilities at the date of the financial statements and the reported amounts of revenues and expenses during the reporting period. Our estimates, judgments and assumptions are continually evaluated based on available information and experience; however, actual amounts could differ from those estimates.
Certain of our accounting policies and estimates require higher degrees of judgment than others in their application. These include the recognition of revenue and earnings from construction contracts, the valuation of long-lived assets and insurance estimates. We evaluate all of our estimates and judgments on an on-going basis.
Revenue Recognition for Construction Contracts: Our contracts with our customers are primarily either “fixed unit price” or “fixed price.” Under fixed unit price contracts, we are committed to provide materials or services required by a project at fixed unit prices (for example, dollars per cubic yard of concrete poured or cubic yards of earth excavated). While the fixed unit price contract shifts the risk of estimating the quantity of units required for a particular project to the customer, any increase in our unit cost over the expected unit cost in the bid, whether due to inflation, inefficiency, faulty estimates or other factors, is borne by us unless otherwise provided in the contract. Fixed price contracts are priced on a lump-sum basis under which we bear the risk that we may not be able to perform all the work profitably for the specified contract amount. The percentage of fixed price contracts in our backlog increased from approximately 63.0% at December 31, 2005 to approximately 67.7% at December 31, 2006. All state and federal government contracts and many of our other contracts provide for termination of the contract for the convenience of the party contracting with us, with provisions to pay us for work performed through the date of termination.
We use the percentage of completion accounting method for construction contracts in accordance with the American Institute of Certified Public Accountants Statement of Position 81-1, “Accounting for Performance of Construction-Type and Certain Production-Type Contracts.” Revenue and earnings on construction contracts, including construction joint ventures, are recognized using the percentage of completion method in the ratio of costs incurred to estimated final costs. Revenue in an amount equal to cost incurred is recognized prior to contracts reaching 25% completion. The related profit is deferred until the period in which such percentage completion is attained. It is our judgment that until a project reaches 25% completion, there is insufficient information to determine what the estimated profit on the project will be with a reasonable level of assurance. Additionally, as a result of experience gained on past design/build projects, we now evaluate each design/build project individually to determine whether it is appropriate to begin profit recognition at 25% completion or at a later point. The factors considered in this evaluation of risk associated with each design/build project include the stage of design completion, the stage of construction completion, status of outstanding purchase orders and subcontracts, certainty of quantities, certainty of schedule and the relationship with the owner.
Revenue from contract claims is recognized when we have a signed settlement agreement and payment is assured. Revenue from contract change orders, which occur in most large projects, is recognized when the owner has agreed to the change order in writing. Provisions are recognized in the statement of income for the full amount of estimated losses on uncompleted contracts whenever evidence indicates that the estimated total cost of a contract exceeds its estimated total revenue. Contract cost consists of direct costs on contracts, including labor and materials, amounts payable to subcontractors, direct overhead costs and equipment expense (primarily depreciation, fuel, maintenance and repairs). Depreciation is provided using accelerated methods for construction equipment. Contract cost is recorded as incurred and revisions in contract revenue and cost estimates are reflected when known. The completion threshold for the start of contract profit recognition is applied to all percentage of completion projects without exception unless and until we project a loss on the project, in which case the estimated loss is immediately recognized.
The accuracy of our revenue and profit recognition in a given period is almost solely dependent on the accuracy of our estimates of the cost to complete each project. Our cost estimates for all of our significant projects use a highly detailed “bottom up” approach and we believe our experience allows us to provide materially reliable estimates. There are a number of factors that can contribute to changes in estimates of contract cost and profitability. The most significant of these include the completeness and accuracy of the original bid, costs associated with added scope changes, extended overhead due primarily to owner and weather delays, subcontractor performance issues, changes in productivity expectations, site conditions that differ from those assumed in the original bid (to the extent contract remedies are unavailable), the availability and skill level of workers in the geographic location of the project and a change in the availability and proximity of equipment and materials. The foregoing factors as well as the stage of completion of contracts in process and the mix of contracts at different margins may cause fluctuations in gross profit between periods and these fluctuations may be significant. Substantial changes in cost estimates, particularly in the larger, more complex projects in our Heavy Construction Division, have had and can in future periods have a significant effect on our profitability.
Valuation of Long-Lived Assets: Long-lived assets, which include property, equipment and acquired identifiable intangibles, are reviewed for impairment whenever events or changes in circumstances indicate that the carrying amount of an asset may not be recoverable. Impairment evaluations involve management estimates of asset useful lives and future cash flows. Actual useful lives and cash flows could be different from those estimated by management and this could have a material effect on our operating results and financial position.
We had approximately $9.9 million in goodwill at December 31, 2006 relating to our Branch Division primarily associated with our majority owned Wilder Construction Company subsidiary. We perform goodwill impairment tests on an annual basis and more frequently when events and circumstances occur that indicate a possible impairment of goodwill. In determining whether there is an impairment of goodwill, we calculate the estimated fair value of the reporting unit in which the goodwill is recorded using a discounted future cash flow method. We then compare the resulting fair value to the net book value of the reporting unit, including goodwill. If the net book value of a reporting unit exceeds its fair value, we would measure the amount of the impairment loss by comparing the implied fair value of the reporting unit’s goodwill with the carrying amount of that goodwill. To the extent that the carrying amount of a reporting unit’s goodwill exceeds its implied fair value, we recognize a goodwill impairment loss. We performed our annual impairment test in 2006 and we determined that no impairment had occurred with respect to the Branch Division goodwill. Additionally, we performed our annual impairment test in 2006 for approximately $18.0 million in goodwill related to our Heavy Construction Division and determined that it was fully impaired (see Note 8 of the “Notes to the Consolidated Financial Statements”).
The discounted future cash flow method used in the first step of our impairment test involves significant estimates including future cash inflows from estimated revenues, future cash outflows from estimated project cost and general and administrative costs, estimates of timing of collection and payment of various items and future growth rates as well as discount rate and terminal value assumptions. Although we believe the estimates and assumptions that we used in testing for impairment are reasonable and supportable, significant changes in any one of these assumptions could produce a significantly different result.
Insurance estimates: We carry insurance policies to cover various risks, primarily general liability and workers compensation, under which we are liable to reimburse the insurance company for a portion of each claim paid. The amounts that we are liable for generally range from the first $250,000 to $1.0 million per occurrence. We accrue for the estimated ultimate liability for incurred losses, both reported and unreported, using actuarial methods based on historic trends modified, if necessary, by recent events. Changes in our loss assumptions caused by changes in actual experience would result in a change in our assessment of the ultimate liability that could have a material effect on our operating results and financial position.
Current Year
Revenue
| | | | | | | | |
| Total Revenue | | | | | | | |
| Years ended December 31, | | 2006 | | 2005 | | 2004 | |
| | Amount | | Percent | | Amount | | Percent | | Amount | | Percent | |
| Revenue by Division: | | | | | | | | | | | | | | | | | | | |
| Branch Division | | $ | 1,848,725 | | | 62.3 | | $ | | | | | | $ | | | | | |
| Heavy Construction Division | | | 1,085,888 | | | 36.6 | | | | | | | | | | | | | |
| Other | | | 34,991 | | | 1.1 | | | 19,698 | | | 0.7 | | | - | | | - | |
| Total | | $ | 2,969,604 | | | | | $ | 2,641,352 | | | 100.0 | | $ | | | | 100.0 | |
| | | | | | | | |
| Branch Division Revenue | | | | | | | |
| Years ended December 31, | | 2006 | | 2005 | | 2004 | |
| (in thousands) | | Amount | | Percent | | Amount | | Percent | | Amount | | Percent | |
| California: | | | | | | | | | | | | | | | | | | | |
| Public sector | | $ | 537,967 | | | 48.5 | | $ | | | | | | $ | | | | | |
| Private sector | | | 300,245 | | | 27.0 | | | | | | | | | | | | | |
| Material sales | | | 272,039 | | | 24.5 | | | | | | | | | | | | | |
| Total | | $ | 1,110,251 | | | 100.0 | | $ | 871,914 | | | 100.0 | | $ | | | | 100.0 | |
| West (excluding California): | | | | | | | | | | | | | | | | | | | |
| Public sector | | $ | 429,288 | | | 58.1 | | $ | | | | | | $ | | | | | |
| Private sector | | | 171,166 | | | 23.2 | | | | | | | | | | | | | |
| Material sales | | | 138,020 | 18.7 | | | | | | | | | | | | | |
| Total | | $ | 738,474 | | | 100.0 | | $ | 719,631 | | | 100.0 | | $ | 550,605 | | | 100.0 | |
| Total Branch Division Revenue: | | | | | | | | | | | | | | | | | | | |
| Public sector | | $ | 967,255 | | | 52.3 | | $ | 812,319 | | | 51.0 | | $ | 752,492 | | | 58.4 | |
| Private sector | | | 471,411 | | | 25.5 | | | 447,573 | | | 28.1 | | | 271,923 | | | 21.1 | |
| Material sales | | | 410,059 | | | 22.2 | | | 331,653 | | | 20.9 | | | 263,200 | | | 20.5 | |
| Total | | $ | 1,848,725 | | | 100.0 | | $ | 1,591,545 | | | 100.0 | | $ | 1,287,615 | | | 100.0 | |
Branch Division Revenue: Revenue from our Branch Division increased $257.2 million, or 16.2%, in the year ended December 31, 2006 from the year ended December 31, 2005. The increased revenue from both construction and the sale of materials was driven by higher levels of public spending, particularly in California. Increased revenue from the sale of materials reflects an increase in average selling prices in 2006. Although our private sector revenue remains strong, we continue to see a reduction in residential development opportunities. A portion of the increase in Branch Division revenue was also attributable to mild weather in the fourth quarter of 2006 which enabled many of our locations to complete more work in the quarter than in the fourth quarter of 2005.
| | | | | | | | | | | | | |
HCD Revenue | | | | | | | | | | | | | |
| Years ended December 31, | | 2006 | | 2005 | | 2004 | |
(in thousands) | | Amount | | Percent | | Amount | | Percent | | Amount | | Percent | |
| Revenue by Geographic Area: | | | | | | | | | | | | | | | | | | | |
| Midwest | | $ | 58,726 | | | 5.4 | | $ | 92,931 | | | 9.0 | | $ | 96,041 | | | 11.3 | |
| Northeast | | | 281,552 | | | 25.9 | | | 324,477 | | | 31.5 | | | 346,704 | | | 40.9 | |
| South | | | 219,978 | | | 20.3 | | | | | | | | | | | | | |
| Southeast | | | 244,233 | | | 22.5 | | | 176,088 | | | 17.1 | | | 167,925 | | | 19.8 | |
| West | | | 281,399 | | | 25.9 | | | | | | | | | | | | | |
| Total | | $ | 1,085,888 | | | 100.0 | | $ | 1,030,109 | | | 100.0 | | $ | | | | 100.0 | |
| Revenue by Market Sector: | | | | | | | | | | | | | | | | | | | |
| Public sector | | $ | 1,058,746 | | | 97.5 | | $ | | | | | | $ | | | | | |
| Private sector | | | 27,042 | | | 2.5 | | | | | | | | | | | | | |
| Material sales | | | 100 | | | - | | | 2,637 | | | 0.2 | | | 1,153 | | | 0.2 | |
| | $ | 1,085,888 | | | 100.0 | | $ | 1,030,109 | | | 100.0 | | $ | | | | 100.0 | |
| Revenue by Contract Type: | | | | | | | | | | | | | | | | | | | |
| Fixed unit price | | $ | 243,103 | | | 22.4 | | $ | | | | 31.4 | | $ | | | | | |
| Fixed price, including design/build | | | 842,666 | | | 77.6 | | | | | | | | | | | | | |
| Other | | | 119 | | | - | | | | | | | | | | | | | |
| | $ | 1,085,888 | | | 100.0 | | $ | 1,030,109 | | | 100.0 | | $ | | | | 100.0 | |
HCD Revenue: Revenue from our Heavy Construction Division increased $55.8 million, or 5.4%, in the year ended December 31, 2006 from the year ended December 31, 2005, due primarily to the increase in volume from a higher backlog at the beginning of 2006 and a large project award received in the first quarter of 2006. Revenue generated from projects with a contract value greater than $100 million increased to 72.9% of total HCD revenue in 2006 from 57.6% in 2005, and our minority partners’ share of our consolidated joint venture revenue increased to approximately $214.6 million in 2006 from approximately $175.0 million in 2005 (see Note 5 of the “Notes to the Consolidated Financial Statements”). Geographically, the increased revenue in the West in 2006 was primarily attributable to a large design/build project in Utah which was awarded in late 2005. In the Southeast, the increased revenue for 2006 was due primarily to a large design/build project in Mississippi which was awarded in the first quarter of 2006. Decreases in revenue in the Northeast in 2006 were due primarily to more projects in New York reaching substantial completion during 2006 than in 2005 and a lack of new project awards during 2006. Revenue from fixed price contracts increased from 68.4% of HCD revenue in 2005 to 77.6% of HCD revenue in 2006 due primarily to growth in design/build projects in our backlog.
Backlog
| | | | |
Total Backlog | | | |
December 31, | | 2006 | | 2005 | |
(in thousands) | | Amount | | Percent | | Amount | | Percent | |
| Backlog by Division: | | | | | | | | | | | | | |
| Branch Division | | $ | 807,648 | | | 35.8 | | $ | | | | | |
| Heavy Construction Division | | | 1,448,939 | | | 64.2 | | | | | | | |
| Total | | $ | 2,256,587 | | | 100.0 | | $ | 2,331,540 | | | 100.0 | |
| | | | |
| Branch Division Backlog | | | | | |
| December 31, | | 2006 | | 2005 | |
| (in thousands) | | Amount | | Percent | | Amount | | Percent | |
| California: | | | | | | | | | | | | | |
| Public sector | | $ | 423,542 | | | 84.2 | | $ | | | | | |
| Private sector | | | 79,718 | | | 15.8 | | | | | | | |
| Total | | $ | 503,260 | | | 100.0 | | $ | 399,969 | | | 100.0 | |
| West (excluding California): | | | | | | | | | | | | | |
| Public sector | | $ | 230,230 | | | 75.6 | | $ | | | | | |
| Private sector | | | 74,158 | | | 24.4 | | | | | | | |
| Total | | $ | 304,388 | | | 100.0 | | $ | 328,287 | | | 100.0 | |
| Total Branch Division backlog: | | | | | | | | | | | | | |
| Public sector | | $ | 653,772 | | | 80.9 | | $ | 537,454 | | | 73.8 | |
| Private sector | | | 153,876 | | | 19.1 | | | 190,802 | | | 26.2 | |
| Total Branch Division backlog | | $ | 807,648 | | | 100.0 | | $ | 728,256 | | | 100.0 | |
Branch Division Backlog: Branch Division backlog at December 31, 2006 was $807.7 million, an increase of $79.4 million, or 10.9%, from December 31, 2005. The increase was due primarily to higher public sector awards in California, partially offset by a decrease in private sector backlog in California. Although our private sector backlog remains strong, we are experiencing a reduction in residential development opportunities. The increase in California public sector backlog includes a $51.9 million share of a joint venture highway reconstruction project for the California Department of Transportation (“Caltrans”) that was awarded in the first quarter of 2006 and a $30.5 million highway widening project for Caltrans that was awarded in the third quarter of 2006. Branch Division awards in the fourth quarter of 2006 included a $26.3 million highway reconstruction project and a $24.8 million road construction project in Southern California. Other Branch Division awards in 2006 included an $81.8 million joint venture highway reconstruction project in Northern California, a $44.9 million road construction project near Bakersfield, California and a $21.3 million residential site development project in Nevada.
| | | | | | | | | | |
HCD Backlog | | | | | | | | | |
| December 31, | | 2006 | | 2005 | |
| (in thousands) | | Amount | | Percent | | Amount | | Percent | |
| Backlog by Geographic Area: | | | | | | | | | | | | | |
| Midwest | | $ | 443,909 | | | 30.6 | | $ | 76,464 | | | 4.8 | |
| Northeast | | | 248,605 | | | 17.2 | | | 491,944 | | | 30.7 | |
| South | | | 214,809 | | | 14.8 | | | | | | 22.1 | |
| Southeast | | | 272,881 | | | 18.8 | | | 224,549 | | | 14.0 | |
| West | | | 268,735 | | | | | | | | | | |
| Total | | $ | 1,448,939 | | | 100.0 | | $ | 1,603,284 | | | 100.0 | |
| Backlog by Market Sector: | | | | | | | | | | | | | |
| Public sector | | $ | 1,413,778 | | | 97.6 | | $ | | | | | |
| Private sector | | | 35,161 | | | 2.4 | | | | | | | |
| | $ | 1,448,939 | | | 100.0 | | $ | 1,603,284 | | | 100.0 | |
| Backlog by Contract Type: | | | | | | | | | | | | | |
| Fixed unit price | | $ | 171,239 | | | 11.8 | | $ | | | | | |
| Fixed price including design/build | | | 1,277,700 | | | 88.2 | | | | | | | |
| Total | | $ | 1,448,939 | | | 100.0 | | $ | 1,603,284 | | | 100.0 | |
HCD Backlog: Backlog in our Heavy Construction Division at December 31, 2006 was $1,448.9 million, a decrease of $154.3 million, or 9.6%, from backlog at December 31, 2005. Decreases in HCD backlog reflect our strategy of bidding work at higher margins and focusing on successful execution of a lower volume of work. HCD backlog includes approximately $22.7 million related to our 20% portion of a joint venture project to construct a transportation hub at the World Trade Center in New York. We currently expect the total revenue on that contract to be approximately $1.5 billion of which our share would be approximately $300.0 million. HCD awards in the fourth quarter of 2006 included a $420.0 million design/build consolidated joint venture highway reconstruction project in St. Louis, Missouri.Approximately 26.2% of the HCD backlog at December 31, 2006 relates to projects that have forecasted a loss. The forecasted losses have been recognized in the period(s) they were identified. Assuming no further changes, either upward or downward, in the forecasted results for these projects this backlog will earn no profit or loss in future periods.
Gross Profit
| | | | |
Years ended December 31, | | 2006 | | 2005 | | 2004 | |
| (in thousands) | | | |
| Branch Division gross profit | | $ | 364,878 | | $ | | | $ | | |
| Percent of division revenue | | | 19.7 | % | | | % | | | % |
| Heavy Construction Division gross profit | | $ | (86,856 | ) | $ | | | $ | | |
| Percent of division revenue | | | (8.0 | )% | | | % | | | % |
| Other | | $ | 17,698 | | $ | | | $ | | ) |
| Total gross profit | | $ | 295,720 | | $ | | | $ | | |
| Percent of revenue | | | 10.0 | % | | | % | | | % |
Gross Profit: As more fully described under “Critical Accounting Estimates” we recognize revenue only equal to cost, deferring profit recognition, until a project reaches 25% completion. In certain cases, such as large, complex design/build projects, we may continue to defer profit recognition beyond the point of 25% completion until such time as we believe we have enough information to make a reasonably dependable estimate of contract revenue and cost. Because we have a large number of projects at various stages of completion in our Branch Division, this policy generally has very little impact on the Branch Division’s gross profit on a quarterly or annual basis. However, HCD has fewer projects in process at any given time and those projects tend to be much larger than Branch Division projects. As a result, HCD gross profit as a percent of revenue can vary significantly in periods where one or several very large projects reach our completion threshold and the deferred profit is recognized or conversely, in periods where backlog is growing rapidly and a higher percentage of projects are in their early stages with no associated gross margin recognition. Revenue from projects less than our completion threshold, for which no margin has been recognized, was as follows:
| | | | | | | | |
Revenue from Contracts with Deferred Profit | | | | | | | |
Years ended December 31, | | 2006 | | 2005 | | 2004 | |
| (in thousands) | | | |
| Branch Division | | $ | 22,227 | | $ | | | $ | | |
| Heavy Construction Division | | | 19,038 | | | | | | | |
| Total revenue from contracts with deferred profit | | $ | 41,265 | | $ | 76,112 | | $ | 132,211 | |
Additionally, as we also describe under “Critical Accounting Estimates” we do not recognize revenue from contract claims until we have a signed agreement and payment is assured and we do not recognize revenue from contract change orders until the contract owner has agreed to the change order in writing. However, we do recognize the costs related to any contract claims or pending change orders in our forecasts when we are contractually obligated to incur them. As a result, our gross profit as a percent of revenue can vary during periods where a large volume of change orders or contract claims are pending resolution (reducing gross profit percent) or, conversely, during periods where large change orders or contract claims are agreed or settled (increasing gross profit percent). Although this variability can occur in both our Branch Division and HCD, it can be much more pronounced in HCD because of the larger size of its projects.
Gross profit as a percent of revenue in our Branch Division increased to 19.7% in 2006 from 16.0% in 2005. The increase in 2006 is attributable to higher profit margins for both construction and the sale of materials due to strong demand in both the private and public sectors. Branch Division construction gross profit as a percent of revenue in 2006 increased to 18.6% from 14.3% in 2005. Branch Division gross profit from the sale of materials as a percent of revenue in 2006 increased to 23.6% from 22.3% in 2005.
Branch Division gross profit for 2006 includes the effects of changes in the estimates of the profitability of certain projects. The net impact of these estimate changes for 2006 was an increase to gross profit of approximately $3.8 million due primarily to the settlement of outstanding issues on two projects with no associated cost, partially offset by increases in estimated costs on several other projects. The net impact of such estimate changes for 2005 was a decrease to gross profit of approximately $2.5 million due primarily to unanticipated costs related to quality issues in work originally performed by a subcontractor on one project and changes in site conditions from our original expectations on a second project.
HCD recognized a negative gross margin of 8.0% for the year ended December 31, 2006 compared to a gross profit margin of 4.9% for 2005. The reduction in gross margin was primarily due to additional estimated project costs that had the effect of reducing gross profit by approximately $145.0 million in 2006. This compares with reduced gross margin from reductions in estimated project profitability of approximately $31.0 million in 2005 (See Note 2 of the “Notes to the Consolidated Financial Statements”). Additionally HCD’s gross margin in 2006 was negatively impacted by lower estimated profitability in the division’s backlog at the beginning of 2006 resulting from the deterioration in estimated project margins experienced during 2005. When there are contract forecast changes having the significance of those we experienced in 2006, we undergo a process that includes reviewing the nature of the changes to ensure that there are no material amounts that should have been recorded in a prior period rather than as a change in estimate. In our review of these changes, we did not identify any material amounts that should have been recorded in a prior period.
Other gross profit in 2006 and 2005 is primarily related to sales of certain real estate development projects by consolidated subsidiaries of approximately $17.6 million and $12.3 million, respectively. The minority partners’ share of these gross profit amounts was approximately $7.8 million and $6.1 million, respectively.
Cost of revenue consists of direct costs on contracts, including labor and materials, subcontractor costs, direct overhead costs and equipment expense (primarily depreciation, maintenance and repairs and fuel).
General and Administrative Expenses
| | | | |
Years ended December 31, | | 2006 | | 2005 | | 2004 | |
(in thousands) | | | |
| Salaries and related expenses | | $ | 102,935 | | $ | | | $ | | |
| Incentive compensation, discretionary profit sharing and other variable compensation | | | 33,094 | | | | | | | |
| Other general and administrative expenses | | | 68,252 | | | | | | | |
| Total | | $ | 204,281 | | $ | | | $ | | |
| Percent of revenue | | | 6.9 | % | | | % | | | % |
General and Administrative Expenses: General and administrative expenses increased by $20.9 million, or 11.4%, from 2005 to 2006. Salaries and related expenses increased in 2006 due primarily to additional staffing needed to support a higher volume of work. Incentive compensation, discretionary profit sharing and other variable compensation increased in 2006 due to higher profitability in our Branch Division and higher restricted stock amortization cost. The increase in other general and administrative expenses in 2006 related primarily to increased bidding activity and other costs related to higher revenue volume. Other general and administrative expenses also includes information technology, occupancy, office equipment and supplies, depreciation, travel and entertainment, outside services, advertising and marketing, training and other miscellaneous expenses, none of which individually exceeded 10% of total general and administrative expenses.
Provision for (Reversal of) Legal Judgment
| | | | |
Years ended December 31, | | 2006 | | 2005 | | 2004 | |
(in thousands) | | | |
Provision for (reversal of) legal judgment | | $ | (4,800 | ) | $ | | | $ | - | |
Provision for (Reversal of) Legal Judgment: In June 2005, we recorded a provision of $9.3 million related to an unfavorable judgment in a legal proceeding. In January 2007, we entered into an agreement to resolve the related dispute which resulted in a partial reversal of the provision during the year ended December 31, 2006 (see Note 15 of the “Notes to the Consolidated Financial Statements”).
Goodwill Impairment Charge
| | | | |
Years ended December 31, | | 2006 | | 2005 | | 2004 | |
(in thousands) | | | |
| Goodwill impairment charge | | $ | 18,011 | | $ | | | $ | - | |
Goodwill Impairment Charge: The goodwill balance represented the excess of the purchase price over the fair value assigned to the net assets acquired in our 2001 acquisition of our Granite Northeast operation in New York (“GNE”), a reporting unit in our HCD operating segment. During the fourth quarter of 2006 we performed our annual impairment test and determined that the carrying amount of the goodwill exceeded its implied fair value and that a full impairment of goodwill existed. This impairment conclusion was reached due to continuing losses at GNE, including significant unexpected losses in the quarter ended December 31, 2006 which have caused us to re-evaluate our strategy in New York. We continue to believe that the New York market will present opportunities for us to build profitable work. However, in order to return to profitability we believe it is necessary to reduce the number of ongoing GNE projects so that we can devote the resources necessary to successfully manage and execute the work. See Note 8 of the “Notes to the Consolidated Financial Statements” for additional information about the impairment charge.
Gain on Sales of Property and Equipment
| | | | |
Years ended December 31, | | 2006 | | 2005 | | 2004 | |
(in thousands) | | | |
| Gain on sales of property and equipment | | $ | 10,408 | | $ | | | $ | | |
Gain on Sales of Property and Equipment: Gain on sales of property and equipment for the year ended December 31, 2006 included approximately $2.3 million from the sale of a rental property recognized in the first quarter of 2006.
Other Income (Expense)
| | | | |
| Years ended December 31, | | 2006 | | 2005 | | 2004 | |
| (in thousands) | | | |
| Interest income | | $ | 24,112 | | $ | | | $ | | |
| Interest expense | | | (4,492 | ) | | | ) | | | ) |
| Equity in income of affiliates | | | 2,157 | | | | | | | |
| Other, net | | | 2,604 | | | | | | | |
| Total | | $ | 24,381 | | $ | | | $ | | |
Other Income (Expense): Interest income increased $12.5 million, or 108.3%, in 2006 compared with 2005 due primarily to a higher average yield on higher average balances of interest bearing investments. Interest expense decreased $2.4 million, or 35.2% in 2006 compared with 2005 primarily due to a lower amount of debt outstanding during 2006. Additionally, in January 2007, we entered into an agreement to resolve a dispute which resulted in the reversal of accrued interest expense of approximately $337,000 (see Note 15 of the “Notes to the Consolidated Financial Statements”). Other, net in 2006 includes approximately $3.2 million recognized on the sale of gold in the second quarter. The gold is produced as a by-product of one of our aggregate mining operations and held for investment.
Provision for Income Taxes
| | | | |
Years ended December 31, | | 2006 | | 2005 | | 2004 | |
(in thousands) | | | |
| Provision for income taxes | | $ | 38,678 | | $ | | | $ | | |
| Effective tax rate | | | 34.2 | % | | | % | | | % |
Provision for Income Taxes: Our effective tax rate increased to 34.2% in 2006 from 29.1% in 2005 due primarily to the impact on the tax rate of minority interest losses in several of our construction joint ventures, which are not subject to income taxes on a stand alone basis.
Minority Interest in Consolidated Subsidiaries
| | | | |
Years ended December 31, | | 2006 | | 2005 | | 2004 | |
(in thousands) | | | |
| Minority interest in consolidated subsidiaries | | $ | 6,170 | | $ | | ) | $ | | ) |
Minority Interest in Consolidated Subsidiaries: Our minority interest in consolidated subsidiaries represents the minority owners’ share of the income or loss of our consolidated subsidiaries, primarily Wilder Construction Company, certain real estate development entities and various consolidated construction joint ventures. We recognized net minority interest benefit of approximately $6.2 million for the year ended December 31, 2006 primarily due to losses on certain construction joint venture projects.Four of our joint venture projects are currently forecast at a loss and will require additional capital contributions from our minority partners if the forecasts do not improve. Our joint venture agreements require that such capital contributions be made if needed. Based on our most recent assessment of our partners’ financial condition, we currently believe that two of our partners do not have the ability to contribute all of the additional capital that will be needed if the project forecasts do not improve. During the fourth quarter of 2006, we received updated financial information that caused concerns about these partners’ liquidity. Included in the net minority interest benefit for the year ended December 31, 2006 is expense related to these potentially uncollectible partner balances of approximately $9.4 million. The remaining minority interest balance related to these loss projects of $14.8 million at December 31, 2006 has been included in other long-term assets in our consolidated balance sheet.
Outlook
On February 14, 2007, we announced a strategic and organizational realignment of our business which is expected to be completed over the next 12 months. The realignment is designed to accommodate growth of our vertically integrated Branch business in the West and improve profitability on our large, complex Heavy Construction Division (“HCD”) projects. A key component of our corporate strategy over the coming years is to expand our vertically integrated branch business model into new geographies in the West and right-size our large projects business. By realigning our business and resources into Granite West and Granite East, we feel that we will be in better position to take full advantage of the long-term opportunities and strong market conditions we foresee for our business.
Led by Senior Vice President James H. Roberts, Granite West will be structured to strategically support the growth of our construction and construction materials businesses. The western portion of our current large projects business will be integrated into Granite West by carefully capitalizing on Granite West’s capacity, people and assets, as well as its extensive and proven management and support structure.
We will retain our successful decentralized operating structure within Granite West, with each branch location aligning under one of three Operating Groups: Northwest, Northern California and Southwest. Each branch will remain intact with little or no change in their operations and will report to a newly created position, Granite West Group Vice President. Each of the three Group Vice Presidents will oversee three to six branches and will have the responsibility to stimulate strategic thinking and growth in their geographic territory. Among other key benefits, this structure will allow Granite West to utilize its resources and market knowledge to take advantage of the larger projects we expect to be let as a result of healthy state funding and the recently passed Propositions in California.
Led by Senior Vice President Michael F. Donnino, Granite East will be aligned to focus on enhancing project management oversight and discipline from estimating through execution. Granite East will leverage its resources and core capabilities in areas where it has local knowledge, local relationships, and local resources. It will be operated out of three regional offices: the Central Region, based in Dallas, Texas; the Southeast Region, based in Tampa, Florida; and the Northeast Region, based in Tarrytown, New York.
The demand for our construction services in the public sector is very high. State and federal funding for transportation projects is very promising. Last November, California voters approved a major bond issue that should provide $19.9 billion for transportation-related improvements over the next ten years. Voters also approved a measure that would require California to stop diverting revenues from the state sales tax on motor vehicle fuels to non-transportation purposes. Early assessments of the California Department of Transportation (“Caltrans”) contracting levels for the 2007-08 fiscal year (beginning July 1) may reach or exceed record levels. We currently expect the bond monies to translate into new work by the second half of 2007 with bottom-line impact evident in 2008 and beyond.
While residential housing work in our private sector markets has slowed considerably, we believe the robust public sector market as well as continued strength in private sector commercial construction may offset the slowdown in the residential market. In addition to California, our markets in Utah, Arizona and Washington are also expected to be strong in 2007. However, public sector funding in Nevada is more restricted than normal due to a large highway project that is reducing monies available for smaller projects throughout the state.
The ownership of aggregate materials has proven to be extremely valuable both as a resource for our core construction business as well as a strategic and profitable retail business. Our long-term plan is to continue to invest in this part of our business by acquiring additional aggregate reserves, permitting or “green fielding” new facilities and expanding our existing operations to have at least a 30-year reserve life at all of our locations. We expect demand for our construction materials to remain healthy throughout the coming year. While sales volumes to third parties are expected to remain relatively flat, we believe that if we are able to manage production costs effectively and aggregates prices continue to improve, the prospects are good for another successful year for our construction materials business in the West.
Congress recently appropriated and the President signed into law SAFETEA-LU level funding of $39.1 billion for the federal highway program. The approved amount is a 10% increase over the fiscal 2006 level. SAFETEA-LU is a six-year federal transportation bill that runs through fiscal 2009 and calls for $286.5 billion in guaranteed funding for highways, transit and highway safety. These guaranteed funding levels established under SAFETEA-LU help guide Congress through the annual appropriations process, which determines yearly funding for the federal highway, transit and airport construction programs.
Our industry continues to be challenged with a shortage of skilled labor, and we expect the industry will continue to face this challenge as the demand for construction-related services remains strong or grows across the United States. At Granite, we are working diligently to implement specialized training programs to develop our people and improve their skills while proactively hiring skilled employees, both professional and craft, and continuing to focus on retention. Our investment in our Employee Development Initiative is an important strategic initiative that we believe will allow us to turn the shortage of labor in the marketplace into an advantage for Granite.
As we have stated previously, we are subject to oil price volatility as it relates to our use of liquid asphalt and diesel fuel. Some of our projects are indexed and include price escalation clauses that provide protection in the event that petroleum product prices increase significantly. Although we are exposed to price spikes in projects that do not include such clauses, we have historically been able to recover some or all of those costs when prices come down. With respect to steel, we are exposed to price increases and steel delivery delays on some of our HCD projects that are currently under construction. While we do have some exposure in these areas of our business, we have not been materially adversely impacted to date. In an effort to minimize our exposure on future projects, we are closely monitoring the industry’s outlook on future pricing so that we can reflect anticipated future price escalation in our bids.
In the short term, our business in the West is poised to take advantage of a number of opportunities that lie ahead in 2007. Pricing for construction materials is expected to be healthy next year as demand for aggregates remains strong.
In HCD, we expect consolidated revenue to be approximately $800.0 million next year. This compares with $1.1 billion in revenue for the division in 2006. In addition, we are currently forecasting HCD to break even in 2007 followed by a return to acceptable operating margins as the older backlog is worked off and the benefits of the organizational realignment are realized.
Overall, we are encouraged by the on-going demand for our construction services and materials as well as the positive outlook for transportation-related funding throughout most of our markets. We are excited about the strategic and organizational realignment of our large projects business and the opportunities it will provide for us to continue to build long-term shareholder value.
Prior Years
Revenue: Revenue from our Branch Division increased $303.9 million, or 23.6%, in the year ended December 31, 2005 from the year ended December 31, 2004. This increase was largely driven by a strong housing market, particularly in California and Nevada. A strong housing market increases demand for our services, including housing and commercial site development and related infrastructure such as roads and sewer systems. This private sector demand was also a major factor in the increased sales of materials in California, which grew by $49.1 million, or 29.7%, in the year ended December 31, 2005 from the year ended December 31, 2004. A portion of the Branch Division increase was also attributable to mild weather in the fourth quarter of 2005 which enabled many of our locations to complete more work in the quarter than in the fourth quarter of 2004.
Revenue from our Heavy Construction Division increased $181.5 million, or 21.4%, in the year ended December 31, 2005 from the year ended December 31, 2004, due primarily to the increase in volume from a higher backlog at the beginning of 2005 and several large project awards received in the first quarter of 2005. Revenue generated from projects with a contract value greater than $100 million increased to 57.6% of total HCD revenue in 2005 from 39.8% in 2004 and our minority partners’ share of our consolidated joint venture revenue increased to approximately $175.0 million in 2005 from approximately $111.6 million in 2004. Geographically, the largest increase was seen in the West, due primarily to a large design/build project in California that was awarded in 2004. Revenue from fixed price contracts increased from 59.9% of HCD revenue in 2004 to 68.4% of HCD revenue in 2005 due primarily to growth in design/build projects in our backlog.
Backlog: Branch Division backlog at December 31, 2005 was $728.3 million, an increase of $166.4 million, or 29.6%, from December 31, 2004. The increase was due primarily to higher backlog in California, particularly from contracts in the public sector, including a $62.6 million freeway reconstruction project for the California Department of Transportation (“Caltrans”) that was awarded in the fourth quarter 2005. Branch Division awards in the fourth quarter of 2005 also included a $14.7 million road construction project in California.
Backlog in our Heavy Construction Division at December 31, 2005 was $1,603.3 million, a decrease of $272.8 million, or 14.5%, from backlog at December 31, 2004. Additions to HCD backlog in the fourth quarter of 2005 included a $14.4 million levee repair project in New Orleans and HCD’s portion of a $182.9 million consolidated joint venture highway project in Utah which is being shared with the Branch Division.
Gross Profit: Revenue from projects that were less than 25% complete was $76.1 million in 2005 and $132.2 million in 2004. This decrease in revenue from projects less than 25% complete had the effect of increasing our overall gross margin.
Gross profit as a percent of revenue in our Branch Division increased to 16.0% in 2005 from 14.4% in 2004. Gross profit margins for both construction and the sale of materials in the Branch Division reflected our ability to capitalize on the continued strong private development market in many of the Division’s locations.
HCD gross profit as a percent of revenue in 2005 and 2004 of 4.9% and 4.8%, respectively, reflected the impact of downward revisions in the estimated profitability of certain contracts. The net impact of these estimate changes on recognized gross profit during 2005 was a reduction in gross profit of approximately $31.0 million. This compares with a net reduction in gross profit in 2004 of approximately $40.0 million (see Note 2 of the “Notes to the Consolidated Financial Statements”).
Other gross profit in 2005 is primarily related to sales of certain real estate development projects by consolidated subsidiaries of approximately $12.3 million. The minority partners’ share of this gross profit amount was approximately $6.1 million.
General and Administrative Expenses: General and administrative expenses increased by $26.4 million, or 16.8%, from 2004 to 2005. Salaries and related expenses increased in 2005 due primarily to additional staffing needed to support a higher volume of work. Incentive compensation, discretionary profit sharing and other variable compensation increased in 2005 due to higher profitability. The increase in other general administrative costs in 2005 related primarily to increased bidding activity and other costs related to higher revenue volume. Additionally, other general and administrative expense includes $3.5 million related to a reserve recorded in the fourth quarter of 2005 against a $3.5 million receivable that we accepted as a partial payment for work on a large private mass transit project which became operational in the latter half of 2004. The receivable is part of a series of bonds that formed the basis for the project owners’ funding for the entire project and is payable out of future fare revenues. In March 2005, one of the two services rating a series of these bonds reduced their rating to below investment grade. On February 10, 2006, the second rating service also reduced its rating, citing serious concerns about whether the project’s fare revenues would be adequate to pay the series of bonds that we hold. There is currently no market for these bonds and we have determined that a reserve of 100% of the carrying amount is appropriate. Other general and administrative costs also includes information technology, occupancy, office equipment and supplies, depreciation, travel and entertainment, outside services, advertising and marketing, training and other miscellaneous expenses, none of which individually exceeded 10% of total general and administrative expenses.
Provision for Legal Judgment: In June 2005, we recorded a provision of $9.3 million related to an unfavorable judgment in a legal proceeding (see Note 15 of the “Notes to the Consolidated Financial Statements”).
Gain on Sales of Property and Equipment: Gain on sales of property and equipment for the year ended December 31, 2004 included a $10.0 million gain on the sale of certain assets related to our redi-mix concrete business in Utah in March 2004.
Other Income (Expense): Interest income increased $3.6 million, or 45.4%, in the year ended December 31, 2005 compared with the year ended December 31, 2004 due primarily to a higher average yield on higher interest bearing investments. The decrease in equity in income of affiliates in 2005 was due to a $6.7 million gain recorded in 2004 related to the sale of certain assets by two partnerships in which we hold an equity method investment. The decrease in other, net in 2005 was due to a gain recognized in the fourth quarter of 2004 on the sale of certain shares of T.I.C. Holdings, Inc. (“TIC”) back to TIC (see Note 6 of the “Notes to the Consolidated Financial Statements”).
Provision for Income Taxes: Our effective tax rate decreased to 29.1% in 2005 from 30.0% in 2004 due in part to an increase in our partners’ share of consolidated construction joint venture income. Generally, our construction joint ventures are not subject to income taxes on a stand-alone basis. Also contributing to the decreased effective tax rate in 2005 was the impact of a deduction based on income from qualified domestic production activities under the American Jobs Creation Act of 2004.
Minority Interest in Consolidated Subsidiaries: The increase in minority interest in 2005 compared with 2004 was due to higher profitability of our consolidated subsidiaries in 2005.
Liquidity and Capital Resources
| | | | |
December 31, | | 2006 | | 2005 | | 2004 | |
| (in thousands) | | | |
| Cash and cash equivalents excluding consolidated joint ventures | | $ | 110,913 | | $ | | | $ | | |
| Consolidated joint venture cash and cash equivalents | | | 93,980 | | | 52,356 | | | 67,797 | |
| Total consolidated cash and cash equivalents | | $ | 204,893 | | $ | 199,881 | | $ | 161,627 | |
| Net cash provided by (used in): | | | | | | | | | | |
| Operating activities | | $ | 259,643 | | $ | | | $ | | |
| Investing activities | | | (183,683 | ) | | | ) | | | ) |
| Financing activities | | | (70,948 | ) | | | ) | | | ) |
| Capital expenditures | | | 116,238 | | | | | | | |
| Working capital | | | 319,762 | | | | | | | |
Our primary sources of liquidity are cash flows from operations and borrowings under our credit facilities. We expect the principal use of funds for the foreseeable future will be for acquisitions, capital expenditures, working capital, debt service and other investments. We have budgeted approximately $110.0 million for capital expenditures in 2007, which includes amounts for construction equipment, aggregate and asphalt plants, buildings, leasehold improvements and the purchase of land and aggregate reserves.
Our cash and cash equivalents and short-term and long-term marketable securities totaled $394.9 million at December 31, 2006 and included $94.0 million of cash from our consolidated joint ventures (see Note 5 of the “Notes to the Consolidated Financial Statements”). This joint venture cash is for the working capital needs of each joint venture’s project. The decision to distribute cash must generally be made jointly by all of the partners. We believe that our current cash and cash equivalents, short-term investments, cash generated from operations and amounts available under our existing credit facilities will be sufficient to meet our expected working capital needs, capital expenditures, financial commitments and other liquidity requirements associated with our existing operations through the next twelve months and beyond. If we experience a significant change in our business such as the execution of a significant acquisition, we would likely need to acquire additional sources of financing, which may be limited by the terms of our existing debt covenants, or may require the amendment of our existing debt agreements.
Cash provided by operating activities of $259.6 million for the year ended December 31, 2006 represents an increase of $113.1 million from the amount provided by operating activities during 2005. Although accounts receivable were higher at December 31, 2006 than at December 31, 2005 due to higher revenue in 2006, the balance increased at a lower rate in the year ended December 31, 2006 than in 2005 due to higher cash collections contributing to the increase in cash from operations. Additionally, the increase was due to higher net income prior to the non-cash goodwill impairment charge and higher net billings in excess of costs and estimated earnings resulting primarily from large cash payments received to mobilize projects in the early stages of construction, which have the effect of increasing cash flow in the periods received and decreasing cash flow in subsequent periods as cash is expended towards project completion.
Cash used in investing activities of $183.7 million for the year ended December 31, 2006 represents an increase of approximately $118.9 million from the amount used in 2005 due primarily to increased net purchases of marketable securities and net additions to property and equipment in 2006.
Cash used in financing activities was $70.9 million for the year ended December 31, 2006, representing an increase of $27.5 million from the amount used in 2005 due primarily to increases in net repayments of long-term debt and net distributions to minority partners in the 2006 period.
Contractual Obligations
The following table summarizes our significant contractual obligations outstanding as of December 31, 2006:
| | | | |
| Contractual Obligations | | Payments due by period | |
| (in thousands) | | Total | | Less than 1 year | | 1-3 years | | 3-5 years | | More than 5 years | |
| Long term debt (1) | | $ | 107,236 | | $ | 28,660 | | $ | 37,460 | | $ | 23,667 | | $ | 17,449 | |
| Operating leases (2) | | | 42,707 | | | 11,702 | | | 7,094 | | | 5,529 | | | 18,382 | |
| Purchase obligations under construction contracts (3) | | | 1,196,732 | | | 834,101 | | | 322,047 | | | 40,584 | | | - | |
| Other purchase obligations (4) | | | 22,802 | | | 18,335 | | | 2,071 | | | 129 | | | 2,267 | |
| Deferred compensation obligations (5) | | | 28,154 | | | 1,340 | | | 4,557 | | | 8,625 | | | 13,632 | |
| Wilder stock repurchase obligation (6) | | | 19,680 | | | 1,420 | | | 1,464 | | | 5,260 | | | 11,536 | |
| Total | | $ | | | $ | | | $ | | | $ | | | $ | | |
(1) These obligations represent the aggregate minimum principal maturities of long-term debt and do not include interest. See Note 10 of the “Notes to the Consolidated Financial Statements.”
(2) These obligations represent the minimum rental commitments and minimum royalty requirements under all noncancellable operating leases. See Note 15 of the “Notes to the Consolidated Financial Statements.”
(3) These obligations represent our best estimate of future purchases of materials and subcontract services related to our current contract backlog.
(4) These obligations represent firm purchase commitments for equipment and other goods and services not connected with our construction backlog which are individually greater than $10,000 and have an expected purchase after February 28, 2007.
(5) The timing of expected payment of deferred compensation is based on estimated dates of retirement. Actual dates of retirement could be different and would cause the timing of payments to change.
(6) The timing of expected payment for redemptions is based on estimates including dates of retirement which could differ from actual dates of retirement and would cause the timing of payments to change. See Note 15 of the “Notes to the Consolidated Financial Statements.”
In 2002, our Board of Directors authorized us to repurchase up to $25.0 million of our common stock of which $22.8 million remained at December 31, 2006.
We had standby letters of credit totaling approximately $4.7 million outstanding at December 31, 2006, all of which expire between February 2007 and March 2008. We are generally required by the beneficiaries of these standby letters of credit to replace them upon expiration. Additionally, we generally are required to provide various types of surety bonds that provide an additional measure of security under certain public and private sector contracts. At December 31, 2006, approximately $2.2 billion of our backlog was bonded and performance bonds totaling approximately $10.0 billion were outstanding. Performance bonds do not have stated expiration dates; rather, we are generally released from the bonds when each contract is accepted by the owner. The ability to maintain bonding capacity to support our current and future level of contracting requires that we maintain cash and working capital balances satisfactory to our sureties.
We have a $150.0 million bank revolving line of credit, which allows for unsecured borrowings through June 24, 2010, with interest rate options. Interest on outstanding borrowings under the revolving line of credit is at our choice of selected LIBOR rates plus a margin that is recalculated quarterly. The margin was 0.60% at December 31, 2006. The unused and available portion of this line of credit was $145.6 million at December 31, 2006. Additionally, our Wilder subsidiary has a bank revolving line of credit of $10.0 million that expires in June 2008. The unused and available portion of this line of credit was $9.8 million at December 31, 2006.
Restrictive covenants under the terms of our debt agreements require the maintenance of certain financial ratios and the maintenance of tangible net worth (as defined) (see Note 10 of the “Notes to the Consolidated Financial Statements”). We were in compliance with these covenants at December 31, 2006. Additionally, our Wilder subsidiary has restrictive covenants (on a Wilder stand-alone basis) under the terms of its debt agreements that include the maintenance of certain ratios of working capital, liabilities to net worth and tangible net worth and restricts Wilder capital expenditures in excess of specified limits. Wilder was in compliance with these covenants at December 31, 2006. Failure to comply with these covenants could cause the amounts due under the debt agreements to become currently payable.
Joint Ventures; Off-Balance-Sheet Arrangements
We participate in various construction joint venture partnerships in order to share expertise, risk and resources for certain highly complex projects. Generally, each construction joint venture is formed to accomplish a specific project and is jointly controlled by the joint venture partners. We select our joint venture partners based on our analysis of their construction and financial capabilities, expertise in the type of work to be performed and past working relationships with us, among other criteria. The joint venture agreements typically provide that our interests in any profits and assets, and our respective share in any losses and liabilities that may result from the performance of the contract are limited to our stated percentage interest in the project.
Under each joint venture agreement, one partner is designated as the sponsor. The sponsoring partner typically provides all administrative, accounting and most of the project management support for the project and generally receives a fee from the joint venture for these services. We have been designated as the sponsoring partner in certain of our current joint venture projects and are a non-sponsoring partner in others.
We also participate in various “line item” joint venture agreements under which each partner is responsible for performing certain discrete items of the total scope of contracted work. The revenue for these discrete items is defined in the contract with the project owner and each venture partner bears the profitability risk associated with its own work. All partners in a line item joint venture are jointly and severally liable for the completion of the total project under the terms of the contract with the project owner. There is not a single set of books and records for a line item joint venture. Each partner accounts for its items of work individually as it would for any self-performed contract. We account for our portion of these contracts as project revenues and costs in our accounting system and include receivables and payables associated with our work in our consolidated financial statements.
The venture’s contract with the project owner typically requires joint and several liability among the joint venture partners. Although our agreements with our joint venture partners for both construction joint ventures and line item joint ventures provide that each party will assume and pay its share of any losses resulting from a project, if one of our partners was unable to pay its share we would be fully liable under our contract with the project owner. Circumstances that could lead to a loss under these guarantee arrangements include a partner’s inability to contribute additional funds to the venture in the event that the project incurred a loss or additional costs that we could incur should the partner fail to provide the services and resources toward project completion that had been committed to in the joint venture agreement. At December 31, 2006, approximately $447.0 million of work representing either our partners’ proportionate share of unconsolidated construction joint ventures or work that our partners are directly responsible for in line item joint ventures, had yet to be completed. During 2006 we recorded approximately $9.4 million in additional minority interest cost related to our assessment that our partners in two construction joint venture projects would be unable to pay their full share of the projects’ projected losses. Prior to 2006 we had never incurred a loss under these joint and several liability provisions, however, it is possible that we could record additional losses in the future and such losses could be significant.
Recent Accounting Pronouncements
See Note 1 of the “Notes to the Consolidated Financial Statements” for a description of recent accounting pronouncements, including the expected dates of adoption and effects on our financial position, results of operations and cash flows.
Quarterly Results
The following table sets forth selected unaudited financial information for the eight quarters in the two-year period ended December 31, 2006. This information has been prepared on the same basis as the audited financial statements and, in the opinion of management, contains all adjustments necessary for a fair statement thereof.
| | | | | | | | | | |
| | | | | | | |
| (unaudited - in thousands, except per share data) | | | | | | | | | |
2006 Quarters Ended | | December 31 | | September 30 | | June 30 | | March 31 | |
| Revenue | | $ | 719,927 | | $ | 941,672 | | $ | 812,037 | | $ | 495,968 | |
| Gross profit | | | 56,443 | | | 105,932 | | | 93,110 | | | 40,235 | |
| As a percent of revenue | | | 7.8 | % | | 11.2 | % | | 11.5 | % | | 8.1 | % |
| Net income (loss) | | | 2,917 | | | 45,725 | | | 33,289 | | | (1,422 | ) |
| As a percent of revenue | | | 0.4 | % | | 4.9 | % | | 4.1 | % | | (0.3 | )% |
| Net income (loss) per share: | | | | | | | | | | | | | |
| Basic | | $ | 0.07 | | $ | 1.12 | | $ | 0.81 | | $ | (0.03 | ) |
| Diluted | | $ | 0.07 | | $ | 1.10 | | $ | 0.80 | | $ | (0.03 | ) |
| Dividends per share | | $ | 0.10 | | $ | 0.10 | | $ | 0.10 | | $ | 0.10 | |
| Market price of common stock | | | | | | | | | | | | | |
| High | | $ | 63.73 | | $ | 56.14 | | $ | 51.65 | | $ | 49.75 | |
| Low | | $ | 47.69 | | $ | 37.35 | | $ | 37.63 | | $ | 35.42 | |
| | | | | | | | | | | | | | |
2005 Quarters Ended | | | December 31 | | | September 30 | | | June 30 | | | March 31 | |
| Revenue | | $ | | | $ | | | $ | | | $ | | |
| Gross profit | | | | | | | | | | | | | |
| As a percent of revenue | | | | % | | | % | | | % | | | % |
| Net income (loss) | | | | | | | | | | | | | ) |
| As a percent of revenue | | | | % | | | % | | | % | | | )% |
| Net income (loss) per share: | | | | | | | | | | | | | |
| Basic | | $ | | | $ | | | $ | | | $ | | ) |
| Diluted | | $ | | | $ | | | $ | | | $ | | ) |
| Dividends per share | | $ | | | $ | | | $ | | | $ | | |
| Market price of common stock | | | | | | | | | | | | | |
| High | | $ | | | $ | | | $ | | | $ | | |
| Low | | $ | | | $ | | | $ | | | $ | | |
Net income (loss) per share calculations are based on the weighted average common shares outstanding for each period presented. Accordingly, the sum of the quarterly net income (loss) per share amounts may not equal the per share amount reported for the year.
We are exposed to financial market risks due largely to changes in interest rates, which we have managed primarily by managing the maturities in our investment portfolio. We currently do not have any material business transactions in foreign currencies.
The fair value of our short-term held-to-maturity investment portfolio and related income would not be significantly impacted by changes in interest rates since the investment maturities are short and the interest rates are primarily fixed. The fair value of our long-term held-to-maturity investment portfolio may be impacted by changes in interest rates. Our mutual fund portfolio of $33.0 million is exposed to equity price risks.
We had senior notes payable of $26.7 million at December 31, 2006 which carry a fixed interest rate of 6.54% per annum with principal payments due in nine equal annual installments that began in 2002 and senior notes payable of $58.3 million at December 31, 2006 which carry a fixed interest rate of 6.96% per annum with principal payments due in nine equal annual installments which began in 2005.
The table below presents principal amounts and related weighted average interest rates by year for our cash and cash equivalents, held-to-maturity investments and significant debt obligations (in thousands):
| | | | | | | | | | | | | | | | |
| | | 2007 | | 2008 | | 2009 | | 2010 | | 2011 | | Thereafter | | Total | |
| Assets | | | | | | | | | | | | | | | | | | | | | | |
| Cash, cash equivalents and held-to-maturity investments | | $ | 312,952 | | $ | 42,555 | | $ | 2,199 | | $ | 4,194 | | $ | - | | $ | - | | $ | 361,900 | |
| Weighted average interest rate | | | 4.98 | % | | 5.05 | % | | 3.64 | % | | 5.36 | % | | - | % | | - | % | | 4.98 | % |
| Liabilities | | | | | | | | | | | | | | | | | | | | | | |
| Fixed rate debt | | | | | | | | | | | | | | | | | | | | | | |
| Senior notes payable | | $ | 15,000 | | $ | 15,000 | | $ | 15,000 | | $ | 15,000 | | $ | 8,333 | | $ | | | $ | 85,000 | |
| Weighted average interest rate | | | 6.77 | % | | 6.77 | % | | 6.77 | % | | 6.77 | % | | 6.96 | % | | | % | | 6.83 | % |
| | | | | | | | | | | | | | | | | | | | | | | |
The estimated fair value of our cash, cash equivalents and short-term held-to-maturity investments approximate the principal amounts reflected above based on the generally short maturities of these financial instruments. The estimated fair value of our long-term held-to-maturity investments approximates the principal amounts above due to the relatively minor difference between the effective yields of these investments and rates currently available on similar instruments. Rates currently available to us for debt with similar terms and remaining maturities are used to estimate fair value of existing debt. Based on the lower fixed borrowing rates currently available to us for bank loans with similar terms and average maturities, the fair value of the senior notes payable was approximately $87.9 million as of December 31, 2006 and $104.9 million as of December 31, 2005.
The following consolidated financial statements of Granite and the independent registered public accounting firm’s report are incorporated by reference from Part IV, Item 15(1) and (2):
Report of Independent Registered Public Accounting Firm
Consolidated Balance Sheets - At December 31, 2006 and 2005
Consolidated Statements of Income - Years Ended December 31, 2006, 2005 and 2004
Consolidated Statements of Shareholders’ Equity and Comprehensive Income - Years Ended December 31, 2006, 2005 and 2004
Consolidated Statements of Cash Flows - Years Ended December 31, 2006, 2005 and 2004
Notes to the Consolidated Financial Statements
Schedule II - Schedule of Valuation and Qualifying Accounts
Additionally, a two-year Summary of Quarterly Financial Data (unaudited) is included in “Quarterly Results” under “Item 7. Management’s Discussion and Analysis of Financial Condition and Results of Operation.”
Item 9. CHANGES IN AND DISAGREEMENTS WITH ACCOUNTANTS ON ACCOUNTING AND FINANCIAL DISCLOSURE
Not applicable.
Evaluation of Disclosure Controls and Procedures: We carried out an evaluation, under the supervision of and with the participation of management, including our Chief Executive Officer and our Chief Financial Officer, of the design and operation of our disclosure controls and procedures (as defined in Rules 13a-15(e) and 15d-15(e) under the Securities Exchange Act of 1934, as amended (the “Exchange Act”)). Based on that evaluation, our Chief Executive Officer and Chief Financial Officer concluded that, as of December 31, 2006, our disclosure controls and procedures were effective.
Changes in Internal Control Over Financial Reporting: During the fourth quarter of 2006, there have been no changes in our internal control over financial reporting that have materially affected, or were reasonably likely to materially affect, our internal control over financial reporting.
Management’s Report on Internal Control Over Financial Reporting : Our management is responsible for establishing and maintaining adequate internal control over financial reporting, as such term is defined in Exchange Act Rules 13a-15(f) and 15d -15(f). Under the supervision and with the participation of our management, including our Chief Executive Officer and Chief Financial Officer, we conducted an evaluation of the effectiveness of our internal control over financial reporting based on the framework in “Internal Control—Integrated Framework” issued by the Committee of Sponsoring Organizations of the Treadway Commission. Based on that evaluation our management concluded that our internal control over financial reporting was effective as of December 31, 2006.
Our management’s assessment of the effectiveness of our internal control over financial reporting as of December 31, 2006 has been audited by PricewaterhouseCoopers LLP, an independent registered public accounting firm, as stated in their report which is included herein.
Not applicable.
Certain information required by Part III is omitted from this Report. We will file our definitive proxy statement for our Annual Meeting of Shareholders to be held on May 21, 2007 (the “Proxy Statement”) pursuant to Regulation 14A not later than 120 days after the end of the fiscal year covered by this Report, and certain information included therein is incorporated herein by reference.
For information regarding our Directors and compliance with Section 16(a) of the Securities Exchange Act of 1934, we direct you to the sections entitled “Election of Directors” and “Section 16(a) Beneficial Ownership Reporting Compliance,” respectively, in the Proxy Statement. For information regarding our Audit/Compliance Committee’s financial expert and our Committees of the Board, we direct you to the section captioned “Committees of the Board” in the Proxy Statement. For information regarding our Nomination Policy, we direct you to the section captioned “Board of Directors’ Nomination Policy” in the Proxy Statement. For information regarding our Code of Conduct, we direct you to the section captioned “Code of Conduct” in the Proxy Statement. This information is incorporated herein by reference. Information regarding our executive officers is contained in the section entitled “Executive Officers of the Registrant,” in Part I of this Report.
For information regarding our Executive Compensation, we direct you to the section captioned “Executive & Director Compensation and Other Matters” in the Proxy Statement. This information is incorporated herein by reference.
This information is located in the sections captioned “Stock Ownership of Beneficial Owners and Certain Management” and “Equity Compensation Plan Information” in the Proxy Statement. This information is incorporated herein by reference.
Item 13. CERTAIN RELATIONSHIPS AND RELATED TRANSACTIONS, AND DIRECTOR INDEPENDENCE
You will find this information in the section captioned “Certain Relationships and Related Transactions” in the Proxy Statement. This information is incorporated herein by reference.
You will find this information in the subsection captioned “Principal Accountant Fees and Services” in the Proxy Statement. This information is incorporated herein by reference.
The following documents are filed as part of this Report:
1. Financial Statements. The following consolidated financial statements and related documents are filed as part of this report:
| | |
Schedule | Page |
| Report of Independent Registered Public Accounting Firm | F-1 |
| Consolidated Balance Sheets at December 31, 2006 and 2005 | F-2 |
| Consolidated Statements of Income for the Years Ended December 31, 2006, 2005 and 2004 | F-3 |
| Consolidated Statements of Shareholders’ Equity and Comprehensive Income for the Years Ended December 31, 2006, 2005 and 2004 | F-4 |
| Consolidated Statements of Cash Flows for the Years Ended December 31, 2006, 2005 and 2004 | F-5 |
| Notes to the Consolidated Financial Statements | F-6 to F-26 |
2. Financial Statement Schedule. The following financial statement schedule of Granite for the years ended December 31, 2006, 2005 and 2004 is filed as part of this report and should be read in conjunction with the consolidated financial statements of Granite.
| | |
Schedule | Page |
| Schedule II - Schedule of Valuation and Qualifying Accounts | S-1 |
Schedules not listed above have been omitted because the required information is either not material, not applicable or is shown in the consolidated financial statements or notes thereto.
3. Exhibits. The Exhibits listed in the accompanying Exhibit Index are filed or incorporated by reference as part of this report.
REPORT OF INDEPENDENT REGISTERED PUBLIC ACCOUNTING FIRM
To the Shareholders and Board of Directors of
Granite Construction Incorporated:
We have completed integrated audits of Granite Construction Incorporated’s consolidated financial statements and of its internal control over financial reporting as of December 31, 2006 in accordance with the standards of the Public Company Accounting Oversight Board (United States). Our opinions, based on our audits, are presented below.
Consolidated financial statements and financial statement schedule
In our opinion, the consolidated financial statements listed in the index appearing under Item 15(1) present fairly, in all material respects, the financial position of Granite Construction Incorporated and its subsidiaries at December 31, 2006 and 2005, and the results of their operations and their cash flows for each of the three years in the period ended December 31, 2006 in conformity with accounting principles generally accepted in the United States of America. In addition, in our opinion, the financial statement schedule listed in the index appearing under Item 15(2) presents fairly, in all material respects, the information set forth therein when read in conjunction with the related consolidated financial statements. These financial statements and financial statement schedule are the responsibility of the Company’s management. Our responsibility is to express an opinion on these financial statements and financial statement schedule based on our audits. We conducted our audits of these statements in accordance with the standards of the Public Company Accounting Oversight Board (United States). Those standards require that we plan and perform the audit to obtain reasonable assurance about whether the financial statements are free of material misstatement. An audit of financial statements includes examining, on a test basis, evidence supporting the amounts and disclosures in the financial statements, assessing the accounting principles used and significant estimates made by management, and evaluating the overall financial statement presentation. We believe that our audits provide a reasonable basis for our opinion.
Internal control over financial reporting
Also, in our opinion, management’s assessment, included in Management’s Report on Internal Control Over Financial Reporting appearing under Item 9A, that the Company maintained effective internal control over financial reporting as of December 31, 2006 based on criteria established in Internal Control - Integrated Framework issued by the Committee of Sponsoring Organizations of the Treadway Commission (“COSO”), is fairly stated, in all material respects, based on those criteria. Furthermore, in our opinion, the Company maintained, in all material respects, effective internal control over financial reporting as of December 31, 2006, based on criteria established in Internal Control - Integrated Framework issued by the COSO. The Company’s management is responsible for maintaining effective internal control over financial reporting and for its assessment of the effectiveness of internal control over financial reporting. Our responsibility is to express opinions on management’s assessment and on the effectiveness of the Company’s internal control over financial reporting based on our audit. We conducted our audit of internal control over financial reporting in accordance with the standards of the Public Company Accounting Oversight Board (United States). Those standards require that we plan and perform the audit to obtain reasonable assurance about whether effective internal control over financial reporting was maintained in all material respects. An audit of internal control over financial reporting includes obtaining an understanding of internal control over financial reporting, evaluating management’s assessment, testing and evaluating the design and operating effectiveness of internal control, and performing such other procedures as we consider necessary in the circumstances. We believe that our audit provides a reasonable basis for our opinions.
A company’s internal control over financial reporting is a process designed to provide reasonable assurance regarding the reliability of financial reporting and the preparation of financial statements for external purposes in accordance with generally accepted accounting principles. A company’s internal control over financial reporting includes those policies and procedures that (i) pertain to the maintenance of records that, in reasonable detail, accurately and fairly reflect the transactions and dispositions of the assets of the company; (ii) provide reasonable assurance that transactions are recorded as necessary to permit preparation of financial statements in accordance with generally accepted accounting principles, and that receipts and expenditures of the company are being made only in accordance with authorizations of management and directors of the company; and (iii) provide reasonable assurance regarding prevention or timely detection of unauthorized acquisition, use, or disposition of the company’s assets that could have a material effect on the financial statements.
Because of its inherent limitations, internal control over financial reporting may not prevent or detect misstatements. Also, projections of any evaluation of effectiveness to future periods are subject to the risk that controls may become inadequate because of changes in conditions, or that the degree of compliance with the policies or procedures may deteriorate.
PRICEWATERHOUSECOOPERS LLP
San Jose, California
February 26, 2007
GRANITE CONSTRUCTION INCORPORATED | |
CONSOLIDATED BALANCE SHEETS | |
(in thousands, except share and per share data) |
| December 31, | | 2006 | | 2005 | |
ASSETS |
| Current assets | | | | | | | |
| Cash and cash equivalents | | $ | 204,893 | | $ | | |
| Short-term marketable securities | | | 141,037 | | | | |
| Accounts receivable, net | | | 492,229 | | | | |
| Costs and estimated earnings in excess of billings | | | 15,797 | | | | |
| Inventories | | | 41,529 | | | | |
| Real estate held for sale | | | 55,888 | | | 46,889 | |
| Deferred income taxes | | | 36,776 | | | | |
| Equity in construction joint ventures | | | 31,912 | | | | |
| Other current assets | | | 63,144 | | | | |
| Total current assets | | | 1,083,205 | | | | |
| Property and equipment, net | | | 429,966 | | | | |
| Long-term marketable securities | | | 48,948 | | | | |
| Investments in affiliates | | | 21,471 | | | | |
| Other assets | | | 49,248 | | | | |
| Total assets | | $ | 1,632,838 | | $ | 1,472,230 | |
LIABILITIES AND SHAREHOLDERS’ EQUITY |
| Current liabilities | | | | | | | |
| Current maturities of long-term debt | | $ | 28,660 | | $ | | |
| Accounts payable | | | 257,612 | | | | |
| Billings in excess of costs and estimated earnings | | | 287,843 | | | | |
| Accrued expenses and other current liabilities | | | 189,328 | | | | |
| Total current liabilities | | | 763,443 | | | | |
| Long-term debt | | | 78,576 | | | | |
| Other long-term liabilities | | | 58,419 | | | | |
| Deferred income taxes | | | 22,324 | | | | |
| Commitments and contingencies | | | | | | | |
| Minority interest in consolidated subsidiaries | | | 15,532 | | | | |
| Shareholders’ equity | | | | | | | |
| Preferred stock, $0.01 par value, authorized 3,000,000 shares, none outstanding | | | - | | | - | |
| Common stock, $0.01 par value, authorized 150,000,000 shares in 2006 and 100,000,000 shares in 2005; issued and outstanding 41,833,559 in 2006 and 41,682,010 in 2005 | | | 418 | | | | |
| Additional paid-in capital | | | 78,620 | | | | |
| Retained earnings | | | 612,875 | | | | |
| Accumulated other comprehensive income | | | 2,631 | | | | |
| Unearned compensation | | | - | | | | ) |
| Total shareholders’ equity | | | 694,544 | | | 621,560 | |
| Total liabilities and shareholders’ equity | | $ | 1,632,838 | | $ | 1,472,230 | |
The accompanying notes are an integral part of these consolidated financial statements.
GRANITE CONSTRUCTION INCORPORATED | |
CONSOLIDATED STATEMENTS OF INCOME | |
(in thousands, except per share data) |
Years Ended December 31, | | 2006 | | 2005 | | 2004 | |
| Revenue | | | | | | | | | | |
| Construction | | $ | 2,559,445 | | $ | | | $ | | |
| Material sales | | | 410,159 | | | | | | | |
| Total revenue | | | 2,969,604 | | | | | | | |
| Cost of revenue | | | | | | | | | | |
| Construction | | | 2,360,555 | | | | | | | |
| Material sales | | | 313,329 | | | | | | | |
| Total cost of revenue | | | 2,673,884 | | | | | | | |
Gross Profit | | | 295,720 | | | | | | | |
| General and administrative expenses | | | 204,281 | | | | | | | |
| Provision for (reversal of) legal judgment | | | (4,800 | ) | | | | | - | |
| Goodwill impairment charge | | | 18,011 | | | - | | | - | |
| Gain on sales of property and equipment | | | 10,408 | | | | | | | |
Operating income | | | 88,636 | | | | | | | |
| Other income (expense) | | | | | | | | | | |
| Interest income | | | 24,112 | | | | | | | |
| Interest expense | | | (4,492 | ) | | | ) | | | ) |
| Equity in income of affiliates | | | 2,157 | | | | | | | |
| Other, net | | | 2,604 | | | | | | | |
| Total other income (expense) | | | 24,381 | | | 7,396 | | | | |
Income before provision for income taxes and minority interest | | | 113,017 | | | | | | | |
| Provision for income taxes | | | 38,678 | | | | | | | |
Income before minority interest | | | 74,339 | | | | | | | |
| Minority interest in consolidated subsidiaries | | | 6,170 | | | | ) | | | ) |
Net income | | $ | 80,509 | | $ | | | $ | | |
| | | | | | | | | | | |
Net income per share | | | | | | | | | | |
| Basic | | $ | 1.97 | | $ | | | $ | | |
| Diluted | | $ | 1.94 | | $ | | | $ | | |
| | | | | | | | | | | |
Weighted average shares of common stock | | | | | | | | | | |
| Basic | | | 40,874 | | | | | | | |
| Diluted | | | 41,471 | | | | | | | |
| | | | | | | | | | | |
Dividends per share | | $ | 0.40 | | $ | | | $ | | |
The accompanying notes are an integral part of these consolidated financial statements.
GRANITE CONSTRUCTION INCORPORATED | |
CONSOLIDATED STATEMENTS OF SHAREHOLDERS’ EQUITY AND COMPREHENSIVE INCOME | |
(in thousands, except share data) |
Years Ended December 31, 2004, 2005 and 2006 | | Outstanding Shares | | Common Stock | | Additional Paid-in Capital | | Retained Earnings | | Accumulated Other Comprehensive Income (loss) | | Unearned Compensation | | Total | |
| Balances, December 31, 2003 | | | | | $ | 415 | | $ | | | $ | | | $ | 76 | | $ | | ) | $ | | |
| Comprehensive income: | | | | | | | | | | | | | | | | | | | | | | |
| Net income | | | - | | | - | | | - | | | | | | - | | | - | | | | |
| Other comprehensive income: | | | | | | | | | | | | | | | | | | | | | | |
| Changes in net unrealized gains on investments | | | - | | | - | | | - | | | - | | | | | | - | | | | |
| Total comprehensive income | | | | | | | | | | | | | | | | | | | | | | |
| Restricted stock issued | | | | | | 2 | | | | | | - | | | - | | | | ) | | | ) |
| Amortized restricted stock | | | - | | | - | | | - | | | - | | | - | | | | | | | |
| Repurchase of common stock | | | | ) | | | ) | | | ) | | - | | | - | | | - | | | | ) |
| Cash dividends on common stock | | | - | | | - | | | - | | | | ) | | - | | | - | | | | ) |
| Common stock contributed to ESOP | | | 192,000 | | | 2 | | | 3,987 | | | - | | | - | | | - | | | 3,989 | |
| Excess tax benefit on stock-based compensation | | | - | | | - | | | 703 | | | - | | | - | | | - | | | 703 | |
| Stock options exercised and other | | | | | | - | | | | | | - | | | - | | | - | | | | |
| Balances, December 31, 2004 | | | | | | 416 | | | | | | | | | | | | | ) | | | |
| Comprehensive income: | | | | | | | | | | | | | | | | | | | | | | |
| Net income | | | - | | | - | | | - | | | | | | - | | | - | | | | |
| Other comprehensive income: | | | | | | | | | | | | | | | | | | | | | | |
| Changes in net unrealized gains on investments | | | - | | | - | | | - | | | - | | | | | | - | | | | |
| Total comprehensive income | | | | | | | | | | | | | | | | | | | | | | |
| Restricted stock issued | | | | | | | | | | | | - | | | - | | | | ) | | | ) |
| Amortized restricted stock | | | - | | | - | | | - | | | - | | | - | | | | | | | |
| Repurchase of common stock | | | | ) | | | ) | | | ) | | - | | | - | | | - | | | | ) |
| Cash dividends on common stock | | | - | | | - | | | - | | | | ) | | - | | | - | | | | ) |
| Common stock contributed to ESOP | | | | | | | | | | | | - | | | - | | | - | | | | |
| Excess tax benefit on stock-based compensation | | | - | | | - | | | 1,723 | | | - | | | - | | | - | | | 1,723 | |
| Stock options exercised and other | | | | | | - | | | | | | - | | | - | | | - | | | | |
| Balances, December 31, 2005 | | | | | | | | | | | | | | | | | | | ) | | | |
| Comprehensive income: | | | | | | | | | | | | | | | | | | | | | | |
| Net income | | | - | | | - | | | - | | | 80,509 | | | - | | | - | | | | |
| Other comprehensive income: | | | | | | | | | | | | | | | | | | | | | | |
| Changes in net unrealized gains on investments | | | - | | | - | | | - | | | - | | | 1,029 | | | - | | | | |
| Total comprehensive income | | | | | | | | | | | | | | | | | | | | | 81,538 | |
| Reclassification of unearned compensation on non-vested restricted stock balance upon adoption of SFAS 123-R | | | - | | | - | | | (10,179 | ) | | - | | | - | | | 10,179 | | | - | |
| Restricted stock issued | | | 202,730 | | | 2 | | | (2 | ) | | - | | | - | | | - | | | - | |
| Amortized restricted stock | | | - | | | - | | | 7,572 | | | - | | | - | | | - | | | 7,572 | |
| Repurchase of common stock | | | (159,285 | ) | | (2 | ) | | (7,373 | ) | | - | | | - | | | - | | | (7,375 | ) |
| Cash dividends on common stock | | | - | | | - | | | - | | | (16,735 | ) | | - | | | - | | | (16,735 | ) |
| Common stock contributed to ESOP | | | 45,300 | | | - | | | 1,995 | | | - | | | - | | | - | | | 1,995 | |
| Excess tax benefit on stock-based compensation | | | - | | | - | | | 3,390 | | | - | | | - | | | - | | | 3,390 | |
| Stock options exercised and other | | | 62,804 | | | 1 | | | 2,598 | | | - | | | - | | | - | | | 2,599 | |
| Balances, December 31, 2006 | | | 41,833,559 | | $ | 418 | | $ | 78,620 | | $ | 612,875 | | $ | 2,631 | | $ | - | | $ | 694,544 | |
The accompanying notes are an integral part of these consolidated financial statements.
GRANITE CONSTRUCTION INCORPORATED
CONSOLIDATED STATEMENTS OF CASH FLOWS
| | | | | | | | |
Years Ended December 31, | | 2006 | | 2005 | | 2004 | |
| Operating Activities | | | | | | | |
| Net income | | $ | 80,509 | | $ | | | $ | | |
| Adjustments to reconcile net income to net cash provided by operating activities: | | | | | | | | | | |
| Goodwill impairment charge | | | 18,011 | | | - | | | - | |
| Depreciation, depletion and amortization | | | 69,180 | | | | | | | |
| Gain on sales of property and equipment | | | (10,408 | ) | | | ) | | | ) |
| Change in deferred income taxes | | | (29,462 | ) | | (8,839 | ) | | | ) |
| Stock-based compensation | | | 7,572 | | | | | | | |
| Excess tax benefit on stock-based compensation | | | (3,390 | ) | | - | | | - | |
| Common stock contributed to ESOP | | | 1,995 | | | | | | | |
| Minority interest in consolidated subsidiaries | | | (6,170 | ) | | | | | | |
| Equity in income of affiliates | | | (2,157 | ) | | | ) | | | ) |
| Gain on sale of equity investment | | | | | | | ) | | | ) |
| Changes in assets and liabilities, net of the effects of acquisitions and FIN 46 consolidations: | | | | | | | | | | |
| Accounts receivable, net | | | (18,905 | ) | | | ) | | | ) |
| Inventories | | | (8,368 | ) | | | ) | | | ) |
| Real estate held for sale | | | (10,289 | ) | | (13,071 | ) | | (20,345 | ) |
| Equity in construction joint ventures | | | (4,504 | ) | | | ) | | | ) |
| Other assets | | | (10,073 | ) | | | ) | | | ) |
| Accounts payable | | | 24,805 | | | | | | | |
| Billings in excess of costs and estimated earnings, net | | | 106,823 | | | | | | | ) |
| Accrued expenses and other liabilities | | | 54,474 | | | | | | | |
| Net cash provided by operating activities | | | 259,643 | | | | | | | |
| Investing Activities | | | | | | | | | | |
| Purchases of marketable securities | | | (233,868 | ) | | | ) | | | ) |
| Maturities and sales of marketable securities | | | 153,024 | | | | | | | |
| Additions to property and equipment | | | (116,238 | ) | | | ) | | | ) |
| Proceeds from sales of property and equipment | | | 16,398 | | | | | | | |
| Proceeds from sales of equity investment | | | | | | | | | | |
| Contributions to affiliates | | | (6,982 | ) | | | ) | | | ) |
| Distributions from affiliates | | | 1,970 | | | 669 | | | 11,860 | |
| Other investing activities | | | 2,013 | | | | | | (9,219 | ) |
| Net cash used in investing activities | | | (183,683 | ) | | | ) | | | ) |
| Financing Activities | | | | | | | | | | |
| Proceeds from long-term debt | | | 56,869 | | | | | | | |
| Repayments of long-term debt | | | (92,873 | ) | | | ) | | | ) |
| Repurchase of common stock | | | (7,375 | ) | | | ) | | | ) |
| Dividends paid | | | (16,722 | ) | | | ) | | | ) |
| Contributions from minority partners | | | 6,171 | | | | | | | |
| Distributions to minority partners | | | (23,007 | ) | | | ) | | | ) |
| Excess tax benefit on stock-based compensation | | | 3,390 | | | - | | | - | |
| Stock options and other financing activities | | | 2,599 | | | | | | | |
| Net cash used in financing activities | | | (70,948 | ) | | | ) | | | ) |
| Increase in cash and cash equivalents | | $ | 5,012 | | $ | 38,254 | | $ | 21,994 | |
| Cash and cash equivalent added in FIN 46 consolidations | | | - | | | - | | | 69,714 | |
| Cash and cash equivalents at beginning of year | | | 199,881 | | | 161,627 | | | 69,919 | |
| Cash and cash equivalents at end of year | | $ | 204,893 | | $ | 199,881 | | $ | 161,627 | |
| Supplementary Information | | | | | | | | | | |
| Cash paid during the period for: | | | | | | | | | | |
| Interest | | $ | 5,009 | | $ | | | $ | | |
| Income taxes | | | 79,511 | | | | | | | |
| Non-cash investing and financing activity: | | | | | | | | | | |
| Restricted stock issued for services, net | | $ | 9,774 | | $ | | | $ | | |
| Dividends accrued but not paid | | | 4,184 | | | | | | | |
| Financed acquisition of assets | | | 5,335 | | | | | | | |
| Notes received from sale of assets | | | - | | | - | | | | |
| Debt repayments from sale of assets | | | 13,398 | | | - | | | - | |
| | | | | | | | | | | |
| The accompanying notes are an integral part of these consolidated financial statements. |
GRANITE CONSTRUCTION INCORPORATED
NOTES TO THE CONSOLIDATED FINANCIAL STATEMENTS
1. Summary of Significant Accounting Policies
Description of Business: Granite Construction Incorporated is a heavy civil contractor and a construction materials producer. We are engaged in the construction of highways, dams, airport infrastructure, mass transit facilities, real estate site development and other infrastructure related projects with offices in Alaska, Arizona, California, Florida, Minnesota, Nevada, New York, Oregon, Texas, Utah and Washington. Unless otherwise indicated, the terms “we,” “us,” “our,” and “Granite” refer to Granite Construction Incorporated and its consolidated subsidiaries.
Principles of Consolidation: The consolidated financial statements include the accounts of Granite Construction Incorporated and its wholly owned and majority owned subsidiaries. All material inter-company transactions and accounts have been eliminated. We use the equity method of accounting for affiliated companies where we have the ability to exercise significant influence, but not control. Additionally, we participate in joint ventures with other construction companies. We have consolidated these joint ventures where we have determined that through our participation in these joint ventures we have a variable interest and are the primary beneficiary as defined by Financial Accounting Standards Board Interpretation No. 46 (revised December 2003) “Consolidation of Variable Interest Entities,” (“FIN 46”). Where we have determined we are not the primary beneficiary we account for our share of the operations of jointly controlled construction joint ventures on a pro rata basis in the consolidated statements of income and as a single line item in the consolidated balance sheets in accordance with Emerging Issues Task Force Issue 00-01, “Investor Balance Sheet and Income Statement Display under the Equity Method for Investments in Certain Partnerships and Other Ventures.”
Use of Estimates in the Preparation of Financial Statements: The preparation of financial statements in conformity with accounting principles generally accepted in the United States of America requires management to make estimates and assumptions that affect the reported amounts of assets and liabilities and disclosure of contingent assets and liabilities at the date of the financial statements and the reported amounts of revenues and expenses during the reporting period. Actual results could differ from those estimates.
Revenue Recognition: We use the percentage of completion accounting method for construction contracts in accordance with the American Institute of Certified Public Accountants Statement of Position 81-1, “Accounting for Performance of Construction-Type and Certain Production-Type Contracts.” Revenue and earnings on construction contracts, including construction joint ventures, are recognized on the percentage of completion method in the ratio of costs incurred to estimated final costs. Revenue in an amount equal to cost incurred is recognized prior to contracts reaching 25% completion. The related profit is deferred until the period in which such percentage completion is attained. It is our judgment that until a project reaches 25% completion, there is insufficient information to determine what the estimated profit on the project will be with a reasonable level of assurance. Additionally, as a result of experience gained on past design/build projects, we now evaluate each design/build project individually to determine whether it is appropriate to begin profit recognition at 25% completion or at a later point. The factors considered in this evaluation of risk associated with each design/build project include the stage of design completion, the stage of construction completion, status of outstanding purchase orders and subcontracts, certainty of quantities, certainty of schedule and the relationship with the owner.
Revenue from contract claims is recognized when we have a signed settlement agreement and payment is assured. Revenue from contract change orders, which occur in most large projects, is recognized when the owner has agreed to the change order in writing. During 2006 we settled various contract issues for which the associated cost was included in prior periods (see Note 2). Provisions are recognized in the statement of income for the full amount of estimated losses on uncompleted contracts whenever evidence indicates that the estimated total cost of a contract exceeds its estimated total revenue. Contract cost consists of direct costs on contracts, including labor and materials, amounts payable to subcontractors, direct overhead costs and equipment expense (primarily depreciation, fuel, maintenance and repairs). Depreciation is provided using accelerated methods for construction equipment. Contract cost is recorded as incurred and revisions in contract revenue and cost estimates are reflected when known. The completion threshold for the start of contract profit recognition is applied to all percentage of completion projects unless and until we project a loss on the project, in which case the estimated loss is immediately recognized.
Revenue from the sale of materials is recognized when delivery occurs and risk of ownership passes to the customer.
GRANITE CONSTRUCTION INCORPORATED
NOTES TO THE CONSOLIDATED FINANCIAL STATEMENTS - (Continued)
Real Estate Transactions: In recognizing revenue from real estate transactions, we follow the provisions in Statement of Financial Accounting Standards No. 66, “Accounting for Sales of Real Estate” (“SFAS 66”). The specific timing of a sale is measured against various criteria in SFAS 66 related to the terms of the transaction and any continuing involvement in the form of management or financial assistance associated with the property. If the sales criteria are not met, we defer recognition and account for the continued operations of the property by applying the deposit, finance, installment or cost recovery methods, as appropriate. When a sale occurs within one of our real estate developments and we have not completed all infrastructure development related to the total project, we follow SFAS 66 and Statement of Financials Accounting Standards No. 67, “Accounting for Costs and Initial Rental Operations of Real Estate Projects,” to determine the appropriate cost of sales and the timing of recognition of the sale. In the calculation of cost of sales, we use estimates and forecasts to determine total costs at completion of the development project.
Balance Sheet Classifications: We include in current assets and liabilities amounts receivable and payable under construction contracts (principally retentions) that may extend beyond one year. Additionally, we include the cost of property purchased for development and sale in current assets. A one-year time period is used as the basis for classifying all other current assets and liabilities.
Cash and Cash Equivalents: Cash equivalents are securities having maturities of three months or less from the date of purchase.
Marketable Securities: We determine the classification of our marketable securities at the time of purchase and reevaluate these determinations at each balance sheet date. Debt securities are classified as held-to-maturity when we have the positive intent and ability to hold the securities to maturity. Held-to-maturity investments are stated at amortized cost. Debt securities for which we do not have the positive intent or ability to hold to maturity are classified as available-for-sale, along with any investments in equity securities. Securities available-for-sale are carried at fair value with the unrealized gains and losses, net of income taxes, reported as a separate component of other comprehensive income until realized. We have no investments that qualify as trading.
The amortized cost of debt securities is adjusted for amortization of premiums and accretion of discounts to maturity, which is included in interest income. Realized gains and losses are included in other income, net. The cost of securities sold is based on the specific identification method.
Financial Instruments: The carrying value of marketable securities approximates their fair value as determined by market quotes. Rates currently available to us for debt with similar terms and remaining maturities are used to estimate the fair value of existing debt. The carrying value of receivables and other amounts arising out of normal contract activities, including retentions, which may be settled beyond one year, is estimated to approximate fair value.
Concentrations: We maintain the majority of cash balances and all of our marketable securities with several financial institutions. We invest with high credit quality financial institutions and, by policy, limit the amount of credit exposure to any financial institution. A significant portion of our labor force is subject to collective bargaining agreements. Collective bargaining agreements covering approximately 20.0% of our labor force at December 31, 2006 will expire during 2007.
Revenue earned by both the Branch Division and the Heavy Construction Division from federal, state and local government agencies amounted to $2,026.0 million (68.2%) in 2006, $1,808.0 million (68.5%) in 2005 and $1,553.1 million (72.7%) in 2004. Revenue from the California Department of Transportation represented $245.2 million (8.3%) in 2006, $127.1 million (4.8%) in 2005 and $134.5 million (6.3%) in 2004. At December 31, 2006 and 2005, we had significant amounts receivable from these agencies. We perform ongoing credit evaluations of our customers and generally do not require collateral, although the law provides us the ability to file mechanics’ liens on real property improved for private customers in the event of non-payment by such customers. We maintain an allowance for potential credit losses and such losses have been within management’s expectations. We have no foreign operations.
GRANITE CONSTRUCTION INCORPORATEDNOTES TO THE CONSOLIDATED FINANCIAL STATEMENTS - (Continued)
Inventories: Inventories consist primarily of quarry products valued at the lower of average cost or market.
Property and Equipment: Property and equipment are stated at cost. Depreciation for construction and other equipment is primarily provided using accelerated methods over lives ranging from three to ten years and the straight-line method over lives from three to twenty years for the remaining depreciable assets. We believe that accelerated methods best approximate the service provided by the construction and other equipment. Depletion of quarry property is based on the usage of depletable reserves. We frequently sell property and equipment that has reached the end of its useful life or no longer meets our needs, including depleted quarry property. Such property is held in property and equipment until sold. The cost and accumulated depreciation or depletion of property sold or retired is removed from the accounts and gains or losses, if any, are reflected in earnings for the period. We capitalized interest costs related to certain self-constructed assets of $4.8 million in 2006, $3.3 million in 2005 and $1.9 million in 2004. Maintenance and repairs are charged to operations as incurred.
Long-Lived Assets: Long-lived assets held and used by us are reviewed for impairment whenever events or changes in circumstances indicate that the carrying amount of an asset may not be recoverable. An impairment loss is recorded when the asset’s carrying value exceeds its estimated undiscounted future cash flows.
We perform goodwill impairment tests annually during our fourth quarter and more frequently when events and circumstances occur that indicate a possible impairment of goodwill. In determining whether there is an impairment of goodwill, we calculate the estimated fair value of the reporting unit in which the goodwill is recorded using a discounted future cash flow method. We then compare the resulting fair value to the net book value of the reporting unit, including goodwill. If the net book value of a reporting unit exceeds its fair value, we measure the amount of the impairment loss by comparing the implied fair value of the reporting unit’s goodwill with the carrying amount of that goodwill. To the extent that the carrying amount of a reporting unit’s goodwill exceeds its implied fair value, we recognize a goodwill impairment loss. We performed our annual impairment test in 2006 and we determined that goodwill associated with one of our reporting units in the amount of $18.0 million was impaired. See Note 8 for additional information about this impairment charge.
Other intangible assets include covenants not to compete, permits and trade name which are being amortized on a straight-line basis over terms from two to fifteen years.
Reclamation Costs: We account for the costs related to legal obligations to reclaim aggregate mining sites and other facilities in accordance with Statement of Financial Accounting Standards No. 143, “Accounting for Asset Retirement Obligations” (“SFAS 143”). Accordingly, we record our estimated reclamation liability when incurred, capitalize the estimated liability as part of the related asset’s carrying amount and allocate it to expense over the asset’s useful life.
Warranties: Many of our construction contracts contain warranty provisions covering defects in equipment, materials, design or workmanship that generally run from six months to one year after our customer accepts the project. Because of the nature of our projects, including contract owner inspections of the work both during construction and prior to acceptance, we have not experienced material warranty costs for these short-term warranties and therefore, do not believe an accrual for these costs is necessary. Certain construction contracts carry longer warranty periods, ranging from two to ten years for which we have accrued an estimate of warranty cost. The warranty cost is estimated based on our experience with the type of work and any known risks relative to the project and was not material at December 31, 2006 or December 31, 2005.
Accrued Insurance Costs: We carry insurance policies to cover various risks, primarily general liability and workers compensation, under which we are liable to reimburse the insurance company for a portion of each claim paid. The amounts that we are liable for generally range from the first $250,000 to $1.0 million per occurrence. We accrue for the estimated ultimate liability for incurred losses, both reported and unreported, using actuarial methods based on historic trends modified, if necessary, by recent events.
GRANITE CONSTRUCTION INCORPORATED NOTES TO THE CONSOLIDATED FINANCIAL STATEMENTS - (Continued)
Stock-Based Compensation: As more fully described in Note 12, we provide certain stock-based compensation under our Amended and Restated 1999 Equity Incentive Plan (the “Plan”). Prior to January 1, 2006, we accounted for stock-based compensation under Statement of Financial Accounting Standard No. 123. Effective January 1, 2006, we adopted FASB Statement No. 123 (revised 2004), “Share-Based Payment” (“SFAS 123-R”) and Securities and Exchange Commission Staff Accounting Bulletin No. 107 (“SAB 107”) using the modified prospective transition method.
Income Taxes: Deferred taxes are provided on a liability method whereby deferred tax assets are recognized for deductible temporary differences and operating loss carry-forwards and deferred tax liabilities are recognized for taxable temporary differences. Temporary differences are the differences between the reported amounts of assets and liabilities and their tax bases. Deferred tax assets are reduced by a valuation allowance when, in the opinion of management, it is more likely than not that some portion or all of the deferred tax assets will not be realized. Deferred tax assets and liabilities are adjusted for the effects of changes in tax laws and rates on the date of enactment.
Computation of Earnings Per Share: Basic earnings per share is computed by dividing income available to common shareholders by the weighted average number of common shares outstanding, excluding restricted common stock. Diluted earnings per share is computed giving effect to all dilutive potential common shares that were outstanding during the period. Dilutive potential common shares consist of the incremental common shares issuable upon the exercise of stock options and upon the vesting of restricted common stock.
Reclassifications: Certain financial statement items have been reclassified to conform to the current year’s format. These reclassifications had no impact on previously reported net income, financial position or cash flows.
Recent Accounting Pronouncements: In July 2006, the Financial Accounting Standards Board (“FASB”) issued Interpretation No. 48, “Accounting for Uncertainty in Income Taxes - an Interpretation of FASB Statement 109” (“FIN 48”). FIN 48 prescribes a comprehensive model for recognizing, measuring, presenting and disclosing in the financial statements tax positions taken or expected to be taken on a tax return, including a decision whether to file or not to file in a particular jurisdiction. FIN 48 is effective for fiscal years beginning after December 15, 2006. While we do not believe this will have a material effect, we have not yet completed our evaluation of the impact of implementing FIN 48 on our consolidated financial statements.In September 2006, the Securities and Exchange Commission (“SEC”) issued Staff Accounting Bulletin No. 108 (“SAB 108”). Due to diversity in practice among registrants, SAB 108 expresses SEC staff views regarding the process by which misstatements in financial statements are evaluated. SAB 108 is effective for fiscal years ending after November 15, 2006 and its adoption did not have an effect on our financial position, results of operation or cash flows. However, primarily in connection with our evaluation of SAB 108, we recorded an adjustment of approximately $6.4 million during the fourth quarter 2006 which we determined was immaterial. The adjustment principally related to a reduction of accrued insurance liabilities from periods prior to 2002, the majority of which reduced cost of revenue.
In September 2006, the FASB issued Statement of Financial Accounting Standard No. 157, “Fair Value Measurements” (“SFAS 157”). SFAS 157 defines fair value, establishes a framework for measuring fair value and expands disclosures about fair value measurements, but does not change existing guidance as to whether or not an instrument is carried at fair value. SFAS 157 is effective for fiscal years beginning after November 15, 2007. We are currently evaluating the impact of implementing SFAS 157 on our consolidated financial statements.
In February 2007, the FASB issued Statement of Financial Accounting Standard No. 159, “The Fair Value Option for Financial Assets and Financial Liabilities” (“SFAS 159”). SFAS 159 permits entities to choose to measure many financial instruments and certain other items at fair value. Unrealized gains and losses on items for which the fair value option has been elected are reported in earnings. SFAS 159 is effective for fiscal years beginning after November 15, 2007. We are currently evaluating the impact of implementing SFAS 159 on our consolidated financial statements.
GRANITE CONSTRUCTION INCORPORATED
NOTES TO THE CONSOLIDATED FINANCIAL STATEMENTS - (Continued)
2. Change in Accounting Estimate
Our gross profit in the years ended December 31, 2006 and 2005 include the effects of significant changes in the estimates of the profitability of certain of our Heavy Construction Division (“HCD”) projects. The net effect of these estimate changes decreased gross profit in each period. The following table presents the changes in HCD accounting estimates for the years ended December 31, 2006, 2005 and 2004 (dollars in millions):
| | | | | | | | |
Years Ended December 31, | | 2006 | | 2005 | | 2004 | |
| Reduction in gross profit from projects with downward estimate changes | | $ | (175.0 | ) | $ | (62.0 | ) | $ | (51.0 | ) |
| Increase in gross profit from projects with upward estimate changes | | | 30.0 | | | | | | | |
| Net reduction in gross profit | | $ | (145.0 | ) | $ | | ) | $ | | ) |
| Number of projects with significant downward estimate changes* | | | 19 | | | | | | | |
| Range of reduction to gross profit from each project** | | $ | 1.0 - 49.0 | | $ | | | $ | | |
| Number of projects with significant upward estimate changes* | | | 9 | | | | | | | |
| Range of increase to gross profit from each project** | | $ | 1.0 - 7.0 | | $ | | | $ | | |
* Significant is defined as a change with a net gross margin impact of $1.0 million or greater. ** The reduction in gross profit from each project is net of any increase in the respective periods. The increase in gross profit from each project is net of any reduction in the respective periods. |
The downward adjustments in estimated project profitability were made in response to unanticipated changes in project conditions occurring during the periods when recorded and were due to a variety of factors, including changes in productivity and quantity estimates based on experience gained in the period, site conditions that differed materially from our expectations, design issues on design/build projects, issues related to subcontractors, costs associated with owner directed scope changes and owner delays, changes in cost expectations in response to market factors for labor and certain materials and liquidated damages.
GRANITE CONSTRUCTION INCORPORATED
NOTES TO THE CONSOLIDATED FINANCIAL STATEMENTS - (Continued)
The following table presents additional information about the nineteen projects with significant downward estimate changes in 2006 (dollars in millions):
| | | | | | | | | | | | |
| | | Number of Projects | | Total Contract Value | | 2006 Gross Profit Reduction Impact | | HCD Backlog at December 31, 2006 | | Percent of Total HCD Backlog at December 31, 2006 | |
| Projects either complete or greater than 90% complete with gross profit impact less than $20.0 million | | | 9 | | $ | 556.0 | | $ | 18.0 | | $ | 13.0 | | | 0.9 | |
| Projects between 65% and 90% complete with gross profit impact less than $20.0 million | | | 6 | | | 787.0 | | | 69.0 | | | 164.0 | | | 11.3 | |
| Projects between 25% and 55% complete with gross profit impact less than $20.0 million | | | 2 | | | 123.0 | | | 13.0 | | | 71.0 | | | 4.9 | |
| Highway project in Oregon - 29% complete | | | 1 | | | 130.0 | | | 22.0 | | | 83.0 | | | 5.7 | |
| Highway project in California - 87% complete | | | 1 | | | 447.0 | | | 49.0 | | | 57.0 | | | 4.0 | |
| Total for projects with significant downward changes | | | 19 | | $ | 2,043.0 | | $ | 171.0 | | $ | 388.0 | | | 26.8 | |
| All other projects with backlog greater than $5.0 million with no significant downward changes | | | 13 | | | | | | | | $ | 1,042.00 | | | 71.9 | |
The highway project in Oregon was awarded in 2005 and involves construction of at least eight new structures over creeks, rivers and a railroad and also includes construction of retaining walls, culverts and drainage improvements. In our work to date on this project we have encountered a number of issues, the most significant of which are related to the discovery of geotechnical issues (landslide activity) in an unexpectedly high number of areas and a significant delay in being provided a necessary right-of-way. There is a significant degree of uncertainty associated with the geotechnical issues. This uncertainty relates to difficulty in the identification of all areas of potential landslide activity and the associated design and cost impacts. We believe that these unexpected geotechnical issues represent a differing site condition that is compensable under our contract. However, the resolution of the amount and timing of any additional compensation is uncertain. We have forecasted the cost to complete this project using all of the information available to us and the project is currently forecasted at a loss of approximately $20.0 million. It is reasonably possible that our cost estimate will increase as more information, especially concerning the geotechnical issues, becomes available. We also believe that we are entitled to and will receive additional revenue for any work that is out of the contract scope. However, we will not recognize that revenue in our forecast until we have a signed change order, which could occur after we recognize any additional costs associated with this issue.
The highway project in California has been impacted by significant increased costs from lost productivity due to the accelerated schedule for completion of the project as well as extended overhead and other costs related to scope growth. We are pursuing additional compensation from the project owner for some of these additional costs, but the amount and timing of any future recovery is highly uncertain.
We recorded minority interest related to these estimate changes of approximately $24.0 million, $3.4 million and $2.9 million for years ended December 31, 2006, 2005 and 2004 respectively. Four of our joint venture projects are currently forecasted at a loss and will require additional capital contributions from our minority partners if the forecasts do not improve. Our joint venture agreements require that such capital contributions be made if needed. Based on our most recent assessment of our partners’ financial condition, we currently believe that two of our partners do not have the ability to contribute all of the additional capital that will be needed if the project forecasts do not improve. During the fourth quarter of 2006, we received updated financial information that caused concerns about these partners’ liquidity. Included in the net minority interest benefit for the year ended December 31, 2006 is expense related to these potentially uncollectible partner balances of approximately $9.4 million. The remaining minority interest balance related to these loss projects of $14.8 million at December 31, 2006 has been included in other long-term assets in our consolidated balance sheet.
When there are contract forecast changes having the significance of those we experienced in the year ended December 31, 2006, we undergo a process that includes reviewing the nature of the changes to ensure that there are no material amounts that should have been recorded in a prior period rather than as a change in estimate. In our review of the changes for 2006, we did not identify any material amounts that should have been recorded in a prior period.
GRANITE CONSTRUCTION INCORPORATED
NOTES TO THE CONSOLIDATED FINANCIAL STATEMENTS - (Continued)
We believe we are entitled to additional compensation related to some of our downward estimate changes and are actively pursuing these issues with the contract owners, but the amount and timing of any future recovery is highly uncertain. While we recognize the impact of estimated costs immediately when known, under our accounting policies we do not recognize revenue from contract changes until we have a signed change order or executed claim settlement. We believe that our current estimates of the gross profit are achievable. However, it is possible that the actual cost to complete will vary from our current estimate and any future estimate changes could be significant.
Additionally, our gross profit in the year ended December 31, 2006 includes the effects of changes in the estimates of the profitability of certain of our Branch Division projects. The net impact of these estimate changes was an increase of approximately $3.8 million in gross profit due primarily to the settlement of outstanding issues on two projects with no associated cost, partially offset by additional estimated costs on several other projects. The net impact of these estimate changes for 2005 was a decrease of approximately $2.5 million in gross profit due primarily to unanticipated costs related to quality issues in work originally performed by a subcontractor on one project and changes in site conditions from our original expectations on a second project.
3. Marketable Securities
The carrying amounts of marketable securities were as follows at December 31, 2006 and 2005 (in thousands):
| | | | | | | | |
| | | Held-to-Maturity | | Available-for-Sale | | Total | |
| | | 2006 | | 2005 | | 2006 | | 2005 | | 2006 | | 2005 | |
| Securities classified as current: | | | | | | | | | | | | | |
| U.S. Government and agency obligations | | $ | 34,529 | | $ | | | $ | - | | $ | - | | $ | 34,529 | | $ | | |
| Commercial paper | | | 58,493 | | | | | | - | | | - | | | 58,493 | | | | |
| Municipal bonds | | | 15,037 | | | | | | - | | | - | | | 15,037 | | | | |
| Mutual funds | | | - | | | - | | | 32,978 | | | 26,026 | | | 32,978 | | | 26,026 | |
| Total current marketable securities | | | 108,059 | | | 42,514 | | | 32,978 | | | | | | 141,037 | | | | |
| Securities classified as long-term: | | | | | | | | | | | | | | | | | | | |
| U.S. Government and agency obligations | | | 37,315 | | | | | | - | | | - | | | 37,315 | | | | |
| Municipal bonds | | | 11,633 | | | | | | - | | | - | | | 11,633 | | | | |
| Total long-term marketable securities | | | 48,948 | | | 32,960 | | | - | | | - | | | 48,948 | | | | |
| Total marketable securities | | $ | 157,007 | | $ | | | $ | 32,978 | | $ | | | $ | 189,985 | | $ | | |
Held-to-maturity investments are carried at amortized cost, which approximates fair value. Unrealized holding gains and losses for all debt securities were insignificant for the years ended December 31, 2006 and 2005. We recognized unrealized holding gains of $1,710 ($1,029 after tax), $172 ($127 after tax) and $2,304 ($1,399 after tax) related to our available-for-sale investment in mutual funds as a component of the other comprehensive income for the years ended December 31, 2006, 2005 and 2004, respectively. At December 31, 2006 and 2005, none of our investments in our mutual fund portfolio were in an unrealized loss position.
At December 31, 2006, scheduled maturities of held-to-maturity investments were as follows (in thousands):
| | | | | |
| Within one year | | $ | 108,059 | |
| After one year through five years | | | 48,948 | |
| Total | | $ | 157,007 | |
GRANITE CONSTRUCTION INCORPORATED NOTES TO THE CONSOLIDATED FINANCIAL STATEMENTS - (Continued)
For the years ended December 31, 2006 and 2005, changes in our marketable securities were as follows (in thousands):
| | | | | | |
| | | 2006 | | 2005 | |
| | | Held-to-Maturity | | Available-for-Sale | | Total | | Held-to-Maturity | | Available-for-Sale | | Total | |
| Purchases | | $ | 228,626 | | $ | 5,242 | | $ | 233,868 | | $ | | | $ | | | $ | | |
| Maturities and sales | | | (153,024 | ) | | | | | (153,024 | ) | | | ) | | | ) | | | ) |
| Amortization and other | | | 5,931 | | | - | | | 5,931 | | | | | | - | | | | |
| Unrealized gains | | | - | | | 1,710 | | | 1,710 | | | - | | | | | | | |
| Net Change | | $ | 81,533 | | $ | 6,952 | | $ | 88,485 | | $ | | ) | $ | | | $ | | ) |
4. Accounts Receivable (in thousands)
| | | | |
December 31, | | 2006 | | 2005 | |
| Construction contracts: | | | | | | | |
| Completed and in progress | | $ | 231,226 | | $ | | |
| Retentions | | | 191,613 | | | | |
| Total construction contracts | | | 422,839 | | | | |
| Construction material sales | | | 47,082 | | | | |
| Other | | | 24,735 | | | | |
| Total gross accounts receivable | | | 494,656 | | | | |
| Less: allowance for doubtful accounts | | | (2,427 | ) | | | ) |
| Total net accounts receivable | | $ | 492,229 | | $ | | |
Accounts receivable includes amounts billed and billable for public and private contracts and do not bear interest. The balances billed but not paid by customers pursuant to retainage provisions in construction contracts generally become due upon completion of the contracts and acceptance by the owners. Retainage amounts of $191.6 million at December 31, 2006 are expected to be collected as follows: $173.5 million in 2007, $14.1 million in 2008, $0.8 million in 2009, $0.6 million in 2010 and $2.6 million in 2011.
5. Construction Joint Ventures
We participate in various construction joint venture partnerships. Generally, each construction joint venture is formed to accomplish a specific project and is jointly controlled by the joint venture partners. The joint venture agreements typically provide that our interests in any profits and assets, and our respective share in any losses and liabilities that may result from the performance of the contract is limited to our stated percentage interest in the project. Although the venture’s contract with the project owner typically requires joint and several liability, our agreements with our joint venture partners provide that each partner will assume and pay its full proportionate share of any losses resulting from a project. We have no significant commitments beyond completion of the contract.
We have determined that certain of these joint ventures are variable interest entities as defined by FIN 46. Accordingly, we have consolidated those joint ventures where we have determined that we are the primary beneficiary on a prospective basis beginning January 1, 2004. The joint ventures we have consolidated are engaged in 13 active construction projects with total contract values ranging from $14.6 million to $447.2 million. Our proportionate share of the consolidated joint ventures ranges from 52.0% to 79.0%.
Consistent with Emerging Issues Task Force Issue 00-01, “Investor Balance Sheet and Income Statement Display under the Equity Method for Investments in Certain Partnerships and Other Ventures,” we account for our share of the operations of construction joint ventures in which we have determined we are not the primary beneficiary on a pro rata basis in the consolidated statements of income and as a single line item in the consolidated balance sheets. The joint ventures in which we hold a significant interest but are not the primary beneficiary are engaged in 8 active construction projects with total contract values ranging from $2.2 million to $347.9 million. Our proportionate share of equity in these joint ventures ranges from 20% to 40%, the most significant of which includes a 40% share and a 20% share, respectively, of two rapid transit projects in New York.
GRANITE CONSTRUCTION INCORPORATED NOTES TO THE CONSOLIDATED FINANCIAL STATEMENTS - (Continued)
We also participate in various “line item” joint venture agreements under which each partner is responsible for performing certain discrete items of the total scope of contracted work. The revenue for these discrete items is defined in the contract with the project owner and each venture partner bears the profitability risk associated with its own work. All partners in a line item joint venture are jointly and severally liable for the completion of the total project under the terms of the contract with the project owner. There is not a single set of books and records for a line item joint venture. Each partner accounts for its items of work individually as it would for any self-performed contract. We account for our portion of these contracts as project revenues and costs in our accounting system and include receivables and payables associated with our work in our consolidated financial statements.
The combined assets, liabilities and net assets of unconsolidated joint ventures in which we have determined we are not the primary beneficiary are as follows (in thousands):
| | | | |
December 31, | | 2006 | | 2005 | |
| Assets: | | | | | | | |
| Total | | $ | 158,178 | | $ | | |
Less other partners’ interest | | | 103,723 | | | | |
| Company’s interest | | | 54,455 | | | | |
| Liabilities: | | | | | | | |
| Total | | | 79,183 | | | | |
Less other partners’ interest | | | 56,640 | | | | |
| Company’s interest | | | 22,543 | | | | |
| Company’s interest in net assets | | $ | 31,912 | | $ | | |
The revenue and costs of revenue of unconsolidated joint ventures in which we have determined we are not the primary beneficiary are as follows (in thousands):
| | | | |
December 31, | | 2006 | | 2005 | | 2004 | |
| Revenue: | | | | | | | | | | |
| Total | | $ | 349,945 | | $ | | | $ | | |
Less other partners’ interest | | | 239,045 | | | | | | | |
| Company’s interest | | | 110,900 | | | | | | | |
| Cost of revenue: | | | | | | | | | | |
| Total | | | 281,622 | | | | | | | |
Less other partners’ interest | | | 192,802 | | | | | | | |
| Company’s interest | | | 88,820 | | | | | | | |
| Company’s interest in gross profit | | $ | 22,080 | | $ | | | $ | | |
6. Real Estate Partnerships and Investment in Affiliates
We participate in real estate partnerships. Generally, each partnership is formed to accomplish a specific real estate development project. We have determined that certain of these partnerships are variable interest entities as defined by FIN 46. Accordingly, we have consolidated those partnerships where we have determined that we are the primary beneficiary. At December 31, 2006, the partnerships we have consolidated were engaged in development projects with total assets ranging from approximately $0.2 million to $23.3 million. At December 31, 2006, approximately $55.9 million was classified as real estate held for sale on our consolidated balance sheet and of that balance approximately $53.4 million was pledged as collateral for the obligations of consolidated real estate partnerships. Our proportionate share of the results of these partnerships varies depending on the ultimate profitability of the partnerships.
GRANITE CONSTRUCTION INCORPORATED NOTES TO THE CONSOLIDATED FINANCIAL STATEMENTS - (Continued)
We account for our share of the operations of real estate partnerships in which we have determined we are not the primary beneficiary using the equity method. Additionally we have other investments in affiliates that are accounted for using the equity method. The most significant of these investments are a 50% interest in a limited liability company which owns and operates an asphalt terminal in Nevada, a 48% interest in a limited liability company which develops land in Oregon, and a 42% interest in a limited partnership which develops land in Texas. We have made advances to the asphalt terminal limited liability company of which $5.5 million remained outstanding at December 31, 2006.
At December 31, 2006, we held a minority interest in T.I.C. Holdings, Inc. (“TIC”) which we account for under the cost method of accounting. In December 2004, TIC repurchased 0.3 million shares of the TIC shares held by us for a cash payment of $7.5 million. The transaction reduced our interest in TIC to approximately 6% and resulted in a gain of $3.3 million, which was included in other income (expense) for the year ended December 31, 2004.
Our investments in affiliates comprised (in thousands):
| | | | | | |
December 31, | | 2006 | | 2005 | |
| Equity method investments in affiliates | | $ | 17,298 | | $ | | |
| Cost method investment in TIC | | | 4,173 | | | | |
| Total investments in affiliates | | $ | 21,471 | | $ | | |
The following table provides summarized combined financial information on a combined 100% basis for our affiliates accounted for under the equity method (in thousands):
| | | | | | |
December 31, | | 2006 | | 2005 | |
| Balance sheet data: | | | | | |
| Current assets | | $ | 20,279 | | $ | 16,868 | |
| Long-term assets | | | 107,562 | | | 94,371 | |
| Total assets | | | 127,841 | | | 111,239 | |
| Current liabilities | | | 17,433 | | | 5,827 | |
| Long-term liabilities | | | 73,208 | | | 73,846 | |
| Total liabilities | | | 90,641 | | | 79,673 | |
| Net assets | | $ | 37,200 | | $ | 31,566 | |
| Company’s interest in affiliates’ net assets | | $ | 17,298 | | $ | 11,680 | |
| | | | | | | |
Years Ended December 31, | | 2006 | | 2005 | | 2004 | |
| Earnings data: | | | | | | | | | | |
| Revenue | | $ | 50,353 | | $ | 30,732 | | $ | 138,222 | |
| Gross profit | | | 9,580 | | | 8,616 | | | 73,828 | |
| Earnings before taxes | | | 3,158 | | | 2,170 | | | 60,301 | |
| Net income | | | 3,158 | | | 2,170 | | | 60,301 | |
| Company’s interest in affiliates’ net income | | | 2,157 | | | 1,497 | | | 6,162 | |
7. Property and Equipment (in thousands)
| | | | |
December 31, | | 2006 | | 2005 | |
| Land | | $ | 56,797 | | $ | | |
| Quarry property | | | 112,654 | | | | |
| Buildings and leasehold improvements | | | 72,975 | | | | |
| Equipment and vehicles | | | 804,370 | | | | |
| Office furniture and equipment | | | 26,006 | | | | |
| Gross property and equipment | | | 1,072,802 | | | | |
| Less accumulated depreciation and depletion | | | 642,836 | | | | |
| Net property and equipment | | $ | 429,966 | | $ | | |
GRANITE CONSTRUCTION INCORPORATED NOTES TO THE CONSOLIDATED FINANCIAL STATEMENTS - (Continued)
Depreciation and depletion expense for the years ended December 31, 2006, 2005 and 2004 was $70.7 million, $65.1 million and $61.0 million, respectively. We have recorded liabilities associated with our legally required obligations to reclaim owned and leased quarry property and related facilities in accordance with SFAS 143. The following is a reconciliation of these asset retirement obligations which are primarily included in other long-term liabilities on our consolidated balance sheet (in thousands):
| | | | |
December 31, | | 2006 | | 2005 | |
| Beginning balance | | $ | 11,901 | | $ | | |
| Liabilities incurred and revisions to estimates | | | 216 | | | | |
| Liabilities settled | | | (18 | ) | | | ) |
| Accretion | | | 581 | | | | |
| Ending balance | | $ | 12,680 | | $ | | |
8. Intangible Assets
The following table indicates the allocation of goodwill by reportable segment which is included in other assets on our consolidated balance sheets (in thousands):
| | | | | | |
December 31, | | 2006 | | 2005 | |
| Goodwill by segment: | | | | | | | |
| Heavy Construction Division | | $ | - | | $ | | |
| Branch Division | | | 9,900 | | | | |
| Total goodwill | | $ | 9,900 | | $ | | |
We perform goodwill impairment tests in accordance with Financial Accounting Standard No. 142, “Goodwill and Other Intangible Assets” on an annual basis at the end of the fourth quarter and more frequently when events and circumstances occur that indicate a possible impairment of goodwill. In determining whether there is an impairment of goodwill, we calculate the estimated fair value of the reporting unit in which the goodwill is recorded using a discounted future cash flow method. We then compare the resulting fair value to the net book value of the reporting unit, including goodwill (Step One). If the net book value of a reporting unit exceeds its fair value, we would measure the amount of the impairment loss by comparing the implied fair value of the reporting unit’s goodwill with the carrying amount of that goodwill (Step Two). To the extent that the carrying amount of a reporting unit’s goodwill exceeds its implied fair value, we recognize a goodwill impairment loss.
During the fourth quarter of 2006, a goodwill impairment charge of $18.0 million was recorded in the HCD segment associated with our New York based Granite Northeast (“GNE”) reporting unit. This impairment conclusion was reached due to continuing losses at GNE, including significant unexpected losses in the quarter ended December 31, 2006 which have caused us to re-evaluate our strategy in New York. We continue to believe that the New York market will present opportunities for us to build profitable work. However, in order to return to profitability we believe it is necessary to reduce the number of ongoing GNE projects so that we can devote the resources necessary to successfully manage and execute the work. As a result, the revenue growth and gross profit margin assumptions used in estimating the fair value of the reporting unit for our annual impairment test changed and the resulting estimated fair value exceeded the book value of the reporting unit in step one of the test - indicating that the goodwill was impaired. We performed step two of the test to measure the amount of the impairment and determined that the goodwill was fully impaired. The impairment charge is presented as a separate line item in our Consolidated Statements of Income.
GRANITE CONSTRUCTION INCORPORATED NOTES TO THE CONSOLIDATED FINANCIAL STATEMENTS - (Continued)
The following other intangible assets are included in other assets on our consolidated balance sheets (in thousands):
| | | | |
| | | December 31, 2006 | |
| | | Gross Value | | Accumulated Amortization | | Net Value | |
| Amortized intangible assets: | | | | | | | | | | |
| Covenants not to compete | | $ | 161 | | $ | (109 | ) | $ | 52 | |
| Permits | | | 2,000 | | | (761 | ) | | 1,239 | |
| Trade names | | | 1,425 | | | (768 | ) | | 657 | |
| Other | | | 603 | | | (193 | ) | | 410 | |
| Total amortized intangible assets | | $ | 4,189 | | $ | (1,831 | ) | $ | 2,358 | |
| | | | | | | | | | | |
| | | December 31, 2005 |
| | | | Gross Value | | | Accumulated Amortization | | | Net Value | |
| Amortized intangible assets: | | | | | | | | | | |
| Covenants not to compete | | $ | | | $ | | ) | $ | | |
| Permits | | | 2,000 | | | | ) | | | |
| Trade names | | | 1,425 | | | | ) | | | |
| Other | | | | | | | ) | | | |
| Total amortized intangible assets | | $ | | | $ | | ) | $ | | |
Amortization expense related to these intangible assets for the years ended December 31, 2006, 2005 and 2004 was $0.6 million, $0.7 million, and $0.9 million, respectively. Amortization expense expected to be recorded in the future is as follows: $558,000 in 2007, $554,000 in 2008, $269,000 in 2009, $230,000 in 2010, $170,000 in 2011 and $577,000 thereafter.
9. Accrued Expenses and Other Current Liabilities (in thousands)
| | | | | | |
December 31, | | 2006 | | 2005 | |
| Payroll and related employee benefits | | $ | 53,956 | | $ | | |
| Accrued insurance | | | 37,582 | | | | |
| Loss job reserves | | | 54,825 | | | 16,999 | |
| Other | | | 42,965 | | | | |
| Total | | $ | 189,328 | | $ | | |
Loss job reserves consist of the estimated costs for the uncompleted portion of projects forecasted at a loss (see Note 2).
10. Long-Term Debt and Credit Arrangements (in thousands)
| | | | | | |
December 31, | | 2006 | | 2005 | |
| Senior notes payable | | $ | 85,000 | | $ | | |
| Bank revolving line of credit | | | - | | | | |
| Mortgages | | | 21,436 | | | | |
| Other notes payable | | | 800 | | | | |
| Total debt | | | 107,236 | | | | |
| Less current maturities | | | 28,660 | | | | |
| Total long-term debt | | $ | 78,576 | | $ | | |
The aggregate minimum principal maturities of long-term debt for each of the five years following December 31, 2006 are as follows (in thousands): 2007 - $28,660; 2008 - $19,679; 2009 - $17,781; 2010 - $15,166; 2011 - $8,501; and beyond 2011 - $17,449.
GRANITE CONSTRUCTION INCORPORATED NOTES TO THE CONSOLIDATED FINANCIAL STATEMENTS - (Continued)
Senior notes payable in the amount of $26.7 million are due to a group of institutional holders. The notes are due in nine equal annual installments which began in 2002 and bear interest at 6.54% per annum. Additional senior notes payable in the amount of $58.3 million are due to a second group of institutional holders. The notes are due in nine equal annual installments which began in 2005 and bear interest at 6.96% per annum. Based on the borrowing rates currently available to us for bank loans with similar terms and average maturities, the fair value of the senior notes payable was approximately $87.9 million as of December 31, 2006 and $104.9 million as of December 31, 2005.
We have a $150.0 million bank revolving line of credit, which allows for unsecured borrowings through June 24, 2010, with interest rate options. Interest on outstanding borrowings under the revolving line of credit is at our choice of selected LIBOR rates plus a margin that is recalculated quarterly. The margin was 0.60% at December 31, 2006. At December 31, 2006 we had no amounts outstanding under this line of credit. We also have standby letters of credit totaling $4.4 million that reduce the amount available under the line of credit. The unused and available portion of this line of credit was $145.6 million at December 31, 2006. Additionally, our Wilder subsidiary has a bank revolving line of credit of $10.0 million that expires in 2008, with borrowings collateralized by certain of Wilder’s equipment, accounts receivable, inventory and general intangibles. Outstanding borrowings under this line are charged interest at the bank’s prime rate (8.25% as of December 31, 2006) less 1.0%. There were no amounts outstanding at December 31, 2006.
Mortgages consist of notes incurred in connection with the purchase of property connected with our Granite Land Company subsidiary. These notes are collateralized by the property purchased and bear interest at 6.50% to 9.75% per annum with principal and interest payable in installments through 2019. The carrying amount of property pledged as collateral was approximately $56.4 million at December 31, 2006.
Restrictive covenants under the terms or our debt agreements require the maintenance of certain levels of working capital and cash flow, financial ratios and the maintenance of tangible net worth (as defined) of approximately $504.7 million. We were in compliance with these covenants at December 31, 2006. Our Wilder subsidiary has restrictive covenants (on a Wilder stand-alone basis) under the terms of its debt agreements that require the maintenance of certain ratios of working capital, liabilities to net worth and tangible net worth and restrict Wilder capital expenditures in excess of specified limits. Wilder was in compliance with these covenants at December 31, 2006.
11. Employee Benefit Plans
Employee Stock Ownership Plan: Our Employee Stock Ownership Plan (“ESOP”) covers all employees not included in collective bargaining agreements, except employees of our majority owned subsidiary, Wilder, and of our consolidated construction joint ventures. As of December 31, 2006, the ESOP owned 5,961,621 shares of our common stock. Dividends on shares held by the ESOP are charged to retained earnings and all shares held by the ESOP are treated as outstanding in computing our earnings per share.
Contributions to the ESOP have been discretionary and comprised shares of our stock that were purchased on the market and immediately contributed to the plan. Compensation cost is measured as the cost to purchase the shares (market value on the date of purchase and contribution). Contribution expense was $2.0 million in each of the years ended December 31, 2006, 2005 and 2004. Effective January 1, 2007, the ESOP was amended to effectively freeze the plan. Under the amended plan, no new participants will be added and no further contributions will be made.
Profit Sharing and 401k Plan: The plan is a defined contribution plan covering all employees not included in collective bargaining agreements, except employees of our majority owned subsidiary, Wilder, and our consolidated construction joint ventures. Each employee can elect to have up to 15% of gross pay contributed to the 401k plan on a before-tax basis. The plan allows for company matching and additional contributions at the discretion of the Board of Directors. Our contributions to the Profit Sharing and 401k Plan for the years ended December 31, 2006, 2005 and 2004 were $8.1 million, $7.0 million and $6.2 million, respectively. Included in the contributions were 401k matching contributions of $5.6 million, $4.9 million and $4.5 million, respectively. Additionally, Wilder provides a 401k plan covering all of its employees and a separate defined contribution plan covering employees not covered by other plans. Wilder’s contributions under these plans totaled approximately $2.6 million, $2.4 million and $2.1 million in the years ended December 31, 2006, 2005 and 2004, respectively.
GRANITE CONSTRUCTION INCORPORATED
NOTES TO THE CONSOLIDATED FINANCIAL STATEMENTS - (Continued)
Other: Two of our wholly owned subsidiaries, Granite Construction Company and Granite Construction Northeast, Inc. (formerly Granite Halmar Construction Company, Inc.) and our majority owned subsidiary, Wilder, also contribute to various multi-employer pension plans on behalf of union employees. Under the Employee Retirement Income Security Act, a contributor to a multi-employer plan is liable, upon termination or withdrawal from a plan, for its proportionate share of a plan’s unfunded vested liability. We currently have no intention of withdrawing from any of the multi-employer pension plans in which we participate. Contributions to these plans for the years ended December 31, 2006, 2005 and 2004 were $25.3 million, $20.4 million and $20.5 million, respectively. We also provide non-qualified deferred compensation plans to certain of our highly compensated employees that provide the participants the opportunity to defer payment of certain compensation as defined in the plan and provides for matching of certain amounts deferred as part of a retirement plan excess feature of the plan.
12. Stock-based Compensation
We provide certain stock-based compensation under our Amended and Restated 1999 Equity Incentive Plan (the “Plan”). Prior to January 1, 2006, we accounted for stock-based compensation under Statement of Financial Accounting Standard No. 123. Effective January 1, 2006, we adopted FASB Statement No. 123 (revised 2004), “Share-Based Payment” (“SFAS 123-R”) and Securities and Exchange Commission Staff Accounting Bulletin No. 107 (“SAB 107”) using the modified prospective transition method.
The primary change to our accounting for stock-based compensation as a result of this change in accounting principle is that forfeitures of restricted stock are now estimated and accounted for at the time of grant and updated based on actual forfeitures over the vesting period rather than accounting for forfeitures as they occur. The cumulative effect of our transition to SFAS 123-R, resulting from the change in accounting for forfeitures, was not significant and therefore was recognized as an adjustment to compensation cost, representing previously recognized compensation cost on restricted shares outstanding as of January 1, 2006 which we do not expect to vest. Additionally, prior to our adoption of SFAS 123-R, we presented all tax benefits for deductions resulting from our stock-based compensation as operating cash flows on our consolidated statements of cash flows. SFAS 123-R requires the benefits of tax deductions in excess of recognized compensation expense (“Excess Tax Benefits”) to be reported as a financing cash flow, rather than as an operating cash flow. This requirement will reduce net operating cash flows and increase net financing cash flows in periods after adoption. Total cash flow will remain unchanged from what would have been reported under prior accounting rules. Excess tax benefits of $3.4 million, $1.7 million and $0.7 million were recorded in the years ended December 31, 2006, 2005 and 2004, respectively.
The Plan provides for the grant of restricted common stock, incentive and nonqualified stock options, performance units and performance shares to employees and awards to members of our Board of Directors in the form of stock units or stock options (“Director Options”). A total of 4,250,000 shares of our common stock have been reserved for issuance under the Plan of which approximately 2,333,100 remained available as of December 31 2006.
Restricted Stock: Restricted common stock is issued for services to be rendered and may not be sold, transferred or pledged for such period as determined by our compensation committee. Restricted stock compensation cost is measured as the stock’s fair value based on the market price at the date of grant. We recognize compensation cost only on restricted shares that will ultimately vest. We estimate the number of shares that will ultimately vest at each grant date based on our historical experience and adjust compensation cost and the carrying amount of unearned compensation based on changes in those estimates over time. Prior to our adoption of SFAS 123-R, we did not estimate forfeitures at the time of grant; rather, we recognized the effects of forfeitures in the period in which the forfeitures occurred.
Restricted stock representing approximately 127,000 shares, 42,000 shares and 254,000 shares for the years ended December 31, 2006, 2005 and 2004, respectively, have been excluded from the calculation of diluted net income per share because their effects are anti-dilutive. We calculate dilutive shares on a quarterly basis and average the quarterly amounts to determine the year-end amount.
The impact on the effective tax rate related to minority interest in consolidated joint ventures is a result of the consolidation of construction joint ventures as required by FIN 46 (see Note 5), which are not subject to income taxes on a stand-alone basis.
The deferred tax asset for other accrued liabilities relates to various items including accrued vacation and accrued reclamation costs which are deductible in future periods.
Operating lease rental expense was $14.6 million in 2006, $9.5 million in 2005 and $8.0 million in 2004.
The accounting policies of the segments are the same as those described in the Summary of Significant Accounting Policies (see Note 1). We evaluate performance based on operating profit or loss (excluding gain on sales of property and equipment), and do not include income taxes, interest income, interest expense or other income (expense). Unallocated other corporate expenses principally comprise corporate general and administrative expenses.