UNITED STATES
SECURITIES AND EXCHANGE COMMISSION
Washington, D.C. 20549
FORM 10-K
x ANNUAL REPORT PURSUANT TO SECTION 13 OR 15(d) OF THE SECURITIES EXCHANGE ACT OF 1934
For the fiscal year ended December 31, 2009
OR
o TRANSITION REPORT PURSUANT TO SECTION 13 OR 15(d) OF THE SECURITIES EXCHANGE ACT OF 1934
For the transition period from _____ to _____
Commission file number 1-12911
Granite Construction Incorporated
(Exact name of registrant as specified in its charter)
| Delaware | 77-0239383 |
| (State or other jurisdiction of incorporation or organization) | (I.R.S. Employer Identification Number) |
| | |
| 585 West Beach Street | |
| Watsonville, California | 95076 |
| (Address of principal executive offices) | (Zip Code) |
Registrant’s telephone number, including area code: (831) 724-1011
Securities registered pursuant to Section 12(b) of the Act:
Title of each class | Name of each exchange on which registered |
| Common Stock, $0.01 par value | New York Stock Exchange |
Securities registered pursuant to Section 12(g) of the Act: None
Indicate by check mark if the registrant is a well-known seasoned issuer, as defined in Rule 405 of the Securities Act. Yes x No o
Indicate by check mark if the registrant is not required to file reports pursuant to Section 13 or Section 15(d) of the Act. Yes o No x
Indicate by check mark whether the registrant (1) has filed all reports required to be filed by Section 13 or 15(d) of the Securities Exchange Act of 1934 during the preceding 12 months (or for such shorter period that the registrant was required to file such reports), and (2) has been subject to such filing requirements for the past 90 days. Yes x No o
Indicate by check mark whether the registrant has submitted electronically and posted on its corporate Web site, if any, every Interactive Data File required to be submitted and posted pursuant to Rule 405 of Regulation S-T (§ 232.405 of this chapter) during the preceding 12 months (or for such shorter period that the registrant was required to submit and post such files). Yes o No o
Indicate by check mark if disclosure of delinquent filers pursuant to Item 405 of Regulation S-K (§ 229.405 of this chapter) is not contained herein, and will not be contained, to the best of registrant’s knowledge, in definitive proxy or information statements incorporated by reference in Part III of this Form 10-K or any amendment to this Form 10-K. o
Indicate by check mark whether the registrant is a large accelerated filer, an accelerated filer, a non-accelerated filer, or a smaller reporting company. See the definitions of “large accelerated filer,” “accelerated filer” and “smaller reporting company” in Rule 12b-2 of the Exchange Act. Large accelerated filer x Accelerated filer o Non-accelerated filer o Smaller reporting company o
Indicate by check mark whether the registrant is a shell company (as defined in Rule 12b-2 of the Act). Yes o No x
The aggregate market value of voting and non-voting common equity held by non-affiliates of the registrant was approximately $1.3 billion as of June 30, 2009, based upon the average of the bid and asked prices per share of the registrant’s Common Stock as reported on the New York Stock Exchange on such date. Shares of Common Stock held by each executive officer and director and by each person who owns 5% or more of the outstanding Common Stock have been excluded in that such persons may be deemed to be affiliates. This determination of affiliate status is not necessarily a conclusive determination for other purposes.
At February 12, 2010, 38,629,378 shares of Common Stock, par value $0.01, of the registrant were outstanding.
DOCUMENTS INCORPORATED BY REFERENCE
Certain information called for by Part III is incorporated by reference to the definitive Proxy Statement for the Annual Meeting of Shareholders of Granite Construction Incorporated to be held on May 7, 2010, which will be filed with the Securities and Exchange Commission not later than 120 days after December 31, 2009.
DISCLOSURE REGARDING FORWARD-LOOKING STATEMENTS
This Annual Report on Form 10-K contains statements that are not based on historical facts and which may be forward-looking in nature. Under the Private Securities Litigation Reform Act of 1995, a “safe harbor” may be provided to us for certain of these forward-looking statements. Words such as “outlook,” “believes,” “expects,” “appears,” “may,” “will,” “should,” “anticipates” or the negative thereof or comparable terminology, are intended to identify these forward-looking statements. These forward-looking statements are estimates reflecting the best judgment of our senior management and are based on our current expectations and projections concerning future events, many of which are outside of our control, and involve a number of risks and uncertainties that could cause actual results to differ materially from those suggested by the forward-looking statements. Factors that might cause or contribute to such differences include, but are not limited to, those risks described in this Report under “Item 1A. Risk Factors.” Except as required by law, we undertake no obligation to revise or update any forward-looking statements for any reason. As a result, the reader is cautioned not to place undue reliance on these forward-looking statements, which speak only as of the date of this Report.
Introduction
Granite Construction Company was originally incorporated in 1922. In 1990, Granite Construction Incorporated was formed as the holding company for Granite Construction Company and its wholly owned subsidiaries and was incorporated in Delaware. Unless otherwise indicated, the terms “we,” “us,” “our,” “Company” and “Granite” refer to Granite Construction Incorporated and its consolidated subsidiaries.
We are one of the largest heavy civil construction contractors in the United States. We operate nationwide, serving both public and private sector clients. Within the public sector, we primarily concentrate on heavy-civil infrastructure projects, including the construction of roads, highways, mass transit facilities, airport infrastructure, bridges, dams and canals. Within the private sector, we perform site preparation and infrastructure services for residential development, commercial and industrial buildings, and other facilities.
We own and lease substantial aggregate reserves and own a number of construction materials processing plants. We also have one of the largest contractor-owned heavy construction equipment fleets in the United States. We believe that the ownership of these assets enables us to compete more effectively by ensuring availability of these resources at a favorable cost.
In 2000, we diversified into real estate investment and development, investing our own capital in carefully selected real estate projects throughout the western United States and Texas.
Operating Structure
Our construction business has been organized into two geographic segments, Granite West and Granite East. Included in our Granite West segment is our vertically integrated construction materials business. The Company also has a real estate investment and development business, Granite Land Company (“GLC”). Our results of operations discussed herein have been reported with the segment structure that was in place during 2009. See Note 20 of “Notes to the Consolidated Financial Statements” for additional information about our operating segments.
On August 31, 2009, we announced changes to our organizational structure designed to improve operating efficiencies and position the Company for long-term growth. In conjunction with the reorganization we are changing our reportable segments to reflect our business product lines. Beginning in fiscal 2010, the Company’s new reportable segments are: Construction, Large Project Construction, Construction Materials and Real Estate. The Real Estate segment will contain what was previously known as Granite Land Company. We will continue to provide geographic information within the new segment structure.
Granite West: In 2009 and 2008, Granite West contract revenue and sales of construction materials was $1.4 billion and $2.0 billion (71.9% and 73.7% of our total revenue), respectively. Granite West revenue is derived from both public and private sector clients. Typical public sector projects include both new construction and improvement of roads, highways, airport infrastructure and bridges. Major private sector contracts typically include site preparation for housing and commercial development, including excavation, grading and street paving and installation of curbs, gutters, sidewalks and underground utilities.
Granite West’s decentralized operating structure includes 14 branch offices in the western United States, several with additional satellite operations. In 2009, individual branch revenues ranged from $47.0 million to $210.1 million. Although most Granite West projects are started and completed within a year, the division also has the capability of constructing larger projects and, as of December 31, 2009, had four active large projects, each with total contract revenue greater than $50.0 million.
The Company mines aggregates and/or operates plants that process aggregates into construction materials for internal use and for sale to third parties. These activities are vertically integrated into Granite West and provide both a source of profits and a competitive advantage to our construction business through the readily available supply of materials. We have significant aggregate reserves that we have acquired by ownership in fee or through long-term leases.
Aggregate products used in our construction projects represented approximately 54.9% of our aggregate sales during 2009 and ranged from 42.3% to 54.9% over the last five years. The remainder is sold to third parties.
Granite East: In 2009, revenue from Granite East was $550.2 million (28.0% of our total revenue), compared with $695.0 million (26.0% of our total revenue) in 2008. Granite East’s focus is on large, complex infrastructure projects and included major highways, mass transit facilities, bridges, tunnels, waterway locks and dams, pipelines, canals, and airport infrastructure. It also performs activities such as demolition, clearing, large-scale earthwork and grading, dewatering, drainage improvements, structural concrete, rail signalization, and concrete and asphalt paving. Granite East also has the ability to process locally sourced aggregates into construction materials using owned or rented portable crushing, concrete and asphalt processing plants.
Granite East operates out of three regional offices that provide management and administrative support and are the primary hubs for estimating efforts. Granite East construction contracts are typically greater than two years in duration with contract values ranging from $12.0 million to $466.5 million at December 31, 2009.
Joint Ventures and Design/Build Projects: We participate in joint ventures with other construction companies. Joint ventures are used for large, technically complex projects, including design/build projects, where it is desirable to share risk and resources. Joint venture partners typically provide independently prepared estimates, shared financing and equipment and often bring local knowledge and expertise (see “Joint Ventures; Off-Balance-Sheet Arrangements” under “Item 7. Management’s Discussion and Analysis of Financial Condition and Results of Operations”).
We also utilize the design/build method of project delivery. Unlike traditional projects where owners first hire a design firm or design a project themselves and then put the project out to bid for construction, design/build projects provide the owner with a single point of responsibility and a single contact for both final design and construction. Revenue from design/build projects represented 64.0% and 66.4% of Granite East revenue in 2009 and 2008, respectively, and 10.1% and 14.1% of Granite West revenue in 2009 and 2008, respectively. Although these projects carry additional risk as compared to traditional bid/build projects, the profit potential can also be higher.
Granite Land Company: GLC is an investor in a diversified portfolio of land assets and provides real estate services for other Granite operations. GLC’s current portfolio consists of residential, retail and office site development projects for sale to home and commercial property developers, or held for rental income. The range of our involvement in an individual project may vary from passive investment to management of land rights or entitlement (use of land authorized by government agency), development, construction, leasing and eventual sale of the project. GLC projects have long lead times affording us the flexibility to stage our land entitlement and construction activities to meet market demand. Our strategy is to remain flexible, and to evaluate opportunities to sell any of our investments at any stage of the development process.
Generally, we team with partners who have local knowledge and expertise in the development of each property. Each of these developments is affected by such factors as changes in general economic conditions, bank-lending practices, interest rate fluctuations, and demand for real estate. In addition, each project is subject to issues unique to that property such as environmental conditions, local entitlement policies and market conditions.
Our current investments are located in Washington, Oregon, California and Texas. In 2009, revenue from GLC was $2.3 million (0.1% of our total revenue), compared with $9.0 million (0.3% of our total revenue) in 2008.
Business Strategy
Our fundamental objective is to increase long-term shareholder value as measured by the appreciation of the value of our common stock over a period of time as well as dividend yields. A specific measure of our financial success is the achievement of a return on net assets greater than the cost of capital, creating “Granite Value Added.” The following are key factors in our ability to achieve these objectives:
Controlled Growth - We intend to grow our business by working on many types of infrastructure projects as well as by expanding into new geographic areas. In addition, we are focusing our efforts on larger projects wherein our financial strength and project experience provide us with a competitive advantage.
Decentralized Profit Centers - Each of our operating groups is established as an individual profit center which encourages entrepreneurial activity while allowing the offices to benefit from centralized administrative and support functions.
Diversification - To mitigate the risks inherent in the construction business as the result of general economic factors, we pursue projects: (i) in both the public and private sectors, (ii) for a wide range of customers within each sector (from the federal government to small municipalities and from large corporations to individual homeowners), (iii) in diverse geographic markets, (iv) that are design/build, lump sum and fixed unit price and (v) of various sizes, durations and complexity.
Employee Development - We believe that our employees are key to the successful implementation of our business strategies. Significant resources are employed to attract, develop and retain extraordinary talent and fully promote each employee’s capabilities.
Infrastructure Construction Focus - We concentrate our core competencies on this segment of the construction industry, which includes the building of roads, highways, bridges, dams, tunnels, mass transit facilities, railroad infrastructure and underground utilities as well as site preparation. This focus allows us to most effectively utilize our specialized strengths, which include grading, paving and concrete structures.
Aggregate Materials - We own and lease aggregate reserves and own processing plants that are vertically integrated into our construction operations. By ensuring availability of these resources and providing quality products, we believe we have a competitive advantage in many of our markets as well as a source of revenue and income from the sale of construction materials to third parties.
Ownership of Construction Equipment - We own a large fleet of well maintained heavy construction equipment. We believe that ownership of construction equipment enables us to compete more effectively by ensuring availability of the equipment at a favorable cost.
Profit-based Incentives - Profit center managers are incentivized with cash compensation and restricted stock, payable upon the attainment of pre-established annual financial and non-financial metrics.
Selective Bidding - We focus our resources on bidding jobs that meet our selective bidding criteria, which include analyzing the risk of a potential job relative to: (i) available personnel to estimate and prepare the proposal, (ii) available personnel to effectively manage and build the project, (iii) the competitive environment, (iv) our experience with the type of work, (v) our experience with the owner, (vi) local resources and partnerships, (vii) equipment resources, (viii) the size and complexity of the job and (ix) profitability.
Our operating principles include:
Accident Prevention - We believe accident prevention is a moral obligation as well as good business. By identifying and concentrating resources to address jobsite hazards, we continually strive to reduce our incident rates and the costs associated with accidents.
Environmental Responsibility - We believe in environmentally responsible operations. We are committed to protecting the environment, maintaining good community relations and ensuring compliance with government agency requirements.
Quality and High Ethical Standards - We believe in the importance of performing high quality work and maintaining high ethical standards through an established code of conduct and an effective corporate compliance program.
Raw Materials
We purchase raw materials consisting of aggregate products, cement, diesel fuel, liquid asphalt, natural gas, propane and steel from numerous sources. Our aggregate reserves supply a portion of the raw materials needed in our construction projects. The price and availability of raw materials may vary from year to year due to market conditions and production capacities. We do not foresee the lack of availability of any raw materials.
Seasonality
The first and fourth quarter of our fiscal year are typically affected by weather conditions, primarily in the West, which may alter our construction schedules and can create variability in our revenues, profitability and the required number of employees.
Customers
We have customers in both the public and private sectors. Our largest volume customer is the California Department of Transportation (“Caltrans”). Contracts with Caltrans represented 11.9% and 9.6% of our total revenue and 16.6% and 13.1% of our Granite West revenue in 2009 and 2008, respectively. Public sector revenue in California represented 28.1% and 27.7% of our total revenue in 2009 and 2008, respectively. Other Granite West customers include certain federal agencies, departments of transportation of other states, county and city public works departments, school districts and developers and owners of industrial, commercial and residential sites. Granite East’s customers are predominantly in the public sector and currently include various state departments of transportation, local transit authorities, and federal agencies.
Contract Backlog
Our contract backlog is comprised of the unearned portion of revenue on awarded contracts that have not been completed, including 100% of the unearned revenue of our consolidated joint ventures and our proportionate share of unconsolidated joint venture contracts. We include a construction project in our contract backlog at the time a contract is awarded and funding is in place, with the exception of certain federal government contracts for which funding is appropriated on a periodic basis. Substantially all of the contracts in our contract backlog may be canceled or modified at the election of the customer; however, we have not been materially adversely affected by contract cancellations or modifications in the past (see “Contract Provisions and Subcontracting”). Most Granite West projects are added and completed within each year and therefore are not reflected in our year-end contract backlog. Contract backlog by segment is presented in “Contract Backlog” under “Item 7. Management’s Discussion and Analysis of Financial Condition and Results of Operations.” Our contract backlog was approximately $1.4 billion and $1.7 billion at December 31, 2009 and 2008, respectively. Approximately $931.2 million of the December 31, 2009 contract backlog is expected to be completed during 2010.
Equipment
At December 31, 2009 and 2008, we owned the following construction equipment and vehicles:
December 31, | | | 2009 | | | 2008 | | |
Heavy construction equipment | | | 2,362 | | | | | |
Trucks, truck-tractors, trailers and vehicles | | | 5,254 | | | | | |
Our portfolio of equipment includes loaders, bulldozers, excavators, rollers, motor graders, pavers, scrapers, cranes, trucks, backhoes and barges. We believe that ownership of equipment is generally preferable to leasing because it ensures the equipment is available as needed and normally results in lower costs. We pool certain equipment for use by both Granite West and Granite East to maximize utilization. On a short-term basis, we lease or rent equipment to supplement existing equipment in response to construction activity peaks. In 2009 and 2008, we spent approximately $17.6 million and $36.5 million, respectively, on purchases of construction equipment and vehicles.
Employees
On December 31, 2009, we employed approximately 1,800 salaried employees, who work in management, estimating and clerical capacities, plus approximately 600 hourly employees. The total number of hourly personnel we employ is subject to the volume of construction in progress and is seasonal. During 2009, the number of hourly employees ranged from approximately 600 to 3,600 and averaged approximately 2,700. Two of our wholly owned subsidiaries - Granite Construction Company and Granite Construction Northeast, Inc. - are parties to craft collective bargaining agreements in many areas in which they work.
We believe our employees are our most valuable resource and that our workforce possesses a strong dedication to and pride in our company. Among salaried and non-union hourly employees, this dedication is reinforced by a 14.6% equity ownership at December 31, 2009 through our Employee Stock Ownership Plan, our Profit Sharing and 401(k) Plan and performance-based incentive compensation arrangements. Our managerial and supervisory personnel have an average of approximately 11 years of service with us.
Competition
Granite West competitors range from small local construction companies to large regional, national and global construction companies. While the market areas of these competitors overlap with several of the markets served by our branches, few compete in all of our market areas. Many of our Granite West competitors have the ability to perform work in either the private or public sectors. When opportunities for work in one sector are reduced, competitors tend to look for opportunities in the other sector. This migration has the potential to reduce revenue growth and/or increase pressure on gross profit margins. In addition, we own and/or have long-term leases on aggregate resources that provide an extra measure of competitive advantage in certain markets. Granite East normally competes with large regional, national and global construction companies.
Factors influencing our competitiveness include price, estimating abilities, knowledge of local markets and conditions, project management, financial strength, reputation for quality, the availability of aggregate materials, and machinery and equipment. Although some of our competitors are larger than us and may possess greater resources, we believe that we compete favorably on the basis of the foregoing factors. Historically, the construction business has not required large amounts of capital, particularly for the smaller size construction work pursued by Granite West, which can result in relative ease of market entry for companies possessing acceptable qualifications. Although the construction business is highly competitive, we believe we are well positioned to compete effectively in the markets in which we operate.
Contract Provisions and Subcontracting
Our contracts with our customers are primarily “fixed unit price” or “fixed price.” Under fixed unit price contracts, we are committed to providing materials or services at fixed unit prices (for example, dollars per cubic yard of concrete poured or cubic yard of earth excavated). While the fixed unit price contract shifts the risk of estimating the quantity of units required for a particular project to the customer, any increase in our unit cost over the expected unit cost in the bid, whether due to inflation, inefficiency, errors in our estimates or other factors, is borne by us unless otherwise provided in the contract. Fixed price contracts are priced on a lump-sum basis under which we bear the risk of performing all the work for the specified amount. The percentage of fixed price contracts in our contract backlog increased to approximately 75.1% at December 31, 2009 compared with approximately 68.7% at December 31, 2008.
Our contracts are generally obtained through competitive bidding in response to advertisements by federal, state and local government agencies and private parties. Less frequently, contracts may be obtained through direct negotiations with private owners. Our contract review process includes identifying risks and opportunities during the bidding process and managing these risks through mitigation efforts such as insurance and pricing. Contracts fitting certain criteria of size and complexity are reviewed by various levels of management and, in some cases, by the Executive Committee of our Board of Directors.
There are a number of factors that can create variability in contract performance and results as compared to a project’s original bid. The most significant of these include the completeness and accuracy of the original bid, costs associated with added scope changes, extended overhead due to owner, weather and other delays, subcontractor performance issues, changes in productivity expectations, site conditions that differ from those assumed in the original bid (to the extent contract remedies are unavailable), the availability and skill level of workers in the geographic location of the project and a change in the availability and proximity of equipment or materials. All of these factors can impose inefficiencies on contract performance, which can increase costs and lower profits. Conversely, positive variations in any of these or other factors can decrease costs and improve profitability. However, the ability to realize improvements on project profitability is often more limited than the risk of lower profitability. Design/build projects typically incur additional costs such as right-of-way and permit acquisition costs and carry additional risks such as design error risk and the risk associated with estimating quantities and prices before the project design is completed. These unknown factors may cause higher than anticipated construction costs and additional liability to the contract owner. We manage this additional risk by adding contingencies to our bid amounts, obtaining errors and omissions insurance and obtaining indemnifications from our design consultants where possible. However, there is no guarantee that these risk management strategies will always be successful.
Most of our contracts, including those with the government, provide for termination at the convenience of the contract owner, with provisions to pay us for work performed through the date of termination. We have not been materially adversely affected by these provisions in the past. Many of our contracts contain provisions that require us to pay liquidated damages if specified completion schedule requirements are not met and these amounts could be significant.
We act as prime contractor on most of our construction projects. We complete the majority of our projects with our own resources and subcontract specialized activities such as electrical and mechanical work. As prime contractor, we are responsible for the performance of the entire contract, including subcontract work. Thus, we may be subject to increased costs associated with the failure of one or more subcontractors to perform as anticipated. Based on our analysis of their construction and financial capabilities, among other criteria, we determine whether to require the subcontractor to furnish a bond or other type of security to guarantee their performance. Disadvantaged business enterprise regulations require us to use our best efforts to subcontract a specified portion of contract work done for governmental agencies to certain types of disadvantaged subcontractors. As with all of our subcontractors, some may not be able to obtain surety bonds or other types of performance security.
Insurance and Bonding
We maintain general and excess liability, construction equipment and workers’ compensation insurance; all in amounts consistent with industry practices.
In connection with our business, we generally are required to provide various types of surety bonds that provide an additional measure of security for our performance under certain public and private sector contracts. Our ability to obtain surety bonds depends upon our capitalization, working capital, past performance, management expertise and external factors, including the capacity of the overall surety market. Surety companies consider such factors in light of the amount of our contract backlog that we have currently bonded and their current underwriting standards, which may change from time to time. The capacity of the surety market is subject to market-based fluctuations driven primarily by the level of surety industry losses and the degree of surety market consolidation. When the surety market capacity shrinks it results in higher premiums and increased difficulty obtaining bonding, in particular for larger, more complex projects throughout the market. In order to help mitigate this risk, we employ a co-surety structure involving three sureties. Although we do not believe that fluctuations in surety market capacity have significantly affected our ability to grow our business, there is no assurance that it will not significantly affect our ability to obtain new contracts in the future (see “Item 1A. Risk Factors”).
Environmental Regulations
Our operations are subject to various federal, state and local laws and regulations relating to the environment, including those relating to discharges to air, water and land, the handling and disposal of solid and hazardous waste, the handling of underground storage tanks and the cleanup of properties affected by hazardous substances. Certain environmental laws impose substantial penalties for non-compliance and others, such as the federal Comprehensive Environmental Response, Compensation and Liability Act, impose strict, retroactive, joint and several liability upon persons responsible for releases of hazardous substances. We continually evaluate whether we must take additional steps at our locations to ensure compliance with environmental laws. While compliance with applicable regulatory requirements has not materially adversely affected our operations in the past, there can be no assurance that these requirements will not change and that compliance will not adversely affect our operations in the future. In addition, our aggregate materials operations require operating permits granted by governmental agencies. We believe that tighter regulations for the protection of the environment and other factors will make it increasingly difficult to obtain new permits and renewal of existing permits may be subject to more restrictive conditions than currently exist.
In July 2007, the California Air Resources Board (“CARB”) approved a regulation that will require California equipment owners/operators to reduce diesel particulate and nitrogen oxide emissions from in-use off-road diesel equipment and to meet progressively more restrictive emission targets proposed for each year from 2010 to 2020. In December 2008, CARB approved a similar regulation for in-use on-road diesel equipment that includes more restrictive emission targets from 2010 to 2022. The emission targets will require California off-road and on-road diesel equipment owners to retrofit equipment with diesel emission control devices or replace equipment with new engine technology as it becomes available, which will result in higher equipment related expenses. To date, costs to prepare the Company for compliance have been minimal. However, it is too early to determine what the full cost of compliance will be.
As is the case with other companies in our industry, some of our aggregate products contain varying amounts of crystalline silica, a common mineral. Also, some of our construction and material processing operations release, as dust, crystalline silica that is in the materials being handled. Excessive, prolonged inhalation of very small-sized particles of crystalline silica has allegedly been associated with respiratory disease (including silicosis). The Mine Safety and Health Administration and the Occupational Safety and Health Administration have established occupational thresholds for crystalline silica exposure as respirable dust. We have implemented dust control procedures to measure compliance with requisite thresholds and to verify that respiratory protective equipment is made available as necessary. We also communicate, through safety information sheets and other means, what we believe to be appropriate warnings and cautions to employees and customers about the risks associated with excessive, prolonged inhalation of mineral dust in general and crystalline silica in particular.
Website Access
Our website address is www.graniteconstruction.com. On our website we make available, free of charge, our annual report on Form 10-K, quarterly reports on Form 10-Q, current reports on Form 8-K, and all amendments to those reports as soon as reasonably practicable after such material is electronically filed with or furnished to the Securities and Exchange Commission (“SEC”). The information on our website is not incorporated into, and is not part of, this report. These reports, and any amendments to them, are also available at the website of the SEC, www.sec.gov.
Set forth below and elsewhere in this Report and in other documents we file with the SEC are various risks and uncertainties that could cause our actual results to differ materially from the results contemplated by the forward-looking statements contained in this Report or otherwise adversely affect our business.
| · | Reductions in governmental infrastructure spending could have a negative impact on our business. A significant portion of our revenue is generated from infrastructure work funded by various government entities, including state departments of transportation such as Caltrans. Infrastructure spending by government entities could be negatively affected by the overall condition of the economy and declining tax revenues. Our ability to obtain future public sector work at reasonable margins is highly dependent on the amount of work that is available to bid. It may also affect our customer base, subcontractors and suppliers and could materially affect our contract backlog, operating results, cash flows and our ability to implement our strategic plan. |
| We work in a highly competitive marketplace. We have multiple competitors in all of the areas in which we work. During economic down cycles or times of lower government funding for public works projects, competition for the fewer available public projects intensifies and this increased competition may result in a decrease in new awards at acceptable profit margins. In addition, downturns in residential and commercial construction activity increases the competition for available public sector work, further impacting our revenue, contract backlog and profit margins. |
| Accounting for our revenues and costs involves significant estimates. As further described in “Critical Accounting Estimates” under “Item 7. Management’s Discussion and Analysis of Financial Condition and Results of Operations,” accounting for our contract related revenues and costs, as well as other expenses, requires management to make a variety of significant estimates and assumptions. Although we believe we have sufficient experience and processes to enable us to formulate appropriate assumptions and produce reasonably dependable estimates, these assumptions and estimates may change significantly in the future and could result in the reversal of previously recognized revenue and profit. Such changes could have a material adverse effect on our financial position, results of operations, and cash flows. |
| · | Our success depends on attracting and retaining qualified personnel in a competitive environment. The single largest factor affecting our ability to profitably execute our work is our ability to attract, develop and retain qualified personnel. Our success in attracting qualified people is dependent on the resources available in individual geographic areas and changes in the labor supply as a result of general economic conditions, as well as our ability to provide compensation packages and a work environment that are competitive. |
| Fixed price and fixed unit price contracts subject us to the risk of increased project cost. As more fully described under “Contract Provisions and Subcontracting” above, the profitability of our fixed price and fixed unit price contracts can be adversely affected by a number of factors that can cause our actual costs to materially exceed the costs estimated at the time of our original bid. |
| Many of our contracts have penalties for late completion. In some instances, including many of our fixed price contracts, we guarantee that we will complete a project by a certain date. If we subsequently fail to complete the project as scheduled we may be held responsible for costs resulting from the delay, generally in the form of contractually agreed-upon liquidated damages. To the extent these events occur, the total cost of the project could exceed our original estimate and we could experience reduced profits or, in some cases, a loss on that project. |
| Weather can significantly affect our quarterly revenues and profitability. Our ability to perform work is significantly affected by weather conditions such as precipitation and temperature. Changes in weather conditions can cause delays and otherwise significantly affect our project costs. The impact of weather conditions can result in variability in our quarterly revenues and profitability, particularly in the first and fourth quarters of the year. |
| Design/build contracts subject us to the risk of design errors and omissions. Design/build is increasingly being used as a method of project delivery as it provides the owner with a single point of responsibility for both design and construction. We generally subcontract design responsibility to architectural and engineering firms. However, in the event of a design error or omission causing damages, there is risk that the subcontractor or their errors and omissions insurance would not be able to absorb the liability. In this case we may be responsible, resulting in a potentially material adverse effect on our financial position, results of operations and cash flows. |
| Failure of our subcontractors to perform as anticipated could have a negative effect on our results. As further described under “Contract Provisions and Subcontracting” above, we subcontract portions of many of our contracts to specialty subcontractors, but we are ultimately responsible for the successful completion of their work. Although we seek to require bonding or other forms of guarantees, we are not always successful in obtaining those bonds or guarantees from our higher risk subcontractors. In this case we may be responsible, resulting in a potentially adverse effect on our financial position, results of operations and cash flows. |
| We may be unable to identify qualified Disadvantaged Business Enterprise (“DBE”) contractors to perform as subcontractors. Certain of our government agency projects contain minimum DBE participation clauses. If we subsequently fail to complete these projects with the minimum DBE participation, we may be held responsible for breach of contract damages which may include restrictions on our ability to bid on future projects as well as monetary damages. To the extent we are responsible for monetary damages, the total costs of the project could exceed our original estimates and we could experience reduced profits or, in some cases, a loss for that project. |
| Government contracts generally have strict regulatory requirements. Approximately 86.0% of our consolidated revenue in 2009 was derived from contracts funded by federal, state and local government agencies and authorities. Government contracts are subject to specific procurement regulations, contract provisions and a variety of socioeconomic requirements relating to their formation, administration, performance and accounting and often include express or implied certifications of compliance. Claims for civil or criminal fraud may be brought for violations of regulations, requirements or statutes. We may also be subject to qui tam (“Whistle Blower”) litigation brought by private individuals on behalf of the government under the Federal Civil False Claims Act, which could include claims for up to treble damages. Further, if we fail to comply with any of the regulations, requirements or statutes, our existing government contracts could be terminated and we could be suspended from government contracting or subcontracting, including federally funded projects at the state level. Should one of these events occur, it could have a material adverse effect on our financial position, results of operations, and cash flows. |
| We are subject to environmental and other regulation. As more fully described under “Environmental Regulations” above, we are subject to a number of federal, state and local laws and regulations relating to the environment, workplace safety and a variety of socioeconomic requirements, the noncompliance with which can result in substantial penalties, termination or suspension of government contracts as well as civil and criminal liability. While compliance with these laws and regulations has not materially adversely affected our operations in the past, there can be no assurance that these requirements will not change and that compliance will not adversely affect our operations in the future. |
| Strikes or work stoppages could have a negative effect on our operations and results. We are party to collective bargaining agreements covering a portion of our craft workforce. Although our results and operations have not been significantly affected by strikes or work stoppages in the past, such labor actions could have a significant effect on our operations if they occur in the future. |
| Unavailability of insurance coverage could have a negative effect on our operations and results. We maintain insurance coverage as part of our overall risk management strategy and pursuant to requirements to maintain specific coverage that are contained in our financing agreements and in most of our construction contracts. Although we have been able to obtain reasonably priced insurance coverage to meet our requirements in the past, there is no assurance that we will be able to do so in the future, and our inability to obtain such coverage could materially affect our financial position, results of operations and cash flows. |
| An inability to obtain bonding would have a negative effect on our operations and results. As more fully described in “Insurance and Bonding” above, we generally are required to provide surety bonds securing our performance under the majority of our public and private sector contracts. Our inability to obtain reasonably priced surety bonds in the future could significantly affect our ability to be awarded new contracts, which would have a material adverse effect on our financial position, results of operations and cash flows. |
| Our joint venture contracts with project owners subject us to joint and several liability. As further described in “Joint Ventures; Off-Balance Sheet Arrangements” under “Item 7. Management’s Discussion and Analysis of Financial Condition and Results of Operations,” if a joint venture partner fails to perform we could be liable for completion of the entire contract. If the contract were unprofitable, this could result in a material adverse effect on our financial position, results of operations and cash flows. |
| Our contract backlog is subject to unexpected adjustments and cancellations and could be an uncertain indicator of our future earnings. We cannot guarantee that the revenues projected in our contract backlog will be realized or, if realized, will be profitable. Projects reflected in our contract backlog may be affected by project cancellations, scope adjustments, time extensions or other changes. Such changes may adversely affect the revenue and profit we ultimately realize on these projects. |
| We use certain commodity products that are subject to significant price fluctuations. Diesel fuel, liquid asphalt and other petroleum-based products are used to fuel and lubricate our equipment and fire our asphalt concrete processing plants. In addition, they constitute a significant part of the asphalt paving materials that are used in many of our construction projects and are sold to third parties. Although we are partially protected by asphalt or fuel price escalation clauses in some of our contracts, many contracts provide no such protection. We also use steel and other commodities in our construction projects that can be subject to significant price fluctuations. We enter into supply agreements or pre-purchase commodities to secure pricing. We have not been significantly adversely affected by price fluctuations in the past; however, there is no guarantee that we will not be in the future. |
| An inability to secure and permit aggregate reserves could negatively affect our future operations and results. Tighter regulations for the protection of the environment and the finite nature of property containing suitable aggregate reserves are making it increasingly challenging and costly to secure and permit aggregate reserves. Although we have thus far been able to secure and permit reserves to support our business, our operating results and financial conditions may be adversely affected by an increasingly difficult permitting process. |
| Private sector work can be affected by economic downturns. The availability of private sector work can be adversely affected by economic downturns in the residential housing market, demand for commercial property or the availability of credit. To the extent these events occur, our operating results will be adversely affected. |
| Granite Land Company is greatly affected by the strength of the real estate industry. Our real estate development activities are subject to numerous factors beyond our control including local real estate market conditions; substantial existing and potential competition; general national, regional and local economic conditions; fluctuations in interest rates and mortgage availability and changes in demographic conditions. If our outlook for a project’s forecasted profitability deteriorates, we may find it necessary to curtail our development activities and evaluate our real estate assets for possible impairment. Our evaluation includes a variety of estimates and assumptions and future changes in these estimates and assumptions could affect future impairment analyses. If our real estate assets are determined to be impaired, the impairment would result in a charge to income from operations in the year of the impairment. |
| Our real estate investments may require additional funding. Granite Land Company’s real estate investments generally utilize short-term debt financing for their development activities. Due to the tightening of the credit markets, banks have required lower loan-to-value ratios often resulting in the need to pay a portion of the debt when short-term financing is renegotiated. If our real estate investment partners are unable to make their proportional share of a required repayment, GLC may be required to provide the additional funding which could materially affect our financial position and cash flows. Also, if we assume full financial management responsibility, additional real estate investments may need to be consolidated in our financial statements. |
| Our long-term debt and credit arrangements contain restrictive covenants, and failure to meet these covenants could significantly harm our financial condition. Our long-term debt and credit arrangements and related restrictive covenants are more fully described in Note 11 of “Notes to the Consolidated Financial Statements” included in this report. In most cases, failure to meet the restrictive covenants would result in the acceleration of outstanding indebtedness requiring immediate repayment of all amounts due and cancellation of open lines of credit. Additionally, failure to meet restrictive covenants related to our debt and credit agreements could trigger cross-default provisions that would cause us to also be in default of our surety agreements. Although we have not had difficulty meeting these covenants in the past, failure to do so in the future could have a material adverse effect on our business and financial condition. |
| As a part of our growth strategy we may make future acquisitions and acquisitions involve many risks. These risks include difficulties integrating the operations and personnel of the acquired companies, diversion of management’s attention from ongoing operations, potential difficulties and increased costs associated with completion of any assumed construction projects, insufficient revenues to offset increased expenses associated with acquisitions and the potential loss of key employees or customers of the acquired companies. Acquisitions may also cause us to increase our liabilities, record goodwill or other non-amortizable intangible assets that will be subject to subsequent impairment testing and potential impairment charges, as well as amortization expenses related to certain other intangible assets. Failure to manage and successfully integrate acquisitions could harm our financial position, results of operations and cash flows. |
The foregoing list is not all-inclusive. There can be no assurance that we have correctly identified and appropriately assessed all factors affecting our business or that the publicly available and other information with respect to these matters is complete and correct. Additional risks and uncertainties not presently known to us or that we currently believe to be immaterial also may adversely affect us. These developments could have material adverse effects on our business, financial condition and results of operations. For these reasons, the reader is cautioned not to place undue reliance on our forward-looking statements.
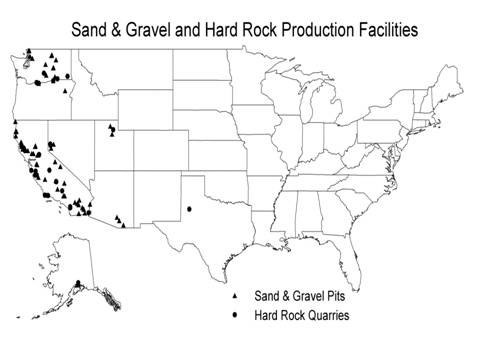
We have 53 active and 37 inactive quarry properties available for the extraction of sand and gravel and hard rock, all of which are located in the western United States. All of our quarries are open-pit and are primarily accessible by road. We process aggregates into construction materials for internal use and for sale to third parties. The following map shows the approximate locations of our permitted quarry properties as of December 31, 2009.
We estimate our permitted proven1 and probable2 aggregate reserves to be 752 million tons with an average permitted life of approximately 38 years at present operating levels. Present operating levels are determined based on a three-year annual average aggregate production rate of 15.9 million tons. Reserve estimates were made by our geologists and engineers based primarily on drilling studies. Our plant equipment is powered mostly by electricity provided by local utility companies.
1Proven reserves are determined through the testing of samples obtained from closely spaced subsurface drilling and/or exposed pit faces. Proven reserves are sufficiently understood so that quantity, quality, and engineering conditions are known with sufficient accuracy to be mined without the need for any further subsurface work. Actual required spacing is based on geologic judgment about the predictability and continuity of each deposit.
2Probable reserves are determined through the testing of samples obtained from subsurface drilling but the sample points are too widely spaced to allow detailed prediction of quantity, quality, and engineering conditions. Additional subsurface work may be needed prior to mining the reserve.
The following tables present information about our quarry properties as of December 31, 2009:
| | Type | | Permitted | | Unpermitted | | Three-Year
Annual Average | | | |
| Quarry Properties | Sand & Gravel | Hard Rock | | Aggregate Reserves (tons) | | Aggregate Reserves (tons) | | Production Rate (tons) | | Average Reserve Life | |
| Owned quarry properties | 31 | 8 | | 416.0 million | | 540.0 million | | 8.0 million | | 47 years | |
Leased quarry properties1 | 35 | 16 | | 336.3 million | | 644.0 million | | 7.9 million | | 33 years | |
1 Our leases have expiration dates which range from 5 to 50 years with most including an option to renew.
| | | | | | Permitted Reserves for Each Product Type (tons) | | | Percentage of Permitted Reserves Owned and Leased | |
| State | | Number of Properties | | | Sand & Gravel | | | Hard Rock | | | Owned | | | Leased | |
| California | | | | | | | | | | | | | | | | % | | | | % |
| Non-California | | | | | | | | | | | | | | | | % | | | | % |
Plant Properties
We operate plants at our quarry sites to process aggregates into construction materials. Some of our quarry sites may have more than one crushing, concrete or asphalt processing plant. At December 31, 2009 and 2008, we owned the following plants:
December 31, | | | 2009 | | | 2008 | | |
Aggregate crushing plants | | | 52 | | | | | |
| | | 69 | | | | | |
Portland cement concrete batch plants | | | 22 | | | | | |
| | | 5 | | | | | |
| | | 9 | | | | | |
Other Properties
The following table provides our estimate of certain information about other properties as of December 31, 2009:
| | Land Area (acres) | Building Square Feet |
Office and shop space (owned and leased) | | |
Real estate held for development and sale and use | | |
Granite West uses approximately 86% of our office and shop space with the remainder being primarily utilized by Granite East.
Silica Litigation
Our wholly-owned subsidiary Granite Construction Company (“GCCO”) is one of approximately 100 to 300 defendants in six active California Superior Court lawsuits. Of the six lawsuits, four were filed against GCCO in 2005 and two were filed against GCCO in 2006, in Alameda County (Dominguez vs. A-1 Aggregates, et al.; Guido vs. A. Teichert & Son, Inc.; Williams vs. A. Teichert & Son, Inc.; Horne vs. Teichert & Son, Inc.; Kammer vs. A-1 Aggregates, et al.; and Solis vs. The 3M Company et al.). Each lawsuit was brought by a single plaintiff who is seeking money damages by way of various causes of action, including strict product and market share liability, and alleges personal injuries caused by exposure to silica products and related materials during the plaintiffs’ use or association with sand blasting or grinding concrete. The plaintiff in each lawsuit has categorized the defendants as equipment defendants, respirator defendants, premises defendants and sand defendants. We have been identified as a sand defendant, meaning a party that manufactured, supplied or distributed silica-containing products. Our investigation revealed that we have not knowingly sold or distributed abrasive silica sand for sandblasting, and therefore, we believe the probability of these lawsuits resulting in an incurrence of a material liability is remote. We have been dismissed from eighteen other similar lawsuits.
Hiawatha Project DBE Issues
The Hiawatha Light Rail Transit (“HLRT”) project was performed by Minnesota Transit Constructors (“MnTC”), a joint venture that consisted of GCCO and other unrelated companies. GCCO was the managing partner of the joint venture, with a 56.5% interest. The Minnesota Department of Transportation (“MnDOT”) is the contracting agency for this federally funded project. The Metropolitan Council is the local agency conduit for providing federal funds to MnDOT for the HLRT project. MnDOT and the U.S. Department of Transportation Office of Inspector General (“OIG”) each conducted a review of the Disadvantaged Business Enterprise (“DBE”) program maintained by MnTC for the HLRT project. In addition, the U.S. Department of Justice (“USDOJ”) is conducting an investigation into compliance issues with respect to MnTC’s DBE Program for the HLRT project. MnDOT and the OIG (collectively, the “Agencies”) have initially identified certain compliance issues in connection with MnTC’s DBE Program and, as a result, have determined that MnTC failed to meet the DBE utilization criteria as represented by MnTC. Although there has been no formal administrative subpoena issued, nor has a civil complaint been filed in connection with the administrative reviews or the investigation, MnDOT has proposed a monetary sanction of $4.3 million against MnTC and specified DBE training for personnel from the members of the MnTC joint venture as a condition of awarding future projects to joint venture members of MnTC on MnDOT and Metropolitan Council work. MnTC is fully cooperating with the Agencies and the USDOJ and has presented its detailed written responses to the initial determinations of the Agencies as well as the investigation by the USDOJ. On September 17, 2009, the USDOJ replied to MnTC’s responses. MnTC and the USDOJ are continuing to engage in informal discussions in an attempt to resolve this matter. Such discussions, if successful, are expected to include resolution of issues with the USDOT and with the state agencies. We cannot, however, rule out the possibility of civil or criminal actions being brought against MnTC or one or more of its members which could result in civil and criminal penalties.
US Highway 20 Project
GCCO and our wholly-owned subsidiary, Granite Northwest, Inc. are the members of a joint venture known as Yaquina River Constructors (“YRC”) which is currently constructing a new road alignment of US Highway 20 near Eddyville, Oregon under contract with the Oregon Department of Transportation (“ODOT”). The project involves constructing seven miles of new road through steep and forested terrain in the Coast Range Mountains. During the fall and winter of 2006, extraordinary rain events produced runoff that overwhelmed erosion control measures installed at the project and resulted in discharges to surface water in alleged violations of YRC’s stormwater permit. In June 2009, YRC was informed that the USDOJ had assumed the criminal investigation that the Oregon Department of Justice had previously been conducting in connection with stormwater runoff from the project. YRC and its members are fully cooperating in the investigation. We do not know whether any criminal charges or civil lawsuits will be brought or against whom, as a result of the investigation. Therefore, we cannot estimate what, if any, criminal or civil penalty or conditional assessment may result from this investigation.
City of San Diego Fire Debris Cleanup
In the aftermath of the 2007 San Diego County wildfires, GCCO bid for and was awarded a fixed unit price, variable quantity contract with the City of San Diego (the “City”) to perform specified debris cleanup work. GCCO began work in November 2007 and completed the work in April 2008. In August 2008, the City announced that it would conduct an independent audit of the project. In December 2008, the City’s audit report was released with findings that, while some GCCO billings contained mistakes, rates paid to GCCO appear to be generally reasonable. GCCO has reimbursed the City for the undisputed overbilled amount of less than $3,000. The former San Diego City Attorney, after conducting a separate investigation of GCCO’s work on the project, filed a civil lawsuit in California Superior Court, County of San Diego on October 17, 2008 against GCCO and another contractor that had been awarded a similar cleanup contract with the City. In the complaint, the City alleges that both contractors knowingly presented to the City false claims for payment in violation of the California False Claims Act. The City seeks trebled damages in an amount to be determined, and a civil penalty in the amount of $10,000 for each false claim made. After the November 2008 election in which a new City Attorney was elected, GCCO and the City Attorney agreed to stay the lawsuit in order to allow the City Attorney time to complete its investigation. The stay expired in January 2010, and the parties have agreed to jointly request a further stay. GCCO believes the allegations in the City’s complaint to be without factual or legal basis and, therefore, the City’s entitlement to relief sought under the California False Claims Act is remote.
Grand Avenue Project DBE Issues
On March 6, 2009, the U.S. Department of Transportation, Office of Inspector General (“OIG”) served upon our wholly-owned subsidiary, Granite Construction Northeast, Inc. (“Granite Northeast”), a United States District Court Eastern District of New York subpoena to testify before a grand jury by producing documents. The subpoena seeks all documents pertaining to a Granite Northeast Disadvantaged Business Enterprise (“DBE”) subcontractor (the “Subcontractor”), and the Subcontractor’s non-DBE lower tier subcontractor/consultant, relating to the Subcontractor’s work on the Grand Avenue Bus Depot and Central Maintenance Facility for the Borough of Queens Project (the “Grand Avenue Project”). The subpoena also seeks all documents regarding Granite Northeast’s use of the Subcontractor as a DBE on the Grand Avenue Project and all documents related to the Subcontractor as a DBE on any other contract including other public works construction projects. We have complied with the subpoena and are fully cooperating with the OIG’s investigation. To date, Granite Northeast has not been notified that it is either a subject or target of the OIG’s investigation. As a result, we do not know whether any criminal charges or civil lawsuits will be brought or against whom, as a result of the investigation. Therefore, we cannot estimate what, if any, criminal or civil penalty or conditional assessment may result from this investigation.
Other Legal Proceedings/Government Inquiries
We are a party to a number of other legal proceedings arising in the normal course of business. From time to time, we also receive inquiries from public agencies seeking information concerning our compliance with government construction contracting requirements and related laws and regulations. We believe that the nature and number of these proceedings and compliance inquiries are typical for a construction firm of our size and scope. Our litigation typically involves claims regarding public liability or contract related issues. While management currently believes, after consultation with counsel, that the ultimate outcome of pending proceedings and compliance inquiries, individually and in the aggregate, will not have a material adverse affect on our financial position or overall trends in results of operations or cash flows, litigation is subject to inherent uncertainties. Were an unfavorable ruling to occur, there exists the possibility of a material adverse affect on our results of operations, cash flows and/or financial position for the period in which the ruling occurs. While any one of our pending legal proceedings is subject to early resolution as a result of our ongoing efforts to settle, whether or when any legal proceeding will be resolved through settlement is neither predictable nor guaranteed.
During the fourth quarter of 2009, no matter was submitted to a vote of security holders through the solicitation of proxies or otherwise.
Executive Officers of the Registrant
Our current executive officers are as follows:
| Name | Age | Position |
| | President, Chief Executive Officer and Director |
| James H. Roberts | 53 | Executive Vice President and Chief Operating Officer |
| LeAnne M. Stewart | 45 | Senior Vice President and Chief Financial Officer |
| Michael F. Donnino | 55 | Senior Vice President and Group Manager |
| John A. Franich | 53 | Vice President and Group Manager |
| Thomas S. Case | 47 | Vice President and Group Manager |
Granite Construction Incorporated was incorporated in Delaware in January 1990 as the holding company for Granite Construction Company, which was incorporated in California in 1922. All dates of service for our executive officers include the periods in which they served for Granite Construction Company.
Mr. Dorey has been an employee of Granite since 1968 and has served in various capacities, including Chief Executive Officer since January 2004 and President since February 2003. He also served as Chief Operating Officer from May 1998 to January 2004, Executive Vice President from November 1998 to February 2003, Senior Vice President from 1990 to 1998, Branch Division Manager from 1987 to 1998, and Vice President and Branch Division Assistant Manager from 1983 to 1987. Mr. Dorey has also served as a member of our Board of Directors since January 2004. He received a B.S. degree in Construction Engineering from Arizona State University in 1967.
Mr. Roberts joined Granite in 1981 and has served in various capacities, including Executive Vice President and Chief Operating Officer since September 2009, Senior Vice President from May 2004 to September 2009, Granite West Manager from February 2007 to September 2009, Branch Division Manager from May 2004 to February 2007, Vice President and Assistant Branch Division Manager from 1999 to 2004, and Regional Manager of Nevada and Utah Operations from 1995 to 1999. He received a B.S.C.E. in 1979 and an M.S.C.E. in 1980 from the University of California, Berkeley, and an M.B.A. from the University of Southern California in 1981. He also completed the Stanford Executive Program in 2009.
Ms. Stewart has been a Senior Vice President of Granite since February 2008. In June 2008, she was appointed Chief Financial Officer. Prior to joining Granite, Ms. Stewart was employed by Nash Finch Company as Senior Vice President and Chief Financial Officer from October 2004 to January 2007 and as Vice President and Corporate Controller from April 2000 to October 2004. She has served on the Board of Trustees of the College of St. Benedict since 1995. Ms. Stewart became a Certified Public Accountant in 1987, received a B.A. in Accounting from the College of St. Benedict in 1987 and an M.B.A. from the Wharton School at the University of Pennsylvania in 1997.
Mr. Donnino joined Granite in 1977 and has served as Senior Vice President and Group Manager since January 2010, Senior Vice President since January 2005, Manager of Granite East since February 2007, and Heavy Construction Division Manager from January 2005 to February 2007. He served as Vice President and Heavy Construction Division Assistant Manager during 2004, Texas Regional Manager from 2000 to 2003 and Dallas Estimating Office Area Manager from 1991 to 2000. Mr. Donnino received a B.S.C.E. in Structural, Water and Soils Engineering from the University of Minnesota in 1976.
Mr. Franich joined Granite in 2005 and has served as Vice President and Group Manager since January 2010, Vice President and Granite West Manager of Construction from February 2007 to December 2009, and Vice President, Branch Division Construction Manager from January 2005 through January 2007. Prior to joining Granite in 2005, Mr. Franich has held various positions in the construction industry since 1979 and was formerly the President of Associated General Contractors of California. Mr. Franich received a B.S. in Business Administration (Finance) from California State University, Chico in 1979.
Mr. Case has been an employee of Granite since 1987 and has been Vice President and Group Manager since January 2010. He also served as Southwest Operating Group Manager from March 2007 to December 2009, Utah Operations Branch Manager from August 2001 through March 2007, Utah Operations Construction Manager during 2001, Utah Operations Materials Manager between 1996 and 2000, and in various positions at Granite’s Nevada and Santa Barbara, California operations between 1986 and 1996. Mr. Case received a B.S. degree in Construction Management from California Polytechnic State University in 1986.
Our common stock trades on the New York Stock Exchange under the ticker symbol GVA.
As of February 12, 2010, there were 38,629,378 shares of our common stock outstanding held by 1,529 shareholders of record.
We have paid quarterly cash dividends since the second quarter of 1990, and we expect to continue to do so. However, declaration and payment of dividends is within the sole discretion of our Board of Directors, subject to limitations imposed by Delaware law and compliance with our credit agreements, and will depend on our earnings, capital requirements, financial condition and such other factors as the Board of Directors deems relevant.
| Market Price and Dividends of Common Stock | | | | | | |
| | December 31, | | | September 30, | | | June 30, | | | March 31, | |
| High | | $ | 34.58 | | | $ | 36.39 | | | $ | 45.94 | | | $ | 45.82 | |
| Low | | $ | 27.14 | | | $ | 29.41 | | | $ | 32.29 | | | $ | 30.14 | |
| Dividends per share | | $ | 0.13 | | | $ | 0.13 | | | $ | 0.13 | | | $ | 0.13 | |
| | | | | | | | | | | | | | | | | |
| 2008 Quarters Ended | | December 31, | | September 30, | | | | June 30, | | | | March 31, | |
| High | | $ | 50.00 | | | $ | 42.24 | | | $ | 37.79 | | | $ | 39.84 | |
| Low | | $ | 21.20 | | | $ | 30.22 | | | $ | 29.19 | | | $ | 26.64 | |
| Dividends per share | | $ | 0.13 | | | $ | 0.13 | | | $ | 0.13 | | | $ | 0.13 | |
During the three months ended December 31, 2009, we did not sell any of our equity securities that were not registered under the Securities Act of 1933, as amended. The following table sets forth information regarding the repurchase of shares of our common stock during the three months ended December 31, 2009:
| Period | | Total Number of Shares Purchased1 | | | Average Price Paid per Share | | | Total Number of Shares Purchased as Part of Publicly Announced Plans or Programs | | | Approximate Dollar Value of Shares that May yet be Purchased Under the Plans or Programs2 | |
October 1 through October 31, 2009 | | | 479 | | | $ | 29.52 | | | | | | | $ | | |
November 1 through November 30, 2009 | | | 89 | | | $ | 31.35 | | | | - | | | $ | | |
December 1 through December 31, 2009 | | | | | | $ | 29.97 | | | | - | | | $ | | |
| | | | | | $ | 29.97 | | | | - | | | | | |
1The number of shares purchased is in connection with employee tax withholding for shares granted under our Amended and Restated 1999 Equity Incentive Plan.
2In October 2007, our Board of Directors authorized us to repurchase, at management’s discretion, up to $200.0 million of our common stock. Under this repurchase program, the Company may repurchase shares from time to time on the open market or in private transactions. The specific timing and amount of repurchases will vary based on market conditions, securities law limitations and other factors. The share repurchase program may be suspended or discontinued at any time without prior notice.
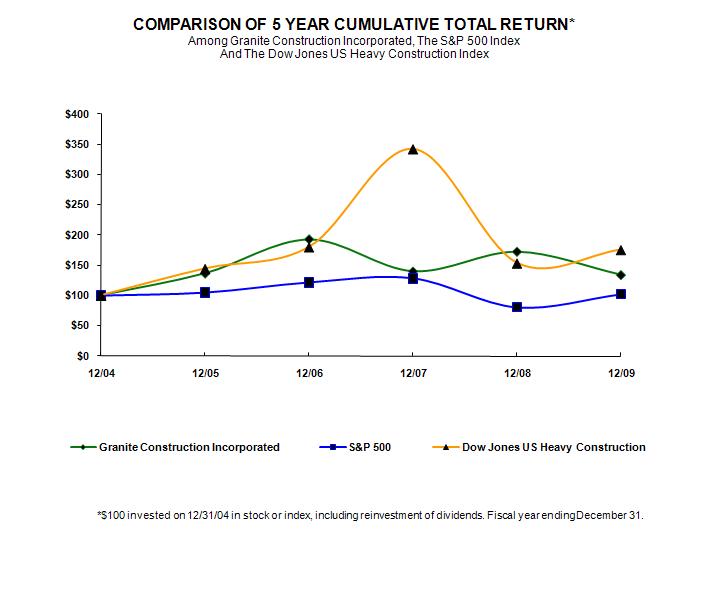
Performance Graph
The graph below compares Granite Construction Incorporated’s cumulative 5-year total shareholder return on common stock with the cumulative total returns of the S&P 500 index and the Dow Jones U.S. Heavy Construction index. The Dow Jones U.S. Heavy Construction index includes the following companies: EMCOR Group Inc., Fluor Corp., Foster Wheeler Ltd., Granite Construction Inc., Insituform Technologies Inc., Jacobs Engineering Group Inc., KBR Inc., McDermott International Inc., Quanta Services Inc. and Shaw Group Inc. The graph tracks the performance of a $100 investment in our common stock and in each of the indexes (with reinvestment of all dividends) from December 31, 2004 to December 31, 2009.
| | | 2004 | | | 2005 | | | 2006 | | | 2007 | | | 2008 | | | 2009 | |
| Granite Construction Incorporated | | $ | 100.00 | | | $ | 136.76 | | | $ | 193.23 | | | $ | 140.14 | | | $ | 172.69 | | | $ | 134.32 | |
| S&P 500 | | | 100.00 | | | | 104.91 | | | | 121.48 | | | | 128.16 | | | | 80.74 | | | | 102.11 | |
| Dow Jones U.S. Heavy Construction | | | 100.00 | | | | 144.50 | | | | 180.25 | | | | 342.40 | | | | 153.66 | | | | 175.65 | |
The selected consolidated operations data for 2009, 2008 and 2007 and consolidated balance sheet data as of December 31, 2009 and 2008 set forth below have been derived from our audited consolidated financial statements included herein, and are qualified by reference to those consolidated financial statements. The selected consolidated operations data for 2006 and 2005 and the consolidated balance sheet data as of December 31, 2007, 2006 and 2005 have been derived from our audited consolidated financial statements not included herein. These historical results are not necessarily indicative of the results of operations to be expected for any future period.
| Selected Consolidated Financial Data | | |
| Years Ended December 31, | | 2009 | | | 2008 | | | 2007 | | | 2006 | | | | 2005 | | |
| Operating Summary | (Dollars In Thousands, Except Per Share Data) | | |
| | $ | 1,963,479 | | | $ | 2,674,244 | | | $ | 2,737,914 | | | $ | 2,969,604 | | | $ | 2,641,352 | | |
| | | 346,373 | | | | 468,720 | | | | 410,744 | | | | 295,720 | | | | 319,372 | | |
| | | 17.6 | % | | | 17.5 | % | | | 15.0 | % | | | 10.0 | % | | | 12.1 | % | |
General and administrative expenses | | | 224,910 | | | | 257,532 | | | | 246,202 | | | | 199,481 | | | | 192,692 | | |
| | | 11.5 | % | | | 9.6 | % | | | 9.0 | % | | | 6.7 | % | | | 7.3 | % | |
| Restructuring charges1 | | | 9,453 | | | | - | | | | - | | | | - | | | | - | | |
Goodwill impairment charge2 | | | - | | | | - | | | | - | | | | 18,011 | | | | - | | |
| Net income | | | 100,201 | | | | 165,738 | | | | 132,924 | | | | 74,339 | | | | 100,898 | | |
Amount attributable to noncontrolling interests3 | | | (26,701 | ) | | | (43,334 | ) | | | (20,859 | ) | | | 6,170 | | | | (17,748 | ) | |
Net income attributable to Granite | | | 73,500 | | | | 122,404 | | | | 112,065 | | | | 80,509 | | | | 83,150 | | |
| | | 3.7 | % | | | 4.6 | % | | | 4.1 | % | | | 2.7 | % | | | 3.1 | % | |
Net income per share attributable to common shareholders4: | | | | | | | | | | | | | | | | | | | | | |
| | $ | 1.91 | | | $ | 3.19 | | | $ | 2.69 | | | $ | 1.93 | | | $ | 2.00 | | |
| | | 1.90 | | | | 3.18 | | | | 2.68 | | | | 1.92 | | | | 1.99 | | |
Weighted average shares of common stock: | | | | | | | | | | | | | | | | | | | | | |
| | | 37,566 | | | | 37,606 | | | | 40,866 | | | | 40,874 | | | | 40,614 | | |
| | | 37,683 | | | | 37,709 | | | | 40,909 | | | | 40,920 | | | | 40,684 | | |
Consolidated Balance Sheet | | | | | | | | | | | | | | | | | | | | | |
| | $ | 1,709,575 | | | $ | 1,743,455 | | | $ | 1,786,418 | | | $ | 1,632,838 | | | $ | 1,472,230 | | |
Cash, cash equivalents and marketable securities | | | 458,341 | | | | 520,402 | | | | 485,348 | | | | 394,878 | | | | 301,381 | | |
| | | 500,605 | | | | 475,942 | | | | 397,568 | | | | 319,762 | | | | 367,801 | | |
Current maturities of long-term debt | | | 58,978 | | | | 39,692 | | | | 28,696 | | | | 28,660 | | | | 26,888 | | |
| | | 244,688 | | | | 250,687 | | | | 268,417 | | | | 78,576 | | | | 124,415 | | |
Other long-term liabilities | | | 48,998 | | | | 43,604 | | | | 46,441 | | | | 58,419 | | | | 46,556 | | |
Granite shareholders’ equity | | | 830,651 | | | | 767,509 | | | | 700,199 | | | | 694,544 | | | | 621,560 | | |
| | | 21.50 | | | | 20.06 | | | | 17.75 | | | | 16.60 | | | | 14.91 | | |
| | | 0.52 | | | | 0.52 | | | | 0.43 | | | | 0.40 | | | | 0.40 | | |
Common shares outstanding | | | 38,635 | | | | 38,267 | | | | 39,451 | | | | 41,834 | | | | 41,682 | | |
| | $ | 1,401,988 | | | $ | 1,699,396 | | | $ | 2,084,545 | | | $ | 2,256,587 | | | $ | 2,331,540 | | |
1 During 2009, we recorded restructuring charges of approximately $9.5 million as part of our reorganization.
2 In 2006, we recorded a goodwill impairment charge of approximately $18.0 million related to our Granite Northeast operation in New York.
3 Effective January 1, 2009, we adopted a new accounting standard requiring net income attributable to both the parent and noncontrolling interests to be disclosed separately as well as the components of equity attributable to the parent and noncontrolling interests. Prior years have been adjusted to conform to this new standard.
4 Computed using the two-class method required by accounting standards adopted January 1, 2009, which requires prior period per share data to be restated retrospectively for comparability.
General
We are one of the largest heavy civil contractors in the United States engaged in the construction and improvement of streets, roads, highways, mass transit facilities, airport infrastructure, bridges, dams and other infrastructure-related projects. We produce construction materials through the use of our aggregate reserves and plant facilities. We also operate a real estate investment and development company on a significantly smaller scale. We have three operating segments: Granite West, Granite East and Granite Land Company (“GLC”). Our offices are located in Alaska, Arizona, California, Florida, Nevada, New York, Oregon, Texas, Utah and Washington.
Our construction business has been organized into two geographic segments, Granite West and Granite East. Included in our Granite West segment is our vertically integrated construction materials business. The Company also has a real estate investment and development business, Granite Land Company (“GLC”). Our results of operations discussed herein have been reported with the segment structure that was in place during 2009. See Note 20 of “Notes to the Consolidated Financial Statements” for additional information about our operating segments.
On August 31, 2009, we announced changes to our organizational structure designed to improve operating efficiencies and position the Company for long-term growth. In conjunction with the reorganization we are changing our reportable segments to reflect our business product lines. Beginning in fiscal 2010, the Company’s new reportable segments are: Construction, Large Project Construction, Construction Materials and Real Estate. The Real Estate segment will contain what was previously known as Granite Land Company. We will continue to provide geographic information within the new segment structure.
Our contracts are obtained primarily through competitive bidding in response to advertisements by both public agencies and private parties and to a lesser extent on a negotiated basis as a result of direct solicitation by private parties. Our bidding activity is affected by such factors as contract backlog, available personnel, current utilization of equipment and other resources, our ability to obtain necessary surety bonds and competitive considerations. Bidding activity, contract backlog and revenue resulting from the award of new contracts may vary significantly from period to period.
The three primary economic drivers of our business are (1) the overall health of the economy, (2) federal, state and local public funding levels and (3) population growth with the resulting private development. For example, a stagnant or declining economy will generally result in reduced demand for construction in the private sector. This reduced demand increases competition for private sector projects and will ultimately also increase competition in the public sector as companies migrate from bidding on scarce private sector work to projects in the public sector. Greater competition can reduce our revenue growth and/or have a downward affect on gross profit margins. In addition, a stagnant or declining economy tends to produce less tax revenue, thereby decreasing a source of funds available for spending on public infrastructure improvements. Some funding sources that have been specifically earmarked for infrastructure spending, such as diesel and gasoline taxes, are not as directly affected by a stagnant or declining economy. However, even these can be temporarily at risk as state and local governments struggle to balance their budgets. Additionally, high fuel prices can have a dampening effect on consumption, resulting in overall lower tax revenue. Conversely, increased levels of public funding as well as an expanding or robust economy will generally increase demand for our services and provide opportunities for revenue growth and margin improvement.
Our general and administrative expenses include salaries and related expenses, incentive compensation, discretionary profit sharing, provision for doubtful accounts and other costs to support our business. In general, these costs will increase in response to the growth and the related increased complexity of our business. These costs will vary depending on the number of projects in process in a particular area and the corresponding level of estimating activity. For example, as large projects are completed or if the level of work slows down in a particular area, we will often re-assign project employees to estimating and bidding activities until another project gets underway, temporarily re-allocating their salaries and related costs from cost of revenue to general and administrative expense. Additionally, our compensation strategy for selected management personnel is to rely heavily on a variable cash and restricted stock performance-based incentive element. The cash portion of these incentives is expensed when earned while the restricted stock portion is expensed over the vesting period of the restricted stock award (generally three to five years).
Critical Accounting Policies and Estimates
The financial statements included in “Item 8. Financial Statements and Supplementary Data” have been prepared in accordance with accounting principles generally accepted in the United States of America (“U.S. GAAP”). The preparation of these financial statements requires management to make estimates and assumptions that affect the reported amounts of assets and liabilities, revenue and expenses, and related disclosure of contingent assets and liabilities. Our estimates, judgments and assumptions are continually evaluated based on available information and experiences; however, actual amounts could differ from those estimates.
Certain of our accounting policies and estimates require higher degrees of judgment in their application. These include the recognition of revenue and earnings from construction contracts, the valuation of real estate held for development and sale and insurance estimates. The Audit and Compliance Committee of our Board of Directors has reviewed our disclosure of critical accounting estimates.
Revenue Recognition for Construction Contracts
Revenue and earnings on construction contracts, including construction joint ventures, are recognized under the percentage of completion method using the ratio of costs incurred to estimated total costs. Revenue in an amount equal to cost incurred is recognized prior to contracts reaching 25% completion, thus deferring the related profit. It is our judgment that until a project reaches 25% completion, there is insufficient information to determine the estimated profit on the project with a reasonable level of certainty. In the case of large, complex design/build projects we may defer profit recognition beyond the point of 25% completion based on an evaluation of specific project risks. The factors considered in this evaluation include the stage of design completion, the stage of construction completion, status of outstanding purchase orders and subcontracts, certainty of quantities of labor and materials, and certainty of schedule and the relationship with the owner.
Revenue from contract claims is recognized when we have a signed agreement and payment is assured. Revenue from contract change orders, which occur in most large projects, is recognized when the owner has agreed to the change order in writing. Provisions are recognized in the consolidated statements of income for the full amount of estimated losses on uncompleted contracts whenever evidence indicates that the estimated total cost of a contract exceeds its estimated total revenue. All contract costs, including those associated with claims and change orders, are recorded as incurred and revisions to estimated total costs are reflected as soon as the obligation to perform is determined. Contract cost consists of direct costs on contracts, including labor and materials, amounts payable to subcontractors, direct overhead costs and equipment expense (primarily depreciation, fuel, maintenance and repairs).
The accuracy of our revenue and profit recognition in a given period is dependent on the accuracy of our estimates of the cost to complete each project. Cost estimates for all of our significant projects use a highly detailed “bottom up” approach and we believe our experience allows us to provide materially reliable estimates. There are a number of factors that can contribute to changes in estimates of contract cost and profitability. The most significant of these include:
| · | the completeness and accuracy of the original bid; |
| · | costs associated with added scope changes; |
| · | extended overhead due to owner, weather and other delays; |
| · | subcontractor performance issues; |
| · | changes in productivity expectations; |
| · | site conditions that differ from those assumed in the original bid (to the extent contract remedies are unavailable); |
| · | the availability and skill level of workers in the geographic location of the project; and |
| · | a change in the availability and proximity of equipment and materials. |
The foregoing factors as well as the stage of completion of contracts in process and the mix of contracts at different margins may cause fluctuations in gross profit between periods. Substantial changes in cost estimates, particularly in our larger, more complex projects have had, and can in future periods have, a significant effect on our profitability.
Our contracts with our customers are primarily either “fixed unit price” or “fixed price.” Under fixed unit price contracts, we are committed to provide materials or services required by a project at fixed unit prices (for example, dollars per cubic yard of concrete poured or cubic yards of earth excavated). While the fixed unit price contract shifts the risk of estimating the quantity of units required for a particular project to the customer, any increase in our unit cost over the expected unit cost in the bid, whether due to inflation, inefficiency, faulty estimates or other factors, is borne by us unless otherwise provided in the contract. Fixed price contracts are priced on a lump-sum basis under which we bear the risk that we may not be able to perform all the work profitably for the specified contract amount. The percentage of fixed price contracts in our contract backlog increased from approximately 68.7% at December 31, 2008 to approximately 75.1% at December 31, 2009. All state and federal government contracts and many of our other contracts provide for termination of the contract at the convenience of the party contracting with us, with provisions to pay us for work performed through the date of termination.
Valuation of Real Estate Held for Development and Sale
We assess impairment of our real estate held for development and sale at least annually or whenever events or changes in circumstances indicate that carrying values of these assets may not be recoverable. Events or changes in circumstances, which could trigger an impairment review include, but are not limited to:
| · | significant decreases in the market price of the asset; |
| · | significant adverse changes in legal factors or the business climate; |
| · | accumulation of costs significantly in excess of the amount originally expected for the acquisition, development or construction of the asset; and |
| · | current period cash flow or operating losses combined with a history of losses, or a forecast of continuing losses associated with the use of the asset. |
If events and changes in circumstances indicate that the carrying amounts of the real estate held for development and sale might not be fully recoverable, we compare projected undiscounted net cash flows associated with the related asset or group of assets against their respective carrying amounts. Future undiscounted cash flows are estimated based on entitlement status, market conditions, cost of construction, debt load, development schedules, status of joint venture partners and other factors applicable to the specific project. In the event that the projected undiscounted cash flows are not sufficient to recover the carrying value of the assets, the assets are written down to their estimated fair values. Fair value is estimated based on the expected future cash flows attributable to the asset or group of assets and on other assumptions that market participants would use in determining fair value, such as market discount rates, transaction prices for other comparable assets, and other market data. Our estimates of cash flows may differ from actual cash flows due to, among other things, fluctuations in interest rates, decisions made by jurisdictional agencies, economic conditions, or changes to our business operations.
In 2009 and 2008, we recorded impairment charges of $1.7 million and $4.5 million, respectively. The impairments were due to changes in sales and pricing projections for three of our residential real estate investments that reduced the estimated fair value of the assets below the carrying amounts. Given the current economic environment surrounding real estate, we regularly evaluate the recoverability of our real estate held for development and sale and have determined that no further impairment loss was required. A continued decline in the residential and/or commercial real estate markets may decrease the expected profitability for certain development activities to the point we would be required to recognize additional impairments in the future.
Insurance Estimates
We carry insurance policies to cover various risks, primarily general liability and workers compensation, under which we are liable to reimburse the insurance company for a portion of each claim paid. Payment for claim amounts generally range from the first $0.5 million to $1.0 million per occurrence. We accrue for the estimated ultimate liability for incurred losses, both reported and unreported, using actuarial methods based on historic trends, modified, if necessary, by recent events. Changes in our loss assumptions caused by changes in actual experience would affect our assessment of the ultimate liability and could have a material effect on our operating results and financial position.
Current Economic Environment and Outlook for 2010
Challenging market conditions negatively affected our overall revenue and contract backlog in 2009. The continued weak residential and commercial development markets significantly reduced demand for our construction materials and created a highly competitive bidding environment for available public sector work. In addition, the slow pace of the economic recovery has affected the financial health of state and local agencies and ultimately the amount of work available to bid.
We currently expect 2010 to be a challenging year for our business due to the ongoing competitive climate and uncertainty surrounding both federal and state funding. Despite an increase in contract backlog in Granite East, our contract backlog in Granite West is substantially lower and includes projects with lower projected gross profit margins than recent years. In response, we have reduced our planned capital spending from recent levels and will continue to focus on reducing our costs.
Results of Operations
| Comparative Financial Summary | | | | | | | |
Years Ended December 31, | | 2009 | | 2008 | | 2007 | |
(in thousands) | | | |
| | | 1,963,479 | | | | | | | |
| | | 346,373 | | | | | | | |
| Restructuring charges | | | 9,453 | | | - | | | - | |
| | | 129,179 | | | | | | | |
| | | 9,672 | | | | | | | |
Provision for income taxes | | | 38,650 | | | | | | | |
Amount attributable to noncontrolling interests | | | (26,701 | ) | | | ) | | | ) |
Net income attributable to Granite | | | 73,500 | | | | | | | |
Revenue
| Total Revenue | | | | | | | |
| Years Ended December 31, | | 2009 | | 2008 | | 2007 | |
| (in thousands) | | Amount | | Percent | | Amount | | Percent | | Amount | | Percent | |
| | | | | | | | | | | | | | | | | | | |
| | | 1,411,016 | | | 71.9 | | | | | | | | | | | | | |
| | | 550,189 | | | 28.0 | | | | | | | | | | | | | |
| | | 2,274 | | | 0.1 | | | | | | | | | | | | | |
| | | 1,963,479 | | | 100.0 | | | | | | | | | | | | | |
| Granite West Revenue | | | | | | | |
Years Ended December 31, | | 2009 | | 2008 | | 2007 | |
| (in thousands) | | Amount | | Percent | | Amount | | Percent | | Amount | | Percent | |
| | | | | | | | | | | | | | | | | | | |
| | | 512,111 | | | 75.7 | | | | | | | | | | | | | |
| | | 36,499 | | | 5.4 | | | | | | | | | | | | | |
| | | 127,649 | | | 18.9 | | | | | | | | | | | | | |
| | | 676,259 | | | 100.0 | | | | | | | | | | | | | |
West (excluding California): | | | | | | | | | | | | | | | | | | | |
| | | 624,517 | | | 85.0 | | | | | | | | | | | | | |
| | | 31,944 | | | 4.3 | | | | | | | | | | | | | |
| | | 78,296 | | | 10.7 | | | | | | | | | | | | | |
| | | 734,757 | | | 100.0 | | | | | | | | | | | | | |
| | | | | | | | | | | | | | | | | | | |
| | | 1,136,628 | | | 80.5 | | | | | | | | | | | | | |
| | | 68,443 | | | 4.9 | | | | | | | | | | | | | |
| | | 205,945 | | | 14.6 | | | | | | | | | | | | | |
| | | 1,411,016 | | | 100.0 | | | | | | | | | | | | | |
Granite West Revenue: Revenue from Granite West for the year ended December 31, 2009 decreased by $559.2 million, or 28.4%, compared to the year ended December 31, 2008 as a result of the economic downturn and decline in residential development in the West. The decrease in revenue affected all sectors of our Granite West segment. With less private work available, competition has migrated into the public sector. In addition, lack of available private sector work has reduced the demand for construction materials. There is also less work available for bid in the public sector as a result of reduced state and local government budgets.
| Granite East Revenue | | | | | | | | | | | | | |
Years Ended December 31, | | 2009 | | 2008 | | 2007 | |
(in thousands) | | Amount | | Percent | | Amount | | Percent | | Amount | | Percent | |
Revenue by Geographic Area: | | | | | | | | | | | | | | | | | | | |
| | | 157,338 | | | 28.6 | | | | | | | | | | | | | |
| | | 117,783 | | | 21.4 | | | | | | | | | | | | | |
| | | 95,612 | | | 17.4 | | | | | | | | | | | | | |
| | | 178,467 | | | 32.4 | | | | | | | | | | | | | |
| | | 989 | | | 0.2 | | | | | | | | | | | | | |
| | | 550,189 | | | 100.0 | | | | | | | | | | | | | |
Revenue by Market Sector: | | | | | | | | | | | | | | | | | | | |
| | | 544,719 | | | 99.0 | | | | | | | | | | | | | |
| | | 5,470 | | | 1.0 | | | | | | | | | | | | | |
| | | 550,189 | | | 100.0 | | | | | | | | | | | | | |
Granite East Revenue: Revenue from Granite East for the year ended December 31, 2009 decreased by $144.8 million, or 20.8%, compared to the year ended December 31, 2008. This decrease was the result of an increased number of large projects nearing completion in 2009 compared to 2008, the stage of a large project when revenue recognition typically slows. Additionally, in 2009, delays in notices to proceed on three awarded projects contributed to lower revenue. Included in Granite East revenue for the years ended 2009 and 2008, were settlements of negotiated claims with contract owners in the amounts of $16.0 million and $39.3 million, respectively, both of which improved revenue.
The following table provides information about revenue from our large projects for the years ended December 31, 2009, 2008 and 2007:
| Large Project Revenue | | | | | | | | |
| Years Ended December 31, | | 2009 | | 2008 | | 2007 | |
| | | | | | | | | | |
| | | 142,555 | | | | | | | |
| | | 6 | | | | | | | |
| | | 496,561 | | | | | | | |
| | | 19 | | | | | | | |
| | | 639,116 | | | | | | | |
| | | 25 | | | | | | | |
1 Includes only projects with a total contract value greater than $50.0 million and over $1.0 million of revenue in the respective periods.
Granite Land Company Revenue: Revenue from GLC for the year ended December 31, 2009 decreased by $6.7 million, or 74.8%, compared to the year ended December 31, 2008. GLC’s revenues have been negatively impacted by the downturn in the real estate market.
Contract Backlog
Our contract backlog is comprised of the unearned revenue on awarded contracts that have not been completed, including 100% of our consolidated joint ventures and our proportionate share of unconsolidated joint venture contracts. We include a construction project in our contract backlog at such time as a contract is awarded and funding is in place, with the exception of certain federal government contracts for which funding is appropriated on a periodic basis. Substantially all of the contracts in our contract backlog may be canceled or modified at the election of the customer; however, we have not been materially adversely affected by contract cancellations or modifications in the past.
The following tables illustrate our contract backlog as of the respective dates:
| Total Contract Backlog | | | |
| December 31, | | 2009 | | 2008 | |
| (in thousands) | | Amount | | Percent | | Amount | | Percent | |
Contract Backlog by Segment: | | | | | | | | | | | | | |
| | | 439,155 | | | 31.3 | | | | | | | |
| | | 962,833 | | | 68.7 | | | | | | | |
| | | 1,401,988 | | | 100.0 | | | | | | | |
| Granite West Contract Backlog | | | | | |
December 31, | | 2009 | | 2008 | |
(in thousands) | | Amount | | Percent | | Amount | | Percent | |
| | | | | | | | | | | | | |
| | | 218,701 | | | 96.6 | | | | | | | |
| | | 7,608 | | | 3.4 | | | | | | | |
| | | 226,309 | | | 100.0 | | | | | | | |
West (excluding California): | | | | | | | | | | | | | |
| | | 208,215 | | | 97.8 | | | | | | | |
| | | 4,631 | | | 2.2 | | | | | | | |
| | | 212,846 | | | 100.0 | | | | | | | |
| | | | | | | | | | | | | |
| | | 426,916 | | | 97.2 | | | | | | | |
| | | 12,239 | | | 2.8 | | | | | | | |
| | | 439,155 | | | 100.0 | | | | | | | |
Granite West Contract Backlog: Granite West contract backlog of $439.2 million at December 31, 2009 was $349.7 million, or 44.3%, lower than at December 31, 2008. The decrease in contract backlog was due to a number of projects being completed or nearing completion in 2009. Additionally, the current economic climate and increased competition significantly reduced new awards in contract backlog at December 31, 2009 relative to 2008.
| Granite East Contract Backlog | | | | | | | | | |
December 31, | | 2009 | | 2008 | |
(in thousands) | | Amount | | Percent | | Amount | | Percent | |
Contract Backlog by Geographic Area: | | | | | | | | | | | | | |
| | | 13,604 | | | 1.4 | | | | | | | |
| | | 434,873 | | | 45.2 | | | | | | | |
| | | 78,285 | | | 8.1 | | | | | | | |
| | | 434,343 | | | 45.1 | | | | | | | |
| | | 1,728 | | | 0.2 | | | | | | | |
| | | 962,833 | | | 100.0 | | | | | | | |
| Contract Backlog by Market Sector: | | | | | | | | | | | | | |
| Public sector | | $ | 960,926 | | | 99.8 | | $ | | | | | |
| Private sector | | | 1,907 | | | 0.2 | | | | | | | |
| Total | | $ | 962,833 | | | 100.0 | | $ | | | | 100.0 | |
Granite East Contract Backlog: Granite East contract backlog of $962.8 million at December 31, 2009 was $52.3 million, or 5.7%, higher than at December 31, 2008. The increase reflects new projects awarded in 2009, including our portion of the work for the expansion of Houston’s light rail project, as well as our participation in joint ventures for a tunnel in New York City and a highway reconstruction project in North Carolina. The decrease in contract backlog in the Midwest was due to the substantial completion of a large design/build project in St. Louis, Missouri. Not included in contract backlog is approximately $400.0 million associated with the Houston light rail project that will be booked into contract backlog as additional notices to proceed are received.
The following tables provide additional information about our large project contract backlog at December 31, 2009 and 2008:
| Large Project Contract Backlog | | | |
| 2009 | 2008 | |
(dollars in thousands) | | | | |
| Granite West | | $ | 113,543 | | $ | 243,818 | |
Number of projects1 | | | 4 | | | 6 | |
| Granite East | | $ | 932,917 | | $ | 868,638 | |
Number of projects1 | | | 15 | | | 14 | |
| Total | | $ | 1,046,460 | | $ | 1,112,456 | |
Number of projects1 | | | 19 | | | 20 | |
Large Project Contract Backlog by Expected Profitability (dollars in thousands) | | | | | | |
| December 31, 2009 | | Number of Projects1 | Average Percent Complete | | Remaining Contract Backlog | | Percent | |
Projects with Forecasted Loss: | | | | | | | | | |
| | 1 | | | | | | 62,013 | | 5.9% | |
| | 5 | | | | | | 32,347 | | 3.1% | |
| | 6 | | | | | | 94,360 | | 9.0% | |
Projects with Forecasted Profit: | | | | | | | | | | | |
| | 3 | | | | | | 51,531 | | 4.9% | |
| | 10 | | | | | | 900,569 | | 86.1% | |
| | 13 | | | | | | 952,100 | | 91.0% | |
| | | | | | | | 1,046,460 | | 100.0% | |
| December 31, 2008 | | | | | | | | |
Projects with Forecasted Loss: | | | | | | | | | |
| | | | | | | | | | | |
| | | | | | | | | | | |
| | | | | | | | | | | |
Projects with Forecasted Profit: | | | | | | | | | | | |
| | | | | | | | | | | |
| | | | | | | | | | | |
| | | | | | | | | | | |
| | | | | | | | | | | |
1Includes only projects with total contract value greater than $50.0 million and remaining contract backlog over $1.0 million.
Gross Profit (Loss)
The following table presents gross profit (loss) by operating segment for the respective periods:
| Gross Profit (Loss) | | | | | | | | | | | |
Years Ended December 31, | | 2009 | | | 2008 | | | 2007 | | | |
(in thousands) | | | | | |
| | | 236,868 | | | | | | | | | | | |
Percent of segment revenue | | | 16.8 | | % | | | | % | | | | % | |
| | | 110,823 | | | | | | | | | | | |
Percent of segment revenue | | | 20.1 | | % | | | | % | | | | % | |
| | | (1,318 | ) | | | | ) | | | | | | |
Percent of segment revenue | | | (58.0 | | % | | | | % | | | | % | |
| | | 346,373 | | | | | | | | | | | |
| | | 17.6 | | % | | | | % | | | | % | |
Gross Profit (Loss): We defer profit recognition until a project reaches 25% completion. In the case of large, complex design/build projects, we may defer profit recognition beyond the point of 25% completion until such time as we believe we have enough information to make a reasonably dependable estimate of contract revenue and cost. Because we have a large number of smaller projects at various stages of completion in Granite West, this policy generally has a lesser affect on Granite West’s gross profit on a quarterly or annual basis. However, Granite East has fewer projects in process at any given time and those projects tend to be much larger than Granite West projects. As a result, Granite East gross profit as a percent of revenue can vary significantly from period to period where one or several very large projects reach our percentage of completion threshold and the deferred profit is recognized or, conversely, in periods where contract backlog is growing rapidly and a higher percentage of projects are in their early stages with no associated gross profit recognition.
Revenue from projects that have not yet reached our profit recognition threshold is as follows:
| Revenue from Contracts with Deferred Profit | | | | | | | | | | | |
Years Ended December 31, | | 2009 | | | 2008 | | | 2007 | | | |
(in thousands) | | | | | |
| | | 5,664 | | | | | | | | | | | |
| | | 63,098 | | | | | | | | | | | |
Total revenue from contracts with deferred profit | | | 68,762 | | | | | | | | | | | |
We do not recognize revenue from contract claims until we have a signed agreement and payment is assured, nor do we recognize revenue from contract change orders until the contract owner has agreed to the change order in writing. However, we do recognize the costs related to any contract claims or pending change orders in our forecasts when costs are incurred and revisions to estimated total costs are reflected as soon as the obligation to perform is determined. As a result, our gross profit as a percent of revenue can vary depending on the magnitude and timing of settlement claims and change orders.
When we experience significant contract forecast changes, we undergo a process that includes reviewing the nature of the changes to ensure that there are no material amounts that should have been recorded in a prior period rather than as a change in estimate for the current period. In our review of these changes, we did not identify any material amounts that should have been recorded in a prior period.
Granite West Gross Profit: Granite West gross profit in 2009 decreased to $236.9 million, or 16.8%, from $348.8 million, or 17.7%, in 2008. Construction gross profit as a percent of construction revenue remained relatively unchanged at 18.5% and 18.9% for 2009 and 2008, respectively. Construction gross profit margins were negatively affected by lower gross profit margins on projects bid in a more competitive environment, offset by the positive effect of significant project forecast changes of $44.6 million for the year ended December 31, 2009 compared with $44.5 million for the year ended December 31, 2008. These positive forecast changes were due to change orders, resolution of issues with owners, projects nearing completion and production efficiencies (see Note 2 of “Notes to the Consolidated Financial Statements”).
Construction materials gross profit as a percent of material sales in 2009 decreased to 7.0% from 11.9% in 2008. Fixed plant costs together with decreased sales contributed to lower gross profit.
Granite East Gross Profit: Granite East gross profit in 2009 decreased to $110.8 million from $121.4 million in 2008. Gross profit as a percent of revenue increased to 20.1% in 2009 from 17.5% in 2008 as a result of improved margins. The increase was primarily related to the resolution of project uncertainties on projects nearing completion as well as improved project productivity. Gross profits in 2009 and 2008 were favorably affected by negotiated claims settlements with contract owners for $18.3 million and $32.2 million, respectively. The positive effect of significant project forecast changes was $59.5 million for the year ended December 31, 2009 compared to $50.5 million for the year ended December 31, 2008. These positive forecast changes were due to the resolution of project uncertainties, the settlement of outstanding issues with various contract owners and improved productivity on certain projects (see Note 2 of “Notes to the Consolidated Financial Statements”).
GLC Gross Loss: GLC recorded gross losses of $1.3 million and $1.5 million for the years ended December 31, 2009 and 2008, respectively. These gross losses included amounts attributable to noncontrolling interests of $2.5 million in 2009 and $0.6 million in 2008.
During 2009 and 2008, we recorded impairment charges related to our real estate held for development and sale of $1.7 million and $4.5 million, respectively. A continued decline in the residential and/or commercial real estate markets may decrease the expected profitability of certain development activities to the point that we would be required to recognize additional valuation impairments in the future.
General and Administrative Expenses
The following table presents the components of general and administrative expenses for the respective periods:
Years ended December 31, | | 2009 | | 2008 | | 2007 | | |
(in thousands) | | | | |
| Salaries and related expenses | | $ | 125,381 | | $ | 131,811 | | $ | 124,804 | | |
Incentive compensation, discretionary profit sharing and other variable compensation | | | 34,602 | | | | | | | | |
| (Recovery of) provision for doubtful accounts, net | | | (4,404 | ) | | 10,958 | | | 3,894 | | |
Other general and administrative expenses | | | 69,331 | | | | | | | | |
| | | 224,910 | | | | | | | | |
| | | 11.5 | | | | | | | | |
General and administrative expenses for 2009 decreased $32.6 million, or 12.7%, compared to 2008 as we continue to reduce our overall cost structure. Salaries and incentive compensation declined by $9.5 million, or 5.6%, compared to 2008 as a result of reduced headcount and lower incentive compensation associated with lower profits in 2009. For 2009, our provision for doubtful accounts was offset by the recovery of $4.6 million related to one account with a real estate developer that had been reserved for in 2008.
Other general and administrative expenses include information technology, occupancy, office supplies, depreciation, travel and entertainment, outside services, marketing, training and other miscellaneous expenses, none of which individually exceeded 10% of total general and administrative expenses. Approximately $5.3 million of the decrease in other general and administrative expenses in 2009 was due to lower travel expenses, and a reduction in relocation and occupancy costs.
Restructuring Charges
Years Ended December 31, | | 2009 | | 2008 | | 2007 | |
(in thousands) | | | |
| | | 9,453 | | | | | | | |
During 2009, we recorded restructuring charges of approximately $9.5 million as part of our reorganization. Included in this amount was $7.0 million associated with a reduction in force announced on October 1, 2009 and an impairment of $2.5 million related to selected plant facilities in the Pacific Northwest. Of the total charges, $3.0 million remains outstanding as of December 31, 2009. We estimate annualized pre-tax savings associated with the personnel reduction to be approximately $11.0 million.
The following table presents the components of other income (expense) for the respective periods:
Years Ended December 31, | | 2009 | | 2008 | | 2007 | |
| (in thousands) | | | |
| | | 5,049 | | | | | | | |
| | | (15,756 | ) | | | | | | |
| | | - | | | | | | | ) |
Equity in income (loss) of affiliates | | | 7,696 | | | | ) | | | |
| | | 12,683 | | | | | | | |
| | | 9,672 | | | | | | | |
Interest income decreased $13.4 million, or 72.6%, in 2009 compared to 2008 as investment interest yields on marketable securities were lower in 2009. The change in equity in income (loss) of affiliates during 2009 was primarily due to an increase in income earned on our investment in an entity that owns and operates an asphalt terminal in Nevada, which is accounted for under the equity method. In 2009, other income, net included a gain on the sale of gold, a by-product of our aggregate mining operations, of $10.2 million and a gain on assets held in the Rabbi Trust related to our Non-Qualified Deferred Compensation Plan of $2.2 million. Other income, net, in 2008 included a $10.9 million loss on the sale of available-for-sale securities, a $9.3 million gain on the sale of gold and a $14.4 million gain on the sale of an investment in an affiliate.
Provision for Income Taxes
The following table presents the provision for income taxes for the respective periods:
| Years Ended December 31, | | 2009 | | 2008 | | 2007 | | |
| (in thousands) | | | | |
| Provision for income taxes | | $ | 38,650 | | $ | | | $ | | | |
| Effective tax rate | | | 27.8 | % | | 29.0 | % | | | % | |
Our effective tax rate decreased to 27.8% in 2009 from 29.0% in 2008. The decrease was primarily due to lower estimated state taxes in 2009, an increased benefit of percentage depletion in 2009, and higher nontaxable gains from investments in our company owned life insurance compared to the prior year. The tax benefit related to company owned life insurance is included in “Other” in the reconciliation of the statutory-to-effective tax rate (See Note 17 of “Notes to the Consolidated Financial Statements”). Our tax rate is also affected by discrete items that may occur in any given year, but are not consistent from year to year. Noncontrolling interests are generally not subject to income taxes on a stand-alone basis and are deducted from income before provision for income taxes in arriving at our effective tax rate for the year.
Amount Attributable to Noncontrolling Interests
The following table presents the amount attributable to noncontrolling interests in consolidated subsidiaries for the respective periods:
Years Ended December 31, | | 2009 | | 2008 | | 2007 | |
(in thousands) | | | |
Amount attributable to noncontrolling interests | | | (26,701 | ) | | | | | | ) |
The amount attributable to the noncontrolling interests in consolidated subsidiaries represents the noncontrolling owners’ share of the income or loss of our consolidated construction joint ventures and real estate development entities. Included in amounts attributable to noncontrolling interests for the years ended 2009 and 2008 are noncontrolling owners’ share of settlements of claims with two contract owners in the amounts of $1.0 million and $17.7 million, respectively.
Prior Years
Revenue: Revenue from Granite West for the year ended December 31, 2008 increased by $41.4 million, or 2.1%, compared with the year ended December 31, 2007. This increase was due to an increase in public sector revenue of $260.3 million, or 22.5%, offset by a decrease of $218.9 million, or 28.4%, in private sector and materials revenues. The increase in public sector revenue was primarily attributable to profitable progress toward completion of federally funded security projects and the positive effect of the resolution of significant uncertainties on certain projects. The decreases in private sector and materials revenue were driven by the ongoing contraction of credit markets and residential construction in all geographic areas in which Granite West operates.
Revenue from Granite East for the year ended December 31, 2008 decreased by $73.4 million, or 9.6%, compared with the year ended December 31, 2007. This decrease was reflective, in part, of our plan to slow revenue growth in the division over the last several years to focus on execution and improved profitability. Geographically, the largest decreases were experienced in the Southeast and Northeast due primarily to certain large projects nearing completion. Increases in the Midwest and South resulted from revenue contributions from progress on a large design/build project in St. Louis, Missouri and project productivity on a bridge project in Mississippi, respectively.
Revenue from GLC for the year ended December 31, 2008 decreased by $31.7 million, or 77.9%, compared to the year ended December 31, 2007. GLC’s revenue is dependent on the timing of real estate sales transactions, which are relatively few in number and can cause variability in the timing of revenue and profit recognition. The current real estate downturn and associated tightening of credit markets had a direct affect on the anticipated timing of several GLC development projects.
Contract Backlog: Granite West contract backlog of $788.9 million at December 31, 2008 was $65.3 million, or 7.6%, lower than at December 31, 2007. The reduction in contract backlog was primarily a result of the ongoing contraction of residential construction and credit markets. The reduced residential demand increased competition on public sector work, as competitors migrated from the increasingly scarce private sector work. Granite West project awards in the fourth quarter 2008 included a $44.0 million highway rehabilitation project in California and a $42.7 million highway reconstruction project near the California-Nevada border.
Granite East contract backlog of $910.5 million at December 31, 2008 was $319.9 million, or 26.0%, lower than at December 31, 2007. The decrease reflected progress on construction projects. Project awards during the year ended December 31, 2008 included a $33.8 million freeway project in Texas and a $161.4 million transit project in New York. We received $37.9 million in awards from Houston Metro for preliminary work and received $67.8 million in additional awards related to our 20% share of a joint venture project to construct a transportation hub at the World Trade Center in New York.
Gross Profit (Loss): Granite West gross profit as a percent of revenue for 2008 decreased to 17.7% from 19.1% for 2007. The decrease was primarily due to significantly lower gross profit margins on the sale of construction materials. Construction materials gross profit as a percent of materials sales for 2008 decreased to 11.9% from 20.1% for 2007. Construction materials margins were negatively affected by lower demand from the private sector for our higher margin products, higher costs of certain raw materials such as diesel fuel and liquid asphalt, and a write-down of inventory due to production in excess of estimated foreseeable use. Additionally, margins were negatively affected by the fixed costs of our plants running at less than normal capacity. These decreases were partially offset by the positive effect of significant project forecast changes of $44.5 million for 2008 compared with $7.8 million for 2007 (see Note 2 of “Notes to the Consolidated Financial Statements”).
Granite East gross profit as a percent of revenue for 2008 increased to 17.5% from 3.4% for 2007. The improved gross profit margin in 2008 was driven by favorable project forecast changes, projects reaching the state of completion allowing profit recognition, and the settlement of a significant claim associated with a large design/build project nearing completion in southern California. The positive effect of significant project forecast changes was $50.5 million for the year ended December 31, 2008 compared with $0.4 million for the year ended December 31, 2007 (see Note 2 of “Notes to the Consolidated Financial Statements”).
Included in GLC’s cost of revenue for 2008 and 2007 were impairment charges of $4.5 million and $3.0 million, respectively, on residential development projects in California. GLC’s gross loss in 2008 of $1.5 million and gross profit in 2007 of $15.8 million included approximately $0.6 million and $8.8 million, respectively, of amounts attributable to noncontrolling partners.
General and Administrative Expenses: General and administrative expenses increased by $11.3 million, or 4.6%, to $257.5 million in 2008 from $246.2 million in 2007. The change was due to an increased allowance for doubtful accounts for Granite West, approximately $3.0 million in severance costs associated with our voluntary opt-out program and other reductions in force, as well as the full year effect of, and integration costs associated with, businesses acquired in 2007. Other general and administrative expenses include information technology, occupancy, office supplies, depreciation, travel and entertainment, outside services, marketing, training and other miscellaneous expenses, none of which individually exceeded 10% of total general and administrative expenses.
Gain on Sales of Property and Equipment: Gain on sales of property and equipment decreased by $4.8 million, or 46.8%, for the year ended December 31, 2008 compared with 2007.
Other Income (Expense): Interest income decreased $8.5 million, or 31.5%, in 2008 compared with 2007 due to the decline in short term interest rates on our invested balances. Interest expense increased in 2008 compared to 2007 due primarily to an increase in the average debt outstanding during the period. Acquisition expense in 2007 was associated with the purchase of all remaining shares of Wilder Construction Company (“Wilder”). We recorded equity in the loss of affiliates of $1.1 million during 2008 due primarily to losses associated with our investment in an asphalt terminal in Nevada. In 2007, we recorded a gain of approximately $3.9 million on the sale of a building by a partnership in which we had an equity method investment. The increase in other income, net during 2008 was primarily related to a gain of $14.4 million on the sale of an investment in an affiliate, gains on the sale of gold of $9.3 million, and a gain of $1.2 million related to a GLC extinguishment of debt. This increase was partially offset by a $10.9 million loss on the sale of available-for-sale securities. We sold these securities as a result of changes in our investment policy and to maximize the associated tax benefit.
Provision for Income Taxes: Our effective tax rate decreased to 29.0% in 2008 from 33.0% in 2007. The decrease was primarily due to increases in the estimated income attributable to noncontrolling interests in our consolidated construction joint ventures and other entities which are not subject to income taxes on a stand alone basis.
Amount Attributable to Noncontrolling Interests: The increase in noncontrolling interests in our consolidated subsidiaries for the year ended December 31, 2008 compared to the prior year was largely attributable to the continued progression and the effect of changes in estimates related to certain consolidated joint venture projects for Granite East, including $17.7 million for settlement of revenue issues on a large project in southern California. In addition, the increase reflects the increased profitability of joint venture work, an increase in the volume of joint venture contracts and the size of our joint venture projects.
Liquidity and Capital Resources
We believe our cash and cash equivalents, short-term investments, cash generated from operations and amounts available under our existing committed credit facility will be sufficient to meet our expected working capital needs, capital expenditures, financial commitments, cash dividend payments, and other liquidity requirements associated with our existing operations through the next twelve months. If we experience a significant change in our business operating results or make a significant acquisition, we may need to acquire additional sources of financing, which, if available, may be limited by the terms of our existing debt covenants, or may require the amendment of our existing debt agreements.
| December 31, | | 2009 | | 2008 | |
| (in thousands) | | | |
Cash and cash equivalents excluding consolidated joint ventures | | | 216,518 | | | | |
Consolidated joint venture cash and cash equivalents | | | 122,438 | | | | |
| Total consolidated cash and cash equivalents | | | 338,956 | | | 460,843 | |
| Short-term and long-term marketable securities1 | | | 119,385 | | | 59,559 | |
| Total cash, cash equivalents and marketable securities | | $ | 458,341 | | $ | 520,402 | |
| Working capital | | $ | 500,605 | | $ | 475,942 | |
1See Note 3 of “Notes to the Consolidated Financial Statements” for the composition of our marketable securities.
Our primary sources of liquidity are cash and cash equivalents and short-term marketable securities. Our cash and cash equivalents are comprised of deposits held with established national financial institutions and money market funds. Short-term marketable securities consist of municipal bonds, commercial paper, and U.S. government and agency obligations. We also hold long-term marketable securities consisting of municipal bonds and U.S. government and agency obligations. Cash and cash equivalents held by our consolidated joint ventures represents the working capital needs of each joint venture’s project. The decision to distribute cash must generally be made jointly by all of the partners and therefore these funds are not available for the working capital needs of Granite.
Cash Flows
| Years Ended December 31, | | 2009 | | 2008 | | | 2007 | |
(in thousands) | | | | | | | | |
| Net cash provided by (used in): | | | | | | | | |
| Operating activities | | $ | 64,301 | | $ | 257,336 | | $ | 234,788 | |
| Investing activities | | | (129,879 | ) | | (18,257 | ) | | (166,744 | ) |
| Financing activities | | | (56,309 | ) | | (130,670 | ) | | 79,497 | |
| Capital expenditures | | | 87,645 | | | 94,135 | | | 118,612 | |
Cash provided by operating activities decreased $193.0 million in 2009 compared to 2008. The decrease was primarily due to reduced revenues and the associated negative effect on net income of $65.5 million. Receivables were $64.8 million lower consistent with the decline in revenues. Cash used for equity in construction joint ventures increased $12.7 million due to contributions to newly formed joint ventures associated with 2009 project awards. The $24.8 million increase in the use of cash for billings in excess of cost was due to project progression.
Cash used in investing activities was $111.6 million higher in 2009 than in 2008. This change was primarily due to reduced proceeds and increased purchases of marketable securities as we moved from cash and cash equivalents to longer term investments in 2009.
Cash used in financing activities was $74.4 million lower than in 2008. The primary driver of this change was a reduction in the purchase of our common stock of $42.1 million. Additionally, distributions to noncontrolling partners were $19.9 million lower.
Capital Expenditures
During 2009, we had capital expenditures of $87.6 million compared to $94.1 million during 2008. Major capital expenditures are typically for aggregate and asphalt production facilities, aggregate reserves, construction equipment, buildings and leasehold improvements, and upgrades to our information technology systems. The timing and amount of such expenditures can vary based on the progress of planned capital projects, the type and size of construction projects, changes in business outlook and other factors. We currently anticipate investing approximately $50.0 million in 2010.
Debt and Contractual Obligations
The following table summarizes our significant obligations outstanding as of December 31, 2009:
| | | Payments Due by Period | |
| (in thousands) | | Total | | Less than 1 year | | 1-3 years | | 3-5 years | | More than 5 years | |
Long-term debt - principal | | | 303,666 | | $ | 58,978 | | $ | 27,394 | | $ | 8,778 | | $ | 208,516 | |
| Long-term debt - interest1 | | | 108,978 | | | 16,721 | | | 28,204 | | | 25,832 | | | 38,221 | |
| Operating leases2 | | | 43,776 | | | 9,225 | | | 11,005 | | | 6,189 | | | 17,357 | |
Other purchase obligations3 | | | 22,113 | | | 11,340 | | | 7,593 | | | 3,180 | | | - | |
Deferred compensation obligations4 | | | 28,532 | | | 3,938 | | | 4,362 | | | 3,026 | | | 17,206 | |
| | | | | $ | 100,202 | | $ | 78,558 | | $ | 47,005 | | $ | 281,300 | |
1 Included in the total is $6.4 million related to mortgages, the terms of which include variable interest rates that range from 3.75% to 9.5%. The future payments were calculated using rates in effect as of December 31, 2009 and may differ from actual results.
2 These obligations represent the minimum rental commitments and minimum royalty requirements under all noncancellable operating leases. See Note 18 of “Notes to the Consolidated Financial Statements”.
3 These obligations represent firm purchase commitments for equipment and other goods and services not connected with our construction contract backlog which are individually greater than $10,000.
4 The timing of expected payment of deferred compensation is based on estimated dates of retirement. Actual dates of retirement could be different and would cause the timing of payments to change.
In addition to the above, as of December 31, 2009, the following obligations were excluded from the foregoing table:
| · | approximately $5.9 million associated with uncertain tax positions filed on our tax returns were excluded because we cannot estimate the timing of potential payments relative to such reserves; |
| · | asset retirement obligations of $19.7 million associated with our owned and leased quarry properties were excluded because they are performance obligations (see Note 8 of “Notes to the Consolidated Financial Statements”); and |
| · | purchase commitments for purchases of materials and subcontract services in the ordinary course of business related to our current contract backlog were excluded as they are generally settled in less than one year. |
Bank and Surety Credit Facilities
We have a $150.0 million bank revolving line of credit, which allows for unsecured borrowings through June 24, 2011. Borrowings under the line of credit bear interest at LIBOR plus an applicable margin based upon certain financial ratios calculated quarterly. The margin was 0.80% at December 31, 2009. The unused and available portion of this line of credit was $145.8 million at December 31, 2009. We had standby letters of credit (“Letters”) totaling approximately $4.2 million outstanding at December 31, 2009, all of which will expire between March 2010 and October 2010. These Letters will be replaced upon expiration.
Additionally, we are generally required to provide various types of surety bonds that provide an additional measure of security under certain public and private sector contracts. At December 31, 2009, approximately $1.4 billion of our contract backlog was bonded. Performance bonds do not have stated expiration dates; rather, we are generally released from the bonds when the owner accepts the contract. The ability to maintain bonding capacity to support our current and future level of contracting requires that we maintain cash and working capital balances satisfactory to our sureties.
A significant portion of our real estate held for development and sale is secured by mortgages. These mortgages are typically renegotiated to reflect the evolving nature of the real estate projects as they progress through acquisition, entitlement and development. Modification of mortgage terms may include changes in loan-to-value ratios requiring GLC’s real estate entities to repay portions of the debt. During 2009, we provided additional funding of $4.6 million to our real estate investments to facilitate mortgage refinancing. As of December 31, 2009, GLC mortgages were $63.5 million of which $44.0 million is included in current maturities of long-term debt and $19.5 million is included in long-term debt on our consolidated balance sheet.
Covenants contained in our debt agreements require the maintenance of certain financial ratios and the maintenance of tangible net worth (as defined by the debt agreements). Our debt agreements define certain events of default such as the failure to observe certain covenants or the failure by us or one of our consolidated subsidiaries, which may include a real estate affiliate of GLC over which we exercise control, to pay its debts as they become due. As of December 31, 2009, we were in compliance with our debt covenants and our affiliates and consolidated subsidiaries were current with their debt agreements. We are not aware of any debt agreement non-compliance by our unconsolidated entities as of December 31, 2009. Should we, our affiliates, consolidated subsidiaries, or unconsolidated entities fail to comply with these covenants, or should any other event of default occur, the lenders could cause the amounts due under the debt agreements to become immediately payable and terminate their obligation to make further credit available.
Share Purchase Program
In 2007, our Board of Directors authorized us to purchase, at management’s discretion, up to $200.0 million of our common stock. During the year ended December 31, 2009, we did not purchase shares under the share purchase program. From the inception of this program in 2007 through December 31, 2009, we have purchased a total of 3.8 million shares of our common stock for an aggregate price of $135.9 million. All shares were retired upon acquisition. At December 31, 2009, $64.1 million of the $200.0 million authorization was available for additional share purchases.
Joint Ventures; Off-Balance-Sheet Arrangements
We participate in various construction joint venture partnerships in order to share expertise, risk and resources for certain highly complex projects. Generally, each construction joint venture is formed to accomplish a specific project and is jointly controlled by the joint venture partners. We select our joint venture partners based on our analysis of their construction and financial capabilities, expertise in the type of work to be performed and past working relationships, among other criteria. The joint venture agreements typically provide that our interests in any profits and assets, and our respective share in any losses and liabilities that may result from the performance of the contract are limited to our stated percentage interest in the project.
Under each joint venture agreement, one partner is designated as the sponsor. The sponsoring partner typically provides all administrative, accounting and most of the project management support for the project and generally receives a fee from the joint venture for these services. We have been designated as the sponsoring partner in certain of our current joint venture projects and are a non-sponsoring partner in others.
We also participate in various “line item” joint venture agreements under which each partner is responsible for performing certain discrete items of the total scope of contracted work. The revenue for these discrete items is defined in the contract with the project owner and each venture partner bears the profitability risk associated with its own work. There is not a single set of books and records for a line item joint venture. Each partner accounts for its items of work individually as it would for any self-performed contract. We account for our portion of these contracts as project revenues and costs in our accounting system and include receivables and payables associated with our work in our consolidated financial statements.
The venture’s contract with the project owner typically requires joint and several liability among the joint venture partners. Although our agreements with our joint venture partners for both construction joint ventures and line item joint ventures provide that each party will assume and fund its share of any losses resulting from a project, if one of our partners was unable to pay its share we would be fully liable under our contract with the project owner. Circumstances that could lead to a loss under these guarantee arrangements include a partner’s inability to contribute additional funds to the venture in the event that the project incurred a loss or additional costs that we could incur should the partner fail to provide the services and resources toward project completion that had been committed to in the joint venture agreement.
At December 31, 2009, we had approximately $1.5 billion of construction work to be completed on unconsolidated construction joint venture contracts of which $562.2 million represented our portion and the remaining $915.4 million represented our partners’ proportionate share. Due to the joint and several liability under our joint venture arrangements, if one of our many joint venture partners fails to perform, we and the remaining joint venture partners, would be responsible for completion of the outstanding work. As of December 31, 2009, we are not aware of situations that would require us to fulfill responsibilities of our joint venture partners pursuant to the joint and several liability under our contracts.
Recently Issued Accounting Pronouncements
Consolidation of Variable Interest Entities
In June 2009, the Financial Accounting Standards Board (“FASB”) issued a new standard requiring ongoing analysis to determine whether a company holds a controlling financial interest in a variable interest entity (“VIE”). The standard includes a new approach for determining who should consolidate a VIE, requiring a qualitative rather than a quantitative analysis. This standard also changes when it is necessary to reassess who should consolidate a VIE. Previously an enterprise was required to reconsider whether it was the primary beneficiary of a VIE only when specific events had occurred. The new standard requires continuous reassessment of an enterprise’s interest in the VIE to determine who is the primary beneficiary. This statement will be effective for us in 2010. We do not expect the adoption of this accounting standard to have a material effect on our consolidated financial statements.
Disclosures about Fair Value Measurements
In January 2010, the FASB issued a new accounting standard update (“ASU”) which clarifies and provides additional disclosure requirements on the transfers of assets and liabilities between Level 1 (quoted prices in active market for identical assets or liabilities) and Level 2 (significant other observable inputs) of the fair value measurement hierarchy, including the reasons for and the timing of the transfers. Additionally, the guidance requires a roll forward of activities on purchases, sales, issuance, and settlements of the assets and liabilities measured using significant unobservable inputs (Level 3 fair value measurements). This ASU is effective for us in 2010, except for the requirements to provide Level 3 activity which will become effective us in 2011. We do not expect the adoption of this ASU to have a material effect on our consolidated financial statements.
We maintain an investment portfolio of various holdings, types and maturities. We place our cash investments in instruments that meet high credit quality standards, as specified in our investment policy. This policy prohibits investments in auction rate and asset-backed securities. It also limits the amount of credit exposure to any one issue, issuer or type of instrument. The portfolio is limited to an average maturity of no more than one year from date of purchase. On an ongoing basis we monitor credit ratings, financial condition and other factors that could affect the carrying amount of our investment portfolio.
Marketable securities, consisting of U.S. government obligations, agencies and municipal bonds, are generally classified as held-to-maturity and are stated at cost, adjusted for amortization of premiums and discounts to maturity.
We are exposed to financial market risks due largely to changes in interest rates, which we have managed primarily by managing the maturities in our investment portfolio. We do not have any business transactions in foreign currencies.
We are exposed to various commodity price risks, including, but not limited to, diesel fuel, natural gas, propane, steel, cement and liquid asphalt arising from transactions that are entered into in the normal course of business. In order to manage or reduce commodity price risk, we monitor the costs of these commodities at the time of bid and price them into our contracts accordingly. Additionally, some of our contracts include commodity price escalation clauses which partially protect us from increasing prices. At times we enter into supply agreements or pre-purchase commodities to secure pricing and are reviewing the use of financial contracts to further manage price risk. At this time, we have no such financial contracts in place.
The fair value of our short-term held-to-maturity investment portfolio and related income would not be significantly affected by changes in interest rates since the investment maturities are short and the interest rates are primarily fixed. The fair value of our long-term held-to-maturity investment portfolio may be affected by changes in interest rates.
Given the short-term nature of certain investments, our investment income is subject to the general level of interest rates in the United States at the time of maturity and reinvestment.
We had outstanding senior notes payable, which carry a fixed interest rate per annum, as follows (in millions):
| December 31, | | | 2009 | |
Principal payments due in nine equal installments that began in 2002, 6.54% | | $ | 6.7 | |
Principal payments due in nine equal installments that began in 2005, 6.96% | | | 33.3 | |
Principal payments due in five equal installments beginning in 2015, 6.11% | | | 200.0 | |
| Total | | $ | 240.0 | |
The table below presents principal amounts due by year and related weighted average interest rates for our cash and cash equivalents, held-to-maturity investments and significant debt obligations as of December 31, 2009 (in thousands):
| | | 2010 | | 2011 | | 2012 | | 2013 | | 2014 | | Thereafter | | Total | | |
| | | | | | | | | | | | | | | | | | | | | | | |
Cash, cash equivalents, held-to-maturity and trading investments | | | | | | | | | | | | | | | | | | | | | | | |
Weighted average interest rate | | | | | | | | | | | | | | | | | | | | | 0.77 | | |
| | | | | | | | | | | | | | | | | | | | | | | |
| | | | | | | | | | | | | | | | | | | | | | | |
| | | | | | | | | | | | | | | - | | | 200,000 | | | 240,000 | | |
Weighted average interest rate | | | | | | | | | | | | | | | - | | | 6.11 | | | 6.24 | | |
The estimated fair value of our cash, cash equivalents and short-term held-to-maturity investments approximates the principal amounts reflected above based on the generally short maturities of these financial instruments. The estimated fair value of our long-term held-to-maturity investments approximates the principal amounts above due to the relatively minor difference between the effective yields of these investments and rates currently available on similar instruments. Rates currently available to us for debt with similar terms and remaining maturities are used to estimate fair value of existing debt. Based on the fixed borrowing rates currently available to us for bank loans with similar terms and average maturities, the fair value of the senior notes payable was approximately $249.2 million as of December 31, 2009 and $200.9 million as of December 31, 2008.
The following consolidated financial statements of Granite and the independent registered public accounting firm’s report are incorporated by reference from Part IV, Item 15(1) and (2):
Report of Independent Registered Public Accounting Firm
Consolidated Balance Sheets - At December 31, 2009 and 2008
Consolidated Statements of Income - Years Ended December 31, 2009, 2008 and 2007
Consolidated Statements of Shareholders’ Equity and Comprehensive Income - Years Ended December 31, 2009, 2008 and 2007
Consolidated Statements of Cash Flows - Years Ended December 31, 2009, 2008 and 2007
Notes to the Consolidated Financial Statements
Quarterly Financial Data (unaudited)
Schedule II - Schedule of Valuation and Qualifying Accounts
Not applicable.
Evaluation of Disclosure Controls and Procedures: We carried out an evaluation, under the supervision of and with the participation of management, including our Chief Executive Officer and our Chief Financial Officer, of the design and operation of our disclosure controls and procedures (as defined in Rules 13a-15(e) and 15d-15(e) under the Securities Exchange Act of 1934, as amended (the “Exchange Act”)). Based on that evaluation, our Chief Executive Officer and Chief Financial Officer concluded that, as of December 31, 2009, our disclosure controls and procedures were effective.
Changes in Internal Control Over Financial Reporting: During the fourth quarter of 2009, there were no changes in our internal control over financial reporting that have materially affected, or are reasonably likely to materially affect, our internal control over financial reporting.
Management’s Report on Internal Control Over Financial Reporting: Our management is responsible for establishing and maintaining adequate internal control over financial reporting, as such term is defined in Exchange Act Rules 13a-15(f) and 15d -15(f). Under the supervision and with the participation of our management, including our Chief Executive Officer and Chief Financial Officer, we conducted an evaluation of the effectiveness of our internal control over financial reporting based on the framework in “Internal Control—Integrated Framework” issued by the Committee of Sponsoring Organizations of the Treadway Commission. Based on that evaluation our management concluded that our internal control over financial reporting was effective as of December 31, 2009.
Independent Registered Public Accounting Firm Attestation Report: PricewaterhouseCoopers LLP, the independent registered public accounting firm that audited our consolidated financial statements included in this Annual Report on Form 10-K, has issued an attestation report on the Company’s internal control over financial reporting as of December 31, 2009. The report, which expresses an unqualified opinion on the effectiveness of the Company’s internal control over financial reporting as of December 31, 2009, is included in Item 15 under the heading “Report of Independent Registered Public Accounting Firm.”
Not applicable.
Certain information required by Part III is omitted from this report. We will file our definitive proxy statement for our Annual Meeting of Shareholders to be held on May 7, 2010 (the “Proxy Statement”) pursuant to Regulation 14A not later than 120 days after the end of the fiscal year covered by this report, and certain information included therein is incorporated herein by reference.
For information regarding our Directors and compliance with Section 16(a) of the Securities Exchange Act of 1934, we direct you to the subsections entitled “Election of Directors” and “Section 16(a) Beneficial Ownership Reporting Compliance,” respectively, in the Proxy Statement. For information regarding our Audit and Compliance Committee’s financial expert and our Committees of the Board, we direct you to the subsection captioned “Committees of the Board” in the Proxy Statement. For information regarding our Nomination Policy, we direct you to the subsection captioned “Board of Directors’ Nomination Policy” in the Proxy Statement. For information regarding our Code of Conduct, we direct you to the subsection captioned “Code of Conduct” in the Proxy Statement. This information is incorporated herein by reference. Information regarding our executive officers is contained in the section entitled “Executive Officers of the Registrant,” in Part I of this report.
For information regarding our Executive Compensation, we direct you to the section captioned “Executive and Director Compensation and Other Matters” in the Proxy Statement. This information is incorporated herein by reference.
This information is located in the subsections captioned “Stock Ownership of Beneficial Owners and Certain Management” and “Equity Compensation Plan Information” in the Proxy Statement. This information is incorporated herein by reference.
You will find this information in the sections captioned “Transactions with Related Persons” in the Proxy Statement. This information is incorporated herein by reference.
You will find this information in the subsection captioned “Principal Accountant Fees and Services” in the Proxy Statement. This information is incorporated herein by reference.
The following documents are filed as part of this report:
1. Financial Statements. The following consolidated financial statements and related documents are filed as part of this report:
| Financial Statements | Page |
Report of Independent Registered Public Accounting Firm | |
Consolidated Balance Sheets at December 31, 2009 and 2008 | |
Consolidated Statements of Income for the Years Ended December 31, 2009, 2008 and 2007 | |
Consolidated Statements of Shareholders’ Equity and Comprehensive Income for the Years Ended December 31, 2009, 2008 and 2007 | |
Consolidated Statements of Cash Flows for the Years Ended December 31, 2009, 2008 and 2007 | |
Notes to the Consolidated Financial Statements | |
| Quarterly Financial Data | F-41 |
2. Financial Statement Schedule. The following financial statement schedule of Granite for the years ended December 31, 2009, 2008 and 2007 is filed as part of this report and should be read in conjunction with the consolidated financial statements of Granite.
| Schedule | Page |
Schedule II - Schedule of Valuation and Qualifying Accounts | |
Schedules not listed above have been omitted because the required information is either not material, not applicable or is shown in the consolidated financial statements or notes thereto.
3. Exhibits. The Exhibits listed in the accompanying Exhibit Index are filed or incorporated by reference as part of this report.
REPORT OF INDEPENDENT REGISTERED PUBLIC ACCOUNTING FIRM
To the Shareholders and Board of Directors of
Granite Construction Incorporated:
In our opinion, the consolidated financial statements listed in the index appearing under Item 15(1) present fairly, in all material respects, the financial position of Granite Construction Incorporated and its subsidiaries at December 31, 2009 and December 31, 2008, and the results of their operations and their cash flows for each of the three years in the period ended December 31, 2009 in conformity with accounting principles generally accepted in the United States of America. In addition, in our opinion, the financial statement schedule listed in the index appearing under Item 15(2) presents fairly, in all material respects, the information set forth therein when read in conjunction with the related consolidated financial statements. Also in our opinion, the Company maintained, in all material respects, effective internal control over financial reporting as of December 31, 2009, based on criteria established in Internal Control - Integrated Framework issued by the Committee of Sponsoring Organizations of the Treadway Commission (COSO). The Company's management is responsible for these financial statements and financial statement schedule, for maintaining effective internal control over financial reporting and for its assessment of the effectiveness of internal control over financial reporting, included in Management's Report on Internal Control over Financial Reporting appearing under Item 9A. Our responsibility is to express opinions on these financial statements, on the financial statement schedule, and on the Company's internal control over financial reporting based on our integrated audits. We conducted our audits in accordance with the standards of the Public Company Accounting Oversight Board (United States). Those standards require that we plan and perform the audits to obtain reasonable assurance about whether the financial statements are free of material misstatement and whether effective internal control over financial reporting was maintained in all material respects. Our audits of the financial statements included examining, on a test basis, evidence supporting the amounts and disclosures in the financial statements, assessing the accounting principles used and significant estimates made by management, and evaluating the overall financial statement presentation. Our audit of internal control over financial reporting included obtaining an understanding of internal control over financial reporting, assessing the risk that a material weakness exists, and testing and evaluating the design and operating effectiveness of internal control based on the assessed risk. Our audits also included performing such other procedures as we considered necessary in the circumstances. We believe that our audits provide a reasonable basis for our opinions.
As discussed in Note 1 of “Notes to the Consolidated Financial Statements”, the Company changed the manner in which it accounts for noncontrolling interests in 2009.
A company’s internal control over financial reporting is a process designed to provide reasonable assurance regarding the reliability of financial reporting and the preparation of financial statements for external purposes in accordance with generally accepted accounting principles. A company’s internal control over financial reporting includes those policies and procedures that (i) pertain to the maintenance of records that, in reasonable detail, accurately and fairly reflect the transactions and dispositions of the assets of the company; (ii) provide reasonable assurance that transactions are recorded as necessary to permit preparation of financial statements in accordance with generally accepted accounting principles, and that receipts and expenditures of the company are being made only in accordance with authorizations of management and directors of the company; and (iii) provide reasonable assurance regarding prevention or timely detection of unauthorized acquisition, use, or disposition of the company’s assets that could have a material effect on the financial statements.
Because of its inherent limitations, internal control over financial reporting may not prevent or detect misstatements. Also, projections of any evaluation of effectiveness to future periods are subject to the risk that controls may become inadequate because of changes in conditions, or that the degree of compliance with the policies or procedures may deteriorate.
/s/PricewaterhouseCoopers LLP
San Francisco, California
February 25, 2010
| GRANITE CONSTRUCTION INCORPORATED | | |
| CONSOLIDATED BALANCE SHEETS | | |
(in thousands, except share and per share data) | |
| December 31, | | 2009 | | 2008 | | |
| |
| | | | | | | | |
Cash and cash equivalents | | | 338,956 | | | | | |
Short-term marketable securities | | | 42,448 | | | | | |
| | | 280,252 | | | | | |
Costs and estimated earnings in excess of billings | | | 10,619 | | | | | |
| | | 45,800 | | | | | |
Real estate held for development and sale | | | 139,449 | | | | | |
| | | 31,034 | | | | | |
Equity in construction joint ventures | | | 67,693 | | | | | |
| | | 50,467 | | | | | |
| | | 1,006,718 | | | | | |
Property and equipment, net | | | 520,778 | | | | | |
Long-term marketable securities | | | 76,937 | | | | | |
Investments in affiliates | | | 24,644 | | | | | |
| | | 80,498 | | | | | |
| | | 1,709,575 | | | | | |
| |
| | | | | | | | |
Current maturities of long-term debt | | | 58,978 | | | | | |
| | | 131,251 | | | | | |
Billings in excess of costs and estimated earnings | | | 156,041 | | | | | |
Accrued expenses and other current liabilities | | | 159,843 | | | | | |
Total current liabilities | | | 506,113 | | | | | |
| | | 244,688 | | | | | |
Other long-term liabilities | | | 48,998 | | | | | |
| | | 27,220 | | | | | |
Commitments and contingencies | | | | | | | | |
| | | | | | | | |
Preferred stock, $0.01 par value, authorized 3,000,000 shares, none outstanding | | | - | | | | | |
Common stock, $0.01 par value, authorized 150,000,000 shares in 2009 and 2008; issued and outstanding 38,635,021 shares as of December 31, 2009 and 38,266,791 shares as of December 31, 2008 | | | 386 | | | | | |
Additional paid-in capital | | | 94,633 | | | | | |
| | | 735,632 | | | | | |
Accumulated other comprehensive loss | | | - | | | | ) | |
Total Granite Construction Inc. shareholders’ equity | | | 830,651 | | | | | |
| Noncontrolling interests | | | 51,905 | | | 36,773 | | |
| Total equity | | | 882,556 | | | 804,282 | | |
Total liabilities and equity | | | 1,709,575 | | | | | |
The accompanying notes are an integral part of these consolidated financial statements.
| GRANITE CONSTRUCTION INCORPORATED | | |
| CONSOLIDATED STATEMENTS OF INCOME | | |
(in thousands, except per share data) | | |
| Years Ended December 31, | | 2009 | | | 2008 | | | 2007 | | |
| | | | | | | | | | |
| | $ | 1,755,260 | | | $ | 2,312,116 | | | $ | 2,321,502 | | |
| | | 205,945 | | | | 353,115 | | | | 375,700 | | |
| | | 2,274 | | | | 9,013 | | | | 40,712 | | |
| | | 1,963,479 | | | | 2,674,244 | | | | 2,737,914 | | |
| | | | | | | | | | | | | |
| | | 1,421,969 | | | | 1,883,742 | | | | 2,002,064 | | |
| | | 191,545 | | | | 311,246 | | | | 300,234 | | |
| | | 3,592 | | | | 10,536 | | | | 24,872 | | |
| | | 1,617,106 | | | | 2,205,524 | | | | 2,327,170 | | |
| | | 346,373 | | | | 468,720 | | | | 410,744 | | |
General and administrative expenses | | | 224,910 | | | | 257,532 | | | | 246,202 | | |
| Restructuring charges | | | 9,453 | | | | - | | | | - | | |
Gain on sales of property and equipment | | | 17,169 | | | | 5,503 | | | | 10,343 | | |
| | | 129,179 | | | | 216,691 | | | | 174,885 | | |
| | | | | | | | | | | | | |
| | | 5,049 | | | | 18,445 | | | | 26,925 | | |
| | | (15,756 | ) | | | (16,001 | ) | | | (6,367 | ) | |
| | | - | | | | - | | | | (7,752 | ) | |
Equity in income (loss) of affiliates | | | 7,696 | | | | (1,058 | ) | | | 5,205 | | |
| | | 12,683 | | | | 15,353 | | | | 5,498 | | |
| | | 9,672 | | | | 16,739 | | | | 23,509 | | |
Income before provision for income taxes | | | 138,851 | | | | 233,430 | | | | 198,394 | | |
Provision for income taxes | | | 38,650 | | | | 67,692 | | | | 65,470 | | |
| | | 100,201 | | | | 165,738 | | | | 132,924 | | |
Amount attributable to noncontrolling interests | | | (26,701 | ) | | | (43,334 | ) | | | (20,859 | ) | |
Net income attributable to Granite Construction Inc. | | $ | 73,500 | | | $ | 122,404 | | | $ | 112,065 | | |
| | | | | | | | | | | | | | |
Net income per share attributable to common shareholders (see Note 15) | | | | | | | | | | | | | |
| | $ | 1.91 | | | $ | 3.19 | | | $ | 2.69 | | |
| | $ | 1.90 | | | $ | 3.18 | | | $ | 2.68 | | |
| | | | | | | | | | | | | | |
Weighted average shares of common stock | | | | | | | | | | | | | |
| | | 37,566 | | | | 37,606 | | | | 40,866 | | |
| | | 37,683 | | | | 37,709 | | | | 40,909 | | |
| | | | | | | | | | | | | | |
Dividends per common share | | $ | 0.52 | | | $ | 0.52 | | | $ | 0.43 | | |
The accompanying notes are an integral part of these consolidated financial statements.
| GRANITE CONSTRUCTION INCORPORATED | | |
| CONSOLIDATED STATEMENTS OF SHAREHOLDERS’ EQUITY AND COMPREHENSIVE INCOME | | |
(in thousands, except share data) | |
| | Outstanding Shares | | Common Stock | | Additional Paid-in Capital | | Retained Earnings | | Accumulated Other Comprehensive Income (Loss) | | Total Granite Shareholders’ Equity | | Noncontrolling Interests | | Total Equity | | |
Balances at December 31, 2006 | | | | $ | | | $ | | | $ | | | $ | | | $ | | | $ | 15,532 | | $ | | | |
Comprehensive income (see Note 16): | | | | | | | | | | | | | | | | | | | | | | | | | |
| | | | | | | | | | | | | | | | | | | | 20,859 | | | | | |
Changes in net unrealized gains (losses) on investments | | | | | | | | | | | | | | | ) | | | ) | | - | | | | | |
| Total comprehensive income | | | | | | | | | | | | | | | | | | | | | | | | | |
| | | | | | | | | | | | | | | | | | | | - | | | | | |
| Stock issued for services | | 19,712 | | | - | | | 1,134 | | | - | | | - | | | 1,134 | | | - | | | 1,134 | | |
Amortized restricted stock | | | | | | | | | | | | | | | | | | | | - | | | | | |
Repurchase of common stock | | | | | | | | | | | | ) | | | | | | ) | | - | | | | | |
Cash dividends on common stock | | | | | | | | | | | | | | | | | | ) | | - | | | | | |
Net tax benefit on stock-based compensation | | | | | | | | | | | | | | | | | | | | - | | | | | |
| Cumulative effect of adopting accounting standard for uncertain tax provisions | | - | | | - | | | - | | | (634 | ) | | - | | | (634 | ) | | - | | | (634 | ) | |
Transactions with noncontrolling interests, net | | - | | | - | | | - | | | - | | | - | | | - | | | (12,920 | ) | | (12,920 | ) | |
Stock options exercised and other | | | | | | | | | | | | | | | | | | | | - | | | | | |
Balances at December 31, 2007 | | | | | | | | | | | | | | | | | | | | 23,471 | | | | | |
| | | | | | | | | | | | | | | | | | | | | | | | | |
| | | | | | | | | | | | | | | | | | | | 43,334 | | | | | |
Changes in net unrealized gains (losses) on investments | | | | | | | | | | | | | | | | | | ) | | - | | | | | |
Total comprehensive income | | | | | | | | | | | | | | | | | | | | | | | | | |
| | | | | | | | | | | | | | | | | | | | - | | | | | |
Stock issued for services | | | | | | | | | | | | | | | | | | | | - | | | | | |
Amortized restricted stock | | | | | | | | | | | | | | | | | | | | - | | | | | |
Repurchase of common stock | | | | | | | | | | | | | | | | | | ) | | - | | | | | |
Cash dividends on common stock | | | | | | | | | | | | | | | | | | ) | | - | | | | | |
Net tax benefit on stock-based compensation | | | | | | | | | | | | | | | | | | | | - | | | | | |
Non-qualified deferred compensation plan stock units | | | | | | | | | | | | | | - | | | 3,237 | | | - | | | | | |
Transactions with noncontrolling interests, net | | - | | | - | | | - | | | - | | | - | | | - | | | (30,032 | ) | | (30,032 | ) | |
Stock options exercised and other | | | | | | | | | | | | | | | | | | | | - | | | | | |
Balances at December 31, 2008 | | | | | | | | | | | | | | | ) | | | | | 36,773 | | | | | |
| | | | | | | | | | | | | | | | | | | | | | | | | |
| | - | | | - | | | - | | | 73,500 | | | - | | | 73,500 | | | 26,701 | | | | | |
Changes in net unrealized gains on investments | | - | | | - | | | - | | | - | | | 146 | | | 146 | | | - | | | | | |
Total comprehensive income | | | | | �� | | | | | | | | | | | | | | | | | | 100,347 | | |
| | 390,468 | | | 4 | | | (4 | ) | | - | | | - | | | - | | | - | | | - | | |
Stock issued for services | | 47,126 | | | - | | | 1,904 | | | - | | | - | | | 1,904 | | | - | | | 1,904 | | |
Amortized restricted stock | | - | | | - | | | 10,765 | | | - | | | - | | | 10,765 | | | - | | | 10,765 | | |
Repurchase of common stock | | (93,763 | | | (1 | ) | | (3,430 | ) | | - | | | - | | | (3,431 | ) | | - | | | (3,431 | ) | |
Cash dividends on common stock | | - | | | - | | | - | | | (20,105 | ) | | - | | | (20,105 | ) | | - | | | (20,105 | ) | |
| Net tax benefit on stock-based compensation | | - | | | - | | | 632 | | | - | | | - | | | 632 | | | - | | | 632 | | |
Transactions with noncontrolling interests, net | | - | | | - | | | - | | | - | | | - | | | - | | | (11,569 | ) | | (11,569 | ) | |
Stock options exercised and other | | 24,399 | | | - | | | (269 | ) | | - | | | - | | | (269 | ) | | - | | | (269 | ) | |
Balances at December 31, 2009 | | 38,635,021 | | | 386 | | $ | 94,633 | | $ | 735,632 | | $ | - | | $ | 830,651 | | $ | 51,905 | | $ | 882,556 | | |
The accompanying notes are an integral part of these consolidated financial statements.
| GRANITE CONSTRUCTION INCORPORATED | | |
| CONSOLIDATED STATEMENTS OF CASH FLOWS | | |
| (in thousands) |
| |
| Years Ended December 31, | | 2009 | | 2008 | | 2007 | | |
| | | | | | | | |
| | | 100,201 | | | | | | | | |
Adjustments to reconcile net income to net cash provided by operating activities: | | | | | | | | | | | |
Impairment of real estate held for development and sale | | | 1,686 | | | 4,500 | | | 3,000 | | |
| Intangible impairment charge | | | 3,873 | | | - | | | - | | |
| Inventory written down | | | 3,097 | | | 12,848 | | | 478 | | |
Depreciation, depletion and amortization | | | 80,195 | | | | | | | | |
| (Recovery of ) provision for doubtful accounts | | | (4,404 | ) | | | | | 3,894 | | |
Gain on sales of property and equipment | | | (17,169 | ) | | | | | | | |
Change in deferred income taxes | | | 21,107 | | | | | | | | |
| | | 10,765 | | | | | | | | |
Excess tax benefit on stock-based compensation | | | (828 | ) | | | | | | | |
| | | - | | | | | | | | |
| (Gain) loss from marketable securities | | | (485 | ) | | 10,939 | | | - | | |
Equity in (income) loss of affiliates | | | (7,696 | ) | | | | | | | |
Acquisition of noncontrolling interest | | | - | | | | ) | | | | |
| Gain on sale of investment in affiliate | | | - | | | (14,416 | ) | | - | | |
| Gain on early extinguishment of debt | | | - | | | (1,150 | ) | | - | | |
Changes in assets and liabilities, net of the effects of acquisition and consolidations: | | | | | | | | | | | |
| | | 35,706 | | | | | | | | |
| | | 6,326 | | | | | | | | |
Real estate held for development and sale | | | (17,263 | ) | | | ) | | | | |
Equity in construction joint ventures | | | (23,012 | ) | | | | | | | |
| | | 2,590 | | | | | | | | |
| | | (43,480 | ) | | | | | | ) | |
Accrued expenses and other liabilities, net | | | (18,261 | ) | | | | | | | |
| Billings in excess of costs and estimated earnings, net | | | (68,647 | ) | | (43,823 | ) | | | ) | |
Net cash provided by operating activities | | | 64,301 | | | | | | | | |
| | | | | | | | | | | |
Purchases of marketable securities | | | (99,011 | ) | | | | | | | |
Maturities of marketable securities | | | 36,970 | | | | | | | | |
| Proceeds from sale of marketable securities | | | 7,966 | | | 22,499 | | | - | | |
| Purchase of company owned life insurance | | | (8,000 | ) | | (8,000 | ) | | - | | |
| Release of funds for acquisition of noncontrolling interest | | | - | | | 28,332 | | | - | | |
Additions to property and equipment | | | (87,645 | ) | | | | | | | |
Proceeds from sales of property and equipment | | | 23,020 | | | | | | | | |
Acquisition of businesses | | | - | | | | | | | ) | |
Contributions to affiliates | | | (4,969 | ) | | | | | | | |
| Distributions from affiliates | | | - | | | 3,895 | | | - | | |
Acquisition of noncontrolling interest | | | - | | | | | | | ) | |
| Issuance of notes receivable | | | (11,314 | ) | | - | | | - | | |
| Collection of notes receivable | | | 13,104 | | | 728 | | | 3,683 | | |
Other investing activities, net | | | - | | | | ) | | | ) | |
Net cash used in investing activities | | | (129,879 | ) | | | | | | | |
| | | | | | | | | | | |
Proceeds from long-term debt | | | 10,750 | | | | | | | | |
Long-term debt principal payments | | | (18,856 | ) | | | | | | | |
| | | (3,431 | ) | | | | | | | |
| | | (20,057 | ) | | | | | | | |
Contributions from noncontrolling partners | | | 420 | | | | | | | | |
Distributions to noncontrolling partners | | | (26,019 | ) | | | | | | | |
| Acquisition of noncontrolling interest | | | - | | | (11,716 | ) | | - | | |
Excess tax benefit on stock-based compensation | | | 828 | | | | | | | | |
Other financing activities | | | 56 | | | | | | | | |
Net cash (used in) provided by financing activities | | | (56,309 | ) | | | ) | | | | |
(Decrease) increase in cash and cash equivalents | | | (121,887 | ) | | | | | | |
Cash and cash equivalents at beginning of year | | | 460,843 | | | | | | | |
Cash and cash equivalents at end of year | | | 338,956 | | | | | | | |
The accompanying notes are an integral part of these consolidated financial statements.
| GRANITE CONSTRUCTION INCORPORATED | | |
| CONSOLIDATED STATEMENTS OF CASH FLOWS - (Continued) | | |
| (in thousands) |
| Years Ended December 31, | | | 2009 | | | 2008 | | | 2007 | |
Supplementary Information | | | | | | | | | | |
Cash paid during the period for: | | | | | | | | | | |
| | | 22,783 | | | | | | | |
| | | 54,082 | | | | | | | |
Non-cash investing and financing activities: | | | | | | | | | | |
Restricted stock issued for services, net | | | 18,405 | | | | | | | |
| Restricted stock units issued | | | 52 | | | 3,237 | | | - | |
| | | 5,023 | | | | | | | |
Assets acquired through issuances of debt | | | - | | | | | | | |
| Debt payments from sale of assets | | | - | | | | | | | |
Settlement of debt from release of assets | | | - | | | | | | | |
The accompanying notes are an integral part of these consolidated financial statements.
GRANITE CONSTRUCTION INCORPORATED
NOTES TO THE CONSOLIDATED FINANCIAL STATEMENTS
1. Summary of Significant Accounting Policies
Description of Business: Granite Construction Incorporated is a heavy civil contractor and a construction materials producer. We are engaged in the construction of roads, highways, mass transit facilities, airport infrastructure, bridges, dams and canals. We are also diversified into real estate investment and development. We have offices in Alaska, Arizona, California, Florida, Nevada, New York, Oregon, Texas, Utah and Washington. Unless otherwise indicated, the terms “we”, “us”, “our”, “Company” and “Granite” refer to Granite Construction Incorporated and its consolidated subsidiaries.
Principles of Consolidation: The consolidated financial statements include the accounts of Granite Construction Incorporated and its wholly owned and majority owned subsidiaries. All material inter-company transactions and accounts have been eliminated. We use the equity method of accounting for affiliated companies where we have the ability to exercise significant influence, but not control. Additionally, we participate in joint ventures with other construction companies and various real estate ventures. We have consolidated these ventures where we have determined that through our participation we have a variable interest and are the primary beneficiary as defined by Financial Accounting Standards Board (“FASB”) Accounting Standards Codification (“ASC”) Topic 810, Consolidation, and related standards. We account for our share of the operations of jointly controlled construction joint ventures on a pro rata basis in the consolidated statements of income and as a single line item in the consolidated balance sheets. Real estate entities are accounted for under the equity method of accounting, as a single line item in both the consolidated statements of income and in the consolidated balance sheets where we have determined we are not the primary beneficiary but do exercise significant influence. Effective January 1, 2009, we adopted a new accounting standard that required noncontrolling interests, formerly known as minority interest, to be separately presented in both the consolidated balance sheets and consolidated statements of income. Prior years have been adjusted to conform to this new standard.
Subsequent Events: In preparing these financial statements, we have evaluated events and transactions for potential recognition or disclosure through the date the financial statements were issued.
Use of Estimates in the Preparation of Financial Statements: The financial statements have been prepared in accordance with accounting principles generally accepted in the United States of America (“U.S. GAAP”). The preparation of these financial statements requires management to make estimates and assumptions that affect the reported amounts of assets and liabilities, revenue and expenses, and related disclosure of contingent assets and liabilities. Our estimates, judgments and assumptions are continually evaluated based on available information and experiences; however, actual amounts could differ from those estimates.
Revenue Recognition - Construction: Revenue and earnings on construction contracts, including construction joint ventures, are recognized under the percentage of completion method using the ratio of costs incurred to estimated total costs. Revenue in an amount equal to cost incurred is recognized prior to contracts reaching 25% completion, thus deferring the related profit. It is our judgment that until a project reaches 25% completion, there is insufficient information to determine the estimated profit on the project with a reasonable level of certainty. In the case of large, complex design/build projects we may defer profit recognition beyond the point of 25% completion based on an evaluation of specific project risks. The factors considered in this evaluation include the stage of design completion, the stage of construction completion, status of outstanding purchase orders and subcontracts, certainty of quantities of labor and materials, certainty of schedule and the relationship with the owner.
Revenue from contract claims is recognized when we have a signed agreement and payment is assured. Revenue from contract change orders, which occur in most large projects, is recognized when the owner has agreed to the change order in writing. Provisions are recognized in the consolidated statements of income for the full amount of estimated losses on uncompleted contracts whenever evidence indicates that the estimated total cost of a contract exceeds its estimated total revenue. All contract costs, including those associated with claims and change orders, are recorded as incurred and revisions to estimated total costs are reflected as soon as the obligation to perform is determined. Contract cost consists of direct costs on contracts, including labor and materials, amounts payable to subcontractors, direct overhead costs and equipment expense (primarily depreciation, fuel, maintenance and repairs).
GRANITE CONSTRUCTION INCORPORATED
NOTES TO THE CONSOLIDATED FINANCIAL STATEMENTS - (Continued)
The accuracy of our revenue and profit recognition in a given period is dependent on the accuracy of our estimates of the cost to complete each project. Cost estimates for all of our significant projects use a highly detailed “bottom up” approach and we believe our experience allows us to provide materially reliable estimates. There are a number of factors that can contribute to changes in estimates of contract cost and profitability. The most significant of these include:
| · | the completeness and accuracy of the original bid; |
| · | costs associated with added scope changes; |
| · | extended overhead due to owner, weather and other delays; |
| · | subcontractor performance issues; |
| · | changes in productivity expectations; |
| · | site conditions that differ from those assumed in the original bid (to the extent contract remedies are unavailable); |
| · | the availability and skill level of workers in the geographic location of the project; and |
| · | a change in the availability and proximity of equipment and materials. |
The foregoing factors as well as the stage of completion of contracts in process and the mix of contracts at different margins may cause fluctuations in gross profit between periods. Substantial changes in cost estimates, particularly in our larger, more complex projects have had, and can in future periods have, a significant effect on our profitability.
Revenue Recognition - Materials: Revenue from the sale of materials is recognized when delivery occurs and risk of ownership passes to the customer.
Revenue Recognition - Real Estate: Revenue from the sale of real estate is recognized when title passes to the new owner, receipt of funds is reasonably assured and we do not have substantial continuing obligations on the property. If the criteria for recognition of a sale are not met, we account for the continuing operations of the property by applying the deposit, finance, installment or cost recovery methods, as appropriate. We use estimates and forecasts to determine total costs at completion of the development project to calculate cost of revenue related to sales transactions.
Balance Sheet Classifications: Amounts receivable and payable under construction contracts (principally retentions) that may extend beyond one year are included in current assets and liabilities. Additionally, the cost of property purchased for development and sale is included in current assets. A one-year time period is used as the basis for classifying all other current assets and liabilities.
Cash and Cash Equivalents: Cash equivalents are securities having remaining maturities of three months or less from the date of purchase.
Marketable Securities: We determine the classification of our marketable securities at the time of purchase and re-evaluate these determinations at each balance sheet date. Debt securities are classified as held-to-maturity when we have the positive intent and ability to hold the securities to maturity. Held-to-maturity investments are stated at amortized cost. Amortized cost of debt securities is adjusted for amortization of premiums and accretion of discounts to maturity, and is included in interest income. Realized gains and losses are included in other income, net. The cost of securities sold is based on the specific identification method.
Debt securities which we do not have the positive intent or ability to hold to maturity are classified as available-for-sale, along with any investments in equity securities. Securities available-for-sale are carried at fair value with the unrealized gains and losses, net of income taxes, reported as a separate component of other comprehensive income/loss until realized. Short-term marketable securities include trading securities and are carried at fair value with realized gains and losses reported in other income, net.
Financial Instruments: The carrying value of marketable securities approximates their fair value as determined by market quotes. Rates currently available to us for debt with similar terms and remaining maturities are used to estimate the fair value of existing debt. The carrying value of receivables and other amounts arising out of normal contract activities, including retentions, which may be settled beyond one year, is estimated to approximate fair value.
GRANITE CONSTRUCTION INCORPORATED
NOTES TO THE CONSOLIDATED FINANCIAL STATEMENTS - (Continued)
Fair Value of Financial Assets and Liabilities: We measure and disclose certain financial assets and liabilities at fair value. ASC Topic 820 defines fair value as the exchange price that would be received for an asset or paid to transfer a liability (an exit price) in the principal or most advantageous market for the asset or liability in an orderly transaction between market participants on the measurement date. ASC Topic 820 also establishes a fair value hierarchy which requires an entity to maximize the use of observable inputs and minimize the use of unobservable inputs when measuring fair value. The standard describes three levels of inputs that may be used to measure fair value:
Level 1 - Quoted prices in active markets for identical assets or liabilities.
Level 2 - Observable inputs other than Level 1 prices such as quoted prices for similar assets or liabilities; quoted prices in markets that are not active; or other inputs that are observable or can be corroborated by observable market data for substantially the full term of the assets or liabilities.
Level 3 - Unobservable inputs that are supported by little or no market activity and that are significant to the fair value of the assets or liabilities.
We utilize the active market approach to measure fair value for our financial assets and liabilities.
Concentrations of Credit Risk and Other Risks: Financial instruments, which potentially subject us to concentrations of credit risk, consist primarily of cash and cash equivalents, short-term and long-term marketable securities, and accounts receivable. We maintain our cash and cash equivalents and our marketable securities with several financial institutions. We invest with high credit quality financial institutions and, by policy, limit the amount of credit exposure to any one financial institution.
Our receivables are from customers concentrated in the United States and we have no foreign operations. We perform ongoing credit evaluations of our customers and generally do not require collateral, although the law provides us the ability to file mechanics’ liens on real property improved for private customers in the event of non-payment by such customers. We maintain an allowance for doubtful accounts which has been within management’s expectations.
A significant portion of our labor force is subject to collective bargaining agreements.
Inventories: Inventories consist primarily of quarry products valued at the lower of average cost or market. We write down the inventories based on estimated quantities of materials on hand in excess of estimated foreseeable use.
GRANITE CONSTRUCTION INCORPORATED
NOTES TO THE CONSOLIDATED FINANCIAL STATEMENTS - (Continued)
Property and Equipment: Property and equipment are stated at cost. Depreciation for construction and other equipment is primarily provided using accelerated methods over lives ranging from three to seven years, and the straight-line method over lives from three to twenty years for the remaining depreciable assets. We believe that accelerated methods best approximate the service provided by the construction and other equipment. Depletion of quarry property is based on the usage of depletable reserves. We frequently sell property and equipment that has reached the end of its useful life or no longer meets our needs, including depleted quarry property. Such property is held in property and equipment until sold. The cost and accumulated depreciation or depletion of property sold or retired is removed from the accounts and gains or losses, if any, are reflected in earnings for the period. Maintenance and repairs are charged to operations as incurred.
Long-lived assets: We review property and equipment, and amortizable intangible assets for impairment whenever events or changes in circumstances indicate the carrying amount of an asset may not be recoverable. Recoverability of these assets is measured by comparison of their carrying amounts to future undiscounted cash flows the assets are expected to generate. If the assets are considered to be impaired, an impairment charge will be recognized equal to the amount by which the carrying value of the asset exceeds its fair value.
Amortizable intangible assets include covenants not to compete, permits, trade names and customer lists which are being amortized on a straight-line basis over terms from three to thirty years.
Real Estate Held for Development and Sale: We assess impairment of our real estate held for development and sale at least annually or whenever events or changes in circumstances indicate that carrying values of these assets may not be recoverable. Events or changes in circumstances, which could trigger an impairment review include, but are not limited to:
| · | significant decreases in the market price of the asset; |
| · | significant adverse changes in legal factors or the business climate; |
| · | accumulation of costs significantly in excess of the amount originally expected for the acquisition, development or construction of the asset; and |
| · | current period cash flow or operating losses combined with a history of losses, or a forecast of continuing losses associated with the use of the asset. |
If events and changes in circumstances indicate that the carrying amounts of the real estate held for development and sale might not be fully recoverable, we compare projected undiscounted net cash flows associated with the related asset or group of assets against their respective carrying amounts. Future undiscounted cash flows are estimated based on entitlement status, market conditions, cost of construction, debt load, development schedules, status of joint venture partners and other factors applicable to the specific project. In the event that the projected undiscounted cash flows are not sufficient to recover the carrying value of the assets, the assets are written down to their estimated fair values. Fair value is estimated based on the expected future cash flows attributable to the asset or group of assets and on other assumptions that market participants would use in determining fair value, such as market discount rates, transaction prices for other comparable assets, and other market driven data. Our estimates of cash flows may differ from actual cash flows due to, among other things, fluctuations in interest rates, decisions made by jurisdictional agencies, economic conditions, or changes to our business operations.
GRANITE CONSTRUCTION INCORPORATED
NOTES TO THE CONSOLIDATED FINANCIAL STATEMENTS - (Continued)
Goodwill and Indefinite-Lived Intangible Assets: We perform impairment tests annually during the fourth quarter and more frequently when events and circumstances occur that indicate a possible impairment of goodwill and indefinite-lived intangible assets.
In determining whether there is an impairment of goodwill, we calculate the estimated fair value of the reporting unit in which the goodwill is recorded using a discounted future cash flow method. We then compare the resulting fair value to the net book value of the reporting unit, including goodwill. If the net book value of a reporting unit exceeds its fair value, we measure and record the amount of the impairment loss by comparing the implied fair value of the reporting unit’s goodwill with the carrying amount of that goodwill. Our assessment of goodwill impairment during the fourth quarter of 2009 indicated that the fair value of the reporting unit substantially exceeded its net book value and therefore goodwill was not impaired.
In determining whether there is an impairment of indefinite-lived intangible assets, we compare the fair value of the asset to the carrying value. We use internal discounted cash flow estimates, quoted market prices when available and independent appraisals, as appropriate, to determine fair value. If the carrying value exceeds the fair value, an impairment charge is recognized equal to the amount by which the carrying value of the asset exceeds its fair value. During 2009, we recognized an impairment charge of $1.7 million related to water use rights in Nevada.
Reclamation Costs: We account for the costs related to legal obligations to reclaim aggregate mining sites and other facilities by recording our estimated reclamation liability when incurred, capitalizing the estimated liability as part of the related asset’s carrying amount and allocating it to expense over the asset’s useful life.
Warranties: Many of our construction contracts contain warranty provisions covering defects in equipment, materials, design or workmanship that generally run from six months to one year after our customer accepts the contract. Because of the nature of our projects, including contract owner inspections of the work both during construction and prior to acceptance, we have not experienced material warranty costs for these short-term warranties and therefore, do not believe an accrual for these costs is necessary. Certain construction contracts carry longer warranty periods, ranging from two to ten years for which we have accrued an estimate of warranty cost. The warranty cost is estimated based on our experience with the type of work and any known risks relative to the project