                                 UNITED STATES
                       SECURITIES AND EXCHANGE COMMISSION
                            WASHINGTON, D.C.  20549

                                   FORM N-CSR
   CERTIFIED SHAREHOLDER REPORT OF REGISTERED MANAGEMENT INVESTMENT COMPANIES


                                    811-6061

                      (Investment Company Act File Number)


                             Federated Index Trust
        _______________________________________________________________

               (Exact Name of Registrant as Specified in Charter)


                           Federated Investors Funds
                              5800 Corporate Drive
                      Pittsburgh, Pennsylvania 15237-7000
                    (Address of Principal Executive Offices)


                                 (412) 288-1900
                        (Registrant's Telephone Number)


                           John W. McGonigle, Esquire
                           Federated Investors Tower
                              1001 Liberty Avenue
                      Pittsburgh, Pennsylvania 15222-3779
                    (Name and Address of Agent for Service)
               (Notices should be sent to the Agent for Service)


                       Date of Fiscal Year End:  10/31/07


             Date of Reporting Period:  Fiscal year ended 10/31/07


ITEM 1.     REPORTS TO STOCKHOLDERS
Federated
World-Class Investment Manager
Federated Max-Cap Index Fund
A Portfolio of Federated Index Trust
ANNUAL SHAREHOLDER REPORT
October 31, 2007
Institutional Shares
Institutional Service Shares
Class C Shares
Class K Shares
FINANCIAL HIGHLIGHTS
SHAREHOLDER EXPENSE EXAMPLE
MANAGEMENT'S DISCUSSION OF FUND PERFORMANCE
PORTFOLIO OF INVESTMENTS SUMMARY TABLE
PORTFOLIO OF INVESTMENTS
STATEMENT OF ASSETS AND LIABILITIES
STATEMENT OF OPERATIONS
STATEMENT OF CHANGES IN NET ASSETS
NOTES TO FINANCIAL STATEMENTS
REPORT OF INDEPENDENT REGISTERED PUBLIC ACCOUNTING FIRM
BOARD OF TRUSTEES AND TRUST OFFICERS
EVALUATION AND APPROVAL OF ADVISORY CONTRACT
VOTING PROXIES ON FUND PORTFOLIO SECURITIES
QUARTERLY PORTFOLIO SCHEDULE
Not FDIC Insured * May Lose Value * No Bank Guarantee
Financial Highlights - Institutional Shares
(For a Share Outstanding Throughout Each Period)
Year Ended October 31
|
| 2007
|
|
| 2006
|
|
| 2005
|
|
| 2004
|
|
| 2003
|
|
Net Asset Value, Beginning of Period
| | $27.36 | | | $24.47 | | | $22.93 | | | $21.29 | | | $17.97 | |
Income From Investment Operations:
| | | | | | | | | | | | | | | |
Net investment income
| | 0.45 | | | 0.42 | | | 0.43 | | | 0.32 | | | 0.28 | |
Net realized and unrealized gain on investments and futures contracts
|
| 3.12
|
|
| 3.40
|
|
| 1.53
|
|
| 1.63
|
|
| 3.31
|
|
TOTAL FROM INVESTMENT OPERATIONS
|
| 3.57
|
|
| 3.82
|
|
| 1.96
|
|
| 1.95
|
|
| 3.59
|
|
Less Distributions:
| | | | | | | | | | | | | | | |
Distributions from net investment income
| | (0.45 | ) | | (0.41 | ) | | (0.42 | ) | | (0.31 | ) | | (0.27 | ) |
Distributions from net realized gain on investments and futures contracts
|
| (2.00
| )
|
| (0.52
| )
|
| - --
|
|
| - --
|
|
| - --
|
|
TOTAL DISTRIBUTIONS
|
| (2.45
| )
|
| (0.93
| )
|
| (0.42
| )
|
| (0.31
| )
|
| (0.27
| )
|
Net Asset Value, End of Period
|
| $28.48
|
|
| $27.36
|
|
| $24.47
|
|
| $22.93
|
|
| $21.29
|
|
Total Return 1
|
| 14.13
| %
|
| 15.99
| %
|
| 8.58
| %
|
| 9.21
| %
|
| 20.18
| %
|
| | | | | | | | | | | | | | | |
Ratios to Average Net Assets:
|
|
|
|
|
|
|
|
|
|
|
|
|
|
|
|
Net expenses
|
| 0.35
| %
|
| 0.35
| %
|
| 0.35
| %
|
| 0.35
| %
|
| 0.35
| %
|
Net investment income
|
| 1.63
| %
|
| 1.63
| %
|
| 1.76
| %
|
| 1.35
| %
|
| 1.44
| %
|
Expense waiver/reimbursement 2
|
| 0.03
| %
|
| 0.17
| %
|
| 0.28
| %
|
| 0.28
| %
|
| 0.29
| %
|
Supplemental Data:
|
|
|
|
|
|
|
|
|
|
|
|
|
|
|
|
Net assets, end of period (000 omitted)
|
| $651,327
|
|
| $660,249
|
|
| $628,948
|
|
| $705,040
|
|
| $962,928
|
|
Portfolio turnover
|
| 49
| %
|
| 42
| %
|
| 30
| %
|
| 19
| %
|
| 24
| %
|
1 Based on net asset value, which does not reflect the sales charge, redemption fee, or contingent deferred sales charge, if applicable.
2 This expense decrease is reflected in both the net expense and the net investment income ratios shown above.
See Notes which are an integral part of the Financial Statements
Financial Highlights - Institutional Service Shares
(For a Share Outstanding Throughout Each Period)
Year Ended October 31
|
| 2007
|
|
| 2006
|
|
| 2005
|
|
| 2004
|
|
| 2003
|
|
Net Asset Value, Beginning of Period
| | $27.30 | | | $24.42 | | | $22.88 | | | $21.24 | | | $17.93 | |
Income From Investment Operations:
| | | | | | | | | | | | | | | |
Net investment income
| | 0.35 | | | 0.34 | | | 0.35 | | | 0.23 | | | 0.21 | |
Net realized and unrealized gain on investments and futures contracts
|
| 3.12
|
|
| 3.40
|
|
| 1.54
|
|
| 1.65
|
|
| 3.32
|
|
TOTAL FROM INVESTMENT OPERATIONS
|
| 3.47
|
|
| 3.74
|
|
| 1.89
|
|
| 1.88
|
|
| 3.53
|
|
Less Distributions:
| | | | | | | | | | | | | | | |
Distributions from net investment income
| | (0.36 | ) | | (0.34 | ) | | (0.35 | ) | | (0.24 | ) | | (0.22 | ) |
Distributions from net realized gain on investments and futures contracts
|
| (2.00
| )
|
| (0.52
| )
|
| - --
|
|
| - --
|
|
| - --
|
|
TOTAL DISTRIBUTIONS
|
| (2.36
| )
|
| (0.86
| )
|
| (0.35
| )
|
| (0.24
| )
|
| (0.22
| )
|
Net Asset Value, End of Period
|
| $28.41
|
|
| $27.30
|
|
| $24.42
|
|
| $22.88
|
|
| $21.24
|
|
Total Return 1
|
| 13.78
| %
|
| 15.63
| %
|
| 8.27
| %
|
| 8.89
| %
|
| 19.84
| %
|
| | | | | | | | | | | | | | | |
Ratios to Average Net Assets:
|
|
|
|
|
|
|
|
|
|
|
|
|
|
|
|
Net expenses
|
| 0.65
| %
|
| 0.65
| %
|
| 0.65
| %
|
| 0.65
| %
|
| 0.65
| %
|
Net investment income
|
| 1.33
| %
|
| 1.34
| %
|
| 1.45
| %
|
| 1.05
| %
|
| 1.14
| %
|
Expense waiver/reimbursement 2
|
| 0.29
| %
|
| 0.29
| %
|
| 0.29
| %
|
| 0.28
| %
|
| 0.29
| %
|
Supplemental Data:
|
|
|
|
|
|
|
|
|
|
|
|
|
|
|
|
Net assets, end of period (000 omitted)
|
| $490,722
|
|
| $526,622
|
|
| $526,555
|
|
| $556,243
|
|
| $605,437
|
|
Portfolio turnover
|
| 49
| %
|
| 42
| %
|
| 30
| %
|
| 19
| %
|
| 24
| %
|
1 Based on net asset value, which does not reflect the sales charge, redemption fee, or contingent deferred sales charge, if applicable.
2 This expense decrease is reflected in both the net expense and the net investment income ratios shown above.
See Notes which are an integral part of the Financial Statements
Financial Highlights - Class C Shares
(For a Share Outstanding Throughout Each Period)
Year Ended October 31
|
| 2007
|
|
| 2006
|
|
| 2005
|
|
| 2004
|
|
| 2003
|
|
Net Asset Value, Beginning of Period
| | $27.23 | | | $24.35 | | | $22.81 | | | $21.18 | | | $17.88 | |
Income From Investment Operations:
| | | | | | | | | | | | | | | |
Net investment income
| | 0.15 | | | 0.15 | | | 0.17 | | | 0.07 | | | 0.08 | |
Net realized and unrealized gain on investments and futures contracts
|
| 3.10
|
|
| 3.41
|
|
| 1.55
|
|
| 1.64
|
|
| 3.31
|
|
TOTAL FROM INVESTMENT OPERATIONS
|
| 3.25
|
|
| 3.56
|
|
| 1.72
|
|
| 1.71
|
|
| 3.39
|
|
Less Distributions:
| | | | | | | | | | | | | | | |
Distributions from net investment income
| | (0.16 | ) | | (0.16 | ) | | (0.18 | ) | | (0.08 | ) | | (0.09 | ) |
Distributions from net realized gain on investments and futures contracts
|
| (2.00
| )
|
| (0.52
| )
|
| - --
|
|
| - --
|
|
| - --
|
|
TOTAL DISTRIBUTIONS
|
| (2.16
| )
|
| (0.68
| )
|
| (0.18
| )
|
| (0.08
| )
|
| (0.09
| )
|
Net Asset Value, End of Period
|
| $28.32
|
|
| $27.23
|
|
| $24.35
|
|
| $22.81
|
|
| $21.18
|
|
Total Return 1
|
| 12.91
| %
|
| 14.86
| %
|
| 7.55
| %
|
| 8.07
| %
|
| 19.01
| %
|
| | | | | | | | | | | | | | | |
Ratios to Average Net Assets:
|
|
|
|
|
|
|
|
|
|
|
|
|
|
|
|
Net expenses
|
| 1.40
| %
|
| 1.35
| %
|
| 1.32
| %
|
| 1.41
| %
|
| 1.37
| %
|
Net investment income
|
| 0.59
| %
|
| 0.64
| %
|
| 0.80
| %
|
| 0.29
| %
|
| 0.42
| %
|
Expense waiver/reimbursement 2
|
| 0.02
| %
|
| 0.02
| %
|
| 0.02
| %
|
| 0.01
| %
|
| 0.04
| %
|
Supplemental Data:
|
|
|
|
|
|
|
|
|
|
|
|
|
|
|
|
Net assets, end of period (000 omitted)
|
| $75,531
|
|
| $78,043
|
|
| $86,361
|
|
| $102,614
|
|
| $104,086
|
|
Portfolio turnover
|
| 49
| %
|
| 42
| %
|
| 30
| %
|
| 19
| %
|
| 24
| %
|
1 Based on net asset value, which does not reflect the sales charge, redemption fee, or contingent deferred sales charge, if applicable.
2 This expense decrease is reflected in both the net expense and the net investment income ratios shown above.
See Notes which are an integral part of the Financial Statements
Financial Highlights - Class K Shares
(For a Share Outstanding Throughout Each Period)
| | Year Ended October 31,
| | Period
Ended | 1
|
|
| 2007
|
|
| 2006
|
|
| 2005
|
|
| 2004
|
|
| 10/31/2003
|
Net Asset Value, Beginning of Period
| | $27.30 | | | $24.43 | | | $22.90 | | | $21.27 | | | $17.81 | |
Income From Investment Operations:
| | | | | | | | | | | | | | | |
Net investment income
| | 0.23 | | | 0.22 | | | 0.24 | | | 0.14 | | | 0.10 | |
Net realized and unrealized gain on investments and futures contracts
|
| 3.13
|
|
| 3.41
|
|
| 1.53
|
|
| 1.65
|
|
| 3.45
|
|
TOTAL FROM INVESTMENT OPERATIONS
|
| 3.36
|
|
| 3.63
|
|
| 1.77
|
|
| 1.79
|
|
| 3.55
|
|
Less Distributions:
| | | | | | | | | | | | | | | |
Distributions from net investment income
| | (0.25 | ) | | (0.24 | ) | | (0.24 | ) | | (0.16 | ) | | (0.09 | ) |
Distributions from net realized gain on investments and futures contracts
|
| (2.00
| )
|
| (0.52
| )
|
| - --
|
|
| - --
|
|
| - --
|
|
TOTAL DISTRIBUTIONS
|
| (2.25
| )
|
| (0.76
| )
|
| (0.24
| )
|
| (0.16
| )
|
| (0.09
| )
|
Net Asset Value, End of Period
|
| $28.41
|
|
| $27.30
|
|
| $24.43
|
|
| $22.90
|
|
| $21.27
|
|
Total Return 2
|
| 13.29
| %
|
| 15.14
| %
|
| 7.75
| %
|
| 8.42
| % 3
|
| 19.99
| %
|
| | | | | | | | | | | | | | | |
Ratios to Average Net Assets:
|
|
|
|
|
|
|
|
|
|
|
|
|
|
|
|
Net expenses
|
| 1.10
| %
|
| 1.10
| %
|
| 1.10
| %
|
| 1.10
| %
|
| 1.09
| % 4
|
Net investment income
|
| 0.88
| %
|
| 0.85
| %
|
| 0.96
| %
|
| 0.60
| %
|
| 0.70
| % 4
|
Expense waiver/reimbursement 5
|
| 0.02
| %
|
| 0.02
| %
|
| 0.02
| %
|
| 0.01
| %
|
| 0.04
| % 4
|
Supplemental Data:
|
|
|
|
|
|
|
|
|
|
|
|
|
|
|
|
Net assets, end of period (000 omitted)
|
| $73,702
|
|
| $76,756
|
|
| $39,617
|
|
| $31,940
|
|
| $16,228
|
|
Portfolio turnover
|
| 49
| %
|
| 42
| %
|
| 30
| %
|
| 19
| %
|
| 24
| % 6
|
1 Reflects operations for the period from April 8, 2003 (date of initial public investment) to October 31, 2003.
2 Based on net asset value, which does not reflect the sales charge, redemption fee, or contingent deferred sales charge, if applicable. Total returns for periods of less than one year are not annualized.
3 During the year, the Fund was reimbursed by the Manager, which had an impact of 0.05% on the total return.
4 Computed on an annualized basis.
5 This expense decrease is reflected in both the net expense and the net investment income ratios shown above.
6 Portfolio turnover is calculated at the Fund level. Percentage indicated was calculated for the year ended October 31, 2003.
See Notes which are an integral part of the Financial Statements
Shareholder Expense Example
As a shareholder of the Fund, you incur two types of costs: (1) transaction costs, including sales charges (loads) on purchase or redemption payments; and (2) ongoing costs, including management fees and to the extent applicable, distribution (12b-1) fees and/or shareholder services fees and other Fund expenses. This Example is intended to help you to understand your ongoing costs (in dollars) of investing in the Fund and to compare these costs with the ongoing costs of investing in other mutual funds. It is based on an investment of $1,000 invested at the beginning of the period and held for the entire period from May 1, 2007 to October 31, 2007.
ACTUAL EXPENSES
The first section of the table below provides information about actual account values and actual expenses. You may use the information in this section, together with the amount you invested, to estimate the expenses that you incurred over the period. Simply divide your account value by $1,000 (for example, an $8,600 account value divided by $1,000 = 8.6), then multiply the result by the number in the first section under the heading entitled "Expenses Paid During Period" to estimate the expenses attributable to your investment during this period.
HYPOTHETICAL EXAMPLE FOR COMPARISON PURPOSES
The second section of the table below provides information about hypothetical account values and hypothetical expenses based on the Fund's actual expense ratio and an assumed rate of return of 5% per year before expenses, which is not the Fund's actual return. Thus, you should not use the hypothetical account values and expenses to estimate the actual ending account balance or your expenses for the period. Rather, these figures are required to be provided to enable you to compare the ongoing costs of investing in the Fund with other funds. To do so, compare this 5% hypothetical example with the 5% hypothetical examples that appear in the shareholder reports of the other funds.
Please note that the expenses shown in the table are meant to highlight your ongoing costs only and do not reflect any transaction costs, such as sales charges (loads) on purchase or redemption payments. Therefore, the second section of the table is useful in comparing ongoing costs only, and will not help you determine the relative total costs of owning different funds. In addition, if these transaction costs were included, your costs would have been higher.
|
| Beginning
Account Value
5/1/2007
|
| Ending
Account Value
10/31/2007
|
| Expenses Paid
During Period 1
|
Actual:
|
|
|
|
|
|
|
Institutional Shares
|
| $1,000
|
| $1,054.00
|
| $1.81
|
Institutional Service Shares
|
| $1,000
|
| $1,052.20
|
| $3.36
|
Class C Shares
|
| $1,000
|
| $1,048.10
|
| $7.18
|
Class K Shares
|
| $1,000
|
| $1,049.80
|
| $5.68
|
Hypothetical (assuming a 5% return before expenses):
|
|
|
|
|
|
|
Institutional Shares
|
| $1,000
|
| $1,023.44
|
| $1.79
|
Institutional Service Shares
|
| $1,000
|
| $1,021.93
|
| $3.31
|
Class C Shares
|
| $1,000
|
| $1,018.20
|
| $7.07
|
Class K Shares
|
| $1,000
|
| $1,019.66
|
| $5.60
|
1 Expenses are equal to the Fund's annualized net expense ratios, multiplied by the average account value over the period, multiplied by 184/365 (to reflect the one-half year period). The annualized net expense ratios are as follows:
Institutional Shares
|
| 0.35%
|
Institutional Service Shares
|
| 0.65%
|
Class C Shares
|
| 1.39%
|
Class K Shares
|
| 1.10%
|
Management's Discussion of Fund Performance
The Federated Max-Cap Index Fund's Institutional Shares, Institutional Service Shares, Class C Shares, and Class K Shares produced total returns of 14.13%, 13.78%, 12.91%, and 13.29%, respectively, based on net asset value for the 12-month reporting period ended October 31, 2007. The Fund's benchmark, the Standard and Poor's 500 Index (S&P 500), 1 posted a total return of 14.56% for the 12-month reporting period. The fund's total return for the fiscal year reflected actual cashflows, transaction costs and other expenses, which were not reflected in the total return of the benchmark.
U.S. equities, as represented by the broad-market S&P 500 Index, gained 14.56% during the 12-month reporting period ended October 31, 2007, despite continued weakness in the housing and subprime mortgage markets. Shares of large-cap growth companies outperformed large-cap value stocks, with the Standard and Poor's 500/Citigroup Growth Index 2 advancing 15.60%, versus the 13.55% return of the Standard & Poor's 500/Citigroup Value Index. 3 Stocks continued to post gains as strong mergers-and-acquisitions activity, solid global growth and an easing of inflation pressures helped to drive up share prices. Regarding the economy, the most recent data from the U.S. Department of Labor's Bureau of Labor Statistics indicated that the U.S. unemployment rate stood at 4.7% as of October 31, 2007. The rate was unchanged from September, but was somewhat higher than the 4.1% rate in October 2006. Non-farm payroll employment rose by roughly 166,000 during the month, with gains in professional and business services, healthcare, and leisure and hospitality. Conversely, manufacturing employment fell by 21,000 in October, following a decline of 17,000 during the previous month.
1 The S&P 500 is a market capitalization weighted index of 500 stocks designed to measure performance of the broad domestic economy through changes in the aggregate market value of 500 stocks representing all major industries. The index is unmanaged, and investments cannot be made in an index. "Standard & Poor's®," "S&P®," "S&P 500®," "Standard & Poor's 500," and "500" are trademarks of The McGraw-Hill Companies, Inc. and have been licensed for use by Federated Securities Corp. The Fund is not sponsored, endorsed, sold or promoted by, or affiliated with, Standard & Poor's ("S&P"). S&P makes no representation or warranty, express or implied, to the owners of the Fund or any member of the public regarding the advisability of investing in securities generally or in the Fund particularly or the ability of the S&P 500 Index to track general stock market performance.
2 The S&P 500/Citigroup Growth Index is a market capitalization-weighted index of the stocks in the S&P 500 having the highest price-to-book ratios. The index consists of approximately half of the S&P 500 on a market capitalization basis. The index is unmanaged, and investments cannot be made in an index.
3 The S&P 500/Citigroup Value Index is a market capitalization-weighted index of the stocks in the S&P 500 having the lowest price-to-book ratios. The index consists of approximately half of the S&P 500 on a market capitalization basis. The index is unmanaged, and investments cannot be made in an index.
Eight of the ten sectors 4 within the S&P 500 recorded positive performances for the 12-month reporting period. The strongest performers were energy, returning 38.4%, materials, returning 34.1%, information technology, returning 26.9%, utilities, returning 22.6% and telecommunication services, returning 22.4%. National Oilwell Varco Inc. (in the energy sector), Apple, Inc. (information technology), Amazon.com Inc. (consumer discretionary), Jacobs Engineering Group, Inc. (industrials) and Monsanto Co. (materials) provided the highest individual stock returns in the S&P 500 for the year ending October 31, 2007.
The financials and consumer discretionary sectors were down 2.5% and 0.1%, respectively, for the reporting period. The weakest-performing stocks within the S&P 500 included Circuit City Stores, Inc. (consumer discretionary), MGIC Investment Corp., Countrywide Financial Corp. and Ambac Financial Group, Inc. (all in the financials sector), and Office Depot, Inc. (consumer discretionary).
The enhanced index component of the Fund made a slightly positive contribution to the Fund's performance during the reporting period. Positive contributions to performance were driven by stock substitution strategies involving the purchasing of substitutes for benchmark stocks, such as acquisition targets of benchmark companies or shares listed on another exchange. Negative contributions to performance were driven by quantitative strategies involving the overweight and underweight of stocks relative to the S&P 500. Additionally, the Fund's management of certain index changes produced a slight negative contribution to the Fund's performance.
The Fund utilized S&P 500 futures to provide equity exposure on the Fund's cash balances. While over the long term, S&P 500 futures should mirror the performance of the S&P 500, pricing disparity can appear in the short term and the Fund may benefit or be harmed by trading futures instead of stocks when money goes in and out of the Fund. During the reporting period, the trading of futures contracts had a negligible impact on the Fund.
4 Sector classifications are based upon the classification of the Standard & Poor's Global Industry Classification Standard (SPGIC).
GROWTH OF A $25,000 INVESTMENT - INSTITUTIONAL SHARES
The graph below illustrates the hypothetical investment of $25,000 1 in Federated Max-Cap Index Fund (Institutional Shares) (the "Fund") from October 31, 1997 to October 31, 2007, compared to the Standard & Poor's 500 Index (S&P 500). 2
Average Annual Total Returns for the Period Ended 10/31/2007
|
|
|
1 Year
|
| 14.13%
|
5 Years
|
| 13.54%
|
10 Years
|
| 6.71%
|
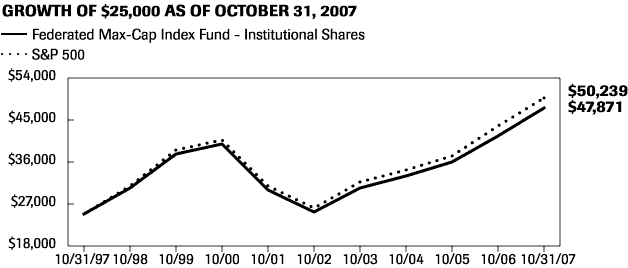
Performance data quoted represents past performance which is no guarantee of future results. Investment return and principal value will fluctuate so that an investor's shares, when redeemed, may be worth more or less than their original cost. Mutual fund performance changes over time and current performance may be lower or higher than what is stated. For current to the most recent month-end performance and after-tax returns, visit FederatedInvestors.com or call 1-800-341-7400. Returns shown do not reflect the deduction of taxes that a shareholder would pay on Fund distributions or the redemption of Fund shares. Mutual funds are not obligations of or guaranteed by any bank and are not federally insured.
1 The Fund's performance assumes the reinvestment of all dividends and distributions. The S&P 500 has been adjusted to reflect reinvestment of dividends on securities in the index.
2 The S&P 500 is not adjusted to reflect taxes, sales charges, expenses or other fees that the Securities and Exchange Commission (SEC) requires to be reflected in the Fund's performance. Indexes are unmanaged and, unlike the Fund, are not affected by cashflows. It is not possible to invest directly in an index.
GROWTH OF A $25,000 INVESTMENT - INSTITUTIONAL SERVICE SHARES
The graph below illustrates the hypothetical investment of $25,000 1 in Federated Max-Cap Index Fund (Institutional Service Shares) (the "Fund") from October 31, 1997 to October 31, 2007, compared to the Standard & Poor's 500 Index (S&P 500). 2
Average Annual Total Returns for the Period Ended 10/31/2007
|
|
|
1 Year
|
| 13.78%
|
5 Years
|
| 13.20%
|
10 Years
|
| 6.39%
|
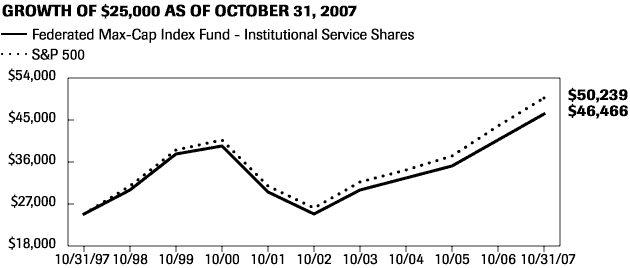
Performance data quoted represents past performance which is no guarantee of future results. Investment return and principal value will fluctuate so that an investor's shares, when redeemed, may be worth more or less than their original cost. Mutual fund performance changes over time and current performance may be lower or higher than what is stated. For current to the most recent month-end performance and after-tax returns, visit FederatedInvestors.com or call 1-800-341-7400. Returns shown do not reflect the deduction of taxes that a shareholder would pay on Fund distributions or the redemption of Fund shares. Mutual funds are not obligations of or guaranteed by any bank and are not federally insured.
1 The Fund's performance assumes the reinvestment of all dividends and distributions. The S&P 500 has been adjusted to reflect reinvestment of dividends on securities in the index.
2 The S&P 500 is not adjusted to reflect taxes, sales charges, expenses or other fees that the SEC requires to be reflected in the Fund's performance. Indexes are unmanaged and, unlike the Fund, are not affected by cashflows. It is not possible to invest directly in an index.
GROWTH OF A $10,000 INVESTMENT - CLASS C SHARES
The graph below illustrates the hypothetical investment of $10,000 1 in Federated Max-Cap Index Fund (Class C Shares) (the "Fund") from November 10, 1997 (start of performance) to October 31, 2007, compared to the Standard & Poor's 500 Index (S&P 500). 2
Average Annual Total Returns 3 for the Period Ended 10/31/2007
|
|
|
1 Year
|
| 11.91%
|
5 Years
|
| 12.40%
|
Start of Performance (11/10/1997)
|
| 5.59%
|
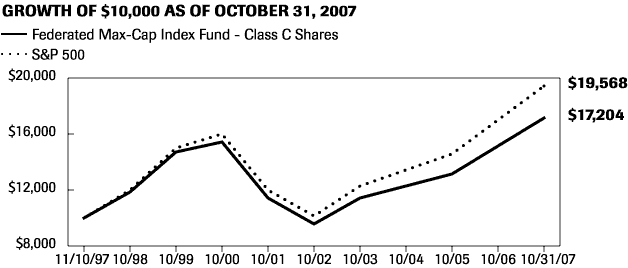
Performance data quoted represents past performance which is no guarantee of future results. Investment return and principal value will fluctuate so that an investor's shares, when redeemed, may be worth more or less than their original cost. Mutual fund performance changes over time and current performance may be lower or higher than what is stated. For current to the most recent month-end performance and after-tax returns, visit FederatedInvestors.com or call 1-800-341-7400. Returns shown do not reflect the deduction of taxes that a shareholder would pay on Fund distributions or the redemption of Fund shares. Mutual funds are not obligations of or guaranteed by any bank and are not federally insured. Total returns shown include the maximum contingent deferred sales charge of 1.00% as applicable.
1 Represents a hypothetical investment of $10,000 in the Fund. A 1.00% contingent deferred sales charge would be applied to any redemption less than one year from the purchase date. The Fund's performance assumes the reinvestment of all dividends and distributions. The S&P 500 has been adjusted to reflect reinvestment of dividends on securities in the index.
2 The S&P 500 is not adjusted to reflect taxes, sales charges, expenses or other fees that the SEC requires to be reflected in the Fund's performance. Indexes are unmanaged and, unlike the Fund, are not affected by cashflows. It is not possible to invest directly in an index.
3 Total returns quoted reflect all applicable contingent deferred sales charges.
GROWTH OF A $10,000 INVESTMENT - CLASS K SHARES
The Fund's Class K Shares commenced operations on April 8, 2003. The Fund offers three other classes of shares; Institutional Shares, Institutional Service Shares and Class C Shares. For the period prior to commencement of operations of the Class K Shares, the performance information shown is for the Fund's Institutional Shares, adjusted to reflect the expenses of Class K Shares. The graph below illustrates the hypothetical investment of $10,000 1 in Federated Max-Cap Index Fund (Class K Shares) (the "Fund") from October 31, 1997 to October 31, 2007, compared to the Standard & Poor's 500 (S&P 500). 2
Average Annual Total Returns for the Period Ended 10/31/2007
|
|
|
1 Year
|
| 13.29%
|
5 Years
|
| 12.72%
|
10 Years
|
| 5.91%
|
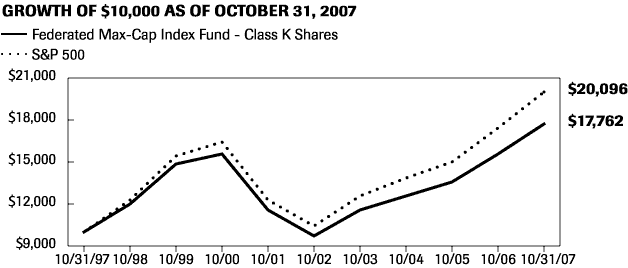
Performance data quoted represents past performance which is no guarantee of future results. Investment return and principal value will fluctuate so that an investor's shares, when redeemed, may be worth more or less than their original cost. Mutual fund performance changes over time and current performance may be lower or higher than what is stated. For current to the most recent month-end performance and after-tax returns, visit FederatedInvestors.com or call 1-800-341-7400. Returns shown do not reflect the deduction of taxes that a shareholder would pay on Fund distributions or the redemption of Fund shares. Mutual funds are not obligations of or guaranteed by any bank and are not federally insured.
1 Represents a hypothetical investment of $10,000 in the Fund with no sales load. The Fund's performance assumes the reinvestment of all dividends and distributions. The S&P 500 has been adjusted to reflect reinvestment of dividends on securities in the index.
2 The S&P 500 is not adjusted to reflect taxes, sales charges, expenses or other fees that the SEC requires to be reflected in the Fund's performance. The S&P 500 is unmanaged and, unlike the Fund, is not affected by cashflows. It is not possible to invest directly in an index.
Performance data quoted represents past performance which is no guarantee of future results. Investment return and principal value will fluctuate so that an investor's shares, when redeemed, may be worth more or less than their original cost. Mutual fund performance changes over time and current performance may be lower or higher than what is stated. For current to the most recent month-end performance and after-tax returns, visit FederatedInvestors.com or call 1-800-341-7400.
Portfolio of Investments Summary Table
At October 31, 2007, the Fund's sector composition 1 for its equity securities investments was as follows:
Sector
|
| Percentage of
Total Net Assets
|
Financials
|
| 18.6
| %
|
Information Technology
|
| 16.6
| %
|
Health Care
|
| 11.5
| %
|
Energy
|
| 11.2
| %
|
Industrials
|
| 11.1
| %
|
Consumer Staples
|
| 9.3
| %
|
Consumer Discretionary
|
| 9.0
| %
|
Telecommunication Services
|
| 3.7
| %
|
Utilities
|
| 3.3
| %
|
Materials
|
| 3.2
| %
|
Other Securities 2
|
| 0.8
| %
|
Cash Equivalents 3
|
| 1.8
| %
|
Other Assets and Liabilities--Net 4
|
| (0.1
| )%
|
TOTAL 5
|
| 100.0
| %
|
1 Except for Other Securities, Cash Equivalents and Other Assets and Liabilities, sector classifications are based upon, and individual portfolio securities are assigned to, the classifications of the Global Industry Classification Standard (GICS), except that the adviser assigns a classification to securities not classified by the GICS and to securities for which the adviser does not have access to the classification made by the GICS.
2 Other Securities includes Exchange Traded Funds.
3 Cash Equivalents includes any investments in money market mutual funds and/or overnight repurchase agreements.
4 Assets, other than investments in securities, less liabilities. See Statement of Assets and Liabilities.
5 The Fund purchases index futures contracts to efficiently manage cash flows resulting from shareholder purchases and redemptions, dividend and capital gain payments to shareholders and corporate actions while maintaining exposure to the S&P 500 Index and minimizing trading costs. Taking into consideration these open index futures contracts, the Fund's total exposure to the S&P 500 Index is effectively 101.0%.
Portfolio of Investments
October 31, 2007
Shares
|
|
|
|
| Value
|
|
| | | COMMON STOCKS -97.5% 1 | | | | |
| | | Consumer Discretionary--9.0% | | | | |
| 5,600 | | Abercrombie & Fitch Co., Class A
| | $ | 443,520 | |
| 26,800 | 2 | Amazon.com, Inc.
| | | 2,389,220 | |
| 13,600 | 2 | Apollo Group, Inc., Class A
| | | 1,077,936 | |
| 4,700 | | Applebee's International, Inc.
| | | 119,098 | |
| 13,196 | 2 | AutoNation, Inc.
| | | 233,437 | |
| 4,630 | 2 | AutoZone, Inc.
| | | 576,018 | |
| 18,414 | 2 | Bed Bath & Beyond, Inc.
| | | 624,971 | |
| 26,360 | | Best Buy Co., Inc.
| | | 1,278,987 | |
| 10,821 | 2 | Big Lots, Inc.
| | | 259,488 | |
| 5,141 | | Black & Decker Corp.
| | | 462,227 | |
| 100,686 | | Block (H&R), Inc.
| | | 2,194,955 | |
| 6,099 | | Brunswick Corp.
| | | 136,069 | |
| 63,671 | | CBS Corp. (New), Class B
| | | 1,827,358 | |
| 7,600 | 2 | Cablevision Systems Corp., Class A
| | | 222,908 | |
| 35,307 | | Carnival Corp.
| | | 1,694,030 | |
| 9,086 | | Centex Corp.
| | | 227,695 | |
| 300 | 2 | Chipotle Mexican Grill, Inc.
| | | 41,700 | |
| 11,369 | | Circuit City Stores, Inc.
| | | 90,156 | |
| 81,057 | | Clear Channel Communications, Inc.
| | | 3,061,523 | |
| 33,300 | 2 | Coach, Inc.
| | | 1,217,448 | |
| 245,728 | 2 | Comcast Corp., Class A
| | | 5,172,574 | |
| 18,600 | | D.R. Horton, Inc.
| | | 236,034 | |
| 69,500 | 2 | DIRECTV Group, Inc.
| | | 1,840,360 | |
| 13,682 | | Darden Restaurants, Inc.
| | | 588,326 | |
| 5,816 | | Dillards, Inc., Class A
| | | 133,942 | |
| 15,107 | | Dow Jones & Co.
| | | 903,550 | |
| 6,000 | | E.W. Scripps Co., Class A
| | | 270,060 | |
| 22,205 | | Eastman Kodak Co.
| | | 636,395 | |
| 2,100 | 2 | Echostar Communications Corp., Class A
| | | 102,816 | |
| 19,600 | 2 | Expedia, Inc.
| | | 640,136 | |
| 19,060 | | Family Dollar Stores, Inc.
| | | 483,171 | |
| 142,309 | 2 | Ford Motor Co.
| | | 1,262,281 | |
Shares
|
|
|
|
| Value
|
|
| | | COMMON STOCKS-continued 1 | | | | |
| | | Consumer Discretionary--continued | | | | |
| 9,949 | | Fortune Brands, Inc.
| | $ | 833,428 | |
| 61,180 | | Gannett Co., Inc.
| | | 2,594,644 | |
| 36,600 | | Gap (The), Inc.
| | | 691,740 | |
| 37,925 | | General Motors Corp.
| | | 1,486,281 | |
| 1,600 | 2 | Genesco, Inc.
| | | 73,920 | |
| 11,367 | | Genuine Parts Co.
| | | 557,779 | |
| 16,108 | 2 | Goodyear Tire & Rubber Co.
| | | 485,656 | |
| 20,120 | | Harley Davidson, Inc.
| | | 1,036,180 | |
| 12,400 | | Harman International Industries, Inc.
| | | 1,044,080 | |
| 29,744 | | Harrah's Entertainment, Inc.
| | | 2,624,908 | |
| 14,814 | | Hasbro, Inc.
| | | 442,198 | |
| 155,289 | | Home Depot, Inc.
| | | 4,893,156 | |
| 14,800 | 2 | IAC Interactive Corp.
| | | 436,008 | |
| 26,636 | | International Game Technology
| | | 1,161,596 | |
| 28,967 | 2 | Interpublic Group Cos., Inc.
| | | 299,808 | |
| 46,818 | | Johnson Controls, Inc.
| | | 2,046,883 | |
| 8,435 | | Jones Apparel Group, Inc.
| | | 176,629 | |
| 6,092 | | KB HOME
| | | 168,383 | |
| 45,508 | 2 | Kohl's Corp.
| | | 2,501,575 | |
| 13,151 | | Leggett and Platt, Inc.
| | | 255,524 | |
| 10,722 | | Lennar Corp., Class A
| | | 244,998 | |
| 4,400 | 2 | Liberty Global, Inc., Class C
| | | 161,392 | |
| 26,471 | | Limited Brands, Inc.
| | | 582,627 | |
| 6,778 | | Liz Claiborne, Inc.
| | | 192,970 | |
| 121,914 | | Lowe's Cos., Inc.
| | | 3,278,267 | |
| 2,820 | 2 | MGM Mirage
| | | 258,340 | |
| 36,942 | | Macy's, Inc.
| | | 1,183,252 | |
| 23,546 | | Marriott International, Inc., Class A
| | | 967,976 | |
| 27,061 | | Mattel, Inc.
| | | 565,304 | |
| 108,393 | | McDonald's Corp.
| | | 6,471,062 | |
| 24,614 | | McGraw-Hill Cos., Inc.
| | | 1,231,685 | |
| 3,159 | | Meredith Corp.
| | | 196,648 | |
| 9,905 | | New York Times Co., Class A
| | | 193,742 | |
| 17,510 | | Newell Rubbermaid, Inc.
| | | 510,592 | |
| 225,264 | | News Corp., Inc.
| | | 4,881,471 | |
Shares
|
|
|
|
| Value
|
|
| | | COMMON STOCKS-continued 1 | | | | |
| | | Consumer Discretionary--continued | | | | |
| 53,970 | | Nike, Inc., Class B
| | $ | 3,576,052 | |
| 21,860 | | Nordstrom, Inc.
| | | 862,158 | |
| 2,600 | | Oakley, Inc.
| | | 76,050 | |
| 20,653 | 2 | Office Depot, Inc.
| | | 387,450 | |
| 23,806 | | Officemax, Inc.
| | | 753,460 | |
| 31,252 | | Omnicom Group, Inc.
| | | 1,593,227 | |
| 14,590 | | Penney (J.C.) Co., Inc.
| | | 820,542 | |
| 5,500 | | Polo Ralph Lauren Corp., Class A
| | | 378,400 | |
| 15,584 | | Pulte Homes, Inc.
| | | 231,267 | |
| 26,685 | | RadioShack Corp.
| | | 550,245 | |
| 7,900 | 2 | Saks, Inc.
| | | 167,164 | |
| 4,937 | 2 | Sears Holdings Corp.
| | | 665,458 | |
| 10,823 | | Sherwin-Williams Co.
| | | 691,806 | |
| 3,803 | | Snap-On, Inc.
| | | 189,808 | |
| 5,813 | | Stanley Works
| | | 334,538 | |
| 48,490 | | Staples, Inc.
| | | 1,131,757 | |
| 73,668 | 2 | Starbucks Corp.
| | | 1,965,462 | |
| 15,533 | | Starwood Hotels & Resorts Worldwide, Inc.
| | | 883,206 | |
| 9,400 | | Station Casinos, Inc.
| | | 844,120 | |
| 42,242 | | TJX Cos., Inc.
| | | 1,222,061 | |
| 62,083 | | Target Corp.
| | | 3,809,413 | |
| 15,396 | | Tiffany & Co.
| | | 834,155 | |
| 267,477 | | Time Warner, Inc.
| | | 4,884,130 | |
| 6,828 | 2 | Tribune Co.
| | | 206,615 | |
| 8,830 | | V.F. Corp.
| | | 769,358 | |
| 49,121 | 2 | Viacom, Inc., Class B
| | | 2,028,206 | |
| 7,100 | | Virgin Media, Inc.
| | | 156,981 | |
| 226,534 | | Walt Disney Co.
| | | 7,844,872 | |
| 8,719 | | Wendy's International, Inc.
| | | 303,072 | |
| 5,640 | | Whirlpool Corp.
| | | 446,575 | |
| 13,612 | | Wyndham Worldwide Corp.
| | | 446,882 | |
| 49,280 | | Yum! Brands, Inc.
|
|
| 1,984,506
|
|
| | | TOTAL
|
|
| 116,218,087
|
|
Shares
|
|
|
|
| Value
|
|
| | | COMMON STOCKS-continued 1 | | | | |
| | | Consumer Staples--9.3% | | | | |
| 198,310 | | Altria Group, Inc.
| | $ | 14,462,748 | |
| 62,224 | | Anheuser-Busch Cos., Inc.
| | | 3,190,847 | |
| 63,174 | | Archer-Daniels-Midland Co.
| | | 2,260,366 | |
| 30,736 | | Avon Products, Inc.
| | | 1,259,561 | |
| 6,660 | | Brown-Forman Corp., Class B
| | | 492,707 | |
| 132,536 | | CVS Caremark Corp.
| | | 5,536,029 | |
| 20,023 | | Campbell Soup Co.
| | | 740,451 | |
| 9,473 | | Clorox Corp.
| | | 592,726 | |
| 183,982 | | Coca-Cola Co.
| | | 11,362,728 | |
| 22,537 | | Coca-Cola Enterprises, Inc.
| | | 581,680 | |
| 45,440 | | Colgate-Palmolive Co.
| | | 3,465,709 | |
| 53,804 | | ConAgra, Inc.
| | | 1,276,769 | |
| 14,100 | 2 | Constellation Brands, Inc., Class A
| | | 354,192 | |
| 42,304 | | Costco Wholesale Corp.
| | | 2,845,367 | |
| 9,700 | 2 | Dean Foods Co.
| | | 269,369 | |
| 8,300 | | Estee Lauder Cos., Inc., Class A
| | | 364,370 | |
| 25,255 | | General Mills, Inc.
| | | 1,457,971 | |
| 31,402 | | H.J. Heinz Co.
| | | 1,468,986 | |
| 10,922 | | Hershey Foods Corp.
| | | 470,847 | |
| 20,607 | | Kellogg Co.
| | | 1,087,844 | |
| 41,186 | | Kimberly-Clark Corp.
| | | 2,919,676 | |
| 152,172 | | Kraft Foods, Inc., Class A
| | | 5,084,067 | |
| 119,021 | | Kroger Co.
| | | 3,498,027 | |
| 8,600 | | McCormick & Co., Inc.
| | | 301,258 | |
| 8,904 | | Molson Coors Brewing Co., Class B
| | | 509,576 | |
| 143,345 | | PepsiCo, Inc.
| | | 10,567,393 | |
| 306,115 | | Procter & Gamble Co.
| | | 21,281,115 | |
| 5,100 | | Reddy Ice Group, Inc.
| | | 141,219 | |
| 12,500 | | Reynolds American, Inc.
| | | 805,375 | |
| 19,520 | | SUPERVALU, Inc.
| | | 756,400 | |
| 33,523 | | Safeway Inc.
| | | 1,139,782 | |
| 168,987 | | Sara Lee Corp.
| | | 2,795,045 | |
| 56,672 | | Sysco Corp.
| | | 1,943,283 | |
| 11,524 | | The Pepsi Bottling Group, Inc.
| | | 496,454 | |
Shares
|
|
|
|
| Value
|
|
| | | COMMON STOCKS-continued 1 | | | | |
| | | Consumer Staples--continued | | | | |
| 77,100 | | Tyson Foods, Inc., Class A
| | $ | 1,218,180 | |
| 11,077 | | UST, Inc.
| | | 590,626 | |
| 172,344 | | Wal-Mart Stores, Inc.
| | | 7,791,672 | |
| 85,096 | | Walgreen Co.
| | | 3,374,056 | |
| 9,700 | | Whole Foods Market, Inc.
| | | 480,538 | |
| 17,257 | | Wrigley (Wm.), Jr. Co.
|
|
| 1,064,239
|
|
| | | TOTAL
|
|
| 120,299,248
|
|
| | | Energy--11.2% | | | | |
| 77,620 | | Anadarko Petroleum Corp.
| | | 4,581,132 | |
| 26,572 | | Apache Corp.
| | | 2,758,439 | |
| 21,400 | | BJ Services Co.
| | | 539,066 | |
| 48,181 | | Baker Hughes, Inc.
| | | 4,178,256 | |
| 11,900 | | CONSOL Energy, Inc.
| | | 672,350 | |
| 26,500 | | Chesapeake Energy Corp.
| | | 1,046,220 | |
| 193,961 | | Chevron Corp.
| | | 17,749,371 | |
| 163,070 | | ConocoPhillips
| | | 13,854,427 | |
| 30,036 | | Devon Energy Corp.
| | | 2,805,362 | |
| 10,600 | | ENSCO International, Inc.
| | | 588,194 | |
| 18,006 | | EOG Resources, Inc.
| | | 1,595,332 | |
| 46,539 | | El Paso Corp.
| | | 821,879 | |
| 524,010 | | Exxon Mobil Corp.
| | | 48,203,680 | |
| 88,896 | | Halliburton Co.
| | | 3,504,280 | |
| 24,364 | | Hess Corp.
| | | 1,744,706 | |
| 62,492 | | Marathon Oil Corp.
| | | 3,695,152 | |
| 16,300 | | Murphy Oil Corp.
| | | 1,200,169 | |
| 17,580 | 2 | Nabors Industries Ltd.
| | | 493,646 | |
| 32,028 | 2 | National-Oilwell, Inc.
| | | 2,345,731 | |
| 22,156 | | Noble Corp.
| | | 1,173,160 | |
| 16,300 | | Noble Energy, Inc.
| | | 1,247,602 | |
| 56,430 | | Occidental Petroleum Corp.
| | | 3,896,492 | |
| 18,800 | | Peabody Energy Corp.
| | | 1,048,100 | |
| 6,352 | | Rowan Cos., Inc.
| | | 247,601 | |
| 86,112 | | Schlumberger Ltd.
| | | 8,315,836 | |
| 17,700 | | Smith International, Inc.
| | | 1,169,085 | |
Shares
|
|
|
|
| Value
|
|
| | | COMMON STOCKS-continued 1 | | | | |
| | | Energy--continued | | | | |
| 48,024 | | Spectra Energy Corp.
| | $ | 1,247,664 | |
| 8,220 | | Sunoco, Inc.
| | | 604,992 | |
| 13,200 | | Tesoro Petroleum Corp.
| | | 798,996 | |
| 26,090 | 2 | Transocean Sedco Forex, Inc.
| | | 3,114,363 | |
| 49,357 | | Valero Energy Corp.
| | | 3,476,214 | |
| 27,400 | 2 | Weatherford International Ltd.
| | | 1,778,534 | |
| 53,561 | | Williams Cos., Inc.
| | | 1,954,441 | |
| 34,882 | | XTO Energy, Inc.
|
|
| 2,315,467
|
|
| | | TOTAL
|
|
| 144,765,939
|
|
| | | Financials--18.6% | | | | |
| 26,174 | | AON Corp.
| | | 1,186,206 | |
| 42,600 | | Ace Ltd.
| | | 2,581,986 | |
| 43,582 | | Aflac, Inc.
| | | 2,736,078 | |
| 58,725 | | Allstate Corp.
| | | 3,077,190 | |
| 6,373 | | Ambac Financial Group, Inc.
| | | 234,718 | |
| 12,600 | | American Capital Strategies Ltd.
| | | 546,966 | |
| 135,895 | | American Express Co.
| | | 8,282,800 | |
| 230,432 | | American International Group, Inc.
| | | 14,544,868 | |
| 21,839 | | Ameriprise Financial, Inc.
| | | 1,375,420 | |
| 8,200 | | Apartment Investment & Management Co., Class A
| | | 383,186 | |
| 7,300 | | Assurant, Inc.
| | | 426,612 | |
| 5,200 | | Avalonbay Communities, Inc.
| | | 637,780 | |
| 43,285 | | BB&T Corp.
| | | 1,600,246 | |
| 398,456 | | Bank of America Corp.
| | | 19,237,456 | |
| 97,672 | | Bank of New York Mellon Corp.
| | | 4,771,277 | |
| 7,634 | | Bear Stearns & Co., Inc.
| | | 867,222 | |
| 8,100 | | Boston Properties, Inc.
| | | 877,554 | |
| 12,700 | 2 | CB Richard Ellis Services, Inc.
| | | 309,626 | |
| 14,300 | | CIT Group, Inc.
| | | 503,932 | |
| 3,600 | | CME Group, Inc.
| | | 2,398,583 | |
| 52,913 | | Capital One Financial Corp.
| | | 3,470,564 | |
| 67,590 | | Chubb Corp.
| | | 3,605,927 | |
| 12,395 | | Cincinnati Financial Corp.
| | | 493,073 | |
| 450,819 | | Citigroup, Inc.
| | | 18,889,316 | |
Shares
|
|
|
|
| Value
|
|
| | | COMMON STOCKS-continued 1 | | | | |
| | | Financials--continued | | | | |
| 11,323 | | Comerica, Inc.
| | $ | 528,558 | |
| 15,000 | | Commerce Bancorp, Inc.
| | | 611,250 | |
| 37,442 | | Countrywide Financial Corp.
| | | 581,100 | |
| 9,900 | | Developers Diversified Realty
| | | 498,960 | |
| 45,178 | | Discover Financial Services
| | | 871,935 | |
| 31,500 | 2 | E*Trade Group, Inc.
| | | 350,910 | |
| 18,400 | | Equity Residential Properties Trust
| | | 768,752 | |
| 44,069 | | Federal Home Loan Mortgage Corp.
| | | 2,301,724 | |
| 110,516 | | Federal National Mortgage Association
| | | 6,303,833 | |
| 6,800 | | Federated Investors, Inc.
| | | 292,400 | |
| 44,607 | | Fifth Third Bancorp
| | | 1,395,307 | |
| 10,800 | | First Horizon National Corp.
| | | 281,664 | |
| 27,925 | | Franklin Resources, Inc.
| | | 3,621,314 | |
| 24,400 | | General Growth Properties, Inc.
| | | 1,326,384 | |
| 31,378 | | Genworth Financial, Inc., Class A
| | | 856,619 | |
| 28,100 | | Goldman Sachs Group, Inc.
| | | 6,966,552 | |
| 25,870 | | Hartford Financial Services Group, Inc.
| | | 2,510,166 | |
| 45,500 | | Host Marriott Corp.
| | | 1,008,280 | |
| 36,500 | | Hudson City Bancorp, Inc.
| | | 571,590 | |
| 26,609 | | Huntington Bancshares, Inc.
| | | 476,567 | |
| 7,700 | 2 | InterContinentalExchange, Inc.
| | | 1,372,140 | |
| 6,600 | | International Securities Exchange Holdings, Inc.
| | | 442,530 | |
| 2,100 | | Invesco PLC, ADR
| | | 64,386 | |
| 346,568 | | J.P. Morgan Chase & Co.
| | | 16,288,696 | |
| 16,492 | | Janus Capital Group, Inc.
| | | 569,139 | |
| 26,579 | | KeyCorp
| | | 756,173 | |
| 16,301 | | Kimco Realty Corp.
| | | 676,818 | |
| 8,700 | | Legg Mason, Inc.
| | | 721,578 | |
| 47,406 | | Lehman Brothers Holdings, Inc.
| | | 3,002,696 | |
| 15,700 | | Leucadia National Corp.
| | | 795,362 | |
| 22,160 | | Lincoln National Corp.
| | | 1,382,119 | |
| 39,647 | | Loews Corp.
| | | 1,946,271 | |
| 5,900 | | M & T Bank Corp.
| | | 586,932 | |
| 7,931 | | MBIA Insurance Corp.
| | | 341,350 | |
Shares
|
|
|
|
| Value
|
|
| | | COMMON STOCKS-continued 1 | | | | |
| | | Financials--continued | | | | |
| 4,364 | | MGIC Investment Corp.
| | $ | 84,487 | |
| 41,910 | | Marsh & McLennan Cos., Inc.
| | | 1,085,050 | |
| 17,042 | | Marshall & Ilsley Corp.
| | | 727,693 | |
| 59,725 | | Merrill Lynch & Co., Inc.
| | | 3,943,045 | |
| 94,041 | | MetLife, Inc.
| | | 6,474,723 | |
| 14,434 | | Moody's Corp.
| | | 631,054 | |
| 84,356 | | Morgan Stanley
| | | 5,673,785 | |
| 25,100 | | NYSE Euronext
| | | 2,356,137 | |
| 40,967 | | National City Corp.
| | | 993,450 | |
| 13,269 | | Northern Trust Corp.
| | | 997,962 | |
| 21,500 | | Nuveen Investments, Class A
| | | 1,393,200 | |
| 3,900 | | Nymex Holdings Inc.
| | | 501,228 | |
| 31,027 | | PNC Financial Services Group
| | | 2,238,908 | |
| 11,800 | | Plum Creek Timber Co., Inc.
| | | 527,106 | |
| 21,600 | | Principal Financial Group
| | | 1,461,672 | |
| 50,220 | | Progressive Corp., OH
| | | 929,070 | |
| 20,500 | | Prologis
| | | 1,470,670 | |
| 40,100 | | Prudential Financial, Inc.
| | | 3,878,472 | |
| 8,400 | | Public Storage, Inc.
| | | 680,148 | |
| 58,672 | | Regions Financial Corp.
| | | 1,591,185 | |
| 8,522 | | SAFECO Corp.
| | | 493,424 | |
| 41,940 | 2 | SLM Corp.
| | | 1,977,890 | |
| 75,086 | | Schwab (Charles) Corp.
| | | 1,744,999 | |
| 19,949 | | Simon Property Group, Inc.
| | | 2,076,890 | |
| 24,430 | | Sovereign Bancorp, Inc.
| | | 352,525 | |
| 30,923 | | State Street Corp.
| | | 2,466,728 | |
| 55,291 | | SunTrust Banks, Inc.
| | | 4,014,127 | |
| 20,955 | | Synovus Financial Corp.
| | | 552,374 | |
| 37,908 | | T. Rowe Price Group, Inc.
| | | 2,435,210 | |
| 61,149 | | The Travelers Cos., Inc.
| | | 3,192,589 | |
| 7,837 | | Torchmark Corp.
| | | 510,659 | |
| 147,363 | | U.S. Bancorp
| | | 4,886,557 | |
| 30,753 | | UNUMProvident Corp.
| | | 717,775 | |
| 9,900 | | Vornado Realty Trust
| | | 1,106,028 | |
Shares
|
|
|
|
| Value
|
|
| | | COMMON STOCKS-continued 1 | | | | |
| | | Financials--continued | | | | |
| 189,639 | | Wachovia Corp.
| | $ | 8,672,208 | |
| 58,813 | | Washington Mutual Bank
| | | 1,639,706 | |
| 303,200 | | Wells Fargo & Co.
| | | 10,311,832 | |
| 15,936 | | XL Capital Ltd., Class A
| | | 1,146,595 | |
| 6,572 | | Zions Bancorp
|
|
| 388,471
|
|
| | | TOTAL
|
|
| 240,434,273
|
|
| | | Health Care--11.5% | | | | |
| 126,741 | | Abbott Laboratories
| | | 6,922,593 | |
| 45,204 | | Aetna, Inc.
| | | 2,539,109 | |
| 20,742 | | Allergan, Inc.
| | | 1,401,744 | |
| 21,384 | | AmerisourceBergen Corp.
| | | 1,007,400 | |
| 75,357 | 2 | Amgen, Inc.
| | | 4,378,995 | |
| 22,648 | | Applera Corp.
| | | 841,147 | |
| 6,704 | | Bard (C.R.), Inc.
| | | 560,521 | |
| 7,200 | 2 | Barr Laboratories, Inc.
| | | 412,704 | |
| 85,724 | | Baxter International, Inc.
| | | 5,144,297 | |
| 18,728 | | Becton, Dickinson & Co.
| | | 1,563,039 | |
| 25,334 | 2 | Biogen Idec, Inc.
| | | 1,885,863 | |
| 91,545 | 2 | Boston Scientific Corp.
| | | 1,269,729 | |
| 134,925 | | Bristol-Myers Squibb Co.
| | | 4,046,401 | |
| 23,410 | | CIGNA Corp.
| | | 1,228,791 | |
| 59,708 | | Cardinal Health, Inc.
| | | 4,061,935 | |
| 35,200 | 2 | Celgene Corp.
| | | 2,323,200 | |
| 39,300 | 2 | Coventry Health Care, Inc.
| | | 2,370,183 | |
| 53,998 | | Covidien Ltd.
| | | 2,246,317 | |
| 7,500 | 2 | DJ Orthopedics, Inc.
| | | 374,625 | |
| 14,200 | | Dade Behring Holdings, Inc.
| | | 1,092,406 | |
| 84,166 | | Eli Lilly & Co.
| | | 4,557,589 | |
| 24,000 | 2 | Express Scripts, Inc., Class A
| | | 1,514,400 | |
| 26,076 | 2 | Forest Laboratories, Inc., Class A
| | | 1,018,789 | |
| 40,800 | 2 | Genzyme Corp.
| | | 3,099,576 | |
| 64,228 | 2 | Gilead Sciences, Inc.
| | | 2,966,691 | |
| 10,344 | 2 | Hospira, Inc.
| | | 427,518 | |
| 14,831 | 2 | Humana, Inc.
| | | 1,111,583 | |
Shares
|
|
|
|
| Value
|
|
| | | COMMON STOCKS-continued 1 | | | | |
| | | Health Care--continued | | | | |
| 14,373 | | IMS Health, Inc.
| | $ | 362,343 | |
| 227,344 | | Johnson & Johnson
| | | 14,816,008 | |
| 108,684 | 2 | King Pharmaceuticals, Inc.
| | | 1,152,050 | |
| 12,500 | 2 | Kyphon, Inc.
| | | 886,000 | |
| 9,000 | 2 | Laboratory Corp. of America Holdings
| | | 618,750 | |
| 27,343 | | Manor Care, Inc.
| | | 1,820,497 | |
| 19,966 | | McKesson HBOC, Inc.
| | | 1,319,753 | |
| 21,889 | 2 | Medco Health Solutions, Inc.
| | | 2,065,884 | |
| 97,783 | | Medtronic, Inc.
| | | 4,638,826 | |
| 192,520 | | Merck & Co., Inc.
| | | 11,216,215 | |
| 3,177 | 2 | Millipore Corp.
| | | 246,694 | |
| 16,710 | 2 | Mylan Laboratories, Inc.
| | | 251,318 | |
| 12,800 | 2 | Patterson Cos., Inc.
| | | 500,608 | |
| 9,507 | | PerkinElmer, Inc.
| | | 261,633 | |
| 639,020 | | Pfizer, Inc.
| | | 15,726,282 | |
| 2,900 | | PolyMedica Industries, Inc.
| | | 153,584 | |
| 11,892 | | Quest Diagnostics, Inc.
| | | 632,417 | |
| 174,432 | | Schering Plough Corp.
| | | 5,323,665 | |
| 24,400 | 2 | Sierra Health Services, Inc.
| | | 1,032,120 | |
| 30,908 | 2 | St. Jude Medical, Inc.
| | | 1,258,883 | |
| 47,202 | | Stryker Corp.
| | | 3,351,342 | |
| 31,305 | 2 | Tenet Healthcare Corp.
| | | 109,881 | |
| 39,453 | 2 | Thermo Electron Corp.
| | | 2,320,231 | |
| 115,830 | | UnitedHealth Group, Inc.
| | | 5,693,045 | |
| 9,000 | 2 | Varian Medical Systems, Inc.
| | | 438,930 | |
| 7,800 | 2 | Waters Corp.
| | | 600,444 | |
| 7,083 | 2 | Watson Pharmaceuticals, Inc.
| | | 216,456 | |
| 53,491 | 2 | Wellpoint, Inc.
| | | 4,238,092 | |
| 93,154 | | Wyeth
| | | 4,530,079 | |
| 21,094 | 2 | Zimmer Holdings, Inc.
|
|
| 1,465,822
|
|
| | | TOTAL
|
|
| 147,614,997
|
|
| | | Industrials--11.1% | | | | |
| 64,852 | | 3M Co.
| | | 5,600,619 | |
| 23,043 | 2 | Allied Waste Industries, Inc.
| | | 291,264 | |
Shares
|
|
|
|
| Value
|
|
| | | COMMON STOCKS-continued 1 | | | | |
| | | Industrials--continued | | | | |
| 15,800 | | American Standard Cos.
| | $ | 588,866 | |
| 6,742 | | Avery Dennison Corp.
| | | 390,362 | |
| 74,505 | | Boeing Co.
| | | 7,345,448 | |
| 37,638 | | Burlington Northern Santa Fe Corp.
| | | 3,280,152 | |
| 17,500 | | C.H. Robinson Worldwide, Inc.
| | | 873,600 | |
| 42,264 | | CSX Corp.
| | | 1,892,159 | |
| 59,376 | | Caterpillar, Inc.
| | | 4,430,043 | |
| 10,337 | | Cintas Corp.
| | | 378,334 | |
| 12,814 | | Cooper Industries Ltd., Class A
| | | 671,325 | |
| 9,234 | | Cummins, Inc.
| | | 1,107,711 | |
| 17,540 | | Danaher Corp.
| | | 1,502,652 | |
| 19,786 | | Deere & Co.
| | | 3,064,851 | |
| 18,523 | | Donnelley (R.R.) & Sons Co.
| | | 746,292 | |
| 14,002 | | Dover Corp.
| | | 644,092 | |
| 12,754 | | Eaton Corp.
| | | 1,180,765 | |
| 71,804 | | Emerson Electric Co.
| | | 3,753,195 | |
| 12,916 | | Equifax, Inc.
| | | 497,266 | |
| 20,400 | | Expeditors International Washington, Inc.
| | | 1,033,260 | |
| 25,168 | | FedEx Corp.
| | | 2,600,861 | |
| 920 | 2 | First Solar, Inc.
| | | 146,105 | |
| 7,656 | | Fluor Corp.
| | | 1,209,648 | |
| 33,716 | | General Dynamics Corp.
| | | 3,066,807 | |
| 875,836 | | General Electric Co.
| | | 36,049,410 | |
| 10,490 | | Goodrich (B.F.) Co.
| | | 730,733 | |
| 10,047 | | Grainger (W.W.), Inc.
| | | 903,426 | |
| 69,018 | | Honeywell International, Inc.
| | | 4,169,377 | |
| 16,092 | | ITT Corp.
| | | 1,076,877 | |
| 30,218 | | Illinois Tool Works, Inc.
| | | 1,730,283 | |
| 23,884 | | Ingersoll-Rand Co., Class A
| | | 1,202,559 | |
| 11,300 | 2 | Jacobs Engineering Group, Inc.
| | | 984,795 | |
| 3,550 | 2 | KBR, Inc.
| | | 152,224 | |
| 8,575 | | L-3 Communications Holdings, Inc.
| | | 940,163 | |
| 42,288 | | Lockheed Martin Corp.
| | | 4,653,372 | |
| 94,836 | | Masco Corp.
| | | 2,283,651 | |
Shares
|
|
|
|
| Value
|
|
| | | COMMON STOCKS-continued 1 | | | | |
| | | Industrials--continued | | | | |
| 8,068 | 2 | Monster Worldwide, Inc.
| | $ | 327,399 | |
| 35,053 | | Norfolk Southern Corp.
| | | 1,810,487 | |
| 30,800 | | Northrop Grumman Corp.
| | | 2,575,496 | |
| 33,366 | | PACCAR, Inc.
| | | 1,853,815 | |
| 2,900 | 2 | PHH Corp.
| | | 64,844 | |
| 10,289 | | Pall Corp.
| | | 412,280 | |
| 15,296 | | Parker-Hannifin Corp.
| | | 1,229,299 | |
| 16,103 | | Pitney Bowes, Inc.
| | | 644,764 | |
| 12,800 | | Precision Castparts Corp.
| | | 1,917,568 | |
| 66,455 | | Raytheon Co.
| | | 4,227,203 | |
| 11,094 | | Robert Half International, Inc.
| | | 333,818 | |
| 14,743 | | Rockwell Automation, Inc.
| | | 1,015,498 | |
| 12,343 | | Rockwell Collins
| | | 923,380 | |
| 3,986 | | Ryder System, Inc.
| | | 190,730 | |
| 51,746 | | Southwest Airlines Co.
| | | 735,311 | |
| 9,200 | 2 | Terex Corp.
| | | 682,824 | |
| 20,160 | | Textron Inc.
| | | 1,395,274 | |
| 35,823 | | Tyco International Ltd.
| | | 1,474,833 | |
| 29,895 | | Union Pacific Corp.
| | | 3,827,756 | |
| 6,100 | | United Industrial Corp.
| | | 493,002 | |
| 93,240 | | United Parcel Service, Inc.
| | | 7,002,324 | |
| 20,700 | 2 | United Rentals, Inc.
| | | 707,733 | |
| 86,822 | | United Technologies Corp.
| | | 6,649,697 | |
| 43,024 | | Waste Management, Inc.
|
|
| 1,565,643
|
|
| | | TOTAL
|
|
| 143,233,525
|
|
| | | Information Technology--16.6% | | | | |
| 46,800 | 2 | 3Com Corp.
| | | 228,384 | |
| 47,110 | 2 | Adobe Systems, Inc.
| | | 2,256,569 | |
| 34,734 | 2 | Advanced Micro Devices, Inc.
| | | 454,321 | |
| 15,500 | 2 | Affiliated Computer Services, Inc., Class A
| | | 785,230 | |
| 37,272 | 2 | Agilent Technologies, Inc.
| | | 1,373,473 | |
| 12,400 | 2 | Akamai Technologies, Inc.
| | | 485,956 | |
| 13,900 | 2 | Alliance Data Systems Corp.
| | | 1,117,560 | |
| 31,939 | | Altera Corp.
| | | 626,643 | |
Shares
|
|
|
|
| Value
|
|
| | | COMMON STOCKS-continued 1 | | | | |
| | | Information Technology--continued | | | | |
| 24,524 | | Analog Devices, Inc.
| | $ | 820,573 | |
| 34,700 | 2 | Andrew Corp.
| | | 508,702 | |
| 79,198 | 2 | Apple, Inc.
| | | 15,043,660 | |
| 112,210 | | Applied Materials, Inc.
| | | 2,179,118 | |
| 20,220 | 2 | Autodesk, Inc.
| | | 988,758 | |
| 45,205 | | Automatic Data Processing, Inc.
| | | 2,240,360 | |
| 19,724 | 2 | BMC Software, Inc.
| | | 667,460 | |
| 36,966 | 2 | Broadcom Corp.
| | | 1,203,243 | |
| 450 | | Broadridge Financial Solutions
| | | 9,000 | |
| 66,168 | | CA, Inc.
| | | 1,750,144 | |
| 4,807 | 2 | CIENA Corp.
| | | 230,063 | |
| 41,400 | 2 | Ceridian Corp.
| | | 1,487,916 | |
| 5,400 | 2 | Checkfree Corp.
| | | 256,662 | |
| 605,728 | 2 | Cisco Systems, Inc.
| | | 20,025,368 | |
| 11,530 | 2 | Citrix Systems, Inc.
| | | 495,675 | |
| 21,600 | 2 | Cognizant Technology Solutions Corp.
| | | 895,536 | |
| 15,241 | 2 | Computer Sciences Corp.
| | | 889,922 | |
| 30,270 | 2 | Compuware Corp.
| | | 302,700 | |
| 10,325 | 2 | Convergys Corp.
| | | 189,257 | |
| 180,200 | | Corning, Inc.
| | | 4,373,454 | |
| 163,299 | 2 | Dell, Inc.
| | | 4,996,949 | |
| 186,925 | | EMC Corp. Mass
| | | 4,746,026 | |
| 21,000 | 2 | Electronic Arts, Inc.
| | | 1,283,520 | |
| 33,980 | | Electronic Data Systems Corp.
| | | 733,628 | |
| 11,300 | | Fidelity National Information Services, Inc.
| | | 521,156 | |
| 11,267 | 2 | Fiserv, Inc.
| | | 624,192 | |
| 1 | 2 | Flextronics International Ltd.
| | | 12 | |
| 21,262 | 2 | Google Inc.
| | | 15,032,234 | |
| 235,347 | | Hewlett-Packard Co.
| | | 12,162,733 | |
| 138,138 | | IBM Corp.
| | | 16,040,585 | |
| 444,580 | | Intel Corp.
| | | 11,959,202 | |
| 23,230 | 2 | Intuit, Inc.
| | | 747,309 | |
| 12,292 | 2 | JDS Uniphase Corp.
| | | 187,576 | |
| 16,985 | | Jabil Circuit, Inc.
| | | 369,084 | |
Shares
|
|
|
|
| Value
|
|
| | | COMMON STOCKS-continued 1 | | | | |
| | | Information Technology--continued | | | | |
| 46,300 | 2 | Juniper Networks, Inc.
| | $ | 1,666,800 | |
| 12,225 | | KLA-Tencor Corp.
| | | 643,646 | |
| 211,414 | 2 | LSI Logic Corp.
| | | 1,395,332 | |
| 7,718 | 2 | Lexmark International Group, Class A
| | | 324,079 | |
| 13,614 | | Linear Technology Corp.
| | | 449,534 | |
| 20,800 | 2 | MEMC Electronic Materials, Inc.
| | | 1,522,976 | |
| 11,170 | | Maxim Integrated Products, Inc.
| | | 302,707 | |
| 21,700 | | Microchip Technology, Inc.
| | | 719,789 | |
| 53,798 | 2 | Micron Technology, Inc.
| | | 565,417 | |
| 736,689 | | Microsoft Corp.
| | | 27,117,522 | |
| 11,181 | | Molex, Inc.
| | | 319,329 | |
| 157,221 | | Motorola, Inc.
| | | 2,954,183 | |
| 7,500 | 2 | NAVTEQ Corp.
| | | 579,000 | |
| 6,800 | 2 | NCR Corp.
| | | 187,612 | |
| 48,250 | 2 | NVIDIA Corp.
| | | 1,707,085 | |
| 18,514 | | National Semiconductor Corp.
| | | 465,442 | |
| 29,361 | 2 | Network Appliance, Inc.
| | | 924,578 | |
| 32,323 | 2 | Novell, Inc.
| | | 244,362 | |
| 10,321 | 2 | Novellus Systems, Inc.
| | | 293,220 | |
| 349,413 | 2 | Oracle Corp.
| | | 7,746,486 | |
| 31,757 | | Paychex, Inc.
| | | 1,326,807 | |
| 12,432 | 2 | Qlogic Corp.
| | | 193,069 | |
| 115,978 | | Qualcomm, Inc.
| | | 4,955,740 | |
| 14,900 | 2 | Sandisk Corp.
| | | 661,560 | |
| 490,486 | 2 | Sun Microsystems, Inc.
| | | 2,800,675 | |
| 130,080 | 2 | Symantec Corp.
| | | 2,442,902 | |
| 7,856 | | Tektronix, Inc.
| | | 297,350 | |
| 28,985 | 2 | Tellabs, Inc.
| | | 255,358 | |
| 24,332 | 2 | Teradata Corp.
| | | 694,192 | |
| 99,501 | 2 | Teradyne, Inc.
| | | 1,227,842 | |
| 121,591 | | Texas Instruments, Inc.
| | | 3,963,867 | |
| 49,498 | | Tyco Electronics Ltd.
| | | 1,765,594 | |
| 21,422 | 2 | Unisys Corp.
| | | 130,246 | |
| 18,200 | 2 | Verisign, Inc.
| | | 620,438 | |
Shares
|
|
|
|
| Value
|
|
| | | COMMON STOCKS-continued 1 | | | | |
| | | Information Technology--continued | | | | |
| 54,354 | | Western Union Co.
| | $ | 1,197,962 | |
| 72,422 | 2 | Xerox Corp.
| | | 1,263,040 | |
| 22,612 | | Xilinx, Inc.
| | | 551,733 | |
| 91,596 | 2 | Yahoo, Inc.
| | | 2,848,636 | |
| 134,500 | 2 | eBay, Inc.
|
|
| 4,855,450
|
|
| | | TOTAL
|
|
| 213,471,473
|
|
| | | Materials--3.2% | | | | |
| 17,032 | | Air Products & Chemicals, Inc.
| | | 1,666,581 | |
| 74,648 | | Alcoa, Inc.
| | | 2,955,314 | |
| 9,245 | | Allegheny Technologies, Inc.
| | | 944,562 | |
| 5,920 | | Ashland, Inc.
| | | 347,622 | |
| 7,944 | | Ball Corp.
| | | 393,864 | |
| 6,876 | | Bemis Co., Inc.
| | | 193,628 | |
| 84,237 | | Dow Chemical Co.
| | | 3,794,034 | |
| 77,306 | | Du Pont (E.I.) de Nemours & Co.
| | | 3,827,420 | |
| 7,396 | | Eastman Chemical Co.
| | | 492,500 | |
| 13,706 | | Ecolab, Inc.
| | | 646,512 | |
| 3,175 | | Florida Rock Industries, Inc.
| | | 199,803 | |
| 33,986 | | Freeport-McMoRan Copper & Gold, Inc.
| | | 3,999,472 | |
| 9,458 | | Hercules, Inc.
| | | 177,905 | |
| 14,200 | | Huntsman Corp.
| | | 374,170 | |
| 6,142 | | International Flavors & Fragrances, Inc.
| | | 320,674 | |
| 34,426 | | International Paper Co.
| | | 1,272,385 | |
| 17,400 | | Lyondell Chemical Co.
| | | 825,630 | |
| 24,728 | | MeadWestvaco Corp.
| | | 831,850 | |
| 45,854 | | Monsanto Co.
| | | 4,476,726 | |
| 5,300 | | Myers Industries, Inc.
| | | 112,307 | |
| 29,713 | | Newmont Mining Corp.
| | | 1,511,203 | |
| 45,668 | | Nucor Corp.
| | | 2,832,329 | |
| 21,342 | | PPG Industries, Inc.
| | | 1,595,101 | |
| 10,908 | 2 | Pactiv Corp.
| | | 299,643 | |
| 25,490 | | Praxair, Inc.
| | | 2,178,885 | |
| 10,858 | | Rohm & Haas Co.
| | | 563,313 | |
| 12,150 | | Sealed Air Corp.
| | | 302,900 | |
Shares
|
|
|
|
| Value
|
|
| | | COMMON STOCKS-continued 1 | | | | |
| | | Materials--continued | | | | |
| 12,360 | | Sigma-Aldrich Corp.
| | $ | 638,641 | |
| 9,224 | | Temple-Inland, Inc.
| | | 495,052 | |
| 8,300 | 2 | Titanium Metals Corp.
| | | 292,160 | |
| 10,310 | | United States Steel Corp.
| | | 1,112,449 | |
| 6,606 | | Vulcan Materials Co.
| | | 564,879 | |
| 18,417 | | Weyerhaeuser Co.
|
|
| 1,398,034
|
|
| | | TOTAL
|
|
| 41,637,548
|
|
| | | Telecommunication Services--3.7% | | | | |
| 565,139 | 3 | AT&T, Inc.
| | | 23,617,159 | |
| 59,246 | | Alltel Corp.
| | | 4,215,353 | |
| 9,130 | | CenturyTel, Inc.
| | | 402,177 | |
| 28,238 | | Citizens Communications Co., Class B
| | | 371,612 | |
| 32,700 | 2 | Dobson Communications Corp., Class A
| | | 423,138 | |
| 10,020 | | Embarq Corp.
| | | 530,258 | |
| 132,972 | 2 | Qwest Communications International, Inc.
| | | 954,739 | |
| 10,900 | 2 | Rural Cellular Corp.
| | | 483,633 | |
| 247,195 | | Sprint Nextel Corp.
| | | 4,227,035 | |
| 259,254 | | Verizon Communications
| | | 11,943,832 | |
| 44,418 | | Windstream Corp.
|
|
| 597,422
|
|
| | | TOTAL
|
|
| 47,766,358
|
|
| | | Utilities--3.3% | | | | |
| 53,239 | 2 | AES Corp.
| | | 1,139,847 | |
| 16,043 | 2 | Allegheny Energy, Inc.
| | | 973,168 | |
| 15,557 | | Ameren Corp.
| | | 841,011 | |
| 28,904 | | American Electric Power Co., Inc.
| | | 1,393,462 | |
| 12,492 | | CMS Energy Corp.
| | | 211,989 | |
| 131,314 | | CenterPoint Energy, Inc.
| | | 2,200,823 | |
| 18,441 | | Consolidated Edison Co.
| | | 868,387 | |
| 14,524 | | Constellation Energy Group
| | | 1,375,423 | |
| 16,467 | | DTE Energy Co.
| | | 816,763 | |
| 38,707 | | Dominion Resources, Inc.
| | | 3,546,722 | |
| 108,625 | | Duke Energy Corp.
| | | 2,082,341 | |
| 39,054 | 2 | Dynegy, Inc.
| | | 359,687 | |
| 29,758 | | Edison International
| | | 1,730,428 | |
Shares or
Principal
Amount
|
|
|
|
| Value
|
|
| | | COMMON STOCKS-continued 1 | | | | |
| | | Utilities--continued | | | | |
| 17,282 | | Entergy Corp.
| | $ | 2,071,593 | |
| 59,938 | | Exelon Corp.
| | | 4,961,668 | |
| 38,082 | | FPL Group, Inc.
| | | 2,605,570 | |
| 22,984 | | FirstEnergy Corp.
| | | 1,601,985 | |
| 4,827 | | Integrys Energy Group, Inc.
| | | 259,740 | |
| 1,589 | | NICOR, Inc.
| | | 68,756 | |
| 16,080 | | NiSource, Inc.
| | | 328,836 | |
| 33,436 | | P G & E Corp.
| | | 1,636,023 | |
| 63,774 | | PPL Corp.
| | | 3,297,116 | |
| 7,418 | | Pinnacle West Capital Corp.
| | | 299,687 | |
| 16,707 | | Progress Energy, Inc.
| | | 801,936 | |
| 22,569 | | Public Service Enterprises Group, Inc.
| | | 2,157,596 | |
| 12,100 | | Questar Corp.
| | | 690,668 | |
| 23,841 | | Sempra Energy
| | | 1,466,460 | |
| 60,486 | | Southern Co.
| | | 2,217,417 | |
| 19,088 | | TECO Energy, Inc.
| | | 321,251 | |
| 26,324 | | Xcel Energy, Inc.
|
|
| 593,606
|
|
| | | TOTAL
|
|
| 42,919,959
|
|
| | | TOTAL COMMON STOCKS (IDENTIFIED COST $517,764,456)
|
|
| 1,258,361,407
|
|
| | | CORPORATE BONDS--0.0% | | | | |
| | | Health Care--0.0% | | | | |
| $ | 250,000 | 4,5 | Genzyme Corp., Conv. Bond, 1.25%, 12/1/2023
|
|
| 290,480
|
|
| | | Industrials--0.0% | | | | |
| 227,000 | | Tyco International Group, Conv. Bond, 3.125%, 1/15/2023
|
|
| 312,577
|
|
| | | TOTAL CORPORATE BONDS (IDENTIFIED COST $583,871)
|
|
| 603,057
|
|
| | | Exchange Traded Funds--0.8% | | | | |
| 500 | | Midcap SPDR Trust Series 1
| | | 82,495 | |
| 61,897 | | SPDR Trust Series 1
|
|
| 9,572,371
|
|
| | | TOTAL EXCHANGE TRADED FUNDS (IDENTIFIED COST $8,953,259)
|
|
| 9,654,866
|
|
Shares
|
|
|
|
| Value
|
| | | MUTUAL FUND--1.8% | | | | |
| 23,728,562 | 6,7 | Prime Value Obligations Fund, Institutional Shares, 5.06%
(AT NET ASSET VALUE)
|
| $
| 23,728,562
|
|
| | | TOTAL INVESTMENTS--100.1%
(IDENTIFIED COST $551,030,148) 8
|
|
| 1,292,347,892
|
|
| | | OTHER ASSETS AND LIABILITIES - NET--(0.1)%
|
|
| (1,066,857
| )
|
| | | TOTAL NET ASSETS--100%
|
| $
| 1,291,281,035
|
|
At October 31, 2007, the Fund had the following outstanding futures contracts 1 :
Description
|
| Number of
Contracts
|
| Notional Value
|
| Expiration Date
|
| Unrealized
Appreciation
|
2 S&P 500 Index Long Futures
|
| 120
|
| $46,647,000
|
| December 2007
|
| $1,987,376
|
At October 31, 2007, the Fund had the following securities sold short:
Description
|
| Shares
|
| Value
|
Patriot Coal Corp. (Proceeds $63,278)
|
| 1,780
|
| $63,279
|
1 The Fund purchases index futures contracts to efficiently manage cash flows resulting from shareholder purchases and redemptions, dividend and capital gain payments to shareholders and corporate actions while maintaining exposure to the S&P 500 Index and minimizing trading costs. The underlying face amount, at value, of open index futures contracts is $46,647,000 at October 31, 2007, which represents 3.6% of total net assets. Taking into consideration these open index futures contracts, the Fund's effective total exposure to the S&P 500 Index is 101.0%.
2 Non-income producing security.
3 Pledged as collateral to ensure the Fund is able to satisfy the obligations of its outstanding long futures contracts.
4 Denotes a restricted security that either: (a) cannot be offered for public sale without first being registered, or being able to take advantage of an exemption from registration, under the Securities Act of 1933; or (b) is subject to a contractual restriction on public sales. At October 31, 2007, this restricted security amounted to $290,480, which represented 0.0% of total net assets.
5 Denotes a restricted security that may be resold without restriction to "qualified institutional buyers" as defined in Rule 144A under the Securities Act of 1933 and that the Fund has determined to be liquid under criteria established by the Fund's Board of Trustees. At October 31, 2007, this liquid restricted security amounted to $290,480, which represented 0.0% of total net assets.
6 Affiliated company.
7 7-Day net yield.
8 The cost of investments for federal tax purposes amounts to $576,032,709.
Note: The categories of investments are shown as a percentage of total net assets at October 31, 2007.
The following acronym is used throughout this portfolio:
| ADR | - --American Depositary Receipt |
See Notes which are an integral part of the Financial Statements
Statement of Assets and Liabilities
October 31, 2007
Assets:
| | | | | | |
Total investments in securities, at value including $23,728,562 of investments in affiliated issuers (Note 5) (identified cost $551,030,148)
| | | | | $ | 1,292,347,892 |
Cash
| | | | | | 794,367 |
Restricted cash
| | | | | | 1,843,000 |
Income receivable
| | | | | | 1,109,224 |
Receivable for investments sold
| | | | | | 3,199,963 |
Receivable for shares sold
| | | | | | 591,846 |
Receivable for daily variation margin
|
|
|
|
|
| 553,746
|
TOTAL ASSETS
|
|
|
|
|
| 1,300,440,038
|
Liabilities:
| | | | | | |
Securities sold short, at value (proceeds $63,278)
| | $ | 63,279 | | | |
Payable for investments purchased
| | | 3,390,572 | | | |
Payable for shares redeemed
| | | 5,196,065 | | | |
Payable for Directors'/Trustees' fees
| | | 1,681 | | | |
Payable for distribution services fee (Note 5)
| | | 102,945 | | | |
Payable for shareholder services fee (Note 5)
| | | 141,205 | | | |
Accrued expenses
|
|
| 263,256
|
|
|
|
TOTAL LIABILITIES
|
|
|
|
|
| 9,159,003
|
Net assets for 45,401,867 shares outstanding
|
|
|
|
| $
| 1,291,281,035
|
Net Assets Consist of:
| | | | | | |
Paid-in capital
| | | | | $ | 429,443,795 |
Net unrealized appreciation of investments and futures contracts
| | | | | | 743,305,119 |
Accumulated net realized gain on investments and futures contracts
| | | | | | 117,262,782 |
Undistributed net investment income
|
|
|
|
|
| 1,269,339
|
TOTAL NET ASSETS
|
|
|
|
| $
| 1,291,281,035
|
Net Asset Value, Offering Price and Redemption Proceeds Per Share:
| | | | | | |
Institutional Shares:
| | | | | | |
Net asset value per share ($651,326,778 ÷ 22,870,182 shares outstanding), no par value, unlimited shares authorized
|
|
|
|
|
| $28.48
|
Institutional Service Shares:
| | | | | | |
Net asset value per share ($490,721,714 ÷ 17,270,243 shares outstanding), no par value, unlimited shares authorized
|
|
|
|
|
| $28.41
|
Class C Shares:
| | | | | | |
Net asset value per share ($75,530,861 ÷ 2,666,797 shares outstanding), no par value, unlimited shares authorized
|
|
|
|
|
| $28.32
|
Offering price per share
|
|
|
|
|
| $28.32
|
Redemption proceeds per share (99.00/100 of $28.32) 1
|
|
|
|
|
| $28.04
|
Class K Shares:
| | | | | | |
Net asset value per share ($73,701,682 ÷ 2,594,645 shares outstanding), no par value, unlimited shares authorized
|
|
|
|
|
| $28.41
|
1 See "What Do Shares Cost?" in the Prospectus.
See Notes which are an integral part of the Financial Statements
Statement of Operations
Year Ended October 31, 2007
Investment Income:
| | | | | | | | | | | |
Dividends (including $87,119 received from affiliated issuers (Note 5) and net of foreign taxes withheld of $508)
| | | | | | | | | | $ | 24,375,960 |
Interest (including income on securities loaned of $45,060)
|
|
|
|
|
|
|
|
|
|
| 1,881,658
|
TOTAL INCOME
|
|
|
|
|
|
|
|
|
|
| 26,257,618
|
Expenses:
| | | | | | | | | | | |
Management fee (Note 5)
| | | | | | $ | 3,964,909 | | | | |
Custodian fees
| | | | | | | 134,465 | | | | |
Transfer and dividend disbursing agent fees and expenses--Institutional Shares
| | | | | | | 306,714 | | | | |
Transfer and dividend disbursing agent fees and expenses--Institutional Services Shares
| | | | | | | 294,459 | | | | |
Transfer and dividend disbursing agent fees and expenses--Class C Shares
| | | | | | | 58,291 | | | | |
Transfer and dividend disbursing agent fees and expenses--Class K Shares
| | | | | | | 218,654 | | | | |
Directors'/Trustees' fees
| | | | | | | 15,687 | | | | |
Auditing fees
| | | | | | | 21,060 | | | | |
Legal fees
| | | | | | | 12,361 | | | | |
Portfolio accounting fees
| | | | | | | 204,080 | | | | |
Distribution services fee--Institutional Service Shares (Note 5)
| | | | | | | 1,521,853 | | | | |
Distribution services fee--Class C Shares (Note 5)
| | | | | | | 568,974 | | | | |
Distribution services fee--Class K Shares (Note 5)
| | | | | | | 392,547 | | | | |
Shareholder services fee--Institutional Service Shares (Note 5)
| | | | | | | 1,228,066 | | | | |
Shareholder services fee--Class C Shares (Note 5)
| | | | | | | 186,127 | | | | |
Account administration fee--Institutional Service Shares
| | | | | | | 21,030 | | | | |
Account administration fee--Class C Shares
| | | | | | | 1,259 | | | | |
Share registration costs
| | | | | | | 58,366 | | | | |
Printing and postage
| | | | | | | 85,459 | | | | |
Insurance premiums
| | | | | | | 12,352 | | | | |
Miscellaneous
|
|
|
|
|
|
| 12,945
|
|
|
|
|
TOTAL EXPENSES
|
|
|
|
|
|
| 9,319,658
|
|
|
|
|
Statement of Operations - continued
Year Ended October 31, 2007
Waivers and Reimbursements (Note 5):
| | | | | | | | | | | |
Waiver/Reimbursement of management fee
| | $ | (207,996 | ) | | | | | | | |
Waiver of distribution services fee--Institutional Service Shares
| | | (1,249,097 | ) | | | | | | | |
Reimbursement of transfer and dividend disbursing agent fees and expenses--Institutional Shares
| | | (119,458 | ) | | | | | | | |
Reimbursement of transfer and dividend disbursing agent fees and expenses--Institutional Service Shares
|
|
| (149,785
| )
|
|
|
|
|
|
|
|
TOTAL WAIVERS AND REIMBURSEMENTS
|
|
|
|
|
| $
| (1,726,336
| )
|
|
|
|
Net expenses
|
|
|
|
|
|
|
|
|
| $
| 7,593,322
|
Net investment income
|
|
|
|
|
|
|
|
|
|
| 18,664,296
|
Realized and Unrealized Gain on Investments and Futures Contracts:
| | | | | | | | | | | |
Net realized gain on investments
| | | | | | | | | | | 148,307,332 |
Net realized gain on futures contracts
| | | | | | | | | | | 3,882,654 |
Net change in unrealized appreciation of investments
| | | | | | | | | | | 1,073,983 |
Net change in unrealized appreciation of futures contracts
|
|
|
|
|
|
|
|
|
|
| 877,406
|
Net realized and unrealized gain on investments and futures contracts
|
|
|
|
|
|
|
|
|
|
| 154,141,375
|
Change in net assets resulting from operations
|
|
|
|
|
|
|
|
|
| $
| 172,805,671
|
See Notes which are an integral part of the Financial Statements
Statement of Changes in Net Assets
Year Ended October 31
|
|
| 2007
|
|
|
| 2006
| |
Increase (Decrease) in Net Assets
| | | | | | | | |
Operations:
| | | | | | | | |
Net investment income
| | $ | 18,664,296 | | | $ | 18,320,306 | |
Net realized gain on investments and futures contracts
| | | 152,189,986 | | | | 104,056,643 | |
Net change in unrealized appreciation/depreciation of investments and futures contracts
|
|
| 1,951,389
|
|
|
| 68,317,402
|
|
CHANGE IN NET ASSETS RESULTING FROM OPERATIONS
|
|
| 172,805,671
|
|
|
| 190,694,351
|
|
Distributions to Shareholders:
| | | | | | | | |
Distributions from net investment income
| | | | | | | | |
Institutional Shares
| | | (10,838,506 | ) | | | (10,135,947 | ) |
Institutional Service Shares
| | | (6,835,922 | ) | | | (6,810,465 | ) |
Class C Shares
| | | (461,547 | ) | | | (491,679 | ) |
Class K Shares
| | | (725,527 | ) | | | (567,194 | ) |
Distributions from net realized gain on investments and futures contracts
| | | | | | | | |
Institutional Shares
| | | (48,133,782 | ) | | | (13,315,437 | ) |
Institutional Service Shares
| | | (38,534,752 | ) | | | (11,254,029 | ) |
Class C Shares
| | | (5,704,443 | ) | | | (1,822,764 | ) |
Class K Shares
|
|
| (5,668,243
| )
|
|
| (852,806
| )
|
CHANGE IN NET ASSETS RESULTING FROM DISTRIBUTIONS TO SHAREHOLDERS
|
|
| (116,902,722
| )
|
|
| (45,250,321
| )
|
Share Transactions:
| | | | | | | | |
Proceeds from sale of shares
| | | 319,255,829 | | | | 310,746,903 | |
Net asset value of shares issued to shareholders in payment of distributions declared
| | | 94,782,616 | | | | 35,282,309 | |
Cost of shares redeemed
|
|
| (520,329,678
| )
|
|
| (431,285,161
| )
|
CHANGE IN NET ASSETS RESULTING FROM SHARE TRANSACTIONS
|
|
| (106,291,233
| )
|
|
| (85,255,949
| )
|
Change in net assets
|
|
| (50,388,284
| )
|
|
| 60,188,081
|
|
Net Assets:
| | | | | | | | |
Beginning of period
|
|
| 1,341,669,319
|
|
|
| 1,281,481,238
|
|
End of period (including undistributed net investment income of $1,269,339 and $1,466,547, respectively)
|
| $
| 1,291,281,035
|
|
| $
| 1,341,669,319
|
|
See Notes which are an integral part of the Financial Statements
Notes to Financial Statements
October 31, 2007
1. ORGANIZATION
Federated Index Trust (the "Trust") is registered under the Investment Company Act of 1940, as amended (the "Act"), as an open-end management investment company. The Trust consists of three portfolios. The financial statements included herein are only those of Federated Max-Cap Index Fund (the "Fund"), a diversified portfolio. The financial statements of the other portfolios are presented separately. The assets of each portfolio are segregated and a shareholder's interest is limited to the portfolio in which shares are held. Each portfolio pays its own expenses. The Fund offers four classes of shares: Institutional Shares, Institutional Service Shares, Class C Shares and Class K Shares. All shares of the Fund have equal rights with respect to voting, except on class-specific matters. The investment objective of the Fund is to provide investment results that generally correspond to the aggregate price and dividend performance of publicly traded common stocks comprising the Standard & Poor's 500 Composite Stock Price Index.
2. SIGNIFICANT ACCOUNTING POLICIES
The following is a summary of significant accounting policies consistently followed by the Fund in the preparation of its financial statements. These policies are in conformity with generally accepted accounting principles (GAAP) in the United States of America.
Investment Valuation
In calculating its net asset value (NAV), the Fund generally values investments as follows:
- Equity securities listed on an exchange or traded through a regulated market system are valued at their last reported sale price or official closing price in their principal exchange or market.
- Shares of other mutual funds are valued based upon their reported NAVs.
- Derivative contracts listed on exchanges are valued at their reported settlement or closing price.
- OTC derivative contracts are fair valued using price evaluations provided by a pricing service approved by the Board of Trustees (the "Trustees").
- Fixed-income securities acquired with remaining maturities of 60 days or less are valued at their cost (adjusted for the accretion of any discount or amortization of any premium).
- Fixed-income securities acquired with remaining maturities greater than 60 days are fair valued using price evaluations provided by a pricing service approved by the Trustees.
If the Fund cannot obtain a price or price evaluation from a pricing service for an investment, the Fund may attempt to value the investment based upon the mean of bid and asked quotations or fair value the investment based on price evaluations, from one or more dealers. If any price, quotation, price evaluation or other pricing source is not readily available when the NAV is calculated, the Fund uses the fair value of the investment determined in accordance with the procedures described below. There can be no assurance that the Fund could purchase or sell an investment at the price used to calculate the Fund's NAV.
Fair Valuation and Significant Events Procedures
The Trustees have authorized the use of pricing services to provide evaluations of the current fair value of certain investments for purposes of calculating the NAV. Factors considered by pricing services in evaluating an investment include the yields or prices of investments of comparable quality, coupon, maturity, call rights and other potential prepayments, terms and type, reported transactions, indications as to values from dealers, and general market conditions. Some pricing services provide a single price evaluation reflecting the bid-side of the market for an investment (a "bid" evaluation). Other pricing services offer both bid evaluations and price evaluations indicative of a price between the prices bid and asked for the investment (a "mid" evaluation). The Fund normally uses bid evaluations for U.S. Treasury and Agency securities, mortgage-backed securities and municipal securities. The Fund normally uses mid evaluations for other types of fixed-income securities and OTC derivative contracts. In the event that market quotations and price evaluations are not available for an investment, the fair value of the investment is determined in accordance with procedures adopted by the Trustees.
The Trustees also have adopted procedures requiring an investment to be priced at its fair value whenever the Adviser determines that a significant event affecting the value of the investment has occurred between the time as of which the price of the investment would otherwise be determined and the time as of which the NAV is computed. An event is considered significant if there is both an affirmative expectation that the investment's value will change in response to the event and a reasonable basis for quantifying the resulting change in value. Examples of significant events that may occur after the close of the principal market on which a security is traded, or after the time of a price evaluation provided by a pricing service or a dealer, include:
- With respect to securities traded in foreign markets, significant trends in U.S. equity markets or in the trading of foreign securities index futures or options contracts;
- With respect to price evaluations of fixed-income securities determined before the close of regular trading on the NYSE, actions by the Federal Reserve Open Market Committee and other significant trends in U.S. fixed-income markets;
- Political or other developments affecting the economy or markets in which an issuer conducts its operations or its securities are traded; and
- Announcements concerning matters such as acquisitions, recapitalizations, litigation developments, a natural disaster affecting the issuer's operations or regulatory changes or market developments affecting the issuer's industry.
The Trustees have approved the use of a pricing service to determine the fair value of equity securities traded principally in foreign markets when the Adviser determines that there has been a significant trend in the U.S. equity markets or in index futures trading. For other significant events, the Fund may seek to obtain more current quotations or price evaluations from alternative pricing sources. If a reliable alternative pricing source is not available, the Fund will determine the fair value of the investment using another method approved by the Trustees.
Repurchase Agreements
It is the policy of the Fund to require the other party to a repurchase agreement to transfer to the Fund's custodian or sub-custodian eligible securities or cash with a market value (after transaction costs) at least equal to the repurchase price to be paid under the repurchase agreement. The eligible securities are transferred to accounts with the custodian or sub-custodian in which the Fund holds a "securities entitlement" and exercises "control" as those terms are defined in the Uniform Commercial Code. The Fund has established procedures for monitoring the market value of the transferred securities and requiring the transfer of additional eligible securities if necessary to equal at least the repurchase price. These procedures also allow the other party to require securities to be transferred from the account to the extent that their market value exceeds the repurchase price or in exchange for other eligible securities of equivalent market value.
With respect to agreements to repurchase U.S. government securities and cash items, the Fund treats the repurchase agreement as an investment in the underlying securities and not as an obligation of the other party to the repurchase agreement. Other repurchase agreements are treated as obligations of the other party secured by the underlying securities. Nevertheless, the insolvency of the other party or other failure to repurchase the securities may delay the disposition of the underlying securities or cause the Fund to receive less than the full repurchase price. Under the terms of the repurchase agreement, any amounts received by the Fund in excess of the repurchase price and related transaction costs must be remitted to the other party.
The Fund may enter into repurchase agreements in which eligible securities are transferred into joint trading accounts maintained by the custodian or sub-custodian for investment companies and other clients advised by the Fund's adviser and its affiliates. The Fund will participate on a pro rata basis with the other investment companies and clients in its share of the securities transferred under such repurchase agreements and in its share of proceeds from any repurchase or other disposition of such securities.
Investment Income, Gains and Losses, Expenses and Distributions
Interest income and expenses are accrued daily. Dividend income and distributions to shareholders are recorded on the ex-dividend date. Foreign dividends are recorded on the ex-dividend date or when the Fund is informed of the ex-dividend date. Distributions of net investment income are declared and paid quarterly. Non-cash dividends included in dividend income, if any, are recorded at fair value. Investment income, realized and unrealized gains and losses, and certain fund-level expenses are allocated to each class based on relative average daily net assets, except that Institutional Shares, Institutional Service Shares, Class C Shares and Class K Shares may bear distribution services fees, shareholder services fees, account administration fees and certain transfer and dividend disbursing agent fees unique to those classes. Dividends are declared separately for each class. No class has preferential dividend rights; differences in per share dividend rates are generally due to differences in separate class expenses.
Premium and Discount Amortization
All premiums and discounts on fixed-income securities are amortized/accreted for financial statement purposes.
Federal Taxes
It is the Fund's policy to comply with the Subchapter M provision of the Internal Revenue Code (the "Code") and to distribute to shareholders each year substantially all of its income. Accordingly, no provision for federal income tax is necessary.
Withholding taxes and where appropriate, deferred withholding taxes on foreign interest, dividends and capital gains have been provided for in accordance with the applicable country's tax rules and rates.
When-Issued and Delayed Delivery Transactions
The Fund may engage in when-issued or delayed delivery transactions. The Fund records when-issued securities on the trade date and maintains security positions such that sufficient liquid assets will be available to make payment for the securities purchased. Securities purchased on a when-issued or delayed delivery basis are marked to market daily and begin earning interest on the settlement date. Losses may occur on these transactions due to changes in market conditions or the failure of counterparties to perform under the contract.
Futures Contracts
The Fund purchases stock index futures contracts to manage cashflows, maintain exposure to the S&P 500 Index and to potentially reduce transaction costs. Upon entering into a stock index futures contract with a broker, the Fund is required to deposit in a segregated account a specified amount of cash or U.S. government securities. Futures contracts are valued daily and unrealized gains or losses are recorded in a "variation margin" account. Daily, the Fund receives from or pays to the broker a specified amount of cash based upon changes in the variation margin account. When a contract is closed, the Fund recognizes a realized gain or loss. Futures contracts have market risks, including the risk that the change in the value of the contract may not correlate with the changes in the value of the underlying securities. For the year ended October 31, 2007, the Fund had net realized gains on futures contracts of $3,882,654.
Futures contracts outstanding at period end are listed after the Fund's portfolio of investments.
Foreign Currency Translation
The accounting records of the Fund are maintained in U.S. dollars. All assets and liabilities denominated in foreign currencies (FCs) are translated into U.S. dollars based on the rates of exchange of such currencies against U.S. dollars on the date of valuation. Purchases and sales of securities, income and expenses are translated at the rate of exchange quoted on the respective date that such transactions are recorded. The Fund does not isolate that portion of the results of operations resulting from changes in foreign exchange rates on investments from the fluctuations arising from changes in market prices of securities held. Such fluctuations are included with the net realized and unrealized gain or loss from investments.
Reported net realized foreign exchange gains or losses arise from sales of portfolio securities, sales and maturities of short-term securities, sales of FCs, currency gains or losses realized between the trade and settlement dates on securities transactions, the difference between the amounts of dividends, interest and foreign withholding taxes recorded on the Fund's books, and the U.S. dollar equivalent of the amounts actually received or paid. Net unrealized foreign exchange gains and losses arise from changes in the value of assets and liabilities other than investments in securities at fiscal year end, resulting from changes in the exchange rate.
Securities Lending
The Fund participates in a securities lending program providing for the lending of equity securities to qualified brokers. The Fund normally receives cash collateral for securities loaned that is invested in short-term securities including repurchase agreements. Collateral is maintained at a minimum level of 100% of the market value of investments loaned, plus interest, if applicable. Earnings on collateral are allocated between the securities lending agent, as a fee for its services under the program, and the Fund, according to agreed-upon rates.
As of October 31, 2007, the Fund had no outstanding securities on loan.
Restricted Securities
Restricted securities are securities that either: (a) cannot be offered for public sale without first being registered, or being able to take advantage of an exemption from registration, under the Securities Act of 1933; or (b) are subject to contractual restrictions on public sales. In some cases, when a security cannot be offered for public sale without first being registered, the issuer of the restricted security has agreed to register such securities for resale, at the issuer's expense, either upon demand by the Fund or in connection with another registered offering of the securities. Many such restricted securities may be resold in the secondary market in transactions exempt from registration. Restricted securities may be determined to be liquid under criteria established by the Trustees. The Fund will not incur any registration costs upon such resales. The Fund's restricted securities are valued at the price provided by dealers in the secondary market or, if no market prices are available, at the fair value as determined in accordance with procedures established by and under the general supervision of the Trustees.
Use of Estimates
The preparation of financial statements in conformity with GAAP requires management to make estimates and assumptions that affect the amounts of assets, liabilities, expenses and revenues reported in the financial statements. Actual results could differ from those estimated.
Other
Investment transactions are accounted for on a trade-date basis. Realized gains and losses from investment transactions are recorded on an identified cost basis.
3. SHARES OF BENEFICIAL INTEREST
The following tables summarize share activity:
Year Ended October 31
|
| 2007
|
|
| 2006
|
|
Institutional Shares:
|
| Shares
|
|
|
| Amount
|
|
| Shares
|
|
|
| Amount
|
|
Shares sold
| | 5,745,886 | | | $ | 155,519,637 | | | 4,973,618 | | | $ | 126,951,778 | |
Shares issued to shareholders in payment of distributions declared
|
| 1,515,491 | |
| | 39,030,951 | |
| 568,043 |
|
| | 14,368,500 |
|
Shares redeemed
|
| (8,519,748
| )
|
|
| (231,469,095
| )
|
| (7,114,013
| )
|
|
| (181,529,111
| )
|
NET CHANGE RESULTING FROM INSTITUTIONAL SHARE TRANSACTIONS
|
| (1,258,371
| )
|
|
$
| (36,918,507
| )
|
| (1,572,352
| )
|
|
$
| (40,208,833
| )
|
| | | | | | | | | | | | | | |
Year Ended October 31
|
| 2007
|
|
| 2006
|
|
Institutional Service Shares:
|
| Shares
|
|
|
| Amount
|
|
| Shares
|
|
|
| Amount
|
|
Shares sold
| | 4,459,045 | | | $ | 120,537,344 | | | 4,898,375 | | | $ | 125,588,208 | |
Shares issued to shareholders in payment of distributions declared
|
| 1,719,290 | |
|
| 44,055,302 | |
| 694,494 |
|
|
| 17,518,532 |
|
Shares redeemed
|
| (8,196,177
| )
|
|
| (221,826,097
| )
|
| (7,867,507
| )
|
|
| (201,260,876
| )
|
NET CHANGE RESULTING FROM INSTITUTIONAL SERVICE SHARE TRANSACTIONS
|
| (2,017,842
| )
|
|
$
| (57,233,451
| )
|
| (2,274,638
| )
|
|
$
| (58,154,136
| )
|
| | | | | | | | | | | | | | |
Year Ended October 31
|
| 2007
|
|
| 2006
|
|
Class C Shares:
|
| Shares
|
|
|
| Amount
|
|
| Shares
|
|
|
| Amount
|
|
Shares sold
| | 551,878 | | | $ | 14,801,313 | | | 503,180 | | | $ | 12,812,525 | |
Shares issued to shareholders in payment of distributions declared
|
| 209,367 |
|
|
| 5,324,508 |
|
| 78,951 |
|
| | 1,980,852 |
|
Shares redeemed
|
| (960,840
| )
|
|
| (25,734,027
| )
|
| (1,261,909
| )
|
|
| (32,067,621
| )
|
NET CHANGE RESULTING FROM CLASS C SHARE TRANSACTIONS
|
| (199,595
| )
|
| $
| (5,608,206
| )
|
| (679,778
| )
|
|
$
| (17,274,244
| )
|
| | | | | | | | | | | | | | |
Year Ended October 31
|
| 2007
|
|
| 2006
|
|
Class K Shares:
|
| Shares
|
|
|
| Amount
|
|
| Shares
|
|
|
| Amount
|
|
Shares sold
| | 1,054,766 | | | $ | 28,397,535 | | | 1,767,633 | | | $ | 45,394,392 | |
Shares issued to shareholders in payment of distributions declared
|
| 249,269 | |
|
| 6,371,855 | |
| 55,989 |
|
|
| 1,414,425 |
|
Shares redeemed
|
| (1,520,582
| )
|
|
| (41,300,459
| )
|
| (633,754
| )
|
|
| (16,427,553
| )
|
NET CHANGE RESULTING FROM CLASS K SHARE TRANSACTIONS
|
| (216,547
| )
|
|
$
| (6,531,069
| )
|
| 1,189,868
|
|
|
$
| 30,381,264
|
|
NET CHANGE RESULTING FROM SHARE TRANSACTIONS
|
| (3,692,355
| )
|
| $
| (106,291,233
| )
|
| (3,336,900
| )
|
| $
| (85,255,949
| )
|
4. FEDERAL TAX INFORMATION
The timing and character of income and capital gain distributions are determined in accordance with income tax regulations, which may differ from GAAP. These differences are due in part to differing treatments for deferral of wash sales and regulatory settlement proceeds.
For the year ended October 31, 2007, permanent differences identified and reclassified among the components of net assets were as follows:
Paid-in Capital
|
| Undistributed Net
Investment Income (Loss)
|
| Accumulated Net
Realized Gains (Losses)
|
$(142,132)
|
| $(2)
|
| $142,134
|
Net investment income (loss), net realized gains (losses), and net assets were not affected by this reclassification.
The tax character of distributions as reported on the Statement of Changes in Net Assets for the years ended October 31, 2007 and 2006, was as follows:
|
| 2007
|
| 2006
|
Ordinary income 1
|
| $26,939,109
|
| $18,005,285
|
Long-term capital gains
|
| $89,963,613
|
| $27,245,036
|
1 For tax purposes, short-term capital gain distributions are considered ordinary income distributions.
As of October 31, 2007, the components of distributable earnings on a tax basis were as follows:
Undistributed ordinary income
|
| $
| 16,528,040
|
Undistributed long-term capital gains
|
| $
| 128,994,025
|
Net unrealized appreciation
|
| $
| 716,315,175
|
The difference between book-basis and tax-basis net unrealized appreciation/depreciation is attributable in part to differing treatments for the deferral of losses on wash sales.
At October 31, 2007, the cost of investments for federal tax purposes was $576,032,709. The net unrealized appreciation of investments for federal tax purposes excluding any unrealized appreciation/depreciation resulting from changes in foreign currency exchange rates and from futures contracts was $716,315,183. This consists of net unrealized appreciation from investments for those securities having an excess of value over cost of $721,375,848 and net unrealized depreciation from investments for those securities having an excess of cost over value of $5,060,665.
5. INVESTMENT ADVISER FEE AND OTHER TRANSACTIONS WITH AFFILIATES
Management Fee
Federated Equity Management Company of Pennsylvania is the Fund's manager (the "Manager"). The Management agreement between the Fund and Manager provides for an annual fee equal to 0.30% of the Fund's average daily net assets. Subject to the terms described in the Expense Limitation note, the Manager may voluntarily choose to waive any portion of its fee. The Manager can modify or terminate this voluntary waiver at any time at its sole discretion. For the year ended October 31, 2007, the Manager voluntarily waived $206,580 of its fee. In addition, an affiliate of the Manager reimbursed $269,243 of transfer and dividend disbursing agent fees and expenses. Under the terms of a subadvisory contract between the Manager and BlackRock Investment Management LLC, a wholly owned subsidiary of BlackRock, Inc. (the "Subadvisor"), the Subadvisor receives an annual fee from the Manager equal to 0.0150% times 80% of the Fund's average daily net assets plus 0.150% times 20% of the Fund's average daily net assets.
Distribution Services Fee
The Fund has adopted a Distribution Plan (the "Plan") pursuant to Rule 12b-1 under the Act. Under the terms of the Plan, the Fund will compensate Federated Securities Corp. (FSC), the principal distributor, from the daily net assets of the Fund's Institutional Service Shares, Class C Shares and Class K Shares to finance activities intended to result in the sale of these shares. The Plan provides that the Fund may incur distribution expenses at the following percentages of average daily net assets annually, to compensate FSC:
Share Class Name
|
| Percentage of Average Daily
Net Assets of Class
|
Institutional Service Shares
|
| 0.30%
|
Class C Shares
|
| 0.75%
|
Class K Shares
|
| 0.50%
|
Subject to the terms described in the Expense Limitation note, FSC may voluntarily choose to waive any portion of its fee. FSC can modify or terminate this voluntary waiver at any time at its sole discretion. For the year ended October 31, 2007, FSC voluntarily waived $1,249,097 of its fee. When FSC receives fees, it may pay some or all of them to financial intermediaries whose customers purchase shares. For the year ended October 31, 2007, FSC retained $514,449 of fees paid by the Fund.
Sales Charges
For the year ended October 31, 2007, FSC retained $1,047 of contingent deferred sales charges relating to redemptions of Class C Shares. See "What Do Shares Cost?" in the Prospectus.
Shareholder Services Fee
The Fund may pay fees (Service Fees) up to 0.25% of the average daily net assets of the Fund's Institutional Shares, Institutional Service Shares and Class C Shares to financial intermediaries or to Federated Shareholder Services Company (FSSC) for providing services to shareholders and maintaining shareholder accounts. Subject to the terms described in the Expense Limitation note, FSSC may voluntarily reimburse the Fund for shareholder services fees. This voluntary reimbursement can be modified or terminated at any time. For the year ended October 31, 2007, FSSC did not receive any fees paid by the Fund. For the year ended October 31, 2007, the Fund's Institutional Shares did not incur a shareholder services fee.
Expense Limitation
The Adviser and its affiliates (which may include FSC and FSSC) have voluntarily agreed to waive their fees and/or reimburse expenses so that the total operating expenses (as shown in the financial highlights) paid by the Fund's Institutional Shares, Institutional Service Shares, Class C Shares and Class K Shares (after the voluntary waivers and reimbursements) will not exceed 0.35%, 0.65%, 1.45% and 1.10%, respectively, for the fiscal year ending October 31, 2008. Although these actions are voluntary, the Manager and its affiliates have agreed not to terminate these waivers and/or reimbursements until after December 31, 2008.
General
Certain of the Officers and Trustees of the Fund are Officers and Directors or Trustees of the above companies.
Transactions with Affiliated Companies
Affiliated holdings are mutual funds which are managed by the Adviser or an affiliate of the Adviser. The Adviser has agreed to reimburse the Fund for certain investment adviser fees as a result of transactions in other affiliated mutual funds. For the year ended October 31, 2007, the Adviser reimbursed $1,416 in connection with the affiliated mutual fund listed below. Transactions with the affiliated company during the year ended October 31, 2007 are as follows:
Affiliate
|
| Balance of
Shares Held
10/31/2006
|
| Purchases/
Additions
|
| Sales/
Reductions
|
| Balance of
Shares Held
10/31/2007
|
| Value
|
| Dividend
Income
|
Prime Value Obligations Fund, Institutional Shares, 5.06%
|
| - --
|
| 41,236,768
|
| 17,508,206
|
| 23,728,562
|
| $23,728,562
|
| $87,119
|
6. INVESTMENT TRANSACTIONS
Purchases and sales of investments, excluding long-term U.S. government securities and short-term obligations, for the year ended October 31, 2007, were as follows:
Purchases
|
| $
| 626,725,958
|
Sales
|
| $
| 825,114,183
|
7. INTERFUND LENDING
Pursuant to an Exemptive Order issued by the Securities and Exchange Commission (SEC), the Fund, along with other funds advised by subsidiaries of Federated Investors, Inc., may participate in an interfund lending program. This program provides an alternative credit facility allowing the funds to borrow from other participating affiliated funds.
As of October 31, 2007, there were no outstanding loans. During the year ended October 31, 2007, the program was not utilized.
8. LEGAL PROCEEDINGS
Beginning in October 2003, Federated Investors, Inc. and various subsidiaries thereof (including the advisers and distributor for various investment companies, collectively, "Federated"), along with various investment companies sponsored by Federated ("Funds") were named as defendants in several class action lawsuits now pending in the United States District Court for the District of Maryland. The lawsuits were purportedly filed on behalf of people who purchased, owned and/or redeemed shares of Federated-sponsored mutual funds during specified periods beginning November 1, 1998. The suits are generally similar in alleging that Federated engaged in illegal and improper trading practices including market timing and late trading in concert with certain institutional traders, which allegedly caused financial injury to the mutual fund shareholders. These lawsuits began to be filed shortly after Federated's first public announcement that it had received requests for information on shareholder trading activities in the Funds from the SEC, the Office of the New York State Attorney General ("NYAG"), and other authorities. In that regard, on November 28, 2005, Federated announced that it had reached final settlements with the SEC and the NYAG with respect to those matters. As Federated previously reported in 2004, it has already paid approximately $8.0 million to certain funds as determined by an independent consultant. As part of these settlements, Federated agreed to pay for the benefit of fund shareholders additional disgorgement and a civil money penalty in the aggregate amount of an additional $72 million. Federated and various Funds have also been named as defendants in several additional lawsuits, the majority of which are now pending in the United States District Court for the Western District of Pennsylvania, alleging, among other things, excessive advisory and Rule 12b-1 fees. The Board of the Funds has retained the law firm of Dickstein Shapiro LLP to represent the Funds in these lawsuits. Federated and the Funds, and their respective counsel, are reviewing the allegations and intend to defend this litigation. Additional lawsuits based upon similar allegations may be filed in the future. The potential impact of these lawsuits, all of which seek unquantified damages, attorneys' fees and expenses, and future potential similar suits is uncertain. Although we do not believe that these lawsuits will have a material adverse effect on the Funds, there can be no assurance that these suits, the ongoing adverse publicity and/or other developments resulting from the regulatory investigations will not result in increased Fund redemptions, reduced sales of Fund shares, or other adverse consequences for the Funds.
9. RECENT ACCOUNTING PRONOUNCEMENTS
In July 2006, the Financial Accounting Standards Board (FASB) released FASB Interpretation No. 48 "Accounting for Uncertainty in Income Taxes" (FIN 48). FIN 48 provides guidance for how uncertain tax positions should be recognized, measured, presented and disclosed in the financial statements. FIN 48 requires the evaluation of tax positions taken in the course of preparing the Fund's tax returns to determine whether the tax positions are "more-likely-than-not" of being sustained by the applicable tax authority. Tax benefits of positions not deemed to meet the more-likely-than-not threshold would be recorded as a tax expense in the current year. Adoption of FIN 48 is required for fiscal years beginning after December 15, 2006. Recent SEC guidance allows implementing FIN 48 in fund NAV calculations as late as the Fund's last NAV calculation in the first required financial statement reporting period. As a result, the Fund will adopt FIN 48 no later than April 30, 2008. At this time, management has concluded that the adoption of FIN 48 is not expected to have a material impact on the Fund's net assets or results of operations.
In addition, in September 2006, FASB released Statement on Financial Accounting Standards No. 157, "Fair Value Measurements" (FAS 157), which is effective for fiscal years beginning after November 15, 2007. FAS 157 defines fair value, establishes a framework for measuring fair value and expands disclosures about fair value measurements. Management is currently evaluating the impact the adoption of FAS 157 will have on the Fund's financial statement disclosures.
10. FEDERAL TAX INFORMATION (UNAUDITED)
For the year ended October 31, 2007, the amount of long-term capital gains designated by the Fund was $89,963,613.
For the fiscal year ended October 31, 2007, 87.8% of total ordinary income (including short-term capital gain) distributions made by the Fund are qualifying dividends which may be subject to a maximum tax rate of 15%, as provided for by the Jobs and Growth Tax Relief Act of 2003. Complete information is reported in conjunction with the reporting of your distributions on Form 1099-DIV.
Of the ordinary income (including short-term capital gain) distributions made by the Fund during the year ended October 31, 2007, 87.8% qualify for the dividend received deduction available to corporate shareholders.
Report of Independent Registered Public Accounting Firm
TO THE BOARD OF TRUSTEES OF FEDERATED INDEX TRUST AND SHAREHOLDERS OF FEDERATED MAX-CAP INDEX FUND:
We have audited the accompanying statement of assets and liabilities of Federated Max-Cap Index Fund (the "Fund") (one of the portfolios constituting Federated Index Trust), including the portfolio of investments, as of October 31, 2007, and the related statement of operations for the year then ended, the statement of changes in net assets for each of the two years in the period then ended, and the financial highlights for each of the periods indicated therein. These financial statements and financial highlights are the responsibility of the Fund's management. Our responsibility is to express an opinion on these financial statements and financial highlights based on our audits.
We conducted our audits in accordance with the standards of the Public Company Accounting Oversight Board (United States). Those standards require that we plan and perform the audit to obtain reasonable assurance about whether the financial statements and financial highlights are free of material misstatement. We were not engaged to perform an audit of the Fund's internal control over financial reporting. Our audits included consideration of internal control over financial reporting as a basis for designing audit procedures that are appropriate in the circumstances, but not for the purpose of expressing an opinion on the effectiveness of the Fund's internal control over financial reporting. Accordingly, we express no such opinion. An audit also includes examining, on a test basis, evidence supporting the amounts and disclosures in the financial statements and financial highlights, assessing the accounting principles used and significant estimates made by management, and evaluating the overall financial statement presentation. Our procedures included confirmation of securities owned as of October 31, 2007, by correspondence with the custodian and brokers or by other appropriate auditing procedures where replies from brokers were not received. We believe that our audits provide a reasonable basis for our opinion.
In our opinion, the financial statements and financial highlights referred to above present fairly, in all material respects, the financial position of Federated Max-Cap Index Fund, a portfolio of Federated Index Trust at October 31, 2007, the results of its operations for the year then ended, the changes in its net assets for each of the two years in the period then ended, and the financial highlights for each of the periods indicated therein, in conformity with U.S. generally accepted accounting principles.
Ernst & Young LLP
Boston, Massachusetts
December 18, 2007
Board of Trustees and Trust Officers
The Board is responsible for managing the Trust's business affairs and for exercising all the Trust's powers except those reserved for the shareholders. The following tables give information about each Board member and the senior officers of the Fund. Where required, the tables separately list Board members who are "interested persons" of the Fund (i.e., "Interested" Board members) and those who are not (i.e., "Independent" Board members). Unless otherwise noted, the address of each person listed is Federated Investors Tower, 1001 Liberty Avenue, Pittsburgh, PA. As of December 31, 2006, the Trust comprised 3 portfolios, and the Federated Fund Complex consisted of 45 investment companies (comprising 148 portfolios). Unless otherwise noted, each Officer is elected annually. Unless otherwise noted, each Board member oversees all portfolios in the Federated Fund Complex and serves for an indefinite term. The Fund's Statement of Additional Information includes additional information about Trust Trustees and is available, without charge and upon request, by calling 1-800-341-7400.
INTERESTED TRUSTEES BACKGROUND
|
|
|
Name
Birth Date
Address
Positions Held with Trust
Date Service Began
|
| Principal Occupation(s) for Past Five Years,
Other Directorships Held and Previous Position(s)
|
John F. Donahue*
Birth Date: July 28, 1924
TRUSTEE
Began serving: January 1990 | | Principal Occupations: Director or Trustee of the Federated Fund Complex; Chairman and Director, Federated Investors, Inc.; Chairman of the Federated Fund Complex's Executive Committee.
Previous Positions: Chairman of the Federated Fund Complex; Trustee, Federated Investment Management Company and Chairman and Director, Federated Investment Counseling. |
|
|
|
J. Christopher Donahue*
Birth Date: April 11, 1949
PRESIDENT AND TRUSTEE
Began serving: January 1990 | | Principal Occupations: Principal Executive Officer and President of the Federated Fund Complex; Director or Trustee of some of the Funds in the Federated Fund Complex; President, Chief Executive Officer and Director, Federated Investors, Inc.; Chairman and Trustee, Federated Investment Management Company; Trustee, Federated Investment Counseling; Chairman and Director, Federated Global Investment Management Corp.; Chairman, Federated Equity Management Company of Pennsylvania and Passport Research, Ltd. (Investment advisory subsidiary of Federated); Trustee, Federated Shareholder Services Company; Director, Federated Services Company.
Previous Positions: President, Federated Investment Counseling; President and Chief Executive Officer, Federated Investment Management Company, Federated Global Investment Management Corp. and Passport Research, Ltd. |
|
|
|
|
|
|
Name
Birth Date
Address
Positions Held with Trust
Date Service Began
|
| Principal Occupation(s) for Past Five Years,
Other Directorships Held and Previous Position(s)
|
Lawrence D. Ellis, M.D.*
Birth Date: October 11, 1932
3471 Fifth Avenue
Suite 1111
Pittsburgh, PA
TRUSTEE
Began serving: January 1990 | | Principal Occupations: Director or Trustee of the Federated Fund Complex; Professor of Medicine, University of Pittsburgh; Medical Director, University of Pittsburgh Medical Center Downtown; Hematologist, Oncologist and Internist, University of Pittsburgh Medical Center.
Other Directorships Held: Member, National Board of Trustees, Leukemia Society of America.
Previous Positions: Trustee, University of Pittsburgh; Director, University of Pittsburgh Medical Center. |
|
|
|
* Family relationships and reasons for "interested" status: John F. Donahue is the father of J. Christopher Donahue; both are "interested" due to the positions they hold with Federated Investors, Inc. and its subsidiaries. Lawrence D. Ellis, M.D. is "interested" because his son-in-law is employed by the Fund's principal underwriter, Federated Securities Corp.
INDEPENDENT TRUSTEES BACKGROUND
|
|
|
Name
Birth Date
Address
Positions Held with Trust
Date Service Began
|
| Principal Occupation(s) for Past Five Years,
Other Directorships Held and Previous Position(s)
|
Thomas G. Bigley
Birth Date: February 3, 1934
15 Old Timber Trail
Pittsburgh, PA
TRUSTEE
Began serving: October 1995 | | Principal Occupation: Director or Trustee of the Federated Fund Complex.
Other Directorships Held: Director, Member of Executive Committee, Children's Hospital of Pittsburgh; Director, University of Pittsburgh.
Previous Position: Senior Partner, Ernst & Young LLP. |
|
|
|
John T. Conroy, Jr.
Birth Date: June 23, 1937
Investment Properties Corporation
3838 North Tamiami Trail
Suite 402
Naples, FL
TRUSTEE
Began serving: August 1991 | | Principal Occupations: Director or Trustee of the Federated Fund Complex; Chairman of the Board, Investment Properties Corporation; Partner or Trustee in private real estate ventures in Southwest Florida.
Previous Positions: President, Investment Properties Corporation; Senior Vice President, John R. Wood and Associates, Inc., Realtors; President, Naples Property Management, Inc. and Northgate Village Development Corporation. |
|
|
|
|
|
|
Name
Birth Date
Address
Positions Held with Trust
Date Service Began
|
| Principal Occupation(s) for Past Five Years,
Other Directorships Held and Previous Position(s)
|
Nicholas P. Constantakis
Birth Date: September 3, 1939
175 Woodshire Drive
Pittsburgh, PA
TRUSTEE
Began serving: February 1998 | | Principal Occupation: Director or Trustee of the Federated Fund Complex.
Other Directorships Held: Director and Member of the Audit Committee, Michael Baker Corporation (engineering and energy services worldwide).
Previous Position: Partner, Andersen Worldwide SC. |
|
|
|
John F. Cunningham
Birth Date: March 5, 1943
353 El Brillo Way
Palm Beach, FL
TRUSTEE
Began serving: January 1999 | | Principal Occupations: Director or Trustee of the Federated Fund Complex; Director, QSGI, Inc. (technology services company).
Other Directorships Held: Chairman, President and Chief Executive Officer, Cunningham & Co., Inc. (strategic business consulting); Trustee Associate, Boston College.
Previous Positions: Director, Redgate Communications and EMC Corporation (computer storage systems); Chairman of the Board and Chief Executive Officer, Computer Consoles, Inc.; President and Chief Operating Officer, Wang Laboratories; Director, First National Bank of Boston; Director, Apollo Computer, Inc. |
|
|
|
Peter E. Madden
Birth Date: March 16, 1942
One Royal Palm Way
100 Royal Palm Way
Palm Beach, FL
TRUSTEE
Began serving: August 1991 | | Principal Occupation: Director or Trustee of the Federated Fund Complex.
Other Directorships Held: Board of Overseers, Babson College.
Previous Positions: Representative, Commonwealth of Massachusetts General Court; President, State Street Bank and Trust Company and State Street Corporation (retired); Director, VISA USA and VISA International; Chairman and Director, Massachusetts Bankers Association; Director, Depository Trust Corporation; Director, The Boston Stock Exchange. |
|
|
|
Charles F. Mansfield, Jr.
Birth Date: April 10, 1945
80 South Road
Westhampton Beach, NY
TRUSTEE
Began serving: January 1999 | | Principal Occupations: Director or Trustee of the Federated Fund Complex; Management Consultant.
Previous Positions: Chief Executive Officer, PBTC International Bank; Partner, Arthur Young & Company (now Ernst & Young LLP); Chief Financial Officer of Retail Banking Sector, Chase Manhattan Bank; Senior Vice President, HSBC Bank USA (formerly, Marine Midland Bank); Vice President, Citibank; Assistant Professor of Banking and Finance, Frank G. Zarb School of Business, Hofstra University; Executive Vice President DVC Group, Inc. (marketing, communications and technology). |
|
|
|
|
|
|
Name
Birth Date
Address
Positions Held with Trust
Date Service Began
|
| Principal Occupation(s) for Past Five Years,
Other Directorships Held and Previous Position(s)
|
John E. Murray, Jr., J.D., S.J.D.
Birth Date: December 20, 1932
Chancellor, Duquesne University
Pittsburgh, PA
TRUSTEE
Began serving: February 1995 | | Principal Occupations: Director or Trustee, and Chairman of the Board of Directors or Trustees, of the Federated Fund Complex; Chancellor and Law Professor, Duquesne University; Partner, Murray, Hogue & Lannis.
Other Directorships Held: Director, Michael Baker Corp. (engineering, construction, operations and technical services).
Previous Positions: President, Duquesne University; Dean and Professor of Law, University of Pittsburgh School of Law; Dean and Professor of Law, Villanova University School of Law. |
|
|
|
Thomas M. O'Neill
Birth Date: June 14, 1951
95 Standish Street P.O. Box 2779
Duxbury, MA
TRUSTEE
Began serving: October 2006 | | Principal Occupations: Director or Trustee of the Federated Fund Complex; Managing Director and Partner, Navigator Management Company, L.P. (investment and strategic consulting).
Other Directorships Held: Director, Midway Pacific (lumber); Board of Overseers, Children's Hospital of Boston; Visiting Committee on Athletics, Harvard College.
Previous Positions: Chief Executive Officer and President, Managing Director and Chief Investment Officer, Fleet Investment Advisors; President and Chief Executive Officer, Aeltus Investment Management, Inc.; General Partner, Hellman, Jordan Management Co., Boston, MA; Chief Investment Officer, The Putnam Companies, Boston, MA; and Credit Analyst and Lending Officer, Fleet Bank. |
|
|
|
Marjorie P. Smuts
Birth Date: June 21, 1935
4905 Bayard Street
Pittsburgh, PA
TRUSTEE
Began serving: January 1990 | | Principal Occupation: Director or Trustee of the Federated Fund Complex.
Previous Positions: Public Relations/Marketing Consultant/Conference Coordinator; National Spokesperson, Aluminum Company of America; television producer; President, Marj Palmer Assoc.; Owner, Scandia Bord. |
|
|
|
John S. Walsh
Birth Date: November 28, 1957
2604 William Drive
Valparaiso, IN
TRUSTEE
Began serving: January 1999 | | Principal Occupations: Director or Trustee of the Federated Fund Complex; President and Director, Heat Wagon, Inc. (manufacturer of construction temporary heaters); President and Director, Manufacturers Products, Inc. (distributor of portable construction heaters); President, Portable Heater Parts, a division of Manufacturers Products, Inc.
Previous Position: Vice President, Walsh & Kelly, Inc. |
|
|
|
|
|
|
Name
Birth Date
Address
Positions Held with Trust
Date Service Began
|
| Principal Occupation(s) for Past Five Years,
Other Directorships Held and Previous Position(s)
|
James F. Will
Birth Date: October 12, 1938 721 E. McMurray Road McMurray, PA TRUSTEE
Began serving: April 2006 | | Principal Occupations: Director or Trustee of the Federated Fund Complex; Prior to June 2006, Vice Chancellor and President, Saint Vincent College.
Other Directorships Held: Trustee, Saint Vincent College; Alleghany Corporation.
Previous Positions: Chairman, President and Chief Executive Officer, Armco, Inc.; President and Chief Executive Officer, Cyclops Industries; President and Chief Operating Officer, Kaiser Steel Corporation. |
|
|
|
OFFICERS
|
|
|
Name
Birth Date
Positions Held with Trust
Date Service Began
|
| Principal Occupation(s) for Past Five Years and Previous Position(s)
|
John W. McGonigle
Birth Date: October 26, 1938
EXECUTIVE VICE PRESIDENT
AND SECRETARY
Began serving: February 1990 | | Principal Occupations: Executive Vice President and Secretary of the Federated Fund Complex; Vice Chairman, Executive Vice President, Secretary and Director, Federated Investors, Inc.
Previous Positions: Trustee, Federated Investment Management Company and Federated Investment Counseling; Director, Federated Global Investment Management Corp., Federated Services Company and Federated Securities Corp. |
|
|
|
Richard A. Novak
Birth Date: December 25, 1963
TREASURER
Began serving: January 2006 | | Principal Occupations: Principal Financial Officer and Treasurer of the Federated Fund Complex; Senior Vice President, Federated Administrative Services; Financial and Operations Principal for Federated Securities Corp., Edgewood Services, Inc. and Southpointe Distribution Services, Inc.
Previous Positions: Controller of Federated Investors, Inc.; Vice President, Finance of Federated Services Company; held various financial management positions within The Mercy Hospital of Pittsburgh; Auditor, Arthur Andersen & Co. |
|
|
|
Richard B. Fisher
Birth Date: May 17, 1923
TREASURER
Began serving: February 1990 | | Principal Occupations: Vice Chairman or Vice President of some of the Funds in the Federated Fund Complex; Vice Chairman, Federated Investors, Inc.; Chairman, Federated Securities Corp.
Previous Positions: President and Director or Trustee of some of the Funds in the Federated Fund Complex; Executive Vice President, Federated Investors, Inc. and Director and Chief Executive Officer, Federated Securities Corp. |
|
|
|
|
|
|
Name
Birth Date
Positions Held with Trust
Date Service Began
|
| Principal Occupation(s) for Past Five Years and Previous Position(s)
|
Brian P. Bouda
Birth Date: February 28, 1947
SENIOR VICE PRESIDENT
Began serving: January 2006 | | Principal Occupations: Senior Vice President and Chief Compliance Officer of the Federated Fund Complex; Vice President and Chief Compliance Officer of Federated Investors, Inc.; and Chief Compliance Officer of its subsidiaries. Mr. Bouda joined Federated in 1999 and is a member of the American Bar Association and the State Bar Association of Wisconsin. |
|
|
|
Stephen F. Auth
Birth Date: September 3, 1956
CHIEF INVESTMENT OFFICER
Began serving: November 2002 | | Principal Occupations: Chief Investment Officer of this Fund and various other Funds in the Federated Fund Complex; Executive Vice President, Federated Investment Counseling, Federated Global Investment Management Corp. and Federated Equity Management Company of Pennsylvania.
Previous Positions: Executive Vice President, Federated Investment Management Company, and Passport Research, Ltd. (Investment advisory subsidiary of Federated); Senior Vice President, Global Portfolio Management Services Division; Senior Vice President, Federated Investment Management Company and Passport Research, Ltd.; Senior Managing Director and Portfolio Manager, Prudential Investments. |
|
|
|
Evaluation and Approval of Advisory Contract
FEDERATED MAX-CAP INDEX FUND (THE "FUND")
The Fund's Board reviewed the Fund's investment advisory and subadvisory contracts at meetings held in May 2007. The Board's decision regarding these contracts reflects the exercise of its business judgment on whether to continue the existing arrangements.
In this connection, the Federated funds had previously appointed a Senior Officer, whose duties include specified responsibilities relating to the process by which advisory fees are to be charged to a Federated fund. The Senior Officer has the authority to retain consultants, experts, or staff as may be reasonably necessary to assist in the performance of his duties, reports directly to the Board, and may be terminated only with the approval of a majority of the independent members of the Board. The Senior Officer prepared and furnished to the Board an independent written evaluation that covered topics discussed below. The Board considered that evaluation, along with other information, in deciding to approve the advisory and subadvisory contracts.
During its review of these contracts, the Board considered compensation and benefits received by the Adviser and subadviser. This included the fees received for services provided to the Fund by other entities in the Federated organization and research services (if any) received by the Adviser and subadviser from brokers that execute Federated fund trades, as well as advisory fees. The Board is also familiar with and considered judicial decisions concerning allegedly excessive investment advisory fees which have indicated that the following factors may be relevant to an Adviser's fiduciary duty with respect to its receipt of compensation from a fund: the nature and quality of the services provided by the Adviser, including the performance of the Fund; the Adviser's cost of providing the services; the extent to which the Adviser may realize "economies of scale" as the Fund grows larger; any indirect benefits that may accrue to the Adviser and its affiliates as a result of the Adviser's relationship with the Fund; performance and expenses of comparable funds; and the extent to which the independent Board members are fully informed about all facts the Board deems relevant bearing on the Adviser's services and fees. The Board further considered management fees (including any components thereof) charged to institutional and other clients of the Adviser for what might be viewed as like services, and costs to the Adviser and its affiliates of supplying services pursuant to the management fee agreements, excluding any intra-corporate profit and profit margins of the Adviser and its affiliates from supplying such services. The Board was aware of these factors and was guided by them in its review of the Fund's advisory and subadvisory contracts to the extent it considered them to be appropriate and relevant, as discussed further below.
The Board considered and weighed these circumstances in light of its substantial accumulated experience in governing the Fund and working with Federated on matters relating to the Federated funds, and was assisted in its deliberations by the advice of independent legal counsel. Throughout the year, the Board has requested and received substantial and detailed information about the Fund and the Federated organization that was in addition to the extensive materials that comprise and accompany the Senior Officer's evaluation. Federated provided much of this information at each regular meeting of the Board, and furnished additional reports in connection with the particular meeting at which the Board's formal review of the advisory and subadvisory contracts occurred. Between regularly scheduled meetings, the Board also received information on particular matters as the need arose. Thus, the Board's consideration of the advisory and subadvisory contracts included review of the Senior Officer's evaluation, accompanying data and additional reports covering such matters as: the Adviser's profitability, and the Adviser's and subadviser's investment philosophy, revenue, personnel and processes; investment and operating strategies; the Fund's short- and long-term performance (in absolute terms, both on a gross basis and net of expenses, as well as in relationship to its particular investment program and certain competitor or "peer group" funds and/or other benchmarks, as appropriate), and comments on the reasons for performance; the Fund's investment objectives; the Fund's expenses (including the advisory fee itself and the overall expense structure of the Fund, both in absolute terms and relative to similar and/or competing funds, with due regard for contractual or voluntary expense limitations); the use and allocation of brokerage commissions derived from trading the Fund's portfolio securities (if any); and the nature, quality and extent of the advisory and other services provided to the Fund by the Adviser, the subadviser, and their affiliates. The Board also considered the preferences and expectations of Fund shareholders and their relative sophistication; the continuing state of competition in the mutual fund industry and market practices; the range of comparable fees for similar funds in the mutual fund industry; the Fund's relationship to the Federated family of funds which include a comprehensive array of funds with different investment objectives, policies and strategies which are available for exchange without the incurrence of additional sales charges; compliance and audit reports concerning the Federated funds, the Federated companies that service them, and the subadviser (including communications from regulatory agencies), as well as Federated's and/or the subadviser's responses to any issues raised therein; and relevant developments in the mutual fund industry and how the Federated funds and/or Federated are responding to them. The Board's evaluation process is evolutionary. The criteria considered and the emphasis placed on relevant criteria change in recognition of changing circumstances in the mutual fund marketplace.
With respect to the Fund's performance and expenses in particular, the Board has found the use of comparisons to other mutual funds with comparable investment programs to be particularly useful, given the high degree of competition in the mutual fund business. The Board focused on comparisons with other similar mutual funds more heavily than non-mutual fund products or services because, simply put, they are more relevant. For example, other mutual funds are the products most like the Fund, they are readily available to Fund shareholders as alternative investment vehicles, and they are the type of investment vehicle in fact chosen and maintained by the Fund's investors. The range of their fees and expenses therefore appears to be a generally reliable indication of what consumers have found to be reasonable in the precise marketplace in which the Fund competes. The Fund's ability to deliver competitive performance when compared to its peer group was a useful indicator of how the Adviser and subadviser are executing the Fund's investment program, which in turn assisted the Board in reaching a conclusion that the nature, extent, and quality of the Adviser's and subadviser's investment management services were such as to warrant continuation of the advisory and subadvisory contracts. In this regard, the Senior Officer has reviewed Federated's fees for providing advisory services to products outside the Federated family of funds (e.g., institutional and separate accounts). He concluded that mutual funds and institutional accounts are inherently different products. Those differences included, but are not limited to targeting different investors, being subject to different laws and regulations, different legal structure, distribution costs, average account size and portfolio management techniques made necessary by different cash flows. The Senior Officer did not consider these fee schedules to be significant in determining the appropriateness of mutual fund advisory contracts.
The Senior Officer reviewed reports compiled by Federated, using data supplied by independent fund ranking organizations, regarding the performance of, and fees charged by, other mutual funds, noting his view that comparisons to fund peer groups are highly important in judging the reasonableness of proposed fees.
The Fund's performance fell below the median of the relevant peer group for both the one and three year periods ending December 31, 2006. The Board discussed the Fund's performance with the Adviser and recognized the efforts being undertaken by the Adviser and subadviser. The Board will continue to monitor these efforts and the performance of the Fund.
The Board also received financial information about Federated, including reports on the compensation and benefits Federated derived from its relationships with the Federated funds. These reports covered not only the fees under the advisory contracts, but also fees received by Federated's subsidiaries for providing other services to the Federated funds under separate contracts (e.g., for serving as the Federated funds' administrator). The reports also discussed any indirect benefit Federated may derive from its receipt of research services from brokers who execute Federated fund trades. In addition, the Board considered the fact that, in order for a fund to be competitive in the marketplace, Federated and its affiliates frequently waived fees and/or reimbursed expenses and have disclosed to fund investors and/or indicated to the Board their intention to do so in the future, where appropriate. The Board also received financial information about the subadviser, as well as reports that discussed any indirect benefit the subadviser may derive from its receipt of research services from brokers who execute Fund trades.
Federated furnished reports, requested by the Senior Officer, that reported revenues on a fund by fund basis and made estimates of the allocation of expenses on a fund by fund basis, using allocation methodologies specified by the Senior Officer. The Senior Officer noted that, although they may apply consistent allocation processes, the inherent difficulties in allocating costs (and the unavoidable arbitrary aspects of that exercise) and the lack of consensus on how to allocate those costs may render such allocation reports unreliable. The allocation reports were considered in the analysis by the Board but were determined to be of limited use.
The Board and the Senior Officer also reviewed a report compiled by Federated comparing profitability information for Federated to other publicly held fund management companies. In this regard, the Senior Officer noted the limited availability of such information, but nonetheless concluded that Federated's profit margins did not appear to be excessive and the Board agreed. With respect to the subadviser, the Board noted that it had reviewed relevant information, and initially approved the current subadvisory contract, at meetings held in August 2006, in contemplation of the impending combination of the asset management businesses of the Fund's former subadviser with another asset management firm. The combination took place in the latter part of 2006. In connection with the Board's present review, the subadviser had informed the Board that it was still in the process of implementing post-merger changes to relevant accounting systems, and that this is affecting its cost allocation capabilities. Consequently, the subadviser was unable to furnish profitability information for the Board's consideration at the May 2007 meetings, but undertook to provide the 2006 profitability information with respect to the Fund for consideration at a Board meeting later in 2007.
The Senior Officer's evaluation also discussed the notion of possible realization of "economies of scale" as a fund grows larger. The Board considered in this regard that the Adviser has made significant additional investments in areas such as personnel and processes for the portfolio management, compliance, and risk management functions; distribution efforts; and systems technology; that support all of the Federated funds, and that the benefits of these efforts (as well as any economies, should they exist) were likely to be enjoyed by the fund complex as a whole. Finally, the Board also noted the absence of any applicable regulatory or industry guidelines on this subject, which (as discussed in independently prepared materials included in the Senior Officer's evaluation) is compounded by the lack of any common industry practice or general pattern with respect to structuring fund advisory fees with "breakpoints" that serve to reduce the fee as the fund attains a certain size. The Senior Officer did not recommend institution of breakpoints in pricing Federated's fund advisory services at this time.
For the Fund's most recently completed fiscal year, the Fund's investment advisory fee after waivers and expense reimbursements, if any, was above the median of the relevant peer group. The Board reviewed the fees and other expenses of the Fund with the Adviser and was satisfied that the overall expense structure of the Fund remained competitive. The Board will continue to monitor advisory fees and other expenses borne by the Fund.
The Senior Officer's evaluation noted his belief that the information and observations contained in his evaluation supported his finding that the proposed management fees are reasonable, and that Federated appeared to provide appropriate administrative services to the Fund for the fees paid. Under these circumstances, no changes were recommended to, and no objection was raised to the continuation of the Fund's advisory and subadvisory contracts. For 2006, the Board concluded that the nature, quality and scope of services provided the Fund by the Adviser and its affiliates, and by the subadviser, were satisfactory.
In its decision to continue an existing investment advisory contract, the Board was mindful of the potential disruptions of the Fund's operations and various risks, uncertainties and other effects that could occur as a result of a decision to terminate or not renew an advisory contract. In particular, the Board recognized that most shareholders have invested in the Fund on the strength of the Adviser's industry standing and reputation and in the expectation that the Adviser will have a continuing role in providing advisory services to the Fund. Thus, the Board's approval of the advisory contract reflected the fact that it is the shareholders who have effectively selected the Adviser by virtue of having invested in the Fund.
The Board based its decision to approve the advisory and subadvisory contracts on the totality of the circumstances and relevant factors and with a view to past and future long-term considerations. Not all of the factors and considerations identified above were necessarily relevant to the Fund, nor did the Board consider any one of them to be determinative. With respect to the factors that were relevant, the Board's decision to approve the contract reflects its determination that Federated's performance and actions provided a satisfactory basis to support the decision to continue the existing arrangements.
Voting Proxies on Fund Portfolio Securities
A description of the policies and procedures that the Fund uses to determine how to vote proxies, if any, relating to securities held in the Fund's portfolio is available, without charge and upon request, by calling 1-800-341-7400. A report on "Form N-PX" of how the Fund voted any such proxies during the most recent 12-month period ended June 30 is available from Federated's website at FederatedInvestors.com. To access this information from the "Products" section of the website, click on the "Prospectuses and Regulatory Reports" link under "Related Information," then select the appropriate link opposite the name of the Fund; or select the name of the Fund and, from the Fund's page, click on the "Prospectuses and Regulatory Reports" link. Form N-PX filings are also available at the SEC's website at www.sec.gov.
Quarterly Portfolio Schedule
The Fund files with the SEC a complete schedule of its portfolio holdings, as of the close of the first and third quarters of its fiscal year, on "Form N-Q." These filings are available on the SEC's website at www.sec.gov and may be reviewed and copied at the SEC's Public Reference Room in Washington, DC. (Call 1-800-SEC-0330 for information on the operation of the Public Reference Room.) You may also access this information from the "Products" section of Federated's website at FederatedInvestors.com by clicking on "Portfolio Holdings" under "Related Information," then selecting the appropriate link opposite the name of the Fund; or select the name of the Fund and, from the Fund's page, click on the "Portfolio Holdings" link.
Mutual funds are not bank deposits or obligations, are not guaranteed by any bank, and are not insured or guaranteed by the U.S. government, the Federal Deposit Insurance Corporation, the Federal Reserve Board, or any other government agency. Investment in mutual funds involves investment risk, including the possible loss of principal.
This report is authorized for distribution to prospective investors only when preceded or accompanied by the Fund's prospectus, which contains facts concerning its objective and policies, management fees, expenses, and other information.
Federated
World-Class Investment Manager
Federated Max-Cap Index Fund
Federated Investors Funds
5800 Corporate Drive
Pittsburgh, PA 15237-7000
Contact us at FederatedInvestors.com
or call 1-800-341-7400.
Federated Securities Corp., Distributor
Cusip 31420E502
Cusip 31420E809
Cusip 31420E106
Cusip 31420E403
29454 (12/07)
Federated is a registered mark of Federated Investors, Inc. 2007 (c)Federated Investors, Inc.
Federated
World-Class Investment Manager
Federated Mid-Cap Index Fund
A Portfolio of Federated Index Trust
ANNUAL SHAREHOLDER REPORT
October 31, 2007
FINANCIAL HIGHLIGHTS
SHAREHOLDER EXPENSE EXAMPLE
MANAGEMENT'S DISCUSSION OF FUND PERFORMANCE
PORTFOLIO OF INVESTMENTS SUMMARY TABLE
PORTFOLIO OF INVESTMENTS
STATEMENT OF ASSETS AND LIABILITIES
STATEMENT OF OPERATIONS
STATEMENT OF CHANGES IN NET ASSETS
NOTES TO FINANCIAL STATEMENTS
REPORT OF INDEPENDENT REGISTERED PUBLIC ACCOUNTING FIRM
BOARD OF TRUSTEES AND TRUST OFFICERS
EVALUATION AND APPROVAL OF ADVISORY CONTRACT
VOTING PROXIES ON FUND PORTFOLIO SECURITIES
QUARTERLY PORTFOLIO SCHEDULE
Not FDIC Insured * May Lose Value * No Bank Guarantee
Financial Highlights
(For a Share Outstanding Throughout Each Period)
Year Ended October 31
|
| 2007
|
|
| 2006
|
|
| 2005
|
|
| 2004
|
|
| 2003
|
|
Net Asset Value, Beginning of Period
| | $23.49 | | | $22.19 | | | $19.84 | | | $18.22 | | | $14.11 | |
Income From Investment Operations:
| | | | | | | | | | | | | | | |
Net investment income
| | 0.34 | | | 0.30 | | | 0.22 | | | 0.13 | | | 0.10 | |
Net realized and unrealized gain on investments and futures contracts
|
| 3.37
|
|
| 2.48
|
|
| 3.09
|
|
| 1.75
|
|
| 4.12
|
|
TOTAL FROM INVESTMENT OPERATIONS
|
| 3.71
|
|
| 2.78
|
|
| 3.31
|
|
| 1.88
|
|
| 4.22
|
|
Less Distributions:
| | | | | | | | | | | | | | | |
Distributions from net investment income
| | (0.35 | ) | | (0.32 | ) | | (0.19 | ) | | (0.12 | ) | | (0.11 | ) |
Distributions from net realized gain on investments and futures contracts
|
| (1.06
| )
|
| (1.16
| )
|
| (0.77
| )
|
| (0.14
| )
|
| - --
|
|
TOTAL DISTRIBUTIONS
|
| (1.41
| )
|
| (1.48
| )
|
| (0.96
| )
|
| (0.26
| )
|
| (0.11
| )
|
Net Asset Value, End of Period
|
| $25.79
|
|
| $23.49
|
|
| $22.19
|
|
| $19.84
|
|
| $18.22
|
|
Total Return 1
|
| 16.59
| %
|
| 12.91
| %
|
| 17.09
| %
|
| 10.38
| %
|
| 30.04
| %
|
| | | | | | | | | | | | | | | |
Ratios to Average Net Assets:
|
|
|
|
|
|
|
|
|
|
|
|
|
|
|
|
Net expenses
|
| 0.49
| %
|
| 0.49
| %
|
| 0.49
| %
|
| 0.49
| %
|
| 0.49
| %
|
Net investment income
|
| 1.41
| %
|
| 1.33
| %
|
| 1.06
| %
|
| 0.69
| %
|
| 0.69
| %
|
Expense waiver/reimbursement 2
|
| 0.19
| %
|
| 0.21
| %
|
| 0.20
| %
|
| 0.27
| %
|
| 0.26
| %
|
Supplemental Data:
|
|
|
|
|
|
|
|
|
|
|
|
|
|
|
|
Net assets, end of period (000 omitted)
|
| $1,257,048
|
|
| $1,202,627
|
|
| $889,064
|
|
| $708,296
|
|
| $564,618
|
|
Portfolio turnover
|
| 17
| %
|
| 13
| %
|
| 14
| %
|
| 16
| %
|
| 11
| %
|
1 Based on net asset value, which does not reflect the sales charge, redemption fee or contingent deferred sales charge, if applicable.
2 This expense decrease is reflected in both the net expense and the net investment income ratios shown above.
See Notes which are an integral part of the Financial Statements
Shareholder Expense Example
As a shareholder of the Fund, you incur ongoing costs, including management fees and to the extent applicable, distribution (12b-1) fees and/or shareholder services fees and other Fund expenses. This Example is intended to help you to understand your ongoing costs (in dollars) of investing in the Fund and to compare these costs with the ongoing costs of investing in other mutual funds. It is based on an investment of $1,000 invested at the beginning of the period and held for the entire period from May 1, 2007 to October 31, 2007.
ACTUAL EXPENSES
The first section of the table below provides information about actual account values and actual expenses. You may use the information in this section, together with the amount you invested, to estimate the expenses that you incurred over the period. Simply divide your account value by $1,000 (for example, an $8,600 account value divided by $1,000 = 8.6), then multiply the result by the number in the first section under the heading entitled "Expenses Paid During Period" to estimate the expenses attributable to your investment during this period.
HYPOTHETICAL EXAMPLE FOR COMPARISON PURPOSES
The second section of the table below provides information about hypothetical account values and hypothetical expenses based on the Fund's actual expense ratio and an assumed rate of return of 5% per year before expenses, which is not the Fund's actual return. Thus, you should not use the hypothetical account values and expenses to estimate the actual ending account balance or your expenses for the period. Rather, these figures are required to be provided to enable you to compare the ongoing costs of investing in the Fund with other funds. To do so, compare this 5% hypothetical example with the 5% hypothetical examples that appear in the shareholder reports of the other funds.
Please note that the expenses shown in the table are meant to highlight your ongoing costs only. Therefore, the second section of the table is useful in comparing ongoing costs only, and will not help you determine the relative total costs of owning different funds.
|
| Beginning
Account Value
5/1/2007
|
| Ending
Account Value
10/31/2007
|
| Expenses Paid
During Period 1
|
Actual
|
| $1,000
|
| $1,043.10
|
| $2.52
|
Hypothetical (assuming a 5% return before expenses)
|
| $1,000
|
| $1,022.74
|
| $2.50
|
1 Expenses are equal to the Fund's annualized net expense ratio of 0.49%, multiplied by the average account value over the period, multiplied by 184/365 (to reflect the one-half year period).
Management's Discussion of Fund Performance
Federated Mid-Cap Index Fund produced a total return of 16.59%, based on net asset value, during the 12-month reporting period ended October 31, 2007. The Fund's benchmark, the Standard and Poor's MidCap 400 Index (S&P 400), 1 posted a total return of 17.02% during the reporting period. The fund's total return for the fiscal year reflected actual cash flows, transaction costs and other expenses, which were not reflected in the total return of the benchmark.
U.S. equities, as represented by the broad-market S&P 500 Index, 2 gained 14.56% during the 12-month reporting period ended October 31, 2007, despite continued weakness in the housing and subprime mortgage markets. Shares of mid-cap companies outperformed large- and small-cap stocks, with the Standard and Poor's MidCap 400 Index advancing 17.02%, versus the 14.56% and 11.55% returns of the Standard and Poor's 500 ® Index (S&P 500) and the Standard and Poor's 600 ® Index 3 (S&P 600), respectively. Strong mergers-and-acquisitions activity, solid global growth and an easing of inflation pressures helped to drive up equity prices during the reporting period. Regarding the economy, the most recent data from the U.S. Department of Labor's Bureau of Labor Statistics indicated that the U.S. unemployment rate stood at 4.7% at October 31, 2007. The rate was unchanged from September, but was somewhat higher than the 4.1% rate in October 2006. Non-farm payroll employment rose by roughly 166,000 during the month, with gains in professional and business services, healthcare, and leisure and hospitality. However, manufacturing employment fell by 21,000 in October, following a decline of 17,000 during the previous month.
1 The S&P 400 is a market capitalization weighted index of common stocks representing all major industries in the mid-range of the U.S. stock market. The index is unmanaged, and investments cannot be made in an index. "Standard & Poor's," "S&P, ® " "S&P MidCap 400 Index," and "Standard and Poor's MidCap 400 Index" are trademarks of The McGraw-Hill Companies, Inc. and have been licensed for use by Federated Securities Corp. The Fund is not sponsored, endorsed, sold or promoted by, or affiliated with, Standard & Poor's ("S&P"). S&P makes no representation or warranty, express or implied, to the owners of the Fund or any member of the public regarding the advisability of investing in securities generally or in the Fund particularly or the ability of the S&P 400 Index to track general stock market performance.
2 The S&P 500 is an unmanaged capitalization-weighted index of 500 stocks designed to measure performance of the broad domestic economy through changes in the aggregate market value of 500 stocks representing all major industries. The index is unmanaged, and investments cannot be made in an index.
3 The S&P 600 ® is an unmanaged capitalization-weighted index representing all major industries in the small-cap of the U.S. stock market. The index is unmanaged and investments cannot be made in an index.
Nine of the ten sectors 4 in the S&P 400 finished in positive territory for the reporting period, led by energy, returning 42.2%; materials, returning 37.6%; telecommunication services, returning 33.4%; and industrials, returning 30.6%. CF Industries Holdings Inc. and Terra Industries Inc. (both in the materials sector), Intuitive Surgical Inc. (in the healthcare section), and Chipotle Mexican Grill Inc. and GameStop Corp. (both in the consumer discretionary sector) were the strongest individual stock performers within the Index for the period.
Only the financials sector, which declined 1.4%, recorded a negative return for the year. However, the consumer discretionary (+3.8%) and utilities (+11.9%) sectors considerably underperformed the return of the S&P 400. Weaker performing stocks within the S&P 400 for the reporting period included Radian Group Inc. (financials), Coldwater Creek Inc. (consumer discretionary), UTStarcom Inc. (information technology), IndyMac Bancorp Inc. (financials) and Hovnanian Enterprises Inc. (consumer discretionary).
The Fund utilized S&P 400 futures to provide equity exposure on the Fund's cash balances. While over the long term S&P 400 futures should mirror the performance of the S&P 400, pricing disparity can occur in the short term, and the Fund may benefit or be harmed by trading futures instead of stocks when money goes in and out of the Fund. During the reporting period, the Fund benefited from its trading of futures contracts.
4 Sector classifications are based upon the classification of the Standard & Poor's Global Industry Classification Standard (SPGICS).
GROWTH OF A $25,000 INVESTMENT
The graph below illustrates the hypothetical investment of $25,000 1 in Federated Mid-Cap Index Fund (the "Fund") from October 31, 1997 to October 31, 2007 compared to the S&P MidCap 400 Index (S&P 400). 2
Average Annual Total Returns for the Period Ended 10/31/2007
|
|
|
1 Year
|
| 16.59%
|
5 Years
|
| 17.21%
|
10 Years
|
| 11.68%
|
Performance data quoted represents past performance which is no guarantee of future results. Investment return and principal value will fluctuate so that an investor's shares, when redeemed, may be worth more or less than their original cost. Mutual fund performance changes over time and current performance may be lower or higher than what is stated. For current to the most recent month-end performance and after-tax returns, visit FederatedInvestors.com or call 1-800-341-7400. Returns shown do not reflect the deduction of taxes that a shareholder would pay on Fund distributions or the redemption of Fund shares. Mutual funds are not obligations of or guaranteed by any bank and are not federally insured.
1 The Fund's performance assumes the reinvestment of all dividends and distributions. The S&P 400 has been adjusted to reflect reinvestment of dividends on securities in the index.
2 The S&P 400 is not adjusted to reflect sales charges, expenses, or other fees that the Securities and Exchange Commission requires to be reflected in the Fund's performance. The index is unmanaged and, unlike the Fund, is not affected by cashflows. It is not possible to invest directly in an index.
Performance data quoted represents past performance which is no guarantee of future results. Investment return and principal value will fluctuate so that an investor's shares, when redeemed, may be worth more or less than their original cost. Mutual fund performance changes over time and current performance may be lower or higher than what is stated. For current to the most recent month-end performance and after-tax returns, visit FederatedInvestors.com or call 1-800-341-7400.
Portfolio of Investments Summary Table
At October 31, 2007, the Fund's sector composition 1 for its equity securities investments was as follows:
Sector
|
| Percentage of
Total Net Assets
|
Information Technology
|
| 14.5
| %
|
Industrials
|
| 13.6
| %
|
Consumer Discretionary
|
| 13.5
| %
|
Financials
|
| 13.3
| %
|
Health Care
|
| 11.2
| %
|
Energy
|
| 8.7
| %
|
Materials
|
| 7.3
| %
|
Utilities
|
| 7.1
| %
|
Consumer Staples
|
| 2.9
| %
|
Telecommunication Services
|
| 0.9
| %
|
Securities Lending Collateral 2
|
| 6.7
| %
|
Cash Equivalents 3
|
| 6.9
| %
|
Other Assets and Liabilities--Net 4
|
| (6.6
| )%
|
TOTAL 5
|
| 100.0
| %
|
1 Except for Securities Lending Collateral, Cash Equivalents and Other Assets and Liabilities, sector classifications are based upon, and individual portfolio securities are assigned to, the classifications of the Global Industry Classification Standard (GICS), except that the adviser assigns a classification to securities not classified by the GICS and to securities for which the adviser does not have access to the classification made by the GICS.
2 Cash collateral received from lending portfolio securities which is invested in short-term investments such as repurchase agreements or money market mutual funds.
3 Cash Equivalents includes any investments in money market mutual funds and/or overnight repurchase agreements (other than those representing Securities Lending Collateral).
4 Assets, other than investments in securities, less liabilities. See Statement of Assets and Liabilities.
5 The Fund purchases index futures contracts to efficiently manage cash flows resulting from shareholder purchases and redemptions, dividend and capital gain payments to shareholders and corporate actions while maintaining exposure to the index and minimizing trading costs. Taking into consideration these open index futures contracts, the Fund's total exposure to the S&P MidCap 400 Index is effectively 100.2%.
Portfolio of Investments
October 31, 2007
Shares
|
|
|
|
| Value
|
|
| | | COMMON STOCKS--93.0% 1 | | | | |
| | | Consumer Discretionary--13.5% | | | | |
| 48,310 | 2 | 99 Cents Only Stores
| | $ | 519,333 | |
| 99,150 | | Advance Auto Parts, Inc.
| | | 3,382,998 | |
| 73,800 | 2 | Aeropostale, Inc.
| | | 1,690,020 | |
| 208,493 | | American Eagle Outfitters, Inc.
| | | 4,957,963 | |
| 56,770 | | American Greetings Corp., Class A
| | | 1,495,322 | |
| 60,380 | 2,3 | AnnTaylor Stores Corp.
| | | 1,871,176 | |
| 76,566 | 3 | Applebee's International, Inc.
| | | 1,940,182 | |
| 71,388 | | ArvinMeritor, Inc.
| | | 1,058,684 | |
| 51,350 | | Barnes & Noble, Inc.
| | | 1,984,164 | |
| 90,232 | | Belo (A.H.) Corp., Series A
| | | 1,669,292 | |
| 27,100 | | Blyth Industries, Inc.
| | | 517,339 | |
| 32,000 | | Bob Evans Farms, Inc.
| | | 901,760 | |
| 61,302 | | Borders Group, Inc.
| | | 945,277 | |
| 55,188 | | BorgWarner, Inc.
| | | 5,833,923 | |
| 52,627 | | Boyd Gaming Corp.
| | | 2,200,861 | |
| 102,066 | | Brinker International, Inc.
| | | 2,591,456 | |
| 25,068 | | CBRL Group, Inc.
| | | 1,000,213 | |
| 64,700 | | Callaway Golf Co.
| | | 1,120,604 | |
| 210,426 | 2,3 | CarMax, Inc.
| | | 4,391,591 | |
| 90,894 | 2 | Career Education Corp.
| | | 3,248,552 | |
| 121,800 | 2 | Charming Shoppes, Inc.
| | | 903,756 | |
| 73,573 | 2 | Cheesecake Factory, Inc.
| | | 1,650,242 | |
| 169,076 | 2 | Chicos Fas, Inc.
| | | 2,221,659 | |
| 30,780 | 2 | Chipotle Mexican Grill, Inc.
| | | 4,278,420 | |
| 58,700 | 2,3 | Coldwater Creek, Inc.
| | | 525,365 | |
| 63,547 | 2 | Collective Brands, Inc.
| | | 1,174,984 | |
| 78,476 | 2 | Corinthian Colleges, Inc.
| | | 1,286,222 | |
| 56,044 | | DeVRY, Inc.
| | | 3,065,046 | |
| 78,620 | 2 | Dick's Sporting Goods, Inc.
| | | 2,623,549 | |
| 93,982 | 2 | Dollar Tree Stores, Inc.
| | | 3,599,511 | |
| 29,869 | | Entercom Communication Corp.
| | | 554,070 | |
| 153,600 | | Foot Locker, Inc.
| | | 2,287,104 | |
Shares
|
|
|
|
| Value
|
|
| | | COMMON STOCKS--continued 1 | | | | |
| | | Consumer Discretionary--continued | | | | |
| 50,444 | 3 | Furniture Brands International, Inc.
| | $ | 607,850 | |
| 154,300 | 2 | GameStop Corp.
| | | 9,137,646 | |
| 140,900 | | Gentex Corp.
| | | 2,927,902 | |
| 44,820 | 2 | Getty Images, Inc.
| | | 1,266,165 | |
| 57,700 | | Guess ?, Inc.
| | | 2,965,203 | |
| 94,500 | 2 | Hanesbrands, Inc.
| | | 2,933,280 | |
| 52,188 | | Harte-Hanks
| | | 920,074 | |
| 39,988 | 2,3 | Hovnanian Enterprises, Inc., Class A
| | | 454,664 | |
| 29,544 | 2 | ITT Educational Services, Inc.
| | | 3,757,701 | |
| 32,331 | | International Speedway Corp., Class A
| | | 1,436,466 | |
| 85,400 | 2,3 | Lamar Advertising Co.
| | | 4,565,484 | |
| 75,068 | 2 | Lear Corp.
| | | 2,667,166 | |
| 40,156 | | Lee Enterprises, Inc.
| | | 644,504 | |
| 31,280 | 2,3 | Life Time Fitness, Inc.
| | | 1,896,819 | |
| 34,300 | | M.D.C. Holdings, Inc.
| | | 1,389,493 | |
| 32,130 | | Matthews International Corp., Class A
| | | 1,464,164 | |
| 24,750 | | Media General, Inc., Class A
| | | 692,505 | |
| 30,000 | | Modine Manufacturing Co.
| | | 697,800 | |
| 52,688 | 2,3 | Mohawk Industries, Inc.
| | | 4,496,394 | |
| 5,180 | 2,3 | NVR, Inc.
| | | 2,464,385 | |
| 50,570 | 2,3 | NetFlix, Inc.
| | | 1,338,588 | |
| 108,900 | 2 | O'Reilly Automotive, Inc.
| | | 3,595,878 | |
| 70,700 | 2 | Pacific Sunwear of California
| | | 1,182,104 | |
| 129,876 | | PetSmart, Inc.
| | | 3,889,786 | |
| 55,170 | | Phillips Van Heusen Corp.
| | | 2,637,126 | |
| 45,150 | | Regis Corp. Minnesota
| | | 1,517,040 | |
| 65,957 | 2 | Rent-A-Center, Inc.
| | | 1,055,312 | |
| 136,025 | | Ross Stores, Inc.
| | | 3,675,396 | |
| 54,313 | 3 | Ruby Tuesday, Inc.
| | | 867,379 | |
| 43,100 | | Ryland Group, Inc.
| | | 1,225,333 | |
| 142,699 | 2,3 | Saks, Inc.
| | | 3,019,511 | |
| 27,481 | 2 | Scholastic Corp.
| | | 1,087,698 | |
| 64,000 | 2,3 | Scientific Games Holdings Corp.
| | | 2,313,600 | |
| 63,320 | | Sothebys Holdings, Inc., Class A
| | | 3,430,044 | |
| 13,950 | | Strayer Education, Inc.
| | | 2,601,117 | |
Shares
|
|
|
|
| Value
|
|
| | | COMMON STOCKS--continued 1 | | | | |
| | | Consumer Discretionary--continued | | | | |
| 33,500 | | Thor Industries, Inc.
| | $ | 1,608,000 | |
| 51,700 | 2 | Timberland Co., Class A
| | | 1,008,667 | |
| 120,800 | 2,3 | Toll Brothers, Inc.
| | | 2,767,528 | |
| 57,860 | | Tupperware Brands Corp.
| | | 2,088,746 | |
| 106,900 | 2 | Urban Outfitters, Inc.
| | | 2,701,363 | |
| 43,962 | 2 | Valassis Communications, Inc.
| | | 433,026 | |
| 44,460 | 2 | Warnaco Group, Inc.
| | | 1,809,077 | |
| 5,500 | | Washington Post Co., Class B
| | | 4,669,500 | |
| 42,390 | | Wiley (John) & Sons, Inc., Class A
| | | 1,864,312 | |
| 89,851 | | Williams-Sonoma, Inc.
|
|
| 2,824,915
|
|
| | | TOTAL
|
|
| 170,087,349
|
|
| | | Consumer Staples--2.9% | | | | |
| 77,940 | | Alberto-Culver Co.
| | | 2,025,661 | |
| 63,163 | 2 | BJ's Wholesale Club, Inc.
| | | 2,266,288 | |
| 61,755 | | Church and Dwight, Inc.
| | | 2,921,629 | |
| 73,170 | | Corn Products International, Inc.
| | | 3,112,652 | |
| 55,250 | 2 | Energizer Holdings, Inc.
| | | 5,762,575 | |
| 58,700 | 2 | Hansen Natural Corp.
| | | 3,991,600 | |
| 68,714 | | Hormel Foods Corp.
| | | 2,506,687 | |
| 23,749 | | Lancaster Colony Corp.
| | | 953,997 | |
| 54,900 | 2 | NBTY, Inc.
| | | 1,954,440 | |
| 59,951 | | PepsiAmericas, Inc.
| | | 2,141,450 | |
| 34,600 | | Ruddick Corp.
| | | 1,176,400 | |
| 113,017 | 2 | Smithfield Foods, Inc.
| | | 3,240,197 | |
| 54,124 | | Smucker (J.M.) Co.
| | | 2,891,845 | |
| 27,313 | | Tootsie Roll Industries, Inc.
| | | 703,856 | |
| 27,237 | | Universal Corp.
|
|
| 1,327,531
|
|
| | | TOTAL
|
|
| 36,976,808
|
|
| | | Energy--8.7% | | | | |
| 137,200 | | Arch Coal, Inc.
| | | 5,625,200 | |
| 32,040 | 2,3 | Bill Barrett Corp.
| | | 1,499,472 | |
| 105,612 | 2 | Cameron International Corp.
| | | 10,282,384 | |
| 82,620 | | Cimarex Energy Co.
| | | 3,346,936 | |
| 118,400 | 2 | Denbury Resources, Inc.
| | | 6,701,440 | |
| 52,380 | 2 | Encore Aquisition Co.
| | | 1,922,346 | |
| 62,675 | 2,3 | Exterran Holdings, Inc.
| | | 5,277,235 | |
Shares
|
|
|
|
| Value
|
|
| | | COMMON STOCKS--continued 1 | | | | |
| | | Energy--continued | | | | |
| 127,480 | 2 | FMC Technologies, Inc.
| | $ | 7,729,112 | |
| 83,098 | 2 | Forest Oil Corp.
| | | 4,037,732 | |
| 105,210 | | Frontier Oil Corp.
| | | 4,817,566 | |
| 124,467 | 2 | Grant Prideco, Inc.
| | | 6,118,798 | |
| 102,314 | | Helmerich & Payne, Inc.
| | | 3,235,169 | |
| 127,100 | 2,3 | Newfield Exploration Co.
| | | 6,843,064 | |
| 26,613 | | Overseas Shipholding Group, Inc.
| | | 1,980,007 | |
| 152,488 | 3 | Patterson-UTI Energy, Inc.
| | | 3,040,611 | |
| 119,551 | | Pioneer Natural Resources, Inc.
| | | 6,099,492 | |
| 71,219 | 2 | Plains Exploration & Production Co.
| | | 3,628,608 | |
| 58,057 | | Pogo Producing Co.
| | | 3,457,875 | |
| 164,538 | 2 | Pride International, Inc.
| | | 6,071,452 | |
| 51,400 | 2,3 | Quicksilver Resources, Inc.
| | | 2,929,800 | |
| 165,200 | 2 | Southwestern Energy Co.
| | | 8,545,796 | |
| 81,150 | 2 | Superior Energy Services, Inc.
| | | 3,009,042 | |
| 54,325 | | Tidewater, Inc.
|
|
| 2,969,948
|
|
| | | TOTAL
|
|
| 109,169,085
|
|
| | | Financials--13.3% | | | | |
| 96,957 | | AMB Property Corp.
| | | 6,336,140 | |
| 69,666 | | American Financial Group, Inc.
| | | 2,083,013 | |
| 110,806 | 2,3 | Americredit Corp.
| | | 1,563,473 | |
| 125,233 | | Associated Banc Corp.
| | | 3,614,224 | |
| 79,801 | | Astoria Financial Corp.
| | | 2,074,028 | |
| 49,663 | | Bank of Hawaii Corp.
| | | 2,640,085 | |
| 163,225 | | Berkley, W. R. Corp.
| | | 4,911,440 | |
| 108,076 | | Brown & Brown
| | | 2,722,434 | |
| 51,100 | | Cathay Bancorp, Inc.
| | | 1,582,567 | |
| 40,394 | | City National Corp.
| | | 2,730,634 | |
| 145,682 | | Colonial BancGroup, Inc.
| | | 2,794,181 | |
| 46,940 | 3 | Commerce Group, Inc.
| | | 1,712,841 | |
| 39,510 | 3 | Cousins Properties, Inc.
| | | 1,137,493 | |
| 56,990 | | Cullen Frost Bankers, Inc.
| | | 3,030,728 | |
| 129,510 | | Duke Realty Corp.
| | | 4,163,747 | |
| 122,012 | | Eaton Vance Corp.
| | | 6,104,260 | |
| 36,270 | | Equity One, Inc.
| | | 949,549 | |
Shares
|
|
|
|
| Value
|
|
| | | COMMON STOCKS--continued 1 | | | | |
| | | Financials--continued | | | | |
| 62,257 | | Everest Re Group Ltd.
| | $ | 6,632,861 | |
| 216,698 | | Fidelity National Financial, Inc., Class A
| | | 3,334,982 | |
| 94,308 | | First American Financial Corp.
| | | 2,838,671 | |
| 25,920 | | First Community Bancorp
| | | 1,262,304 | |
| 109,000 | | First Niagara Financial Group, Inc.
| | | 1,438,800 | |
| 74,231 | | FirstMerit Corp.
| | | 1,573,697 | |
| 95,807 | | Gallagher (Arthur J.) & Co.
| | | 2,549,424 | |
| 105,862 | | HCC Insurance Holdings, Inc.
| | | 3,164,215 | |
| 48,900 | | Hanover Insurance Group, Inc.
| | | 2,252,823 | |
| 55,500 | | Highwoods Properties, Inc.
| | | 1,995,780 | |
| 38,500 | | Horace Mann Educators Corp.
| | | 796,565 | |
| 91,042 | | Hospitality Properties Trust
| | | 3,605,263 | |
| 69,931 | 3 | IndyMac Bancorp, Inc.
| | | 938,474 | |
| 107,800 | | Jefferies Group, Inc.
| | | 2,881,494 | |
| 35,820 | | Jones Lang LaSalle, Inc.
| | | 3,414,721 | |
| 86,850 | | Liberty Property Trust
| | | 3,267,297 | |
| 70,800 | | Macerich Co. (The)
| | | 6,068,268 | |
| 66,217 | | Mack-Cali Realty Corp.
| | | 2,621,531 | |
| 33,700 | | Mercury General Corp.
| | | 1,729,147 | |
| 91,290 | | Nationwide Health Properties, Inc.
| | | 2,850,074 | |
| 304,668 | | New York Community Bancorp, Inc.
| | | 5,669,871 | |
| 76,150 | | Nuveen Investments, Class A
| | | 4,934,520 | |
| 219,563 | | Old Republic International Corp.
| | | 3,365,901 | |
| 83,275 | | PMI Group, Inc.
| | | 1,334,898 | |
| 39,294 | | Potlatch Corp.
| | | 1,872,752 | |
| 70,344 | | Protective Life Corp.
| | | 3,015,647 | |
| 77,982 | 3 | Radian Group, Inc.
| | | 981,793 | |
| 88,950 | | Raymond James Financial, Inc.
| | | 3,313,388 | |
| 73,469 | | Rayonier, Inc.
| | | 3,547,818 | |
| 66,700 | | Regency Centers Corp.
| | | 4,767,716 | |
| 120,602 | | SEI Investments Co.
| | | 3,813,435 | |
| 33,288 | 3 | SVB Financial Group
| | | 1,723,986 | |
| 50,188 | | StanCorp Financial Group, Inc.
| | | 2,766,864 | |
| 109,814 | | TCF Financial Corp.
| | | 2,500,465 | |
| 132,627 | | UDR, Inc.
| | | 3,148,565 | |
| 48,931 | | Unitrin, Inc.
| | | 2,265,995 | |
Shares
|
|
|
|
| Value
|
|
| | | COMMON STOCKS--continued 1 | | | | |
| | | Financials--continued | | | | |
| 78,075 | | Waddell & Reed Financial, Inc., Class A
| | $ | 2,593,652 | |
| 81,131 | | Washington Federal, Inc.
| | | 1,960,125 | |
| 52,100 | | Webster Financial Corp. Waterbury
| | | 1,888,104 | |
| 75,200 | | Weingarten Realty Investors
| | | 2,877,152 | |
| 28,900 | | WestAmerica Bancorp.
| | | 1,389,512 | |
| 63,919 | | Wilmington Trust Corp.
|
|
| 2,324,734
|
|
| | | TOTAL
|
|
| 167,424,121
|
|
| | | Health Care--11.2% | | | | |
| 60,715 | 2,3 | Advanced Medical Optics, Inc.
| | | 1,666,627 | |
| 69,300 | 2,3 | Affymetrix, Inc.
| | | 1,764,378 | |
| 43,425 | 2 | Apria Healthcare Group, Inc.
| | | 1,049,582 | |
| 62,125 | | Beckman Coulter, Inc.
| | | 4,399,692 | |
| 65,990 | 2,3 | Cephalon, Inc.
| | | 4,866,103 | |
| 63,720 | 2,3 | Cerner Corp.
| | | 3,795,163 | |
| 67,169 | 2 | Charles River Laboratories International, Inc.
| | | 3,895,802 | |
| 93,363 | 2 | Community Health Systems, Inc.
| | | 3,074,444 | |
| 60,519 | 2 | Covance, Inc.
| | | 4,992,818 | |
| 149,826 | | Dentsply International, Inc.
| | | 6,214,782 | |
| 57,513 | 2 | Edwards Lifesciences Corp.
| | | 2,888,303 | |
| 132,100 | 2 | Endo Pharmaceuticals Holdings, Inc.
| | | 3,870,530 | |
| 50,400 | 2 | Gen-Probe, Inc.
| | | 3,529,008 | |
| 243,410 | 2 | Health Management Association, Class A
| | | 1,608,940 | |
| 109,604 | 2 | Health Net, Inc.
| | | 5,875,870 | |
| 84,888 | 2 | Henry Schein, Inc.
| | | 5,084,791 | |
| 58,425 | | Hillenbrand Industries, Inc.
| | | 3,226,229 | |
| 108,990 | 2 | Hologic, Inc.
| | | 7,403,691 | |
| 36,900 | 2 | Intuitive Surgical, Inc.
| | | 12,061,503 | |
| 44,880 | 2 | Invitrogen Corp.
| | | 4,078,246 | |
| 30,690 | 2 | Kindred Healthcare, Inc.
| | | 651,856 | |
| 43,830 | 2 | Kyphon, Inc.
| | | 3,106,670 | |
| 58,450 | 2 | LifePoint Hospitals, Inc.
| | | 1,783,894 | |
| 84,854 | 2 | Lincare Holdings, Inc.
| | | 2,950,374 | |
| 54,400 | | Medicis Pharmaceutical Corp., Class A
| | | 1,615,136 | |
| 306,152 | 2 | Millennium Pharmaceuticals, Inc.
| | | 3,618,717 | |
| 119,194 | 3 | Omnicare, Inc.
| | | 3,516,223 | |
Shares
|
|
|
|
| Value
|
|
| | | COMMON STOCKS--continued 1 | | | | |
| | | Health Care--continued | | | | |
| 110,632 | 2 | PDL BioPharma, Inc.
| | $ | 2,345,398 | |
| 35,462 | 2 | Par Pharmaceutical Cos., Inc.
| | | 653,919 | |
| 73,288 | | Perrigo Co.
| | | 1,737,658 | |
| 99,400 | | Pharmaceutical Product Development, Inc.
| | | 4,198,656 | |
| 52,900 | 2 | Psychiatric Solutions, Inc.
| | | 2,094,840 | |
| 73,600 | 2 | ResMed, Inc.
| | | 3,049,248 | |
| 104,157 | 2 | Sepracor, Inc.
| | | 2,868,484 | |
| 59,800 | | Steris Corp.
| | | 1,736,592 | |
| 36,800 | 2 | Techne Corp.
| | | 2,400,832 | |
| 53,469 | | Universal Health Services, Inc., Class B
| | | 2,606,614 | |
| 79,400 | 2 | VCA Antech, Inc.
| | | 3,656,370 | |
| 90,200 | 2 | Valeant Pharmaceuticals International
| | | 1,312,410 | |
| 30,169 | 2 | Varian, Inc.
| | | 2,229,187 | |
| 29,060 | 2 | Ventana Medical Systems
| | | 2,557,280 | |
| 129,287 | 2 | Vertex Pharmaceuticals, Inc.
| | | 4,181,142 | |
| 39,900 | 2,3 | Wellcare Health Plans, Inc.
|
|
| 965,181
|
|
| | | TOTAL
|
|
| 141,183,183
|
|
| | | Industrials--13.6% | | | | |
| 89,157 | 2 | AGCO Corp.
| | | 5,320,890 | |
| 101,468 | | AMETEK, Inc.
| | | 4,768,996 | |
| 83,300 | 2 | AirTran Holdings, Inc.
| | | 867,153 | |
| 39,300 | 2 | Alaska Air Group, Inc.
| | | 998,220 | |
| 39,850 | | Alexander and Baldwin, Inc.
| | | 2,087,343 | |
| 33,500 | 2 | Alliant Techsystems, Inc.
| | | 3,698,065 | |
| 98,130 | 2 | Avis Budget Group, Inc.
| | | 2,047,973 | |
| 46,950 | | Brinks Co. (The)
| | | 2,941,418 | |
| 58,488 | | Carlisle Cos., Inc.
| | | 2,307,352 | |
| 75,216 | 2 | ChoicePoint, Inc.
| | | 2,957,493 | |
| 43,800 | | Con-way, Inc.
| | | 1,866,318 | |
| 67,282 | 2 | Copart, Inc.
| | | 2,582,283 | |
| 36,200 | | Corporate Executive Board Co.
| | | 2,579,250 | |
| 47,494 | | Crane Co.
| | | 2,253,115 | |
| 40,100 | | DRS Technologies, Inc.
| | | 2,303,344 | |
| 49,070 | | Deluxe Corp.
| | | 1,979,484 | |
| 66,876 | | Donaldson Co., Inc.
| | | 2,866,305 | |
| 58,106 | | Dun & Bradstreet Corp.
| | | 5,627,566 | |
Shares
|
|
|
|
| Value
|
|
| | | COMMON STOCKS--continued 1 | | | | |
| | | Industrials--continued | | | | |
| 122,712 | 3 | Fastenal Co.
| | $ | 5,458,230 | |
| 44,626 | | Federal Signal Corp.
| | | 597,542 | |
| 54,338 | | Flowserve Corp.
| | | 4,290,528 | |
| 49,925 | | GATX Corp.
| | | 2,045,427 | |
| 65,862 | | Graco, Inc.
| | | 2,592,328 | |
| 33,925 | | Granite Construction, Inc.
| | | 1,452,669 | |
| 46,988 | 3 | HNI Corp.
| | | 2,037,400 | |
| 79,988 | | Harsco Corp.
| | | 4,848,873 | |
| 55,424 | | Hubbell, Inc., Class B
| | | 3,048,320 | |
| 93,976 | | Hunt (J.B.) Transportation Services, Inc.
| | | 2,605,015 | |
| 77,940 | | IDEX Corp.
| | | 2,760,635 | |
| 168,164 | 2,3 | Jet Blue Airways Corp.
| | | 1,535,337 | |
| 105,580 | | Joy Global, Inc.
| | | 6,129,975 | |
| 163,990 | 2 | KBR, Inc.
| | | 7,031,891 | |
| 20,375 | | Kelly Services, Inc., Class A
| | | 428,486 | |
| 37,362 | | Kennametal, Inc.
| | | 3,407,788 | |
| 44,300 | 2 | Korn/Ferry International
| | | 848,788 | |
| 42,200 | | Lincoln Electric Holdings
| | | 3,048,950 | |
| 47,700 | | MSC Industrial Direct Co.
| | | 2,323,467 | |
| 83,200 | | Manpower, Inc.
| | | 6,218,368 | |
| 62,232 | | Miller Herman, Inc.
| | | 1,693,955 | |
| 27,500 | | Mine Safety Appliances Co.
| | | 1,259,225 | |
| 42,010 | 2 | Navigant Consulting, Inc.
| | | 553,692 | |
| 33,182 | | Nordson Corp.
| | | 1,775,237 | |
| 70,500 | | OshKosh Truck Corp.
| | | 3,821,100 | |
| 99,326 | | Pentair, Inc.
| | | 3,515,147 | |
| 163,612 | 2 | Quanta Services, Inc.
| | | 5,399,196 | |
| 160,571 | | Republic Services, Inc.
| | | 5,489,922 | |
| 30,325 | | Rollins, Inc.
| | | 920,970 | |
| 85,900 | | Roper Industries, Inc.
| | | 6,082,579 | |
| 53,744 | | SPX Corp.
| | | 5,444,267 | |
| 6,800 | 2 | Sequa Corp., Class A
| | | 1,181,976 | |
| 86,838 | 2 | Stericycle, Inc.
| | | 5,065,261 | |
| 37,062 | | Teleflex, Inc.
| | | 2,713,309 | |
| 49,986 | 2 | Thomas & Betts Corp.
| | | 2,799,716 | |
Shares
|
|
|
|
| Value
|
|
| | | COMMON STOCKS--continued 1 | | | | |
| | | Industrials--continued | | | | |
| 90,200 | | Timken Co.
| | $ | 3,000,052 | |
| 76,725 | | Trinity Industries, Inc.
| | | 2,772,842 | |
| 69,069 | 2 | United Rentals, Inc.
| | | 2,361,469 | |
| 49,506 | | Werner Enterprises, Inc.
| | | 941,604 | |
| 57,457 | 2,3 | YRC Worldwide, Inc.
|
|
| 1,412,293
|
|
| | | TOTAL
|
|
| 170,966,397
|
|
| | | Information Technology--14.5% | | | | |
| 375,641 | 2 | 3Com Corp.
| | | 1,833,128 | |
| 33,900 | 2 | ACI Worldwide, Inc.
| | | 775,293 | |
| 115,943 | 2 | ADC Telecommunications, Inc.
| | | 2,168,134 | |
| 276,954 | 2 | Activision, Inc.
| | | 6,549,962 | |
| 65,457 | 2 | Acxiom Corp.
| | | 860,105 | |
| 61,350 | | Adtran, Inc.
| | | 1,476,694 | |
| 17,400 | 2 | Advent Software, Inc.
| | | 962,742 | |
| 76,400 | 2,3 | Alliance Data Systems Corp.
| | | 6,142,560 | |
| 175,000 | | Amphenol Corp., Class A
| | | 7,747,250 | |
| 154,800 | 2 | Andrew Corp.
| | | 2,269,368 | |
| 118,019 | 2 | Arrow Electronics, Inc.
| | | 4,718,400 | |
| 465,404 | 2 | Atmel Corp.
| | | 2,275,826 | |
| 145,445 | 2 | Avnet, Inc.
| | | 6,067,965 | |
| 50,775 | 2 | Avocent Corp.
| | | 1,372,448 | |
| 135,360 | | Broadridge Financial Solutions
| | | 2,707,200 | |
| 43,300 | 2 | CSG Systems International, Inc.
| | | 888,949 | |
| 273,177 | 2,3 | Cadence Design Systems, Inc.
| | | 5,354,269 | |
| 137,670 | 2 | Ceridian Corp.
| | | 4,947,860 | |
| 84,938 | 2 | Checkfree Corp.
| | | 4,037,103 | |
| 58,744 | 2 | CommScope, Inc.
| | | 2,770,954 | |
| 83,900 | 2,3 | Cree, Inc.
| | | 2,349,200 | |
| 147,688 | 2 | Cypress Semiconductor Corp.
| | | 5,397,996 | |
| 52,838 | 2,3 | DST Systems, Inc.
| | | 4,475,907 | |
| 65,444 | | Diebold, Inc.
| | | 2,738,177 | |
| 40,290 | 2 | Digital River, Inc.
| | | 2,137,787 | |
| 37,906 | 2 | Dycom Industries, Inc.
| | | 1,070,845 | |
| 80,200 | 2 | F5 Networks, Inc.
| | | 2,889,606 | |
| 55,832 | | Fair Isaac & Co., Inc.
| | | 2,117,149 | |
Shares
|
|
|
|
| Value
|
|
| | | COMMON STOCKS--continued 1 | | | | |
| | | Information Technology--continued | | | | |
| 116,532 | 2 | Fairchild Semiconductor International, Inc., Class A
| | $ | 2,126,709 | |
| 64,861 | 2 | Gartner Group, Inc., Class A
| | | 1,420,456 | |
| 76,800 | | Global Payments, Inc.
| | | 3,652,608 | |
| 133,526 | | Harris Corp.
| | | 8,086,335 | |
| 73,008 | | Henry Jack & Associates, Inc.
| | | 2,133,294 | |
| 37,269 | | Imation Corp.
| | | 830,353 | |
| 137,500 | 2 | Ingram Micro, Inc., Class A
| | | 2,920,500 | |
| 191,177 | 2 | Integrated Device Technology, Inc.
| | | 2,567,507 | |
| 68,331 | 2 | International Rectifier Corp.
| | | 2,280,889 | |
| 131,713 | | Intersil Holding Corp.
| | | 3,996,172 | |
| 75,294 | 2 | Kemet Corp.
| | | 532,329 | |
| 131,258 | 2 | Lam Research Corp.
| | | 6,589,152 | |
| 100,313 | 2 | Lattice Semiconductor Corp.
| | | 419,308 | |
| 94,295 | 2 | MPS Group, Inc.
| | | 1,151,342 | |
| 50,806 | 2 | Macrovision Corp.
| | | 1,219,344 | |
| 154,782 | 2,3 | McAfee, Inc.
| | | 6,400,236 | |
| 83,019 | 2 | Mentor Graphics Corp.
| | | 1,329,964 | |
| 59,513 | | Micrel, Inc.
| | | 538,593 | |
| 79,800 | | Moneygram International, Inc.
| | | 1,272,810 | |
| 170,820 | 2 | NCR Corp.
| | | 4,712,924 | |
| 52,800 | | National Instruments Corp.
| | | 1,712,832 | |
| 104,700 | 2 | Palm, Inc.
| | | 944,394 | |
| 109,980 | 2 | Parametric Technology Corp.
| | | 2,100,618 | |
| 48,462 | | Plantronics, Inc.
| | | 1,325,436 | |
| 91,531 | 2 | Polycom, Inc.
| | | 2,561,037 | |
| 117,800 | 2,3 | Powerwave Technologies, Inc.
| | | 654,968 | |
| 179,351 | 2,3 | RF Micro Devices, Inc.
| | | 1,115,563 | |
| 38,400 | 2 | SRA International, Inc.
| | | 1,054,464 | |
| 65,050 | 2 | Semtech Corp.
| | | 1,113,006 | |
| 55,425 | 2 | Silicon Laboratories, Inc.
| | | 2,422,073 | |
| 88,375 | 2 | Sybase, Inc.
| | | 2,527,525 | |
| 137,939 | 2 | Synopsys, Inc.
| | | 3,898,156 | |
| 54,700 | 2 | Tech Data Corp.
| | | 2,151,351 | |
| 123,962 | 2 | Triquint Semiconductor, Inc.
| | | 777,242 | |
| 97,300 | 2,3 | UTStarcom, Inc.
| | | 311,360 | |
| 95,130 | 2 | ValueClick, Inc.
| | | 2,586,585 | |
Shares
|
|
|
|
| Value
|
|
| | | COMMON STOCKS--continued 1 | | | | |
| | | Information Technology--continued | | | | |
| 176,209 | 2 | Vishay Intertechnology, Inc.
| | $ | 2,218,471 | |
| 212,500 | 2 | Western Digital Corp.
| | | 5,508,000 | |
| 77,400 | 2 | Wind River Systems, Inc.
| | | 968,274 | |
| 64,634 | 2 | Zebra Technologies Corp., Class A
|
|
| 2,526,543
|
|
| | | TOTAL
|
|
| 181,761,600
|
|
| | | Materials--7.3% | | | | |
| 77,744 | | Airgas, Inc.
| | | 3,923,740 | |
| 78,762 | | Albemarle Corp.
| | | 3,761,673 | |
| 44,910 | | CF Industries Holdings, Inc.
| | | 3,947,589 | |
| 63,600 | | Cabot Corp.
| | | 2,226,636 | |
| 25,560 | | Carpenter Technology Corp.
| | | 3,703,900 | |
| 234,677 | | Chemtura Corp.
| | | 2,187,190 | |
| 39,330 | | Cleveland Cliffs, Inc.
| | | 3,761,914 | |
| 114,000 | | Commercial Metals Corp.
| | | 3,577,320 | |
| 39,726 | | Cytec Industries, Inc.
| | | 2,650,121 | |
| 72,462 | | FMC Corp.
| | | 4,166,565 | |
| 39,119 | | Ferro Corp.
| | | 810,546 | |
| 47,100 | | Florida Rock Industries, Inc.
| | | 2,964,003 | |
| 105,800 | | Louisiana-Pacific Corp.
| | | 1,741,468 | |
| 68,300 | | Lubrizol Corp.
| | | 4,636,204 | |
| 245,939 | | Lyondell Chemical Co.
| | | 11,669,806 | |
| 41,105 | 3 | Martin Marietta Materials
| | | 5,316,932 | |
| 20,100 | | Minerals Technologies, Inc.
| | | 1,411,422 | |
| 74,794 | | Olin Corp.
| | | 1,703,807 | |
| 86,351 | | Packaging Corp. of America
| | | 2,749,416 | |
| 113,669 | | RPM, Inc.
| | | 2,435,927 | |
| 63,600 | | Reliance Steel & Aluminum Co.
| | | 3,711,060 | |
| 44,900 | | Scotts Co.
| | | 2,060,461 | |
| 48,575 | | Sensient Technologies Corp.
| | | 1,451,907 | |
| 94,823 | | Sonoco Products Co.
| | | 2,931,927 | |
| 99,000 | | Steel Dynamics, Inc.
| | | 5,268,780 | |
| 86,490 | 2 | Terra Industries, Inc.
| | | 3,190,616 | |
| 94,076 | | Valspar Corp.
| | | 2,354,722 | |
| 68,881 | 3 | Worthington Industries, Inc.
|
|
| 1,722,025
|
|
| | | TOTAL
|
|
| 92,037,677
|
|
Shares
|
|
|
|
| Value
|
|
| | | COMMON STOCKS--continued 1 | | | | |
| | | Telecommunication Services--0.9% | | | | |
| 229,490 | 2 | Cincinnati Bell, Inc.
| | $ | 1,243,836 | |
| 71,950 | 2,3 | NeuStar, Inc., Class A
| | | 2,460,690 | |
| 36,888 | | Telephone and Data System, Inc.
| | | 2,429,075 | |
| 66,488 | | Telephone and Data System, Inc.
|
|
| 4,640,862
|
|
| | | TOTAL
|
|
| 10,774,463
|
|
| | | Utilities--7.1% | | | | |
| 75,132 | | AGL Resources, Inc.
| | | 2,969,968 | |
| 111,113 | | Alliant Energy Corp.
| | | 4,444,520 | |
| 133,068 | 3 | Aqua America, Inc.
| | | 3,095,162 | |
| 353,400 | 2 | Aquila, Inc.
| | | 1,477,212 | |
| 38,969 | | Black Hills Corp.
| | | 1,731,003 | |
| 113,313 | 3 | DPL, Inc.
| | | 3,290,610 | |
| 149,960 | | Energy East Corp.
| | | 4,180,885 | |
| 118,900 | | Equitable Resources, Inc.
| | | 6,696,448 | |
| 80,144 | | Great Plains Energy, Inc.
| | | 2,391,497 | |
| 75,524 | | Hawaiian Electric Industries, Inc.
| | | 1,752,157 | |
| 43,706 | | Idacorp, Inc.
| | | 1,524,902 | |
| 173,114 | | MDU Resources Group, Inc.
| | | 4,874,890 | |
| 100,776 | | NSTAR
| | | 3,543,284 | |
| 78,963 | | National Fuel Gas Co.
| | | 3,828,916 | |
| 146,745 | | Northeast Utilities Co.
| | | 4,524,148 | |
| 88,057 | | OGE Energy Corp.
| | | 3,372,583 | |
| 102,032 | | ONEOK, Inc.
| | | 5,095,478 | |
| 78,043 | | PNM Resources, Inc.
| | | 1,951,855 | |
| 191,357 | | Pepco Holdings, Inc.
| | | 5,451,761 | |
| 109,457 | | Puget Energy, Inc.
| | | 3,092,160 | |
| 110,645 | | SCANA Corp.
| | | 4,491,081 | |
| 210,048 | | Sierra Pacific Resources
| | | 3,543,510 | |
| 70,604 | | Vectren Corp.
| | | 1,979,736 | |
| 45,000 | | WGL Holdings, Inc.
| | | 1,526,400 | |
| 91,526 | | Westar Energy, Inc.
| | | 2,436,422 | |
| 113,845 | 4 | Wisconsin Energy Corp.
|
|
| 5,450,899
|
|
| | | TOTAL
|
|
| 88,717,487
|
|
| | | TOTAL COMMON STOCKS
(IDENTIFIED COST $844,192,828)
|
|
| 1,169,098,170
|
|
Shares
|
|
|
|
| Value
|
|
| | | MUTUAL FUND--13.6% | | | | |
| 170,985,823 | 5,6,7 | Prime Value Obligations Fund, Institutional Shares, 5.06%
(AT NET ASSET VALUE)
|
| $
| 170,985,823
|
|
| | | TOTAL INVESTMENTS--106.6%
(IDENTIFIED COST $1,015,178,651) 8
|
|
| 1,340,083,993
|
|
| | | OTHER ASSETS AND LIABILITIES - NET--(6.6)%
|
|
| (83,035,577
| )
|
| | | TOTAL NET ASSETS--100%
|
| $
| 1,257,048,416
|
|
At October 31, 2007, the Fund had the following outstanding futures contracts: 1
| Contracts
|
| Number of
Contracts
|
| Notional Value
|
| Expiration Date
|
| Unrealized
Appreciation
|
| 2 | S&P MidCap 400 Index Long Futures
|
| 195
|
| $88,929,750
|
| December 2007
|
| $3,183,409
|
1 The Fund purchases index futures contracts to efficiently manage cash flows resulting from shareholder purchases and redemptions, dividend and capital gain payments to shareholders and corporate actions while maintaining exposure to the S&P MidCap 400 Index and minimizing trading costs. The underlying face amount, at value, of open index futures contracts is $88,929,750 at October 31, 2007, which represents 7.1% of total net assets. Taking into consideration these open index futures contracts, the Fund's effective total exposure to the S&P MidCap 400 Index is 100.2%.
2 Non-income-producing security.
3 All or a portion of these securities are temporarily on loan to unaffiliated broker/dealers.
4 Pledged as collateral to ensure the Fund is able to satisfy the obligations of its outstanding futures contracts.
5 Affiliated company.
6 7-Day net yield.
7 All or a portion of this security is held as collateral for securities lending.
8 The cost of investments for federal tax purposes amounts to $1,035,311,588.
Note: The categories of investments are shown as a percentage of total net assets at October 31, 2007.
See Notes which are an integral part of the Financial Statements
Statement of Assets and Liabilities
October 31, 2007
Assets:
| | | | | | |
Total investments in securities, at value including $170,985,823 of investments in affiliated issuers (Note 5) and $80,516,416 of securities loaned (identified cost $1,015,178,651)
| | | | | $ | 1,340,083,993 |
Cash
| | | | | | 3,966,982 |
Income receivable
| | | | | | 543,921 |
Receivable for investments sold
| | | | | | 1,126,986 |
Receivable for shares sold
| | | | | | 702,395 |
Receivable for daily variation margin
|
|
|
|
|
| 1,482,000
|
TOTAL ASSETS
|
|
|
|
|
| 1,347,906,277
|
Liabilities:
| | | | | | |
Payable for investments purchased
| | $ | 4,651,477 | | | |
Payable for shares redeemed
| | | 1,344,167 | | | |
Payable for shareholder services fee (Note 5)
| | | 235,637 | | | |
Payable for collateral due to broker for securities loaned
| | | 84,485,855 | | | |
Accrued expenses
|
|
| 140,725
|
|
|
|
TOTAL LIABILITIES
|
|
|
|
|
| 90,857,861
|
Net assets for 48,743,403 shares outstanding
|
|
|
|
| $
| 1,257,048,416
|
Net Assets Consist of:
| | | | | | |
Paid-in capital
| | | | | $ | 832,962,476 |
Net unrealized appreciation of investments and futures contracts
| | | | | | 328,088,751 |
Accumulated net realized gain on investments and futures contracts
| | | | | | 94,819,896 |
Undistributed net investment income
|
|
|
|
|
| 1,177,293
|
TOTAL NET ASSETS
|
|
|
|
| $
| 1,257,048,416
|
Net Asset Value, Offering Price and Redemption Proceeds Per Share:
| | | | | | |
$1,257,048,416 ÷ 48,743,403 shares outstanding, no par value, unlimited shares authorized
|
|
|
|
|
| $25.79
|
See Notes which are an integral part of the Financial Statements
Statement of Operations
Year Ended October 31, 2007
Investment Income:
| | | | | | | | |
Dividends (including $276,120 received from affiliated issuers (Note 5))
| | | | | | $ | 16,606,745 | |
Interest (including income on securities loaned of $449,381)
|
|
|
|
|
|
| 7,435,420
|
|
TOTAL INCOME
|
|
|
|
|
|
| 24,042,165
|
|
Expenses:
| | | | | | | | |
Management fee (Note 5)
| | $ | 5,052,614 | | | | | |
Custodian fees
| | | 73,772 | | | | | |
Transfer and dividend disbursing agent fees and expenses
| | | 570,853 | | | | | |
Directors'/Trustees' fees
| | | 18,679 | | | | | |
Auditing fees
| | | 19,013 | | | | | |
Legal fees
| | | 17,399 | | | | | |
Portfolio accounting fees
| | | 157,664 | | | | | |
Shareholder services fee (Note 5)
| | | 2,634,828 | | | | | |
Account administration fee
| | | 41,231 | | | | | |
Share registration costs
| | | 25,654 | | | | | |
Printing and postage
| | | 67,527 | | | | | |
Insurance premiums
| | | 11,874 | | | | | |
Miscellaneous
|
|
| 9,826
|
|
|
|
|
|
TOTAL EXPENSES
|
|
| 8,700,934
|
|
|
|
|
|
Waiver/reimbursement of management fee
|
|
| (2,449,708
| )
|
|
|
|
|
Net expenses
|
|
|
|
|
|
| 6,251,226
|
|
Net investment income
|
|
|
|
|
|
| 17,790,939
|
|
Realized and Unrealized Gain on Investments and Futures Contracts:
| | | | | | | | |
Net realized gain on investments
| | | | | | | 105,086,579 | |
Net realized gain on futures contracts
| | | | | | | 19,085,686 | |
Net change in unrealized appreciation of investments
| | | | | | | 54,602,891 | |
Net change in unrealized appreciation of futures contracts
|
|
|
|
|
|
| (3,739,811)
|
|
Net realized and unrealized gain on investments and futures contracts
|
|
|
|
|
|
| 175,035,345
|
|
Change in net assets resulting from operations
|
|
|
|
|
| $
| 192,826,284
|
|
See Notes which are an integral part of the Financial Statements
Statement of Changes in Net Assets
Year Ended October 31
|
|
| 2007
|
|
|
| 2006
|
|
Increase (Decrease) in Net Assets
| | | | | | | | |
Operations:
| | | | | | | | |
Net investment income
| | $ | 17,790,939 | | | $ | 14,617,923 | |
Net realized gain on investments and futures contracts
| | | 124,172,265 | | | | 46,881,013 | |
Net change in unrealized appreciation/depreciation on investments and futures contracts
|
|
| 50,863,080
|
|
|
| 52,579,952
|
|
CHANGE IN NET ASSETS RESULTING FROM OPERATIONS
|
|
| 192,826,284
|
|
|
| 114,078,888
|
|
Distributions to Shareholders:
| | | | | | | | |
Distributions from net investment income
| | | (18,334,648 | ) | | | (14,769,271 | ) |
Distributions from net realized gain on investments and futures contracts
|
|
| (53,813,499
| )
|
|
| (46,621,162
| )
|
CHANGE IN NET ASSETS RESULTING FROM DISTRIBUTIONS TO SHAREHOLDERS
|
|
| (72,148,147
| )
|
|
| (61,390,433
| )
|
Share Transactions:
| | | | | | | | |
Proceeds from sale of shares
| | | 232,425,596 | | | | 271,588,687 | |
Proceeds from shares issued in connection with the tax-free transfer of assets from Mason Street Index 400 Stock Fund
| | | - -- | | | | 217,939,098 | |
Net asset value of shares issued to shareholders in payment of distributions declared
| | | 66,306,072 | | | | 55,274,268 | |
Cost of shares redeemed
|
|
| (364,988,324
| )
|
|
| (283,927,186
| )
|
CHANGE IN NET ASSETS RESULTING FROM SHARE TRANSACTIONS
|
|
| (66,256,656
| )
|
|
| 260,874,867
|
|
Change in net assets
|
|
| 54,421,481
|
|
|
| 313,563,322
|
|
Net Assets:
| | | | | | | | |
Beginning of period
|
|
| 1,202,626,935
|
|
|
| 889,063,613
|
|
End of period (including undistributed net investment income of $1,177,293 and $1,721,002, respectively)
|
| $
| 1,257,048,416
|
|
| $
| 1,202,626,935
|
|
See Notes which are an integral part of the Financial Statements
Notes to Financial Statements
October 31, 2007
1. ORGANIZATION
Federated Index Trust (the "Trust") is registered under the Investment Company Act of 1940, as amended (the "Act"), as an open-end management investment company. The Trust consists of three portfolios. The financial statements included herein are only those of Federated Mid-Cap Index Fund (the "Fund"), a diversified portfolio. The financial statements of the other portfolios are presented separately. The assets of each portfolio are segregated and a shareholder's interest is limited to the portfolio in which shares are held. Each portfolio pays its own expenses. The investment objective of the Fund is to provide investment results generally corresponding to the aggregate price and dividend performance of the publicly traded common stocks that comprise the mid-level stock capitalization sector of the U.S. equity market. This group of stocks is known as the S&P MidCap 400 Index.
On March 24, 2006, the Fund received assets from the Mason Street Index 400 Stock Fund as the result of a tax-free reorganization, as follows:
Shares of the
Fund Issued
|
| Mason Street
Index 400
Stock Fund
Net Assets
Received
|
| Unrealized
Appreciation 1
|
| Net Assets
of the Fund
Immediately
Prior to
Combination
|
| Net Assets of
Mason Street
Index 400
Stock Fund
Immediately
Prior to
Combination
|
| Net Assets
of the Fund
Immediately
After
Combination
|
9,234,480
|
| $217,939,098
|
| $55,558,471
|
| $1,012,418,107
|
| $217,939,098
|
| $1,230,357,205
|
1 Unrealized Appreciation is included in the Mason Street Index 400 Stock Fund Net Assets Received amount shown above.
2. SIGNIFICANT ACCOUNTING POLICIES
The following is a summary of significant accounting policies consistently followed by the Fund in the preparation of its financial statements. These policies are in conformity with generally accepted accounting principles (GAAP) in the United States of America.
Investment Valuation
In calculating its net asset value (NAV), the Fund generally values investments as follows:
- Equity securities listed on an exchange or traded through a regulated market system are valued at their last reported sale price or official closing price in their principal exchange or market.
- Derivative contracts listed on exchanges are valued at their reported settlement or closing price.
- Over-the-counter (OTC) derivative contracts are fair valued using price evaluations provided by a pricing service approved by the Board of Trustees (the "Trustees").
- Shares of other mutual funds are valued based upon their reported NAVs.
- Fixed-income securities acquired with remaining maturities of 60 days or less are valued at their cost (adjusted for the accretion of any discount or amortization of any premium).
- Fixed-income securities acquired with remaining maturities greater than 60 days are fair valued using price evaluations provided by a pricing service approved by the Trustees.
If the Fund cannot obtain a price or price evaluation from a pricing service for an investment, the Fund may attempt to value the investment based upon the mean of bid and asked quotations or fair value the investment based on price evaluations, from one or more dealers. If any price, quotation, price evaluation or other pricing source is not readily available when the NAV is calculated, the Fund uses the fair value of the investment determined in accordance with the procedures described below. There can be no assurance that the Fund could purchase or sell an investment at the price used to calculate the Fund's NAV.
Fair Valuation and Significant Events Procedures
The Trustees have authorized the use of pricing services to provide evaluations of the current fair value of certain investments for purposes of calculating the NAV. Factors considered by pricing services in evaluating an investment include the yields or prices of investments of comparable quality, coupon, maturity, call rights and other potential prepayments, terms and type, reported transactions, indications as to values from dealers, and general market conditions. Some pricing services provide a single price evaluation reflecting the bid-side of the market for an investment (a "bid" evaluation). Other pricing services offer both bid evaluations and price evaluations indicative of a price between the prices bid and asked (a "mid" evaluation) for the investment. The Fund normally uses bid evaluations for U.S. Treasury and Agency securities, mortgage-backed securities and municipal securities. The Fund normally uses mid evaluations for other types of fixed-income securities and OTC derivative contracts. In the event that market quotations and price evaluations are not available for an investment, the fair value of the investment is determined in accordance with procedures adopted by the Trustees.
The Trustees also have adopted procedures requiring an investment to be priced at its fair value whenever the Adviser determines that a significant event affecting the value of the investment has occurred between the time as of which the price of the investment would otherwise be determined and the time as of which the NAV is computed. An event is considered significant if there is both an affirmative expectation that the investment's value will change in response to the event and a reasonable basis for quantifying the resulting change in value. Examples of significant events that may occur after the close of the principal market on which a security is traded, or after the time of a price evaluation provided by a pricing service or a dealer, include:
- With respect to securities traded in foreign markets, significant trends in U.S. equity markets or in the trading of foreign securities index futures or options contracts;
- With respect to price evaluations of fixed-income securities determined before the close of regular trading on the NYSE, actions by the Federal Reserve Open Market Committee and other significant trends in U.S. fixed-income markets;
- Political or other developments affecting the economy or markets in which an issuer conducts its operations or its securities are traded; and
- Announcements concerning matters such as acquisitions, recapitalizations, litigation developments, a natural disaster affecting the issuer's operations or regulatory changes or market developments affecting the issuer's industry.
The Trustees have approved the use of a pricing service to determine the fair value of equity securities traded principally in foreign markets when the Adviser determines that there has been a significant trend in the U.S. equity markets or in index futures trading. For other significant events, the Fund may seek to obtain more current quotations or price evaluations from alternative pricing sources. If a reliable alternative pricing source is not available, the Fund will determine the fair value of the investment using another method approved by the Trustees.
Repurchase Agreements
It is the policy of the Fund to require the other party to a repurchase agreement to transfer to the Fund's custodian or sub-custodian eligible securities or cash with a market value (after transaction costs) at least equal to the repurchase price to be paid under the repurchase agreement. The eligible securities are transferred to accounts with the custodian or sub-custodian in which the Fund holds a "securities entitlement" and exercises "control" as those terms are defined in the Uniform Commercial Code. The Fund has established procedures for monitoring the market value of the transferred securities and requiring the transfer of additional eligible securities if necessary to equal at least the repurchase price. These procedures also allow the other party to require securities to be transferred from the account to the extent that their market value exceeds the repurchase price or in exchange for other eligible securities of equivalent market value.
With respect to agreements to repurchase U.S. government securities and cash items, the Fund treats the repurchase agreement as an investment in the underlying securities and not as an obligation of the other party to the repurchase agreement. Other repurchase agreements are treated as obligations of the other party secured by the underlying securities. Nevertheless, the insolvency of the other party or other failure to repurchase the securities may delay the disposition of the underlying securities or cause the Fund to receive less than the full repurchase price. Under the terms of the repurchase agreement, any amounts received by the Fund in excess of the repurchase price and related transaction costs must be remitted to the other party.
The Fund may enter into repurchase agreements in which eligible securities are transferred into joint trading accounts maintained by the custodian or sub-custodian for investment companies and other clients advised by the Fund's adviser and its affiliates. The Fund will participate on a pro rata basis with the other investment companies and clients in its share of the securities transferred under such repurchase agreements and in its share of proceeds from any repurchase or other disposition of such securities.
Investment Income, Expenses and Distributions
Interest income and expenses are accrued daily. Dividend income and distributions to shareholders are recorded on the ex-dividend date. Foreign dividends are recorded on the ex-dividend date or when the Fund is informed of the ex-dividend date. Distributions of net investment income are declared and paid quarterly. Non-cash dividends included in dividend income, if any, are recorded at fair value.
Premium and Discount Amortization
All premiums and discounts on fixed-income securities are amortized/accreted for financial statement purposes.
Federal Taxes
It is the Fund's policy to comply with the Subchapter M provision of the Internal Revenue Code (the "Code") and to distribute to shareholders each year substantially all of its income. Accordingly, no provision for federal income tax is necessary.
When-Issued and Delayed Delivery Transactions
The Fund may engage in when-issued or delayed delivery transactions. The Fund records when-issued securities on the trade date and maintains security positions such that sufficient liquid assets will be available to make payment for the securities purchased. Securities purchased on a when-issued or delayed delivery basis are marked to market daily and begin earning interest on the settlement date. Losses may occur on these transactions due to changes in market conditions or the failure of counterparties to perform under the contract.
Futures Contracts
The Fund purchases stock index futures contracts to manage cashflows, maintain exposure to the S&P MidCap 400 Index and to potentially reduce transaction costs. Upon entering into a stock index futures contract with a broker, the Fund is required to deposit in a segregated account a specified amount of cash or U.S. government securities. Futures contracts are valued daily and unrealized gains or losses are recorded in a "variation margin" account. Daily, the Fund receives from or pays to the broker a specified amount of cash based upon changes in the variation margin account. When a contract is closed, the Fund recognizes a realized gain or loss. Futures contracts have market risks, including the risk that the change in the value of the contract may not correlate with the changes in the value of the underlying securities. For the year ended October 31, 2007, the Fund had net realized gains on futures contracts of $19,085,686.
Futures contracts outstanding at period end are listed after the Fund's portfolio of investments.
Securities Lending
The Fund participates in a securities lending program providing for the lending of equity securities to qualified brokers. The Fund normally receives cash collateral for securities loaned that is invested in an affiliated money market fund or other short-term securities including repurchase agreements. Collateral is maintained at a minimum level of 100% of the market value of investments loaned, plus interest, if applicable. Earnings on collateral are allocated between the securities lending agent, as a fee for its services under the program, and the Fund, according to agreed-upon rates.
As of October 31, 2007, securities subject to this type of arrangement and related collateral were as follows:
Market Value of
Securities Loaned
|
| Market Value
of Collateral
|
$80,516,416
|
| $84,485,855
|
Use of Estimates
The preparation of financial statements in conformity with GAAP requires management to make estimates and assumptions that affect the amounts of assets, liabilities, expenses and revenues reported in the financial statements. Actual results could differ from those estimated.
Other
Investment transactions are accounted for on a trade-date basis. Realized gains and losses from investment transactions are recorded on an identified cost basis.
3. SHARES OF BENEFICIAL INTEREST
The following table summarizes share activity:
Year Ended October 31
|
| 2007
|
|
| 2006
|
|
Shares sold
| | 9,532,339 | | | 11,837,240 | |
Shares issued in connection with the tax-free transfer of assets from Mason Street Index 400 Stock Fund
| | - -- | | | 9,234,480 | |
Shares issued to shareholders in payment of distributions declared
| | 2,863,373 | | | 2,468,422 | |
Shares redeemed
|
| (14,849,745
| )
|
| (12,410,806
| )
|
NET CHANGE RESULTING FROM SHARE TRANSACTIONS
|
| (2,454,033
| )
|
| 11,129,336
|
|
4. FEDERAL TAX INFORMATION
The timing and character of income and capital gain distributions are determined in accordance with income tax regulations, which may differ from GAAP. These differences are due to differing treatments for regulatory settlement proceeds.
For the year ended October 31, 2007, permanent differences identified and reclassified among the components of net assets were as follows:
Increase (Decrease)
|
Paid-In Capital
|
| Accumulated
Net Realized
Gains (Losses)
|
$(44,281)
|
| $44,281
|
Net investment income (loss), net realized gains (losses), and net assets were not affected by this reclassification.
The tax character of distributions as reported on the Statement of Changes in Net Assets for the years ended October 31, 2007 and 2006, was as follows:
|
| 2007
|
| 2006
|
Ordinary income 1
|
| $23,510,251
|
| $19,462,785
|
Long-term capital gains
|
| $48,637,896
|
| $41,927,648
|
1 For tax purposes short-term capital gain distributions are considered ordinary income distributions.
As of October 31, 2007, the components of distributable earnings on a tax basis were as follows:
Undistributed ordinary income
|
| $
| 7,653,981
|
Undistributed long-term capital gain
|
| $
| 111,659,567
|
Net unrealized appreciation
|
| $
| 304,772,392
|
The difference between book-basis and tax-basis net unrealized appreciation/depreciation is attributable in part to differing treatments for the deferral of losses on wash sales.
At October 31, 2007, the cost of investments for federal tax purposes was $1,035,311,588. The net unrealized appreciation of investments for federal tax purposes excluding any unrealized appreciation resulting from futures contracts was $304,772,405. This consists of net unrealized appreciation from investments for those securities having an excess of value over cost of $367,968,708 and net unrealized depreciation from investments for those securities having an excess of cost over value of $63,196,303.
5. MANAGEMENT FEE AND OTHER TRANSACTIONS WITH AFFILIATES
Management Fee
Federated Equity Management Company of Pennsylvania is the Fund's manager (the "Manager"). The management agreement between the Fund and Manager provides for an annual fee equal to 0.40% of the Fund's average daily net assets.
Under the terms of a subadvisory contract between the Manager and BlackRock Investment Management LLC, a wholly owned subsidiary of BlackRock, Inc. (the "Subadvisor"), the Subadvisor receives an annual fee from the Manager equal to 0.030% of the Fund's average daily net assets. Subject to the terms described in the Expense Limitation note, the Manager may voluntarily choose to waive any portion of its fee. The Manager can modify or terminate this voluntary waiver at any time at its sole discretion. For the year ended October 31, 2007, the Manager voluntarily waived $2,443,671 of its fee.
Shareholder Services Fee
The Fund may pay fees (Service Fees) up to 0.25% of the average daily net assets of the Fund's Shares to financial intermediaries or to Federated Shareholder Services Company (FSSC) for providing services to shareholders and maintaining shareholder accounts. Financial intermediaries may include a company affiliated with management of Federated Investors, Inc. Subject to the terms described in the Expense Limitation note, FSSC may voluntarily reimburse the Fund for shareholder services fees. This voluntary reimbursement can be modified or terminated at any time. A financial intermediary affiliated with management of Federated Investors, Inc. received $4,483 of Service Fees for the year ended October 31, 2007. For the year ended October 31, 2007, FSSC did not receive any fees paid by the Fund.
Expense Limitation
The Manager and its affiliate (FSSC) have voluntarily agreed to waive their fees and/or reimburse expenses (as shown in the financial highlights) so that the total operating expenses paid by the Fund (after the voluntary waivers and reimbursements) will not exceed 0.49% for the fiscal year ending October 31, 2008. Although these actions are voluntary, the Manager and its affiliates have agreed not to terminate these waivers and/or reimbursements until after December 31, 2008.
General
Certain of the Officers and Trustees of the Fund are Officers and Directors or Trustees of the above companies.
Transactions with Affiliated Companies
Affiliated holdings are mutual funds which are managed by the Manager or an affiliate of the Manager. The Manager has agreed to reimburse the Fund for certain investment manager fees as a result of transactions in other affiliated mutual funds. For the year ended October 31, 2007, the Manager reimbursed $6,037 in connection with the affiliated mutual fund listed below. Transactions with the affiliated company during the year ended October 31, 2007 are as follows:
Affiliate
|
| Balance of
Shares Held
10/31/2006
|
| Purchases/
Additions
|
| Sales/
Reductions
|
| Balance of
Shares Held
10/31/2007
|
| Value
|
| Dividend
Income
|
Prime Value Obligations Fund, Institutional Shares
|
| - --
|
| 240,056,718
|
| 69,070,895
|
| 170,985,823
|
| $170,985,823
|
| $276,120
|
6. INVESTMENT TRANSACTIONS
Purchases and sales of investments, excluding long-term U.S. government securities and short-term obligations, for the year ended October 31, 2007, were as follows:
Purchases
|
| $
| 190,319,572
|
Sales
|
| $
| 245,050,586
|
7. INTERFUND LENDING
Pursuant to an Exemptive Order issued by the Securities and Exchange Commission (SEC), the Fund, along with other funds advised by subsidiaries of Federated Investors, Inc., may participate in an interfund lending program. This program provides an alternative credit facility allowing the funds to borrow from other participating affiliated funds.
As of October 31, 2007, there were no outstanding loans. During the year ended October 31, 2007, the program was not utilized.
8. LEGAL PROCEEDINGS
Beginning in October 2003, Federated Investors, Inc. and various subsidiaries thereof (including the advisers and distributor for various investment companies, collectively, "Federated"), along with various investment companies sponsored by Federated ("Funds") were named as defendants in several class action lawsuits now pending in the United States District Court for the District of Maryland. The lawsuits were purportedly filed on behalf of people who purchased, owned and/or redeemed shares of Federated-sponsored mutual funds during specified periods beginning November 1, 1998. The suits are generally similar in alleging that Federated engaged in illegal and improper trading practices including market timing and late trading in concert with certain institutional traders, which allegedly caused financial injury to the mutual fund shareholders. These lawsuits began to be filed shortly after Federated's first public announcement that it had received requests for information on shareholder trading activities in the Funds from the SEC, the Office of the New York State Attorney General ("NYAG"), and other authorities. In that regard, on November 28, 2005, Federated announced that it had reached final settlements with the SEC and the NYAG with respect to those matters. As Federated previously reported in 2004, it has already paid approximately $8.0 million to certain funds as determined by an independent consultant. As part of these settlements, Federated agreed to pay for the benefit of fund shareholders additional disgorgement and a civil money penalty in the aggregate amount of an additional $72 million. Federated and various Funds have also been named as defendants in several additional lawsuits, the majority of which are now pending in the United States District Court for the Western District of Pennsylvania, alleging, among other things, excessive advisory and Rule 12b-1 fees. The Board of the Funds has retained the law firm of Dickstein Shapiro LLP to represent the Funds in these lawsuits. Federated and the Funds, and their respective counsel, are reviewing the allegations and intend to defend this litigation. Additional lawsuits based upon similar allegations may be filed in the future. The potential impact of these lawsuits, all of which seek unquantified damages, attorneys' fees and expenses, and future potential similar suits is uncertain. Although we do not believe that these lawsuits will have a material adverse effect on the Funds, there can be no assurance that these suits, the ongoing adverse publicity and/or other developments resulting from the regulatory investigations will not result in increased Fund redemptions, reduced sales of Fund shares, or other adverse consequences for the Funds.
9. RECENT ACCOUNTING PRONOUNCEMENTS
In July 2006, the Financial Accounting Standards Board (FASB) released FASB Interpretation No. 48 "Accounting for Uncertainty in Income Taxes" (FIN 48). FIN 48 provides guidance for how uncertain tax positions should be recognized, measured, presented and disclosed in the financial statements. FIN 48 requires the evaluation of tax positions taken in the course of preparing the Fund's tax returns to determine whether the tax positions are "more-likely-than-not" of being sustained by the applicable tax authority. Tax benefits of positions not deemed to meet the more-likely-than-not threshold would be recorded as a tax expense in the current year. Adoption of FIN 48 is required for fiscal years beginning after December 15, 2006. Recent SEC guidance allows implementing FIN 48 in fund NAV calculations as late as a fund's last NAV calculation in the first required financial statement reporting period. As a result, the Fund will adopt FIN 48 no later than April 30, 2008. At this time, management has concluded that the adoption of FIN 48 is not expected to have a material impact on the Fund's net assets or results of operations.
In addition, in September 2006, FASB released Statement on Financial Accounting Standards No. 157, "Fair Value Measurements" (FAS 157), which is effective for fiscal years beginning after November 15, 2007. FAS 157 defines fair value, establishes a framework for measuring fair value and expands disclosures about fair value measurements. Management is currently evaluating the impact the adoption of FAS 157 will have on the Fund's financial statement disclosures.
10. FEDERAL TAX INFORMATION (UNAUDITED)
For the year ended October 31, 2007, the amount of long-term capital gains designated by the Fund was $48,637,896.
For the fiscal year ended October 31, 2007, 63.63% of total ordinary income (including short-term capital gain) distributions made by the Fund are qualifying dividends which may be subject to a maximum tax rate of 15%, as provided for by the Jobs and Growth Tax Relief Act of 2003. Complete information is reported in conjunction with the reporting of your distributions on Form 1099-DIV.
Of the ordinary income (including short-term capital gain) distributions made by the Fund during the year ended October 31, 2007, 63.62% qualify for the dividend received deduction available to corporate shareholders.
Report of Independent Registered Public Accounting Firm
TO THE BOARD OF TRUSTEES OF FEDERATED INDEX TRUST AND SHAREHOLDERS OF FEDERATED MID-CAP INDEX FUND:
We have audited the accompanying statement of assets and liabilities of Federated Mid-Cap Index Fund (the "Fund") (one of the portfolios constituting Federated Index Trust), including the portfolio of investments, as of October 31, 2007, and the related statement of operations for the year then ended, the statement of changes in net assets for each of the two years in the period then ended, and the financial highlights for each of the five years in the period then ended. These financial statements and financial highlights are the responsibility of the Fund's management. Our responsibility is to express an opinion on these financial statements and financial highlights based on our audits.
We conducted our audits in accordance with the standards of the Public Company Accounting Oversight Board (United States). Those standards require that we plan and perform the audit to obtain reasonable assurance about whether the financial statements and financial highlights are free of material misstatement. We were not engaged to perform an audit of the Fund's internal control over financial reporting. Our audits included consideration of internal control over financial reporting as a basis for designing audit procedures that are appropriate in the circumstances, but not for the purpose of expressing an opinion on the effectiveness of the Fund's internal control over financial reporting. Accordingly, we express no such opinion. An audit also includes examining, on a test basis, evidence supporting the amounts and disclosures in the financial statements and financial highlights, assessing the accounting principles used and significant estimates made by management, and evaluating the overall financial statement presentation. Our procedures included confirmation of securities owned as of October 31, 2007, by correspondence with the custodian and brokers or by other appropriate auditing procedures where replies from brokers were not received. We believe that our audits provide a reasonable basis for our opinion.
In our opinion, the financial statements and financial highlights referred to above present fairly, in all material respects, the financial position of Federated Mid-Cap Index Fund, a portfolio of Federated Index Trust at October 31, 2007, the results of its operations for the year then ended, the changes in its net assets for each of the two years in the period then ended, and the financial highlights for each of the five years in the period then ended, in conformity with U.S. generally accepted accounting principles.
Ernst & Young LLP
Boston, Massachusetts
December 18, 2007
Board of Trustees and Trust Officers
The Board is responsible for managing the Trust's business affairs and for exercising all the Trust's powers except those reserved for the shareholders. The following tables give information about each Board member and the senior officers of the Fund. Where required, the tables separately list Board members who are "interested persons" of the Fund (i.e., "Interested" Board members) and those who are not (i.e., "Independent" Board members). Unless otherwise noted, the address of each person listed is Federated Investors Tower, 1001 Liberty Avenue, Pittsburgh, PA. As of December 31, 2006, the Trust comprised three portfolios, and the Federated Fund Complex consisted of 45 investment companies (comprising 148 portfolios). Unless otherwise noted, each Officer is elected annually. Unless otherwise noted, each Board member oversees all portfolios in the Federated Fund Complex and serves for an indefinite term. The Fund's Statement of Additional Information includes additional information about Trust Trustees and is available, without charge and upon request, by calling 1-800-341-7400.
INTERESTED TRUSTEES BACKGROUND
|
|
|
Name
Birth Date
Address
Positions Held with Trust
Date Service Began
|
| Principal Occupation(s) for Past Five Years,
Other Directorships Held and Previous Position(s)
|
John F. Donahue*
Birth Date: July 28, 1924
TRUSTEE
Began serving: January 1990 | | Principal Occupations: Director or Trustee of the Federated Fund Complex; Chairman and Director, Federated Investors, Inc.; Chairman of the Federated Fund Complex's Executive Committee.
Previous Positions: Chairman of the Federated Fund Complex; Trustee, Federated Investment Management Company; and Chairman and Director, Federated Investment Counseling. |
|
|
|
J. Christopher Donahue*
Birth Date: April 11, 1949
PRESIDENT AND TRUSTEE
Began serving: January 1990 | | Principal Occupations: Principal Executive Officer and President of the Federated Fund Complex; Director or Trustee of some of the Funds in the Federated Fund Complex; President, Chief Executive Officer and Director, Federated Investors, Inc.; Chairman and Trustee, Federated Investment Management Company; Trustee, Federated Investment Counseling; Chairman and Director, Federated Global Investment Management Corp.; Chairman, Federated Equity Management Company of Pennsylvania and Passport Research, Ltd. (Investment advisory subsidiary of Federated); Trustee, Federated Shareholder Services Company; Director, Federated Services Company.
Previous Positions: President, Federated Investment Counseling; President and Chief Executive Officer, Federated Investment Management Company, Federated Global Investment Management Corp. and Passport Research, Ltd. |
|
|
|
|
|
|
Name
Birth Date
Address
Positions Held with Trust
Date Service Began
|
| Principal Occupation(s) for Past Five Years,
Other Directorships Held and Previous Position(s)
|
Lawrence D. Ellis, M.D.*
Birth Date: October 11, 1932
3471 Fifth Avenue
Suite 1111
Pittsburgh, PA
TRUSTEE
Began serving: January 1990 | | Principal Occupations: Director or Trustee of the Federated Fund Complex; Professor of Medicine, University of Pittsburgh; Medical Director, University of Pittsburgh Medical Center Downtown; Hematologist, Oncologist and Internist, University of Pittsburgh Medical Center.
Other Directorships Held: Member, National Board of Trustees, Leukemia Society of America.
Previous Positions: Trustee, University of Pittsburgh; Director, University of Pittsburgh Medical Center. |
|
|
|
* Family relationships and reasons for "interested" status: John F. Donahue is the father of J. Christopher Donahue; both are "interested" due to the positions they hold with Federated Investors, Inc. and its subsidiaries. Lawrence D. Ellis, M.D. is "interested" because his son-in-law is employed by the Fund's principal underwriter, Federated Securities Corp.
INDEPENDENT TRUSTEES BACKGROUND
|
|
|
Name
Birth Date
Address
Positions Held with Trust
Date Service Began
|
| Principal Occupation(s) for Past Five Years,
Other Directorships Held and Previous Position(s)
|
Thomas G. Bigley
Birth Date: February 3, 1934
15 Old Timber Trail
Pittsburgh, PA
TRUSTEE
Began serving: October 1995 | | Principal Occupation: Director or Trustee of the Federated Fund Complex.
Other Directorships Held: Director, Member of Executive Committee, Children's Hospital of Pittsburgh; Director, University of Pittsburgh.
Previous Position: Senior Partner, Ernst & Young LLP. |
|
|
|
John T. Conroy, Jr.
Birth Date: June 23, 1937
Investment Properties Corporation
3838 North Tamiami Trail
Suite 402
Naples, FL
TRUSTEE
Began serving: August 1991 | | Principal Occupations: Director or Trustee of the Federated Fund Complex; Chairman of the Board, Investment Properties Corporation; Partner or Trustee in private real estate ventures in Southwest Florida.
Previous Positions: President, Investment Properties Corporation; Senior Vice President, John R. Wood and Associates, Inc., Realtors; President, Naples Property Management, Inc. and Northgate Village Development Corporation. |
|
|
|
Nicholas P. Constantakis
Birth Date: September 3, 1939
175 Woodshire Drive
Pittsburgh, PA
TRUSTEE
Began serving: February 1998 | | Principal Occupation: Director or Trustee of the Federated Fund Complex.
Other Directorships Held: Director and Member of the Audit Committee, Michael Baker Corporation (engineering and energy services worldwide).
Previous Position: Partner, Andersen Worldwide SC. |
|
|
|
|
|
|
Name
Birth Date
Address
Positions Held with Trust
Date Service Began
|
| Principal Occupation(s) for Past Five Years,
Other Directorships Held and Previous Position(s)
|
John F. Cunningham
Birth Date: March 5, 1943
353 El Brillo Way
Palm Beach, FL
TRUSTEE
Began serving: January 1999 | | Principal Occupations: Director or Trustee of the Federated Fund Complex; Director, QSGI, Inc. (technology services company).
Other Directorships Held: Chairman, President and Chief Executive Officer, Cunningham & Co., Inc. (strategic business consulting); Trustee Associate, Boston College.
Previous Positions: Director, Redgate Communications and EMC Corporation (computer storage systems); Chairman of the Board and Chief Executive Officer, Computer Consoles, Inc.; President and Chief Operating Officer, Wang Laboratories; Director, First National Bank of Boston; Director, Apollo Computer, Inc. |
|
|
|
Peter E. Madden
Birth Date: March 16, 1942
One Royal Palm Way
100 Royal Palm Way
Palm Beach, FL
TRUSTEE
Began serving: August 1991 | | Principal Occupation: Director or Trustee of the Federated Fund Complex.
Other Directorships Held: Board of Overseers, Babson College.
Previous Positions: Representative, Commonwealth of Massachusetts General Court; President, State Street Bank and Trust Company and State Street Corporation (retired); Director, VISA USA and VISA International; Chairman and Director, Massachusetts Bankers Association; Director, Depository Trust Corporation; Director, The Boston Stock Exchange. |
|
|
|
Charles F. Mansfield, Jr.
Birth Date: April 10, 1945
80 South Road
Westhampton Beach, NY
TRUSTEE
Began serving: January 1999 | | Principal Occupations: Director or Trustee of the Federated Fund Complex; Management Consultant.
Previous Positions: Chief Executive Officer, PBTC International Bank; Partner, Arthur Young & Company (now Ernst & Young LLP); Chief Financial Officer of Retail Banking Sector, Chase Manhattan Bank; Senior Vice President, HSBC Bank USA (formerly, Marine Midland Bank); Vice President, Citibank; Assistant Professor of Banking and Finance, Frank G. Zarb School of Business, Hofstra University; Executive Vice President DVC Group, Inc. (marketing, communications and technology). |
|
|
|
John E. Murray, Jr., J.D., S.J.D.
Birth Date: December 20, 1932
Chancellor, Duquesne University
Pittsburgh, PA
TRUSTEE
Began serving: February 1995 | | Principal Occupations: Director or Trustee, and Chairman of the Board of Directors or Trustees, of the Federated Fund Complex; Chancellor and Law Professor, Duquesne University; Partner, Murray, Hogue & Lannis.
Other Directorships Held: Director, Michael Baker Corp. (engineering, construction, operations and technical services).
Previous Positions: President, Duquesne University; Dean and Professor of Law, University of Pittsburgh School of Law; Dean and Professor of Law, Villanova University School of Law. |
|
|
|
|
|
|
Name
Birth Date
Address
Positions Held with Trust
Date Service Began
|
| Principal Occupation(s) for Past Five Years,
Other Directorships Held and Previous Position(s)
|
Thomas M. O'Neill
Birth Date: June 14, 1951
95 Standish Street
P.O. Box 2779
Duxbury, MA
TRUSTEE
Began serving: October 2006 | | Principal Occupations: Director or Trustee of the Federated Fund Complex; Managing Director and Partner, Navigator Management Company, L.P. (investment and strategic consulting).
Other Directorships Held: Director, Midway Pacific (lumber); Board of Overseers, Children's Hospital of Boston; Visiting Committee on Athletics, Harvard College.
Previous Positions: Chief Executive Officer and President, Managing Director and Chief Investment Officer, Fleet Investment Advisors; President and Chief Executive Officer, Aeltus Investment Management, Inc.; General Partner, Hellman, Jordan Management Co., Boston, MA; Chief Investment Officer, The Putnam Companies, Boston, MA; and Credit Analyst and Lending Officer, Fleet Bank. |
|
|
|
Marjorie P. Smuts
Birth Date: June 21, 1935
4905 Bayard Street
Pittsburgh, PA
TRUSTEE
Began serving: January 1990 | | Principal Occupation: Director or Trustee of the Federated Fund Complex.
Previous Positions: Public Relations/Marketing Consultant/Conference Coordinator; National Spokesperson, Aluminum Company of America; television producer; President, Marj Palmer Assoc.; Owner, Scandia Bord. |
|
|
|
John S. Walsh
Birth Date: November 28, 1957
2604 William Drive
Valparaiso, IN
TRUSTEE
Began serving: January 1999 | | Principal Occupations: Director or Trustee of the Federated Fund Complex; President and Director, Heat Wagon, Inc. (manufacturer of construction temporary heaters); President and Director, Manufacturers Products, Inc. (distributor of portable construction heaters); President, Portable Heater Parts, a division of Manufacturers Products, Inc.
Previous Position: Vice President, Walsh & Kelly, Inc. |
|
|
|
James F. Will
Birth Date: October 12, 1938
721 E. McMurray Road
McMurray, PA
TRUSTEE
Began serving: April 2006 | | Principal Occupations: Director or Trustee of the Federated Fund Complex; Prior to June 2006, Vice Chancellor and President, Saint Vincent College.
Other Directorships Held: Trustee, Saint Vincent College; Alleghany Corporation.
Previous Positions: Chairman, President and Chief Executive Officer, Armco, Inc.; President and Chief Executive Officer, Cyclops Industries; President and Chief Operating Officer, Kaiser Steel Corporation. |
|
|
|
OFFICERS
|
|
|
Name
Birth Date
Positions Held with Trust
Date Service Began
|
| Principal Occupation(s) for Past Five Years and Previous Position(s)
|
John W. McGonigle
Birth Date: October 26, 1938
EXECUTIVE VICE PRESIDENT
AND SECRETARY
Began serving: February 1990 | | Principal Occupations: Executive Vice President and Secretary of the Federated Fund Complex; Vice Chairman, Executive Vice President, Secretary and Director, Federated Investors, Inc.
Previous Positions: Trustee, Federated Investment Management Company and Federated Investment Counseling; Director, Federated Global Investment Management Corp., Federated Services Company and Federated Securities Corp. |
|
|
|
Richard A. Novak
Birth Date: December 25, 1963
TREASURER
Began serving: January 2006 | | Principal Occupations: Principal Financial Officer and Treasurer of the Federated Fund Complex; Senior Vice President, Federated Administrative Services; Financial and Operations Principal for Federated Securities Corp., Edgewood Services, Inc. and Southpointe Distribution Services, Inc.
Previous Positions: Controller of Federated Investors, Inc.; Vice President, Finance of Federated Services Company; held various financial management positions within The Mercy Hospital of Pittsburgh; Auditor, Arthur Andersen & Co. |
|
|
|
Richard B. Fisher
Birth Date: May 17, 1923
TREASURER
Began serving: February 1990 | | Principal Occupations: Vice Chairman or Vice President of some of the Funds in the Federated Fund Complex; Vice Chairman, Federated Investors, Inc.; Chairman, Federated Securities Corp.
Previous Positions: President and Director or Trustee of some of the Funds in the Federated Fund Complex; Executive Vice President, Federated Investors, Inc. and Director and Chief Executive Officer, Federated Securities Corp. |
|
|
|
Brian P. Bouda
Birth Date: February 28, 1947
SENIOR VICE PRESIDENT
Began serving: January 2006 | | Principal Occupations: Senior Vice President and Chief Compliance Officer of the Federated Fund Complex; Vice President and Chief Compliance Officer of Federated Investors, Inc.; and Chief Compliance Officer of its subsidiaries. Mr. Bouda joined Federated in 1999 and is a member of the American Bar Association and the State Bar Association of Wisconsin. |
|
|
|
Stephen F. Auth
Birth Date: September 3, 1956
CHIEF INVESTMENT OFFICER
Began serving: November 2002 | | Principal Occupations: Chief Investment Officer of this Fund and various other Funds in the Federated Fund Complex; Executive Vice President, Federated Investment Counseling, Federated Global Investment Management Corp. and Federated Equity Management Company of Pennsylvania.
Previous Positions: Executive Vice President, Federated Investment Management Company, and Passport Research, Ltd. (Investment advisory subsidiary of Federated); Senior Vice President, Global Portfolio Management Services Division; Senior Vice President, Federated Investment Management Company and Passport Research, Ltd.; Senior Managing Director and Portfolio Manager, Prudential Investments. |
|
|
|
Evaluation and Approval of Advisory Contract
FEDERATED MID-CAP INDEX FUND (THE "FUND")
The Fund's Board reviewed the Fund's investment advisory and subadvisory contracts at meetings held in May 2007. The Board's decision regarding these contracts reflects the exercise of its business judgment on whether to continue the existing arrangements.
In this connection, the Federated funds had previously appointed a Senior Officer, whose duties include specified responsibilities relating to the process by which advisory fees are to be charged to a Federated fund. The Senior Officer has the authority to retain consultants, experts, or staff as may be reasonably necessary to assist in the performance of his duties, reports directly to the Board, and may be terminated only with the approval of a majority of the independent members of the Board. The Senior Officer prepared and furnished to the Board an independent written evaluation that covered topics discussed below. The Board considered that evaluation, along with other information, in deciding to approve the advisory and subadvisory contracts.
During its review of these contracts, the Board considered compensation and benefits received by the Adviser and subadviser. This included the fees received for services provided to the Fund by other entities in the Federated organization and research services (if any) received by the Adviser and subadviser from brokers that execute Federated fund trades, as well as advisory fees. The Board is also familiar with and considered judicial decisions concerning allegedly excessive investment advisory fees which have indicated that the following factors may be relevant to an Adviser's fiduciary duty with respect to its receipt of compensation from a fund: the nature and quality of the services provided by the Adviser, including the performance of the Fund; the Adviser's cost of providing the services; the extent to which the Adviser may realize "economies of scale" as the Fund grows larger; any indirect benefits that may accrue to the Adviser and its affiliates as a result of the Adviser's relationship with the Fund; performance and expenses of comparable funds; and the extent to which the independent Board members are fully informed about all facts the Board deems relevant bearing on the Adviser's services and fees. The Board further considered management fees (including any components thereof) charged to institutional and other clients of the Adviser for what might be viewed as like services, and costs to the Adviser and its affiliates of supplying services pursuant to the management fee agreements, excluding any intra-corporate profit and profit margins of the Adviser and its affiliates from supplying such services. The Board was aware of these factors and was guided by them in its review of the Fund's advisory and subadvisory contracts to the extent it considered them to be appropriate and relevant, as discussed further below.
The Board considered and weighed these circumstances in light of its substantial accumulated experience in governing the Fund and working with Federated on matters relating to the Federated funds, and was assisted in its deliberations by the advice of independent legal counsel. Throughout the year, the Board has requested and received substantial and detailed information about the Fund and the Federated organization that was in addition to the extensive materials that comprise and accompany the Senior Officer's evaluation. Federated provided much of this information at each regular meeting of the Board, and furnished additional reports in connection with the particular meeting at which the Board's formal review of the advisory and subadvisory contracts occurred. Between regularly scheduled meetings, the Board also received information on particular matters as the need arose. Thus, the Board's consideration of the advisory and subadvisory contracts included review of the Senior Officer's evaluation, accompanying data and additional reports covering such matters as: the Adviser's profitability, and the Adviser's and subadviser's investment philosophy, revenue, personnel and processes; investment and operating strategies; the Fund's short- and long-term performance (in absolute terms, both on a gross basis and net of expenses, as well as in relationship to its particular investment program and certain competitor or "peer group" funds and/or other benchmarks, as appropriate), and comments on the reasons for performance; the Fund's investment objectives; the Fund's expenses (including the advisory fee itself and the overall expense structure of the Fund, both in absolute terms and relative to similar and/or competing funds, with due regard for contractual or voluntary expense limitations); the use and allocation of brokerage commissions derived from trading the Fund's portfolio securities (if any); and the nature, quality and extent of the advisory and other services provided to the Fund by the Adviser, the subadviser, and their affiliates. The Board also considered the preferences and expectations of Fund shareholders and their relative sophistication; the continuing state of competition in the mutual fund industry and market practices; the range of comparable fees for similar funds in the mutual fund industry; the Fund's relationship to the Federated family of funds which include a comprehensive array of funds with different investment objectives, policies and strategies which are available for exchange without the incurrence of additional sales charges; compliance and audit reports concerning the Federated funds, the Federated companies that service them, and the subadviser (including communications from regulatory agencies), as well as Federated's and/or the subadviser's responses to any issues raised therein; and relevant developments in the mutual fund industry and how the Federated funds and/or Federated are responding to them. The Board's evaluation process is evolutionary. The criteria considered and the emphasis placed on relevant criteria change in recognition of changing circumstances in the mutual fund marketplace.
With respect to the Fund's performance and expenses in particular, the Board has found the use of comparisons to other mutual funds with comparable investment programs to be particularly useful, given the high degree of competition in the mutual fund business. The Board focused on comparisons with other similar mutual funds more heavily than non-mutual fund products or services because, simply put, they are more relevant. For example, other mutual funds are the products most like the Fund, they are readily available to Fund shareholders as alternative investment vehicles, and they are the type of investment vehicle in fact chosen and maintained by the Fund's investors. The range of their fees and expenses therefore appears to be a generally reliable indication of what consumers have found to be reasonable in the precise marketplace in which the Fund competes. The Fund's ability to deliver competitive performance when compared to its peer group was a useful indicator of how the Adviser and subadviser are executing the Fund's investment program, which in turn assisted the Board in reaching a conclusion that the nature, extent, and quality of the Adviser's and subadviser's investment management services were such as to warrant continuation of the advisory and subadvisory contracts. In this regard, the Senior Officer has reviewed Federated's fees for providing advisory services to products outside the Federated family of funds (e.g., institutional and separate accounts). He concluded that mutual funds and institutional accounts are inherently different products. Those differences included, but are not limited to targeting different investors, being subject to different laws and regulations, different legal structure, distribution costs, average account size and portfolio management techniques made necessary by different cash flows. The Senior Officer did not consider these fee schedules to be significant in determining the appropriateness of mutual fund advisory contracts.
The Senior Officer reviewed reports compiled by Federated, using data supplied by independent fund ranking organizations, regarding the performance of, and fees charged by, other mutual funds, noting his view that comparisons to fund peer groups are highly important in judging the reasonableness of proposed fees.
The Fund's performance fell below the median of the relevant peer group for both the one and three year periods ending December 31, 2006. The Board discussed the Fund's performance with the Adviser and recognized the efforts being undertaken by the Adviser and subadviser. The Board will continue to monitor these efforts and the performance of the Fund.
The Board also received financial information about Federated, including reports on the compensation and benefits Federated derived from its relationships with the Federated funds. These reports covered not only the fees under the advisory contracts, but also fees received by Federated's subsidiaries for providing other services to the Federated funds under separate contracts (e.g., for serving as the Federated funds' administrator). The reports also discussed any indirect benefit Federated may derive from its receipt of research services from brokers who execute Federated fund trades. In addition, the Board considered the fact that, in order for a fund to be competitive in the marketplace, Federated and its affiliates frequently waived fees and/or reimbursed expenses and have disclosed to fund investors and/or indicated to the Board their intention to do so in the future, where appropriate. The Board also received financial information about the subadviser, as well as reports that discussed any indirect benefit the subadviser may derive from its receipt of research services from brokers who execute Fund trades.
Federated furnished reports, requested by the Senior Officer, that reported revenues on a fund by fund basis and made estimates of the allocation of expenses on a fund by fund basis, using allocation methodologies specified by the Senior Officer. The Senior Officer noted that, although they may apply consistent allocation processes, the inherent difficulties in allocating costs (and the unavoidable arbitrary aspects of that exercise) and the lack of consensus on how to allocate those costs may render such allocation reports unreliable. The allocation reports were considered in the analysis by the Board but were determined to be of limited use.
The Board and the Senior Officer also reviewed a report compiled by Federated comparing profitability information for Federated to other publicly held fund management companies. In this regard, the Senior Officer noted the limited availability of such information, but nonetheless concluded that Federated's profit margins did not appear to be excessive and the Board agreed. With respect to the subadviser, the Board noted that it had reviewed relevant information, and initially approved the current subadvisory contract, at meetings held in August 2006, in contemplation of the impending combination of the asset management businesses of the Fund's former subadviser with another asset management firm. The combination took place in the latter part of 2006. In connection with the Board's present review, the subadviser had informed the Board that it was still in the process of implementing post-merger changes to relevant accounting systems, and that this is affecting its cost allocation capabilities. Consequently, the subadviser was unable to furnish profitability information for the Board's consideration at the May 2007 meetings, but undertook to provide the 2006 profitability information with respect to the Fund for consideration at a Board meeting later in 2007.
The Senior Officer's evaluation also discussed the notion of possible realization of "economies of scale" as a fund grows larger. The Board considered in this regard that the Adviser has made significant additional investments in areas such as personnel and processes for the portfolio management, compliance, and risk management functions; distribution efforts; and systems technology; that support all of the Federated funds, and that the benefits of these efforts (as well as any economies, should they exist) were likely to be enjoyed by the fund complex as a whole. Finally, the Board also noted the absence of any applicable regulatory or industry guidelines on this subject, which (as discussed in independently prepared materials included in the Senior Officer's evaluation) is compounded by the lack of any common industry practice or general pattern with respect to structuring fund advisory fees with "breakpoints" that serve to reduce the fee as the fund attains a certain size. The Senior Officer did not recommend institution of breakpoints in pricing Federated's fund advisory services at this time.
For the Fund's most recently completed fiscal year, the Fund's investment advisory fee after waivers and expense reimbursements, if any, was above the median of the relevant peer group. The Board reviewed the fees and other expenses of the Fund with the Adviser and was satisfied that the overall expense structure of the Fund remained competitive. The Board will continue to monitor advisory fees and other expenses borne by the Fund.
The Senior Officer's evaluation noted his belief that the information and observations contained in his evaluation supported his finding that the proposed management fees are reasonable, and that Federated appeared to provide appropriate administrative services to the Fund for the fees paid. Under these circumstances, no changes were recommended to, and no objection was raised to the continuation of the Fund's advisory and subadvisory contracts. For 2006, the Board concluded that the nature, quality and scope of services provided the Fund by the Adviser and its affiliates, and by the subadviser, were satisfactory.
In its decision to continue an existing investment advisory contract, the Board was mindful of the potential disruptions of the Fund's operations and various risks, uncertainties and other effects that could occur as a result of a decision to terminate or not renew an advisory contract. In particular, the Board recognized that most shareholders have invested in the Fund on the strength of the Adviser's industry standing and reputation and in the expectation that the Adviser will have a continuing role in providing advisory services to the Fund. Thus, the Board's approval of the advisory contract reflected the fact that it is the shareholders who have effectively selected the Adviser by virtue of having invested in the Fund.
The Board based its decision to approve the advisory and subadvisory contracts on the totality of the circumstances and relevant factors and with a view to past and future long-term considerations. Not all of the factors and considerations identified above were necessarily relevant to the Fund, nor did the Board consider any one of them to be determinative. With respect to the factors that were relevant, the Board's decision to approve the contract reflects its determination that Federated's performance and actions provided a satisfactory basis to support the decision to continue the existing arrangements.
Voting Proxies on Fund Portfolio Securities
A description of the policies and procedures that the Fund uses to determine how to vote proxies, if any, relating to securities held in the Fund's portfolio is available, without charge and upon request, by calling 1-800-341-7400. A report on "Form N-PX" of how the Fund voted any such proxies during the most recent 12-month period ended June 30 is available from Federated's website at FederatedInvestors.com. To access this information from the "Products" section of the website, click on the "Prospectuses and Regulatory Reports" link under "Related Information," then select the appropriate link opposite the name of the Fund; or select the name of the Fund and from the Fund's page, click on the "Prospectuses and Regulatory Reports" link. Form N-PX filings are also available at the SEC's website at www.sec.gov.
Quarterly Portfolio Schedule
The Fund files with the SEC a complete schedule of its portfolio holdings, as of the close of the first and third quarters of its fiscal year, on "Form N-Q." These filings are available on the SEC's website at www.sec.gov and may be reviewed and copied at the SEC's Public Reference Room in Washington, DC. (Call 1-800-SEC-0330 for information on the operation of the Public Reference Room.) You may also access this information from the "Products" section of Federated's website at FederatedInvestors.com by clicking on "Portfolio Holdings" under "Related Information," then selecting the appropriate link opposite the name of the Fund; or select the name of the Fund and from the Fund's page, click on the "Portfolio Holdings" link.
Mutual funds are not bank deposits or obligations, are not guaranteed by any bank, and are not insured or guaranteed by the U.S. government, the Federal Deposit Insurance Corporation, the Federal Reserve Board, or any other government agency. Investment in mutual funds involves investment risk, including the possible loss of principal.
This report is authorized for distribution to prospective investors only when preceded or accompanied by the Fund's prospectus, which contains facts concerning its objective and policies, management fees, expenses and other information.
Federated
World-Class Investment Manager
Federated Mid-Cap Index Fund
Federated Investors Funds
5800 Corporate Drive
Pittsburgh, PA 15237-7000
Contact us at FederatedInvestors.com
or call 1-800-341-7400.
Federated Securities Corp., Distributor
Cusip 31420E205
29455 (12/07)
Federated is a registered mark of Federated Investors, Inc. 2007 (c)Federated Investors, Inc.
Federated
World-Class Investment Manager
Federated Mini-Cap Index Fund
A Portfolio of Federated Index Trust
ANNUAL SHAREHOLDER REPORT
October 31, 2007
Institutional Shares
Class C Shares
FINANCIAL HIGHLIGHTS
SHAREHOLDER EXPENSE EXAMPLE
MANAGEMENT'S DISCUSSION OF FUND PERFORMANCE
PORTFOLIO OF INVESTMENTS SUMMARY TABLE
PORTFOLIO OF INVESTMENTS
STATEMENT OF ASSETS AND LIABILITIES
STATEMENT OF OPERATIONS
STATEMENT OF CHANGES IN NET ASSETS
NOTES TO FINANCIAL STATEMENTS
REPORT OF INDEPENDENT REGISTERED PUBLIC ACCOUNTING FIRM
BOARD OF TRUSTEES AND TRUST OFFICERS
EVALUATION AND APPROVAL OF ADVISORY CONTRACT
VOTING PROXIES ON FUND PORTFOLIO SECURITIES
QUARTERLY PORTFOLIO SCHEDULE
Not FDIC Insured * May Lose Value * No Bank Guarantee
Financial Highlights - Institutional Shares
(For a Share Outstanding Throughout Each Period)
Year Ended October 31
|
| 2007
|
|
| 2006
|
|
| 2005
|
|
| 2004
|
|
| 2003
|
|
Net Asset Value, Beginning of Period
| | $17.85 | | | $15.58 | | | $14.06 | | | $12.65 | | | $8.95 | |
Income From Investment Operations:
| | | | | | | | | | | | | | | |
Net investment income
| | 0.13 | 1 | | 0.10 | 1 | | 0.06 | 1 | | 0.02 | | | 0.04 | |
Net realized and unrealized gain on investments and futures contracts
|
| 1.20
|
|
| 2.81
|
|
| 1.48
|
|
| 1.40
|
|
| 3.70
|
|
TOTAL FROM INVESTMENT OPERATIONS
|
| 1.33
|
|
| 2.91
|
|
| 1.54
|
|
| 1.42
|
|
| 3.74
|
|
Less Distributions:
| | | | | | | | | | | | | | | |
Distributions from net investment income
| | (0.11 | ) | | (0.03 | ) | | (0.02 | ) | | (0.01 | ) | | (0.04 | ) |
Distributions from net realized gain on investments and futures contracts
|
| (1.98
| )
|
| (0.61
| )
|
| - --
|
|
| - --
|
|
| - --
|
|
TOTAL DISTRIBUTIONS
|
| (2.09
| )
|
| (0.64
| )
|
| (0.02
| )
|
| (0.01
| )
|
| (0.04
| )
|
Net Asset Value, End of Period
|
| $17.09
|
|
| $17.85
|
|
| $15.58
|
|
| $14.06
|
|
| $12.65
|
|
Total Return 2
|
| 8.31
| %
|
| 19.24
| %
|
| 10.95
| %
|
| 11.20
| % 3
|
| 41.96
| %
|
| | | | | | | | | | | | | | | |
Ratios to Average Net Assets:
|
|
|
|
|
|
|
|
|
|
|
|
|
|
|
|
Net expenses
|
| 0.93
| %
|
| 0.91
| %
|
| 0.91
| %
|
| 0.91
| %
|
| 0.89
| %
|
Net investment income
|
| 0.77
| %
|
| 0.60
| %
|
| 0.40
| %
|
| 0.16
| %
|
| 0.41
| %
|
Expense waiver/reimbursement 4
|
| 0.23
| %
|
| 0.29
| %
|
| 0.25
| %
|
| 0.23
| %
|
| 0.44
| %
|
Supplemental Data:
|
|
|
|
|
|
|
|
|
|
|
|
|
|
|
|
Net assets, end of period (000 omitted)
|
| $81,091
|
| $88,669
|
| $79,665
|
| $90,937
|
| $89,785
|
|
Portfolio turnover
|
| 15
| %
|
| 22
| %
|
| 20
| %
|
| 27
| %
|
| 48
| %
|
1 Per share numbers have been calculated using the average shares method.
2 Based on net asset value, which does not reflect the sales charge, redemption fee, or contingent deferred sales charge, if applicable.
3 During the period, the Fund was reimbursed by the Manager, which had an impact of 0.24% on the total return.
4 This expense decrease is reflected in both the net expense and the net investment income ratios shown above.
See Notes which are an integral part of the Financial Statements
Financial Highlights-Class C Shares
(For a Share Outstanding Throughout Each Period)
Year Ended October 31
|
| 2007
|
|
| 2006
|
|
| 2005
|
|
| 2004
|
|
| 2003
|
|
Net Asset Value, Beginning of Period
| | $17.19 | | | $15.12 | | | $13.73 | | | $12.47 | | | $8.85 | |
Income From Investment Operations:
| | | | | | | | | | | | | | | |
Net investment income (loss)
| | (0.02 | ) 1 | | (0.03 | ) 1 | | (0.06 | ) 1 | | (0.08 | ) | | (0.03 | ) |
Net realized and unrealized gain on investments and futures contracts
|
| 1.16
|
|
| 2.71
|
|
| 1.45
|
|
| 1.34
|
|
| 3.65
|
|
TOTAL FROM INVESTMENT OPERATIONS
|
| 1.14
|
|
| 2.68
|
|
| 1.39
|
|
| 1.26
|
|
| 3.62
|
|
Less Distributions:
| | | | | | | | | | | | | | | |
Distributions from net realized gain on investments and futures contracts
|
| (1.98
| )
|
| (0.61
| )
|
| - --
|
|
| - --
|
|
| - --
|
|
Net Asset Value, End of Period
|
| $16.35
|
|
| $17.19
|
|
| $15.12
|
|
| $13.73
|
|
| $12.47
|
|
Total Return 2
|
| 7.39
| %
|
| 18.23
| %
|
| 10.12
| %
|
| 10.10
| % 3
|
| 40.90
| %
|
| | | | | | | | | | | | | | | |
Ratios to Average Net Assets:
|
|
|
|
|
|
|
|
|
|
|
|
|
|
|
|
Net expenses
|
| 1.81
| %
|
| 1.72
| %
|
| 1.72
| %
|
| 1.79
| %
|
| 1.77
| %
|
Net investment income (loss)
|
| (0.11
| )%
|
| (0.20
| )%
|
| (0.41
| )%
|
| (0.72
| )%
|
| (0.47
| )%
|
Expense waiver/reimbursement 4
|
| 0.13
| %
|
| 0.20
| %
|
| 0.15
| %
|
| 0.10
| %
|
| 0.31
| %
|
Supplemental Data:
|
|
|
|
|
|
|
|
|
|
|
|
|
|
|
|
Net assets, end of period (000 omitted)
|
| $20,968
|
| $19,577
|
| $14,232
|
| $10,473
|
| $8,643
|
|
Portfolio turnover
|
| 15
| %
|
| 22
| %
|
| 20
| %
|
| 27
| %
|
| 48
| %
|
1 Per share numbers have been calculated using the average shares method.
2 Based on net asset value, which does not reflect the sales charge, redemption fee, or contingent deferred sales charge, if applicable.
3 During the period, the Fund was reimbursed by the Manager, which had an impact of 0.16% on the total return.
4 This expense decrease is reflected in both the net expense and the net investment income (loss) ratios shown above.
See Notes which are an integral part of the Financial Statements
Shareholder Expense Example
As a shareholder of the Fund, you incur two types of costs: (1) transaction costs, including sales charges (loads) on purchase or redemption payments; and (2) ongoing costs, including management fees and to the extent applicable, distribution (12b-1) fees and/or shareholder service fees and other Fund expenses. This Example is intended to help you to understand your ongoing costs (in dollars) of investing in the Fund and to compare these costs with the ongoing costs of investing in other mutual funds. It is based on an investment of $1,000 invested at the beginning of the period and held for the entire period from May 1, 2007 to October 31, 2007.
ACTUAL EXPENSES
The first section of the table below provides information about actual account values and actual expenses. You may use the information in this section, together with the amount you invested, to estimate the expenses that you incurred over the period. Simply divide your account value by $1,000 (for example, an $8,600 account value divided by $1,000 = 8.6), then multiply the result by the number in the first section under the heading entitled "Expenses Paid During Period" to estimate the expenses attributable to your investment during this period.
HYPOTHETICAL EXAMPLE FOR COMPARISON PURPOSES
The second section of the table below provides information about hypothetical account values and hypothetical expenses based on the Fund's actual expense ratio and an assumed rate of return of 5% per year before expenses, which is not the Fund's actual return. Thus, you should not use the hypothetical account values and expenses to estimate the actual ending account balance or your expenses for the period. Rather, these figures are required to be provided to enable you to compare the ongoing costs of investing in the Fund with other funds. To do so, compare this 5% hypothetical example with the 5% hypothetical examples that appear in the shareholder reports of the other funds.
Please note that the expenses shown in the table are meant to highlight your ongoing costs only and do not reflect any transaction costs, such as sales charges (loads) on purchase or redemption payments. Therefore, the second section of the table is useful in comparing ongoing costs only, and will not help you determine the relative total costs of owning different funds. In addition, if these transaction costs were included, your costs would have been higher.
|
| Beginning
Account Value
5/1/2007
|
| Ending
Account Value
10/31/2007
|
| Expenses Paid
During Period 1
|
Actual:
|
|
|
|
|
|
|
Institutional Shares
|
| $1,000
|
| $1,017.30
|
| $4.78
|
Class C Shares
|
| $1,000
|
| $1,013.00
|
| $9.18
|
Hypothetical (assuming a 5% return before expenses):
|
|
|
|
|
|
|
Institutional Shares
|
| $1,000
|
| $1,020.47
|
| $4.79
|
Class C Shares
|
| $1,000
|
| $1,016.08
|
| $9.20
|
1 Expenses are equal to the Fund's annualized net expense ratios, multiplied by the average account value over the period, multiplied by 184/365 (to reflect the one-half year period). The annualized net expense ratios are as follows:
Institutional Shares
|
| 0.94%
|
Class C Shares
|
| 1.81%
|
Management's Discussion of Fund Performance
The Federated Mini-Cap Index Fund's Institutional Shares produced a total return of 8.31% while the Fund's Class C Shares produced a total return of 7.39%, based on net asset value, during the 12-month period ended October 31, 2007. The Fund's benchmark, the Russell 2000 ® Index (RUS2), 1 returned 9.27% during the 12-month reporting period. The Fund's total return for the fiscal year reflected actual cash flows, transaction costs and other expenses, which were not reflected in the total return of the benchmark.
The RUS2 had positive returns in the first half of the reporting period, advancing 6.86% between November 1, 2006 and April 30, 2007. The RUS2 fell 4.44% during the Fund's fiscal third quarter, May 1 to July 31, 2007, before rebounding with a 7.01% gain in the last three months of the reporting period.
Nine of the ten sectors 2 in the RUS2 recorded gains for the reporting period, led by materials, returning 41.6%, energy, returning 21.2%, telecommunication services, returning 20.5% and information technology, returning 18.4%. The strongest performers among individual stocks were CF Industries Holdings, Inc. (in the materials sector), aQuantive, Inc. (consumer discretionary), AK Steel Holding Corp. and Terra Industries, Inc. (both in the materials sector), and Flir Systems, Inc. (information technology).
The Fund utilized RUS2 futures to provide equity exposure on the Fund's cash balances. While over the long-term RUS2 futures should mirror the performance of the RUS2, pricing disparity can appear in the short term and the Fund may benefit from or be harmed by trading futures instead of stocks when money goes in and out of the Fund. During the reporting period, the Fund benefited from its trading of futures contracts.
1 The RUS2 measures the performance of the 2,000 smallest companies in the Russell 3000 Index, which represents approximately 8% of the total market capitalization of the Russell 3000 Index. The index is unmanaged, and investments cannot be made in an index. The Russell 2000 Index is a trademark/service mark for the Frank Russell Company. The Fund is neither affiliated with, nor promoted, sponsored or endorsed by the Frank Russell Company. Frank Russell's only relationship to the Fund is the licensing of the use of the Index. Frank Russell Company is owner of the trademarks and copyrights relating to the Index.
2 Sector classifications are based upon the classification of the Standard & Poor's Global Industry Classification Standard (SPGIC).
GROWTH OF A $25,000 INVESTMENT - INSTITUTIONAL SHARES
The graph below illustrates the hypothetical investment of $25,000 1 in the Federated Mini-Cap Index Fund (Institutional Shares) (the "Fund") from October 31, 1997 to October 31, 2007, compared to the Russell 2000 Index (RUS2) 2 ..
Average Annual Total Returns for the Period Ended 10/31/2007
|
|
|
1 Year
|
| 8.31%
|
5 Years
|
| 17.73%
|
10 Years
|
| 6.72%
|

Performance data quoted represents past performance which is no guarantee of future results. Investment return and principal value will fluctuate so that an investor's shares, when redeemed, may be worth more or less than their original cost. Mutual fund performance changes over time and current performance may be lower or higher than what is stated. For current to the most recent month-end performance and after-tax returns, visit FederatedInvestors.com or call 1-800-341-7400. Returns shown do not reflect the deduction of taxes that a shareholder would pay on Fund distributions or the redemption of Fund shares. Mutual funds are not obligations of or guaranteed by any bank and are not federally insured.
1 The Fund's performance assumes the reinvestment of all dividends and distributions. The RUS2 has been adjusted to reflect reinvestment of dividends on securities in the index.
2 The RUS2 is not adjusted to reflect sales charges, expenses or other fees that the Securities and Exchange Commission (SEC) requires to be reflected in the Fund's performance. The index is unmanaged and, unlike the Fund, is not affected by cashflows. It is not possible to invest directly in an index.
GROWTH OF A $10,000 INVESTMENT - CLASS C SHARES
The graph below illustrates the hypothetical investment of $10,000 1 in the Federated Mini-Cap Index Fund (Class C Shares) (the "Fund") from November 10, 1997 (start of performance) to October 31, 2007 compared to the Russell 2000 Index (RUS2) 2 ..
Average Annual Total Returns 3 for the Period Ended 10/31/2007
|
|
|
1 Year
|
| 6.44%
|
5 Years
|
| 16.75%
|
Start of Performance (11/10/1997)
|
| 5.80%
|
Performance data quoted represents past performance which is no guarantee of future results. Investment return and principal value will fluctuate so that an investor's shares, when redeemed, may be worth more or less than their original cost. Mutual fund performance changes over time and current performance may be lower or higher than what is stated. For current to the most recent month-end performance and after-tax returns, visit FederatedInvestors.com or call 1-800-341-7400. Returns shown do not reflect the deduction of taxes that a shareholder would pay on Fund distributions or the redemption of Fund shares. Mutual funds are not obligations of or guaranteed by any bank and are not federally insured. Total returns shown include the 1.00% contingent deferred sales charge as applicable.
1 Represents a hypothetical investment of $10,000 in the Fund. A 1.00% contingent deferred sales charge would be applied to any redemption less than one year from the purchase date. The Fund's performance assumes the reinvestment of all dividends and distributions. The RUS2 has been adjusted to reflect reinvestment of dividends on securities in the index.
2 The RUS2 is not adjusted to reflect sales charges, expenses or other fees that the SEC requires to be reflected in the Fund's performance. The index is unmanaged and, unlike the Fund, is not affected by cashflows. It is not possible to invest directly in an index.
3 Total returns quoted reflect all applicable contingent deferred sales charges.
Performance data quoted represents past performance which is no guarantee of future results. Investment return and principal value will fluctuate so that an investor's shares, when redeemed, may be worth more or less than their original cost. Mutual fund performance changes over time and current performance may be lower or higher than what is stated. For current to the most recent month-end performance and after-tax returns, visit FederatedInvestors.com or call 1-800-341-7400.
Portfolio of Investments Summary Table
At October 31, 2007, the Fund's sector composition 1 was as follows:
Sector
|
| Percentage of
Total Net Assets
|
Financials
|
| 18.8
| %
|
Information Technology
|
| 18.2
| %
|
Industrials
|
| 14.6
| %
|
Consumer Discretionary
|
| 14.4
| %
|
Health Care
|
| 13.4
| %
|
Energy
|
| 6.1
| %
|
Materials
|
| 5.1
| %
|
Consumer Staples
|
| 2.9
| %
|
Utilities
|
| 2.8
| %
|
Telecommunication Services
|
| 1.6
| %
|
Other Securities 2
|
| 0.0
| % 7
|
Securities Lending Collateral 3
|
| 2.1
| %
|
Cash Equivalents 4
|
| 1.5
| %
|
Other Assets and Liabilities--Net 5
|
| (1.5
| )%
|
TOTAL 6
|
| 100.0
| %
|
1 Except for Other Securities, Securities Lending Collateral, Cash Equivalents and Other Assets and Liabilities, sector classifications are based upon, and individual portfolio securities are assigned to, the classifications of the Global Industry Classification Standard (GICS) except that the adviser assigns a classification to securities not classified by the GICS and to securities for which the adviser does not have access to the classification made by the GICS.
2 Other Securities includes preferred stock.
3 Cash collateral received from lending portfolio securities which is invested in short-term investments such as repurchase agreements or money market mutual funds.
4 Cash Equivalents includes any investments in money market mutual funds and/or overnight repurchase agreements other than those representing Securities Lending Collateral.
5 Assets, other than investments in securities, less liabilities. See Statement of Assets and Liabilities.
6 The Fund purchases index futures contracts to efficiently manage cash flows resulting from shareholder purchases and redemptions, dividend and capital gain payments to shareholders and corporate actions while maintaining exposure to the Russell 2000 Index and minimizing trading costs. Taking into consideration these open index futures contracts, the Fund's effective total exposure to the Russell 2000 Index is 102.1%.
7 Represents less than 0.1%.
Portfolio of Investments
October 31, 2007
Shares
|
|
|
|
| Value
|
|
| | COMMON STOCKS--97.9% 1 | | | | |
| | Consumer Discretionary--14.4% | | | | |
| 2,579 | 2 | 1-800-FLOWERS.COM, Inc.
| | $ | 30,922 | |
| 3,300 | 2 | 99 Cents Only Stores
| | | 35,475 | |
| 1,500 | 2 | A.C. Moore Arts & Crafts, Inc.
| | | 25,080 | |
| 2,100 | 2 | AFC Enterprises, Inc.
| | | 28,035 | |
| 3,086 | | Aaron Rents, Inc.
| | | 65,361 | |
| 5,850 | 2 | Aeropostale, Inc.
| | | 133,965 | |
| 1,531 | 2 | Aftermarket Technology Co.
| | | 52,850 | |
| 1,400 | | Ambassadors Group, Inc.
| | | 25,438 | |
| 900 | | Ambassadors International, Inc.
| | | 18,414 | |
| 3,200 | | American Axle & Manufacturing Holdings, Inc.
| | | 87,872 | |
| 4,000 | | American Greetings Corp., Class A
| | | 105,360 | |
| 2,000 | 2 | Amerigon, Inc.
| | | 39,280 | |
| 1,900 | | Ameristar Casinos, Inc.
| | | 61,845 | |
| 5,500 | | Applebee's International, Inc.
| | | 139,370 | |
| 2,200 | | Arbitron, Inc.
| | | 111,364 | |
| 1,329 | | Arctic Cat, Inc.
| | | 19,164 | |
| 5,200 | | ArvinMeritor, Inc.
| | | 77,116 | |
| 1,400 | | Asbury Automotive Group, Inc.
| | | 25,662 | |
| 1,198 | 2 | Audiovox Corp., Class A
| | | 14,376 | |
| 400 | 2 | Avatar Holdings, Inc.
| | | 18,620 | |
| 900 | 2 | BJ's Restaurants, Inc.
| | | 17,811 | |
| 3,800 | 2 | Bally Technologies, Inc.
| | | 153,254 | |
| 2,500 | 3 | Beazer Homes USA, Inc.
| | | 28,075 | |
| 6,100 | | Belo (A.H.) Corp., Series A
| | | 112,850 | |
| 400 | 2 | Benihana, Inc., Class A
| | | 7,060 | |
| 2,100 | | Big 5 Sporting Goods Corp.
| | | 37,485 | |
| 14,300 | 2,3 | Blockbuster, Inc.
| | | 75,218 | |
| 1,100 | 2 | Blue Nile, Inc.
| | | 86,944 | |
| 1,300 | 2 | Bluegreen Corp.
| | | 9,789 | |
| 1,900 | | Blyth Industries, Inc.
| | | 36,271 | |
| 2,863 | | Bob Evans Farms, Inc.
| | | 80,679 | |
| 700 | | Bon-Ton Stores, Inc.
| | | 12,390 | |
Shares
|
|
|
|
| Value
|
|
| | COMMON STOCKS--continued 1 | | | | |
| | Consumer Discretionary--continued | | | | |
| 1,500 | | Books-A-Million, Inc.
| | $ | 20,085 | |
| 4,300 | | Borders Group, Inc.
| | | 66,306 | |
| 1,846 | 2 | Bright Horizons Family Solutions, Inc.
| | | 71,625 | |
| 1,088 | 3 | Brookfield Homes Corp.
| | | 16,353 | |
| 3,237 | | Brown Shoe Co., Inc.
| | | 66,035 | |
| 936 | | Buckle, Inc.
| | | 40,342 | |
| 1,300 | 2 | Buffalo Wild Wings, Inc.
| | | 39,858 | |
| 1,100 | 2 | Build-A-Bear Workshop, Inc.
| | | 21,340 | |
| 2,400 | | Building Materials Holding Corp.
| | | 18,864 | |
| 1,800 | | CBRL Group, Inc.
| | | 71,820 | |
| 2,350 | 2 | CEC Entertainment, Inc.
| | | 70,030 | |
| 4,300 | | CKE Restaurants, Inc.
| | | 69,574 | |
| 3,300 | 2 | CKX, Inc.
| | | 40,128 | |
| 300 | | CPI Corp.
| | | 9,963 | |
| 3,194 | 2 | CSK Auto Corp.
| | | 36,412 | |
| 581 | | CSS Industries, Inc.
| | | 23,008 | |
| 2,300 | 2 | Cabela's, Inc., Class A
| | | 44,896 | |
| 900 | 2 | Cache, Inc.
| | | 14,094 | |
| 2,600 | 2 | California Pizza Kitchen, Inc.
| | | 42,068 | |
| 5,800 | | Callaway Golf Co.
| | | 100,456 | |
| 600 | 2 | Capella Education Co.
| | | 37,200 | |
| 1,200 | | Carmike Cinemas, Inc.
| | | 19,080 | |
| 300 | 2 | Carrols Restaurant Group, Inc.
| | | 3,342 | |
| 4,000 | 2 | Carter's, Inc.
| | | 88,320 | |
| 2,900 | 2 | Casual Male Retail Group, Inc.
| | | 24,244 | |
| 2,337 | | Cato Corp., Class A
| | | 46,927 | |
| 5,898 | 2 | Champion Enterprises, Inc.
| | | 69,950 | |
| 1,800 | 2 | Charlotte Russe Holdings, Inc.
| | | 26,082 | |
| 9,171 | 2 | Charming Shoppes, Inc.
| | | 68,049 | |
| 29,400 | 2,3 | Charter Communications, Inc., Class A
| | | 60,858 | |
| 800 | | Cherokee, Inc.
| | | 30,480 | |
| 1,621 | 2 | Children's Place Retail Stores, Inc.
| | | 41,498 | |
| 2,200 | 2 | Chipotle Mexican Grill, Inc., Class B
| | | 271,304 | |
| 2,725 | | Christopher & Banks Corp.
| | | 37,387 | |
| 585 | | Churchill Downs, Inc.
| | | 29,747 | |
Shares
|
|
|
|
| Value
|
|
| | COMMON STOCKS--continued 1 | | | | |
| | Consumer Discretionary--continued | | | | |
| 1,400 | 2 | Cinemark Holdings, Inc.
| | $ | 24,094 | |
| 16,860 | 2 | Citadel Broadcasting Corp.
| | | 74,184 | |
| 1,000 | 2 | Citi Trends, Inc.
| | | 19,560 | |
| 1,300 | | Coinmach Service Corp., Class A
| | | 17,069 | |
| 2,025 | 2 | Coinstar, Inc.
| | | 69,761 | |
| 4,700 | 2 | Collective Brands, Inc.
| | | 86,903 | |
| 1,000 | | Columbia Sportswear Co.
| | | 48,750 | |
| 600 | 2 | Conn's, Inc.
| | | 15,342 | |
| 4,700 | | Cooper Tire & Rubber Co.
| | | 104,716 | |
| 700 | 2 | Core-Mark Holding Co., Inc.
| | | 24,290 | |
| 6,600 | 2 | Corinthian Colleges, Inc.
| | | 108,174 | |
| 750 | | Courier Corp.
| | | 28,342 | |
| 2,400 | 2 | Cox Radio, Inc., Class A
| | | 28,992 | |
| 1,171 | 2 | Crown Media Holdings, Inc., Class A
| | | 9,227 | |
| 3,218 | 2 | Cumulus Media, Inc., Class A
| | | 33,178 | |
| 1,300 | 2 | DG Fastchannel, Inc.
| | | 31,967 | |
| 1,400 | 2 | DSW, Inc., Class A
| | | 31,500 | |
| 4,300 | | DeVRY, Inc.
| | | 235,167 | |
| 900 | 2 | Deckers Outdoor Corp.
| | | 125,811 | |
| 8,400 | 2 | Denny's Corp.
| | | 40,488 | |
| 2,550 | 2 | Domino's Pizza, Inc.
| | | 39,372 | |
| 1,148 | | Dover Downs Gaming & Entertainment, Inc.
| | | 12,548 | |
| 3,668 | 2 | Dress Barn, Inc.
| | | 60,119 | |
| 1,200 | 2 | Drew Industries, Inc.
| | | 47,496 | |
| 1,700 | 2 | Eddie Bauer Holdings, Inc.
| | | 12,784 | |
| 2,500 | 2 | Emmis Communications Corp., Class A
| | | 12,975 | |
| 2,400 | | Entercom Communication Corp.
| | | 44,520 | |
| 5,000 | 2 | Entravision Communications Corp.
| | | 45,500 | |
| 2,200 | | Ethan Allen Interiors, Inc.
| | | 67,892 | |
| 3,500 | 2 | Exide Corp.
| | | 29,225 | |
| 100 | 2 | F.A.O., Inc.
| | | 0 | |
| 1,000 | | FTD Group, Inc.
| | | 14,050 | |
| 3,000 | 2 | Finish Line, Inc., Class A
| | | 11,250 | |
| 400 | 2 | Fisher Communications, Inc.
| | | 19,308 | |
| 4,674 | 2 | Fleetwood Enterprises, Inc.
| | | 42,066 | |
Shares
|
|
|
|
| Value
|
|
| | COMMON STOCKS--continued 1 | | | | |
| | Consumer Discretionary--continued | | | | |
| 3,300 | 2 | Fossil, Inc.
| | $ | 123,948 | |
| 3,003 | | Freds, Inc.
| | | 31,832 | |
| 3,500 | | Furniture Brands International, Inc.
| | | 42,175 | |
| 500 | 2 | G-III Apparel Group Ltd.
| | | 8,135 | |
| 1,800 | 2 | GSI Commerce, Inc.
| | | 51,282 | |
| 1,200 | 2 | Gaiam, Inc.
| | | 27,900 | |
| 900 | 2 | Gander Mountain, CO
| | | 4,590 | |
| 1,070 | | GateHouse Media, Inc.
| | | 12,294 | |
| 2,978 | 2 | Gaylord Entertainment Co.
| | | 162,241 | |
| 18,000 | 2 | Gemstar-TV Guide International, Inc.
| | | 124,020 | |
| 1,754 | 2 | Genesco, Inc.
| | | 81,035 | |
| 600 | 2 | Gentek, Inc.
| | | 20,400 | |
| 800 | 2 | Global Sources Ltd.
| | | 25,928 | |
| 3,000 | | Gray Television, Inc.
| | | 28,380 | |
| 1,900 | 2 | Great Wolf Resorts, Inc.
| | | 24,814 | |
| 1,745 | | Group 1 Automotive, Inc.
| | | 54,182 | |
| 2,400 | 2 | Gymboree Corp.
| | | 81,672 | |
| 3,900 | 2 | Harris Interactive, Inc.
| | | 17,979 | |
| 1,448 | | Haverty Furniture Cos., Inc.
| | | 12,308 | |
| 8,200 | 2 | Hayes Lemmerz International, Inc.
| | | 38,130 | |
| 500 | 2 | Heelys, Inc.
| | | 3,705 | |
| 2,500 | 2 | Helen of Troy Ltd.
| | | 45,000 | |
| 2,637 | 2 | Hibbett Sports Inc.
| | | 62,207 | |
| 4,100 | 2,3 | Home Solutions of America, Inc.
| | | 10,373 | |
| 700 | | Hooker Furniture Corp.
| | | 15,078 | |
| 3,466 | 2 | Hot Topic, Inc.
| | | 26,550 | |
| 3,100 | 2,3 | Hovnanian Enterprises, Inc., Class A
| | | 35,247 | |
| 1,295 | | IHOP Corp.
| | | 82,012 | |
| 4,460 | 2 | INVESTools, Inc.
| | | 65,071 | |
| 3,600 | 2 | Iconix Brand Group, Inc.
| | | 82,260 | |
| 2,200 | | Interactive Data Corp.
| | | 70,708 | |
| 1,123 | 2 | Isle of Capri Casinos, Inc.
| | | 22,741 | |
| 2,650 | 2 | J. Crew Group, Inc.
| | | 99,110 | |
| 2,243 | 2 | JAKKS Pacific, Inc.
| | | 59,440 | |
| 4,494 | 2 | Jack in the Box, Inc.
| | | 140,977 | |
Shares
|
|
|
|
| Value
|
|
| | COMMON STOCKS--continued 1 | | | | |
| | Consumer Discretionary--continued | | | | |
| 2,300 | | Jackson Hewitt Tax Service, Inc.
| | $ | 71,875 | |
| 4,700 | 2,3 | Jamba, Inc.
| | | 25,568 | |
| 1,840 | 2 | Jo-Ann Stores, Inc.
| | | 35,457 | |
| 1,477 | 2 | Jos A. Bank Clothiers, Inc.
| | | 43,143 | |
| 3,200 | | Journal Communications, Inc., Class A
| | | 28,512 | |
| 1,900 | | K-Swiss, Inc., Class A
| | | 44,460 | |
| 2,039 | | Kellwood Co.
| | | 33,786 | |
| 669 | | Kenneth Cole Productions, Inc., Class A
| | | 12,490 | |
| 1,796 | | Kimball International, Inc., Class B
| | | 23,941 | |
| 1,400 | 2 | Knology, Inc.
| | | 23,506 | |
| 4,600 | 2 | Krispy Kreme Doughnuts, Inc.
| | | 14,720 | |
| 3,800 | 2 | LKQ Corp.
| | | 146,528 | |
| 3,700 | 3 | La-Z Boy Chair Co.
| | | 29,193 | |
| 1,900 | 2 | Lakes Gaming, Inc.
| | | 15,770 | |
| 1,263 | | Landry's Seafood Restaurants, Inc.
| | | 36,273 | |
| 2,500 | 2 | Leapfrog Enterprises, Inc.
| | | 18,725 | |
| 5,310 | 2 | Lear Corp.
| | | 188,664 | |
| 3,300 | | Lee Enterprises, Inc.
| | | 52,965 | |
| 700 | | Libbey, Inc.
| | | 12,593 | |
| 2,250 | 2 | Life Time Fitness, Inc.
| | | 136,440 | |
| 800 | | Lifetime Brands, Inc.
| | | 12,832 | |
| 2,400 | 2 | Lin TV Corp., Class A
| | | 34,968 | |
| 1,100 | | Lithia Motors, Inc., Class A
| | | 18,678 | |
| 4,700 | 2 | Live Nation, Inc.
| | | 96,068 | |
| 1,558 | 2 | Lodgenet Entertainment
| | | 33,606 | |
| 1,300 | 2 | Lodgian, Inc.
| | | 15,821 | |
| 1,200 | 2,3 | Lululemon Athletica, Inc.
| | | 63,864 | |
| 900 | | M/I Schottenstein Homes, Inc.
| | | 14,940 | |
| 2,000 | 2 | MTR Gaming Group, Inc.
| | | 17,420 | |
| 3,000 | 2 | Magna Entertainment Corp., Class A
| | | 6,600 | |
| 1,300 | 2 | Maidenform Brands, Inc.
| | | 19,305 | |
| 1,517 | | Marcus Corp.
| | | 29,187 | |
| 900 | | Marine Products Corp.
| | | 7,371 | |
| 1,100 | 2 | MarineMax, Inc.
| | | 15,664 | |
| 1,996 | 2 | Martha Stewart Living Omnimedia
| | | 27,525 | |
Shares
|
|
|
|
| Value
|
|
| | COMMON STOCKS--continued 1 | | | | |
| | Consumer Discretionary--continued | | | | |
| 3,500 | 2 | Marvel Entertainment, Inc.
| | $ | 86,590 | |
| 2,292 | | Matthews International Corp., Class A
| | | 104,446 | |
| 600 | 2 | McCormick & Schmick's Seafood Restaurants, Inc.
| | | 10,188 | |
| 1,600 | | Media General, Inc., Class A
| | | 44,768 | |
| 4,200 | 2 | Mediacom Communications Corp.
| | | 24,150 | |
| 3,700 | | Mens Wearhouse, Inc.
| | | 156,362 | |
| 1,700 | 2,3 | Meritage Corp.
| | | 27,353 | |
| 1,189 | 2 | Midas, Inc.
| | | 18,988 | |
| 2,321 | | Modine Manufacturing Co.
| | | 53,986 | |
| 2,179 | | Monaco Coach Corp.
| | | 25,276 | |
| 500 | 2 | Monarch Casino & Resort, Inc.
| | | 15,295 | |
| 1,350 | | Monro Muffler Brake, Inc.
| | | 30,753 | |
| 1,500 | 2 | Morgans Hotel Group Co.
| | | 34,140 | |
| 800 | 2 | Morningstar, Inc.
| | | 59,536 | |
| 200 | 2 | Mortons Restaurant Group, Inc.
| | | 2,772 | |
| 1,200 | | Movado Group, Inc.
| | | 36,108 | |
| 2,400 | 2 | Multimedia Games, Inc.
| | | 21,168 | |
| 2,940 | | National CineMedia, Inc.
| | | 79,145 | |
| 436 | | National Presto Industries, Inc.
| | | 23,954 | |
| 3,400 | 2,3 | NetFlix, Inc.
| | | 89,998 | |
| 1,100 | 2 | New York & Co.
| | | 7,777 | |
| 200 | 2 | Nexstar Broadcasting Group, Inc., Class A
| | | 1,886 | |
| 800 | | Noble International Ltd.
| | | 14,936 | |
| 2,321 | | O'Charleys, Inc.
| | | 37,206 | |
| 1,800 | | Oakley, Inc.
| | | 52,650 | |
| 1,600 | 2,3 | Overstock.com, Inc.
| | | 62,608 | |
| 1,100 | | Oxford Industries, Inc.
| | | 28,501 | |
| 1,810 | 2 | P.F. Chang's China Bistro, Inc.
| | | 52,689 | |
| 5,400 | 2 | Pacific Sunwear of California
| | | 90,288 | |
| 743 | 2 | Palm Harbor Homes, Inc.
| | | 10,573 | |
| 1,806 | 2 | Papa Johns International, Inc.
| | | 42,080 | |
| 1,200 | 2 | Peet's Coffee & Tea, Inc.
| | | 32,724 | |
| 3,456 | | Pep Boys-Manny Moe & Jack
| | | 50,838 | |
| 1,050 | 2 | Perry Ellis International, Inc.
| | | 24,360 | |
| 2,100 | 2 | PetMed Express, Inc.
| | | 30,618 | |
Shares
|
|
|
|
| Value
|
|
| | COMMON STOCKS--continued 1 | | | | |
| | Consumer Discretionary--continued | | | | |
| 6,400 | 2 | Pier 1 Imports, Inc.
| | $ | 32,576 | |
| 4,331 | 2 | Pinnacle Entertainment, Inc.
| | | 126,465 | |
| 1,840 | 2 | Playboy Enterprises, Inc., Class B
| | | 20,608 | |
| 2,800 | | Polaris Industries, Inc., Class A
| | | 137,704 | |
| 831 | | Pre-Paid Legal Services, Inc.
| | | 49,528 | |
| 2,100 | 2 | Premier Exhibitions, Inc.
| | | 23,289 | |
| 2,650 | 2 | Priceline.com, Inc.
| | | 246,715 | |
| 3,616 | 2 | Primedia, Inc.
| | | 32,942 | |
| 8,900 | 2 | Quiksilver, Inc.
| | | 120,150 | |
| 1,400 | 2 | RC2 Corp.
| | | 41,748 | |
| 2,100 | 2 | RCN Corp.
| | | 30,660 | |
| 5,500 | 2 | Radio One, Inc.
| | | 19,195 | |
| 1,200 | 2 | Raser Technologies, Inc.
| | | 13,428 | |
| 1,200 | 2 | Red Robin Gourmet Burgers
| | | 48,024 | |
| 3,400 | | Regis Corp. Minnesota
| | | 114,240 | |
| 5,100 | 2 | Rent-A-Center, Inc.
| | | 81,600 | |
| 1,500 | 2 | Retail Ventures, Inc.
| | | 13,005 | |
| 500 | 2 | Riviera Holdings Corp.
| | | 13,950 | |
| 4,300 | | Ruby Tuesday, Inc.
| | | 68,671 | |
| 1,070 | 2 | Russ Berrie & Co., Inc.
| | | 18,725 | |
| 1,300 | 2 | Ruth's Chris Steak House, Inc.
| | | 16,432 | |
| 633 | 2 | Salem Communications Corp.
| | | 5,064 | |
| 5,800 | 2 | Sally Beauty Holdings, Inc.
| | | 53,650 | |
| 776 | | Sauer-Danfoss, Inc.
| | | 20,098 | |
| 2,500 | 2 | Scholastic Corp.
| | | 98,950 | |
| 2,500 | | Sealy Corp.
| | | 33,050 | |
| 4,100 | 2 | Select Comfort Corp.
| | | 46,863 | |
| 600 | 2 | Shoe Carnival, Inc.
| | | 9,588 | |
| 2,750 | 2 | Shuffle Master, Inc.
| | | 37,620 | |
| 700 | 2 | Shutterfly, Inc.
| | | 23,359 | |
| 4,131 | | Sinclair Broadcast Group, Inc.
| | | 49,737 | |
| 5,700 | 2 | Six Flags, Inc.
| | | 18,468 | |
| 1,336 | 2 | Skechers USA, Inc., Class A
| | | 32,852 | |
| 525 | | Skyline Corp.
| | | 18,606 | |
| 2,400 | 2 | Smith & Wesson Holding Corp.
| | | 29,016 | |
Shares
|
|
|
|
| Value
|
|
| | COMMON STOCKS--continued 1 | | | | |
| | Consumer Discretionary--continued | | | | |
| 1,900 | | Sonic Automotive, Inc.
| | $ | 47,994 | |
| 4,790 | 2 | Sonic Corp.
| | | 118,696 | |
| 4,641 | | Sothebys Holdings, Inc., Class A
| | | 251,403 | |
| 3,900 | 2 | Source Information Management Co.
| | | 12,441 | |
| 3,324 | 2 | Spanish Broadcasting System, Inc.
| | | 8,642 | |
| 1,950 | | Spartan Motors, Inc.
| | | 27,378 | |
| 1,036 | | Speedway Motorsports, Inc.
| | | 37,607 | |
| 3,125 | | Stage Stores, Inc.
| | | 58,625 | |
| 1,608 | 2 | Stamps.com, Inc.
| | | 22,319 | |
| 600 | | Standard Motor Products, Inc.
| | | 5,016 | |
| 4,100 | 3 | Standard Pacific Corp.
| | | 19,680 | |
| 1,961 | | Stein Mart, Inc.
| | | 12,884 | |
| 1,000 | 2 | Steiner Leisure Ltd.
| | | 44,980 | |
| 600 | 2 | Steinway Musical Instruments
| | | 17,970 | |
| 1,705 | 2 | Steven Madden Ltd.
| | | 38,004 | |
| 8,060 | | Stewart Enterprises, Inc., Class A
| | | 73,104 | |
| 400 | 2 | Stoneridge, Inc.
| | | 4,116 | |
| 1,100 | | Strayer Education, Inc.
| | | 205,106 | |
| 1,100 | 2 | Sturm Ruger & Co., Inc.
| | | 10,285 | |
| 6,000 | 2 | Sun-Times Media Group, Inc.
| | | 13,260 | |
| 2,091 | | Superior Industries International, Inc.
| | | 42,259 | |
| 5,600 | 2,3 | Syntax-Brillian Corp.
| | | 25,256 | |
| 400 | 2 | Systemax, Inc.
| | | 9,360 | |
| 1,600 | | Talbots, Inc.
| | | 23,536 | |
| 687 | | Tarragon Corp.
| | | 1,422 | |
| 5,600 | | Tempur-Pedic International, Inc.
| | | 201,600 | |
| 3,400 | 2 | Tenneco Automotive, Inc.
| | | 104,074 | |
| 3,500 | 2 | Texas Roadhouse, Inc.
| | | 44,345 | |
| 2,463 | 3 | The Nautilus Group, Inc.
| | | 15,837 | |
| 1,969 | 2 | The Steak 'n Shake Co.
| | | 29,830 | |
| 7,031 | 2 | TiVo, Inc.
| | | 50,131 | |
| 3,400 | 2 | Timberland Co., Class A
| | | 66,334 | |
| 800 | 2 | Town Sports International Holdings, Inc.
| | | 12,168 | |
| 4,242 | | Triarc Cos., Inc., Class B
| | | 47,510 | |
| 1,400 | 2 | True Religion Apparel, Inc.
| | | 21,672 | |
Shares
|
|
|
|
| Value
|
|
| | COMMON STOCKS--continued 1 | | | | |
| | Consumer Discretionary--continued | | | | |
| 2,200 | 2,3 | Trump Entertainment Resorts, Inc.
| | $ | 17,138 | |
| 2,108 | | Tuesday Morning Corp.
| | | 16,063 | |
| 4,596 | | Tupperware Brands Corp.
| | | 165,916 | |
| 2,226 | 2 | Tween Brands, Inc.
| | | 68,338 | |
| 1,800 | 2 | Under Armour, Inc., Class A
| | | 112,050 | |
| 800 | | Unifirst Corp.
| | | 30,104 | |
| 1,008 | 2 | Universal Electronics, Inc.
| | | 36,389 | |
| 1,600 | 2 | Universal Technical Institute, Inc.
| | | 30,128 | |
| 2,143 | 2 | Vail Resorts, Inc.
| | | 130,059 | |
| 3,500 | 2 | Valassis Communications, Inc.
| | | 34,475 | |
| 74 | | Value Line, Inc.
| | | 3,252 | |
| 2,267 | 2 | Valuevision International, Inc., Class A
| | | 11,720 | |
| 9,400 | 2 | Visteon Corp.
| | | 59,690 | |
| 900 | 2 | Volcom, Inc.
| | | 26,325 | |
| 2,800 | 2 | WCI Communities, Inc.
| | | 15,288 | |
| 2,734 | 2 | WMS Industries, Inc.
| | | 94,788 | |
| 3,300 | 2 | Warnaco Group, Inc.
| | | 134,277 | |
| 1,200 | 2 | West Marine, Inc.
| | | 12,948 | |
| 4,400 | 2 | Westwood One, Inc.
| | | 9,416 | |
| 5,600 | 2 | Wet Seal, Inc., Class A
| | | 14,840 | |
| 100 | | Weyco Group, Inc.
| | | 3,196 | |
| 2,224 | | Winnebago Industries, Inc.
| | | 57,335 | |
| 4,190 | | Wolverine World Wide, Inc.
| | | 107,432 | |
| 1,597 | | World Wrestling Entertainment, Inc.
| | | 24,274 | |
| 3,600 | 2 | Zale Corp.
| | | 75,888 | |
| 1,100 | 2 | Zumiez Inc.
| | | 46,046 | |
| 1,400 | | bebe stores, Inc.
| | | 19,474 | |
| 700 | 2 | iRobot Corp.
|
|
| 12,663
|
|
| | TOTAL
|
|
| 14,655,564
|
|
| | Consumer Staples--2.9% | | | | |
| 300 | | Alico, Inc.
| | | 14,232 | |
| 6,900 | 2 | Alliance One International, Inc.
| | | 45,057 | |
| 100 | 2 | American Dairy, Inc.
| | | 2,197 | |
| 2,900 | 2 | American Oriental Bioengineering, Inc.
| | | 39,933 | |
| 100 | | Arden Group, Inc., Class A
| | | 14,242 | |
Shares
|
|
|
|
| Value
|
|
| | COMMON STOCKS--continued 1 | | | | |
| | Consumer Staples--continued | | | | |
| 100 | 2 | Aurora Foods, Inc.
| | $ | 0 | |
| 800 | | Cal-Maine Foods, Inc.
| | | 19,152 | |
| 3,754 | | Casey's General Stores, Inc.
| | | 106,989 | |
| 2,575 | 2 | Central European Distribution Corp.
| | | 136,938 | |
| 4,980 | 2 | Central Garden & Pet Co., Class A
| | | 41,434 | |
| 1,400 | 2 | Chattem, Inc.
| | | 104,020 | |
| 3,100 | 2 | Chiquita Brands International
| | | 58,125 | |
| 342 | | Coca-Cola Bottling Co.
| | | 20,178 | |
| 5,500 | 2 | Darling International, Inc.
| | | 55,330 | |
| 1,900 | 2 | Elizabeth Arden, Inc.
| | | 47,310 | |
| 510 | | Farmer Brothers Co.
| | | 12,694 | |
| 5,511 | | Flowers Foods, Inc.
| | | 120,911 | |
| 1,600 | 2 | Fresh Del Monte Produce, Inc.
| | | 58,048 | |
| 1,447 | 2 | Great Atlantic & Pacific Tea Co., Inc.
| | | 46,839 | |
| 1,500 | 2 | Green Mountain Coffee, Inc.
| | | 55,950 | |
| 2,466 | 2 | Hain Celestial Group, Inc.
| | | 86,458 | |
| 800 | | Imperial Sugar Co.
| | | 20,632 | |
| 990 | | Ingles Markets, Inc., Class A
| | | 27,473 | |
| 500 | | Inter Parfums, Inc.
| | | 11,920 | |
| 1,000 | | J&J Snack Foods Corp.
| | | 35,620 | |
| 2,300 | 2,3 | Jones Soda Co.
| | | 21,367 | |
| 1,800 | | Lancaster Colony Corp.
| | | 72,306 | |
| 2,195 | | Lance, Inc.
| | | 46,490 | |
| 2,253 | | Longs Drug Stores Corp.
| | | 118,305 | |
| 800 | | MGP Ingredients, Inc.
| | | 7,632 | |
| 1,200 | | Mannatech, Inc.
| | | 9,540 | |
| 300 | 2,3 | Maui Land & Pineapple Co., Inc.
| | | 8,835 | |
| 1,100 | | Nash Finch Co.
| | | 41,195 | |
| 720 | 2 | National Beverage Corp.
| | | 5,983 | |
| 4,307 | | Nu Skin Enterprises, Inc., Class A
| | | 74,382 | |
| 3,100 | 2 | Pathmark Stores, Inc.
| | | 40,610 | |
| 2,500 | 2 | Performance Food Group Co.
| | | 67,475 | |
| 2,800 | | Pilgrim's Pride Corp.
| | | 83,160 | |
| 2,200 | 2 | Prestige Brands Holdings, Inc.
| | | 23,012 | |
| 600 | | Pricesmart, Inc.
| | | 17,064 | |
Shares
|
|
|
|
| Value
|
|
| | COMMON STOCKS--continued 1 | | | | |
| | Consumer Staples--continued | | | | |
| 2,167 | 2 | Ralcorp Holdings, Inc.
| | $ | 122,002 | |
| 1,500 | | Reddy Ice Group, Inc.
| | | 41,535 | |
| 15,337 | 2 | Revlon, Inc., Class A
| | | 17,638 | |
| 2,964 | | Ruddick Corp.
| | | 100,776 | |
| 1,400 | | Sanderson Farms, Inc.
| | | 48,720 | |
| 33 | | Seaboard Corp.
| | | 53,856 | |
| 1,600 | | Spartan Stores, Inc.
| | | 35,568 | |
| 2,800 | 2 | Spectrum Brands, Inc.
| | | 12,068 | |
| 1,100 | | The Anderson's, Inc.
| | | 54,615 | |
| 900 | 2 | The Boston Beer Co., Inc., Class A
| | | 47,025 | |
| 1,600 | 2 | The Pantry, Inc.
| | | 44,832 | |
| 2,520 | | Tootsie Roll Industries, Inc.
| | | 64,940 | |
| 2,000 | 2 | TreeHouse Foods, Inc.
| | | 55,800 | |
| 800 | 2,3 | USANA, Inc.
| | | 32,648 | |
| 3,172 | 2 | United Natural Foods, Inc.
| | | 91,798 | |
| 1,988 | | Universal Corp.
| | | 96,895 | |
| 2,789 | | Vector Group Ltd.
| | | 61,023 | |
| 200 | | Village Super Market, Inc., Class A
| | | 10,918 | |
| 1,549 | | WD 40 Co.
| | | 61,340 | |
| 900 | | Weis Markets, Inc.
| | | 39,501 | |
| 2,200 | 2 | Winn-Dixie Stores, Inc.
|
|
| 52,008
|
|
| | TOTAL
|
|
| 2,964,544
|
|
| | Energy--6.1% | | | | |
| 1,500 | 2 | ATP Oil & Gas Corp.
| | | 86,025 | |
| 2,100 | 2 | Allis-Chalmers Corp.
| | | 36,897 | |
| 900 | | Alon USA Energy, Inc.
| | | 33,093 | |
| 4,300 | 2 | Alpha Natural Resources, Inc.
| | | 117,992 | |
| 2,400 | 2 | Arena Resources, Inc.
| | | 87,624 | |
| 600 | | Arlington Tankers Ltd.
| | | 14,760 | |
| 1,818 | | Atlas America, Inc.
| | | 104,899 | |
| 1,984 | 2 | Atwood Oceanics, Inc.
| | | 167,132 | |
| 2,140 | 2 | Aventine Renewable Energy Holdings, Inc.
| | | 22,449 | |
| 4,600 | 2,3 | BPZ Energy, Inc.
| | | 52,532 | |
| 2,500 | 2 | Basic Energy Services, Inc.
| | | 49,475 | |
| 2,594 | | Berry Petroleum Co., Class A
| | | 126,380 | |
Shares
|
|
|
|
| Value
|
|
| | COMMON STOCKS--continued 1 | | | | |
| | Energy--continued | | | | |
| 1,900 | 2 | Bill Barrett Corp.
| | $ | 88,920 | |
| 700 | 2 | Bois d'Arc Energy, Inc.
| | | 15,358 | |
| 3,300 | 2 | Brigham Exploration Co.
| | | 24,321 | |
| 1,709 | 2 | Bristow Group, Inc.
| | | 85,262 | |
| 2,347 | 2 | Bronco Drilling Co., Inc.
| | | 31,919 | |
| 1,000 | 2 | Cal Dive International, Inc.
| | | 13,230 | |
| 1,500 | 2 | Callon Petroleum Corp.
| | | 21,870 | |
| 1,502 | | Carbo Ceramics, Inc.
| | | 67,470 | |
| 1,900 | 2 | Carrizo Oil & Gas, Inc.
| | | 97,641 | |
| 400 | 2 | Clayton Williams Energy, Inc.
| | | 11,972 | |
| 1,500 | 2 | Clean Energy Fuels Corp.
| | | 26,820 | |
| 2,700 | 2 | Complete Production Services, Inc.
| | | 53,730 | |
| 2,946 | 2 | Comstock Resources, Inc.
| | | 107,676 | |
| 1,100 | 2 | Contango Oil & Gas Co.
| | | 48,642 | |
| 2,500 | | Crosstex Energy, Inc.
| | | 92,175 | |
| 700 | 2 | Dawson Geophysical Co.
| | | 55,867 | |
| 500 | | Delek US Holdings, Inc.
| | | 11,995 | |
| 4,700 | 2,3 | Delta Petroleum Corp.
| | | 87,890 | |
| 1,100 | | Double Hull Tankers, Inc.
| | | 17,083 | |
| 1,762 | 2 | Dril-Quip, Inc.
| | | 93,967 | |
| 1,800 | 2 | ENGlobal Corp.
| | | 24,984 | |
| 3,900 | 2 | EXCO Resources, Inc.
| | | 65,832 | |
| 2,600 | 2 | Edge Petroleum Corp.
| | | 23,608 | |
| 3,600 | 2 | Encore Acquisition Co.
| | | 132,120 | |
| 2,100 | 2 | Energy Infrastructure Acquisition Corp.
| | | 20,874 | |
| 2,550 | 2 | Energy Partners Ltd.
| | | 39,143 | |
| 5,300 | 2,3 | Evergreen Energy, Inc.
| | | 24,963 | |
| 4,244 | 2 | Exterran Holdings, Inc.
| | | 357,345 | |
| 3,300 | 2 | FX Energy, Inc.
| | | 23,265 | |
| 800 | 2 | GMX Resources, Inc.
| | | 30,808 | |
| 1,700 | | General Maritime Corp.
| | | 47,906 | |
| 1,700 | 2 | GeoGlobal Resources, Inc.
| | | 6,545 | |
| 700 | 2 | Geokinetics, Inc.
| | | 14,700 | |
| 300 | 2 | Geomet, Inc.
| | | 1,575 | |
| 3,000 | | Golar LNG Ltd.
| | | 78,000 | |
Shares
|
|
|
|
| Value
|
|
| | COMMON STOCKS--continued 1 | | | | |
| | Energy--continued | | | | |
| 1,100 | 2 | Goodrich Petroleum Corp.
| | $ | 36,531 | |
| 14,398 | 2 | Grey Wolf, Inc.
| | | 81,061 | |
| 1,039 | | Gulf Island Fabrication, Inc.
| | | 36,282 | |
| 1,900 | 2 | Gulfmark Offshore, Inc.
| | | 88,502 | |
| 1,900 | 2 | Gulfport Energy Corp.
| | | 42,066 | |
| 2,900 | 2 | Harvest Natural Resources, Inc.
| | | 39,904 | |
| 5,750 | 2 | Hercules Offshore, Inc.
| | | 155,480 | |
| 2,000 | 2 | Horizon Offshore, Inc.
| | | 32,200 | |
| 1,640 | 2 | Hornbeck Offshore Services, Inc.
| | | 64,124 | |
| 5,064 | 2 | Input/Output, Inc.
| | | 76,720 | |
| 7,900 | 2,3 | International Coal Group, Inc.
| | | 42,502 | |
| 400 | | Kayne Anderson Energy Development Co.
| | | 10,244 | |
| 900 | | Knightbridge Tankers Ltd.
| | | 22,932 | |
| 1,100 | | Lufkin Industries, Inc.
| | | 65,406 | |
| 5,800 | 2 | Mariner Energy, Inc.
| | | 145,000 | |
| 300 | | MarkWest Hydrocarbon, Inc.
| | | 18,144 | |
| 2,000 | 2 | Matrix Services Co.
| | | 58,980 | |
| 2,200 | 2 | McMoRan Exploration Co.
| | | 26,796 | |
| 6,786 | 2 | Meridian Resource Corp.
| | | 17,169 | |
| 1,300 | 2 | NATCO Group, Inc., Class A
| | | 69,303 | |
| 1,606 | | NGP Capital Resources Co.
| | | 25,712 | |
| 6,583 | 2 | Newpark Resources, Inc.
| | | 41,275 | |
| 1,700 | 3 | Nordic American Tanker Shipping Ltd.
| | | 65,773 | |
| 300 | 2 | OYO Geospace Corp.
| | | 32,457 | |
| 3,400 | 2 | Oil States International, Inc.
| | | 146,846 | |
| 5,200 | 2 | Oilsands Quest, Inc.
| | | 28,496 | |
| 1,300 | 2 | PHI, Inc.
| | | 44,980 | |
| 2,500 | 2,3 | Pacific Ethanol, Inc.
| | | 20,075 | |
| 3,100 | 2 | Parallel Petroleum Corp.
| | | 63,457 | |
| 8,037 | 2 | Parker Drilling Co.
| | | 67,832 | |
| 2,644 | | Penn Virginia Corp.
| | | 127,970 | |
| 3,300 | 2 | PetroQuest Energy, Inc.
| | | 42,570 | |
| 11,595 | 2 | Petrohawk Energy Corp.
| | | 214,508 | |
| 1,300 | 2 | Petroleum Development Corp.
| | | 59,046 | |
| 3,600 | 2 | Pioneer Drilling Co.
| | | 43,848 | |
Shares
|
|
|
|
| Value
|
|
| | COMMON STOCKS--continued 1 | | | | |
| | Energy--continued | | | | |
| 2,566 | | RPC, Inc.
| | $ | 28,688 | |
| 14,700 | 2 | Rentech, Inc.
| | | 31,311 | |
| 3,400 | 2 | Rosetta Resources, Inc.
| | | 64,600 | |
| 2,600 | | Ship Finance International Ltd.
| | | 71,188 | |
| 2,031 | 2 | Stone Energy Corp.
| | | 90,542 | |
| 3,900 | 2,3 | SulphCo, Inc.
| | | 24,882 | |
| 600 | 2 | Superior Offshore International, Inc.
| | | 6,270 | |
| 900 | 2 | Superior Well Services, Inc.
| | | 18,360 | |
| 2,223 | 2 | Swift Energy Co.
| | | 105,437 | |
| 100 | 2 | T-3 Energy Services, Inc.
| | | 4,752 | |
| 3,000 | 2 | TXCO Resources, Inc.
| | | 34,830 | |
| 1,600 | 2 | Toreador Resources Corp.
| | | 16,784 | |
| 900 | 2 | Trico Marine Services, Inc.
| | | 29,205 | |
| 700 | 2 | US BioEnergy Corp.
| | | 5,292 | |
| 6,283 | 2 | USEC, Inc.
| | | 55,290 | |
| 800 | 2 | Union Drilling, Inc.
| | | 10,664 | |
| 4,400 | 2 | Uranium Resources, Inc.
| | | 54,780 | |
| 5,000 | 2 | VAALCO Energy, Inc.
| | | 25,400 | |
| 400 | 2 | Venoco, Inc.
| | | 9,144 | |
| 1,780 | 2,3 | VeraSun Energy Corp.
| | | 24,137 | |
| 2,225 | 2,3 | Verenium Corp.
| | | 11,837 | |
| 2,300 | 2 | W-H Energy Services, Inc.
| | | 132,388 | |
| 3,900 | 2 | Warren Resources, Inc.
| | | 59,202 | |
| 2,590 | 2 | Whiting Petroleum Corp.
| | | 140,015 | |
| 2,100 | 2 | Willbros. Group, Inc.
| | | 80,367 | |
| 2,100 | | World Fuel Services Corp.
|
|
| 93,009
|
|
| | TOTAL
|
|
| 6,227,299
|
|
| | Financials--18.8% | | | | |
| 943 | | 1st Source Corp.
| | | 18,143 | |
| 93 | 2 | ACA Capital Holdings, Inc.
| | | 322 | |
| 1,000 | | ASTA Funding, Inc.
| | | 35,540 | |
| 2,400 | | Acadia Realty Trust
| | | 63,600 | |
| 4,800 | | Advance America Cash Advance, Inc.
| | | 45,888 | |
| 2,550 | | Advanta Corp., Class B
| | | 40,290 | |
| 900 | | Agree Realty Corp.
| | | 29,142 | |
Shares
|
|
|
|
| Value
|
|
| | COMMON STOCKS--continued 1 | | | | |
| | Financials--continued | | | | |
| 1,196 | | Alabama National Bancorp
| | $ | 94,269 | |
| 5,100 | 3 | Alesco Financial, Inc.
| | | 20,298 | |
| 119 | 2 | Alexander's, Inc.
| | | 47,832 | |
| 2,140 | | Alexandria Real Estate Equities, Inc.
| | | 220,720 | |
| 2,362 | | Alfa Corp.
| | | 42,988 | |
| 2,400 | | AmTrust Financial Services, Inc.
| | | 33,480 | |
| 1,780 | | Amcore Financial, Inc.
| | | 42,204 | |
| 2,100 | | American Campus Communities, Inc.
| | | 59,724 | |
| 4,100 | | American Equity Investment Life Holding Co.
| | | 40,057 | |
| 9,400 | | American Financial Realty Trust
| | | 63,356 | |
| 950 | | American Physicians Capital, Inc.
| | | 41,382 | |
| 1,260 | | AmericanWest Bancorp.
| | | 24,356 | |
| 980 | | Ameris Bancorp
| | | 16,523 | |
| 1,800 | 2 | Amerisafe, Inc.
| | | 29,106 | |
| 1,605 | | Anchor Bancorp Wisconsin, Inc.
| | | 39,483 | |
| 4,200 | | Anthracite Capital, Inc.
| | | 34,944 | |
| 3,700 | | Anworth Mortgage Asset Corp.
| | | 25,271 | |
| 7,435 | | Apollo Investment Corp.
| | | 154,648 | |
| 1,200 | | Arbor Realty Trust, Inc.
| | | 22,656 | |
| 4,995 | | Ares Capital Corp.
| | | 83,117 | |
| 1,820 | 2 | Argo Group International Holdings Ltd.
| | | 77,550 | |
| 7,640 | | Ashford Hospitality Trust
| | | 75,178 | |
| 6,400 | | Aspen Insurance Holdings Ltd.
| | | 175,104 | |
| 900 | 2 | Asset Acceptance Capital Corp.
| | | 9,684 | |
| 1,800 | | Associated Estates Realty Corp.
| | | 21,852 | |
| 4,500 | | Assured Guaranty Ltd.
| | | 103,815 | |
| 2,000 | 2 | Authorize.Net Holdings, Inc.
| | | 46,740 | |
| 200 | | BRT Realty Trust
| | | 3,204 | |
| 873 | | Baldwin & Lyons, Inc., Class B
| | | 23,021 | |
| 478 | | BancFirst Corp.
| | | 21,720 | |
| 1,400 | | Banco Latinoamericano de Exportaciones S.A., Class E
| | | 27,258 | |
| 730 | 2 | Bancorp, Inc., DE
| | | 13,103 | |
| 4,435 | | Bank Mutual Corp.
| | | 49,273 | |
| 900 | | Bank of the Ozarks, Inc.
| | | 26,055 | |
| 3,500 | | BankAtlantic Bancorp, Inc., Class A
| | | 14,385 | |
Shares
|
|
|
|
| Value
|
|
| | COMMON STOCKS--continued 1 | | | | |
| | Financials--continued | | | | |
| 1,700 | | BankFinancial Corp.
| | $ | 27,064 | |
| 2,600 | | BankUnited Financial Corp., Class A
| | | 22,438 | |
| 900 | | Banner Corp.
| | | 29,394 | |
| 600 | | Berkshire Hills Bancorp, Inc.
| | | 16,722 | |
| 5,090 | | BioMed Realty Trust, Inc.
| | | 121,600 | |
| 2,700 | | Boston Private Financial Holdings
| | | 77,652 | |
| 4,550 | | Brookline Bancorp, Inc.
| | | 48,958 | |
| 1,200 | | CBRE Realty Finance, Inc.
| | | 5,856 | |
| 1,172 | 2 | CNA Surety Corp.
| | | 23,194 | |
| 4,814 | | CVB Financial Corp.
| | | 56,420 | |
| 1,700 | | Calamos Asset Management, Inc.
| | | 57,834 | |
| 921 | | Capital City Bank Group, Inc.
| | | 25,963 | |
| 700 | | Capital Corp. of the West
| | | 13,615 | |
| 3,100 | | Capital Lease Funding, Inc.
| | | 29,016 | |
| 200 | | Capital Southwest Corp.
| | | 24,432 | |
| 700 | | Capital Trust, Inc.
| | | 23,604 | |
| 1,000 | | Capitol Bancorp Ltd.
| | | 21,200 | |
| 1,656 | | Cascade Bancorp
| | | 31,861 | |
| 2,257 | | Cash America International, Inc.
| | | 88,023 | |
| 3,558 | | Cathay Bancorp, Inc.
| | | 110,191 | |
| 3,200 | | Cedar Shopping Centers, Inc.
| | | 41,120 | |
| 4,000 | 2 | Centennial Bank Holdings, Inc.
| | | 22,000 | |
| 900 | | Center Financial Corp.
| | | 11,511 | |
| 3,760 | | Centerline Holding Co.
| | | 51,888 | |
| 2,191 | | Central Pacific Financial Corp.
| | | 49,144 | |
| 1,776 | | Chemical Financial Corp.
| | | 44,400 | |
| 3,162 | | Chittenden Corp.
| | | 112,630 | |
| 5,949 | | Citizens Banking Corp.
| | | 90,544 | |
| 1,000 | 2 | Citizens, Inc., Class A
| | | 8,600 | |
| 882 | | City Bank Lynwood, WA
| | | 21,124 | |
| 1,500 | | City Holding Co.
| | | 56,715 | |
| 400 | 2 | Clayton Holdings, Inc.
| | | 1,920 | |
| 600 | | Clifton Savings Bancorp, Inc.
| | | 6,588 | |
| 1,125 | | CoBiz, Inc.
| | | 20,081 | |
| 1,100 | | Cohen & Steers, Inc.
| | | 41,360 | |
Shares
|
|
|
|
| Value
|
|
| | COMMON STOCKS--continued 1 | | | | |
| | Financials--continued | | | | |
| 1,221 | | Columbia Banking Systems, Inc.
| | $ | 37,936 | |
| 3,800 | | Commerce Group, Inc.
| | | 138,662 | |
| 700 | 2 | Community Bancorp
| | | 14,189 | |
| 2,200 | | Community Bank System, Inc.
| | | 46,002 | |
| 1,801 | | Community Banks, Inc.
| | | 54,678 | |
| 1,134 | | Community Trust Bancorp, Inc.
| | | 33,056 | |
| 2,200 | | Compass Diversified Trust
| | | 35,442 | |
| 1,467 | 2 | CompuCredit Corp.
| | | 29,237 | |
| 400 | | Consolidated Tomoka Co.
| | | 27,408 | |
| 2,800 | | Corporate Office Properties Trust
| | | 115,724 | |
| 2,824 | | Corus Bankshares, Inc.
| | | 31,120 | |
| 2,900 | | Cousins Properties, Inc.
| | | 83,491 | |
| 700 | 2 | Cowen Group, Inc.
| | | 8,498 | |
| 1,862 | | Crawford & Co., Class B
| | | 12,457 | |
| 393 | 2 | Credit Acceptance Corp.
| | | 8,803 | |
| 1,400 | | Crystal River Capital, Inc.
| | | 20,370 | |
| 12,020 | | DCT Industrial Trust, Inc.
| | | 128,975 | |
| 600 | 2 | Darwin Professional Underwriters, Inc.
| | | 13,608 | |
| 3,600 | | Deerfield Triarc Capital Corp.
| | | 34,380 | |
| 3,262 | | Delphi Financial Group, Inc., Class A
| | | 126,403 | |
| 1,800 | 3 | Delta Financial Corp.
| | | 8,892 | |
| 6,230 | | DiamondRock Hospitality Co.
| | | 119,367 | |
| 3,560 | | Digital Realty Trust, Inc.
| | | 156,604 | |
| 2,457 | | Dime Community Bancorp, Inc.
| | | 35,356 | |
| 1,400 | 2 | Dollar Financial Corp.
| | | 45,920 | |
| 710 | | Donegal Group, Inc., Class A
| | | 12,191 | |
| 1,500 | | Downey Financial Corp.
| | | 61,095 | |
| 400 | | EMC Insurance Group, Inc.
| | | 10,532 | |
| 1,687 | | EastGroup Properties, Inc.
| | | 80,436 | |
| 2,800 | | Education Realty Trust, Inc.
| | | 36,232 | |
| 3,880 | | Employers Holdings, Inc.
| | | 74,341 | |
| 1,800 | 2 | Encore Capital Group, Inc.
| | | 20,538 | |
| 400 | 2 | Enstar Group Ltd.
| | | 51,276 | |
| 300 | | Enterprise Financial Services Corp.
| | | 6,696 | |
| 1,932 | | Entertainment Properties Trust
| | | 106,009 | |
Shares
|
|
|
|
| Value
|
|
| | COMMON STOCKS--continued 1 | | | | |
| | Financials--continued | | | | |
| 1,200 | | Epoch Holding Corp.
| | $ | 16,848 | |
| 1,551 | | Equity Lifestyle Properties, Inc.
| | | 77,922 | |
| 2,568 | | Equity One, Inc.
| | | 67,230 | |
| 300 | | Evercore Partners, Inc., Class A
| | | 7,779 | |
| 4,500 | | Extra Space Storage, Inc.
| | | 70,740 | |
| 2,900 | 2 | Ezcorp, Inc., Class A
| | | 38,164 | |
| 1,028 | | FBL Financial Group, Inc., Class A
| | | 41,613 | |
| 4,000 | | FNB Corp. (PA)
| | | 66,480 | |
| 800 | 2 | FPIC Insurance Group, Inc.
| | | 33,424 | |
| 750 | 2 | Fcstone Group, Inc.
| | | 26,437 | |
| 800 | | Federal Agricultural Mortgage Association, Class C
| | | 23,480 | |
| 3,992 | | FelCor Lodging Trust, Inc.
| | | 83,592 | |
| 2,043 | | Financial Federal Corp.
| | | 55,202 | |
| 1,000 | 2 | First Acceptance Corp.
| | | 4,320 | |
| 5,300 | | First BanCorp
| | | 46,587 | |
| 850 | | First Bancorp, Inc.
| | | 15,376 | |
| 1,046 | | First Busey Corp.
| | | 21,684 | |
| 2,100 | 2 | First Cash Financial Services, Inc.
| | | 41,286 | |
| 2,286 | | First Charter Corp.
| | | 69,266 | |
| 5,225 | | First Commonwealth Financial Corp.
| | | 60,035 | |
| 1,841 | | First Community Bancorp
| | | 89,657 | |
| 768 | | First Community Bancshares, Inc.
| | | 26,373 | |
| 2,341 | | First Financial Bancorp
| | | 27,507 | |
| 1,344 | | First Financial Bankshares, Inc.
| | | 52,456 | |
| 1,088 | | First Financial Corp.
| | | 33,369 | |
| 1,072 | | First Financial Holdings, Inc.
| | | 30,959 | |
| 1,288 | | First Indiana Corp.
| | | 40,958 | |
| 3,300 | | First Industrial Realty Trust
| | | 134,475 | |
| 1,315 | | First Merchants Corp.
| | | 28,996 | |
| 1,400 | 2 | First Mercury Financial Corp.
| | | 31,010 | |
| 3,900 | | First Midwest Bancorp, Inc.
| | | 131,352 | |
| 8,343 | | First Niagara Financial Group, Inc.
| | | 110,128 | |
| 1,000 | | First Place Financial Corp.
| | | 16,690 | |
| 1,700 | | First Potomac Realty Trust
| | | 35,530 | |
| 600 | 2 | First Regional Bancorp
| | | 14,100 | |
Shares
|
|
|
|
| Value
|
|
| | COMMON STOCKS--continued 1 | | | | |
| | Financials--continued | | | | |
| 250 | | First South Bancorp, Inc.
| | $ | 6,245 | |
| 1,700 | | First State Bancorporation
| | | 28,849 | |
| 1,238 | 2,3 | FirstFed Financial Corp.
| | | 52,962 | |
| 5,800 | | FirstMerit Corp.
| | | 122,960 | |
| 3,150 | | Flagstar Bancorp, Inc.
| | | 25,484 | |
| 100 | | Flagstone Reinsurance Holdings Ltd.
| | | 1,312 | |
| 1,525 | | Flushing Financial Corp.
| | | 25,925 | |
| 2,200 | 2 | Franklin Bank Corp.
| | | 17,006 | |
| 3,600 | | Franklin Street Properties Corp.
| | | 58,500 | |
| 3,840 | 2 | Freedom Acquisition Holdings, Inc.
| | | 50,842 | |
| 4,900 | 2,3 | Fremont General Corp.
| | | 13,573 | |
| 10,300 | | Friedman, Billings, Ramsey Group, Inc., Class A
| | | 44,290 | |
| 2,816 | | Frontier Financial Corp.
| | | 62,487 | |
| 422 | | GAMCO Investors, Inc., Class A
| | | 26,126 | |
| 1,000 | 2 | GFI Group, Inc.
| | | 86,320 | |
| 3,140 | | GMH Communities Trust
| | | 23,173 | |
| 1,200 | | Getty Realty Holding Corp.
| | | 34,116 | |
| 3,496 | | Glacier Bancorp, Inc.
| | | 71,109 | |
| 900 | | Gladstone Capital Corp.
| | | 16,947 | |
| 2,765 | | Glimcher Realty Trust
| | | 61,383 | |
| 1,000 | | Gramercy Capital Corp.
| | | 26,370 | |
| 700 | | Great Southern Bancorp, Inc.
| | | 16,380 | |
| 600 | | Greene Bancshares, Inc.
| | | 19,230 | |
| 1,400 | | Greenhill & Co., Inc.
| | | 103,572 | |
| 1,100 | 2 | Greenlight Capital Reinsurance Ltd.
| | | 22,814 | |
| 1,800 | 2 | Grubb & Ellis Co.
| | | 15,282 | |
| 1,100 | 2 | HFF, Inc.
| | | 11,055 | |
| 1,906 | | Hancock Holding Co.
| | | 72,485 | |
| 2,980 | | Hanmi Financial Corp.
| | | 32,840 | |
| 1,054 | | Harleysville Group, Inc.
| | | 32,853 | |
| 2,199 | | Harleysville National Corp.
| | | 33,139 | |
| 3,400 | | Healthcare Realty Trust, Inc.
| | | 89,896 | |
| 850 | | Heartland Financial USA, Inc.
| | | 16,949 | |
| 2,500 | | Hercules Technology Growth Capital, Inc.
| | | 32,075 | |
| 800 | | Heritage Commerce Corp.
| | | 14,832 | |
Shares
|
|
|
|
| Value
|
|
| | COMMON STOCKS--continued 1 | | | | |
| | Financials--continued | | | | |
| 2,900 | | Hersha Hospitality Trust
| | $ | 31,349 | |
| 4,100 | | Highwoods Properties, Inc.
| | | 147,436 | |
| 2,496 | | Hilb Rogal & Hamilton Co.
| | | 109,999 | |
| 3,184 | 2 | Hilltop Holdings, Inc.
| | | 38,272 | |
| 300 | | Home Bancshares, Inc.
| | | 6,396 | |
| 2,615 | | Home Properties of New York, Inc.
| | | 134,463 | |
| 3,293 | | Horace Mann Educators Corp.
| | | 68,132 | |
| 875 | | Horizon Financial Corp.
| | | 15,172 | |
| 5,900 | | IMPAC Mortgage Holdings, Inc.
| | | 6,608 | |
| 4,200 | | IPC Holdings Ltd.
| | | 125,622 | |
| 899 | | Iberiabank Corp.
| | | 44,563 | |
| 400 | | Imperial Capital Bancorp, Inc.
| | | 8,636 | |
| 32 | | Imperial Credit Industries, Inc., Warrants
| | | 0 | |
| 340 | | Independence Holdings Co.
| | | 5,518 | |
| 1,100 | | Independent Bank Corp.- Massachusetts
| | | 32,538 | |
| 2,006 | | Independent Bank Corp.- Michigan
| | | 21,183 | |
| 1,400 | | Infinity Property & Casualty
| | | 56,308 | |
| 1,000 | 2 | Information Services Group, Inc.
| | | 7,540 | |
| 4,200 | | Inland Real Estate Corp.
| | | 62,580 | |
| 1,462 | | Integra Bank Corp.
| | | 25,190 | |
| 3,200 | 2 | Interactive Brokers Group, Inc., Class A
| | | 92,384 | |
| 3,510 | | International Bancshares Corp.
| | | 76,729 | |
| 2,800 | | International Securities Exchange Holdings, Inc.
| | | 187,740 | |
| 3,700 | 2 | Investors Bancorp, Inc.
| | | 55,500 | |
| 3,500 | | Investors Real Estate Trust
| | | 37,975 | |
| 1,407 | | Irwin Financial Corp.
| | | 13,563 | |
| 800 | | James River Group, Inc.
| | | 27,440 | |
| 1,500 | | Jer Investors Trust, Inc.
| | | 16,755 | |
| 1,800 | 2 | KBW, Inc.
| | | 54,522 | |
| 2,000 | | KNBT Bancorp, Inc.
| | | 34,280 | |
| 255 | | Kansas City Life Insurance Co.
| | | 11,891 | |
| 1,500 | | Kearny Financial Corp.
| | | 19,875 | |
| 2,130 | | Kite Realty Group Trust
| | | 38,596 | |
| 8,100 | 2 | Knight Capital Group, Inc., Class A
| | | 108,621 | |
| 1,000 | | Kohlberg Capital Corp.
| | | 12,880 | |
Shares
|
|
|
|
| Value
|
|
| | COMMON STOCKS--continued 1 | | | | |
| | Financials--continued | | | | |
| 1,500 | | LTC Properties, Inc.
| | $ | 38,010 | |
| 2,920 | | LaSalle Hotel Properties
| | | 120,654 | |
| 3,800 | 2 | Labranche & Co. Inc.
| | | 20,824 | |
| 4,300 | 2,3 | Ladenburg Thalmann Financial Services, Inc.
| | | 8,256 | |
| 1,355 | | Lakeland Bancorp, Inc.
| | | 18,381 | |
| 900 | | Lakeland Financial Corp.
| | | 18,819 | |
| 1,239 | | LandAmerica Financial Group, Inc.
| | | 34,432 | |
| 4,710 | | Lexington Realty Trust
| | | 93,211 | |
| 3,800 | 3 | Luminent Mortgage Capital, Inc.
| | | 7,410 | |
| 2,300 | | MB Financial, Inc.
| | | 76,682 | |
| 4,400 | | MCG Capital Corp.
| | | 61,644 | |
| 6,400 | | MFA Mortgage Investments, Inc.
| | | 54,784 | |
| 2,100 | | MVC Capital, Inc.
| | | 35,826 | |
| 1,139 | | Macatawa Bank Corp.
| | | 12,688 | |
| 2,700 | | Maguire Properties, Inc.
| | | 73,575 | |
| 1,165 | | MainSource Financial Group, Inc.
| | | 19,584 | |
| 4,000 | 2 | Marathon Acquisition Corp.
| | | 31,880 | |
| 2,200 | 2 | MarketAxess Holdings, Inc.
| | | 34,474 | |
| 4,700 | | Max Capital Group Ltd.
| | | 132,963 | |
| 1,900 | 2 | Meadowbrook Insurance Group, Inc.
| | | 18,297 | |
| 3,600 | | Medical PPTYS Trust, Inc.
| | | 47,268 | |
| 3,110 | 2 | Meruelo Maddux Properties, Inc.
| | | 14,959 | |
| 1,581 | | Mid-American Apartment Communities, Inc.
| | | 82,212 | |
| 688 | | Midland Co.
| | | 43,771 | |
| 1,100 | | Midwest Banc Holdings, Inc.
| | | 14,630 | |
| 600 | | Mission West Properties, Inc.
| | | 7,194 | |
| 7,400 | | Montpelier Re Holdings Ltd.
| | | 132,460 | |
| 8,400 | 2 | Move, Inc.
| | | 21,336 | |
| 200 | | NASB Financial, Inc.
| | | 5,940 | |
| 2,423 | | NBT Bancorp, Inc.
| | | 59,775 | |
| 700 | 2 | NTR Acquisition Co.
| | | 6,734 | |
| 1,600 | | Nara Bancorp, Inc.
| | | 24,768 | |
| 1 | | National City Corp.
| | | 15 | |
| 2,700 | | National Financial Partners Corp.
| | | 147,609 | |
| 1,721 | | National Health Investors, Inc.
| | | 50,408 | |
Shares
|
|
|
|
| Value
|
|
| | COMMON STOCKS--continued 1 | | | | |
| | Financials--continued | | | | |
| 800 | | National Interstate Corp.
| | $ | 25,600 | |
| 3,491 | | National Penn Bancshares, Inc.
| | | 58,853 | |
| 4,686 | | National Retail Properties, Inc.
| | | 118,790 | |
| 191 | 2 | National Western Life Insurance Co., Class A
| | | 41,500 | |
| 6,001 | | Nationwide Health Properties, Inc.
| | | 187,351 | |
| 800 | 2 | Navigators Group, Inc.
| | | 48,240 | |
| 900 | | Nelnet, Inc., Class A
| | | 16,722 | |
| 8,100 | | Newalliance Bancshares, Inc.
| | | 113,319 | |
| 3,300 | | Newcastle Investment Corp.
| | | 49,005 | |
| 400 | 2 | Newstar Financial, Inc.
| | | 4,016 | |
| 2,400 | 2 | NexCen Brands, Inc.
| | | 14,736 | |
| 5,200 | | Northstar Realty Finance Corp.
| | | 48,620 | |
| 1,300 | | Northwest Bancorp, Inc.
| | | 38,285 | |
| 675 | 2,3 | Novastar Financial, Inc.
| | | 3,564 | |
| 400 | | Nymagic, Inc.
| | | 11,536 | |
| 2,505 | 2 | Ocwen Financial Corp.
| | | 18,687 | |
| 1,800 | | Odyssey Re Holdings Corp.
| | | 66,924 | |
| 5,210 | | Old National Bancorp
| | | 87,059 | |
| 1,219 | | Old Second Bancorp, Inc.
| | | 34,559 | |
| 839 | | Omega Financial Corp.
| | | 22,947 | |
| 4,800 | | Omega Healthcare Investors
| | | 80,304 | |
| 2,800 | | optionsXpress Holdings, Inc.
| | | 83,328 | |
| 1,591 | | Oriental Financial Group
| | | 19,871 | |
| 100 | 2 | Oritani Financial Corp.
| | | 1,660 | |
| 1,776 | | PFF Bancorp, Inc.
| | | 18,914 | |
| 866 | 2 | PICO Holdings, Inc.
| | | 35,723 | |
| 2,919 | 2 | PMA Capital Corp.
| | | 28,898 | |
| 1,129 | | PS Business Parks, Inc.
| | | 65,821 | |
| 3,489 | | Pacific Capital Bancorp
| | | 72,327 | |
| 865 | 3 | Park National Corp.
| | | 68,560 | |
| 1,140 | | Parkway Properties, Inc.
| | | 49,020 | |
| 3,121 | | Partners Trust Financial Group, Inc.
| | | 38,763 | |
| 2,100 | | Patriot Capital Funding, Inc.
| | | 26,292 | |
| 2,100 | | Pennantpark Investment Corp.
| | | 27,426 | |
| 2,396 | | Pennsylvania Real Estate Investment Trust
| | | 91,407 | |
Shares
|
|
|
|
| Value
|
|
| | COMMON STOCKS--continued 1 | | | | |
| | Financials--continued | | | | |
| 900 | 2 | Penson Worldwide, Inc.
| | $ | 15,237 | |
| 745 | | Peoples Bancorp, Inc.
| | | 18,603 | |
| 8,100 | | Phoenix Cos., Inc.
| | | 111,618 | |
| 1,100 | 2 | Pinnacle Financial Partners, Inc.
| | | 32,109 | |
| 1,344 | 2 | Piper Jaffray Cos., Inc.
| | | 69,082 | |
| 4,000 | | Platinum Underwriters Holdings Ltd.
| | | 144,000 | |
| 1,300 | 2 | Portfolio Recovery Associates, Inc.
| | | 58,643 | |
| 3,200 | | Post Properties, Inc.
| | | 131,200 | |
| 2,807 | | Potlatch Corp.
| | | 133,782 | |
| 650 | | Preferred Bank Los Angeles, CA
| | | 19,325 | |
| 1,553 | | Presidential Life Corp.
| | | 27,348 | |
| 2,400 | 2 | Primus Guaranty Ltd.
| | | 21,984 | |
| 1,400 | | PrivateBancorp, Inc.
| | | 39,424 | |
| 2,380 | 2 | ProAssurance Corp.
| | | 131,233 | |
| 800 | | Prospect Energy Corp.
| | | 11,712 | |
| 2,600 | | Prosperity Bancshares, Inc.
| | | 84,032 | |
| 2,467 | | Provident Bankshares Corp.
| | | 60,861 | |
| 4,730 | | Provident Financial Services, Inc.
| | | 74,923 | |
| 2,872 | | Provident New York Bancorp
| | | 36,503 | |
| 100 | | QC Holdings, Inc.
| | | 1,516 | |
| 300 | | Quadra Realty Trust, Inc.
| | | 2,481 | |
| 4,830 | | RAIT Investment Trust
| | | 43,953 | |
| 600 | 2 | RAM Holdings Ltd.
| | | 4,146 | |
| 1,510 | | RLI Corp.
| | | 87,837 | |
| 1,600 | | Ramco-Gershenson Properties
| | | 45,776 | |
| 7,300 | | Realty Income Corp.
| | | 215,642 | |
| 1,600 | | Redwood Trust, Inc.
| | | 42,160 | |
| 1,200 | | Renasant Corp.
| | | 27,900 | |
| 651 | | Republic Bancorp, Inc.
| | | 10,058 | |
| 900 | | Resource America, Inc., Class A
| | | 13,923 | |
| 900 | | Resource Capital Corp.
| | | 9,288 | |
| 600 | | Rockville Financial, Inc.
| | | 9,000 | |
| 100 | | Roma Financial Corp.
| | | 1,747 | |
| 375 | | Royal Bancshares of Pennsylvania
| | | 7,118 | |
| 1,771 | | S & T Bancorp, Inc.
| | | 58,656 | |
Shares
|
|
|
|
| Value
|
|
| | COMMON STOCKS--continued 1 | | | | |
| | Financials--continued | | | | |
| 850 | | S.Y. Bancorp, Inc.
| | $ | 21,471 | |
| 621 | | SCBT Financial Corp.
| | | 19,841 | |
| 2,700 | 2 | SVB Financial Group
| | | 139,833 | |
| 1,863 | | SWS Group, Inc.
| | | 35,378 | |
| 1,200 | | Safety Insurance Group, Inc.
| | | 43,152 | |
| 1,000 | | Sanders Morris Harris Group, Inc.
| | | 9,090 | |
| 1,119 | | Sandy Spring Bancorp, Inc.
| | | 33,257 | |
| 313 | | Santander BanCorp
| | | 4,288 | |
| 1,029 | | Saul Centers, Inc.
| | | 56,410 | |
| 3,400 | 2 | Scottish Re Group Ltd.
| | | 8,704 | |
| 2,100 | 2 | Seabright Insurance Holdings, Inc.
| | | 35,028 | |
| 1,020 | 3 | Seacoast Banking Corp. of Florida
| | | 14,943 | |
| 1,100 | | Security Bank Corp.
| | | 11,462 | |
| 1,300 | | Security Capital Assurance Ltd.
| | | 17,056 | |
| 4,392 | | Selective Insurance Group, Inc.
| | | 106,770 | |
| 5,543 | | Senior Housing Properties Trust
| | | 124,274 | |
| 100 | | Sierra Bancorp
| | | 2,718 | |
| 2,000 | 2 | Signature Bank
| | | 68,300 | |
| 1,000 | | Simmons 1st National Corp., Class A
| | | 27,040 | |
| 4,900 | | South Financial Group, Inc.
| | | 101,234 | |
| 791 | | Southside Bancshares, Inc.
| | | 17,521 | |
| 1,400 | | Southwest Bancorp, Inc.
| | | 26,502 | |
| 1,455 | | Sovran Self Storage, Inc.
| | | 68,836 | |
| 1,400 | 2 | Star Maritime Acquisition Corp.
| | | 20,678 | |
| 1,047 | | State Auto Financial Corp.
| | | 28,813 | |
| 1,885 | | Sterling Bancorp
| | | 27,691 | |
| 5,811 | | Sterling Bancshares, Inc.
| | | 70,894 | |
| 2,087 | 2 | Sterling Financial Corp.
| | | 38,296 | |
| 3,661 | | Sterling Financial Corp. WA
| | | 82,373 | |
| 1,277 | | Stewart Information Services Corp.
| | | 37,033 | |
| 966 | 2 | Stifel Financial Corp.
| | | 54,821 | |
| 5,350 | | Strategic Hotels & Resorts, Inc.
| | | 116,844 | |
| 800 | | Suffolk Bancorp
| | | 26,424 | |
| 1,035 | 2 | Sun Bancorp, Inc.
| | | 17,916 | |
| 1,566 | | Sun Communities, Inc.
| | | 47,763 | |
Shares
|
|
|
|
| Value
|
|
| | COMMON STOCKS--continued 1 | | | | |
| | Financials--continued | | | | |
| 4,200 | | Sunstone Hotel Investors, Inc.
| | $ | 116,802 | |
| 1,900 | 2 | Superior Bancorp
| | | 14,516 | |
| 3,730 | | Susquehanna Bankshares, Inc.
| | | 75,234 | |
| 2,290 | | Tanger Factory Outlet Centers, Inc.
| | | 96,455 | |
| 400 | | Taylor Capital Group, Inc.
| | | 10,344 | |
| 934 | | Technology Investment Capital Corp.
| | | 12,189 | |
| 708 | 2 | Tejon Ranch Co.
| | | 28,377 | |
| 1,700 | 2 | Texas Capital Bancshares, Inc.
| | | 37,621 | |
| 1,100 | | Thomas Properties Group, Inc.
| | | 13,409 | |
| 1,100 | 2 | Thomas Weisel Partners Group, Inc.
| | | 17,501 | |
| 1,500 | | TierOne Corp.
| | | 34,275 | |
| 724 | | Tompkins Financial Corporation
| | | 30,075 | |
| 1,800 | | Tower Group, Inc.
| | | 54,342 | |
| 2,700 | 2 | Tradestation Group, Inc.
| | | 32,940 | |
| 900 | | TriCo Bancshares
| | | 19,890 | |
| 767 | 2 | Triad Guaranty, Inc.
| | | 6,182 | |
| 5,531 | | Trustco Bank Corp.
| | | 58,297 | |
| 3,600 | | Trustmark Corp.
| | | 97,164 | |
| 3,350 | | U-Store-It Trust
| | | 43,215 | |
| 1,100 | | U.S. Global Investors, Inc., Class A
| | | 25,256 | |
| 7,500 | | UCBH Holdings, Inc.
| | | 128,025 | |
| 2,200 | | UMB Financial Corp.
| | | 92,400 | |
| 764 | | USB Holdings Co., Inc.
| | | 16,648 | |
| 4,372 | | Umpqua Holdings Corp.
| | | 74,018 | |
| 950 | | Union Bankshares Corp.
| | | 20,302 | |
| 1,300 | 2 | United America Indemnity Ltd., Class A
| | | 28,665 | |
| 2,900 | | United Bankshares, Inc.
| | | 87,870 | |
| 2,529 | | United Community Banks, Inc.
| | | 55,992 | |
| 1,892 | | United Community Financial Corp.
| | | 12,109 | |
| 1,500 | | United Fire & Casualty Co.
| | | 48,060 | |
| 200 | | United Security Bancshares
| | | 3,300 | |
| 2,300 | 2 | Universal American Financial Corp.
| | | 55,798 | |
| 800 | | Universal Health Realty Trust, Inc.
| | | 29,576 | |
| 900 | | Univest Corp.
| | | 19,692 | |
| 1,500 | | Urstadt Biddle Properties, Class A
| | | 24,930 | |
Shares
|
|
|
|
| Value
|
|
| | COMMON STOCKS--continued 1 | | | | |
| | Financials--continued | | | | |
| 200 | | ViewPoint Financial Group
| | $ | 3,590 | |
| 1,288 | 2 | Virginia Commerce Bancorp, Inc.
| | | 18,406 | |
| 8,100 | | W Holding Co., Inc.
| | | 17,010 | |
| 600 | | W.P. Stewart & Co.
| | | 3,888 | |
| 500 | | WSFS Financial Corp.
| | | 28,830 | |
| 6,000 | | Waddell & Reed Financial, Inc., Class A
| | | 199,320 | |
| 3,202 | | Washington Real Estate Investment Trust
| | | 112,774 | |
| 1,000 | | Washington Trust Bancorp
| | | 24,930 | |
| 200 | 2 | Wauwatosa Holdings, Inc.
| | | 3,346 | |
| 0 | | Wells Fargo & Co.
| | | 16 | |
| 1,835 | | Wesbanco, Inc.
| | | 42,333 | |
| 1,100 | | West Coast Bancorp
| | | 29,832 | |
| 2,400 | | WestAmerica Bancorp.
| | | 115,392 | |
| 800 | 2,3 | Western Alliance Bancorp
| | | 18,192 | |
| 728 | | Westfield Financial, Inc.
| | | 7,411 | |
| 1,200 | | Wilshire Bancorp, Inc.
| | | 12,360 | |
| 1,900 | | Winthrop Realty Trust
| | | 10,374 | |
| 1,999 | | Wintrust Financial Corp.
| | | 73,443 | |
| 1,500 | 2 | World Acceptance Corp.
| | | 48,390 | |
| 2,568 | | Zenith National Insurance Corp.
| | | 103,182 | |
| 1,400 | 2 | eHealth, Inc.
|
|
| 39,116
|
|
| | TOTAL
|
|
| 19,183,707
|
|
| | Health Care--13.4% | | | | |
| 1,540 | 2 | AMAG Pharmaceutical, Inc.
| | | 100,639 | |
| 2,393 | 2 | AMN Healthcare Services, Inc.
| | | 45,491 | |
| 1,700 | 2 | Abaxis, Inc.
| | | 49,844 | |
| 2,100 | 2 | Abiomed, Inc.
| | | 28,707 | |
| 2,700 | 2 | Acadia Pharmaceuticals, Inc.
| | | 41,526 | |
| 800 | 2 | Accuray, Inc.
| | | 16,080 | |
| 1,900 | 2 | Acorda Therapeutics, Inc.
| | | 38,513 | |
| 2,400 | 2 | Adams Respiratory Therapeutics, Inc.
| | | 105,456 | |
| 100 | 2 | Affymax, Inc.
| | | 2,845 | |
| 4,900 | 2 | Affymetrix, Inc.
| | | 124,754 | |
| 800 | 2 | Air Methods Corp.
| | | 43,176 | |
| 2,800 | 2 | Akorn, Inc.
| | | 20,664 | |
Shares
|
|
|
|
| Value
|
|
| | COMMON STOCKS--continued 1 | | | | |
| | Health Care--continued | | | | |
| 2,294 | 2 | Albany Molecular Research, Inc.
| | $ | 41,498 | |
| 2,603 | 2 | Alexion Pharmaceuticals, Inc.
| | | 199,129 | |
| 700 | 2 | Alexza Pharmaceuticals, Inc.
| | | 5,698 | |
| 4,300 | 2 | Align Technology, Inc.
| | | 89,010 | |
| 6,900 | 2 | Alkermes, Inc.
| | | 111,780 | |
| 2,700 | 2 | Alliance Imaging, Inc.
| | | 26,757 | |
| 2,200 | 2 | Allos Therapeutics, Inc.
| | | 12,804 | |
| 3,621 | 2 | Allscripts Healthcare Solutions, Inc.
| | | 100,302 | |
| 2,300 | 2 | Alnylam Pharmaceuticals, Inc.
| | | 72,634 | |
| 3,145 | 2 | Alpharma, Inc., Class A
| | | 64,849 | |
| 900 | 2 | Altus Pharmaceuticals, Inc.
| | | 12,456 | |
| 1,866 | 2 | Amedisys, Inc.
| | | 79,212 | |
| 1,300 | 2 | American Dental Partners, Inc.
| | | 32,227 | |
| 5,600 | 2 | American Medical Systems Holdings, Inc.
| | | 71,624 | |
| 3,800 | 2 | Amerigroup Corp.
| | | 133,000 | |
| 2,500 | 2 | Amsurg Corp.
| | | 66,125 | |
| 1,195 | | Analogic Corp.
| | | 68,294 | |
| 1,500 | 2 | AngioDynamics, Inc.
| | | 30,000 | |
| 300 | 2 | Animal Health International, Inc.
| | | 3,270 | |
| 5,700 | 2 | Applera Corp.
| | | 92,967 | |
| 3,300 | 2 | Apria Healthcare Group, Inc.
| | | 79,761 | |
| 1,400 | 2 | ArQule, Inc.
| | | 10,990 | |
| 4,400 | 2 | Arena Pharmaceuticals, Inc.
| | | 42,284 | |
| 6,302 | 2,3 | Ariad Pharmaceuticals, Inc.
| | | 32,140 | |
| 2,700 | 2 | Array BioPharma, Inc.
| | | 30,240 | |
| 2,062 | 2 | Arthrocare Corp.
| | | 133,700 | |
| 1,700 | 2 | Aspect Medical Systems, Inc.
| | | 23,273 | |
| 3,500 | 2 | Assisted Living Concepts, Inc., Class A
| | | 30,800 | |
| 1,500 | 2 | Auxilium Pharmaceutical, Inc.
| | | 39,615 | |
| 2,600 | 2 | Beijing Med-Pharm Corp.
| | | 32,188 | |
| 1,300 | 2 | Bentley Pharmaceuticals, Inc.
| | | 17,992 | |
| 1,300 | 2 | Bio Rad Laboratories, Inc., Class A
| | | 125,554 | |
| 900 | 2 | Bio-Reference Laboratories, Inc.
| | | 28,872 | |
| 6,894 | 2 | BioMarin Pharmaceutical, Inc.
| | | 191,171 | |
| 1,200 | 2 | BioMimetic Therapeutics, Inc.
| | | 16,524 | |
Shares
|
|
|
|
| Value
|
|
| | COMMON STOCKS--continued 1 | | | | |
| | Health Care--continued | | | | |
| 1,600 | 2,3 | Bionovo, Inc.
| | $ | 3,776 | |
| 900 | 2 | Bradley Pharmaceuticals, Inc.
| | | 17,703 | |
| 3,852 | 2 | Bruker BioSciences Corp.
| | | 39,868 | |
| 2,102 | 2 | CONMED Corp.
| | | 59,781 | |
| 4,257 | 2 | CV Therapeutics, Inc.
| | | 43,592 | |
| 600 | 2 | Cadence Pharmaceuticals, Inc.
| | | 8,568 | |
| 2,065 | | Cambrex Corp.
| | | 23,520 | |
| 300 | 2 | Cantel Medical Corp.
| | | 5,376 | |
| 800 | 2 | Capital Senior Living Corp.
| | | 7,152 | |
| 400 | 2 | Caraco Pharmaceutical Laboratories, Ltd.
| | | 6,228 | |
| 5,290 | 2 | Cell Genesys, Inc.
| | | 17,986 | |
| 3,300 | 2 | Centene Corp.
| | | 76,989 | |
| 4,000 | 2 | Cepheid, Inc.
| | | 103,520 | |
| 1,826 | | Chemed Corp.
| | | 104,666 | |
| 800 | | Computer Programs & Systems, Inc.
| | | 19,816 | |
| 2,500 | 2 | Conceptus, Inc.
| | | 54,825 | |
| 671 | 2 | Corvel Corp.
| | | 17,835 | |
| 2,700 | 2 | Cross Country Healthcare, Inc.
| | | 42,417 | |
| 1,100 | 2 | Cryolife, Inc.
| | | 7,425 | |
| 4,238 | 2 | Cubist Pharmaceuticals, Inc.
| | | 99,169 | |
| 900 | 2 | Cutera, Inc.
| | | 22,068 | |
| 1,698 | 2 | Cyberonics, Inc.
| | | 24,621 | |
| 800 | 2 | Cynosure, Inc., Class A
| | | 30,408 | |
| 2,800 | 2 | Cypress Biosciences, Inc.
| | | 37,772 | |
| 1,700 | 2 | Cytokinetics, Inc.
| | | 8,415 | |
| 4,300 | 2 | Cytrex Corp.
| | | 16,254 | |
| 1,600 | 2 | DJ Orthopedics, Inc.
| | | 79,920 | |
| 959 | | Datascope Corp.
| | | 34,649 | |
| 6,600 | 2,3 | Dendreon Corp.
| | | 49,302 | |
| 1,501 | 2 | Dionex Corp.
| | | 132,088 | |
| 8,300 | 2 | Discovery Laboratories, Inc.
| | | 20,667 | |
| 4,000 | 2 | Durect Corp.
| | | 23,280 | |
| 3,094 | 2 | Eclipsys Corp.
| | | 69,801 | |
| 500 | 2 | Emergency Medical Services Corp., Class A
| | | 15,185 | |
| 200 | 2 | Emeritus Corp.
| | | 6,600 | |
Shares
|
|
|
|
| Value
|
|
| | COMMON STOCKS--continued 1 | | | | |
| | Health Care--continued | | | | |
| 7,884 | 2 | Encysive Pharmaceuticals, Inc.
| | $ | 10,328 | |
| 2,008 | 2 | Enzo Biochem, Inc.
| | | 24,317 | |
| 4,000 | 2 | Enzon, Inc.
| | | 38,120 | |
| 3,068 | 2 | Ev3, Inc.
| | | 45,038 | |
| 6,455 | 2 | Exelixis, Inc.
| | | 71,005 | |
| 61,000 | | Five Star Quality Care, Inc., Rights
| | | 0 | |
| 800 | 2 | GTX, Inc.
| | | 12,624 | |
| 600 | 2 | Genomic Health, Inc.
| | | 15,378 | |
| 2,000 | 2 | Gentiva Health Services, Inc.
| | | 37,960 | |
| 7,500 | 2 | Genvec, Inc.
| | | 19,050 | |
| 5,240 | 2 | Geron Corp.
| | | 40,034 | |
| 1,600 | 2 | Greatbatch Technologies, Inc.
| | | 39,776 | |
| 1,100 | 2 | HMS Holdings Corp.
| | | 31,317 | |
| 1,964 | 2 | Haemonetics Corp.
| | | 100,930 | |
| 3,900 | 2 | Halozyme Therapeutics, Inc.
| | | 35,802 | |
| 600 | 2 | Hansen Medical, Inc.
| | | 23,322 | |
| 2,100 | 2 | HealthExtras, Inc.
| | | 61,194 | |
| 6,000 | 2 | HealthSouth Corp.
| | | 120,300 | |
| 2,800 | 2 | Healthspring, Inc.
| | | 58,800 | |
| 2,600 | 2 | Healthways, Inc.
| | | 157,820 | |
| 8,450 | 2 | Hologic, Inc.
| | | 574,009 | |
| 10,300 | 2 | Human Genome Sciences, Inc.
| | | 97,438 | |
| 3,100 | 2 | Hythiam, Inc.
| | | 22,630 | |
| 1,500 | 2 | I-Flow Corp.
| | | 27,345 | |
| 1,100 | 2 | ICU Medical, Inc.
| | | 44,110 | |
| 1,200 | 2 | Idenix Pharmaceuticals, Inc.
| | | 3,108 | |
| 3,812 | 2 | Illumina, Inc.
| | | 214,044 | |
| 4,952 | 2 | Immucor, Inc.
| | | 159,702 | |
| 5,800 | 2 | Immunomedics, Inc.
| | | 13,340 | |
| 7,100 | 2 | Incyte Genomics, Inc.
| | | 61,486 | |
| 5,400 | 2 | Indevus Pharmaceuticals, Inc.
| | | 41,580 | |
| 1,500 | 2 | Integra Lifesciences Corp.
| | | 72,705 | |
| 2,248 | 2 | InterMune, Inc.
| | | 44,780 | |
| 2,163 | | Invacare Corp.
| | | 58,531 | |
| 3,660 | 2 | Inverness Medical Innovations, Inc.
| | | 219,929 | |
Shares
|
|
|
|
| Value
|
|
| | COMMON STOCKS--continued 1 | | | | |
| | Health Care--continued | | | | |
| 5,978 | 2 | Isis Pharmaceuticals, Inc.
| | $ | 105,332 | |
| 1,900 | 2 | Javelin Pharmaceuticals, Inc.
| | | 10,051 | |
| 2,550 | 2 | KV Pharmaceutical Co., Class A
| | | 79,917 | |
| 1,000 | 2 | Kendle International, Inc.
| | | 40,330 | |
| 900 | 2 | Kensey Nash Corp.
| | | 24,624 | |
| 2,800 | 2 | Keryx Biopharmaceuticals, Inc.
| | | 28,840 | |
| 1,880 | 2 | Kindred Healthcare, Inc.
| | | 39,931 | |
| 1,800 | 2 | Kosan Biosciences, Inc.
| | | 9,162 | |
| 3,300 | 2 | Kyphon, Inc.
| | | 233,904 | |
| 1,650 | | LCA Vision, Inc.
| | | 28,165 | |
| 1,000 | 2 | LHC Group, Inc.
| | | 22,980 | |
| 700 | | Landauer, Inc.
| | | 34,489 | |
| 2,700 | 2 | LifeCell Corp.
| | | 118,962 | |
| 5,400 | 2 | Ligand Pharmaceuticals, Inc., Class B
| | | 29,052 | |
| 2,039 | 2 | Luminex Corp.
| | | 32,502 | |
| 5,700 | 2 | MGI PHARMA, Inc.
| | | 185,706 | |
| 600 | 2 | MWI Veterinary Supply, Inc.
| | | 25,050 | |
| 2,800 | 2 | Magellan Health Services, Inc.
| | | 117,880 | |
| 2,400 | 2,3 | Mannkind Corp.
| | | 21,912 | |
| 2,500 | 2 | Martek Biosciences Corp.
| | | 76,375 | |
| 1,700 | 2 | Matria Healthcare, Inc.
| | | 43,656 | |
| 1,707 | 2 | Maxygen, Inc.
| | | 12,922 | |
| 1,000 | 2 | MedCath Corp.
| | | 27,730 | |
| 9,100 | 2 | Medarex, Inc.
| | | 108,745 | |
| 800 | 2 | Medical Action Industries, Inc.
| | | 16,448 | |
| 3,700 | 2 | Medicines Co.
| | | 70,855 | |
| 4,300 | | Medicis Pharmaceutical Corp., Class A
| | | 127,667 | |
| 1,900 | | Medivation, Inc.
| | | 39,691 | |
| 3,076 | | Mentor Corp.
| | | 130,945 | |
| 2,373 | | Meridian Bioscience, Inc.
| | | 78,523 | |
| 1,954 | 2 | Merit Medical Systems, Inc.
| | | 25,500 | |
| 700 | 2 | Metabolix, Inc.
| | | 20,223 | |
| 1,400 | 2 | Micrus Endovascular Corp.
| | | 27,510 | |
| 4,800 | 2 | Minrad International, Inc.
| | | 21,072 | |
| 900 | 2 | Molina Healthcare, Inc.
| | | 34,299 | |
Shares
|
|
|
|
| Value
|
|
| | COMMON STOCKS--continued 1 | | | | |
| | Health Care--continued | | | | |
| 1,700 | 2 | Momenta Pharmaceuticals, Inc.
| | $ | 22,117 | |
| 3,100 | 2 | Myriad Genetics, Inc.
| | | 171,616 | |
| 4,403 | 2 | Nabi Biopharmaceuticals
| | | 16,996 | |
| 2,500 | 2 | Nastech Pharmaceutical Co.
| | | 34,075 | |
| 500 | | National Healthcare Corp.
| | | 24,900 | |
| 2,100 | 2 | Natus Medical, Inc.
| | | 38,010 | |
| 7,000 | 2 | Nektar Therapeutics
| | | 41,860 | |
| 3,300 | 2 | Neurocrine Biosciences, Inc.
| | | 30,525 | |
| 1,300 | 2 | Neurogen Corp.
| | | 5,122 | |
| 1,100 | 2 | Nighthawk Radiology Holdings, Inc.
| | | 25,894 | |
| 800 | 2 | Northstar Neuroscience, Inc.
| | | 10,600 | |
| 1,200 | 2 | Novacea, Inc.
| | | 9,264 | |
| 1,801 | 2 | Noven Pharmaceuticals, Inc.
| | | 27,843 | |
| 2,800 | 2 | NuVasive, Inc.
| | | 119,812 | |
| 2,100 | 2 | NxStage Medical, Inc.
| | | 30,975 | |
| 4,400 | 2 | OSI Pharmaceuticals, Inc.
| | | 182,908 | |
| 200 | 2 | Obagi Medical Products, Inc.
| | | 4,368 | |
| 2,775 | 2 | Odyssey Healthcare, Inc.
| | | 28,444 | |
| 2,300 | 2 | Omnicell, Inc.
| | | 60,720 | |
| 1,200 | 2 | Omrix Biopharmaceuticals, Inc.
| | | 41,808 | |
| 3,870 | 2 | Onyx Pharmaceuticals, Inc.
| | | 180,768 | |
| 3,400 | 2 | OraSure Technologies, Inc.
| | | 30,838 | |
| 100 | 2 | Orexigen Therapeutics, Inc.
| | | 1,464 | |
| 1,000 | 2 | Orthofix International NV
| | | 53,900 | |
| 300 | 2,3 | Osiris Therapeutics, Inc.
| | | 4,245 | |
| 3,126 | | Owens & Minor, Inc.
| | | 126,728 | |
| 1,400 | 2 | PRA International
| | | 42,266 | |
| 5,161 | 2 | PSS World Medical, Inc.
| | | 104,252 | |
| 2,600 | 2 | Pain Therapeutics, Inc.
| | | 26,676 | |
| 1,400 | 2 | Palomar Medical Technologies, Inc.
| | | 35,406 | |
| 2,600 | 2 | Par Pharmaceutical Cos., Inc.
| | | 47,944 | |
| 2,305 | 2 | Parexel International Corp.
| | | 106,030 | |
| 2,200 | 2 | Penwest Pharmaceuticals Co.
| | | 18,238 | |
| 6,074 | | Perrigo Co.
| | | 144,015 | |
| 688 | 2 | PharMerica Corp.
| | | 10,974 | |
Shares
|
|
|
|
| Value
|
|
| | COMMON STOCKS--continued 1 | | | | |
| | Health Care--continued | | | | |
| 1,600 | 2 | PharmaNet Development Group, Inc.
| | $ | 51,840 | |
| 1,900 | 2 | Pharmion Corp.
| | | 91,428 | |
| 2,500 | 2 | Phase Forward, Inc.
| | | 59,475 | |
| 1,718 | | PolyMedica Industries, Inc.
| | | 90,985 | |
| 2,700 | 2 | Poniard Pharmaceuticals, Inc.
| | | 12,528 | |
| 2,200 | 2 | Pozen, Inc.
| | | 20,592 | |
| 1,700 | 2 | Progenics Pharmaceuticals, Inc.
| | | 39,372 | |
| 840 | 2,3 | Protalix Biotherapeutics, Inc.
| | | 4,284 | |
| 900 | 2 | Providence Service Corp.
| | | 28,611 | |
| 3,900 | 2 | Psychiatric Solutions, Inc.
| | | 154,440 | |
| 2,000 | 2 | Quidel Corp.
| | | 41,300 | |
| 900 | 2 | Radiation Therapy Services, Inc.
| | | 27,828 | |
| 1,500 | 2 | Regeneration Technologies, Inc.
| | | 15,915 | |
| 4,212 | 2 | Regeneron Pharmaceuticals, Inc.
| | | 92,664 | |
| 1,399 | 2 | RehabCare Group, Inc.
| | | 29,015 | |
| 1,800 | 2 | Res-Care, Inc.
| | | 44,208 | |
| 2,156 | 2 | Rigel Pharmaceuticals, Inc.
| | | 22,703 | |
| 3,850 | 2 | Salix Pharmaceuticals Ltd.
| | | 45,045 | |
| 3,100 | 2 | Santarus, Inc.
| | | 6,758 | |
| 3,848 | 2 | Savient Pharmaceuticals, Inc.
| | | 54,180 | |
| 2,500 | 2 | Sciele Pharma, Inc.
| | | 63,600 | |
| 2,200 | 2 | Seattle Genetics, Inc.
| | | 26,422 | |
| 2,700 | 2 | Senomyx, Inc.
| | | 31,212 | |
| 1,200 | 2 | Sirona Dental Systems, Inc.
| | | 40,368 | |
| 2,200 | 2 | Skilled Healthcare Group, Inc., Class A
| | | 36,036 | |
| 1,300 | 2 | Somaxon Pharmaceuticals, Inc.
| | | 11,635 | |
| 1,100 | 2 | Sonic Innovations, Inc.
| | | 11,308 | |
| 1,287 | 2 | SonoSight, Inc.
| | | 45,290 | |
| 3,100 | 2 | Spectranetics Corp.
| | | 49,600 | |
| 1,400 | 2 | Stereotaxis, Inc.
| | | 21,560 | |
| 4,700 | | Steris Corp.
| | | 136,488 | |
| 3,600 | 2 | Sun Healthcare Group, Inc.
| | | 58,140 | |
| 3,276 | 2 | Sunrise Senior Living, Inc.
| | | 121,212 | |
| 3,926 | 2 | SuperGen, Inc.
| | | 17,706 | |
| 1,232 | 2 | SurModics, Inc.
| | | 69,904 | |
Shares
|
|
|
|
| Value
|
|
| | COMMON STOCKS--continued 1 | | | | |
| | Health Care--continued | | | | |
| 2,400 | 2 | Symmetry Medical, Inc.
| | $ | 41,160 | |
| 4,100 | 2 | Telik, Inc.
| | | 16,810 | |
| 1,100 | 2 | Tercica, Inc.
| | | 6,765 | |
| 3,930 | 2 | Thoratec Laboratories Corp.
| | | 78,482 | |
| 400 | 2 | TomoTherapy, Inc.
| | | 8,748 | |
| 3,235 | 2 | TriZetto Group, Inc.
| | | 52,860 | |
| 300 | 2 | Trubion Pharmaceuticals, Inc.
| | | 3,981 | |
| 1,673 | 2 | United Therapeutics Corp.
| | | 114,500 | |
| 6,700 | 2 | Valeant Pharmaceuticals International
| | | 97,485 | |
| 2,300 | 2 | Vanda Pharmaceuticals, Inc.
| | | 34,500 | |
| 2,360 | 2 | Varian, Inc.
| | | 174,380 | |
| 2,148 | 2 | Ventana Medical Systems
| | | 189,024 | |
| 4,900 | 2 | ViroPharma, Inc.
| | | 42,189 | |
| 300 | 2 | Visicu, Inc.
| | | 2,250 | |
| 1,200 | 2 | Vital Images, Inc.
| | | 21,060 | |
| 601 | | Vital Signs, Inc.
| | | 31,793 | |
| 2,700 | 2 | Vivus, Inc.
| | | 13,473 | |
| 1,300 | 2 | Volcano Corp.
| | | 22,217 | |
| 2,384 | | West Pharmaceutical Services, Inc.
| | | 98,555 | |
| 2,500 | 2 | Wright Medical Group, Inc.
| | | 66,250 | |
| 7,300 | 2 | XOMA Ltd.
| | | 26,791 | |
| 1,400 | 2 | Xenoport, Inc.
| | | 68,712 | |
| 1,788 | 2 | Zoll Medical Corp.
| | | 43,734 | |
| 2,400 | 2 | Zymogenetics, Inc.
| | | 32,280 | |
| 3,825 | 2 | eResearch Technology, Inc.
| | | 42,457 | |
| 2,400 | 2 | inVentiv Health, Inc.
|
|
| 101,352
|
|
| | TOTAL
|
|
| 13,713,540
|
|
| | Industrials--14.6% | | | | |
| 800 | 2 | 3D Systems Corp.
| | | 17,512 | |
| 1,500 | 2,3 | A.S.V., Inc.
| | | 17,460 | |
| 2,667 | 2 | AAR Corp.
| | | 85,477 | |
| 3,204 | | ABM Industries, Inc.
| | | 75,358 | |
| 3,900 | 2 | ABX Air, Inc.
| | | 24,648 | |
| 700 | 2 | AMERCO
| | | 45,171 | |
| 100 | 2 | AMREP Corp.
| | | 3,738 | |
Shares
|
|
|
|
| Value
|
|
| | COMMON STOCKS--continued 1 | | | | |
| | Industrials--continued | | | | |
| 600 | 2 | AZZ, Inc.
| | $ | 20,460 | |
| 1,050 | | Aaon, Inc.
| | | 19,173 | |
| 3,400 | 2 | Acco Brands Corp.
| | | 72,896 | |
| 1,300 | 2 | Accuride Corp.
| | | 13,260 | |
| 2,100 | | Actuant Corp.
| | | 144,858 | |
| 3,277 | | Acuity Brands, Inc.
| | | 156,641 | |
| 1,726 | | Administaff, Inc.
| | | 68,833 | |
| 1,400 | 2 | Advisory Board Co.
| | | 89,894 | |
| 2,500 | 2 | Aecom Technology Corp.
| | | 84,425 | |
| 200 | 2 | Aerovironment, Inc.
| | | 5,146 | |
| 6,594 | 2 | AirTran Holdings, Inc.
| | | 68,643 | |
| 2,851 | 2 | Alaska Air Group, Inc.
| | | 72,415 | |
| 1,956 | | Albany International Corp., Class A
| | | 73,350 | |
| 100 | 2 | Allegiant Travel Co.
| | | 3,602 | |
| 200 | 2 | Altra Holdings, Inc.
| | | 3,250 | |
| 4,400 | 2 | American Commercial Lines, Inc.
| | | 65,604 | |
| 1,200 | | American Ecology, Inc.
| | | 28,728 | |
| 500 | | American Railcar Industries, Inc.
| | | 11,320 | |
| 1,800 | 2 | American Reprographics Co.
| | | 36,504 | |
| 700 | | American Science & Engineering, Inc.
| | | 42,308 | |
| 2,400 | 2,3 | American Superconductor Corp.
| | | 65,160 | |
| 1,100 | | American Woodmark Corp.
| | | 27,896 | |
| 700 | | Ameron, Inc.
| | | 75,509 | |
| 500 | | Ampco-Pittsburgh Corp.
| | | 20,040 | |
| 2,500 | | Apogee Enterprises, Inc.
| | | 58,825 | |
| 3,483 | | Applied Industrial Technologies, Inc.
| | | 123,472 | |
| 900 | 2 | Argon ST, Inc.
| | | 18,189 | |
| 1,884 | | Arkansas Best Corp.
| | | 51,716 | |
| 3,600 | 2 | Arrowhead Research Corp.
| | | 14,868 | |
| 1,261 | 2 | Astec Industries, Inc.
| | | 57,148 | |
| 1,200 | 2 | Atlas Air Worldwide Holdings, Inc.
| | | 70,308 | |
| 900 | | Badger Meter, Inc.
| | | 34,605 | |
| 800 | 2 | Baker Michael Corp.
| | | 42,232 | |
| 3,276 | | Baldor Electric Co.
| | | 132,088 | |
| 2,956 | | Barnes Group, Inc.
| | | 108,574 | |
Shares
|
|
|
|
| Value
|
|
| | COMMON STOCKS--continued 1 | | | | |
| | Industrials--continued | | | | |
| 300 | | Barrett Business Services, Inc.
| | $ | 5,097 | |
| 3,600 | 2 | Beacon Roofing Supply, Inc.
| | | 32,364 | |
| 3,372 | | Belden, Inc.
| | | 196,486 | |
| 3,400 | 2 | Blount International, Inc.
| | | 41,582 | |
| 800 | | BlueLinx Holdings, Inc.
| | | 4,168 | |
| 2,555 | | Bowne & Co., Inc.
| | | 44,406 | |
| 3,274 | | Brady (W.H.) Co.
| | | 120,811 | |
| 3,800 | | Briggs & Stratton Corp.
| | | 85,538 | |
| 2,575 | | Bucyrus International, Inc.
| | | 212,437 | |
| 1,000 | 2 | Builders Firstsource, Inc.
| | | 7,250 | |
| 3,459 | 2 | CBIZ, Inc.
| | | 31,131 | |
| 1,151 | | CDI Corp.
| | | 31,721 | |
| 1,000 | | CIRCOR International, Inc.
| | | 50,230 | |
| 4,018 | | CLARCOR, Inc.
| | | 146,496 | |
| 1,300 | 2 | COMSYS IT Partners, Inc.
| | | 23,114 | |
| 900 | 2 | CRA International, Inc.
| | | 46,602 | |
| 900 | | Cascade Corp.
| | | 56,682 | |
| 1,609 | 2 | Casella Waste Systems, Inc.
| | | 23,700 | |
| 1,700 | 2 | Celadon Group, Inc.
| | | 13,600 | |
| 3,900 | 2 | Cenveo, Inc.
| | | 88,062 | |
| 2,100 | 2 | Ceradyne, Inc.
| | | 143,661 | |
| 600 | 2 | Chart Industries, Inc.
| | | 19,680 | |
| 1,300 | 2 | Clean Harbors, Inc.
| | | 63,999 | |
| 1,345 | 2 | CoStar Group, Inc.
| | | 77,337 | |
| 800 | 2 | Coleman Cable, Inc.
| | | 10,640 | |
| 1,200 | 2 | Columbus McKinnon Corp.
| | | 39,816 | |
| 2,900 | | Comfort Systems USA, Inc.
| | | 42,398 | |
| 1,150 | 2 | Commercial Vehicle Group, Inc.
| | | 15,674 | |
| 100 | | CompX International, Inc.
| | | 1,980 | |
| 800 | 2 | Consolidated Graphics, Inc.
| | | 51,184 | |
| 800 | 2 | Cornell Corrections, Inc.
| | | 19,904 | |
| 1,100 | | Cubic Corp.
| | | 49,500 | |
| 3,164 | | Curtiss Wright Corp.
| | | 178,102 | |
| 3,800 | | Deluxe Corp.
| | | 153,292 | |
| 2,000 | | Diamond Management & Technology Consultants, Inc.
| | | 21,360 | |
Shares
|
|
|
|
| Value
|
|
| | COMMON STOCKS--continued 1 | | | | |
| | Industrials--continued | | | | |
| 2,000 | 2 | Dollar Thrifty Automotive Group
| | $ | 69,000 | |
| 700 | 2 | Dynamex, Inc.
| | | 20,776 | |
| 900 | | Dynamic Materials Corp.
| | | 49,518 | |
| 2,200 | 2 | Dyncorp International, Inc., Class A
| | | 49,808 | |
| 1,300 | | EDO Corp.
| | | 75,400 | |
| 1,866 | 2 | ESCO Technologies, Inc.
| | | 77,234 | |
| 2,500 | | Eagle Bulk Shipping, Inc.
| | | 85,225 | |
| 1,279 | | Electro Rent Corp.
| | | 18,494 | |
| 4,512 | 2 | Emcor Group, Inc.
| | | 155,348 | |
| 1,500 | 2 | EnPro Industries, Inc.
| | | 61,515 | |
| 1,950 | | Encore Wire Corp.
| | | 40,950 | |
| 2,100 | 2 | EnerSys, Inc.
| | | 38,052 | |
| 3,075 | 2,3 | Energy Conversion Devices, Inc.
| | | 83,917 | |
| 1,800 | | Ennis Business Forms, Inc.
| | | 36,792 | |
| 1,751 | 2 | Esterline Technologies Corp.
| | | 95,920 | |
| 6,400 | 2,3 | Evergreen Solar, Inc.
| | | 73,984 | |
| 1,200 | 2 | Exponent, Inc.
| | | 36,252 | |
| 2,900 | 2 | ExpressJet Holdings, Inc.
| | | 9,628 | |
| 2,950 | 2 | FTI Consulting, Inc.
| | | 160,185 | |
| 3,513 | | Federal Signal Corp.
| | | 47,039 | |
| 500 | 2 | First Advantage Corp., Class A
| | | 9,180 | |
| 2,000 | 2 | Flow International Corp.
| | | 16,820 | |
| 4,600 | 2,3 | Force Protection, Inc.
| | | 82,340 | |
| 2,251 | | Forward Air Corp.
| | | 73,450 | |
| 1,340 | | Franklin Electronics, Inc.
| | | 58,384 | |
| 1,100 | | Freightcar America, Inc.
| | | 47,520 | |
| 1,000 | 2,3 | Fuel Tech, Inc.
| | | 29,570 | |
| 4,740 | 2 | Fuelcell Energy, Inc.
| | | 47,684 | |
| 1,555 | | G & K Services, Inc., Class A
| | | 63,040 | |
| 800 | 2 | Gehl Co.
| | | 15,304 | |
| 3,990 | 2 | GenCorp, Inc.
| | | 47,002 | |
| 1,000 | | Genco Shipping & Trading Ltd.
| | | 71,890 | |
| 2,425 | 2 | Genesee & Wyoming, Inc., Class A
| | | 71,101 | |
| 1,908 | 2 | Genlyte Group, Inc.
| | | 124,211 | |
| 3,600 | 2 | Geo Group, Inc.
| | | 113,868 | |
Shares
|
|
|
|
| Value
|
|
| | COMMON STOCKS--continued 1 | | | | |
| | Industrials--continued | | | | |
| 900 | 2 | GeoEye, Inc.
| | $ | 28,179 | |
| 1,818 | | Gibraltar Industries, Inc.
| | | 32,760 | |
| 2,300 | 2 | Goodman Global, Inc.
| | | 56,695 | |
| 875 | | Gorman Rupp Co.
| | | 33,880 | |
| 7,618 | 2 | GrafTech International Ltd.
| | | 143,980 | |
| 2,566 | | Granite Construction, Inc.
| | | 109,876 | |
| 900 | 2 | Great Lakes Dredge & Dock Corp.
| | | 8,055 | |
| 1,100 | | Greenbrier Cos., Inc.
| | | 29,381 | |
| 2,429 | 2 | Griffon Corp.
| | | 37,479 | |
| 1,100 | 2 | H&E Equipment Services, Inc.
| | | 19,393 | |
| 600 | | Hardinge, Inc.
| | | 19,398 | |
| 3,075 | | Healthcare Services Group, Inc.
| | | 67,527 | |
| 4,600 | | Heartland Express, Inc.
| | | 64,124 | |
| 1,858 | | Heico Corp.
| | | 101,150 | |
| 1,522 | | Heidrick & Struggles International, Inc.
| | | 65,781 | |
| 6,369 | 2 | Hexcel Corp.
| | | 159,416 | |
| 2,100 | | Horizon Lines, Inc., Class A
| | | 66,066 | |
| 1,000 | | Houston Wire & Cable Co.
| | | 17,570 | |
| 2,800 | 2 | Hub Group, Inc.
| | | 71,036 | |
| 1,800 | 2 | Hudson Highland Group, Inc.
| | | 20,664 | |
| 600 | 2 | Hurco Co., Inc.
| | | 34,260 | |
| 1,300 | 2 | Huron Consulting Group, Inc.
| | | 90,844 | |
| 600 | 2 | ICT Group, Inc.
| | | 6,552 | |
| 2,000 | 2 | IHS, Inc., Class A
| | | 126,100 | |
| 1,748 | 2 | II-VI, Inc.
| | | 60,726 | |
| 7,700 | | Ikon Office Solutions, Inc.
| | | 101,640 | |
| 1,100 | 2 | Innerworkings, Inc.
| | | 17,699 | |
| 1,050 | 2 | Innovative Solutions and Support, Inc.
| | | 22,701 | |
| 2,292 | 2 | Insituform Technologies, Inc., Class A
| | | 32,226 | |
| 1,200 | | Insteel Industries, Inc.
| | | 13,920 | |
| 1,000 | 2 | Integrated Electrical Services, Inc.
| | | 23,310 | |
| 3,905 | | Interface, Inc.
| | | 74,703 | |
| 1,800 | 2 | Interline Brands, Inc.
| | | 43,002 | |
| 2,300 | 2 | Ionatron, Inc.
| | | 8,464 | |
| 12,900 | 2 | Jet Blue Airways Corp.
| | | 117,777 | |
Shares
|
|
|
|
| Value
|
|
| | COMMON STOCKS--continued 1 | | | | |
| | Industrials--continued | | | | |
| 2,300 | 2 | KForce Com, Inc.
| | $ | 27,692 | |
| 1,028 | 2 | Kadant, Inc.
| | | 33,379 | |
| 1,841 | | Kaman Corp., Class A
| | | 69,424 | |
| 2,268 | | Kaydon Corp.
| | | 121,996 | |
| 1,720 | | Kelly Services, Inc., Class A
| | | 36,172 | |
| 2,000 | 2 | Kenexa Corp.
| | | 58,640 | |
| 4,072 | | Knight Transportation, Inc.
| | | 65,030 | |
| 3,100 | | Knoll, Inc.
| | | 58,869 | |
| 3,108 | 2 | Korn/Ferry International
| | | 59,549 | |
| 1,000 | 2 | L.B. Foster Co.
| | | 43,050 | |
| 1,800 | 2 | LECG Corp.
| | | 31,518 | |
| 1,275 | | LSI Industries, Inc.
| | | 24,098 | |
| 3,770 | 2 | Labor Ready, Inc.
| | | 66,277 | |
| 1,200 | 2 | Ladish Co., Inc.
| | | 55,068 | |
| 900 | 2 | Lamson & Sessions Co.
| | | 24,516 | |
| 378 | | Lawson Products, Inc.
| | | 13,377 | |
| 1,200 | 2 | Layne Christensen Co.
| | | 68,328 | |
| 1,072 | | Lindsay Manufacturing Co.
| | | 52,742 | |
| 800 | 2 | M & F Worldwide Corp.
| | | 41,976 | |
| 2,887 | 2 | MOOG, Inc., Class A
| | | 133,235 | |
| 700 | 2 | MTC Technologies, Inc.
| | | 12,803 | |
| 800 | 2 | Marten Transport Ltd.
| | | 11,376 | |
| 1,412 | | McGrath Rentcorp.
| | | 48,403 | |
| 1,499 | 2 | Medis Technologies Ltd.
| | | 20,956 | |
| 1,000 | 2 | Middleby Corp.
| | | 65,170 | |
| 1,300 | 2 | Midwest Express Holdings, Inc.
| | | 21,086 | |
| 4,600 | | Miller Herman, Inc.
| | | 125,212 | |
| 700 | 2 | Miller Industries, Inc.
| | | 10,157 | |
| 1,976 | | Mine Safety Appliances Co.
| | | 90,481 | |
| 2,852 | 2 | Mobile Mini, Inc.
| | | 51,136 | |
| 2,781 | | Mueller Industries, Inc.
| | | 100,005 | |
| 8,220 | | Mueller Water Products, Inc.
| | | 96,585 | |
| 150 | | Multi-Color Corp.
| | | 3,450 | |
| 414 | | NACCO Industries, Inc., Class A
| | | 42,886 | |
| 1,527 | 2 | NCI Building System, Inc.
| | | 59,828 | |
Shares
|
|
|
|
| Value
|
|
| | COMMON STOCKS--continued 1 | | | | |
| | Industrials--continued | | | | |
| 4,139 | 2 | Navigant Consulting, Inc.
| | $ | 54,552 | |
| 2,186 | | Nordson Corp.
| | | 116,951 | |
| 1,100 | 2 | NuCo2, Inc.
| | | 28,369 | |
| 4,100 | 2 | Odyssey Marine Exploration, Inc.
| | | 28,741 | |
| 1,975 | 2 | Old Dominion Freight Lines, Inc.
| | | 44,615 | |
| 2,300 | 2 | On Assignment, Inc.
| | | 19,182 | |
| 4,362 | 2 | Orbital Sciences Corp.
| | | 111,362 | |
| 100 | 2 | PGT, Inc.
| | | 799 | |
| 3,800 | 2 | PHH Corp.
| | | 84,968 | |
| 2,600 | | Pacer International, Inc.
| | | 38,324 | |
| 800 | 2 | Park-Ohio Holdings Corp.
| | | 19,096 | |
| 2,300 | 2 | PeopleSupport, Inc.
| | | 26,496 | |
| 1,800 | 2 | Perini Corp.
| | | 103,230 | |
| 1,100 | 2 | Pike Electric Corp.
| | | 21,670 | |
| 1,800 | 2 | Pinnacle Airlines Corp.
| | | 28,512 | |
| 600 | 2 | Powell Industries, Inc.
| | | 25,254 | |
| 5,400 | 2 | Power-One, Inc.
| | | 30,618 | |
| 1,500 | 2 | RBC Bearings, Inc.
| | | 60,285 | |
| 900 | 2 | RSC Holdings, Inc.
| | | 13,095 | |
| 1,200 | | Raven Industries, Inc.
| | | 51,852 | |
| 2,298 | | Regal Beloit Corp.
| | | 112,694 | |
| 2,200 | 2 | Republic Airways Holdings, Inc.
| | | 46,838 | |
| 3,700 | 2 | Resources Connection, Inc.
| | | 84,249 | |
| 1,047 | | Robbins & Myers, Inc.
| | | 75,698 | |
| 2,290 | | Rollins, Inc.
| | | 69,547 | |
| 2,250 | 2 | Rush Enterprises, Inc.
| | | 38,138 | |
| 1,301 | 2 | Saia, Inc.
| | | 18,331 | |
| 1,100 | | Schawk, Inc.
| | | 24,992 | |
| 1,660 | 2 | School Specialty, Inc.
| | | 56,025 | |
| 474 | 2 | Sequa Corp., Class A
| | | 82,391 | |
| 2,608 | | Simpson Manufacturing Co., Inc.
| | | 78,214 | |
| 4,800 | | SkyWest, Inc.
| | | 130,992 | |
| 1,504 | | Smith (A.O.) Corp.
| | | 56,235 | |
| 4,465 | 2 | Spherion Corp.
| | | 38,935 | |
| 200 | 2 | Standard Parking Corp.
| | | 8,580 | |
Shares
|
|
|
|
| Value
|
|
| | COMMON STOCKS--continued 1 | | | | |
| | Industrials--continued | | | | |
| 1,230 | | Standard Register
| | $ | 15,781 | |
| 977 | | Standex International Corp.
| | | 20,947 | |
| 100 | 2 | Stanley, Inc.
| | | 2,648 | |
| 1,050 | | Sun Hydraulics Corp.
| | | 37,790 | |
| 1,400 | 2 | Superior Essex, Inc.
| | | 46,550 | |
| 900 | | TAL International Group, Inc.
| | | 21,249 | |
| 700 | 2 | TBS International Ltd., Class A
| | | 43,988 | |
| 1,500 | 2 | Taleo Corp., Class A
| | | 41,925 | |
| 5,100 | 2,3 | Taser International, Inc.
| | | 84,915 | |
| 1,200 | 2 | Team, Inc.
| | | 38,628 | |
| 1,426 | 2 | Tecumseh Products Co., Class A
| | | 25,768 | |
| 3,000 | 2 | TeleTech Holdings, Inc.
| | | 74,790 | |
| 2,552 | 2 | Teledyne Technologies, Inc.
| | | 133,495 | |
| 1,322 | | Tennant Co.
| | | 62,346 | |
| 4,187 | 2 | Tetra Tech, Inc.
| | | 97,766 | |
| 1,500 | | Titan International, Inc.
| | | 45,390 | |
| 500 | 2 | TransDigm Group, Inc.
| | | 22,760 | |
| 2,121 | | Tredegar Industries, Inc.
| | | 36,948 | |
| 1,029 | 2,3 | Trex Co., Inc.
| | | 11,154 | |
| 100 | 2 | TriMas Corp.
| | | 1,600 | |
| 1,210 | | Triumph Group, Inc.
| | | 96,340 | |
| 2,000 | 2 | TurboChef Technologies, Inc.
| | | 30,720 | |
| 200 | | Twin Disc, Inc.
| | | 13,214 | |
| 3,400 | | UAP Holding Corp.
| | | 108,222 | |
| 1,400 | 2 | Ultrapetrol Bahamas Ltd.
| | | 26,222 | |
| 800 | | United Industrial Corp.
| | | 64,656 | |
| 2,193 | 2 | United Stationers, Inc.
| | | 126,997 | |
| 1,238 | | Universal Forest Products, Inc.
| | | 44,333 | |
| 400 | 2 | Universal Truckload Services, Inc.
| | | 7,060 | |
| 1,264 | | Valmont Industries, Inc.
| | | 120,990 | |
| 1,500 | | Viad Corp.
| | | 53,160 | |
| 1,366 | | Vicor Corp.
| | | 19,179 | |
| 1,061 | 2 | Volt Information Science, Inc.
| | | 16,499 | |
| 2,272 | | Wabash National Corp.
| | | 23,061 | |
| 3,435 | | Wabtec Corp.
| | | 128,916 | |
Shares
|
|
|
|
| Value
|
|
| | COMMON STOCKS--continued 1 | | | | |
| | Industrials--continued | | | | |
| 3,400 | | Walter Industries, Inc.
| | $ | 104,176 | |
| 2,100 | 2 | Washington Group International, Inc.
| | | 204,435 | |
| 5,279 | 2 | Waste Connections, Inc.
| | | 178,483 | |
| 200 | | Waste Holdings, Inc.
| | | 7,200 | |
| 1,366 | 2 | Waste Services, Inc.
| | | 12,513 | |
| 1,748 | | Watsco, Inc.
| | | 72,787 | |
| 3,040 | | Watson Wyatt & Co. Holdings
| | | 144,917 | |
| 2,147 | | Watts Industries, Inc., Class A
| | | 61,039 | |
| 3,800 | | Werner Enterprises, Inc.
| | | 72,276 | |
| 2,194 | | Woodward Governor Co.
| | | 146,998 | |
| 500 | | Xerium Technologies, Inc.
|
|
| 2,055
|
|
| | TOTAL
|
|
| 14,911,229
|
|
| | Information Technology--18.2% | | | | |
| 29,000 | 2 | 3Com Corp.
| | | 141,520 | |
| 2,941 | 2 | ACI Worldwide, Inc.
| | | 67,261 | |
| 3,900 | 2 | AMIS Holdings, Inc.
| | | 29,913 | |
| 2,470 | 2 | ATMI, Inc.
| | | 79,386 | |
| 2,000 | 2 | Acacia Research - Technologies
| | | 33,020 | |
| 1,000 | 2 | Acme Packet, Inc.
| | | 14,360 | |
| 2,051 | 2 | Actel Corp.
| | | 23,361 | |
| 3,200 | 2 | Actuate Software Corp.
| | | 28,128 | |
| 8,600 | 2 | Adaptec, Inc.
| | | 30,358 | |
| 4,700 | | Adtran, Inc.
| | | 113,129 | |
| 2,500 | 2 | Advanced Analogic Technologies, Inc.
| | | 30,200 | |
| 2,569 | 2 | Advanced Energy Industries, Inc.
| | | 41,104 | |
| 1,500 | 2 | Advent Software, Inc.
| | | 82,995 | |
| 2,579 | | Agilysys, Inc.
| | | 44,617 | |
| 7,500 | 2 | Amkor Technology, Inc.
| | | 84,975 | |
| 4,200 | 2 | Anadigics, Inc.
| | | 61,950 | |
| 1,680 | 2 | Anaren Microwave, Inc.
| | | 26,326 | |
| 11,200 | 2 | Andrew Corp.
| | | 164,192 | |
| 2,330 | 2 | Anixter International, Inc.
| | | 167,410 | |
| 1,000 | 2 | Ansoft Corp.
| | | 30,080 | |
| 5,600 | 2 | Ansys, Inc.
| | | 217,336 | |
| 21,900 | 2 | Applied Micro Circuits Corp.
| | | 70,518 | |
Shares
|
|
|
|
| Value
|
|
| | COMMON STOCKS--continued 1 | | | | |
| | Information Technology--continued | | | | |
| 5,679 | 2 | Ariba, Inc.
| | $ | 73,486 | |
| 7,800 | 2 | Arris Group, Inc.
| | | 89,700 | |
| 7,200 | 2 | Art Technology Group, Inc.
| | | 33,192 | |
| 1,500 | 2 | Asiainfo Holdings, Inc.
| | | 18,345 | |
| 6,229 | 2 | Aspen Technology, Inc.
| | | 108,634 | |
| 3,748 | 2 | Asyst Technologies, Inc.
| | | 17,990 | |
| 4,100 | 2 | Atheros Communications
| | | 143,910 | |
| 14,000 | 2 | Avanex Corp.
| | | 25,900 | |
| 3,000 | 2 | Avid Technology, Inc.
| | | 88,170 | |
| 3,960 | 2 | Avocent Corp.
| | | 107,039 | |
| 7,300 | 2 | Axcelis Technologies, Inc.
| | | 34,237 | |
| 800 | 2 | Bankrate, Inc.
| | | 36,760 | |
| 13,900 | 2 | BearingPoint, Inc.
| | | 66,581 | |
| 700 | | Bel Fuse, Inc.
| | | 22,274 | |
| 4,792 | 2 | Benchmark Electronics, Inc.
| | | 98,284 | |
| 400 | 2 | Bigband Networks, Inc.
| | | 2,400 | |
| 1,522 | | Black Box Corp.
| | | 60,850 | |
| 2,885 | | Blackbaud, Inc.
| | | 77,751 | |
| 2,100 | 2 | Blackboard, Inc.
| | | 104,790 | |
| 1,800 | 2 | Blue Coat Systems, Inc.
| | | 73,062 | |
| 6,220 | 2 | Borland Software Corp.
| | | 27,244 | |
| 1,600 | 2 | Bottomline Technologies, Inc.
| | | 25,696 | |
| 4,010 | 2 | Brightpoint, Inc.
| | | 64,962 | |
| 5,632 | 2 | Brooks Automation, Inc.
| | | 73,103 | |
| 3,724 | 2 | C-COR Electronics, Inc.
| | | 45,656 | |
| 2,200 | 2 | CACI International, Inc., Class A
| | | 118,470 | |
| 35,000 | 2 | CMG Information Services, Inc.
| | | 49,350 | |
| 11,100 | 2 | CNET, Inc.
| | | 89,688 | |
| 100 | 2 | CPI International, Inc.
| | | 2,032 | |
| 3,500 | 2 | CSG Systems International, Inc.
| | | 71,855 | |
| 2,550 | | CTS Corp.
| | | 31,493 | |
| 1,700 | 2 | Cabot Microelectronics Corp.
| | | 67,456 | |
| 150 | | Cass Information Systems, Inc.
| | | 5,404 | |
| 100 | 2 | Cavium Networks, Inc.
| | | 2,908 | |
| 3,032 | 2 | Checkpoint Systems, Inc.
| | | 91,718 | |
Shares
|
|
|
|
| Value
|
|
| | COMMON STOCKS--continued 1 | | | | |
| | Information Technology--continued | | | | |
| 2,260 | 2 | Chordiant Software, Inc.
| | $ | 32,521 | |
| 4,180 | 2 | Ciber, Inc.
| | | 32,562 | |
| 6,300 | 2 | Cirrus Logic, Inc.
| | | 38,745 | |
| 2,800 | 2 | Cogent, Inc.
| | | 41,356 | |
| 3,200 | | Cognex Corp.
| | | 57,536 | |
| 2,244 | 2 | Coherent, Inc.
| | | 73,603 | |
| 1,821 | | Cohu, Inc.
| | | 29,864 | |
| 3,000 | 2 | Commvault Systems, Inc.
| | | 61,020 | |
| 1,400 | 2 | Comtech Group, Inc.
| | | 30,114 | |
| 1,875 | 2 | Comtech Telecommunications Corp.
| | | 101,719 | |
| 100 | 2 | Comverge, Inc.
| | | 3,520 | |
| 2,700 | 2 | Concur Technologies, Inc.
| | | 97,308 | |
| 35,300 | 2 | Conexant Systems, Inc.
| | | 45,184 | |
| 3,300 | 2 | Cray, Inc.
| | | 20,031 | |
| 6,740 | 2 | Credence Systems Corp.
| | | 20,557 | |
| 2,100 | 2 | Cybersource Corp.
| | | 34,335 | |
| 4 | 2 | CycleLogic, Inc.
| | | 0 | |
| 2,900 | 2 | Cymer, Inc.
| | | 123,250 | |
| 2,218 | 2 | DSP Group, Inc.
| | | 35,022 | |
| 1,300 | 2 | DTS, Inc.
| | | 36,959 | |
| 2,700 | | Daktronics, Inc.
| | | 80,514 | |
| 2,100 | 2 | DealerTrack Holdings, Inc.
| | | 103,089 | |
| 1,600 | 2 | Digi International, Inc.
| | | 25,664 | |
| 3,000 | 2 | Digital River, Inc.
| | | 159,180 | |
| 2,212 | 2 | Diodes, Inc.
| | | 73,129 | |
| 2,400 | 2 | Ditech Networks, Inc.
| | | 11,928 | |
| 1,200 | 2 | DivX, Inc.
| | | 15,036 | |
| 1,100 | 2 | Double-Take Software, Inc.
| | | 26,213 | |
| 3,000 | 2 | Dycom Industries, Inc.
| | | 84,750 | |
| 1,100 | 2 | EMS Technologies, Inc.
| | | 30,844 | |
| 1,850 | 2 | EPIQ Systems, Inc.
| | | 35,872 | |
| 200 | 2 | Eagle Test Systems, Inc.
| | | 2,528 | |
| 9,900 | 2 | EarthLink Network, Inc.
| | | 78,309 | |
| 2,300 | 2 | Echelon Corp.
| | | 50,715 | |
| 2,339 | 2 | Electro Scientific Industries, Inc.
| | | 51,037 | |
Shares
|
|
|
|
| Value
|
|
| | COMMON STOCKS--continued 1 | | | | |
| | Information Technology--continued | | | | |
| 4,300 | 2 | Electronics for Imaging, Inc.
| | $ | 98,040 | |
| 6,100 | 2 | Emulex Corp.
| | | 132,126 | |
| 100 | 2 | EnerNOC, Inc.
| | | 4,660 | |
| 9,526 | 2 | Entegris, Inc.
| | | 86,972 | |
| 4,200 | 2 | Epicor Software Corp.
| | | 49,056 | |
| 2,500 | 2 | Equinix, Inc.
| | | 291,650 | |
| 3,250 | 2 | Euronet Worldwide, Inc.
| | | 104,097 | |
| 2,844 | 2 | Exar Corp.
| | | 34,583 | |
| 850 | 2 | Excel Technology, Inc.
| | | 23,919 | |
| 1,200 | 2 | Exlservice Holding, Inc.
| | | 32,400 | |
| 9,100 | 2 | Extreme Networks, Inc.
| | | 39,858 | |
| 2,331 | 2 | FEI Co.
| | | 67,622 | |
| 4,800 | 2 | FLIR Systems, Inc.
| | | 333,072 | |
| 2,273 | 2 | FalconStor Software, Inc.
| | | 31,890 | |
| 800 | 2 | Faro Technologies, Inc.
| | | 23,008 | |
| 17,400 | 2 | Finisar Corp.
| | | 40,368 | |
| 3,300 | 2 | FormFactor, Inc.
| | | 129,063 | |
| 1,041 | 2 | Forrester Research, Inc.
| | | 24,693 | |
| 10,400 | 2 | Foundry Networks, Inc.
| | | 219,856 | |
| 4,941 | 2 | Gartner Group, Inc., Class A
| | | 108,208 | |
| 3,000 | 2 | Genesis Microchip, Inc.
| | | 22,140 | |
| 1,200 | 2 | Gerber Scientific, Inc.
| | | 13,260 | |
| 2,000 | | Gevity HR, Inc.
| | | 19,960 | |
| 2,500 | 2 | Global Cash Access LLC
| | | 24,975 | |
| 2,100 | 2 | Greenfield Online, Inc.
| | | 32,046 | |
| 5,800 | 2 | Harmonic Lightwaves, Inc.
| | | 71,456 | |
| 1,500 | 2 | Harris Stratex Networks, Inc., Class A
| | | 28,680 | |
| 700 | | Heartland Payment Systems, Inc.
| | | 21,000 | |
| 5,700 | | Henry Jack & Associates, Inc.
| | | 166,554 | |
| 900 | 2 | Hittite Microwave Corp.
| | | 45,225 | |
| 200 | 2 | Hughes Communications, Inc.
| | | 11,918 | |
| 1,860 | 2 | Hutchinson Technology, Inc.
| | | 44,138 | |
| 4,100 | 2 | Hypercom Corp.
| | | 22,181 | |
| 1,100 | 2 | I2 Technologies, Inc.
| | | 18,656 | |
| 1,600 | 2 | IGATE Capital Corp.
| | | 14,032 | |
Shares
|
|
|
|
| Value
|
|
| | COMMON STOCKS--continued 1 | | | | |
| | Information Technology--continued | | | | |
| 400 | 2 | IPG Photonics Corp.
| | $ | 7,616 | |
| 1,544 | 2 | IXYS Corp.
| | | 16,289 | |
| 2,500 | | Imation Corp.
| | | 55,700 | |
| 1,200 | 3 | Imergent, Inc.
| | | 28,944 | |
| 2,400 | 2 | Immersion Corp.
| | | 38,856 | |
| 2,400 | 2 | InfoSpace.com, Inc.
| | | 46,392 | |
| 2,324 | | InfoUSA, Inc.
| | | 24,448 | |
| 6,400 | 2 | Informatica Corp.
| | | 109,312 | |
| 3,796 | 2 | Insight Enterprises, Inc.
| | | 104,921 | |
| 450 | | Integral Systems, Inc.
| | | 10,089 | |
| 3,700 | 2 | InterDigital, Inc.
| | | 79,513 | |
| 600 | 2 | Interactive Intelligence, Inc.
| | | 15,630 | |
| 3,983 | 2 | Intermec, Inc.
| | | 101,248 | |
| 2,950 | 2 | Internap Network Services Corp.
| | | 49,147 | |
| 2,800 | 2 | Internet Capital Group, Inc.
| | | 35,952 | |
| 2,900 | 2 | Intervoice, Inc.
| | | 28,420 | |
| 3,425 | 2 | Interwoven, Inc.
| | | 48,601 | |
| 1,500 | 2 | Intevac, Inc.
| | | 26,355 | |
| 100 | 2 | Isilon Systems, Inc.
| | | 545 | |
| 2,330 | 2 | Itron, Inc.
| | | 250,452 | |
| 2,600 | 2 | Ixia
| | | 27,196 | |
| 2,193 | 2 | JDA Software Group, Inc.
| | | 54,737 | |
| 6,000 | 2 | Kemet Corp.
| | | 42,420 | |
| 500 | 2 | Keynote Systems, Inc.
| | | 7,345 | |
| 4,694 | 2 | Kulicke & Soffa Industries
| | | 35,534 | |
| 4,649 | 2 | L-1 Identity Solutions, Inc.
| | | 86,332 | |
| 5,331 | 2 | LTX Corp.
| | | 17,646 | |
| 8,400 | 2 | Lattice Semiconductor Corp.
| | | 35,112 | |
| 8,800 | 2 | Lawson Software, Inc.
| | | 99,352 | |
| 4,200 | 2 | Lionbridge Technologies, Inc.
| | | 19,530 | |
| 800 | 2 | Liquidity Services, Inc.
| | | 9,944 | |
| 1,664 | 2 | Littelfuse, Inc.
| | | 52,965 | |
| 3,800 | 2 | LivePerson, Inc.
| | | 21,812 | |
| 1,400 | 2 | Lo-Jack Corp.
| | | 24,598 | |
| 1,600 | 2 | LoopNet, Inc.
| | | 30,160 | |
Shares
|
|
|
|
| Value
|
|
| | COMMON STOCKS--continued 1 | | | | |
| | Information Technology--continued | | | | |
| 600 | 2 | Loral Space & Communications Ltd.
| | $ | 24,228 | |
| 3,026 | 2 | MICROS Systems Corp.
| | | 217,327 | |
| 3,100 | 2 | MIPS Technologies, Inc.
| | | 24,490 | |
| 3,300 | 2 | MKS Instruments, Inc.
| | | 66,264 | |
| 7,358 | 2 | MPS Group, Inc.
| | | 89,841 | |
| 9,090 | 2 | MRV Communications, Inc.
| | | 25,816 | |
| 2,400 | 2 | MSC Software Corp.
| | | 33,120 | |
| 1,500 | | MTS Systems Corp.
| | | 66,735 | |
| 3,800 | 2 | Macrovision Corp.
| | | 91,200 | |
| 3,300 | 2 | Magma Design Automation
| | | 49,137 | |
| 1,300 | 2 | ManTech International Corp., Class A
| | | 51,688 | |
| 2,012 | 2 | Manhattan Associates, Inc.
| | | 60,682 | |
| 1,500 | | Marchex, Inc., Class B
| | | 16,935 | |
| 2,500 | 2 | Mastec, Inc.
| | | 39,475 | |
| 3,771 | 2 | Mattson Technology, Inc.
| | | 32,732 | |
| 1,479 | | Maximus, Inc.
| | | 70,874 | |
| 800 | 2 | Measurement Specialties, Inc.
| | | 22,192 | |
| 5,900 | 2 | Mentor Graphics Corp.
| | | 94,518 | |
| 1,100 | 2 | Mercadolibre, Inc.
| | | 49,148 | |
| 1,747 | 2 | Mercury Computer Systems, Inc.
| | | 27,323 | |
| 2,786 | | Methode Electronics, Inc., Class A
| | | 34,936 | |
| 4,800 | | Micrel, Inc.
| | | 43,440 | |
| 737 | 2 | MicroStrategy, Inc., Class A
| | | 72,469 | |
| 5,508 | 2 | Microsemi Corp.
| | | 146,568 | |
| 3,600 | 2 | Microtune, Inc.
| | | 21,708 | |
| 2,689 | 2,3 | Midway Games, Inc.
| | | 8,363 | |
| 1,200 | 2 | Monolithic Power Systems
| | | 26,316 | |
| 500 | 2 | Multi-Fineline Electronix, Inc.
| | | 7,105 | |
| 2,400 | 2 | NIC, Inc.
| | | 17,472 | |
| 2,300 | 2 | Ness Technologies, Inc.
| | | 26,910 | |
| 3,300 | 2 | Net 1 UEPS Technologies, Inc.
| | | 105,666 | |
| 1,300 | 2 | NetLogic Microsystems, Inc.
| | | 43,160 | |
| 2,700 | 2 | Netgear, Inc.
| | | 95,418 | |
| 1,100 | 2 | Network Equipment Technologies, Inc.
| | | 16,390 | |
| 3,000 | 2 | Newport Corp.
| | | 41,010 | |
Shares
|
|
|
|
| Value
|
|
| | COMMON STOCKS--continued 1 | | | | |
| | Information Technology--continued | | | | |
| 1,100 | 2 | Nextwave Wireless, Inc.
| | $ | 6,600 | |
| 2,500 | 2 | Novatel Wireless, Inc.
| | | 65,000 | |
| 9,452 | 2 | Nuance Communications, Inc.
| | | 208,984 | |
| 16,800 | 2 | ON Semiconductor Corp.
| | | 171,360 | |
| 1,100 | 2 | OSI Systems, Inc.
| | | 27,533 | |
| 2,400 | 2 | Omniture, Inc.
| | | 81,984 | |
| 4,000 | 2 | Omnivision Technologies, Inc.
| | | 88,600 | |
| 10,700 | 2 | On2 Technologies, Inc.
| | | 12,198 | |
| 2,500 | 2 | Online Resources Corp.
| | | 23,125 | |
| 800 | 2 | OpNext, Inc.
| | | 9,520 | |
| 3,400 | 2 | OpenTV Corp.
| | | 4,624 | |
| 7,033 | 2 | Openwave Systems, Inc.
| | | 27,851 | |
| 2,085 | 2 | Oplink Communications, Inc.
| | | 31,525 | |
| 1,400 | 2 | Optium Corp.
| | | 14,994 | |
| 1,400 | 2 | Orbcomm, Inc.
| | | 11,550 | |
| 300 | 2 | PC Connections, Inc.
| | | 4,410 | |
| 1,100 | 2 | PDF Solutions, Inc.
| | | 8,690 | |
| 1,800 | 2 | PLX Technology, Inc.
| | | 18,792 | |
| 14,200 | 2 | PMC-Sierra, Inc.
| | | 127,942 | |
| 2,661 | 2 | Packeteer, Inc.
| | | 23,124 | |
| 7,478 | 2 | Palm, Inc.
| | | 67,452 | |
| 8,220 | 2 | Parametric Technology Corp.
| | | 157,002 | |
| 1,592 | | Park Electrochemical Corp.
| | | 49,861 | |
| 700 | | Pegasystems, Inc.
| | | 8,197 | |
| 1,700 | 2 | Perficient, Inc.
| | | 32,045 | |
| 1,884 | 2 | Pericom Semiconductor Corp.
| | | 28,147 | |
| 6,100 | 2 | Perot Systems Corp.
| | | 89,060 | |
| 2,924 | 2 | Photronics, Inc.
| | | 31,989 | |
| 3,500 | | Plantronics, Inc.
| | | 95,725 | |
| 3,358 | 2 | Plexus Corp.
| | | 86,636 | |
| 6,600 | 2 | Polycom, Inc.
| | | 184,668 | |
| 9,100 | 2 | Powerwave Technologies, Inc.
| | | 50,596 | |
| 3,214 | 2 | Progress Software Corp.
| | | 105,130 | |
| 700 | | QAD, Inc.
| | | 6,300 | |
| 1,200 | | Quality Systems, Inc.
| | | 43,476 | |
Shares
|
|
|
|
| Value
|
|
| | COMMON STOCKS--continued 1 | | | | |
| | Information Technology--continued | | | | |
| 14,000 | 2 | Quantum Corp. - DLT & Storage Systems
| | $ | 56,000 | |
| 4,600 | 2 | Quest Software, Inc.
| | | 80,040 | |
| 15,100 | 2 | RF Micro Devices, Inc.
| | | 93,922 | |
| 2,200 | 2 | Rackable Systems, Inc.
| | | 30,052 | |
| 1,549 | 2 | RadiSys Corp.
| | | 20,834 | |
| 1,900 | 2 | Radiant Systems, Inc.
| | | 31,008 | |
| 7,900 | 2 | RealNetworks, Inc.
| | | 57,354 | |
| 579 | | Renaissance Learning, Inc.
| | | 8,118 | |
| 1,400 | 2 | RightNow Technologies, Inc.
| | | 28,028 | |
| 400 | 2 | Rimage Corp.
| | | 10,456 | |
| 1,200 | 2 | Rofin-Sinar Technologies, Inc.
| | | 94,344 | |
| 1,316 | 2 | Rogers Corp.
| | | 64,523 | |
| 1,958 | 2 | Rudolph Technologies, Inc.
| | | 25,513 | |
| 4,900 | 2 | S1 Corp.
| | | 41,258 | |
| 6,520 | 2 | SAIC, Inc.
| | | 128,509 | |
| 1,940 | 2 | SAVVIS, Inc.
| | | 73,293 | |
| 900 | 2 | SI International, Inc.
| | | 25,389 | |
| 1,316 | 2 | SPSS, Inc.
| | | 50,008 | |
| 2,600 | 2 | SRA International, Inc.
| | | 71,396 | |
| 3,500 | 2 | STEC, Inc.
| | | 22,540 | |
| 6,800 | 2 | Safeguard Scientifics, Inc.
| | | 15,980 | |
| 6,300 | 2 | Sapient Corp.
| | | 44,100 | |
| 1,900 | 2 | ScanSource, Inc.
| | | 70,186 | |
| 1,100 | 2 | SeaChange International, Inc.
| | | 6,831 | |
| 3,852 | 2 | Secure Computing Corp.
| | | 38,135 | |
| 1,543 | 2 | Semitool, Inc.
| | | 14,319 | |
| 5,300 | 2 | Semtech Corp.
| | | 90,683 | |
| 3,800 | 2 | SiRF Technology Holdings, Inc.
| | | 113,278 | |
| 1,700 | 2 | Sigma Designs, Inc.
| | | 99,909 | |
| 200 | 2 | Silicon Graphics, Inc.
| | | 3,748 | |
| 6,306 | 2 | Silicon Image, Inc.
| | | 40,169 | |
| 6,800 | 2 | Silicon Storage Technology
| | | 22,576 | |
| 2,200 | 2 | Sirenza Microdevices, Inc.
| | | 36,388 | |
| 11,900 | 2 | Skyworks Solutions, Inc.
| | | 109,718 | |
| 3,100 | 2 | Smart Modular Technologies (WWH), Inc.
| | | 27,404 | |
Shares
|
|
|
|
| Value
|
|
| | COMMON STOCKS--continued 1 | | | | |
| | Information Technology--continued | | | | |
| 2,700 | 2 | Smith Micro Software, Inc.
| | $ | 41,607 | |
| 2,100 | 2 | Sohu.com, Inc.
| | | 125,811 | |
| 1,400 | 2 | Solera Holdings, Inc.
| | | 30,114 | |
| 2,200 | 2 | Sonic Solutions
| | | 26,400 | |
| 4,164 | 2 | Sonicwall, Inc.
| | | 43,056 | |
| 18,200 | 2 | Sonus Networks, Inc.
| | | 125,580 | |
| 6,600 | 2 | SourceForge, Inc.
| | | 17,490 | |
| 5,800 | 2 | Spansion, Inc.
| | | 40,890 | |
| 1,622 | 2 | Standard Microsystems Corp.
| | | 63,258 | |
| 200 | 2 | StorageNetworks, Inc.
| | | 0 | |
| 1,700 | 2 | Stratasys, Inc.
| | | 44,251 | |
| 1,031 | 2 | Supertex, Inc.
| | | 37,673 | |
| 1,400 | 2 | Switch & Data Facilities Co.
| | | 27,552 | |
| 6,600 | 2 | Sybase, Inc.
| | | 188,760 | |
| 13,300 | 2 | Sycamore Networks, Inc.
| | | 56,791 | |
| 2,200 | 2 | Sykes Enterprises, Inc.
| | | 38,830 | |
| 3,600 | 2 | Symmetricom, Inc.
| | | 17,064 | |
| 2,100 | 2 | Synaptics, Inc.
| | | 114,135 | |
| 1,100 | 2 | Synchronoss Technologies, Inc.
| | | 44,000 | |
| 700 | 2 | Synnex Corp.
| | | 15,659 | |
| 665 | | Syntel, Inc.
| | | 28,316 | |
| 4,999 | 2 | THQ, Inc.
| | | 135,423 | |
| 1,700 | 2 | TNS, Inc.
| | | 27,455 | |
| 3,100 | 2 | TTM Technologies
| | | 39,773 | |
| 5,300 | 2,3 | Take-Two Interactive Software, Inc.
| | | 99,534 | |
| 2,938 | | Technitrol, Inc.
| | | 86,407 | |
| 1,300 | 2 | Techwell, Inc.
| | | 16,146 | |
| 4,400 | 2 | Tekelec, Inc.
| | | 58,080 | |
| 3,430 | 2 | Terremark Worldwide, Inc.
| | | 26,514 | |
| 3,300 | 2 | Tessera Technologies, Inc.
| | | 126,027 | |
| 2,300 | 2 | The Knot, Inc.
| | | 44,597 | |
| 1,500 | | TheStreet.com, Inc.
| | | 20,250 | |
| 15,600 | 2 | Tibco Software, Inc.
| | | 143,208 | |
| 400 | 2 | Travelzoo, Inc.
| | | 7,200 | |
| 4,500 | 2 | Trident Microsystems, Inc.
| | | 33,885 | |
Shares
|
|
|
|
| Value
|
|
| | COMMON STOCKS--continued 1 | | | | |
| | Information Technology--continued | | | | |
| 10,312 | 2 | Triquint Semiconductor, Inc.
| | $ | 64,656 | |
| 2,800 | 2 | Tyler Technologies, Inc.
| | | 45,136 | |
| 8,000 | 2,3 | UTStarcom, Inc.
| | | 25,600 | |
| 1,800 | 2 | Ultimate Software Group, Inc.
| | | 62,118 | |
| 1,900 | 2 | Ultra Clean Holdings, Inc.
| | | 24,396 | |
| 1,843 | 2 | Ultratech, Inc.
| | | 21,360 | |
| 300 | 2 | Unica Corp.
| | | 3,903 | |
| 4,800 | | United Online, Inc.
| | | 84,480 | |
| 1,690 | 2 | Universal Display Corp.
| | | 31,688 | |
| 2,200 | 2 | VASCO Data Security International, Inc.
| | | 58,168 | |
| 7,130 | 2 | ValueClick, Inc.
| | | 193,865 | |
| 2,241 | 2 | Veeco Instruments, Inc.
| | | 40,495 | |
| 1,674 | 2 | ViaSat, Inc.
| | | 51,057 | |
| 2,210 | 2 | Vignette Corp.
| | | 38,100 | |
| 3,300 | 2 | VistaPrint Ltd.
| | | 156,981 | |
| 1,900 | 2 | Visual Sciences, Inc.
| | | 34,580 | |
| 1,200 | 2 | Vocus, Inc.
| | | 43,176 | |
| 1,400 | 2 | Volterra Semiconductor Corp.
| | | 17,206 | |
| 3,376 | 2 | Websense, Inc.
| | | 62,118 | |
| 5,600 | 2 | Wind River Systems, Inc.
| | | 70,056 | |
| 2,900 | 2 | Wright Express Corp.
| | | 112,230 | |
| 2,006 | 2 | X-Rite, Inc.
| | | 27,903 | |
| 3,793 | 2 | Zoran Corp.
| | | 96,722 | |
| 1,000 | 2 | Zygo Corp.
| | | 11,760 | |
| 2,259 | 2 | eSpeed, Inc., Class A
| | | 22,951 | |
| 1,600 | | iBasis, Inc.
| | | 12,640 | |
| 3,600 | 2 | iPass, Inc.
| | | 17,280 | |
| 3,600 | 2 | j2 Global Communications, Inc.
|
|
| 121,284
|
|
| | TOTAL
|
|
| 18,606,018
|
|
| | Materials--5.1% | | | | |
| 600 | 2 | AEP Industries, Inc.
| | | 23,910 | |
| 1,666 | | AMCOL International Corp.
| | | 67,206 | |
| 3,900 | 3 | Abitibibowater, Inc.
| | | 133,614 | |
| 1,199 | | American Vanguard Corp.
| | | 21,306 | |
| 3,900 | 2 | Apex Silver Mines Ltd.
| | | 79,950 | |
Shares
|
|
|
|
| Value
|
|
| | COMMON STOCKS--continued 1 | | | | |
| | Materials--continued | | | | |
| 5,000 | | Aptargroup, Inc.
| | $ | 223,500 | |
| 1,793 | | Arch Chemicals, Inc.
| | | 81,797 | |
| 925 | | Balchem Corp.
| | | 20,082 | |
| 1,455 | 2 | Brush Engineered Materials, Inc.
| | | 70,276 | |
| 2,290 | 2 | Buckeye Technologies, Inc.
| | | 41,037 | |
| 3,800 | | CF Industries Holdings, Inc.
| | | 334,020 | |
| 3,051 | 2,3 | Calgon Carbon Corp.
| | | 45,460 | |
| 600 | | Castle (A.M.) & Co.
| | | 18,060 | |
| 2,260 | 2 | Century Aluminum Co.
| | | 131,509 | |
| 1,429 | 2 | Chesapeake Corp.
| | | 10,589 | |
| 200 | 2 | Claymont Steel Holdings, Inc.
| | | 4,098 | |
| 21,800 | 2,3 | Coeur d'Alene Mines Corp.
| | | 86,110 | |
| 2,300 | | Compass Minerals International, Inc.
| | | 84,893 | |
| 792 | | Deltic Timber Corp.
| | | 44,289 | |
| 3,501 | | Ferro Corp.
| | | 72,541 | |
| 1,600 | 2 | Flotek Industries, Inc.
| | | 81,280 | |
| 4,372 | | Fuller (H.B.) Co.
| | | 128,668 | |
| 4,700 | 2,3 | General Moly, Inc.
| | | 45,167 | |
| 2,883 | | Georgia Gulf Corp.
| | | 34,884 | |
| 3,257 | | Glatfelter (P.H.) Co.
| | | 52,340 | |
| 5,300 | 2 | Grace (W.R.) & Co.
| | | 156,880 | |
| 4,900 | 2 | Graphic Packaging Corp.
| | | 24,108 | |
| 2,168 | | Greif, Inc., Class A
| | | 137,885 | |
| 700 | 2 | Haynes International, Inc.
| | | 61,264 | |
| 3,400 | 2 | Headwaters, Inc.
| | | 48,790 | |
| 9,600 | 2 | Hecla Mining Co.
| | | 92,352 | |
| 8,400 | | Hercules, Inc.
| | | 158,004 | |
| 900 | | Innophos Holdings, Inc.
| | | 14,310 | |
| 1,800 | | Innospec, Inc.
| | | 38,322 | |
| 1,000 | | Kaiser Aluminum Corp.
| | | 75,780 | |
| 1,000 | | Koppers Holdings, Inc.
| | | 44,800 | |
| 284 | | Kronos Worldwide, Inc.
| | | 5,334 | |
| 1,400 | 2 | LSB Industries, Inc.
| | | 37,828 | |
| 900 | 2 | Landec Corp.
| | | 13,374 | |
| 2,000 | 2 | Mercer International, Inc.
| | | 18,800 | |
| 1,800 | | Metal Management, Inc.
| | | 94,626 | |
Shares
|
|
|
|
| Value
|
|
| | COMMON STOCKS--continued 1 | | | | |
| | Materials--continued | | | | |
| 1,563 | | Minerals Technologies, Inc.
| | $ | 109,754 | |
| 2,059 | | Myers Industries, Inc.
| | | 43,630 | |
| 622 | | NL Industries, Inc.
| | | 6,879 | |
| 1,100 | | Neenah Paper, Inc.
| | | 37,400 | |
| 1,100 | | Newmarket Corp.
| | | 59,136 | |
| 300 | 2 | Northwest Pipe Co.
| | | 11,076 | |
| 2,200 | 2 | OM Group, Inc.
| | | 116,556 | |
| 5,323 | | Olin Corp.
| | | 121,258 | |
| 600 | | Olympic Steel, Inc.
| | | 15,618 | |
| 6,642 | 2 | Polyone Corp.
| | | 53,070 | |
| 2,755 | | Quanex Corp.
| | | 113,478 | |
| 1,777 | 2 | RTI International Metals
| | | 138,926 | |
| 2,304 | | Rock-Tenn Co.
| | | 67,185 | |
| 2,200 | 2 | Rockwood Holdings, Inc.
| | | 85,998 | |
| 1,700 | | Royal Gold, Inc.
| | | 60,078 | |
| 1,700 | | Schnitzer Steel Industries, Inc., Class A
| | | 112,319 | |
| 2,459 | | Schulman (A.), Inc.
| | | 58,057 | |
| 1,093 | | Schweitzer-Mauduit International, Inc.
| | | 30,626 | |
| 3,563 | | Sensient Technologies Corp.
| | | 106,498 | |
| 600 | 2 | Shengdatech, Inc.
| | | 4,854 | |
| 1,700 | | Silgan Holdings, Inc.
| | | 92,769 | |
| 2,147 | | Spartech Corp.
| | | 32,999 | |
| 430 | | Stepan Co.
| | | 14,895 | |
| 2,990 | 2 | Stillwater Mining Co.
| | | 33,279 | |
| 2,501 | 2 | Symyx Technologies, Inc.
| | | 23,034 | |
| 6,300 | 2 | Terra Industries, Inc.
| | | 232,407 | |
| 2,006 | | Texas Industries, Inc.
| | | 146,558 | |
| 600 | | Tronox, Inc., Class A
| | | 5,106 | |
| 2,000 | | Tronox, Inc., Class B
| | | 16,460 | |
| 2,400 | 2 | U.S. Concrete, Inc.
| | | 11,904 | |
| 4,400 | 2 | U.S. Gold Corp.
| | | 20,548 | |
| 600 | 2 | Universal Stainless & Alloy
| | | 22,350 | |
| 500 | | Valhi, Inc.
| | | 13,345 | |
| 3,395 | | Wausau-Mosinee Paper Corp.
| | | 33,984 | |
| 800 | 2 | Wheeling Pittsburgh Corp.
| | | 15,736 | |
| 5,300 | | Worthington Industries, Inc.
| | | 132,500 | |
| 1,600 | 2 | Zoltek Cos., Inc.
|
|
| 70,800
|
|
| | TOTAL
|
|
| 5,230,113
|
|
Shares
|
|
|
|
| Value
|
|
| | COMMON STOCKS--continued 1 | | | | |
| | Telecommunication Services--1.6% | | | | |
| 3,800 | | Alaska Communications Systems Holdings, Inc.
| | $ | 61,826 | |
| 300 | | Atlantic Telephone Network, Inc.
| | | 10,773 | |
| 200 | 2 | Aruba Networks, Inc.
| | | 3,818 | |
| 1,300 | 2 | Cbeyond Communications, Inc.
| | | 50,856 | |
| 1,327 | 2 | Centennial Cellular Corp., Class A
| | | 13,588 | |
| 19,100 | 2 | Cincinnati Bell, Inc.
| | | 103,522 | |
| 3,300 | 2 | Cogent Communications Group, Inc.
| | | 91,344 | |
| 1,300 | | Consolidated Communications Holdings, Inc.
| | | 25,883 | |
| 11,000 | 2 | Dobson Communications Corp., Class A
| | | 142,340 | |
| 2,300 | | FairPoint Communications, Inc.
| | | 42,527 | |
| 8,550 | 2 | FiberTower Corp.
| | | 27,018 | |
| 4,376 | 2 | General Communications, Inc., Class A
| | | 51,330 | |
| 2,100 | 2 | Global Crossing Ltd.
| | | 44,289 | |
| 600 | 2 | Globalstar, Inc.
| | | 5,172 | |
| 1,157 | 2 | Golden Telecom, Inc.
| | | 119,692 | |
| 9,300 | 2 | ICO Global Communications Holdings Ltd.
| | | 40,455 | |
| 3,600 | | IDT Corp., Class B
| | | 28,908 | |
| 2,000 | 2,3 | Inphonic, Inc.
| | | 760 | |
| 2,300 | | Iowa Telecommunication Services, Inc.
| | | 45,356 | |
| 1,600 | | NTELOS Holdings Corp.
| | | 48,304 | |
| 1,529 | | North Pittsburgh Systems, Inc.
| | | 37,124 | |
| 5,020 | 2 | PAETEC Holding Corp.
| | | 67,519 | |
| 5,000 | 2 | Premiere Global Services, Inc.
| | | 82,400 | |
| 700 | 2 | Rural Cellular Corp.
| | | 31,059 | |
| 1,500 | | Shenandoah Telecommunications Co.
| | | 35,850 | |
| 1,000 | | SureWest Communications
| | | 26,480 | |
| 1,400 | 2 | Syniverse Holdings, Inc.
| | | 23,366 | |
| 10,750 | 2 | Time Warner Telecom, Inc.
| | | 249,830 | |
| 1,940 | 2 | USA Mobility, Inc.
| | | 30,342 | |
| 3,200 | 2 | Vonage Holdings Corp.
| | | 6,528 | |
| 1,200 | 2 | iPCS, Inc.
|
|
| 42,900
|
|
| | TOTAL
|
|
| 1,591,159
|
|
Shares
|
|
|
|
| Value
|
|
| | COMMON STOCKS--continued 1 | | | | |
| | Utilities--2.8% | | | | |
| 1,900 | | Allete, Inc.
| | $ | 83,011 | |
| 1,279 | | American States Water Co.
| | | 58,131 | |
| 26,899 | 2 | Aquila, Inc.
| | | 112,438 | |
| 3,985 | | Avista Corp.
| | | 87,869 | |
| 2,700 | | Black Hills Corp.
| | | 119,934 | |
| 1,104 | | CH Energy Group, Inc.
| | | 51,601 | |
| 500 | 2 | Cadiz, Inc.
| | | 9,500 | |
| 1,327 | | California Water Service Group
| | | 58,906 | |
| 500 | | Central VT Public Service Corp.
| | | 15,890 | |
| 4,280 | | Cleco Corp.
| | | 112,778 | |
| 600 | | Consolidated Water Co.
| | | 19,890 | |
| 3,615 | 2 | El Paso Electric Co.
| | | 88,025 | |
| 2,361 | | Empire Distribution Electric Co.
| | | 56,782 | |
| 500 | | EnergySouth, Inc.
| | | 28,100 | |
| 2,800 | | ITC Holdings Corp.
| | | 160,272 | |
| 3,200 | | Idacorp, Inc.
| | | 111,648 | |
| 1,597 | | Laclede Group, Inc.
| | | 55,560 | |
| 1,542 | | MGE Energy, Inc.
| | | 51,657 | |
| 3,300 | | NICOR, Inc.
| | | 142,791 | |
| 2,121 | | New Jersey Resources Corp.
| | | 104,459 | |
| 2,096 | | Northwest Natural Gas Co.
| | | 100,964 | |
| 2,400 | | Northwestern Corp.
| | | 66,192 | |
| 700 | | Ormat Technologies, Inc.
| | | 37,751 | |
| 2,171 | | Otter Tail Corp.
| | | 75,203 | |
| 5,500 | | PNM Resources, Inc.
| | | 137,555 | |
| 5,400 | | Piedmont Natural Gas, Inc.
| | | 137,862 | |
| 2,200 | | Portland General Electric Co.
| | | 61,930 | |
| 1,064 | | SJW Corp.
| | | 37,166 | |
| 1,200 | 2 | Semco Energy, Inc.
| | | 9,744 | |
| 2,164 | | South Jersey Industries, Inc.
| | | 81,280 | |
| 2,878 | | Southwest Gas Corp.
| | | 85,649 | |
| 2,271 | | Southwest Water Co.
| | | 29,341 | |
| 1,941 | | UIL Holdings Corp.
| | | 68,284 | |
| 2,606 | | UniSource Energy Corp.
| | | 82,662 | |
| 3,500 | | WGL Holdings, Inc.
| | | 118,720 | |
| 6,400 | | Westar Energy, Inc.
|
|
| 170,368
|
|
| | TOTAL
|
|
| 2,829,913
|
|
| | TOTAL COMMON STOCKS (IDENTIFIED COST $69,383,080)
|
|
| 99,913,086
|
|
Shares
|
|
|
|
| Value
|
|
| | PREFERRED STOCK--0.0% | | | | |
| | Health Care--0.0% | | | | |
| 76 | | Genesis Health Ventures, Inc., Pfd. (IDENTIFIED COST $28,732)
|
| $
| 0
|
|
| | MUTUAL FUND--3.6% | | | | |
| 3,724,520 | 4,5,6 | Prime Value Obligations Fund, Institutional Shares, 5.06%
(AT NET ASSET VALUE)
|
|
| 3,724,520
|
|
| | TOTAL INVESTMENTS--101.5%
(IDENTIFIED COST $73,136,332) 7
|
|
| 103,637,606
|
|
| | OTHER ASSETS AND LIABILITIES - NET--(1.5)%
|
|
| (1,578,297
| )
|
| | TOTAL NET ASSETS--100%
|
| $
| 102,059,309
|
|
At October 31, 2007, the Fund had the following outstanding futures contracts: 1
Description
|
| Number of
Contracts
|
| Notional
Value
|
| Expiration Date
|
| Unrealized
Appreciation
|
2 Russell 2000 Index Long Futures
|
| 5
|
| $2,080,750
|
| December 2007
|
| $108,581
|
1 The Fund purchases index futures contracts to efficiently manage cash flows resulting from shareholder purchases and redemptions, dividend and capital gain payments to shareholders and corporate actions while maintaining exposure to the Russell 2000 Index and minimizing trading costs. The underlying face amount, at value, of open index futures contracts is $2,080,750 at October 31, 2007, which represents 2.0% of net assets. Taking into consideration these open index futures contracts, the Fund's effective total exposure to the Russell 2000 Index is 102.1%.
2 Non-income producing security.
3 All or a portion of these securities are temporarily on loan to unaffiliated broker/dealers.
4 Affiliated company.
5 7-Day net yield.
6 All or a portion of this security is held as collateral for securities lending.
7 The cost of investments for federal tax purposes amounts to $74,968,637.
Note: The categories of investments are shown as a percentage of total net assets at October 31, 2007.
See Notes which are an integral part of the Financial Statements
Statement of Assets and Liabilities
October 31, 2007
Assets:
| | | | | | |
Total investments in securities, at value including $3,724,520 in an affiliated issuer (Note 5) and $2,030,926 of securities loaned (identified cost $73,136,332)
| | | | | $ | 103,637,606 |
Cash
| | | | | | 204,547 |
Restricted cash
| | | | | | 520,000 |
Income receivable
| | | | | | 79,686 |
Receivable for investments sold
| | | | | | 2,593 |
Receivable for shares sold
| | | | | | 72,365 |
Receivable for daily variation margin
|
|
|
|
|
| 37,546
|
TOTAL ASSETS
|
|
|
|
|
| 104,554,343
|
Liabilities:
| | | | | | |
Payable for investments purchased
| | $ | 131,001 | | | |
Payable for shares redeemed
| | | 65,000 | | | |
Payable for collateral due to broker for securities loaned
| | | 2,213,701 | | | |
Payable for distribution services fee (Note 5)
| | | 13,444 | | | |
Payable for shareholder services fee (Note 5)
| | | 25,948 | | | |
Accrued expenses
|
|
| 45,940
|
|
|
|
TOTAL LIABILITIES
|
|
|
|
|
| 2,495,034
|
Net assets for 6,027,701 shares outstanding
|
|
|
|
| $
| 102,059,309
|
Net Assets Consist of:
| | | | | | |
Paid-in capital
| | | | | $ | 65,597,772 |
Net unrealized appreciation of investments and futures contracts
| | | | | | 30,609,855 |
Accumulated net realized gain on investments and futures contracts
| | | | | | 5,353,404 |
Undistributed net investment income
|
|
|
|
|
| 498,278
|
TOTAL NET ASSETS
|
|
|
|
| $
| 102,059,309
|
Net Asset Value, Offering Price and Redemption Proceeds Per Share
| | | | | | |
Institutional Shares:
| | | | | | |
Net asset value, offering price and redemption proceeds per share ($81,091,124 ÷ 4,745,422 shares outstanding), no par value, unlimited shares authorized
|
|
|
|
|
| $17.09
|
Class C Shares:
| | | | | | |
Net asset value per share ($20,968,185 ÷ 1,282,279 shares outstanding), no par value, unlimited shares authorized
|
|
|
|
|
| $16.35
|
Offering price per share
|
|
|
|
|
| $16.35
|
Redemption proceeds per share (99.00/100 of $16.35) 1
|
|
|
|
|
| $16.19
|
1 See "What Do Shares Cost?" in the Prospectus.
See Notes which are an integral part of the Financial Statements
Statement of Operations
Year Ended October 31, 2007
Investment Income:
| | | | | | | | | | | | |
Dividends (including $7,926 received from an affiliated issuer and net of foreign taxes withheld of $411)
| | | | | | | | | | $ | 1,331,309 | |
Interest (including income on securities loaned of $78,067)
|
|
|
|
|
|
|
|
|
|
| 510,252
|
|
TOTAL INCOME
|
|
|
|
|
|
|
|
|
|
| 1,841,561
|
|
Expenses:
| | | | | | | | | | | | |
Management fee (Note 5)
| | | | | | $ | 540,222 | | | | | |
Custodian fees
| | | | | | | 72,420 | | | | | |
Transfer and dividend disbursing agent fees and expenses
| | | | | | | 124,879 | | | | | |
Directors'/Trustees' fees
| | | | | | | 5,208 | | | | | |
Auditing fees
| | | | | | | 20,012 | | | | | |
Legal fees
| | | | | | | 7,877 | | | | | |
Portfolio accounting fees
| | | | | | | 154,724 | | | | | |
Distribution services fee--Class C Shares (Note 5)
| | | | | | | 155,793 | | | | | |
Shareholder services fee--Institutional Shares (Note 5)
| | | | | | | 185,942 | | | | | |
Shareholder services fee--Class C Shares (Note 5)
| | | | | | | 51,190 | | | | | |
Account administration fee--Institutional Shares
| | | | | | | 6,716 | | | | | |
Account administration fee--Class C Shares
| | | | | | | 68 | | | | | |
Share registration costs
| | | | | | | 29,492 | | | | | |
Printing and postage
| | | | | | | 48,744 | | | | | |
Insurance premiums
| | | | | | | 6,505 | | | | | |
Miscellaneous
|
|
|
|
|
|
| 7,144
|
|
|
|
|
|
TOTAL EXPENSES
|
|
|
|
|
|
| 1,416,936
|
|
|
|
|
|
Waiver and Reimbursements (Note 5):
| | | | | | | | | | | | |
Waiver/reimbursement of management fee
| | $ | (136,841 | ) | | | | | | | | |
Reimbursement of shareholder services fee--Institutional Shares
|
|
| (87,932
| )
|
|
|
|
|
|
|
|
|
TOTAL WAIVER AND REIMBURSEMENTS
|
|
|
|
|
|
| (224,773
| )
|
|
|
|
|
Net expenses
|
|
|
|
|
|
|
|
|
|
| 1,192,163
|
|
Net investment income
|
|
|
|
|
|
|
|
|
|
| 649,398
|
|
Realized and Unrealized Gain (Loss) on Investments and Futures Contracts:
| | | | | | | | | | | | |
Net realized gain on investments
| | | | | | | | | | | 7,228,507 | |
Net realized gain on futures contracts
| | | | | | | | | | | 943,778 | |
Net change in unrealized appreciation of investments
| | | | | | | | | | | 39,809 | |
Net change in unrealized appreciation of futures contracts
|
|
|
|
|
|
|
|
|
|
| (585,401
| )
|
Net realized and unrealized gain on investments and futures contracts
|
|
|
|
|
|
|
|
|
|
| 7,626,693
|
|
Change in net assets resulting from operations
|
|
|
|
|
|
|
|
|
| $
| 8,276,091
|
|
See Notes which are an integral part of the Financial Statements
Statement of Changes in Net Assets
Year Ended October 31
|
|
| 2007
|
|
|
| 2006
|
|
Increase (Decrease) in Net Assets
| | | | | | | | |
Operations:
| | | | | | | | |
Net investment income
| | $ | 649,398 | | | $ | 469,793 | |
Net realized gain on investments and futures contracts
| | | 8,172,285 | | | | 11,996,966 | |
Net change in unrealized appreciation/depreciation of investments and futures contracts
|
|
| (545,592
| )
|
|
| 4,922,445
|
|
CHANGE IN NET ASSETS RESULTING FROM OPERATIONS
|
|
| 8,276,091
|
|
|
| 17,389,204
|
|
Distributions to Shareholders:
| | | | | | | | |
Distributions from net investment income
| | | | | | | | |
Institutional Shares
| | | (595,280 | ) | | | (158,928 | ) |
Distributions from net realized gains on investments and futures contracts
| | | | | | | | |
Institutional Shares
| | | (9,738,172 | ) | | | (3,093,658 | ) |
Class C Shares
|
|
| (2,266,303
| )
|
|
| (584,930
| )
|
CHANGE IN NET ASSETS RESULTING FROM DISTRIBUTIONS TO SHAREHOLDERS
|
|
| (12,599,755
| )
|
|
| (3,837,516
| )
|
Share Transactions:
| | | | | | | | |
Proceeds from sale of shares
| | | 26,432,697 | | | | 30,697,963 | |
Net asset value of shares issued to shareholders in payment of distributions declared
| | | 11,112,239 | | | | 3,346,996 | |
Cost of shares redeemed
|
|
| (39,408,232
| )
|
|
| (33,247,292
| )
|
CHANGE IN NET ASSETS RESULTING FROM SHARE TRANSACTIONS
|
|
| (1,863,296
| )
|
|
| 797,667
|
|
Change in net assets
|
|
| (6,186,960
| )
|
|
| 14,349,355
|
|
Net Assets:
| | | | | | | | |
Beginning of period
|
|
| 108,246,269
|
|
|
| 93,896,914
|
|
End of period (including undistributed net investment income of $498,278 and $444,160, respectively)
|
| $
| 102,059,309
|
|
| $
| 108,246,269
|
|
See Notes which are an integral part of the Financial Statements
Notes to Financial Statements
October 31, 2007
1. ORGANIZATION
Federated Index Trust (the "Trust") is registered under the Investment Company Act of 1940, as amended (the "Act"), as an open-end management investment company. The Trust consists of three portfolios. The financial statements included herein are only those of Federated Mini-Cap Index Fund (the "Fund"), a diversified portfolio. The financial statements of the other portfolios are presented separately. The assets of each portfolio are segregated and a shareholder's interest is limited to the portfolio in which shares are held. Each portfolio pays its own expenses. The Fund offers two classes of shares: Institutional Shares and Class C Shares. All shares of the Fund have equal rights with respect to voting, except on class-specific matters. The investment objective of the Fund is to provide investment results that correspond to the aggregate price and dividend performance of approximately 2,000 publicly traded common stocks that are ranked in terms of capitalization below the top 1,000 stocks that comprise the large and mid-range capitalization sector of the United States equity market. This group of stocks is known as the Russell 2000 ® Index.
2. SIGNIFICANT ACCOUNTING POLICIES
The following is a summary of significant accounting policies consistently followed by the Fund in the preparation of its financial statements. These policies are in conformity with generally accepted accounting principles (GAAP) in the United States of America.
Investment Valuation
In calculating its net asset value (NAV), the Fund generally values investments as follows:
- Equity securities listed on an exchange or traded through a regulated market system are valued at their last reported sale price or official closing price in their principal exchange or market.
- Shares of other mutual funds are valued based upon their reported NAVs.
- Derivative contracts listed on exchanges are valued at their reported settlement or closing price.
- Over-the-counter (OTC) derivative contracts are fair valued using price evaluations provided by a pricing service approved by the Board of Trustees (the "Trustees").
- Fixed-income securities acquired with remaining maturities of 60 days or less are valued at their cost (adjusted for the accretion of any discount or amortization of any premium).
- Fixed-income securities acquired with remaining maturities greater than 60 days are fair valued using price evaluations provided by a pricing service approved by the Trustees.
If the Fund cannot obtain a price or price evaluation from a pricing service for an investment, the Fund may attempt to value the investment based upon the mean of bid and asked quotations or fair value the investment based on price evaluations, from one or more dealers. If any price, quotation, price evaluation or other pricing source is not readily available when the NAV is calculated, the Fund uses the fair value of the investment determined in accordance with the procedures described below. There can be no assurance that the Fund could purchase or sell an investment at the price used to calculate the Fund's NAV.
Fair Valuation and Significant Events Procedures
The Trustees have authorized the use of pricing services to provide evaluations of the current fair value of certain investments for purposes of calculating the NAV. Factors considered by pricing services in evaluating an investment include the yields or prices of investments of comparable quality, coupon, maturity, call rights and other potential prepayments, terms and type, reported transactions, indications as to values from dealers, and general market conditions. Some pricing services provide a single price evaluation reflecting the bid side of the market for an investment (a "bid" evaluation). Other pricing services offer both bid evaluations and price evaluations indicative of a price between the prices bid and asked for the investment (a "mid" evaluation). The Fund normally uses bid evaluations for U.S. Treasury and Agency securities, mortgage-backed securities and municipal securities. The Fund normally uses mid evaluations for other types of fixed-income securities and OTC derivative contracts. In the event that market quotations and price evaluations are not available for an investment, the fair value of the investment is determined in accordance with procedures adopted by the Trustees.
The Trustees also have adopted procedures requiring an investment to be priced at its fair value whenever the Adviser determines that a significant event affecting the value of the investment has occurred between the time as of which the price of the investment would otherwise be determined and the time as of which the NAV is computed. An event is considered significant if there is both an affirmative expectation that the investment's value will change in response to the event and a reasonable basis for quantifying the resulting change in value. Examples of significant events that may occur after the close of the principal market on which a security is traded, or after the time of a price evaluation provided by a pricing service or a dealer, include:
- With respect to securities traded in foreign markets, significant trends in U.S. equity markets or in the trading of foreign securities index futures or options contracts;
- With respect to price evaluations of fixed-income securities determined before the close of regular trading on the NYSE, actions by the Federal Reserve Open Market Committee and other significant trends in U.S. fixed-income markets;
- Political or other developments affecting the economy or markets in which an issuer conducts its operations or its securities are traded; and
- Announcements concerning matters such as acquisitions, recapitalizations, litigation developments, a natural disaster affecting the issuer's operations or regulatory changes or market developments affecting the issuer's industry.
The Trustees have approved the use of a pricing service to determine the fair value of equity securities traded principally in foreign markets when the Adviser determines that there has been a significant trend in the U.S. equity markets or in index futures trading. For other significant events, the Fund may seek to obtain more current quotations or price evaluations from alternative pricing sources. If a reliable alternative pricing source is not available, the Fund will determine the fair value of the investment using another method approved by the Trustees.
Repurchase Agreements
It is the policy of the Fund to require the other party to a repurchase agreement to transfer to the Fund's custodian or sub-custodian eligible securities or cash with a market value (after transaction costs) at least equal to the repurchase price to be paid under the repurchase agreement. The eligible securities are transferred to accounts with the custodian or sub-custodian in which the Fund holds a "securities entitlement" and exercises "control" as those terms are defined in the Uniform Commercial Code. The Fund has established procedures for monitoring the market value of the transferred securities and requiring the transfer of additional eligible securities if necessary to equal at least the repurchase price. These procedures also allow the other party to require securities to be transferred from the account to the extent that their market value exceeds the repurchase price or in exchange for other eligible securities of equivalent market value.
With respect to agreements to repurchase U.S. government securities and cash items, the Fund treats the repurchase agreement as an investment in the underlying securities and not as an obligation of the other party to the repurchase agreement. Other repurchase agreements are treated as obligations of the other party secured by the underlying securities. Nevertheless, the insolvency of the other party or other failure to repurchase the securities may delay the disposition of the underlying securities or cause the Fund to receive less than the full repurchase price. Under the terms of the repurchase agreement, any amounts received by the Fund in excess of the repurchase price and related transaction costs must be remitted to the other party.
The Fund may enter into repurchase agreements in which eligible securities are transferred into joint trading accounts maintained by the custodian or sub-custodian for investment companies and other clients advised by the Fund's adviser and its affiliates. The Fund will participate on a pro rata basis with the other investment companies and clients in its share of the securities transferred under such repurchase agreements and in its share of proceeds from any repurchase or other disposition of such securities.
Investment Income, Gains and Losses, Expenses and Distributions
Interest income and expenses are accrued daily. Dividend income and distributions to shareholders are recorded on the ex-dividend date. Foreign dividends are recorded on the ex-dividend date or when the Fund is informed of the ex-dividend date. Distributions of net investment income are declared and paid annually. Non-cash dividends included in dividend income, if any, are recorded at fair value. Investment income, realized and unrealized gains and losses, and certain fund-level expenses are allocated to each class based on relative average daily net assets, except that each class may bear certain expenses unique to that class such as account administration, distribution and shareholder services fees. Dividends are declared separately for each class. No class has preferential dividend rights; differences in per share dividend rates are generally due to differences in separate class expenses.
Premium and Discount Amortization
All premiums and discounts on fixed-income securities are amortized/accreted for financial statement purposes.
Federal Taxes
It is the Fund's policy to comply with the Subchapter M provision of the Internal Revenue Code (the "Code") and to distribute to shareholders each year substantially all of its income. Accordingly, no provision for federal income tax is necessary.
Withholding taxes, and where appropriate, deferred withholding taxes on foreign interest, dividends and capital gains have been provided for in accordance with the applicable country's tax rules and rates.
When-Issued and Delayed Delivery Transactions
The Fund may engage in when-issued or delayed delivery transactions. The Fund records when-issued securities on the trade date and maintains security positions such that sufficient liquid assets will be available to make payment for the securities purchased. Securities purchased on a when-issued or delayed delivery basis are marked to market daily and begin earning interest on the settlement date. Losses may occur on these transactions due to changes in market conditions or the failure of counterparties to perform under the contract.
Futures Contracts
The Fund purchases stock index futures contracts to manage cashflows, maintain exposure to the Russell 2000 Index and to potentially reduce transaction costs. Upon entering into a stock index futures contract with a broker, the Fund is required to deposit in a segregated account a specified amount of cash or U.S. government securities. Futures contracts are valued daily and unrealized gains or losses are recorded in a "variation margin" account. Daily, the Fund receives from or pays to the broker a specified amount of cash based upon changes in the variation margin account. When a contract is closed, the Fund recognizes a realized gain or loss. Futures contracts have market risks, including the risk that the change in the value of the contract may not correlate with the changes in the value of the underlying securities. For the year ended October 31, 2007, the Fund had net realized gains on futures contracts of $943,778.
Futures contracts outstanding at period end are listed after the Fund's portfolio of investments.
Securities Lending
The Fund participates in a securities lending program providing for the lending of equity securities to qualified brokers. The Fund normally receives cash collateral for securities loaned that is invested in an affiliated money market fund or in short-term securities including repurchase agreements. Collateral is maintained at a minimum level of 100% of the market value of investments loaned, plus interest, if applicable. Earnings on collateral are allocated between the securities lending agent, as a fee for its services under the program, and the Fund, according to agreed-upon rates.
As of October 31, 2007, securities subject to this type of arrangement and related collateral were as follows:
Market Value of
Securities Loaned
|
| Market Value
of Collateral
|
$2,030,926
|
| $2,213,701
|
Use of Estimates
The preparation of financial statements in conformity with GAAP requires management to make estimates and assumptions that affect the amounts of assets, liabilities, expenses and revenues reported in the financial statements. Actual results could differ from those estimated.
Other
Investment transactions are accounted for on a trade-date basis. Realized gains and losses from investment transactions are recorded on an identified cost basis.
3. SHARES OF BENEFICIAL INTEREST
The following tables summarize share activity:
Year Ended October 31
|
| 2007
|
| 2006
|
Institutional Shares:
|
| Shares
|
|
|
| Amount
|
|
| Shares
|
|
|
| Amount
|
|
Shares sold
| | 1,155,712 | | | $ | 19,343,093 | | | 1,380,480 | | | $ | 23,149,305 | |
Shares issued to shareholders in payment of distributions declared
| | 556,504 | | | | 8,911,032 | | | 175,739 | | | | 2,785,671 | |
Shares redeemed
|
| (1,935,134
| )
|
|
| (32,351,239
| )
|
| (1,701,762
| )
|
|
| (28,292,061
| )
|
NET CHANGE RESULTING FROM INSTITUTIONAL SHARE TRANSACTIONS
|
| (222,918
| )
|
| $
| (4,097,114
| )
|
| (145,543
| )
|
| $
| (2,357,085
| )
|
| | | | | | | | | | | | | | |
Year Ended October 31
|
| 2007
|
| 2006
|
Class C Shares:
|
| Shares
|
|
|
| Amount
|
|
| Shares
|
|
|
| Amount
|
|
Shares sold
| | 440,180 | | | $ | 7,089,604 | | | 466,558 | | | $ | 7,548,658 | |
Shares issued to shareholders in payment of distributions declared
| | 143,588 | | | | 2,201,207 | | | 36,544 | | | | 561,325 | |
Shares redeemed
|
| (440,043
| )
|
|
| (7,056,993
| )
|
| (305,910
| )
|
|
| (4,955,231
| )
|
NET CHANGE RESULTING FROM CLASS C SHARE TRANSACTIONS
|
|
143,725
|
|
| $
| 2,233,818
|
|
| 197,192
|
|
| $
| 3,154,752
|
|
NET CHANGE RESULTING FROM SHARE TRANSACTIONS
|
|
(79,193
| )
|
| $
|
(1,863,296
| )
|
| 51,649
|
|
| $
| 797,667
|
|
4. FEDERAL TAX INFORMATION
The tax character of distributions as reported on the Statement of Changes in Net Assets for the years ended October 31, 2007 and 2006, was as follows:
|
| 2007
|
| 2006
|
Ordinary income 1
|
| $ 1,533,452
|
| $ 158,928
|
Long-term capital gains
|
| $11,066,303
|
| $3,678,588
|
1 For tax purposes short-term capital gain distributions are considered ordinary income distributions.
As of October 31, 2007, the components of distributable earnings on a tax basis were as follows:
Undistributed ordinary income
|
| $
| 1,267,617
|
Undistributed long-term capital gain
|
| $
| 6,524,951
|
Net unrealized appreciation
|
| $
| 28,668,969
|
The difference between book-basis and tax-basis net unrealized appreciation/depreciation is attributable in part to differing treatments for the deferral of losses on wash sales.
At October 31, 2007, the cost of investments for federal tax purposes was $74,968,637. The net unrealized appreciation of investments for federal tax purposes excluding any unrealized appreciation resulting from futures contracts was $28,668,969. This consists of net unrealized appreciation from investments for those securities having an excess of value over cost of $35,948,555 and net unrealized depreciation from investments for those securities having an excess of cost over value of $7,279,586.
5. INVESTMENT ADVISER FEE AND OTHER TRANSACTIONS WITH AFFILIATES
Management Fee
Federated Equity Management Company of Pennsylvania is the Fund's manager (the "Manager"). The advisory agreement between the Fund and Manager provides for an annual fee equal to 0.50% of the Fund's average daily net assets. Subject to the terms described in the Expense Limitation note, the Manager may voluntarily choose to waive any portion of its fee. The Manager can modify or terminate this voluntary waiver at any time at its sole discretion. For the year ended October 31, 2007, the Manager voluntarily waived $136,666 of its fee. Under the terms of a subadvisory contract between the Manager and BlackRock Investment Management LLC, a wholly owned subsidiary of BlackRock, Inc. (the "Subadviser"), the Subadviser receives an annual fee from the Manager equal to 0.030% of the Fund's average daily net assets.
Distribution Services Fee
The Fund has adopted a Distribution Plan (the "Plan") pursuant to Rule 12b-1 under the Act. Under the terms of the Plan, the Fund will compensate Federated Securities Corp. (FSC), the principal distributor, from the daily net assets of the Fund's Class C Shares to finance activities intended to result in the sale of these shares. The Plan provides that the Fund may incur distribution expenses at 0.75% of average daily net assets, annually, to compensate FSC. When FSC receives fees, it may pay some or all of them to financial intermediaries whose customers purchase shares. For the year ended October 31, 2007, FSC retained $59,365 of fees paid by the Fund.
Sales Charges
For the year ended October 31, 2007, FSC retained $32 of contingent deferred sales charges relating to redemptions of Class C Shares. See "What Do Shares Cost?" in the Prospectus.
Shareholder Services Fee
The Fund may pay fees (Service Fees) up to 0.25% of the average daily net assets of the Fund's Institutional Shares and Class C Shares to financial intermediaries or to Federated Shareholder Services Company (FSSC) for providing services to shareholders and maintaining shareholder accounts. Financial intermediaries may include a company affiliated with management of Federated Investors, Inc. Subject to the terms described in the Expense Limitation footnote, FSSC may voluntarily reimburse the Fund for shareholder services fees. This voluntary reimbursement can be modified or terminated at any time. A financial intermediary affiliated with management of Federated Investors, Inc. received $3,761 of Service Fees for the year ended October 31, 2007. For the year ended October 31, 2007, FSSC voluntarily reimbursed $87,932 of shareholder services fees. For the year ended October 31, 2007, FSSC did not receive any fees paid by the Fund.
Expense Limitation
The Manager and its affiliates (which may include FSC and FSSC) have voluntarily agreed to waive their fees and/or reimburse expenses so that the total operating expenses (as shown in the financial highlights) paid by the Fund's Institutional Shares and Class C Shares (after the voluntary waivers and reimbursements) will not exceed 0.94% and 1.82%, respectively, for the fiscal year ending October 31, 2008. Although these actions are voluntary, the Manager and its affiliates have agreed not to terminate these waivers and/or reimbursements until after December 31, 2008.
General
Certain of the Officers and Trustees of the Fund are Officers and Directors or Trustees of the above companies.
Transactions with Affiliated Companies
Affiliated holdings are mutual funds which are managed by the Manager or an affiliate of the Manager. The Manager has agreed to reimburse the Fund for certain investment adviser fees as a result of transactions in other affiliated mutual funds. For the year ended October 31, 2007, the Manager reimbursed $175 in connection with the affiliated mutual fund listed below. Transactions with the affiliated company during the year ended October 31, 2007 are as follows:
Affiliate
|
| Balance of
Shares Held
10/31/2006
|
| Purchases/
Additions
|
| Sales/
Reductions
|
| Balance of
Shares Held
10/31/2007
|
| Value
|
| Dividend
Income
|
Prime Value Obligations Fund, Institutional Shares
|
| - --
|
| 6,136,422
|
| 2,411,902
|
| 3,724,520
|
| $3,724,520
|
| $7,926
|
6. INVESTMENT TRANSACTIONS
Purchases and sales of investments, excluding long-term U.S. government securities and short-term obligations, for the year ended October 31, 2007, were as follows:
Purchases
|
| $
| 14,730,367
|
Sales
|
| $
| 20,089,524
|
7. INTERFUND LENDING
Pursuant to an Exemptive Order issued by the Securities and Exchange Commission (SEC), the Fund, along with other funds advised by subsidiaries of Federated Investors, Inc., may participate in an interfund lending program. This program provides an alternative credit facility allowing the funds to borrow from other participating affiliated funds. As of October 31, 2007, there were no outstanding loans. During the year ended October 31, 2007, the program was not utilized.
8. LEGAL PROCEEDINGS
Beginning in October 2003, Federated Investors, Inc. and various subsidiaries thereof (including the advisers and distributor for various investment companies, collectively, "Federated"), along with various investment companies sponsored by Federated ("Funds") were named as defendants in several class action lawsuits now pending in the United States District Court for the District of Maryland. The lawsuits were purportedly filed on behalf of people who purchased, owned and/or redeemed shares of Federated-sponsored mutual funds during specified periods beginning November 1, 1998. The suits are generally similar in alleging that Federated engaged in illegal and improper trading practices including market timing and late trading in concert with certain institutional traders, which allegedly caused financial injury to the mutual fund shareholders. These lawsuits began to be filed shortly after Federated's first public announcement that it had received requests for information on shareholder trading activities in the Funds from the SEC, the Office of the New York State Attorney General ("NYAG"), and other authorities. In that regard, on November 28, 2005, Federated announced that it had reached final settlements with the SEC and the NYAG with respect to those matters. As Federated previously reported in 2004, it has already paid approximately $8.0 million to certain funds as determined by an independent consultant. As part of these settlements, Federated agreed to pay for the benefit of fund shareholders additional disgorgement and a civil money penalty in the aggregate amount of an additional $72 million. Federated and various Funds have also been named as defendants in several additional lawsuits, the majority of which are now pending in the United States District Court for the Western District of Pennsylvania, alleging, among other things, excessive advisory and Rule 12b-1 fees. The Board of the Funds has retained the law firm of Dickstein Shapiro LLP to represent the Funds in these lawsuits. Federated and the Funds, and their respective counsel, are reviewing the allegations and intend to defend this litigation. Additional lawsuits based upon similar allegations may be filed in the future. The potential impact of these lawsuits, all of which seek unquantified damages, attorneys' fees and expenses, and future potential similar suits is uncertain. Although we do not believe that these lawsuits will have a material adverse effect on the Funds, there can be no assurance that these suits, the ongoing adverse publicity and/or other developments resulting from the regulatory investigations will not result in increased Fund redemptions, reduced sales of Fund shares, or other adverse consequences for the Funds.
9. RECENT ACCOUNTING PRONOUNCEMENTS
In July 2006, the Financial Accounting Standards Board (FASB) released FASB Interpretation No. 48 "Accounting for Uncertainty in Income Taxes" (FIN 48). FIN 48 provides guidance for how uncertain tax positions should be recognized, measured, presented and disclosed in the financial statements. FIN 48 requires the evaluation of tax positions taken in the course of preparing the Fund's tax returns to determine whether the tax positions are "more-likely-than-not" of being sustained by the applicable tax authority. Tax benefits of positions not deemed to meet the more-likely-than-not threshold would be recorded as a tax expense in the current year. Adoption of FIN 48 is required for fiscal years beginning after December 15, 2006. Recent SEC guidance allows implementing FIN 48 in fund NAV calculations as late as a fund's last NAV calculation in the first required financial statement reporting period. As a result, the Fund will adopt FIN 48 no later than April 30, 2008. At this time, management has concluded that the adoption of FIN 48 is not expected to have a material impact on the Fund's net assets or results of operations.
In addition, in September 2006, FASB released Statement on Financial Accounting Standards No. 157, "Fair Value Measurements" (FAS 157), which is effective for fiscal years beginning after November 15, 2007. FAS 157 defines fair value, establishes a framework for measuring fair value and expands disclosures about fair value measurements. Management is currently evaluating the impact the adoption of FAS 157 will have on the Fund's financial statement disclosures.
10. FEDERAL TAX INFORMATION (UNAUDITED)
For the year ended October 31, 2007, the amount of long-term capital gains designated by the Fund was $11,066,303.
For the fiscal year ended October 31, 2007, 45.9% of total ordinary income (including short-term capital gain) distributions made by the Fund are qualifying dividends which may be subject to a maximum tax rate of 15%, as provided for by the Jobs and Growth Tax Relief Act of 2003. Complete information is reported in conjunction with the reporting of your distributions on Form 1099-DIV.
Of the ordinary income (including short-term capital gain) distributions made by the Fund during the year ended October 31, 2007, 45.5% qualify for the dividend received deduction available to corporate shareholders.
Report of Independent Registered Public Accounting Firm
TO THE BOARD OF TRUSTEES OF FEDERATED INDEX TRUST AND SHAREHOLDERS OF FEDERATED MINI-CAP INDEX FUND:
We have audited the accompanying statement of assets and liabilities of Federated Mini-Cap Index Fund (the "Fund") (one of the portfolios constituting Federated Index Trust), including the portfolio of investments, as of October 31, 2007, and the related statement of operations for the year then ended, the statement of changes in net assets for each of the two years in the period then ended, and the financial highlights for each of the five years in the period then ended. These financial statements and financial highlights are the responsibility of the Fund's management. Our responsibility is to express an opinion on these financial statements and financial highlights based on our audits.
We conducted our audits in accordance with the standards of the Public Company Accounting Oversight Board (United States). Those standards require that we plan and perform the audit to obtain reasonable assurance about whether the financial statements and financial highlights are free of material misstatement. We were not engaged to perform an audit of the Fund's internal control over financial reporting. Our audits included consideration of internal control over financial reporting as a basis for designing audit procedures that are appropriate in the circumstances, but not for the purpose of expressing an opinion on the effectiveness of the Fund's internal control over financial reporting. Accordingly, we express no such opinion. An audit also includes examining, on a test basis, evidence supporting the amounts and disclosures in the financial statements and financial highlights, assessing the accounting principles used and significant estimates made by management, and evaluating the overall financial statement presentation. Our procedures included confirmation of securities owned as of October 31, 2007, by correspondence with the custodian and brokers or by other appropriate auditing procedures where replies from brokers were not received. We believe that our audits provide a reasonable basis for our opinion.
In our opinion, the financial statements and financial highlights referred to above present fairly, in all material respects, the financial position of Federated Mini-Cap Index Fund, a portfolio of Federated Index Trust at October 31, 2007, the results of its operations for the year then ended, the changes in its net assets for each of the two years in the period then ended, and the financial highlights for each of the five years in the period then ended, in conformity with U.S. generally accepted accounting principles.
Ernst & Young LLP
Boston, Massachusetts
December 18, 2007
Board of Trustees and Trust Officers
The Board is responsible for managing the Trust's business affairs and for exercising all the Trust's powers except those reserved for the shareholders. The following tables give information about each Board member and the senior officers of the Fund. Where required, the tables separately list Board members who are "interested persons" of the Fund (i.e., "Interested" Board members) and those who are not (i.e., "Independent" Board members). Unless otherwise noted, the address of each person listed is Federated Investors Tower, 1001 Liberty Avenue, Pittsburgh, PA. As of December 31, 2006, the Trust comprised 3 portfolios, and the Federated Fund Complex consisted of 45 investment companies (comprising 148 portfolios). Unless otherwise noted, each Officer is elected annually. Unless otherwise noted, each Board member oversees all portfolios in the Federated Fund Complex and serves for an indefinite term. The Fund's Statement of Additional Information includes additional information about Trust Trustees and is available, without charge and upon request, by calling 1-800-341-7400.
INTERESTED TRUSTEES BACKGROUND
|
|
|
Name
Birth Date
Address
Positions Held with Trust
Date Service Began
|
| Principal Occupation(s) for Past Five Years,
Other Directorships Held and Previous Position(s)
|
John F. Donahue*
Birth Date: July 28, 1924
TRUSTEE
Began serving: January 1990 | | Principal Occupations: Director or Trustee of the Federated Fund Complex; Chairman and Director, Federated Investors, Inc.; Chairman of the Federated Fund Complex's Executive Committee.
Previous Positions: Chairman of the Federated Fund Complex; Trustee, Federated Investment Management Company and Chairman and Director, Federated Investment Counseling. |
|
|
|
J. Christopher Donahue*
Birth Date: April 11, 1949
PRESIDENT AND TRUSTEE
Began serving: January 1990 | | Principal Occupations: Principal Executive Officer and President of the Federated Fund Complex; Director or Trustee of some of the Funds in the Federated Fund Complex; President, Chief Executive Officer and Director, Federated Investors, Inc.; Chairman and Trustee, Federated Investment Management Company; Trustee, Federated Investment Counseling; Chairman and Director, Federated Global Investment Management Corp.; Chairman, Federated Equity Management Company of Pennsylvania and Passport Research, Ltd. (Investment advisory subsidiary of Federated); Trustee, Federated Shareholder Services Company; Director, Federated Services Company.
Previous Positions: President, Federated Investment Counseling; President and Chief Executive Officer, Federated Investment Management Company, Federated Global Investment Management Corp. and Passport Research, Ltd. |
|
|
|
|
|
|
Name
Birth Date
Address
Positions Held with Trust
Date Service Began
|
| Principal Occupation(s) for Past Five Years,
Other Directorships Held and Previous Position(s)
|
Lawrence D. Ellis, M.D.*
Birth Date: October 11, 1932
3471 Fifth Avenue
Suite 1111
Pittsburgh, PA
TRUSTEE
Began serving: January 1990 | | Principal Occupations: Director or Trustee of the Federated Fund Complex; Professor of Medicine, University of Pittsburgh; Medical Director, University of Pittsburgh Medical Center Downtown; Hematologist, Oncologist and Internist, University of Pittsburgh Medical Center.
Other Directorships Held: Member, National Board of Trustees, Leukemia Society of America.
Previous Positions: Trustee, University of Pittsburgh; Director, University of Pittsburgh Medical Center. |
|
|
|
* Family relationships and reasons for "interested" status: John F. Donahue is the father of J. Christopher Donahue; both are "interested" due to the positions they hold with Federated Investors, Inc. and its subsidiaries. Lawrence D. Ellis, M.D. is "interested" because his son-in-law is employed by the Fund's principal underwriter, Federated Securities Corp.
INDEPENDENT TRUSTEES BACKGROUND
|
|
|
Name
Birth Date
Address
Positions Held with Trust
Date Service Began
|
| Principal Occupation(s) for Past Five Years, Other Directorships Held and Previous Position(s)
|
Thomas G. Bigley
Birth Date: February 3, 1934
15 Old Timber Trail
Pittsburgh, PA
TRUSTEE
Began serving: October 1995 | | Principal Occupation: Director or Trustee of the Federated Fund Complex.
Other Directorships Held: Director, Member of Executive Committee, Children's Hospital of Pittsburgh; Director, University of Pittsburgh.
Previous Position: Senior Partner, Ernst & Young LLP. |
|
|
|
John T. Conroy, Jr.
Birth Date: June 23, 1937
Investment Properties Corporation
3838 North Tamiami Trail
Suite 402
Naples, FL
TRUSTEE
Began serving: August 1991 | | Principal Occupations: Director or Trustee of the Federated Fund Complex; Chairman of the Board, Investment Properties Corporation; Partner or Trustee in private real estate ventures in Southwest Florida.
Previous Positions: President, Investment Properties Corporation; Senior Vice President, John R. Wood and Associates, Inc., Realtors; President, Naples Property Management, Inc. and Northgate Village Development Corporation. |
|
|
|
|
|
|
Name
Birth Date
Address
Positions Held with Trust
Date Service Began
|
| Principal Occupation(s) for Past Five Years,
Other Directorships Held and Previous Position(s)
|
Nicholas P. Constantakis
Birth Date: September 3, 1939
175 Woodshire Drive
Pittsburgh, PA
TRUSTEE
Began serving: February 1998 | | Principal Occupation: Director or Trustee of the Federated Fund Complex.
Other Directorships Held: Director and Member of the Audit Committee, Michael Baker Corporation (engineering and energy services worldwide).
Previous Position: Partner, Andersen Worldwide SC. |
|
|
|
John F. Cunningham
Birth Date: March 5, 1943
353 El Brillo Way
Palm Beach, FL
TRUSTEE
Began serving: January 1999 | | Principal Occupation: Director or Trustee of the Federated Fund Complex; Director, QSGI, Inc. (technology services company).
Other Directorships Held: Chairman, President and Chief Executive Officer, Cunningham & Co., Inc. (strategic business consulting); Trustee Associate, Boston College.
Previous Positions: Director, Redgate Communications and EMC Corporation (computer storage systems); Chairman of the Board and Chief Executive Officer, Computer Consoles, Inc.; President and Chief Operating Officer, Wang Laboratories; Director, First National Bank of Boston; Director, Apollo Computer, Inc. |
|
|
|
Peter E. Madden
Birth Date: March 16, 1942
One Royal Palm Way
100 Royal Palm Way
Palm Beach, FL
TRUSTEE
Began serving: August 1991 | | Principal Occupation: Director or Trustee of the Federated Fund Complex.
Other Directorships Held: Board of Overseers, Babson College.
Previous Positions: Representative, Commonwealth of Massachusetts General Court; President, State Street Bank and Trust Company and State Street Corporation (retired); Director, VISA USA and VISA International; Chairman and Director, Massachusetts Bankers Association; Director, Depository Trust Corporation; Director, The Boston Stock Exchange. |
|
|
|
Charles F. Mansfield, Jr.
Birth Date: April 10, 1945
80 South Road
Westhampton Beach, NY
TRUSTEE
Began serving: January 1999 | | Principal Occupations: Director or Trustee of the Federated Fund Complex; Management Consultant.
Previous Positions: Chief Executive Officer, PBTC International Bank; Partner, Arthur Young & Company (now Ernst & Young LLP); Chief Financial Officer of Retail Banking Sector, Chase Manhattan Bank; Senior Vice President, HSBC Bank USA (formerly, Marine Midland Bank); Vice President, Citibank; Assistant Professor of Banking and Finance, Frank G. Zarb School of Business, Hofstra University; Executive Vice President DVC Group, Inc. (marketing, communications and technology). |
|
|
|
|
|
|
Name
Birth Date
Address
Positions Held with Trust
Date Service Began
|
| Principal Occupation(s) for Past Five Years,
Other Directorships Held and Previous Position(s)
|
John E. Murray, Jr., J.D., S.J.D.
Birth Date: December 20, 1932
Chancellor, Duquesne University
Pittsburgh, PA
TRUSTEE
Began serving: February 1995 | | Principal Occupations: Director or Trustee, and Chairman of the Board of Directors or Trustees, of the Federated Fund Complex; Chancellor and Law Professor, Duquesne University; Partner, Murray, Hogue & Lannis.
Other Directorships Held: Director, Michael Baker Corp. (engineering, construction, operations and technical services).
Previous Positions: President, Duquesne University; Dean and Professor of Law, University of Pittsburgh School of Law; Dean and Professor of Law, Villanova University School of Law. |
|
|
|
Thomas M. O'Neill
Birth Date: June 14, 1951
95 Standish Street P.O. Box 2779
Duxbury, MA
TRUSTEE
Began serving: October 2006 | | Principal Occupations: Director or Trustee of the Federated Fund Complex; Managing Director and Partner, Navigator Management Company, L.P. (investment and strategic consulting).
Other Directorships Held: Director, Midway Pacific (lumber); Board of Overseers, Children's Hospital of Boston; Visiting Committee on Athletics, Harvard College.
Previous Positions: Chief Executive Officer and President, Managing Director and Chief Investment Officer, Fleet Investment Advisors; President and Chief Executive Officer, Aeltus Investment Management, Inc.; General Partner, Hellman, Jordan Management Co., Boston, MA; Chief Investment Officer, The Putnam Companies, Boston, MA; and Credit Analyst and Lending Officer, Fleet Bank. |
|
|
|
Marjorie P. Smuts
Birth Date: June 21, 1935
4905 Bayard Street
Pittsburgh, PA
TRUSTEE
Began serving: January 1990 | | Principal Occupation: Director or Trustee of the Federated Fund Complex.
Previous Positions: Public Relations/Marketing Consultant/Conference Coordinator; National Spokesperson, Aluminum Company of America; television producer; President, Marj Palmer Assoc.; Owner, Scandia Bord. |
|
|
|
|
|
|
Name
Birth Date
Address
Positions Held with Trust
Date Service Began
|
| Principal Occupation(s) for Past Five Years,
Other Directorships Held and Previous Position(s)
|
John S. Walsh
Birth Date: November 28, 1957
2604 William Drive
Valparaiso, IN
TRUSTEE
Began serving: January 1999 | | Principal Occupations: Director or Trustee of the Federated Fund Complex; President and Director, Heat Wagon, Inc. (manufacturer of construction temporary heaters); President and Director, Manufacturers Products, Inc. (distributor of portable construction heaters); President, Portable Heater Parts, a division of Manufacturers Products, Inc.
Previous Position: Vice President, Walsh & Kelly, Inc. |
|
|
|
James F. Will
Birth Date: October 12, 1938
721 E. McMurray Road
McMurray, PA
TRUSTEE
Began serving: April 2006 | | Principal Occupations: Director or Trustee of the Federated Fund Complex; Prior to June 2006, Vice Chancellor and President, Saint Vincent College.
Other Directorships Held: Trustee, Saint Vincent College; Alleghany Corporation.
Previous Positions: Chairman, President and Chief Executive Officer, Armco, Inc.; President and Chief Executive Officer, Cyclops Industries; President and Chief Operating Officer, Kaiser Steel Corporation. |
|
|
|
OFFICERS
|
|
|
Name
Birth Date
Positions Held with Trust
Date Service Began
|
| Principal Occupation(s) for Past Five Years and Previous Position(s)
|
John W. McGonigle
Birth Date: October 26, 1938
EXECUTIVE VICE PRESIDENT
AND SECRETARY
Began serving: February 1990 | | Principal Occupations: Executive Vice President and Secretary of the Federated Fund Complex; Vice Chairman, Executive Vice President, Secretary and Director, Federated Investors, Inc.
Previous Positions: Trustee, Federated Investment Management Company and Federated Investment Counseling; Director, Federated Global Investment Management Corp., Federated Services Company and Federated Securities Corp. |
|
|
|
Richard A. Novak
Birth Date: December 25, 1963
TREASURER
Began serving: January 2006 | | Principal Occupations: Principal Financial Officer and Treasurer of the Federated Fund Complex; Senior Vice President, Federated Administrative Services; Financial and Operations Principal for Federated Securities Corp., Edgewood Services, Inc. and Southpointe Distribution Services, Inc.
Previous Positions: Controller of Federated Investors, Inc.; Vice President, Finance of Federated Services Company; held various financial management positions within The Mercy Hospital of Pittsburgh; Auditor, Arthur Andersen & Co. |
|
|
|
Richard B. Fisher
Birth Date: May 17, 1923
TREASURER
Began serving: February 1990 | | Principal Occupations: Vice Chairman or Vice President of some of the Funds in the Federated Fund Complex; Vice Chairman, Federated Investors, Inc.; Chairman, Federated Securities Corp.
Previous Positions: President and Director or Trustee of some of the Funds in the Federated Fund Complex; Executive Vice President, Federated Investors, Inc. and Director and Chief Executive Officer, Federated Securities Corp. |
|
|
|
Brian P. Bouda
Birth Date: February 28, 1947
SENIOR VICE PRESIDENT
Began serving: January 2006 | | Principal Occupations: Senior Vice President and Chief Compliance Officer of the Federated Fund Complex; Vice President and Chief Compliance Officer of Federated Investors, Inc.; and Chief Compliance Officer of its subsidiaries. Mr. Bouda joined Federated in 1999 and is a member of the American Bar Association and the State Bar Association of Wisconsin. |
|
|
|
Stephen F. Auth
Birth Date: September 3, 1956
CHIEF INVESTMENT OFFICER
Began serving: November 2002 | | Principal Occupations: Chief Investment Officer of this Fund and various other Funds in the Federated Fund Complex; Executive Vice President, Federated Investment Counseling, Federated Global Investment Management Corp. and Federated Equity Management Company of Pennsylvania.
Previous Positions: Executive Vice President, Federated Investment Management Company, and Passport Research, Ltd. (Investment advisory subsidiary of Federated); Senior Vice President, Global Portfolio Management Services Division; Senior Vice President, Federated Investment Management Company and Passport Research, Ltd.; Senior Managing Director and Portfolio Manager, Prudential Investments. |
|
|
|
Evaluation and Approval of Advisory Contract
FEDERATED MINI-CAP INDEX FUND (THE "FUND")
The Fund's Board reviewed the Fund's investment advisory and subadvisory contracts at meetings held in May 2007. The Board's decision regarding these contracts reflects the exercise of its business judgment on whether to continue the existing arrangements.
In this connection, the Federated funds had previously appointed a Senior Officer, whose duties include specified responsibilities relating to the process by which advisory fees are to be charged to a Federated fund. The Senior Officer has the authority to retain consultants, experts, or staff as may be reasonably necessary to assist in the performance of his duties, reports directly to the Board, and may be terminated only with the approval of a majority of the independent members of the Board. The Senior Officer prepared and furnished to the Board an independent written evaluation that covered topics discussed below. The Board considered that evaluation, along with other information, in deciding to approve the advisory and subadvisory contracts.
During its review of these contracts, the Board considered compensation and benefits received by the Adviser and subadviser. This included the fees received for services provided to the Fund by other entities in the Federated organization and research services (if any) received by the Adviser and subadviser from brokers that execute Federated fund trades, as well as advisory fees. The Board is also familiar with and considered judicial decisions concerning allegedly excessive investment advisory fees which have indicated that the following factors may be relevant to an Adviser's fiduciary duty with respect to its receipt of compensation from a fund: the nature and quality of the services provided by the Adviser, including the performance of the Fund; the Adviser's cost of providing the services; the extent to which the Adviser may realize "economies of scale" as the Fund grows larger; any indirect benefits that may accrue to the Adviser and its affiliates as a result of the Adviser's relationship with the Fund; performance and expenses of comparable funds; and the extent to which the independent Board members are fully informed about all facts the Board deems relevant bearing on the Adviser's services and fees. The Board further considered management fees (including any components thereof) charged to institutional and other clients of the Adviser for what might be viewed as like services, and costs to the Adviser and its affiliates of supplying services pursuant to the management fee agreements, excluding any intra-corporate profit and profit margins of the Adviser and its affiliates from supplying such services. The Board was aware of these factors and was guided by them in its review of the Fund's advisory and subadvisory contracts to the extent it considered them to be appropriate and relevant, as discussed further below.
The Board considered and weighed these circumstances in light of its substantial accumulated experience in governing the Fund and working with Federated on matters relating to the Federated funds, and was assisted in its deliberations by the advice of independent legal counsel. Throughout the year, the Board has requested and received substantial and detailed information about the Fund and the Federated organization that was in addition to the extensive materials that comprise and accompany the Senior Officer's evaluation. Federated provided much of this information at each regular meeting of the Board, and furnished additional reports in connection with the particular meeting at which the Board's formal review of the advisory and subadvisory contracts occurred. Between regularly scheduled meetings, the Board also received information on particular matters as the need arose. Thus, the Board's consideration of the advisory and subadvisory contracts included review of the Senior Officer's evaluation, accompanying data and additional reports covering such matters as: the Adviser's profitability, and the Adviser's and subadviser's investment philosophy, revenue, personnel and processes; investment and operating strategies; the Fund's short- and long-term performance (in absolute terms, both on a gross basis and net of expenses, as well as in relationship to its particular investment program and certain competitor or "peer group" funds and/or other benchmarks, as appropriate), and comments on the reasons for performance; the Fund's investment objectives; the Fund's expenses (including the advisory fee itself and the overall expense structure of the Fund, both in absolute terms and relative to similar and/or competing funds, with due regard for contractual or voluntary expense limitations); the use and allocation of brokerage commissions derived from trading the Fund's portfolio securities (if any); and the nature, quality and extent of the advisory and other services provided to the Fund by the Adviser, the subadviser, and their affiliates. The Board also considered the preferences and expectations of Fund shareholders and their relative sophistication; the continuing state of competition in the mutual fund industry and market practices; the range of comparable fees for similar funds in the mutual fund industry; the Fund's relationship to the Federated family of funds which include a comprehensive array of funds with different investment objectives, policies and strategies which are available for exchange without the incurrence of additional sales charges; compliance and audit reports concerning the Federated funds, the Federated companies that service them, and the subadviser (including communications from regulatory agencies), as well as Federated's and/or the subadviser's responses to any issues raised therein; and relevant developments in the mutual fund industry and how the Federated funds and/or Federated are responding to them. The Board's evaluation process is evolutionary. The criteria considered and the emphasis placed on relevant criteria change in recognition of changing circumstances in the mutual fund marketplace.
With respect to the Fund's performance and expenses in particular, the Board has found the use of comparisons to other mutual funds with comparable investment programs to be particularly useful, given the high degree of competition in the mutual fund business. The Board focused on comparisons with other similar mutual funds more heavily than non-mutual fund products or services because, simply put, they are more relevant. For example, other mutual funds are the products most like the Fund, they are readily available to Fund shareholders as alternative investment vehicles, and they are the type of investment vehicle in fact chosen and maintained by the Fund's investors. The range of their fees and expenses therefore appears to be a generally reliable indication of what consumers have found to be reasonable in the precise marketplace in which the Fund competes. The Fund's ability to deliver competitive performance when compared to its peer group was a useful indicator of how the Adviser and subadviser are executing the Fund's investment program, which in turn assisted the Board in reaching a conclusion that the nature, extent, and quality of the Adviser's and subadviser's investment management services were such as to warrant continuation of the advisory and subadvisory contracts. In this regard, the Senior Officer has reviewed Federated's fees for providing advisory services to products outside the Federated family of funds (e.g., institutional and separate accounts). He concluded that mutual funds and institutional accounts are inherently different products. Those differences included, but are not limited to targeting different investors, being subject to different laws and regulations, different legal structure, distribution costs, average account size and portfolio management techniques made necessary by different cash flows. The Senior Officer did not consider these fee schedules to be significant in determining the appropriateness of mutual fund advisory contracts.
The Senior Officer reviewed reports compiled by Federated, using data supplied by independent fund ranking organizations, regarding the performance of, and fees charged by, other mutual funds, noting his view that comparisons to fund peer groups are highly important in judging the reasonableness of proposed fees.
The Fund's performance fell below the median of the relevant peer group for both the one and three year periods ending December 31, 2006. The Board discussed the Fund's performance with the Adviser and recognized the efforts being undertaken by the Adviser and subadviser. The Board will continue to monitor these efforts and the performance of the Fund.
The Board also received financial information about Federated, including reports on the compensation and benefits Federated derived from its relationships with the Federated funds. These reports covered not only the fees under the advisory contracts, but also fees received by Federated's subsidiaries for providing other services to the Federated funds under separate contracts (e.g., for serving as the Federated funds' administrator). The reports also discussed any indirect benefit Federated may derive from its receipt of research services from brokers who execute Federated fund trades. In addition, the Board considered the fact that, in order for a fund to be competitive in the marketplace, Federated and its affiliates frequently waived fees and/or reimbursed expenses and have disclosed to fund investors and/or indicated to the Board their intention to do so in the future, where appropriate. The Board also received financial information about the subadviser, as well as reports that discussed any indirect benefit the subadviser may derive from its receipt of research services from brokers who execute Fund trades.
Federated furnished reports, requested by the Senior Officer, that reported revenues on a fund by fund basis and made estimates of the allocation of expenses on a fund by fund basis, using allocation methodologies specified by the Senior Officer. The Senior Officer noted that, although they may apply consistent allocation processes, the inherent difficulties in allocating costs (and the unavoidable arbitrary aspects of that exercise) and the lack of consensus on how to allocate those costs may render such allocation reports unreliable. The allocation reports were considered in the analysis by the Board but were determined to be of limited use.
The Board and the Senior Officer also reviewed a report compiled by Federated comparing profitability information for Federated to other publicly held fund management companies. In this regard, the Senior Officer noted the limited availability of such information, but nonetheless concluded that Federated's profit margins did not appear to be excessive and the Board agreed. With respect to the subadviser, the Board noted that it had reviewed relevant information, and initially approved the current subadvisory contract, at meetings held in August 2006, in contemplation of the impending combination of the asset management businesses of the Fund's former subadviser with another asset management firm. The combination took place in the latter part of 2006. In connection with the Board's present review, the subadviser had informed the Board that it was still in the process of implementing post-merger changes to relevant accounting systems, and that this is affecting its cost allocation capabilities. Consequently, the subadviser was unable to furnish profitability information for the Board's consideration at the May 2007 meetings, but undertook to provide the 2006 profitability information with respect to the Fund for consideration at a Board meeting later in 2007.
The Senior Officer's evaluation also discussed the notion of possible realization of "economies of scale" as a fund grows larger. The Board considered in this regard that the Adviser has made significant additional investments in areas such as personnel and processes for the portfolio management, compliance, and risk management functions; distribution efforts; and systems technology; that support all of the Federated funds, and that the benefits of these efforts (as well as any economies, should they exist) were likely to be enjoyed by the fund complex as a whole. Finally, the Board also noted the absence of any applicable regulatory or industry guidelines on this subject, which (as discussed in independently prepared materials included in the Senior Officer's evaluation) is compounded by the lack of any common industry practice or general pattern with respect to structuring fund advisory fees with "breakpoints" that serve to reduce the fee as the fund attains a certain size. The Senior Officer did not recommend institution of breakpoints in pricing Federated's fund advisory services at this time.
For the Fund's most recently completed fiscal year, the Fund's investment advisory fee after waivers and expense reimbursements, if any, was above the median of the relevant peer group. The Board reviewed the fees and other expenses of the Fund with the Adviser and was satisfied that the overall expense structure of the Fund remained competitive. The Board will continue to monitor advisory fees and other expenses borne by the Fund.
The Senior Officer's evaluation noted his belief that the information and observations contained in his evaluation supported his finding that the proposed management fees are reasonable, and that Federated appeared to provide appropriate administrative services to the Fund for the fees paid. Under these circumstances, no changes were recommended to, and no objection was raised to the continuation of the Fund's advisory and subadvisory contracts. For 2006, the Board concluded that the nature, quality and scope of services provided the Fund by the Adviser and its affiliates, and by the subadviser, were satisfactory.
In its decision to continue an existing investment advisory contract, the Board was mindful of the potential disruptions of the Fund's operations and various risks, uncertainties and other effects that could occur as a result of a decision to terminate or not renew an advisory contract. In particular, the Board recognized that most shareholders have invested in the Fund on the strength of the Adviser's industry standing and reputation and in the expectation that the Adviser will have a continuing role in providing advisory services to the Fund. Thus, the Board's approval of the advisory contract reflected the fact that it is the shareholders who have effectively selected the Adviser by virtue of having invested in the Fund.
The Board based its decision to approve the advisory and subadvisory contracts on the totality of the circumstances and relevant factors and with a view to past and future long-term considerations. Not all of the factors and considerations identified above were necessarily relevant to the Fund, nor did the Board consider any one of them to be determinative. With respect to the factors that were relevant, the Board's decision to approve the contract reflects its determination that Federated's performance and actions provided a satisfactory basis to support the decision to continue the existing arrangements.
Voting Proxies on Fund Portfolio Securities
A description of the policies and procedures that the Fund uses to determine how to vote proxies, if any, relating to securities held in the Fund's portfolio is available, without charge and upon request, by calling 1-800-341-7400. A report on "Form N-PX" of how the Fund voted any such proxies during the most recent 12-month period ended June 30 is available from Federated's website at FederatedInvestors.com. To access this information from the "Products" section of the website, click on the "Prospectuses and Regulatory Reports" link under "Related Information," then select the appropriate link opposite the name of the Fund; or select the name of the Fund and, from the Fund's page, click on the "Prospectuses and Regulatory Reports" link. Form N-PX filings are also available at the SEC's website at www.sec.gov.
Quarterly Portfolio Schedule
The Fund files with the SEC a complete schedule of its portfolio holdings, as of the close of the first and third quarters of its fiscal year, on "Form N-Q." These filings are available on the SEC's website at www.sec.gov and may be reviewed and copied at the SEC's Public Reference Room in Washington, DC. (Call 1-800-SEC-0330 for information on the operation of the Public Reference Room.) You may also access this information from the "Products" section of Federated's website at FederatedInvestors.com by clicking on "Portfolio Holdings" under "Related Information," then selecting the appropriate link opposite the name of the Fund; or select the name of the Fund and, from the Fund's page, click on the "Portfolio Holdings" link.
Mutual funds are not bank deposits or obligations, are not guaranteed by any bank, and are not insured or guaranteed by the U.S. government, the Federal Deposit Insurance Corporation, the Federal Reserve Board, or any other government agency. Investment in mutual funds involves investment risk, including the possible loss of principal.
This report is authorized for distribution to prospective investors only when preceded or accompanied by the Fund's prospectus, which contains facts concerning its objective and policies, management fees, expenses, and other information.
Federated
World-Class Investment Manager
Federated Mini-Cap Index Fund
Federated Investors Funds
5800 Corporate Drive
Pittsburgh, PA 15237-7000
Contact us at FederatedInvestors.com
or call 1-800-341-7400.
Federated Securities Corp., Distributor
Cusip 31420E601
Cusip 31420E304
29456 (12/07)
Federated is a registered mark of Federated Investors, Inc. 2007 (c)Federated Investors, Inc.
ITEM 2.     CODE OF ETHICS

(a) As of the end of the period covered by this report, the registrant has
adopted a code of ethics (the "Section 406 Standards for Investment Companies -
Ethical Standards for Principal Executive and Financial Officers") that applies
to the registrant's Principal Executive Officer and Principal Financial Officer;
the registrant's Principal Financial Officer also serves as the Principal
Accounting Officer.

(c) Not Applicable

(d) Not Applicable

(e) Not Applicable

(f)(3) The registrant hereby undertakes to provide any person, without charge,
upon request, a copy of the code of ethics.  To request a copy of the code of
ethics, contact the registrant at 1-800-341-7400, and ask for a copy of the
Section 406 Standards for Investment Companies - Ethical Standards for Principal
Executive and Financial Officers.


ITEM 3.     AUDIT COMMITTEE FINANCIAL EXPERT

The registrant's Board has determined that each member of the Board's Audit
Committee is an "audit committee financial expert," and that each such member is
"independent," for purposes of this Item.  The Audit Committee consists of the
following Board members:  Thomas G. Bigley, John T. Conroy, Jr., Nicholas P.
Constantakis and Charles F. Mansfield, Jr.


ITEM 4.     PRINCIPAL ACCOUNTANT FEES AND SERVICES

            (a)   Audit Fees billed to the registrant for the two most recent
fiscal years:

                  Fiscal year ended 2007 - $63,600

                  Fiscal year ended 2006 - $60,000

(b)         Audit-Related Fees billed to the registrant for the two most recent
fiscal years:

                  Fiscal year ended 2007 - $0

                  Fiscal year ended 2006 - $0

      Amount requiring approval of the registrant's audit committee pursuant to
      paragraph (c)(7)(ii) of Rule 2-01 of Regulation S-X, $0 and $1,886
      respectively.  Fiscal year ended 2006 - Audit consents issued related to
      N-14 merger review.

(c)          Tax Fees billed to the registrant for the two most recent fiscal
years:

                  Fiscal year ended 2007 - $0

                  Fiscal year ended 2006 - $0

      Amount requiring approval of the registrant's audit committee pursuant to
      paragraph (c)(7)(ii) of Rule 2-01 of Regulation S-X, $0 and $0
      respectively.

(d)         All Other Fees billed to the registrant for the two most recent
fiscal years:

                  Fiscal year ended 2007 - $0

                  Fiscal year ended 2006 - $0

      Amount requiring approval of the registrant's audit committee pursuant to
      paragraph (c)(7)(ii) of Rule 2-01 of Regulation S-X, $8,431 and $0
      respectively.  Fiscal year ended 2007- Discussions related to accounting
      for swaps.

(e)(1)      Audit Committee Policies regarding Pre-approval of Services.

            The Audit Committee is required to pre-approve audit and non-audit
services performed by the independent auditor in order to assure that the
provision of such services do not impair the auditor's independence.  Unless a
type of service to be provided by the independent auditor has received general
pre-approval, it will require specific pre-approval by the Audit Committee.  Any
proposed services exceeding pre-approved cost levels will require specific pre-
approval by the Audit Committee.

            Certain services have the general pre-approval of the Audit
Committee.  The term of the general pre-approval is 12 months from the date of
pre-approval, unless the Audit Committee specifically provides for a different
period.  The Audit Committee will annually review the services that may be
provided by the independent auditor without obtaining specific pre-approval from
the Audit Committee and may grant general pre-approval for such services.  The
Audit Committee will revise the list of general pre-approved services from time
to time, based on subsequent determinations.  The Audit Committee will not
delegate its responsibilities to pre-approve services performed by the
independent auditor to management.

            The Audit Committee has delegated pre-approval authority to its
Chairman.  The Chairman will report any pre-approval decisions to the Audit
Committee at its next scheduled meeting.  The Committee will designate another
member with such pre-approval authority when the Chairman is unavailable.

AUDIT SERVICES

      The annual Audit services engagement terms and fees will be subject to the
specific pre-approval of the Audit Committee.  The Audit Committee must approve
any changes in terms, conditions and fees resulting from changes in audit scope,
registered investment company (RIC) structure or other matters.

      In addition to the annual Audit services engagement specifically approved
by the Audit Committee, the Audit Committee may grant general pre-approval for
other Audit Services, which are those services that only the independent auditor
reasonably can provide.  The Audit Committee has pre-approved certain Audit
services, all other Audit services must be specifically pre-approved by the
Audit Committee.

AUDIT-RELATED SERVICES

      Audit-related services are assurance and related services that are
reasonably related to the performance of the audit or review of the Company's
financial statements or that are traditionally performed by the independent
auditor.  The Audit Committee believes that the provision of Audit-related
services does not impair the independence of the auditor, and has pre-approved
certain Audit-related services, all other Audit-related services must be
specifically pre-approved by the Audit Committee.

TAX SERVICES

      The Audit Committee believes that the independent auditor can provide Tax
services to the Company such as tax compliance, tax planning and tax advice
without impairing the auditor's independence.  However, the Audit Committee will
not permit the retention of the independent auditor in connection with a
transaction initially recommended by the independent auditor, the purpose of
which may be tax avoidance and the tax treatment of which may not be supported
in the Internal Revenue Code and related regulations.  The Audit Committee has
pre-approved certain Tax services, all Tax services involving large and complex
transactions must be specifically pre-approved by the Audit Committee.

ALL OTHER SERVICES

      With respect to the provision of services other than audit, review or
attest services the pre-approval requirement is waived if:

      (1)         The aggregate amount of all such services provided constitutes
                  no more than five percent of the total amount of revenues paid
                  by the registrant, the registrant's adviser (not including any
                  sub-adviser whose role is primarily portfolio management and
                  is subcontracted with or overseen by another investment
                  adviser), and any entity controlling, controlled by, or under
                  common control with the investment adviser that provides
                  ongoing services to the registrant to its accountant during
                  the fiscal year in which the services are provided;
      (2)         Such services were not recognized by the registrant, the
                  registrant's adviser (not including any sub-adviser whose role
                  is primarily portfolio management and is subcontracted with or
                  overseen by another investment adviser), and any entity
                  controlling, controlled by, or under common control with the
                  investment adviser that provides ongoing services to the
                  registrant  at the time of the engagement to be non-audit
                  services; and
      (3)         Such services are promptly brought to the attention of the
                  Audit Committee of the issuer and approved prior to the
                  completion of the audit by the Audit Committee or by one or
                  more members of the Audit Committee who are members of the
                  board of directors to whom authority to grant such approvals
                  has been delegated by the Audit Committee.


      The Audit Committee may grant general pre-approval to those permissible
non-audit services classified as All Other services that it believes are routine
and recurring services, and would not impair the independence of the auditor.

      The SEC's rules and relevant guidance should be consulted to determine the
precise definitions of prohibited non-audit services and the applicability of
exceptions to certain of the prohibitions.

PRE-APPROVAL FEE LEVELS

      Pre-approval fee levels for all services to be provided by the independent
auditor will be established annually by the Audit Committee.  Any proposed
services exceeding these levels will require specific pre-approval by the Audit
Committee.

PROCEDURES

      Requests or applications to provide services that require specific
approval by the Audit Committee will be submitted to the Audit Committee by both
the independent auditor and the Principal Accounting Officer and/or Internal
Auditor, and must include a joint statement as to whether, in their view, the
request or application is consistent with the SEC's rules on auditor
independence.

(e)(2)      Percentage of services identified in items 4(b) through 4(d) that
were approved by the registrants audit committee pursuant to paragraph
(c)(7)(i)(C) of Rule 2-01 of Regulation S-X:

            4(b)

            Fiscal year ended 2007 - 0%

            Fiscal year ended 2006 - 0%

            Percentage of services provided to the registrants investment
            adviser and any entity controlling, controlled by, or under common
            control with the investment adviser that provides ongoing services
            to the registrant that were approved by the registrants audit
            committee pursuant to paragraph (c)(7)(i)(C) of Rule 2-01 of
            Regulation S-X, 0% and 0% respectively.

            4(c)

            Fiscal year ended 2007 - 0%

            Fiscal year ended 2006 - 0%

            Percentage of services provided to the registrants investment
            adviser and any entity controlling, controlled by, or under common
            control with the investment adviser that provides ongoing services
            to the registrant that were approved by the registrants audit
            committee pursuant to paragraph (c)(7)(i)(C) of Rule 2-01 of
            Regulation S-X, 0% and 0% respectively.

            4(d)

            Fiscal year ended 2007 - 0%

            Fiscal year ended 2006 - 0%

            Percentage of services provided to the registrants investment
            adviser and any entity controlling, controlled by, or under common
            control with the investment adviser that provides ongoing services
            to the registrant that were approved by the registrants audit
            committee pursuant to paragraph (c)(7)(i)(C) of Rule 2-01 of
            Regulation S-X, 0% and 0% respectively.

(f)   NA


(g)   Non-Audit Fees billed to the registrant, the registrant's investment
      adviser, and certain entities controlling, controlled by or under common
      control with the investment adviser:
            Fiscal year ended 2007 - $146,930

            Fiscal year ended 2006 - $161,706

(h)         The registrant's Audit Committee has considered that the provision
of non-audit services that were rendered to the registrant's adviser (not
including any sub-adviser whose role is primarily portfolio management and is
subcontracted with or overseen by another investment adviser), and any entity
controlling, controlled by, or under common control with the investment adviser
that provides ongoing services to the registrant that were not pre-approved
pursuant to paragraph (c)(7)(ii) of Rule 2-01 of Regulation S-X is compatible
with maintaining the principal accountant's independence.


ITEM 5.     AUDIT COMMITTEE OF LISTED REGISTRANTS

            Not Applicable

ITEM 6.     SCHEDULE OF INVESTMENTS

            Not Applicable

ITEM 7.     DISCLOSURE OF PROXY VOTING POLICIES AND PROCEDURES FOR CLOSED-END
            MANAGEMENT INVESTMENT COMPANIES

            Not Applicable

ITEM 8.     PORTFOLIO MANAGERS OF CLOSED-END MANAGEMENT INVESTMENT COMPANIES

            Not Applicable

ITEM 9.     PURCHASES OF EQUITY SECURITIES BY CLOSED-END MANAGEMENT INVESTMENT
            COMPANY AND AFFILIATED PURCHASERS

            Not Applicable

ITEM 10.    SUBMISSION OF MATTERS TO A VOTE OF SECURITY HOLDERS

            Not Applicable

ITEM 11.    CONTROLS AND PROCEDURES

(a) The registrant's President and Treasurer have concluded that the
registrant's disclosure controls and procedures (as defined in rule 30a-3(c)
under the Act) are effective in design and operation and are sufficient to form
the basis of the certifications required by Rule 30a-(2) under the Act, based on
their evaluation of these disclosure controls and procedures within 90 days of
the filing date of this report on Form N-CSR.

(b) There were no changes in the registrant's internal control over financial
reporting (as defined in rule 30a-3(d) under the Act) during the last fiscal
quarter that have materially affected, or are reasonably likely to materially
affect, the registrant's internal control over financial reporting.

ITEM 12.    EXHIBITS


SIGNATURES

PURSUANT TO THE REQUIREMENTS OF THE SECURITIES EXCHANGE ACT OF 1934 AND THE
INVESTMENT COMPANY ACT OF 1940, THE REGISTRANT HAS DULY CAUSED THIS REPORT TO BE
SIGNED ON ITS BEHALF BY THE UNDERSIGNED, THEREUNTO DULY AUTHORIZED.

REGISTRANT  FEDERATED INDEX TRUST

BY          /S/ RICHARD A. NOVAK
            RICHARD A. NOVAK, PRINCIPAL FINANCIAL OFFICER

DATE        DECEMBER 21, 2007


PURSUANT TO THE REQUIREMENTS OF THE SECURITIES EXCHANGE ACT OF 1934 AND THE
INVESTMENT COMPANY ACT OF 1940, THIS REPORT HAS BEEN SIGNED BELOW BY THE
FOLLOWING PERSONS ON BEHALF OF THE REGISTRANT AND IN THE CAPACITIES AND ON THE
DATES INDICATED.


BY          /S/ J. CHRISTOPHER DONAHUE
            J. CHRISTOPHER DONAHUE, PRINCIPAL EXECUTIVE OFFICER

DATE        DECEMBER 20, 2007


BY          /S/ RICHARD A. NOVAK
            RICHARD A. NOVAK, PRINCIPAL FINANCIAL OFFICER

DATE        DECEMBER 21, 2007