Cash Management Fund
Institutional Shares
Annual Report
to Shareholders
December 31, 2011
Contents
Cash Management Fund 3 Portfolio Management Review 7 Statement of Assets and Liabilities 8 Statement of Operations 9 Statement of Changes in Net Assets 11 Notes to Financial Statements 15 Report of Independent Registered Public Accounting Firm 16 Information About Your Fund's Expenses Cash Management Portfolio 36 Statement of Assets and Liabilities 37 Statement of Operations 38 Statement of Changes in Net Assets 40 Notes to Financial Statements 44 Report of Independent Registered Public Accounting Firm 45 Investment Management Agreement Approval 50 Summary of Management Fee Evaluation by Independent Fee Consultant 54 Board Members and Officers 59 Account Management Resources |
This report must be preceded or accompanied by a prospectus. To obtain a summary prospectus, if available, or prospectus for any of our funds, refer to the Account Management Resources information provided in the back of this booklet. We advise you to consider the fund's objectives, risks, charges and expenses carefully before investing. The summary prospectus and prospectus contain this and other important information about the fund. Please read the prospectus carefully before you invest.
An investment in this fund is not insured or guaranteed by the Federal Deposit Insurance Corporation (FDIC) or by any other government agency. Although the fund seeks to preserve the value of your investment at $1.00 per share, it is possible to lose money by investing in the fund. The share price of money market funds can fall below the $1.00 share price. You should not rely on or expect the Advisor to enter into support agreements or take other actions to maintain the fund's $1.00 share price. The credit quality of the fund's holdings can change rapidly in certain markets, and the default of a single holding could have an adverse impact on the fund's share price. The fund's share price can also be negatively affected during periods of high redemption pressures and/or illiquid markets. The actions of a few large investors of the fund may have a significant adverse effect on the share price of the fund. See the prospectus for specific details regarding the fund's risk profile.
DWS Investments is part of Deutsche Bank's Asset Management division and, within the U.S., represents the retail asset management activities of Deutsche Bank AG, Deutsche Bank Trust Company Americas, Deutsche Investment Management Americas Inc. and DWS Trust Company.
NOT FDIC/NCUA INSURED NO BANK GUARANTEE MAY LOSE VALUE NOT A DEPOSIT NOT INSURED BY ANY FEDERAL GOVERNMENT AGENCY
Portfolio Management Review
Market Overview
All performance information below is historical and does not guarantee future results. Investment return and principal fluctuate, so your shares may be worth more or less when redeemed. Current performance may differ from performance data shown. Please visit www.dbadvisorsliquidity.com/US for the fund's most recent month-end performance. The 7-day current yield refers to the income paid by the fund over a 7-day period expressed as an annual percentage rate of the fund's shares outstanding. Yields fluctuate and are not guaranteed.
Over the fund's most recent 12-month period ended December 31, 2011, money markets were responding to alternating degrees of perceived risk in the global financial markets, with short-term rates rising or falling slightly in response to the current state of the European sovereign debt crisis. During the summer, the political standoff in the United States related to the raising of the U.S. debt ceiling spurred volatility in financial markets. The extreme difficulties that Congress encountered in coming to agreement regarding the debt ceiling made up a large part of the rationale cited by Standard & Poor's® in deciding to downgrade U.S. debt from AAA to AA+ on August 5, 2011. However, the United States' role as a perceived "safe haven" for fixed-income investors worldwide has thus far remained unchanged. In addition, credit downgrades of various domestic and international banks and "credit watches" instituted by ratings agencies on some European countries exerted pressure on the money markets. Encouragingly, the European Central Bank (ECB) has made some extraordinary efforts over the past several months to head off additional problems for European governments and banks by securing funding access for the major banks in Europe.

Positive Contributors to Fund Performance
We were able to maintain a competitive yield for the fund during the period.
Over the period, we continued to hold a large percentage of portfolio assets in short-maturity instruments for liquidity purposes as well as for high quality and yield. We also maintained a higher than average maturity, with fund assets broadly diversified among a number of different sectors, including banks, corporate issues, U.S. government securities and municipal debt, though diversification neither assures a profit nor guarantees against loss. In addition, we focused on more favorable geographical areas for money market investment, such as Canada, Australia and the Nordic region. Lastly, given market uncertainty and our desire to maintain larger cash positions in the fund, we found value in municipal Variable Rate Demand Notes compared with taxable alternatives of the same maturity, such as bank Certificates of Deposit.
Fund Performance (as of December 31, 2011)
Performance is historical and does not guarantee future results. Current performance may be lower or higher than the performance data quoted.
An investment in this fund is not insured or guaranteed by the FDIC or by any other government agency. Although the fund seeks to preserve the value of your investment at $1.00 per share, it is possible to lose money by investing in the fund. The share price of money market funds can fall below the $1.00 share price.
| 7-Day Current Yield |
| December 31, 2011 | .01%* |
| December 31, 2010 | .02%* |
| * The investment advisor has agreed to waive fees/reimburse expenses. Without such fee waivers/expense reimbursements, the 7-day current yield would have been lower. |
Yields are historical, will fluctuate and do not guarantee future performance. The 7-day current yield refers to the income paid by the portfolio over a 7-day period expressed as an annual percentage rate of the fund's shares outstanding. Please visit our Web site at www.dbadvisorsliquidity.com/US for the product's most recent month-end performance.
Negative Contributors to Fund Performance
The types of securities that we were investing in during the period ended December 31, 2011, tended to have shorter maturities and lower yields than issues carrying more risk. We preferred to be cautious during a time of market fluctuation. In the end this cost the fund some yield, but we believe that this represented a prudent approach to preserving principal.
| "Encouragingly, the European Central Bank (ECB) has made some extraordinary efforts over the past several months to head off additional problems for European governments and banks by securing funding access for the major banks in Europe." |
Outlook and Positioning
Positive news for U.S. markets has come recently in the form of improved economic reports, including a pickup in manufacturing activity and some declines in domestic unemployment. The U.S. Federal Reserve Board (the Fed) has been doing its part by continuing its accommodative monetary policy and hinting at additional transparency for financial market participants in the near term. The main headwind to improved economic and financial market prospects comes from uncertainty over the European sovereign debt crisis. With several European countries facing austerity measures, we tend to believe that Europe is on the precipice of a recession. Market participants are urgently wishing for concrete and permanent solutions to the European crisis in the hopes that such a result would encourage further global economic progress and reduce financial market uncertainty.
We continue our insistence on the highest credit quality within the fund. We also continue to apply a careful approach to investing on behalf of the fund and to seek competitive yield for our shareholders.
Portfolio Management Team
A group of investment professionals is responsible for the day-to-day management of the fund. These investment professionals have a broad range of experience managing money market funds.
The views expressed reflect those of the portfolio management team only through the end of the period of the report as stated on the cover. The management team's views are subject to change at any time based on market and other conditions and should not be construed as a recommendation. Past performance is no guarantee of future results. Current and future portfolio holdings are subject to risk.
Terms to Know
Municipal debt is state and local government bonds issued to finance capital expenditures.
Credit quality measures a bond issuer's ability to repay interest and principal in a timely manner. Rating agencies assign letter designations, such as AAA, AA and so forth. The lower the rating, the higher the probability of default. Credit quality does not remove market risk and is subject to change.
Statement of Assets and Liabilities | as of December 31, 2011 | |
| Assets | |
| Investment in Cash Management Portfolio, at value | | $ | 2,270,908,089 | |
| Receivable for Fund shares sold | | | 408 | |
| Due from Advisor | | | 12,427 | |
| Other assets | | | 17,644 | |
| Total assets | | | 2,270,938,568 | |
| Liabilities | |
| Payable for Fund shares redeemed | | | 1,407,188 | |
| Distributions payable | | | 8,735 | |
| Other accrued expenses and payables | | | 372,406 | |
| Total liabilities | | | 1,788,329 | |
| Net assets, at value | | $ | 2,269,150,239 | |
| Net Assets Consist of | |
| Accumulated net realized gain (loss) | | | (197,391 | ) |
| Paid-in capital | | | 2,269,347,630 | |
| Net assets, at value | | $ | 2,269,150,239 | |
| Net Asset Value | |
Institutional Shares Net Asset Value, offering and redemption price per share ($2,269,150,239 ÷ 2,269,421,063 outstanding shares of beneficial interest, $.01 par value, unlimited number of shares authorized) | | $ | 1.00 | |
The accompanying notes are an integral part of the financial statements.
| for the year ended December 31, 2011 | |
| Investment Income | |
Income and expenses allocated from Cash Management Portfolio: Interest | | $ | 5,311,121 | |
| Expenses* | | | (3,213,064 | ) |
| Net investment income allocated from Cash Management Portfolio | | | 2,098,057 | |
Expenses: Administration fee | | | 2,137,929 | |
| Services to shareholders | | | 171,894 | |
| Service fees | | | 1,193,280 | |
| Professional fees | | | 35,433 | |
| Reports to shareholders | | | 48,837 | |
| Registration fees | | | 31,905 | |
| Trustees' fees and expenses | | | 4,551 | |
| Other | | | 27,720 | |
| Total expenses before expense reductions | | | 3,651,549 | |
| Expense reductions | | | (1,796,469 | ) |
| Total expenses after expense reductions | | | 1,855,080 | |
| Net investment income (loss) | | | 242,977 | |
| Net realized gain (loss) allocated from Cash Management Portfolio | | | 105,324 | |
| Net increase (decrease) in net assets resulting from operations | | $ | 348,301 | |
* Net of $215,611 Advisor reimbursement allocated from Cash Management Portfolio for the year ended December 31, 2011.
The accompanying notes are an integral part of the financial statements.
Statement of Changes in Net Assets | | | Years Ended December 31, | |
| Increase (Decrease) in Net Assets | | 2011 | | | 2010 | |
Operations: Net investment income | | $ | 242,977 | | | $ | 1,157,839 | |
| Net realized gain (loss) | | | 105,324 | | | | 229,420 | |
| Net increase (decrease) in net assets resulting from operations | | | 348,301 | | | | 1,387,259 | |
Distributions to shareholders from: Net investment income | | | (251,515 | ) | | | (1,222,839 | ) |
Fund share transactions: Proceeds from shares sold | | | 14,897,455,866 | | | | 13,959,569,610 | |
| Reinvestment of distributions | | | 207,268 | | | | 1,106,246 | |
| Payments for shares redeemed | | | (15,161,351,369 | ) | | | (13,464,962,553 | ) |
| Net increase (decrease) in net assets from Fund share transactions | | | (263,688,235 | ) | | | 495,713,303 | |
| Increase (decrease) in net assets | | | (263,591,449 | ) | | | 495,877,723 | |
| Net assets at beginning of period | | | 2,532,741,688 | | | | 2,036,863,965 | |
| Net assets at end of period (including undistributed net investment income of $0 and $0, respectively) | | $ | 2,269,150,239 | | | $ | 2,532,741,688 | |
| Other Information | |
| Shares outstanding at beginning of period | | | 2,533,109,298 | | | | 2,037,395,995 | |
| Shares sold | | | 14,897,455,866 | | | | 13,959,569,610 | |
| Shares issued to shareholders in reinvestment of distributions | | | 207,268 | | | | 1,106,246 | |
| Shares redeemed | | | (15,161,351,369 | ) | | | (13,464,962,553 | ) |
| Net increase (decrease) in Fund shares | | | (263,688,235 | ) | | | 495,713,303 | |
| Shares outstanding at end of period | | | 2,269,421,063 | | | | 2,533,109,298 | |
The accompanying notes are an integral part of the financial statements.
| Institutional Shares | |
| | | Years Ended December 31, | |
| | 2011 | | | 2010 | | | 2009 | | | 2008 | | | 2007 | |
| Selected Per Share Datac | |
| Net asset value, beginning of period | | $ | 1.00 | | | $ | 1.00 | | | $ | 1.00 | | | $ | 1.00 | | | $ | 1.00 | |
Income from investment operations: Net investment income | | | .000 | a | | | .001 | | | | .004 | | | | .027 | | | | .051 | |
Net realized gain (loss)a | | | .000 | | | | .000 | | | | .000 | | | | .000 | | | | .000 | |
| Total from investment operations | | | .000 | a | | | .001 | | | | .004 | | | | .027 | | | | .051 | |
Less distributions from: Net investment income | | | (.000 | )a | | | (.001 | ) | | | (.004 | ) | | | (.027 | ) | | | (.051 | ) |
| Net asset value, end of period | | $ | 1.00 | | | $ | 1.00 | | | $ | 1.00 | | | $ | 1.00 | | | $ | 1.00 | |
Total Return (%)b | | | .01 | | | | .05 | | | | .37 | | | | 2.70 | | | | 5.22 | |
| Ratios to Average Net Assets and Supplemental Data | |
| Net assets, end of period ($ millions) | | | 2,269 | | | | 2,533 | | | | 2,037 | | | | 2,668 | | | | 2,594 | |
| Ratio of expenses before expense reductions, including expenses allocated from Cash Management Portfolio (%) | | | .33 | | | | .34 | | | | .38 | | | | .34 | | | | .35 | |
| Ratio of expenses after expense reductions, including expenses allocated from Cash Management Portfolio (%) | | | .24 | | | | .28 | | | | .26 | | | | .24 | | | | .23 | |
| Ratio of net investment income (%) | | | .01 | | | | .05 | | | | .34 | | | | 2.68 | | | | 5.10 | |
a Amount is less than $.0005. b Total return would have been lower had certain expenses not been reduced. | |
Notes to Financial Statements
A. Organization and Significant Accounting Policies
Cash Management Fund (the "Fund'') is a series of DWS Money Market Trust (the "Trust''), which is registered under the Investment Company Act of 1940, as amended (the "1940 Act''), as an open-end management investment company organized as a Massachusetts business trust. The Fund offers one class of shares, Institutional Shares, to investors. The Fund is the successor to Cash Management Fund, a series of DWS Institutional Funds (the "Predecessor Fund"). On April 29, 2011, the Predecessor Fund transferred all of its assets and liabilities to the Trust, while retaining the same fund name. The transaction had no material effect on an investment in the Fund. All financial and other information contained herein for periods prior to April 29, 2011, is that of the Predecessor Fund.
The Fund, a feeder fund, seeks to achieve its investment objective by investing all of its investable assets in a master portfolio, the Cash Management Portfolio (the "Portfolio''), an open-end management investment company registered under the 1940 Act and organized as a New York business trust advised by Deutsche Investment Management Americas Inc. ("DIMA'' or the "Advisor''), an indirect, wholly owned subsidiary of Deutsche Bank AG. A master/feeder fund structure is one in which a fund (a "feeder fund"), instead of investing directly in a portfolio of securities, invests most or all of its investment assets in a separate registered investment company (the "master fund") with substantially the same investment objective and policies as the feeder fund. Such a structure permits the pooling of assets of two or more feeder funds, preserving separate identities or distribution channels at the feeder fund level. At December 31, 2011, the Fund owned approximately 11% of the Portfolio.
The Fund's financial statements are prepared in accordance with accounting principles generally accepted in the United States of America which require the use of management estimates. Actual results could differ from those estimates. The policies described below are followed consistently by the Fund in the preparation of its financial statements. The financial statements of the Portfolio, including the Investment Portfolio, are contained elsewhere in this report and should be read in conjunction with the Fund's financial statements.
Security Valuation. The Fund records its investment in the Portfolio at value, which reflects its proportionate interest in the net assets of the Portfolio. Valuation of the securities held by the Portfolio is discussed in the notes to the Portfolio's financial statements included elsewhere in this report.
Disclosure about the classification of fair value measurements is included in a table following the Portfolio's Investment Portfolio.
Federal Income Taxes. The Fund's policy is to comply with the requirements of the Internal Revenue Code, as amended, which are applicable to regulated investment companies, and to distribute all of its taxable income to its shareholders.
Under the Regulated Investment Company Modernization Act of 2010, net capital losses may be carried forward indefinitely, and their character is retained as short-term and/or long-term. Previously, net capital losses were carried forward for eight years and treated as short-term losses. As a transition rule, the Act requires that post-enactment net capital losses be used before pre-enactment net capital losses.
At December 31, 2011, the Fund had a net tax basis capital loss carryforward of approximately $197,000 of pre-enactment losses, which may be applied against any realized net taxable capital gains of each succeeding year until fully utilized or until December 31, 2016, the expiration date, whichever occurs first.
The Fund has reviewed the tax positions for the open tax years as of December 31, 2011 and has determined that no provision for income tax is required in the Fund's financial statements. The Fund's federal tax returns for the prior three fiscal years remain open subject to examination by the Internal Revenue Service.
Distribution of Income and Gains. Net investment income of the Fund is declared as a daily dividend and is distributed to shareholders monthly. The Fund may take into account capital gains and losses in its daily dividend declarations. The Fund may also make additional distributions for tax purposes if necessary.
Permanent book and tax differences relating to shareholder distributions will result in reclassifications to paid in capital. Temporary book and tax differences will reverse in a subsequent period. There were no significant book to tax differences for the Fund.
At December 31, 2011, the Fund's components of distributable earnings (accumulated losses) on a tax basis were as follows:
| Capital loss carryforward | | $ | (197,000 | ) |
In addition, the tax character of distributions paid to shareholders by the Fund is summarized as follows:
| | | Years Ended December 31, | |
| | | 2011 | | | 2010 | |
| Distributions from ordinary income | | $ | 251,515 | | | $ | 1,222,839 | |
Contingencies. In the normal course of business, the Fund may enter into contracts with service providers that contain general indemnification clauses. The Fund's maximum exposure under these arrangements is unknown as this would involve future claims that may be made against the Fund that have not yet been made. However, based on experience, the Fund expects the risk of loss to be remote.
Other. The Fund receives an allocation of the Portfolio's net investment income and net realized gains and losses in proportion to its investment in the Portfolio. Expenses directly attributed to a fund are charged to that fund, while expenses which are attributable to the Trust are allocated among the funds in the Trust on the basis of relative net assets.
B. Fees and Transactions with Affiliates
Management Agreement. Under the Investment Management Agreement with Deutsche Investment Management Americas Inc. ("DIMA" or the "Advisor"), an indirect, wholly owned subsidiary of Deutsche Bank AG, the Advisor serves as the investment manager to the Fund. The Advisor receives a management fee from the Portfolio pursuant to the master/feeder structure listed above in Note A.
Administration Fee. Pursuant to an Administrative Services Agreement, DIMA provides most administrative services to the Fund. For all services provided under the Administrative Services Agreement, the Fund pays the Advisor an annual fee ("Administration Fee") of 0.10% of the Fund's average daily net assets, computed and accrued daily and payable monthly.
For the period from January 1, 2011 through September 30, 2012, DIMA has contractually agreed to waive its fees and/or reimburse certain operating expenses of the Fund, including expenses of the Portfolio allocated to the Fund, to the extent necessary to maintain the operating expenses (excluding certain expenses such as extraordinary expenses, taxes, brokerage and interest) at 0.30% of the Fund's average daily net assets.
Accordingly, for the year ended December 31, 2011, the Administration Fee was $2,137,929, of which $443,808 was waived and $144,380 is unpaid.
In addition, the Advisor has agreed to voluntarily waive additional expenses. The waiver may be changed or terminated at any time without notice. Under this arrangement, the Advisor waived certain expenses of the Fund.
Service Provider Fees. DWS Investments Service Company ("DISC"), an affiliate of the Advisor, is the transfer agent, dividend-paying agent and shareholder service agent for the Fund. Pursuant to a sub-transfer agency agreement between DISC and DST Systems, Inc. ("DST"), DISC has delegated certain transfer agent, dividend-paying agent and shareholder service agent functions to DST. DISC compensates DST out of the shareholder servicing fee it receives from the Fund. For the year ended December 31, 2011, the amount charged to the Fund by DISC aggregated $73,024, all of which was waived.
In addition, for the year ended December 31, 2011, the Advisor reimbursed the fund $86,357 of sub-recordkeeping expense.
Shareholder Servicing Fee. DWS Investments Distributors, Inc. ("DIDI"), an affiliate of the Advisor, provides information and administrative services for a fee ("Service Fee") to shareholders at an annual rate of up to 0.25% of average daily net assets. DIDI in turn has various agreements with financial services firms that provide these services and pays these fees based upon the assets of shareholder accounts the firm services. For the year ended December 31, 2011, the Service Fee was as follows:
| | | Total Aggregated | | | Waived | | | Annual Effective Rate | |
| Cash Management Fund | | $ | 1,193,280 | | | $ | 1,193,280 | | | | .00 | % |
Typesetting and Filing Service Fees. Under an agreement with DIMA, DIMA is compensated for providing typesetting and certain regulatory filing services to the Fund. For the year ended December 31, 2011, the amount charged to the Fund by DIMA included in the Statement of Operations under "reports to shareholders" aggregated $21,332, of which $8,777 is unpaid.
Trustees' Fees and Expenses. The Fund paid each Trustee not affiliated with the Advisor retainer fees plus specified amounts for various committee services and for the Board Chairperson.
C. Concentration of Ownership
From time to time, the Fund may have a concentration of several shareholder accounts holding a significant percentage of shares outstanding. Investment activities of these shareholders could have a material impact on the Fund.
At December 31, 2011, there was one shareholder account that held approximately 23% of the outstanding shares of the Fund.
Report of Independent Registered Public Accounting Firm
To the Trustees of DWS Money Market Trust and Shareholders of Cash Management Fund:
In our opinion, the accompanying statement of assets and liabilities and the related statements of operations and of changes in net assets and the financial highlights present fairly, in all material respects, the financial position of Cash Management Fund (hereafter referred to as the "Fund'') at December 31, 2011, and the results of its operations, the changes in its net assets and the financial highlights for each of the periods indicated therein, in conformity with accounting principles generally accepted in the United States of America. These financial statements and financial highlights (hereafter referred to as "financial statements'') are the responsibility of the Fund's management. Our responsibility is to express an opinion on these financial statements based on our audits. We conducted our audits of these financial statements in accordance with the standards of the Public Company Accounting Oversight Board (United States). Those standards require that we plan and perform the audits to obtain reasonable assurance about whether the financial statements are free of material misstatement. An audit includes examining, on a test basis, evidence supporting the amounts and disclosures in the financial statements, assessing the accounting principles used and significant estimates made by management, and evaluating the overall financial statement presentation. We believe that our audits provide a reasonable basis for our opinion.
Boston, Massachusetts February 24, 2012 | PricewaterhouseCoopers LLP |
Information About Your Fund's Expenses
As an investor of the Fund, you incur two types of costs: ongoing expenses and transaction costs. Ongoing expenses include management fees and other Fund expenses. Examples of transaction costs include account maintenance fees, which are not shown in this section. The following tables are intended to help you understand your ongoing expenses (in dollars) of investing in the Fund and to help you compare these expenses with the ongoing expenses of investing in other mutual funds. In the most recent six-month period, the Fund limited these expenses; had it not done so, expenses would have been higher. The example in the table is based on an investment of $1,000 invested at the beginning of the six-month period and held for the entire period (July 1, 2011 to December 31, 2011).
The tables illustrate your Fund's expenses in two ways:
·Actual Fund Return. This helps you estimate the actual dollar amount of ongoing expenses (but not transaction costs) paid on a $1,000 investment in the Fund using the Fund's actual return during the period. To estimate the expenses you paid over the period, simply divide your account value by $1,000 (for example, an $8,600 account value divided by $1,000 = 8.6), then multiply the result by the number in the "Expenses Paid per $1,000" line under the share class you hold.
·Hypothetical 5% Fund Return. This helps you to compare your Fund's ongoing expenses (but not transaction costs) with those of other mutual funds using the Fund's actual expense ratio and a hypothetical rate of return of 5% per year before expenses. Examples using a 5% hypothetical fund return may be found in the shareholder reports of other mutual funds. The hypothetical account values and expenses may not be used to estimate the actual ending account balance or expenses you paid for the period.
Please note that the expenses shown in these tables are meant to highlight your ongoing expenses only and do not reflect any transaction costs. The "Expenses Paid per $1,000" line of the tables is useful in comparing ongoing expenses only and will not help you determine the relative total expense of owning different funds. If these transaction costs had been included, your costs would have been higher.
Expenses and Value of a $1,000 Investment for the six months ended December 31, 2011 | |
| Actual Fund Return* | | Institutional Shares | |
| Beginning Account Value 7/1/11 | | $ | 1,000.00 | |
| Ending Account Value 12/31/11 | | $ | 1,000.05 | |
| Expenses Paid per $1,000** | | $ | 1.06 | |
| Hypothetical 5% Fund Return* | | Institutional Shares | |
| Beginning Account Value 7/1/11 | | $ | 1,000.00 | |
| Ending Account Value 12/31/11 | | $ | 1,024.15 | |
| Expenses Paid per $1,000** | | $ | 1.07 | |
* Expenses include amounts allocated proportionally from the master portfolio.
** Expenses are equal to the Fund's annualized expense ratio, multiplied by the average account value over the period, multiplied by the number of days in the most recent six-month period, then divided by 365.
| Annualized Expense Ratio | | Institutional Shares | |
| Cash Management Fund | | | .21 | % |
For more information, please refer to the Fund's prospectus.
Tax Information (Unaudited)
A total of 4.12% of the dividends distributed during the fiscal year was derived from interest on U.S. government securities, which is generally exempt from state income tax.
Please contact a tax advisor if you have questions about federal or state income tax laws, or on how to prepare your tax returns. If you have specific questions about your account, please call (800) 621-1048
(The following financial statements of the Cash Management Portfolio should be read in conjunction with the Fund's financial statements.)
Investment Portfolio as of December 31, 2011 | | | Principal Amount ($) | | | Value ($) | |
| | | | |
| Certificates of Deposit and Bank Notes 7.5% | |
| ANZ National International Ltd., 144A, 3.25%, 4/2/2012 | | | 49,000,000 | | | | 49,336,289 | |
| Banco del Estado de Chile, 0.5%, 1/17/2012 | | | 20,000,000 | | | | 20,000,000 | |
| Bank Nederlandse Gemeenten, 6.0%, 3/26/2012 | | | 35,000,000 | | | | 35,455,384 | |
| Bank of Nova Scotia, 0.28%, 1/4/2012 | | | 100,000,000 | | | | 100,000,000 | |
| China Construction Bank Corp., 0.3%, 1/3/2012 | | | 37,451,000 | | | | 37,451,000 | |
| Commonwealth Bank of Australia, 144A, 2.4%, 1/12/2012 | | | 43,132,000 | | | | 43,157,466 | |
| Credit Suisse, 0.38%, 1/3/2012 | | | 97,000,000 | | | | 97,000,000 | |
| DnB Bank ASA, 0.35%, 1/17/2012 | | | 79,500,000 | | | | 79,500,000 | |
| General Electric Capital Corp., 6.0%, 6/15/2012 | | | 12,500,000 | | | | 12,810,030 | |
| Industrial & Commercial Bank of China: | |
| 0.7%, 1/3/2012 | | | 100,000,000 | | | | 100,000,000 | |
| 0.7%, 1/4/2012 | | | 99,500,000 | | | | 99,500,000 | |
| 0.7%, 1/6/2012 | | | 39,600,000 | | | | 39,600,000 | |
| Mizuho Corporate Bank Ltd., 0.42%, 2/6/2012 | | | 50,000,000 | | | | 50,003,492 | |
| Nederlandse Waterschapsbank NV, 1.375%, 2/17/2012 | | | 44,700,000 | | | | 44,756,807 | |
| Nordea Bank Finland PLC: | |
| 0.35%, 1/13/2012 | | | 69,500,000 | | | | 69,500,000 | |
| 0.4%, 2/15/2012 | | | 45,000,000 | | | | 45,000,561 | |
| Rabobank Nederland NV: | |
| 0.4%, 2/15/2012 | | | 133,500,000 | | | | 133,500,000 | |
| 0.43%, 2/24/2012 | | | 45,000,000 | | | | 45,000,000 | |
| 0.43%, 3/2/2012 | | | 160,000,000 | | | | 160,000,000 | |
| Skandinaviska Enskilda Banken AB: | |
| 0.35%, 1/11/2012 | | | 49,700,000 | | | | 49,700,000 | |
| 0.36%, 1/6/2012 | | | 46,500,000 | | | | 46,500,000 | |
| 0.45%, 2/13/2012 | | | 138,500,000 | | | | 138,500,000 | |
| Sumitomo Mitsui Banking Corp., 0.35%, 1/13/2012 | | | 50,000,000 | | | | 50,000,332 | |
| Svenska Handelsbanken AB, 0.385%, 1/23/2012 | | | 15,000,000 | | | | 15,000,091 | |
Total Certificates of Deposit and Bank Notes (Cost $1,561,271,452) | | | | 1,561,271,452 | |
| | |
| Commercial Paper 26.3% | |
| Issued at Discount** 24.7% | |
| ASB Finance Ltd., 0.585%, 4/27/2012 | | | 981,000 | | | | 979,135 | |
| Australia & New Zealand Banking Group Ltd., 0.25%, 2/7/2012 | | | 200,000 | | | | 199,949 | |
| Bank of Nova Scotia, 0.1%, 1/17/2012 | | | 600,000 | | | | 599,973 | |
| Barclays Bank PLC: | |
| 0.2%, 1/3/2012 | | | 1,000,000 | | | | 999,989 | |
| 0.33%, 1/20/2012 | | | 145,000,000 | | | | 144,974,746 | |
| 0.36%, 1/6/2012 | | | 30,000,000 | | | | 29,998,500 | |
| 0.38%, 1/4/2012 | | | 153,000,000 | | | | 152,995,155 | |
| 0.46%, 2/1/2012 | | | 77,000,000 | | | | 76,969,499 | |
| 0.52%, 2/27/2012 | | | 33,500,000 | | | | 33,472,418 | |
| BNZ International Funding Ltd: | |
| 144A, 0.57%, 4/10/2012 | | | 60,000,000 | | | | 59,905,000 | |
| 144A, 0.58%, 4/10/2012 | | | 50,000,000 | | | | 49,919,444 | |
| Coca-Cola Co.: | |
| 0.18%, 6/1/2012 | | | 29,888,000 | | | | 29,865,285 | |
| 0.2%, 4/10/2012 | | | 30,350,000 | | | | 30,333,139 | |
| Erste Abwicklungsanstalt: | |
| 0.35%, 1/30/2012 | | | 20,000,000 | | | | 19,994,361 | |
| 0.36%, 1/30/2012 | | | 50,000,000 | | | | 49,985,500 | |
| 0.37%, 1/9/2012 | | | 50,000,000 | | | | 49,995,889 | |
| 0.37%, 1/17/2012 | | | 50,000,000 | | | | 49,991,778 | |
| 0.39%, 2/16/2012 | | | 50,000,000 | | | | 49,975,083 | |
| 0.4%, 3/14/2012 | | | 35,000,000 | | | | 34,971,611 | |
| 0.42%, 1/3/2012 | | | 55,500,000 | | | | 55,498,705 | |
| Erste Finance Delaware LLC, 0.16%, 1/3/2012 | | | 154,540,000 | | | | 154,538,626 | |
| General Electric Capital Corp., 0.25%, 2/2/2012 | | | 150,000,000 | | | | 149,966,667 | |
| General Electric Capital Services, Inc.: | |
| 0.23%, 2/6/2012 | | | 42,000,000 | | | | 41,990,340 | |
| 0.26%, 2/2/2012 | | | 50,000,000 | | | | 49,988,444 | |
| 0.3%, 2/13/2012 | | | 75,000,000 | | | | 74,973,125 | |
| Johnson & Johnson: | |
| 144A, 0.02%, 1/13/2012 | | | 25,000,000 | | | | 24,999,833 | |
| 144A, 0.04%, 2/27/2012 | | | 75,000,000 | | | | 74,995,250 | |
| 144A, 0.05%, 4/3/2012 | | | 10,000,000 | | | | 9,998,708 | |
| 144A, 0.06%, 2/17/2012 | | | 100,000,000 | | | | 99,992,167 | |
| 144A, 0.07%, 4/2/2012 | | | 280,000,000 | | | | 279,947,867 | |
| 144A, 0.08%, 4/2/2012 | | | 70,000,000 | | | | 69,985,689 | |
| 144A, 0.08%, 4/3/2012 | | | 40,000,000 | | | | 39,991,733 | |
| 144A, 0.15%, 3/7/2012 | | | 33,175,000 | | | | 33,165,877 | |
| Kells Funding LLC: | |
| 144A, 0.29%, 1/12/2012 | | | 125,000,000 | | | | 124,988,924 | |
| 144A, 0.3%, 1/26/2012 | | | 25,000,000 | | | | 24,994,792 | |
| 144A, 0.35%, 2/17/2012 | | | 43,100,000 | | | | 43,080,306 | |
| 144A, 0.37%, 3/19/2012 | | | 25,700,000 | | | | 25,679,397 | |
| 144A, 0.37%, 4/10/2012 | | | 80,000,000 | | | | 79,917,778 | |
| 144A, 0.38%, 4/17/2012 | | | 25,000,000 | | | | 24,971,764 | |
| 144A, 0.45%, 1/20/2012 | | | 75,687,000 | | | | 75,669,024 | |
| 144A, 0.48%, 1/19/2012 | | | 57,014,000 | | | | 57,000,317 | |
| 144A, 0.52%, 2/1/2012 | | | 72,500,000 | | | | 72,467,536 | |
| 144A, 0.52%, 2/16/2012 | | | 37,000,000 | | | | 36,975,416 | |
| Merck & Co., Inc.: | |
| 0.06%, 1/9/2012 | | | 7,750,000 | | | | 7,749,897 | |
| 0.06%, 1/11/2012 | | | 86,000,000 | | | | 85,998,567 | |
| New York Life Capital Corp.: | |
| 144A, 0.12%, 2/3/2012 | | | 3,725,000 | | | | 3,724,590 | |
| 144A, 0.13%, 2/1/2012 | | | 37,900,000 | | | | 37,895,757 | |
| 144A, 0.15%, 3/2/2012 | | | 20,000,000 | | | | 19,994,917 | |
| 144A, 0.16%, 2/14/2012 | | | 25,000,000 | | | | 24,995,111 | |
| 144A, 0.16%, 3/8/2012 | | | 40,000,000 | | | | 39,988,089 | |
| 144A, 0.16%, 3/19/2012 | | | 38,000,000 | | | | 37,986,827 | |
| Nieuw Amsterdam Receivables Corp.: | |
| 144A, 0.32%, 1/4/2012 | | | 100,000,000 | | | | 99,997,333 | |
| 144A, 0.33%, 1/3/2012 | | | 653,000 | | | | 652,988 | |
| NRW.Bank: | |
| 0.24%, 1/17/2012 | | | 30,062,000 | | | | 30,058,793 | |
| 0.4%, 1/6/2012 | | | 61,000,000 | | | | 60,996,611 | |
| Oversea-Chinese Banking Corp., Ltd., 0.29%, 1/17/2012 | | | 45,000,000 | | | | 44,994,200 | |
| PepsiCo, Inc., 0.04%, 1/18/2012 | | | 95,000,000 | | | | 94,998,206 | |
| Pfizer, Inc.: | |
| 0.03%, 1/5/2012 | | | 58,000,000 | | | | 57,999,807 | |
| 0.04%, 1/12/2012 | | | 40,000,000 | | | | 39,999,511 | |
| Proctor & Gamble Co.: | |
| 0.08%, 1/3/2012 | | | 100,000,000 | | | | 99,999,556 | |
| 0.08%, 1/31/2012 | | | 40,000,000 | | | | 39,997,333 | |
| 0.08%, 2/24/2012 | | | 34,000,000 | | | | 33,995,920 | |
| 0.08%, 3/23/2012 | | | 60,000,000 | | | | 59,989,067 | |
| 0.09%, 1/25/2012 | | | 40,000,000 | | | | 39,997,600 | |
| 0.09%, 2/14/2012 | | | 75,000,000 | | | | 74,991,750 | |
| 0.09%, 3/30/2012 | | | 25,000,000 | | | | 24,994,437 | |
| 0.1%, 4/9/2012 | | | 25,000,000 | | | | 24,993,125 | |
| 0.11%, 5/4/2012 | | | 30,000,000 | | | | 29,988,633 | |
| 0.11%, 5/21/2012 | | | 23,000,000 | | | | 22,990,091 | |
| 0.12%, 4/2/2012 | | | 67,800,000 | | | | 67,779,208 | |
| 0.12%, 5/4/2012 | | | 128,000,000 | | | | 127,947,093 | |
| 0.13%, 4/12/2012 | | | 75,000,000 | | | | 74,972,375 | |
| 0.13%, 4/30/2012 | | | 80,000,000 | | | | 79,965,333 | |
| 0.15%, 3/30/2012 | | | 25,000,000 | | | | 24,990,729 | |
| Rabobank U.S.A. Financial Corp., 0.4%, 2/8/2012 | | | 19,250,000 | | | | 19,241,872 | |
| SBAB Bank AB: | |
| 144A, 0.5%, 1/4/2012 | | | 50,000,000 | | | | 49,997,917 | |
| 144A, 0.55%, 1/13/2012 | | | 15,000,000 | | | | 14,997,250 | |
| 144A, 0.55%, 1/30/2012 | | | 26,000,000 | | | | 25,988,481 | |
| Sheffield Receivables Corp.: | |
| 144A, 0.3%, 1/27/2012 | | | 24,000,000 | | | | 23,994,800 | |
| 144A, 0.4%, 2/7/2012 | | | 61,000,000 | | | | 60,974,922 | |
| Standard Chartered Bank: | |
| 0.37%, 1/5/2012 | | | 100,000,000 | | | | 99,995,889 | |
| 0.38%, 2/7/2012 | | | 135,750,000 | | | | 135,696,982 | |
| Straight-A Funding LLC: | |
| 144A, 0.12%, 1/11/2012 | | | 30,105,000 | | | | 30,103,996 | |
| 144A, 0.19%, 1/31/2012 | | | 60,061,000 | | | | 60,051,490 | |
| 144A, 0.19%, 2/13/2012 | | | 27,999,000 | | | | 27,992,646 | |
| Sumitomo Mitsui Banking Corp., 0.355%, 1/6/2012 | | | 77,050,000 | | | | 77,046,201 | |
| Swedbank AB, 0.44%, 1/13/2012 | | | 35,000,000 | | | | 34,994,867 | |
| Toyota Motor Credit Corp., 0.27%, 1/6/2012 | | | 107,000,000 | | | | 106,995,987 | |
| Unilever Capital Corp., 0.08%, 3/6/2012 | | | 30,000,000 | | | | 29,995,667 | |
| Victory Receivables Corp.: | |
| 144A, 0.35%, 1/19/2012 | | | 50,000,000 | | | | 49,991,250 | |
| 144A, 0.36%, 1/9/2012 | | | 75,106,000 | | | | 75,099,992 | |
| Walt Disney Co., 0.09%, 2/23/2012 | | | 95,000,000 | | | | 94,987,412 | |
| | | | | 5,125,675,814 | |
| Issued at Par 1.6% | |
| DnB Bank ASA, 144A, 0.43%*, 4/2/2012 | | | 50,000,000 | | | | 50,000,000 | |
| Westpac Banking Corp., 144A, 0.426%*, 4/11/2012 | | | 282,900,000 | | | | 282,893,007 | |
| | | | | 332,893,007 | |
Total Commercial Paper (Cost $5,458,568,821) | | | | 5,458,568,821 | |
| | |
| Government & Agency Obligations 15.0% | |
| U.S. Government Sponsored Agencies 1.9% | |
| Federal Home Loan Bank: | |
| 0.13%, 1/23/2012 | | | 11,000,000 | | | | 10,999,782 | |
| 0.13%, 2/24/2012 | | | 28,225,000 | | | | 28,224,444 | |
| 0.13%, 5/15/2012 | | | 26,500,000 | | | | 26,494,841 | |
| 0.16%, 4/30/2012 | | | 103,320,000 | | | | 103,309,653 | |
| 0.16%**, 11/13/2012 | | | 24,000,000 | | | | 23,966,187 | |
| 0.23%, 8/24/2012 | | | 15,670,000 | | | | 15,674,189 | |
| 0.27%, 7/6/2012 | | | 20,600,000 | | | | 20,600,105 | |
| Federal Home Loan Mortgage Corp.: | |
| 0.099%**, 2/23/2012 | | | 50,000,000 | | | | 49,992,639 | |
| 0.111%**, 1/11/2012 | | | 25,000,000 | | | | 24,999,167 | |
| Federal National Mortgage Association: | |
| 0.132%**, 1/3/2012 | | | 20,000,000 | | | | 19,999,789 | |
| 0.137%**, 2/17/2012 | | | 11,500,000 | | | | 11,497,898 | |
| 0.148%**, 3/1/2012 | | | 20,000,000 | | | | 19,995,000 | |
| 0.159%**, 10/1/2012 | | | 10,000,000 | | | | 9,987,822 | |
| 0.189%**, 10/1/2012 | | | 17,500,000 | | | | 17,474,693 | |
| | | | | 383,216,209 | |
| U.S. Treasury Obligations 13.1% | |
| U.S. Treasury Bills: | |
| 0.005%**, 1/26/2012 | | | 503,000 | | | | 502,998 | |
| 0.035%**, 5/17/2012 | | | 2,500,000 | | | | 2,499,667 | |
| 0.051%**, 4/19/2012 | | | 921,000 | | | | 920,858 | |
| U.S. Treasury Notes: | |
| 0.375%, 8/31/2012 | | | 212,478,000 | | | | 212,794,495 | |
| 0.375%, 9/30/2012 | | | 18,000,000 | | | | 18,034,370 | |
| 0.375%, 10/31/2012 | | | 360,000,000 | | | | 360,730,389 | |
| 0.625%, 6/30/2012 | | | 84,924,000 | | | | 85,135,391 | |
| 0.625%, 7/31/2012 | | | 433,130,000 | | | | 434,394,582 | |
| 0.75%, 5/31/2012 | | | 212,478,000 | | | | 213,053,545 | |
| 1.375%, 10/15/2012 | | | 212,000,000 | | | | 214,035,648 | |
| 1.5%, 7/15/2012 | | | 480,000,000 | | | | 483,642,949 | |
| 1.875%, 6/15/2012 | | | 250,000,000 | | | | 252,038,171 | |
| 4.75%, 5/31/2012 | | | 98,500,000 | | | | 100,373,472 | |
| 4.875%, 6/30/2012 | | | 342,512,000 | | | | 350,642,757 | |
| | | | | 2,728,799,292 | |
Total Government & Agency Obligations (Cost $3,112,015,501) | | | | 3,112,015,501 | |
| | |
| Short-Term Notes* 14.1% | |
| Australia & New Zealand Banking Group Ltd., 144A, 0.31%, 1/20/2012 | | | 72,000,000 | | | | 72,000,000 | |
| Bank of Nova Scotia: | |
| 0.35%, 4/2/2012 | | | 32,500,000 | | | | 32,500,000 | |
| 0.38%, 3/13/2012 | | | 134,500,000 | | | | 134,500,000 | |
| 0.39%, 6/11/2012 | | | 107,000,000 | | | | 107,000,000 | |
| Bayerische Landesbank, 0.353%, 11/23/2012 | | | 40,000,000 | | | | 40,000,000 | |
| Caisse d'Amortissement de la Dette Sociale, 144A, 0.432%, 5/25/2012 | | | 315,000,000 | | | | 314,986,168 | |
| Canadian Imperial Bank of Commerce, 0.373%, 4/26/2012 | | | 200,000,000 | | | | 200,000,000 | |
| Coca-Cola Co., 0.507%, 5/15/2012 | | | 48,000,000 | | | | 48,027,583 | |
| Commonwealth Bank of Australia: | |
| 144A, 0.376%, 2/3/2012 | | | 135,000,000 | | | | 135,000,000 | |
| 144A, 0.455%, 4/30/2012 | | | 40,000,000 | | | | 40,000,000 | |
| JPMorgan Chase Bank NA, 0.57%, 1/8/2013 | | | 250,000,000 | | | | 250,000,000 | |
| Kells Funding LLC: | |
| 144A, 0.361%, 5/4/2012 | | | 125,000,000 | | | | 125,000,000 | |
| 144A, 0.37%, 2/27/2012 | | | 56,000,000 | | | | 56,000,000 | |
| 144A, 0.377%, 1/9/2012 | | | 64,000,000 | | | | 63,999,885 | |
| 144A, 0.384%, 1/19/2012 | | | 27,000,000 | | | | 27,000,000 | |
| 144A, 0.423%, 2/24/2012 | | | 147,500,000 | | | | 147,500,000 | |
| 144A, 0.468%, 4/16/2012 | | | 150,000,000 | | | | 150,000,000 | |
| Nordea Bank Finland PLC: | |
| 0.681%, 2/3/2012 | | | 35,000,000 | | | | 35,006,457 | |
| 0.737%, 9/13/2012 | | | 20,000,000 | | | | 20,034,002 | |
| 0.941%, 9/13/2012 | | | 50,000,000 | | | | 50,085,207 | |
| Rabobank Nederland NV: | |
| 0.356%, 1/10/2012 | | | 108,250,000 | | | | 108,250,000 | |
| 0.388%, 4/24/2012 | | | 133,000,000 | | | | 133,000,000 | |
| 0.46%, 5/16/2012 | | | 50,000,000 | | | | 50,000,000 | |
| 144A, 0.6%, 12/14/2012 | | | 75,000,000 | | | | 75,000,000 | |
| 144A, 0.668%, 2/29/2012 | | | 50,000,000 | | | | 50,007,960 | |
| Svenska Handelsbanken AB, 144A, 0.577%, 8/7/2012 | | | 80,000,000 | | | | 80,000,000 | |
| Toronto-Dominion Bank, 0.296%, 5/11/2012 | | | 130,500,000 | | | | 130,500,000 | |
| Westpac Banking Corp.: | |
| 0.34%, 1/10/2012 | | | 85,000,000 | | | | 85,000,000 | |
| 0.366%, 5/9/2012 | | | 60,000,000 | | | | 60,000,000 | |
| 0.452%, 2/13/2012 | | | 49,000,000 | | | | 49,000,000 | |
| 144A, 0.965%, 10/23/2012 | | | 61,110,000 | | | | 61,280,869 | |
Total Short-Term Notes (Cost $2,930,678,131) | | | | 2,930,678,131 | |
| | |
| Time Deposits 11.3% | |
| Citibank NA, 0.1%, 1/4/2012 | | | 350,000,000 | | | | 350,000,000 | |
| Nordea Bank Finland PLC, 0.02%, 1/3/2012 | | | 400,000,000 | | | | 400,000,000 | |
| State Street Bank & Trust Co., 0.01%, 1/3/2012 | | | 800,000,000 | | | | 800,000,000 | |
| Svenska Handelsbanken AB, 0.01%, 1/3/2012 | | | 800,000,000 | | | | 800,000,000 | |
Total Time Deposits (Cost $2,350,000,000) | | | | 2,350,000,000 | |
| | |
| Municipal Investments 21.1% | |
| Allegheny County, PA, Industrial Development Authority, UPMC Children's Hospital, Series A, 0.08%***, 10/1/2032, LOC: Bank of America NA | | | 20,460,000 | | | | 20,460,000 | |
| Allegheny County, PA, RBC Municipal Products, Inc. Trust Certificates, Series E-16, 144A, 0.1%***, 4/15/2039, LIQ: Royal Bank of Canada, LOC: Royal Bank of Canada | | | 22,165,000 | | | | 22,165,000 | |
| Appleton, WI, Redevelopment Authority Revenue, Fox Cities Performing Arts Center, Inc., Series B, 0.1%***, 6/1/2036, LOC: JPMorgan Chase Bank NA | | | 18,400,000 | | | | 18,400,000 | |
| Arizona, State Health Facilities Authority Revenue, Catholic West: | | | | | | | | |
| Series A, 0.08%***, 7/1/2035, LOC: JPMorgan Chase Bank NA | | | 23,100,000 | | | | 23,100,000 | |
| Series B, 0.08%***, 7/1/2035, LOC: JPMorgan Chase Bank NA | | | 17,680,000 | | | | 17,680,000 | |
| Austin, TX, Water & Wastewater Systems Revenue, 0.07%***, 5/15/2031, LOC: Bank of Tokyo-Mitsubishi UFJ, Sumitomo Mitsui Banking | | | 25,920,000 | | | | 25,920,000 | |
| BlackRock Municipal Intermediate Duration Fund, Inc., Series W-7-2871, 144A, AMT, 0.23%***, 3/1/2041, LIQ: JPMorgan Chase Bank NA | | | 30,000,000 | | | | 30,000,000 | |
| BlackRock MuniHoldings New Jersey Quality Fund, Inc., Series W-7-1727, 144A, AMT, 0.3%***, 7/1/2041, LIQ: Bank of America NA | | | 30,000,000 | | | | 30,000,000 | |
| BlackRock MuniHoldings New York Quality Fund, Inc., Series W-7-2436, 144A, AMT, 0.3%***, 7/1/2041, LIQ: Bank of America NA | | | 40,000,000 | | | | 40,000,000 | |
| BlackRock MuniYield California Quality Fund, Inc., Series W-7-1665, 144A, AMT, 0.22%***, 5/1/2041, LIQ: Citibank NA | | | 13,500,000 | | | | 13,500,000 | |
| BlackRock MuniYield Fund, Inc., Series W-7-2514, 144A, AMT, 0.3%***, 7/1/2041, LIQ: Bank of America NA | | | 25,000,000 | | | | 25,000,000 | |
| BlackRock MuniYield New York Quality Fund, Inc., Series W-7-2477, 144A, AMT, 0.22%***, 5/1/2041, LIQ: Citibank NA | | | 26,300,000 | | | | 26,300,000 | |
| BlackRock MuniYield Quality Fund III, Inc., 144A, AMT, 0.24%***, 6/1/2041, LIQ: Citibank NA | | | 44,500,000 | | | | 44,500,000 | |
| BlackRock MuniYield Quality Fund, Inc., Series W-7-1766, 144A, AMT, 0.26%***, 10/1/2041, LIQ: Morgan Stanley Bank | | | 57,000,000 | | | | 57,000,000 | |
| Blount County, TN, Public Building Authority, Local Government Public Improvement, Series E-5-A, 0.12%***, 6/1/2030, LOC: Branch Banking & Trust | | | 45,400,000 | | | | 45,400,000 | |
| Cabell County, WV, University Facilities, Provident Group Marshall Properties, Series A, 0.13%***, 7/1/2039, LOC: Bank of America NA | | | 19,995,000 | | | | 19,995,000 | |
| Calhoun County, TX, Navigation Industrial Development Authority, Formosa Plastics Corp. Project, Series C, 144A, AMT, 0.12%***, 9/1/2031, LOC: Sumitomo Mitsui Banking | | | 10,000,000 | | | | 10,000,000 | |
| Calhoun, TX, Port Authority, Environmental Facilities Revenue, Formosa Plastics Corp. Project, Series B, 144A, AMT, 0.12%***, 9/1/2041, LOC: Sumitomo Mitsui Banking | | | 21,300,000 | | | | 21,300,000 | |
| California, Housing Finance Agency Revenue, Home Mortgage, Series D, 144A, AMT, 0.1%***, 2/1/2040, LOC: Fannie Mae, Freddie Mac | | | 29,130,000 | | | | 29,130,000 | |
| California, RBC Municipal Products, Inc. Trust, Series E-24, 144A, 0.14%**, Mandatory Put 4/2/2012 @ 100, 7/1/2031, LIQ: Royal Bank of Canada, LOC: Royal Bank of Canada | | | 9,250,000 | | | | 9,250,000 | |
| California, State Kindergarten, Series A5, 0.05%***, 5/1/2034, LOC: Citibank NA & California State Teacher's Retirement System | | | 18,250,000 | | | | 18,250,000 | |
| California, Statewide Communities Development Authority, Multi-Family Housing Revenue, Bay Vista At Meadow Park, Series NN-1, AMT, 0.09%***, 11/15/2037, LIQ: Fannie Mae | | | 29,320,000 | | | | 29,320,000 | |
| California, The Olympic Club Revenue, 0.46%***, 9/30/2032, LOC: Bank of America NA (a) | | | 52,100,000 | | | | 52,100,000 | |
| California, Wells Fargo State Trusts: | | | | | | | | |
| Series 16C, 144A, 0.1%***, 9/1/2029, LIQ: Wells Fargo Bank NA | | | 42,515,000 | | | | 42,515,000 | |
| Series 72C, 144A, 0.1%***, 8/15/2039, GTY: Wells Fargo Bank NA, LIQ: Wells Fargo Bank NA | | | 28,275,000 | | | | 28,275,000 | |
| Series 25C, 144A, 0.1%***, 11/1/2041, GTY: Wells Fargo Bank NA, LIQ: Wells Fargo Bank NA | | | 9,525,000 | | | | 9,525,000 | |
| Channahon, IL, Morris Hospital Revenue, 0.1%***, 12/1/2034, LOC: U.S. Bank NA | | | 5,220,000 | | | | 5,220,000 | |
| Charlotte, NC, Certificates of Participation, Series D, 0.25%***, 6/1/2035, LOC: Bank of America NA (a) | | | 19,600,000 | | | | 19,600,000 | |
| Chattanooga, TN, Industrial Development Board Revenue, BlueCross Corp. Project, 0.22%***, 1/1/2028, LOC: Bank of America NA (a) | | | 99,000,000 | | | | 99,000,000 | |
| Chicago, IL, Midway Airport Revenue, Series A-1, 0.1%***, 1/1/2021, LOC: Bank of Montreal (a) | | | 22,000,000 | | | | 22,000,000 | |
| Clark County, NV, Passenger Facility Charge Revenue, McCarran International Airport, Series F-2, 0.1%***, 7/1/2022, LOC: Union Bank NA | | | 18,000,000 | | | | 18,000,000 | |
| Cleveland, OH, Airport Systems Revenue, Series D, 0.07%***, 1/1/2024, LOC: PNC Bank NA | | | 9,725,000 | | | | 9,725,000 | |
| Cleveland-Cuyahoga County, OH, Port Authority Revenue, Carnegie/89th Garage Project, 0.1%***, 1/1/2037, LOC: JPMorgan Chase Bank | | | 17,730,000 | | | | 17,730,000 | |
| Colorado, Health Facilities Authority Revenue, Fraiser Meadows Community Project, 0.08%***, 6/1/2038, LOC: JPMorgan Chase Bank NA | | | 14,000,000 | | | | 14,000,000 | |
| Colorado, Housing Finance Authority, Single Family Mortgage Revenue: | | | | | | | | |
| "I", Series B-1, 0.15%***, 5/1/2038, LOC: Fannie Mae, Freddie Mac (a) | | | 18,935,000 | | | | 18,935,000 | |
| "I", Series A-2, 0.16%***, 5/1/2038, LOC: Fannie Mae, Freddie Mac (a) | | | 10,185,000 | | | | 10,185,000 | |
| Colorado, Meridian Village Metropolitan, RBC Municipal Products, Inc. Trust, Series C-11, 144A, 0.1%***, 12/1/2031, LIQ: Royal Bank of Canada, LOC: Royal Bank of Canada | | | 17,580,000 | | | | 17,580,000 | |
| Colorado, RBC Municipal Products, Inc. Trust, Series E-25, 144A, AMT, 0.13%***, 11/15/2025, LIQ: Royal Bank of Canada, LOC: Royal Bank of Canada | | | 22,000,000 | | | | 22,000,000 | |
| Colorado, State Educational & Cultural Facilities Authority, Linfield Christian School Project, 0.08%***, 5/1/2030, LOC: Evangelical Christian Credit Union | | | 16,000,000 | | | | 16,000,000 | |
| Colorado, Wells Fargo Stage Trust, Series 42C, 144A, AMT, 0.11%***, 11/15/2023, GTY: Wells Fargo Bank NA, LIQ: Wells Fargo Bank NA | | | 9,835,000 | | | | 9,835,000 | |
| Colorado Springs, CO, Utilities Revenue: | |
| Series C, 0.08%***, 11/1/2040, SPA: JPMorgan Chase Bank NA | | | 29,415,000 | | | | 29,415,000 | |
| Series B, 0.1%***, 11/1/2026, SPA: Barclays Bank PLC | | | 11,000,000 | | | | 11,000,000 | |
| Series A, 0.11%***, 11/1/2038, SPA: Bank of America NA | | | 31,645,000 | | | | 31,645,000 | |
| County of Carroll, KY, Environmental Facilities Revenue, Utilities Company Project, Series A, AMT, 0.11%***, 2/1/2032, LOC: Sumitomo Mitsui Banking | | | 27,800,000 | | | | 27,800,000 | |
| Covina, CA, Redevelopment Agency, Multi-Family Housing, ShadowHills Apartments, Inc., Series A, 0.08%***, 12/1/2015, LIQ: Fannie Mae | | | 12,825,000 | | | | 12,825,000 | |
| Eclipse Funding Trust, Solar Eclipse, Springfield, IL Electric Revenue, Series 2006-0007, 144A, 0.09%***, 3/1/2030, LIQ: U.S. Bank NA, LOC: U.S. Bank NA | | | 22,545,000 | | | | 22,545,000 | |
| Florida, Capital Trust Agency Housing Revenue, Atlantic Housing Foundation, Series A, 0.1%***, 7/15/2024, LIQ: Fannie Mae | | | 19,000,000 | | | | 19,000,000 | |
| Florida, Development Finance Corp., Enterprise Board Industrial Development Program, Out of Door Academy, 0.11%***, 7/1/2038, LOC: Northern Trust Co. | | | 12,910,000 | | | | 12,910,000 | |
| Florida, State Board of Public Education, Series 3834Z, 144A, 0.1%***, 12/1/2015, LIQ: JPMorgan Chase Bank NA | | | 9,000,000 | | | | 9,000,000 | |
| Florida, Sunshine State Governmental Financing Commission Revenue, Miami Dade County Program, Series B, 0.08%***, 9/1/2032, LOC: JPMorgan Chase Bank NA | | | 28,500,000 | | | | 28,500,000 | |
| Georgia, Main Street Natural Gas, Inc., Gas Revenue, Series A, 0.09%***, 8/1/2040, SPA: Royal Bank of Canada | | | 84,000,000 | | | | 84,000,000 | |
| Georgia, Private Colleges & Universities Authority Revenue, Mercer University Project, Series A, 0.1%***, 10/1/2036, LOC: Branch Banking & Trust | | | 10,240,000 | | | | 10,240,000 | |
| Hawaii, State Department of Budget & Finance Special Purpose Revenue, Series 2135, 144A, AMT, 0.1%***, 3/1/2037, GTY: Wells Fargo & Co., INS: FGIC, LIQ: Wells Fargo & Co. | | | 19,485,000 | | | | 19,485,000 | |
| Hawaii, Wells Fargo Stage Trust, Series 54C, 144A, 0.11%***, 4/1/2029, GTY: Wells Fargo Bank NA, LIQ: Wells Fargo Bank NA | | | 9,240,000 | | | | 9,240,000 | |
| Hayward, CA, Multi-Family Housing Revenue, Shorewood Bay Waterford Inc., Series A, 0.08%***, 7/15/2014, LIQ: Fannie Mae | | | 20,000,000 | | | | 20,000,000 | |
| Houston, TX, Airport Systems Revenue, 0.09%***, 7/1/2030, LOC: Barclays Bank PLC | | | 8,000,000 | | | | 8,000,000 | |
| Houston, TX, RBC Municipal Products, Inc. Trust Certificates, Utility Systems Revenue, Series E-14, 144A, 0.1%***, 5/15/2034, LIQ: Royal Bank of Canada, LOC: Royal Bank of Canada | | | 24,070,000 | | | | 24,070,000 | |
| Houston, TX, Utility Systems Revenue, Series D-1, 0.16%***, 5/15/2034, INS: AGMC, LOC: JPMorgan Chase Bank NA (a) | | | 44,000,000 | | | | 44,000,000 | |
| Houston, TX, Water & Sewer Systems Revenue, Series 27TPZ, 144A, 0.09%***, 12/1/2028, INS: AGMC, LIQ: Wells Fargo Bank NA, LOC: Wells Fargo Bank NA | | | 15,865,000 | | | | 15,865,000 | |
| Illinois, Development Finance Authority Revenue, Chicago Symphony Project, 0.08%***, 12/1/2033, LOC: Bank One NA | | | 12,500,000 | | | | 12,500,000 | |
| Illinois, Finance Authority Revenue, Series A, 0.1%***, 11/15/2022, INS: Radian, LOC: JPMorgan Chase Bank NA | | | 12,045,000 | | | | 12,045,000 | |
| Illinois, State Finance Authority Revenue, Methodist Medical Center, Series B, 0.1%***, 11/15/2041, LOC: PNC Bank NA | | | 10,000,000 | | | | 10,000,000 | |
| Illinois, State Toll Highway Authority Revenue, Series A-1A, 0.13%***, 1/1/2031, INS: AGMC, SPA: JPMorgan Chase Bank NA | | | 50,000,000 | | | | 50,000,000 | |
| Illinois, State Toll Highway Authority, Senior Priority, Series A-2A, 0.09%***, 7/1/2030, LOC: Bank of Tokyo-Mitsubishi UFJ | | | 15,000,000 | | | | 15,000,000 | |
| Illinois, Wells Fargo Stage Trust: | | | | | | | | |
| Series 50C, 144A, 0.11%***, 11/15/2035, GTY: Wells Fargo Bank NA, LIQ: Wells Fargo Bank NA | | | 9,110,000 | | | | 9,110,000 | |
| Series 15C, 144A, 0.11%***, 10/1/2040, GTY: Wells Fargo Bank NA, LIQ: Wells Fargo Bank NA | | | 24,405,000 | | | | 24,405,000 | |
| Indiana, State Finance Authority Hospital Revenue, Indiana University Health: | | | | | | | | |
| Series A, 0.06%***, 3/1/2033, LOC: Northern Trust Co. | | | 10,000,000 | | | | 10,000,000 | |
| Series K, 0.09%***, 3/1/2033, LOC: JPMorgan Chase Bank NA (a) | | | 31,700,000 | | | | 31,700,000 | |
| Series J, 0.14%***, 3/1/2033, LOC: JPMorgan Chase Bank NA (a) | | | 15,625,000 | | | | 15,625,000 | |
| Indiana, State Municipal Power Agency, Series A, 0.09%***, 1/1/2018, LOC: Citibank NA | | | 3,800,000 | | | | 3,800,000 | |
| Indiana, Wells Fargo Stage Trust, Series 41C, 144A, 0.11%***, 1/1/2021, GTY: Wells Fargo Bank NA, LIQ: Wells Fargo Bank NA | | | 16,750,000 | | | | 16,750,000 | |
| Iowa, State Finance Authority, Series C, AMT, 0.13%***, 1/1/2036, SPA: State Street Bank & Trust Co. | | | 5,700,000 | | | | 5,700,000 | |
| Iowa, State Finance Authority, Single Family Mortgage, Series C, AMT, 0.12%***, 1/1/2036, SPA: State Street Bank & Trust Co. | | | 8,100,000 | | | | 8,100,000 | |
| Johnson City, TN, Health & Educational Facilities Board Hospital Revenue, Series B3, 0.24%***, 7/1/2033, LOC: Mizuho Corporate Bank (a) | | | 11,400,000 | | | | 11,400,000 | |
| Kansas, State Department of Transportation Highway Revenue, Series C-3, 0.06%***, 9/1/2023, SPA: JPMorgan Chase Bank NA | | | 10,750,000 | | | | 10,750,000 | |
| Kentucky, State Housing Corp. Revenue, Series O, 0.6%***, 1/1/2036, SPA: State Street Bank & Trust Co. (a) | | | 19,160,000 | | | | 19,160,000 | |
| Long Island, NY, Power Authority, Series 3A, 0.28%***, 5/1/2033, LOC: JPMorgan Chase Bank NA & Landesbank Baden-Wurttemberg | | | 15,000,000 | | | | 15,000,000 | |
| Los Angeles County, CA, Multi-Family Housing Authority Revenue, Canyon Country Villas Project, Series H, 0.09%***, 12/1/2032, LIQ: Freddie Mac | | | 8,200,000 | | | | 8,200,000 | |
| Louisiana, Wells Fargo Stage Trust, Series 11C, 144A, 0.11%***, 5/1/2045, LIQ: Wells Fargo Bank NA | | | 17,310,000 | | | | 17,310,000 | |
| Maine, State Housing Authority Mortgage Revenue, Series B-3, AMT, 0.14%***, 11/15/2038, SPA: State Street Bank & Trust Co. | | | 3,310,000 | | | | 3,310,000 | |
| Maine, State Housing Authority, Mortgage Revenue, Series E-2, AMT, 0.12%***, 11/15/2041, SPA: State Street Bank & Trust Co. | | | 8,000,000 | | | | 8,000,000 | |
| Maricopa County, AZ, Industrial Development Authority, Senior Living Facilities Revenue, Christian Care Apartments, Series A, 0.09%***, 9/15/2035, LIQ: Fannie Mae | | | 10,845,000 | | | | 10,845,000 | |
| Massachusetts, State Department of Transportation, Metropolitan Highway Systems Revenue, Contract Assistance, Series A3, 0.09%***, 1/1/2039, LOC: Bank of America NA | | | 38,845,000 | | | | 38,845,000 | |
| Massachusetts, State Development Finance Agency Revenue, Milton Academy, Series B, 0.17%***, 3/1/2039, LOC: TD Bank NA (a) | | | 5,225,000 | | | | 5,225,000 | |
| Massachusetts, State Development Finance Agency Revenue, Wentworth Institute of Technology, 0.1%***, 10/1/2030, LOC: RBS Citizens NA | | | 26,390,000 | | | | 26,390,000 | |
| Massachusetts, State Development Finance Agency Revenue, YMCA of Greater Worcester, 0.08%***, 9/1/2041, LOC: TD Bank NA | | | 11,615,000 | | | | 11,615,000 | |
| Massachusetts, State General Obligation, Series B, 0.25%***, 8/1/2015, SPA: JPMorgan Chase Bank NA | | | 33,000,000 | | | | 33,000,000 | |
| Massachusetts, State Health & Educational Facilities Authority Revenue, Boston University, Series N, 0.16%***, 10/1/2034, LOC: Bank of America NA (a) | | | 13,410,000 | | | | 13,410,000 | |
| Massachusetts, State Water Resources Authority: | |
| Series C-2, 0.08%***, 11/1/2026, SPA: Barclays Bank PLC | | | 20,200,000 | | | | 20,200,000 | |
| Series A-1, 0.08%***, 8/1/2037, SPA: JPMorgan Chase Bank NA | | | 20,000,000 | | | | 20,000,000 | |
| Michigan, Finance Authority, School Loan: | |
| Series B, 0.19%***, 9/1/2050, LOC: PNC Bank NA (a) | | | 25,000,000 | | | | 25,000,000 | |
| Series C, 0.19%***, 9/1/2050, LOC: Bank of Montreal (a) | | | 21,000,000 | | | | 21,000,000 | |
| Michigan, Higher Education Facilities Authority Revenue, Limited Obligation, Hope College, Series B, 0.09%***, 4/1/2032, LOC: PNC Bank NA | | | 17,430,000 | | | | 17,430,000 | |
| Michigan, RBC Municipal Products, Inc. Trust: | | | | | | | | |
| Series L-23, 144A, AMT, 0.13%***, 3/1/2028, INS: AMBAC, LIQ: Royal Bank of Canada, LOC: Royal Bank of Canada | | | 31,000,000 | | | | 31,000,000 | |
| Series L-25, 144A, AMT, 0.13%***, 9/1/2033, LIQ: Royal Bank of Canada, LOC: Royal Bank of Canada | | | 66,745,000 | | | | 66,745,000 | |
| Michigan, State Strategic Fund Limited Obligation Revenue, Kroger Co., Recovery Zone Facility, 0.1%***, 1/1/2026, LOC: Bank of Tokyo-Mitsubishi UFJ | | | 9,500,000 | | | | 9,500,000 | |
| Michigan, Wells Fargo Stage Trust, Series 90C, 144A, 0.11%***, 7/1/2035, LIQ: Wells Fargo Bank NA | | | 14,510,000 | | | | 14,510,000 | |
| Minnesota, RBC Municipal Products, Inc. Trust, Series E-19, 144A, 0.17%***, Mandatory Put 4/2/2012 @ 100, 11/15/2047, LIQ: Royal Bank of Canada, LOC: Royal Bank of Canada | | | 10,000,000 | | | | 10,000,000 | |
| Minnesota, State Housing Finance Agency, Residential Housing Finance, Series C, AMT, 0.12%***, 7/1/2048, LIQ: Federal Home Loan Bank | | | 8,000,000 | | | | 8,000,000 | |
| Minnesota, State Office of Higher Education Revenue, Supplementary Student, Series A, 0.17%***, 12/1/2043, LOC: U.S. Bank NA (a) | | | 11,500,000 | | | | 11,500,000 | |
| Mississippi, State Business Finance Commission, Gulf Opportunity Zone, Chevron U.S.A., Inc. Project, Series C, 0.03%***, 12/1/2030, GTY: Chevron Corp. | | | 8,295,000 | | | | 8,295,000 | |
| Mississippi, State Business Finance Corp., Gulf Opportunity Zone Revenue, Tindall Corp. Project, 0.09%***, 4/1/2028, LOC: Wells Fargo Bank NA | | | 9,005,000 | | | | 9,005,000 | |
| Missouri, State Health & Educational Facilities Authority, Ascension Health, Series C-3, 0.07%***, 11/15/2039 | | | 14,000,000 | | | | 14,000,000 | |
| Missouri, State Health & Educational Facilities Authority, SSM Health Care Corp., Series E, 0.04%***, 6/1/2045, LOC: PNC Bank NA | | | 22,660,000 | | | | 22,660,000 | |
| Monroe County, GA, Development Authority Pollution Control Revenue, Oglethorpe Power Corp., Series B, 0.08%***, 1/1/2036, LOC: JPMorgan Chase Bank NA | | | 27,530,000 | | | | 27,530,000 | |
| Montgomery County, TN, Public Building Authority, Pooled Financing Revenue, Tennessee County Loan Pool, 0.23%***, 11/1/2027, LOC: Bank of America NA | | | 30,790,000 | | | | 30,790,000 | |
| Nashville & Davidson County, TN, Metropolitan Government Health & Educational Facilities Board, Multi-Family Housing, Weatherly Ridge Apartments, Series A, AMT, 0.13%***, 12/1/2041, LOC: U.S. Bank NA | | | 3,000,000 | | | | 3,000,000 | |
| Nevada, Housing Division, Multi-Unit Housing, Apache Project, Series A, AMT, 0.1%***, 10/15/2032, LIQ: Fannie Mae | | | 11,815,000 | | | | 11,815,000 | |
| New Hampshire, State Health & Education Facilities Authority Revenue, Higher Education Loan Corp., Series A, 0.18%***, 12/1/2032, LOC: Royal Bank of Canada (a) | | | 24,401,000 | | | | 24,401,000 | |
| New Jersey, State Health Care Facilities Financing Authority Revenue, Saint Barnabas Health, Series C, 0.09%***, 7/1/2038, LOC: JPMorgan Chase Bank NA (a) | | | 21,495,000 | | | | 21,495,000 | |
| New Mexico, Educational Assistance Foundation, Series A-1, AMT, 0.12%***, 4/1/2034, LOC: Royal Bank of Canada | | | 19,485,000 | | | | 19,485,000 | |
| New Mexico, Wells Fargo Stage Trust, Series 40C, 144A, 0.11%***, 8/1/2039, GTY: Wells Fargo Bank NA, LIQ: Wells Fargo Bank NA | | | 9,265,000 | | | | 9,265,000 | |
| New York, State Dormitory Authority Revenues, Non State Supported Debt, Series 47C, 144A, 0.11%***, 7/1/2050, GTY: Wells Fargo Bank NA, LIQ: Wells Fargo Bank NA | | | 20,595,000 | | | | 20,595,000 | |
| New York, State Dormitory Authority Revenues, Non-State Supported Debt, St. John's University, Series B-2, 0.08%***, 7/1/2037, LOC: Bank of America NA | | | 32,000,000 | | | | 32,000,000 | |
| New York, State Dormitory Authority Revenues, Secondary Issues, Series R-12121, 0.1%***, 4/1/2015, LIQ: Citibank NA | | | 15,830,000 | | | | 15,830,000 | |
| New York, State Energy Research & Development Authority Facilities Revenue, Consolidated Edison Co. of New York, Inc.: | | | | | | | | |
| Series A-2, 144A, 0.06%***, 5/1/2039, LOC: Mizuho Corporate Bank | | | 21,100,000 | | | | 21,100,000 | |
| Series A-1, 144A, 0.07%***, 5/1/2039, LOC: Mizuho Corporate Bank | | | 22,300,000 | | | | 22,300,000 | |
| Series C-3, 144A, AMT, 0.08%***, 11/1/2039, LOC: Mizuho Corporate Bank | | | 27,000,000 | | | | 27,000,000 | |
| Series C-1, 144A, AMT, 0.09%***, 11/1/2039, LOC: Mizuho Corporate Bank | | | 11,200,000 | | | | 11,200,000 | |
| New York, State Housing Finance Agency Revenue, 100 Maiden Lane Properties, Series A, 0.08%***, 5/15/2037, LIQ: Fannie Mae | | | 29,660,000 | | | | 29,660,000 | |
| New York, State Housing Finance Agency Revenue, 88 Leonard Street, Series A, 144A, 1.25%***, 11/1/2037, LOC: Landesbank Hessen-Thuringen (a) | | | 11,750,000 | | | | 11,750,000 | |
| New York, State Housing Finance Agency Revenue, West 38 Street, Series A, AMT, 0.09%***, 5/15/2033, LIQ: Fannie Mae | | | 16,000,000 | | | | 16,000,000 | |
| New York, State Housing Finance Agency, Affordable Housing Revenue, Clinton Park Housing, Series A, 0.1%***, 11/1/2044, LOC: Wells Fargo Bank NA | | | 21,750,000 | | | | 21,750,000 | |
| New York, State Housing Finance Agency, Affordable Housing Revenue, Clinton Park Phase II, Series A-1, 0.09%***, 11/1/2049, LOC: Wells Fargo Bank NA | | | 19,000,000 | | | | 19,000,000 | |
| New York, State Mortgage Agency, Homeowner Revenue, Series 153, AMT, 0.11%***, 4/1/2047, SPA: Barclays Bank PLC | | | 25,000,000 | | | | 25,000,000 | |
| New York City, NY, Municipal Water Finance Authority, Water & Sewer Systems Revenue, Series TR-T30001-I, 144A, 0.3%***, 6/15/2044, LIQ: Citibank NA (a) | | | 8,000,000 | | | | 8,000,000 | |
| North Carolina, Capital Facilities Finance Agency, Educational Facilities Revenue, Forsyth Country Day School, 0.12%***, 12/1/2031, LOC: Branch Banking & Trust | | | 12,190,000 | | | | 12,190,000 | |
| North Carolina, State Capital Facilities Finance Agency Revenue, ELON University, 0.11%***, 1/1/2035, LOC: Bank of America NA | | | 19,935,000 | | | | 19,935,000 | |
| Nuveen Arizona Premium Income Municipal Fund, Inc., Series T30017-I, 144A, 0.3%***, 8/1/2014, LIQ: Citibank NA (a) | | | 27,900,000 | | | | 27,900,000 | |
| Nuveen Dividend Advantage Municipal Fund, Series T30016-I, 144A, 0.3%***, 8/1/2014, LIQ: Citibank NA (a) | | | 70,300,000 | | | | 70,300,000 | |
| Nuveen Select Quality Municipal Fund, Inc., Series 1-2525, 144A, AMT, 0.25%***, 5/1/2041, LIQ: Barclays Bank PLC | | | 40,000,000 | | | | 40,000,000 | |
| Ohio, Housing Finance Agency, Residential Mortgage-Backed Revenue, Series F, AMT, 0.15%***, 3/1/2037, SPA: Citibank NA | | | 31,930,000 | | | | 31,930,000 | |
| Ohio, State Housing Finance Agency, Residental Mortgage Revenue, Series M, AMT, 0.15%***, 9/1/2036, SPA: Citibank NA | | | 32,000,000 | | | | 32,000,000 | |
| Ohio, State Housing Finance Agency, Residential Mortgage Revenue, Mortgage-Backed Securities Program, Series N, AMT, 0.15%***, 9/1/2036, SPA: State Street Bank & Trust Co. | | | 68,405,000 | | | | 68,405,000 | |
| Oklahoma, State Turnpike Authority Revenue, Series B, 0.08%***, 1/1/2028, SPA: Royal Bank of Canada | | | 20,330,000 | | | | 20,330,000 | |
| Orlando & Orange County, FL, Expressway Authority, Series C-1, 0.1%***, 7/1/2025, INS: AGMC, LOC: JPMorgan Chase Bank NA | | | 26,000,000 | | | | 26,000,000 | |
| Palm Beach County, FL, Solid Waste Authority Revenue, 1.0%, Mandatory Put 1/12/2012 @ 100, 10/1/2031 | | | 100,000,000 | | | | 100,017,369 | |
| Philadelphia, PA, Authority for Industrial Development, Series B-3, 0.07%***, 10/1/2030, LOC: PNC Bank NA | | | 10,655,000 | | | | 10,655,000 | |
| Philadelphia, PA, Gas Works Revenue, Series D, 0.07%***, 8/1/2031, LOC: Bank of America NA | | | 25,000,000 | | | | 25,000,000 | |
| Raleigh Durham, NC, Airport Authority Revenue, Series C, 0.1%***, 5/1/2036, LOC: U.S. Bank NA | | | 10,595,000 | | | | 10,595,000 | |
| Salem, OR, Hospital Facility Authority Revenue, Salem Hospital Project, Series C, 0.12%***, 8/15/2036, LOC: Bank of America NA | | | 12,500,000 | | | | 12,500,000 | |
| San Jose, CA, Financing Authority, Series E2, 0.16%***, 6/1/2025, LOC: U.S. Bank NA (a) | | | 12,455,000 | | | | 12,455,000 | |
| San Jose, CA, Financing Authority Lease Revenue, Hayes Mansion, Series D, 0.17%***, 6/1/2025, LOC: U.S. Bank NA (a) | | | 40,985,000 | | | | 40,985,000 | |
| San Jose, CA, Financing Authority Lease Revenue, Ice Center, Series E1, 0.2%***, 6/1/2025, LOC: Bank of America NA (a) | | | 12,460,000 | | | | 12,460,000 | |
| South Carolina, State Jobs-Economic Development Authority, Economic Development Revenue, Bon Secours Health Systems, 0.1%***, 11/1/2042, INS: AGMC, LOC: JPMorgan Chase Bank NA | | | 17,500,000 | | | | 17,500,000 | |
| Southern California, Metropolitan Water District, State Authorization, Series B, 0.07%***, 7/1/2028, SPA: Landesbank Hessen-Thuringen | | | 16,600,000 | | | | 16,600,000 | |
| St. James Parish, LA, Nustar Logistics, Series A, 0.09%***, 10/1/2040, LOC: JPMorgan Chase Bank NA | | | 12,500,000 | | | | 12,500,000 | |
| Stafford County, VA, Industrial Development Authority Revenue, Series B-1, 0.15%***, 8/1/2028, LOC: Bank of America NA | | | 21,505,000 | | | | 21,505,000 | |
| Sweetwater County, WY, Pollution Control Revenue, PacifiCorp Project, Series A, 144A, 0.09%***, 7/1/2015, LOC: Barclays Bank PLC | | | 12,550,000 | | | | 12,550,000 | |
| Texas, Alliance Airport Authority, Inc., Special Facilities Revenue, Series 2088, 144A, AMT, 0.1%***, 4/1/2021, GTY: Wells Fargo & Co., LIQ: Wells Fargo & Co. | | | 24,570,000 | | | | 24,570,000 | |
| Texas, Capital Area Housing Finance Corp., Cypress Creek at River Apartments, AMT, 0.13%***, 10/1/2039, LOC: Citibank NA | | | 10,895,000 | | | | 10,895,000 | |
| Texas, Lower Neches Valley Authority, Industrial Development Corp., Series B-2, AMT, 0.03%***, 12/1/2039, GTY: Exxon Mobil Corp. | | | 7,880,000 | | | | 7,880,000 | |
| Texas, RBC Municipal Products, Inc. Trust, Series E-27, 144A, 0.1%***, 6/1/2027, LIQ: Royal Bank of Canada, LOC: Royal Bank of Canada | | | 10,000,000 | | | | 10,000,000 | |
| Texas, State General Obligation: | |
| Series E, 0.14%***, 12/1/2026, SPA: JPMorgan Chase Bank NA (a) | | | 19,000,000 | | | | 19,000,000 | |
| Series E, 0.15%***, 6/1/2032, LOC: Sumitomo Mitsui Banking (a) | | | 24,435,000 | | | | 24,435,000 | |
| Texas, State Higher Education Authority, Series L-46, 144A, AMT, 0.13%***, 12/1/2034, LIQ: Royal Bank of Canada, LOC: Royal Bank of Canada | | | 52,995,000 | | | | 52,995,000 | |
| Texas, State Veterans Housing Assistance Fund II: | |
| Series C, 0.14%***, 6/1/2031, SPA: JPMorgan Chase & Co. (a) | | | 11,255,000 | | | | 11,255,000 | |
| Series A, 144A, AMT, 0.14%***, 6/1/2034, SPA: Landesbank Hessen-Thuringen | | | 18,395,000 | | | | 18,395,000 | |
| Texas, Tax & Revenue Anticipation Notes: | |
| Series 3945, 144A, 0.07%***, 8/30/2012, LIQ: JPMorgan Chase & Co. | | | 95,000,000 | | | | 95,000,000 | |
| Series 3946, 144A, 0.07%***, 8/30/2012, LIQ: JPMorgan Chase & Co. | | | 90,975,000 | | | | 90,975,000 | |
| Series 3953, 144A, 0.07%***, 8/30/2012, LIQ: JPMorgan Chase & Co. | | | 166,075,000 | | | | 166,075,000 | |
| Series 3964, 144A, 0.07%***, 8/30/2012, LIQ: JPMorgan Chase & Co. | | | 195,000,000 | | | | 195,000,000 | |
| Texas, University of Houston Revenues, Consolidated Systems, 0.08%***, 2/15/2024 | | | 8,860,000 | | | | 8,860,000 | |
| Texas, Wells Fargo Stage Trust, Series 20C, 144A, AMT, 0.11%***, 5/1/2038, GTY: Wells Fargo Bank NA, LIQ: Wells Fargo Bank NA | | | 16,120,000 | | | | 16,120,000 | |
| Travis County, TX, Health Facilities Development Corp., Retirement Facilities Revenue, Longhorn Village Project, Series B, 0.1%***, 7/1/2037, LOC: Bank of Scotland | | | 20,430,000 | | | | 20,430,000 | |
| Troy, NY, Capital Resource Corp. Revenue, Series 4C, 144A, 0.11%***, 9/1/2040, LIQ: Wells Fargo Bank NA | | | 18,715,000 | | | | 18,715,000 | |
| Tulsa, OK, Airports Improvement Trust, Special Facility Revenue, Bizjet International Sales & Support, Inc., 144A, AMT, 0.14%***, 8/1/2018, LOC: Landesbank Hessen-Thuringen | | | 10,120,000 | | | | 10,120,000 | |
| Union County, NC, Enterprise Systems Revenue, 0.07%***, 6/1/2034, LOC: Bank of America NA | | | 13,700,000 | | | | 13,700,000 | |
| University of California Revenue, Series R-12236, 0.07%***, 10/1/2015, INS: AGMC, FGIC, LIQ: Citibank NA | | | 15,000,000 | | | | 15,000,000 | |
| University of New Mexico, Systems Improvement Revenues, 0.1%***, 6/1/2026, SPA: JPMorgan Chase Bank NA | | | 33,625,000 | | | | 33,625,000 | |
| Vermont, State Educational & Health Buildings Financing Agency Revenue, Fletcher Allen Health Care, Series A, 0.08%***, 12/1/2030, LOC: TD BankNorth NA | | | 7,070,000 | | | | 7,070,000 | |
| Volusia County, FL, Housing Finance Authority, Multi-Family Housing Revenue, Cape Morris Cove Apartments, Series A, AMT, 0.12%***, 10/15/2042, LOC: JPMorgan Chase Bank NA | | | 6,140,000 | | | | 6,140,000 | |
| Washington, State Economic Development Finance Authority, Solid Waste Disposal Revenue, Waste Management, Inc. Project, Series D, AMT, 0.15%***, 7/1/2030, LOC: JPMorgan Chase Bank NA | | | 20,000,000 | | | | 20,000,000 | |
| Washington, State Health Care Facilities Authority, Swedish Health Services: | | | | | | | | |
| Series B, 0.09%***, 11/15/2046, LOC: Citibank NA | | | 13,000,000 | | | | 13,000,000 | |
| Series C, 0.09%***, 11/15/2046, LOC: Citibank NA | | | 14,000,000 | | | | 14,000,000 | |
| Washington, State Housing Finance Commission, Rolling Hills Apartments Project, Series A, 144A, AMT, 0.13%***, 6/15/2037, LIQ: Fannie Mae | | | 6,125,000 | | | | 6,125,000 | |
| Washington, Wells Fargo Stage Trust, Series 21C, 144A, 0.11%***, 12/1/2037, GTY: Wells Fargo Bank NA, LIQ: Wells Fargo Bank NA | | | 10,360,000 | | | | 10,360,000 | |
| Wayne County, MI, Airport Authority Revenue, Detroit Metropolitan Airport: | | | | | | | | |
| Series E2, AMT, 0.1%***, 12/1/2028, LOC: PNC Bank NA | | | 16,000,000 | | | | 16,000,000 | |
| Series E1, AMT, 0.11%***, 12/1/2028, LOC: JPMorgan Chase Bank NA | | | 25,000,000 | | | | 25,000,000 | |
| Wisconsin, Housing & Economic Development Authority, Home Ownership Revenue, Series B, 0.15%***, 3/1/2033, LOC: Fannie Mae, Freddie Mac (a) | | | 13,905,000 | | | | 13,905,000 | |
| Wisconsin, State Health & Educational Facilities Authority Revenue, Mercy Alliance, Inc., 0.06%***, 6/1/2039, LOC: U.S. Bank NA | | | 23,000,000 | | | | 23,000,000 | |
| Wisconsin, State Health & Educational Facilities Authority Revenue, Oakwood Village Apartments, Inc., 0.06%***, 8/15/2028, LOC: BMO Harris Bank NA | | | 9,095,000 | | | | 9,095,000 | |
| Woodstock, IL, Multi-Family Housing Revenue, Willow Brooke Apartments, AMT, 0.12%***, 4/1/2042, LOC: Wells Fargo Bank NA | | | 24,600,000 | | | | 24,600,000 | |
| Wyoming, Student Loan Corp. Revenue, Series A-3, 0.08%***, 12/1/2043, LOC: Royal Bank of Canada | | | 40,000,000 | | | | 40,000,000 | |
Total Municipal Investments (Cost $4,389,093,369) | | | | 4,389,093,369 | |
| | |
| Repurchase Agreements 0.5% | |
| JPMorgan Securities, Inc., 0.16%, dated 12/30/2011, to be repurchased at $100,001,778 on 1/3/2012 (b) (Cost $100,000,000) | | | 100,000,000 | | | | 100,000,000 | |
| | | % of Net Assets | | | Value ($) | |
| | | | |
Total Investment Portfolio ($19,901,627,274)+ | | | 95.8 | | | | 19,901,627,274 | |
| Other Assets and Liabilities, Net | | | 4.2 | | | | 882,549,401 | |
| Net Assets | | | 100.0 | | | | 20,784,176,675 | |
* Floating rate securities' yields vary with a designated market index or market rate, such as the coupon-equivalent of the U.S. Treasury Bill rate. These securities are shown at their current rate as of December 31, 2011.
** Annualized yield at time of purchase; not a coupon rate.
*** Variable rate demand notes and variable rate demand preferred shares are securities whose interest rates are reset periodically at market levels. These securities are payable on demand and are shown at their current rates as of December 31, 2011.
+ The cost for federal income tax purposes was $19,901,627,274.
(a) Taxable issue.
(b) Collateralized by:
| Principal Amount ($) | | Security | | Rate (%) | | Maturity Date | | Collateral Value ($) | |
| | 50,870,000 | | Federated Republic of Brazil | | | 8.875-12.75 | | 1/15/2020- 4/15/2024 | | | 84,676,763 | |
| | 20,000,000 | | Republic of South Africa | | | 7.375 | | 4/25/2012 | | | 20,325,000 | |
| Total Collateral Value | | | 105,001,763 | |
144A: Security exempt from registration under Rule 144A of the Securities Act of 1933. These securities may be resold in transactions exempt from registration, normally to qualified institutional buyers.
AGMC: Assured Guaranty Municipal Corp.
AMBAC: Ambac Financial Group, Inc.
AMT: Subject to alternative minimum tax.
FGIC: Financial Guaranty Insurance Co.
GTY: Guaranty Agreement
INS: Insured
LIQ: Liquidity Facility
LOC: Letter of Credit
Radian: Radian Asset Assurance, Inc.
SPA: Standby Bond Purchase Agreement
Fair Value Measurements
Various inputs are used in determining the value of the Portfolio's investments. These inputs are summarized in three broad levels. Level 1 includes quoted prices in active markets for identical securities. Level 2 includes other significant observable inputs (including quoted prices for similar securities, interest rates, prepayment speeds and credit risk). Level 3 includes significant unobservable inputs (including the Portfolio's own assumptions in determining the fair value of investments). The inputs or methodology used for valuing securities are not necessarily an indication of the risk associated with investing in those securities. Securities held by the Portfolio are reflected as Level 2 because the securities are valued at amortized cost (which approximates fair value) and, accordingly, the inputs used to determine value are not quoted prices in an active market.
The following is a summary of the inputs used as of December 31, 2011 in valuing the Portfolio's investments. For information on the Portfolio's policy regarding the valuation of investments, please refer to the Security Valuation section of Note A in the accompanying Notes to Financial Statements.
| Assets | | Level 1 | | | Level 2 | | | Level 3 | | | Total | |
| | |
| Investments in Securities (c) | | $ | — | | | $ | 19,801,627,274 | | | $ | — | | | $ | 19,801,627,274 | |
| Repurchase Agreements | | | — | | | | 100,000,000 | | | | — | | | | 100,000,000 | |
| Total | | $ | — | | | $ | 19,901,627,274 | | | $ | — | | | $ | 19,901,627,274 | |
There have been no transfers between Level 1 and Level 2 fair value measurements during the year ended December 31, 2011.
(c) See Investment Portfolio for additional detailed categorizations.
The accompanying notes are an integral part of the financial statements.
Statement of Assets and Liabilities | as of December 31, 2011 | |
| Assets | |
| Investments in non-affiliated securities, valued at amortized cost | | $ | 19,901,627,274 | |
| Cash | | | 702,330,627 | |
| Receivable for investments sold | | | 161,146,638 | |
| Interest receivable | | | 21,929,547 | |
| Other assets | | | 408,290 | |
| Total assets | | | 20,787,442,376 | |
| Liabilities | |
| Accrued management fee | | | 2,182,416 | |
| Other accrued expenses and payables | | | 1,083,285 | |
| Total liabilities | | | 3,265,701 | |
| Net assets, at value | | $ | 20,784,176,675 | |
The accompanying notes are an integral part of the financial statements.
| for the year ended December 31, 2011 | |
| Investment Income | |
Income: Interest | | $ | 66,333,359 | |
Expenses: Management fee | | | 32,771,738 | |
| Administration fee | | | 7,827,308 | |
| Custodian fee | | | 98,023 | |
| Professional fees | | | 124,799 | |
| Reports to shareholders | | | 22,736 | |
| Trustees' fees and expenses | | | 668,115 | |
| Other | | | 919,172 | |
| Total expenses before expense reductions | | | 42,431,891 | |
| Expense reductions | | | (2,631,189 | ) |
| Total expenses after expense reductions | | | 39,800,702 | |
| Net investment income | | | 26,532,657 | |
| Net realized gain (loss) from investments | | | 1,557,847 | |
| Net increase (decrease) in net assets resulting from operations | | $ | 28,090,504 | |
The accompanying notes are an integral part of the financial statements.
Statement of Changes in Net Assets | | | Years Ended December 31, | |
| Increase (Decrease) in Net Assets | | 2011 | | | 2010 | |
Operations: Net investment income | | $ | 26,532,657 | | | $ | 54,765,972 | |
| Net realized gain (loss) | | | 1,557,847 | | | | 1,171,699 | |
| Net increase (decrease) in net assets resulting from operations | | | 28,090,504 | | | | 55,937,671 | |
Capital transactions in shares of beneficial interest: Proceeds from capital invested | | | 230,841,771,646 | | | | 321,400,411,976 | |
| Value of capital withdrawn | | | (244,517,559,931 | ) | | | (329,490,407,575 | ) |
| Net increase (decrease) in net assets from capital transactions in shares of beneficial interest | | | (13,675,788,285 | ) | | | (8,089,995,599 | ) |
| Increase (decrease) in net assets | | | (13,647,697,781 | ) | | | (8,034,057,928 | ) |
| Net assets at beginning of period | | | 34,431,874,456 | | | | 42,465,932,384 | |
| Net assets at end of period | | $ | 20,784,176,675 | | | $ | 34,431,874,456 | |
The accompanying notes are an integral part of the financial statements.
| | | Years Ended December 31, | |
| | | | 2011 | | | 2010 | | | 2009 | | | 2008 | | | 2007 | |
| Ratios to Average Net Assets and Supplemental Data | |
| Net assets, end of period ($ millions) | | | 20,784 | | | | 34,432 | | | | 42,466 | | | | 29,653 | | | | 33,739 | |
| Ratio of expenses before expense reductions (%) | | | .16 | | | | .17 | | | | .16 | | | | .17 | | | | .17 | |
| Ratio of expenses after expense reductions (%) | | | .15 | | | | .16 | | | | .14 | | | | .13 | | | | .14 | |
| Ratio of net investment income (%) | | | .10 | | | | .16 | | | | .43 | | | | 2.85 | | | | 5.14 | |
Total Return (%)a,b | | | .11 | | | | .17 | | | | .48 | | | | 2.81 | | | | 5.31 | |
a Total return would have been lower had certain expenses not been reduced. b Total return for the Portfolio was derived from the performance of Cash Reserves Fund Institutional. | |
Notes to Financial Statements
A. Organization and Significant Accounting Policies
Cash Management Portfolio (the "Portfolio'') is registered under the Investment Company Act of 1940, as amended (the "1940 Act''), as an open-end management investment company organized as a New York business trust.
The Portfolio is a master fund. A master/feeder fund structure is one in which a fund (a "feeder fund"), instead of investing directly in a portfolio of securities, invests most or all of its investment assets in a separate registered investment company (the "master fund") with substantially the same investment objective and policies as the feeder fund. Such a structure permits the pooling of assets of two or more feeder funds, preserving separate identities or distribution channels at the feeder fund level. The Portfolio may have several feeder funds, including affiliated DWS feeder funds, with a significant ownership percentage of the Portfolio's net assets. Investment activities of these feeder funds could have a material impact on the Portfolio. As of December 31, 2011, Cash Management Fund, Cash Reserves Fund Institutional, Cash Reserves Fund — Prime Series and DWS Money Market Series owned approximately 11%, 10%, 5% and 72%, respectively, of the Portfolio.
The Portfolio's financial statements are prepared in accordance with accounting principles generally accepted in the United States of America which require the use of management estimates. Actual results could differ from those estimates. The policies described below are followed consistently by the Portfolio in the preparation of its financial statements.
Security Valuation. Various inputs are used in determining the value of the Portfolio's investments. These inputs are summarized in three broad levels. Level 1 includes quoted prices in active markets for identical securities. Level 2 includes other significant observable inputs (including quoted prices for similar securities, interest rates, prepayment speeds, and credit risk). Level 3 includes significant unobservable inputs (including the Portfolios' own assumptions in determining the fair value of investments). The inputs or methodology used for valuing securities are not necessarily an indication of the risk associated with investing in those securities.
The Portfolio values all securities utilizing the amortized cost method permitted in accordance with Rule 2a-7 under the 1940 Act and certain conditions therein. Under this method, which does not take into account unrealized capital gains or losses on securities, an instrument is initially valued at its cost and thereafter assumes a constant accretion/amortization rate to maturity of any discount or premium. Securities held by the Portfolio are reflected as Level 2 because the securities are valued at amortized cost (which approximates fair value) and, accordingly, the inputs used to determine value are not quoted prices in an active market.
Repurchase Agreements. The Portfolio may enter into repurchase agreements with certain banks and broker/dealers whereby the Portfolio, through its custodian or a sub-custodian bank, receives delivery of the underlying securities, the amount of which at the time of purchase and each subsequent business day is required to be maintained at such a level that the value is equal to at least the principal amount of the repurchase price plus accrued interest. The custodian bank or another designated subcustodian holds the collateral in a separate account until the agreement matures. If the value of the securities falls below the principal amount of the repurchase agreement plus accrued interest, the financial institution deposits additional collateral by the following business day. If the financial institution either fails to deposit the required additional collateral or fails to repurchase the securities as agreed, the Portfolio has the right to sell the securities and recover any resulting loss from the financial institution. If the financial institution enters into bankruptcy, the Portfolio's claims on the collateral may be subject to legal proceedings.
Federal Income Taxes. The Portfolio is considered a Partnership under the Internal Revenue Code, as amended. Therefore, no federal income tax provision is necessary.
It is intended that the Portfolio's assets, income and distributions will be managed in such a way that an investor in the Portfolio will be able to satisfy the requirements of Subchapter M of the Code, assuming that the investor invested all of its assets in the Portfolio.
The Portfolio has reviewed the tax positions for the open tax years as of December 31, 2011 and has determined that no provision for income tax is required in the Portfolio's financial statements. The Portfolio's federal tax returns for the prior three fiscal years remain open subject to examination by the Internal Revenue Service.
Contingencies. In the normal course of business, the Portfolio may enter into contracts with service providers that contain general indemnification clauses. The Portfolio's maximum exposure under these arrangements is unknown as this would involve future claims that may be made against the Portfolio that have not yet been made. However, based on experience, the Portfolio expects the risk of loss to be remote.
Other. Investment transactions are accounted for on trade date. Interest income is recorded on the accrual basis. Distributions of income and capital gains from investment companies are recorded on the ex-dividend date. Realized gains and losses from investment transactions are recorded on an identified cost basis. All discounts and premiums are accreted/amortized for both tax and financial reporting purposes.
The Portfolio makes an allocation of its net investment income and realized gains and losses from securities transactions to its investors in proportion to their investment in the Portfolio.
B. Fees and Transactions with Affiliates
Management Agreement. Under the Investment Management Agreement with Deutsche Investment Management Americas Inc. ("DIMA" or the "Advisor"), an indirect, wholly owned subsidiary of Deutsche Bank AG, the Advisor determines the securities, instruments and other contracts relating to investments to be purchased, sold or entered into by the Portfolio.
Under the Investment Management Agreement, the Portfolio pays the Advisor a monthly management fee based on its average daily net assets, computed and accrued daily and payable monthly, at the following annual rates:
| First $3.0 billion of the Portfolio's average daily net assets | | | .1500 | % |
| Next $4.5 billion of such net assets | | | .1325 | % |
| Over $7.5 billion of such net assets | | | .1200 | % |
For the period from January 1, 2011 through July 26, 2011, the Advisor had voluntarily agreed to waive total operating expenses at 0.16% of its average daily net assets (excluding certain expenses such as extraordinary expenses, taxes, brokerage and interest).
Effective July 27, 2011, the Advisor has voluntarily agreed to waive its fees and/or reimburse certain operating expenses to the extent necessary to maintain the operating expenses (excluding certain expenses such as extraordinary expenses, taxes, brokerage and interest) at 0.14% of the Fund's average daily net assets. The waiver may be changed or terminated at anytime without notice.
For the year ended December 31, 2011, the Advisor waived a portion of its management fee aggregating $2,631,189, and the amount charged aggregated $30,140,549, which was equivalent to an annual effective rate of 0.12% of the Portfolio's average daily net assets.
Administration Fee. Pursuant to an Administrative Services Agreement, DIMA provides most administrative services to the Portfolio. For all services provided under the Administrative Services Agreement, the Portfolio pays the Advisor an annual fee ("Administration Fee") of 0.03% of the Portfolio's average daily net assets, computed and accrued daily and payable monthly. For the year ended December 31, 2011, the Administration Fee was $7,827,308, of which $569,638 is unpaid.
Filing Service Fees. Under an agreement with DIMA, DIMA is compensated for providing certain regulatory filing services to the Portlfolio. For the year ended December 31, 2011, the amount charged to the Portfolio by DIMA included in the Statement of Operations under "reports to shareholders" aggregated $3,074, of which $1,343 is unpaid.
Trustees' Fees and Expenses. The Portfolio paid each Trustee not affiliated with the Advisor retainer fees plus specified amounts for various committee services and for the Board Chairperson.
C. Line of Credit
The Portfolio and other affiliated funds (the "Participants") share in a $450 million revolving credit facility provided by a syndication of banks. The Portfolio may borrow for temporary or emergency purposes, including the meeting of redemption requests that otherwise might require the untimely disposition of securities. The Participants are charged an annual commitment fee which is allocated based on net assets, among each of the Participants. Interest is calculated at a rate per annum equal to the sum of the Federal Funds Rate plus 1.25 percent plus if LIBOR exceeds the Federal Funds Rate the amount of such excess. The Portfolio may borrow up to a maximum of 33 percent of its net assets under the agreement. The Portfolio had no outstanding loans at December 31, 2011.
Report of Independent Registered Public Accounting Firm
To the Trustees and Holders of Beneficial Interest of Cash Management Portfolio:
In our opinion, the accompanying statement of assets and liabilities, including the portfolio of investments, and the related statements of operations and of changes in net assets and the financial highlights presents fairly, in all material respects, the financial position of Cash Management Portfolio (hereafter referred to as the "Portfolio'') at December 31, 2011, and the results of its operations, the changes in its net assets and the financial highlights for each of the periods indicated therein, in conformity with accounting principles generally accepted in the United States of America. These financial statements and financial highlights (hereafter referred to as "financial statements'') are the responsibility of the Portfolio's management. Our responsibility is to express an opinion on these financial statements based on our audits. We conducted our audits of these financial statements in accordance with the standards of the Public Company Accounting Oversight Board (United States). Those standards require that we plan and perform the audits to obtain reasonable assurance about whether the financial statements are free of material misstatement. An audit includes examining, on a test basis, evidence supporting the amounts and disclosures in the financial statements, assessing the accounting principles used and significant estimates made by management, and evaluating the overall financial statement presentation. We believe that our audits, which included confirmation of securities at December 31, 2011 by correspondence with the custodian and brokers, provide a reasonable basis for our opinion.
Boston, Massachusetts February 24, 2012 | PricewaterhouseCoopers LLP |
Investment Management Agreement Approval
Cash Management Fund (the "Fund"), a series of DWS Money Market Trust, invests all of its assets in Cash Management Portfolio (the "Portfolio") in order to achieve its investment objectives. The Portfolio's Board of Trustees approved the renewal of the Portfolio's investment management agreement (the "Portfolio Agreement") with Deutsche Investment Management Americas Inc. ("DWS") and the Fund's Board of Trustees (which consists of the same members as the Board of Trustees of the Portfolio) approved the renewal of the Fund's investment management agreement with DWS (the "Fund Agreement," and together with the Portfolio Agreement, the "Agreements") in September 2011. The Portfolio's Board of Trustees and the Fund's Board of Trustees are collectively referred to as the "Board."
In terms of the process that the Board followed prior to approving the Agreements, shareholders should know that:
· In September 2011, all of the Portfolio's and Fund's Trustees were independent of DWS and its affiliates.
· The Trustees met frequently during the past year to discuss fund matters and dedicated a substantial amount of time to contract review matters. Over the course of several months, the Board's Contract Committee, in coordination with the Board's Fixed Income and Quant Oversight Committee, reviewed comprehensive materials received from DWS, independent third parties and independent counsel. These materials included an analysis of performance, fees and expenses, and profitability compiled by an independent fee consultant. The Board also received extensive information throughout the year regarding performance of the Portfolio and the Fund.
· The Independent Trustees regularly meet privately with their independent counsel to discuss contract review and other matters. In addition, the Independent Trustees were also advised by an independent fee consultant in the course of their review of the Portfolio's and the Fund's contractual arrangements and considered a comprehensive report prepared by the independent fee consultant in connection with their deliberations (the "IFC Report").
· In connection with reviewing the Agreements, the Board also reviewed the terms of the Fund's distribution agreement, administrative services agreement, transfer agency agreement and other material service agreements.
· Based on its evaluation of the information provided, the Contract Committee presented its findings and recommendations to the Board. The Board then reviewed the Contract Committee's findings and recommendations.
In connection with the contract review process, the Contract Committee and the Board considered the factors discussed below, among others. The Board also considered that DWS and its predecessors have managed the Portfolio and the Fund since their inception, and the Board believes that a long-term relationship with a capable, conscientious advisor is in the best interests of the Portfolio and the Fund. The Board considered, generally, that shareholders chose to invest or remain invested in the Fund knowing that DWS managed the Portfolio and the Fund, and that the Fund Agreement was approved by the Fund's shareholders. DWS is part of Deutsche Bank, a major global banking institution that is engaged in a wide range of financial services. The Board believes that there are significant advantages to being part of a global asset management business that offers a wide range of investing expertise and resources, including hundreds of portfolio managers and analysts with research capabilities in many countries throughout the world.
While shareholders may focus primarily on fund performance and fees, the Board considers these and many other factors, including the quality and integrity of DWS's personnel and such other issues as back-office operations, fund valuations, and compliance policies and procedures.
Nature, Quality and Extent of Services. The Board considered the terms of the Agreements, including the scope of advisory services provided under the Agreements. The Board noted that, under the Agreements, DWS provides portfolio management services to the Portfolio and the Fund and that, pursuant to separate administrative services agreements, DWS provides administrative services to the Portfolio and the Fund. The Board considered the experience and skills of senior management and investment personnel, the resources made available to such personnel, the ability of DWS to attract and retain high-quality personnel, and the organizational depth and stability of DWS. The Board reviewed the Portfolio's and the Fund's performance over short-term and long-term periods and compared those returns to various agreed-upon performance measures, including market indices and a peer universe compiled by the independent fee consultant using information supplied by iMoneyNet Inc. ("iMoneyNet"). The Board also noted that it has put into place a process of identifying "Focus Funds" (e.g., funds performing poorly relative to their benchmark or a peer universe compiled by an independent fund data service), and receives more frequent reporting and information from DWS regarding such funds, along with DWS's remedial plans to address underperformance. The Board believes this process is an effective manner of identifying and addressing underperforming funds. Based on the information provided, the Board noted that for the one- and three-year periods ended December 31, 2010, the Fund's gross performance (Institutional Shares) was in the 3rd quartile of the applicable iMoneyNet universe (the 1st quartile being the best performers and the 4th quartile being the worst performers).
On the basis of this evaluation and the ongoing review of investment results by the Board, the Board concluded that the nature, quality and extent of services provided by DWS historically have been and continue to be satisfactory.
Fees and Expenses. The Board considered the Portfolio's and the Fund's investment management fee schedules and the Fund's operating expenses and total expense ratios, and comparative information provided by Lipper Inc. ("Lipper") and the independent fee consultant regarding investment management fee rates paid to other investment advisors by similar funds (1st quartile being the most favorable and 4th quartile being the least favorable). With respect to management fees paid to other investment advisors by similar funds, the Board noted that the contractual fee rates paid by the Portfolio and the Fund, which include 0.03% and 0.10% fees paid to DWS under the respective administrative services agreements, were lower than the median (2nd quartile) of the applicable Lipper peer group (based on Lipper data provided as of December 31, 2010). The Board noted that, although shareholders of the Fund indirectly bear the Portfolio's management fee, the Fund does not charge an additional investment management fee. The Board noted that the Fund's total (net) operating expenses, which include Portfolio expenses allocated to the Fund, were expected to be higher than the median of the applicable Lipper expense universe for Institutional Shares (3rd quartile) (based on Lipper data provided as of December 31, 2010). The Board considered the Portfolio's management fee rate as compared to fees charged by DWS and certain of its affiliates for comparable mutual funds and considered differences in fund and fee structures between the DWS Funds. The Board also considered how the Fund's total (net) operating expenses compared to the total (net) operating expenses of a more customized peer group selected by Lipper (based on such factors as asset size). The Board also noted that the expense limitation agreed to by DWS helped to ensure that the Fund's and the Portfolio's combined total (net) operating expenses would remain competitive.
The information considered by the Board as part of its review of management fees included information regarding fees charged by DWS and its affiliates to similar institutional accounts and to similar funds offered primarily to European investors ("DWS Europe funds"), in each case as applicable. The Board observed that advisory fee rates for institutional accounts generally were lower than the management fees charged by similarly managed DWS U.S. mutual funds ("DWS Funds"), but also took note of the differences in services provided to DWS Funds as compared to institutional accounts. In the case of DWS Europe funds, the Board observed that fee rates for DWS Europe funds generally were higher than for similarly managed DWS Funds, but noted that differences in the types of services provided to DWS Funds relative to DWS Europe funds made it difficult to compare such fees.
On the basis of the information provided, the Board concluded that management fees were reasonable and appropriate in light of the nature, quality and extent of services provided by DWS.
Profitability. The Board reviewed detailed information regarding revenues received by DWS under the Agreements. The Board considered the estimated costs and pre-tax profits realized by DWS from advising the DWS Funds, as well as estimates of the pre-tax profits attributable to managing the Fund in particular. The Board also received information regarding the estimated enterprise-wide profitability of DWS and its affiliates with respect to all fund services in totality and by fund. The Board and the independent fee consultant reviewed DWS's methodology in allocating its costs to the management of the Fund. Based on the information provided, the Board concluded that the pre-tax profits realized by DWS in connection with the management of the Fund were not unreasonable. The Board also reviewed information regarding the profitability of certain similar investment management firms. The Board noted that while information regarding the profitability of such firms is limited (and in some cases is not necessarily prepared on a comparable basis), DWS and its affiliates' overall profitability with respect to the DWS fund complex (after taking into account distribution and other services provided to the funds by DWS and its affiliates) was lower than the overall profitability levels of many comparable firms for which such data was available.
Economies of Scale. The Board considered whether there are economies of scale with respect to the management of the Portfolio and the Fund and whether the Portfolio and the Fund benefit from any economies of scale. The Board noted that the Portfolio's management fee schedule includes fee breakpoints. The Board concluded that the Portfolio's and the Fund's fee schedules represent an appropriate sharing between the Portfolio and the Fund, as the case may be, and DWS of such economies of scale as may exist in the management of the Portfolio and the Fund at current asset levels.
Other Benefits to DWS and Its Affiliates. The Board also considered the character and amount of other incidental benefits received by DWS and its affiliates, including any fees received by DWS for administrative services provided to the Portfolio and the Fund and any fees received by an affiliate of DWS for distribution services. The Board also considered benefits to DWS related to brokerage and soft-dollar allocations, including allocating brokerage to pay for research generated by parties other than the executing broker dealers, which pertain primarily to funds investing in equity securities, along with the incidental public relations benefits to DWS related to DWS Funds advertising and cross-selling opportunities among DWS products and services. The Board concluded that management fees were reasonable in light of these fallout benefits.
Compliance. The Board considered the significant attention and resources dedicated by DWS to documenting and enhancing its compliance processes in recent years. The Board noted in particular (i) the experience and seniority of both DWS's chief compliance officer and the Fund's chief compliance officer; (ii) the large number of DWS compliance personnel; and (iii) the substantial commitment of resources by DWS and its affiliates to compliance matters.
Based on all of the information considered and the conclusions reached, the Board unanimously determined that the continuation of the Agreements is in the best interests of the Portfolio and the Fund. In making this determination, the Board did not give particular weight to any single factor identified above. The Board considered these factors over the course of numerous meetings, certain of which were in executive session with only the Independent Trustees and their counsel present. It is possible that individual Trustees may have weighed these factors differently in reaching their individual decisions to approve the continuation of the Agreements.
Summary of Management Fee Evaluation by Independent Fee Consultant
September 26, 2011
Pursuant to an Order entered into by Deutsche Investment Management Americas and affiliates (collectively, "DeAM") with the Attorney General of New York, I, Thomas H. Mack, have been appointed the Independent Fee Consultant for the DWS Funds (formerly the DWS Scudder Funds). My duties include preparing an annual written evaluation of the management fees DeAM charges the Funds, considering among other factors the management fees charged by other mutual fund companies for like services, management fees DeAM charges other clients for like services, DeAM's costs of supplying services under the management agreements and related profit margins, possible economies of scale if a Fund grows larger, and the nature and quality of DeAM's services, including fund performance. This report summarizes my evaluation for 2011, including my qualifications, the evaluation process for each of the DWS Funds, consideration of certain complex-level factors, and my conclusions. I served in substantially the same capacity in 2007, 2008, 2009 and 2010.
Qualifications
For more than 35 years I have served in various professional capacities within the investment management business. I have held investment analysis and advisory positions, including securities analyst, portfolio strategist and director of investment policy with a large investment firm. I have also performed business management functions, including business development, financial management and marketing research and analysis.
Since 1991, I have been an independent consultant within the asset management industry. I have provided services to over 125 client organizations, including investment managers, mutual fund boards, product distributors and related organizations. Over the past ten years I have completed a number of assignments for mutual fund boards, specifically including assisting boards with management contract renewal.
I hold a Master of Business Administration degree, with highest honors, from Harvard University and Master of Science and Bachelor of Science (highest honors) degrees from the University of California at Berkeley. I am an independent director and audit committee financial expert for two closed-end mutual funds and have served in various leadership and financial oversight capacities with non-profit organizations.
Evaluation of Fees for each DWS Fund
My work focused primarily on evaluating, fund-by-fund, the fees charged to each of the 109 mutual fund portfolios in the DWS Fund family. For each Fund, I considered each of the key factors mentioned above, as well as any other relevant information. In doing so I worked closely with the Funds' Independent Directors in their annual contract renewal process, as well as in their approval of contracts for several new funds (documented separately).
In evaluating each Fund's fees, I reviewed comprehensive materials provided by or on behalf of DeAM, including expense information prepared by Lipper Analytical, comparative performance information, profitability data, manager histories, and other materials. I also accessed certain additional information from the Lipper and Morningstar databases and drew on my industry knowledge and experience.
To facilitate evaluating this considerable body of information, I prepared for each Fund a document summarizing the key data elements in each area as well as additional analytics discussed below. This made it possible to consider each key data element in the context of the others.
In the course of contract renewal, DeAM agreed to implement a number of fee and expense adjustments requested by the Independent Directors which will favorably impact future fees and expenses, and my evaluation includes the effects of these changes.
Fees and Expenses Compared with Other Funds
The competitive fee and expense evaluation for each fund focused on two primary comparisons:
The Fund's contractual management fee (the advisory fee plus the administration fee where applicable) compared with those of a group of typically 12-15 funds in the same Lipper investment category (e.g. Large Capitalization Growth) having similar distribution arrangements and being of similar size.
The Fund's total expenses compared with a broader universe of funds from the same Lipper investment category and having similar distribution arrangements.
These two comparisons provide a view of not only the level of the fee compared with funds of similar scale but also the total expense the Fund bears for all the services it receives, in comparison with the investment choices available in the Fund's investment category and distribution channel. The principal figure-of-merit used in these comparisons was the subject Fund's percentile ranking against peers.
DeAM's Fees for Similar Services to Others
DeAM provided management fee schedules for all of its US domiciled fund and non-fund investment management accounts in any of the investment categories where there is a DWS Fund. These similar products included the other DWS Funds, non-fund pooled accounts, institutional accounts and sub-advisory accounts. Using this information, I calculated for each Fund the fee that would be charged to each similar product, at the subject Fund's asset level.
Evaluating information regarding non-fund products is difficult because there are varying levels of services required for different types of accounts, with mutual funds generally requiring considerably more regulatory and administrative types of service as well as having more frequent cash flows than other types of accounts. Also, while mutual fund fees for similar fund products can be expected to be similar, there will be some differences due to different pricing conditions in different distribution channels (e.g. retail funds versus those used in variable insurance products), differences in underlying investment processes and other factors.
Costs and Profit Margins
DeAM provided a detailed profitability analysis for each Fund. After making some adjustments so that the presentation would be more comparable to the available industry figures, I reviewed profit margins from investment management alone, from investment management plus other fund services (excluding distribution) provided to the Funds by DeAM (principally shareholder services), and DeAM profits from all sources, including distribution. A later section comments on overall profitability.
Economies of Scale
Economies of scale — an expected decline in management cost per dollar of fund assets as fund assets grow — are very rarely quantified and documented because of inherent difficulties in collecting and analyzing relevant data. However, in virtually every investment category that I reviewed, larger funds tend to have lower fees and lower total expenses than smaller funds. To see how each DWS Fund compares with this industry observation, I reviewed:
The trend in Fund assets over the last five years and the accompanying trend in total expenses. This shows if the Fund has grown and, if so, whether total expense (management fees as well as other expenses) have declined as a percent of assets.
Whether the Fund has break-points in its management fee schedule, the extent of the fee reduction built into the schedule and the asset levels where the breaks take effect, and in the case of a sub-advised Fund how the Fund's break-points compare with those of the sub-advisory fee schedule.
How the Fund's contractual fee schedule compares with trends in the industry data. To accomplish this, I constructed a chart showing how actual latest-fiscal-year contractual fees of the Fund and of other similar funds relate to average fund assets, with the subject Fund's contractual fee schedule superimposed.
Quality of Service — Performance
The quality-of-service evaluation focused on investment performance, which is the principal result of the investment management service. Each Fund's performance was reviewed over the past 1, 3, 5 and 10 years, as applicable, and compared with that of other funds in the same investment category and with a suitable market index.
In addition, I calculated and reviewed risk-adjusted returns relative to an index of similar mutual funds' returns and a suitable market index. The risk-adjusted returns analysis provides a way of determining the extent to which the Fund's return comparisons are mainly the product of investment value-added (or lack thereof) or alternatively taking considerably more or less risk than is typical in its investment category.
I also received and considered the history of portfolio manager changes for each Fund, as this provided an important context for evaluating the performance results.
Complex-Level Considerations
While this evaluation was conducted mainly at the individual fund level, there are some issues relating to the reasonableness of fees that can alternatively be considered across the whole fund complex:
I reviewed DeAM's profitability analysis for all DWS Funds, with a view toward determining if the allocation procedures used were reasonable and how profit levels compared with public data for other investment managers.
I considered whether DeAM and affiliates receive any significant ancillary or "fall-out" benefits that should be considered in interpreting the direct profitability results. These would be situations where serving as the investment manager of the Funds is beneficial to another part of the Deutsche Bank organization.
I considered how aggregated DWS Fund expenses had varied over the years, by asset class and in the context of trends in asset levels.
I reviewed the structure of the DeAM organization, trends in staffing levels, and information on compensation of investment management and other professionals compared with industry data.
Findings
Based on the process and analysis discussed above, which included reviewing a wide range of information from management and external data sources and considering among other factors the fees DeAM charges other clients, the fees charged by other fund managers, DeAM's costs and profits associated with managing the Funds, economies of scale, possible fall-out benefits, and the nature and quality of services provided, in my opinion the management fees charged the DWS Funds are reasonable.
Thomas H. Mack
President, Thomas H. Mack & Co., Inc.
Board Members and Officers
The following table presents certain information regarding the Board Members and Officers of the Trusts of Cash Management Fund and Cash Management Portfolio as of December 31, 2011. Each Board Member's year of birth is set forth in parentheses after his or her name. Unless otherwise noted, (i) each Board Member has engaged in the principal occupation(s) noted in the table for at least the most recent five years, although not necessarily in the same capacity; and (ii) the address of each Independent Board Member is c/o Paul K. Freeman, Independent Chairman, DWS Funds, PO Box 101833, Denver, CO 80250-1833. Except as otherwise noted below, the term of office for each Board Member is until the election and qualification of a successor, or until such Board Member sooner dies, resigns, is removed or as otherwise provided in the governing documents of the fund. Because the fund does not hold an annual meeting of shareholders, each Board Member will hold office for an indeterminate period. The Board Members may also serve in similar capacities with other funds in the fund complex. The Length of Time Served represents the year in which the Board Member joined the Board of one or more DWS funds now overseen by the Board.
| Independent Board Members |
Name, Year of Birth, Position with the Fund and Length of Time Served1 | Business Experience and Directorships During the Past Five Years | Number of Funds in DWS Fund Complex Overseen |
Other Directorships Held by Board Member |
Paul K. Freeman (1950) Chairperson since 2009 Board Member since 1993 | Consultant, World Bank/Inter-American Development Bank; Executive and Governing Council of the Independent Directors Council (Chairman of Education Committee); formerly: Project Leader, International Institute for Applied Systems Analysis (1998-2001); Chief Executive Officer, The Eric Group, Inc. (environmental insurance) (1986-1998) | 110 | — |
John W. Ballantine (1946) Board Member since 1999 | Retired; formerly, Executive Vice President and Chief Risk Management Officer, First Chicago NBD Corporation/The First National Bank of Chicago (1996-1998); Executive Vice President and Head of International Banking (1995-1996). Directorships: Chairman of the Board, Healthways, Inc. (provider of disease and care management services); Portland General Electric (utility company); Stockwell Capital Investments PLC (private equity); former Directorships: First Oak Brook Bancshares, Inc. and Oak Brook Bank; Prisma Energy International | 110 | — |
Henry P. Becton, Jr. (1943) Board Member since 1990 | Vice Chair and former President, WGBH Educational Foundation. Directorships: Association of Public Television Stations; Public Radio International; Public Radio Exchange (PRX); The PBS Foundation; former Directorships: Boston Museum of Science; American Public Television; Concord Academy; New England Aquarium; Mass. Corporation for Educational Telecommunications; Committee for Economic Development; Public Broadcasting Service | 110 | Lead Director, Becton Dickinson and Company2 (medical technology company); Lead Director, Belo Corporation2 (media company) |
Dawn-Marie Driscoll (1946) Board Member since 1987 | President, Driscoll Associates (consulting firm); Executive Fellow, Center for Business Ethics, Bentley University; formerly, Partner, Palmer & Dodge (1988-1990); Vice President of Corporate Affairs and General Counsel, Filene's (1978-1988). Directorships: Director of ICI Mutual Insurance Company (since 2007); Advisory Board, Center for Business Ethics, Bentley University; Trustee, Southwest Florida Community Foundation (charitable organization); former Directorships: Investment Company Institute (audit, executive, nominating committees) and Independent Directors Council (governance, executive committees) | 110 | Trustee, Sun Capital Advisers, Inc. (22 open-end mutual funds advised by Sun Capital Advisers, Inc.) (since 2007) |
Keith R. Fox, CFA (1954) Board Member since 1996 | Managing General Partner, Exeter Capital Partners (a series of private investment funds) (since 1986). Directorships: Progressive International Corporation (kitchen goods importer and distributor); BoxTop Media Inc. (advertising); The Kennel Shop (retailer); former Chairman, National Association of Small Business Investment Companies | 110 | Trustee, Sun Capital Advisers, Inc. (22 open-end mutual funds advised by Sun Capital Advisers, Inc.) (since 2011) |
Kenneth C. Froewiss (1945) Board Member since 2001 | Adjunct Professor of Finance, NYU Stern School of Business (September 2009-present; Clinical Professor from 1997-September 2009); Member, Finance Committee, Association for Asian Studies (2002-present); Director, Mitsui Sumitomo Insurance Group (US) (2004-present); prior thereto, Managing Director, J.P. Morgan (investment banking firm) (until 1996) | 110 | — |
Richard J. Herring (1946) Board Member since 1990 | Jacob Safra Professor of International Banking and Professor, Finance Department, The Wharton School, University of Pennsylvania (since July 1972); Co-Director, Wharton Financial Institutions Center (since July 2000); Co-Chair, U.S. Shadow Financial Regulatory Committee; Executive Director, Financial Economists Roundtable; formerly: Vice Dean and Director, Wharton Undergraduate Division (July 1995-June 2000); Director, Lauder Institute of International Management Studies (July 2000-June 2006) | 110 | Director, Japan Equity Fund, Inc. (since September 2007), Thai Capital Fund, Inc. (since September 2007), Singapore Fund, Inc. (since September 2007), Independent Director of Barclays Bank Delaware (since September 2010) |
William McClayton (1944) Board Member since 2004 | Private equity investor (since October 2009); previously, Managing Director, Diamond Management & Technology Consultants, Inc. (global consulting firm) (2001-2009); Directorship: Board of Managers, YMCA of Metropolitan Chicago; formerly: Senior Partner, Arthur Andersen LLP (accounting) (1966-2001); Trustee, Ravinia Festival | 110 | — |
Rebecca W. Rimel (1951) Board Member since 1995 | President and Chief Executive Officer, The Pew Charitable Trusts (charitable organization) (1994 to present); Trustee, Washington College (2011 to present); formerly: Executive Vice President, The Glenmede Trust Company (investment trust and wealth management) (1983-2004); Board Member, Investor Education (charitable organization) (2004-2005); Trustee, Executive Committee, Philadelphia Chamber of Commerce (2001-2007); Trustee, Pro Publica (charitable organization) (2007-2010); Trustee, Thomas Jefferson Foundation (charitable organization) (1994 to 2011) | 110 | Director, CardioNet, Inc.2 (health care) (2009- present); Director, Viasys Health Care2 (January 2007- June 2007) |
William N. Searcy, Jr. (1946) Board Member since 1993 | Private investor since October 2003; formerly: Pension & Savings Trust Officer, Sprint Corporation2 (telecommunications) (November 1989-September 2003) | 110 | Trustee, Sun Capital Advisers, Inc. (22 open-end mutual funds advised by Sun Capital Advisers, Inc.) (since 1998) |
Jean Gleason Stromberg (1943) Board Member since 1997 | Retired. Formerly, Consultant (1997-2001); Director, Financial Markets US Government Accountability Office (1996-1997); Partner, Fulbright & Jaworski, L.L.P. (law firm) (1978-1996). Directorships: The William and Flora Hewlett Foundation; former Directorships: Service Source, Inc., Mutual Fund Directors Forum (2002-2004), American Bar Retirement Association (funding vehicle for retirement plans) (1987-1990 and 1994-1996) | 110 | — |
Robert H. Wadsworth (1940) Board Member since 1999 | President, Robert H. Wadsworth & Associates, Inc. (consulting firm) (1983 to present); Director, The Phoenix Boys Choir Association | 113 | — |
Officers4 |
Name, Year of Birth, Position with the Fund and Length of Time Served5 | Principal Occupation(s) During Past 5 Years and Other Directorships Held |
W. Douglas Beck, CFA6 (1967) President, 2011-present | Managing Director3, Deutsche Asset Management (2006-present); President of DWS family of funds and Head of Product Management, U.S. for DWS Investments; formerly, Executive Director, Head of Product Management (2002-2006) and President (2005-2006) of the UBS Funds at UBS Global Asset Management; Co-Head of Manager Research/Managed Solutions Group, Merrill Lynch (1998-2002) |
John Millette7 (1962) Vice President and Secretary, 1999-present | Director3, Deutsche Asset Management |
Paul H. Schubert6 (1963) Chief Financial Officer, 2004-present Treasurer, 2005-present | Managing Director3, Deutsche Asset Management (since July 2004); formerly, Executive Director, Head of Mutual Fund Services and Treasurer for UBS Family of Funds (1998-2004); Vice President and Director of Mutual Fund Finance at UBS Global Asset Management (1994-1998) |
Caroline Pearson7 (1962) Chief Legal Officer, 2010-present | Managing Director3, Deutsche Asset Management; formerly, Assistant Secretary for DWS family of funds (1997-2010) |
Rita Rubin6 (1970) Assistant Secretary, 2009-present | Director3 and Senior Counsel, Deutsche Asset Management (since October 2007); formerly, Vice President, Morgan Stanley Investment Management (2004-2007) |
Paul Antosca7 (1957) Assistant Treasurer, 2007-present | Director3, Deutsche Asset Management (since 2006); Vice President, The Manufacturers Life Insurance Company (U.S.A.) (1990-2006) |
Jack Clark7 (1967) Assistant Treasurer, 2007-present | Director3, Deutsche Asset Management (since 2007); formerly, Vice President, State Street Corporation (2002-2007) |
Diane Kenneally7 (1966) Assistant Treasurer, 2007-present | Director3, Deutsche Asset Management |
John Caruso6 (1965) Anti-Money Laundering Compliance Officer, 2010-present | Managing Director3, Deutsche Asset Management |
Robert Kloby6 (1962) Chief Compliance Officer, 2006-present | Managing Director3, Deutsche Asset Management |
1 The length of time served represents the year in which the Board Member joined the board of one or more DWS funds currently overseen by the Board.
2 A publicly held company with securities registered pursuant to Section 12 of the Securities Exchange Act of 1934.
3 Executive title, not a board directorship.
4 As a result of their respective positions held with the Advisor, these individuals are considered "interested persons" of the Advisor within the meaning of the 1940 Act. Interested persons receive no compensation from the fund.
5 The length of time served represents the year in which the officer was first elected in such capacity for one or more DWS funds.
6 Address: 60 Wall Street, New York, NY 10005.
7 Address: One Beacon Street, Boston, MA 02108.
The fund's Statement of Additional Information ("SAI") includes additional information about the Board Members. The SAI is available, without charge, upon request. If you would like to request a copy of the SAI, you may do so by calling the following toll-free number: (800) 621-1048.
Account Management Resources | |
| Automated Information Line | | Institutional Investor Services (800) 730-1313 Personalized account information, information on other DeAM funds and services via touchtone telephone and the ability to exchange or redeem shares. |
| Web Site | | www.dbadvisorsliquidity.com/US View your account transactions and balances, trade shares, monitor your asset allocation, and change your address, 24 hours a day. Obtain prospectuses and applications, blank forms, interactive worksheets, news about the funds, subscription to fund updates by e-mail, retirement planning information, and more. |
| For More Information | | (800) 730-1313, option 1 To speak with a fund service representative. |
| Written Correspondence | | Deutsche Asset Management PO Box 219210 Kansas City, MO 64121-9210 |
| Proxy Voting | | The fund's policies and procedures for voting proxies for portfolio securities and information about how the fund voted proxies related to its portfolio securities during the 12-month period ended June 30 are available on our Web site — www.dws-investments.com (click on "proxy voting"at the bottom of the page) — or on the SEC's Web site — www.sec.gov. To obtain a written copy of the fund's policies and procedures without charge, upon request, call us toll free at (800) 621-1048. |
| Portfolio Holdings | | Following the fund's fiscal first and third quarter-end, a complete portfolio holdings listing is filed with the SEC on Form N-Q. In addition, each month, information about the fund and its portfolio holdings is filed with the SEC on Form N-MFP. The SEC delays the public availability of the information filed on Form N-MFP for 60 days after the end of the reporting period included in the filing. These forms will be available on the SEC's Web site at www.sec.gov, and they may also be reviewed and copied at the SEC's Public Reference Room in Washington, D.C. Information on the operation of the SEC's Public Reference Room may be obtained by calling (800) SEC-0330. The fund's portfolio holdings are also posted on www.dws-investments.com from time to time. Please see the fund's current prospectus for more information. |
| Principal Underwriter | | If you have questions, comments or complaints, contact: DWS Investments Distributors, Inc. 222 South Riverside Plaza Chicago, IL 60606-5808 (800) 621-1148 |
| Investment Management | | Deutsche Investment Management Americas Inc. ("DIMA" or the "Advisor"), which is part of Deutsche Asset Management, is the investment advisor for the fund. DIMA and its predecessors have more than 80 years of experience managing mutual funds and DIMA provides a full range of investment advisory services to both institutional and retail clients. DIMA is an indirect, wholly owned subsidiary of Deutsche Bank AG. Deutsche Bank AG is a major global banking institution engaged in a wide variety of financial services, including investment management, retail, private and commercial banking, investment banking and insurance. DWS Investments is the retail brand name in the U.S. for the asset management activities of Deutsche Bank AG and DIMA. As such, DWS is committed to delivering the investing expertise, insight and resources of this global investment platform to American investors. |
| Nasdaq Symbol | | BICXX |
| CUSIP Number | | 23337T 110 |
| Fund Number | | 541 |
Notes
Notes
Notes

ANNUAL REPORT TO SHAREHOLDERS
Cash Reserve Fund
Prime Series
December 31, 2011
Contents
Cash Reserve Fund — Prime Series 3 Portfolio Management Review 7 Statement of Assets and Liabilities 8 Statement of Operations 9 Statement of Changes in Net Assets 13 Notes to Financial Statements 18 Report of Independent Registered Public Accounting Firm 19 Information About Your Fund's Expenses Cash Management Portfolio 39 Statement of Assets and Liabilities 40 Statement of Operations 41 Statement of Changes in Net Assets 43 Notes to Financial Statements 47 Report of Independent Registered Public Accounting Firm 49 Investment Management Agreement Approval 54 Summary of Management Fee Evaluation by Independent Fee Consultant 58 Board Members and Officers |
This report must be preceded or accompanied by a prospectus. To obtain a summary prospectus, if available, or prospectus for any of our funds, visit www.dws-investments.com. We advise you to consider the fund's objectives, risks, charges and expenses carefully before investing. The summary prospectus and prospectus contain this and other important information about the fund. Please read the prospectus carefully before you invest.
An investment in this fund is not insured or guaranteed by the Federal Deposit Insurance Corporation (FDIC) or by any other government agency. Although the fund seeks to preserve the value of your investment at $1.00 per share, it is possible to lose money by investing in the fund. The share price of money market funds can fall below the $1.00 share price. You should not rely on or expect the Advisor to enter into support agreements or take other actions to maintain the fund's $1.00 share price. The credit quality of the fund's holdings can change rapidly in certain markets, and the default of a single holding could have an adverse impact on the fund's share price. The fund's share price can also be negatively affected during periods of high redemption pressures and/or illiquid markets. The actions of a few large investors in one class of shares of the fund may have a significant adverse effect on the share prices of all classes of shares of the fund. See the prospectus for specific details regarding the fund's risk profile.
DWS Investments is part of Deutsche Bank's Asset Management division and, within the U.S., represents the retail asset management activities of Deutsche Bank AG, Deutsche Bank Trust Company Americas, Deutsche Investment Management Americas Inc. and DWS Trust Company.
NOT FDIC/NCUA INSURED NO BANK GUARANTEE MAY LOSE VALUE NOT A DEPOSIT NOT INSURED BY ANY FEDERAL GOVERNMENT AGENCY
Portfolio Management Review
Market Overview
All performance information below is historical and does not guarantee future results. Investment return and principal fluctuate, so your shares may be worth more or less when redeemed. Current performance may differ from performance data shown. Please visit www.dbadvisorsliquidity.com/US for the fund's most recent month-end performance. The 7-day current yield refers to the income paid by the fund over a 7-day period expressed as an annual percentage rate of the fund's shares outstanding. Yields fluctuate and are not guaranteed.
Over the fund's most recent 12-month period ended December 31, 2011, money markets were responding to alternating degrees of perceived risk in the global financial markets, with short-term rates rising or falling slightly in response to the current state of the European sovereign debt crisis. During the summer, the political standoff in the United States related to the raising of the U.S. debt ceiling spurred volatility in financial markets. The extreme difficulties that Congress encountered in coming to agreement regarding the debt ceiling made up a large part of the rationale cited by Standard & Poor's® in deciding to downgrade U.S. debt from AAA to AA+ on August 5, 2011. However, the United States' role as a perceived "safe haven" for fixed-income investors worldwide has thus far remained unchanged. In addition, credit downgrades of various domestic and international banks and "credit watches" instituted by ratings agencies on some European countries exerted pressure on the money markets. Encouragingly, the European Central Bank (ECB) has made some extraordinary efforts over the past several months to head off additional problems for European governments and banks by securing funding access for the major banks in Europe.

Positive Contributors to Fund Performance
We were able to maintain a competitive yield for the fund during the period.
Over the period, we continued to hold a large percentage of portfolio assets in short-maturity instruments for liquidity purposes as well as for high quality and yield. We also maintained a higher than average maturity, with fund assets broadly diversified among a number of different sectors, including banks, corporate issues, U.S. government securities and municipal debt, though diversification neither assures a profit nor guarantees against loss. In addition, we focused on more favorable geographical areas for money market investment, such as Canada, Australia and the Nordic region. Lastly, given market uncertainty and our desire to maintain larger cash positions in the fund, we found value in municipal Variable Rate Demand Notes compared with taxable alternatives of the same maturity, such as bank Certificates of Deposit.
Fund Performance (as of December 31, 2011)
Performance is historical and does not guarantee future results. Current performance may be lower or higher than the performance data quoted.
An investment in this fund is not insured or guaranteed by the FDIC or by any other government agency. Although the fund seeks to preserve the value of your investment at $1.00 per share, it is possible to lose money by investing in the fund. The share price of money market funds can fall below the $1.00 share price.
| 7-Day Current Yield — Prime Shares | |
| December 31, 2011 | .01%* |
| December 31, 2010 | .01%* |
| 7-Day Current Yield — Prime Institutional Shares | |
| December 31, 2011 | .01%* |
| December 31, 2010 | .05% |
| * The investment advisor has agreed to waive fees/reimburse expenses. Without such fee waivers/expense reimbursements, the 7-day current yield would have been lower. |
Yields are historical, will fluctuate and do not guarantee future performance. The 7-day current yield refers to the income paid by the portfolio over a 7-day period expressed as an annual percentage rate of the fund's shares outstanding. Please visit our Web site at www.dbadvisorsliquidity.com/US for the product's most recent month-end performance.
Negative Contributors to Fund Performance
The types of securities that we were investing in during the period ended December 31, 2011, tended to have shorter maturities and lower yields than issues carrying more risk. We preferred to be cautious during a time of market fluctuation. In the end this cost the fund some yield, but we believe that this represented a prudent approach to preserving principal.
| "Encouragingly, the European Central Bank (ECB) has made some extraordinary efforts over the past several months to head off additional problems for European governments and banks by securing funding access for the major banks in Europe." |
Outlook and Positioning
Positive news for U.S. markets has come recently in the form of improved economic reports, including a pickup in manufacturing activity and some declines in domestic unemployment. The U.S. Federal Reserve Board (the Fed) has been doing its part by continuing its accommodative monetary policy and hinting at additional transparency for financial market participants in the near term. The main headwind to improved economic and financial market prospects comes from uncertainty over the European sovereign debt crisis. With several European countries facing austerity measures, we tend to believe that Europe is on the precipice of a recession. Market participants are urgently wishing for concrete and permanent solutions to the European crisis in the hopes that such a result would encourage further global economic progress and reduce financial market uncertainty.
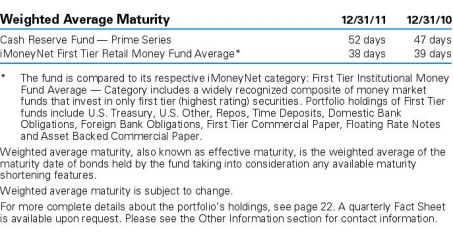
We continue our insistence on the highest credit quality within the fund. We also continue to apply a careful approach to investing on behalf of the fund and to seek competitive yield for our shareholders.
Portfolio Management Team
A group of investment professionals is responsible for the day-to-day management of the fund. These investment professionals have a broad range of experience managing money market funds.
The views expressed reflect those of the portfolio management team only through the end of the period of the report as stated on the cover. The management team's views are subject to change at any time based on market and other conditions and should not be construed as a recommendation. Past performance is no guarantee of future results. Current and future portfolio holdings are subject to risk.
Terms to Know
Municipal debt is state and local government bonds issued to finance capital expenditures.
Credit quality measures a bond issuer's ability to repay interest and principal in a timely manner. Rating agencies assign letter designations, such as AAA, AA and so forth. The lower the rating, the higher the probability of default. Credit quality does not remove market risk and is subject to change.
Statement of Assets and Liabilities | as of December 31, 2011 | |
| Assets | |
| Investment in Cash Management Portfolio, at value | | $ | 1,133,772,054 | |
| Receivable for Fund shares sold | | | 18,546 | |
| Due from Advisor | | | 105,031 | |
| Other assets | | | 38,337 | |
| Total assets | | | 1,133,933,968 | |
| Liabilities | |
| Distributions payable | | | 6,384 | |
| Other accrued expenses and payables | | | 209,812 | |
| Total liabilities | | | 216,196 | |
| Net assets, at value | | $ | 1,133,717,772 | |
| Net Assets Consist of | |
| Accumulated net realized gain (loss) | | | 63,140 | |
| Paid-in capital | | | 1,133,654,632 | |
| Net assets, at value | | $ | 1,133,717,772 | |
| Net Asset Value | |
Prime Shares Net Asset Value, offering and redemption price per share ($619,742,199 ÷ 619,849,068 outstanding shares of beneficial interest, $.001 par value, 9,000,000,000 shares authorized) | | $ | 1.00 | |
Prime Institutional Shares Net Asset Value, offering and redemption price per share ($513,971,573 ÷ 514,029,894 outstanding shares of beneficial interest, $.001 par value, 3,200,000,000 shares authorized) | | $ | 1.00 | |
Managed Shares Net Asset Value, offering and redemption price per share ($4,000 ÷ 4,002 outstanding shares of beneficial interest, $.001 par value, 200,000,000 shares authorized) | | $ | 1.00 | |
The accompanying notes are an integral part of the financial statements.
| for the year ended December 31, 2011 | |
| Investment Income | | | |
Income and expenses allocated from Cash Management Portfolio: Interest | | $ | 2,900,465 | |
| Expenses* | | | (1,743,261 | ) |
| Net investment income allocated from Cash Management Portfolio | | | 1,157,204 | |
Expenses: Administration fee | | | 1,146,983 | |
| Services to shareholders | | | 695,054 | |
| Distribution and service fees | | | 2,216,817 | |
| Professional fees | | | 30,927 | |
| Reports to shareholders | | | 92,659 | |
| Registration fees | | | 83,150 | |
| Directors' fees and expenses | | | 3,393 | |
| Other | | | 53,185 | |
| Total expenses before expense reductions | | | 4,322,168 | |
| Expense reductions | | | (3,302,745 | ) |
| Total expenses after expense reductions | | | 1,019,423 | |
| Net investment income (loss) | | | 137,781 | |
| Net realized gain (loss) allocated from Cash Management Portfolio | | | 65,564 | |
| Net increase (decrease) in net assets resulting from operations | | $ | 203,345 | |
* Net of $115,673 Advisor reimbursement allocated from Cash Management Portfolio for the year ended December 31, 2011.
The accompanying notes are an integral part of the financial statements.
Statement of Changes in Net Assets | | | Years Ended December 31, | |
| Increase (Decrease) in Net Assets | | 2011 | | | 2010 | |
Operations: Net investment income | | $ | 137,781 | | | $ | 315,191 | |
| Net realized gain (loss) | | | 65,564 | | | | 1,098,135 | |
| Net increase (decrease) in net assets resulting from operations | | | 203,345 | | | | 1,413,326 | |
Distributions to shareholders from: Net investment income: Prime Shares | | | (119,515 | ) | | | (82,881 | ) |
| Prime Institutional Shares | | | (96,148 | ) | | | (241,647 | ) |
| Managed Shares* | | | (3 | ) | | | — | |
| Total distributions | | | (215,666 | ) | | | (324,528 | ) |
Fund share transactions: Proceeds from shares sold | | | 3,025,111,289 | | | | 3,165,789,872 | |
| Reinvestment of distributions | | | 193,530 | | | | 280,886 | |
| Payments for shares redeemed | | | (3,234,677,026 | ) | | | (3,231,259,038 | ) |
| Net increase (decrease) in net assets from Fund share transactions | | | (209,372,207 | ) | | | (65,188,280 | ) |
| Increase (decrease) in net assets | | | (209,384,528 | ) | | | (64,099,482 | ) |
| Net assets at beginning of period | | | 1,343,102,300 | | | | 1,407,201,782 | |
| Net assets at end of period (including undistributed net investment income of $0 and $75,462, respectively) | | $ | 1,133,717,772 | | | $ | 1,343,102,300 | |
* For the period from January 18, 2011 (commencement of operations) through December 31, 2011.
The accompanying notes are an integral part of the financial statements.
| Prime Shares | |
| | | Years Ended December 31, | | | | | | | |
| | 2011 | | | 2010 | | | 2009 | | | 2008 | | | Period Ended 12/31/07a | | | Year Ended 3/31/07 | |
| Selected Per Share Data | |
| Net asset value, beginning of period | | $ | 1.00 | | | $ | 1.00 | | | $ | 1.00 | | | $ | 1.00 | | | $ | 1.00 | | | $ | 1.00 | |
Income from investment operations: Net investment income | | | .000 | *** | | | .000 | *** | | | .001 | | | | .023 | | | | .035 | | | | .046 | |
| Net realized gain (loss) | | | .000 | *** | | | .001 | | | | .000 | *** | | | .000 | *** | | | .000 | *** | | | .000 | *** |
| Total from investment operations | | | .000 | *** | | | .001 | | | | .001 | | | | .023 | | | | .035 | | | | .046 | |
Less distributions from: Net investment income | | | (.000 | )*** | | | (.000 | )*** | | | (.001 | ) | | | (.023 | ) | | | (.035 | ) | | | (.046 | ) |
| Net asset value, end of period | | $ | 1.00 | | | $ | 1.00 | | | $ | 1.00 | | | $ | 1.00 | | | $ | 1.00 | | | $ | 1.00 | |
Total Return (%)b | | | .02 | | | | .01 | | | | .10 | | | | 2.28 | | | | 3.57 | ** | | | 4.65 | |
| Ratios to Average Net Assets and Supplemental Data | |
| Net assets, end of period ($ millions) | | | 620 | | | | 754 | | | | 850 | | | | 1,173 | | | | 1,364 | | | | 2,104 | |
Ratio of expenses before expense reductions, including expenses allocated from Cash Management Portfolio (%)c | | | .69 | | | | .67 | | | | .72 | | | | .68 | | | | .67 | * | | | .71 | |
Ratio of expenses after expense reductions, including expenses allocated from Cash Management Portfolio (%)c | | | .24 | | | | .31 | | | | .55 | | | | .64 | | | | .65 | * | | | .71 | |
| Ratio of net investment income (%) | | | .01 | | | | .01 | | | | .08 | | | | 2.35 | | | | 4.67 | * | | | 4.56 | |
a For the period from April 1, 2007 through December 31, 2007. b Total return would have been lower had certain expenses not been reduced. c On May 14, 2007, Cash Reserve Fund — Prime Series became a feeder of Cash Management Portfolio. Expense ratios disclosed prior to December 31, 2007 are for Cash Reserve Fund — Prime Series as a stand-alone fund. * Annualized ** Not annualized *** Amount is less than $.0005. | |
| Prime Institutional Shares | |
| | | Years Ended December 31, | | | | | | | |
| | 2011 | | | 2010 | | | 2009 | | | 2008 | | | Period Ended 12/31/07a | | | Year Ended 3/31/07 | |
| Selected Per Share Data | |
| Net asset value, beginning of period | | $ | 1.00 | | | $ | 1.00 | | | $ | 1.00 | | | $ | 1.00 | | | $ | 1.00 | | | $ | 1.00 | |
Income from investment operations: Net investment income | | | .000 | *** | | | .001 | | | | .003 | | | | .026 | | | | .038 | | | | .049 | |
| Net realized gain (loss) | | | .000 | *** | | | .001 | | | | .000 | *** | | | .000 | *** | | | .000 | *** | | | .000 | *** |
| Total from investment operations | | | .000 | *** | | | .002 | | | | .003 | | | | .026 | | | | .038 | | | | .049 | |
Less distributions from: Net investment income | | | (.000 | )*** | | | (.001 | ) | | | (.003 | ) | | | (.026 | ) | | | (.038 | ) | | | (.049 | ) |
| Net asset value, end of period | | $ | 1.00 | | | $ | 1.00 | | | $ | 1.00 | | | $ | 1.00 | | | $ | 1.00 | | | $ | 1.00 | |
Total Return (%)b | | | .02 | | | | .05 | | | | .32 | | | | 2.67 | | | | 3.87 | ** | | | 5.05 | |
| Ratios to Average Net Assets and Supplemental Data | |
| Net assets, end of period ($ millions) | | | 514 | | | | 589 | | | | 557 | | | | 819 | | | | 1,265 | | | | 857 | |
Ratio of expenses before expense reductions, including expenses allocated from Cash Management Portfolio (%)c | | | .30 | | | | .29 | | | | .35 | | | | .30 | | | | .29 | * | | | .32 | |
Ratio of expenses after expense reductions, including expenses allocated from Cash Management Portfolio (%)c | | | .24 | | | | .27 | | | | .32 | | | | .26 | | | | .27 | * | | | .32 | |
| Ratio of net investment income (%) | | | .01 | | | | .05 | | | | .32 | | | | 2.73 | | | | 5.05 | * | | | 4.95 | |
a For the period from April 1, 2007 through December 31, 2007. b Total return would have been lower had certain expenses not been reduced. c On May 14, 2007, Cash Reserve Fund — Prime Series became a feeder of Cash Management Portfolio. Expense ratios disclosed prior to December 31, 2007 are for Cash Reserve Fund — Prime Series as a stand-alone fund. * Annualized ** Not annualized *** Amount is less than $.0005. | |
| Managed Shares | |
| | | Period Ended 12/31/11a | |
| Selected Per Share Data | |
| Net asset value, beginning of period | | $ | 1.00 | |
Income from investment operations: Net investment income | | | .000 | *** |
| Net realized gain (loss) | | | .000 | *** |
| Total from investment operations | | | .000 | *** |
Less distributions from: Net investment income | | | (.001 | ) |
| Net asset value, end of period | | $ | 1.00 | |
Total Return (%)b | | | .07 | ** |
| Ratios to Average Net Assets and Supplemental Data | |
| Net assets, end of period ($ thousands) | | | 4 | |
| Ratio of expenses before expense reductions, including expenses allocated from Cash Management Portfolio (%) | | | 2.26 | * |
| Ratio of expenses after expense reductions, including expenses allocated from Cash Management Portfolio (%) | | | .23 | * |
| Ratio of net investment income (%) | | | .00 | * |
a For the period from January 18, 2011 (commencement of operations of Managed Shares class) to December 31, 2011. b Total return would have been lower had certain expenses not been reduced. * Annualized ** Not annualized *** Amount is less than $.0005. | |
Notes to Financial Statements
A. Organization and Significant Accounting Policies
Cash Reserve Fund — Prime Series (the "Fund") is a diversified series of Cash Reserve Fund, Inc., which is registered under the Investment Company Act of 1940, as amended (the "1940 Act"), as a diversified, open-end management investment company and is organized as a corporation under the laws of the state of Maryland.
The Fund offers three classes of shares to investors: Cash Reserve Prime Shares ("Prime Shares"), Cash Reserve Prime Institutional Shares ("Prime Institutional Shares") and Cash Reserve Managed Shares ("Managed Shares"), which commenced operations on January 18, 2011.
The Fund, a feeder fund, seeks to achieve its investment objective by investing all of its investable assets in a master portfolio, the Cash Management Portfolio (the "Portfolio''), an open-end management investment company registered under the 1940 Act and organized as a New York business trust advised by Deutsche Investment Management Americas Inc. ("DIMA'' or the "Advisor''), an indirect, wholly owned subsidiary of Deutsche Bank AG. A master/feeder fund structure is one in which a fund (a "feeder fund"), instead of investing directly in a portfolio of securities, invests most or all of its investment assets in a separate registered investment company (the "master fund") with substantially the same investment objective and policies as the feeder fund. Such a structure permits the pooling of assets of two or more feeder funds, preserving separate identities or distribution channels at the feeder fund level. At December 31, 2011, the Fund owned approximately 5% of the Portfolio.
Investment income, realized gains and losses, and certain fund-level expenses and expense reductions, if any, were borne pro rata on the basis of relative net assets by the holders of all classes of shares, except that each class bears certain expenses unique to that class such as distribution and service fees, services to shareholders and certain other class-specific expenses. Differences in class-level expenses may result in payment of different per share dividends by class. All shares of the Fund have equal rights with respect to voting subject to class-specific arrangements.
The Fund's financial statements are prepared in accordance with accounting principles generally accepted in the United States of America which require the use of management estimates. Actual results could differ from those estimates. The policies described below are followed consistently by the Fund in the preparation of its financial statements. The financial statements of the Portfolio, including the Investment Portfolio, are contained elsewhere in this report and should be read in conjunction with the Fund's financial statements.
Security Valuation. The Fund records its investment in the Portfolio at value, which reflects its proportionate interest in the net assets of the Portfolio. Valuation of the securities held by the Portfolio is discussed in the notes to the Portfolio's financial statements included elsewhere in this report.
Disclosure about the classification of fair value measurements is included in a table following the Portfolio's investment Portfolio.
Federal Income Taxes. The Fund's policy is to comply with the requirements of the Internal Revenue Code, as amended, which are applicable to regulated investment companies, and to distribute all of its taxable income to its shareholders.
The Fund has reviewed the tax positions for the open tax years as of December 31, 2011 and has determined that no provision for income tax is required in the Fund's financial statements. The Fund's federal tax returns for the prior three fiscal periods/years remain open subject to examination by the Internal Revenue Service.
Distribution of Income and Gains. Net investment income of the Fund is declared as a daily dividend and is distributed to shareholders monthly. The Fund may take into account capital gains and losses in its daily dividend declarations. The Fund may also make additional distributions for tax purposes if necessary.
Permanent book and tax differences relating to shareholder distributions will result in reclassifications to paid in capital. Temporary book and tax differences will reverse in a subsequent period. There were no significant book to tax differences for the Fund.
At December 31, 2011, the Fund's components of distributable earnings (accumulated losses) on a tax basis were as follows:
| Undistributed ordinary income | | $ | 63,140 | |
In addition, the tax character of the distributions was characterized as follows:
| | | Years Ended December 31, | |
| | | 2011 | | | 2010 | |
| Distributions from ordinary income | | $ | 215,666 | | | $ | 324,528 | |
Contingencies. In the normal course of business, the Fund may enter into contracts with service providers that contain general indemnification clauses. The Fund's maximum exposure under these arrangements is unknown as this would involve future claims that may be made against the Fund that have not yet been made. However, based on experience, the Fund expects the risk of loss to be remote.
Other. The Fund receives an allocation of the Portfolio's net investment income and net realized gains and losses in proportion to its investment in the Portfolio. Expenses directly attributed to a fund are charged to that fund, while expenses which are attributable to the Corporation are allocated among the Funds in the Corporation on the basis of relative net assets.
B. Fees and Transactions with Affiliates
Management Agreement. Under the Investment Management Agreement with Deutsche Investment Management Americas Inc. ("DIMA" or the "Advisor"), an indirect, wholly owned subsidiary of Deutsche Bank AG, the Advisor serves as the investment manager to the Fund. The Advisor receives a management fee from the Portfolio pursuant to the master/feeder structure listed above in Note A.
Administration Fee. Pursuant to an Administrative Services Agreement, DIMA provides most administrative services to the Fund. For all services provided under the Administrative Services Agreement, the Fund pays the Advisor an annual fee ("Administration Fee") of 0.10% of the Fund's average daily net assets, computed and accrued daily and payable monthly.
For the period from January 18, 2011 through September 30, 2012, the Advisor has contractually agreed to waive its fees and/or reimburse certain operating expenses of Managed Shares Class to the extent necessary to maintain the operating expenses (excluding certain expenses such as extraordinary expenses, taxes, brokerage and interest) at 0.45%.
In addition, the Advisor has agreed to voluntarily waive additional expenses. The waiver may be changed or terminated at any time without notice. Under this arrangement, the Advisor waived certain expenses of the Fund.
Accordingly, for the year ended December 31, 2011, the Administration Fee was $1,146,983, of which $417,728 was waived and $52,878 is unpaid.
Service Provider Fees. DWS Investments Service Company ("DISC"), an affiliate of the Advisor, is the transfer agent, dividend-paying agent and shareholder service agent for the Fund. Pursuant to a sub-transfer agency agreement between DISC and DST Systems, Inc. ("DST"). DISC has delegated certain transfer agent, dividend-paying agent and shareholder service agent functions to DST. DISC compensates DST out of the shareholder servicing fee it receives from the Fund. For the year ended December 31, 2011, the amounts charged to the Fund by DISC were as follows:
| | | Total Aggregated | | | Waived | |
| Prime Shares | | $ | 618,302 | | | $ | 609,970 | |
| Prime Institutional Shares | | | 58,164 | | | | 58,164 | |
| Managed Shares | | | 68 | | | | 66 | |
| | | $ | 676,534 | | | $ | 668,200 | |
Distribution and Service Fees. DWS Investments Distributors, Inc. ("DIDI") is the Fund's Distributor. The Fund pays the Distributor an annual fee, pursuant to Rule 12b-1, based on its average daily net assets, which is calculated daily and payable monthly at 0.25% and 0.15% of Prime Shares average daily net assets and Managed Shares average daily net assets, respectively. For the year ended December 31, 2011, the Distribution Fee was as follows:
| | | Total Aggregated | | | Waived | | | Annual Effective Rates | |
| Prime Shares | | $ | 1,737,798 | | | $ | 1,737,798 | | | | .00 | % |
| Managed Shares | | | 5 | | | | 5 | | | | .00 | % |
| | | $ | 1,737,803 | | | $ | 1,737,803 | | | | | |
The Fund pays the Distributor a shareholder servicing fee based on the average daily net assets which is calculated daily and paid monthly at a rate of 0.07% of Prime Shares. The Distributor uses this fee to compensate third parties that provide shareholder services to their clients who own shares. For the year ended December 31, 2011, the shareholder servicing fee was as follows:
| | | Total Aggregated | | | Waived | | | Annual Effective Rates | |
| Prime Shares | | $ | 479,014 | | | $ | 479,014 | | | | .00 | % |
Typesetting and Filing Service Fees. Under an agreement with DIMA, DIMA is compensated for providing typesetting and certain regulatory filing services to the Fund. For the year ended December 31, 2011, the amount charged to the Fund by DIMA included in Statement of Operations under "reports to shareholders" aggregated $35,166, of which $9,552 was unpaid.
Directors' Fees and Expenses. The Fund paid each Director not affiliated with the Advisor retainer fees plus specified amounts for various committee services and for the Board Chairperson.
C. Concentration of Ownership
From time to time, the Fund may have a concentration of several shareholders holding a significant percentage of shares outstanding. Investment activities of these shareholder accounts could have a material impact on the Fund.
At December 31, 2011, there was no shareholder account that held greater than 10% of the outstanding shares of the Fund.
D. Share Transactions
The following table summarizes share and dollar activity in the Fund:
| | | Year Ended December 31, 2011 | | | Year Ended December 31, 2010 | |
| | | Shares | | | Dollars | | | Shares | | | Dollars | |
| Shares sold | |
| Prime Shares | | | 956,103,230 | | | $ | 956,103,230 | | | | 798,876,776 | | | $ | 798,876,776 | |
| Prime Institutional Shares | | | 2,069,004,059 | | | | 2,069,004,059 | | | | 2,366,913,096 | | | | 2,366,913,096 | |
| Managed Shares* | | | 4,000 | | | | 4,000 | | | | — | | | | — | |
| | | | | | | $ | 3,025,111,289 | | | | | | | $ | 3,165,789,872 | |
| Shares issued to shareholders in reinvestment of distributions | |
| Prime Shares | | | 108,327 | | | $ | 108,327 | | | | 74,912 | | | $ | 74,912 | |
| Prime Institutional Shares | | | 85,201 | | | | 85,201 | | | | 205,974 | | | | 205,974 | |
| Managed Shares* | | | 2 | | | | 2 | | | | — | | | | — | |
| | | | | | | $ | 193,530 | | | | | | | $ | 280,886 | |
| Shares redeemed | |
| Prime Shares | | | (1,090,672,652 | ) | | $ | (1,090,672,652 | ) | | | (895,106,033 | ) | | $ | (895,106,033 | ) |
| Prime Institutional Shares | | | (2,144,004,374 | ) | | | (2,144,004,374 | ) | | | (2,336,153,005 | ) | | | (2,336,153,005 | ) |
| | | | | | | $ | (3,234,677,026 | ) | | | | | | $ | (3,231,259,038 | ) |
| Net increase (decrease) | |
| Prime Shares | | | (134,461,095 | ) | | $ | (134,461,095 | ) | | | (96,154,345 | ) | | $ | (96,154,345 | ) |
| Prime Institutional Shares | | | (74,915,114 | ) | | | (74,915,114 | ) | | | 30,966,065 | | | | 30,966,065 | |
| Managed Shares* | | | 4,002 | | | | 4,002 | | | | — | | | | — | |
| | | | | | | $ | (209,372,207 | ) | | | | | | $ | (65,188,280 | ) |
* For the perod from January 18, 2011 (commencement of operations) through December 31, 2011.
Report of Independent Registered Public Accounting Firm
To the Directors of Cash Reserve Fund, Inc. and Shareholders of Cash Reserve Fund — Prime Series:
In our opinion, the accompanying statement of assets and liabilities and the related statements of operations and of changes in net assets and the financial highlights present fairly, in all material respects, the financial position of Cash Reserve Fund — Prime Series (hereafter referred to as the "Fund'') at December 31, 2011, and the results of its operations, the changes in its net assets and the financial highlights for each of the periods indicated therein, in conformity with accounting principles generally accepted in the United States of America. These financial statements and financial highlights (hereafter referred to as "financial statements'') are the responsibility of the Fund's management. Our responsibility is to express an opinion on these financial statements based on our audits. We conducted our audits of these financial statements in accordance with the standards of the Public Company Accounting Oversight Board (United States). Those standards require that we plan and perform the audits to obtain reasonable assurance about whether the financial statements are free of material misstatement. An audit includes examining, on a test basis, evidence supporting the amounts and disclosures in the financial statements, assessing the accounting principles used and significant estimates made by management, and evaluating the overall financial statement presentation. We believe that our audits provide a reasonable basis for our opinion.
Boston, Massachusetts February 24, 2012 | PricewaterhouseCoopers LLP |
Information About Your Fund's Expenses
As an investor of the Fund, you incur two types of costs: ongoing expenses and transaction costs. Ongoing expenses include management fees and other Fund expenses. Examples of transaction costs include account maintenance fees, which are not shown in this section. The following tables are intended to help you understand your ongoing expenses (in dollars) of investing in the Fund and to help you compare these expenses with the ongoing expenses of investing in other mutual funds. In the most recent six-month period, the Fund limited these expenses; had it not done so, expenses would have been higher. The example in the table is based on an investment of $1,000 invested at the beginning of the six-month period and held for the entire period (July 1, 2011 to December 31, 2011).
The tables illustrate your Fund's expenses in two ways:
·Actual Fund Return. This helps you estimate the actual dollar amount of ongoing expenses (but not transaction costs) paid on a $1,000 investment in the Fund using the Fund's actual return during the period. To estimate the expenses you paid over the period, simply divide your account value by $1,000 (for example, an $8,600 account value divided by $1,000 = 8.6), then multiply the result by the number in the "Expenses Paid per $1,000" line under the share class you hold.
·Hypothetical 5% Fund Return. This helps you to compare your Fund's ongoing expenses (but not transaction costs) with those of other mutual funds using the Fund's actual expense ratio and a hypothetical rate of return of 5% per year before expenses. Examples using a 5% hypothetical fund return may be found in the shareholder reports of other mutual funds. The hypothetical account values and expenses may not be used to estimate the actual ending account balance or expenses you paid for the period.
Please note that the expenses shown in these tables are meant to highlight your ongoing expenses only and do not reflect any transaction costs. The "Expenses Paid per $1,000" line of the tables is useful in comparing ongoing expenses only and will not help you determine the relative total expense of owning different funds. If these transaction costs had been included, your costs would have been higher.
Expenses and Value of a $1,000 Investment for the six months ended December 31, 2011 | |
| Actual Fund Return* | | Prime Shares | | | Prime Institutional Shares | | | Managed Shares | |
| Beginning Account Value 7/1/11 | | $ | 1,000.00 | | | $ | 1,000.00 | | | $ | 1,000.00 | |
| Ending Account Value 12/31/11 | | $ | 1,000.13 | | | $ | 1,000.13 | | | $ | 1,000.16 | |
| Expenses Paid per $1,000** | | $ | 1.01 | | | $ | 1.01 | | | $ | 1.36 | |
| Hypothetical 5% Fund Return* | | Prime Shares | | | Prime Institutional Shares | | | Managed Shares | |
| Beginning Account Value 7/1/11 | | $ | 1,000.00 | | | $ | 1,000.00 | | | $ | 1,000.00 | |
| Ending Account Value 12/31/11 | | $ | 1,024.20 | | | $ | 1,024.20 | | | $ | 1,023.84 | |
| Expenses Paid per $1,000** | | $ | 1.02 | | | $ | 1.02 | | | $ | 1.38 | |
* Expenses include amounts allocated proportionally from the master portfolio.
** Expenses are equal to the Fund's annualized expense ratio for each share class, multiplied by the average account value over the period, multiplied by the number of days in the most recent six-month period, then divided by 365.
| Annualized Expense Ratios | | Prime Shares | | | Prime Institutional Shares | | | Managed Shares | |
| Cash Reserve Fund — Prime Series | | | .20 | % | | | .20 | % | | | .27 | % |
For more information, please refer to the Fund's prospectus.
Tax Information (Unaudited)
A total of 4.12% of the dividends distributed during the fiscal year was derived from interest on U.S. government securities, which is generally exempt from state income tax.
Please contact a tax advisor if you have questions about federal or state income tax laws, or on how to prepare your tax returns. If you have specific questions about your account, please call (800) 621-1048.
(The following financial statements of the Cash Management Portfolio should be read in conjunction with the Fund's financial statements.)
Investment Portfolio as of December 31, 2011 | | | Principal Amount ($) | | | Value ($) | |
| | | | |
| Certificates of Deposit and Bank Notes 7.5% | |
| ANZ National International Ltd., 144A, 3.25%, 4/2/2012 | | | 49,000,000 | | | | 49,336,289 | |
| Banco del Estado de Chile, 0.5%, 1/17/2012 | | | 20,000,000 | | | | 20,000,000 | |
| Bank Nederlandse Gemeenten, 6.0%, 3/26/2012 | | | 35,000,000 | | | | 35,455,384 | |
| Bank of Nova Scotia, 0.28%, 1/4/2012 | | | 100,000,000 | | | | 100,000,000 | |
| China Construction Bank Corp., 0.3%, 1/3/2012 | | | 37,451,000 | | | | 37,451,000 | |
| Commonwealth Bank of Australia, 144A, 2.4%, 1/12/2012 | | | 43,132,000 | | | | 43,157,466 | |
| Credit Suisse, 0.38%, 1/3/2012 | | | 97,000,000 | | | | 97,000,000 | |
| DnB Bank ASA, 0.35%, 1/17/2012 | | | 79,500,000 | | | | 79,500,000 | |
| General Electric Capital Corp., 6.0%, 6/15/2012 | | | 12,500,000 | | | | 12,810,030 | |
| Industrial & Commercial Bank of China: | |
| 0.7%, 1/3/2012 | | | 100,000,000 | | | | 100,000,000 | |
| 0.7%, 1/4/2012 | | | 99,500,000 | | | | 99,500,000 | |
| 0.7%, 1/6/2012 | | | 39,600,000 | | | | 39,600,000 | |
| Mizuho Corporate Bank Ltd., 0.42%, 2/6/2012 | | | 50,000,000 | | | | 50,003,492 | |
| Nederlandse Waterschapsbank NV, 1.375%, 2/17/2012 | | | 44,700,000 | | | | 44,756,807 | |
| Nordea Bank Finland PLC: | |
| 0.35%, 1/13/2012 | | | 69,500,000 | | | | 69,500,000 | |
| 0.4%, 2/15/2012 | | | 45,000,000 | | | | 45,000,561 | |
| Rabobank Nederland NV: | |
| 0.4%, 2/15/2012 | | | 133,500,000 | | | | 133,500,000 | |
| 0.43%, 2/24/2012 | | | 45,000,000 | | | | 45,000,000 | |
| 0.43%, 3/2/2012 | | | 160,000,000 | | | | 160,000,000 | |
| Skandinaviska Enskilda Banken AB: | |
| 0.35%, 1/11/2012 | | | 49,700,000 | | | | 49,700,000 | |
| 0.36%, 1/6/2012 | | | 46,500,000 | | | | 46,500,000 | |
| 0.45%, 2/13/2012 | | | 138,500,000 | | | | 138,500,000 | |
| Sumitomo Mitsui Banking Corp., 0.35%, 1/13/2012 | | | 50,000,000 | | | | 50,000,332 | |
| Svenska Handelsbanken AB, 0.385%, 1/23/2012 | | | 15,000,000 | | | | 15,000,091 | |
Total Certificates of Deposit and Bank Notes (Cost $1,561,271,452) | | | | 1,561,271,452 | |
| | |
| Commercial Paper 26.3% | |
| Issued at Discount** 24.7% | |
| ASB Finance Ltd., 0.585%, 4/27/2012 | | | 981,000 | | | | 979,135 | |
| Australia & New Zealand Banking Group Ltd., 0.25%, 2/7/2012 | | | 200,000 | | | | 199,949 | |
| Bank of Nova Scotia, 0.1%, 1/17/2012 | | | 600,000 | | | | 599,973 | |
| Barclays Bank PLC: | |
| 0.2%, 1/3/2012 | | | 1,000,000 | | | | 999,989 | |
| 0.33%, 1/20/2012 | | | 145,000,000 | | | | 144,974,746 | |
| 0.36%, 1/6/2012 | | | 30,000,000 | | | | 29,998,500 | |
| 0.38%, 1/4/2012 | | | 153,000,000 | | | | 152,995,155 | |
| 0.46%, 2/1/2012 | | | 77,000,000 | | | | 76,969,499 | |
| 0.52%, 2/27/2012 | | | 33,500,000 | | | | 33,472,418 | |
| BNZ International Funding Ltd: | |
| 144A, 0.57%, 4/10/2012 | | | 60,000,000 | | | | 59,905,000 | |
| 144A, 0.58%, 4/10/2012 | | | 50,000,000 | | | | 49,919,444 | |
| Coca-Cola Co.: | |
| 0.18%, 6/1/2012 | | | 29,888,000 | | | | 29,865,285 | |
| 0.2%, 4/10/2012 | | | 30,350,000 | | | | 30,333,139 | |
| Erste Abwicklungsanstalt: | |
| 0.35%, 1/30/2012 | | | 20,000,000 | | | | 19,994,361 | |
| 0.36%, 1/30/2012 | | | 50,000,000 | | | | 49,985,500 | |
| 0.37%, 1/9/2012 | | | 50,000,000 | | | | 49,995,889 | |
| 0.37%, 1/17/2012 | | | 50,000,000 | | | | 49,991,778 | |
| 0.39%, 2/16/2012 | | | 50,000,000 | | | | 49,975,083 | |
| 0.4%, 3/14/2012 | | | 35,000,000 | | | | 34,971,611 | |
| 0.42%, 1/3/2012 | | | 55,500,000 | | | | 55,498,705 | |
| Erste Finance Delaware LLC, 0.16%, 1/3/2012 | | | 154,540,000 | | | | 154,538,626 | |
| General Electric Capital Corp., 0.25%, 2/2/2012 | | | 150,000,000 | | | | 149,966,667 | |
| General Electric Capital Services, Inc.: | |
| 0.23%, 2/6/2012 | | | 42,000,000 | | | | 41,990,340 | |
| 0.26%, 2/2/2012 | | | 50,000,000 | | | | 49,988,444 | |
| 0.3%, 2/13/2012 | | | 75,000,000 | | | | 74,973,125 | |
| Johnson & Johnson: | |
| 144A, 0.02%, 1/13/2012 | | | 25,000,000 | | | | 24,999,833 | |
| 144A, 0.04%, 2/27/2012 | | | 75,000,000 | | | | 74,995,250 | |
| 144A, 0.05%, 4/3/2012 | | | 10,000,000 | | | | 9,998,708 | |
| 144A, 0.06%, 2/17/2012 | | | 100,000,000 | | | | 99,992,167 | |
| 144A, 0.07%, 4/2/2012 | | | 280,000,000 | | | | 279,947,867 | |
| 144A, 0.08%, 4/2/2012 | | | 70,000,000 | | | | 69,985,689 | |
| 144A, 0.08%, 4/3/2012 | | | 40,000,000 | | | | 39,991,733 | |
| 144A, 0.15%, 3/7/2012 | | | 33,175,000 | | | | 33,165,877 | |
| Kells Funding LLC: | |
| 144A, 0.29%, 1/12/2012 | | | 125,000,000 | | | | 124,988,924 | |
| 144A, 0.3%, 1/26/2012 | | | 25,000,000 | | | | 24,994,792 | |
| 144A, 0.35%, 2/17/2012 | | | 43,100,000 | | | | 43,080,306 | |
| 144A, 0.37%, 3/19/2012 | | | 25,700,000 | | | | 25,679,397 | |
| 144A, 0.37%, 4/10/2012 | | | 80,000,000 | | | | 79,917,778 | |
| 144A, 0.38%, 4/17/2012 | | | 25,000,000 | | | | 24,971,764 | |
| 144A, 0.45%, 1/20/2012 | | | 75,687,000 | | | | 75,669,024 | |
| 144A, 0.48%, 1/19/2012 | | | 57,014,000 | | | | 57,000,317 | |
| 144A, 0.52%, 2/1/2012 | | | 72,500,000 | | | | 72,467,536 | |
| 144A, 0.52%, 2/16/2012 | | | 37,000,000 | | | | 36,975,416 | |
| Merck & Co., Inc.: | |
| 0.06%, 1/9/2012 | | | 7,750,000 | | | | 7,749,897 | |
| 0.06%, 1/11/2012 | | | 86,000,000 | | | | 85,998,567 | |
| New York Life Capital Corp.: | |
| 144A, 0.12%, 2/3/2012 | | | 3,725,000 | | | | 3,724,590 | |
| 144A, 0.13%, 2/1/2012 | | | 37,900,000 | | | | 37,895,757 | |
| 144A, 0.15%, 3/2/2012 | | | 20,000,000 | | | | 19,994,917 | |
| 144A, 0.16%, 2/14/2012 | | | 25,000,000 | | | | 24,995,111 | |
| 144A, 0.16%, 3/8/2012 | | | 40,000,000 | | | | 39,988,089 | |
| 144A, 0.16%, 3/19/2012 | | | 38,000,000 | | | | 37,986,827 | |
| Nieuw Amsterdam Receivables Corp.: | |
| 144A, 0.32%, 1/4/2012 | | | 100,000,000 | | | | 99,997,333 | |
| 144A, 0.33%, 1/3/2012 | | | 653,000 | | | | 652,988 | |
| NRW.Bank: | |
| 0.24%, 1/17/2012 | | | 30,062,000 | | | | 30,058,793 | |
| 0.4%, 1/6/2012 | | | 61,000,000 | | | | 60,996,611 | |
| Oversea-Chinese Banking Corp., Ltd., 0.29%, 1/17/2012 | | | 45,000,000 | | | | 44,994,200 | |
| PepsiCo, Inc., 0.04%, 1/18/2012 | | | 95,000,000 | | | | 94,998,206 | |
| Pfizer, Inc.: | |
| 0.03%, 1/5/2012 | | | 58,000,000 | | | | 57,999,807 | |
| 0.04%, 1/12/2012 | | | 40,000,000 | | | | 39,999,511 | |
| Proctor & Gamble Co.: | |
| 0.08%, 1/3/2012 | | | 100,000,000 | | | | 99,999,556 | |
| 0.08%, 1/31/2012 | | | 40,000,000 | | | | 39,997,333 | |
| 0.08%, 2/24/2012 | | | 34,000,000 | | | | 33,995,920 | |
| 0.08%, 3/23/2012 | | | 60,000,000 | | | | 59,989,067 | |
| 0.09%, 1/25/2012 | | | 40,000,000 | | | | 39,997,600 | |
| 0.09%, 2/14/2012 | | | 75,000,000 | | | | 74,991,750 | |
| 0.09%, 3/30/2012 | | | 25,000,000 | | | | 24,994,437 | |
| 0.1%, 4/9/2012 | | | 25,000,000 | | | | 24,993,125 | |
| 0.11%, 5/4/2012 | | | 30,000,000 | | | | 29,988,633 | |
| 0.11%, 5/21/2012 | | | 23,000,000 | | | | 22,990,091 | |
| 0.12%, 4/2/2012 | | | 67,800,000 | | | | 67,779,208 | |
| 0.12%, 5/4/2012 | | | 128,000,000 | | | | 127,947,093 | |
| 0.13%, 4/12/2012 | | | 75,000,000 | | | | 74,972,375 | |
| 0.13%, 4/30/2012 | | | 80,000,000 | | | | 79,965,333 | |
| 0.15%, 3/30/2012 | | | 25,000,000 | | | | 24,990,729 | |
| Rabobank U.S.A. Financial Corp., 0.4%, 2/8/2012 | | | 19,250,000 | | | | 19,241,872 | |
| SBAB Bank AB: | |
| 144A, 0.5%, 1/4/2012 | | | 50,000,000 | | | | 49,997,917 | |
| 144A, 0.55%, 1/13/2012 | | | 15,000,000 | | | | 14,997,250 | |
| 144A, 0.55%, 1/30/2012 | | | 26,000,000 | | | | 25,988,481 | |
| Sheffield Receivables Corp.: | |
| 144A, 0.3%, 1/27/2012 | | | 24,000,000 | | | | 23,994,800 | |
| 144A, 0.4%, 2/7/2012 | | | 61,000,000 | | | | 60,974,922 | |
| Standard Chartered Bank: | |
| 0.37%, 1/5/2012 | | | 100,000,000 | | | | 99,995,889 | |
| 0.38%, 2/7/2012 | | | 135,750,000 | | | | 135,696,982 | |
| Straight-A Funding LLC: | |
| 144A, 0.12%, 1/11/2012 | | | 30,105,000 | | | | 30,103,996 | |
| 144A, 0.19%, 1/31/2012 | | | 60,061,000 | | | | 60,051,490 | |
| 144A, 0.19%, 2/13/2012 | | | 27,999,000 | | | | 27,992,646 | |
| Sumitomo Mitsui Banking Corp., 0.355%, 1/6/2012 | | | 77,050,000 | | | | 77,046,201 | |
| Swedbank AB, 0.44%, 1/13/2012 | | | 35,000,000 | | | | 34,994,867 | |
| Toyota Motor Credit Corp., 0.27%, 1/6/2012 | | | 107,000,000 | | | | 106,995,987 | |
| Unilever Capital Corp., 0.08%, 3/6/2012 | | | 30,000,000 | | | | 29,995,667 | |
| Victory Receivables Corp.: | |
| 144A, 0.35%, 1/19/2012 | | | 50,000,000 | | | | 49,991,250 | |
| 144A, 0.36%, 1/9/2012 | | | 75,106,000 | | | | 75,099,992 | |
| Walt Disney Co., 0.09%, 2/23/2012 | | | 95,000,000 | | | | 94,987,412 | |
| | | | | 5,125,675,814 | |
| Issued at Par 1.6% | |
| DnB Bank ASA, 144A, 0.43%*, 4/2/2012 | | | 50,000,000 | | | | 50,000,000 | |
| Westpac Banking Corp., 144A, 0.426%*, 4/11/2012 | | | 282,900,000 | | | | 282,893,007 | |
| | | | | 332,893,007 | |
Total Commercial Paper (Cost $5,458,568,821) | | | | 5,458,568,821 | |
| | |
| Government & Agency Obligations 15.0% | |
| U.S. Government Sponsored Agencies 1.9% | |
| Federal Home Loan Bank: | |
| 0.13%, 1/23/2012 | | | 11,000,000 | | | | 10,999,782 | |
| 0.13%, 2/24/2012 | | | 28,225,000 | | | | 28,224,444 | |
| 0.13%, 5/15/2012 | | | 26,500,000 | | | | 26,494,841 | |
| 0.16%, 4/30/2012 | | | 103,320,000 | | | | 103,309,653 | |
| 0.16%**, 11/13/2012 | | | 24,000,000 | | | | 23,966,187 | |
| 0.23%, 8/24/2012 | | | 15,670,000 | | | | 15,674,189 | |
| 0.27%, 7/6/2012 | | | 20,600,000 | | | | 20,600,105 | |
| Federal Home Loan Mortgage Corp.: | |
| 0.099%**, 2/23/2012 | | | 50,000,000 | | | | 49,992,639 | |
| 0.111%**, 1/11/2012 | | | 25,000,000 | | | | 24,999,167 | |
| Federal National Mortgage Association: | |
| 0.132%**, 1/3/2012 | | | 20,000,000 | | | | 19,999,789 | |
| 0.137%**, 2/17/2012 | | | 11,500,000 | | | | 11,497,898 | |
| 0.148%**, 3/1/2012 | | | 20,000,000 | | | | 19,995,000 | |
| 0.159%**, 10/1/2012 | | | 10,000,000 | | | | 9,987,822 | |
| 0.189%**, 10/1/2012 | | | 17,500,000 | | | | 17,474,693 | |
| | | | | 383,216,209 | |
| U.S. Treasury Obligations 13.1% | |
| U.S. Treasury Bills: | |
| 0.005%**, 1/26/2012 | | | 503,000 | | | | 502,998 | |
| 0.035%**, 5/17/2012 | | | 2,500,000 | | | | 2,499,667 | |
| 0.051%**, 4/19/2012 | | | 921,000 | | | | 920,858 | |
| U.S. Treasury Notes: | |
| 0.375%, 8/31/2012 | | | 212,478,000 | | | | 212,794,495 | |
| 0.375%, 9/30/2012 | | | 18,000,000 | | | | 18,034,370 | |
| 0.375%, 10/31/2012 | | | 360,000,000 | | | | 360,730,389 | |
| 0.625%, 6/30/2012 | | | 84,924,000 | | | | 85,135,391 | |
| 0.625%, 7/31/2012 | | | 433,130,000 | | | | 434,394,582 | |
| 0.75%, 5/31/2012 | | | 212,478,000 | | | | 213,053,545 | |
| 1.375%, 10/15/2012 | | | 212,000,000 | | | | 214,035,648 | |
| 1.5%, 7/15/2012 | | | 480,000,000 | | | | 483,642,949 | |
| 1.875%, 6/15/2012 | | | 250,000,000 | | | | 252,038,171 | |
| 4.75%, 5/31/2012 | | | 98,500,000 | | | | 100,373,472 | |
| 4.875%, 6/30/2012 | | | 342,512,000 | | | | 350,642,757 | |
| | | | | 2,728,799,292 | |
Total Government & Agency Obligations (Cost $3,112,015,501) | | | | 3,112,015,501 | |
| | |
| Short-Term Notes* 14.1% | |
| Australia & New Zealand Banking Group Ltd., 144A, 0.31%, 1/20/2012 | | | 72,000,000 | | | | 72,000,000 | |
| Bank of Nova Scotia: | |
| 0.35%, 4/2/2012 | | | 32,500,000 | | | | 32,500,000 | |
| 0.38%, 3/13/2012 | | | 134,500,000 | | | | 134,500,000 | |
| 0.39%, 6/11/2012 | | | 107,000,000 | | | | 107,000,000 | |
| Bayerische Landesbank, 0.353%, 11/23/2012 | | | 40,000,000 | | | | 40,000,000 | |
| Caisse d'Amortissement de la Dette Sociale, 144A, 0.432%, 5/25/2012 | | | 315,000,000 | | | | 314,986,168 | |
| Canadian Imperial Bank of Commerce, 0.373%, 4/26/2012 | | | 200,000,000 | | | | 200,000,000 | |
| Coca-Cola Co., 0.507%, 5/15/2012 | | | 48,000,000 | | | | 48,027,583 | |
| Commonwealth Bank of Australia: | |
| 144A, 0.376%, 2/3/2012 | | | 135,000,000 | | | | 135,000,000 | |
| 144A, 0.455%, 4/30/2012 | | | 40,000,000 | | | | 40,000,000 | |
| JPMorgan Chase Bank NA, 0.57%, 1/8/2013 | | | 250,000,000 | | | | 250,000,000 | |
| Kells Funding LLC: | |
| 144A, 0.361%, 5/4/2012 | | | 125,000,000 | | | | 125,000,000 | |
| 144A, 0.37%, 2/27/2012 | | | 56,000,000 | | | | 56,000,000 | |
| 144A, 0.377%, 1/9/2012 | | | 64,000,000 | | | | 63,999,885 | |
| 144A, 0.384%, 1/19/2012 | | | 27,000,000 | | | | 27,000,000 | |
| 144A, 0.423%, 2/24/2012 | | | 147,500,000 | | | | 147,500,000 | |
| 144A, 0.468%, 4/16/2012 | | | 150,000,000 | | | | 150,000,000 | |
| Nordea Bank Finland PLC: | |
| 0.681%, 2/3/2012 | | | 35,000,000 | | | | 35,006,457 | |
| 0.737%, 9/13/2012 | | | 20,000,000 | | | | 20,034,002 | |
| 0.941%, 9/13/2012 | | | 50,000,000 | | | | 50,085,207 | |
| Rabobank Nederland NV: | |
| 0.356%, 1/10/2012 | | | 108,250,000 | | | | 108,250,000 | |
| 0.388%, 4/24/2012 | | | 133,000,000 | | | | 133,000,000 | |
| 0.46%, 5/16/2012 | | | 50,000,000 | | | | 50,000,000 | |
| 144A, 0.6%, 12/14/2012 | | | 75,000,000 | | | | 75,000,000 | |
| 144A, 0.668%, 2/29/2012 | | | 50,000,000 | | | | 50,007,960 | |
| Svenska Handelsbanken AB, 144A, 0.577%, 8/7/2012 | | | 80,000,000 | | | | 80,000,000 | |
| Toronto-Dominion Bank, 0.296%, 5/11/2012 | | | 130,500,000 | | | | 130,500,000 | |
| Westpac Banking Corp.: | |
| 0.34%, 1/10/2012 | | | 85,000,000 | | | | 85,000,000 | |
| 0.366%, 5/9/2012 | | | 60,000,000 | | | | 60,000,000 | |
| 0.452%, 2/13/2012 | | | 49,000,000 | | | | 49,000,000 | |
| 144A, 0.965%, 10/23/2012 | | | 61,110,000 | | | | 61,280,869 | |
Total Short-Term Notes (Cost $2,930,678,131) | | | | 2,930,678,131 | |
| | |
| Time Deposits 11.3% | |
| Citibank NA, 0.1%, 1/4/2012 | | | 350,000,000 | | | | 350,000,000 | |
| Nordea Bank Finland PLC, 0.02%, 1/3/2012 | | | 400,000,000 | | | | 400,000,000 | |
| State Street Bank & Trust Co., 0.01%, 1/3/2012 | | | 800,000,000 | | | | 800,000,000 | |
| Svenska Handelsbanken AB, 0.01%, 1/3/2012 | | | 800,000,000 | | | | 800,000,000 | |
Total Time Deposits (Cost $2,350,000,000) | | | | 2,350,000,000 | |
| | |
| Municipal Investments 21.1% | |
| Allegheny County, PA, Industrial Development Authority, UPMC Children's Hospital, Series A, 0.08%***, 10/1/2032, LOC: Bank of America NA | | | 20,460,000 | | | | 20,460,000 | |
| Allegheny County, PA, RBC Municipal Products, Inc. Trust Certificates, Series E-16, 144A, 0.1%***, 4/15/2039, LIQ: Royal Bank of Canada, LOC: Royal Bank of Canada | | | 22,165,000 | | | | 22,165,000 | |
| Appleton, WI, Redevelopment Authority Revenue, Fox Cities Performing Arts Center, Inc., Series B, 0.1%***, 6/1/2036, LOC: JPMorgan Chase Bank NA | | | 18,400,000 | | | | 18,400,000 | |
| Arizona, State Health Facilities Authority Revenue, Catholic West: | | | | | | | | |
| Series A, 0.08%***, 7/1/2035, LOC: JPMorgan Chase Bank NA | | | 23,100,000 | | | | 23,100,000 | |
| Series B, 0.08%***, 7/1/2035, LOC: JPMorgan Chase Bank NA | | | 17,680,000 | | | | 17,680,000 | |
| Austin, TX, Water & Wastewater Systems Revenue, 0.07%***, 5/15/2031, LOC: Bank of Tokyo-Mitsubishi UFJ, Sumitomo Mitsui Banking | | | 25,920,000 | | | | 25,920,000 | |
| BlackRock Municipal Intermediate Duration Fund, Inc., Series W-7-2871, 144A, AMT, 0.23%***, 3/1/2041, LIQ: JPMorgan Chase Bank NA | | | 30,000,000 | | | | 30,000,000 | |
| BlackRock MuniHoldings New Jersey Quality Fund, Inc., Series W-7-1727, 144A, AMT, 0.3%***, 7/1/2041, LIQ: Bank of America NA | | | 30,000,000 | | | | 30,000,000 | |
| BlackRock MuniHoldings New York Quality Fund, Inc., Series W-7-2436, 144A, AMT, 0.3%***, 7/1/2041, LIQ: Bank of America NA | | | 40,000,000 | | | | 40,000,000 | |
| BlackRock MuniYield California Quality Fund, Inc., Series W-7-1665, 144A, AMT, 0.22%***, 5/1/2041, LIQ: Citibank NA | | | 13,500,000 | | | | 13,500,000 | |
| BlackRock MuniYield Fund, Inc., Series W-7-2514, 144A, AMT, 0.3%***, 7/1/2041, LIQ: Bank of America NA | | | 25,000,000 | | | | 25,000,000 | |
| BlackRock MuniYield New York Quality Fund, Inc., Series W-7-2477, 144A, AMT, 0.22%***, 5/1/2041, LIQ: Citibank NA | | | 26,300,000 | | | | 26,300,000 | |
| BlackRock MuniYield Quality Fund III, Inc., 144A, AMT, 0.24%***, 6/1/2041, LIQ: Citibank NA | | | 44,500,000 | | | | 44,500,000 | |
| BlackRock MuniYield Quality Fund, Inc., Series W-7-1766, 144A, AMT, 0.26%***, 10/1/2041, LIQ: Morgan Stanley Bank | | | 57,000,000 | | | | 57,000,000 | |
| Blount County, TN, Public Building Authority, Local Government Public Improvement, Series E-5-A, 0.12%***, 6/1/2030, LOC: Branch Banking & Trust | | | 45,400,000 | | | | 45,400,000 | |
| Cabell County, WV, University Facilities, Provident Group Marshall Properties, Series A, 0.13%***, 7/1/2039, LOC: Bank of America NA | | | 19,995,000 | | | | 19,995,000 | |
| Calhoun County, TX, Navigation Industrial Development Authority, Formosa Plastics Corp. Project, Series C, 144A, AMT, 0.12%***, 9/1/2031, LOC: Sumitomo Mitsui Banking | | | 10,000,000 | | | | 10,000,000 | |
| Calhoun, TX, Port Authority, Environmental Facilities Revenue, Formosa Plastics Corp. Project, Series B, 144A, AMT, 0.12%***, 9/1/2041, LOC: Sumitomo Mitsui Banking | | | 21,300,000 | | | | 21,300,000 | |
| California, Housing Finance Agency Revenue, Home Mortgage, Series D, 144A, AMT, 0.1%***, 2/1/2040, LOC: Fannie Mae, Freddie Mac | | | 29,130,000 | | | | 29,130,000 | |
| California, RBC Municipal Products, Inc. Trust, Series E-24, 144A, 0.14%**, Mandatory Put 4/2/2012 @ 100, 7/1/2031, LIQ: Royal Bank of Canada, LOC: Royal Bank of Canada | | | 9,250,000 | | | | 9,250,000 | |
| California, State Kindergarten, Series A5, 0.05%***, 5/1/2034, LOC: Citibank NA & California State Teacher's Retirement System | | | 18,250,000 | | | | 18,250,000 | |
| California, Statewide Communities Development Authority, Multi-Family Housing Revenue, Bay Vista At Meadow Park, Series NN-1, AMT, 0.09%***, 11/15/2037, LIQ: Fannie Mae | | | 29,320,000 | | | | 29,320,000 | |
| California, The Olympic Club Revenue, 0.46%***, 9/30/2032, LOC: Bank of America NA (a) | | | 52,100,000 | | | | 52,100,000 | |
| California, Wells Fargo State Trusts: | | | | | | | | |
| Series 16C, 144A, 0.1%***, 9/1/2029, LIQ: Wells Fargo Bank NA | | | 42,515,000 | | | | 42,515,000 | |
| Series 72C, 144A, 0.1%***, 8/15/2039, GTY: Wells Fargo Bank NA, LIQ: Wells Fargo Bank NA | | | 28,275,000 | | | | 28,275,000 | |
| Series 25C, 144A, 0.1%***, 11/1/2041, GTY: Wells Fargo Bank NA, LIQ: Wells Fargo Bank NA | | | 9,525,000 | | | | 9,525,000 | |
| Channahon, IL, Morris Hospital Revenue, 0.1%***, 12/1/2034, LOC: U.S. Bank NA | | | 5,220,000 | | | | 5,220,000 | |
| Charlotte, NC, Certificates of Participation, Series D, 0.25%***, 6/1/2035, LOC: Bank of America NA (a) | | | 19,600,000 | | | | 19,600,000 | |
| Chattanooga, TN, Industrial Development Board Revenue, BlueCross Corp. Project, 0.22%***, 1/1/2028, LOC: Bank of America NA (a) | | | 99,000,000 | | | | 99,000,000 | |
| Chicago, IL, Midway Airport Revenue, Series A-1, 0.1%***, 1/1/2021, LOC: Bank of Montreal (a) | | | 22,000,000 | | | | 22,000,000 | |
| Clark County, NV, Passenger Facility Charge Revenue, McCarran International Airport, Series F-2, 0.1%***, 7/1/2022, LOC: Union Bank NA | | | 18,000,000 | | | | 18,000,000 | |
| Cleveland, OH, Airport Systems Revenue, Series D, 0.07%***, 1/1/2024, LOC: PNC Bank NA | | | 9,725,000 | | | | 9,725,000 | |
| Cleveland-Cuyahoga County, OH, Port Authority Revenue, Carnegie/89th Garage Project, 0.1%***, 1/1/2037, LOC: JPMorgan Chase Bank | | | 17,730,000 | | | | 17,730,000 | |
| Colorado, Health Facilities Authority Revenue, Fraiser Meadows Community Project, 0.08%***, 6/1/2038, LOC: JPMorgan Chase Bank NA | | | 14,000,000 | | | | 14,000,000 | |
| Colorado, Housing Finance Authority, Single Family Mortgage Revenue: | | | | | | | | |
| "I", Series B-1, 0.15%***, 5/1/2038, LOC: Fannie Mae, Freddie Mac (a) | | | 18,935,000 | | | | 18,935,000 | |
| "I", Series A-2, 0.16%***, 5/1/2038, LOC: Fannie Mae, Freddie Mac (a) | | | 10,185,000 | | | | 10,185,000 | |
| Colorado, Meridian Village Metropolitan, RBC Municipal Products, Inc. Trust, Series C-11, 144A, 0.1%***, 12/1/2031, LIQ: Royal Bank of Canada, LOC: Royal Bank of Canada | | | 17,580,000 | | | | 17,580,000 | |
| Colorado, RBC Municipal Products, Inc. Trust, Series E-25, 144A, AMT, 0.13%***, 11/15/2025, LIQ: Royal Bank of Canada, LOC: Royal Bank of Canada | | | 22,000,000 | | | | 22,000,000 | |
| Colorado, State Educational & Cultural Facilities Authority, Linfield Christian School Project, 0.08%***, 5/1/2030, LOC: Evangelical Christian Credit Union | | | 16,000,000 | | | | 16,000,000 | |
| Colorado, Wells Fargo Stage Trust, Series 42C, 144A, AMT, 0.11%***, 11/15/2023, GTY: Wells Fargo Bank NA, LIQ: Wells Fargo Bank NA | | | 9,835,000 | | | | 9,835,000 | |
| Colorado Springs, CO, Utilities Revenue: | |
| Series C, 0.08%***, 11/1/2040, SPA: JPMorgan Chase Bank NA | | | 29,415,000 | | | | 29,415,000 | |
| Series B, 0.1%***, 11/1/2026, SPA: Barclays Bank PLC | | | 11,000,000 | | | | 11,000,000 | |
| Series A, 0.11%***, 11/1/2038, SPA: Bank of America NA | | | 31,645,000 | | | | 31,645,000 | |
| County of Carroll, KY, Environmental Facilities Revenue, Utilities Company Project, Series A, AMT, 0.11%***, 2/1/2032, LOC: Sumitomo Mitsui Banking | | | 27,800,000 | | | | 27,800,000 | |
| Covina, CA, Redevelopment Agency, Multi-Family Housing, ShadowHills Apartments, Inc., Series A, 0.08%***, 12/1/2015, LIQ: Fannie Mae | | | 12,825,000 | | | | 12,825,000 | |
| Eclipse Funding Trust, Solar Eclipse, Springfield, IL Electric Revenue, Series 2006-0007, 144A, 0.09%***, 3/1/2030, LIQ: U.S. Bank NA, LOC: U.S. Bank NA | | | 22,545,000 | | | | 22,545,000 | |
| Florida, Capital Trust Agency Housing Revenue, Atlantic Housing Foundation, Series A, 0.1%***, 7/15/2024, LIQ: Fannie Mae | | | 19,000,000 | | | | 19,000,000 | |
| Florida, Development Finance Corp., Enterprise Board Industrial Development Program, Out of Door Academy, 0.11%***, 7/1/2038, LOC: Northern Trust Co. | | | 12,910,000 | | | | 12,910,000 | |
| Florida, State Board of Public Education, Series 3834Z, 144A, 0.1%***, 12/1/2015, LIQ: JPMorgan Chase Bank NA | | | 9,000,000 | | | | 9,000,000 | |
| Florida, Sunshine State Governmental Financing Commission Revenue, Miami Dade County Program, Series B, 0.08%***, 9/1/2032, LOC: JPMorgan Chase Bank NA | | | 28,500,000 | | | | 28,500,000 | |
| Georgia, Main Street Natural Gas, Inc., Gas Revenue, Series A, 0.09%***, 8/1/2040, SPA: Royal Bank of Canada | | | 84,000,000 | | | | 84,000,000 | |
| Georgia, Private Colleges & Universities Authority Revenue, Mercer University Project, Series A, 0.1%***, 10/1/2036, LOC: Branch Banking & Trust | | | 10,240,000 | | | | 10,240,000 | |
| Hawaii, State Department of Budget & Finance Special Purpose Revenue, Series 2135, 144A, AMT, 0.1%***, 3/1/2037, GTY: Wells Fargo & Co., INS: FGIC, LIQ: Wells Fargo & Co. | | | 19,485,000 | | | | 19,485,000 | |
| Hawaii, Wells Fargo Stage Trust, Series 54C, 144A, 0.11%***, 4/1/2029, GTY: Wells Fargo Bank NA, LIQ: Wells Fargo Bank NA | | | 9,240,000 | | | | 9,240,000 | |
| Hayward, CA, Multi-Family Housing Revenue, Shorewood Bay Waterford Inc., Series A, 0.08%***, 7/15/2014, LIQ: Fannie Mae | | | 20,000,000 | | | | 20,000,000 | |
| Houston, TX, Airport Systems Revenue, 0.09%***, 7/1/2030, LOC: Barclays Bank PLC | | | 8,000,000 | | | | 8,000,000 | |
| Houston, TX, RBC Municipal Products, Inc. Trust Certificates, Utility Systems Revenue, Series E-14, 144A, 0.1%***, 5/15/2034, LIQ: Royal Bank of Canada, LOC: Royal Bank of Canada | | | 24,070,000 | | | | 24,070,000 | |
| Houston, TX, Utility Systems Revenue, Series D-1, 0.16%***, 5/15/2034, INS: AGMC, LOC: JPMorgan Chase Bank NA (a) | | | 44,000,000 | | | | 44,000,000 | |
| Houston, TX, Water & Sewer Systems Revenue, Series 27TPZ, 144A, 0.09%***, 12/1/2028, INS: AGMC, LIQ: Wells Fargo Bank NA, LOC: Wells Fargo Bank NA | | | 15,865,000 | | | | 15,865,000 | |
| Illinois, Development Finance Authority Revenue, Chicago Symphony Project, 0.08%***, 12/1/2033, LOC: Bank One NA | | | 12,500,000 | | | | 12,500,000 | |
| Illinois, Finance Authority Revenue, Series A, 0.1%***, 11/15/2022, INS: Radian, LOC: JPMorgan Chase Bank NA | | | 12,045,000 | | | | 12,045,000 | |
| Illinois, State Finance Authority Revenue, Methodist Medical Center, Series B, 0.1%***, 11/15/2041, LOC: PNC Bank NA | | | 10,000,000 | | | | 10,000,000 | |
| Illinois, State Toll Highway Authority Revenue, Series A-1A, 0.13%***, 1/1/2031, INS: AGMC, SPA: JPMorgan Chase Bank NA | | | 50,000,000 | | | | 50,000,000 | |
| Illinois, State Toll Highway Authority, Senior Priority, Series A-2A, 0.09%***, 7/1/2030, LOC: Bank of Tokyo-Mitsubishi UFJ | | | 15,000,000 | | | | 15,000,000 | |
| Illinois, Wells Fargo Stage Trust: | | | | | | | | |
| Series 50C, 144A, 0.11%***, 11/15/2035, GTY: Wells Fargo Bank NA, LIQ: Wells Fargo Bank NA | | | 9,110,000 | | | | 9,110,000 | |
| Series 15C, 144A, 0.11%***, 10/1/2040, GTY: Wells Fargo Bank NA, LIQ: Wells Fargo Bank NA | | | 24,405,000 | | | | 24,405,000 | |
| Indiana, State Finance Authority Hospital Revenue, Indiana University Health: | | | | | | | | |
| Series A, 0.06%***, 3/1/2033, LOC: Northern Trust Co. | | | 10,000,000 | | | | 10,000,000 | |
| Series K, 0.09%***, 3/1/2033, LOC: JPMorgan Chase Bank NA (a) | | | 31,700,000 | | | | 31,700,000 | |
| Series J, 0.14%***, 3/1/2033, LOC: JPMorgan Chase Bank NA (a) | | | 15,625,000 | | | | 15,625,000 | |
| Indiana, State Municipal Power Agency, Series A, 0.09%***, 1/1/2018, LOC: Citibank NA | | | 3,800,000 | | | | 3,800,000 | |
| Indiana, Wells Fargo Stage Trust, Series 41C, 144A, 0.11%***, 1/1/2021, GTY: Wells Fargo Bank NA, LIQ: Wells Fargo Bank NA | | | 16,750,000 | | | | 16,750,000 | |
| Iowa, State Finance Authority, Series C, AMT, 0.13%***, 1/1/2036, SPA: State Street Bank & Trust Co. | | | 5,700,000 | | | | 5,700,000 | |
| Iowa, State Finance Authority, Single Family Mortgage, Series C, AMT, 0.12%***, 1/1/2036, SPA: State Street Bank & Trust Co. | | | 8,100,000 | | | | 8,100,000 | |
| Johnson City, TN, Health & Educational Facilities Board Hospital Revenue, Series B3, 0.24%***, 7/1/2033, LOC: Mizuho Corporate Bank (a) | | | 11,400,000 | | | | 11,400,000 | |
| Kansas, State Department of Transportation Highway Revenue, Series C-3, 0.06%***, 9/1/2023, SPA: JPMorgan Chase Bank NA | | | 10,750,000 | | | | 10,750,000 | |
| Kentucky, State Housing Corp. Revenue, Series O, 0.6%***, 1/1/2036, SPA: State Street Bank & Trust Co. (a) | | | 19,160,000 | | | | 19,160,000 | |
| Long Island, NY, Power Authority, Series 3A, 0.28%***, 5/1/2033, LOC: JPMorgan Chase Bank NA & Landesbank Baden-Wurttemberg | | | 15,000,000 | | | | 15,000,000 | |
| Los Angeles County, CA, Multi-Family Housing Authority Revenue, Canyon Country Villas Project, Series H, 0.09%***, 12/1/2032, LIQ: Freddie Mac | | | 8,200,000 | | | | 8,200,000 | |
| Louisiana, Wells Fargo Stage Trust, Series 11C, 144A, 0.11%***, 5/1/2045, LIQ: Wells Fargo Bank NA | | | 17,310,000 | | | | 17,310,000 | |
| Maine, State Housing Authority Mortgage Revenue, Series B-3, AMT, 0.14%***, 11/15/2038, SPA: State Street Bank & Trust Co. | | | 3,310,000 | | | | 3,310,000 | |
| Maine, State Housing Authority, Mortgage Revenue, Series E-2, AMT, 0.12%***, 11/15/2041, SPA: State Street Bank & Trust Co. | | | 8,000,000 | | | | 8,000,000 | |
| Maricopa County, AZ, Industrial Development Authority, Senior Living Facilities Revenue, Christian Care Apartments, Series A, 0.09%***, 9/15/2035, LIQ: Fannie Mae | | | 10,845,000 | | | | 10,845,000 | |
| Massachusetts, State Department of Transportation, Metropolitan Highway Systems Revenue, Contract Assistance, Series A3, 0.09%***, 1/1/2039, LOC: Bank of America NA | | | 38,845,000 | | | | 38,845,000 | |
| Massachusetts, State Development Finance Agency Revenue, Milton Academy, Series B, 0.17%***, 3/1/2039, LOC: TD Bank NA (a) | | | 5,225,000 | | | | 5,225,000 | |
| Massachusetts, State Development Finance Agency Revenue, Wentworth Institute of Technology, 0.1%***, 10/1/2030, LOC: RBS Citizens NA | | | 26,390,000 | | | | 26,390,000 | |
| Massachusetts, State Development Finance Agency Revenue, YMCA of Greater Worcester, 0.08%***, 9/1/2041, LOC: TD Bank NA | | | 11,615,000 | | | | 11,615,000 | |
| Massachusetts, State General Obligation, Series B, 0.25%***, 8/1/2015, SPA: JPMorgan Chase Bank NA | | | 33,000,000 | | | | 33,000,000 | |
| Massachusetts, State Health & Educational Facilities Authority Revenue, Boston University, Series N, 0.16%***, 10/1/2034, LOC: Bank of America NA (a) | | | 13,410,000 | | | | 13,410,000 | |
| Massachusetts, State Water Resources Authority: | |
| Series C-2, 0.08%***, 11/1/2026, SPA: Barclays Bank PLC | | | 20,200,000 | | | | 20,200,000 | |
| Series A-1, 0.08%***, 8/1/2037, SPA: JPMorgan Chase Bank NA | | | 20,000,000 | | | | 20,000,000 | |
| Michigan, Finance Authority, School Loan: | |
| Series B, 0.19%***, 9/1/2050, LOC: PNC Bank NA (a) | | | 25,000,000 | | | | 25,000,000 | |
| Series C, 0.19%***, 9/1/2050, LOC: Bank of Montreal (a) | | | 21,000,000 | | | | 21,000,000 | |
| Michigan, Higher Education Facilities Authority Revenue, Limited Obligation, Hope College, Series B, 0.09%***, 4/1/2032, LOC: PNC Bank NA | | | 17,430,000 | | | | 17,430,000 | |
| Michigan, RBC Municipal Products, Inc. Trust: | | | | | | | | |
| Series L-23, 144A, AMT, 0.13%***, 3/1/2028, INS: AMBAC, LIQ: Royal Bank of Canada, LOC: Royal Bank of Canada | | | 31,000,000 | | | | 31,000,000 | |
| Series L-25, 144A, AMT, 0.13%***, 9/1/2033, LIQ: Royal Bank of Canada, LOC: Royal Bank of Canada | | | 66,745,000 | | | | 66,745,000 | |
| Michigan, State Strategic Fund Limited Obligation Revenue, Kroger Co., Recovery Zone Facility, 0.1%***, 1/1/2026, LOC: Bank of Tokyo-Mitsubishi UFJ | | | 9,500,000 | | | | 9,500,000 | |
| Michigan, Wells Fargo Stage Trust, Series 90C, 144A, 0.11%***, 7/1/2035, LIQ: Wells Fargo Bank NA | | | 14,510,000 | | | | 14,510,000 | |
| Minnesota, RBC Municipal Products, Inc. Trust, Series E-19, 144A, 0.17%***, Mandatory Put 4/2/2012 @ 100, 11/15/2047, LIQ: Royal Bank of Canada, LOC: Royal Bank of Canada | | | 10,000,000 | | | | 10,000,000 | |
| Minnesota, State Housing Finance Agency, Residential Housing Finance, Series C, AMT, 0.12%***, 7/1/2048, LIQ: Federal Home Loan Bank | | | 8,000,000 | | | | 8,000,000 | |
| Minnesota, State Office of Higher Education Revenue, Supplementary Student, Series A, 0.17%***, 12/1/2043, LOC: U.S. Bank NA (a) | | | 11,500,000 | | | | 11,500,000 | |
| Mississippi, State Business Finance Commission, Gulf Opportunity Zone, Chevron U.S.A., Inc. Project, Series C, 0.03%***, 12/1/2030, GTY: Chevron Corp. | | | 8,295,000 | | | | 8,295,000 | |
| Mississippi, State Business Finance Corp., Gulf Opportunity Zone Revenue, Tindall Corp. Project, 0.09%***, 4/1/2028, LOC: Wells Fargo Bank NA | | | 9,005,000 | | | | 9,005,000 | |
| Missouri, State Health & Educational Facilities Authority, Ascension Health, Series C-3, 0.07%***, 11/15/2039 | | | 14,000,000 | | | | 14,000,000 | |
| Missouri, State Health & Educational Facilities Authority, SSM Health Care Corp., Series E, 0.04%***, 6/1/2045, LOC: PNC Bank NA | | | 22,660,000 | | | | 22,660,000 | |
| Monroe County, GA, Development Authority Pollution Control Revenue, Oglethorpe Power Corp., Series B, 0.08%***, 1/1/2036, LOC: JPMorgan Chase Bank NA | | | 27,530,000 | | | | 27,530,000 | |
| Montgomery County, TN, Public Building Authority, Pooled Financing Revenue, Tennessee County Loan Pool, 0.23%***, 11/1/2027, LOC: Bank of America NA | | | 30,790,000 | | | | 30,790,000 | |
| Nashville & Davidson County, TN, Metropolitan Government Health & Educational Facilities Board, Multi-Family Housing, Weatherly Ridge Apartments, Series A, AMT, 0.13%***, 12/1/2041, LOC: U.S. Bank NA | | | 3,000,000 | | | | 3,000,000 | |
| Nevada, Housing Division, Multi-Unit Housing, Apache Project, Series A, AMT, 0.1%***, 10/15/2032, LIQ: Fannie Mae | | | 11,815,000 | | | | 11,815,000 | |
| New Hampshire, State Health & Education Facilities Authority Revenue, Higher Education Loan Corp., Series A, 0.18%***, 12/1/2032, LOC: Royal Bank of Canada (a) | | | 24,401,000 | | | | 24,401,000 | |
| New Jersey, State Health Care Facilities Financing Authority Revenue, Saint Barnabas Health, Series C, 0.09%***, 7/1/2038, LOC: JPMorgan Chase Bank NA (a) | | | 21,495,000 | | | | 21,495,000 | |
| New Mexico, Educational Assistance Foundation, Series A-1, AMT, 0.12%***, 4/1/2034, LOC: Royal Bank of Canada | | | 19,485,000 | | | | 19,485,000 | |
| New Mexico, Wells Fargo Stage Trust, Series 40C, 144A, 0.11%***, 8/1/2039, GTY: Wells Fargo Bank NA, LIQ: Wells Fargo Bank NA | | | 9,265,000 | | | | 9,265,000 | |
| New York, State Dormitory Authority Revenues, Non State Supported Debt, Series 47C, 144A, 0.11%***, 7/1/2050, GTY: Wells Fargo Bank NA, LIQ: Wells Fargo Bank NA | | | 20,595,000 | | | | 20,595,000 | |
| New York, State Dormitory Authority Revenues, Non-State Supported Debt, St. John's University, Series B-2, 0.08%***, 7/1/2037, LOC: Bank of America NA | | | 32,000,000 | | | | 32,000,000 | |
| New York, State Dormitory Authority Revenues, Secondary Issues, Series R-12121, 0.1%***, 4/1/2015, LIQ: Citibank NA | | | 15,830,000 | | | | 15,830,000 | |
| New York, State Energy Research & Development Authority Facilities Revenue, Consolidated Edison Co. of New York, Inc.: | | | | | | | | |
| Series A-2, 144A, 0.06%***, 5/1/2039, LOC: Mizuho Corporate Bank | | | 21,100,000 | | | | 21,100,000 | |
| Series A-1, 144A, 0.07%***, 5/1/2039, LOC: Mizuho Corporate Bank | | | 22,300,000 | | | | 22,300,000 | |
| Series C-3, 144A, AMT, 0.08%***, 11/1/2039, LOC: Mizuho Corporate Bank | | | 27,000,000 | | | | 27,000,000 | |
| Series C-1, 144A, AMT, 0.09%***, 11/1/2039, LOC: Mizuho Corporate Bank | | | 11,200,000 | | | | 11,200,000 | |
| New York, State Housing Finance Agency Revenue, 100 Maiden Lane Properties, Series A, 0.08%***, 5/15/2037, LIQ: Fannie Mae | | | 29,660,000 | | | | 29,660,000 | |
| New York, State Housing Finance Agency Revenue, 88 Leonard Street, Series A, 144A, 1.25%***, 11/1/2037, LOC: Landesbank Hessen-Thuringen (a) | | | 11,750,000 | | | | 11,750,000 | |
| New York, State Housing Finance Agency Revenue, West 38 Street, Series A, AMT, 0.09%***, 5/15/2033, LIQ: Fannie Mae | | | 16,000,000 | | | | 16,000,000 | |
| New York, State Housing Finance Agency, Affordable Housing Revenue, Clinton Park Housing, Series A, 0.1%***, 11/1/2044, LOC: Wells Fargo Bank NA | | | 21,750,000 | | | | 21,750,000 | |
| New York, State Housing Finance Agency, Affordable Housing Revenue, Clinton Park Phase II, Series A-1, 0.09%***, 11/1/2049, LOC: Wells Fargo Bank NA | | | 19,000,000 | | | | 19,000,000 | |
| New York, State Mortgage Agency, Homeowner Revenue, Series 153, AMT, 0.11%***, 4/1/2047, SPA: Barclays Bank PLC | | | 25,000,000 | | | | 25,000,000 | |
| New York City, NY, Municipal Water Finance Authority, Water & Sewer Systems Revenue, Series TR-T30001-I, 144A, 0.3%***, 6/15/2044, LIQ: Citibank NA (a) | | | 8,000,000 | | | | 8,000,000 | |
| North Carolina, Capital Facilities Finance Agency, Educational Facilities Revenue, Forsyth Country Day School, 0.12%***, 12/1/2031, LOC: Branch Banking & Trust | | | 12,190,000 | | | | 12,190,000 | |
| North Carolina, State Capital Facilities Finance Agency Revenue, ELON University, 0.11%***, 1/1/2035, LOC: Bank of America NA | | | 19,935,000 | | | | 19,935,000 | |
| Nuveen Arizona Premium Income Municipal Fund, Inc., Series T30017-I, 144A, 0.3%***, 8/1/2014, LIQ: Citibank NA (a) | | | 27,900,000 | | | | 27,900,000 | |
| Nuveen Dividend Advantage Municipal Fund, Series T30016-I, 144A, 0.3%***, 8/1/2014, LIQ: Citibank NA (a) | | | 70,300,000 | | | | 70,300,000 | |
| Nuveen Select Quality Municipal Fund, Inc., Series 1-2525, 144A, AMT, 0.25%***, 5/1/2041, LIQ: Barclays Bank PLC | | | 40,000,000 | | | | 40,000,000 | |
| Ohio, Housing Finance Agency, Residential Mortgage-Backed Revenue, Series F, AMT, 0.15%***, 3/1/2037, SPA: Citibank NA | | | 31,930,000 | | | | 31,930,000 | |
| Ohio, State Housing Finance Agency, Residental Mortgage Revenue, Series M, AMT, 0.15%***, 9/1/2036, SPA: Citibank NA | | | 32,000,000 | | | | 32,000,000 | |
| Ohio, State Housing Finance Agency, Residential Mortgage Revenue, Mortgage-Backed Securities Program, Series N, AMT, 0.15%***, 9/1/2036, SPA: State Street Bank & Trust Co. | | | 68,405,000 | | | | 68,405,000 | |
| Oklahoma, State Turnpike Authority Revenue, Series B, 0.08%***, 1/1/2028, SPA: Royal Bank of Canada | | | 20,330,000 | | | | 20,330,000 | |
| Orlando & Orange County, FL, Expressway Authority, Series C-1, 0.1%***, 7/1/2025, INS: AGMC, LOC: JPMorgan Chase Bank NA | | | 26,000,000 | | | | 26,000,000 | |
| Palm Beach County, FL, Solid Waste Authority Revenue, 1.0%, Mandatory Put 1/12/2012 @ 100, 10/1/2031 | | | 100,000,000 | | | | 100,017,369 | |
| Philadelphia, PA, Authority for Industrial Development, Series B-3, 0.07%***, 10/1/2030, LOC: PNC Bank NA | | | 10,655,000 | | | | 10,655,000 | |
| Philadelphia, PA, Gas Works Revenue, Series D, 0.07%***, 8/1/2031, LOC: Bank of America NA | | | 25,000,000 | | | | 25,000,000 | |
| Raleigh Durham, NC, Airport Authority Revenue, Series C, 0.1%***, 5/1/2036, LOC: U.S. Bank NA | | | 10,595,000 | | | | 10,595,000 | |
| Salem, OR, Hospital Facility Authority Revenue, Salem Hospital Project, Series C, 0.12%***, 8/15/2036, LOC: Bank of America NA | | | 12,500,000 | | | | 12,500,000 | |
| San Jose, CA, Financing Authority, Series E2, 0.16%***, 6/1/2025, LOC: U.S. Bank NA (a) | | | 12,455,000 | | | | 12,455,000 | |
| San Jose, CA, Financing Authority Lease Revenue, Hayes Mansion, Series D, 0.17%***, 6/1/2025, LOC: U.S. Bank NA (a) | | | 40,985,000 | | | | 40,985,000 | |
| San Jose, CA, Financing Authority Lease Revenue, Ice Center, Series E1, 0.2%***, 6/1/2025, LOC: Bank of America NA (a) | | | 12,460,000 | | | | 12,460,000 | |
| South Carolina, State Jobs-Economic Development Authority, Economic Development Revenue, Bon Secours Health Systems, 0.1%***, 11/1/2042, INS: AGMC, LOC: JPMorgan Chase Bank NA | | | 17,500,000 | | | | 17,500,000 | |
| Southern California, Metropolitan Water District, State Authorization, Series B, 0.07%***, 7/1/2028, SPA: Landesbank Hessen-Thuringen | | | 16,600,000 | | | | 16,600,000 | |
| St. James Parish, LA, Nustar Logistics, Series A, 0.09%***, 10/1/2040, LOC: JPMorgan Chase Bank NA | | | 12,500,000 | | | | 12,500,000 | |
| Stafford County, VA, Industrial Development Authority Revenue, Series B-1, 0.15%***, 8/1/2028, LOC: Bank of America NA | | | 21,505,000 | | | | 21,505,000 | |
| Sweetwater County, WY, Pollution Control Revenue, PacifiCorp Project, Series A, 144A, 0.09%***, 7/1/2015, LOC: Barclays Bank PLC | | | 12,550,000 | | | | 12,550,000 | |
| Texas, Alliance Airport Authority, Inc., Special Facilities Revenue, Series 2088, 144A, AMT, 0.1%***, 4/1/2021, GTY: Wells Fargo & Co., LIQ: Wells Fargo & Co. | | | 24,570,000 | | | | 24,570,000 | |
| Texas, Capital Area Housing Finance Corp., Cypress Creek at River Apartments, AMT, 0.13%***, 10/1/2039, LOC: Citibank NA | | | 10,895,000 | | | | 10,895,000 | |
| Texas, Lower Neches Valley Authority, Industrial Development Corp., Series B-2, AMT, 0.03%***, 12/1/2039, GTY: Exxon Mobil Corp. | | | 7,880,000 | | | | 7,880,000 | |
| Texas, RBC Municipal Products, Inc. Trust, Series E-27, 144A, 0.1%***, 6/1/2027, LIQ: Royal Bank of Canada, LOC: Royal Bank of Canada | | | 10,000,000 | | | | 10,000,000 | |
| Texas, State General Obligation: | |
| Series E, 0.14%***, 12/1/2026, SPA: JPMorgan Chase Bank NA (a) | | | 19,000,000 | | | | 19,000,000 | |
| Series E, 0.15%***, 6/1/2032, LOC: Sumitomo Mitsui Banking (a) | | | 24,435,000 | | | | 24,435,000 | |
| Texas, State Higher Education Authority, Series L-46, 144A, AMT, 0.13%***, 12/1/2034, LIQ: Royal Bank of Canada, LOC: Royal Bank of Canada | | | 52,995,000 | | | | 52,995,000 | |
| Texas, State Veterans Housing Assistance Fund II: | |
| Series C, 0.14%***, 6/1/2031, SPA: JPMorgan Chase & Co. (a) | | | 11,255,000 | | | | 11,255,000 | |
| Series A, 144A, AMT, 0.14%***, 6/1/2034, SPA: Landesbank Hessen-Thuringen | | | 18,395,000 | | | | 18,395,000 | |
| Texas, Tax & Revenue Anticipation Notes: | |
| Series 3945, 144A, 0.07%***, 8/30/2012, LIQ: JPMorgan Chase & Co. | | | 95,000,000 | | | | 95,000,000 | |
| Series 3946, 144A, 0.07%***, 8/30/2012, LIQ: JPMorgan Chase & Co. | | | 90,975,000 | | | | 90,975,000 | |
| Series 3953, 144A, 0.07%***, 8/30/2012, LIQ: JPMorgan Chase & Co. | | | 166,075,000 | | | | 166,075,000 | |
| Series 3964, 144A, 0.07%***, 8/30/2012, LIQ: JPMorgan Chase & Co. | | | 195,000,000 | | | | 195,000,000 | |
| Texas, University of Houston Revenues, Consolidated Systems, 0.08%***, 2/15/2024 | | | 8,860,000 | | | | 8,860,000 | |
| Texas, Wells Fargo Stage Trust, Series 20C, 144A, AMT, 0.11%***, 5/1/2038, GTY: Wells Fargo Bank NA, LIQ: Wells Fargo Bank NA | | | 16,120,000 | | | | 16,120,000 | |
| Travis County, TX, Health Facilities Development Corp., Retirement Facilities Revenue, Longhorn Village Project, Series B, 0.1%***, 7/1/2037, LOC: Bank of Scotland | | | 20,430,000 | | | | 20,430,000 | |
| Troy, NY, Capital Resource Corp. Revenue, Series 4C, 144A, 0.11%***, 9/1/2040, LIQ: Wells Fargo Bank NA | | | 18,715,000 | | | | 18,715,000 | |
| Tulsa, OK, Airports Improvement Trust, Special Facility Revenue, Bizjet International Sales & Support, Inc., 144A, AMT, 0.14%***, 8/1/2018, LOC: Landesbank Hessen-Thuringen | | | 10,120,000 | | | | 10,120,000 | |
| Union County, NC, Enterprise Systems Revenue, 0.07%***, 6/1/2034, LOC: Bank of America NA | | | 13,700,000 | | | | 13,700,000 | |
| University of California Revenue, Series R-12236, 0.07%***, 10/1/2015, INS: AGMC, FGIC, LIQ: Citibank NA | | | 15,000,000 | | | | 15,000,000 | |
| University of New Mexico, Systems Improvement Revenues, 0.1%***, 6/1/2026, SPA: JPMorgan Chase Bank NA | | | 33,625,000 | | | | 33,625,000 | |
| Vermont, State Educational & Health Buildings Financing Agency Revenue, Fletcher Allen Health Care, Series A, 0.08%***, 12/1/2030, LOC: TD BankNorth NA | | | 7,070,000 | | | | 7,070,000 | |
| Volusia County, FL, Housing Finance Authority, Multi-Family Housing Revenue, Cape Morris Cove Apartments, Series A, AMT, 0.12%***, 10/15/2042, LOC: JPMorgan Chase Bank NA | | | 6,140,000 | | | | 6,140,000 | |
| Washington, State Economic Development Finance Authority, Solid Waste Disposal Revenue, Waste Management, Inc. Project, Series D, AMT, 0.15%***, 7/1/2030, LOC: JPMorgan Chase Bank NA | | | 20,000,000 | | | | 20,000,000 | |
| Washington, State Health Care Facilities Authority, Swedish Health Services: | | | | | | | | |
| Series B, 0.09%***, 11/15/2046, LOC: Citibank NA | | | 13,000,000 | | | | 13,000,000 | |
| Series C, 0.09%***, 11/15/2046, LOC: Citibank NA | | | 14,000,000 | | | | 14,000,000 | |
| Washington, State Housing Finance Commission, Rolling Hills Apartments Project, Series A, 144A, AMT, 0.13%***, 6/15/2037, LIQ: Fannie Mae | | | 6,125,000 | | | | 6,125,000 | |
| Washington, Wells Fargo Stage Trust, Series 21C, 144A, 0.11%***, 12/1/2037, GTY: Wells Fargo Bank NA, LIQ: Wells Fargo Bank NA | | | 10,360,000 | | | | 10,360,000 | |
| Wayne County, MI, Airport Authority Revenue, Detroit Metropolitan Airport: | | | | | | | | |
| Series E2, AMT, 0.1%***, 12/1/2028, LOC: PNC Bank NA | | | 16,000,000 | | | | 16,000,000 | |
| Series E1, AMT, 0.11%***, 12/1/2028, LOC: JPMorgan Chase Bank NA | | | 25,000,000 | | | | 25,000,000 | |
| Wisconsin, Housing & Economic Development Authority, Home Ownership Revenue, Series B, 0.15%***, 3/1/2033, LOC: Fannie Mae, Freddie Mac (a) | | | 13,905,000 | | | | 13,905,000 | |
| Wisconsin, State Health & Educational Facilities Authority Revenue, Mercy Alliance, Inc., 0.06%***, 6/1/2039, LOC: U.S. Bank NA | | | 23,000,000 | | | | 23,000,000 | |
| Wisconsin, State Health & Educational Facilities Authority Revenue, Oakwood Village Apartments, Inc., 0.06%***, 8/15/2028, LOC: BMO Harris Bank NA | | | 9,095,000 | | | | 9,095,000 | |
| Woodstock, IL, Multi-Family Housing Revenue, Willow Brooke Apartments, AMT, 0.12%***, 4/1/2042, LOC: Wells Fargo Bank NA | | | 24,600,000 | | | | 24,600,000 | |
| Wyoming, Student Loan Corp. Revenue, Series A-3, 0.08%***, 12/1/2043, LOC: Royal Bank of Canada | | | 40,000,000 | | | | 40,000,000 | |
Total Municipal Investments (Cost $4,389,093,369) | | | | 4,389,093,369 | |
| | |
| Repurchase Agreements 0.5% | |
| JPMorgan Securities, Inc., 0.16%, dated 12/30/2011, to be repurchased at $100,001,778 on 1/3/2012 (b) (Cost $100,000,000) | | | 100,000,000 | | | | 100,000,000 | |
| | | % of Net Assets | | | Value ($) | |
| | | | |
Total Investment Portfolio ($19,901,627,274)+ | | | 95.8 | | | | 19,901,627,274 | |
| Other Assets and Liabilities, Net | | | 4.2 | | | | 882,549,401 | |
| Net Assets | | | 100.0 | | | | 20,784,176,675 | |
* Floating rate securities' yields vary with a designated market index or market rate, such as the coupon-equivalent of the U.S. Treasury Bill rate. These securities are shown at their current rate as of December 31, 2011.
** Annualized yield at time of purchase; not a coupon rate.
*** Variable rate demand notes and variable rate demand preferred shares are securities whose interest rates are reset periodically at market levels. These securities are payable on demand and are shown at their current rates as of December 31, 2011.
+ The cost for federal income tax purposes was $19,901,627,274.
(a) Taxable issue.
(b) Collateralized by:
| Principal Amount ($) | | Security | | Rate (%) | | Maturity Date | | Collateral Value ($) | |
| | 50,870,000 | | Federated Republic of Brazil | | | 8.875-12.75 | | 1/15/2020- 4/15/2024 | | | 84,676,763 | |
| | 20,000,000 | | Republic of South Africa | | | 7.375 | | 4/25/2012 | | | 20,325,000 | |
| Total Collateral Value | | | 105,001,763 | |
144A: Security exempt from registration under Rule 144A of the Securities Act of 1933. These securities may be resold in transactions exempt from registration, normally to qualified institutional buyers.
AGMC: Assured Guaranty Municipal Corp.
AMBAC: Ambac Financial Group, Inc.
AMT: Subject to alternative minimum tax.
FGIC: Financial Guaranty Insurance Co.
GTY: Guaranty Agreement
INS: Insured
LIQ: Liquidity Facility
LOC: Letter of Credit
Radian: Radian Asset Assurance, Inc.
SPA: Standby Bond Purchase Agreement
Fair Value Measurements
Various inputs are used in determining the value of the Portfolio's investments. These inputs are summarized in three broad levels. Level 1 includes quoted prices in active markets for identical securities. Level 2 includes other significant observable inputs (including quoted prices for similar securities, interest rates, prepayment speeds and credit risk). Level 3 includes significant unobservable inputs (including the Portfolio's own assumptions in determining the fair value of investments). The inputs or methodology used for valuing securities are not necessarily an indication of the risk associated with investing in those securities. Securities held by the Portfolio are reflected as Level 2 because the securities are valued at amortized cost (which approximates fair value) and, accordingly, the inputs used to determine value are not quoted prices in an active market.
The following is a summary of the inputs used as of December 31, 2011 in valuing the Portfolio's investments. For information on the Portfolio's policy regarding the valuation of investments, please refer to the Security Valuation section of Note A in the accompanying Notes to Financial Statements.
| Assets | | Level 1 | | | Level 2 | | | Level 3 | | | Total | |
| | |
| Investments in Securities (c) | | $ | — | | | $ | 19,801,627,274 | | | $ | — | | | $ | 19,801,627,274 | |
| Repurchase Agreements | | | — | | | | 100,000,000 | | | | — | | | | 100,000,000 | |
| Total | | $ | — | | | $ | 19,901,627,274 | | | $ | — | | | $ | 19,901,627,274 | |
There have been no transfers between Level 1 and Level 2 fair value measurements during the year ended December 31, 2011.
(c) See Investment Portfolio for additional detailed categorizations.
The accompanying notes are an integral part of the financial statements.
Statement of Assets and Liabilities | as of December 31, 2011 | |
| Assets | |
| Investments in non-affiliated securities, valued at amortized cost | | $ | 19,901,627,274 | |
| Cash | | | 702,330,627 | |
| Receivable for investments sold | | | 161,146,638 | |
| Interest receivable | | | 21,929,547 | |
| Other assets | | | 408,290 | |
| Total assets | | | 20,787,442,376 | |
| Liabilities | |
| Accrued management fee | | | 2,182,416 | |
| Other accrued expenses and payables | | | 1,083,285 | |
| Total liabilities | | | 3,265,701 | |
| Net assets, at value | | $ | 20,784,176,675 | |
The accompanying notes are an integral part of the financial statements.
| for the year ended December 31, 2011 | |
| Investment Income | |
Income: Interest | | $ | 66,333,359 | |
Expenses: Management fee | | | 32,771,738 | |
| Administration fee | | | 7,827,308 | |
| Custodian fee | | | 98,023 | |
| Professional fees | | | 124,799 | |
| Reports to shareholders | | | 22,736 | |
| Trustees' fees and expenses | | | 668,115 | |
| Other | | | 919,172 | |
| Total expenses before expense reductions | | | 42,431,891 | |
| Expense reductions | | | (2,631,189 | ) |
| Total expenses after expense reductions | | | 39,800,702 | |
| Net investment income | | | 26,532,657 | |
| Net realized gain (loss) from investments | | | 1,557,847 | |
| Net increase (decrease) in net assets resulting from operations | | $ | 28,090,504 | |
The accompanying notes are an integral part of the financial statements.
Statement of Changes in Net Assets | | | Years Ended December 31, | |
| Increase (Decrease) in Net Assets | | 2011 | | | 2010 | |
Operations: Net investment income | | $ | 26,532,657 | | | $ | 54,765,972 | |
| Net realized gain (loss) | | | 1,557,847 | | | | 1,171,699 | |
| Net increase (decrease) in net assets resulting from operations | | | 28,090,504 | | | | 55,937,671 | |
Capital transactions in shares of beneficial interest: Proceeds from capital invested | | | 230,841,771,646 | | | | 321,400,411,976 | |
| Value of capital withdrawn | | | (244,517,559,931 | ) | | | (329,490,407,575 | ) |
| Net increase (decrease) in net assets from capital transactions in shares of beneficial interest | | | (13,675,788,285 | ) | | | (8,089,995,599 | ) |
| Increase (decrease) in net assets | | | (13,647,697,781 | ) | | | (8,034,057,928 | ) |
| Net assets at beginning of period | | | 34,431,874,456 | | | | 42,465,932,384 | |
| Net assets at end of period | | $ | 20,784,176,675 | | | $ | 34,431,874,456 | |
The accompanying notes are an integral part of the financial statements.
| | | Years Ended December 31, | |
| | | | 2011 | | | 2010 | | | 2009 | | | 2008 | | | 2007 | |
| Ratios to Average Net Assets and Supplemental Data | |
| Net assets, end of period ($ millions) | | | 20,784 | | | | 34,432 | | | | 42,466 | | | | 29,653 | | | | 33,739 | |
| Ratio of expenses before expense reductions (%) | | | .16 | | | | .17 | | | | .16 | | | | .17 | | | | .17 | |
| Ratio of expenses after expense reductions (%) | | | .15 | | | | .16 | | | | .14 | | | | .13 | | | | .14 | |
| Ratio of net investment income (%) | | | .10 | | | | .16 | | | | .43 | | | | 2.85 | | | | 5.14 | |
Total Return (%)a,b | | | .11 | | | | .17 | | | | .48 | | | | 2.81 | | | | 5.31 | |
a Total return would have been lower had certain expenses not been reduced. b Total return for the Portfolio was derived from the performance of Cash Reserves Fund Institutional. | |
Notes to Financial Statements
A. Organization and Significant Accounting Policies
Cash Management Portfolio (the "Portfolio'') is registered under the Investment Company Act of 1940, as amended (the "1940 Act''), as an open-end management investment company organized as a New York business trust.
The Portfolio is a master fund. A master/feeder fund structure is one in which a fund (a "feeder fund"), instead of investing directly in a portfolio of securities, invests most or all of its investment assets in a separate registered investment company (the "master fund") with substantially the same investment objective and policies as the feeder fund. Such a structure permits the pooling of assets of two or more feeder funds, preserving separate identities or distribution channels at the feeder fund level. The Portfolio may have several feeder funds, including affiliated DWS feeder funds, with a significant ownership percentage of the Portfolio's net assets. Investment activities of these feeder funds could have a material impact on the Portfolio. As of December 31, 2011, Cash Management Fund, Cash Reserves Fund Institutional, Cash Reserves Fund — Prime Series and DWS Money Market Series owned approximately 11%, 10%, 5% and 72%, respectively, of the Portfolio.
The Portfolio's financial statements are prepared in accordance with accounting principles generally accepted in the United States of America which require the use of management estimates. Actual results could differ from those estimates. The policies described below are followed consistently by the Portfolio in the preparation of its financial statements.
Security Valuation. Various inputs are used in determining the value of the Portfolio's investments. These inputs are summarized in three broad levels. Level 1 includes quoted prices in active markets for identical securities. Level 2 includes other significant observable inputs (including quoted prices for similar securities, interest rates, prepayment speeds, and credit risk). Level 3 includes significant unobservable inputs (including the Portfolios' own assumptions in determining the fair value of investments). The inputs or methodology used for valuing securities are not necessarily an indication of the risk associated with investing in those securities.
The Portfolio values all securities utilizing the amortized cost method permitted in accordance with Rule 2a-7 under the 1940 Act and certain conditions therein. Under this method, which does not take into account unrealized capital gains or losses on securities, an instrument is initially valued at its cost and thereafter assumes a constant accretion/amortization rate to maturity of any discount or premium. Securities held by the Portfolio are reflected as Level 2 because the securities are valued at amortized cost (which approximates fair value) and, accordingly, the inputs used to determine value are not quoted prices in an active market.
Repurchase Agreements. The Portfolio may enter into repurchase agreements with certain banks and broker/dealers whereby the Portfolio, through its custodian or a sub-custodian bank, receives delivery of the underlying securities, the amount of which at the time of purchase and each subsequent business day is required to be maintained at such a level that the value is equal to at least the principal amount of the repurchase price plus accrued interest. The custodian bank or another designated subcustodian holds the collateral in a separate account until the agreement matures. If the value of the securities falls below the principal amount of the repurchase agreement plus accrued interest, the financial institution deposits additional collateral by the following business day. If the financial institution either fails to deposit the required additional collateral or fails to repurchase the securities as agreed, the Portfolio has the right to sell the securities and recover any resulting loss from the financial institution. If the financial institution enters into bankruptcy, the Portfolio's claims on the collateral may be subject to legal proceedings.
Federal Income Taxes. The Portfolio is considered a Partnership under the Internal Revenue Code, as amended. Therefore, no federal income tax provision is necessary.
It is intended that the Portfolio's assets, income and distributions will be managed in such a way that an investor in the Portfolio will be able to satisfy the requirements of Subchapter M of the Code, assuming that the investor invested all of its assets in the Portfolio.
The Portfolio has reviewed the tax positions for the open tax years as of December 31, 2011 and has determined that no provision for income tax is required in the Portfolio's financial statements. The Portfolio's federal tax returns for the prior three fiscal years remain open subject to examination by the Internal Revenue Service.
Contingencies. In the normal course of business, the Portfolio may enter into contracts with service providers that contain general indemnification clauses. The Portfolio's maximum exposure under these arrangements is unknown as this would involve future claims that may be made against the Portfolio that have not yet been made. However, based on experience, the Portfolio expects the risk of loss to be remote.
Other. Investment transactions are accounted for on trade date. Interest income is recorded on the accrual basis. Distributions of income and capital gains from investment companies are recorded on the ex-dividend date. Realized gains and losses from investment transactions are recorded on an identified cost basis. All discounts and premiums are accreted/amortized for both tax and financial reporting purposes.
The Portfolio makes an allocation of its net investment income and realized gains and losses from securities transactions to its investors in proportion to their investment in the Portfolio.
B. Fees and Transactions with Affiliates
Management Agreement. Under the Investment Management Agreement with Deutsche Investment Management Americas Inc. ("DIMA" or the "Advisor"), an indirect, wholly owned subsidiary of Deutsche Bank AG, the Advisor determines the securities, instruments and other contracts relating to investments to be purchased, sold or entered into by the Portfolio.
Under the Investment Management Agreement, the Portfolio pays the Advisor a monthly management fee based on its average daily net assets, computed and accrued daily and payable monthly, at the following annual rates:
| First $3.0 billion of the Portfolio's average daily net assets | | | .1500 | % |
| Next $4.5 billion of such net assets | | | .1325 | % |
| Over $7.5 billion of such net assets | | | .1200 | % |
For the period from January 1, 2011 through July 26, 2011, the Advisor had voluntarily agreed to waive total operating expenses at 0.16% of its average daily net assets (excluding certain expenses such as extraordinary expenses, taxes, brokerage and interest).
Effective July 27, 2011, the Advisor has voluntarily agreed to waive its fees and/or reimburse certain operating expenses to the extent necessary to maintain the operating expenses (excluding certain expenses such as extraordinary expenses, taxes, brokerage and interest) at 0.14% of the Fund's average daily net assets. The waiver may be changed or terminated at anytime without notice.
For the year ended December 31, 2011, the Advisor waived a portion of its management fee aggregating $2,631,189, and the amount charged aggregated $30,140,549, which was equivalent to an annual effective rate of 0.12% of the Portfolio's average daily net assets.
Administration Fee. Pursuant to an Administrative Services Agreement, DIMA provides most administrative services to the Portfolio. For all services provided under the Administrative Services Agreement, the Portfolio pays the Advisor an annual fee ("Administration Fee") of 0.03% of the Portfolio's average daily net assets, computed and accrued daily and payable monthly. For the year ended December 31, 2011, the Administration Fee was $7,827,308, of which $569,638 is unpaid.
Filing Service Fees. Under an agreement with DIMA, DIMA is compensated for providing certain regulatory filing services to the Portlfolio. For the year ended December 31, 2011, the amount charged to the Portfolio by DIMA included in the Statement of Operations under "reports to shareholders" aggregated $3,074, of which $1,343 is unpaid.
Trustees' Fees and Expenses. The Portfolio paid each Trustee not affiliated with the Advisor retainer fees plus specified amounts for various committee services and for the Board Chairperson.
C. Line of Credit
The Portfolio and other affiliated funds (the "Participants") share in a $450 million revolving credit facility provided by a syndication of banks. The Portfolio may borrow for temporary or emergency purposes, including the meeting of redemption requests that otherwise might require the untimely disposition of securities. The Participants are charged an annual commitment fee which is allocated based on net assets, among each of the Participants. Interest is calculated at a rate per annum equal to the sum of the Federal Funds Rate plus 1.25 percent plus if LIBOR exceeds the Federal Funds Rate the amount of such excess. The Portfolio may borrow up to a maximum of 33 percent of its net assets under the agreement. The Portfolio had no outstanding loans at December 31, 2011.
Report of Independent Registered Public Accounting Firm
To the Trustees and Holders of Beneficial Interest of Cash Management Portfolio:
In our opinion, the accompanying statement of assets and liabilities, including the portfolio of investments, and the related statements of operations and of changes in net assets and the financial highlights presents fairly, in all material respects, the financial position of Cash Management Portfolio (hereafter referred to as the "Portfolio'') at December 31, 2011, and the results of its operations, the changes in its net assets and the financial highlights for each of the periods indicated therein, in conformity with accounting principles generally accepted in the United States of America. These financial statements and financial highlights (hereafter referred to as "financial statements'') are the responsibility of the Portfolio's management. Our responsibility is to express an opinion on these financial statements based on our audits. We conducted our audits of these financial statements in accordance with the standards of the Public Company Accounting Oversight Board (United States). Those standards require that we plan and perform the audits to obtain reasonable assurance about whether the financial statements are free of material misstatement. An audit includes examining, on a test basis, evidence supporting the amounts and disclosures in the financial statements, assessing the accounting principles used and significant estimates made by management, and evaluating the overall financial statement presentation. We believe that our audits, which included confirmation of securities at December 31, 2011 by correspondence with the custodian and brokers, provide a reasonable basis for our opinion.
Boston, Massachusetts February 24, 2012 | PricewaterhouseCoopers LLP |
Proxy Voting
The fund's policies and procedures for voting proxies for portfolio securities and information about how the fund's voted proxies related to its portfolio securities during the 12-month period ended June 30 are available on our Web site — www.dws-investments.com (click on "proxy voting"at the bottom of the page) — or on the SEC's Web site — www.sec.gov. To obtain a written copy of each fund's policies and procedures without charge, upon request, call us toll free at (800) 621-1048.
Portfolio Holdings
Following the Fund's fiscal first and third quarter-end, a complete portfolio holdings listing is filed with the SEC on Form N-Q. In addition, each month, information about the Fund and its portfolio holdings is filed with the SEC on Form N-MFP. The SEC delays the public availability of the information filed on Form N-MFP for 60 days after the end of the reporting period included in the filing. These forms will be available on the SEC's Web site at www.sec.gov, and they may also be reviewed and copied at the SEC's Public Reference Room in Washington, D.C. Information on the operation of the SEC's Public Reference Room may be obtained by calling (800) SEC-0330. The Fund's portfolio holdings are also posted on www.dws-investments.com from time to time. Please see the Fund's current prospectus for more information.
Investment Management Agreement Approval
Cash Reserve Fund — Prime Series (the "Fund"), a series of Cash Reserve Fund, Inc., invests all of its assets in Cash Management Portfolio (the "Portfolio") in order to achieve its investment objectives. The Portfolio's Board of Trustees approved the renewal of the Portfolio's investment management agreement (the "Portfolio Agreement") with Deutsche Investment Management Americas Inc. ("DWS") and the Fund's Board of Directors (which consists of the same members as the Board of Trustees of the Portfolio) approved the renewal of the Fund's investment management agreement with DWS (the "Fund Agreement," and together with the Portfolio Agreement, the "Agreements") in September 2011. The Portfolio's Board of Trustees and the Fund's Board of Directors are collectively referred to as the "Board."
In terms of the process that the Board followed prior to approving the Agreements, shareholders should know that:
· In September 2011, all of the Portfolio's Trustees and the Fund's Directors were independent of DWS and its affiliates.
· The Board met frequently during the past year to discuss fund matters and dedicated a substantial amount of time to contract review matters. Over the course of several months, the Board's Contract Committee, in coordination with the Board's Fixed Income and Quant Oversight Committee, reviewed comprehensive materials received from DWS, independent third parties and independent counsel. These materials included an analysis of performance, fees and expenses, and profitability compiled by an independent fee consultant. The Board also received extensive information throughout the year regarding performance of the Portfolio and the Fund.
· The Independent Trustees/Directors regularly meet privately with their independent counsel to discuss contract review and other matters. In addition, the Independent Trustees/Directors were also advised by an independent fee consultant in the course of their review of the Portfolio's and the Fund's contractual arrangements and considered a comprehensive report prepared by the independent fee consultant in connection with their deliberations (the "IFC Report").
· In connection with reviewing the Agreements, the Board also reviewed the terms of the Fund's distribution agreement, administrative services agreement, transfer agency agreement and other material service agreements.
· Based on its evaluation of the information provided, the Contract Committee presented its findings and recommendations to the Board. The Board then reviewed the Contract Committee's findings and recommendations.
In connection with the contract review process, the Contract Committee and the Board considered the factors discussed below, among others. The Board also considered that DWS and its predecessors have managed the Portfolio and the Fund since their inception, and the Board believes that a long-term relationship with a capable, conscientious advisor is in the best interests of the Portfolio and the Fund. The Board considered, generally, that shareholders chose to invest or remain invested in the Fund knowing that DWS managed the Portfolio and the Fund, and that the Fund Agreement was approved by the Fund's shareholders. DWS is part of Deutsche Bank, a major global banking institution that is engaged in a wide range of financial services. The Board believes that there are significant advantages to being part of a global asset management business that offers a wide range of investing expertise and resources, including hundreds of portfolio managers and analysts with research capabilities in many countries throughout the world.
While shareholders may focus primarily on fund performance and fees, the Board considers these and many other factors, including the quality and integrity of DWS's personnel and such other issues as back-office operations, fund valuations, and compliance policies and procedures.
Nature, Quality and Extent of Services. The Board considered the terms of the Agreements, including the scope of advisory services provided under the Agreements. The Board noted that, under the Agreements, DWS provides portfolio management services to the Portfolio and the Fund and that, pursuant to separate administrative services agreements, DWS provides administrative services to the Portfolio and the Fund. The Board considered the experience and skills of senior management and investment personnel, the resources made available to such personnel, the ability of DWS to attract and retain high-quality personnel, and the organizational depth and stability of DWS. The Board reviewed the Portfolio's and the Fund's performance over short-term and long-term periods and compared those returns to various agreed-upon performance measures, including market indices and a peer universe compiled by the independent fee consultant using information supplied by iMoneyNet Inc. ("iMoneyNet"). The Board also noted that it has put into place a process of identifying "Focus Funds" (e.g., funds performing poorly relative to their benchmark or a peer universe compiled by an independent fund data service), and receives more frequent reporting and information from DWS regarding such funds, along with DWS's remedial plans to address underperformance. The Board believes this process is an effective manner of identifying and addressing underperforming funds. Based on the information provided, the Board noted that for the one- and three-year periods ended December 31, 2010, the Fund's gross performance (Prime Institutional Shares) was in the 3rd quartile of the applicable iMoneyNet universe (the 1st quartile being the best performers and the 4th quartile being the worst performers).
On the basis of this evaluation and the ongoing review of investment results by the Board, the Board concluded that the nature, quality and extent of services provided by DWS historically have been and continue to be satisfactory.
Fees and Expenses. The Board considered the Portfolio's and the Fund's investment management fee schedules and the Fund's operating expenses and total expense ratios, and comparative information provided by Lipper Inc. ("Lipper") and the independent fee consultant regarding investment management fee rates paid to other investment advisors by similar funds (1st quartile being the most favorable and 4th quartile being the least favorable). With respect to management fees paid to other investment advisors by similar funds, the Board noted that the contractual fee rates paid by the Portfolio and the Fund, which include 0.03% and 0.10% fees paid to DWS under the respective administrative services agreements, were lower than the median (2nd quartile) of the applicable Lipper peer group (based on Lipper data provided as of December 31, 2010). The Board noted that, although shareholders of the Fund indirectly bear the Portfolio's management fee, the Fund does not charge an additional investment management fee. The Board noted that the Fund's total (net) operating expenses, which include Portfolio expenses allocated to the Fund, were expected to be higher than the median of the applicable Lipper expense universe for the Prime Institutional Shares (3rd quartile) and Managed Shares (4th quartile) and lower than the median of the applicable Lipper expense universe for Prime Shares (2nd quartile) (based on Lipper data provided as of December 31, 2010). The Board considered the Portfolio's management fee rate as compared to fees charged by DWS and certain of its affiliates for comparable mutual funds and considered differences in fund and fee structures between the DWS Funds. The Board also considered how the Fund's total (net) operating expenses compared to the total (net) operating expenses of a more customized peer group selected by Lipper (based on such factors as asset size). The Board also noted that the expense limitations agreed to by DWS helped to ensure that the Fund's and the Portfolio's combined total (net) operating expenses would remain competitive.
The information considered by the Board as part of its review of management fees included information regarding fees charged by DWS and its affiliates to similar institutional accounts and to similar funds offered primarily to European investors ("DWS Europe funds"), in each case as applicable. The Board observed that advisory fee rates for institutional accounts generally were lower than the management fees charged by similarly managed DWS U.S. mutual funds ("DWS Funds"), but also took note of the differences in services provided to DWS Funds as compared to institutional accounts. In the case of DWS Europe funds, the Board observed that fee rates for DWS Europe funds generally were higher than for similarly managed DWS Funds, but noted that differences in the types of services provided to DWS Funds relative to DWS Europe funds made it difficult to compare such fees.
On the basis of the information provided, the Board concluded that management fees were reasonable and appropriate in light of the nature, quality and extent of services provided by DWS.
Profitability. The Board reviewed detailed information regarding revenues received by DWS under the Agreements. The Board considered the estimated costs and pre-tax profits realized by DWS from advising the DWS Funds, as well as estimates of the pre-tax profits attributable to managing the Fund in particular. The Board also received information regarding the estimated enterprise-wide profitability of DWS and its affiliates with respect to all fund services in totality and by fund. The Board and the independent fee consultant reviewed DWS's methodology in allocating its costs to the management of the Fund. Based on the information provided, the Board concluded that the pre-tax profits realized by DWS in connection with the management of the Fund were not unreasonable. The Board also reviewed information regarding the profitability of certain similar investment management firms. The Board noted that while information regarding the profitability of such firms is limited (and in some cases is not necessarily prepared on a comparable basis), DWS and its affiliates' overall profitability with respect to the DWS fund complex (after taking into account distribution and other services provided to the funds by DWS and its affiliates) was lower than the overall profitability levels of many comparable firms for which such data was available.
Economies of Scale. The Board considered whether there are economies of scale with respect to the management of the Portfolio and the Fund and whether the Portfolio and the Fund benefit from any economies of scale. The Board noted that the Portfolio's management fee schedule includes fee breakpoints. The Board concluded that the Portfolio's and the Fund's fee schedules represent an appropriate sharing between the Portfolio and the Fund, as the case may be, and DWS of such economies of scale as may exist in the management of the Portfolio and the Fund at current asset levels.
Other Benefits to DWS and Its Affiliates. The Board also considered the character and amount of other incidental benefits received by DWS and its affiliates, including any fees received by DWS for administrative services provided to the Portfolio and the Fund and any fees received by an affiliate of DWS for distribution services. The Board also considered benefits to DWS related to brokerage and soft-dollar allocations, including allocating brokerage to pay for research generated by parties other than the executing broker dealers, which pertain primarily to funds investing in equity securities, along with the incidental public relations benefits to DWS related to DWS Funds advertising and cross-selling opportunities among DWS products and services. The Board concluded that management fees were reasonable in light of these fallout benefits.
Compliance. The Board considered the significant attention and resources dedicated by DWS to documenting and enhancing its compliance processes in recent years. The Board noted in particular (i) the experience and seniority of both DWS's chief compliance officer and the Fund's chief compliance officer; (ii) the large number of DWS compliance personnel; and (iii) the substantial commitment of resources by DWS and its affiliates to compliance matters.
Based on all of the information considered and the conclusions reached, the Board unanimously determined that the continuation of the Agreements is in the best interests of the Portfolio and the Fund. In making this determination, the Board did not give particular weight to any single factor identified above. The Board considered these factors over the course of numerous meetings, certain of which were in executive session with only the Independent Trustees/Directors and their counsel present. It is possible that individual Trustees/Directors may have weighed these factors differently in reaching their individual decisions to approve the continuation of the Agreements.
Summary of Management Fee Evaluation by Independent Fee Consultant
September 26, 2011
Pursuant to an Order entered into by Deutsche Investment Management Americas and affiliates (collectively, "DeAM") with the Attorney General of New York, I, Thomas H. Mack, have been appointed the Independent Fee Consultant for the DWS Funds (formerly the DWS Scudder Funds). My duties include preparing an annual written evaluation of the management fees DeAM charges the Funds, considering among other factors the management fees charged by other mutual fund companies for like services, management fees DeAM charges other clients for like services, DeAM's costs of supplying services under the management agreements and related profit margins, possible economies of scale if a Fund grows larger, and the nature and quality of DeAM's services, including fund performance. This report summarizes my evaluation for 2011, including my qualifications, the evaluation process for each of the DWS Funds, consideration of certain complex-level factors, and my conclusions. I served in substantially the same capacity in 2007, 2008, 2009 and 2010.
Qualifications
For more than 35 years I have served in various professional capacities within the investment management business. I have held investment analysis and advisory positions, including securities analyst, portfolio strategist and director of investment policy with a large investment firm. I have also performed business management functions, including business development, financial management and marketing research and analysis.
Since 1991, I have been an independent consultant within the asset management industry. I have provided services to over 125 client organizations, including investment managers, mutual fund boards, product distributors and related organizations. Over the past ten years I have completed a number of assignments for mutual fund boards, specifically including assisting boards with management contract renewal.
I hold a Master of Business Administration degree, with highest honors, from Harvard University and Master of Science and Bachelor of Science (highest honors) degrees from the University of California at Berkeley. I am an independent director and audit committee financial expert for two closed-end mutual funds and have served in various leadership and financial oversight capacities with non-profit organizations.
Evaluation of Fees for each DWS Fund
My work focused primarily on evaluating, fund-by-fund, the fees charged to each of the 109 mutual fund portfolios in the DWS Fund family. For each Fund, I considered each of the key factors mentioned above, as well as any other relevant information. In doing so I worked closely with the Funds' Independent Directors in their annual contract renewal process, as well as in their approval of contracts for several new funds (documented separately).
In evaluating each Fund's fees, I reviewed comprehensive materials provided by or on behalf of DeAM, including expense information prepared by Lipper Analytical, comparative performance information, profitability data, manager histories, and other materials. I also accessed certain additional information from the Lipper and Morningstar databases and drew on my industry knowledge and experience.
To facilitate evaluating this considerable body of information, I prepared for each Fund a document summarizing the key data elements in each area as well as additional analytics discussed below. This made it possible to consider each key data element in the context of the others.
In the course of contract renewal, DeAM agreed to implement a number of fee and expense adjustments requested by the Independent Directors which will favorably impact future fees and expenses, and my evaluation includes the effects of these changes.
Fees and Expenses Compared with Other Funds
The competitive fee and expense evaluation for each fund focused on two primary comparisons:
The Fund's contractual management fee (the advisory fee plus the administration fee where applicable) compared with those of a group of typically 12-15 funds in the same Lipper investment category (e.g. Large Capitalization Growth) having similar distribution arrangements and being of similar size.
The Fund's total expenses compared with a broader universe of funds from the same Lipper investment category and having similar distribution arrangements.
These two comparisons provide a view of not only the level of the fee compared with funds of similar scale but also the total expense the Fund bears for all the services it receives, in comparison with the investment choices available in the Fund's investment category and distribution channel. The principal figure-of-merit used in these comparisons was the subject Fund's percentile ranking against peers.
DeAM's Fees for Similar Services to Others
DeAM provided management fee schedules for all of its US domiciled fund and non-fund investment management accounts in any of the investment categories where there is a DWS Fund. These similar products included the other DWS Funds, non-fund pooled accounts, institutional accounts and sub-advisory accounts. Using this information, I calculated for each Fund the fee that would be charged to each similar product, at the subject Fund's asset level.
Evaluating information regarding non-fund products is difficult because there are varying levels of services required for different types of accounts, with mutual funds generally requiring considerably more regulatory and administrative types of service as well as having more frequent cash flows than other types of accounts. Also, while mutual fund fees for similar fund products can be expected to be similar, there will be some differences due to different pricing conditions in different distribution channels (e.g. retail funds versus those used in variable insurance products), differences in underlying investment processes and other factors.
Costs and Profit Margins
DeAM provided a detailed profitability analysis for each Fund. After making some adjustments so that the presentation would be more comparable to the available industry figures, I reviewed profit margins from investment management alone, from investment management plus other fund services (excluding distribution) provided to the Funds by DeAM (principally shareholder services), and DeAM profits from all sources, including distribution. A later section comments on overall profitability.
Economies of Scale
Economies of scale — an expected decline in management cost per dollar of fund assets as fund assets grow — are very rarely quantified and documented because of inherent difficulties in collecting and analyzing relevant data. However, in virtually every investment category that I reviewed, larger funds tend to have lower fees and lower total expenses than smaller funds. To see how each DWS Fund compares with this industry observation, I reviewed:
The trend in Fund assets over the last five years and the accompanying trend in total expenses. This shows if the Fund has grown and, if so, whether total expense (management fees as well as other expenses) have declined as a percent of assets.
Whether the Fund has break-points in its management fee schedule, the extent of the fee reduction built into the schedule and the asset levels where the breaks take effect, and in the case of a sub-advised Fund how the Fund's break-points compare with those of the sub-advisory fee schedule.
How the Fund's contractual fee schedule compares with trends in the industry data. To accomplish this, I constructed a chart showing how actual latest-fiscal-year contractual fees of the Fund and of other similar funds relate to average fund assets, with the subject Fund's contractual fee schedule superimposed.
Quality of Service — Performance
The quality-of-service evaluation focused on investment performance, which is the principal result of the investment management service. Each Fund's performance was reviewed over the past 1, 3, 5 and 10 years, as applicable, and compared with that of other funds in the same investment category and with a suitable market index.
In addition, I calculated and reviewed risk-adjusted returns relative to an index of similar mutual funds' returns and a suitable market index. The risk-adjusted returns analysis provides a way of determining the extent to which the Fund's return comparisons are mainly the product of investment value-added (or lack thereof) or alternatively taking considerably more or less risk than is typical in its investment category.
I also received and considered the history of portfolio manager changes for each Fund, as this provided an important context for evaluating the performance results.
Complex-Level Considerations
While this evaluation was conducted mainly at the individual fund level, there are some issues relating to the reasonableness of fees that can alternatively be considered across the whole fund complex:
I reviewed DeAM's profitability analysis for all DWS Funds, with a view toward determining if the allocation procedures used were reasonable and how profit levels compared with public data for other investment managers.
I considered whether DeAM and affiliates receive any significant ancillary or "fall-out" benefits that should be considered in interpreting the direct profitability results. These would be situations where serving as the investment manager of the Funds is beneficial to another part of the Deutsche Bank organization.
I considered how aggregated DWS Fund expenses had varied over the years, by asset class and in the context of trends in asset levels.
I reviewed the structure of the DeAM organization, trends in staffing levels, and information on compensation of investment management and other professionals compared with industry data.
Findings
Based on the process and analysis discussed above, which included reviewing a wide range of information from management and external data sources and considering among other factors the fees DeAM charges other clients, the fees charged by other fund managers, DeAM's costs and profits associated with managing the Funds, economies of scale, possible fall-out benefits, and the nature and quality of services provided, in my opinion the management fees charged the DWS Funds are reasonable.
Thomas H. Mack
President, Thomas H. Mack & Co., Inc.
Board Members and Officers
The following table presents certain information regarding the Board Members and Officers of the Corporation of Cash Reserve Fund -- Prime Series and the Trust of Cash Management Portfolio as of December 31, 2011. Each Board Member's year of birth is set forth in parentheses after his or her name. Unless otherwise noted, (i) each Board Member has engaged in the principal occupation(s) noted in the table for at least the most recent five years, although not necessarily in the same capacity; and (ii) the address of each Independent Board Member is c/o Paul K. Freeman, Independent Chairman, DWS Funds, PO Box 101833, Denver, CO 80250-1833. Except as otherwise noted below, the term of office for each Board Member is until the election and qualification of a successor, or until such Board Member sooner dies, resigns, is removed or as otherwise provided in the governing documents of the fund. Because the fund does not hold an annual meeting of shareholders, each Board Member will hold office for an indeterminate period. The Board Members may also serve in similar capacities with other funds in the fund complex. The Length of Time Served represents the year in which the Board Member joined the Board of one or more DWS funds now overseen by the Board.
| Independent Board Members |
Name, Year of Birth, Position with the Fund and Length of Time Served1 | Business Experience and Directorships During the Past Five Years | Number of Funds in DWS Fund Complex Overseen |
Other Directorships Held by Board Member |
Paul K. Freeman (1950) Chairperson since 2009 Board Member since 1993 | Consultant, World Bank/Inter-American Development Bank; Executive and Governing Council of the Independent Directors Council (Chairman of Education Committee); formerly: Project Leader, International Institute for Applied Systems Analysis (1998-2001); Chief Executive Officer, The Eric Group, Inc. (environmental insurance) (1986-1998) | 110 | — |
John W. Ballantine (1946) Board Member since 1999 | Retired; formerly, Executive Vice President and Chief Risk Management Officer, First Chicago NBD Corporation/The First National Bank of Chicago (1996-1998); Executive Vice President and Head of International Banking (1995-1996). Directorships: Chairman of the Board, Healthways, Inc. (provider of disease and care management services); Portland General Electric (utility company); Stockwell Capital Investments PLC (private equity); former Directorships: First Oak Brook Bancshares, Inc. and Oak Brook Bank; Prisma Energy International | 110 | — |
Henry P. Becton, Jr. (1943) Board Member since 1990 | Vice Chair and former President, WGBH Educational Foundation. Directorships: Association of Public Television Stations; Public Radio International; Public Radio Exchange (PRX); The PBS Foundation; former Directorships: Boston Museum of Science; American Public Television; Concord Academy; New England Aquarium; Mass. Corporation for Educational Telecommunications; Committee for Economic Development; Public Broadcasting Service | 110 | Lead Director, Becton Dickinson and Company2 (medical technology company); Lead Director, Belo Corporation2 (media company) |
Dawn-Marie Driscoll (1946) Board Member since 1987 | President, Driscoll Associates (consulting firm); Executive Fellow, Center for Business Ethics, Bentley University; formerly, Partner, Palmer & Dodge (1988-1990); Vice President of Corporate Affairs and General Counsel, Filene's (1978-1988). Directorships: Director of ICI Mutual Insurance Company (since 2007); Advisory Board, Center for Business Ethics, Bentley University; Trustee, Southwest Florida Community Foundation (charitable organization); former Directorships: Investment Company Institute (audit, executive, nominating committees) and Independent Directors Council (governance, executive committees) | 110 | Trustee, Sun Capital Advisers, Inc. (22 open-end mutual funds advised by Sun Capital Advisers, Inc.) (since 2007) |
Keith R. Fox, CFA (1954) Board Member since 1996 | Managing General Partner, Exeter Capital Partners (a series of private investment funds) (since 1986). Directorships: Progressive International Corporation (kitchen goods importer and distributor); BoxTop Media Inc. (advertising); The Kennel Shop (retailer); former Chairman, National Association of Small Business Investment Companies | 110 | Trustee, Sun Capital Advisers, Inc. (22 open-end mutual funds advised by Sun Capital Advisers, Inc.) (since 2011) |
Kenneth C. Froewiss (1945) Board Member since 2001 | Adjunct Professor of Finance, NYU Stern School of Business (September 2009-present; Clinical Professor from 1997-September 2009); Member, Finance Committee, Association for Asian Studies (2002-present); Director, Mitsui Sumitomo Insurance Group (US) (2004-present); prior thereto, Managing Director, J.P. Morgan (investment banking firm) (until 1996) | 110 | — |
Richard J. Herring (1946) Board Member since 1990 | Jacob Safra Professor of International Banking and Professor, Finance Department, The Wharton School, University of Pennsylvania (since July 1972); Co-Director, Wharton Financial Institutions Center (since July 2000); Co-Chair, U.S. Shadow Financial Regulatory Committee; Executive Director, Financial Economists Roundtable; formerly: Vice Dean and Director, Wharton Undergraduate Division (July 1995-June 2000); Director, Lauder Institute of International Management Studies (July 2000-June 2006) | 110 | Director, Japan Equity Fund, Inc. (since September 2007), Thai Capital Fund, Inc. (since September 2007), Singapore Fund, Inc. (since September 2007), Independent Director of Barclays Bank Delaware (since September 2010) |
William McClayton (1944) Board Member since 2004 | Private equity investor (since October 2009); previously, Managing Director, Diamond Management & Technology Consultants, Inc. (global consulting firm) (2001-2009); Directorship: Board of Managers, YMCA of Metropolitan Chicago; formerly: Senior Partner, Arthur Andersen LLP (accounting) (1966-2001); Trustee, Ravinia Festival | 110 | — |
Rebecca W. Rimel (1951) Board Member since 1995 | President and Chief Executive Officer, The Pew Charitable Trusts (charitable organization) (1994 to present); Trustee, Washington College (2011 to present); formerly: Executive Vice President, The Glenmede Trust Company (investment trust and wealth management) (1983-2004); Board Member, Investor Education (charitable organization) (2004-2005); Trustee, Executive Committee, Philadelphia Chamber of Commerce (2001-2007); Trustee, Pro Publica (charitable organization) (2007-2010); Trustee, Thomas Jefferson Foundation (charitable organization) (1994 to 2011) | 110 | Director, CardioNet, Inc.2 (health care) (2009- present); Director, Viasys Health Care2 (January 2007- June 2007) |
William N. Searcy, Jr. (1946) Board Member since 1993 | Private investor since October 2003; formerly: Pension & Savings Trust Officer, Sprint Corporation2 (telecommunications) (November 1989-September 2003) | 110 | Trustee, Sun Capital Advisers, Inc. (22 open-end mutual funds advised by Sun Capital Advisers, Inc.) (since 1998) |
Jean Gleason Stromberg (1943) Board Member since 1997 | Retired. Formerly, Consultant (1997-2001); Director, Financial Markets US Government Accountability Office (1996-1997); Partner, Fulbright & Jaworski, L.L.P. (law firm) (1978-1996). Directorships: The William and Flora Hewlett Foundation; former Directorships: Service Source, Inc., Mutual Fund Directors Forum (2002-2004), American Bar Retirement Association (funding vehicle for retirement plans) (1987-1990 and 1994-1996) | 110 | — |
Robert H. Wadsworth (1940) Board Member since 1999 | President, Robert H. Wadsworth & Associates, Inc. (consulting firm) (1983 to present); Director, The Phoenix Boys Choir Association | 113 | — |
Officers4 |
Name, Year of Birth, Position with the Fund and Length of Time Served5 | Principal Occupation(s) During Past 5 Years and Other Directorships Held |
W. Douglas Beck, CFA6 (1967) President, 2011-present | Managing Director3, Deutsche Asset Management (2006-present); President of DWS family of funds and Head of Product Management, U.S. for DWS Investments; formerly, Executive Director, Head of Product Management (2002-2006) and President (2005-2006) of the UBS Funds at UBS Global Asset Management; Co-Head of Manager Research/Managed Solutions Group, Merrill Lynch (1998-2002) |
John Millette7 (1962) Vice President and Secretary, 1999-present | Director3, Deutsche Asset Management |
Paul H. Schubert6 (1963) Chief Financial Officer, 2004-present Treasurer, 2005-present | Managing Director3, Deutsche Asset Management (since July 2004); formerly, Executive Director, Head of Mutual Fund Services and Treasurer for UBS Family of Funds (1998-2004); Vice President and Director of Mutual Fund Finance at UBS Global Asset Management (1994-1998) |
Caroline Pearson7 (1962) Chief Legal Officer, 2010-present | Managing Director3, Deutsche Asset Management; formerly, Assistant Secretary for DWS family of funds (1997-2010) |
Rita Rubin6 (1970) Assistant Secretary, 2009-present | Director3 and Senior Counsel, Deutsche Asset Management (since October 2007); formerly, Vice President, Morgan Stanley Investment Management (2004-2007) |
Paul Antosca7 (1957) Assistant Treasurer, 2007-present | Director3, Deutsche Asset Management (since 2006); Vice President, The Manufacturers Life Insurance Company (U.S.A.) (1990-2006) |
Jack Clark7 (1967) Assistant Treasurer, 2007-present | Director3, Deutsche Asset Management (since 2007); formerly, Vice President, State Street Corporation (2002-2007) |
Diane Kenneally7 (1966) Assistant Treasurer, 2007-present | Director3, Deutsche Asset Management |
John Caruso6 (1965) Anti-Money Laundering Compliance Officer, 2010-present | Managing Director3, Deutsche Asset Management |
Robert Kloby6 (1962) Chief Compliance Officer, 2006-present | Managing Director3, Deutsche Asset Management |
1 The length of time served represents the year in which the Board Member joined the board of one or more DWS funds currently overseen by the Board.
2 A publicly held company with securities registered pursuant to Section 12 of the Securities Exchange Act of 1934.
3 Executive title, not a board directorship.
4 As a result of their respective positions held with the Advisor, these individuals are considered "interested persons" of the Advisor within the meaning of the 1940 Act. Interested persons receive no compensation from the fund.
5 The length of time served represents the year in which the officer was first elected in such capacity for one or more DWS funds.
6 Address: 60 Wall Street, New York, NY 10005.
7 Address: One Beacon Street, Boston, MA 02108.
The fund's Statement of Additional Information ("SAI") includes additional information about the Board Members. The SAI is available, without charge, upon request. If you would like to request a copy of the SAI, you may do so by calling the following toll-free number: (800) 621-1048.
Notes
Cash Reserves Fund Institutional
Annual Report
to Shareholders
December 31, 2011
Contents
Cash Reserves Fund Institutional 3 Portfolio Management Review 7 Statement of Assets and Liabilities 8 Statement of Operations 9 Statement of Changes in Net Assets 11 Notes to Financial Statements 15 Report of Independent Registered Public Accounting Firm 16 Information About Your Fund's Expenses Cash Management Portfolio 36 Statement of Assets and Liabilities 37 Statement of Operations 38 Statement of Changes in Net Assets 40 Notes to Financial Statements 44 Report of Independent Registered Public Accounting Firm 45 Investment Management Agreement Approval 50 Summary of Management Fee Evaluation by Independent Fee Consultant 54 Board Members and Officers 59 Account Management Resources |
This report must be preceded or accompanied by a prospectus. To obtain a summary prospectus, if available, or prospectus for any of our funds, refer to the Account Management Resources information provided in the back of this booklet. We advise you to consider the fund's objectives, risks, charges and expenses carefully before investing. The summary prospectus and prospectus contain this and other important information about the fund. Please read the prospectus carefully before you invest.
An investment in this fund is not insured or guaranteed by the Federal Deposit Insurance Corporation (FDIC) or by any other government agency. Although the fund seeks to preserve the value of your investment at $1.00 per share, it is possible to lose money by investing in the fund. The share price of money market funds can fall below the $1.00 share price. You should not rely on or expect the Advisor to enter into support agreements or take other actions to maintain the fund's $1.00 share price. The credit quality of the fund's holdings can change rapidly in certain markets, and the default of a single holding could have an adverse impact on the fund's share price. The fund's share price can also be negatively affected during periods of high redemption pressures and/or illiquid markets. The actions of a few large investors of the fund may have a significant adverse effect on the share price of the fund. See the prospectus for specific details regarding the fund's risk profile.
DWS Investments is part of Deutsche Bank's Asset Management division and, within the U.S., represents the retail asset management activities of Deutsche Bank AG, Deutsche Bank Trust Company Americas, Deutsche Investment Management Americas Inc. and DWS Trust Company.
NOT FDIC/NCUA INSURED NO BANK GUARANTEE MAY LOSE VALUE NOT A DEPOSIT NOT INSURED BY ANY FEDERAL GOVERNMENT AGENCY
Portfolio Management Review
Market Overview
All performance information below is historical and does not guarantee future results. Investment return and principal fluctuate, so your shares may be worth more or less when redeemed. Current performance may differ from performance data shown. Please visit www.dbadvisorsliquidity.com/US for the fund's most recent month-end performance. The 7-day current yield refers to the income paid by the fund over a 7-day period expressed as an annual percentage rate of the fund's shares outstanding. Yields fluctuate and are not guaranteed.
Over the fund's most recent 12-month period ended December 31, 2011, money markets were responding to alternating degrees of perceived risk in the global financial markets, with short-term rates rising or falling slightly in response to the current state of the European sovereign debt crisis. During the summer, the political standoff in the United States related to the raising of the U.S. debt ceiling spurred volatility in financial markets. The extreme difficulties that Congress encountered in coming to agreement regarding the debt ceiling made up a large part of the rationale cited by Standard & Poor's® in deciding to downgrade U.S. debt from AAA to AA+ on August 5, 2011. However, the United States' role as a perceived "safe haven" for fixed-income investors worldwide has thus far remained unchanged. In addition, credit downgrades of various domestic and international banks and "credit watches" instituted by ratings agencies on some European countries exerted pressure on the money markets. Encouragingly, the European Central Bank (ECB) has made some extraordinary efforts over the past several months to head off additional problems for European governments and banks by securing funding access for the major banks in Europe.

Positive Contributors to Fund Performance
We were able to maintain a competitive yield for the fund during the period.
Over the period, we continued to hold a large percentage of portfolio assets in short-maturity instruments for liquidity purposes as well as for high quality and yield. We also maintained a higher than average maturity, with fund assets broadly diversified among a number of different sectors, including banks, corporate issues, U.S. government securities and municipal debt, though diversification neither assures a profit nor guarantees against loss. In addition, we focused on more favorable geographical areas for money market investment, such as Canada, Australia and the Nordic region. Lastly, given market uncertainty and our desire to maintain larger cash positions in the fund, we found value in municipal Variable Rate Demand Notes compared with taxable alternatives of the same maturity, such as bank Certificates of Deposit.
Fund Performance (as of December 31, 2011)
Performance is historical and does not guarantee future results. Current performance may be lower or higher than the performance data quoted.
An investment in this fund is not insured or guaranteed by the FDIC or by any other government agency. Although the fund seeks to preserve the value of your investment at $1.00 per share, it is possible to lose money by investing in the fund. The share price of money market funds can fall below the $1.00 share price.
| 7-Day Current Yield |
| December 31, 2011 | .01%* |
| December 31, 2010 | .12%* |
| * The investment advisor has agreed to waive fees/reimburse expenses. Without such fee waivers/expense reimbursements, the 7-day current yield would have been lower. |
Yields are historical, will fluctuate and do not guarantee future performance. The 7-day current yield refers to the income paid by the portfolio over a 7-day period expressed as an annual percentage rate of the fund's shares outstanding. Please visit our Web site at www.dbadvisorsliquidity.com/US for the product's most recent month-end performance.
Negative Contributors to Fund Performance
The types of securities that we were investing in during the period ended December 31, 2011, tended to have shorter maturities and lower yields than issues carrying more risk. We preferred to be cautious during a time of market fluctuation. In the end this cost the fund some yield, but we believe that this represented a prudent approach to preserving principal.
| "Encouragingly, the European Central Bank (ECB) has made some extraordinary efforts over the past several months to head off additional problems for European governments and banks by securing funding access for the major banks in Europe." |
Outlook and Positioning
Positive news for U.S. markets has come recently in the form of improved economic reports, including a pickup in manufacturing activity and some declines in domestic unemployment. The U.S. Federal Reserve Board (the Fed) has been doing its part by continuing its accommodative monetary policy and hinting at additional transparency for financial market participants in the near term. The main headwind to improved economic and financial market prospects comes from uncertainty over the European sovereign debt crisis. With several European countries facing austerity measures, we tend to believe that Europe is on the precipice of a recession. Market participants are urgently wishing for concrete and permanent solutions to the European crisis in the hopes that such a result would encourage further global economic progress and reduce financial market uncertainty.
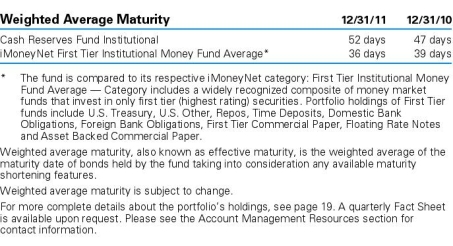
We continue our insistence on the highest credit quality within the fund. We also continue to apply a careful approach to investing on behalf of the fund and to seek competitive yield for our shareholders.
Portfolio Management Team
A group of investment professionals is responsible for the day-to-day management of the fund. These investment professionals have a broad range of experience managing money market funds.
The views expressed reflect those of the portfolio management team only through the end of the period of the report as stated on the cover. The management team's views are subject to change at any time based on market and other conditions and should not be construed as a recommendation. Past performance is no guarantee of future results. Current and future portfolio holdings are subject to risk.
Terms to Know
Municipal debt is state and local government bonds issued to finance capital expenditures.
Credit quality measures a bond issuer's ability to repay interest and principal in a timely manner. Rating agencies assign letter designations, such as AAA, AA and so forth. The lower the rating, the higher the probability of default. Credit quality does not remove market risk and is subject to change.
Statement of Assets and Liabilities | as of December 31, 2011 | |
| Assets | |
| Investment in Cash Management Portfolio, at value | | $ | 1,992,456,366 | |
| Receivable for Fund shares sold | | | 813,158 | |
| Other assets | | | 19,981 | |
| Total assets | | | 1,993,289,505 | |
| Liabilities | |
| Distributions payable | | | 6,655 | |
| Other accrued expenses and payables | | | 199,278 | |
| Total liabilities | | | 205,933 | |
| Net assets, at value | | $ | 1,993,083,572 | |
| Net Assets Consist of | |
| Accumulated net realized gain (loss) | | | (275,568 | ) |
| Paid-in capital | | | 1,993,359,140 | |
| Net assets, at value | | $ | 1,993,083,572 | |
| Net Asset Value | |
Net Asset Value, offering and redemption price per share ($1,993,083,572 ÷ 1,993,547,912 outstanding shares of beneficial interest, $.01 par value, unlimited number of shares authorized) | | $ | 1.00 | |
The accompanying notes are an integral part of the financial statements.
| for the year ended December 31, 2011 | |
| Investment Income | |
Income and expenses allocated from Cash Management Portfolio: Interest | | $ | 6,191,992 | |
| Expenses* | | | (3,693,286 | ) |
| Net investment income allocated from Cash Management Portfolio | | | 2,498,706 | |
Expenses: Administration fee | | | 2,416,388 | |
| Services to shareholders | | | 172,869 | |
| Service fees | | | 100,305 | |
| Professional fees | | | 36,556 | |
| Reports to shareholders | | | 46,952 | |
| Registration fees | | | 26,618 | |
| Trustees' fees and expenses | | | 3,187 | |
| Other | | | 41,531 | |
| Total expenses before expense reductions | | | 2,844,406 | |
| Expense reductions | | | (1,575,513 | ) |
| Total expenses after expense reductions | | | 1,268,893 | |
| Net investment income | | | 1,229,813 | |
| Net realized gain (loss) allocated from Cash Management Portfolio | | | 145,460 | |
| Net increase (decrease) in net assets resulting from operations | | $ | 1,375,273 | |
* Net of $243,715 Advisor reimbursement allocated from Cash Management Portfolio for the year ended December 31, 2011.
The accompanying notes are an integral part of the financial statements.
Statement of Changes in Net Assets | | | Years Ended December 31, | |
| Increase (Decrease) in Net Assets | | 2011 | | | 2010 | |
Operations: Net investment income | | $ | 1,229,813 | | | $ | 5,018,258 | |
| Net realized gain (loss) | | | 145,460 | | | | 1,479,943 | |
| Net increase (decrease) in net assets resulting from operations | | | 1,375,273 | | | | 6,498,201 | |
Distributions to shareholders from: Net investment income | | | (1,256,917 | ) | | | (5,180,258 | ) |
Fund share transactions: Proceeds from shares sold | | | 17,690,479,605 | | | | 30,814,908,862 | |
| Reinvestment of distributions | | | 861,333 | | | | 2,959,143 | |
| Payments for shares redeemed | | | (19,738,223,929 | ) | | | (33,188,371,955 | ) |
| Net increase (decrease) in net assets from Fund share transactions | | | (2,046,882,991 | ) | | | (2,370,503,950 | ) |
| Increase (decrease) in net assets | | | (2,046,764,635 | ) | | | (2,369,186,007 | ) |
| Net assets at beginning of period | | | 4,039,848,207 | | | | 6,409,034,214 | |
| Net assets at end of period (including undistributed net investment income of $0 and $0, respectively) | | $ | 1,993,083,572 | | | $ | 4,039,848,207 | |
| Other Information | |
| Shares outstanding at beginning of period | | | 4,040,430,903 | | | | 6,410,934,853 | |
| Shares sold | | | 17,690,479,605 | | | | 30,814,908,862 | |
| Shares issued to shareholders in reinvestment of distributions | | | 861,333 | | | | 2,959,143 | |
| Shares redeemed | | | (19,738,223,929 | ) | | | (33,188,371,955 | ) |
| Net increase (decrease) in Fund shares | | | (2,046,882,991 | ) | | | (2,370,503,950 | ) |
| Shares outstanding at end of period | | | 1,993,547,912 | | | | 4,040,430,903 | |
The accompanying notes are an integral part of the financial statements.
| | | Years Ended December 31, | |
| | | | 2011 | | | 2010 | | | 2009 | | | 2008 | | | 2007 | |
| Selected Per Share Data | |
| Net asset value, beginning of period | | $ | 1.00 | | | $ | 1.00 | | | $ | 1.00 | | | $ | 1.00 | | | $ | 1.00 | |
Income from investment operations: Net investment income | | | .000 | a | | | .001 | | | | .004 | | | | .027 | | | | .051 | |
Net realized gain (loss)a | | | .000 | | | | .000 | | | | .000 | | | | .000 | | | | .000 | |
| Total from investment operations | | | .000 | a | | | .001 | | | | .004 | | | | .027 | | | | .051 | |
Less distributions from: Net investment income | | | (.000 | )a | | | (.001 | ) | | | (.004 | ) | | | (.027 | ) | | | (.051 | ) |
| Net asset value, end of period | | $ | 1.00 | | | $ | 1.00 | | | $ | 1.00 | | | $ | 1.00 | | | $ | 1.00 | |
Total Return (%)b | | | .05 | | | | .13 | | | | .41 | | | | 2.75 | | | | 5.27 | |
| Ratios to Average Net Assets and Supplemental Data | |
| Net assets, end of period ($ millions) | | | 1,993 | | | | 4,040 | | | | 6,409 | | | | 4,409 | | | | 5,189 | |
| Ratio of expenses before expense reductions, including expenses allocated from Cash Management Portfolio (%) | | | .28 | | | | .28 | | | | .31 | | | | .29 | | | | .28 | |
| Ratio of expenses after expense reductions, including expenses allocated from Cash Management Portfolio (%) | | | .21 | | | | .20 | | | | .21 | | | | .19 | | | | .18 | |
| Ratio of net investment income (%) | | | .05 | | | | .12 | | | | .36 | | | | 2.86 | | | | 5.14 | |
a Amount is less than $.0005. b Total return would have been lower had certain expenses not been reduced. | |
Notes to Financial Statements
A. Organization and Significant Accounting Policies
Cash Reserves Fund Institutional (the "Fund'') is a series of DWS Money Market Trust (the "Trust''), which is registered under the Investment Company Act of 1940, as amended (the "1940 Act''), as an open-end management investment company organized as a Massachusetts business trust. The Fund is the successor to Cash Reserves Fund Institutional, a series of DWS Institutional Funds (the "Predecessor Fund"). On April 29, 2011, the Predecessor Fund transferred all of its assets and liabilities to the Trust, while retaining the same fund name. The transaction had no material effect on an investment in the Fund. All financial and other information contained herein for periods prior to April 29, 2011, is that of the Predecessor Fund.
The Fund, a feeder fund, seeks to achieve its investment objective by investing all of its investable assets in a master portfolio, the Cash Management Portfolio (the "Portfolio''), an open-end management investment company registered under the 1940 Act and organized as a New York business trust advised by Deutsche Investment Management Americas Inc. ("DIMA'' or the "Advisor''), an indirect, wholly owned subsidiary of Deutsche Bank AG. A master/feeder fund structure is one in which a fund (a "feeder fund"), instead of investing directly in a portfolio of securities, invests most or all of its investment assets in a separate registered investment company (the "master fund") with substantially the same investment objective and policies as the feeder fund. Such a structure permits the pooling of assets of two or more feeder funds, preserving separate identities or distribution channels at the feeder fund level. At December 31, 2011, the Fund owned approximately 10% of the Portfolio.
The Fund's financial statements are prepared in accordance with accounting principles generally accepted in the United States of America which require the use of management estimates. Actual results could differ from those estimates. The policies described below are followed consistently by the Fund in the preparation of its financial statements. The financial statements of the Portfolio, including the Investment Portfolio, are contained elsewhere in this report and should be read in conjunction with the Fund's financial statements.
Security Valuation. The Fund records its investment in the Portfolio at value, which reflects its proportionate interest in the net assets of the Portfolio. Valuation of the securities held by the Portfolio is discussed in the notes to the Portfolio's financial statements included elsewhere in this report.
Disclosure about the classification of fair value measurements is included in a table following the Portfolio's Investment Portfolio.
Federal Income Taxes. The Fund's policy is to comply with the requirements of the Internal Revenue Code, as amended, which are applicable to regulated investment companies, and to distribute all of its taxable income to its shareholders.
Under the Regulated Investment Company Modernization Act of 2010, net capital losses may be carried forward indefinitely, and their character is retained as short-term and/or long-term. Previously, net capital losses were carried forward for eight years and treated as short-term losses. As a transition rule, the Act requires that post-enactment net capital losses be used before pre-enactment net capital losses.
At December 31, 2011, the Fund had a net tax basis capital loss carryforward of approximately $276,000 of pre-enactment losses, which may be applied against any realized net taxable capital gains of each succeeding year until fully utilized or until December 31, 2016, the expiration date, whichever occurs first.
The Fund has reviewed the tax positions for the open tax years as of December 31, 2011, and has determined that no provision for income tax is required in the Fund's financial statements. The Fund's federal tax returns for the prior three fiscal years remain open subject to examination by the Internal Revenue Service.
Distribution of Income and Gains. Net investment income of the Fund is declared as a daily dividend and is distributed to shareholders monthly. The Fund may take into account capital gains and losses in its daily dividend declarations. The Fund may also make additional distributions for tax purposes if necessary.
Permanent book and tax differences relating to shareholder distributions will result in reclassifications to paid in capital. Temporary book and tax differences will reverse in a subsequent period. There were no significant book to tax differences for the Fund.
At December 31, 2011, the Fund's components of distributable earnings (accumulated losses) on a tax basis were as follows:
| Capital loss carryforward | | $ | (276,000 | ) |
In addition, the tax character of distributions paid to shareholders by the Fund is summarized as follows:
| | | Years Ended December 31, | |
| | | 2011 | | | 2010 | |
| Distributions from ordinary income | | $ | 1,256,917 | | | $ | 5,180,258 | |
Contingencies. In the normal course of business, the Fund may enter into contracts with service providers that contain general indemnification clauses. The Fund's maximum exposure under these arrangements is unknown as this would involve future claims that may be made against the Fund that have not yet been made. However, based on experience, the Fund expects the risk of loss to be remote.
Other. The Fund receives an allocation of the Portfolio's net investment income and net realized gains and losses in proportion to its investment in the Portfolio. Expenses directly attributed to a fund are charged to that fund, while expenses which are attributable to the Trust are allocated among the funds in the Trust on the basis of relative net assets.
B. Fees and Transactions with Affiliates
Management Agreement. Under the Investment Management Agreement with Deutsche Investment Management Americas Inc. ("DIMA" or the "Advisor"), an indirect, wholly owned subsidiary of Deutsche Bank AG, the Advisor serves as the investment manager to the Fund. The Advisor receives a management fee from the Portfolio pursuant to the master/feeder structure listed above in Note A.
Administration Fee. Pursuant to an Administrative Services Agreement, DIMA provides most administrative services to the Fund. For all services provided under the Administrative Services Agreement, the Fund pays the Advisor an annual fee ("Administration Fee") of 0.10% of the Fund's average daily net assets, computed and accrued daily and payable monthly.
For the period from January 1, 2011 through September 30, 2012, DIMA has contractually agreed to waive its fees and/or reimburse certain operating expenses of the Fund, including expenses of the Portfolio allocated to the Fund, to the extent necessary to maintain the operating expenses (excluding certain expenses such as extraordinary expenses, taxes, brokerage and interest) at 0.21% of the Fund's average daily net assets.
Accordingly, for the year ended December 31, 2011, the Administration Fee was $2,416,388, of which $1,312,073 was waived and $115,918 is unpaid.
In addition, the Advisor has agreed to voluntarily waive additional expenses. The waiver may be changed or terminated at any time without notice. Under this arrangement, the Advisor waived certain expenses of the Fund.
Service Provider Fees. DWS Investments Service Company ("DISC"), an affiliate of the Advisor, is the transfer agent, dividend-paying agent and shareholder service agent for the Fund. Pursuant to a sub-transfer agency agreement between DISC and DST Systems, Inc. ("DST"), DISC has delegated certain transfer agent, dividend-paying agent and shareholder service agent functions to DST. DISC compensates DST out of the shareholder servicing fee it receives from the Fund. For the year ended December 31, 2011, the amount charged to the Fund by DISC aggregated $163,040, all of which was waived.
In addition, for the year ended December 31, 2011, the Advisor reimbursed the Fund $95 of sub-recordkeeping expense.
Shareholder Servicing Fee. DWS Investments Distributors, Inc. ("DIDI"), an affiliate of the Advisor, provides information and administrative services for a fee ("Service Fee") to shareholders at an annual rate of up to 0.25% of average daily net assets. DIDI in turn has various agreements with financial services firms that provide these services and pays these fees based upon the assets of shareholder accounts the firm services. For the year ended December 31, 2011, the Service Fee was as follows:
| | | Total Aggregated | | | Waived | | | Annual Effective Rate | |
| Cash Reserves Fund Institutional | | $ | 100,305 | | | $ | 100,305 | | | | .00 | % |
Typesetting and Filing Service Fees. Under an agreement with DIMA, DIMA is compensated for providing typesetting and certain regulatory filing services to the Fund. For the year ended December 31, 2011, the amount charged to the Fund by DIMA included in Statement of Operations under "reports to shareholders" aggregated $21,242, of which $8,760 is unpaid.
Trustees' Fees and Expenses. The Fund paid each Trustee not affiliated with the Advisor retainer fees plus specified amounts for various committee services and for the Board Chairperson.
C. Concentration of Ownership
From time to time the Fund may have a concentration of several shareholder accounts holding a significant percentage of shares outstanding. Investment activities of these shareholders could have a material impact on the Fund.
At December 31, 2011, there was one shareholder account that held approximately 11% of the outstanding shares of the Fund.
Report of Independent Registered Public Accounting Firm
To the Trustees of DWS Money Market Trust and Shareholders of Cash Reserves Fund Institutional:
In our opinion, the accompanying statement of assets and liabilities and the related statements of operations and of changes in net assets and the financial highlights present fairly, in all material respects, the financial position of Cash Reserves Fund Institutional (hereafter referred to as the "Fund'') at December 31, 2011, and the results of its operations, the changes in its net assets and the financial highlights for each of the periods indicated therein, in conformity with accounting principles generally accepted in the United States of America. These financial statements and financial highlights (hereafter referred to as "financial statements'') are the responsibility of the Fund's management. Our responsibility is to express an opinion on these financial statements based on our audits. We conducted our audits of these financial statements in accordance with the standards of the Public Company Accounting Oversight Board (United States). Those standards require that we plan and perform the audits to obtain reasonable assurance about whether the financial statements are free of material misstatement. An audit includes examining, on a test basis, evidence supporting the amounts and disclosures in the financial statements, assessing the accounting principles used and significant estimates made by management, and evaluating the overall financial statement presentation. We believe that our audits provide a reasonable basis for our opinion.
Boston, Massachusetts February 24, 2012 | PricewaterhouseCoopers LLP |
Information About Your Fund's Expenses
As an investor of the Fund, you incur two types of costs: ongoing expenses and transaction costs. Ongoing expenses include management fees and other Fund expenses. Examples of transaction costs include account maintenance fees, which are not shown in this section. The following tables are intended to help you understand your ongoing expenses (in dollars) of investing in the Fund and to help you compare these expenses with the ongoing expenses of investing in other mutual funds. In the most recent six-month period, the Fund limited these expenses; had it not done so, expenses would have been higher. The example in the table is based on an investment of $1,000 invested at the beginning of the six-month period and held for the entire period (July 1, 2011 to December 31, 2011).
The tables illustrate your Fund's expenses in two ways:
·Actual Fund Return. This helps you estimate the actual dollar amount of ongoing expenses (but not transaction costs) paid on a $1,000 investment in the Fund using the Fund's actual return during the period. To estimate the expenses you paid over the period, simply divide your account value by $1,000 (for example, an $8,600 account value divided by $1,000 = 8.6), then multiply the result by the number in the "Expenses Paid per $1,000" line under the share class you hold.
·Hypothetical 5% Fund Return. This helps you to compare your Fund's ongoing expenses (but not transaction costs) with those of other mutual funds using the Fund's actual expense ratio and a hypothetical rate of return of 5% per year before expenses. Examples using a 5% hypothetical fund return may be found in the shareholder reports of other mutual funds. The hypothetical account values and expenses may not be used to estimate the actual ending account balance or expenses you paid for the period.
Please note that the expenses shown in these tables are meant to highlight your ongoing expenses only and do not reflect any transaction costs. The "Expenses Paid per $1,000" line of the tables is useful in comparing ongoing expenses only and will not help you determine the relative total expense of owning different funds. If these transaction costs had been included, your costs would have been higher.
Expenses and Value of a $1,000 Investment for the six months ended December 31, 2011 | |
Actual Fund Return* | | | |
| Beginning Account Value 7/1/11 | | $ | 1,000.00 | |
| Ending Account Value 12/31/11 | | $ | 1,000.09 | |
Expenses Paid per $1,000** | | $ | 1.01 | |
Hypothetical 5% Fund Return* | | | | |
| Beginning Account Value 7/1/11 | | $ | 1,000.00 | |
| Ending Account Value 12/31/11 | | $ | 1,024.20 | |
Expenses Paid per $1,000** | | $ | 1.02 | |
* Expenses include amounts allocated proportionally from the master portfolio.
** Expenses are equal to the Fund's annualized expense ratio, multiplied by the average account value over the period, multiplied by the number of days in the most recent six-month period, then divided by 365.
| Annualized Expense Ratio | |
| Cash Reserves Fund Institutional | .20% |
For more information, please refer to the Fund's prospectus.
Tax Information (Unaudited)
A total of 4.12% of the dividends distributed during the fiscal year was derived from interest on U.S. government securities, which is generally exempt from state income tax.
Please contact a tax advisor if you have questions about federal or state income tax laws, or on how to prepare your tax returns. If you have specific questions about your account, please call (800) 621-1048.
(The following financial statements of the Cash Management Portfolio should be read in conjunction with the Fund's financial statements.)
Investment Portfolio as of December 31, 2011 | | | Principal Amount ($) | | | Value ($) | |
| | | | |
| Certificates of Deposit and Bank Notes 7.5% | |
| ANZ National International Ltd., 144A, 3.25%, 4/2/2012 | | | 49,000,000 | | | | 49,336,289 | |
| Banco del Estado de Chile, 0.5%, 1/17/2012 | | | 20,000,000 | | | | 20,000,000 | |
| Bank Nederlandse Gemeenten, 6.0%, 3/26/2012 | | | 35,000,000 | | | | 35,455,384 | |
| Bank of Nova Scotia, 0.28%, 1/4/2012 | | | 100,000,000 | | | | 100,000,000 | |
| China Construction Bank Corp., 0.3%, 1/3/2012 | | | 37,451,000 | | | | 37,451,000 | |
| Commonwealth Bank of Australia, 144A, 2.4%, 1/12/2012 | | | 43,132,000 | | | | 43,157,466 | |
| Credit Suisse, 0.38%, 1/3/2012 | | | 97,000,000 | | | | 97,000,000 | |
| DnB Bank ASA, 0.35%, 1/17/2012 | | | 79,500,000 | | | | 79,500,000 | |
| General Electric Capital Corp., 6.0%, 6/15/2012 | | | 12,500,000 | | | | 12,810,030 | |
| Industrial & Commercial Bank of China: | |
| 0.7%, 1/3/2012 | | | 100,000,000 | | | | 100,000,000 | |
| 0.7%, 1/4/2012 | | | 99,500,000 | | | | 99,500,000 | |
| 0.7%, 1/6/2012 | | | 39,600,000 | | | | 39,600,000 | |
| Mizuho Corporate Bank Ltd., 0.42%, 2/6/2012 | | | 50,000,000 | | | | 50,003,492 | |
| Nederlandse Waterschapsbank NV, 1.375%, 2/17/2012 | | | 44,700,000 | | | | 44,756,807 | |
| Nordea Bank Finland PLC: | |
| 0.35%, 1/13/2012 | | | 69,500,000 | | | | 69,500,000 | |
| 0.4%, 2/15/2012 | | | 45,000,000 | | | | 45,000,561 | |
| Rabobank Nederland NV: | |
| 0.4%, 2/15/2012 | | | 133,500,000 | | | | 133,500,000 | |
| 0.43%, 2/24/2012 | | | 45,000,000 | | | | 45,000,000 | |
| 0.43%, 3/2/2012 | | | 160,000,000 | | | | 160,000,000 | |
| Skandinaviska Enskilda Banken AB: | |
| 0.35%, 1/11/2012 | | | 49,700,000 | | | | 49,700,000 | |
| 0.36%, 1/6/2012 | | | 46,500,000 | | | | 46,500,000 | |
| 0.45%, 2/13/2012 | | | 138,500,000 | | | | 138,500,000 | |
| Sumitomo Mitsui Banking Corp., 0.35%, 1/13/2012 | | | 50,000,000 | | | | 50,000,332 | |
| Svenska Handelsbanken AB, 0.385%, 1/23/2012 | | | 15,000,000 | | | | 15,000,091 | |
Total Certificates of Deposit and Bank Notes (Cost $1,561,271,452) | | | | 1,561,271,452 | |
| | |
| Commercial Paper 26.3% | |
| Issued at Discount** 24.7% | |
| ASB Finance Ltd., 0.585%, 4/27/2012 | | | 981,000 | | | | 979,135 | |
| Australia & New Zealand Banking Group Ltd., 0.25%, 2/7/2012 | | | 200,000 | | | | 199,949 | |
| Bank of Nova Scotia, 0.1%, 1/17/2012 | | | 600,000 | | | | 599,973 | |
| Barclays Bank PLC: | |
| 0.2%, 1/3/2012 | | | 1,000,000 | | | | 999,989 | |
| 0.33%, 1/20/2012 | | | 145,000,000 | | | | 144,974,746 | |
| 0.36%, 1/6/2012 | | | 30,000,000 | | | | 29,998,500 | |
| 0.38%, 1/4/2012 | | | 153,000,000 | | | | 152,995,155 | |
| 0.46%, 2/1/2012 | | | 77,000,000 | | | | 76,969,499 | |
| 0.52%, 2/27/2012 | | | 33,500,000 | | | | 33,472,418 | |
| BNZ International Funding Ltd: | |
| 144A, 0.57%, 4/10/2012 | | | 60,000,000 | | | | 59,905,000 | |
| 144A, 0.58%, 4/10/2012 | | | 50,000,000 | | | | 49,919,444 | |
| Coca-Cola Co.: | |
| 0.18%, 6/1/2012 | | | 29,888,000 | | | | 29,865,285 | |
| 0.2%, 4/10/2012 | | | 30,350,000 | | | | 30,333,139 | |
| Erste Abwicklungsanstalt: | |
| 0.35%, 1/30/2012 | | | 20,000,000 | | | | 19,994,361 | |
| 0.36%, 1/30/2012 | | | 50,000,000 | | | | 49,985,500 | |
| 0.37%, 1/9/2012 | | | 50,000,000 | | | | 49,995,889 | |
| 0.37%, 1/17/2012 | | | 50,000,000 | | | | 49,991,778 | |
| 0.39%, 2/16/2012 | | | 50,000,000 | | | | 49,975,083 | |
| 0.4%, 3/14/2012 | | | 35,000,000 | | | | 34,971,611 | |
| 0.42%, 1/3/2012 | | | 55,500,000 | | | | 55,498,705 | |
| Erste Finance Delaware LLC, 0.16%, 1/3/2012 | | | 154,540,000 | | | | 154,538,626 | |
| General Electric Capital Corp., 0.25%, 2/2/2012 | | | 150,000,000 | | | | 149,966,667 | |
| General Electric Capital Services, Inc.: | |
| 0.23%, 2/6/2012 | | | 42,000,000 | | | | 41,990,340 | |
| 0.26%, 2/2/2012 | | | 50,000,000 | | | | 49,988,444 | |
| 0.3%, 2/13/2012 | | | 75,000,000 | | | | 74,973,125 | |
| Johnson & Johnson: | |
| 144A, 0.02%, 1/13/2012 | | | 25,000,000 | | | | 24,999,833 | |
| 144A, 0.04%, 2/27/2012 | | | 75,000,000 | | | | 74,995,250 | |
| 144A, 0.05%, 4/3/2012 | | | 10,000,000 | | | | 9,998,708 | |
| 144A, 0.06%, 2/17/2012 | | | 100,000,000 | | | | 99,992,167 | |
| 144A, 0.07%, 4/2/2012 | | | 280,000,000 | | | | 279,947,867 | |
| 144A, 0.08%, 4/2/2012 | | | 70,000,000 | | | | 69,985,689 | |
| 144A, 0.08%, 4/3/2012 | | | 40,000,000 | | | | 39,991,733 | |
| 144A, 0.15%, 3/7/2012 | | | 33,175,000 | | | | 33,165,877 | |
| Kells Funding LLC: | |
| 144A, 0.29%, 1/12/2012 | | | 125,000,000 | | | | 124,988,924 | |
| 144A, 0.3%, 1/26/2012 | | | 25,000,000 | | | | 24,994,792 | |
| 144A, 0.35%, 2/17/2012 | | | 43,100,000 | | | | 43,080,306 | |
| 144A, 0.37%, 3/19/2012 | | | 25,700,000 | | | | 25,679,397 | |
| 144A, 0.37%, 4/10/2012 | | | 80,000,000 | | | | 79,917,778 | |
| 144A, 0.38%, 4/17/2012 | | | 25,000,000 | | | | 24,971,764 | |
| 144A, 0.45%, 1/20/2012 | | | 75,687,000 | | | | 75,669,024 | |
| 144A, 0.48%, 1/19/2012 | | | 57,014,000 | | | | 57,000,317 | |
| 144A, 0.52%, 2/1/2012 | | | 72,500,000 | | | | 72,467,536 | |
| 144A, 0.52%, 2/16/2012 | | | 37,000,000 | | | | 36,975,416 | |
| Merck & Co., Inc.: | |
| 0.06%, 1/9/2012 | | | 7,750,000 | | | | 7,749,897 | |
| 0.06%, 1/11/2012 | | | 86,000,000 | | | | 85,998,567 | |
| New York Life Capital Corp.: | |
| 144A, 0.12%, 2/3/2012 | | | 3,725,000 | | | | 3,724,590 | |
| 144A, 0.13%, 2/1/2012 | | | 37,900,000 | | | | 37,895,757 | |
| 144A, 0.15%, 3/2/2012 | | | 20,000,000 | | | | 19,994,917 | |
| 144A, 0.16%, 2/14/2012 | | | 25,000,000 | | | | 24,995,111 | |
| 144A, 0.16%, 3/8/2012 | | | 40,000,000 | | | | 39,988,089 | |
| 144A, 0.16%, 3/19/2012 | | | 38,000,000 | | | | 37,986,827 | |
| Nieuw Amsterdam Receivables Corp.: | |
| 144A, 0.32%, 1/4/2012 | | | 100,000,000 | | | | 99,997,333 | |
| 144A, 0.33%, 1/3/2012 | | | 653,000 | | | | 652,988 | |
| NRW.Bank: | |
| 0.24%, 1/17/2012 | | | 30,062,000 | | | | 30,058,793 | |
| 0.4%, 1/6/2012 | | | 61,000,000 | | | | 60,996,611 | |
| Oversea-Chinese Banking Corp., Ltd., 0.29%, 1/17/2012 | | | 45,000,000 | | | | 44,994,200 | |
| PepsiCo, Inc., 0.04%, 1/18/2012 | | | 95,000,000 | | | | 94,998,206 | |
| Pfizer, Inc.: | |
| 0.03%, 1/5/2012 | | | 58,000,000 | | | | 57,999,807 | |
| 0.04%, 1/12/2012 | | | 40,000,000 | | | | 39,999,511 | |
| Proctor & Gamble Co.: | |
| 0.08%, 1/3/2012 | | | 100,000,000 | | | | 99,999,556 | |
| 0.08%, 1/31/2012 | | | 40,000,000 | | | | 39,997,333 | |
| 0.08%, 2/24/2012 | | | 34,000,000 | | | | 33,995,920 | |
| 0.08%, 3/23/2012 | | | 60,000,000 | | | | 59,989,067 | |
| 0.09%, 1/25/2012 | | | 40,000,000 | | | | 39,997,600 | |
| 0.09%, 2/14/2012 | | | 75,000,000 | | | | 74,991,750 | |
| 0.09%, 3/30/2012 | | | 25,000,000 | | | | 24,994,437 | |
| 0.1%, 4/9/2012 | | | 25,000,000 | | | | 24,993,125 | |
| 0.11%, 5/4/2012 | | | 30,000,000 | | | | 29,988,633 | |
| 0.11%, 5/21/2012 | | | 23,000,000 | | | | 22,990,091 | |
| 0.12%, 4/2/2012 | | | 67,800,000 | | | | 67,779,208 | |
| 0.12%, 5/4/2012 | | | 128,000,000 | | | | 127,947,093 | |
| 0.13%, 4/12/2012 | | | 75,000,000 | | | | 74,972,375 | |
| 0.13%, 4/30/2012 | | | 80,000,000 | | | | 79,965,333 | |
| 0.15%, 3/30/2012 | | | 25,000,000 | | | | 24,990,729 | |
| Rabobank U.S.A. Financial Corp., 0.4%, 2/8/2012 | | | 19,250,000 | | | | 19,241,872 | |
| SBAB Bank AB: | |
| 144A, 0.5%, 1/4/2012 | | | 50,000,000 | | | | 49,997,917 | |
| 144A, 0.55%, 1/13/2012 | | | 15,000,000 | | | | 14,997,250 | |
| 144A, 0.55%, 1/30/2012 | | | 26,000,000 | | | | 25,988,481 | |
| Sheffield Receivables Corp.: | |
| 144A, 0.3%, 1/27/2012 | | | 24,000,000 | | | | 23,994,800 | |
| 144A, 0.4%, 2/7/2012 | | | 61,000,000 | | | | 60,974,922 | |
| Standard Chartered Bank: | |
| 0.37%, 1/5/2012 | | | 100,000,000 | | | | 99,995,889 | |
| 0.38%, 2/7/2012 | | | 135,750,000 | | | | 135,696,982 | |
| Straight-A Funding LLC: | |
| 144A, 0.12%, 1/11/2012 | | | 30,105,000 | | | | 30,103,996 | |
| 144A, 0.19%, 1/31/2012 | | | 60,061,000 | | | | 60,051,490 | |
| 144A, 0.19%, 2/13/2012 | | | 27,999,000 | | | | 27,992,646 | |
| Sumitomo Mitsui Banking Corp., 0.355%, 1/6/2012 | | | 77,050,000 | | | | 77,046,201 | |
| Swedbank AB, 0.44%, 1/13/2012 | | | 35,000,000 | | | | 34,994,867 | |
| Toyota Motor Credit Corp., 0.27%, 1/6/2012 | | | 107,000,000 | | | | 106,995,987 | |
| Unilever Capital Corp., 0.08%, 3/6/2012 | | | 30,000,000 | | | | 29,995,667 | |
| Victory Receivables Corp.: | |
| 144A, 0.35%, 1/19/2012 | | | 50,000,000 | | | | 49,991,250 | |
| 144A, 0.36%, 1/9/2012 | | | 75,106,000 | | | | 75,099,992 | |
| Walt Disney Co., 0.09%, 2/23/2012 | | | 95,000,000 | | | | 94,987,412 | |
| | | | | 5,125,675,814 | |
| Issued at Par 1.6% | |
| DnB Bank ASA, 144A, 0.43%*, 4/2/2012 | | | 50,000,000 | | | | 50,000,000 | |
| Westpac Banking Corp., 144A, 0.426%*, 4/11/2012 | | | 282,900,000 | | | | 282,893,007 | |
| | | | | 332,893,007 | |
Total Commercial Paper (Cost $5,458,568,821) | | | | 5,458,568,821 | |
| | |
| Government & Agency Obligations 15.0% | |
| U.S. Government Sponsored Agencies 1.9% | |
| Federal Home Loan Bank: | |
| 0.13%, 1/23/2012 | | | 11,000,000 | | | | 10,999,782 | |
| 0.13%, 2/24/2012 | | | 28,225,000 | | | | 28,224,444 | |
| 0.13%, 5/15/2012 | | | 26,500,000 | | | | 26,494,841 | |
| 0.16%, 4/30/2012 | | | 103,320,000 | | | | 103,309,653 | |
| 0.16%**, 11/13/2012 | | | 24,000,000 | | | | 23,966,187 | |
| 0.23%, 8/24/2012 | | | 15,670,000 | | | | 15,674,189 | |
| 0.27%, 7/6/2012 | | | 20,600,000 | | | | 20,600,105 | |
| Federal Home Loan Mortgage Corp.: | |
| 0.099%**, 2/23/2012 | | | 50,000,000 | | | | 49,992,639 | |
| 0.111%**, 1/11/2012 | | | 25,000,000 | | | | 24,999,167 | |
| Federal National Mortgage Association: | |
| 0.132%**, 1/3/2012 | | | 20,000,000 | | | | 19,999,789 | |
| 0.137%**, 2/17/2012 | | | 11,500,000 | | | | 11,497,898 | |
| 0.148%**, 3/1/2012 | | | 20,000,000 | | | | 19,995,000 | |
| 0.159%**, 10/1/2012 | | | 10,000,000 | | | | 9,987,822 | |
| 0.189%**, 10/1/2012 | | | 17,500,000 | | | | 17,474,693 | |
| | | | | 383,216,209 | |
| U.S. Treasury Obligations 13.1% | |
| U.S. Treasury Bills: | |
| 0.005%**, 1/26/2012 | | | 503,000 | | | | 502,998 | |
| 0.035%**, 5/17/2012 | | | 2,500,000 | | | | 2,499,667 | |
| 0.051%**, 4/19/2012 | | | 921,000 | | | | 920,858 | |
| U.S. Treasury Notes: | |
| 0.375%, 8/31/2012 | | | 212,478,000 | | | | 212,794,495 | |
| 0.375%, 9/30/2012 | | | 18,000,000 | | | | 18,034,370 | |
| 0.375%, 10/31/2012 | | | 360,000,000 | | | | 360,730,389 | |
| 0.625%, 6/30/2012 | | | 84,924,000 | | | | 85,135,391 | |
| 0.625%, 7/31/2012 | | | 433,130,000 | | | | 434,394,582 | |
| 0.75%, 5/31/2012 | | | 212,478,000 | | | | 213,053,545 | |
| 1.375%, 10/15/2012 | | | 212,000,000 | | | | 214,035,648 | |
| 1.5%, 7/15/2012 | | | 480,000,000 | | | | 483,642,949 | |
| 1.875%, 6/15/2012 | | | 250,000,000 | | | | 252,038,171 | |
| 4.75%, 5/31/2012 | | | 98,500,000 | | | | 100,373,472 | |
| 4.875%, 6/30/2012 | | | 342,512,000 | | | | 350,642,757 | |
| | | | | 2,728,799,292 | |
Total Government & Agency Obligations (Cost $3,112,015,501) | | | | 3,112,015,501 | |
| | |
| Short-Term Notes* 14.1% | |
| Australia & New Zealand Banking Group Ltd., 144A, 0.31%, 1/20/2012 | | | 72,000,000 | | | | 72,000,000 | |
| Bank of Nova Scotia: | |
| 0.35%, 4/2/2012 | | | 32,500,000 | | | | 32,500,000 | |
| 0.38%, 3/13/2012 | | | 134,500,000 | | | | 134,500,000 | |
| 0.39%, 6/11/2012 | | | 107,000,000 | | | | 107,000,000 | |
| Bayerische Landesbank, 0.353%, 11/23/2012 | | | 40,000,000 | | | | 40,000,000 | |
| Caisse d'Amortissement de la Dette Sociale, 144A, 0.432%, 5/25/2012 | | | 315,000,000 | | | | 314,986,168 | |
| Canadian Imperial Bank of Commerce, 0.373%, 4/26/2012 | | | 200,000,000 | | | | 200,000,000 | |
| Coca-Cola Co., 0.507%, 5/15/2012 | | | 48,000,000 | | | | 48,027,583 | |
| Commonwealth Bank of Australia: | |
| 144A, 0.376%, 2/3/2012 | | | 135,000,000 | | | | 135,000,000 | |
| 144A, 0.455%, 4/30/2012 | | | 40,000,000 | | | | 40,000,000 | |
| JPMorgan Chase Bank NA, 0.57%, 1/8/2013 | | | 250,000,000 | | | | 250,000,000 | |
| Kells Funding LLC: | |
| 144A, 0.361%, 5/4/2012 | | | 125,000,000 | | | | 125,000,000 | |
| 144A, 0.37%, 2/27/2012 | | | 56,000,000 | | | | 56,000,000 | |
| 144A, 0.377%, 1/9/2012 | | | 64,000,000 | | | | 63,999,885 | |
| 144A, 0.384%, 1/19/2012 | | | 27,000,000 | | | | 27,000,000 | |
| 144A, 0.423%, 2/24/2012 | | | 147,500,000 | | | | 147,500,000 | |
| 144A, 0.468%, 4/16/2012 | | | 150,000,000 | | | | 150,000,000 | |
| Nordea Bank Finland PLC: | |
| 0.681%, 2/3/2012 | | | 35,000,000 | | | | 35,006,457 | |
| 0.737%, 9/13/2012 | | | 20,000,000 | | | | 20,034,002 | |
| 0.941%, 9/13/2012 | | | 50,000,000 | | | | 50,085,207 | |
| Rabobank Nederland NV: | |
| 0.356%, 1/10/2012 | | | 108,250,000 | | | | 108,250,000 | |
| 0.388%, 4/24/2012 | | | 133,000,000 | | | | 133,000,000 | |
| 0.46%, 5/16/2012 | | | 50,000,000 | | | | 50,000,000 | |
| 144A, 0.6%, 12/14/2012 | | | 75,000,000 | | | | 75,000,000 | |
| 144A, 0.668%, 2/29/2012 | | | 50,000,000 | | | | 50,007,960 | |
| Svenska Handelsbanken AB, 144A, 0.577%, 8/7/2012 | | | 80,000,000 | | | | 80,000,000 | |
| Toronto-Dominion Bank, 0.296%, 5/11/2012 | | | 130,500,000 | | | | 130,500,000 | |
| Westpac Banking Corp.: | |
| 0.34%, 1/10/2012 | | | 85,000,000 | | | | 85,000,000 | |
| 0.366%, 5/9/2012 | | | 60,000,000 | | | | 60,000,000 | |
| 0.452%, 2/13/2012 | | | 49,000,000 | | | | 49,000,000 | |
| 144A, 0.965%, 10/23/2012 | | | 61,110,000 | | | | 61,280,869 | |
Total Short-Term Notes (Cost $2,930,678,131) | | | | 2,930,678,131 | |
| | |
| Time Deposits 11.3% | |
| Citibank NA, 0.1%, 1/4/2012 | | | 350,000,000 | | | | 350,000,000 | |
| Nordea Bank Finland PLC, 0.02%, 1/3/2012 | | | 400,000,000 | | | | 400,000,000 | |
| State Street Bank & Trust Co., 0.01%, 1/3/2012 | | | 800,000,000 | | | | 800,000,000 | |
| Svenska Handelsbanken AB, 0.01%, 1/3/2012 | | | 800,000,000 | | | | 800,000,000 | |
Total Time Deposits (Cost $2,350,000,000) | | | | 2,350,000,000 | |
| | |
| Municipal Investments 21.1% | |
| Allegheny County, PA, Industrial Development Authority, UPMC Children's Hospital, Series A, 0.08%***, 10/1/2032, LOC: Bank of America NA | | | 20,460,000 | | | | 20,460,000 | |
| Allegheny County, PA, RBC Municipal Products, Inc. Trust Certificates, Series E-16, 144A, 0.1%***, 4/15/2039, LIQ: Royal Bank of Canada, LOC: Royal Bank of Canada | | | 22,165,000 | | | | 22,165,000 | |
| Appleton, WI, Redevelopment Authority Revenue, Fox Cities Performing Arts Center, Inc., Series B, 0.1%***, 6/1/2036, LOC: JPMorgan Chase Bank NA | | | 18,400,000 | | | | 18,400,000 | |
| Arizona, State Health Facilities Authority Revenue, Catholic West: | | | | | | | | |
| Series A, 0.08%***, 7/1/2035, LOC: JPMorgan Chase Bank NA | | | 23,100,000 | | | | 23,100,000 | |
| Series B, 0.08%***, 7/1/2035, LOC: JPMorgan Chase Bank NA | | | 17,680,000 | | | | 17,680,000 | |
| Austin, TX, Water & Wastewater Systems Revenue, 0.07%***, 5/15/2031, LOC: Bank of Tokyo-Mitsubishi UFJ, Sumitomo Mitsui Banking | | | 25,920,000 | | | | 25,920,000 | |
| BlackRock Municipal Intermediate Duration Fund, Inc., Series W-7-2871, 144A, AMT, 0.23%***, 3/1/2041, LIQ: JPMorgan Chase Bank NA | | | 30,000,000 | | | | 30,000,000 | |
| BlackRock MuniHoldings New Jersey Quality Fund, Inc., Series W-7-1727, 144A, AMT, 0.3%***, 7/1/2041, LIQ: Bank of America NA | | | 30,000,000 | | | | 30,000,000 | |
| BlackRock MuniHoldings New York Quality Fund, Inc., Series W-7-2436, 144A, AMT, 0.3%***, 7/1/2041, LIQ: Bank of America NA | | | 40,000,000 | | | | 40,000,000 | |
| BlackRock MuniYield California Quality Fund, Inc., Series W-7-1665, 144A, AMT, 0.22%***, 5/1/2041, LIQ: Citibank NA | | | 13,500,000 | | | | 13,500,000 | |
| BlackRock MuniYield Fund, Inc., Series W-7-2514, 144A, AMT, 0.3%***, 7/1/2041, LIQ: Bank of America NA | | | 25,000,000 | | | | 25,000,000 | |
| BlackRock MuniYield New York Quality Fund, Inc., Series W-7-2477, 144A, AMT, 0.22%***, 5/1/2041, LIQ: Citibank NA | | | 26,300,000 | | | | 26,300,000 | |
| BlackRock MuniYield Quality Fund III, Inc., 144A, AMT, 0.24%***, 6/1/2041, LIQ: Citibank NA | | | 44,500,000 | | | | 44,500,000 | |
| BlackRock MuniYield Quality Fund, Inc., Series W-7-1766, 144A, AMT, 0.26%***, 10/1/2041, LIQ: Morgan Stanley Bank | | | 57,000,000 | | | | 57,000,000 | |
| Blount County, TN, Public Building Authority, Local Government Public Improvement, Series E-5-A, 0.12%***, 6/1/2030, LOC: Branch Banking & Trust | | | 45,400,000 | | | | 45,400,000 | |
| Cabell County, WV, University Facilities, Provident Group Marshall Properties, Series A, 0.13%***, 7/1/2039, LOC: Bank of America NA | | | 19,995,000 | | | | 19,995,000 | |
| Calhoun County, TX, Navigation Industrial Development Authority, Formosa Plastics Corp. Project, Series C, 144A, AMT, 0.12%***, 9/1/2031, LOC: Sumitomo Mitsui Banking | | | 10,000,000 | | | | 10,000,000 | |
| Calhoun, TX, Port Authority, Environmental Facilities Revenue, Formosa Plastics Corp. Project, Series B, 144A, AMT, 0.12%***, 9/1/2041, LOC: Sumitomo Mitsui Banking | | | 21,300,000 | | | | 21,300,000 | |
| California, Housing Finance Agency Revenue, Home Mortgage, Series D, 144A, AMT, 0.1%***, 2/1/2040, LOC: Fannie Mae, Freddie Mac | | | 29,130,000 | | | | 29,130,000 | |
| California, RBC Municipal Products, Inc. Trust, Series E-24, 144A, 0.14%**, Mandatory Put 4/2/2012 @ 100, 7/1/2031, LIQ: Royal Bank of Canada, LOC: Royal Bank of Canada | | | 9,250,000 | | | | 9,250,000 | |
| California, State Kindergarten, Series A5, 0.05%***, 5/1/2034, LOC: Citibank NA & California State Teacher's Retirement System | | | 18,250,000 | | | | 18,250,000 | |
| California, Statewide Communities Development Authority, Multi-Family Housing Revenue, Bay Vista At Meadow Park, Series NN-1, AMT, 0.09%***, 11/15/2037, LIQ: Fannie Mae | | | 29,320,000 | | | | 29,320,000 | |
| California, The Olympic Club Revenue, 0.46%***, 9/30/2032, LOC: Bank of America NA (a) | | | 52,100,000 | | | | 52,100,000 | |
| California, Wells Fargo State Trusts: | | | | | | | | |
| Series 16C, 144A, 0.1%***, 9/1/2029, LIQ: Wells Fargo Bank NA | | | 42,515,000 | | | | 42,515,000 | |
| Series 72C, 144A, 0.1%***, 8/15/2039, GTY: Wells Fargo Bank NA, LIQ: Wells Fargo Bank NA | | | 28,275,000 | | | | 28,275,000 | |
| Series 25C, 144A, 0.1%***, 11/1/2041, GTY: Wells Fargo Bank NA, LIQ: Wells Fargo Bank NA | | | 9,525,000 | | | | 9,525,000 | |
| Channahon, IL, Morris Hospital Revenue, 0.1%***, 12/1/2034, LOC: U.S. Bank NA | | | 5,220,000 | | | | 5,220,000 | |
| Charlotte, NC, Certificates of Participation, Series D, 0.25%***, 6/1/2035, LOC: Bank of America NA (a) | | | 19,600,000 | | | | 19,600,000 | |
| Chattanooga, TN, Industrial Development Board Revenue, BlueCross Corp. Project, 0.22%***, 1/1/2028, LOC: Bank of America NA (a) | | | 99,000,000 | | | | 99,000,000 | |
| Chicago, IL, Midway Airport Revenue, Series A-1, 0.1%***, 1/1/2021, LOC: Bank of Montreal (a) | | | 22,000,000 | | | | 22,000,000 | |
| Clark County, NV, Passenger Facility Charge Revenue, McCarran International Airport, Series F-2, 0.1%***, 7/1/2022, LOC: Union Bank NA | | | 18,000,000 | | | | 18,000,000 | |
| Cleveland, OH, Airport Systems Revenue, Series D, 0.07%***, 1/1/2024, LOC: PNC Bank NA | | | 9,725,000 | | | | 9,725,000 | |
| Cleveland-Cuyahoga County, OH, Port Authority Revenue, Carnegie/89th Garage Project, 0.1%***, 1/1/2037, LOC: JPMorgan Chase Bank | | | 17,730,000 | | | | 17,730,000 | |
| Colorado, Health Facilities Authority Revenue, Fraiser Meadows Community Project, 0.08%***, 6/1/2038, LOC: JPMorgan Chase Bank NA | | | 14,000,000 | | | | 14,000,000 | |
| Colorado, Housing Finance Authority, Single Family Mortgage Revenue: | | | | | | | | |
| "I", Series B-1, 0.15%***, 5/1/2038, LOC: Fannie Mae, Freddie Mac (a) | | | 18,935,000 | | | | 18,935,000 | |
| "I", Series A-2, 0.16%***, 5/1/2038, LOC: Fannie Mae, Freddie Mac (a) | | | 10,185,000 | | | | 10,185,000 | |
| Colorado, Meridian Village Metropolitan, RBC Municipal Products, Inc. Trust, Series C-11, 144A, 0.1%***, 12/1/2031, LIQ: Royal Bank of Canada, LOC: Royal Bank of Canada | | | 17,580,000 | | | | 17,580,000 | |
| Colorado, RBC Municipal Products, Inc. Trust, Series E-25, 144A, AMT, 0.13%***, 11/15/2025, LIQ: Royal Bank of Canada, LOC: Royal Bank of Canada | | | 22,000,000 | | | | 22,000,000 | |
| Colorado, State Educational & Cultural Facilities Authority, Linfield Christian School Project, 0.08%***, 5/1/2030, LOC: Evangelical Christian Credit Union | | | 16,000,000 | | | | 16,000,000 | |
| Colorado, Wells Fargo Stage Trust, Series 42C, 144A, AMT, 0.11%***, 11/15/2023, GTY: Wells Fargo Bank NA, LIQ: Wells Fargo Bank NA | | | 9,835,000 | | | | 9,835,000 | |
| Colorado Springs, CO, Utilities Revenue: | |
| Series C, 0.08%***, 11/1/2040, SPA: JPMorgan Chase Bank NA | | | 29,415,000 | | | | 29,415,000 | |
| Series B, 0.1%***, 11/1/2026, SPA: Barclays Bank PLC | | | 11,000,000 | | | | 11,000,000 | |
| Series A, 0.11%***, 11/1/2038, SPA: Bank of America NA | | | 31,645,000 | | | | 31,645,000 | |
| County of Carroll, KY, Environmental Facilities Revenue, Utilities Company Project, Series A, AMT, 0.11%***, 2/1/2032, LOC: Sumitomo Mitsui Banking | | | 27,800,000 | | | | 27,800,000 | |
| Covina, CA, Redevelopment Agency, Multi-Family Housing, ShadowHills Apartments, Inc., Series A, 0.08%***, 12/1/2015, LIQ: Fannie Mae | | | 12,825,000 | | | | 12,825,000 | |
| Eclipse Funding Trust, Solar Eclipse, Springfield, IL Electric Revenue, Series 2006-0007, 144A, 0.09%***, 3/1/2030, LIQ: U.S. Bank NA, LOC: U.S. Bank NA | | | 22,545,000 | | | | 22,545,000 | |
| Florida, Capital Trust Agency Housing Revenue, Atlantic Housing Foundation, Series A, 0.1%***, 7/15/2024, LIQ: Fannie Mae | | | 19,000,000 | | | | 19,000,000 | |
| Florida, Development Finance Corp., Enterprise Board Industrial Development Program, Out of Door Academy, 0.11%***, 7/1/2038, LOC: Northern Trust Co. | | | 12,910,000 | | | | 12,910,000 | |
| Florida, State Board of Public Education, Series 3834Z, 144A, 0.1%***, 12/1/2015, LIQ: JPMorgan Chase Bank NA | | | 9,000,000 | | | | 9,000,000 | |
| Florida, Sunshine State Governmental Financing Commission Revenue, Miami Dade County Program, Series B, 0.08%***, 9/1/2032, LOC: JPMorgan Chase Bank NA | | | 28,500,000 | | | | 28,500,000 | |
| Georgia, Main Street Natural Gas, Inc., Gas Revenue, Series A, 0.09%***, 8/1/2040, SPA: Royal Bank of Canada | | | 84,000,000 | | | | 84,000,000 | |
| Georgia, Private Colleges & Universities Authority Revenue, Mercer University Project, Series A, 0.1%***, 10/1/2036, LOC: Branch Banking & Trust | | | 10,240,000 | | | | 10,240,000 | |
| Hawaii, State Department of Budget & Finance Special Purpose Revenue, Series 2135, 144A, AMT, 0.1%***, 3/1/2037, GTY: Wells Fargo & Co., INS: FGIC, LIQ: Wells Fargo & Co. | | | 19,485,000 | | | | 19,485,000 | |
| Hawaii, Wells Fargo Stage Trust, Series 54C, 144A, 0.11%***, 4/1/2029, GTY: Wells Fargo Bank NA, LIQ: Wells Fargo Bank NA | | | 9,240,000 | | | | 9,240,000 | |
| Hayward, CA, Multi-Family Housing Revenue, Shorewood Bay Waterford Inc., Series A, 0.08%***, 7/15/2014, LIQ: Fannie Mae | | | 20,000,000 | | | | 20,000,000 | |
| Houston, TX, Airport Systems Revenue, 0.09%***, 7/1/2030, LOC: Barclays Bank PLC | | | 8,000,000 | | | | 8,000,000 | |
| Houston, TX, RBC Municipal Products, Inc. Trust Certificates, Utility Systems Revenue, Series E-14, 144A, 0.1%***, 5/15/2034, LIQ: Royal Bank of Canada, LOC: Royal Bank of Canada | | | 24,070,000 | | | | 24,070,000 | |
| Houston, TX, Utility Systems Revenue, Series D-1, 0.16%***, 5/15/2034, INS: AGMC, LOC: JPMorgan Chase Bank NA (a) | | | 44,000,000 | | | | 44,000,000 | |
| Houston, TX, Water & Sewer Systems Revenue, Series 27TPZ, 144A, 0.09%***, 12/1/2028, INS: AGMC, LIQ: Wells Fargo Bank NA, LOC: Wells Fargo Bank NA | | | 15,865,000 | | | | 15,865,000 | |
| Illinois, Development Finance Authority Revenue, Chicago Symphony Project, 0.08%***, 12/1/2033, LOC: Bank One NA | | | 12,500,000 | | | | 12,500,000 | |
| Illinois, Finance Authority Revenue, Series A, 0.1%***, 11/15/2022, INS: Radian, LOC: JPMorgan Chase Bank NA | | | 12,045,000 | | | | 12,045,000 | |
| Illinois, State Finance Authority Revenue, Methodist Medical Center, Series B, 0.1%***, 11/15/2041, LOC: PNC Bank NA | | | 10,000,000 | | | | 10,000,000 | |
| Illinois, State Toll Highway Authority Revenue, Series A-1A, 0.13%***, 1/1/2031, INS: AGMC, SPA: JPMorgan Chase Bank NA | | | 50,000,000 | | | | 50,000,000 | |
| Illinois, State Toll Highway Authority, Senior Priority, Series A-2A, 0.09%***, 7/1/2030, LOC: Bank of Tokyo-Mitsubishi UFJ | | | 15,000,000 | | | | 15,000,000 | |
| Illinois, Wells Fargo Stage Trust: | | | | | | | | |
| Series 50C, 144A, 0.11%***, 11/15/2035, GTY: Wells Fargo Bank NA, LIQ: Wells Fargo Bank NA | | | 9,110,000 | | | | 9,110,000 | |
| Series 15C, 144A, 0.11%***, 10/1/2040, GTY: Wells Fargo Bank NA, LIQ: Wells Fargo Bank NA | | | 24,405,000 | | | | 24,405,000 | |
| Indiana, State Finance Authority Hospital Revenue, Indiana University Health: | | | | | | | | |
| Series A, 0.06%***, 3/1/2033, LOC: Northern Trust Co. | | | 10,000,000 | | | | 10,000,000 | |
| Series K, 0.09%***, 3/1/2033, LOC: JPMorgan Chase Bank NA (a) | | | 31,700,000 | | | | 31,700,000 | |
| Series J, 0.14%***, 3/1/2033, LOC: JPMorgan Chase Bank NA (a) | | | 15,625,000 | | | | 15,625,000 | |
| Indiana, State Municipal Power Agency, Series A, 0.09%***, 1/1/2018, LOC: Citibank NA | | | 3,800,000 | | | | 3,800,000 | |
| Indiana, Wells Fargo Stage Trust, Series 41C, 144A, 0.11%***, 1/1/2021, GTY: Wells Fargo Bank NA, LIQ: Wells Fargo Bank NA | | | 16,750,000 | | | | 16,750,000 | |
| Iowa, State Finance Authority, Series C, AMT, 0.13%***, 1/1/2036, SPA: State Street Bank & Trust Co. | | | 5,700,000 | | | | 5,700,000 | |
| Iowa, State Finance Authority, Single Family Mortgage, Series C, AMT, 0.12%***, 1/1/2036, SPA: State Street Bank & Trust Co. | | | 8,100,000 | | | | 8,100,000 | |
| Johnson City, TN, Health & Educational Facilities Board Hospital Revenue, Series B3, 0.24%***, 7/1/2033, LOC: Mizuho Corporate Bank (a) | | | 11,400,000 | | | | 11,400,000 | |
| Kansas, State Department of Transportation Highway Revenue, Series C-3, 0.06%***, 9/1/2023, SPA: JPMorgan Chase Bank NA | | | 10,750,000 | | | | 10,750,000 | |
| Kentucky, State Housing Corp. Revenue, Series O, 0.6%***, 1/1/2036, SPA: State Street Bank & Trust Co. (a) | | | 19,160,000 | | | | 19,160,000 | |
| Long Island, NY, Power Authority, Series 3A, 0.28%***, 5/1/2033, LOC: JPMorgan Chase Bank NA & Landesbank Baden-Wurttemberg | | | 15,000,000 | | | | 15,000,000 | |
| Los Angeles County, CA, Multi-Family Housing Authority Revenue, Canyon Country Villas Project, Series H, 0.09%***, 12/1/2032, LIQ: Freddie Mac | | | 8,200,000 | | | | 8,200,000 | |
| Louisiana, Wells Fargo Stage Trust, Series 11C, 144A, 0.11%***, 5/1/2045, LIQ: Wells Fargo Bank NA | | | 17,310,000 | | | | 17,310,000 | |
| Maine, State Housing Authority Mortgage Revenue, Series B-3, AMT, 0.14%***, 11/15/2038, SPA: State Street Bank & Trust Co. | | | 3,310,000 | | | | 3,310,000 | |
| Maine, State Housing Authority, Mortgage Revenue, Series E-2, AMT, 0.12%***, 11/15/2041, SPA: State Street Bank & Trust Co. | | | 8,000,000 | | | | 8,000,000 | |
| Maricopa County, AZ, Industrial Development Authority, Senior Living Facilities Revenue, Christian Care Apartments, Series A, 0.09%***, 9/15/2035, LIQ: Fannie Mae | | | 10,845,000 | | | | 10,845,000 | |
| Massachusetts, State Department of Transportation, Metropolitan Highway Systems Revenue, Contract Assistance, Series A3, 0.09%***, 1/1/2039, LOC: Bank of America NA | | | 38,845,000 | | | | 38,845,000 | |
| Massachusetts, State Development Finance Agency Revenue, Milton Academy, Series B, 0.17%***, 3/1/2039, LOC: TD Bank NA (a) | | | 5,225,000 | | | | 5,225,000 | |
| Massachusetts, State Development Finance Agency Revenue, Wentworth Institute of Technology, 0.1%***, 10/1/2030, LOC: RBS Citizens NA | | | 26,390,000 | | | | 26,390,000 | |
| Massachusetts, State Development Finance Agency Revenue, YMCA of Greater Worcester, 0.08%***, 9/1/2041, LOC: TD Bank NA | | | 11,615,000 | | | | 11,615,000 | |
| Massachusetts, State General Obligation, Series B, 0.25%***, 8/1/2015, SPA: JPMorgan Chase Bank NA | | | 33,000,000 | | | | 33,000,000 | |
| Massachusetts, State Health & Educational Facilities Authority Revenue, Boston University, Series N, 0.16%***, 10/1/2034, LOC: Bank of America NA (a) | | | 13,410,000 | | | | 13,410,000 | |
| Massachusetts, State Water Resources Authority: | |
| Series C-2, 0.08%***, 11/1/2026, SPA: Barclays Bank PLC | | | 20,200,000 | | | | 20,200,000 | |
| Series A-1, 0.08%***, 8/1/2037, SPA: JPMorgan Chase Bank NA | | | 20,000,000 | | | | 20,000,000 | |
| Michigan, Finance Authority, School Loan: | |
| Series B, 0.19%***, 9/1/2050, LOC: PNC Bank NA (a) | | | 25,000,000 | | | | 25,000,000 | |
| Series C, 0.19%***, 9/1/2050, LOC: Bank of Montreal (a) | | | 21,000,000 | | | | 21,000,000 | |
| Michigan, Higher Education Facilities Authority Revenue, Limited Obligation, Hope College, Series B, 0.09%***, 4/1/2032, LOC: PNC Bank NA | | | 17,430,000 | | | | 17,430,000 | |
| Michigan, RBC Municipal Products, Inc. Trust: | | | | | | | | |
| Series L-23, 144A, AMT, 0.13%***, 3/1/2028, INS: AMBAC, LIQ: Royal Bank of Canada, LOC: Royal Bank of Canada | | | 31,000,000 | | | | 31,000,000 | |
| Series L-25, 144A, AMT, 0.13%***, 9/1/2033, LIQ: Royal Bank of Canada, LOC: Royal Bank of Canada | | | 66,745,000 | | | | 66,745,000 | |
| Michigan, State Strategic Fund Limited Obligation Revenue, Kroger Co., Recovery Zone Facility, 0.1%***, 1/1/2026, LOC: Bank of Tokyo-Mitsubishi UFJ | | | 9,500,000 | | | | 9,500,000 | |
| Michigan, Wells Fargo Stage Trust, Series 90C, 144A, 0.11%***, 7/1/2035, LIQ: Wells Fargo Bank NA | | | 14,510,000 | | | | 14,510,000 | |
| Minnesota, RBC Municipal Products, Inc. Trust, Series E-19, 144A, 0.17%***, Mandatory Put 4/2/2012 @ 100, 11/15/2047, LIQ: Royal Bank of Canada, LOC: Royal Bank of Canada | | | 10,000,000 | | | | 10,000,000 | |
| Minnesota, State Housing Finance Agency, Residential Housing Finance, Series C, AMT, 0.12%***, 7/1/2048, LIQ: Federal Home Loan Bank | | | 8,000,000 | | | | 8,000,000 | |
| Minnesota, State Office of Higher Education Revenue, Supplementary Student, Series A, 0.17%***, 12/1/2043, LOC: U.S. Bank NA (a) | | | 11,500,000 | | | | 11,500,000 | |
| Mississippi, State Business Finance Commission, Gulf Opportunity Zone, Chevron U.S.A., Inc. Project, Series C, 0.03%***, 12/1/2030, GTY: Chevron Corp. | | | 8,295,000 | | | | 8,295,000 | |
| Mississippi, State Business Finance Corp., Gulf Opportunity Zone Revenue, Tindall Corp. Project, 0.09%***, 4/1/2028, LOC: Wells Fargo Bank NA | | | 9,005,000 | | | | 9,005,000 | |
| Missouri, State Health & Educational Facilities Authority, Ascension Health, Series C-3, 0.07%***, 11/15/2039 | | | 14,000,000 | | | | 14,000,000 | |
| Missouri, State Health & Educational Facilities Authority, SSM Health Care Corp., Series E, 0.04%***, 6/1/2045, LOC: PNC Bank NA | | | 22,660,000 | | | | 22,660,000 | |
| Monroe County, GA, Development Authority Pollution Control Revenue, Oglethorpe Power Corp., Series B, 0.08%***, 1/1/2036, LOC: JPMorgan Chase Bank NA | | | 27,530,000 | | | | 27,530,000 | |
| Montgomery County, TN, Public Building Authority, Pooled Financing Revenue, Tennessee County Loan Pool, 0.23%***, 11/1/2027, LOC: Bank of America NA | | | 30,790,000 | | | | 30,790,000 | |
| Nashville & Davidson County, TN, Metropolitan Government Health & Educational Facilities Board, Multi-Family Housing, Weatherly Ridge Apartments, Series A, AMT, 0.13%***, 12/1/2041, LOC: U.S. Bank NA | | | 3,000,000 | | | | 3,000,000 | |
| Nevada, Housing Division, Multi-Unit Housing, Apache Project, Series A, AMT, 0.1%***, 10/15/2032, LIQ: Fannie Mae | | | 11,815,000 | | | | 11,815,000 | |
| New Hampshire, State Health & Education Facilities Authority Revenue, Higher Education Loan Corp., Series A, 0.18%***, 12/1/2032, LOC: Royal Bank of Canada (a) | | | 24,401,000 | | | | 24,401,000 | |
| New Jersey, State Health Care Facilities Financing Authority Revenue, Saint Barnabas Health, Series C, 0.09%***, 7/1/2038, LOC: JPMorgan Chase Bank NA (a) | | | 21,495,000 | | | | 21,495,000 | |
| New Mexico, Educational Assistance Foundation, Series A-1, AMT, 0.12%***, 4/1/2034, LOC: Royal Bank of Canada | | | 19,485,000 | | | | 19,485,000 | |
| New Mexico, Wells Fargo Stage Trust, Series 40C, 144A, 0.11%***, 8/1/2039, GTY: Wells Fargo Bank NA, LIQ: Wells Fargo Bank NA | | | 9,265,000 | | | | 9,265,000 | |
| New York, State Dormitory Authority Revenues, Non State Supported Debt, Series 47C, 144A, 0.11%***, 7/1/2050, GTY: Wells Fargo Bank NA, LIQ: Wells Fargo Bank NA | | | 20,595,000 | | | | 20,595,000 | |
| New York, State Dormitory Authority Revenues, Non-State Supported Debt, St. John's University, Series B-2, 0.08%***, 7/1/2037, LOC: Bank of America NA | | | 32,000,000 | | | | 32,000,000 | |
| New York, State Dormitory Authority Revenues, Secondary Issues, Series R-12121, 0.1%***, 4/1/2015, LIQ: Citibank NA | | | 15,830,000 | | | | 15,830,000 | |
| New York, State Energy Research & Development Authority Facilities Revenue, Consolidated Edison Co. of New York, Inc.: | | | | | | | | |
| Series A-2, 144A, 0.06%***, 5/1/2039, LOC: Mizuho Corporate Bank | | | 21,100,000 | | | | 21,100,000 | |
| Series A-1, 144A, 0.07%***, 5/1/2039, LOC: Mizuho Corporate Bank | | | 22,300,000 | | | | 22,300,000 | |
| Series C-3, 144A, AMT, 0.08%***, 11/1/2039, LOC: Mizuho Corporate Bank | | | 27,000,000 | | | | 27,000,000 | |
| Series C-1, 144A, AMT, 0.09%***, 11/1/2039, LOC: Mizuho Corporate Bank | | | 11,200,000 | | | | 11,200,000 | |
| New York, State Housing Finance Agency Revenue, 100 Maiden Lane Properties, Series A, 0.08%***, 5/15/2037, LIQ: Fannie Mae | | | 29,660,000 | | | | 29,660,000 | |
| New York, State Housing Finance Agency Revenue, 88 Leonard Street, Series A, 144A, 1.25%***, 11/1/2037, LOC: Landesbank Hessen-Thuringen (a) | | | 11,750,000 | | | | 11,750,000 | |
| New York, State Housing Finance Agency Revenue, West 38 Street, Series A, AMT, 0.09%***, 5/15/2033, LIQ: Fannie Mae | | | 16,000,000 | | | | 16,000,000 | |
| New York, State Housing Finance Agency, Affordable Housing Revenue, Clinton Park Housing, Series A, 0.1%***, 11/1/2044, LOC: Wells Fargo Bank NA | | | 21,750,000 | | | | 21,750,000 | |
| New York, State Housing Finance Agency, Affordable Housing Revenue, Clinton Park Phase II, Series A-1, 0.09%***, 11/1/2049, LOC: Wells Fargo Bank NA | | | 19,000,000 | | | | 19,000,000 | |
| New York, State Mortgage Agency, Homeowner Revenue, Series 153, AMT, 0.11%***, 4/1/2047, SPA: Barclays Bank PLC | | | 25,000,000 | | | | 25,000,000 | |
| New York City, NY, Municipal Water Finance Authority, Water & Sewer Systems Revenue, Series TR-T30001-I, 144A, 0.3%***, 6/15/2044, LIQ: Citibank NA (a) | | | 8,000,000 | | | | 8,000,000 | |
| North Carolina, Capital Facilities Finance Agency, Educational Facilities Revenue, Forsyth Country Day School, 0.12%***, 12/1/2031, LOC: Branch Banking & Trust | | | 12,190,000 | | | | 12,190,000 | |
| North Carolina, State Capital Facilities Finance Agency Revenue, ELON University, 0.11%***, 1/1/2035, LOC: Bank of America NA | | | 19,935,000 | | | | 19,935,000 | |
| Nuveen Arizona Premium Income Municipal Fund, Inc., Series T30017-I, 144A, 0.3%***, 8/1/2014, LIQ: Citibank NA (a) | | | 27,900,000 | | | | 27,900,000 | |
| Nuveen Dividend Advantage Municipal Fund, Series T30016-I, 144A, 0.3%***, 8/1/2014, LIQ: Citibank NA (a) | | | 70,300,000 | | | | 70,300,000 | |
| Nuveen Select Quality Municipal Fund, Inc., Series 1-2525, 144A, AMT, 0.25%***, 5/1/2041, LIQ: Barclays Bank PLC | | | 40,000,000 | | | | 40,000,000 | |
| Ohio, Housing Finance Agency, Residential Mortgage-Backed Revenue, Series F, AMT, 0.15%***, 3/1/2037, SPA: Citibank NA | | | 31,930,000 | | | | 31,930,000 | |
| Ohio, State Housing Finance Agency, Residental Mortgage Revenue, Series M, AMT, 0.15%***, 9/1/2036, SPA: Citibank NA | | | 32,000,000 | | | | 32,000,000 | |
| Ohio, State Housing Finance Agency, Residential Mortgage Revenue, Mortgage-Backed Securities Program, Series N, AMT, 0.15%***, 9/1/2036, SPA: State Street Bank & Trust Co. | | | 68,405,000 | | | | 68,405,000 | |
| Oklahoma, State Turnpike Authority Revenue, Series B, 0.08%***, 1/1/2028, SPA: Royal Bank of Canada | | | 20,330,000 | | | | 20,330,000 | |
| Orlando & Orange County, FL, Expressway Authority, Series C-1, 0.1%***, 7/1/2025, INS: AGMC, LOC: JPMorgan Chase Bank NA | | | 26,000,000 | | | | 26,000,000 | |
| Palm Beach County, FL, Solid Waste Authority Revenue, 1.0%, Mandatory Put 1/12/2012 @ 100, 10/1/2031 | | | 100,000,000 | | | | 100,017,369 | |
| Philadelphia, PA, Authority for Industrial Development, Series B-3, 0.07%***, 10/1/2030, LOC: PNC Bank NA | | | 10,655,000 | | | | 10,655,000 | |
| Philadelphia, PA, Gas Works Revenue, Series D, 0.07%***, 8/1/2031, LOC: Bank of America NA | | | 25,000,000 | | | | 25,000,000 | |
| Raleigh Durham, NC, Airport Authority Revenue, Series C, 0.1%***, 5/1/2036, LOC: U.S. Bank NA | | | 10,595,000 | | | | 10,595,000 | |
| Salem, OR, Hospital Facility Authority Revenue, Salem Hospital Project, Series C, 0.12%***, 8/15/2036, LOC: Bank of America NA | | | 12,500,000 | | | | 12,500,000 | |
| San Jose, CA, Financing Authority, Series E2, 0.16%***, 6/1/2025, LOC: U.S. Bank NA (a) | | | 12,455,000 | | | | 12,455,000 | |
| San Jose, CA, Financing Authority Lease Revenue, Hayes Mansion, Series D, 0.17%***, 6/1/2025, LOC: U.S. Bank NA (a) | | | 40,985,000 | | | | 40,985,000 | |
| San Jose, CA, Financing Authority Lease Revenue, Ice Center, Series E1, 0.2%***, 6/1/2025, LOC: Bank of America NA (a) | | | 12,460,000 | | | | 12,460,000 | |
| South Carolina, State Jobs-Economic Development Authority, Economic Development Revenue, Bon Secours Health Systems, 0.1%***, 11/1/2042, INS: AGMC, LOC: JPMorgan Chase Bank NA | | | 17,500,000 | | | | 17,500,000 | |
| Southern California, Metropolitan Water District, State Authorization, Series B, 0.07%***, 7/1/2028, SPA: Landesbank Hessen-Thuringen | | | 16,600,000 | | | | 16,600,000 | |
| St. James Parish, LA, Nustar Logistics, Series A, 0.09%***, 10/1/2040, LOC: JPMorgan Chase Bank NA | | | 12,500,000 | | | | 12,500,000 | |
| Stafford County, VA, Industrial Development Authority Revenue, Series B-1, 0.15%***, 8/1/2028, LOC: Bank of America NA | | | 21,505,000 | | | | 21,505,000 | |
| Sweetwater County, WY, Pollution Control Revenue, PacifiCorp Project, Series A, 144A, 0.09%***, 7/1/2015, LOC: Barclays Bank PLC | | | 12,550,000 | | | | 12,550,000 | |
| Texas, Alliance Airport Authority, Inc., Special Facilities Revenue, Series 2088, 144A, AMT, 0.1%***, 4/1/2021, GTY: Wells Fargo & Co., LIQ: Wells Fargo & Co. | | | 24,570,000 | | | | 24,570,000 | |
| Texas, Capital Area Housing Finance Corp., Cypress Creek at River Apartments, AMT, 0.13%***, 10/1/2039, LOC: Citibank NA | | | 10,895,000 | | | | 10,895,000 | |
| Texas, Lower Neches Valley Authority, Industrial Development Corp., Series B-2, AMT, 0.03%***, 12/1/2039, GTY: Exxon Mobil Corp. | | | 7,880,000 | | | | 7,880,000 | |
| Texas, RBC Municipal Products, Inc. Trust, Series E-27, 144A, 0.1%***, 6/1/2027, LIQ: Royal Bank of Canada, LOC: Royal Bank of Canada | | | 10,000,000 | | | | 10,000,000 | |
| Texas, State General Obligation: | |
| Series E, 0.14%***, 12/1/2026, SPA: JPMorgan Chase Bank NA (a) | | | 19,000,000 | | | | 19,000,000 | |
| Series E, 0.15%***, 6/1/2032, LOC: Sumitomo Mitsui Banking (a) | | | 24,435,000 | | | | 24,435,000 | |
| Texas, State Higher Education Authority, Series L-46, 144A, AMT, 0.13%***, 12/1/2034, LIQ: Royal Bank of Canada, LOC: Royal Bank of Canada | | | 52,995,000 | | | | 52,995,000 | |
| Texas, State Veterans Housing Assistance Fund II: | |
| Series C, 0.14%***, 6/1/2031, SPA: JPMorgan Chase & Co. (a) | | | 11,255,000 | | | | 11,255,000 | |
| Series A, 144A, AMT, 0.14%***, 6/1/2034, SPA: Landesbank Hessen-Thuringen | | | 18,395,000 | | | | 18,395,000 | |
| Texas, Tax & Revenue Anticipation Notes: | |
| Series 3945, 144A, 0.07%***, 8/30/2012, LIQ: JPMorgan Chase & Co. | | | 95,000,000 | | | | 95,000,000 | |
| Series 3946, 144A, 0.07%***, 8/30/2012, LIQ: JPMorgan Chase & Co. | | | 90,975,000 | | | | 90,975,000 | |
| Series 3953, 144A, 0.07%***, 8/30/2012, LIQ: JPMorgan Chase & Co. | | | 166,075,000 | | | | 166,075,000 | |
| Series 3964, 144A, 0.07%***, 8/30/2012, LIQ: JPMorgan Chase & Co. | | | 195,000,000 | | | | 195,000,000 | |
| Texas, University of Houston Revenues, Consolidated Systems, 0.08%***, 2/15/2024 | | | 8,860,000 | | | | 8,860,000 | |
| Texas, Wells Fargo Stage Trust, Series 20C, 144A, AMT, 0.11%***, 5/1/2038, GTY: Wells Fargo Bank NA, LIQ: Wells Fargo Bank NA | | | 16,120,000 | | | | 16,120,000 | |
| Travis County, TX, Health Facilities Development Corp., Retirement Facilities Revenue, Longhorn Village Project, Series B, 0.1%***, 7/1/2037, LOC: Bank of Scotland | | | 20,430,000 | | | | 20,430,000 | |
| Troy, NY, Capital Resource Corp. Revenue, Series 4C, 144A, 0.11%***, 9/1/2040, LIQ: Wells Fargo Bank NA | | | 18,715,000 | | | | 18,715,000 | |
| Tulsa, OK, Airports Improvement Trust, Special Facility Revenue, Bizjet International Sales & Support, Inc., 144A, AMT, 0.14%***, 8/1/2018, LOC: Landesbank Hessen-Thuringen | | | 10,120,000 | | | | 10,120,000 | |
| Union County, NC, Enterprise Systems Revenue, 0.07%***, 6/1/2034, LOC: Bank of America NA | | | 13,700,000 | | | | 13,700,000 | |
| University of California Revenue, Series R-12236, 0.07%***, 10/1/2015, INS: AGMC, FGIC, LIQ: Citibank NA | | | 15,000,000 | | | | 15,000,000 | |
| University of New Mexico, Systems Improvement Revenues, 0.1%***, 6/1/2026, SPA: JPMorgan Chase Bank NA | | | 33,625,000 | | | | 33,625,000 | |
| Vermont, State Educational & Health Buildings Financing Agency Revenue, Fletcher Allen Health Care, Series A, 0.08%***, 12/1/2030, LOC: TD BankNorth NA | | | 7,070,000 | | | | 7,070,000 | |
| Volusia County, FL, Housing Finance Authority, Multi-Family Housing Revenue, Cape Morris Cove Apartments, Series A, AMT, 0.12%***, 10/15/2042, LOC: JPMorgan Chase Bank NA | | | 6,140,000 | | | | 6,140,000 | |
| Washington, State Economic Development Finance Authority, Solid Waste Disposal Revenue, Waste Management, Inc. Project, Series D, AMT, 0.15%***, 7/1/2030, LOC: JPMorgan Chase Bank NA | | | 20,000,000 | | | | 20,000,000 | |
| Washington, State Health Care Facilities Authority, Swedish Health Services: | | | | | | | | |
| Series B, 0.09%***, 11/15/2046, LOC: Citibank NA | | | 13,000,000 | | | | 13,000,000 | |
| Series C, 0.09%***, 11/15/2046, LOC: Citibank NA | | | 14,000,000 | | | | 14,000,000 | |
| Washington, State Housing Finance Commission, Rolling Hills Apartments Project, Series A, 144A, AMT, 0.13%***, 6/15/2037, LIQ: Fannie Mae | | | 6,125,000 | | | | 6,125,000 | |
| Washington, Wells Fargo Stage Trust, Series 21C, 144A, 0.11%***, 12/1/2037, GTY: Wells Fargo Bank NA, LIQ: Wells Fargo Bank NA | | | 10,360,000 | | | | 10,360,000 | |
| Wayne County, MI, Airport Authority Revenue, Detroit Metropolitan Airport: | | | | | | | | |
| Series E2, AMT, 0.1%***, 12/1/2028, LOC: PNC Bank NA | | | 16,000,000 | | | | 16,000,000 | |
| Series E1, AMT, 0.11%***, 12/1/2028, LOC: JPMorgan Chase Bank NA | | | 25,000,000 | | | | 25,000,000 | |
| Wisconsin, Housing & Economic Development Authority, Home Ownership Revenue, Series B, 0.15%***, 3/1/2033, LOC: Fannie Mae, Freddie Mac (a) | | | 13,905,000 | | | | 13,905,000 | |
| Wisconsin, State Health & Educational Facilities Authority Revenue, Mercy Alliance, Inc., 0.06%***, 6/1/2039, LOC: U.S. Bank NA | | | 23,000,000 | | | | 23,000,000 | |
| Wisconsin, State Health & Educational Facilities Authority Revenue, Oakwood Village Apartments, Inc., 0.06%***, 8/15/2028, LOC: BMO Harris Bank NA | | | 9,095,000 | | | | 9,095,000 | |
| Woodstock, IL, Multi-Family Housing Revenue, Willow Brooke Apartments, AMT, 0.12%***, 4/1/2042, LOC: Wells Fargo Bank NA | | | 24,600,000 | | | | 24,600,000 | |
| Wyoming, Student Loan Corp. Revenue, Series A-3, 0.08%***, 12/1/2043, LOC: Royal Bank of Canada | | | 40,000,000 | | | | 40,000,000 | |
Total Municipal Investments (Cost $4,389,093,369) | | | | 4,389,093,369 | |
| | |
| Repurchase Agreements 0.5% | |
| JPMorgan Securities, Inc., 0.16%, dated 12/30/2011, to be repurchased at $100,001,778 on 1/3/2012 (b) (Cost $100,000,000) | | | 100,000,000 | | | | 100,000,000 | |
| | | % of Net Assets | | | Value ($) | |
| | | | |
Total Investment Portfolio ($19,901,627,274)+ | | | 95.8 | | | | 19,901,627,274 | |
| Other Assets and Liabilities, Net | | | 4.2 | | | | 882,549,401 | |
| Net Assets | | | 100.0 | | | | 20,784,176,675 | |
* Floating rate securities' yields vary with a designated market index or market rate, such as the coupon-equivalent of the U.S. Treasury Bill rate. These securities are shown at their current rate as of December 31, 2011.
** Annualized yield at time of purchase; not a coupon rate.
*** Variable rate demand notes and variable rate demand preferred shares are securities whose interest rates are reset periodically at market levels. These securities are payable on demand and are shown at their current rates as of December 31, 2011.
+ The cost for federal income tax purposes was $19,901,627,274.
(a) Taxable issue.
(b) Collateralized by:
| Principal Amount ($) | | Security | | Rate (%) | | Maturity Date | | Collateral Value ($) | |
| | 50,870,000 | | Federated Republic of Brazil | | | 8.875-12.75 | | 1/15/2020- 4/15/2024 | | | 84,676,763 | |
| | 20,000,000 | | Republic of South Africa | | | 7.375 | | 4/25/2012 | | | 20,325,000 | |
| Total Collateral Value | | | 105,001,763 | |
144A: Security exempt from registration under Rule 144A of the Securities Act of 1933. These securities may be resold in transactions exempt from registration, normally to qualified institutional buyers.
AGMC: Assured Guaranty Municipal Corp.
AMBAC: Ambac Financial Group, Inc.
AMT: Subject to alternative minimum tax.
FGIC: Financial Guaranty Insurance Co.
GTY: Guaranty Agreement
INS: Insured
LIQ: Liquidity Facility
LOC: Letter of Credit
Radian: Radian Asset Assurance, Inc.
SPA: Standby Bond Purchase Agreement
Fair Value Measurements
Various inputs are used in determining the value of the Portfolio's investments. These inputs are summarized in three broad levels. Level 1 includes quoted prices in active markets for identical securities. Level 2 includes other significant observable inputs (including quoted prices for similar securities, interest rates, prepayment speeds and credit risk). Level 3 includes significant unobservable inputs (including the Portfolio's own assumptions in determining the fair value of investments). The inputs or methodology used for valuing securities are not necessarily an indication of the risk associated with investing in those securities. Securities held by the Portfolio are reflected as Level 2 because the securities are valued at amortized cost (which approximates fair value) and, accordingly, the inputs used to determine value are not quoted prices in an active market.
The following is a summary of the inputs used as of December 31, 2011 in valuing the Portfolio's investments. For information on the Portfolio's policy regarding the valuation of investments, please refer to the Security Valuation section of Note A in the accompanying Notes to Financial Statements.
| Assets | | Level 1 | | | Level 2 | | | Level 3 | | | Total | |
| | |
| Investments in Securities (c) | | $ | — | | | $ | 19,801,627,274 | | | $ | — | | | $ | 19,801,627,274 | |
| Repurchase Agreements | | | — | | | | 100,000,000 | | | | — | | | | 100,000,000 | |
| Total | | $ | — | | | $ | 19,901,627,274 | | | $ | — | | | $ | 19,901,627,274 | |
There have been no transfers between Level 1 and Level 2 fair value measurements during the year ended December 31, 2011.
(c) See Investment Portfolio for additional detailed categorizations.
The accompanying notes are an integral part of the financial statements.
Statement of Assets and Liabilities | as of December 31, 2011 | |
| Assets | |
| Investments in non-affiliated securities, valued at amortized cost | | $ | 19,901,627,274 | |
| Cash | | | 702,330,627 | |
| Receivable for investments sold | | | 161,146,638 | |
| Interest receivable | | | 21,929,547 | |
| Other assets | | | 408,290 | |
| Total assets | | | 20,787,442,376 | |
| Liabilities | |
| Accrued management fee | | | 2,182,416 | |
| Other accrued expenses and payables | | | 1,083,285 | |
| Total liabilities | | | 3,265,701 | |
| Net assets, at value | | $ | 20,784,176,675 | |
The accompanying notes are an integral part of the financial statements.
| for the year ended December 31, 2011 | |
| Investment Income | |
Income: Interest | | $ | 66,333,359 | |
Expenses: Management fee | | | 32,771,738 | |
| Administration fee | | | 7,827,308 | |
| Custodian fee | | | 98,023 | |
| Professional fees | | | 124,799 | |
| Reports to shareholders | | | 22,736 | |
| Trustees' fees and expenses | | | 668,115 | |
| Other | | | 919,172 | |
| Total expenses before expense reductions | | | 42,431,891 | |
| Expense reductions | | | (2,631,189 | ) |
| Total expenses after expense reductions | | | 39,800,702 | |
| Net investment income | | | 26,532,657 | |
| Net realized gain (loss) from investments | | | 1,557,847 | |
| Net increase (decrease) in net assets resulting from operations | | $ | 28,090,504 | |
The accompanying notes are an integral part of the financial statements.
Statement of Changes in Net Assets | | | Years Ended December 31, | |
| Increase (Decrease) in Net Assets | | 2011 | | | 2010 | |
Operations: Net investment income | | $ | 26,532,657 | | | $ | 54,765,972 | |
| Net realized gain (loss) | | | 1,557,847 | | | | 1,171,699 | |
| Net increase (decrease) in net assets resulting from operations | | | 28,090,504 | | | | 55,937,671 | |
Capital transactions in shares of beneficial interest: Proceeds from capital invested | | | 230,841,771,646 | | | | 321,400,411,976 | |
| Value of capital withdrawn | | | (244,517,559,931 | ) | | | (329,490,407,575 | ) |
| Net increase (decrease) in net assets from capital transactions in shares of beneficial interest | | | (13,675,788,285 | ) | | | (8,089,995,599 | ) |
| Increase (decrease) in net assets | | | (13,647,697,781 | ) | | | (8,034,057,928 | ) |
| Net assets at beginning of period | | | 34,431,874,456 | | | | 42,465,932,384 | |
| Net assets at end of period | | $ | 20,784,176,675 | | | $ | 34,431,874,456 | |
The accompanying notes are an integral part of the financial statements.
| | | Years Ended December 31, | |
| | | | 2011 | | | 2010 | | | 2009 | | | 2008 | | | 2007 | |
| Ratios to Average Net Assets and Supplemental Data | |
| Net assets, end of period ($ millions) | | | 20,784 | | | | 34,432 | | | | 42,466 | | | | 29,653 | | | | 33,739 | |
| Ratio of expenses before expense reductions (%) | | | .16 | | | | .17 | | | | .16 | | | | .17 | | | | .17 | |
| Ratio of expenses after expense reductions (%) | | | .15 | | | | .16 | | | | .14 | | | | .13 | | | | .14 | |
| Ratio of net investment income (%) | | | .10 | | | | .16 | | | | .43 | | | | 2.85 | | | | 5.14 | |
Total Return (%)a,b | | | .11 | | | | .17 | | | | .48 | | | | 2.81 | | | | 5.31 | |
a Total return would have been lower had certain expenses not been reduced. b Total return for the Portfolio was derived from the performance of Cash Reserves Fund Institutional. | |
Notes to Financial Statements
A. Organization and Significant Accounting Policies
Cash Management Portfolio (the "Portfolio'') is registered under the Investment Company Act of 1940, as amended (the "1940 Act''), as an open-end management investment company organized as a New York business trust.
The Portfolio is a master fund. A master/feeder fund structure is one in which a fund (a "feeder fund"), instead of investing directly in a portfolio of securities, invests most or all of its investment assets in a separate registered investment company (the "master fund") with substantially the same investment objective and policies as the feeder fund. Such a structure permits the pooling of assets of two or more feeder funds, preserving separate identities or distribution channels at the feeder fund level. The Portfolio may have several feeder funds, including affiliated DWS feeder funds, with a significant ownership percentage of the Portfolio's net assets. Investment activities of these feeder funds could have a material impact on the Portfolio. As of December 31, 2011, Cash Management Fund, Cash Reserves Fund Institutional, Cash Reserves Fund — Prime Series and DWS Money Market Series owned approximately 11%, 10%, 5% and 72%, respectively, of the Portfolio.
The Portfolio's financial statements are prepared in accordance with accounting principles generally accepted in the United States of America which require the use of management estimates. Actual results could differ from those estimates. The policies described below are followed consistently by the Portfolio in the preparation of its financial statements.
Security Valuation. Various inputs are used in determining the value of the Portfolio's investments. These inputs are summarized in three broad levels. Level 1 includes quoted prices in active markets for identical securities. Level 2 includes other significant observable inputs (including quoted prices for similar securities, interest rates, prepayment speeds, and credit risk). Level 3 includes significant unobservable inputs (including the Portfolios' own assumptions in determining the fair value of investments). The inputs or methodology used for valuing securities are not necessarily an indication of the risk associated with investing in those securities.
The Portfolio values all securities utilizing the amortized cost method permitted in accordance with Rule 2a-7 under the 1940 Act and certain conditions therein. Under this method, which does not take into account unrealized capital gains or losses on securities, an instrument is initially valued at its cost and thereafter assumes a constant accretion/amortization rate to maturity of any discount or premium. Securities held by the Portfolio are reflected as Level 2 because the securities are valued at amortized cost (which approximates fair value) and, accordingly, the inputs used to determine value are not quoted prices in an active market.
Repurchase Agreements. The Portfolio may enter into repurchase agreements with certain banks and broker/dealers whereby the Portfolio, through its custodian or a sub-custodian bank, receives delivery of the underlying securities, the amount of which at the time of purchase and each subsequent business day is required to be maintained at such a level that the value is equal to at least the principal amount of the repurchase price plus accrued interest. The custodian bank or another designated subcustodian holds the collateral in a separate account until the agreement matures. If the value of the securities falls below the principal amount of the repurchase agreement plus accrued interest, the financial institution deposits additional collateral by the following business day. If the financial institution either fails to deposit the required additional collateral or fails to repurchase the securities as agreed, the Portfolio has the right to sell the securities and recover any resulting loss from the financial institution. If the financial institution enters into bankruptcy, the Portfolio's claims on the collateral may be subject to legal proceedings.
Federal Income Taxes. The Portfolio is considered a Partnership under the Internal Revenue Code, as amended. Therefore, no federal income tax provision is necessary.
It is intended that the Portfolio's assets, income and distributions will be managed in such a way that an investor in the Portfolio will be able to satisfy the requirements of Subchapter M of the Code, assuming that the investor invested all of its assets in the Portfolio.
The Portfolio has reviewed the tax positions for the open tax years as of December 31, 2011 and has determined that no provision for income tax is required in the Portfolio's financial statements. The Portfolio's federal tax returns for the prior three fiscal years remain open subject to examination by the Internal Revenue Service.
Contingencies. In the normal course of business, the Portfolio may enter into contracts with service providers that contain general indemnification clauses. The Portfolio's maximum exposure under these arrangements is unknown as this would involve future claims that may be made against the Portfolio that have not yet been made. However, based on experience, the Portfolio expects the risk of loss to be remote.
Other. Investment transactions are accounted for on trade date. Interest income is recorded on the accrual basis. Distributions of income and capital gains from investment companies are recorded on the ex-dividend date. Realized gains and losses from investment transactions are recorded on an identified cost basis. All discounts and premiums are accreted/amortized for both tax and financial reporting purposes.
The Portfolio makes an allocation of its net investment income and realized gains and losses from securities transactions to its investors in proportion to their investment in the Portfolio.
B. Fees and Transactions with Affiliates
Management Agreement. Under the Investment Management Agreement with Deutsche Investment Management Americas Inc. ("DIMA" or the "Advisor"), an indirect, wholly owned subsidiary of Deutsche Bank AG, the Advisor determines the securities, instruments and other contracts relating to investments to be purchased, sold or entered into by the Portfolio.
Under the Investment Management Agreement, the Portfolio pays the Advisor a monthly management fee based on its average daily net assets, computed and accrued daily and payable monthly, at the following annual rates:
| First $3.0 billion of the Portfolio's average daily net assets | | | .1500 | % |
| Next $4.5 billion of such net assets | | | .1325 | % |
| Over $7.5 billion of such net assets | | | .1200 | % |
For the period from January 1, 2011 through July 26, 2011, the Advisor had voluntarily agreed to waive total operating expenses at 0.16% of its average daily net assets (excluding certain expenses such as extraordinary expenses, taxes, brokerage and interest).
Effective July 27, 2011, the Advisor has voluntarily agreed to waive its fees and/or reimburse certain operating expenses to the extent necessary to maintain the operating expenses (excluding certain expenses such as extraordinary expenses, taxes, brokerage and interest) at 0.14% of the Fund's average daily net assets. The waiver may be changed or terminated at anytime without notice.
For the year ended December 31, 2011, the Advisor waived a portion of its management fee aggregating $2,631,189, and the amount charged aggregated $30,140,549, which was equivalent to an annual effective rate of 0.12% of the Portfolio's average daily net assets.
Administration Fee. Pursuant to an Administrative Services Agreement, DIMA provides most administrative services to the Portfolio. For all services provided under the Administrative Services Agreement, the Portfolio pays the Advisor an annual fee ("Administration Fee") of 0.03% of the Portfolio's average daily net assets, computed and accrued daily and payable monthly. For the year ended December 31, 2011, the Administration Fee was $7,827,308, of which $569,638 is unpaid.
Filing Service Fees. Under an agreement with DIMA, DIMA is compensated for providing certain regulatory filing services to the Portlfolio. For the year ended December 31, 2011, the amount charged to the Portfolio by DIMA included in the Statement of Operations under "reports to shareholders" aggregated $3,074, of which $1,343 is unpaid.
Trustees' Fees and Expenses. The Portfolio paid each Trustee not affiliated with the Advisor retainer fees plus specified amounts for various committee services and for the Board Chairperson.
C. Line of Credit
The Portfolio and other affiliated funds (the "Participants") share in a $450 million revolving credit facility provided by a syndication of banks. The Portfolio may borrow for temporary or emergency purposes, including the meeting of redemption requests that otherwise might require the untimely disposition of securities. The Participants are charged an annual commitment fee which is allocated based on net assets, among each of the Participants. Interest is calculated at a rate per annum equal to the sum of the Federal Funds Rate plus 1.25 percent plus if LIBOR exceeds the Federal Funds Rate the amount of such excess. The Portfolio may borrow up to a maximum of 33 percent of its net assets under the agreement. The Portfolio had no outstanding loans at December 31, 2011.
Report of Independent Registered Public Accounting Firm
To the Trustees and Holders of Beneficial Interest of Cash Management Portfolio:
In our opinion, the accompanying statement of assets and liabilities, including the portfolio of investments, and the related statements of operations and of changes in net assets and the financial highlights presents fairly, in all material respects, the financial position of Cash Management Portfolio (hereafter referred to as the "Portfolio'') at December 31, 2011, and the results of its operations, the changes in its net assets and the financial highlights for each of the periods indicated therein, in conformity with accounting principles generally accepted in the United States of America. These financial statements and financial highlights (hereafter referred to as "financial statements'') are the responsibility of the Portfolio's management. Our responsibility is to express an opinion on these financial statements based on our audits. We conducted our audits of these financial statements in accordance with the standards of the Public Company Accounting Oversight Board (United States). Those standards require that we plan and perform the audits to obtain reasonable assurance about whether the financial statements are free of material misstatement. An audit includes examining, on a test basis, evidence supporting the amounts and disclosures in the financial statements, assessing the accounting principles used and significant estimates made by management, and evaluating the overall financial statement presentation. We believe that our audits, which included confirmation of securities at December 31, 2011 by correspondence with the custodian and brokers, provide a reasonable basis for our opinion.
Boston, Massachusetts February 24, 2012 | PricewaterhouseCoopers LLP |
Investment Management Agreement Approval
Cash Reserves Fund Institutional (the "Fund"), a series of DWS Money Market Trust, invests all of its assets in Cash Management Portfolio (the "Portfolio") in order to achieve its investment objectives. The Portfolio's Board of Trustees approved the renewal of the Portfolio's investment management agreement (the "Portfolio Agreement") with Deutsche Investment Management Americas Inc. ("DWS") and the Fund's Board of Trustees (which consists of the same members as the Board of Trustees of the Portfolio) approved the renewal of the Fund's investment management agreement with DWS (the "Fund Agreement," and together with the Portfolio Agreement, the "Agreements") in September 2011. The Portfolio's Board of Trustees and the Fund's Board of Trustees are collectively referred to as the "Board."
In terms of the process that the Board followed prior to approving the Agreements, shareholders should know that:
· In September 2011, all of the Portfolio's and Fund's Trustees were independent of DWS and its affiliates.
· The Trustees met frequently during the past year to discuss fund matters and dedicated a substantial amount of time to contract review matters. Over the course of several months, the Board's Contract Committee, in coordination with the Board's Fixed Income and Quant Oversight Committee, reviewed comprehensive materials received from DWS, independent third parties and independent counsel. These materials included an analysis of performance, fees and expenses, and profitability compiled by an independent fee consultant. The Board also received extensive information throughout the year regarding performance of the Portfolio and the Fund.
· The Independent Trustees regularly meet privately with their independent counsel to discuss contract review and other matters. In addition, the Independent Trustees were also advised by an independent fee consultant in the course of their review of the Portfolio's and the Fund's contractual arrangements and considered a comprehensive report prepared by the independent fee consultant in connection with their deliberations (the "IFC Report").
· In connection with reviewing the Agreements, the Board also reviewed the terms of the Fund's distribution agreement, administrative services agreement, transfer agency agreement and other material service agreements.
· Based on its evaluation of the information provided, the Contract Committee presented its findings and recommendations to the Board. The Board then reviewed the Contract Committee's findings and recommendations.
In connection with the contract review process, the Contract Committee and the Board considered the factors discussed below, among others. The Board also considered that DWS and its predecessors have managed the Portfolio and the Fund since their inception, and the Board believes that a long-term relationship with a capable, conscientious advisor is in the best interests of the Portfolio and the Fund. The Board considered, generally, that shareholders chose to invest or remain invested in the Fund knowing that DWS managed the Portfolio and the Fund, and that the Fund Agreement was approved by the Fund's shareholders. DWS is part of Deutsche Bank, a major global banking institution that is engaged in a wide range of financial services. The Board believes that there are significant advantages to being part of a global asset management business that offers a wide range of investing expertise and resources, including hundreds of portfolio managers and analysts with research capabilities in many countries throughout the world.
While shareholders may focus primarily on fund performance and fees, the Board considers these and many other factors, including the quality and integrity of DWS's personnel and such other issues as back-office operations, fund valuations, and compliance policies and procedures.
Nature, Quality and Extent of Services. The Board considered the terms of the Agreements, including the scope of advisory services provided under the Agreements. The Board noted that, under the Agreements, DWS provides portfolio management services to the Portfolio and the Fund and that, pursuant to separate administrative services agreements, DWS provides administrative services to the Portfolio and the Fund. The Board considered the experience and skills of senior management and investment personnel, the resources made available to such personnel, the ability of DWS to attract and retain high-quality personnel, and the organizational depth and stability of DWS. The Board reviewed the Portfolio's and the Fund's performance over short-term and long-term periods and compared those returns to various agreed-upon performance measures, including market indices and a peer universe compiled by the independent fee consultant using information supplied by iMoneyNet Inc. ("iMoneyNet"). The Board also noted that it has put into place a process of identifying "Focus Funds" (e.g., funds performing poorly relative to their benchmark or a peer universe compiled by an independent fund data service), and receives more frequent reporting and information from DWS regarding such funds, along with DWS's remedial plans to address underperformance. The Board believes this process is an effective manner of identifying and addressing underperforming funds. Based on the information provided, the Board noted that for the one- and three-year periods ended December 31, 2010, the Fund's gross performance (Institutional Class shares) was in the 2nd quartile and 3rd quartile, respectively, of the applicable iMoneyNet universe (the 1st quartile being the best performers and the 4th quartile being the worst performers).
On the basis of this evaluation and the ongoing review of investment results by the Board, the Board concluded that the nature, quality and extent of services provided by DWS historically have been and continue to be satisfactory.
Fees and Expenses. The Board considered the Portfolio's and the Fund's investment management fee schedules and the Fund's operating expenses and total expense ratios, and comparative information provided by Lipper Inc. ("Lipper") and the independent fee consultant regarding investment management fee rates paid to other investment advisors by similar funds (1st quartile being the most favorable and 4th quartile being the least favorable). With respect to management fees paid to other investment advisors by similar funds, the Board noted that the contractual fee rates paid by the Portfolio and the Fund, which include 0.03% and 0.10% fees paid to DWS under the respective administrative services agreements, were higher than the median (3rd quartile) of the applicable Lipper peer group (based on Lipper data provided as of December 31, 2010). The Board noted that, although shareholders of the Fund indirectly bear the Portfolio's management fee, the Fund does not charge an additional investment management fee. The Board noted that the Fund's total (net) operating expenses, which include Portfolio expenses allocated to the Fund, were expected to be lower than the median of the applicable Lipper expense universe for Institutional Class shares (1st quartile) (based on Lipper data provided as of December 31, 2010). The Board considered the Portfolio's management fee rate as compared to fees charged by DWS and certain of its affiliates for comparable mutual funds and considered differences in fund and fee structures between the DWS Funds. The Board also considered how the Fund's total (net) operating expenses compared to the total (net) operating expenses of a more customized peer group selected by Lipper (based on such factors as asset size). The Board also noted that the expense limitation agreed to by DWS helped to ensure that the Fund's and the Portfolio's combined total (net) operating expenses would remain competitive.
The information considered by the Board as part of its review of management fees included information regarding fees charged by DWS and its affiliates to similar institutional accounts and to similar funds offered primarily to European investors ("DWS Europe funds"), in each case as applicable. The Board observed that advisory fee rates for institutional accounts generally were lower than the management fees charged by similarly managed DWS U.S. mutual funds ("DWS Funds"), but also took note of the differences in services provided to DWS Funds as compared to institutional accounts. In the case of DWS Europe funds, the Board observed that fee rates for DWS Europe funds generally were higher than for similarly managed DWS Funds, but noted that differences in the types of services provided to DWS Funds relative to DWS Europe funds made it difficult to compare such fees.
On the basis of the information provided, the Board concluded that management fees were reasonable and appropriate in light of the nature, quality and extent of services provided by DWS.
Profitability. The Board reviewed detailed information regarding revenues received by DWS under the Agreements. The Board considered the estimated costs and pre-tax profits realized by DWS from advising the DWS Funds, as well as estimates of the pre-tax profits attributable to managing the Fund in particular. The Board also received information regarding the estimated enterprise-wide profitability of DWS and its affiliates with respect to all fund services in totality and by fund. The Board and the independent fee consultant reviewed DWS's methodology in allocating its costs to the management of the Fund. Based on the information provided, the Board concluded that the pre-tax profits realized by DWS in connection with the management of the Fund were not unreasonable. The Board also reviewed information regarding the profitability of certain similar investment management firms. The Board noted that while information regarding the profitability of such firms is limited (and in some cases is not necessarily prepared on a comparable basis), DWS and its affiliates' overall profitability with respect to the DWS fund complex (after taking into account distribution and other services provided to the funds by DWS and its affiliates) was lower than the overall profitability levels of many comparable firms for which such data was available.
Economies of Scale. The Board considered whether there are economies of scale with respect to the management of the Portfolio and the Fund and whether the Portfolio and the Fund benefit from any economies of scale. The Board noted that the Portfolio's management fee schedule includes fee breakpoints. The Board concluded that the Portfolio's and the Fund's fee schedules represent an appropriate sharing between the Portfolio and the Fund, as the case may be, and DWS of such economies of scale as may exist in the management of the Portfolio and the Fund at current asset levels.
Other Benefits to DWS and Its Affiliates. The Board also considered the character and amount of other incidental benefits received by DWS and its affiliates, including any fees received by DWS for administrative services provided to the Portfolio and the Fund and any fees received by an affiliate of DWS for distribution services. The Board also considered benefits to DWS related to brokerage and soft-dollar allocations, including allocating brokerage to pay for research generated by parties other than the executing broker dealers, which pertain primarily to funds investing in equity securities, along with the incidental public relations benefits to DWS related to DWS Funds advertising and cross-selling opportunities among DWS products and services. The Board concluded that management fees were reasonable in light of these fallout benefits.
Compliance. The Board considered the significant attention and resources dedicated by DWS to documenting and enhancing its compliance processes in recent years. The Board noted in particular (i) the experience and seniority of both DWS's chief compliance officer and the Fund's chief compliance officer; (ii) the large number of DWS compliance personnel; and (iii) the substantial commitment of resources by DWS and its affiliates to compliance matters.
Based on all of the information considered and the conclusions reached, the Board unanimously determined that the continuation of the Agreements is in the best interests of the Portfolio and the Fund. In making this determination, the Board did not give particular weight to any single factor identified above. The Board considered these factors over the course of numerous meetings, certain of which were in executive session with only the Independent Trustees and their counsel present. It is possible that individual Trustees may have weighed these factors differently in reaching their individual decisions to approve the continuation of the Agreements.
Summary of Management Fee Evaluation by Independent Fee Consultant
September 26, 2011
Pursuant to an Order entered into by Deutsche Investment Management Americas and affiliates (collectively, "DeAM") with the Attorney General of New York, I, Thomas H. Mack, have been appointed the Independent Fee Consultant for the DWS Funds (formerly the DWS Scudder Funds). My duties include preparing an annual written evaluation of the management fees DeAM charges the Funds, considering among other factors the management fees charged by other mutual fund companies for like services, management fees DeAM charges other clients for like services, DeAM's costs of supplying services under the management agreements and related profit margins, possible economies of scale if a Fund grows larger, and the nature and quality of DeAM's services, including fund performance. This report summarizes my evaluation for 2011, including my qualifications, the evaluation process for each of the DWS Funds, consideration of certain complex-level factors, and my conclusions. I served in substantially the same capacity in 2007, 2008, 2009 and 2010.
Qualifications
For more than 35 years I have served in various professional capacities within the investment management business. I have held investment analysis and advisory positions, including securities analyst, portfolio strategist and director of investment policy with a large investment firm. I have also performed business management functions, including business development, financial management and marketing research and analysis.
Since 1991, I have been an independent consultant within the asset management industry. I have provided services to over 125 client organizations, including investment managers, mutual fund boards, product distributors and related organizations. Over the past ten years I have completed a number of assignments for mutual fund boards, specifically including assisting boards with management contract renewal.
I hold a Master of Business Administration degree, with highest honors, from Harvard University and Master of Science and Bachelor of Science (highest honors) degrees from the University of California at Berkeley. I am an independent director and audit committee financial expert for two closed-end mutual funds and have served in various leadership and financial oversight capacities with non-profit organizations.
Evaluation of Fees for each DWS Fund
My work focused primarily on evaluating, fund-by-fund, the fees charged to each of the 109 mutual fund portfolios in the DWS Fund family. For each Fund, I considered each of the key factors mentioned above, as well as any other relevant information. In doing so I worked closely with the Funds' Independent Directors in their annual contract renewal process, as well as in their approval of contracts for several new funds (documented separately).
In evaluating each Fund's fees, I reviewed comprehensive materials provided by or on behalf of DeAM, including expense information prepared by Lipper Analytical, comparative performance information, profitability data, manager histories, and other materials. I also accessed certain additional information from the Lipper and Morningstar databases and drew on my industry knowledge and experience.
To facilitate evaluating this considerable body of information, I prepared for each Fund a document summarizing the key data elements in each area as well as additional analytics discussed below. This made it possible to consider each key data element in the context of the others.
In the course of contract renewal, DeAM agreed to implement a number of fee and expense adjustments requested by the Independent Directors which will favorably impact future fees and expenses, and my evaluation includes the effects of these changes.
Fees and Expenses Compared with Other Funds
The competitive fee and expense evaluation for each fund focused on two primary comparisons:
The Fund's contractual management fee (the advisory fee plus the administration fee where applicable) compared with those of a group of typically 12-15 funds in the same Lipper investment category (e.g. Large Capitalization Growth) having similar distribution arrangements and being of similar size.
The Fund's total expenses compared with a broader universe of funds from the same Lipper investment category and having similar distribution arrangements.
These two comparisons provide a view of not only the level of the fee compared with funds of similar scale but also the total expense the Fund bears for all the services it receives, in comparison with the investment choices available in the Fund's investment category and distribution channel. The principal figure-of-merit used in these comparisons was the subject Fund's percentile ranking against peers.
DeAM's Fees for Similar Services to Others
DeAM provided management fee schedules for all of its US domiciled fund and non-fund investment management accounts in any of the investment categories where there is a DWS Fund. These similar products included the other DWS Funds, non-fund pooled accounts, institutional accounts and sub-advisory accounts. Using this information, I calculated for each Fund the fee that would be charged to each similar product, at the subject Fund's asset level.
Evaluating information regarding non-fund products is difficult because there are varying levels of services required for different types of accounts, with mutual funds generally requiring considerably more regulatory and administrative types of service as well as having more frequent cash flows than other types of accounts. Also, while mutual fund fees for similar fund products can be expected to be similar, there will be some differences due to different pricing conditions in different distribution channels (e.g. retail funds versus those used in variable insurance products), differences in underlying investment processes and other factors.
Costs and Profit Margins
DeAM provided a detailed profitability analysis for each Fund. After making some adjustments so that the presentation would be more comparable to the available industry figures, I reviewed profit margins from investment management alone, from investment management plus other fund services (excluding distribution) provided to the Funds by DeAM (principally shareholder services), and DeAM profits from all sources, including distribution. A later section comments on overall profitability.
Economies of Scale
Economies of scale — an expected decline in management cost per dollar of fund assets as fund assets grow — are very rarely quantified and documented because of inherent difficulties in collecting and analyzing relevant data. However, in virtually every investment category that I reviewed, larger funds tend to have lower fees and lower total expenses than smaller funds. To see how each DWS Fund compares with this industry observation, I reviewed:
The trend in Fund assets over the last five years and the accompanying trend in total expenses. This shows if the Fund has grown and, if so, whether total expense (management fees as well as other expenses) have declined as a percent of assets.
Whether the Fund has break-points in its management fee schedule, the extent of the fee reduction built into the schedule and the asset levels where the breaks take effect, and in the case of a sub-advised Fund how the Fund's break-points compare with those of the sub-advisory fee schedule.
How the Fund's contractual fee schedule compares with trends in the industry data. To accomplish this, I constructed a chart showing how actual latest-fiscal-year contractual fees of the Fund and of other similar funds relate to average fund assets, with the subject Fund's contractual fee schedule superimposed.
Quality of Service — Performance
The quality-of-service evaluation focused on investment performance, which is the principal result of the investment management service. Each Fund's performance was reviewed over the past 1, 3, 5 and 10 years, as applicable, and compared with that of other funds in the same investment category and with a suitable market index.
In addition, I calculated and reviewed risk-adjusted returns relative to an index of similar mutual funds' returns and a suitable market index. The risk-adjusted returns analysis provides a way of determining the extent to which the Fund's return comparisons are mainly the product of investment value-added (or lack thereof) or alternatively taking considerably more or less risk than is typical in its investment category.
I also received and considered the history of portfolio manager changes for each Fund, as this provided an important context for evaluating the performance results.
Complex-Level Considerations
While this evaluation was conducted mainly at the individual fund level, there are some issues relating to the reasonableness of fees that can alternatively be considered across the whole fund complex:
I reviewed DeAM's profitability analysis for all DWS Funds, with a view toward determining if the allocation procedures used were reasonable and how profit levels compared with public data for other investment managers.
I considered whether DeAM and affiliates receive any significant ancillary or "fall-out" benefits that should be considered in interpreting the direct profitability results. These would be situations where serving as the investment manager of the Funds is beneficial to another part of the Deutsche Bank organization.
I considered how aggregated DWS Fund expenses had varied over the years, by asset class and in the context of trends in asset levels.
I reviewed the structure of the DeAM organization, trends in staffing levels, and information on compensation of investment management and other professionals compared with industry data.
Findings
Based on the process and analysis discussed above, which included reviewing a wide range of information from management and external data sources and considering among other factors the fees DeAM charges other clients, the fees charged by other fund managers, DeAM's costs and profits associated with managing the Funds, economies of scale, possible fall-out benefits, and the nature and quality of services provided, in my opinion the management fees charged the DWS Funds are reasonable.
Thomas H. Mack
President, Thomas H. Mack & Co., Inc.
Board Members and Officers
The following table presents certain information regarding the Board Members and Officers of the Trusts of Cash Reserves Fund Institutional and Cash Management Portfolio as of December 31, 2011. Each Board Member's year of birth is set forth in parentheses after his or her name. Unless otherwise noted, (i) each Board Member has engaged in the principal occupation(s) noted in the table for at least the most recent five years, although not necessarily in the same capacity; and (ii) the address of each Independent Board Member is c/o Paul K. Freeman, Independent Chairman, DWS Funds, PO Box 101833, Denver, CO 80250-1833. Except as otherwise noted below, the term of office for each Board Member is until the election and qualification of a successor, or until such Board Member sooner dies, resigns, is removed or as otherwise provided in the governing documents of the fund. Because the fund does not hold an annual meeting of shareholders, each Board Member will hold office for an indeterminate period. The Board Members may also serve in similar capacities with other funds in the fund complex. The Length of Time Served represents the year in which the Board Member joined the Board of one or more DWS funds now overseen by the Board.
| Independent Board Members |
Name, Year of Birth, Position with the Fund and Length of Time Served1 | Business Experience and Directorships During the Past Five Years | Number of Funds in DWS Fund Complex Overseen |
Other Directorships Held by Board Member |
Paul K. Freeman (1950) Chairperson since 2009 Board Member since 1993 | Consultant, World Bank/Inter-American Development Bank; Executive and Governing Council of the Independent Directors Council (Chairman of Education Committee); formerly: Project Leader, International Institute for Applied Systems Analysis (1998-2001); Chief Executive Officer, The Eric Group, Inc. (environmental insurance) (1986-1998) | 110 | — |
John W. Ballantine (1946) Board Member since 1999 | Retired; formerly, Executive Vice President and Chief Risk Management Officer, First Chicago NBD Corporation/The First National Bank of Chicago (1996-1998); Executive Vice President and Head of International Banking (1995-1996). Directorships: Chairman of the Board, Healthways, Inc. (provider of disease and care management services); Portland General Electric (utility company); Stockwell Capital Investments PLC (private equity); former Directorships: First Oak Brook Bancshares, Inc. and Oak Brook Bank; Prisma Energy International | 110 | — |
Henry P. Becton, Jr. (1943) Board Member since 1990 | Vice Chair and former President, WGBH Educational Foundation. Directorships: Association of Public Television Stations; Public Radio International; Public Radio Exchange (PRX); The PBS Foundation; former Directorships: Boston Museum of Science; American Public Television; Concord Academy; New England Aquarium; Mass. Corporation for Educational Telecommunications; Committee for Economic Development; Public Broadcasting Service | 110 | Lead Director, Becton Dickinson and Company2 (medical technology company); Lead Director, Belo Corporation2 (media company) |
Dawn-Marie Driscoll (1946) Board Member since 1987 | President, Driscoll Associates (consulting firm); Executive Fellow, Center for Business Ethics, Bentley University; formerly, Partner, Palmer & Dodge (1988-1990); Vice President of Corporate Affairs and General Counsel, Filene's (1978-1988). Directorships: Director of ICI Mutual Insurance Company (since 2007); Advisory Board, Center for Business Ethics, Bentley University; Trustee, Southwest Florida Community Foundation (charitable organization); former Directorships: Investment Company Institute (audit, executive, nominating committees) and Independent Directors Council (governance, executive committees) | 110 | Trustee, Sun Capital Advisers, Inc. (22 open-end mutual funds advised by Sun Capital Advisers, Inc.) (since 2007) |
Keith R. Fox, CFA (1954) Board Member since 1996 | Managing General Partner, Exeter Capital Partners (a series of private investment funds) (since 1986). Directorships: Progressive International Corporation (kitchen goods importer and distributor); BoxTop Media Inc. (advertising); The Kennel Shop (retailer); former Chairman, National Association of Small Business Investment Companies | 110 | Trustee, Sun Capital Advisers, Inc. (22 open-end mutual funds advised by Sun Capital Advisers, Inc.) (since 2011) |
Kenneth C. Froewiss (1945) Board Member since 2001 | Adjunct Professor of Finance, NYU Stern School of Business (September 2009-present; Clinical Professor from 1997-September 2009); Member, Finance Committee, Association for Asian Studies (2002-present); Director, Mitsui Sumitomo Insurance Group (US) (2004-present); prior thereto, Managing Director, J.P. Morgan (investment banking firm) (until 1996) | 110 | — |
Richard J. Herring (1946) Board Member since 1990 | Jacob Safra Professor of International Banking and Professor, Finance Department, The Wharton School, University of Pennsylvania (since July 1972); Co-Director, Wharton Financial Institutions Center (since July 2000); Co-Chair, U.S. Shadow Financial Regulatory Committee; Executive Director, Financial Economists Roundtable; formerly: Vice Dean and Director, Wharton Undergraduate Division (July 1995-June 2000); Director, Lauder Institute of International Management Studies (July 2000-June 2006) | 110 | Director, Japan Equity Fund, Inc. (since September 2007), Thai Capital Fund, Inc. (since September 2007), Singapore Fund, Inc. (since September 2007), Independent Director of Barclays Bank Delaware (since September 2010) |
William McClayton (1944) Board Member since 2004 | Private equity investor (since October 2009); previously, Managing Director, Diamond Management & Technology Consultants, Inc. (global consulting firm) (2001-2009); Directorship: Board of Managers, YMCA of Metropolitan Chicago; formerly: Senior Partner, Arthur Andersen LLP (accounting) (1966-2001); Trustee, Ravinia Festival | 110 | — |
Rebecca W. Rimel (1951) Board Member since 1995 | President and Chief Executive Officer, The Pew Charitable Trusts (charitable organization) (1994 to present); Trustee, Washington College (2011 to present); formerly: Executive Vice President, The Glenmede Trust Company (investment trust and wealth management) (1983-2004); Board Member, Investor Education (charitable organization) (2004-2005); Trustee, Executive Committee, Philadelphia Chamber of Commerce (2001-2007); Trustee, Pro Publica (charitable organization) (2007-2010); Trustee, Thomas Jefferson Foundation (charitable organization) (1994 to 2011) | 110 | Director, CardioNet, Inc.2 (health care) (2009- present); Director, Viasys Health Care2 (January 2007- June 2007) |
William N. Searcy, Jr. (1946) Board Member since 1993 | Private investor since October 2003; formerly: Pension & Savings Trust Officer, Sprint Corporation2 (telecommunications) (November 1989-September 2003) | 110 | Trustee, Sun Capital Advisers, Inc. (22 open-end mutual funds advised by Sun Capital Advisers, Inc.) (since 1998) |
Jean Gleason Stromberg (1943) Board Member since 1997 | Retired. Formerly, Consultant (1997-2001); Director, Financial Markets US Government Accountability Office (1996-1997); Partner, Fulbright & Jaworski, L.L.P. (law firm) (1978-1996). Directorships: The William and Flora Hewlett Foundation; former Directorships: Service Source, Inc., Mutual Fund Directors Forum (2002-2004), American Bar Retirement Association (funding vehicle for retirement plans) (1987-1990 and 1994-1996) | 110 | — |
Robert H. Wadsworth (1940) Board Member since 1999 | President, Robert H. Wadsworth & Associates, Inc. (consulting firm) (1983 to present); Director, The Phoenix Boys Choir Association | 113 | — |
Officers4 |
Name, Year of Birth, Position with the Fund and Length of Time Served5 | Principal Occupation(s) During Past 5 Years and Other Directorships Held |
W. Douglas Beck, CFA6 (1967) President, 2011-present | Managing Director3, Deutsche Asset Management (2006-present); President of DWS family of funds and Head of Product Management, U.S. for DWS Investments; formerly, Executive Director, Head of Product Management (2002-2006) and President (2005-2006) of the UBS Funds at UBS Global Asset Management; Co-Head of Manager Research/Managed Solutions Group, Merrill Lynch (1998-2002) |
John Millette7 (1962) Vice President and Secretary, 1999-present | Director3, Deutsche Asset Management |
Paul H. Schubert6 (1963) Chief Financial Officer, 2004-present Treasurer, 2005-present | Managing Director3, Deutsche Asset Management (since July 2004); formerly, Executive Director, Head of Mutual Fund Services and Treasurer for UBS Family of Funds (1998-2004); Vice President and Director of Mutual Fund Finance at UBS Global Asset Management (1994-1998) |
Caroline Pearson7 (1962) Chief Legal Officer, 2010-present | Managing Director3, Deutsche Asset Management; formerly, Assistant Secretary for DWS family of funds (1997-2010) |
Rita Rubin6 (1970) Assistant Secretary, 2009-present | Director3 and Senior Counsel, Deutsche Asset Management (since October 2007); formerly, Vice President, Morgan Stanley Investment Management (2004-2007) |
Paul Antosca7 (1957) Assistant Treasurer, 2007-present | Director3, Deutsche Asset Management (since 2006); Vice President, The Manufacturers Life Insurance Company (U.S.A.) (1990-2006) |
Jack Clark7 (1967) Assistant Treasurer, 2007-present | Director3, Deutsche Asset Management (since 2007); formerly, Vice President, State Street Corporation (2002-2007) |
Diane Kenneally7 (1966) Assistant Treasurer, 2007-present | Director3, Deutsche Asset Management |
John Caruso6 (1965) Anti-Money Laundering Compliance Officer, 2010-present | Managing Director3, Deutsche Asset Management |
Robert Kloby6 (1962) Chief Compliance Officer, 2006-present | Managing Director3, Deutsche Asset Management |
1 The length of time served represents the year in which the Board Member joined the board of one or more DWS funds currently overseen by the Board.
2 A publicly held company with securities registered pursuant to Section 12 of the Securities Exchange Act of 1934.
3 Executive title, not a board directorship.
4 As a result of their respective positions held with the Advisor, these individuals are considered "interested persons" of the Advisor within the meaning of the 1940 Act. Interested persons receive no compensation from the fund.
5 The length of time served represents the year in which the officer was first elected in such capacity for one or more DWS funds.
6 Address: 60 Wall Street, New York, NY 10005.
7 Address: One Beacon Street, Boston, MA 02108.
The fund's Statement of Additional Information ("SAI") includes additional information about the Board Members. The SAI is available, without charge, upon request. If you would like to request a copy of the SAI, you may do so by calling the following toll-free number: (800) 621-1048.
Account Management Resources | |
| Automated Information Line | | Institutional Investor Services (800) 730-1313 Personalized account information, information on other DeAM funds and services via touchtone telephone and the ability to exchange or redeem shares. |
| Web Site | | www.dbadvisorsliquidity.com/US View your account transactions and balances, trade shares, monitor your asset allocation, and change your address, 24 hours a day. Obtain prospectuses and applications, blank forms, interactive worksheets, news about the funds, subscription to fund updates by e-mail, retirement planning information, and more. |
| For More Information | | (800) 730-1313, option 1 To speak with a fund service representative. |
| Written Correspondence | | Deutsche Asset Management PO Box 219210 Kansas City, MO 64121-9210 |
| Proxy Voting | | The fund's policies and procedures for voting proxies for portfolio securities and information about how the fund voted proxies related to its portfolio securities during the 12-month period ended June 30 are available on our Web site — www.dws-investments.com (click on "proxy voting"at the bottom of the page) — or on the SEC's Web site — www.sec.gov. To obtain a written copy of the fund's policies and procedures without charge, upon request, call us toll free at 800) 621-1048. |
| Portfolio Holdings | | Following the fund's fiscal first and third quarter-end, a complete portfolio holdings listing is filed with the SEC on Form N-Q. In addition, each month, information about the fund and its portfolio holdings is filed with the SEC on Form N-MFP. The SEC delays the public availability of the information filed on Form N-MFP for 60 days after the end of the reporting period included in the filing. These forms will be available on the SEC's Web site at www.sec.gov, and they may also be reviewed and copied at the SEC's Public Reference Room in Washington, D.C. Information on the operation of the SEC's Public Reference Room may be obtained by calling (800) SEC-0330. The fund's portfolio holdings are also posted on www.dws-investments.com from time to time. Please see the fund's current prospectus for more information. |
| Principal Underwriter | | If you have questions, comments or complaints, contact: DWS Investments Distributors, Inc. 222 South Riverside Plaza Chicago, IL 60606-5808 (800) 621-1148 |
| Investment Management | | Deutsche Investment Management Americas Inc. ("DIMA" or the "Advisor"), which is part of Deutsche Asset Management, is the investment advisor for the fund. DIMA and its predecessors have more than 80 years of experience managing mutual funds and DIMA provides a full range of investment advisory services to both institutional and retail clients. DIMA is an indirect, wholly owned subsidiary of Deutsche Bank AG. Deutsche Bank AG is a major global banking institution engaged in a wide variety of financial services, including investment management, retail, private and commercial banking, investment banking and insurance. DWS Investments is the retail brand name in the U.S. for the asset management activities of Deutsche Bank AG and DIMA. As such, DWS is committed to delivering the investing expertise, insight and resources of this global investment platform to American investors. |
| Nasdaq Symbol | | BIRXX |
| CUSIP Number | | 23337T 128 |
| Fund Number | | 500 |
Notes
Notes
Notes
DECEMBER 31, 2011 Annual Report to Shareholders |
| |
| DWS Money Market Series |
|
Contents
DWS Money Market Series 5 Portfolio Management Review 9 Statement of Assets and Liabilities 10 Statement of Operations 11 Statement of Changes in Net Assets 13 Notes to Financial Statements 18 Report of Independent Registered Public Accounting Firm 19 Information About Your Fund's Expenses Cash Management Portfolio 39 Statement of Assets and Liabilities 40 Statement of Operations 41 Statement of Changes in Net Assets 43 Notes to Financial Statements 47 Report of Independent Registered Public Accounting Firm 48 Investment Management Agreement Approval 53 Summary of Management Fee Evaluation by Independent Fee Consultant 57 Board Members and Officers 62 Account Management Resources |
This report must be preceded or accompanied by a prospectus. To obtain a summary prospectus, if available, or prospectus for any of our funds, refer to the Account Management Resources information provided in the back of this booklet. We advise you to consider the fund's objectives, risks, charges and expenses carefully before investing. The summary prospectus and prospectus contain this and other important information about the fund. Please read the prospectus carefully before you invest.
An investment in this fund is not insured or guaranteed by the Federal Deposit Insurance Corporation (FDIC) or by any other government agency. Although the fund seeks to preserve the value of your investment at $1.00 per share, it is possible to lose money by investing in the fund. The share price of money market funds can fall below the $1.00 share price. You should not rely on or expect the Advisor to enter into support agreements or take other actions to maintain the fund's $1.00 share price. The credit quality of the fund's holdings can change rapidly in certain markets, and the default of a single holding could have an adverse impact on the fund's share price. The fund's share price can also be negatively affected during periods of high redemption pressures and/or illiquid markets. The actions of a few large investors of the fund may have a significant adverse effect on the share price of the fund. See the prospectus for specific details regarding the fund's risk profile.
DWS Investments is part of Deutsche Bank's Asset Management division and, within the U.S., represents the retail asset management activities of Deutsche Bank AG, Deutsche Bank Trust Company Americas, Deutsche Investment Management Americas Inc. and DWS Trust Company.
NOT FDIC/NCUA INSURED NO BANK GUARANTEE MAY LOSE VALUE NOT A DEPOSIT NOT INSURED BY ANY FEDERAL GOVERNMENT AGENCY
Portfolio Management Review
Market Overview
All performance information below is historical and does not guarantee future results. Investment return and principal fluctuate, so your shares may be worth more or less when redeemed. Current performance may differ from performance data shown. Please visit www.dbadvisorsliquidity.com/US for the fund's most recent month-end performance. The 7-day current yield refers to the income paid by the fund over a 7-day period expressed as an annual percentage rate of the fund's shares outstanding. Yields fluctuate and are not guaranteed.
Over the fund's most recent 12-month period ended December 31, 2011, money markets were responding to alternating degrees of perceived risk in the global financial markets, with short-term rates rising or falling slightly in response to the current state of the European sovereign debt crisis. During the summer, the political standoff in the United States related to the raising of the U.S. debt ceiling spurred volatility in financial markets. The extreme difficulties that Congress encountered in coming to agreement regarding the debt ceiling made up a large part of the rationale cited by Standard & Poor's® in deciding to downgrade U.S. debt from AAA to AA+ on August 5, 2011. However, the United States' role as a perceived "safe haven" for fixed-income investors worldwide has thus far remained unchanged. In addition, credit downgrades of various domestic and international banks and "credit watches" instituted by ratings agencies on some European countries exerted pressure on the money markets. Encouragingly, the European Central Bank (ECB) has made some extraordinary efforts over the past several months to head off additional problems for European governments and banks by securing funding access for the major banks in Europe.
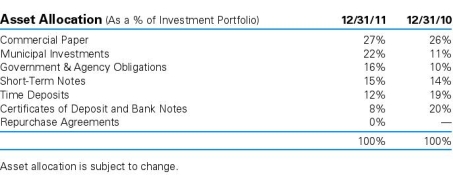
Positive Contributors to Fund Performance
We were able to maintain a competitive yield for the fund during the period.
Over the period, we continued to hold a large percentage of portfolio assets in short-maturity instruments for liquidity purposes as well as for high quality and yield. We also maintained a higher than average maturity, with fund assets broadly diversified among a number of different sectors, including banks, corporate issues, U.S. government securities and municipal debt, though diversification neither assures a profit nor guarantees against loss. In addition, we focused on more favorable geographical areas for money market investment, such as Canada, Australia and the Nordic region. Lastly, given market uncertainty and our desire to maintain larger cash positions in the fund, we found value in municipal Variable Rate Demand Notes compared with taxable alternatives of the same maturity, such as bank Certificates of Deposit.
Fund Performance (as of December 31, 2011)
Performance is historical and does not guarantee future results. Current performance may be lower or higher than the performance data quoted.
An investment in this fund is not insured or guaranteed by the FDIC or by any other government agency. Although the fund seeks to preserve the value of your investment at $1.00 per share, it is possible to lose money by investing in the fund. The share price of money market funds can fall below the $1.00 share price.
| 7-Day Current Yield | | | |
| December 31, 2011 | | | .08 | %* |
| December 31, 2010 | | | .16 | %* |
| * The investment advisor has agreed to waive fees/reimburse expenses. Without such fee waivers/expense reimbursements, the 7-day current yield would have been lower. | |
Yields are historical, will fluctuate and do not guarantee future performance. The 7-day current yield refers to the income paid by the portfolio over a 7-day period expressed as an annual percentage rate of the fund's shares outstanding. Please visit our Web site at www.dbadvisorsliquidity.com/US for the product's most recent month-end performance.
Negative Contributors to Fund Performance
The types of securities that we were investing in during the period ended December 31, 2011, tended to have shorter maturities and lower yields than issues carrying more risk. We preferred to be cautious during a time of market fluctuation. In the end this cost the fund some yield, but we believe that this represented a prudent approach to preserving principal.
| "Encouragingly, the European Central Bank (ECB) has made some extraordinary efforts over the past several months to head off additional problems for European governments and banks by securing funding access for the major banks in Europe." |
Outlook and Positioning
Positive news for U.S. markets has come recently in the form of improved economic reports, including a pickup in manufacturing activity and some declines in domestic unemployment. The U.S. Federal Reserve Board (the Fed) has been doing its part by continuing its accommodative monetary policy and hinting at additional transparency for financial market participants in the near term. The main headwind to improved economic and financial market prospects comes from uncertainty over the European sovereign debt crisis. With several European countries facing austerity measures, we tend to believe that Europe is on the precipice of a recession. Market participants are urgently wishing for concrete and permanent solutions to the European crisis in the hopes that such a result would encourage further global economic progress and reduce financial market uncertainty.
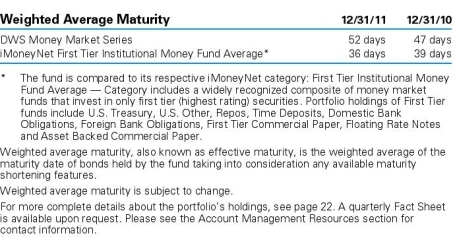
We continue our insistence on the highest credit quality within the fund. We also continue to apply a careful approach to investing on behalf of the fund and to seek competitive yield for our shareholders.
Portfolio Management Team
A group of investment professionals is responsible for the day-to-day management of the fund. These investment professionals have a broad range of experience managing money market funds.
The views expressed reflect those of the portfolio management team only through the end of the period of the report as stated on the cover. The management team's views are subject to change at any time based on market and other conditions and should not be construed as a recommendation. Past performance is no guarantee of future results. Current and future portfolio holdings are subject to risk.
Terms to Know
Municipal debt is state and local government bonds issued to finance capital expenditures.
Credit quality measures a bond issuer's ability to repay interest and principal in a timely manner. Rating agencies assign letter designations, such as AAA, AA and so forth. The lower the rating, the higher the probability of default. Credit quality does not remove market risk and is subject to change.
Statement of Assets and Liabilities | as of December 31, 2011 | |
| Assets | |
| Investment in Cash Management Portfolio, at value | | $ | 14,886,957,646 | |
| Receivable for Fund shares sold | | | 107,036 | |
| Due from Advisor | | | 241,157 | |
| Other assets | | | 14,090 | |
| Total assets | | | 14,887,319,929 | |
| Liabilities | |
| Payable for Fund shares redeemed | | | 225,969 | |
| Distributions payable | | | 362,306 | |
| Accrued expenses | | | 90,715 | |
| Total liabilities | | | 678,990 | |
| Net assets, at value | | $ | 14,886,640,939 | |
| Net Assets Consist of | |
| Accumulated net realized gain (loss) | | | (1,094,011 | ) |
| Paid-in capital | | | 14,887,734,950 | |
| Net assets, at value | | $ | 14,886,640,939 | |
| Net Asset Value | |
Institutional Shares Net Asset Value, offering and redemption price per share ($14,886,640,939 ÷ 14,888,054,190 outstanding shares of beneficial interest, $.01 par value, unlimited number of shares authorized) | | $ | 1.00 | |
The accompanying notes are an integral part of the financial statements.
| for the year ended December 31, 2011 | |
| Investment Income | | | |
| Income and expenses allocated from Cash Management Portfolio: | | | |
| Interest | | $ | 50,643,431 | |
| Expenses* | | | (30,365,413 | ) |
| Net investment income allocated from Cash Management Portfolio | | | 20,278,018 | |
Expenses: Administration fee | | | 19,867,529 | |
| Services to shareholders | | | 1,376,085 | |
| Professional fees | | | 32,795 | |
| Reports to shareholders | | | 11,335 | |
| Registration fees | | | 47,047 | |
| Trustees' fees and expenses | | | 7,244 | |
| Other | | | 79,339 | |
| Total expenses before expense reductions | | | 21,421,374 | |
| Expense reductions | | | (21,421,374 | ) |
| Total expenses after expense reductions | | | 0 | |
| Net investment income (loss) | | | 20,278,018 | |
| Net realized gain (loss) allocated from Cash Management Portfolio | | | 1,213,587 | |
| Net increase (decrease) in net assets resulting from operations | | $ | 21,491,605 | |
* Net of $2,003,651 Advisor reimbursement allocated from Cash Management Portfolio
The accompanying notes are an integral part of the financial statements.for the year ended December 31, 2011.
Statement of Changes in Net Assets | | | Years Ended December 31, | |
| Increase (Decrease) in Net Assets | | 2011 | | | 2010 | |
Operations: Net investment income | | $ | 20,278,018 | | | $ | 41,448,132 | |
| Net realized gain (loss) | | | 1,213,587 | | | | (1,726,043 | ) |
| Net increase (decrease) in net assets resulting from operations | | | 21,491,605 | | | | 39,722,089 | |
Distributions to shareholders from: Net investment income: Institutional Shares | | | (20,519,595 | ) | | | (41,448,132 | ) |
Fund share transactions: Proceeds from shares sold | | | 187,556,353,171 | | | | 264,977,585,156 | |
| Reinvestment of distributions | | | 13,007,040 | | | | 23,520,820 | |
| Payments for shares redeemed | | | (198,608,222,899 | ) | | | (271,056,831,929 | ) |
| Net increase (decrease) in net assets from Fund share transactions | | | (11,038,862,688 | ) | | | (6,055,725,953 | ) |
| Increase (decrease) in net assets | | | (11,037,890,678 | ) | | | (6,057,451,996 | ) |
| Net assets at beginning of period | | | 25,924,531,617 | | | | 31,981,983,613 | |
| Net assets at end of period (including undistributed net investment income of $0 and $0, respectively) | | $ | 14,886,640,939 | | | $ | 25,924,531,617 | |
The accompanying notes are an integral part of the financial statements.
| Institutional Shares | |
| | | Years Ended December 31, | | | Period Ended 12/31/07a | | | Year Ended 5/31/07 | |
| | 2011 | | | 2010 | | | 2009 | | | 2008 | |
| Selected Per Share Data | |
| Net asset value, beginning of period | | $ | 1.00 | | | $ | 1.00 | | | $ | 1.00 | | | $ | 1.00 | | | $ | 1.00 | | | $ | 1.00 | |
Income from investment operations: Net investment income | | | .001 | | | | .002 | | | | .004 | | | | .028 | | | | .030 | | | | .052 | |
Net realized gain (loss)*** | | | .000 | | | | .000 | | | | .000 | | | | .000 | | | | .000 | | | | .000 | |
| Total from investment operations | | | .001 | | | | .002 | | | | .004 | | | | .028 | | | | .030 | | | | .052 | |
Less distributions from: Net investment income | | | (.001 | ) | | | (.002 | ) | | | (.004 | ) | | | (.028 | ) | | | (.030 | ) | | | (.052 | ) |
| Net asset value, end of period | | $ | 1.00 | | | $ | 1.00 | | | $ | 1.00 | | | $ | 1.00 | | | $ | 1.00 | | | $ | 1.00 | |
Total Return (%)b | | | .10 | | | | .17 | | | | .44 | | | | 2.80 | | | | 3.08 | ** | | | 5.37 | |
| Ratios to Average Net Assets and Supplemental Data | |
| Net assets, end of period ($ millions) | | | 14,887 | | | | 25,925 | | | | 31,982 | | | | 19,857 | | | | 21,262 | | | | 17,469 | |
| Ratio of expenses before expense reductions, including expenses allocated from Cash Management Portfolio (%) | | | .27 | | | | .28 | | | | .30 | | | | .29 | | | | .26 | * | | | .24 | c |
| Ratio of expenses after expense reductions, including expenses allocated from Cash Management Portfolio (%) | | | .15 | | | | .15 | | | | .17 | | | | .14 | | | | .12 | * | | | .10 | c |
| Ratio of net investment income (%) | | | .10 | | | | .17 | | | | .39 | | | | 2.83 | | | | 5.18 | * | | | 5.26 | |
a For the period from June 1, 2007 through December 31, 2007. b Total returns would have been lower had certain expenses not been reduced. c On July 30, 2007, DWS Money Market Series became a feeder of Cash Management Portfolio. Expense ratios disclosed prior to December 31, 2007 are for DWS Money Market Series as a stand-alone fund. * Annualized ** Not annualized *** Amount is less than $.005. | |
Notes to Financial Statements
A. Organization and Significant Accounting Policies
DWS Money Market Series (the "Fund") is a diversified investment portfolio of DWS Money Market Trust (the "Trust"), which is registered under the Investment Company Act of 1940, as amended (the "1940 Act"), as an open-end management investment company organized as a Massachusetts business trust.
The Fund, a feeder fund, seeks to achieve its investment objective by investing all of its investable assets in a master portfolio, the Cash Management Portfolio (the "Portfolio''), an open-end management investment company registered under the 1940 Act and organized as a New York business trust advised by Deutsche Investment Management Americas Inc. ("DIMA" or the "Advisor''), an indirect, wholly owned subsidiary of Deutsche Bank AG. A master/feeder fund structure is one in which a fund (a "feeder fund"), instead of investing directly in a portfolio of securities, invests most or all of its investment assets in a separate registered investment company (the "master fund") with substantially the same investment objective and policies as the feeder fund. Such a structure permits the pooling of assets of two or more feeder funds, preserving separate identities or distribution channels at the feeder fund level. At December 31, 2011, the Fund owned approximately 72% of the Portfolio.
The Fund's financial statements are prepared in accordance with accounting principles generally accepted in the United States of America which require the use of management estimates. Actual results could differ from those estimates. The policies described below are followed consistently by the Fund in the preparation of its financial statements. The financial statements of the Portfolio, including the Investment Portfolio, are contained elsewhere in this report and should be read in conjunction with the Fund's financial statements.
Security Valuation. The Fund records its investment in the Portfolio at value, which reflects its proportionate interest in the net assets of the Portfolio. Valuation of the securities held by the Portfolio is discussed in the notes to the Portfolio's financial statements included elsewhere in this report.
Disclosure about the classification of fair value measurements is included in a table following the Portfolio's Investment Portfolio.
Federal Income Taxes. The Fund's policy is to comply with the requirements of the Internal Revenue Code, as amended, which are applicable to regulated investment companies, and to distribute all of its taxable income to its shareholders.
Under the Regulated Investment Company Modernization Act of 2010, net capital losses may be carried forward indefinitely, and their character is retained as short-term and/or long-term. Previously, net capital losses were carried forward for eight years and treated as short-term losses. As a transition rule, the Act requires that post-enactment net capital losses be used before pre-enactment net capital losses.
At December 31, 2011, the Fund had a net tax basis capital loss carryforward of approximately $1,094,000 of pre-enactment losses, which may be applied against any realized net taxable capital gains of each succeeding year until fully utilized or until December 31, 2018, the expiration date, whichever occurs first.
The Fund has reviewed the tax positions for the open tax years as of December 31, 2011 and has determined that no provision for income tax is required in the Fund's financial statements. The Fund's federal tax returns for the prior three fiscal periods/years remain open subject to examination by the Internal Revenue Service.
Distribution of Income and Gains. Net investment income of the Fund is declared as a daily dividend and is distributed to shareholders monthly. The Fund may take into account capital gains and losses in its daily dividend declarations. The Fund may also make additional distributions for tax purposes if necessary.
Permanent book and tax differences relating to shareholder distributions will result in reclassifications to paid in capital. Temporary book and tax differences will reverse in a subsequent period. There were no significant book to tax differences for the Fund.
At December 31, 2011, the Fund's components of distributable earnings (accumulated losses) on a tax basis were as follows:
| Capital loss carryforward | | $ | (1,094,000 | ) |
In addition, during the year ended December 31, 2011, the tax character of distributions paid to shareholders by the Fund is summarized as follows:
| | | Years Ended December 31, | |
| | | 2011 | | | 2010 | |
| Distributions from ordinary income | | $ | 20,519,595 | | | $ | 41,448,132 | |
Contingencies. In the normal course of business, the Fund may enter into contracts with service providers that contain general indemnification clauses. The Fund's maximum exposure under these arrangements is unknown as this would involve future claims that may be made against the Fund that have not yet been made. However, based on experience, the Fund expects the risk of loss to be remote.
Other. The Fund receives an allocation of the Portfolio's net investment income and net realized gains and losses in proportion to its investment in the Portfolio. Expenses directly attributed to a fund are charged to that fund, while expenses which are attributable to the Trust are allocated among the funds in the Trust on the basis of relative net assets.
B. Fees and Transactions with Affiliates
Management Agreement. Under the Investment Management Agreement with Deutsche Investment Management Americas Inc. ("DIMA" or the "Advisor"), an indirect, wholly owned subsidiary of Deutsche Bank AG, the Advisor serves as the Investment Manager to the Fund. The Advisor receives a management fee from the Portfolio pursuant to the master/feeder structure listed above in Note A.
Pursuant to the Investment Management Agreement, the Fund pays no management fee to the Advisor so long as the Fund is a feeder fund that invests substantially all of its assets in the Portfolio. In the event the Board of Trustees determines it is in the best interest of the Fund to withdraw its investment from the Portfolio, the Advisor may become responsible for directly managing the assets of the Fund under the Investment Management Agreement. In such event, the Fund would pay the Advisor a management fee as follows:
| First $1.5 billion of the Fund's average daily net assets | | | .1650 | % |
| Next $1.75 billion of such net assets | | | .1500 | % |
| Next $1.75 billion of such net assets | | | .1350 | % |
| Over $5 billion of such net assets | | | .1200 | % |
Administration Fee. Pursuant to an Administrative Services Agreement, DIMA provides most administrative services to the Fund. For all services provided under the Administrative Services Agreement, the Fund pays the Advisor an annual fee ("Administration Fee") of 0.10% of the Fund's average daily net assets, computed and accrued daily and payable monthly.
For the period from January 1, 2011 through September 30, 2012, DIMA has contractually agreed to waive its fees and/or reimburse certain operating expenses of the Fund, including expenses of the Portfolio allocated to the Fund, to the extent necessary to maintain the operating expenses (excluding certain expenses such as extraordinary expenses, taxes, brokerage and interest) at 0.18% of the Fund's average daily net assets.
For the period from January 1, 2011 through July 26, 2011, the Advisor had voluntarily agreed to waive its fees and/or reimburse certain operating expenses to the extent necessary to maintain the operating expenses (excluding certain expenses such as extraordinary expenses, taxes, brokerage and interest) at 0.16% of the Fund's average daily net assets.
Effective July 27, 2011, the Advisor has voluntarily agreed to waive its fees and/or reimburse certain operating expenses to the extent necessary to maintain the operating expenses (excluding certain expenses such as extraordinary expenses, taxes, brokerage and interest) at 0.14% of the Fund's average daily net assets. The waiver may be changed or terminated at anytime without notice.
Accordingly, for the year ended December 31, 2011, the Administration Fee was $19,867,529, all of which was waived.
In addition, the Advisor waived $326,410 of other expenses.
Service Provider Fees. DWS Investments Service Company ("DISC"), an affiliate of the Advisor, is the transfer agent, dividend-paying agent and shareholder service agent of the Fund. Pursuant to a sub-transfer agency agreement between DISC and DST Systems. Inc. ("DST"), DISC has delegated certain transfer agent, dividend-paying agent and shareholder service agent functions to DST. DISC compensates DST out of the shareholder servicing fee it receives from the Fund. For the year ended December 31, 2011, the amounts charged to the Fund by DISC aggregated $1,227,237, all of which was waived.
For the year ended December 31, 2011, the Advisor reimbursed the Fund $198 of sub-recordkeeping expense.
Typesetting and Filing Service Fees. Under an agreement with DIMA, DIMA is compensated for providing typesetting and certain regulatory filing services to the Fund. For the year ended December 31, 2011, the amount charged to the Fund by DIMA included in the Statement of Operations under "reports to shareholders" aggregated $11,335, of which $10,099 is unpaid.
Trustees' Fees and Expenses. The Fund paid each Trustee not affiliated with the Advisor retainer fees plus specified amounts for various committee services and for the Board Chairperson.
C. Concentration of Ownership
From time to time the Fund may have a concentration of several shareholder accounts holding a significant percentage of shares outstanding. Investment activities of these shareholders could have a material impact on the Fund.
At December 31, 2011, there were two shareholder accounts that each held approximately 14% and 18% of the outstanding shares of the Fund, respectively.
D. Share Transactions
The following table summarizes share and dollar activity in the Fund:
| | | Year Ended December 31, 2011 | | | Year Ended December 31, 2010 | |
| | | Shares | | | Dollars | | | Shares | | | Dollars | |
| Shares sold | |
| Institutional Shares | | | 187,556,353,171 | | | $ | 187,556,353,171 | | | | 264,977,585,156 | | | $ | 264,977,585,156 | |
| | | | | | | $ | 187,556,353,171 | | | | | | | $ | 264,977,585,156 | |
| Shares issued to shareholders in reinvestment of distributions | |
| Institutional Shares | | | 13,007,040 | | | $ | 13,007,040 | | | | 23,520,820 | | | $ | 23,520,820 | |
| | | | | | | $ | 13,007,040 | | | | | | | $ | 23,520,820 | |
| Shares redeemed | |
| Institutional Shares | | | (198,608,222,899 | ) | | $ | (198,608,222,899 | ) | | | (271,056,831,929 | ) | | $ | (271,056,831,929 | ) |
| | | | | | | $ | (198,608,222,899 | ) | | | | | | $ | (271,056,831,929 | ) |
| Net increase (decrease) | |
| Institutional Shares | | | (11,038,862,688 | ) | | $ | (11,038,862,688 | ) | | | (6,055,725,953 | ) | | $ | (6,055,725,953 | ) |
| | | | | | | $ | (11,038,862,688 | ) | | | | | | $ | (6,055,725,953 | ) |
Report of Independent Registered Public Accounting Firm
To the Trustees of DWS Money Market Trust and Shareholders of DWS Money Market Series:
In our opinion, the accompanying statement of assets and liabilities, and the related statements of operations and of changes in net assets and the financial highlights present fairly, in all material respects, the financial position of DWS Money Market Series (the "Fund") at December 31, 2011, and the results of its operations, the changes in its net assets and the financial highlights for each of the periods indicated therein, in conformity with accounting principles generally accepted in the United States of America. These financial statements and financial highlights (hereafter referred to as "financial statements") are the responsibility of the Fund's management. Our responsibility is to express an opinion on these financial statements based on our audits. We conducted our audits of these financial statements in accordance with the standards of the Public Company Accounting Oversight Board (United States). Those standards require that we plan and perform the audit to obtain reasonable assurance about whether the financial statements are free of material misstatement. An audit includes examining, on a test basis, evidence supporting the amounts and disclosures in the financial statements, assessing the accounting principles used and significant estimates made by management, and evaluating the overall financial statement presentation. We believe that our audits provide a reasonable basis for our opinion.
Boston, Massachusetts February 24, 2012 | PricewaterhouseCoopers LLP |
Information About Your Fund's Expenses
As an investor of the Fund, you incur two types of costs: ongoing expenses and transaction costs. Ongoing expenses include management fees and other Fund expenses. Examples of transaction costs include account maintenance fees, which are not shown in this section. The following tables are intended to help you understand your ongoing expenses (in dollars) of investing in the Fund and to help you compare these expenses with the ongoing expenses of investing in other mutual funds. In the most recent six-month period, the Fund limited these expenses; had it not done so, expenses would have been higher. The example in the table is based on an investment of $1,000 invested at the beginning of the six-month period and held for the entire period (July 1, 2011 to December 31, 2011).
The tables illustrate your Fund's expenses in two ways:
·Actual Fund Return. This helps you estimate the actual dollar amount of ongoing expenses (but not transaction costs) paid on a $1,000 investment in the Fund using the Fund's actual return during the period. To estimate the expenses you paid over the period, simply divide your account value by $1,000 (for example, an $8,600 account value divided by $1,000 = 8.6), then multiply the result by the number in the "Expenses Paid per $1,000" line under the share class you hold.
·Hypothetical 5% Fund Return. This helps you to compare your Fund's ongoing expenses (but not transaction costs) with those of other mutual funds using the Fund's actual expense ratio and a hypothetical rate of return of 5% per year before expenses. Examples using a 5% hypothetical fund return may be found in the shareholder reports of other mutual funds. The hypothetical account values and expenses may not be used to estimate the actual ending account balance or expenses you paid for the period.
Please note that the expenses shown in these tables are meant to highlight your ongoing expenses only and do not reflect any transaction costs. The "Expenses Paid per $1,000" line of the tables is useful in comparing ongoing expenses only and will not help you determine the relative total expense of owning different funds. If these transaction costs had been included, your costs would have been higher.
Expenses and Value of a $1,000 Investment for the six months ended December 31, 2011 | |
| Actual Fund Return* | | Institutional Shares | |
| Beginning Account Value 7/1/11 | | $ | 1,000.00 | |
| Ending Account Value 12/31/11 | | $ | 1,000.38 | |
| Expenses Paid per $1,000** | | $ | .71 | |
| Hypothetical 5% Fund Return* | | Institutional Shares | |
| Beginning Account Value 7/1/11 | | $ | 1,000.00 | |
| Ending Account Value 12/31/11 | | $ | 1,024.50 | |
| Expenses Paid per $1,000** | | $ | .71 | |
* Expenses include amounts allocated proportionally from the master portfolio.
** Expenses are equal to the Fund's annualized expense ratio multiplied by the average account value over the period, multiplied by the number of days in the most recent six-month period, then divided by 365.
| Annualized Expense Ratio | | Institutional Shares | |
| DWS Money Market Series | | | .14 | % |
For more information, please refer to the Fund's prospectus.
Tax Information (Unaudited)
A total of 4.12% of the dividends distributed during the fiscal year was derived from interest on U.S. government securities, which is generally exempt from state income tax.
Please consult a tax advisor if you have questions about federal or state income tax laws, or on how to prepare your tax returns. If you have specific questions about your account, please call (800) 730-1313.
(The following financial statements of the Cash Management Portfolio should be read in conjunction with the Fund's financial statements.)
Investment Portfolio as of December 31, 2011 | | | Principal Amount ($) | | | Value ($) | |
| | | | |
| Certificates of Deposit and Bank Notes 7.5% | |
| ANZ National International Ltd., 144A, 3.25%, 4/2/2012 | | | 49,000,000 | | | | 49,336,289 | |
| Banco del Estado de Chile, 0.5%, 1/17/2012 | | | 20,000,000 | | | | 20,000,000 | |
| Bank Nederlandse Gemeenten, 6.0%, 3/26/2012 | | | 35,000,000 | | | | 35,455,384 | |
| Bank of Nova Scotia, 0.28%, 1/4/2012 | | | 100,000,000 | | | | 100,000,000 | |
| China Construction Bank Corp., 0.3%, 1/3/2012 | | | 37,451,000 | | | | 37,451,000 | |
| Commonwealth Bank of Australia, 144A, 2.4%, 1/12/2012 | | | 43,132,000 | | | | 43,157,466 | |
| Credit Suisse, 0.38%, 1/3/2012 | | | 97,000,000 | | | | 97,000,000 | |
| DnB Bank ASA, 0.35%, 1/17/2012 | | | 79,500,000 | | | | 79,500,000 | |
| General Electric Capital Corp., 6.0%, 6/15/2012 | | | 12,500,000 | | | | 12,810,030 | |
| Industrial & Commercial Bank of China: | |
| 0.7%, 1/3/2012 | | | 100,000,000 | | | | 100,000,000 | |
| 0.7%, 1/4/2012 | | | 99,500,000 | | | | 99,500,000 | |
| 0.7%, 1/6/2012 | | | 39,600,000 | | | | 39,600,000 | |
| Mizuho Corporate Bank Ltd., 0.42%, 2/6/2012 | | | 50,000,000 | | | | 50,003,492 | |
| Nederlandse Waterschapsbank NV, 1.375%, 2/17/2012 | | | 44,700,000 | | | | 44,756,807 | |
| Nordea Bank Finland PLC: | |
| 0.35%, 1/13/2012 | | | 69,500,000 | | | | 69,500,000 | |
| 0.4%, 2/15/2012 | | | 45,000,000 | | | | 45,000,561 | |
| Rabobank Nederland NV: | |
| 0.4%, 2/15/2012 | | | 133,500,000 | | | | 133,500,000 | |
| 0.43%, 2/24/2012 | | | 45,000,000 | | | | 45,000,000 | |
| 0.43%, 3/2/2012 | | | 160,000,000 | | | | 160,000,000 | |
| Skandinaviska Enskilda Banken AB: | |
| 0.35%, 1/11/2012 | | | 49,700,000 | | | | 49,700,000 | |
| 0.36%, 1/6/2012 | | | 46,500,000 | | | | 46,500,000 | |
| 0.45%, 2/13/2012 | | | 138,500,000 | | | | 138,500,000 | |
| Sumitomo Mitsui Banking Corp., 0.35%, 1/13/2012 | | | 50,000,000 | | | | 50,000,332 | |
| Svenska Handelsbanken AB, 0.385%, 1/23/2012 | | | 15,000,000 | | | | 15,000,091 | |
Total Certificates of Deposit and Bank Notes (Cost $1,561,271,452) | | | | 1,561,271,452 | |
| | |
| Commercial Paper 26.3% | |
| Issued at Discount** 24.7% | |
| ASB Finance Ltd., 0.585%, 4/27/2012 | | | 981,000 | | | | 979,135 | |
| Australia & New Zealand Banking Group Ltd., 0.25%, 2/7/2012 | | | 200,000 | | | | 199,949 | |
| Bank of Nova Scotia, 0.1%, 1/17/2012 | | | 600,000 | | | | 599,973 | |
| Barclays Bank PLC: | |
| 0.2%, 1/3/2012 | | | 1,000,000 | | | | 999,989 | |
| 0.33%, 1/20/2012 | | | 145,000,000 | | | | 144,974,746 | |
| 0.36%, 1/6/2012 | | | 30,000,000 | | | | 29,998,500 | |
| 0.38%, 1/4/2012 | | | 153,000,000 | | | | 152,995,155 | |
| 0.46%, 2/1/2012 | | | 77,000,000 | | | | 76,969,499 | |
| 0.52%, 2/27/2012 | | | 33,500,000 | | | | 33,472,418 | |
| BNZ International Funding Ltd: | |
| 144A, 0.57%, 4/10/2012 | | | 60,000,000 | | | | 59,905,000 | |
| 144A, 0.58%, 4/10/2012 | | | 50,000,000 | | | | 49,919,444 | |
| Coca-Cola Co.: | |
| 0.18%, 6/1/2012 | | | 29,888,000 | | | | 29,865,285 | |
| 0.2%, 4/10/2012 | | | 30,350,000 | | | | 30,333,139 | |
| Erste Abwicklungsanstalt: | |
| 0.35%, 1/30/2012 | | | 20,000,000 | | | | 19,994,361 | |
| 0.36%, 1/30/2012 | | | 50,000,000 | | | | 49,985,500 | |
| 0.37%, 1/9/2012 | | | 50,000,000 | | | | 49,995,889 | |
| 0.37%, 1/17/2012 | | | 50,000,000 | | | | 49,991,778 | |
| 0.39%, 2/16/2012 | | | 50,000,000 | | | | 49,975,083 | |
| 0.4%, 3/14/2012 | | | 35,000,000 | | | | 34,971,611 | |
| 0.42%, 1/3/2012 | | | 55,500,000 | | | | 55,498,705 | |
| Erste Finance Delaware LLC, 0.16%, 1/3/2012 | | | 154,540,000 | | | | 154,538,626 | |
| General Electric Capital Corp., 0.25%, 2/2/2012 | | | 150,000,000 | | | | 149,966,667 | |
| General Electric Capital Services, Inc.: | |
| 0.23%, 2/6/2012 | | | 42,000,000 | | | | 41,990,340 | |
| 0.26%, 2/2/2012 | | | 50,000,000 | | | | 49,988,444 | |
| 0.3%, 2/13/2012 | | | 75,000,000 | | | | 74,973,125 | |
| Johnson & Johnson: | |
| 144A, 0.02%, 1/13/2012 | | | 25,000,000 | | | | 24,999,833 | |
| 144A, 0.04%, 2/27/2012 | | | 75,000,000 | | | | 74,995,250 | |
| 144A, 0.05%, 4/3/2012 | | | 10,000,000 | | | | 9,998,708 | |
| 144A, 0.06%, 2/17/2012 | | | 100,000,000 | | | | 99,992,167 | |
| 144A, 0.07%, 4/2/2012 | | | 280,000,000 | | | | 279,947,867 | |
| 144A, 0.08%, 4/2/2012 | | | 70,000,000 | | | | 69,985,689 | |
| 144A, 0.08%, 4/3/2012 | | | 40,000,000 | | | | 39,991,733 | |
| 144A, 0.15%, 3/7/2012 | | | 33,175,000 | | | | 33,165,877 | |
| Kells Funding LLC: | |
| 144A, 0.29%, 1/12/2012 | | | 125,000,000 | | | | 124,988,924 | |
| 144A, 0.3%, 1/26/2012 | | | 25,000,000 | | | | 24,994,792 | |
| 144A, 0.35%, 2/17/2012 | | | 43,100,000 | | | | 43,080,306 | |
| 144A, 0.37%, 3/19/2012 | | | 25,700,000 | | | | 25,679,397 | |
| 144A, 0.37%, 4/10/2012 | | | 80,000,000 | | | | 79,917,778 | |
| 144A, 0.38%, 4/17/2012 | | | 25,000,000 | | | | 24,971,764 | |
| 144A, 0.45%, 1/20/2012 | | | 75,687,000 | | | | 75,669,024 | |
| 144A, 0.48%, 1/19/2012 | | | 57,014,000 | | | | 57,000,317 | |
| 144A, 0.52%, 2/1/2012 | | | 72,500,000 | | | | 72,467,536 | |
| 144A, 0.52%, 2/16/2012 | | | 37,000,000 | | | | 36,975,416 | |
| Merck & Co., Inc.: | |
| 0.06%, 1/9/2012 | | | 7,750,000 | | | | 7,749,897 | |
| 0.06%, 1/11/2012 | | | 86,000,000 | | | | 85,998,567 | |
| New York Life Capital Corp.: | |
| 144A, 0.12%, 2/3/2012 | | | 3,725,000 | | | | 3,724,590 | |
| 144A, 0.13%, 2/1/2012 | | | 37,900,000 | | | | 37,895,757 | |
| 144A, 0.15%, 3/2/2012 | | | 20,000,000 | | | | 19,994,917 | |
| 144A, 0.16%, 2/14/2012 | | | 25,000,000 | | | | 24,995,111 | |
| 144A, 0.16%, 3/8/2012 | | | 40,000,000 | | | | 39,988,089 | |
| 144A, 0.16%, 3/19/2012 | | | 38,000,000 | | | | 37,986,827 | |
| Nieuw Amsterdam Receivables Corp.: | |
| 144A, 0.32%, 1/4/2012 | | | 100,000,000 | | | | 99,997,333 | |
| 144A, 0.33%, 1/3/2012 | | | 653,000 | | | | 652,988 | |
| NRW.Bank: | |
| 0.24%, 1/17/2012 | | | 30,062,000 | | | | 30,058,793 | |
| 0.4%, 1/6/2012 | | | 61,000,000 | | | | 60,996,611 | |
| Oversea-Chinese Banking Corp., Ltd., 0.29%, 1/17/2012 | | | 45,000,000 | | | | 44,994,200 | |
| PepsiCo, Inc., 0.04%, 1/18/2012 | | | 95,000,000 | | | | 94,998,206 | |
| Pfizer, Inc.: | |
| 0.03%, 1/5/2012 | | | 58,000,000 | | | | 57,999,807 | |
| 0.04%, 1/12/2012 | | | 40,000,000 | | | | 39,999,511 | |
| Proctor & Gamble Co.: | |
| 0.08%, 1/3/2012 | | | 100,000,000 | | | | 99,999,556 | |
| 0.08%, 1/31/2012 | | | 40,000,000 | | | | 39,997,333 | |
| 0.08%, 2/24/2012 | | | 34,000,000 | | | | 33,995,920 | |
| 0.08%, 3/23/2012 | | | 60,000,000 | | | | 59,989,067 | |
| 0.09%, 1/25/2012 | | | 40,000,000 | | | | 39,997,600 | |
| 0.09%, 2/14/2012 | | | 75,000,000 | | | | 74,991,750 | |
| 0.09%, 3/30/2012 | | | 25,000,000 | | | | 24,994,437 | |
| 0.1%, 4/9/2012 | | | 25,000,000 | | | | 24,993,125 | |
| 0.11%, 5/4/2012 | | | 30,000,000 | | | | 29,988,633 | |
| 0.11%, 5/21/2012 | | | 23,000,000 | | | | 22,990,091 | |
| 0.12%, 4/2/2012 | | | 67,800,000 | | | | 67,779,208 | |
| 0.12%, 5/4/2012 | | | 128,000,000 | | | | 127,947,093 | |
| 0.13%, 4/12/2012 | | | 75,000,000 | | | | 74,972,375 | |
| 0.13%, 4/30/2012 | | | 80,000,000 | | | | 79,965,333 | |
| 0.15%, 3/30/2012 | | | 25,000,000 | | | | 24,990,729 | |
| Rabobank U.S.A. Financial Corp., 0.4%, 2/8/2012 | | | 19,250,000 | | | | 19,241,872 | |
| SBAB Bank AB: | |
| 144A, 0.5%, 1/4/2012 | | | 50,000,000 | | | | 49,997,917 | |
| 144A, 0.55%, 1/13/2012 | | | 15,000,000 | | | | 14,997,250 | |
| 144A, 0.55%, 1/30/2012 | | | 26,000,000 | | | | 25,988,481 | |
| Sheffield Receivables Corp.: | |
| 144A, 0.3%, 1/27/2012 | | | 24,000,000 | | | | 23,994,800 | |
| 144A, 0.4%, 2/7/2012 | | | 61,000,000 | | | | 60,974,922 | |
| Standard Chartered Bank: | |
| 0.37%, 1/5/2012 | | | 100,000,000 | | | | 99,995,889 | |
| 0.38%, 2/7/2012 | | | 135,750,000 | | | | 135,696,982 | |
| Straight-A Funding LLC: | |
| 144A, 0.12%, 1/11/2012 | | | 30,105,000 | | | | 30,103,996 | |
| 144A, 0.19%, 1/31/2012 | | | 60,061,000 | | | | 60,051,490 | |
| 144A, 0.19%, 2/13/2012 | | | 27,999,000 | | | | 27,992,646 | |
| Sumitomo Mitsui Banking Corp., 0.355%, 1/6/2012 | | | 77,050,000 | | | | 77,046,201 | |
| Swedbank AB, 0.44%, 1/13/2012 | | | 35,000,000 | | | | 34,994,867 | |
| Toyota Motor Credit Corp., 0.27%, 1/6/2012 | | | 107,000,000 | | | | 106,995,987 | |
| Unilever Capital Corp., 0.08%, 3/6/2012 | | | 30,000,000 | | | | 29,995,667 | |
| Victory Receivables Corp.: | |
| 144A, 0.35%, 1/19/2012 | | | 50,000,000 | | | | 49,991,250 | |
| 144A, 0.36%, 1/9/2012 | | | 75,106,000 | | | | 75,099,992 | |
| Walt Disney Co., 0.09%, 2/23/2012 | | | 95,000,000 | | | | 94,987,412 | |
| | | | | 5,125,675,814 | |
| Issued at Par 1.6% | |
| DnB Bank ASA, 144A, 0.43%*, 4/2/2012 | | | 50,000,000 | | | | 50,000,000 | |
| Westpac Banking Corp., 144A, 0.426%*, 4/11/2012 | | | 282,900,000 | | | | 282,893,007 | |
| | | | | 332,893,007 | |
Total Commercial Paper (Cost $5,458,568,821) | | | | 5,458,568,821 | |
| | |
| Government & Agency Obligations 15.0% | |
| U.S. Government Sponsored Agencies 1.9% | |
| Federal Home Loan Bank: | |
| 0.13%, 1/23/2012 | | | 11,000,000 | | | | 10,999,782 | |
| 0.13%, 2/24/2012 | | | 28,225,000 | | | | 28,224,444 | |
| 0.13%, 5/15/2012 | | | 26,500,000 | | | | 26,494,841 | |
| 0.16%, 4/30/2012 | | | 103,320,000 | | | | 103,309,653 | |
| 0.16%**, 11/13/2012 | | | 24,000,000 | | | | 23,966,187 | |
| 0.23%, 8/24/2012 | | | 15,670,000 | | | | 15,674,189 | |
| 0.27%, 7/6/2012 | | | 20,600,000 | | | | 20,600,105 | |
| Federal Home Loan Mortgage Corp.: | |
| 0.099%**, 2/23/2012 | | | 50,000,000 | | | | 49,992,639 | |
| 0.111%**, 1/11/2012 | | | 25,000,000 | | | | 24,999,167 | |
| Federal National Mortgage Association: | |
| 0.132%**, 1/3/2012 | | | 20,000,000 | | | | 19,999,789 | |
| 0.137%**, 2/17/2012 | | | 11,500,000 | | | | 11,497,898 | |
| 0.148%**, 3/1/2012 | | | 20,000,000 | | | | 19,995,000 | |
| 0.159%**, 10/1/2012 | | | 10,000,000 | | | | 9,987,822 | |
| 0.189%**, 10/1/2012 | | | 17,500,000 | | | | 17,474,693 | |
| | | | | 383,216,209 | |
| U.S. Treasury Obligations 13.1% | |
| U.S. Treasury Bills: | |
| 0.005%**, 1/26/2012 | | | 503,000 | | | | 502,998 | |
| 0.035%**, 5/17/2012 | | | 2,500,000 | | | | 2,499,667 | |
| 0.051%**, 4/19/2012 | | | 921,000 | | | | 920,858 | |
| U.S. Treasury Notes: | |
| 0.375%, 8/31/2012 | | | 212,478,000 | | | | 212,794,495 | |
| 0.375%, 9/30/2012 | | | 18,000,000 | | | | 18,034,370 | |
| 0.375%, 10/31/2012 | | | 360,000,000 | | | | 360,730,389 | |
| 0.625%, 6/30/2012 | | | 84,924,000 | | | | 85,135,391 | |
| 0.625%, 7/31/2012 | | | 433,130,000 | | | | 434,394,582 | |
| 0.75%, 5/31/2012 | | | 212,478,000 | | | | 213,053,545 | |
| 1.375%, 10/15/2012 | | | 212,000,000 | | | | 214,035,648 | |
| 1.5%, 7/15/2012 | | | 480,000,000 | | | | 483,642,949 | |
| 1.875%, 6/15/2012 | | | 250,000,000 | | | | 252,038,171 | |
| 4.75%, 5/31/2012 | | | 98,500,000 | | | | 100,373,472 | |
| 4.875%, 6/30/2012 | | | 342,512,000 | | | | 350,642,757 | |
| | | | | 2,728,799,292 | |
Total Government & Agency Obligations (Cost $3,112,015,501) | | | | 3,112,015,501 | |
| | |
| Short-Term Notes* 14.1% | |
| Australia & New Zealand Banking Group Ltd., 144A, 0.31%, 1/20/2012 | | | 72,000,000 | | | | 72,000,000 | |
| Bank of Nova Scotia: | |
| 0.35%, 4/2/2012 | | | 32,500,000 | | | | 32,500,000 | |
| 0.38%, 3/13/2012 | | | 134,500,000 | | | | 134,500,000 | |
| 0.39%, 6/11/2012 | | | 107,000,000 | | | | 107,000,000 | |
| Bayerische Landesbank, 0.353%, 11/23/2012 | | | 40,000,000 | | | | 40,000,000 | |
| Caisse d'Amortissement de la Dette Sociale, 144A, 0.432%, 5/25/2012 | | | 315,000,000 | | | | 314,986,168 | |
| Canadian Imperial Bank of Commerce, 0.373%, 4/26/2012 | | | 200,000,000 | | | | 200,000,000 | |
| Coca-Cola Co., 0.507%, 5/15/2012 | | | 48,000,000 | | | | 48,027,583 | |
| Commonwealth Bank of Australia: | |
| 144A, 0.376%, 2/3/2012 | | | 135,000,000 | | | | 135,000,000 | |
| 144A, 0.455%, 4/30/2012 | | | 40,000,000 | | | | 40,000,000 | |
| JPMorgan Chase Bank NA, 0.57%, 1/8/2013 | | | 250,000,000 | | | | 250,000,000 | |
| Kells Funding LLC: | |
| 144A, 0.361%, 5/4/2012 | | | 125,000,000 | | | | 125,000,000 | |
| 144A, 0.37%, 2/27/2012 | | | 56,000,000 | | | | 56,000,000 | |
| 144A, 0.377%, 1/9/2012 | | | 64,000,000 | | | | 63,999,885 | |
| 144A, 0.384%, 1/19/2012 | | | 27,000,000 | | | | 27,000,000 | |
| 144A, 0.423%, 2/24/2012 | | | 147,500,000 | | | | 147,500,000 | |
| 144A, 0.468%, 4/16/2012 | | | 150,000,000 | | | | 150,000,000 | |
| Nordea Bank Finland PLC: | |
| 0.681%, 2/3/2012 | | | 35,000,000 | | | | 35,006,457 | |
| 0.737%, 9/13/2012 | | | 20,000,000 | | | | 20,034,002 | |
| 0.941%, 9/13/2012 | | | 50,000,000 | | | | 50,085,207 | |
| Rabobank Nederland NV: | |
| 0.356%, 1/10/2012 | | | 108,250,000 | | | | 108,250,000 | |
| 0.388%, 4/24/2012 | | | 133,000,000 | | | | 133,000,000 | |
| 0.46%, 5/16/2012 | | | 50,000,000 | | | | 50,000,000 | |
| 144A, 0.6%, 12/14/2012 | | | 75,000,000 | | | | 75,000,000 | |
| 144A, 0.668%, 2/29/2012 | | | 50,000,000 | | | | 50,007,960 | |
| Svenska Handelsbanken AB, 144A, 0.577%, 8/7/2012 | | | 80,000,000 | | | | 80,000,000 | |
| Toronto-Dominion Bank, 0.296%, 5/11/2012 | | | 130,500,000 | | | | 130,500,000 | |
| Westpac Banking Corp.: | |
| 0.34%, 1/10/2012 | | | 85,000,000 | | | | 85,000,000 | |
| 0.366%, 5/9/2012 | | | 60,000,000 | | | | 60,000,000 | |
| 0.452%, 2/13/2012 | | | 49,000,000 | | | | 49,000,000 | |
| 144A, 0.965%, 10/23/2012 | | | 61,110,000 | | | | 61,280,869 | |
Total Short-Term Notes (Cost $2,930,678,131) | | | | 2,930,678,131 | |
| | |
| Time Deposits 11.3% | |
| Citibank NA, 0.1%, 1/4/2012 | | | 350,000,000 | | | | 350,000,000 | |
| Nordea Bank Finland PLC, 0.02%, 1/3/2012 | | | 400,000,000 | | | | 400,000,000 | |
| State Street Bank & Trust Co., 0.01%, 1/3/2012 | | | 800,000,000 | | | | 800,000,000 | |
| Svenska Handelsbanken AB, 0.01%, 1/3/2012 | | | 800,000,000 | | | | 800,000,000 | |
Total Time Deposits (Cost $2,350,000,000) | | | | 2,350,000,000 | |
| | |
| Municipal Investments 21.1% | |
| Allegheny County, PA, Industrial Development Authority, UPMC Children's Hospital, Series A, 0.08%***, 10/1/2032, LOC: Bank of America NA | | | 20,460,000 | | | | 20,460,000 | |
| Allegheny County, PA, RBC Municipal Products, Inc. Trust Certificates, Series E-16, 144A, 0.1%***, 4/15/2039, LIQ: Royal Bank of Canada, LOC: Royal Bank of Canada | | | 22,165,000 | | | | 22,165,000 | |
| Appleton, WI, Redevelopment Authority Revenue, Fox Cities Performing Arts Center, Inc., Series B, 0.1%***, 6/1/2036, LOC: JPMorgan Chase Bank NA | | | 18,400,000 | | | | 18,400,000 | |
| Arizona, State Health Facilities Authority Revenue, Catholic West: | | | | | | | | |
| Series A, 0.08%***, 7/1/2035, LOC: JPMorgan Chase Bank NA | | | 23,100,000 | | | | 23,100,000 | |
| Series B, 0.08%***, 7/1/2035, LOC: JPMorgan Chase Bank NA | | | 17,680,000 | | | | 17,680,000 | |
| Austin, TX, Water & Wastewater Systems Revenue, 0.07%***, 5/15/2031, LOC: Bank of Tokyo-Mitsubishi UFJ, Sumitomo Mitsui Banking | | | 25,920,000 | | | | 25,920,000 | |
| BlackRock Municipal Intermediate Duration Fund, Inc., Series W-7-2871, 144A, AMT, 0.23%***, 3/1/2041, LIQ: JPMorgan Chase Bank NA | | | 30,000,000 | | | | 30,000,000 | |
| BlackRock MuniHoldings New Jersey Quality Fund, Inc., Series W-7-1727, 144A, AMT, 0.3%***, 7/1/2041, LIQ: Bank of America NA | | | 30,000,000 | | | | 30,000,000 | |
| BlackRock MuniHoldings New York Quality Fund, Inc., Series W-7-2436, 144A, AMT, 0.3%***, 7/1/2041, LIQ: Bank of America NA | | | 40,000,000 | | | | 40,000,000 | |
| BlackRock MuniYield California Quality Fund, Inc., Series W-7-1665, 144A, AMT, 0.22%***, 5/1/2041, LIQ: Citibank NA | | | 13,500,000 | | | | 13,500,000 | |
| BlackRock MuniYield Fund, Inc., Series W-7-2514, 144A, AMT, 0.3%***, 7/1/2041, LIQ: Bank of America NA | | | 25,000,000 | | | | 25,000,000 | |
| BlackRock MuniYield New York Quality Fund, Inc., Series W-7-2477, 144A, AMT, 0.22%***, 5/1/2041, LIQ: Citibank NA | | | 26,300,000 | | | | 26,300,000 | |
| BlackRock MuniYield Quality Fund III, Inc., 144A, AMT, 0.24%***, 6/1/2041, LIQ: Citibank NA | | | 44,500,000 | | | | 44,500,000 | |
| BlackRock MuniYield Quality Fund, Inc., Series W-7-1766, 144A, AMT, 0.26%***, 10/1/2041, LIQ: Morgan Stanley Bank | | | 57,000,000 | | | | 57,000,000 | |
| Blount County, TN, Public Building Authority, Local Government Public Improvement, Series E-5-A, 0.12%***, 6/1/2030, LOC: Branch Banking & Trust | | | 45,400,000 | | | | 45,400,000 | |
| Cabell County, WV, University Facilities, Provident Group Marshall Properties, Series A, 0.13%***, 7/1/2039, LOC: Bank of America NA | | | 19,995,000 | | | | 19,995,000 | |
| Calhoun County, TX, Navigation Industrial Development Authority, Formosa Plastics Corp. Project, Series C, 144A, AMT, 0.12%***, 9/1/2031, LOC: Sumitomo Mitsui Banking | | | 10,000,000 | | | | 10,000,000 | |
| Calhoun, TX, Port Authority, Environmental Facilities Revenue, Formosa Plastics Corp. Project, Series B, 144A, AMT, 0.12%***, 9/1/2041, LOC: Sumitomo Mitsui Banking | | | 21,300,000 | | | | 21,300,000 | |
| California, Housing Finance Agency Revenue, Home Mortgage, Series D, 144A, AMT, 0.1%***, 2/1/2040, LOC: Fannie Mae, Freddie Mac | | | 29,130,000 | | | | 29,130,000 | |
| California, RBC Municipal Products, Inc. Trust, Series E-24, 144A, 0.14%**, Mandatory Put 4/2/2012 @ 100, 7/1/2031, LIQ: Royal Bank of Canada, LOC: Royal Bank of Canada | | | 9,250,000 | | | | 9,250,000 | |
| California, State Kindergarten, Series A5, 0.05%***, 5/1/2034, LOC: Citibank NA & California State Teacher's Retirement System | | | 18,250,000 | | | | 18,250,000 | |
| California, Statewide Communities Development Authority, Multi-Family Housing Revenue, Bay Vista At Meadow Park, Series NN-1, AMT, 0.09%***, 11/15/2037, LIQ: Fannie Mae | | | 29,320,000 | | | | 29,320,000 | |
| California, The Olympic Club Revenue, 0.46%***, 9/30/2032, LOC: Bank of America NA (a) | | | 52,100,000 | | | | 52,100,000 | |
| California, Wells Fargo State Trusts: | | | | | | | | |
| Series 16C, 144A, 0.1%***, 9/1/2029, LIQ: Wells Fargo Bank NA | | | 42,515,000 | | | | 42,515,000 | |
| Series 72C, 144A, 0.1%***, 8/15/2039, GTY: Wells Fargo Bank NA, LIQ: Wells Fargo Bank NA | | | 28,275,000 | | | | 28,275,000 | |
| Series 25C, 144A, 0.1%***, 11/1/2041, GTY: Wells Fargo Bank NA, LIQ: Wells Fargo Bank NA | | | 9,525,000 | | | | 9,525,000 | |
| Channahon, IL, Morris Hospital Revenue, 0.1%***, 12/1/2034, LOC: U.S. Bank NA | | | 5,220,000 | | | | 5,220,000 | |
| Charlotte, NC, Certificates of Participation, Series D, 0.25%***, 6/1/2035, LOC: Bank of America NA (a) | | | 19,600,000 | | | | 19,600,000 | |
| Chattanooga, TN, Industrial Development Board Revenue, BlueCross Corp. Project, 0.22%***, 1/1/2028, LOC: Bank of America NA (a) | | | 99,000,000 | | | | 99,000,000 | |
| Chicago, IL, Midway Airport Revenue, Series A-1, 0.1%***, 1/1/2021, LOC: Bank of Montreal (a) | | | 22,000,000 | | | | 22,000,000 | |
| Clark County, NV, Passenger Facility Charge Revenue, McCarran International Airport, Series F-2, 0.1%***, 7/1/2022, LOC: Union Bank NA | | | 18,000,000 | | | | 18,000,000 | |
| Cleveland, OH, Airport Systems Revenue, Series D, 0.07%***, 1/1/2024, LOC: PNC Bank NA | | | 9,725,000 | | | | 9,725,000 | |
| Cleveland-Cuyahoga County, OH, Port Authority Revenue, Carnegie/89th Garage Project, 0.1%***, 1/1/2037, LOC: JPMorgan Chase Bank | | | 17,730,000 | | | | 17,730,000 | |
| Colorado, Health Facilities Authority Revenue, Fraiser Meadows Community Project, 0.08%***, 6/1/2038, LOC: JPMorgan Chase Bank NA | | | 14,000,000 | | | | 14,000,000 | |
| Colorado, Housing Finance Authority, Single Family Mortgage Revenue: | | | | | | | | |
| "I", Series B-1, 0.15%***, 5/1/2038, LOC: Fannie Mae, Freddie Mac (a) | | | 18,935,000 | | | | 18,935,000 | |
| "I", Series A-2, 0.16%***, 5/1/2038, LOC: Fannie Mae, Freddie Mac (a) | | | 10,185,000 | | | | 10,185,000 | |
| Colorado, Meridian Village Metropolitan, RBC Municipal Products, Inc. Trust, Series C-11, 144A, 0.1%***, 12/1/2031, LIQ: Royal Bank of Canada, LOC: Royal Bank of Canada | | | 17,580,000 | | | | 17,580,000 | |
| Colorado, RBC Municipal Products, Inc. Trust, Series E-25, 144A, AMT, 0.13%***, 11/15/2025, LIQ: Royal Bank of Canada, LOC: Royal Bank of Canada | | | 22,000,000 | | | | 22,000,000 | |
| Colorado, State Educational & Cultural Facilities Authority, Linfield Christian School Project, 0.08%***, 5/1/2030, LOC: Evangelical Christian Credit Union | | | 16,000,000 | | | | 16,000,000 | |
| Colorado, Wells Fargo Stage Trust, Series 42C, 144A, AMT, 0.11%***, 11/15/2023, GTY: Wells Fargo Bank NA, LIQ: Wells Fargo Bank NA | | | 9,835,000 | | | | 9,835,000 | |
| Colorado Springs, CO, Utilities Revenue: | |
| Series C, 0.08%***, 11/1/2040, SPA: JPMorgan Chase Bank NA | | | 29,415,000 | | | | 29,415,000 | |
| Series B, 0.1%***, 11/1/2026, SPA: Barclays Bank PLC | | | 11,000,000 | | | | 11,000,000 | |
| Series A, 0.11%***, 11/1/2038, SPA: Bank of America NA | | | 31,645,000 | | | | 31,645,000 | |
| County of Carroll, KY, Environmental Facilities Revenue, Utilities Company Project, Series A, AMT, 0.11%***, 2/1/2032, LOC: Sumitomo Mitsui Banking | | | 27,800,000 | | | | 27,800,000 | |
| Covina, CA, Redevelopment Agency, Multi-Family Housing, ShadowHills Apartments, Inc., Series A, 0.08%***, 12/1/2015, LIQ: Fannie Mae | | | 12,825,000 | | | | 12,825,000 | |
| Eclipse Funding Trust, Solar Eclipse, Springfield, IL Electric Revenue, Series 2006-0007, 144A, 0.09%***, 3/1/2030, LIQ: U.S. Bank NA, LOC: U.S. Bank NA | | | 22,545,000 | | | | 22,545,000 | |
| Florida, Capital Trust Agency Housing Revenue, Atlantic Housing Foundation, Series A, 0.1%***, 7/15/2024, LIQ: Fannie Mae | | | 19,000,000 | | | | 19,000,000 | |
| Florida, Development Finance Corp., Enterprise Board Industrial Development Program, Out of Door Academy, 0.11%***, 7/1/2038, LOC: Northern Trust Co. | | | 12,910,000 | | | | 12,910,000 | |
| Florida, State Board of Public Education, Series 3834Z, 144A, 0.1%***, 12/1/2015, LIQ: JPMorgan Chase Bank NA | | | 9,000,000 | | | | 9,000,000 | |
| Florida, Sunshine State Governmental Financing Commission Revenue, Miami Dade County Program, Series B, 0.08%***, 9/1/2032, LOC: JPMorgan Chase Bank NA | | | 28,500,000 | | | | 28,500,000 | |
| Georgia, Main Street Natural Gas, Inc., Gas Revenue, Series A, 0.09%***, 8/1/2040, SPA: Royal Bank of Canada | | | 84,000,000 | | | | 84,000,000 | |
| Georgia, Private Colleges & Universities Authority Revenue, Mercer University Project, Series A, 0.1%***, 10/1/2036, LOC: Branch Banking & Trust | | | 10,240,000 | | | | 10,240,000 | |
| Hawaii, State Department of Budget & Finance Special Purpose Revenue, Series 2135, 144A, AMT, 0.1%***, 3/1/2037, GTY: Wells Fargo & Co., INS: FGIC, LIQ: Wells Fargo & Co. | | | 19,485,000 | | | | 19,485,000 | |
| Hawaii, Wells Fargo Stage Trust, Series 54C, 144A, 0.11%***, 4/1/2029, GTY: Wells Fargo Bank NA, LIQ: Wells Fargo Bank NA | | | 9,240,000 | | | | 9,240,000 | |
| Hayward, CA, Multi-Family Housing Revenue, Shorewood Bay Waterford Inc., Series A, 0.08%***, 7/15/2014, LIQ: Fannie Mae | | | 20,000,000 | | | | 20,000,000 | |
| Houston, TX, Airport Systems Revenue, 0.09%***, 7/1/2030, LOC: Barclays Bank PLC | | | 8,000,000 | | | | 8,000,000 | |
| Houston, TX, RBC Municipal Products, Inc. Trust Certificates, Utility Systems Revenue, Series E-14, 144A, 0.1%***, 5/15/2034, LIQ: Royal Bank of Canada, LOC: Royal Bank of Canada | | | 24,070,000 | | | | 24,070,000 | |
| Houston, TX, Utility Systems Revenue, Series D-1, 0.16%***, 5/15/2034, INS: AGMC, LOC: JPMorgan Chase Bank NA (a) | | | 44,000,000 | | | | 44,000,000 | |
| Houston, TX, Water & Sewer Systems Revenue, Series 27TPZ, 144A, 0.09%***, 12/1/2028, INS: AGMC, LIQ: Wells Fargo Bank NA, LOC: Wells Fargo Bank NA | | | 15,865,000 | | | | 15,865,000 | |
| Illinois, Development Finance Authority Revenue, Chicago Symphony Project, 0.08%***, 12/1/2033, LOC: Bank One NA | | | 12,500,000 | | | | 12,500,000 | |
| Illinois, Finance Authority Revenue, Series A, 0.1%***, 11/15/2022, INS: Radian, LOC: JPMorgan Chase Bank NA | | | 12,045,000 | | | | 12,045,000 | |
| Illinois, State Finance Authority Revenue, Methodist Medical Center, Series B, 0.1%***, 11/15/2041, LOC: PNC Bank NA | | | 10,000,000 | | | | 10,000,000 | |
| Illinois, State Toll Highway Authority Revenue, Series A-1A, 0.13%***, 1/1/2031, INS: AGMC, SPA: JPMorgan Chase Bank NA | | | 50,000,000 | | | | 50,000,000 | |
| Illinois, State Toll Highway Authority, Senior Priority, Series A-2A, 0.09%***, 7/1/2030, LOC: Bank of Tokyo-Mitsubishi UFJ | | | 15,000,000 | | | | 15,000,000 | |
| Illinois, Wells Fargo Stage Trust: | | | | | | | | |
| Series 50C, 144A, 0.11%***, 11/15/2035, GTY: Wells Fargo Bank NA, LIQ: Wells Fargo Bank NA | | | 9,110,000 | | | | 9,110,000 | |
| Series 15C, 144A, 0.11%***, 10/1/2040, GTY: Wells Fargo Bank NA, LIQ: Wells Fargo Bank NA | | | 24,405,000 | | | | 24,405,000 | |
| Indiana, State Finance Authority Hospital Revenue, Indiana University Health: | | | | | | | | |
| Series A, 0.06%***, 3/1/2033, LOC: Northern Trust Co. | | | 10,000,000 | | | | 10,000,000 | |
| Series K, 0.09%***, 3/1/2033, LOC: JPMorgan Chase Bank NA (a) | | | 31,700,000 | | | | 31,700,000 | |
| Series J, 0.14%***, 3/1/2033, LOC: JPMorgan Chase Bank NA (a) | | | 15,625,000 | | | | 15,625,000 | |
| Indiana, State Municipal Power Agency, Series A, 0.09%***, 1/1/2018, LOC: Citibank NA | | | 3,800,000 | | | | 3,800,000 | |
| Indiana, Wells Fargo Stage Trust, Series 41C, 144A, 0.11%***, 1/1/2021, GTY: Wells Fargo Bank NA, LIQ: Wells Fargo Bank NA | | | 16,750,000 | | | | 16,750,000 | |
| Iowa, State Finance Authority, Series C, AMT, 0.13%***, 1/1/2036, SPA: State Street Bank & Trust Co. | | | 5,700,000 | | | | 5,700,000 | |
| Iowa, State Finance Authority, Single Family Mortgage, Series C, AMT, 0.12%***, 1/1/2036, SPA: State Street Bank & Trust Co. | | | 8,100,000 | | | | 8,100,000 | |
| Johnson City, TN, Health & Educational Facilities Board Hospital Revenue, Series B3, 0.24%***, 7/1/2033, LOC: Mizuho Corporate Bank (a) | | | 11,400,000 | | | | 11,400,000 | |
| Kansas, State Department of Transportation Highway Revenue, Series C-3, 0.06%***, 9/1/2023, SPA: JPMorgan Chase Bank NA | | | 10,750,000 | | | | 10,750,000 | |
| Kentucky, State Housing Corp. Revenue, Series O, 0.6%***, 1/1/2036, SPA: State Street Bank & Trust Co. (a) | | | 19,160,000 | | | | 19,160,000 | |
| Long Island, NY, Power Authority, Series 3A, 0.28%***, 5/1/2033, LOC: JPMorgan Chase Bank NA & Landesbank Baden-Wurttemberg | | | 15,000,000 | | | | 15,000,000 | |
| Los Angeles County, CA, Multi-Family Housing Authority Revenue, Canyon Country Villas Project, Series H, 0.09%***, 12/1/2032, LIQ: Freddie Mac | | | 8,200,000 | | | | 8,200,000 | |
| Louisiana, Wells Fargo Stage Trust, Series 11C, 144A, 0.11%***, 5/1/2045, LIQ: Wells Fargo Bank NA | | | 17,310,000 | | | | 17,310,000 | |
| Maine, State Housing Authority Mortgage Revenue, Series B-3, AMT, 0.14%***, 11/15/2038, SPA: State Street Bank & Trust Co. | | | 3,310,000 | | | | 3,310,000 | |
| Maine, State Housing Authority, Mortgage Revenue, Series E-2, AMT, 0.12%***, 11/15/2041, SPA: State Street Bank & Trust Co. | | | 8,000,000 | | | | 8,000,000 | |
| Maricopa County, AZ, Industrial Development Authority, Senior Living Facilities Revenue, Christian Care Apartments, Series A, 0.09%***, 9/15/2035, LIQ: Fannie Mae | | | 10,845,000 | | | | 10,845,000 | |
| Massachusetts, State Department of Transportation, Metropolitan Highway Systems Revenue, Contract Assistance, Series A3, 0.09%***, 1/1/2039, LOC: Bank of America NA | | | 38,845,000 | | | | 38,845,000 | |
| Massachusetts, State Development Finance Agency Revenue, Milton Academy, Series B, 0.17%***, 3/1/2039, LOC: TD Bank NA (a) | | | 5,225,000 | | | | 5,225,000 | |
| Massachusetts, State Development Finance Agency Revenue, Wentworth Institute of Technology, 0.1%***, 10/1/2030, LOC: RBS Citizens NA | | | 26,390,000 | | | | 26,390,000 | |
| Massachusetts, State Development Finance Agency Revenue, YMCA of Greater Worcester, 0.08%***, 9/1/2041, LOC: TD Bank NA | | | 11,615,000 | | | | 11,615,000 | |
| Massachusetts, State General Obligation, Series B, 0.25%***, 8/1/2015, SPA: JPMorgan Chase Bank NA | | | 33,000,000 | | | | 33,000,000 | |
| Massachusetts, State Health & Educational Facilities Authority Revenue, Boston University, Series N, 0.16%***, 10/1/2034, LOC: Bank of America NA (a) | | | 13,410,000 | | | | 13,410,000 | |
| Massachusetts, State Water Resources Authority: | |
| Series C-2, 0.08%***, 11/1/2026, SPA: Barclays Bank PLC | | | 20,200,000 | | | | 20,200,000 | |
| Series A-1, 0.08%***, 8/1/2037, SPA: JPMorgan Chase Bank NA | | | 20,000,000 | | | | 20,000,000 | |
| Michigan, Finance Authority, School Loan: | |
| Series B, 0.19%***, 9/1/2050, LOC: PNC Bank NA (a) | | | 25,000,000 | | | | 25,000,000 | |
| Series C, 0.19%***, 9/1/2050, LOC: Bank of Montreal (a) | | | 21,000,000 | | | | 21,000,000 | |
| Michigan, Higher Education Facilities Authority Revenue, Limited Obligation, Hope College, Series B, 0.09%***, 4/1/2032, LOC: PNC Bank NA | | | 17,430,000 | | | | 17,430,000 | |
| Michigan, RBC Municipal Products, Inc. Trust: | | | | | | | | |
| Series L-23, 144A, AMT, 0.13%***, 3/1/2028, INS: AMBAC, LIQ: Royal Bank of Canada, LOC: Royal Bank of Canada | | | 31,000,000 | | | | 31,000,000 | |
| Series L-25, 144A, AMT, 0.13%***, 9/1/2033, LIQ: Royal Bank of Canada, LOC: Royal Bank of Canada | | | 66,745,000 | | | | 66,745,000 | |
| Michigan, State Strategic Fund Limited Obligation Revenue, Kroger Co., Recovery Zone Facility, 0.1%***, 1/1/2026, LOC: Bank of Tokyo-Mitsubishi UFJ | | | 9,500,000 | | | | 9,500,000 | |
| Michigan, Wells Fargo Stage Trust, Series 90C, 144A, 0.11%***, 7/1/2035, LIQ: Wells Fargo Bank NA | | | 14,510,000 | | | | 14,510,000 | |
| Minnesota, RBC Municipal Products, Inc. Trust, Series E-19, 144A, 0.17%***, Mandatory Put 4/2/2012 @ 100, 11/15/2047, LIQ: Royal Bank of Canada, LOC: Royal Bank of Canada | | | 10,000,000 | | | | 10,000,000 | |
| Minnesota, State Housing Finance Agency, Residential Housing Finance, Series C, AMT, 0.12%***, 7/1/2048, LIQ: Federal Home Loan Bank | | | 8,000,000 | | | | 8,000,000 | |
| Minnesota, State Office of Higher Education Revenue, Supplementary Student, Series A, 0.17%***, 12/1/2043, LOC: U.S. Bank NA (a) | | | 11,500,000 | | | | 11,500,000 | |
| Mississippi, State Business Finance Commission, Gulf Opportunity Zone, Chevron U.S.A., Inc. Project, Series C, 0.03%***, 12/1/2030, GTY: Chevron Corp. | | | 8,295,000 | | | | 8,295,000 | |
| Mississippi, State Business Finance Corp., Gulf Opportunity Zone Revenue, Tindall Corp. Project, 0.09%***, 4/1/2028, LOC: Wells Fargo Bank NA | | | 9,005,000 | | | | 9,005,000 | |
| Missouri, State Health & Educational Facilities Authority, Ascension Health, Series C-3, 0.07%***, 11/15/2039 | | | 14,000,000 | | | | 14,000,000 | |
| Missouri, State Health & Educational Facilities Authority, SSM Health Care Corp., Series E, 0.04%***, 6/1/2045, LOC: PNC Bank NA | | | 22,660,000 | | | | 22,660,000 | |
| Monroe County, GA, Development Authority Pollution Control Revenue, Oglethorpe Power Corp., Series B, 0.08%***, 1/1/2036, LOC: JPMorgan Chase Bank NA | | | 27,530,000 | | | | 27,530,000 | |
| Montgomery County, TN, Public Building Authority, Pooled Financing Revenue, Tennessee County Loan Pool, 0.23%***, 11/1/2027, LOC: Bank of America NA | | | 30,790,000 | | | | 30,790,000 | |
| Nashville & Davidson County, TN, Metropolitan Government Health & Educational Facilities Board, Multi-Family Housing, Weatherly Ridge Apartments, Series A, AMT, 0.13%***, 12/1/2041, LOC: U.S. Bank NA | | | 3,000,000 | | | | 3,000,000 | |
| Nevada, Housing Division, Multi-Unit Housing, Apache Project, Series A, AMT, 0.1%***, 10/15/2032, LIQ: Fannie Mae | | | 11,815,000 | | | | 11,815,000 | |
| New Hampshire, State Health & Education Facilities Authority Revenue, Higher Education Loan Corp., Series A, 0.18%***, 12/1/2032, LOC: Royal Bank of Canada (a) | | | 24,401,000 | | | | 24,401,000 | |
| New Jersey, State Health Care Facilities Financing Authority Revenue, Saint Barnabas Health, Series C, 0.09%***, 7/1/2038, LOC: JPMorgan Chase Bank NA (a) | | | 21,495,000 | | | | 21,495,000 | |
| New Mexico, Educational Assistance Foundation, Series A-1, AMT, 0.12%***, 4/1/2034, LOC: Royal Bank of Canada | | | 19,485,000 | | | | 19,485,000 | |
| New Mexico, Wells Fargo Stage Trust, Series 40C, 144A, 0.11%***, 8/1/2039, GTY: Wells Fargo Bank NA, LIQ: Wells Fargo Bank NA | | | 9,265,000 | | | | 9,265,000 | |
| New York, State Dormitory Authority Revenues, Non State Supported Debt, Series 47C, 144A, 0.11%***, 7/1/2050, GTY: Wells Fargo Bank NA, LIQ: Wells Fargo Bank NA | | | 20,595,000 | | | | 20,595,000 | |
| New York, State Dormitory Authority Revenues, Non-State Supported Debt, St. John's University, Series B-2, 0.08%***, 7/1/2037, LOC: Bank of America NA | | | 32,000,000 | | | | 32,000,000 | |
| New York, State Dormitory Authority Revenues, Secondary Issues, Series R-12121, 0.1%***, 4/1/2015, LIQ: Citibank NA | | | 15,830,000 | | | | 15,830,000 | |
| New York, State Energy Research & Development Authority Facilities Revenue, Consolidated Edison Co. of New York, Inc.: | | | | | | | | |
| Series A-2, 144A, 0.06%***, 5/1/2039, LOC: Mizuho Corporate Bank | | | 21,100,000 | | | | 21,100,000 | |
| Series A-1, 144A, 0.07%***, 5/1/2039, LOC: Mizuho Corporate Bank | | | 22,300,000 | | | | 22,300,000 | |
| Series C-3, 144A, AMT, 0.08%***, 11/1/2039, LOC: Mizuho Corporate Bank | | | 27,000,000 | | | | 27,000,000 | |
| Series C-1, 144A, AMT, 0.09%***, 11/1/2039, LOC: Mizuho Corporate Bank | | | 11,200,000 | | | | 11,200,000 | |
| New York, State Housing Finance Agency Revenue, 100 Maiden Lane Properties, Series A, 0.08%***, 5/15/2037, LIQ: Fannie Mae | | | 29,660,000 | | | | 29,660,000 | |
| New York, State Housing Finance Agency Revenue, 88 Leonard Street, Series A, 144A, 1.25%***, 11/1/2037, LOC: Landesbank Hessen-Thuringen (a) | | | 11,750,000 | | | | 11,750,000 | |
| New York, State Housing Finance Agency Revenue, West 38 Street, Series A, AMT, 0.09%***, 5/15/2033, LIQ: Fannie Mae | | | 16,000,000 | | | | 16,000,000 | |
| New York, State Housing Finance Agency, Affordable Housing Revenue, Clinton Park Housing, Series A, 0.1%***, 11/1/2044, LOC: Wells Fargo Bank NA | | | 21,750,000 | | | | 21,750,000 | |
| New York, State Housing Finance Agency, Affordable Housing Revenue, Clinton Park Phase II, Series A-1, 0.09%***, 11/1/2049, LOC: Wells Fargo Bank NA | | | 19,000,000 | | | | 19,000,000 | |
| New York, State Mortgage Agency, Homeowner Revenue, Series 153, AMT, 0.11%***, 4/1/2047, SPA: Barclays Bank PLC | | | 25,000,000 | | | | 25,000,000 | |
| New York City, NY, Municipal Water Finance Authority, Water & Sewer Systems Revenue, Series TR-T30001-I, 144A, 0.3%***, 6/15/2044, LIQ: Citibank NA (a) | | | 8,000,000 | | | | 8,000,000 | |
| North Carolina, Capital Facilities Finance Agency, Educational Facilities Revenue, Forsyth Country Day School, 0.12%***, 12/1/2031, LOC: Branch Banking & Trust | | | 12,190,000 | | | | 12,190,000 | |
| North Carolina, State Capital Facilities Finance Agency Revenue, ELON University, 0.11%***, 1/1/2035, LOC: Bank of America NA | | | 19,935,000 | | | | 19,935,000 | |
| Nuveen Arizona Premium Income Municipal Fund, Inc., Series T30017-I, 144A, 0.3%***, 8/1/2014, LIQ: Citibank NA (a) | | | 27,900,000 | | | | 27,900,000 | |
| Nuveen Dividend Advantage Municipal Fund, Series T30016-I, 144A, 0.3%***, 8/1/2014, LIQ: Citibank NA (a) | | | 70,300,000 | | | | 70,300,000 | |
| Nuveen Select Quality Municipal Fund, Inc., Series 1-2525, 144A, AMT, 0.25%***, 5/1/2041, LIQ: Barclays Bank PLC | | | 40,000,000 | | | | 40,000,000 | |
| Ohio, Housing Finance Agency, Residential Mortgage-Backed Revenue, Series F, AMT, 0.15%***, 3/1/2037, SPA: Citibank NA | | | 31,930,000 | | | | 31,930,000 | |
| Ohio, State Housing Finance Agency, Residental Mortgage Revenue, Series M, AMT, 0.15%***, 9/1/2036, SPA: Citibank NA | | | 32,000,000 | | | | 32,000,000 | |
| Ohio, State Housing Finance Agency, Residential Mortgage Revenue, Mortgage-Backed Securities Program, Series N, AMT, 0.15%***, 9/1/2036, SPA: State Street Bank & Trust Co. | | | 68,405,000 | | | | 68,405,000 | |
| Oklahoma, State Turnpike Authority Revenue, Series B, 0.08%***, 1/1/2028, SPA: Royal Bank of Canada | | | 20,330,000 | | | | 20,330,000 | |
| Orlando & Orange County, FL, Expressway Authority, Series C-1, 0.1%***, 7/1/2025, INS: AGMC, LOC: JPMorgan Chase Bank NA | | | 26,000,000 | | | | 26,000,000 | |
| Palm Beach County, FL, Solid Waste Authority Revenue, 1.0%, Mandatory Put 1/12/2012 @ 100, 10/1/2031 | | | 100,000,000 | | | | 100,017,369 | |
| Philadelphia, PA, Authority for Industrial Development, Series B-3, 0.07%***, 10/1/2030, LOC: PNC Bank NA | | | 10,655,000 | | | | 10,655,000 | |
| Philadelphia, PA, Gas Works Revenue, Series D, 0.07%***, 8/1/2031, LOC: Bank of America NA | | | 25,000,000 | | | | 25,000,000 | |
| Raleigh Durham, NC, Airport Authority Revenue, Series C, 0.1%***, 5/1/2036, LOC: U.S. Bank NA | | | 10,595,000 | | | | 10,595,000 | |
| Salem, OR, Hospital Facility Authority Revenue, Salem Hospital Project, Series C, 0.12%***, 8/15/2036, LOC: Bank of America NA | | | 12,500,000 | | | | 12,500,000 | |
| San Jose, CA, Financing Authority, Series E2, 0.16%***, 6/1/2025, LOC: U.S. Bank NA (a) | | | 12,455,000 | | | | 12,455,000 | |
| San Jose, CA, Financing Authority Lease Revenue, Hayes Mansion, Series D, 0.17%***, 6/1/2025, LOC: U.S. Bank NA (a) | | | 40,985,000 | | | | 40,985,000 | |
| San Jose, CA, Financing Authority Lease Revenue, Ice Center, Series E1, 0.2%***, 6/1/2025, LOC: Bank of America NA (a) | | | 12,460,000 | | | | 12,460,000 | |
| South Carolina, State Jobs-Economic Development Authority, Economic Development Revenue, Bon Secours Health Systems, 0.1%***, 11/1/2042, INS: AGMC, LOC: JPMorgan Chase Bank NA | | | 17,500,000 | | | | 17,500,000 | |
| Southern California, Metropolitan Water District, State Authorization, Series B, 0.07%***, 7/1/2028, SPA: Landesbank Hessen-Thuringen | | | 16,600,000 | | | | 16,600,000 | |
| St. James Parish, LA, Nustar Logistics, Series A, 0.09%***, 10/1/2040, LOC: JPMorgan Chase Bank NA | | | 12,500,000 | | | | 12,500,000 | |
| Stafford County, VA, Industrial Development Authority Revenue, Series B-1, 0.15%***, 8/1/2028, LOC: Bank of America NA | | | 21,505,000 | | | | 21,505,000 | |
| Sweetwater County, WY, Pollution Control Revenue, PacifiCorp Project, Series A, 144A, 0.09%***, 7/1/2015, LOC: Barclays Bank PLC | | | 12,550,000 | | | | 12,550,000 | |
| Texas, Alliance Airport Authority, Inc., Special Facilities Revenue, Series 2088, 144A, AMT, 0.1%***, 4/1/2021, GTY: Wells Fargo & Co., LIQ: Wells Fargo & Co. | | | 24,570,000 | | | | 24,570,000 | |
| Texas, Capital Area Housing Finance Corp., Cypress Creek at River Apartments, AMT, 0.13%***, 10/1/2039, LOC: Citibank NA | | | 10,895,000 | | | | 10,895,000 | |
| Texas, Lower Neches Valley Authority, Industrial Development Corp., Series B-2, AMT, 0.03%***, 12/1/2039, GTY: Exxon Mobil Corp. | | | 7,880,000 | | | | 7,880,000 | |
| Texas, RBC Municipal Products, Inc. Trust, Series E-27, 144A, 0.1%***, 6/1/2027, LIQ: Royal Bank of Canada, LOC: Royal Bank of Canada | | | 10,000,000 | | | | 10,000,000 | |
| Texas, State General Obligation: | |
| Series E, 0.14%***, 12/1/2026, SPA: JPMorgan Chase Bank NA (a) | | | 19,000,000 | | | | 19,000,000 | |
| Series E, 0.15%***, 6/1/2032, LOC: Sumitomo Mitsui Banking (a) | | | 24,435,000 | | | | 24,435,000 | |
| Texas, State Higher Education Authority, Series L-46, 144A, AMT, 0.13%***, 12/1/2034, LIQ: Royal Bank of Canada, LOC: Royal Bank of Canada | | | 52,995,000 | | | | 52,995,000 | |
| Texas, State Veterans Housing Assistance Fund II: | |
| Series C, 0.14%***, 6/1/2031, SPA: JPMorgan Chase & Co. (a) | | | 11,255,000 | | | | 11,255,000 | |
| Series A, 144A, AMT, 0.14%***, 6/1/2034, SPA: Landesbank Hessen-Thuringen | | | 18,395,000 | | | | 18,395,000 | |
| Texas, Tax & Revenue Anticipation Notes: | |
| Series 3945, 144A, 0.07%***, 8/30/2012, LIQ: JPMorgan Chase & Co. | | | 95,000,000 | | | | 95,000,000 | |
| Series 3946, 144A, 0.07%***, 8/30/2012, LIQ: JPMorgan Chase & Co. | | | 90,975,000 | | | | 90,975,000 | |
| Series 3953, 144A, 0.07%***, 8/30/2012, LIQ: JPMorgan Chase & Co. | | | 166,075,000 | | | | 166,075,000 | |
| Series 3964, 144A, 0.07%***, 8/30/2012, LIQ: JPMorgan Chase & Co. | | | 195,000,000 | | | | 195,000,000 | |
| Texas, University of Houston Revenues, Consolidated Systems, 0.08%***, 2/15/2024 | | | 8,860,000 | | | | 8,860,000 | |
| Texas, Wells Fargo Stage Trust, Series 20C, 144A, AMT, 0.11%***, 5/1/2038, GTY: Wells Fargo Bank NA, LIQ: Wells Fargo Bank NA | | | 16,120,000 | | | | 16,120,000 | |
| Travis County, TX, Health Facilities Development Corp., Retirement Facilities Revenue, Longhorn Village Project, Series B, 0.1%***, 7/1/2037, LOC: Bank of Scotland | | | 20,430,000 | | | | 20,430,000 | |
| Troy, NY, Capital Resource Corp. Revenue, Series 4C, 144A, 0.11%***, 9/1/2040, LIQ: Wells Fargo Bank NA | | | 18,715,000 | | | | 18,715,000 | |
| Tulsa, OK, Airports Improvement Trust, Special Facility Revenue, Bizjet International Sales & Support, Inc., 144A, AMT, 0.14%***, 8/1/2018, LOC: Landesbank Hessen-Thuringen | | | 10,120,000 | | | | 10,120,000 | |
| Union County, NC, Enterprise Systems Revenue, 0.07%***, 6/1/2034, LOC: Bank of America NA | | | 13,700,000 | | | | 13,700,000 | |
| University of California Revenue, Series R-12236, 0.07%***, 10/1/2015, INS: AGMC, FGIC, LIQ: Citibank NA | | | 15,000,000 | | | | 15,000,000 | |
| University of New Mexico, Systems Improvement Revenues, 0.1%***, 6/1/2026, SPA: JPMorgan Chase Bank NA | | | 33,625,000 | | | | 33,625,000 | |
| Vermont, State Educational & Health Buildings Financing Agency Revenue, Fletcher Allen Health Care, Series A, 0.08%***, 12/1/2030, LOC: TD BankNorth NA | | | 7,070,000 | | | | 7,070,000 | |
| Volusia County, FL, Housing Finance Authority, Multi-Family Housing Revenue, Cape Morris Cove Apartments, Series A, AMT, 0.12%***, 10/15/2042, LOC: JPMorgan Chase Bank NA | | | 6,140,000 | | | | 6,140,000 | |
| Washington, State Economic Development Finance Authority, Solid Waste Disposal Revenue, Waste Management, Inc. Project, Series D, AMT, 0.15%***, 7/1/2030, LOC: JPMorgan Chase Bank NA | | | 20,000,000 | | | | 20,000,000 | |
| Washington, State Health Care Facilities Authority, Swedish Health Services: | | | | | | | | |
| Series B, 0.09%***, 11/15/2046, LOC: Citibank NA | | | 13,000,000 | | | | 13,000,000 | |
| Series C, 0.09%***, 11/15/2046, LOC: Citibank NA | | | 14,000,000 | | | | 14,000,000 | |
| Washington, State Housing Finance Commission, Rolling Hills Apartments Project, Series A, 144A, AMT, 0.13%***, 6/15/2037, LIQ: Fannie Mae | | | 6,125,000 | | | | 6,125,000 | |
| Washington, Wells Fargo Stage Trust, Series 21C, 144A, 0.11%***, 12/1/2037, GTY: Wells Fargo Bank NA, LIQ: Wells Fargo Bank NA | | | 10,360,000 | | | | 10,360,000 | |
| Wayne County, MI, Airport Authority Revenue, Detroit Metropolitan Airport: | | | | | | | | |
| Series E2, AMT, 0.1%***, 12/1/2028, LOC: PNC Bank NA | | | 16,000,000 | | | | 16,000,000 | |
| Series E1, AMT, 0.11%***, 12/1/2028, LOC: JPMorgan Chase Bank NA | | | 25,000,000 | | | | 25,000,000 | |
| Wisconsin, Housing & Economic Development Authority, Home Ownership Revenue, Series B, 0.15%***, 3/1/2033, LOC: Fannie Mae, Freddie Mac (a) | | | 13,905,000 | | | | 13,905,000 | |
| Wisconsin, State Health & Educational Facilities Authority Revenue, Mercy Alliance, Inc., 0.06%***, 6/1/2039, LOC: U.S. Bank NA | | | 23,000,000 | | | | 23,000,000 | |
| Wisconsin, State Health & Educational Facilities Authority Revenue, Oakwood Village Apartments, Inc., 0.06%***, 8/15/2028, LOC: BMO Harris Bank NA | | | 9,095,000 | | | | 9,095,000 | |
| Woodstock, IL, Multi-Family Housing Revenue, Willow Brooke Apartments, AMT, 0.12%***, 4/1/2042, LOC: Wells Fargo Bank NA | | | 24,600,000 | | | | 24,600,000 | |
| Wyoming, Student Loan Corp. Revenue, Series A-3, 0.08%***, 12/1/2043, LOC: Royal Bank of Canada | | | 40,000,000 | | | | 40,000,000 | |
Total Municipal Investments (Cost $4,389,093,369) | | | | 4,389,093,369 | |
| | |
| Repurchase Agreements 0.5% | |
| JPMorgan Securities, Inc., 0.16%, dated 12/30/2011, to be repurchased at $100,001,778 on 1/3/2012 (b) (Cost $100,000,000) | | | 100,000,000 | | | | 100,000,000 | |
| | | % of Net Assets | | | Value ($) | |
| | | | |
Total Investment Portfolio ($19,901,627,274)+ | | | 95.8 | | | | 19,901,627,274 | |
| Other Assets and Liabilities, Net | | | 4.2 | | | | 882,549,401 | |
| Net Assets | | | 100.0 | | | | 20,784,176,675 | |
* Floating rate securities' yields vary with a designated market index or market rate, such as the coupon-equivalent of the U.S. Treasury Bill rate. These securities are shown at their current rate as of December 31, 2011.
** Annualized yield at time of purchase; not a coupon rate.
*** Variable rate demand notes and variable rate demand preferred shares are securities whose interest rates are reset periodically at market levels. These securities are payable on demand and are shown at their current rates as of December 31, 2011.
+ The cost for federal income tax purposes was $19,901,627,274.
(a) Taxable issue.
(b) Collateralized by:
| Principal Amount ($) | | Security | | Rate (%) | | Maturity Date | | Collateral Value ($) | |
| | 50,870,000 | | Federated Republic of Brazil | | | 8.875-12.75 | | 1/15/2020- 4/15/2024 | | | 84,676,763 | |
| | 20,000,000 | | Republic of South Africa | | | 7.375 | | 4/25/2012 | | | 20,325,000 | |
| Total Collateral Value | | | 105,001,763 | |
144A: Security exempt from registration under Rule 144A of the Securities Act of 1933. These securities may be resold in transactions exempt from registration, normally to qualified institutional buyers.
AGMC: Assured Guaranty Municipal Corp.
AMBAC: Ambac Financial Group, Inc.
AMT: Subject to alternative minimum tax.
FGIC: Financial Guaranty Insurance Co.
GTY: Guaranty Agreement
INS: Insured
LIQ: Liquidity Facility
LOC: Letter of Credit
Radian: Radian Asset Assurance, Inc.
SPA: Standby Bond Purchase Agreement
Fair Value Measurements
Various inputs are used in determining the value of the Portfolio's investments. These inputs are summarized in three broad levels. Level 1 includes quoted prices in active markets for identical securities. Level 2 includes other significant observable inputs (including quoted prices for similar securities, interest rates, prepayment speeds and credit risk). Level 3 includes significant unobservable inputs (including the Portfolio's own assumptions in determining the fair value of investments). The inputs or methodology used for valuing securities are not necessarily an indication of the risk associated with investing in those securities. Securities held by the Portfolio are reflected as Level 2 because the securities are valued at amortized cost (which approximates fair value) and, accordingly, the inputs used to determine value are not quoted prices in an active market.
The following is a summary of the inputs used as of December 31, 2011 in valuing the Portfolio's investments. For information on the Portfolio's policy regarding the valuation of investments, please refer to the Security Valuation section of Note A in the accompanying Notes to Financial Statements.
| Assets | | Level 1 | | | Level 2 | | | Level 3 | | | Total | |
| | |
| Investments in Securities (c) | | $ | — | | | $ | 19,801,627,274 | | | $ | — | | | $ | 19,801,627,274 | |
| Repurchase Agreements | | | — | | | | 100,000,000 | | | | — | | | | 100,000,000 | |
| Total | | $ | — | | | $ | 19,901,627,274 | | | $ | — | | | $ | 19,901,627,274 | |
There have been no transfers between Level 1 and Level 2 fair value measurements during the year ended December 31, 2011.
(c) See Investment Portfolio for additional detailed categorizations.
The accompanying notes are an integral part of the financial statements.
Statement of Assets and Liabilities | as of December 31, 2011 | |
| Assets | |
| Investments in non-affiliated securities, valued at amortized cost | | $ | 19,901,627,274 | |
| Cash | | | 702,330,627 | |
| Receivable for investments sold | | | 161,146,638 | |
| Interest receivable | | | 21,929,547 | |
| Other assets | | | 408,290 | |
| Total assets | | | 20,787,442,376 | |
| Liabilities | |
| Accrued management fee | | | 2,182,416 | |
| Other accrued expenses and payables | | | 1,083,285 | |
| Total liabilities | | | 3,265,701 | |
| Net assets, at value | | $ | 20,784,176,675 | |
The accompanying notes are an integral part of the financial statements.
| for the year ended December 31, 2011 | |
| Investment Income | |
Income: Interest | | $ | 66,333,359 | |
Expenses: Management fee | | | 32,771,738 | |
| Administration fee | | | 7,827,308 | |
| Custodian fee | | | 98,023 | |
| Professional fees | | | 124,799 | |
| Reports to shareholders | | | 22,736 | |
| Trustees' fees and expenses | | | 668,115 | |
| Other | | | 919,172 | |
| Total expenses before expense reductions | | | 42,431,891 | |
| Expense reductions | | | (2,631,189 | ) |
| Total expenses after expense reductions | | | 39,800,702 | |
| Net investment income | | | 26,532,657 | |
| Net realized gain (loss) from investments | | | 1,557,847 | |
| Net increase (decrease) in net assets resulting from operations | | $ | 28,090,504 | |
The accompanying notes are an integral part of the financial statements.
Statement of Changes in Net Assets | | | Years Ended December 31, | |
| Increase (Decrease) in Net Assets | | 2011 | | | 2010 | |
Operations: Net investment income | | $ | 26,532,657 | | | $ | 54,765,972 | |
| Net realized gain (loss) | | | 1,557,847 | | | | 1,171,699 | |
| Net increase (decrease) in net assets resulting from operations | | | 28,090,504 | | | | 55,937,671 | |
Capital transactions in shares of beneficial interest: Proceeds from capital invested | | | 230,841,771,646 | | | | 321,400,411,976 | |
| Value of capital withdrawn | | | (244,517,559,931 | ) | | | (329,490,407,575 | ) |
| Net increase (decrease) in net assets from capital transactions in shares of beneficial interest | | | (13,675,788,285 | ) | | | (8,089,995,599 | ) |
| Increase (decrease) in net assets | | | (13,647,697,781 | ) | | | (8,034,057,928 | ) |
| Net assets at beginning of period | | | 34,431,874,456 | | | | 42,465,932,384 | |
| Net assets at end of period | | $ | 20,784,176,675 | | | $ | 34,431,874,456 | |
The accompanying notes are an integral part of the financial statements.
| | | Years Ended December 31, | |
| | | | 2011 | | | 2010 | | | 2009 | | | 2008 | | | 2007 | |
| Ratios to Average Net Assets and Supplemental Data | |
| Net assets, end of period ($ millions) | | | 20,784 | | | | 34,432 | | | | 42,466 | | | | 29,653 | | | | 33,739 | |
| Ratio of expenses before expense reductions (%) | | | .16 | | | | .17 | | | | .16 | | | | .17 | | | | .17 | |
| Ratio of expenses after expense reductions (%) | | | .15 | | | | .16 | | | | .14 | | | | .13 | | | | .14 | |
| Ratio of net investment income (%) | | | .10 | | | | .16 | | | | .43 | | | | 2.85 | | | | 5.14 | |
Total Return (%)a,b | | | .11 | | | | .17 | | | | .48 | | | | 2.81 | | | | 5.31 | |
a Total return would have been lower had certain expenses not been reduced. b Total return for the Portfolio was derived from the performance of Cash Reserves Fund Institutional. | |
Notes to Financial Statements
A. Organization and Significant Accounting Policies
Cash Management Portfolio (the "Portfolio'') is registered under the Investment Company Act of 1940, as amended (the "1940 Act''), as an open-end management investment company organized as a New York business trust.
The Portfolio is a master fund. A master/feeder fund structure is one in which a fund (a "feeder fund"), instead of investing directly in a portfolio of securities, invests most or all of its investment assets in a separate registered investment company (the "master fund") with substantially the same investment objective and policies as the feeder fund. Such a structure permits the pooling of assets of two or more feeder funds, preserving separate identities or distribution channels at the feeder fund level. The Portfolio may have several feeder funds, including affiliated DWS feeder funds, with a significant ownership percentage of the Portfolio's net assets. Investment activities of these feeder funds could have a material impact on the Portfolio. As of December 31, 2011, Cash Management Fund, Cash Reserves Fund Institutional, Cash Reserves Fund — Prime Series and DWS Money Market Series owned approximately 11%, 10%, 5% and 72%, respectively, of the Portfolio.
The Portfolio's financial statements are prepared in accordance with accounting principles generally accepted in the United States of America which require the use of management estimates. Actual results could differ from those estimates. The policies described below are followed consistently by the Portfolio in the preparation of its financial statements.
Security Valuation. Various inputs are used in determining the value of the Portfolio's investments. These inputs are summarized in three broad levels. Level 1 includes quoted prices in active markets for identical securities. Level 2 includes other significant observable inputs (including quoted prices for similar securities, interest rates, prepayment speeds, and credit risk). Level 3 includes significant unobservable inputs (including the Portfolios' own assumptions in determining the fair value of investments). The inputs or methodology used for valuing securities are not necessarily an indication of the risk associated with investing in those securities.
The Portfolio values all securities utilizing the amortized cost method permitted in accordance with Rule 2a-7 under the 1940 Act and certain conditions therein. Under this method, which does not take into account unrealized capital gains or losses on securities, an instrument is initially valued at its cost and thereafter assumes a constant accretion/amortization rate to maturity of any discount or premium. Securities held by the Portfolio are reflected as Level 2 because the securities are valued at amortized cost (which approximates fair value) and, accordingly, the inputs used to determine value are not quoted prices in an active market.
Repurchase Agreements. The Portfolio may enter into repurchase agreements with certain banks and broker/dealers whereby the Portfolio, through its custodian or a sub-custodian bank, receives delivery of the underlying securities, the amount of which at the time of purchase and each subsequent business day is required to be maintained at such a level that the value is equal to at least the principal amount of the repurchase price plus accrued interest. The custodian bank or another designated subcustodian holds the collateral in a separate account until the agreement matures. If the value of the securities falls below the principal amount of the repurchase agreement plus accrued interest, the financial institution deposits additional collateral by the following business day. If the financial institution either fails to deposit the required additional collateral or fails to repurchase the securities as agreed, the Portfolio has the right to sell the securities and recover any resulting loss from the financial institution. If the financial institution enters into bankruptcy, the Portfolio's claims on the collateral may be subject to legal proceedings.
Federal Income Taxes. The Portfolio is considered a Partnership under the Internal Revenue Code, as amended. Therefore, no federal income tax provision is necessary.
It is intended that the Portfolio's assets, income and distributions will be managed in such a way that an investor in the Portfolio will be able to satisfy the requirements of Subchapter M of the Code, assuming that the investor invested all of its assets in the Portfolio.
The Portfolio has reviewed the tax positions for the open tax years as of December 31, 2011 and has determined that no provision for income tax is required in the Portfolio's financial statements. The Portfolio's federal tax returns for the prior three fiscal years remain open subject to examination by the Internal Revenue Service.
Contingencies. In the normal course of business, the Portfolio may enter into contracts with service providers that contain general indemnification clauses. The Portfolio's maximum exposure under these arrangements is unknown as this would involve future claims that may be made against the Portfolio that have not yet been made. However, based on experience, the Portfolio expects the risk of loss to be remote.
Other. Investment transactions are accounted for on trade date. Interest income is recorded on the accrual basis. Distributions of income and capital gains from investment companies are recorded on the ex-dividend date. Realized gains and losses from investment transactions are recorded on an identified cost basis. All discounts and premiums are accreted/amortized for both tax and financial reporting purposes.
The Portfolio makes an allocation of its net investment income and realized gains and losses from securities transactions to its investors in proportion to their investment in the Portfolio.
B. Fees and Transactions with Affiliates
Management Agreement. Under the Investment Management Agreement with Deutsche Investment Management Americas Inc. ("DIMA" or the "Advisor"), an indirect, wholly owned subsidiary of Deutsche Bank AG, the Advisor determines the securities, instruments and other contracts relating to investments to be purchased, sold or entered into by the Portfolio.
Under the Investment Management Agreement, the Portfolio pays the Advisor a monthly management fee based on its average daily net assets, computed and accrued daily and payable monthly, at the following annual rates:
| First $3.0 billion of the Portfolio's average daily net assets | | | .1500 | % |
| Next $4.5 billion of such net assets | | | .1325 | % |
| Over $7.5 billion of such net assets | | | .1200 | % |
For the period from January 1, 2011 through July 26, 2011, the Advisor had voluntarily agreed to waive total operating expenses at 0.16% of its average daily net assets (excluding certain expenses such as extraordinary expenses, taxes, brokerage and interest).
Effective July 27, 2011, the Advisor has voluntarily agreed to waive its fees and/or reimburse certain operating expenses to the extent necessary to maintain the operating expenses (excluding certain expenses such as extraordinary expenses, taxes, brokerage and interest) at 0.14% of the Fund's average daily net assets. The waiver may be changed or terminated at anytime without notice.
For the year ended December 31, 2011, the Advisor waived a portion of its management fee aggregating $2,631,189, and the amount charged aggregated $30,140,549, which was equivalent to an annual effective rate of 0.12% of the Portfolio's average daily net assets.
Administration Fee. Pursuant to an Administrative Services Agreement, DIMA provides most administrative services to the Portfolio. For all services provided under the Administrative Services Agreement, the Portfolio pays the Advisor an annual fee ("Administration Fee") of 0.03% of the Portfolio's average daily net assets, computed and accrued daily and payable monthly. For the year ended December 31, 2011, the Administration Fee was $7,827,308, of which $569,638 is unpaid.
Filing Service Fees. Under an agreement with DIMA, DIMA is compensated for providing certain regulatory filing services to the Portlfolio. For the year ended December 31, 2011, the amount charged to the Portfolio by DIMA included in the Statement of Operations under "reports to shareholders" aggregated $3,074, of which $1,343 is unpaid.
Trustees' Fees and Expenses. The Portfolio paid each Trustee not affiliated with the Advisor retainer fees plus specified amounts for various committee services and for the Board Chairperson.
C. Line of Credit
The Portfolio and other affiliated funds (the "Participants") share in a $450 million revolving credit facility provided by a syndication of banks. The Portfolio may borrow for temporary or emergency purposes, including the meeting of redemption requests that otherwise might require the untimely disposition of securities. The Participants are charged an annual commitment fee which is allocated based on net assets, among each of the Participants. Interest is calculated at a rate per annum equal to the sum of the Federal Funds Rate plus 1.25 percent plus if LIBOR exceeds the Federal Funds Rate the amount of such excess. The Portfolio may borrow up to a maximum of 33 percent of its net assets under the agreement. The Portfolio had no outstanding loans at December 31, 2011.
Report of Independent Registered Public Accounting Firm
To the Trustees and Holders of Beneficial Interest of Cash Management Portfolio:
In our opinion, the accompanying statement of assets and liabilities, including the portfolio of investments, and the related statements of operations and of changes in net assets and the financial highlights presents fairly, in all material respects, the financial position of Cash Management Portfolio (hereafter referred to as the "Portfolio'') at December 31, 2011, and the results of its operations, the changes in its net assets and the financial highlights for each of the periods indicated therein, in conformity with accounting principles generally accepted in the United States of America. These financial statements and financial highlights (hereafter referred to as "financial statements'') are the responsibility of the Portfolio's management. Our responsibility is to express an opinion on these financial statements based on our audits. We conducted our audits of these financial statements in accordance with the standards of the Public Company Accounting Oversight Board (United States). Those standards require that we plan and perform the audits to obtain reasonable assurance about whether the financial statements are free of material misstatement. An audit includes examining, on a test basis, evidence supporting the amounts and disclosures in the financial statements, assessing the accounting principles used and significant estimates made by management, and evaluating the overall financial statement presentation. We believe that our audits, which included confirmation of securities at December 31, 2011 by correspondence with the custodian and brokers, provide a reasonable basis for our opinion.
Boston, Massachusetts February 24, 2012 | PricewaterhouseCoopers LLP |
Investment Management Agreement Approval
DWS Money Market Series (the "Fund"), a series of DWS Money Market Trust, invests all of its assets in Cash Management Portfolio (the "Portfolio") in order to achieve its investment objectives. The Portfolio's Board of Trustees approved the renewal of the Portfolio's investment management agreement (the "Portfolio Agreement") with Deutsche Investment Management Americas Inc. (""DWS") and the Fund's Board of Trustees (which consists of the same members as the Board of Trustees of the Portfolio) approved the renewal of the Fund's investment management agreement with DWS (the "Fund Agreement," and together with the Portfolio Agreement, the "Agreements") in September 2011. The Portfolio's Board of Trustees and the Fund's Board of Trustees are collectively referred to as the "Board."
In terms of the process that the Board followed prior to approving the Agreements, shareholders should know that:
· In September 2011, all of the Portfolio's and Fund's Trustees were independent of DWS and its affiliates.
· The Trustees met frequently during the past year to discuss fund matters and dedicated a substantial amount of time to contract review matters. Over the course of several months, the Board's Contract Committee, in coordination with the Board's Fixed Income and Quant Oversight Committee, reviewed comprehensive materials received from DWS, independent third parties and independent counsel. These materials included an analysis of performance, fees and expenses, and profitability compiled by an independent fee consultant. The Board also received extensive information throughout the year regarding performance of the Portfolio and the Fund.
· The Independent Trustees regularly meet privately with their independent counsel to discuss contract review and other matters. In addition, the Independent Trustees were also advised by an independent fee consultant in the course of their review of the Portfolio's and the Fund's contractual arrangements and considered a comprehensive report prepared by the independent fee consultant in connection with their deliberations (the "IFC Report").
· In connection with reviewing the Agreements, the Board also reviewed the terms of the Fund's distribution agreement, administrative services agreement, transfer agency agreement and other material service agreements.
· Based on its evaluation of the information provided, the Contract Committee presented its findings and recommendations to the Board. The Board then reviewed the Contract Committee's findings and recommendations.
In connection with the contract review process, the Contract Committee and the Board considered the factors discussed below, among others. The Board also considered that DWS and its predecessors have managed the Portfolio and the Fund since their inception, and the Board believes that a long-term relationship with a capable, conscientious advisor is in the best interests of the Portfolio and the Fund. The Board considered, generally, that shareholders chose to invest or remain invested in the Fund knowing that DWS managed the Portfolio and the Fund, and that the Fund Agreement was approved by the Fund's shareholders. DWS is part of Deutsche Bank, a major global banking institution that is engaged in a wide range of financial services. The Board believes that there are significant advantages to being part of a global asset management business that offers a wide range of investing expertise and resources, including hundreds of portfolio managers and analysts with research capabilities in many countries throughout the world.
While shareholders may focus primarily on fund performance and fees, the Board considers these and many other factors, including the quality and integrity of DWS's personnel and such other issues as back-office operations, fund valuations, and compliance policies and procedures.
Nature, Quality and Extent of Services. The Board considered the terms of the Agreements, including the scope of advisory services provided under the Agreements. The Board noted that, under the Agreements, DWS provides portfolio management services to the Portfolio and the Fund and that, pursuant to separate administrative services agreements, DWS provides administrative services to the Portfolio and the Fund. The Board considered the experience and skills of senior management and investment personnel, the resources made available to such personnel, the ability of DWS to attract and retain high-quality personnel, and the organizational depth and stability of DWS. The Board reviewed the Portfolio's and the Fund's performance over short-term and long-term periods and compared those returns to various agreed-upon performance measures, including market indices and a peer universe compiled by the independent fee consultant using information supplied by iMoneyNet Inc. ("iMoneyNet"). The Board also noted that it has put into place a process of identifying "Focus Funds" (e.g., funds performing poorly relative to their benchmark or a peer universe compiled by an independent fund data service), and receives more frequent reporting and information from DWS regarding such funds, along with DWS's remedial plans to address underperformance. The Board believes this process is an effective manner of identifying and addressing underperforming funds. Based on the information provided, the Board noted that for the one- and three-year periods ended December 31, 2010, the Fund's gross performance (Institutional Shares) was in the 3rd quartile of the applicable iMoneyNet universe (the 1st quartile being the best performers and the 4th quartile being the worst performers).
On the basis of this evaluation and the ongoing review of investment results by the Board, the Board concluded that the nature, quality and extent of services provided by DWS historically have been and continue to be satisfactory.
Fees and Expenses. The Board considered the Portfolio's and the Fund's investment management fee schedules and the Fund's operating expenses and total expense ratios, and comparative information provided by Lipper Inc. ("Lipper") and the independent fee consultant regarding investment management fee rates paid to other investment advisors by similar funds (1st quartile being the most favorable and 4th quartile being the least favorable). With respect to management fees paid to other investment advisors by similar funds, the Board noted that the contractual fee rates paid by the Portfolio and the Fund, which include 0.03% and 0.10% fees paid to DWS under the respective administrative services agreements, were higher than the median (4th quartile) of the applicable Lipper peer group (based on Lipper data provided as of December 31, 2010). The Board noted that, although shareholders of the Fund indirectly bear the Portfolio's management fee, the Fund does not charge an additional investment management fee. The Board noted that the Fund's total (net) operating expenses, which include Portfolio expenses allocated to the Fund, were expected to be lower than the median of the applicable Lipper expense universe for Institutional Shares (1st quartile) (based on Lipper data provided as of December 31, 2010). The Board considered the Portfolio's management fee rate as compared to fees charged by DWS and certain of its affiliates for comparable mutual funds and considered differences in fund and fee structures between the DWS Funds. The Board also considered how the Fund's total (net) operating expenses compared to the total (net) operating expenses of a more customized peer group selected by Lipper (based on such factors as asset size). The Board also noted that the expense limitation agreed to by DWS helped to ensure that the Fund's and the Portfolio's combined total (net) operating expenses would remain competitive.
The information considered by the Board as part of its review of management fees included information regarding fees charged by DWS and its affiliates to similar institutional accounts and to similar funds offered primarily to European investors ("DWS Europe funds"), in each case as applicable. The Board observed that advisory fee rates for institutional accounts generally were lower than the management fees charged by similarly managed DWS U.S. mutual funds ("DWS Funds"), but also took note of the differences in services provided to DWS Funds as compared to institutional accounts. In the case of DWS Europe funds, the Board observed that fee rates for DWS Europe funds generally were higher than for similarly managed DWS Funds, but noted that differences in the types of services provided to DWS Funds relative to DWS Europe funds made it difficult to compare such fees.
On the basis of the information provided, the Board concluded that management fees were reasonable and appropriate in light of the nature, quality and extent of services provided by DWS.
Profitability. The Board reviewed detailed information regarding revenues received by DWS under the Agreements. The Board considered the estimated costs and pre-tax profits realized by DWS from advising the DWS Funds, as well as estimates of the pre-tax profits attributable to managing the Fund in particular. The Board also received information regarding the estimated enterprise-wide profitability of DWS and its affiliates with respect to all fund services in totality and by fund. The Board and the independent fee consultant reviewed DWS's methodology in allocating its costs to the management of the Fund. Based on the information provided, the Board concluded that the pre-tax profits realized by DWS in connection with the management of the Fund were not unreasonable. The Board also reviewed information regarding the profitability of certain similar investment management firms. The Board noted that while information regarding the profitability of such firms is limited (and in some cases is not necessarily prepared on a comparable basis), DWS and its affiliates' overall profitability with respect to the DWS fund complex (after taking into account distribution and other services provided to the funds by DWS and its affiliates) was lower than the overall profitability levels of many comparable firms for which such data was available.
Economies of Scale. The Board considered whether there are economies of scale with respect to the management of the Portfolio and the Fund and whether the Portfolio and the Fund benefit from any economies of scale. The Board noted that the Portfolio's management fee schedule includes fee breakpoints. The Board concluded that the Portfolio's and the Fund's fee schedules represent an appropriate sharing between the Portfolio and the Fund, as the case may be, and DWS of such economies of scale as may exist in the management of the Portfolio and the Fund at current asset levels.
Other Benefits to DWS and Its Affiliates. The Board also considered the character and amount of other incidental benefits received by DWS and its affiliates, including any fees received by DWS for administrative services provided to the Portfolio and the Fund and any fees received by an affiliate of DWS for distribution services. The Board also considered benefits to DWS related to brokerage and soft-dollar allocations, including allocating brokerage to pay for research generated by parties other than the executing broker dealers, which pertain primarily to funds investing in equity securities, along with the incidental public relations benefits to DWS related to DWS Funds advertising and cross-selling opportunities among DWS products and services. The Board concluded that management fees were reasonable in light of these fallout benefits.
Compliance. The Board considered the significant attention and resources dedicated by DWS to documenting and enhancing its compliance processes in recent years. The Board noted in particular (i) the experience and seniority of both DWS's chief compliance officer and the Fund's chief compliance officer; (ii) the large number of DWS compliance personnel; and (iii) the substantial commitment of resources by DWS and its affiliates to compliance matters.
Based on all of the information considered and the conclusions reached, the Board unanimously determined that the continuation of the Agreements is in the best interests of the Portfolio and the Fund. In making this determination, the Board did not give particular weight to any single factor identified above. The Board considered these factors over the course of numerous meetings, certain of which were in executive session with only the Independent Trustees and their counsel present. It is possible that individual Trustees may have weighed these factors differently in reaching their individual decisions to approve the continuation of the Agreements.
Summary of Management Fee Evaluation by Independent Fee Consultant
September 26, 2011
Pursuant to an Order entered into by Deutsche Investment Management Americas and affiliates (collectively, "DeAM") with the Attorney General of New York, I, Thomas H. Mack, have been appointed the Independent Fee Consultant for the DWS Funds (formerly the DWS Scudder Funds). My duties include preparing an annual written evaluation of the management fees DeAM charges the Funds, considering among other factors the management fees charged by other mutual fund companies for like services, management fees DeAM charges other clients for like services, DeAM's costs of supplying services under the management agreements and related profit margins, possible economies of scale if a Fund grows larger, and the nature and quality of DeAM's services, including fund performance. This report summarizes my evaluation for 2011, including my qualifications, the evaluation process for each of the DWS Funds, consideration of certain complex-level factors, and my conclusions. I served in substantially the same capacity in 2007, 2008, 2009 and 2010.
Qualifications
For more than 35 years I have served in various professional capacities within the investment management business. I have held investment analysis and advisory positions, including securities analyst, portfolio strategist and director of investment policy with a large investment firm. I have also performed business management functions, including business development, financial management and marketing research and analysis.
Since 1991, I have been an independent consultant within the asset management industry. I have provided services to over 125 client organizations, including investment managers, mutual fund boards, product distributors and related organizations. Over the past ten years I have completed a number of assignments for mutual fund boards, specifically including assisting boards with management contract renewal.
I hold a Master of Business Administration degree, with highest honors, from Harvard University and Master of Science and Bachelor of Science (highest honors) degrees from the University of California at Berkeley. I am an independent director and audit committee financial expert for two closed-end mutual funds and have served in various leadership and financial oversight capacities with non-profit organizations.
Evaluation of Fees for each DWS Fund
My work focused primarily on evaluating, fund-by-fund, the fees charged to each of the 109 mutual fund portfolios in the DWS Fund family. For each Fund, I considered each of the key factors mentioned above, as well as any other relevant information. In doing so I worked closely with the Funds' Independent Directors in their annual contract renewal process, as well as in their approval of contracts for several new funds (documented separately).
In evaluating each Fund's fees, I reviewed comprehensive materials provided by or on behalf of DeAM, including expense information prepared by Lipper Analytical, comparative performance information, profitability data, manager histories, and other materials. I also accessed certain additional information from the Lipper and Morningstar databases and drew on my industry knowledge and experience.
To facilitate evaluating this considerable body of information, I prepared for each Fund a document summarizing the key data elements in each area as well as additional analytics discussed below. This made it possible to consider each key data element in the context of the others.
In the course of contract renewal, DeAM agreed to implement a number of fee and expense adjustments requested by the Independent Directors which will favorably impact future fees and expenses, and my evaluation includes the effects of these changes.
Fees and Expenses Compared with Other Funds
The competitive fee and expense evaluation for each fund focused on two primary comparisons:
The Fund's contractual management fee (the advisory fee plus the administration fee where applicable) compared with those of a group of typically 12-15 funds in the same Lipper investment category (e.g. Large Capitalization Growth) having similar distribution arrangements and being of similar size.
The Fund's total expenses compared with a broader universe of funds from the same Lipper investment category and having similar distribution arrangements.
These two comparisons provide a view of not only the level of the fee compared with funds of similar scale but also the total expense the Fund bears for all the services it receives, in comparison with the investment choices available in the Fund's investment category and distribution channel. The principal figure-of-merit used in these comparisons was the subject Fund's percentile ranking against peers.
DeAM's Fees for Similar Services to Others
DeAM provided management fee schedules for all of its US domiciled fund and non-fund investment management accounts in any of the investment categories where there is a DWS Fund. These similar products included the other DWS Funds, non-fund pooled accounts, institutional accounts and sub-advisory accounts. Using this information, I calculated for each Fund the fee that would be charged to each similar product, at the subject Fund's asset level.
Evaluating information regarding non-fund products is difficult because there are varying levels of services required for different types of accounts, with mutual funds generally requiring considerably more regulatory and administrative types of service as well as having more frequent cash flows than other types of accounts. Also, while mutual fund fees for similar fund products can be expected to be similar, there will be some differences due to different pricing conditions in different distribution channels (e.g. retail funds versus those used in variable insurance products), differences in underlying investment processes and other factors.
Costs and Profit Margins
DeAM provided a detailed profitability analysis for each Fund. After making some adjustments so that the presentation would be more comparable to the available industry figures, I reviewed profit margins from investment management alone, from investment management plus other fund services (excluding distribution) provided to the Funds by DeAM (principally shareholder services), and DeAM profits from all sources, including distribution. A later section comments on overall profitability.
Economies of Scale
Economies of scale — an expected decline in management cost per dollar of fund assets as fund assets grow — are very rarely quantified and documented because of inherent difficulties in collecting and analyzing relevant data. However, in virtually every investment category that I reviewed, larger funds tend to have lower fees and lower total expenses than smaller funds. To see how each DWS Fund compares with this industry observation, I reviewed:
The trend in Fund assets over the last five years and the accompanying trend in total expenses. This shows if the Fund has grown and, if so, whether total expense (management fees as well as other expenses) have declined as a percent of assets.
Whether the Fund has break-points in its management fee schedule, the extent of the fee reduction built into the schedule and the asset levels where the breaks take effect, and in the case of a sub-advised Fund how the Fund's break-points compare with those of the sub-advisory fee schedule.
How the Fund's contractual fee schedule compares with trends in the industry data. To accomplish this, I constructed a chart showing how actual latest-fiscal-year contractual fees of the Fund and of other similar funds relate to average fund assets, with the subject Fund's contractual fee schedule superimposed.
Quality of Service — Performance
The quality-of-service evaluation focused on investment performance, which is the principal result of the investment management service. Each Fund's performance was reviewed over the past 1, 3, 5 and 10 years, as applicable, and compared with that of other funds in the same investment category and with a suitable market index.
In addition, I calculated and reviewed risk-adjusted returns relative to an index of similar mutual funds' returns and a suitable market index. The risk-adjusted returns analysis provides a way of determining the extent to which the Fund's return comparisons are mainly the product of investment value-added (or lack thereof) or alternatively taking considerably more or less risk than is typical in its investment category.
I also received and considered the history of portfolio manager changes for each Fund, as this provided an important context for evaluating the performance results.
Complex-Level Considerations
While this evaluation was conducted mainly at the individual fund level, there are some issues relating to the reasonableness of fees that can alternatively be considered across the whole fund complex:
I reviewed DeAM's profitability analysis for all DWS Funds, with a view toward determining if the allocation procedures used were reasonable and how profit levels compared with public data for other investment managers.
I considered whether DeAM and affiliates receive any significant ancillary or "fall-out" benefits that should be considered in interpreting the direct profitability results. These would be situations where serving as the investment manager of the Funds is beneficial to another part of the Deutsche Bank organization.
I considered how aggregated DWS Fund expenses had varied over the years, by asset class and in the context of trends in asset levels.
I reviewed the structure of the DeAM organization, trends in staffing levels, and information on compensation of investment management and other professionals compared with industry data.
Findings
Based on the process and analysis discussed above, which included reviewing a wide range of information from management and external data sources and considering among other factors the fees DeAM charges other clients, the fees charged by other fund managers, DeAM's costs and profits associated with managing the Funds, economies of scale, possible fall-out benefits, and the nature and quality of services provided, in my opinion the management fees charged the DWS Funds are reasonable.
Thomas H. Mack
President, Thomas H. Mack & Co., Inc.
Board Members and Officers
The following table presents certain information regarding the Board Members and Officers of the Trusts of DWS Money Market Series and Cash Management Portfolio as of December 31, 2011. Each Board Member's year of birth is set forth in parentheses after his or her name. Unless otherwise noted, (i) each Board Member has engaged in the principal occupation(s) noted in the table for at least the most recent five years, although not necessarily in the same capacity; and (ii) the address of each Independent Board Member is c/o Paul K. Freeman, Independent Chairman, DWS Funds, PO Box 101833, Denver, CO 80250-1833. Except as otherwise noted below, the term of office for each Board Member is until the election and qualification of a successor, or until such Board Member sooner dies, resigns, is removed or as otherwise provided in the governing documents of the fund. Because the fund does not hold an annual meeting of shareholders, each Board Member will hold office for an indeterminate period. The Board Members may also serve in similar capacities with other funds in the fund complex. The Length of Time Served represents the year in which the Board Member joined the Board of one or more DWS funds now overseen by the Board.
| Independent Board Members |
Name, Year of Birth, Position with the Fund and Length of Time Served1 | Business Experience and Directorships During the Past Five Years | Number of Funds in DWS Fund Complex Overseen |
Other Directorships Held by Board Member |
Paul K. Freeman (1950) Chairperson since 2009 Board Member since 1993 | Consultant, World Bank/Inter-American Development Bank; Executive and Governing Council of the Independent Directors Council (Chairman of Education Committee); formerly: Project Leader, International Institute for Applied Systems Analysis (1998-2001); Chief Executive Officer, The Eric Group, Inc. (environmental insurance) (1986-1998) | 110 | — |
John W. Ballantine (1946) Board Member since 1999 | Retired; formerly, Executive Vice President and Chief Risk Management Officer, First Chicago NBD Corporation/The First National Bank of Chicago (1996-1998); Executive Vice President and Head of International Banking (1995-1996). Directorships: Chairman of the Board, Healthways, Inc. (provider of disease and care management services); Portland General Electric (utility company); Stockwell Capital Investments PLC (private equity); former Directorships: First Oak Brook Bancshares, Inc. and Oak Brook Bank; Prisma Energy International | 110 | — |
Henry P. Becton, Jr. (1943) Board Member since 1990 | Vice Chair and former President, WGBH Educational Foundation. Directorships: Association of Public Television Stations; Public Radio International; Public Radio Exchange (PRX); The PBS Foundation; former Directorships: Boston Museum of Science; American Public Television; Concord Academy; New England Aquarium; Mass. Corporation for Educational Telecommunications; Committee for Economic Development; Public Broadcasting Service | 110 | Lead Director, Becton Dickinson and Company2 (medical technology company); Lead Director, Belo Corporation2 (media company) |
Dawn-Marie Driscoll (1946) Board Member since 1987 | President, Driscoll Associates (consulting firm); Executive Fellow, Center for Business Ethics, Bentley University; formerly, Partner, Palmer & Dodge (1988-1990); Vice President of Corporate Affairs and General Counsel, Filene's (1978-1988). Directorships: Director of ICI Mutual Insurance Company (since 2007); Advisory Board, Center for Business Ethics, Bentley University; Trustee, Southwest Florida Community Foundation (charitable organization); former Directorships: Investment Company Institute (audit, executive, nominating committees) and Independent Directors Council (governance, executive committees) | 110 | Trustee, Sun Capital Advisers, Inc. (22 open-end mutual funds advised by Sun Capital Advisers, Inc.) (since 2007) |
Keith R. Fox, CFA (1954) Board Member since 1996 | Managing General Partner, Exeter Capital Partners (a series of private investment funds) (since 1986). Directorships: Progressive International Corporation (kitchen goods importer and distributor); BoxTop Media Inc. (advertising); The Kennel Shop (retailer); former Chairman, National Association of Small Business Investment Companies | 110 | Trustee, Sun Capital Advisers, Inc. (22 open-end mutual funds advised by Sun Capital Advisers, Inc.) (since 2011) |
Kenneth C. Froewiss (1945) Board Member since 2001 | Adjunct Professor of Finance, NYU Stern School of Business (September 2009-present; Clinical Professor from 1997-September 2009); Member, Finance Committee, Association for Asian Studies (2002-present); Director, Mitsui Sumitomo Insurance Group (US) (2004-present); prior thereto, Managing Director, J.P. Morgan (investment banking firm) (until 1996) | 110 | — |
Richard J. Herring (1946) Board Member since 1990 | Jacob Safra Professor of International Banking and Professor, Finance Department, The Wharton School, University of Pennsylvania (since July 1972); Co-Director, Wharton Financial Institutions Center (since July 2000); Co-Chair, U.S. Shadow Financial Regulatory Committee; Executive Director, Financial Economists Roundtable; formerly: Vice Dean and Director, Wharton Undergraduate Division (July 1995-June 2000); Director, Lauder Institute of International Management Studies (July 2000-June 2006) | 110 | Director, Japan Equity Fund, Inc. (since September 2007), Thai Capital Fund, Inc. (since September 2007), Singapore Fund, Inc. (since September 2007), Independent Director of Barclays Bank Delaware (since September 2010) |
William McClayton (1944) Board Member since 2004 | Private equity investor (since October 2009); previously, Managing Director, Diamond Management & Technology Consultants, Inc. (global consulting firm) (2001-2009); Directorship: Board of Managers, YMCA of Metropolitan Chicago; formerly: Senior Partner, Arthur Andersen LLP (accounting) (1966-2001); Trustee, Ravinia Festival | 110 | — |
Rebecca W. Rimel (1951) Board Member since 1995 | President and Chief Executive Officer, The Pew Charitable Trusts (charitable organization) (1994 to present); Trustee, Washington College (2011 to present); formerly: Executive Vice President, The Glenmede Trust Company (investment trust and wealth management) (1983-2004); Board Member, Investor Education (charitable organization) (2004-2005); Trustee, Executive Committee, Philadelphia Chamber of Commerce (2001-2007); Trustee, Pro Publica (charitable organization) (2007-2010); Trustee, Thomas Jefferson Foundation (charitable organization) (1994 to 2011) | 110 | Director, CardioNet, Inc.2 (health care) (2009- present); Director, Viasys Health Care2 (January 2007- June 2007) |
William N. Searcy, Jr. (1946) Board Member since 1993 | Private investor since October 2003; formerly: Pension & Savings Trust Officer, Sprint Corporation2 (telecommunications) (November 1989-September 2003) | 110 | Trustee, Sun Capital Advisers, Inc. (22 open-end mutual funds advised by Sun Capital Advisers, Inc.) (since 1998) |
Jean Gleason Stromberg (1943) Board Member since 1997 | Retired. Formerly, Consultant (1997-2001); Director, Financial Markets US Government Accountability Office (1996-1997); Partner, Fulbright & Jaworski, L.L.P. (law firm) (1978-1996). Directorships: The William and Flora Hewlett Foundation; former Directorships: Service Source, Inc., Mutual Fund Directors Forum (2002-2004), American Bar Retirement Association (funding vehicle for retirement plans) (1987-1990 and 1994-1996) | 110 | — |
Robert H. Wadsworth (1940) Board Member since 1999 | President, Robert H. Wadsworth & Associates, Inc. (consulting firm) (1983 to present); Director, The Phoenix Boys Choir Association | 113 | — |
Officers4 |
Name, Year of Birth, Position with the Fund and Length of Time Served5 | Principal Occupation(s) During Past 5 Years and Other Directorships Held |
W. Douglas Beck, CFA6 (1967) President, 2011-present | Managing Director3, Deutsche Asset Management (2006-present); President of DWS family of funds and Head of Product Management, U.S. for DWS Investments; formerly, Executive Director, Head of Product Management (2002-2006) and President (2005-2006) of the UBS Funds at UBS Global Asset Management; Co-Head of Manager Research/Managed Solutions Group, Merrill Lynch (1998-2002) |
John Millette7 (1962) Vice President and Secretary, 1999-present | Director3, Deutsche Asset Management |
Paul H. Schubert6 (1963) Chief Financial Officer, 2004-present Treasurer, 2005-present | Managing Director3, Deutsche Asset Management (since July 2004); formerly, Executive Director, Head of Mutual Fund Services and Treasurer for UBS Family of Funds (1998-2004); Vice President and Director of Mutual Fund Finance at UBS Global Asset Management (1994-1998) |
Caroline Pearson7 (1962) Chief Legal Officer, 2010-present | Managing Director3, Deutsche Asset Management; formerly, Assistant Secretary for DWS family of funds (1997-2010) |
Rita Rubin6 (1970) Assistant Secretary, 2009-present | Director3 and Senior Counsel, Deutsche Asset Management (since October 2007); formerly, Vice President, Morgan Stanley Investment Management (2004-2007) |
Paul Antosca7 (1957) Assistant Treasurer, 2007-present | Director3, Deutsche Asset Management (since 2006); Vice President, The Manufacturers Life Insurance Company (U.S.A.) (1990-2006) |
Jack Clark7 (1967) Assistant Treasurer, 2007-present | Director3, Deutsche Asset Management (since 2007); formerly, Vice President, State Street Corporation (2002-2007) |
Diane Kenneally7 (1966) Assistant Treasurer, 2007-present | Director3, Deutsche Asset Management |
John Caruso6 (1965) Anti-Money Laundering Compliance Officer, 2010-present | Managing Director3, Deutsche Asset Management |
Robert Kloby6 (1962) Chief Compliance Officer, 2006-present | Managing Director3, Deutsche Asset Management |
1 The length of time served represents the year in which the Board Member joined the board of one or more DWS funds currently overseen by the Board.
2 A publicly held company with securities registered pursuant to Section 12 of the Securities Exchange Act of 1934.
3 Executive title, not a board directorship.
4 As a result of their respective positions held with the Advisor, these individuals are considered "interested persons" of the Advisor within the meaning of the 1940 Act. Interested persons receive no compensation from the fund.
5 The length of time served represents the year in which the officer was first elected in such capacity for one or more DWS funds.
6 Address: 60 Wall Street, New York, NY 10005.
7 Address: One Beacon Street, Boston, MA 02108.
The fund's Statement of Additional Information ("SAI") includes additional information about the Board Members. The SAI is available, without charge, upon request. If you would like to request a copy of the SAI, you may do so by calling the following toll-free number: (800) 621-1048.
Account Management Resources | |
| Investment Management | | Deutsche Investment Management Americas Inc. ("DIMA" or the "Advisor"), which is part of Deutsche Asset Management, is the investment advisor for the fund. DIMA and its predecessors have more than 80 years of experience managing mutual funds and DIMA provides a full range of investment advisory services to both institutional and retail clients. DIMA is an indirect, wholly owned subsidiary of Deutsche Bank AG. Deutsche Bank AG is a major global banking institution engaged in a wide variety of financial services, including investment management, retail, private and commercial banking, investment banking and insurance. DWS Investments is the retail brand name in the U.S. for the asset management activities of Deutsche Bank AG and DIMA. As such, DWS is committed to delivering the investing expertise, insight and resources of this global investment platform to American investors. |
| Proxy Voting | | The fund's policies and procedures for voting proxies for portfolio securities and information about how the fund voted proxies related to its portfolio securities during the 12-month period ended June 30 are available on our Web site — www.dws-investments.com (click on "proxy voting"at the bottom of the page) — or on the SEC's Web site — www.sec.gov. To obtain a written copy of the fund's policies and procedures without charge, upon request, call us toll free at (800) 621-1048. |
| Portfolio Holdings | | Following the fund's fiscal first and third quarter-end, a complete portfolio holdings listing is filed with the SEC on Form N-Q. In addition, each month, information about the fund and its portfolio holdings is filed with the SEC on Form N-MFP. The SEC delays the public availability of the information filed on Form N-MFP for 60 days after the end of the reporting period included in the filing. These forms will be available on the SEC's Web site at www.sec.gov, and they may also be reviewed and copied at the SEC's Public Reference Room in Washington, D.C. Information on the operation of the SEC's Public Reference Room may be obtained by calling (800) SEC-0330. The fund's portfolio holdings are also posted on www.dws-investments.com from time to time. Please see the fund's current prospectus for more information. |
| Principal Underwriter | | If you have questions, comments or complaints, contact: DWS Investments Distributors, Inc. 222 South Riverside Plaza Chicago, IL 60606-5808 (800) 621-1148 |
| For shareholders of Institutional Shares and Institutional Shares MGD: |
| For More Information | | (800) 730-1313 To speak with a DWS Investments service representative. |
| Web Site | | www.dbadvisorsliquidity.com/US View your account transactions and balances, trade shares, monitor your asset allocation, 24 hours a day. Obtain prospectuses and applications, blank forms, interactive worksheets, news about DWS funds, subscription to fund updates by e-mail, retirement planning information, and more. |
| Written Correspondence | | DWS Investments Service Company Institutional Money Funds — Client Services PO Box 219210 Kansas City, MO 64121-9210 ifunds@dws.com |
| | | Institutional Shares | Institutional Shares MGD |
| Nasdaq Symbol | | ICAXX | MCAXX |
| Fund Number | | 2403 | 2023 |
| For shareholders of Institutional Shares PS and Institutional Shares PRS: |
| For More Information | | (800) 728-3337 To speak with a DWS Investments service representative. |
| Web Site | | www.dws-investments.com View your account transactions and balances, trade shares, monitor your asset allocation, 24 hours a day. Obtain prospectuses and applications, blank forms, interactive worksheets, news about DWS funds, subscription to fund updates by e-mail, retirement planning information, and more. |
| Written Correspondence | | DWS Investments PO Box 219151 Kansas City, MO 64121-9151 |
| | | Institutional Shares PS | Institutional Shares PRS |
| Nasdaq Symbol | | SPMXX | SCRXX |
| Fund Number | | 2402 | 2309 |
Notes
Notes