UNITED STATES
SECURITIES AND EXCHANGE COMMISSION
Washington, D.C. 20549
FORM N-CSR
CERTIFIED SHAREHOLDER REPORT
OF
REGISTERED MANAGEMENT INVESTMENT COMPANIES
Investment Company Act file number: 811-6093
Name of Registrant: Vanguard Institutional Index Funds
Address of Registrant:
P.O. Box 2600
Valley Forge, PA 19482
Name and address of agent for service:
Heidi Stam, Esquire
P.O. Box 876
Valley Forge, PA 19482
Registrant’s telephone number, including area code: (610) 669-1000
Date of fiscal year end: December 31
Date of reporting period: January 1, 2008– June 30, 2009
Item 1: Reports to Shareholders
Vanguard Institutional Index Fund Semiannual Report
June 30, 2009

> For the fiscal half-year ended June 30, 2009, the Vanguard Institutional Index
Fund returned about 3%, closely tracking the performance of its target benchmark.
> After suffering severe losses in the beginning of the period, stocks began to
bounce back in mid-March, with a few sectors posting gains for the six months.
> The biggest contributors to performance included holdings in the information
technology, consumer discretionary, and materials sectors.
Contents | |
| |
Your Fund’s Total Returns | 1 |
President’s Letter | 2 |
Fund Profile | 6 |
Performance Summary | 7 |
Financial Statements | 8 |
About Your Fund’s Expenses | 23 |
Trustees Approve Advisory Arrangement | 25 |
Glossary | 26 |
Please note: The opinions expressed in this report are just that—informed opinions. They should not be considered promises or advice. Also, please keep in mind that the information and opinions cover the period through the date on the front of this report. Of course, the risks of investing in your fund are spelled out in the prospectus.
Your Fund’s Total Returns
Six Months Ended June 30, 2009 | | |
| Ticker | Total |
| Symbol | Returns |
Vanguard Institutional Index Fund | | |
Institutional Shares1 | VINIX | 3.27% |
Institutional Plus Shares2 | VIIIX | 3.29 |
S&P 500 Index | | 3.16 |
Average Large-Cap Core Fund3 | | 4.83 |
Your Fund’s Performance at a Glance
December 31, 2008–June 30, 2009
| | | Distributions Per Share |
| Starting | Ending | Income | Capital |
| Share Price | Share Price | Dividends | Gains |
Vanguard Institutional Index Fund | | | | |
Institutional Shares | $82.54 | $84.18 | $0.990 | $0.000 |
Institutional Plus Shares | 82.54 | 84.18 | 0.999 | 0.000 |
1 This class of shares carries low expenses and is available for a minimum investment of $5 million.
2 This class of shares also carries low expenses and is available for a minimum investment of $200 million.
3 Derived from data provided by Lipper Inc.
1

President’s Letter
Dear Shareholder,
Vanguard Institutional Index Fund returned about 3% for the first six months of 2009, closely tracking the performance of the Standard & Poor’s 500 Index. The fund finished the half-year a few steps behind the average return of large-capitalization core funds.
Holdings in the information technology, consumer discretionary, and materials sectors helped boost returns. Meanwhile, stocks in the industrial and health care areas of the market were the biggest detractors for the period.
Stock gains petered out by the end of the period
For the six months ended June 30, the broad U.S. stock market returned 5%. The stock market began the period in negative territory, rallied through much of the spring, but then lost steam in June. While the second quarter was the strongest quarter for U.S. stocks since 2003, equity gains fizzled in mid-June as investors were taken aback by a drop in consumer confidence, a decline in home prices, and a larger-than-expected rise in the unemployment rate.
International stocks registered a stronger showing, returning about 14% for the half-year. Emerging markets posted the best results as investors poured money into countries with robust growth prospects. Higher commodity prices and a slight rebound in manufacturing orders helped reverse steep declines in international stocks from earlier in the period.
2
Still, pockets of the developed and developing markets, particularly in Europe, continued to struggle amid the global recession. After three consecutive monthly gains, the MSCI All Country World Index ex USA declined slightly for June, perhaps signaling a bumpy road ahead.
Bond investors grew confident, sought out higher yields. As the fiscal half-year began, investors panicked by the credit-market crisis sought shelter in U.S. Treasury bonds, considered the safest of all securities. The difference between the yields of Treasuries and those of corporate bonds surged to levels not seen since the 1930s.
By mid-March, investors had gained confidence from the federal government’s efforts to thaw the credit market and stimulate the economy. Bond investors were more optimistic and more willing to take on risk; they shifted their focus away from Treasuries to higher-yielding corporate bonds. For the six months, the Barclays Capital U.S. Aggregate Bond Index returned 1.90%, while high-yield bonds, as measured by the Barclays Capital U.S. Corporate High Yield Bond Index, returned about 30%.
Despite some murmurs in the market about longer-term inflation risks, the Federal Reserve in recent months unveiled plans to purchase Treasury and mortgage-backed securities. The Fed hoped to drive up the securities’ prices and push down
Market Barometer | | | |
| | | Total Returns |
| | Periods Ended June 30, 2009 |
| Six Months | One Year | Five Years1 |
Stocks | | | |
Russell 1000 Index (Large-caps) | 4.32% | –26.69% | –1.85% |
Russell 2000 Index (Small-caps) | 2.64 | –25.01 | –1.71 |
Dow Jones U.S. Total Stock Market Index | 5.00 | –26.11 | –1.47 |
MSCI All Country World Index ex USA (International) | 14.35 | –30.54 | 4.95 |
| | | |
| | | |
Bonds | | | |
Barclays Capital U.S. Aggregate Bond Index | | | |
(Broad taxable market) | 1.90% | 6.05% | 5.01% |
Barclays Capital Municipal Bond Index | 6.43 | 3.77 | 4.14 |
Citigroup 3-Month Treasury Bill Index | 0.10 | 0.78 | 3.02 |
| | | |
| | | |
CPI | | | |
Consumer Price Index | 2.60% | –1.43% | 2.60% |
| | | | |
1 Annualized.
3
yields, and thus keep borrowing costs, such as mortgage rates, low. Government initiatives also helped bring down municipal bond yields, which earlier in the period were higher than those of Treasuries, a reversal in the traditional relationship between taxable and tax-exempt yields. For the six months, the tax-exempt bond market returned 6.43%.
The Fed kept the target for short-term interest rates at an all-time low of 0% to 0.25% throughout the period.
Stocks began to recover, resulting in a positive return Vanguard Institutional Index Fund, like the broad U.S. stock market, was down significantly at the beginning of the period. In mid-March, however, stocks began to rally and, by the end of the period, had crept into positive territory for the first half of fiscal 2009. A few sectors ended the six months with positive returns, contributing to the 3.27% return of Institutional Index Fund’s Institutional Shares (3.29% for Institutional Plus Shares).
The information technology sector—the index’s most heavily weighted sector—was the leading contributor to returns for the period. Big-name computer and software companies staged a strong comeback over the last few months as corporations began spending on technology again, after trimming their budgets in 2008 in response to the worldwide recession.
Consumer discretionary stocks were also up for the period, as consumers slowly resumed spending. The biggest contributors to performance included electronics firms and department stores. In the materials sector, chemicals, metals, and mining companies also helped boost returns.
Stocks in the industrial sector weighed most heavily on returns, as losses in the aerospace and defense industry, as well as poor results from a big industrial conglomerate, took their toll. In the health care sector, holdings in pharmaceutical and biotechnology companies also hurt returns.
Regardless of market conditions, a long-term focus is key.
Over the past 18 months, investors’ resolve has been tested repeatedly. In 2008, the U.S. financial markets endured their worst calendar year since the 1930s. The first two months of 2009 brought more bad news and falling prices before stocks rebounded to turn in their best quarter since 2003. Nobody knows where the stock market will go from here, particularly in the shorter term.
4
The important thing to remember is that short-term performance is mostly just noise. At Vanguard, we recommend that you maintain a long-term perspective. Despite market conditions, the Vanguard Institutional Index Fund has a long history of meeting its objective of closely tracking its benchmark index. And over time, we would expect a strategy of simply matching the market to produce very competitive returns. The fund offers a low-cost way to gain exposure to large- and mid-sized companies representing about three-quarters of the broad U.S. stock market’s value. As part of a well-balanced portfolio, the fund can play a useful role in helping investors work toward their long-term financial goals.
Thank you, as always, for investing with Vanguard.
Sincerely,

F. William McNabb III
President and Chief Executive Officer
July 20, 2009
5
Institutional Index Fund
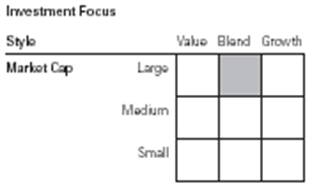
Fund Profile
As of June 30, 2009
Portfolio Characteristics | | |
| | Target |
| Fund | Index1 |
Number of Stocks | 509 | 500 |
Median Market Cap | $39.8B | $39.8B |
Price/Earnings Ratio | 16.6x | 16.6x |
Price/Book Ratio | 2.0x | 2.0x |
Yield2 | | 2.4% |
Institutional Shares | 2.5% | |
Institutional Plus Shares | 2.5% | |
Return on Equity | 21.1% | 21.1% |
Earnings Growth Rate | 14.2% | 14.2% |
Foreign Holdings | 0.0% | 0.0% |
Turnover Rate3 | 5% | — |
Expense Ratio4 | | — |
Institutional Shares | 0.05% | |
Institutional Plus Shares | 0.025% | |
Short-Term Reserves | –0.1%5 | — |
Sector Diversification (% of equity exposure) |
| | Target |
| Fund | Index1 |
Consumer Discretionary | 9.0% | 9.0% |
Consumer Staples | 12.0 | 12.0 |
Energy | 12.4 | 12.4 |
Financials | 13.6 | 13.6 |
Health Care | 14.0 | 14.0 |
Industrials | 9.8 | 9.9 |
Information Technology | 18.4 | 18.3 |
Materials | 3.2 | 3.2 |
Telecommunication Services | 3.5 | 3.5 |
Utilities | 4.1 | 4.1 |
Volatility Measures6 | |
| Fund Versus |
| Target Index1 |
R-Squared | 1.00 |
Beta | 1.00 |
| |
| |
| |
Ten Largest Holdings7 | (% of total net assets) |
| | |
ExxonMobil Corp. | integrated oil | |
| and gas | 4.2% |
Microsoft Corp. | systems software | 2.2 |
Johnson & Johnson | pharmaceuticals | 1.9 |
The Procter & Gamble Co. | household products | 1.8 |
AT&T Inc. | integrated | |
| telecommunication | |
| services | 1.8 |
International Business | | |
Machines Corp. | computer hardware | 1.7 |
JPMorgan Chase & Co. | diversified financial | |
| services | 1.6 |
Chevron Corp. | integrated | |
| oil and gas | 1.6 |
Apple Inc. | computer hardware | 1.6 |
General Electric Co. | industrial | |
| conglomerates | 1.5 |
Top Ten | | 19.9% |
1 S&P 500 Index.
2 | 30-day SEC yield for the fund; annualized dividend yield for the index. See the Glossary. |
3 Annualized.
4 The expense ratios shown are from the prospectus dated April 29, 2009, and represent estimated costs for the current fiscal year based on the fund’s net assets as of the prospectus date. For the six months ended June 30, 2009, the annualized expense ratios were 0.05% for Institutional Shares and 0.025% for Institutional Plus Shares.
5 The fund invested a portion of its cash reserves in equity markets through the use of index futures contracts. After the effect of the futures investments, the fund’s temporary cash position was negative.
6 For an explanation of R-squared, beta, and other terms used here, see the Glossary.
7 | The holdings listed exclude any temporary cash investments and equity index products. |
6
Institutional Index Fund
Performance Summary
All of the returns in this report represent past performance, which is not a guarantee of future results that may be achieved by the fund. (Current performance may be lower or higher than the performance data cited. For performance data current to the most recent month-end, visit our website at www.vanguard.com/performance.) Note, too, that both investment returns and principal value can fluctuate widely, so an investor’s shares, when sold, could be worth more or less than their original cost. The returns shown do not reflect taxes that a shareholder would pay on fund distributions or on the sale of fund shares.
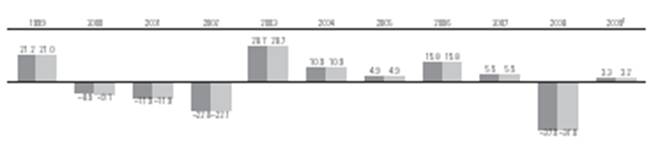
Fiscal-Year Total Returns (%): December 31, 1998–June 30, 2009

Average Annual Total Returns: Periods Ended June 30, 2009 | | | |
| | | | |
| Inception Date | One Year | Five Years | Ten Years |
Institutional Shares | 7/31/1990 | –26.08% | –2.21% | –2.18% |
Institutional Plus Shares | 7/7/1997 | –26.06 | –2.19 | –2.15 |
1 Six months ended June 30, 2009.
| Note: See Financial Highlights tables for dividend and capital gains information. |
7
Institutional Index Fund
Financial Statements (unaudited)
Statement of Net Assets
As of June 30, 2009
The fund provides a complete list of its holdings four times in each fiscal year, at the quarter-ends. For the second and fourth fiscal quarters, the lists appear in the fund’s semiannual and annual reports to shareholders. For the first and third fiscal quarters, the fund files the lists with the Securities and Exchange Commission on Form N-Q. Shareholders can look up the fund’s Forms N-Q on the SEC’s website at www.sec.gov. Forms N-Q may also be reviewed and copied at the SEC’s Public Reference Room (see the back cover of this report for further information).
| | | Market |
| | | Value• |
| | Shares | ($000) |
Common Stocks (99.3%)1 | |
Consumer Discretionary (8.9%) | |
| McDonald’s Corp. | 7,533,114 | 433,079 |
| The Walt Disney Co. | 12,678,322 | 295,785 |
| Home Depot, Inc. | 11,578,022 | 273,589 |
| Comcast Corp. Class A | 18,843,787 | 273,046 |
| Time Warner Inc. | 8,165,672 | 205,693 |
| Target Corp. | 5,136,841 | 202,751 |
| Lowe’s Cos., Inc. | 10,082,130 | 195,694 |
* | Amazon.com, Inc. | 2,200,323 | 184,079 |
| News Corp., Class A | 15,707,143 | 143,092 |
| NIKE, Inc. Class B | 2,645,894 | 137,004 |
* | Ford Motor Co. | 21,975,381 | 133,391 |
| Yum! Brands, Inc. | 3,151,998 | 105,088 |
| Staples, Inc. | 4,884,620 | 98,523 |
* | Viacom Inc. Class B | 4,140,355 | 93,986 |
* | Kohl’s Corp. | 2,085,385 | 89,150 |
| TJX Cos., Inc. | 2,823,903 | 88,840 |
* | DIRECTV Group, Inc. | 3,579,129 | 88,440 |
| Johnson Controls, Inc. | 4,057,929 | 88,138 |
| Best Buy Co., Inc. | 2,330,963 | 78,064 |
| Carnival Corp. | 2,991,882 | 77,101 |
| Time Warner Cable Inc. | 2,406,022 | 76,199 |
* | Starbucks Corp. | 5,025,249 | 69,801 |
| Omnicom Group Inc. | 2,122,719 | 67,035 |
| The McGraw-Hill Cos., Inc. | 2,147,642 | 64,666 |
| Coach, Inc. | 2,168,041 | 58,277 |
* | Bed Bath & Beyond, Inc. | 1,773,220 | 54,527 |
* | Apollo Group, Inc. Class A | 735,898 | 52,337 |
| The Gap, Inc. | 3,134,461 | 51,405 |
| Marriott International, Inc. | | |
| Class A | 2,027,214 | 44,741 |
| J.C. Penney Co., Inc. | | |
| (Holding Co.) | 1,517,843 | 43,577 |
| H & R Block, Inc. | 2,319,685 | 39,968 |
| Mattel, Inc. | 2,448,456 | 39,298 |
* | AutoZone Inc. | 246,515 | 37,251 |
| Genuine Parts Co. | 1,088,956 | 36,545 | |
| Sherwin-Williams Co. | 670,809 | 36,056 | |
| Fortune Brands, Inc. | 1,025,756 | 35,635 | |
* | O’Reilly Automotive, Inc. | 924,477 | 35,204 | |
| Macy’s Inc. | 2,872,136 | 33,776 |
| VF Corp. | 603,091 | 33,381 |
| International Game | | |
| Technology | 2,019,207 | 32,105 |
| CBS Corp. | 4,622,400 | 31,987 |
| Darden Restaurants Inc. | 936,486 | 30,885 |
| Starwood Hotels & | | |
| Resorts Worldwide, Inc. | 1,274,793 | 28,300 |
| Family Dollar Stores, Inc. | 955,701 | 27,046 |
| Harley-Davidson, Inc. | 1,597,804 | 25,900 |
*,^ | Sears Holdings Corp. | 374,077 | 24,884 |
* | GameStop Corp. Class A | 1,121,917 | 24,693 |
| Limited Brands, Inc. | 1,841,246 | 22,040 |
* | Expedia, Inc. | 1,437,040 | 21,714 |
| Nordstrom, Inc. | 1,091,205 | 21,704 |
| Tiffany & Co. | 844,934 | 21,428 |
| Whirlpool Corp. | 503,153 | 21,414 |
| DeVry, Inc. | 419,191 | 20,976 |
| Polo Ralph Lauren Corp. | 386,145 | 20,674 |
| Hasbro, Inc. | 848,248 | 20,562 |
| Newell Rubbermaid, Inc. | 1,888,891 | 19,663 |
* | The Goodyear Tire & | | |
| Rubber Co. | 1,651,754 | 18,599 |
| The Stanley Works | 537,888 | 18,202 |
| D. R. Horton, Inc. | 1,876,705 | 17,566 |
| Scripps Networks | | |
| Interactive | 616,664 | 17,162 |
* | Interpublic Group | | |
| of Cos., Inc. | 3,260,506 | 16,466 |
*,^ | Wynn Resorts Ltd. | 460,983 | 16,273 |
| Leggett & Platt, Inc. | 1,068,288 | 16,270 |
| Abercrombie & Fitch Co. | 598,988 | 15,208 |
| Wyndham | | |
| Worldwide Corp. | 1,211,143 | 14,679 |
| Washington Post Co. | | |
| Class B | 41,004 | 14,441 |
| Pulte Homes, Inc. | 1,459,599 | 12,888 |
* | AutoNation, Inc. | 734,817 | 12,749 |
| Comcast Corp. Special | | |
| Class A | 844,535 | 11,908 |
| RadioShack Corp. | 850,769 | 11,877 |
| | | | | |
8
Institutional Index Fund
| | | Market |
| | | Value• |
| | Shares | ($000) |
* | Big Lots Inc. | 560,894 | 11,796 |
| Black & Decker Corp. | 409,124 | 11,726 |
| Snap-On Inc. | 391,335 | 11,247 |
| Lennar Corp. Class A | 959,523 | 9,298 |
| Harman International | | |
| Industries, Inc. | 472,302 | 8,879 |
* | Office Depot, Inc. | 1,873,353 | 8,542 |
| Centex Corp. | 844,732 | 7,146 |
| KB Home | 511,369 | 6,996 |
| Meredith Corp. | 244,906 | 6,257 |
| Gannett Co., Inc. | 1,585,254 | 5,659 |
| Eastman Kodak Co. | 1,827,749 | 5,410 |
| New York Times Co. | | |
| Class A | 795,250 | 4,382 |
| CBS Corp. Class A | 18,015 | 125 |
* | Viacom Inc. Class A | 775 | 19 |
| | | 4,921,957 |
Consumer Staples (11.9%) | | |
| The Procter & Gamble Co. | 19,901,972 | 1,016,991 |
| Wal-Mart Stores, Inc. | 15,237,793 | 738,119 |
| The Coca-Cola Co. | 13,594,106 | 652,381 |
| Philip Morris | | |
| International Inc. | 13,393,931 | 584,243 |
| PepsiCo, Inc. | 10,630,048 | 584,227 |
| CVS Caremark Corp. | 9,941,033 | 316,821 |
| Kraft Foods Inc. | 10,056,260 | 254,826 |
| Colgate-Palmolive Co. | 3,411,196 | 241,308 |
| Altria Group, Inc. | 14,118,410 | 231,401 |
| Walgreen Co. | 6,771,692 | 199,088 |
| Kimberly-Clark Corp. | 2,828,406 | 148,293 |
| Costco Wholesale Corp. | 2,963,761 | 135,444 |
| General Mills, Inc. | 2,246,392 | 125,843 |
| Archer-Daniels-Midland Co. | 4,383,887 | 117,357 |
| The Kroger Co. | 4,454,534 | 98,222 |
| Sysco Corp. | 4,028,175 | 90,553 |
| Kellogg Co. | 1,724,082 | 80,290 |
| Lorillard, Inc. | 1,148,417 | 77,828 |
| H.J. Heinz Co. | 2,148,539 | 76,703 |
| Avon Products, Inc. | 2,915,220 | 75,154 |
| Safeway, Inc. | 2,908,394 | 59,244 |
| ConAgra Foods, Inc. | 3,054,047 | 58,210 |
| The Clorox Co. | 949,642 | 53,019 |
| Sara Lee Corp. | 4,750,436 | 46,364 |
| Reynolds American Inc. | 1,153,919 | 44,564 |
| Molson Coors | | |
| Brewing Co. Class B | 1,020,954 | 43,217 |
| The Hershey Co. | 1,131,800 | 40,745 |
| Campbell Soup Co. | 1,363,478 | 40,114 |
| J.M. Smucker Co. | 808,818 | 39,357 |
* | Dr. Pepper Snapple | | |
| Group, Inc. | 1,733,727 | 36,738 |
| Coca-Cola Enterprises, Inc. | 2,165,648 | 36,058 |
| The Pepsi Bottling | | |
| Group, Inc. | 933,255 | 31,581 |
| McCormick & Co., Inc. | 889,975 | 28,951 |
| Brown-Forman Corp. | | |
| Class B | 668,278 | 28,723 |
| Tyson Foods, Inc. | 2,059,788 | 25,974 |
| The Estee Lauder | | |
| Cos. Inc. Class A | 790,673 | 25,831 |
* | Dean Foods Co. | 1,209,043 | 23,202 |
| SUPERVALU Inc. | 1,440,922 | 18,660 |
^ | Whole Foods Market, Inc. | 955,430 | 18,134 |
* | Constellation Brands, Inc. | | |
| Class A | 1,339,438 | 16,984 |
| Hormel Foods Corp. | 475,559 | 16,426 |
| | | 6,577,188 |
Energy (12.3%) | | |
| ExxonMobil Corp. | 33,319,067 | 2,329,336 |
| Chevron Corp. | 13,688,135 | 906,839 |
| Schlumberger Ltd. | 8,169,314 | 442,042 |
| ConocoPhillips Co. | 10,116,373 | 425,495 |
| Occidental | | |
| Petroleum Corp. | 5,534,811 | 364,246 |
| Devon Energy Corp. | 3,031,109 | 165,195 |
| Apache Corp. | 2,288,755 | 165,134 |
| Anadarko Petroleum Corp. | 3,408,734 | 154,722 |
| XTO Energy, Inc. | 3,958,378 | 150,973 |
| Marathon Oil Corp. | 4,833,002 | 145,618 |
| Halliburton Co. | 6,125,902 | 126,806 |
| EOG Resources, Inc. | 1,709,067 | 116,080 |
| Hess Corp. | 1,942,930 | 104,433 |
* | National Oilwell Varco Inc. | 2,855,411 | 93,258 |
* | Southwestern Energy Co. | 2,346,611 | 91,166 |
| Baker Hughes Inc. | 2,115,521 | 77,090 |
| Chesapeake Energy Corp. | 3,848,328 | 76,312 |
| Spectra Energy Corp. | 4,404,261 | 74,520 |
| Murphy Oil Corp. | 1,302,861 | 70,771 |
| Noble Energy, Inc. | 1,183,822 | 69,810 |
| Valero Energy Corp. | 3,798,938 | 64,164 |
| Williams Cos., Inc. | 3,961,289 | 61,836 |
| Peabody Energy Corp. | 1,825,804 | 55,066 |
| Range Resources Corp. | 1,069,123 | 44,272 |
| El Paso Corp. | 4,787,173 | 44,186 |
* | Cameron | | |
| International Corp. | 1,481,767 | 41,934 |
| CONSOL Energy, Inc. | 1,233,601 | 41,893 |
| Diamond Offshore | | |
| Drilling, Inc. | 474,634 | 39,418 |
| Smith International, Inc. | 1,497,657 | 38,565 |
| ENSCO International, Inc. | 966,257 | 33,693 |
* | FMC Technologies Inc. | 844,023 | 31,718 |
* | Nabors Industries, Inc. | 1,932,993 | 30,116 |
| BJ Services Co. | 1,994,767 | 27,189 |
| | | | |
* | Denbury Resources, Inc. | 1,699,616 | 25,035 |
| Cabot Oil & Gas Corp. | 707,880 | 21,690 |
| Pioneer Natural | | |
| Resources Co. | 786,739 | 20,062 |
| Sunoco, Inc. | 795,359 | 18,452 |
| Rowan Cos., Inc. | 769,616 | 14,869 |
| Tesoro Corp. | 941,026 | 11,979 |
| Massey Energy Co. | 582,306 | 11,378 |
| | | 6,827,361 |
9
Institutional Index Fund
| | | Market |
| | | Value• |
| | Shares | ($000) |
Financials (13.4%) | | |
| JPMorgan Chase & Co. | 26,637,595 | 908,608 |
| Wells Fargo & Co. | 31,791,810 | 771,269 |
| Bank of America Corp. | 55,221,653 | 728,926 |
| The Goldman Sachs | | |
| Group, Inc. | 3,437,481 | 506,822 |
| Morgan Stanley | 9,229,600 | 263,136 |
| Bank of New York | | |
| Mellon Corp. | 8,162,831 | 239,253 |
| U.S. Bancorp | 12,958,367 | 232,214 |
| American Express Co. | 8,108,096 | 188,432 |
| MetLife, Inc. | 5,589,078 | 167,728 |
| The Travelers Cos., Inc. | 3,997,588 | 164,061 |
| State Street Corp. | 3,371,471 | 159,133 |
| CME Group, Inc. | 453,138 | 140,976 |
| PNC Financial | | |
| Services Group | 3,143,054 | 121,982 |
| Prudential Financial, Inc. | 3,160,607 | 117,638 |
| Charles Schwab Corp. | 6,412,269 | 112,471 |
| AFLAC Inc. | 3,191,934 | 99,237 |
| Simon Property | | |
| Group, Inc. REIT | 1,896,397 | 97,532 |
| BB&T Corp. | 4,417,319 | 97,093 |
| The Chubb Corp. | 2,404,397 | 95,887 |
| The Allstate Corp. | 3,662,611 | 89,368 |
| Northern Trust Corp. | 1,645,453 | 88,328 |
| Franklin Resources, Inc. | 1,031,422 | 74,273 |
| T. Rowe Price Group Inc. | 1,744,234 | 72,682 |
| Marsh & McLennan | | |
| Cos., Inc. | 3,568,236 | 71,829 |
| Aon Corp. | 1,888,304 | 71,510 |
* | Progressive Corp. of Ohio | 4,650,376 | 70,267 |
| Loews Corp. | 2,466,538 | 67,583 |
| Capital One Financial Corp. | 3,085,554 | 67,512 |
^ | Citigroup Inc. | 21,952,786 | 65,200 |
* | Intercontinental | | |
| Exchange Inc. | 497,344 | 56,817 |
| Public Storage, Inc. REIT | 856,519 | 56,085 |
| SunTrust Banks, Inc. | 3,173,342 | 52,201 |
| Invesco, Ltd. | 2,808,873 | 50,054 |
| Vornado Realty Trust REIT | 1,084,087 | 48,816 |
| NYSE Euronext | 1,775,500 | 48,382 |
| Hudson City Bancorp, Inc. | 3,556,405 | 47,265 |
| Boston Properties, Inc. | | |
| REIT | 945,986 | 45,123 |
| Ameriprise Financial, Inc. | 1,740,203 | 42,235 |
| Equity Residential REIT | 1,870,105 | 41,572 |
| The Principal Financial | | |
| Group, Inc. | 2,121,670 | 39,972 |
| HCP, Inc. REIT | 1,860,769 | 39,430 |
| Unum Group | 2,262,387 | 35,881 |
| People’s United | | |
| Financial Inc. | 2,378,560 | 35,773 |
| Fifth Third Bancorp | 5,018,763 | 35,633 |
| Lincoln National Corp. | 2,022,096 | 34,800 |
| Host Hotels & | | |
| Resorts Inc. REIT | 4,105,837 | 34,448 |
| Moody’s Corp. | 1,303,896 | 34,358 |
| Discover Financial | | |
| Services | 3,288,932 | 33,777 |
| Plum Creek Timber | | |
| Co. Inc. REIT | 1,122,993 | 33,443 |
* | SLM Corp. | 3,192,659 | 32,789 |
| Regions Financial Corp. | 7,888,035 | 31,868 |
| Ventas, Inc. REIT | 1,066,579 | 31,848 |
| Avalonbay | | |
| Communities, Inc. REIT | 545,666 | 30,525 |
^ | M & T Bank Corp. | 558,593 | 28,449 |
| XL Capital Ltd. Class A | 2,331,580 | 26,720 |
| The Hartford Financial | | |
| Services Group Inc. | 2,222,582 | 26,382 |
* | Leucadia National Corp. | 1,235,007 | 26,046 |
| Health Care Inc. REIT | 757,376 | 25,826 |
| KeyCorp | 4,834,773 | 25,334 |
| Cincinnati Financial Corp. | 1,107,231 | 24,747 |
| ProLogis REIT | 3,015,593 | 24,306 |
| Legg Mason Inc. | 977,465 | 23,831 |
| Kimco Realty Corp. REIT | 2,210,580 | 22,216 |
| Comerica, Inc. | 1,029,021 | 21,764 |
| Torchmark Corp. | 575,100 | 21,302 |
^ | American International | | |
| Group, Inc. | 18,321,366 | 21,253 |
| Genworth Financial Inc. | 2,949,764 | 20,619 |
* | Nasdaq OMX Group, Inc. | 938,759 | 20,005 |
| Assurant, Inc. | 801,470 | 19,307 |
| First Horizon | | |
| National Corp. | 1,468,136 | 17,618 |
| Huntington | | |
| Bancshares Inc. | 3,698,564 | 15,460 |
* | CB Richard Ellis | | |
| Group, Inc. | 1,609,891 | 15,069 |
| Federated Investors, Inc. | 610,041 | 14,696 |
| Janus Capital Group Inc. | 1,098,260 | 12,520 |
| Marshall & Ilsley Corp. | 2,396,751 | 11,504 |
| Zions Bancorp | 785,585 | 9,081 |
* | E*TRADE Financial Corp. | 6,760,054 | 8,653 |
| Apartment Investment & | | |
| Management Co. | | |
| Class A REIT | 796,706 | 7,051 |
| CIT Group Inc. | 2,640,442 | 5,677 |
* | MBIA, Inc. | 1,162,482 | 5,034 |
| | | 7,424,515 |
Health Care (13.9%) | | |
| Johnson & Johnson | 18,815,303 | 1,068,709 |
| | | | |
| Pfizer Inc. | 46,076,032 | 691,140 |
| Abbott Laboratories | 10,548,066 | 496,181 |
| Wyeth | 9,105,760 | 413,310 |
| Merck & Co., Inc. | 14,398,401 | 402,579 |
* | Amgen Inc. | 6,912,725 | 365,960 |
* | Gilead Sciences, Inc. | 6,189,079 | 289,896 |
10
Institutional Index Fund
| | | Market |
| | | Value• |
| | Shares | ($000) |
| Schering-Plough Corp. | 11,118,610 | 279,299 |
| Bristol-Myers Squibb Co. | 13,525,937 | 274,712 |
| Medtronic, Inc. | 7,635,489 | 266,402 |
| Eli Lilly & Co. | 6,904,291 | 239,165 |
| Baxter International, Inc. | 4,131,287 | 218,793 |
| UnitedHealth Group Inc. | 8,122,301 | 202,895 |
* | WellPoint Inc. | 3,309,293 | 168,410 |
* | Celgene Corp. | 3,143,087 | 150,365 |
* | Medco Health | | |
| Solutions, Inc. | 3,293,781 | 150,229 |
* | Express Scripts Inc. | 1,851,741 | 127,307 |
| Becton, Dickinson & Co. | 1,635,687 | 116,641 |
* | Thermo Fisher | | |
| Scientific, Inc. | 2,856,462 | 116,458 |
* | Boston Scientific Corp. | 10,286,408 | 104,304 |
* | Genzyme Corp. | 1,841,472 | 102,515 |
| Allergan, Inc. | 2,099,910 | 99,914 |
* | St. Jude Medical, Inc. | 2,365,075 | 97,205 |
* | Biogen Idec Inc. | 1,970,471 | 88,967 |
| McKesson Corp. | 1,853,459 | 81,552 |
| Aetna Inc. | 3,051,709 | 76,445 |
| Cardinal Health, Inc. | 2,458,796 | 75,116 |
| Stryker Corp. | 1,627,266 | 64,668 |
* | Zimmer Holdings, Inc. | 1,468,911 | 62,576 |
| Quest Diagnostics, Inc. | 1,025,355 | 57,861 |
* | Forest Laboratories, Inc. | 2,059,698 | 51,719 |
| C.R. Bard, Inc. | 677,396 | 50,432 |
* | Laboratory Corp. of | | |
| America Holdings | 739,622 | 50,139 |
* | Life Technologies Corp. | 1,192,901 | 49,768 |
| CIGNA Corp. | 1,862,804 | 44,875 |
* | Intuitive Surgical, Inc. | 258,576 | 42,319 |
* | Hospira, Inc. | 1,095,930 | 42,215 |
* | Humana Inc. | 1,158,366 | 37,369 |
| AmerisourceBergen Corp. | 2,074,926 | 36,809 |
* | DaVita, Inc. | 707,512 | 34,994 |
* | Waters Corp. | 660,868 | 34,015 |
| DENTSPLY | | |
| International Inc. | 1,012,465 | 30,900 |
* | Varian Medical | | |
| Systems, Inc. | 856,207 | 30,087 |
* | Cephalon, Inc. | 502,926 | 28,491 |
* | Mylan Inc. | 2,083,289 | 27,187 |
* | Millipore Corp. | 378,614 | 26,582 |
* | Watson | | |
| Pharmaceuticals, Inc. | 717,803 | 24,183 |
* | Coventry Health Care Inc. | 1,013,839 | 18,969 |
* | King Pharmaceuticals, Inc. | 1,690,086 | 16,276 |
| IMS Health, Inc. | 1,236,762 | 15,707 |
| PerkinElmer, Inc. | 792,790 | 13,795 |
* | Patterson Companies, Inc. | 623,003 | 13,519 |
* | Tenet Healthcare Corp. | 2,830,935 | 7,983 |
| | | 7,677,907 |
Industrials (9.7%) | | |
| General Electric Co. | 72,306,787 | 847,436 |
| United Parcel Service, Inc. | 6,794,381 | 339,651 |
| United Technologies Corp. | 6,431,949 | 334,204 |
| 3M Co. | 4,741,475 | 284,963 |
| The Boeing Co. | 4,958,685 | 210,744 |
| Lockheed Martin Corp. | 2,230,614 | 179,899 |
| Union Pacific Corp. | 3,442,241 | 179,203 |
| Emerson Electric Co. | 5,131,059 | 166,246 |
| Honeywell | | |
| International Inc. | 5,079,270 | 159,489 |
| General Dynamics Corp. | 2,629,098 | 145,626 |
| Burlington Northern | | |
| Santa Fe Corp. | 1,901,271 | 139,819 |
| Caterpillar, Inc. | 4,108,679 | 135,751 |
| Raytheon Co. | 2,669,961 | 118,626 |
| FedEx Corp. | 2,125,696 | 118,231 |
| Deere & Co. | 2,886,745 | 115,325 |
| Danaher Corp. | 1,741,242 | 107,504 |
| Northrop Grumman Corp. | 2,208,796 | 100,898 |
| Illinois Tool Works, Inc. | 2,625,423 | 98,033 |
| Waste Management, Inc. | 3,359,713 | 94,610 |
| Norfolk Southern Corp. | 2,506,332 | 94,414 |
| CSX Corp. | 2,673,096 | 92,569 |
| PACCAR, Inc. | 2,480,051 | 80,626 |
| Precision Castparts Corp. | 956,479 | 69,852 |
| Fluor Corp. | 1,228,151 | 62,992 |
| C.H. Robinson | | |
| Worldwide Inc. | 1,158,945 | 60,439 |
| ITT Industries, Inc. | 1,242,859 | 55,307 |
| L-3 Communications | | |
| Holdings, Inc. | 795,941 | 55,222 |
| Republic Services, Inc. | | |
| Class A | 2,198,796 | 53,673 |
| Eaton Corp. | 1,130,893 | 50,449 |
| Cummins Inc. | 1,378,246 | 48,528 |
| Expeditors International | | |
| of Washington, Inc. | 1,449,754 | 48,335 |
| Parker Hannifin Corp. | 1,096,154 | 47,091 |
| Rockwell Collins, Inc. | 1,081,600 | 45,135 |
| Goodrich Corp. | 845,841 | 42,267 |
| Dover Corp. | 1,270,371 | 42,037 |
* | Jacobs Engineering | | |
| Group Inc. | 841,280 | 35,409 |
| Cooper Industries, Inc. | | |
| Class A | 1,138,551 | 35,352 |
* | Iron Mountain, Inc. | 1,227,349 | 35,286 |
| W.W. Grainger, Inc. | 424,982 | 34,798 |
| Southwest Airlines Co. | 5,059,195 | 34,048 |
| | | | |
| Rockwell Automation, Inc. | 968,643 | 31,113 |
| Pitney Bowes, Inc. | 1,409,544 | 30,911 |
* | Quanta Services, Inc. | 1,331,550 | 30,799 |
* | Stericycle, Inc. | 581,092 | 29,944 |
| The Dun & Bradstreet Corp. | 363,497 | 29,520 |
| Fastenal Co. | 882,555 | 29,274 |
| Flowserve Corp. | 382,681 | 26,715 |
| Robert Half | | |
| International, Inc. | 1,040,551 | 24,578 |
| Masco Corp. | 2,446,317 | 23,436 |
11
Institutional Index Fund
| | | Market |
| | | Value• |
| | Shares | ($000) |
| Equifax, Inc. | 860,713 | 22,465 |
| Pall Corp. | 804,129 | 21,358 |
| Cintas Corp. | 894,194 | 20,423 |
| Avery Dennison Corp. | 767,373 | 19,706 |
| Textron, Inc. | 1,830,425 | 17,682 |
| R.R. Donnelley & Sons Co. | 1,396,493 | 16,227 |
| Ryder System, Inc. | 379,889 | 10,606 |
* | Monster Worldwide Inc. | 871,592 | 10,294 |
| The Manitowoc Co., Inc. | 886,530 | 4,663 |
| Ingersoll-Rand Co. | 81,095 | 1,695 |
* | Raytheon Co. | | |
| Warrants Exp. 6/16/11 | 20,998 | 197 |
| | | 5,401,693 |
Information Technology (18.3%) | |
| Microsoft Corp. | 52,260,637 | 1,242,235 |
| International Business | | |
| Machines Corp. | 9,022,654 | 942,145 |
* | Apple Inc. | 6,091,423 | 867,601 |
* | Cisco Systems, Inc. | 39,383,824 | 734,114 |
* | Google Inc. | 1,639,527 | 691,208 |
| Intel Corp. | 38,135,078 | 631,135 |
| Hewlett-Packard Co. | 16,293,725 | 629,752 |
| Oracle Corp. | 25,860,841 | 553,939 |
| QUALCOMM Inc. | 11,289,170 | 510,270 |
| Texas Instruments, Inc. | 8,693,144 | 185,164 |
* | EMC Corp. | 13,745,420 | 180,065 |
| Corning, Inc. | 10,610,348 | 170,402 |
* | Dell Inc. | 11,874,701 | 163,040 |
* | Yahoo! Inc. | 9,524,882 | 149,160 |
* | eBay Inc. | 7,379,669 | 126,414 |
| Automatic Data | | |
| Processing, Inc. | 3,425,445 | 121,398 |
| Motorola, Inc. | 15,653,601 | 103,783 |
* | Adobe Systems, Inc. | 3,576,329 | 101,210 |
| Applied Materials, Inc. | 9,102,619 | 99,856 |
* | Symantec Corp. | 5,592,671 | 87,022 |
* | Juniper Networks, Inc. | 3,572,488 | 84,311 |
| MasterCard, Inc. Class A | 494,714 | 82,771 |
| Western Union Co. | 4,788,844 | 78,537 |
* | Broadcom Corp. | 2,918,756 | 72,356 |
* | Intuit, Inc. | 2,206,145 | 62,125 |
| Paychex, Inc. | 2,191,746 | 55,232 |
* | Cognizant Technology | | |
| Solutions Corp. | 1,994,909 | 53,264 |
| Analog Devices, Inc. | 1,988,903 | 49,285 |
* | Fiserv, Inc. | 1,062,223 | 48,544 |
* | Electronic Arts Inc. | 2,205,504 | 47,904 |
* | Agilent Technologies, Inc. | 2,344,776 | 47,622 |
* | Sun Microsystems, Inc. | 5,096,118 | 46,986 |
| CA, Inc. | 2,692,772 | 46,935 |
* | Computer Sciences Corp. | 1,034,620 | 45,834 |
* | McAfee Inc. | 1,061,095 | 44,768 |
* | NetApp, Inc. | 2,258,692 | 44,541 |
* | BMC Software, Inc. | 1,262,883 | 42,673 |
* | NVIDIA Corp. | 3,730,018 | 42,112 |
* | Citrix Systems, Inc. | 1,235,926 | 39,414 |
| Xilinx, Inc. | 1,881,679 | 38,499 |
| Xerox Corp. | 5,905,751 | 38,269 |
| Amphenol Corp. Class A | 1,169,812 | 37,013 |
* | Western Digital Corp. | 1,359,303 | 36,021 |
| Linear Technology Corp. | 1,517,955 | 35,444 |
| Altera Corp. | 2,003,921 | 32,624 |
* | Affiliated Computer | | |
| Services, Inc. Class A | 666,565 | 29,609 |
* | Autodesk, Inc. | 1,559,933 | 29,607 |
| KLA-Tencor Corp. | 1,160,241 | 29,296 |
* | Micron Technology, Inc. | 5,782,624 | 29,260 |
| Microchip Technology, Inc. | 1,246,248 | 28,103 |
* | salesforce.com, inc. | 723,859 | 27,630 |
* | Teradata Corp. | 1,179,153 | 27,628 |
* | MEMC Electronic | | |
| Materials, Inc. | 1,526,316 | 27,184 |
| Fidelity National | | |
| Information Services, Inc. | 1,306,249 | 26,073 |
| Harris Corp. | 910,458 | 25,821 |
* | VeriSign, Inc. | 1,314,194 | 24,286 |
* | FLIR Systems, Inc. | 1,027,457 | 23,179 |
* | SanDisk Corp. | 1,546,068 | 22,712 |
* | Akamai Technologies, Inc. | 1,176,801 | 22,571 |
* | LSI Corp. | 4,416,141 | 20,138 |
| Total System | | |
| Services, Inc. | 1,342,494 | 17,976 |
| National | | |
| Semiconductor Corp. | 1,333,164 | 16,731 |
* | Tellabs, Inc. | 2,696,179 | 15,449 |
* | Advanced Micro | | |
| Devices, Inc. | 3,814,857 | 14,763 |
| Molex, Inc. | 944,344 | 14,685 |
* | Compuware Corp. | 1,679,644 | 11,522 |
* | Novellus Systems, Inc. | 663,131 | 11,074 |
| Jabil Circuit, Inc. | 1,454,390 | 10,792 |
* | Novell, Inc. | 2,347,331 | 10,633 |
* | QLogic Corp. | 825,844 | 10,472 |
* | Tyco Electronics Ltd. | 545,228 | 10,136 |
* | JDS Uniphase Corp. | 1,501,759 | 8,590 |
* | Lexmark International, Inc. | 530,003 | 8,401 |
* | Teradyne, Inc. | 1,172,946 | 8,046 |
* | Convergys Corp. | 832,386 | 7,725 |
* | Ciena Corp. | 618,418 | 6,401 |
| | | 10,119,490 |
Materials (3.2%) | | |
| Monsanto Co. | 3,726,484 | 277,027 |
| E.I. du Pont de | | |
| Nemours & Co. | 6,169,979 | 158,075 |
| Praxair, Inc. | 2,099,541 | 149,214 |
| Freeport-McMoRan | | |
| Copper & Gold, Inc. | | |
| Class B | 2,811,675 | 140,893 |
| Newmont Mining Corp. | | |
| (Holding Co.) | 3,341,991 | 136,587 |
| Dow Chemical Co. | 7,346,837 | 118,578 |
| Nucor Corp. | 2,145,907 | 95,343 |
12
Institutional Index Fund
| | | Market |
| | | Value• |
| | Shares | ($000) |
| Air Products & | | |
| Chemicals, Inc. | 1,432,902 | 92,551 |
| Alcoa Inc. | 6,652,964 | 68,725 |
| PPG Industries, Inc. | 1,123,427 | 49,319 |
| Ecolab, Inc. | 1,146,657 | 44,708 |
| International Paper Co. | 2,951,609 | 44,658 |
| Weyerhaeuser Co. | 1,443,344 | 43,921 |
| Sigma-Aldrich Corp. | 833,818 | 41,324 |
| Vulcan Materials Co. | 832,217 | 35,869 |
| United States Steel Corp. | 978,970 | 34,988 |
* | Owens-Illinois, Inc. | 1,149,354 | 32,193 |
| Ball Corp. | 641,903 | 28,988 |
| CF Industries Holdings, Inc. | 330,575 | 24,509 |
| Allegheny Technologies Inc. | 668,063 | 23,336 |
| Sealed Air Corp. | 1,080,980 | 19,944 |
* | Pactiv Corp. | 901,167 | 19,555 |
| MeadWestvaco Corp. | 1,164,142 | 19,104 |
| Eastman Chemical Co. | 494,357 | 18,736 |
| International Flavors & | | |
| Fragrances, Inc. | 535,912 | 17,535 |
| Bemis Co., Inc. | 680,559 | 17,150 |
| AK Steel Holding Corp. | 755,335 | 14,495 |
| Titanium Metals Corp. | 579,974 | 5,330 |
| | | 1,772,655 |
Other (0.1%) | | |
2 | Miscellaneous Securities | | 40,123 |
| | | |
Telecommunication Services (3.5%) | |
| AT&T Inc. | 40,285,846 | 1,000,701 |
| Verizon | | |
| Communications Inc. | 19,395,867 | 596,035 |
* | Sprint Nextel Corp. | 19,606,527 | 94,307 |
* | American Tower Corp. | | |
| Class A | 2,715,704 | 85,626 |
| Qwest Communications | | |
| International Inc. | 10,102,609 | 41,926 |
| Embarq Corp. | 973,735 | 40,955 |
| Windstream Corp. | 3,005,368 | 25,125 |
* | MetroPCS | | |
| Communications Inc. | 1,725,290 | 22,964 |
| CenturyTel, Inc. | 688,155 | 21,126 |
| Frontier | | |
| Communications Corp. | 2,124,126 | 15,166 |
| | | 1,943,931 |
Utilities (4.1%) | | |
| Exelon Corp. | 4,498,180 | 230,352 |
| Southern Co. | 5,342,709 | 166,479 |
| FPL Group, Inc. | 2,805,055 | 159,495 |
| Dominion Resources, Inc. | 4,028,477 | 134,632 |
| Duke Energy Corp. | 8,788,954 | 128,231 |
| Public Service Enterprise | | |
| Group, Inc. | 3,455,087 | 112,739 |
| Entergy Corp. | 1,339,107 | 103,807 |
| PG&E Corp. | 2,515,169 | 96,683 |
| American Electric | | |
| Power Co., Inc. | 3,255,621 | 94,055 |
| PPL Corp. | 2,567,950 | 84,640 |
| Sempra Energy | 1,668,202 | 82,793 |
| FirstEnergy Corp. | 2,081,621 | 80,663 |
| Progress Energy, Inc. | 1,905,473 | 72,084 |
| Consolidated Edison Inc. | 1,873,799 | 70,117 |
| Edison International | 2,224,867 | 69,994 |
| Xcel Energy, Inc. | 3,111,695 | 57,286 |
* | AES Corp. | 4,546,082 | 52,780 |
| Questar Corp. | 1,188,289 | 36,908 |
| Ameren Corp. | 1,455,355 | 36,224 |
| Constellation Energy | | |
| Group, Inc. | 1,360,371 | 36,159 |
| DTE Energy Co. | 1,116,804 | 35,738 |
| Wisconsin Energy Corp. | 798,499 | 32,507 |
| EQT Corp. | 893,978 | 31,209 |
| Allegheny Energy, Inc. | 1,156,940 | 29,675 |
| SCANA Corp. | 830,224 | 26,957 |
| Northeast Utilities | 1,196,046 | 26,684 |
| CenterPoint Energy Inc. | 2,379,994 | 26,370 |
| NiSource, Inc. | 1,875,423 | 21,867 |
| Pinnacle West Capital Corp. | 688,049 | 20,745 |
| Pepco Holdings, Inc. | 1,499,336 | 20,151 |
| CMS Energy Corp. | 1,549,306 | 18,716 |
| TECO Energy, Inc. | 1,450,101 | 17,300 |
| Integrys Energy Group, Inc. | 520,515 | 15,610 |
| Nicor Inc. | 307,877 | 10,659 |
* | Dynegy, Inc. | 3,438,184 | 7,805 |
| | | 2,248,114 |
Total Common Stocks | | |
(Cost $63,717,362) | | 54,954,934 |
Temporary Cash Investments (0.9%)1 | |
Money Market Fund (0.8%) | |
3,4 | Vanguard Market | | |
| Liquidity Fund, 0.395% | 466,371,674 | 466,372 |
| | | | | |
| | Face | |
| | Amount | |
| | ($000) | |
U.S. Government and Agency Obligations (0.1%) |
5,6 | Federal National | | |
| Mortgage Assn., | | |
| 0.541%, 7/30/09 | 30,000 | 29,996 |
5,6 | Federal Home Loan | | |
| Mortgage Corp., | | |
| 0.210%, 9/28/09 | 12,000 | 11,994 |
5,6 | Federal National | | |
| Mortgage Assn., | | |
| 0.290%, 10/29/09 | 5,000 | 4,996 |
| | | 46,986 |
Total Temporary Cash Investments | |
(Cost $513,347) | | 513,358 |
Total Investments (100.2%) | | |
(Cost $64,230,709) | | 55,468,292 |
13
Institutional Index Fund
| Market |
| Value• |
| ($000) |
Other Assets and Liabilities (–0.2%) | |
Other Assets | 310,688 |
Liabilities4 | (415,786) |
| (105,098) |
Net Assets (100%) | 55,363,194 |
At June 30, 2009, net assets consisted of: |
| Amount |
| ($000) |
Paid-in Capital | 68,103,577 |
Undistributed Net Investment Income | 28,176 |
Accumulated Net Realized Losses | (3,997,384) |
Unrealized Appreciation (Depreciation) | |
Investment Securities | (8,762,417) |
Futures Contracts | (8,758) |
Net Assets | 55,363,194 |
| |
| |
Institutional Shares—Net Assets | |
Applicable to 417,502,342 outstanding | |
$.001 par value shares of beneficial | |
interest (unlimited authorization) | 35,143,916 |
Net Asset Value Per Share— | |
Institutional Shares | $84.18 |
Institutional Plus Shares—Net Assets | |
Applicable to 240,195,027 outstanding | |
$.001 par value shares of beneficial | |
interest (unlimited authorization) | 20,219,278 |
Net Asset Value Per Share— | |
Institutional Plus Shares | $84.18 |
• See Note A in Notes to Financial Statements.
| • | Non-income-producing security. |
^ Part of security position is on loan to broker-dealers. The total value of securities on loan is
$122,879,000.
1 The fund invests a portion of its cash reserves in equity markets through the use of index futures contracts. After giving effect to futures investments, the fund’s effective common stock and temporary cash investment positions represent 100.0% and 0.2%, respectively, of net assets.
2 Securities representing up to 5% of the market value of unaffiliated securities are permitted to be combined and reported as “miscellaneous securities” provided that they have been held for less than one year and not previously reported by name.
3 Affiliated money market fund available only to Vanguard funds and certain trusts and accounts managed by Vanguard. Rate shown is the 7-day yield.
4 Includes $152,045,000 of collateral received for securities on loan.
5 The issuer operates under a congressional charter; its securities are not backed by the full faith and credit of the U.S. government.
6 Securities with a value of $46,986,000 have been segregated as initial margin for open futures contracts.
REIT—Real Estate Investment Trust.
See accompanying Notes, which are an integral part of the Financial Statements.
14
Institutional Index Fund
Statement of Operations
| Six Months Ended |
| June 30, 2009 |
| ($000) |
Investment Income | |
Income | |
Dividends | 635,550 |
Interest1 | 1,347 |
Security Lending | 22,299 |
Total Income | 659,196 |
Expenses | |
The Vanguard Group—Note B | |
Management and Administrative—Institutional Shares | 7,789 |
Management and Administrative—Institutional Plus Shares | 2,210 |
Total Expenses | 9,999 |
Net Investment Income | 649,197 |
Realized Net Gain (Loss) | |
Investment Securities Sold | 169,746 |
Futures Contracts | 31,232 |
Realized Net Gain (Loss) | 200,978 |
Change in Unrealized Appreciation (Depreciation) | |
Investment Securities | 1,082,731 |
Futures Contracts | (21,143) |
Change in Unrealized Appreciation (Depreciation) | 1,061,588 |
Net Increase (Decrease) in Net Assets Resulting from Operations | 1,911,763 |
1 Interest income from an affiliated company of the fund was $984,000.
| See accompanying Notes, which are an integral part of the Financial Statements. |
15
Institutional Index Fund
Statement of Changes in Net Assets
| Six Months Ended | Year Ended |
| June 30, | December 31, |
| 2009 | 2008 |
| ($000) | ($000) |
Increase (Decrease) in Net Assets | | |
Operations | | |
Net Investment Income | 649,197 | 1,436,285 |
Realized Net Gain (Loss) | 200,978 | (732,143) |
Change in Unrealized Appreciation (Depreciation) | 1,061,588 | (28,467,348) |
Net Increase (Decrease) in Net Assets Resulting from Operations | 1,911,763 | (27,763,206) |
Distributions | | |
Net Investment Income | | |
Institutional Shares | (403,017) | (911,292) |
Institutional Plus Shares | (227,618) | (524,799) |
Realized Capital Gain | | |
Institutional Shares | — | — |
Institutional Plus Shares | — | — |
Total Distributions | (630,635) | (1,436,091) |
Capital Share Transactions | | |
Institutional Shares | 2,827,039 | 4,295,881 |
Institutional Plus Shares | 2,068,268 | 2,467,315 |
Net Increase (Decrease) from Capital Share Transactions | 4,895,307 | 6,763,196 |
Total Increase (Decrease) | 6,176,435 | (22,436,101) |
Net Assets | | �� |
Beginning of Period | 49,186,759 | 71,622,860 |
End of Period1 | 55,363,194 | 49,186,759 |
1 Net Assets—End of Period includes undistributed net investment income of $28,176,000
and $9,614,000.
See accompanying Notes, which are an integral part of the Financial Statements.
16
Institutional Index Fund
Financial Highlights
Institutional Shares | | | | | | |
| Six Months | | | | | |
| Ended | | | | | |
For a Share Outstanding | June 30, | | | Year Ended December 31, |
Throughout Each Period | 2009 | 2008 | 2007 | 2006 | 2005 | 2004 |
Net Asset Value, Beginning of Period | $82.54 | $134.14 | $129.59 | $114.01 | $110.70 | $101.78 |
Investment Operations | | | | | | |
Net Investment Income | 1.017 | 2.521 | 2.560 | 2.240 | 2.050 | 2.030 |
Net Realized and Unrealized Gain (Loss) | | | | | | |
on Investments | 1.613 | (51.599) | 4.550 | 15.580 | 3.310 | 8.910 |
Total from Investment Operations | 2.630 | (49.078) | 7.110 | 17.820 | 5.360 | 10.940 |
Distributions | | | | | | |
Dividends from Net Investment Income | (.990) | (2.522) | (2.560) | (2.240) | (2.050) | (2.020) |
Distributions from Realized Capital Gains | — | — | — | — | — | — |
Total Distributions | (.990) | (2.522) | (2.560) | (2.240) | (2.050) | (2.020) |
Net Asset Value, End of Period | $84.18 | $82.54 | $134.14 | $129.59 | $114.01 | $110.70 |
| | | | | | |
Total Return | 3.27% | –36.95% | 5.47% | 15.78% | 4.91% | 10.86% |
| | | | | | |
Ratios/Supplemental Data | | | | | | |
Net Assets, End of Period (Millions) | $35,144 | $31,543 | $45,847 | $45,243 | $39,154 | $34,990 |
Ratio of Total Expenses to | | | | | | |
Average Net Assets | 0.050%1 | 0.050% | 0.050% | 0.050% | 0.050% | 0.050% |
Ratio of Net Investment Income to | | | | | | |
Average Net Assets | 2.65%1 | 2.28% | 1.90% | 1.87% | 1.87% | 2.00% |
Portfolio Turnover Rate2 | 5%1 | 7% | 7% | 8% | 8% | 5% |
| | | | | | | | |
1 Annualized.
2 Excludes the value of portfolio securities received or delivered as a result of in-kind purchases
| or redemptions of the fund’s capital shares. |
| See accompanying Notes, which are an integral part of the Financial Statements. |
17
Institutional Index Fund
Financial Highlights
Institutional Plus Shares | | | | | | |
| Six Months | | | | | |
| Ended | | | | | |
For a Share Outstanding | June 30, | | | Year Ended December 31, |
Throughout Each Period | 2009 | 2008 | 2007 | 2006 | 2005 | 2004 |
Net Asset Value, Beginning of Period | $82.54 | $134.14 | $129.59 | $114.01 | $110.71 | $101.78 |
Investment Operations | | | | | | |
Net Investment Income | 1.026 | 2.548 | 2.597 | 2.269 | 2.068 | 2.051 |
Net Realized and Unrealized Gain (Loss) on Investments | 1.613 | (51.598) | 4.548 | 15.580 | 3.310 | 8.925 |
Total from Investment Operations | 2.639 | (49.050) | 7.145 | 17.849 | 5.378 | 10.976 |
Distributions | | | | | | |
Dividends from Net Investment Income | (.999) | (2.550) | (2.595) | (2.269) | (2.078) | (2.046) |
Distributions from Realized Capital Gains | — | — | — | — | — | — |
Total Distributions | (.999) | (2.550) | (2.595) | (2.269) | (2.078) | (2.046) |
Net Asset Value, End of Period | $84.18 | $82.54 | $134.14 | $129.59 | $114.01 | $110.71 |
| | | | | | |
Total Return | 3.29% | –36.94% | 5.50% | 15.81% | 4.93% | 10.90% |
| | | | | | |
Ratios/Supplemental Data | | | | | | |
Net Assets, End of Period (Millions) | $20,219 | $17,643 | $25,776 | $20,294 | $17,095 | $13,493 |
Ratio of Total Expenses to | | | | | | |
Average Net Assets | 0.025%1 | 0.025% | 0.025% | 0.025% | 0.025% | 0.025% |
Ratio of Net Investment Income to | | | | | | |
Average Net Assets | 2.68%1 | 2.30% | 1.93% | 1.90% | 1.90% | 2.02% |
Portfolio Turnover Rate2 | 5%1 | 7% | 7% | 8% | 8% | 5% |
| | | | | | | | |
1 Annualized.
2 Excludes the value of portfolio securities received or delivered as a result of in-kind purchases or redemptions of the fund’s capital shares.
See accompanying Notes, which are an integral part of the Financial Statements.
18
Institutional Index Fund
Notes to Financial Statements
Vanguard Institutional Index Fund is registered under the Investment Company Act of 1940 as an open-end investment company, or mutual fund. The fund offers two classes of shares, Institutional Shares and Institutional Plus Shares, to investors who invest minimum amounts of $5 million and $200 million, respectively.
A. The following significant accounting policies conform to generally accepted accounting principles for U.S. mutual funds. The fund consistently follows such policies in preparing its financial statements.
1. Security Valuation: Securities are valued as of the close of trading on the New York Stock Exchange (generally 4 p.m., Eastern time) on the valuation date. Equity securities are valued at the latest quoted sales prices or official closing prices taken from the primary market in which each security trades; such securities not traded on the valuation date are valued at the mean of the latest quoted bid and asked prices. Securities for which market quotations are not readily available, or whose values have been materially affected by events occurring before the fund’s pricing time but after the close of the securities’ primary markets, are valued by methods deemed by the board of trustees to represent fair value. Investments in Vanguard Market Liquidity Fund are valued at that fund’s net asset value. Temporary cash investments acquired over 60 days to maturity are valued using the latest bid prices or using valuations based on a matrix system (which considers such factors as security prices, yields, maturities, and ratings), both as furnished by independent pricing services. Other temporary cash investments are valued at amortized cost, which approximates market value.
2. Futures Contracts: The fund uses index futures contracts to a limited extent, with the objectives of maintaining full exposure to the stock market, enhancing returns, maintaining liquidity, and minimizing transaction costs. The fund may purchase futures contracts to immediately invest incoming cash in the market, or sell futures in response to cash outflows, thereby simulating a fully invested position in the underlying index while maintaining a cash balance for liquidity. The fund may seek to enhance returns by using futures contracts instead of the underlying securities when futures are believed to be priced more attractively than the underlying securities. The primary risks associated with the use of futures contracts are imperfect correlation between changes in market values of stocks held by the fund and the prices of futures contracts, and the possibility of an illiquid market.
Futures contracts are valued at their quoted daily settlement prices. The aggregate principal amounts of the contracts are not recorded in the Statement of Net Assets. Fluctuations in the value of the contracts are recorded in the Statement of Net Assets as an asset (liability) and in the Statement of Operations as unrealized appreciation (depreciation) until the contracts are closed, when they are recorded as realized futures gains (losses).
3. Federal Income Taxes: The fund intends to continue to qualify as a regulated investment company and distribute all of its taxable income. Management has analyzed the fund’s tax positions taken on federal income tax returns for all open tax years (tax years ended December 31, 2005–2008) and for the period ended June 30, 2009, and has concluded that no provision for federal income tax is required in the fund’s financial statements.
19
Institutional Index Fund
4. Distributions: Distributions to shareholders are recorded on the ex-dividend date.
5. Security Lending: The fund may lend its securities to qualified institutional borrowers to earn additional income. Security loans are required to be secured at all times by collateral at least equal to the market value of securities loaned. The fund invests cash collateral received in Vanguard Market Liquidity Fund, and records a liability for the return of the collateral, during the period the securities are on loan. Security lending income represents the income earned on investing cash collateral, less expenses associated with the loan.
6. Other: Dividend income is recorded on the ex-dividend date. Interest income includes income distributions received from Vanguard Market Liquidity Fund and is accrued daily. Security transactions are accounted for on the date securities are bought or sold. Costs used to determine realized gains (losses) on the sale of investment securities are those of the specific securities sold. Class-specific shareholder servicing fees are charged to each class at the contractual rate. Income, expenses not attributable to a specific class, and realized and unrealized gains and losses on investments are allocated to each class of shares based on its relative net assets.
B. The Vanguard Group provides investment advisory, corporate management, administrative, marketing, and distribution services and pays for all other operating expenses, except for taxes, in return for a fee calculated at an annual percentage rate of the average net assets of the fund, or, for shareholder services, each class of shares. The fund’s trustees and officers are also directors and officers of Vanguard.
C. Various inputs may be used to determine the value of the fund’s investments. These inputs are summarized in three broad levels for financial statement purposes. The inputs or methodologies used to value securities are not necessarily an indication of the risk associated with investing in those securities.
Level 1—Quoted prices in active markets for identical securities.
Level 2—Other significant observable inputs (including quoted prices for similar securities, interest rates, prepayment speeds, credit risk, etc.).
Level 3—Significant unobservable inputs (including the fund’s own assumptions used to determine the fair value of investments).
The following table summarizes the fund’s investments as of June 30, 2009, based on the inputs used to value them:
| Level 1 | Level 2 | Level 3 |
Investments | ($000) | ($000) | ($000) |
Common Stocks | 54,954,934 | — | — |
Temporary Cash Investments | 466,372 | 46,986 | — |
Futures Contracts—Liabilities1 | (2,529) | — | — |
Total | 55,418,777 | 46,986 | — |
1 Represents variation margin on the last day of the reporting period. |
20
Institutional Index Fund
D. At June 30, 2009, the aggregate settlement value of open futures contracts and the related unrealized appreciation (depreciation) were:
| | | | ($000) |
| | Number of | Aggregate | Unrealized |
| | Long (Short) | Settlement | Appreciation |
Futures Contracts | Expiration | Contracts | Value | (Depreciation) |
S&P 500 Index | September 2009 | 1,775 | 406,253 | (8,758) |
Unrealized appreciation (depreciation) on open futures contracts is required to be treated as realized gain (loss) for tax purposes.
E. Distributions are determined on a tax basis and may differ from net investment income and realized capital gains for financial reporting purposes. Differences may be permanent or temporary. Permanent differences are reclassified among capital accounts in the financial statements to reflect their tax character. Temporary differences arise when certain items of income, expense, gain, or loss are recognized in different periods for financial statement and tax purposes; these differences will reverse at some time in the future. Differences in classification may also result from the treatment of short-term gains as ordinary income for tax purposes.
During the six months ended June 30, 2009, the fund realized $195,241,000 of net capital gains resulting from in-kind redemptions—in which shareholders exchanged fund shares for securities held by the fund rather than for cash. Because such gains are not taxable to the fund, and are not distributed to shareholders, they have been reclassified from accumulated net realized losses to paid-in capital.
The fund’s tax-basis capital gains and losses are determined only at the end of each fiscal year. For tax purposes, at December 31, 2008, the fund had available realized losses of $3,635,716,000 to offset future net capital gains of $385,639,000 through December 31, 2009, $1,269,960,000 through December 31, 2010, $98,196,000 through December 31, 2011, $481,996,000 through December 31, 2013, $663,742,000 through December 31, 2014, $54,429,000 through December 31, 2015, $656,585,000 through December 31, 2016, and $25,169,000 through December 31, 2017. The fund will use these capital losses to offset net taxable capital gains, if any, realized during the year ending December 31, 2009; should the fund realize net capital losses for the year, the losses will be added to the loss carryforward balances above.
At June 30, 2009, the cost of investment securities for tax purposes was $64,230,709,000. Net unrealized depreciation of investment securities for tax purposes was $8,762,417,000, consisting of unrealized gains of $6,738,257,000 on securities that had risen in value since their purchase and $15,500,674,000 in unrealized losses on securities that had fallen in value since their purchase.
21
Institutional Index Fund
F. During the six months ended June 30, 2009, the fund purchased $6,438,239,000 of investment securities and sold $1,481,825,000 of investment securities, other than temporary cash investments.
G. Capital share transactions for each class of shares were:
| Six Months Ended | Year Ended |
| June 30, 2009 | December 31, 2008 |
| Amount | Shares | Amount | Shares |
| ($000) | (000) | ($000) | (000) |
Institutional Shares | | | | |
Issued | 5,556,940 | 71,574 | 10,979,735 | 100,686 |
Issued in Lieu of Cash Distributions | 360,586 | 4,578 | 827,364 | 8,027 |
Redeemed | (3,090,487) | (40,792) | (7,511,218) | (68,358) |
Net Increase (Decrease)—Institutional Shares | 2,827,039 | 35,360 | 4,295,881 | 40,355 |
Institutional Plus Shares | | | | |
Issued | 3,295,280 | 43,222 | 5,751,623 | 52,099 |
Issued in Lieu of Cash Distributions | 217,053 | 2,752 | 506,788 | 4,911 |
Redeemed | (1,444,065) | (19,523) | (3,791,096) | (35,416) |
Net Increase (Decrease)—Institutional Plus Shares | 2,068,268 | 26,451 | 2,467,315 | 21,594 |
H. In preparing the financial statements as of June 30, 2009, management considered the impact of subsequent events occurring through August 5, 2009, for potential recognition or disclosure in these financial statements.
22
About Your Fund’s Expenses
As a shareholder of the fund, you incur ongoing costs, which include costs for portfolio management, administrative services, and shareholder reports (like this one), among others. Operating expenses, which are deducted from a fund’s gross income, directly reduce the investment return of the fund.
A fund’s expenses are expressed as a percentage of its average net assets. This figure is known as the expense ratio. The following examples are intended to help you understand the ongoing costs (in dollars) of investing in your fund and to compare these costs with those of other mutual funds. The examples are based on an investment of $1,000 made at the beginning of the period shown and held for the entire period.
The accompanying table illustrates your fund’s costs in two ways:
• Based on actual fund return. This section helps you to estimate the actual expenses that you paid over the period. The “Ending Account Value” shown is derived from the fund’s actual return, and the third column shows the dollar amount that would have been paid by an investor who started with $1,000 in the fund. You may use the information here, together with the amount you invested, to estimate the expenses that you paid over the period.
To do so, simply divide your account value by $1,000 (for example, an $8,600 account value divided by $1,000 = 8.6), then multiply the result by the number given for your fund under the heading “Expenses Paid During Period.”
• Based on hypothetical 5% yearly return. This section is intended to help you compare your fund’s costs with those of other mutual funds. It assumes that the fund had a yearly return of 5% before expenses, but that the expense ratio is unchanged. In this case—because the return used is not the fund’s actual return—the results do not apply to your investment. The example is useful in making comparisons because the Securities and Exchange Commission requires all mutual funds to calculate expenses based on a 5% return. You can assess your fund’s costs by comparing this hypothetical example with the hypothetical examples that appear in shareholder reports of other funds.
Six Months Ended June 30, 2009 | | | |
| Beginning | Ending | Expenses |
| Account Value | Account Value | Paid During |
Institutional Index Fund | 12/31/2008 | 6/30/2009 | Period1 |
Based on Actual Fund Return | | | |
Institutional Shares | $1,000.00 | $1,032.74 | $0.25 |
Institutional Plus Shares | 1,000.00 | 1,032.85 | 0.12 |
Based on Hypothetical 5% Yearly Return | | | |
Institutional Shares | $1,000.00 | $1,024.55 | $0.25 |
Institutional Plus Shares | 1,000.00 | 1,024.67 | 0.13 |
1 The calculations are based on expenses incurred in the most recent six-month period. The fund’s annualized six-month expense ratios for that period are 0.05% for Institutional Shares and 0.025% for Institutional Plus Shares. The dollar amounts shown as “Expenses Paid” are equal to the annualized expense ratio multiplied by the average account value over the period, multiplied by the number of days in the most recent six-month period, then divided by the number of days in the most recent 12-month period.
23
Note that the expenses shown in the table are meant to highlight and help you compare ongoing costs only and do not reflect transaction costs incurred by the fund for buying and selling securities. Your fund does not charge transaction fees, such as purchase or redemption fees, nor does it carry a “sales load.”
The calculations assume no shares were bought or sold during the period. Your actual costs may have been higher or lower, depending on the amount of your investment and the timing of any purchases or redemptions.
You can find more information about the fund’s expenses, including annual expense ratios, in the Financial Statements section of this report. For additional information on operating expenses and other shareholder costs, please refer to your fund’s current prospectus.
24
Trustees Approve Advisory Arrangement
The board of trustees of Vanguard Institutional Index Fund has renewed the fund’s investment advisory arrangement with The Vanguard Group, Inc. Vanguard—through its Quantitative Equity Group—serves as the investment advisor for the fund. The board determined that continuing the fund’s internalized management structure was in the best interests of the fund and its shareholders.
The board based its decision upon an evaluation of the advisor’s investment staff, portfolio management process, and performance. The trustees considered the factors discussed below, among others. However, no single factor determined whether the board approved the arrangement. Rather, it was the totality of the circumstances that drove the board’s decision.
Nature, extent, and quality of services
The board considered the quality of the fund’s investment management over both the short and long term, and took into account the organizational depth and stability of the advisor. The board noted that Vanguard has been managing investments for more than three decades. The Quantitative Equity Group adheres to a sound, disciplined investment management process; the team has considerable experience, stability, and depth.
The board concluded that Vanguard’s experience, stability, depth, and performance, among other factors, warranted continuation of the advisory arrangement.
Investment performance
The board considered the short- and long-term performance of the fund, including any periods of outperformance or underperformance of its target index and peer group. The board concluded that the fund has performed in line with expectations, and that its results have been consistent with its investment strategies. Information about the fund’s most recent performance can be found in the Performance Summary section of this report.
Cost
The board concluded that the fund’s expense ratio was well below the average expense ratio charged by funds in its peer group. The board noted that the fund’s advisory expense ratio was also well below its peer-group average. Information about the fund’s expense ratio appears in the About Your Fund’s Expenses section of this report as well as in the Financial Statements section.
The board does not conduct a profitability analysis of Vanguard, because of Vanguard’s unique “at-cost” structure. Unlike most other mutual fund management companies, Vanguard is owned by the funds it oversees, and produces “profits” only in the form of reduced expenses for fund shareholders.
The benefit of economies of scale
The board concluded that the fund’s low-cost arrangement with Vanguard reflects economies of scale for the benefit of the fund’s shareholders.
The board will consider whether to renew the advisory arrangement again after a one-year period.
25
Glossary
Beta. A measure of the magnitude of a fund’s past share-price fluctuations in relation to the ups and downs of a given market index. The index is assigned a beta of 1.00. Compared with a given index, a fund with a beta of 1.20 typically would have seen its share price rise or fall by 12% when the index rose or fell by 10%. For this report, beta is based on returns over the past 36 months for both the fund and the index. Note that a fund’s beta should be reviewed in conjunction with its R-squared (see definition). The lower the R-squared, the less correlation there is between the fund and the index, and the less reliable beta is as an indicator of volatility.
Earnings Growth Rate. The average annual rate of growth in earnings over the past five years for the stocks now in a fund.
Equity Exposure. A measure that reflects a fund’s investments in stocks and stock futures. Any holdings in short-term reserves are excluded.
Expense Ratio. The percentage of a fund’s average net assets used to pay its annual administrative and advisory expenses. These expenses directly reduce returns to investors.
Foreign Holdings. The percentage of a fund represented by stocks or depositary receipts of companies based outside the United States.
Inception Date. The date on which the assets of a fund (or one of its share classes) are first invested in accordance with the fund’s investment objective. For funds with a subscription period, the inception date is the day after that period ends. Investment performance is measured from the inception date.
Median Market Cap. An indicator of the size of companies in which a fund invests; the midpoint of market capitalization (market price x shares outstanding) of a fund’s stocks, weighted by the proportion of the fund’s assets invested in each stock. Stocks representing half of the fund’s assets have market capitalizations above the median, and the rest are below it.
Price/Book Ratio. The share price of a stock divided by its net worth, or book value, per share. For a fund, the weighted average price/book ratio of the stocks it holds.
Price/Earnings Ratio. The ratio of a stock’s current price to its per-share earnings over the past year. For a fund, the weighted average P/E of the stocks it holds. P/E is an indicator of market expectations about corporate prospects; the higher the P/E, the greater the expectations for a company’s future growth.
R-Squared. A measure of how much of a fund’s past returns can be explained by the returns from the market in general, as measured by a given index. If a fund’s total returns were precisely synchronized with an index’s returns, its R-squared would be 1.00. If the fund’s returns bore no relationship to the index’s returns, its R-squared would be 0. For this report, R-squared is based on returns over the past 36 months for both the fund and the index.
Return on Equity. The annual average rate of return generated by a company during the past five years for each dollar of shareholder’s equity (net income divided by shareholder’s equity). For a fund, the weighted average return on equity for the companies whose stocks it holds.
Short-Term Reserves. The percentage of a fund invested in highly liquid, short-term securities that can be readily converted to cash.
26
Turnover Rate. An indication of the fund’s trading activity. Funds with high turnover rates incur higher transaction costs and may be more likely to distribute capital gains (which may be taxable to investors). The turnover rate excludes in-kind transactions, which have minimal impact on costs.
Yield. A fund’s 30-day SEC yield is derived using a formula specified by the U.S. Securities and Exchange Commission. Under the formula, data related to the fund’s security holdings in the previous 30 days are used to calculate the fund’s hypothetical net income for that period, which is then annualized and divided by the fund’s estimated average net assets over the calculation period. For the purposes of this calculation, a security’s income is based on its current market yield to maturity (in the case of bonds) or its projected dividend yield (for stocks). Because the SEC yield represents hypothetical annualized income, it will differ—at times significantly—from the fund’s actual experience. As a result, the fund’s income distributions may be higher or lower than implied by the SEC yield.
27
The People Who Govern Your Fund
The trustees of your mutual fund are there to see that the fund is operated and managed in your best interests since, as a shareholder, you are a part owner of the fund. Your fund’s trustees also serve on the board of directors of The Vanguard Group, Inc., which is owned by the Vanguard funds and provides services to them on an at-cost basis.
A majority of Vanguard’s board members are independent, meaning that they have no affiliation with Vanguard or the funds they oversee, apart from the sizable personal investments they have made as private individuals. The independent board members have distinguished backgrounds in business, academia, and public service. Each of the trustees and executive officers oversees 157 Vanguard funds.
The following table provides information for each trustee and executive officer of the fund. More information about the trustees is in the Statement of Additional Information, which can be obtained, without charge, by contacting Vanguard at 800-662-7447, or online at www.vanguard.com.
Interested Trustees
John J. Brennan1
Born 1954. Trustee Since May 1987. Chairman of the Board. Principal Occupation(s) During the Past Five Years: Chairman of the Board and Director/Trustee of The Vanguard Group, Inc., and of each of the investment companies served by The Vanguard Group; Chief Executive Officer and President of The Vanguard Group and of each of the investment companies served by The Vanguard Group (1996–2008); Chairman of the Financial Accounting Foundation; Governor of the Financial Industry Regulatory Authority (FINRA); Director of United Way of Southeastern Pennsylvania.
F. William McNabb III1
Born 1957. Trustee Since July 2009. Principal
Occupation(s) During the Past Five Years: Director of The Vanguard Group, Inc., since 2008; Chief Executive Officer and President of The Vanguard Group and of each of the investment companies served by The Vanguard Group since 2008; Director of Vanguard Marketing Corporation; Managing Director of The Vanguard Group (1995–2008).
Independent Trustees
Charles D. Ellis
Born 1937. Trustee Since January 2001. Principal Occupation(s) During the Past Five Years: Applecore Partners (pro bono ventures in education); Senior Advisor to Greenwich Associates (international business strategy consulting); Successor Trustee of Yale University; Overseer of the Stern School of Business at New York University; Trustee of the Whitehead Institute for Biomedical Research.
Emerson U. Fullwood
Born 1948. Trustee Since January 2008. Principal Occupation(s) During the Past Five Years: Retired Executive Chief Staff and Marketing Officer for North America and Corporate Vice President of Xerox Corporation (photocopiers and printers); Director of SPX Corporation (multi-industry manufacturing), the United Way of Rochester, the Boy Scouts of America, Amerigroup Corporation (direct health and medical insurance carriers), and Monroe Community College Foundation.
Rajiv L. Gupta
Born 1945. Trustee Since December 2001.2 Principal Occupation(s) During the Past Five Years: Retired Chairman and Chief Executive Officer of Rohm and Haas Co. (chemicals); President of
Rohm and Haas Co. (2006–2008); Board Member of American Chemistry Council; Director of Tyco International, Ltd. (diversified manufacturing and services) and Hewlett-Packard Co. (electronic computer manufacturing); Trustee of The Conference Board.
Amy Gutmann
Born 1949. Trustee Since June 2006. Principal
Occupation(s) During the Past Five Years: President of the University of Pennsylvania; Christopher H. Browne Distinguished Professor of Political Science in the School of Arts and Sciences with Secondary Appointments at the Annenberg School for Communication and the Graduate School of Education of the University of Pennsylvania; Director of Carnegie Corporation of New York, Schuylkill River Development Corporation, and Greater Philadelphia Chamber of Commerce; Trustee of the National Constitution Center.
JoAnn Heffernan Heisen
Born 1950. Trustee Since July 1998. Principal Occupation(s) During the Past Five Years: Retired Corporate Vice President, Chief Global Diversity Officer, and Member of the Executive Committee of Johnson & Johnson (pharmaceuticals/consumer products); Vice President and Chief Information Officer of Johnson & Johnson (1997–2005); Director of the University Medical Center at Princeton and Women’s Research and Education Institute.
André F. Perold
Born 1952. Trustee Since December 2004. Principal Occupation(s) During the Past Five Years: George Gund Professor of Finance and Banking, Harvard Business School; Director and Chairman of UNX, Inc. (equities trading firm); Chair of the Investment Committee of HighVista Strategies LLC (private investment firm).
Alfred M. Rankin, Jr.
Born 1941. Trustee Since January 1993. Principal Occupation(s) During the Past Five Years: Chairman, President, Chief Executive Officer, and Director of NACCO Industries, Inc. (forklift trucks/housewares/ lignite); Director of Goodrich Corporation (industrial products/aircraft systems and services).
Peter F. Volanakis
Born 1955. Trustee Since July 2009. Principal Occupations During the Past Five Years: President since 2007 and Chief Operating Officer since 2005 of Corning Incorporated (communications equipment); President of Corning Technologies (2001–2005); Director of Corning Incorporated and Dow Corning; Trustee of the Corning Incorporated Foundation and the Corning Museum of Glass; Overseer of the Amos Tuck School of Business Administration at Dartmouth College.
Executive Officers
Thomas J. Higgins1
Born 1957. Chief Financial Officer Since September 2008. Principal Occupation(s) During the Past Five Years: Principal of The Vanguard Group, Inc.; Chief Financial Officer of each of the investment companies served by The Vanguard Group since 2008; Treasurer of each of the investment companies served by The Vanguard Group (1998–2008).
Kathryn J. Hyatt1
Born 1955. Treasurer Since November 2008. Principal Occupation(s) During the Past Five Years: Principal of The Vanguard Group, Inc.; Treasurer of each of the investment companies served by The Vanguard Group since 2008; Assistant Treasurer of each of the investment companies served by The Vanguard Group (1988–2008).
Heidi Stam1
Born 1956. Secretary Since July 2005. Principal Occupation(s) During the Past Five Years: Managing Director of The Vanguard Group, Inc., since 2006; General Counsel of The Vanguard
Group since 2005; Secretary of The Vanguard Group and of each of the investment companies served by The Vanguard Group since 2005; Director and Senior Vice President of Vanguard Marketing Corporation since 2005; Principal of The Vanguard Group (1997–2006).
Vanguard Senior Management Team |
| |
R. Gregory Barton | Michael S. Miller |
Mortimer J. Buckley | James M. Norris |
Kathleen C. Gubanich | Glenn W. Reed |
Paul A. Heller | George U. Sauter |
Founder
John C. Bogle
Chairman and Chief Executive Officer, 1974–1996
1 These individuals are “interested persons” as defined in the Investment Company Act of 1940.
2 December 2002 for Vanguard Equity Income Fund, Vanguard Growth Equity Fund, the Vanguard Municipal Bond Funds, and the Vanguard State Tax-Exempt Funds.

P.O. Box 2600
Valley Forge, PA 19482-2600
Connect with Vanguard® > www.vanguard.com
Fund Information > 800-662-7447 | All comparative mutual fund data are from Lipper Inc. |
| or Morningstar, Inc., unless otherwise noted. |
Direct Investor Account Services > 800-662-2739 | |
| You can obtain a free copy of Vanguard’s proxy voting |
Institutional Investor Services > 800-523-1036 | |
| guidelines by visiting our website, www.vanguard.com, |
Text Telephone for People | and searching for “proxy voting guidelines,” or by |
With Hearing Impairment > 800-952-3335 | calling Vanguard at 800-662-2739. The guidelines are |
| also available from the SEC’s website, www.sec.gov. |
| In addition, you may obtain a free report on how your |
| fund voted the proxies for securities it owned during |
This material may be used in conjunction | |
| the 12 months ended June 30. To get the report, visit |
with the offering of shares of any Vanguard | |
| either www.vanguard.com or www.sec.gov. |
fund only if preceded or accompanied by | |
| You can review and copy information about your fund |
the fund’s current prospectus. | |
| at the SEC’s Public Reference Room in Washington, D.C. |
Standard & Poor’s 500®, S&P 500®, and 500 are | To find out more about this public service, call the SEC |
trademarks of The McGraw-Hill Companies, Inc., and | at 202-551-8090. Information about your fund is also |
have been licensed for use by The Vanguard Group, Inc. | available on the SEC’s website, and you can receive |
Vanguard mutual funds are not sponsored, endorsed, | copies of this information, for a fee, by sending a |
sold, or promoted by Standard & Poor’s, and Standard & | request in either of two ways: via e-mail addressed to |
Poor’s makes no representation regarding the advisability | publicinfo@sec.gov or via regular mail addressed to the |
of investing in the funds. | Public Reference Section, Securities and Exchange |
| Commission, Washington, DC 20549-0102. |
© 2009 The Vanguard Group, Inc.
All rights reserved.
Vanguard Marketing Corporation, Distributor.
Q942 082009
1

> For the six months ended June 30, 2009, Vanguard Institutional Total Bond Market Index Fund returned 2.08%.
> The fund’s return was in line with that of its target benchmark, the Barclays Capital U.S. Aggregate Bond Index.
> Market sentiment changed dramatically in the half-year as bond investors began favoring riskier investments over Treasuries.
Contents |
|
Your Fund’s Total Returns. . . . . . . . . . . . . . . . . . . . . . .1 |
|
President’s Letter. . . . . . . . . . . . . . . . . . . . . . . . . . . . . 2 |
|
Fund Profile. . . . . . . . . . . . . . . . . . . . . . . . . . . . . . . . . . 5 |
|
Performance Summary. . . . . . . . . . . . . . . . . . . . . . . . . 6 |
|
Financial Statements. . . . . . . . . . . . . . . . . . . . . . . . . . .7 |
|
About Your Fund’s Expenses. . . . . . . . . . . . . . . . . . . 61 |
|
Trustees Approve Advisory Arrangement. . . . . . . . . . 63 |
|
Glossary. . . . . . . . . . . . . . . . . . . . . . . . . . . . . . . . . . . .64 |
Please note: The opinions expressed in this report are just that—informed opinions. They should not be considered promises or advice. Also, please keep in mind that the information and opinions cover the period through the date on the front of this report. Of course, the risks of investing in your fund are spelled out in the prospectus.
See the Glossary for definitions of investment terms used in this report.
Your Fund’s Total Returns
Six Months Ended June 30, 2009 | | | | |
| | | | |
| Income | Capital | 30-Day SEC | Total |
| Return | Return | Yield | Returns |
Vanguard Institutional Total Bond Market | | | | |
Index Fund | 2.31% | -0.23% | 4.20% | 2.08% |
Barclays Capital U.S. Aggregate Bond Index | | | | 1.90 |
Average Intermediate-Term Investment Grade | | | | |
Debt Fund | | | | 5.38 |
Average Intermediate-Term Investment Grade Debt Fund: Derived from data provided by Lipper Inc. |
Your Fund’s Performance at a Glance | | | | |
December 31, 2008, Through June 30, 2009 | | | | |
| | | | |
| | | Distributions | Per Share |
| Starting | Ending | Income | Capital |
| Share Price | Share Price | Dividends | Gains |
Vanguard Institutional Total Bond Market | | | | |
Index Fund | $51.33 | $51.06 | $1.166 | $0.150 |
1

President’s Letter
Dear Shareholder:
After stampeding into U.S. Treasury securities in late 2008, investors surged back out in the first half of 2009, embracing riskier corporate bonds. The shift drove down the prices of Treasuries, which are a significant component of Vanguard Institutional Total Bond Market Index Fund, and drove up the prices of corporate bonds.
The fund returned 2.08%, in line with its target index, but it trailed the average return of peer funds.
The fund’s yield declined to 4.20% as of June 30, 2009, from 4.48% at year- end 2008.
Newly confident bond investors sought out higher yields
As the fiscal half-year began, investors panicked by the credit-market crisis were seeking shelter in U.S. Treasury bonds, considered the safest of all securities. The difference between the yields of Treasuries and those of corporate bonds surged to levels not seen since the 1930s.
By mid-March, however, investors had gained confidence from the federal government’s efforts to thaw the credit market and stimulate the economy. Bond investors moved back from Treasuries toward corporate bonds—the riskier, the better. For the six months, Treasuries in aggregate returned about –4%, investment-grade corporate bonds returned about 7%, and high-yield securities—the riskiest of bonds—gained about 30%, as measured
2
respectively by the Barclays Capital U.S. Treasury, U.S. Credit, and U.S. Corporate High Yield Indexes.
Despite some murmurs in the market about longer-term inflation risks, in March the Federal Reserve unveiled plans to make big purchases of Treasury and mortgage-backed securities, in an attempt to keep borrowing costs, such as mortgage rates, low. Other government initiatives during the period helped to bring down municipal bond yields, which had risen higher than Treasury yields—a reversal in their traditional relationship. For the six months, the tax-exempt bond market returned more than 6%.
The Fed kept the target for short-term interest rates at an all-time low of 0% to 0.25% throughout the period.
Stock gains petered out by the end of the period
For the six months ended June 30, the broad U.S. stock market returned 5%. The stock market began the half-year in negative territory, then rallied through much of the spring. Although the April–June period was the strongest quarter for U.S. stocks since 2003, equity gains fizzled in mid-June as investors were taken aback by a drop in consumer confidence, a decline in home prices, and a larger-than-expected rise in the unemployment rate.
International stocks did better, returning about 14% for the half-year after a very rocky start. Emerging markets posted the best results as investors poured money into countries with strong growth prospects. Higher commodity prices and
Market Barometer | | | |
| | | Total Returns |
| Periods Ended June 30, 2009 |
| Six | One | Five Years |
| Months | Year | (Annualized) |
Bonds | | | |
Barclays Capital U.S. Aggregate Bond Index (Broad | | | |
taxable market) | 1.90% | 6.05% | 5.01% |
Barclays Capital Municipal Bond Index | 6.43 | 3.77 | 4.14 |
Citigroup Three-Month U.S. Treasury Bill Index | 0.10 | 0.78 | 3.02 |
| | | |
| | | |
Stocks | | | |
Russell 1000 Index (Large-caps) | 4.32% | -26.69% | -1.85% |
Russell 2000 Index (Small-caps) | 2.64 | -25.01 | -1.71 |
Dow Jones U.S. Total Stock Market Index | 5.00 | -26.11 | -1.47 |
MSCI All Country World Index ex USA (International) | 14.35 | -30.54 | 4.95 |
| | | |
| | | |
CPI | | | |
Consumer Price Index | 2.60% | -1.43% | 2.60% |
3
a slight rebound in manufacturing orders helped reverse the earlier steep declines in stocks abroad.
Still, pockets of the developed and developing markets, particularly in Europe, continued to struggle amid the global recession. After three consecutive monthly gains, the MSCI All Country World Index ex USA declined slightly for June.
The market environment favored corporate bonds
Reflecting its target benchmark, the Institutional Total Bond Market Index Fund invests in high-quality bonds from both government and corporate issuers. As of June 30, about a quarter of the portfolio consisted of investment-grade corporate bonds and another quarter of Treasuries. The remainder was made up mostly of government mortgage-backed securities.
In 2008’s fearful market environment, the fund’s Treasury holdings boosted returns, while corporates retreated. During the first half of 2009, these dynamics were reversed. In both periods, the fund’s government mortgage-backed holdings outperformed the general bond market, which supported the fund’s return. Overall, the fund’s return was in line with that of its benchmark.
The fund’s relatively large weighting in Treasuries produced falling share prices. The resulting modestly negative capital return (–0.23%) was more than offset by the fund’s income return (2.31%).
A diversified index fund eliminates second-guessing
The experience of the past six months has been called a “low-quality rally” because of investors’ rush from Treasuries to riskier assets of all kinds. Rallies come and go, with unexpected stops and starts. Trying to anticipate a market rally, or jump in after one has begun, rarely works consistently over time.
A low-cost, broad-based index fund—in the hands of a skilled advisor such as Vanguard Fixed Income Group—can offer an excellent way to pursue the fixed income market’s return without second-guessing (or guessing at all) which sector—Treasuries, corporates, or mortgage-backed securities—is likely to lead or lag as the economy emerges from one of its most difficult periods in decades.
As always, thank you for entrusting your assets to Vanguard.
Sincerely,

F. William McNabb III
President and Chief Executive Officer
July 20, 2009
4
Institutional Total Bond Market Index Fund
Fund Profile
As of June 30, 2009
Financial Attributes | | |
| | |
| | Barclays |
| | U.S. |
| | Aggregate |
| Fund | Index |
Number of Bonds | 2,893 | 8,866 |
Average Quality | Aa1 | Aa1 |
Yield to Maturity | | |
(before expenses) | 4.0% | 4.1% |
Average Coupon | 4.9% | 4.9% |
Average Duration | 4.3 years | 4.3 years |
Average Effective | | |
Maturity | 6.7 years | 6.7 years |
Ticker Symbol | VITBX | — |
Expense Ratio1 | 0.05% | — |
30-Day SEC Yield | 4.20% | — |
Short-Term | | |
Reserves | 0.8% | — |
Average quality: Moody’s Investors Service. | |
Sector Diversification (% of portfolio) | |
| |
| |
Asset-Backed | 0.7% |
Commercial Mortgage-Backed | 3.0 |
Finance | 6.6 |
Foreign | 3.6 |
Government Mortgage-Backed | 37.9 |
Industrial | 10.0 |
Treasury/Agency | 35.4 |
Utilities | 2.0 |
Other | 0.8 |
The agency and mortgage-backed securities sectors may include issues from government-sponsored enterprises; such issues are not backed by the full faith and credit of the U.S. government.
Volatility Measures | |
| Barclays |
| U.S. |
| Aggregate |
| Index |
R-Squared | 0.99 |
Beta | 1.01 |
These measures show the degree and timing of the fund’s fluctuations compared with the index over 36 months.
Distribution by Maturity (% of portfolio) | |
| |
Under 1 Year | 2.2% |
1 - 3 Years | 23.4 |
3 - 5 Years | 24.6 |
5 - 10 Years | 36.9 |
10 - 20 Years | 6.7 |
20 - 30 Years | 6.1 |
Over 30 Years | 0.1 |
Distribution by Credit Quality (% of portfolio) |
| |
Aaa | 79.4% |
Aa | 3.6 |
A | 9.7 |
Baa | 7.3 |
Investment Focus
1 The expense ratio shown is from the prospectus dated April 29, 2009, and represents estimated costs for the current fiscal year based on the fund’s net assets as of the prospectus date. For the six months ended June 30, 2009, the annualized expense ratio was 0.05%.
5
Institutional Total Bond Market Index Fund
Performance Summary
All of the returns in this report represent past performance, which is not a guarantee of future results that may be achieved by the fund. (Current performance may be lower or higher than the performance data cited. For performance data current to the most recent month-end, visit our website at www.vanguard.com/performance.) Note, too, that both investment returns and principal value can fluctuate widely, so an investor’s shares, when sold, could be worth more or less than their original cost. The returns shown do not reflect taxes that a shareholder would pay on fund distributions or on the sale of fund shares.
Fiscal-Year Total Returns (%): April 26, 2002, Through June 30, 2009 |
| | | | Barclays Capital |
| | | | U.S. Aggregate |
| | | | Bond Index |
Fiscal Year | Capital Return | Income Return | Total Return | Total Return |
2002 | 3.80% | 3.50% | 7.30% | 7.95% |
2003 | 0.17 | 3.91 | 4.08 | 4.10 |
2004 | 0.03 | 4.33 | 4.36 | 4.34 |
2005 | -1.93 | 4.40 | 2.47 | 2.43 |
2006 | -0.93 | 5.23 | 4.30 | 4.33 |
2007 | 1.73 | 5.28 | 7.01 | 6.97 |
2008 | 0.27 | 4.78 | 5.05 | 5.24 |
2009 | -0.23 | 2.31 | 2.08 | 1.90 |
Note: For 2009, performance data reflect the six months ended June 30, 2009. |
Average Annual Total Returns: Periods Ended June 30, 2009 |
| | | | | | |
| | | | Since Inception |
| Inception Date | One Year | Five Years | Capital | Income | Total |
Institutional Total Bond | | | | | | |
Market Index Fund | 4/26/2002 | 5.99% | 5.03% | 0.39% | 4.71% | 5.10% |
See Financial Highlights for dividend and capital gains information.
6
Institutional Total Bond Market Index Fund
Financial Statements (unaudited)
Statement of Net Assets
As of June 30, 2009
The fund provides a complete list of its holdings four times in each fiscal year, at the quarter-ends. For the second and fourth fiscal quarters, the lists appear in the fund’s semiannual and annual reports to shareholders. For the first and third fiscal quarters, the fund files the lists with the Securities and Exchange Commission on Form N-Q. Shareholders can look up the fund’s Forms N-Q on the SEC’s website at www.sec.gov. Forms N-Q may also be reviewed and copied at the SEC’s Public Reference Room (see the back cover of this report for further information).
| | | Face | Market |
| | Maturity | Amount | Value¥ |
| Coupon | Date | ($000) | ($000) |
U.S. Government and Agency Obligations (71.7%) | | | |
U.S. Government Securities (26.5%) | | | | |
U.S. Treasury Bond | 10.625% | 8/15/15 | 160 | 230 |
U.S. Treasury Bond | 9.875% | 11/15/15 | 6,675 | 9,329 |
U.S. Treasury Bond | 9.250% | 2/15/16 | 85 | 116 |
U.S. Treasury Bond | 7.500% | 11/15/16 | 1,475 | 1,881 |
U.S. Treasury Bond | 8.750% | 5/15/17 | 9,725 | 13,314 |
U.S. Treasury Bond | 8.875% | 8/15/17 | 17,530 | 24,235 |
U.S. Treasury Bond | 9.125% | 5/15/18 | 425 | 609 |
U.S. Treasury Bond | 9.000% | 11/15/18 | 25 | 36 |
U.S. Treasury Bond | 8.875% | 2/15/19 | 4,575 | 6,524 |
U.S. Treasury Bond | 8.125% | 8/15/19 | 30 | 41 |
U.S. Treasury Bond | 8.750% | 5/15/20 | 1,015 | 1,450 |
U.S. Treasury Bond | 8.750% | 8/15/20 | 13,000 | 18,614 |
U.S. Treasury Bond | 7.875% | 2/15/21 | 9,155 | 12,426 |
U.S. Treasury Bond | 8.125% | 5/15/21 | 35 | 48 |
U.S. Treasury Bond | 8.125% | 8/15/21 | 5,550 | 7,700 |
U.S. Treasury Bond | 8.000% | 11/15/21 | 630 | 869 |
U.S. Treasury Bond | 7.250% | 8/15/22 | 3,420 | 4,491 |
U.S. Treasury Bond | 7.625% | 11/15/22 | 95 | 129 |
U.S. Treasury Bond | 7.125% | 2/15/23 | 1,550 | 2,024 |
U.S. Treasury Bond | 6.250% | 8/15/23 | 21,270 | 25,893 |
U.S. Treasury Bond | 6.875% | 8/15/25 | 25 | 33 |
U.S. Treasury Bond | 6.000% | 2/15/26 | 2,125 | 2,561 |
U.S. Treasury Bond | 6.750% | 8/15/26 | 655 | 852 |
U.S. Treasury Bond | 6.500% | 11/15/26 | 25 | 32 |
U.S. Treasury Bond | 6.625% | 2/15/27 | 7,330 | 9,441 |
U.S. Treasury Bond | 6.375% | 8/15/27 | 2,000 | 2,522 |
U.S. Treasury Bond | 5.500% | 8/15/28 | 9,000 | 10,387 |
U.S. Treasury Bond | 5.250% | 11/15/28 | 275 | 309 |
U.S. Treasury Bond | 5.250% | 2/15/29 | 225 | 253 |
U.S. Treasury Bond | 6.125% | 8/15/29 | 4,685 | 5,826 |
U.S. Treasury Bond | 6.250% | 5/15/30 | 2,155 | 2,728 |
U.S. Treasury Bond | 5.375% | 2/15/31 | 160 | 183 |
U.S. Treasury Bond | 4.500% | 2/15/36 | 6,600 | 6,789 |
U.S. Treasury Bond | 4.750% | 2/15/37 | 8,550 | 9,150 |
U.S. Treasury Bond | 5.000% | 5/15/37 | 305 | 339 |
U.S. Treasury Bond | 4.375% | 2/15/38 | 13,575 | 13,690 |
U.S. Treasury Bond | 3.500% | 2/15/39 | 10,550 | 9,108 |
U.S. Treasury Inflation-Indexed Note | 3.500% | 1/15/11 | 2,825 | 3,612 |
U.S. Treasury Note | 2.625% | 5/31/10 | 5,425 | 5,529 |
7
Institutional Total Bond Market Index Fund
| | | Face | Market |
| | Maturity | Amount | Value¥ |
| Coupon | Date | ($000) | ($000) |
U.S. Treasury Note | 2.875% | 6/30/10 | 25,300 | 25,885 |
U.S. Treasury Note | 4.125% | 8/15/10 | 1,915 | 1,991 |
U.S. Treasury Note | 5.750% | 8/15/10 | 1,700 | 1,798 |
U.S. Treasury Note | 2.375% | 8/31/10 | 3,250 | 3,318 |
U.S. Treasury Note | 2.000% | 9/30/10 | 525 | 534 |
U.S. Treasury Note | 1.500% | 10/31/10 | 22,425 | 22,670 |
U.S. Treasury Note | 1.250% | 11/30/10 | 17,200 | 17,326 |
U.S. Treasury Note | 4.375% | 12/15/10 | 3,045 | 3,204 |
U.S. Treasury Note | 0.875% | 12/31/10 | 23,770 | 23,804 |
U.S. Treasury Note | 0.875% | 1/31/11 | 6,800 | 6,804 |
U.S. Treasury Note | 5.000% | 2/15/11 | 1,350 | 1,440 |
U.S. Treasury Note | 0.875% | 2/28/11 | 41,805 | 41,779 |
U.S. Treasury Note | 0.875% | 3/31/11 | 29,150 | 29,114 |
U.S. Treasury Note | 0.875% | 4/30/11 | 22,900 | 22,836 |
U.S. Treasury Note | 4.875% | 4/30/11 | 4,675 | 4,999 |
U.S. Treasury Note | 0.875% | 5/31/11 | 18,500 | 18,436 |
U.S. Treasury Note | 1.125% | 6/30/11 | 18,575 | 18,578 |
U.S. Treasury Note | 4.875% | 7/31/11 | 1,225 | 1,318 |
U.S. Treasury Note | 4.500% | 9/30/11 | 2,840 | 3,044 |
U.S. Treasury Note | 1.750% | 11/15/11 | 12,815 | 12,951 |
U.S. Treasury Note | 4.500% | 11/30/11 | 2,975 | 3,203 |
U.S. Treasury Note | 1.125% | 12/15/11 | 50 | 50 |
U.S. Treasury Note | 4.625% | 12/31/11 | 1,750 | 1,892 |
U.S. Treasury Note | 1.125% | 1/15/12 | 3,195 | 3,175 |
U.S. Treasury Note | 4.750% | 1/31/12 | 1,750 | 1,901 |
U.S. Treasury Note | 4.500% | 3/31/12 | 28,450 | 30,788 |
U.S. Treasury Note | 1.375% | 4/15/12 | 11,075 | 11,037 |
U.S. Treasury Note | 4.500% | 4/30/12 | 1,600 | 1,732 |
U.S. Treasury Note | 1.375% | 5/15/12 | 37,500 | 37,301 |
U.S. Treasury Note | 4.750% | 5/31/12 | 13,275 | 14,478 |
U.S. Treasury Note | 1.875% | 6/15/12 | 21,275 | 21,435 |
U.S. Treasury Note | 4.875% | 6/30/12 | 150 | 164 |
U.S. Treasury Note | 4.625% | 7/31/12 | 275 | 300 |
U.S. Treasury Note | 4.375% | 8/15/12 | 40 | 43 |
U.S. Treasury Note | 4.125% | 8/31/12 | 210 | 226 |
U.S. Treasury Note | 4.250% | 9/30/12 | 600 | 648 |
U.S. Treasury Note | 3.875% | 10/31/12 | 2,575 | 2,754 |
U.S. Treasury Note | 3.375% | 11/30/12 | 1,150 | 1,211 |
U.S. Treasury Note | 3.500% | 5/31/13 | 17,150 | 18,077 |
U.S. Treasury Note | 3.375% | 6/30/13 | 125 | 131 |
U.S. Treasury Note | 3.375% | 7/31/13 | 1,250 | 1,310 |
U.S. Treasury Note | 3.125% | 8/31/13 | 18,675 | 19,352 |
U.S. Treasury Note | 2.750% | 10/31/13 | 41,095 | 41,872 |
U.S. Treasury Note | 4.250% | 11/15/13 | 4,700 | 5,080 |
U.S. Treasury Note | 2.000% | 11/30/13 | 350 | 345 |
U.S. Treasury Note | 1.500% | 12/31/13 | 150 | 145 |
U.S. Treasury Note | 1.750% | 1/31/14 | 2,025 | 1,969 |
U.S. Treasury Note | 4.000% | 2/15/14 | 4,575 | 4,897 |
U.S. Treasury Note | 1.875% | 2/28/14 | 21,025 | 20,486 |
U.S. Treasury Note | 1.750% | 3/31/14 | 7,875 | 7,619 |
U.S. Treasury Note | 1.875% | 4/30/14 | 5,375 | 5,217 |
U.S. Treasury Note | 4.750% | 5/15/14 | 3,500 | 3,860 |
U.S. Treasury Note | 2.250% | 5/31/14 | 2,000 | 1,974 |
U.S. Treasury Note | 2.625% | 6/30/14 | 28,375 | 28,473 |
U.S. Treasury Note | 4.250% | 8/15/14 | 75 | 81 |
U.S. Treasury Note | 4.000% | 2/15/15 | 415 | 441 |
8
Institutional Total Bond Market Index Fund
| | | | Face | Market |
| | | Maturity | Amount | Value¥ |
| | Coupon | Date | ($000) | ($000) |
| U.S. Treasury Note | 4.125% | 5/15/15 | 15,725 | 16,782 |
| U.S. Treasury Note | 2.375% | 3/31/16 | 14,950 | 14,244 |
| U.S. Treasury Note | 2.625% | 4/30/16 | 3,775 | 3,650 |
| U.S. Treasury Note | 5.125% | 5/15/16 | 25,275 | 28,347 |
| U.S. Treasury Note | 3.250% | 5/31/16 | 600 | 602 |
| U.S. Treasury Note | 3.250% | 6/30/16 | 2,150 | 2,157 |
| U.S. Treasury Note | 4.875% | 8/15/16 | 8,725 | 9,647 |
| U.S. Treasury Note | 4.625% | 2/15/17 | 50 | 54 |
| U.S. Treasury Note | 4.500% | 5/15/17 | 150 | 162 |
| U.S. Treasury Note | 4.750% | 8/15/17 | 400 | 438 |
| U.S. Treasury Note | 4.250% | 11/15/17 | 16,200 | 17,182 |
| U.S. Treasury Note | 3.500% | 2/15/18 | 20,175 | 20,276 |
| U.S. Treasury Note | 3.875% | 5/15/18 | 12,125 | 12,492 |
| U.S. Treasury Note | 4.000% | 8/15/18 | 8,870 | 9,200 |
| U.S. Treasury Note | 3.750% | 11/15/18 | 6,925 | 7,043 |
| U.S. Treasury Note | 2.750% | 2/15/19 | 2,430 | 2,275 |
| U.S. Treasury Note | 3.125% | 5/15/19 | 17,325 | 16,751 |
| | | | | 930,101 |
Agency Bonds and Notes (7.3%) | | | | |
| Agency for International Development-Egypt | | | |
| (U.S. Government Guaranteed) | 4.450% | 9/15/15 | 350 | 366 |
1 | Federal Farm Credit Bank | 5.250% | 9/13/10 | 350 | 369 |
1 | Federal Farm Credit Bank | 3.750% | 12/6/10 | 325 | 338 |
1 | Federal Farm Credit Bank | 2.625% | 4/21/11 | 850 | 870 |
1 | Federal Farm Credit Bank | 5.375% | 7/18/11 | 1,125 | 1,215 |
1 | Federal Farm Credit Bank | 3.875% | 8/25/11 | 825 | 867 |
1 | Federal Farm Credit Bank | 2.000% | 1/17/12 | 1,325 | 1,333 |
1 | Federal Farm Credit Bank | 2.250% | 4/24/12 | 375 | 379 |
1 | Federal Farm Credit Bank | 2.125% | 6/18/12 | 850 | 852 |
1 | Federal Farm Credit Bank | 4.500% | 10/17/12 | 1,325 | 1,422 |
1 | Federal Farm Credit Bank | 3.875% | 10/7/13 | 575 | 598 |
1 | Federal Farm Credit Bank | 2.625% | 4/17/14 | 1,225 | 1,208 |
1 | Federal Farm Credit Bank | 4.875% | 12/16/15 | 350 | 375 |
1 | Federal Farm Credit Bank | 5.125% | 8/25/16 | 975 | 1,060 |
1 | Federal Farm Credit Bank | 4.875% | 1/17/17 | 500 | 535 |
1 | Federal Home Loan Bank | 3.500% | 7/16/10 | 1,600 | 1,648 |
1 | Federal Home Loan Bank | 3.375% | 8/13/10 | 2,650 | 2,727 |
1 | Federal Home Loan Bank | 3.375% | 10/20/10 | 1,575 | 1,628 |
1 | Federal Home Loan Bank | 4.750% | 12/10/10 | 325 | 342 |
1 | Federal Home Loan Bank | 3.625% | 12/17/10 | 675 | 702 |
1 | Federal Home Loan Bank | 2.625% | 3/11/11 | 4,375 | 4,473 |
1 | Federal Home Loan Bank | 1.625% | 3/16/11 | 1,050 | 1,058 |
1 | Federal Home Loan Bank | 1.375% | 5/16/11 | 875 | 876 |
1 | Federal Home Loan Bank | 3.125% | 6/10/11 | 1,200 | 1,239 |
1 | Federal Home Loan Bank | 1.625% | 7/27/11 | 775 | 779 |
1 | Federal Home Loan Bank | 5.375% | 8/19/11 | 9,900 | 10,733 |
1 | Federal Home Loan Bank | 3.750% | 9/9/11 | 300 | 315 |
1 | Federal Home Loan Bank | 3.625% | 9/16/11 | 600 | 630 |
1 | Federal Home Loan Bank | 1.875% | 6/20/12 | 825 | 823 |
1 | Federal Home Loan Bank | 4.625% | 10/10/12 | 1,175 | 1,269 |
1 | Federal Home Loan Bank | 3.375% | 2/27/13 | 325 | 338 |
1 | Federal Home Loan Bank | 3.625% | 5/29/13 | 150 | 157 |
1 | Federal Home Loan Bank | 5.375% | 6/14/13 | 425 | 469 |
1 | Federal Home Loan Bank | 5.125% | 8/14/13 | 1,625 | 1,783 |
1 | Federal Home Loan Bank | 4.000% | 9/6/13 | 900 | 948 |
1 | Federal Home Loan Bank | 5.250% | 9/13/13 | 2,075 | 2,279 |
9
Institutional Total Bond Market Index Fund
| | | | Face | Market |
| | | Maturity | Amount | Value¥ |
| | Coupon | Date | ($000) | ($000) |
1 | Federal Home Loan Bank | 4.500% | 9/16/13 | 1,500 | 1,610 |
1 | Federal Home Loan Bank | 3.625% | 10/18/13 | 1,275 | 1,320 |
1 | Federal Home Loan Bank | 4.875% | 11/27/13 | 925 | 999 |
1 | Federal Home Loan Bank | 5.500% | 8/13/14 | 2,925 | 3,262 |
1 | Federal Home Loan Bank | 5.375% | 5/18/16 | 5,950 | 6,581 |
1 | Federal Home Loan Bank | 5.625% | 6/13/16 | 150 | 143 |
1 | Federal Home Loan Bank | 5.125% | 10/19/16 | 300 | 326 |
1 | Federal Home Loan Bank | 4.750% | 12/16/16 | 1,225 | 1,313 |
1 | Federal Home Loan Bank | 4.875% | 5/17/17 | 300 | 322 |
1 | Federal Home Loan Bank | 5.000% | 11/17/17 | 325 | 349 |
1 | Federal Home Loan Bank | 5.250% | 12/11/20 | 1,175 | 1,260 |
1 | Federal Home Loan Bank | 5.625% | 6/11/21 | 75 | 82 |
1 | Federal Home Loan Bank | 5.500% | 7/15/36 | 1,325 | 1,383 |
1 | Federal Home Loan Mortgage Corp. | 4.125% | 7/12/10 | 10,189 | 10,560 |
1 | Federal Home Loan Mortgage Corp. | 3.250% | 7/16/10 | 650 | 668 |
1 | Federal Home Loan Mortgage Corp. | 6.875% | 9/15/10 | 1,166 | 1,252 |
1 | Federal Home Loan Mortgage Corp. | 5.000% | 10/18/10 | 500 | 527 |
1 | Federal Home Loan Mortgage Corp. | 3.125% | 10/25/10 | 1,025 | 1,057 |
1 | Federal Home Loan Mortgage Corp. | 4.750% | 1/18/11 | 1,475 | 1,561 |
1 | Federal Home Loan Mortgage Corp. | 3.250% | 2/25/11 | 1,075 | 1,113 |
1 | Federal Home Loan Mortgage Corp. | 1.625% | 4/26/11 | 1,425 | 1,434 |
1 | Federal Home Loan Mortgage Corp. | 6.000% | 6/15/11 | 4,970 | 5,422 |
1 | Federal Home Loan Mortgage Corp. | 3.875% | 6/29/11 | 160 | 168 |
1 | Federal Home Loan Mortgage Corp. | 5.250% | 7/18/11 | 5,700 | 6,154 |
1 | Federal Home Loan Mortgage Corp. | 5.750% | 1/15/12 | 5,700 | 6,290 |
1 | Federal Home Loan Mortgage Corp. | 2.125% | 3/23/12 | 1,775 | 1,793 |
1 | Federal Home Loan Mortgage Corp. | 1.750% | 6/15/12 | 1,725 | 1,717 |
1 | Federal Home Loan Mortgage Corp. | 5.500% | 8/20/12 | 2,200 | 2,435 |
1 | Federal Home Loan Mortgage Corp. | 4.625% | 10/25/12 | 1,525 | 1,648 |
1 | Federal Home Loan Mortgage Corp. | 4.125% | 12/21/12 | 1,075 | 1,145 |
1 | Federal Home Loan Mortgage Corp. | 4.500% | 1/15/13 | 425 | 459 |
1 | Federal Home Loan Mortgage Corp. | 3.750% | 6/28/13 | 3,900 | 4,093 |
1 | Federal Home Loan Mortgage Corp. | 4.500% | 7/15/13 | 425 | 458 |
1 | Federal Home Loan Mortgage Corp. | 4.875% | 11/15/13 | 4,550 | 4,961 |
1 | Federal Home Loan Mortgage Corp. | 2.500% | 4/23/14 | 4,975 | 4,897 |
1 | Federal Home Loan Mortgage Corp. | 5.000% | 7/15/14 | 4,700 | 5,162 |
1 | Federal Home Loan Mortgage Corp. | 3.000% | 7/28/14 | 875 | 879 |
1 | Federal Home Loan Mortgage Corp. | 4.500% | 1/15/15 | 2,700 | 2,892 |
1 | Federal Home Loan Mortgage Corp. | 5.050% | 1/26/15 | 600 | 657 |
1 | Federal Home Loan Mortgage Corp. | 5.250% | 4/18/16 | 550 | 607 |
1 | Federal Home Loan Mortgage Corp. | 5.500% | 7/18/16 | 325 | 364 |
1 | Federal Home Loan Mortgage Corp. | 5.125% | 10/18/16 | 875 | 959 |
1 | Federal Home Loan Mortgage Corp. | 5.000% | 2/16/17 | 4,375 | 4,774 |
1 | Federal Home Loan Mortgage Corp. | 5.000% | 4/18/17 | 2,200 | 2,394 |
1 | Federal Home Loan Mortgage Corp. | 5.500% | 8/23/17 | 2,200 | 2,474 |
1 | Federal Home Loan Mortgage Corp. | 4.875% | 6/13/18 | 1,350 | 1,455 |
1 | Federal Home Loan Mortgage Corp. | 5.000% | 12/14/18 | 1,409 | 1,326 |
1 | Federal Home Loan Mortgage Corp. | 3.750% | 3/27/19 | 850 | 837 |
1 | Federal Home Loan Mortgage Corp. | 6.750% | 9/15/29 | 425 | 521 |
1 | Federal Home Loan Mortgage Corp. | 6.750% | 3/15/31 | 2,214 | 2,761 |
1 | Federal Home Loan Mortgage Corp. | 6.250% | 7/15/32 | 52 | 62 |
1 | Federal National Mortgage Assn. | 3.000% | 7/12/10 | 1,650 | 1,691 |
1 | Federal National Mortgage Assn. | 4.250% | 8/15/10 | 3,500 | 3,638 |
1 | Federal National Mortgage Assn. | 2.875% | 10/12/10 | 950 | 976 |
1 | Federal National Mortgage Assn. | 6.625% | 11/15/10 | 400 | 432 |
1 | Federal National Mortgage Assn. | 4.750% | 12/15/10 | 475 | 502 |
10
Institutional Total Bond Market Index Fund
| | | | Face | Market |
| | | Maturity | Amount | Value¥ |
| | Coupon | Date | ($000) | ($000) |
1 | Federal National Mortgage Assn. | 6.250% | 2/1/11 | 210 | 220 |
1 | Federal National Mortgage Assn. | 1.750% | 3/23/11 | 1,675 | 1,690 |
1 | Federal National Mortgage Assn. | 2.750% | 4/11/11 | 9,650 | 9,906 |
1 | Federal National Mortgage Assn. | 5.125% | 4/15/11 | 1,425 | 1,523 |
1 | Federal National Mortgage Assn. | 1.375% | 4/28/11 | 1,725 | 1,728 |
1 | Federal National Mortgage Assn. | 6.000% | 5/15/11 | 2,200 | 2,391 |
1 | Federal National Mortgage Assn. | 5.000% | 10/15/11 | 825 | 891 |
1 | Federal National Mortgage Assn. | 2.000% | 1/9/12 | 3,500 | 3,538 |
1 | Federal National Mortgage Assn. | 1.875% | 4/20/12 | 12,475 | 12,502 |
1 | Federal National Mortgage Assn. | 4.875% | 5/18/12 | 1,820 | 1,976 |
1 | Federal National Mortgage Assn. | 5.250% | 8/1/12 | 315 | 327 |
1 | Federal National Mortgage Assn. | 4.375% | 9/15/12 | 475 | 510 |
1 | Federal National Mortgage Assn. | 3.625% | 2/12/13 | 1,075 | 1,128 |
1 | Federal National Mortgage Assn. | 4.750% | 2/21/13 | 450 | 488 |
1 | Federal National Mortgage Assn. | 4.375% | 3/15/13 | 625 | 672 |
1 | Federal National Mortgage Assn. | 4.625% | 5/1/13 | 1,950 | 1,980 |
1 | Federal National Mortgage Assn. | 3.875% | 7/12/13 | 4,700 | 4,950 |
1 | Federal National Mortgage Assn. | 4.625% | 10/15/13 | 4,700 | 5,079 |
1 | Federal National Mortgage Assn. | 2.875% | 12/11/13 | 3,200 | 3,227 |
1 | Federal National Mortgage Assn. | 5.125% | 1/2/14 | 225 | 229 |
1 | Federal National Mortgage Assn. | 2.750% | 2/5/14 | 1,150 | 1,150 |
1 | Federal National Mortgage Assn. | 2.750% | 3/13/14 | 1,425 | 1,422 |
1 | Federal National Mortgage Assn. | 2.500% | 5/15/14 | 4,600 | 4,521 |
1 | Federal National Mortgage Assn. | 5.000% | 4/15/15 | 875 | 958 |
1 | Federal National Mortgage Assn. | 5.250% | 9/15/16 | 2,975 | 3,284 |
1 | Federal National Mortgage Assn. | 4.875% | 12/15/16 | 2,075 | 2,242 |
1 | Federal National Mortgage Assn. | 5.000% | 2/13/17 | 6,450 | 7,020 |
1 | Federal National Mortgage Assn. | 5.375% | 6/12/17 | 2,200 | 2,450 |
1 | Federal National Mortgage Assn. | 6.250% | 5/15/29 | 50 | 59 |
1 | Federal National Mortgage Assn. | 7.125% | 1/15/30 | 925 | 1,191 |
1 | Federal National Mortgage Assn. | 7.250% | 5/15/30 | 3,825 | 5,004 |
1 | Federal National Mortgage Assn. | 5.625% | 7/15/37 | 350 | 364 |
1 | Financing Corp. | 9.800% | 4/6/18 | 425 | 609 |
1 | Financing Corp. | 9.650% | 11/2/18 | 525 | 757 |
| Private Export Funding Corp. | 4.375% | 3/15/19 | 375 | 381 |
| State of Israel (U.S. Government Guaranteed) | 5.500% | 9/18/23 | 200 | 213 |
| State of Israel (U.S. Government Guaranteed) | 5.500% | 12/4/23 | 150 | 155 |
| State of Israel (U.S. Government Guaranteed) | 5.500% | 4/26/24 | 1,000 | 1,034 |
1 | Tennessee Valley Auth. | 5.625% | 1/18/11 | 1,750 | 1,873 |
1 | Tennessee Valley Auth. | 5.500% | 7/18/17 | 1,625 | 1,775 |
1 | Tennessee Valley Auth. | 4.500% | 4/1/18 | 325 | 331 |
1 | Tennessee Valley Auth. | 6.750% | 11/1/25 | 100 | 123 |
1 | Tennessee Valley Auth. | 7.125% | 5/1/30 | 1,475 | 1,799 |
1 | Tennessee Valley Auth. | 4.650% | 6/15/35 | 375 | 337 |
1 | Tennessee Valley Auth. | 5.500% | 6/15/38 | 150 | 151 |
1 | Tennessee Valley Auth. | 4.875% | 1/15/48 | 125 | 113 |
1 | Tennessee Valley Auth. | 5.375% | 4/1/56 | 675 | 669 |
| | | | | 256,068 |
Conventional Mortgage-Backed Securities (35.7%) | | | | |
1,2 | Federal Home Loan Mortgage Corp. | 4.000% | 7/1/10-7/1/39 | 22,165 | 21,844 |
1,2 | Federal Home Loan Mortgage Corp. | 4.500% | 9/1/09-7/1/39 | 60,864 | 61,448 |
1,2 | Federal Home Loan Mortgage Corp. | 5.000% | 7/1/09-2/1/39 | 112,192 | 114,789 |
1,2 | Federal Home Loan Mortgage Corp. | 5.500% | 12/1/13-4/1/38 | 122,368 | 126,689 |
1,2 | Federal Home Loan Mortgage Corp. | 6.000% | 4/1/13-9/1/38 | 78,298 | 82,009 |
1,2 | Federal Home Loan Mortgage Corp. | 6.500% | 1/1/13-9/1/38 | 22,754 | 24,276 |
1,2 | Federal Home Loan Mortgage Corp. | 7.000% | 2/1/11-2/1/37 | 5,766 | 6,230 |
11
Institutional Total Bond Market Index Fund
| | | | Face | Market |
| | | Maturity | Amount | Value¥ |
| | Coupon | Date | ($000) | ($000) |
1,2 | Federal Home Loan Mortgage Corp. | 7.500% | 10/1/12-2/1/32 | 252 | 275 |
1,2 | Federal Home Loan Mortgage Corp. | 8.000% | 6/1/12-11/1/31 | 212 | 231 |
1,2 | Federal Home Loan Mortgage Corp. | 8.500% | 6/1/25-5/1/30 | 138 | 152 |
1,2 | Federal Home Loan Mortgage Corp. | 9.000% | 2/1/25-9/1/30 | 8 | 9 |
1,2 | Federal National Mortgage Assn. | 4.000% | 9/1/10-7/1/39 | 30,442 | 30,019 |
1,2 | Federal National Mortgage Assn. | 4.500% | 6/1/10-7/1/39 | 80,203 | 81,057 |
1,2 | Federal National Mortgage Assn. | 5.000% | 9/1/09-7/1/39 | 140,921 | 144,340 |
1,2 | Federal National Mortgage Assn. | 5.500% | 11/1/16-7/1/39 | 182,045 | 188,678 |
1,2 | Federal National Mortgage Assn. | 6.000% | 11/1/13-10/1/38 | 123,620 | 129,710 |
1,2 | Federal National Mortgage Assn. | 6.500% | 1/1/12-7/1/38 | 37,368 | 39,898 |
1,2 | Federal National Mortgage Assn. | 7.000% | 7/1/14-11/1/38 | 13,763 | 14,951 |
1,2 | Federal National Mortgage Assn. | 7.500% | 11/1/11-4/1/32 | 750 | 821 |
1,2 | Federal National Mortgage Assn. | 8.000% | 12/1/29-6/1/31 | 125 | 138 |
1,2 | Federal National Mortgage Assn. | 8.500% | 4/1/30-4/1/31 | 49 | 54 |
1,2 | Federal National Mortgage Assn. | 9.000% | 8/1/30 | 2 | 3 |
1,2 | Federal National Mortgage Assn. | 9.500% | 11/1/25 | 5 | 6 |
2 | Government National Mortgage Assn. | 4.000% | 9/15/18-7/1/39 | 4,703 | 4,555 |
2 | Government National Mortgage Assn. | 4.500% | 8/15/18-7/1/39 | 16,883 | 16,880 |
2 | Government National Mortgage Assn. | 5.000% | 2/15/18-3/15/39 | 38,978 | 39,788 |
2 | Government National Mortgage Assn. | 5.500% | 2/15/17-1/15/39 | 53,990 | 55,859 |
2 | Government National Mortgage Assn. | 6.000% | 5/15/14-1/20/39 | 43,755 | 45,637 |
2 | Government National Mortgage Assn. | 6.500% | 5/15/13-10/15/38 | 16,618 | 17,683 |
2 | Government National Mortgage Assn. | 7.000% | 10/15/10-9/15/36 | 2,342 | 2,537 |
2 | Government National Mortgage Assn. | 7.500% | 5/15/23-10/15/31 | 342 | 374 |
2 | Government National Mortgage Assn. | 8.000% | 7/15/25-11/15/30 | 314 | 344 |
2 | Government National Mortgage Assn. | 8.500% | 12/15/24-7/15/30 | 18 | 20 |
2 | Government National Mortgage Assn. | 9.000% | 5/15/25-8/15/30 | 11 | 12 |
2 | Government National Mortgage Assn. | 9.500% | 11/15/17 | 8 | 8 |
| | | | | 1,251,324 |
Nonconventional Mortgage-Backed Securities (2.2%) | | |
1,2 | Federal Home Loan Mortgage Corp. | 4.378% | 12/1/34 | 419 | 426 |
1,2 | Federal Home Loan Mortgage Corp. | 4.386% | 1/1/35 | 38 | 39 |
1,2 | Federal Home Loan Mortgage Corp. | 4.431% | 9/1/34 | 230 | 233 |
1,2 | Federal Home Loan Mortgage Corp. | 4.595% | 11/1/34 | 765 | 784 |
1,2 | Federal Home Loan Mortgage Corp. | 4.595% | 4/1/35 | 923 | 953 |
1,2 | Federal Home Loan Mortgage Corp. | 4.643% | 7/1/35 | 354 | 363 |
1,2 | Federal Home Loan Mortgage Corp. | 4.664% | 12/1/35 | 935 | 962 |
1,2 | Federal Home Loan Mortgage Corp. | 4.685% | 12/1/34 | 421 | 435 |
1,2 | Federal Home Loan Mortgage Corp. | 4.797% | 7/1/35 | 1,454 | 1,494 |
1,2 | Federal Home Loan Mortgage Corp. | 4.833% | 3/1/36 | 460 | 471 |
1,2 | Federal Home Loan Mortgage Corp. | 5.002% | 5/1/35 | 476 | 491 |
1,2 | Federal Home Loan Mortgage Corp. | 5.258% | 3/1/37 | 445 | 460 |
1,2 | Federal Home Loan Mortgage Corp. | 5.270% | 3/1/36 | 986 | 1,019 |
1,2 | Federal Home Loan Mortgage Corp. | 5.314% | 12/1/36 | 288 | 295 |
1,2 | Federal Home Loan Mortgage Corp. | 5.330% | 12/1/35 | 954 | 992 |
1,2 | Federal Home Loan Mortgage Corp. | 5.425% | 4/1/37 | 1,243 | 1,294 |
1,2 | Federal Home Loan Mortgage Corp. | 5.433% | 1/1/37 | 518 | 533 |
1,2 | Federal Home Loan Mortgage Corp. | 5.451% | 3/1/37 | 538 | 560 |
1,2 | Federal Home Loan Mortgage Corp. | 5.496% | 2/1/36 | 404 | 420 |
1,2 | Federal Home Loan Mortgage Corp. | 5.503% | 6/1/37 | 1,037 | 1,066 |
1,2 | Federal Home Loan Mortgage Corp. | 5.573% | 5/1/36 | 1,205 | 1,244 |
1,2 | Federal Home Loan Mortgage Corp. | 5.594% | 4/1/37 | 914 | 947 |
1,2 | Federal Home Loan Mortgage Corp. | 5.671% | 12/1/36 | 955 | 995 |
1,2 | Federal Home Loan Mortgage Corp. | 5.714% | 11/1/36 | 392 | 408 |
1,2 | Federal Home Loan Mortgage Corp. | 5.721% | 9/1/36 | 1,962 | 2,050 |
1,2 | Federal Home Loan Mortgage Corp. | 5.763% | 3/1/37 | 406 | 424 |
12
Institutional Total Bond Market Index Fund.
| | | | Face | Market |
| | | Maturity | Amount | Value¥ |
| | Coupon | Date | ($000) | ($000) |
1,2 | Federal Home Loan Mortgage Corp. | 5.773% | 5/1/36 | 499 | 520 |
1,2 | Federal Home Loan Mortgage Corp. | 5.809% | 4/1/37 | 1,948 | 2,020 |
1,2 | Federal Home Loan Mortgage Corp. | 5.827% | 6/1/37 | 690 | 721 |
1,2 | Federal Home Loan Mortgage Corp. | 5.855% | 3/1/37 | 298 | 312 |
1,2 | Federal Home Loan Mortgage Corp. | 5.883% | 12/1/36 | 813 | 852 |
1,2 | Federal Home Loan Mortgage Corp. | 5.891% | 5/1/37 | 1,463 | 1,528 |
1,2 | Federal Home Loan Mortgage Corp. | 5.974% | 10/1/37 | 408 | 428 |
1,2 | Federal Home Loan Mortgage Corp. | 6.066% | 8/1/37 | 569 | 596 |
1,2 | Federal Home Loan Mortgage Corp. | 6.124% | 8/1/37 | 323 | 338 |
1,2 | Federal Home Loan Mortgage Corp. | 6.510% | 2/1/37 | 1,175 | 1,239 |
1,2 | Federal National Mortgage Assn. | 3.997% | 7/1/35 | 1,893 | 1,925 |
1,2 | Federal National Mortgage Assn. | 4.132% | 5/1/34 | 653 | 666 |
1,2 | Federal National Mortgage Assn. | 4.415% | 7/1/35 | 226 | 232 |
1,2 | Federal National Mortgage Assn. | 4.415% | 8/1/35 | 1,439 | 1,472 |
1,2 | Federal National Mortgage Assn. | 4.569% | 1/1/35 | 407 | 411 |
1,2 | Federal National Mortgage Assn. | 4.572% | 11/1/34 | 1,688 | 1,737 |
1,2 | Federal National Mortgage Assn. | 4.575% | 12/1/34 | 602 | 610 |
1,2 | Federal National Mortgage Assn. | 4.579% | 10/1/36 | 1,291 | 1,325 |
1,2 | Federal National Mortgage Assn. | 4.621% | 8/1/35 | 669 | 688 |
1,2 | Federal National Mortgage Assn. | 4.625% | 9/1/34 | 341 | 350 |
1,2 | Federal National Mortgage Assn. | 4.645% | 11/1/33 | 237 | 244 |
1,2 | Federal National Mortgage Assn. | 4.672% | 10/1/34 | 795 | 805 |
1,2 | Federal National Mortgage Assn. | 4.713% | 11/1/34 | 293 | 296 |
1,2 | Federal National Mortgage Assn. | 4.724% | 8/1/35 | 376 | 385 |
1,2 | Federal National Mortgage Assn. | 4.757% | 9/1/34 | 272 | 277 |
1,2 | Federal National Mortgage Assn. | 4.764% | 6/1/34 | 645 | 664 |
1,2 | Federal National Mortgage Assn. | 4.771% | 4/1/36 | 1,143 | 1,194 |
1,2 | Federal National Mortgage Assn. | 4.775% | 5/1/35 | 951 | 980 |
1,2 | Federal National Mortgage Assn. | 4.796% | 12/1/35 | 600 | 617 |
1,2 | Federal National Mortgage Assn. | 4.826% | 9/1/35 | 750 | 778 |
1,2 | Federal National Mortgage Assn. | 4.840% | 4/1/37 | 566 | 585 |
1,2 | Federal National Mortgage Assn. | 4.879% | 7/1/35 | 887 | 909 |
1,2 | Federal National Mortgage Assn. | 4.951% | 7/1/35 | 464 | 479 |
1,2 | Federal National Mortgage Assn. | 4.965% | 10/1/35 | 1,176 | 1,237 |
1,2 | Federal National Mortgage Assn. | 4.978% | 11/1/33 | 214 | 221 |
1,2 | Federal National Mortgage Assn. | 5.034% | 8/1/37 | 2,468 | 2,550 |
1,2 | Federal National Mortgage Assn. | 5.037% | 11/1/35 | 1,427 | 1,472 |
1,2 | Federal National Mortgage Assn. | 5.055% | 12/1/33 | 313 | 324 |
1,2 | Federal National Mortgage Assn. | 5.067% | 2/1/36 | 204 | 211 |
1,2 | Federal National Mortgage Assn. | 5.072% | 12/1/35 | 1,063 | 1,099 |
1,2 | Federal National Mortgage Assn. | 5.107% | 1/1/36 | 702 | 724 |
1,2 | Federal National Mortgage Assn. | 5.115% | 12/1/35 | 1,124 | 1,179 |
1,2 | Federal National Mortgage Assn. | 5.256% | 3/1/37 | 829 | 861 |
1,2 | Federal National Mortgage Assn. | 5.257% | 8/1/38 | 61 | 64 |
1,2 | Federal National Mortgage Assn. | 5.317% | 7/1/38 | 136 | 142 |
1,2 | Federal National Mortgage Assn. | 5.340% | 12/1/35 | 798 | 828 |
1,2 | Federal National Mortgage Assn. | 5.450% | 5/1/37 | 613 | 638 |
1,2 | Federal National Mortgage Assn. | 5.454% | 2/1/36 | 1,002 | 1,036 |
1,2 | Federal National Mortgage Assn. | 5.575% | 1/1/37 | 869 | 904 |
1,2 | Federal National Mortgage Assn. | 5.608% | 7/1/36 | 422 | 435 |
1,2 | Federal National Mortgage Assn. | 5.629% | 3/1/37 | 776 | 808 |
1,2 | Federal National Mortgage Assn. | 5.659% | 6/1/36 | 275 | 284 |
1,2 | Federal National Mortgage Assn. | 5.665% | 2/1/37 | 595 | 616 |
1,2 | Federal National Mortgage Assn. | 5.673% | 3/1/37 | 1,171 | 1,222 |
1,2 | Federal National Mortgage Assn. | 5.733% | 3/1/37 | 3,377 | 3,522 |
1,2 | Federal National Mortgage Assn. | 5.758% | 4/1/36 | 877 | 910 |
13
Institutional Total Bond Market Index Fund
| | | | Face | Market |
| | | Maturity | Amount | Value¥ |
| | Coupon | Date | ($000) | ($000) |
1,2 | Federal National Mortgage Assn. | 5.764% | 1/1/36 | 468 | 483 |
1,2 | Federal National Mortgage Assn. | 5.766% | 4/1/37 | 4,786 | 4,960 |
1,2 | Federal National Mortgage Assn. | 5.799% | 4/1/37 | 1,183 | 1,235 |
1,2 | Federal National Mortgage Assn. | 5.875% | 9/1/36 | 402 | 418 |
1,2 | Federal National Mortgage Assn. | 5.933% | 11/1/36 | 569 | 596 |
1,2 | Federal National Mortgage Assn. | 6.057% | 8/1/37 | 408 | 425 |
1,2 | Federal National Mortgage Assn. | 6.130% | 6/1/36 | 103 | 108 |
1,2 | Federal National Mortgage Assn. | 6.562% | 9/1/37 | 597 | 627 |
| | | | | 75,680 |
Total U.S. Government and Agency Obligations (Cost $2,461,963) | | 2,513,173 |
Corporate Bonds (23.5%) | | | | |
Asset-Backed/Commercial Mortgage-Backed Securities (3.8%) | | |
2 | Banc of America Commercial Mortgage, Inc. | 6.503% | 4/15/36 | 1,316 | 1,293 |
2 | Banc of America Commercial Mortgage, Inc. | 4.050% | 11/10/38 | 225 | 215 |
2 | Banc of America Commercial Mortgage, Inc. | 4.153% | 11/10/38 | 300 | 282 |
2 | Banc of America Commercial Mortgage, Inc. | 4.877% | 7/10/42 | 400 | 359 |
2 | Banc of America Commercial Mortgage, Inc. | 4.727% | 7/10/43 | 275 | 185 |
2 | Banc of America Commercial Mortgage, Inc. | 5.372% | 9/10/45 | 1,585 | 1,291 |
2,3 | Banc of America Commercial Mortgage, Inc. | 5.421% | 9/10/45 | 25 | 13 |
2 | Banc of America Commercial Mortgage, Inc. | 5.115% | 10/10/45 | 875 | 739 |
2,3 | Banc of America Commercial Mortgage, Inc. | 5.120% | 10/10/45 | 875 | 744 |
2,3 | Banc of America Commercial Mortgage, Inc. | 5.176% | 10/10/45 | 40 | 26 |
2 | Banc of America Commercial Mortgage, Inc. | 5.634% | 7/10/46 | 1,275 | 1,091 |
2 | Banc of America Commercial Mortgage, Inc. | 5.675% | 7/10/46 | 230 | 134 |
2,3 | Banc of America Commercial Mortgage, Inc. | 5.351% | 9/10/47 | 50 | 32 |
2 | Banc of America Commercial Mortgage, Inc. | 5.414% | 9/10/47 | 800 | 668 |
2,3 | Banc of America Commercial Mortgage, Inc. | 6.354% | 2/10/51 | 1,525 | 1,162 |
2 | Bear Stearns Commercial Mortgage Securities, Inc. | 5.610% | 11/15/33 | 1,180 | 1,153 |
2 | Bear Stearns Commercial Mortgage Securities, Inc. | 5.629% | 4/12/38 | 677 | 586 |
2,3 | Bear Stearns Commercial Mortgage Securities, Inc. | 5.630% | 4/12/38 | 250 | 128 |
2 | Bear Stearns Commercial Mortgage Securities, Inc. | 4.830% | 8/15/38 | 125 | 122 |
2,3 | Bear Stearns Commercial Mortgage Securities, Inc. | 5.942% | 9/11/38 | 240 | 142 |
2 | Bear Stearns Commercial Mortgage Securities, Inc. | 5.622% | 3/11/39 | 1,685 | 1,417 |
2 | Bear Stearns Commercial Mortgage Securities, Inc. | 4.680% | 8/13/39 | 705 | 656 |
2 | Bear Stearns Commercial Mortgage Securities, Inc. | 4.740% | 3/13/40 | 205 | 197 |
2 | Bear Stearns Commercial Mortgage Securities, Inc. | 5.856% | 6/11/40 | 2,300 | 2,197 |
2 | Bear Stearns Commercial Mortgage Securities, Inc. | 5.582% | 9/11/41 | 170 | 107 |
2 | Bear Stearns Commercial Mortgage Securities, Inc. | 4.521% | 11/11/41 | 275 | 265 |
2 | Bear Stearns Commercial Mortgage Securities, Inc. | 5.742% | 9/11/42 | 1,000 | 836 |
2 | Bear Stearns Commercial Mortgage Securities, Inc. | 5.793% | 9/11/42 | 350 | 315 |
2 | Bear Stearns Commercial Mortgage Securities, Inc. | 5.127% | 10/12/42 | 575 | 572 |
2 | Bear Stearns Commercial Mortgage Securities, Inc. | 5.298% | 10/12/42 | 615 | 535 |
2,3 | Bear Stearns Commercial Mortgage Securities, Inc. | 5.513% | 1/12/45 | 75 | 40 |
2 | Bear Stearns Commercial Mortgage Securities, Inc. | 5.613% | 6/11/50 | 700 | 643 |
2 | Bear Stearns Commercial Mortgage Securities, Inc. | 5.694% | 6/11/50 | 2,725 | 2,220 |
2 | Bear Stearns Commercial Mortgage Securities, Inc. | 5.700% | 6/11/50 | 500 | 386 |
2,3 | Bear Stearns Commercial Mortgage Securities, Inc. | 5.915% | 6/11/50 | 450 | 249 |
2 | Capital Auto Receivables Asset Trust | 4.680% | 10/15/12 | 1,150 | 1,178 |
2 | Capital One Multi-Asset Execution Trust | 5.300% | 2/18/14 | 425 | 444 |
2 | Capital One Multi-Asset Execution Trust | 5.050% | 12/17/18 | 2,695 | 2,671 |
2 | Capital One Multi-Asset Execution Trust | 5.750% | 7/15/20 | 200 | 208 |
2 | CDC Commercial Mortgage Trust | 5.676% | 11/15/30 | 600 | 558 |
2 | Chase Issuance Trust | 4.650% | 12/17/12 | 575 | 591 |
2 | Chase Issuance Trust | 4.650% | 3/15/15 | 2,300 | 2,378 |
2 | Chase Issuance Trust | 5.400% | 7/15/15 | 425 | 450 |
14
Institutional Total Bond Market Index Fund
| | | | Face | Market |
| | | Maturity | Amount | Value¥ |
| | Coupon | Date | ($000) | ($000) |
2 | Citibank Credit Card Issuance Trust | 5.450% | 5/10/13 | 275 | 289 |
2 | Citibank Credit Card Issuance Trust | 4.900% | 6/23/16 | 850 | 883 |
2 | Citibank Credit Card Issuance Trust | 4.150% | 7/7/17 | 225 | 217 |
2 | Citibank Credit Card Issuance Trust | 5.650% | 9/20/19 | 175 | 178 |
2 | Citigroup Commercial Mortgage Trust | 4.623% | 10/15/41 | 225 | 198 |
2 | Citigroup Commercial Mortgage Trust | 4.830% | 5/15/43 | 45 | 31 |
2,3 | Citigroup Commercial Mortgage Trust | 5.917% | 3/15/49 | 950 | 773 |
2,3 | Citigroup Commercial Mortgage Trust | 5.888% | 12/10/49 | 525 | 407 |
2,3 | Citigroup/Deutsche Bank | | | | |
| Commercial Mortgage Trust | 5.399% | 7/15/44 | 500 | 319 |
2 | Citigroup/Deutsche Bank | | | | |
| Commercial Mortgage Trust | 5.399% | 7/15/44 | 2,165 | 1,920 |
2 | Citigroup/Deutsche Bank | | | | |
| Commercial Mortgage Trust | 5.886% | 11/15/44 | 1,290 | 1,011 |
2 | Citigroup/Deutsche Bank | | | | |
| Commercial Mortgage Trust | 5.648% | 10/15/48 | 500 | 315 |
2 | Citigroup/Deutsche Bank | | | | |
| Commercial Mortgage Trust | 5.205% | 12/11/49 | 1,450 | 1,345 |
2 | Citigroup/Deutsche Bank | | | | |
| Commercial Mortgage Trust | 5.322% | 12/11/49 | 1,025 | 749 |
2,4 | Commercial Mortgage Lease-Backed Certificates | 6.746% | 6/20/31 | 311 | 320 |
2 | Commercial Mortgage Pass Through Certificates | 5.116% | 6/10/44 | 1,151 | 965 |
2 | Commercial Mortgage Pass-Through Certificates | 5.960% | 6/10/46 | 1,690 | 1,356 |
2 | Commercial Mortgage Pass-Through Certificates | 5.248% | 12/10/46 | 175 | 165 |
2,3 | Commercial Mortgage Pass-Through Certificates | 6.010% | 12/10/49 | 1,225 | 983 |
2 | Countrywide Home Loans | 4.099% | 5/25/33 | 82 | 67 |
2,3 | Credit Suisse First Boston | | | | |
| Mortgage Securities Corp. | 4.750% | 1/15/37 | 525 | 469 |
2 | Credit Suisse First Boston | | | | |
| Mortgage Securities Corp. | 4.877% | 4/15/37 | 10 | 7 |
2 | Credit Suisse First Boston | | | | |
| Mortgage Securities Corp. | 3.936% | 5/15/38 | 800 | 725 |
2,3 | Credit Suisse First Boston | | | | |
| Mortgage Securities Corp. | 5.100% | 8/15/38 | 65 | 40 |
2 | Credit Suisse First Boston | | | | |
| Mortgage Securities Corp. | 5.100% | 8/15/38 | 2,025 | 1,729 |
2 | Credit Suisse Mortgage Capital Certificates | 6.020% | 6/15/38 | 1,325 | 1,100 |
2 | Credit Suisse Mortgage Capital Certificates | 6.020% | 6/15/38 | 64 | 39 |
2 | Credit Suisse Mortgage Capital Certificates | 5.609% | 2/15/39 | 2,425 | 1,993 |
2,3 | Credit Suisse Mortgage Capital Certificates | 5.732% | 2/15/39 | 245 | 154 |
2,3 | Credit Suisse Mortgage Capital Certificates | 5.912% | 6/15/39 | 2,050 | 1,376 |
2 | Credit Suisse Mortgage Capital Certificates | 5.509% | 9/15/39 | 100 | 59 |
2 | Credit Suisse Mortgage Capital Certificates | 5.311% | 12/15/39 | 425 | 296 |
2 | Credit Suisse Mortgage Capital Certificates | 5.383% | 2/15/40 | 425 | 287 |
2,3 | CWCapital Cobalt | 6.015% | 5/15/46 | 1,475 | 1,011 |
2 | DaimlerChrysler Auto Trust | 4.200% | 7/8/10 | 36 | 36 |
2 | DaimlerChrysler Auto Trust | 5.330% | 8/8/10 | 56 | 57 |
2 | DaimlerChrysler Auto Trust | 3.700% | 6/8/12 | 1,075 | 1,076 |
2 | Discover Card Master Trust | 5.650% | 12/15/15 | 1,525 | 1,579 |
2 | Discover Card Master Trust | 5.650% | 3/16/20 | 425 | 412 |
2,3 | First Union Commercial Mortgage Trust | 6.754% | 10/15/35 | 509 | 512 |
2 | Ford Credit Auto Owner Trust | 4.370% | 10/15/12 | 1,075 | 1,115 |
2 | GE Capital Commercial Mortgage Corp. | 5.994% | 12/10/35 | 65 | 63 |
2,3 | GE Capital Commercial Mortgage Corp. | 5.515% | 3/10/44 | 1,625 | 1,323 |
2,3 | GE Capital Commercial Mortgage Corp. | 5.513% | 11/10/45 | 250 | 158 |
2 | GE Capital Credit Card Master Note Trust | 5.080% | 9/15/12 | 2,900 | 2,920 |
15
Institutional Total Bond Market Index Fund
| | | | Face | Market |
| | | Maturity | Amount | Value¥ |
| | Coupon | Date | ($000) | ($000) |
2 | GMAC Commercial Mortgage Securities, Inc. | 7.455% | 8/16/33 | 224 | 226 |
2 | GMAC Commercial Mortgage Securities, Inc. | 4.908% | 3/10/38 | 100 | 84 |
2 | GMAC Commercial Mortgage Securities, Inc. | 4.646% | 4/10/40 | 245 | 234 |
2 | GMAC Commercial Mortgage Securities, Inc. | 4.864% | 12/10/41 | 450 | 380 |
2 | GMAC Commercial Mortgage Securities, Inc. | 4.754% | 5/10/43 | 100 | 79 |
2 | Greenwich Capital Commercial Funding Corp. | 4.948% | 1/11/35 | 475 | 408 |
2 | Greenwich Capital Commercial Funding Corp. | 5.317% | 6/10/36 | 875 | 821 |
2 | Greenwich Capital Commercial Funding Corp. | 5.117% | 4/10/37 | 325 | 319 |
2 | Greenwich Capital Commercial Funding Corp. | 5.224% | 4/10/37 | 1,550 | 1,339 |
2,3 | Greenwich Capital Commercial Funding Corp. | 5.277% | 4/10/37 | 225 | 145 |
2,3 | Greenwich Capital Commercial Funding Corp. | 6.115% | 7/10/38 | 150 | 81 |
2 | Greenwich Capital Commercial Funding Corp. | 5.475% | 3/10/39 | 50 | 26 |
2 | Greenwich Capital Commercial Funding Corp. | 4.799% | 8/10/42 | 600 | 536 |
2 | GS Mortgage Securities Corp. II | 5.506% | 4/10/38 | 925 | 906 |
2,3 | GS Mortgage Securities Corp. II | 5.553% | 4/10/38 | 300 | 256 |
2,3 | GS Mortgage Securities Corp. II | 5.622% | 4/10/38 | 40 | 23 |
2 | GS Mortgage Securities Corp. II | 5.396% | 8/10/38 | 1,600 | 1,498 |
2 | Harley-Davidson Motorcycle Trust | 5.210% | 6/17/13 | 2,815 | 2,858 |
2 | Honda Auto Receivables Owner Trust | 5.120% | 10/15/10 | 483 | 485 |
2 | Honda Auto Receivables Owner Trust | 4.880% | 9/18/14 | 525 | 547 |
2 | JPMorgan Chase Commercial Mortgage Securities | 6.260% | 3/15/33 | 225 | 227 |
2 | JPMorgan Chase Commercial Mortgage Securities | 5.050% | 12/12/34 | 250 | 235 |
2,3 | JPMorgan Chase Commercial Mortgage Securities | 4.948% | 9/12/37 | 40 | 24 |
2 | JPMorgan Chase Commercial Mortgage Securities | 4.404% | 1/12/39 | 1,120 | 924 |
2,3 | JPMorgan Chase Commercial Mortgage Securities | 5.551% | 6/12/41 | 1,615 | 1,458 |
2 | JPMorgan Chase Commercial Mortgage Securities | 4.780% | 7/15/42 | 135 | 85 |
2,3 | JPMorgan Chase Commercial Mortgage Securities | 5.498% | 1/12/43 | 25 | 16 |
2 | JPMorgan Chase Commercial Mortgage Securities | 5.160% | 4/15/43 | 1,220 | 1,226 |
2,3 | JPMorgan Chase Commercial Mortgage Securities | 5.629% | 12/12/44 | 200 | 111 |
2,3 | JPMorgan Chase Commercial Mortgage Securities | 5.386% | 12/15/44 | 200 | 121 |
2 | JPMorgan Chase Commercial Mortgage Securities | 6.065% | 4/15/45 | 1,600 | 1,245 |
2 | JPMorgan Chase Commercial Mortgage Securities | 6.065% | 4/15/45 | 75 | 45 |
2 | JPMorgan Chase Commercial Mortgage Securities | 5.440% | 5/15/45 | 25 | 15 |
2 | JPMorgan Chase Commercial Mortgage Securities | 5.447% | 5/15/45 | 350 | 281 |
2 | JPMorgan Chase Commercial Mortgage Securities | 5.991% | 6/15/49 | 625 | 579 |
2 | JPMorgan Chase Commercial Mortgage Securities | 6.006% | 6/15/49 | 600 | 473 |
2 | JPMorgan Chase Commercial Mortgage Securities | 5.794% | 2/12/51 | 2,300 | 1,704 |
2 | JPMorgan Chase Commercial Mortgage Securities | 5.855% | 2/12/51 | 600 | 535 |
2 | JPMorgan Chase Commercial Mortgage Securities | 5.716% | 2/15/51 | 300 | 172 |
2,3 | JPMorgan Chase Commercial Mortgage Securities | 5.882% | 2/15/51 | 1,425 | 1,058 |
2,3 | LB Commerical Conduit Mortgage Trust | 6.150% | 7/15/44 | 655 | 262 |
2 | LB-UBS Commercial Mortgage Trust | 7.370% | 8/15/26 | 427 | 416 |
2 | LB-UBS Commercial Mortgage Trust | 4.786% | 10/15/29 | 1,050 | 911 |
2 | LB-UBS Commercial Mortgage Trust | 4.742% | 2/15/30 | 695 | 615 |
2 | LB-UBS Commercial Mortgage Trust | 4.553% | 7/15/30 | 80 | 79 |
2 | LB-UBS Commercial Mortgage Trust | 5.197% | 11/15/30 | 775 | 662 |
2 | LB-UBS Commercial Mortgage Trust | 5.217% | 2/15/31 | 50 | 30 |
2 | LB-UBS Commercial Mortgage Trust | 4.853% | 9/15/31 | 1,075 | 1,048 |
2 | LB-UBS Commercial Mortgage Trust | 4.166% | 5/15/32 | 325 | 296 |
2,3 | LB-UBS Commercial Mortgage Trust | 5.661% | 3/15/39 | 1,720 | 1,428 |
2 | LB-UBS Commercial Mortgage Trust | 5.413% | 9/15/39 | 35 | 22 |
2 | LB-UBS Commercial Mortgage Trust | 5.424% | 2/15/40 | 275 | 201 |
2 | LB-UBS Commercial Mortgage Trust | 5.430% | 2/15/40 | 1,555 | 1,134 |
2 | LB-UBS Commercial Mortgage Trust | 5.455% | 2/15/40 | 175 | 86 |
2,3 | LB-UBS Commercial Mortgage Trust | 5.493% | 2/15/40 | 125 | 52 |
2,3 | LB-UBS Commercial Mortgage Trust | 6.317% | 4/15/41 | 1,675 | 1,376 |
16
Institutional Total Bond Market Index Fund
| | | | Face | Market |
| | | Maturity | Amount | Value¥ |
| | Coupon | Date | ($000) | ($000) |
2 | LB-UBS Commercial Mortgage Trust | 5.866% | 9/15/45 | 1,595 | 1,120 |
2 | LB-UBS Commerical Mortgage Trust | 4.960% | 12/15/31 | 1,075 | 970 |
2 | MBNA Master Credit Card Trust | 7.000% | 2/15/12 | 2,675 | 2,705 |
2 | Merrill Lynch Mortgage Trust | 5.236% | 11/12/35 | 645 | 571 |
2 | Merrill Lynch Mortgage Trust | 5.107% | 7/12/38 | 85 | 54 |
2 | Merrill Lynch Mortgage Trust | 5.839% | 5/12/39 | 1,140 | 903 |
2,3 | Merrill Lynch Mortgage Trust | 5.840% | 5/12/39 | 100 | 58 |
2 | Merrill Lynch Mortgage Trust | 5.782% | 8/12/43 | 205 | 125 |
2,3 | Merrill Lynch Mortgage Trust | 5.291% | 1/12/44 | 825 | 689 |
2,3 | Merrill Lynch Mortgage Trust | 6.022% | 6/12/50 | 185 | 94 |
2 | Merrill Lynch Mortgage Trust | 5.425% | 2/12/51 | 225 | 202 |
2 | Merrill Lynch Mortgage Trust | 5.690% | 2/12/51 | 750 | 488 |
2 | Merrill Lynch/Countrywide | | | | |
| Commercial Mortgage Trust | 5.456% | 7/12/46 | 150 | 84 |
2 | Merrill Lynch/Countrywide | | | | |
| Commercial Mortgage Trust | 5.378% | 8/12/48 | 1,350 | 1,000 |
2 | Merrill Lynch/Countrywide | | | | |
| Commercial Mortgage Trust | 5.590% | 9/12/49 | 675 | 633 |
2 | Merrill Lynch/Countrywide | | | | |
| Commercial Mortgage Trust | 5.700% | 9/12/49 | 1,875 | 1,421 |
2 | Morgan Stanley Capital I | 4.970% | 4/14/40 | 455 | 413 |
2,3 | Morgan Stanley Capital I | 5.110% | 6/15/40 | 500 | 421 |
2 | Morgan Stanley Capital I | 5.270% | 6/13/41 | 750 | 677 |
2,3 | Morgan Stanley Capital I | 5.984% | 8/12/41 | 45 | 23 |
2 | Morgan Stanley Capital I | 4.970% | 12/15/41 | 600 | 567 |
2 | Morgan Stanley Capital I | 5.168% | 1/14/42 | 350 | 328 |
2,3 | Morgan Stanley Capital I | 5.803% | 6/11/42 | 375 | 320 |
2 | Morgan Stanley Capital I | 4.989% | 8/13/42 | 1,605 | 1,404 |
2 | Morgan Stanley Capital I | 5.230% | 9/15/42 | 1,500 | 1,337 |
2 | Morgan Stanley Capital I | 5.770% | 10/15/42 | 500 | 425 |
2,3 | Morgan Stanley Capital I | 5.946% | 10/15/42 | 45 | 25 |
2,3 | Morgan Stanley Capital I | 5.378% | 11/14/42 | 1,125 | 978 |
2,3 | Morgan Stanley Capital I | 5.378% | 11/14/42 | 25 | 16 |
2 | Morgan Stanley Capital I | 6.457% | 1/11/43 | 1,250 | 1,094 |
2 | Morgan Stanley Capital I | 5.332% | 12/15/43 | 205 | 156 |
2,3 | Morgan Stanley Capital I | 5.558% | 3/12/44 | 1,850 | 1,522 |
2,3 | Morgan Stanley Capital I | 5.773% | 7/12/44 | 221 | 112 |
2,3 | Morgan Stanley Capital I | 5.877% | 4/15/49 | 325 | 154 |
2,3 | Morgan Stanley Capital I | 6.076% | 6/11/49 | 260 | 135 |
2,3 | Morgan Stanley Capital I | 5.544% | 11/12/49 | 335 | 184 |
2 | Morgan Stanley Capital I | 5.809% | 12/12/49 | 800 | 694 |
2 | Morgan Stanley Capital I | 5.090% | 10/12/52 | 500 | 492 |
2,3 | Morgan Stanley Capital I | 5.204% | 10/12/52 | 225 | 115 |
2 | Morgan Stanley Dean Witter Capital I | 6.660% | 2/15/33 | 199 | 196 |
2 | Morgan Stanley Dean Witter Capital I | 6.390% | 7/15/33 | 241 | 244 |
2 | Morgan Stanley Dean Witter Capital I | 6.390% | 10/15/35 | 205 | 206 |
2 | Morgan Stanley Dean Witter Capital I | 4.740% | 11/13/36 | 195 | 188 |
2 | Morgan Stanley Dean Witter Capital I | 5.980% | 1/15/39 | 1,485 | 1,515 |
2 | Nissan Auto Receivables Owner Trust | 5.050% | 11/17/14 | 425 | 445 |
2 | PG&E Energy Recovery Funding LLC | 4.140% | 9/25/12 | 135 | 137 |
2 | PG&E Energy Recovery Funding LLC | 5.030% | 3/25/14 | 302 | 316 |
2 | PSE&G Transition Funding LLC | 6.890% | 12/15/17 | 1,075 | 1,219 |
2 | Public Service New Hampshire Funding LLC | 6.480% | 5/1/15 | 249 | 267 |
2 | Salomon Brothers Mortgage Securities VII | 5.552% | 9/25/33 | 171 | 146 |
2 | USAA Auto Owner Trust | 5.360% | 2/15/11 | 112 | 112 |
2 | USAA Auto Owner Trust | 4.710% | 2/18/14 | 825 | 857 |
17
Institutional Total Bond Market Index Fund
| | | | Face | Market |
| | | Maturity | Amount | Value¥ |
| | Coupon | Date | ($000) | ($000) |
2,3 | Wachovia Bank Commercial Mortgage Trust | 5.125% | 8/15/35 | 250 | 227 |
2 | Wachovia Bank Commercial Mortgage Trust | 4.719% | 1/15/41 | 225 | 215 |
2 | Wachovia Bank Commercial Mortgage Trust | 4.748% | 2/15/41 | 1,850 | 1,620 |
2 | Wachovia Bank Commercial Mortgage Trust | 5.001% | 7/15/41 | 598 | 574 |
2,3 | Wachovia Bank Commercial Mortgage Trust | 5.426% | 7/15/41 | 1,150 | 983 |
2 | Wachovia Bank Commercial Mortgage Trust | 4.803% | 10/15/41 | 600 | 545 |
2,3 | Wachovia Bank Commercial Mortgage Trust | 5.083% | 3/15/42 | 1,200 | 1,031 |
2 | Wachovia Bank Commercial Mortgage Trust | 5.118% | 7/15/42 | 879 | 754 |
2,3 | Wachovia Bank Commercial Mortgage Trust | 5.926% | 5/15/43 | 900 | 734 |
2,3 | Wachovia Bank Commercial Mortgage Trust | 5.926% | 5/15/43 | 375 | 219 |
2 | Wachovia Bank Commercial Mortgage Trust | 4.699% | 5/15/44 | 950 | 817 |
2,3 | Wachovia Bank Commercial Mortgage Trust | 5.384% | 10/15/44 | 1,975 | 1,800 |
2,3 | Wachovia Bank Commercial Mortgage Trust | 5.440% | 12/15/44 | 2,225 | 1,924 |
2,3 | Wachovia Bank Commercial Mortgage Trust | 5.490% | 12/15/44 | 15 | 9 |
2,3 | Wachovia Bank Commercial Mortgage Trust | 6.158% | 6/15/45 | 65 | 34 |
2,3 | Wachovia Bank Commercial Mortgage Trust | 5.818% | 5/15/46 | 305 | 151 |
2 | Wachovia Bank Commercial Mortgage Trust | 5.313% | 11/15/48 | 650 | 536 |
2 | Wachovia Bank Commercial Mortgage Trust | 5.339% | 11/15/48 | 800 | 438 |
2 | World Omni Auto Receivables Trust | 3.940% | 10/15/12 | 1,075 | 1,090 |
| | | | | 133,166 |
Finance (7.9%) | | | | |
| Banking (5.3%) | | | | |
| Abbey National PLC | 7.950% | 10/26/29 | 550 | 505 |
5 | American Express Bank, FSB | 3.150% | 12/9/11 | 975 | 1,009 |
| American Express Bank, FSB | 5.550% | 10/17/12 | 300 | 302 |
| American Express Bank, FSB | 5.500% | 4/16/13 | 875 | 858 |
| American Express Bank, FSB | 6.000% | 9/13/17 | 225 | 208 |
| American Express Centurion Bank | 5.550% | 10/17/12 | 300 | 295 |
| American Express Centurion Bank | 5.950% | 6/12/17 | 150 | 139 |
| American Express Centurion Bank | 6.000% | 9/13/17 | 325 | 301 |
| American Express Co. | 7.250% | 5/20/14 | 500 | 519 |
| American Express Co. | 5.500% | 9/12/16 | 225 | 208 |
| American Express Co. | 6.150% | 8/28/17 | 500 | 467 |
| American Express Co. | 8.125% | 5/20/19 | 500 | 521 |
2 | American Express Co. | 6.800% | 9/1/66 | 355 | 254 |
| American Express Credit Corp. | 5.000% | 12/2/10 | 425 | 434 |
| American Express Credit Corp. | 5.875% | 5/2/13 | 600 | 601 |
| American Express Credit Corp. | 7.300% | 8/20/13 | 100 | 104 |
4 | American Express Travel | 5.250% | 11/21/11 | 550 | 546 |
| AmSouth Bank NA | 5.200% | 4/1/15 | 325 | 252 |
| Banc One Corp. | 7.625% | 10/15/26 | 75 | 79 |
4 | Banco Bilbao Vizcaya ARG | 5.750% | 7/20/17 | 575 | 530 |
| Bank of America Corp. | 4.500% | 8/1/10 | 755 | 770 |
| Bank of America Corp. | 4.250% | 10/1/10 | 350 | 353 |
| Bank of America Corp. | 4.375% | 12/1/10 | 490 | 496 |
| Bank of America Corp. | 5.375% | 8/15/11 | 525 | 540 |
| Bank of America Corp. | 6.250% | 4/15/12 | 300 | 308 |
5 | Bank of America Corp. | 2.100% | 4/30/12 | 3,050 | 3,061 |
5 | Bank of America Corp. | 3.125% | 6/15/12 | 1,500 | 1,549 |
5 | Bank of America Corp. | 2.375% | 6/22/12 | 225 | 227 |
| Bank of America Corp. | 5.375% | 9/11/12 | 375 | 376 |
| Bank of America Corp. | 4.875% | 9/15/12 | 675 | 673 |
| Bank of America Corp. | 4.875% | 1/15/13 | 250 | 246 |
| Bank of America Corp. | 4.900% | 5/1/13 | 675 | 659 |
| Bank of America Corp. | 7.375% | 5/15/14 | 1,000 | 1,034 |
| Bank of America Corp. | 5.375% | 6/15/14 | 150 | 145 |
18
Institutional Total Bond Market Index Fund
| | | | Face | Market |
| | | Maturity | Amount | Value¥ |
| | Coupon | Date | ($000) | ($000) |
| Bank of America Corp. | 5.125% | 11/15/14 | 775 | 731 |
| Bank of America Corp. | 4.750% | 8/1/15 | 225 | 206 |
| Bank of America Corp. | 5.250% | 12/1/15 | 125 | 112 |
| Bank of America Corp. | 5.750% | 8/15/16 | 150 | 134 |
| Bank of America Corp. | 5.625% | 10/14/16 | 425 | 386 |
| Bank of America Corp. | 5.420% | 3/15/17 | 900 | 745 |
| Bank of America Corp. | 6.000% | 9/1/17 | 50 | 46 |
| Bank of America Corp. | 5.750% | 12/1/17 | 75 | 67 |
| Bank of America Corp. | 5.650% | 5/1/18 | 1,275 | 1,128 |
| Bank of America Corp. | 7.625% | 6/1/19 | 600 | 602 |
| Bank of America Corp. | 6.800% | 3/15/28 | 400 | 336 |
| Bank of America Corp. | 6.000% | 10/15/36 | 400 | 322 |
| Bank of America Corp. | 6.500% | 9/15/37 | 210 | 179 |
5 | Bank of America, NA | 1.700% | 12/23/10 | 750 | 759 |
| Bank of America, NA | 6.100% | 6/15/17 | 400 | 354 |
| Bank of New York Mellon | 4.950% | 1/14/11 | 475 | 491 |
| Bank of New York Mellon | 4.950% | 11/1/12 | 875 | 928 |
| Bank of New York Mellon | 5.125% | 8/27/13 | 50 | 53 |
| Bank of New York Mellon | 4.300% | 5/15/14 | 325 | 332 |
| Bank of New York Mellon | 4.950% | 3/15/15 | 600 | 598 |
| Bank of New York Mellon | 5.450% | 5/15/19 | 250 | 256 |
4 | Bank of Scotland PLC | 5.250% | 2/21/17 | 700 | 574 |
5 | Bank of the West | 2.150% | 3/27/12 | 675 | 679 |
| Bank One Corp. | 7.875% | 8/1/10 | 950 | 1,002 |
| Bank One Corp. | 5.900% | 11/15/11 | 320 | 334 |
| Bank One Corp. | 5.250% | 1/30/13 | 325 | 329 |
| Bank One Corp. | 4.900% | 4/30/15 | 350 | 346 |
| Barclays Bank PLC | 5.450% | 9/12/12 | 150 | 157 |
| Barclays Bank PLC | 6.750% | 5/22/19 | 400 | 399 |
| BB&T Capital Trust II | 6.750% | 6/7/36 | 450 | 342 |
| BB&T Corp. | 6.500% | 8/1/11 | 50 | 52 |
| BB&T Corp. | 4.750% | 10/1/12 | 625 | 628 |
| BB&T Corp. | 5.700% | 4/30/14 | 150 | 153 |
| BB&T Corp. | 5.200% | 12/23/15 | 325 | 318 |
| BB&T Corp. | 5.625% | 9/15/16 | 300 | 269 |
| BB&T Corp. | 6.850% | 4/30/19 | 125 | 131 |
| BB&T Corp. | 5.250% | 11/1/19 | 500 | 448 |
| Bear Stearns Co., Inc. | 4.500% | 10/28/10 | 175 | 180 |
| Bear Stearns Co., Inc. | 5.350% | 2/1/12 | 1,550 | 1,619 |
| Bear Stearns Co., Inc. | 6.950% | 8/10/12 | 205 | 224 |
| Bear Stearns Co., Inc. | 5.700% | 11/15/14 | 625 | 643 |
| Bear Stearns Co., Inc. | 5.300% | 10/30/15 | 175 | 175 |
| Bear Stearns Co., Inc. | 5.550% | 1/22/17 | 550 | 512 |
| Bear Stearns Co., Inc. | 6.400% | 10/2/17 | 755 | 763 |
| Bear Stearns Co., Inc. | 7.250% | 2/1/18 | 775 | 822 |
| Capital One Bank | 8.800% | 7/15/19 | 350 | 356 |
| Capital One Bank USA N.A. | 5.750% | 9/15/10 | 600 | 620 |
| Capital One Capital III | 7.686% | 8/15/36 | 250 | 178 |
| Capital One Capital IV | 6.745% | 2/17/37 | 150 | 98 |
| Capital One Financial Corp. | 5.700% | 9/15/11 | 175 | 176 |
| Capital One Financial Corp. | 4.800% | 2/21/12 | 75 | 74 |
| Capital One Financial Corp. | 5.500% | 6/1/15 | 200 | 185 |
| Capital One Financial Corp. | 6.150% | 9/1/16 | 400 | 351 |
| Capital One Financial Corp. | 5.250% | 2/21/17 | 500 | 433 |
| Charter One Bank N.A. | 5.500% | 4/26/11 | 425 | 432 |
5 | Citibank, NA | 1.625% | 3/30/11 | 550 | 555 |
19
Institutional Total Bond Market Index Fund
| | | | Face | Market |
| | | Maturity | Amount | Value¥ |
| | Coupon | Date | ($000) | ($000) |
5 | Citibank, NA | 1.500% | 7/12/11 | 600 | 601 |
2,4 | Citicorp Lease Pass-Through Trust | 8.040% | 12/15/19 | 100 | 91 |
5 | Citigroup Funding, Inc. | 2.000% | 3/30/12 | 550 | 552 |
5 | Citigroup Funding, Inc. | 2.125% | 7/12/12 | 250 | 250 |
| Citigroup, Inc. | 4.625% | 8/3/10 | 75 | 76 |
| Citigroup, Inc. | 6.500% | 1/18/11 | 700 | 711 |
| Citigroup, Inc. | 5.125% | 2/14/11 | 50 | 50 |
5 | Citigroup, Inc. | 1.375% | 5/5/11 | 1,925 | 1,928 |
| Citigroup, Inc. | 5.100% | 9/29/11 | 1,050 | 1,041 |
5 | Citigroup, Inc. | 2.875% | 12/9/11 | 1,150 | 1,183 |
| Citigroup, Inc. | 6.000% | 2/21/12 | 200 | 198 |
| Citigroup, Inc. | 5.250% | 2/27/12 | 875 | 857 |
5 | Citigroup, Inc. | 2.125% | 4/30/12 | 2,650 | 2,659 |
5 | Citigroup, Inc. | 1.875% | 5/7/12 | 1,225 | 1,220 |
| Citigroup, Inc. | 5.500% | 8/27/12 | 310 | 299 |
| Citigroup, Inc. | 5.625% | 8/27/12 | 1,350 | 1,258 |
| Citigroup, Inc. | 5.300% | 10/17/12 | 650 | 627 |
| Citigroup, Inc. | 5.500% | 4/11/13 | 230 | 217 |
| Citigroup, Inc. | 6.500% | 8/19/13 | 975 | 947 |
| Citigroup, Inc. | 5.125% | 5/5/14 | 350 | 319 |
| Citigroup, Inc. | 5.000% | 9/15/14 | 3,259 | 2,732 |
| Citigroup, Inc. | 4.700% | 5/29/15 | 125 | 106 |
| Citigroup, Inc. | 5.300% | 1/7/16 | 150 | 132 |
| Citigroup, Inc. | 6.000% | 8/15/17 | 825 | 721 |
| Citigroup, Inc. | 6.125% | 11/21/17 | 875 | 776 |
| Citigroup, Inc. | 6.125% | 5/15/18 | 550 | 480 |
| Citigroup, Inc. | 8.500% | 5/22/19 | 925 | 940 |
| Citigroup, Inc. | 6.625% | 6/15/32 | 1,275 | 1,018 |
| Citigroup, Inc. | 5.875% | 2/22/33 | 1,150 | 863 |
| Citigroup, Inc. | 6.000% | 10/31/33 | 225 | 165 |
| Citigroup, Inc. | 5.850% | 12/11/34 | 175 | 138 |
| Citigroup, Inc. | 5.875% | 5/29/37 | 50 | 39 |
| Citigroup, Inc. | 6.875% | 3/5/38 | 400 | 358 |
| Comerica Bank | 5.750% | 11/21/16 | 825 | 653 |
| Comerica Bank | 5.200% | 8/22/17 | 200 | 147 |
| Compass Bank | 6.400% | 10/1/17 | 200 | 181 |
| Compass Bank | 5.900% | 4/1/26 | 100 | 64 |
4 | Corestates Capital I | 8.000% | 12/15/26 | 325 | 245 |
| Countrywide Financial Corp. | 6.250% | 5/15/16 | 45 | 40 |
| Countrywide Home Loan | 4.125% | 9/15/09 | 400 | 401 |
| Countrywide Home Loan | 4.000% | 3/22/11 | 300 | 294 |
| Credit Suisse First Boston USA, Inc. | 4.875% | 8/15/10 | 1,050 | 1,087 |
| Credit Suisse First Boston USA, Inc. | 5.250% | 3/2/11 | 400 | 420 |
| Credit Suisse First Boston USA, Inc. | 5.500% | 8/16/11 | 225 | 238 |
| Credit Suisse First Boston USA, Inc. | 6.125% | 11/15/11 | 325 | 349 |
| Credit Suisse First Boston USA, Inc. | 6.500% | 1/15/12 | 290 | 314 |
| Credit Suisse First Boston USA, Inc. | 5.500% | 8/15/13 | 1,475 | 1,531 |
| Credit Suisse First Boston USA, Inc. | 5.125% | 1/15/14 | 75 | 77 |
| Credit Suisse First Boston USA, Inc. | 4.875% | 1/15/15 | 1,150 | 1,164 |
| Credit Suisse First Boston USA, Inc. | 5.125% | 8/15/15 | 425 | 434 |
| Credit Suisse First Boston USA, Inc. | 7.125% | 7/15/32 | 600 | 640 |
2 | Credit Suisse First Boston USA, Inc. | 5.860% | 5/15/49 | 350 | 224 |
| Credit Suisse New York | 5.000% | 5/15/13 | 325 | 324 |
| Credit Suisse New York | 5.500% | 5/1/14 | 675 | 703 |
| Deutsche Bank AG London | 5.375% | 10/12/12 | 1,025 | 1,089 |
| Deutsche Bank AG London | 4.875% | 5/20/13 | 750 | 771 |
20
Institutional Total Bond Market Index Fund
| | | | Face | Market |
| | | Maturity | Amount | Value¥ |
| | Coupon | Date | ($000) | ($000) |
| Deutsche Bank AG London | 6.000% | 9/1/17 | 1,425 | 1,455 |
| Deutsche Bank Financial LLC | 5.375% | 3/2/15 | 500 | 487 |
| FIA Card Services NA | 6.625% | 6/15/12 | 300 | 305 |
| Fifth Third Bancorp. | 4.750% | 2/1/15 | 300 | 249 |
| Fifth Third Bancorp. | 4.500% | 6/1/18 | 300 | 205 |
| Fifth Third Bancorp. | 8.250% | 3/1/38 | 525 | 403 |
| First Tennessee Bank | 5.050% | 1/15/15 | 50 | 39 |
| First Union Institutional Capital I | 8.040% | 12/1/26 | 75 | 62 |
| Golden West Financial Corp. | 4.750% | 10/1/12 | 200 | 200 |
2 | Goldman Sachs Capital II | 5.793% | 12/29/49 | 495 | 309 |
| Goldman Sachs Group, Inc. | 4.500% | 6/15/10 | 835 | 857 |
| Goldman Sachs Group, Inc. | 6.875% | 1/15/11 | 260 | 276 |
5 | Goldman Sachs Group, Inc. | 1.700% | 3/15/11 | 450 | 454 |
5 | Goldman Sachs Group, Inc. | 1.625% | 7/15/11 | 650 | 654 |
| Goldman Sachs Group, Inc. | 6.600% | 1/15/12 | 150 | 160 |
| Goldman Sachs Group, Inc. | 5.300% | 2/14/12 | 75 | 78 |
5 | Goldman Sachs Group, Inc. | 3.250% | 6/15/12 | 1,900 | 1,969 |
| Goldman Sachs Group, Inc. | 5.700% | 9/1/12 | 50 | 52 |
| Goldman Sachs Group, Inc. | 5.450% | 11/1/12 | 595 | 621 |
| Goldman Sachs Group, Inc. | 5.250% | 4/1/13 | 625 | 640 |
| Goldman Sachs Group, Inc. | 4.750% | 7/15/13 | 1,075 | 1,082 |
| Goldman Sachs Group, Inc. | 5.250% | 10/15/13 | 800 | 820 |
| Goldman Sachs Group, Inc. | 5.150% | 1/15/14 | 1,100 | 1,107 |
| Goldman Sachs Group, Inc. | 6.000% | 5/1/14 | 1,100 | 1,151 |
| Goldman Sachs Group, Inc. | 5.000% | 10/1/14 | 125 | 126 |
| Goldman Sachs Group, Inc. | 5.125% | 1/15/15 | 800 | 797 |
| Goldman Sachs Group, Inc. | 5.350% | 1/15/16 | 1,075 | 1,049 |
| Goldman Sachs Group, Inc. | 5.750% | 10/1/16 | 300 | 296 |
| Goldman Sachs Group, Inc. | 5.625% | 1/15/17 | 775 | 721 |
| Goldman Sachs Group, Inc. | 6.250% | 9/1/17 | 875 | 869 |
| Goldman Sachs Group, Inc. | 5.950% | 1/18/18 | 1,800 | 1,743 |
| Goldman Sachs Group, Inc. | 6.150% | 4/1/18 | 660 | 646 |
| Goldman Sachs Group, Inc. | 7.500% | 2/15/19 | 125 | 133 |
| Goldman Sachs Group, Inc. | 5.950% | 1/15/27 | 960 | 796 |
| Goldman Sachs Group, Inc. | 6.125% | 2/15/33 | 150 | 141 |
| Goldman Sachs Group, Inc. | 6.345% | 2/15/34 | 500 | 404 |
| Goldman Sachs Group, Inc. | 6.450% | 5/1/36 | 410 | 345 |
| Goldman Sachs Group, Inc. | 6.750% | 10/1/37 | 1,755 | 1,542 |
4 | HBOS PLC | 6.750% | 5/21/18 | 400 | 296 |
| HSBC Bank PLC | 6.950% | 3/15/11 | 150 | 156 |
| HSBC Bank USA | 4.625% | 4/1/14 | 500 | 494 |
| HSBC Bank USA | 5.875% | 11/1/34 | 550 | 524 |
| HSBC Bank USA | 5.625% | 8/15/35 | 625 | 583 |
| HSBC Holdings PLC | 7.350% | 11/27/32 | 50 | 46 |
| HSBC Holdings PLC | 6.500% | 5/2/36 | 145 | 141 |
| HSBC Holdings PLC | 6.500% | 9/15/37 | 1,040 | 997 |
| HSBC Holdings PLC | 6.800% | 6/1/38 | 210 | 214 |
4 | ICICI Bank Ltd. | 6.625% | 10/3/12 | 325 | 322 |
| JPMorgan Chase & Co. | 6.750% | 2/1/11 | 610 | 639 |
5 | JPMorgan Chase & Co. | 1.650% | 2/23/11 | 1,175 | 1,186 |
5 | JPMorgan Chase & Co. | 3.125% | 12/1/11 | 375 | 388 |
| JPMorgan Chase & Co. | 4.500% | 1/15/12 | 1,350 | 1,398 |
| JPMorgan Chase & Co. | 6.625% | 3/15/12 | 175 | 185 |
5 | JPMorgan Chase & Co. | 2.200% | 6/15/12 | 1,150 | 1,158 |
| JPMorgan Chase & Co. | 5.375% | 10/1/12 | 145 | 152 |
5 | JPMorgan Chase & Co. | 2.125% | 12/26/12 | 2,200 | 2,198 |
21
Institutional Total Bond Market Index Fund
| | | | Face | Market |
| | | Maturity | Amount | Value¥ |
| | Coupon | Date | ($000) | ($000) |
| JPMorgan Chase & Co. | 5.750% | 1/2/13 | 475 | 490 |
| JPMorgan Chase & Co. | 4.750% | 5/1/13 | 1,120 | 1,143 |
| JPMorgan Chase & Co. | 4.875% | 3/15/14 | 885 | 872 |
| JPMorgan Chase & Co. | 5.125% | 9/15/14 | 145 | 144 |
| JPMorgan Chase & Co. | 4.750% | 3/1/15 | 1,050 | 1,049 |
| JPMorgan Chase & Co. | 5.250% | 5/1/15 | 725 | 707 |
| JPMorgan Chase & Co. | 5.150% | 10/1/15 | 500 | 501 |
| JPMorgan Chase & Co. | 5.875% | 6/13/16 | 225 | 222 |
| JPMorgan Chase & Co. | 6.125% | 6/27/17 | 300 | 298 |
| JPMorgan Chase & Co. | 6.400% | 5/15/38 | 1,050 | 1,082 |
| JPMorgan Chase Capital XV | 5.875% | 3/15/35 | 760 | 608 |
| JPMorgan Chase Capital XVII | 5.850% | 8/1/35 | 50 | 38 |
| JPMorgan Chase Capital XX | 6.550% | 9/29/36 | 300 | 238 |
| JPMorgan Chase Capital XXII | 6.450% | 2/2/37 | 1,175 | 933 |
| JPMorgan Chase Capital XXV | 6.800% | 10/1/37 | 500 | 431 |
| KeyBank NA | 7.000% | 2/1/11 | 125 | 127 |
| KeyBank NA | 5.500% | 9/17/12 | 425 | 421 |
| KeyBank NA | 4.950% | 9/15/15 | 350 | 306 |
| KeyBank NA | 5.450% | 3/3/16 | 675 | 556 |
| KeyCorp | 6.500% | 5/14/13 | 50 | 49 |
| M&I Marshall & Ilsley Bank | 4.850% | 6/16/15 | 200 | 148 |
| Manufacturers & Traders Trust Co. | 6.625% | 12/4/17 | 500 | 471 |
| MBNA Corp. | 7.500% | 3/15/12 | 325 | 339 |
| MBNA Corp. | 6.125% | 3/1/13 | 225 | 229 |
| MBNA Corp. | 5.000% | 6/15/15 | 350 | 327 |
| Mellon Funding Corp. | 5.000% | 12/1/14 | 150 | 153 |
| Merrill Lynch & Co., Inc. | 5.770% | 7/25/11 | 425 | 438 |
| Merrill Lynch & Co., Inc. | 6.050% | 8/15/12 | 500 | 508 |
| Merrill Lynch & Co., Inc. | 5.450% | 2/5/13 | 235 | 229 |
| Merrill Lynch & Co., Inc. | 6.150% | 4/25/13 | 1,275 | 1,264 |
| Merrill Lynch & Co., Inc. | 5.000% | 2/3/14 | 225 | 213 |
| Merrill Lynch & Co., Inc. | 5.450% | 7/15/14 | 200 | 190 |
| Merrill Lynch & Co., Inc. | 5.000% | 1/15/15 | 2,125 | 1,940 |
| Merrill Lynch & Co., Inc. | 6.050% | 5/16/16 | 25 | 22 |
| Merrill Lynch & Co., Inc. | 5.700% | 5/2/17 | 1,025 | 887 |
| Merrill Lynch & Co., Inc. | 6.400% | 8/28/17 | 1,225 | 1,083 |
| Merrill Lynch & Co., Inc. | 6.875% | 4/25/18 | 405 | 368 |
| Merrill Lynch & Co., Inc. | 6.220% | 9/15/26 | 325 | 255 |
| Merrill Lynch & Co., Inc. | 6.110% | 1/29/37 | 875 | 665 |
| Merrill Lynch & Co., Inc. | 7.750% | 5/14/38 | 1,015 | 926 |
| Morgan Stanley | 4.000% | 1/15/10 | 600 | 609 |
5 | Morgan Stanley | 2.900% | 12/1/10 | 675 | 694 |
| Morgan Stanley | 5.050% | 1/21/11 | 50 | 51 |
5 | Morgan Stanley | 3.250% | 12/1/11 | 1,850 | 1,918 |
| Morgan Stanley | 5.625% | 1/9/12 | 2,425 | 2,512 |
| Morgan Stanley | 6.600% | 4/1/12 | 215 | 228 |
5 | Morgan Stanley | 1.950% | 6/20/12 | 1,550 | 1,548 |
| Morgan Stanley | 5.750% | 8/31/12 | 250 | 261 |
| Morgan Stanley | 4.750% | 4/1/14 | 2,690 | 2,555 |
| Morgan Stanley | 6.000% | 5/13/14 | 875 | 890 |
| Morgan Stanley | 5.375% | 10/15/15 | 400 | 387 |
| Morgan Stanley | 5.750% | 10/18/16 | 550 | 534 |
| Morgan Stanley | 5.450% | 1/9/17 | 600 | 566 |
| Morgan Stanley | 5.550% | 4/27/17 | 430 | 403 |
| Morgan Stanley | 6.250% | 8/28/17 | 50 | 49 |
| Morgan Stanley | 5.950% | 12/28/17 | 425 | 408 |
22
Institutional Total Bond Market Index Fund
| | | | Face | Market |
| | | Maturity | Amount | Value¥ |
| | Coupon | Date | ($000) | ($000) |
| Morgan Stanley | 6.625% | 4/1/18 | 1,880 | 1,865 |
| Morgan Stanley | 7.300% | 5/13/19 | 350 | 364 |
| Morgan Stanley | 6.250% | 8/9/26 | 1,050 | 965 |
| Morgan Stanley | 7.250% | 4/1/32 | 525 | 518 |
| National City Bank - Cleveland OH | 6.250% | 3/15/11 | 400 | 409 |
| National City Corp. | 4.900% | 1/15/15 | 325 | 315 |
| National City Corp. | 6.875% | 5/15/19 | 225 | 216 |
4 | Nationwide Building Society | 5.500% | 7/18/12 | 1,500 | 1,440 |
4 | Northern Rock PLC | 5.625% | 6/22/17 | 2,950 | 2,579 |
| Northern Trust Co. | 6.500% | 8/15/18 | 50 | 54 |
| Northern Trust Corp. | 5.500% | 8/15/13 | 100 | 106 |
| Northern Trust Corp. | 4.625% | 5/1/14 | 225 | 232 |
| PNC Bank NA | 4.875% | 9/21/17 | 600 | 521 |
| PNC Funding Corp. | 7.500% | 11/1/09 | 55 | 56 |
| PNC Funding Corp. | 5.125% | 12/14/10 | 125 | 126 |
5 | PNC Funding Corp. | 2.300% | 6/22/12 | 1,025 | 1,034 |
| PNC Funding Corp. | 5.250% | 11/15/15 | 475 | 451 |
| PNC Funding Corp. | 5.625% | 2/1/17 | 100 | 94 |
5 | Regions Bank | 3.250% | 12/9/11 | 1,150 | 1,192 |
| Santander Financial Issuances | 6.375% | 2/15/11 | 200 | 195 |
| Sanwa Bank Ltd. | 7.400% | 6/15/11 | 300 | 309 |
| Southtrust Corp. | 5.800% | 6/15/14 | 100 | 100 |
| Sovereign Bancorp, Inc. | 4.800% | 9/1/10 | 500 | 494 |
| Sovereign Bancorp, Inc. | 8.750% | 5/30/18 | 270 | 266 |
2,4 | Standard Chartered PLC | 6.409% | 12/31/49 | 300 | 192 |
| State Street Bank & Trust Co. | 5.300% | 1/15/16 | 125 | 119 |
| State Street Corp. | 4.300% | 5/30/14 | 400 | 396 |
| Sumitomo Mitsui Banking Corp. | 8.000% | 6/15/12 | 490 | 530 |
| SunTrust Bank Atlanta GA | 6.375% | 4/1/11 | 100 | 102 |
| SunTrust Bank Atlanta GA | 7.250% | 3/15/18 | 125 | 121 |
| SunTrust Banks, Inc. | 6.000% | 9/11/17 | 350 | 322 |
| SunTrust Banks, Inc. | 6.000% | 2/15/26 | 475 | 341 |
| SunTrust Capital VIII | 6.100% | 12/15/36 | 132 | 88 |
| Swiss Bank Corp. | 7.000% | 10/15/15 | 300 | 270 |
| Swiss Bank Corp. | 7.375% | 6/15/17 | 75 | 67 |
| Synovus Financial Corp. | 5.125% | 6/15/17 | 250 | 152 |
| UBS AG | 5.875% | 7/15/16 | 1,350 | 1,129 |
| UBS AG | 5.875% | 12/20/17 | 675 | 628 |
| UBS AG | 5.750% | 4/25/18 | 475 | 437 |
| UFJ Finance Aruba AEC | 6.750% | 7/15/13 | 1,350 | 1,399 |
| Union Bank of California NA | 5.950% | 5/11/16 | 225 | 213 |
| Union Planters Corp. | 7.750% | 3/1/11 | 500 | 486 |
| UnionBanCal Corp. | 5.250% | 12/16/13 | 50 | 45 |
| US Bank NA | 6.375% | 8/1/11 | 550 | 589 |
| US Bank NA | 6.300% | 2/4/14 | 875 | 950 |
| US Bank NA | 4.950% | 10/30/14 | 225 | 236 |
2 | USB Capital IX | 6.189% | 4/15/49 | 300 | 200 |
| Wachovia Bank NA | 4.875% | 2/1/15 | 1,750 | 1,696 |
| Wachovia Bank NA | 5.000% | 8/15/15 | 75 | 72 |
| Wachovia Bank NA | 6.000% | 11/15/17 | 300 | 289 |
| Wachovia Bank NA | 5.850% | 2/1/37 | 1,425 | 1,263 |
| Wachovia Bank NA | 6.600% | 1/15/38 | 425 | 422 |
2 | Wachovia Capital Trust III | 5.800% | 3/15/11 | 1,010 | 606 |
| Wachovia Corp. | 5.300% | 10/15/11 | 175 | 182 |
| Wachovia Corp. | 4.875% | 2/15/14 | 975 | 956 |
| Wachovia Corp. | 5.625% | 10/15/16 | 275 | 258 |
23
Institutional Total Bond Market Index Fund
| | | | Face | Market |
| | | Maturity | Amount | Value¥ |
| | Coupon | Date | ($000) | ($000) |
| Wachovia Corp. | 5.750% | 6/15/17 | 1,450 | 1,440 |
| Wachovia Corp. | 7.500% | 4/15/35 | 50 | 43 |
| Wachovia Corp. | 5.500% | 8/1/35 | 475 | 362 |
| Wachovia Corp. | 6.550% | 10/15/35 | 50 | 44 |
| Wells Fargo & Co. | 4.200% | 1/15/10 | 775 | 788 |
| Wells Fargo & Co. | 4.875% | 1/12/11 | 375 | 386 |
| Wells Fargo & Co. | 5.300% | 8/26/11 | 450 | 470 |
5 | Wells Fargo & Co. | 3.000% | 12/9/11 | 1,750 | 1,805 |
5 | Wells Fargo & Co. | 2.125% | 6/15/12 | 775 | 778 |
| Wells Fargo & Co. | 5.125% | 9/1/12 | 300 | 312 |
| Wells Fargo & Co. | 5.250% | 10/23/12 | 550 | 569 |
| Wells Fargo & Co. | 4.375% | 1/31/13 | 100 | 101 |
| Wells Fargo & Co. | 4.950% | 10/16/13 | 100 | 100 |
| Wells Fargo & Co. | 5.625% | 12/11/17 | 325 | 320 |
| Wells Fargo & Co. | 5.375% | 2/7/35 | 325 | 291 |
| Wells Fargo Bank NA | 6.450% | 2/1/11 | 500 | 522 |
| Wells Fargo Bank NA | 4.750% | 2/9/15 | 1,275 | 1,237 |
| Wells Fargo Bank NA | 5.750% | 5/16/16 | 1,500 | 1,448 |
| Wells Fargo Bank NA | 5.950% | 8/26/36 | 350 | 318 |
| Wells Fargo Capital X | 5.950% | 12/15/36 | 50 | 37 |
2 | Wells Fargo Capital XIII | 7.700% | 12/29/49 | 400 | 332 |
2 | Wells Fargo Capital XV | 9.750% | 12/29/49 | 425 | 408 |
| Wells Fargo Financial, Inc. | 5.500% | 8/1/12 | 300 | 314 |
| | | | | |
| Brokerage (0.1%) | | | | |
| Ameriprise Financial Inc. | 5.350% | 11/15/10 | 475 | 480 |
| Ameriprise Financial Inc. | 5.650% | 11/15/15 | 375 | 354 |
| Amvescap PLC | 5.375% | 2/27/13 | 25 | 19 |
| BlackRock, Inc. | 6.250% | 9/15/17 | 225 | 236 |
| Charles Schwab Corp. | 4.950% | 6/1/14 | 700 | 715 |
| Jefferies Group Inc. | 6.450% | 6/8/27 | 475 | 353 |
| Jefferies Group Inc. | 6.250% | 1/15/36 | 400 | 271 |
| Lazard Group | 6.850% | 6/15/17 | 775 | 712 |
| | | | | |
| Finance Companies (1.1%) | | | | |
| Block Financial LLC | 7.875% | 1/15/13 | 100 | 106 |
| General Electric Capital Corp. | 4.875% | 10/21/10 | 475 | 491 |
5 | General Electric Capital Corp. | 1.625% | 1/7/11 | 1,325 | 1,344 |
| General Electric Capital Corp. | 6.125% | 2/22/11 | 595 | 624 |
| General Electric Capital Corp. | 5.500% | 4/28/11 | 475 | 493 |
| General Electric Capital Corp. | 5.000% | 11/15/11 | 175 | 180 |
5 | General Electric Capital Corp. | 3.000% | 12/9/11 | 1,025 | 1,058 |
| General Electric Capital Corp. | 5.875% | 2/15/12 | 1,575 | 1,658 |
| General Electric Capital Corp. | 4.375% | 3/3/12 | 475 | 483 |
5 | General Electric Capital Corp. | 2.250% | 3/12/12 | 2,700 | 2,726 |
5 | General Electric Capital Corp. | 2.200% | 6/8/12 | 1,950 | 1,967 |
| General Electric Capital Corp. | 6.000% | 6/15/12 | 2,375 | 2,509 |
| General Electric Capital Corp. | 5.250% | 10/19/12 | 3,600 | 3,714 |
5 | General Electric Capital Corp. | 2.125% | 12/21/12 | 825 | 820 |
5 | General Electric Capital Corp. | 2.625% | 12/28/12 | 775 | 783 |
| General Electric Capital Corp. | 5.450% | 1/15/13 | 500 | 518 |
| General Electric Capital Corp. | 5.900% | 5/13/14 | 325 | 334 |
| General Electric Capital Corp. | 5.500% | 6/4/14 | 1,325 | 1,335 |
| General Electric Capital Corp. | 5.650% | 6/9/14 | 350 | 361 |
| General Electric Capital Corp. | 5.375% | 10/20/16 | 150 | 150 |
| General Electric Capital Corp. | 5.400% | 2/15/17 | 700 | 682 |
24
Institutional Total Bond Market Index Fund
| | | | Face | Market |
| | | Maturity | Amount | Value¥ |
| | Coupon | Date | ($000) | ($000) |
| General Electric Capital Corp. | 5.625% | 9/15/17 | 450 | 433 |
| General Electric Capital Corp. | 5.625% | 5/1/18 | 325 | 310 |
| General Electric Capital Corp. | 6.750% | 3/15/32 | 1,350 | 1,230 |
| General Electric Capital Corp. | 6.150% | 8/7/37 | 525 | 433 |
| General Electric Capital Corp. | 5.875% | 1/14/38 | 3,050 | 2,393 |
| General Electric Capital Corp. | 6.875% | 1/10/39 | 675 | 609 |
2 | General Electric Capital Corp. | 6.375% | 11/15/67 | 725 | 477 |
2 | HSBC Finance Capital Trust IX | 5.911% | 11/30/35 | 50 | 28 |
| HSBC Finance Corp. | 4.625% | 9/15/10 | 425 | 428 |
| HSBC Finance Corp. | 5.250% | 1/14/11 | 675 | 679 |
| HSBC Finance Corp. | 5.700% | 6/1/11 | 1,150 | 1,159 |
| HSBC Finance Corp. | 6.375% | 10/15/11 | 50 | 51 |
| HSBC Finance Corp. | 7.000% | 5/15/12 | 595 | 616 |
| HSBC Finance Corp. | 5.900% | 6/19/12 | 300 | 300 |
| HSBC Finance Corp. | 6.375% | 11/27/12 | 345 | 352 |
| HSBC Finance Corp. | 4.750% | 7/15/13 | 150 | 144 |
| HSBC Finance Corp. | 5.250% | 1/15/14 | 375 | 368 |
| HSBC Finance Corp. | 5.000% | 6/30/15 | 2,075 | 1,955 |
| International Lease Finance Corp. | 5.125% | 11/1/10 | 650 | 578 |
| International Lease Finance Corp. | 4.950% | 2/1/11 | 825 | 709 |
| International Lease Finance Corp. | 5.450% | 3/24/11 | 150 | 128 |
| International Lease Finance Corp. | 5.750% | 6/15/11 | 1,075 | 906 |
| International Lease Finance Corp. | 5.300% | 5/1/12 | 225 | 173 |
| International Lease Finance Corp. | 5.625% | 9/20/13 | 225 | 168 |
| International Lease Finance Corp. | 5.650% | 6/1/14 | 325 | 245 |
| SLM Corp. | 4.500% | 7/26/10 | 200 | 190 |
| SLM Corp. | 5.400% | 10/25/11 | 1,800 | 1,630 |
| SLM Corp. | 5.000% | 10/1/13 | 85 | 69 |
| SLM Corp. | 5.375% | 5/15/14 | 110 | 88 |
| SLM Corp. | 5.050% | 11/14/14 | 360 | 272 |
| SLM Corp. | 5.000% | 4/15/15 | 10 | 8 |
| SLM Corp. | 5.625% | 8/1/33 | 495 | 290 |
| | | | | |
| Insurance (1.0%) | | | | |
| ACE Capital Trust II | 9.700% | 4/1/30 | 360 | 312 |
| ACE INA Holdings, Inc. | 5.600% | 5/15/15 | 125 | 125 |
| ACE INA Holdings, Inc. | 5.700% | 2/15/17 | 505 | 501 |
| AEGON Funding Corp. | 5.750% | 12/15/20 | 50 | 43 |
| AEGON NV | 4.750% | 6/1/13 | 200 | 183 |
| Aetna, Inc. | 7.875% | 3/1/11 | 50 | 54 |
| Aetna, Inc. | 5.750% | 6/15/11 | 125 | 131 |
| Aetna, Inc. | 6.000% | 6/15/16 | 50 | 49 |
| Aetna, Inc. | 6.500% | 9/15/18 | 275 | 275 |
| Aetna, Inc. | 6.625% | 6/15/36 | 875 | 799 |
| Allied World Assurance | 7.500% | 8/1/16 | 1,060 | 902 |
| Allstate Corp. | 6.125% | 2/15/12 | 225 | 234 |
| Allstate Corp. | 5.000% | 8/15/14 | 425 | 422 |
| Allstate Corp. | 6.125% | 12/15/32 | 225 | 209 |
| Allstate Corp. | 5.550% | 5/9/35 | 100 | 85 |
2 | Allstate Corp. | 6.125% | 5/15/37 | 150 | 115 |
2 | Allstate Corp. | 6.500% | 5/15/57 | 200 | 152 |
| Allstate Life Global Funding | 5.375% | 4/30/13 | 375 | 389 |
| American Financial Group | 9.875% | 6/15/19 | 125 | 124 |
| American International Group, Inc. | 4.700% | 10/1/10 | 675 | 547 |
| American International Group, Inc. | 5.375% | 10/18/11 | 225 | 162 |
| American International Group, Inc. | 4.950% | 3/20/12 | 225 | 147 |
25
Institutional Total Bond Market Index Fund
| | | | Face | Market |
| | | Maturity | Amount | Value¥ |
| | Coupon | Date | ($000) | ($000) |
| American International Group, Inc. | 4.250% | 5/15/13 | 600 | 342 |
| American International Group, Inc. | 5.050% | 10/1/15 | 1,025 | 545 |
| American International Group, Inc. | 5.600% | 10/18/16 | 550 | 281 |
| American International Group, Inc. | 5.850% | 1/16/18 | 25 | 13 |
| American International Group, Inc. | 6.250% | 5/1/36 | 150 | 65 |
| Aon Capital Trust | 8.205% | 1/1/27 | 50 | 45 |
| Arch Capital Group Ltd. | 7.350% | 5/1/34 | 350 | 215 |
| Aspen Insurance Holdings Ltd. | 6.000% | 8/15/14 | 100 | 95 |
| Assurant, Inc. | 5.625% | 2/15/14 | 225 | 195 |
| Assurant, Inc. | 6.750% | 2/15/34 | 465 | 321 |
| AXA Financial, Inc. | 7.750% | 8/1/10 | 150 | 151 |
| AXA SA | 8.600% | 12/15/30 | 770 | 719 |
| Axis Capital Holdings Ltd. | 5.750% | 12/1/14 | 75 | 66 |
| Berkshire Hathaway Finance Corp. | 4.200% | 12/15/10 | 100 | 104 |
4 | Berkshire Hathaway Finance Corp. | 4.000% | 4/15/12 | 100 | 102 |
| Berkshire Hathaway Finance Corp. | 5.000% | 8/15/13 | 775 | 813 |
| Berkshire Hathaway Finance Corp. | 5.400% | 5/15/18 | 1,125 | 1,175 |
4 | Berkshire Hathaway Finance Corp. | 5.400% | 5/15/18 | 325 | 337 |
| Chubb Corp. | 5.750% | 5/15/18 | 150 | 158 |
| Chubb Corp. | 6.000% | 5/11/37 | 550 | 556 |
| Chubb Corp. | 6.500% | 5/15/38 | 125 | 135 |
2 | Chubb Corp. | 6.375% | 3/29/67 | 125 | 98 |
| CIGNA Corp. | 7.875% | 5/15/27 | 50 | 44 |
| CIGNA Corp. | 6.150% | 11/15/36 | 475 | 337 |
| Cincinnati Financial Corp. | 6.920% | 5/15/28 | 175 | 141 |
| Cincinnati Financial Corp. | 6.125% | 11/1/34 | 150 | 106 |
| CNA Financial Corp. | 6.000% | 8/15/11 | 100 | 96 |
| CNA Financial Corp. | 5.850% | 12/15/14 | 550 | 451 |
| CNA Financial Corp. | 6.500% | 8/15/16 | 200 | 162 |
| Commerce Group, Inc. | 5.950% | 12/9/13 | 50 | 42 |
| Coventry Health Care Inc. | 6.300% | 8/15/14 | 300 | 261 |
| Fund American Cos., Inc. | 5.875% | 5/15/13 | 100 | 95 |
| GE Global Insurance Holdings Corp. | 6.450% | 3/1/19 | 225 | 191 |
| GE Global Insurance Holdings Corp. | 7.000% | 2/15/26 | 200 | 159 |
| GE Global Insurance Holdings Corp. | 7.750% | 6/15/30 | 150 | 124 |
| Genworth Financial, Inc. | 5.750% | 6/15/14 | 75 | 53 |
| Genworth Financial, Inc. | 4.950% | 10/1/15 | 50 | 32 |
| Genworth Financial, Inc. | 6.500% | 6/15/34 | 150 | 88 |
| Genworth Global Funding Trusts | 5.125% | 3/15/11 | 300 | 290 |
| Hartford Financial Services Group, Inc. | 5.250% | 10/15/11 | 275 | 267 |
| Hartford Financial Services Group, Inc. | 5.500% | 10/15/16 | 175 | 139 |
| Hartford Financial Services Group, Inc. | 5.375% | 3/15/17 | 125 | 96 |
| Hartford Financial Services Group, Inc. | 6.000% | 1/15/19 | 100 | 77 |
| Hartford Financial Services Group, Inc. | 6.100% | 10/1/41 | 600 | 404 |
| Humana Inc. | 6.450% | 6/1/16 | 175 | 153 |
| Humana Inc. | 6.300% | 8/1/18 | 50 | 42 |
| Humana Inc. | 8.150% | 6/15/38 | 300 | 237 |
2 | ING Groep NV | 5.775% | 12/8/49 | 725 | 413 |
| ING USA Global Funding | 4.500% | 10/1/10 | 850 | 864 |
4 | Liberty Mutual Group, Inc. | 4.875% | 2/1/10 | 100 | 98 |
| Lincoln National Corp. | 5.650% | 8/27/12 | 50 | 48 |
| Lincoln National Corp. | 6.150% | 4/7/36 | 675 | 466 |
| Loews Corp. | 6.000% | 2/1/35 | 75 | 62 |
| Marsh & McLennan Cos., Inc. | 5.150% | 9/15/10 | 50 | 50 |
| Marsh & McLennan Cos., Inc. | 6.250% | 3/15/12 | 400 | 413 |
| Marsh & McLennan Cos., Inc. | 5.750% | 9/15/15 | 325 | 308 |
26
Institutional Total Bond Market Index Fund
| | | | Face | Market |
| | | Maturity | Amount | Value¥ |
| | Coupon | Date | ($000) | ($000) |
| Marsh & McLennan Cos., Inc. | 9.250% | 4/15/19 | 300 | 343 |
4 | MetLife Global Funding I | 5.125% | 6/10/14 | 775 | 768 |
| MetLife, Inc. | 5.375% | 12/15/12 | 150 | 152 |
| MetLife, Inc. | 5.000% | 11/24/13 | 100 | 99 |
| MetLife, Inc. | 5.000% | 6/15/15 | 500 | 484 |
| MetLife, Inc. | 7.717% | 2/15/19 | 125 | 133 |
| MetLife, Inc. | 6.375% | 6/15/34 | 350 | 333 |
| MetLife, Inc. | 5.700% | 6/15/35 | 125 | 112 |
| MetLife, Inc. | 6.400% | 12/15/36 | 310 | 220 |
| Principal Financial Group, Inc. | 7.875% | 5/15/14 | 450 | 463 |
| Principal Financial Group, Inc. | 6.050% | 10/15/36 | 225 | 177 |
| Principal Life Income Funding Trusts | 5.300% | 4/24/13 | 300 | 300 |
| Principal Life Income Funding Trusts | 5.100% | 4/15/14 | 150 | 145 |
| Progressive Corp. | 6.375% | 1/15/12 | 225 | 229 |
| Progressive Corp. | 6.625% | 3/1/29 | 100 | 95 |
2 | Progressive Corp. | 6.700% | 6/15/37 | 300 | 211 |
| Protective Life Secured Trusts | 4.850% | 8/16/10 | 225 | 225 |
| Prudential Financial, Inc. | 5.100% | 12/14/11 | 35 | 35 |
| Prudential Financial, Inc. | 5.800% | 6/15/12 | 325 | 326 |
| Prudential Financial, Inc. | 5.150% | 1/15/13 | 345 | 334 |
| Prudential Financial, Inc. | 4.500% | 7/15/13 | 100 | 95 |
| Prudential Financial, Inc. | 4.750% | 4/1/14 | 175 | 167 |
| Prudential Financial, Inc. | 5.100% | 9/20/14 | 375 | 352 |
| Prudential Financial, Inc. | 6.200% | 1/15/15 | 125 | 122 |
| Prudential Financial, Inc. | 5.500% | 3/15/16 | 50 | 46 |
| Prudential Financial, Inc. | 6.100% | 6/15/17 | 75 | 69 |
| Prudential Financial, Inc. | 6.000% | 12/1/17 | 225 | 209 |
| Prudential Financial, Inc. | 5.750% | 7/15/33 | 200 | 154 |
| Prudential Financial, Inc. | 5.400% | 6/13/35 | 200 | 149 |
| Prudential Financial, Inc. | 5.900% | 3/17/36 | 300 | 250 |
| Prudential Financial, Inc. | 5.700% | 12/14/36 | 225 | 181 |
| Torchmark Corp. | 6.375% | 6/15/16 | 225 | 216 |
| Travelers Cos. Inc. | 5.750% | 12/15/17 | 325 | 334 |
| Travelers Cos. Inc. | 5.900% | 6/2/19 | 275 | 285 |
2 | Travelers Cos. Inc. | 6.250% | 3/15/37 | 135 | 108 |
| Travelers Cos. Inc. | 6.250% | 6/15/37 | 250 | 256 |
| Travelers Cos., Inc. | 5.500% | 12/1/15 | 150 | 153 |
| Travelers Cos., Inc. | 6.250% | 6/20/16 | 375 | 397 |
| UnitedHealth Group, Inc. | 5.500% | 11/15/12 | 50 | 52 |
| UnitedHealth Group, Inc. | 4.875% | 2/15/13 | 275 | 275 |
| UnitedHealth Group, Inc. | 4.875% | 4/1/13 | 250 | 249 |
| UnitedHealth Group, Inc. | 5.000% | 8/15/14 | 100 | 97 |
| UnitedHealth Group, Inc. | 4.875% | 3/15/15 | 250 | 240 |
| UnitedHealth Group, Inc. | 6.000% | 6/15/17 | 525 | 501 |
| UnitedHealth Group, Inc. | 6.000% | 11/15/17 | 100 | 95 |
| UnitedHealth Group, Inc. | 5.800% | 3/15/36 | 1,000 | 822 |
| UnitedHealth Group, Inc. | 6.500% | 6/15/37 | 150 | 135 |
| UnitedHealth Group, Inc. | 6.625% | 11/15/37 | 300 | 265 |
| UnitedHealth Group, Inc. | 6.875% | 2/15/38 | 325 | 299 |
| WellPoint Inc. | 5.000% | 1/15/11 | 475 | 488 |
| WellPoint Inc. | 6.375% | 1/15/12 | 125 | 131 |
| WellPoint Inc. | 6.000% | 2/15/14 | 150 | 153 |
| WellPoint Inc. | 5.000% | 12/15/14 | 225 | 220 |
| WellPoint Inc. | 5.250% | 1/15/16 | 50 | 47 |
| WellPoint Inc. | 5.875% | 6/15/17 | 20 | 20 |
| WellPoint Inc. | 5.950% | 12/15/34 | 550 | 458 |
27
Institutional Total Bond Market Index Fund
| | | | Face | Market |
| | | Maturity | Amount | Value¥ |
| | Coupon | Date | ($000) | ($000) |
| WellPoint Inc. | 5.850% | 1/15/36 | 725 | 627 |
| Willis North America Inc. | 5.625% | 7/15/15 | 225 | 199 |
| Willis North America Inc. | 6.200% | 3/28/17 | 370 | 332 |
| XL Capital Ltd. | 5.250% | 9/15/14 | 475 | 398 |
| XL Capital Ltd. | 6.375% | 11/15/24 | 50 | 38 |
| XL Capital Ltd. | 6.250% | 5/15/27 | 400 | 286 |
2 | XL Capital Ltd. | 6.500% | 12/15/49 | 225 | 110 |
| | | | | |
| Other Finance (0.1%) | | | | |
| Chicago Mercantile Exchange Group Inc. | 5.400% | 8/1/13 | 500 | 529 |
| Chicago Mercantile Exchange Group Inc. | 5.750% | 2/15/14 | 175 | 188 |
| Orix Corp. | 5.480% | 11/22/11 | 325 | 299 |
| XTRA Finance Corp. | 5.150% | 4/1/17 | 900 | 868 |
| | | | | |
| Real Estate Investment Trusts (0.3%) | | | | |
| AMB Property LP | 6.300% | 6/1/13 | 125 | 115 |
| Arden Realty LP | 5.250% | 3/1/15 | 50 | 48 |
| AvalonBay Communities, Inc. | 5.500% | 1/15/12 | 125 | 126 |
| AvalonBay Communities, Inc. | 5.750% | 9/15/16 | 50 | 45 |
| Boston Properties, Inc. | 6.250% | 1/15/13 | 250 | 249 |
| Boston Properties, Inc. | 5.625% | 4/15/15 | 150 | 139 |
| Brandywine Operating Partnership | 5.750% | 4/1/12 | 490 | 445 |
| Brandywine Operating Partnership | 5.400% | 11/1/14 | 50 | 40 |
| Brandywine Operating Partnership | 5.700% | 5/1/17 | 305 | 213 |
| Camden Property Trust | 5.700% | 5/15/17 | 225 | 201 |
| Duke Realty LP | 5.950% | 2/15/17 | 100 | 78 |
| ERP Operating LP | 6.625% | 3/15/12 | 75 | 77 |
| ERP Operating LP | 5.500% | 10/1/12 | 300 | 302 |
| ERP Operating LP | 5.125% | 3/15/16 | 475 | 436 |
| ERP Operating LP | 5.375% | 8/1/16 | 100 | 91 |
| ERP Operating LP | 5.750% | 6/15/17 | 200 | 185 |
| HCP Inc. | 6.700% | 1/30/18 | 175 | 153 |
| Health Care Property Investors, Inc. | 6.450% | 6/25/12 | 775 | 763 |
| Health Care Property Investors, Inc. | 5.650% | 12/15/13 | 105 | 96 |
| Health Care Property Investors, Inc. | 6.300% | 9/15/16 | 165 | 144 |
| Health Care REIT, Inc. | 6.200% | 6/1/16 | 725 | 626 |
| Hospitality Properties | 5.125% | 2/15/15 | 300 | 233 |
| HRPT Properties Trust | 6.250% | 8/15/16 | 100 | 82 |
| HRPT Properties Trust | 6.250% | 6/15/17 | 275 | 219 |
| Kimco Realty Corp. | 5.783% | 3/15/16 | 50 | 42 |
| Liberty Property LP | 5.125% | 3/2/15 | 875 | 720 |
| Liberty Property LP | 5.500% | 12/15/16 | 75 | 60 |
| National Retail Properties, Inc. | 6.875% | 10/15/17 | 200 | 173 |
| Nationwide Health Properties, Inc. | 6.250% | 2/1/13 | 300 | 278 |
| ProLogis | 5.625% | 11/15/15 | 325 | 254 |
| ProLogis | 5.750% | 4/1/16 | 225 | 171 |
| ProLogis | 5.625% | 11/15/16 | 225 | 173 |
| Realty Income Corp. | 6.750% | 8/15/19 | 860 | 779 |
| Regency Centers LP | 6.750% | 1/15/12 | 600 | 589 |
| Simon Property Group LP | 4.875% | 8/15/10 | 125 | 126 |
| Simon Property Group LP | 5.600% | 9/1/11 | 225 | 229 |
| Simon Property Group LP | 5.000% | 3/1/12 | 150 | 148 |
| Simon Property Group LP | 5.300% | 5/30/13 | 610 | 587 |
| Simon Property Group LP | 5.750% | 12/1/15 | 425 | 394 |
| Simon Property Group LP | 6.100% | 5/1/16 | 50 | 46 |
| Simon Property Group LP | 5.875% | 3/1/17 | 425 | 388 |
28
Institutional Total Bond Market Index Fund
| | | Face | Market |
| | Maturity | Amount | Value¥ |
| Coupon | Date | ($000) | ($000) |
Simon Property Group LP | 6.125% | 5/30/18 | 425 | 387 |
Tanger Factory Outlet Centers, Inc. | 6.150% | 11/15/15 | 225 | 188 |
| | | | 276,899 |
Industrial (9.8%) | | | | |
Basic Industry (0.8%) | | | | |
Agrium Inc. | 6.750% | 1/15/19 | 100 | 99 |
Alcan, Inc. | 6.450% | 3/15/11 | 250 | 258 |
Alcan, Inc. | 4.875% | 9/15/12 | 300 | 296 |
Alcan, Inc. | 4.500% | 5/15/13 | 225 | 219 |
Alcan, Inc. | 5.000% | 6/1/15 | 50 | 45 |
Alcan, Inc. | 6.125% | 12/15/33 | 700 | 553 |
Alcoa, Inc. | 5.720% | 2/23/19 | 790 | 624 |
Alcoa, Inc. | 5.870% | 2/23/22 | 185 | 144 |
Alcoa, Inc. | 5.900% | 2/1/27 | 450 | 318 |
ArcelorMittal | 5.375% | 6/1/13 | 825 | 789 |
ArcelorMittal | 9.000% | 2/15/15 | 225 | 237 |
ArcelorMittal | 6.125% | 6/1/18 | 350 | 304 |
ArcelorMittal | 9.850% | 6/1/19 | 175 | 188 |
Barrick Gold Finance Inc. | 4.875% | 11/15/14 | 100 | 103 |
Barrick Gold Finance Inc. | 6.950% | 4/1/19 | 150 | 168 |
Barrick North America Finance LLC | 6.800% | 9/15/18 | 225 | 249 |
Barrick North America Finance LLC | 7.500% | 9/15/38 | 300 | 348 |
BHP Billiton Finance (USA) Ltd. | 4.800% | 4/15/13 | 325 | 340 |
BHP Billiton Finance (USA) Ltd. | 5.500% | 4/1/14 | 415 | 445 |
BHP Billiton Finance (USA) Ltd. | 5.250% | 12/15/15 | 325 | 342 |
BHP Billiton Finance (USA) Ltd. | 5.400% | 3/29/17 | 135 | 140 |
BHP Billiton Finance (USA) Ltd. | 6.500% | 4/1/19 | 450 | 500 |
BHP Finance USA Ltd. | 8.500% | 12/1/12 | 125 | 146 |
Celulosa Arauco Constitution SA | 8.625% | 8/15/10 | 325 | 340 |
Celulosa Arauco Constitution SA | 5.625% | 4/20/15 | 350 | 339 |
Commercial Metals Co. | 6.500% | 7/15/17 | 125 | 110 |
Commercial Metals Co. | 7.350% | 8/15/18 | 350 | 320 |
Cytec Industries Inc. | 8.950% | 7/1/17 | 100 | 100 |
Dow Chemical Co. | 6.125% | 2/1/11 | 675 | 694 |
Dow Chemical Co. | 6.000% | 10/1/12 | 50 | 51 |
Dow Chemical Co. | 7.600% | 5/15/14 | 675 | 696 |
Dow Chemical Co. | 8.550% | 5/15/19 | 700 | 706 |
Dow Chemical Co. | 7.375% | 11/1/29 | 500 | 452 |
Dow Chemical Co. | 9.400% | 5/15/39 | 125 | 129 |
E.I. du Pont de Nemours & Co. | 4.750% | 11/15/12 | 425 | 451 |
E.I. du Pont de Nemours & Co. | 5.000% | 1/15/13 | 50 | 53 |
E.I. du Pont de Nemours & Co. | 5.000% | 7/15/13 | 525 | 556 |
E.I. du Pont de Nemours & Co. | 5.875% | 1/15/14 | 225 | 244 |
E.I. du Pont de Nemours & Co. | 5.250% | 12/15/16 | 50 | 52 |
E.I. du Pont de Nemours & Co. | 6.000% | 7/15/18 | 1,275 | 1,380 |
E.I. du Pont de Nemours & Co. | 6.500% | 1/15/28 | 75 | 79 |
Eastman Chemical Co. | 7.250% | 1/15/24 | 225 | 189 |
Eastman Chemical Co. | 7.600% | 2/1/27 | 125 | 106 |
Falconbridge Ltd. | 7.350% | 6/5/12 | 125 | 124 |
Freeport-McMoRan Copper & Gold Inc. | 8.250% | 4/1/15 | 770 | 774 |
Freeport-McMoRan Copper & Gold Inc. | 8.375% | 4/1/17 | 825 | 831 |
Inco Ltd. | 7.750% | 5/15/12 | 100 | 107 |
Inco Ltd. | 5.700% | 10/15/15 | 200 | 194 |
International Paper Co. | 7.400% | 6/15/14 | 345 | 343 |
International Paper Co. | 5.300% | 4/1/15 | 225 | 204 |
International Paper Co. | 9.375% | 5/15/19 | 600 | 610 |
29
Institutional Total Bond Market Index Fund
| | | | Face | Market |
| | | Maturity | Amount | Value¥ |
| | Coupon | Date | ($000) | ($000) |
| Lubrizol Corp. | 8.875% | 2/1/19 | 850 | 939 |
| Lubrizol Corp. | 6.500% | 10/1/34 | 375 | 322 |
| Monsanto Co. | 7.375% | 8/15/12 | 225 | 257 |
| Newmont Mining Corp. | 5.875% | 4/1/35 | 100 | 93 |
| Noranda, Inc. | 7.250% | 7/15/12 | 425 | 428 |
| Noranda, Inc. | 5.500% | 6/15/17 | 400 | 346 |
| Nucor Corp. | 5.750% | 12/1/17 | 100 | 105 |
| Nucor Corp. | 5.850% | 6/1/18 | 325 | 341 |
| Nucor Corp. | 6.400% | 12/1/37 | 225 | 233 |
| Placer Dome, Inc. | 6.450% | 10/15/35 | 425 | 429 |
| Plum Creek Timber Co. | 5.875% | 11/15/15 | 225 | 190 |
| Potash Corp. of Saskatchewan | 7.750% | 5/31/11 | 775 | 850 |
| Praxair, Inc. | 4.375% | 3/31/14 | 375 | 390 |
| Praxair, Inc. | 5.250% | 11/15/14 | 325 | 351 |
| Praxair, Inc. | 5.200% | 3/15/17 | 25 | 25 |
| Rio Tinto Finance USA Ltd. | 5.875% | 7/15/13 | 510 | 513 |
| Rio Tinto Finance USA Ltd. | 8.950% | 5/1/14 | 900 | 998 |
| Rio Tinto Finance USA Ltd. | 6.500% | 7/15/18 | 375 | 375 |
| Rio Tinto Finance USA Ltd. | 9.000% | 5/1/19 | 625 | 691 |
| Rio Tinto Finance USA Ltd. | 7.125% | 7/15/28 | 175 | 166 |
2 | Rohm & Haas Co. | 9.800% | 4/15/20 | 118 | 121 |
| Southern Copper Corp. | 7.500% | 7/27/35 | 375 | 334 |
| Vale Overseas Ltd. | 6.250% | 1/11/16 | 50 | 51 |
| Vale Overseas Ltd. | 6.250% | 1/23/17 | 200 | 203 |
| Vale Overseas Ltd. | 8.250% | 1/17/34 | 150 | 163 |
| Vale Overseas Ltd. | 6.875% | 11/21/36 | 1,424 | 1,343 |
| Valspar Corp. | 7.250% | 6/15/19 | 50 | 51 |
| Weyerhaeuser Co. | 7.375% | 3/15/32 | 850 | 675 |
| WMC Finance USA | 5.125% | 5/15/13 | 425 | 441 |
| | | | | |
| Capital Goods (0.9%) | | | | |
| 3M Co. | 5.125% | 11/6/09 | 75 | 76 |
| 3M Co. | 4.500% | 11/1/11 | 425 | 452 |
| 3M Co. | 6.375% | 2/15/28 | 275 | 299 |
| Allied Waste North America Inc. | 7.875% | 4/15/13 | 225 | 230 |
| Allied Waste North America Inc. | 7.125% | 5/15/16 | 975 | 977 |
2,4 | BAE Systems Asset Trust | 7.156% | 12/15/11 | 27 | 29 |
| Bemis Co. Inc. | 4.875% | 4/1/12 | 200 | 188 |
| Black & Decker Corp. | 7.125% | 6/1/11 | 225 | 236 |
| Boeing Capital Corp. | 7.375% | 9/27/10 | 175 | 186 |
| Boeing Capital Corp. | 6.500% | 2/15/12 | 875 | 960 |
| Boeing Co. | 7.250% | 6/15/25 | 375 | 414 |
| Boeing Co. | 8.750% | 9/15/31 | 75 | 95 |
| Boeing Co. | 6.125% | 2/15/33 | 50 | 49 |
| Caterpillar Financial Services Corp. | 4.300% | 6/1/10 | 775 | 799 |
| Caterpillar Financial Services Corp. | 4.250% | 2/8/13 | 500 | 502 |
| Caterpillar Financial Services Corp. | 6.125% | 2/17/14 | 975 | 1,044 |
| Caterpillar Financial Services Corp. | 4.750% | 2/17/15 | 50 | 49 |
| Caterpillar Financial Services Corp. | 4.625% | 6/1/15 | 125 | 120 |
| Caterpillar Financial Services Corp. | 7.150% | 2/15/19 | 500 | 537 |
| Caterpillar, Inc. | 7.900% | 12/15/18 | 400 | 461 |
| Caterpillar, Inc. | 7.300% | 5/1/31 | 425 | 468 |
| Caterpillar, Inc. | 7.375% | 3/1/97 | 325 | 321 |
| Cooper Industries, Inc. | 5.250% | 11/15/12 | 225 | 241 |
| CRH America Inc. | 5.625% | 9/30/11 | 225 | 221 |
| CRH America Inc. | 6.950% | 3/15/12 | 350 | 353 |
30
Institutional Total Bond Market Index Fund
| | | | Face | Market |
| | | Maturity | Amount | Value¥ |
| | Coupon | Date | ($000) | ($000) |
| CRH America Inc. | 5.300% | 10/15/13 | 200 | 182 |
| CRH America Inc. | 6.000% | 9/30/16 | 475 | 414 |
| CRH America Inc. | 6.400% | 10/15/33 | 150 | 111 |
| Danaher Corp. | 5.625% | 1/15/18 | 150 | 157 |
| Deere & Co. | 6.950% | 4/25/14 | 150 | 170 |
| Deere & Co. | 8.100% | 5/15/30 | 500 | 605 |
| Deere & Co. | 7.125% | 3/3/31 | 300 | 315 |
| Dover Corp. | 5.450% | 3/15/18 | 350 | 358 |
| Dover Corp. | 6.600% | 3/15/38 | 200 | 226 |
| Eaton Corp. | 5.600% | 5/15/18 | 125 | 121 |
| Embraer Overseas Ltd. | 6.375% | 1/24/17 | 125 | 118 |
| Emerson Electric Co. | 7.125% | 8/15/10 | 375 | 399 |
| Emerson Electric Co. | 4.500% | 5/1/13 | 175 | 181 |
| Emerson Electric Co. | 5.250% | 10/15/18 | 400 | 417 |
| Emerson Electric Co. | 4.875% | 10/15/19 | 375 | 380 |
| General Dynamics Corp. | 4.500% | 8/15/10 | 125 | 130 |
| General Dynamics Corp. | 4.250% | 5/15/13 | 750 | 777 |
| General Electric Co. | 5.000% | 2/1/13 | 1,325 | 1,378 |
| General Electric Co. | 5.250% | 12/6/17 | 880 | 867 |
| Goodrich Corp. | 6.125% | 3/1/19 | 550 | 558 |
| Goodrich Corp. | 6.800% | 7/1/36 | 80 | 76 |
| Harsco Corp. | 5.750% | 5/15/18 | 325 | 319 |
| Honeywell International, Inc. | 6.125% | 11/1/11 | 150 | 164 |
| Honeywell International, Inc. | 5.625% | 8/1/12 | 300 | 327 |
| Honeywell International, Inc. | 4.250% | 3/1/13 | 125 | 129 |
| Honeywell International, Inc. | 3.875% | 2/15/14 | 425 | 433 |
| Honeywell International, Inc. | 5.300% | 3/1/18 | 50 | 52 |
| Honeywell International, Inc. | 5.000% | 2/15/19 | 325 | 331 |
| Honeywell International, Inc. | 5.700% | 3/15/36 | 50 | 51 |
4 | Illinois Tool Works, Inc. | 5.150% | 4/1/14 | 375 | 395 |
4 | Illinois Tool Works, Inc. | 6.250% | 4/1/19 | 225 | 244 |
| Ingersoll-Rand Global Holding Co. Ltd. | 6.000% | 8/15/13 | 200 | 201 |
| Ingersoll-Rand Global Holding Co. Ltd. | 9.500% | 4/15/14 | 250 | 276 |
| Ingersoll-Rand Global Holding Co. Ltd. | 6.875% | 8/15/18 | 200 | 201 |
| John Deere Capital Corp | 4.950% | 12/17/12 | 50 | 52 |
| John Deere Capital Corp. | 5.400% | 10/17/11 | 625 | 668 |
| John Deere Capital Corp. | 5.350% | 1/17/12 | 200 | 209 |
| John Deere Capital Corp. | 5.250% | 10/1/12 | 550 | 581 |
| John Deere Capital Corp. | 4.900% | 9/9/13 | 150 | 156 |
| John Deere Capital Corp. | 5.500% | 4/13/17 | 50 | 52 |
| Joy Global, Inc. | 6.000% | 11/15/16 | 100 | 93 |
| Lafarge SA | 6.150% | 7/15/11 | 50 | 51 |
| Lafarge SA | 6.500% | 7/15/16 | 400 | 358 |
| Lafarge SA | 7.125% | 7/15/36 | 325 | 247 |
| Lockheed Martin Corp. | 7.650% | 5/1/16 | 625 | 720 |
| Lockheed Martin Corp. | 6.150% | 9/1/36 | 325 | 346 |
| Martin Marietta Materials, Inc | 6.600% | 4/15/18 | 375 | 353 |
| Northrop Grumman Systems Corp. | 7.125% | 2/15/11 | 125 | 135 |
| Northrop Grumman Systems Corp. | 7.750% | 3/1/16 | 125 | 144 |
| Northrop Grumman Systems Corp. | 7.750% | 2/15/31 | 100 | 124 |
| Parker-Hannifin Corp. | 5.500% | 5/15/18 | 100 | 103 |
| Parker-Hannifin Corp. | 6.250% | 5/15/38 | 100 | 102 |
| Raytheon Co. | 4.850% | 1/15/11 | 325 | 339 |
| Raytheon Co. | 5.500% | 11/15/12 | 325 | 354 |
| Raytheon Co. | 7.200% | 8/15/27 | 225 | 251 |
| Republic Services, Inc. | 6.750% | 8/15/11 | 150 | 155 |
31
Institutional Total Bond Market Index Fund
| | | | Face | Market |
| | | Maturity | Amount | Value¥ |
| | Coupon | Date | ($000) | ($000) |
| Republic Services, Inc. | 6.086% | 3/15/35 | 150 | 115 |
| Rockwell Automation, Inc. | 5.650% | 12/1/17 | 125 | 130 |
| Rockwell Automation, Inc. | 6.700% | 1/15/28 | 75 | 80 |
| Rockwell Automation, Inc. | 6.250% | 12/1/37 | 325 | 340 |
| Rockwell Collins, Inc. | 5.250% | 7/15/19 | 50 | 51 |
| Roper Industries Inc. | 6.625% | 8/15/13 | 600 | 611 |
4 | Smiths Group Inc. | 6.050% | 5/15/14 | 150 | 144 |
4 | Smiths Group Inc. | 7.200% | 5/15/19 | 125 | 117 |
| Textron, Inc. | 6.500% | 6/1/12 | 425 | 414 |
| Tyco International Group SA | 6.750% | 2/15/11 | 1,200 | 1,250 |
| Tyco International Group SA | 7.000% | 12/15/19 | 500 | 490 |
| United Technologies Corp. | 7.125% | 11/15/10 | 100 | 107 |
| United Technologies Corp. | 6.350% | 3/1/11 | 450 | 483 |
| United Technologies Corp. | 6.100% | 5/15/12 | 125 | 134 |
| United Technologies Corp. | 4.875% | 5/1/15 | 125 | 134 |
| United Technologies Corp. | 5.375% | 12/15/17 | 300 | 323 |
| United Technologies Corp. | 8.875% | 11/15/19 | 375 | 514 |
| United Technologies Corp. | 7.500% | 9/15/29 | 150 | 179 |
| United Technologies Corp. | 5.400% | 5/1/35 | 225 | 220 |
| USA Waste Services, Inc. | 7.000% | 7/15/28 | 80 | 75 |
| Vulcan Materials Co. | 6.300% | 6/15/13 | 150 | 155 |
| Vulcan Materials Co. | 7.000% | 6/15/18 | 300 | 290 |
| Waste Management, Inc. | 7.375% | 8/1/10 | 75 | 79 |
| Waste Management, Inc. | 6.375% | 11/15/12 | 100 | 107 |
| Waste Management, Inc. | 6.375% | 3/11/15 | 150 | 157 |
| Waste Management, Inc. | 7.375% | 3/11/19 | 125 | 135 |
| | | | | |
| Communication (2.3%) | | | | |
| America Movil SA de C.V. | 5.500% | 3/1/14 | 100 | 102 |
| America Movil SA de C.V. | 5.750% | 1/15/15 | 650 | 656 |
| America Movil SA de C.V. | 6.375% | 3/1/35 | 300 | 283 |
| America Movil SA de C.V. | 6.125% | 11/15/37 | 325 | 294 |
| AT&T Inc. | 5.300% | 11/15/10 | 300 | 312 |
| AT&T Inc. | 6.250% | 3/15/11 | 175 | 186 |
| AT&T Inc. | 5.875% | 2/1/12 | 385 | 412 |
| AT&T Inc. | 5.875% | 8/15/12 | 615 | 660 |
| AT&T Inc. | 4.950% | 1/15/13 | 460 | 479 |
| AT&T Inc. | 4.850% | 2/15/14 | 675 | 702 |
| AT&T Inc. | 5.100% | 9/15/14 | 1,710 | 1,782 |
| AT&T Inc. | 5.625% | 6/15/16 | 520 | 537 |
| AT&T Inc. | 5.800% | 2/15/19 | 950 | 968 |
| AT&T Inc. | 8.000% | 11/15/31 | 1,475 | 1,701 |
| AT&T Inc. | 6.450% | 6/15/34 | 425 | 432 |
| AT&T Inc. | 6.500% | 9/1/37 | 1,400 | 1,369 |
| AT&T Inc. | 6.300% | 1/15/38 | 500 | 486 |
| AT&T Inc. | 6.400% | 5/15/38 | 325 | 318 |
| AT&T Inc. | 6.550% | 2/15/39 | 575 | 573 |
| AT&T Wireless | 7.875% | 3/1/11 | 615 | 664 |
| AT&T Wireless | 8.125% | 5/1/12 | 325 | 364 |
| AT&T Wireless | 8.750% | 3/1/31 | 440 | 550 |
| BellSouth Capital Funding Corp. | 7.875% | 2/15/30 | 300 | 316 |
| BellSouth Corp. | 5.200% | 9/15/14 | 25 | 26 |
| BellSouth Corp. | 5.200% | 12/15/16 | 225 | 229 |
| BellSouth Corp. | 6.875% | 10/15/31 | 200 | 205 |
| BellSouth Corp. | 6.550% | 6/15/34 | 225 | 219 |
| BellSouth Corp. | 6.000% | 11/15/34 | 230 | 219 |
32
Institutional Total Bond Market Index Fund
| | | Face | Market |
| | Maturity | Amount | Value¥ |
| Coupon | Date | ($000) | ($000) |
BellSouth Telecommunications Inc. | 6.375% | 6/1/28 | 735 | 716 |
British Telecommunications PLC | 9.125% | 12/15/10 | 640 | 680 |
British Telecommunications PLC | 5.150% | 1/15/13 | 290 | 289 |
British Telecommunications PLC | 5.950% | 1/15/18 | 325 | 293 |
British Telecommunications PLC | 9.625% | 12/15/30 | 875 | 966 |
CBS Corp. | 6.625% | 5/15/11 | 570 | 578 |
CBS Corp. | 5.625% | 8/15/12 | 210 | 207 |
CBS Corp. | 7.875% | 7/30/30 | 255 | 203 |
CBS Corp. | 5.500% | 5/15/33 | 75 | 50 |
CenturyTel Enterprises | 6.875% | 1/15/28 | 75 | 64 |
CenturyTel, Inc. | 7.875% | 8/15/12 | 100 | 105 |
Cingular Wireless LLC | 6.500% | 12/15/11 | 950 | 1,018 |
Cingular Wireless LLC | 7.125% | 12/15/31 | 645 | 679 |
Comcast Cable Communications Holdings Inc. | 8.375% | 3/15/13 | 40 | 45 |
Comcast Cable Communications Holdings Inc. | 9.455% | 11/15/22 | 75 | 88 |
Comcast Cable Communications Inc. LLC | 8.875% | 5/1/17 | 275 | 324 |
Comcast Cable Communications, Inc. | 6.750% | 1/30/11 | 1,550 | 1,637 |
Comcast Corp. | 5.500% | 3/15/11 | 315 | 329 |
Comcast Corp. | 5.300% | 1/15/14 | 675 | 696 |
Comcast Corp. | 6.500% | 1/15/15 | 110 | 117 |
Comcast Corp. | 5.900% | 3/15/16 | 125 | 128 |
Comcast Corp. | 6.500% | 1/15/17 | 100 | 105 |
Comcast Corp. | 6.300% | 11/15/17 | 50 | 52 |
Comcast Corp. | 5.700% | 5/15/18 | 325 | 324 |
Comcast Corp. | 5.700% | 7/1/19 | 450 | 447 |
Comcast Corp. | 6.500% | 11/15/35 | 2,825 | 2,817 |
Comcast Corp. | 6.400% | 5/15/38 | 75 | 74 |
Comcast Corp. | 6.550% | 7/1/39 | 475 | 474 |
Cox Communications, Inc. | 7.125% | 10/1/12 | 200 | 213 |
Cox Communications, Inc. | 5.450% | 12/15/14 | 585 | 584 |
Deutsche Telekom International Finance | 5.750% | 3/23/16 | 370 | 382 |
Deutsche Telekom International Finance | 8.750% | 6/15/30 | 950 | 1,117 |
Embarq Corp. | 7.082% | 6/1/16 | 1,175 | 1,144 |
Embarq Corp. | 7.995% | 6/1/36 | 100 | 86 |
France Telecom | 7.750% | 3/1/11 | 1,075 | 1,162 |
France Telecom | 4.375% | 7/8/14 | 75 | 75 |
France Telecom | 8.500% | 3/1/31 | 675 | 871 |
Grupo Televisa SA | 6.625% | 3/18/25 | 275 | 248 |
GTE Corp. | 8.750% | 11/1/21 | 75 | 86 |
Koninklijke KPN NV | 8.000% | 10/1/10 | 655 | 687 |
Koninklijke KPN NV | 8.375% | 10/1/30 | 225 | 257 |
McGraw-Hill Cos. Inc. | 5.375% | 11/15/12 | 325 | 338 |
McGraw-Hill Cos. Inc. | 5.900% | 11/15/17 | 350 | 332 |
New England Telephone & Telegraph Co. | 7.875% | 11/15/29 | 810 | 835 |
News America Holdings, Inc. | 8.000% | 10/17/16 | 365 | 390 |
News America Holdings, Inc. | 8.150% | 10/17/36 | 75 | 79 |
News America Inc. | 6.200% | 12/15/34 | 1,125 | 957 |
News America Inc. | 6.400% | 12/15/35 | 1,475 | 1,286 |
Omnicom Group Inc. | 5.900% | 4/15/16 | 25 | 25 |
Qwest Communications International Inc. | 7.875% | 9/1/11 | 325 | 323 |
Qwest Communications International Inc. | 8.875% | 3/15/12 | 325 | 325 |
Qwest Communications International Inc. | 7.500% | 10/1/14 | 300 | 285 |
Qwest Communications International Inc. | 6.500% | 6/1/17 | 225 | 198 |
R.R. Donnelley & Sons Co. | 5.625% | 1/15/12 | 125 | 120 |
R.R. Donnelley & Sons Co. | 4.950% | 4/1/14 | 50 | 44 |
R.R. Donnelley & Sons Co. | 5.500% | 5/15/15 | 75 | 64 |
33
Institutional Total Bond Market Index Fund
| | | Face | Market |
| | Maturity | Amount | Value¥ |
| Coupon | Date | ($000) | ($000) |
Reed Elsevier Capital | 4.625% | 6/15/12 | 50 | 48 |
Reed Elsevier Capital | 7.750% | 1/15/14 | 225 | 241 |
Reed Elsevier Capital | 8.625% | 1/15/19 | 225 | 256 |
Rogers Communications Inc. | 6.375% | 3/1/14 | 1,400 | 1,501 |
Rogers Communications Inc. | 5.500% | 3/15/14 | 400 | 414 |
Rogers Communications Inc. | 6.800% | 8/15/18 | 475 | 509 |
TCI Communications, Inc. | 8.750% | 8/1/15 | 300 | 348 |
TCI Communications, Inc. | 7.875% | 2/15/26 | 155 | 170 |
Tele-Communications, Inc. | 7.875% | 8/1/13 | 125 | 138 |
Telecom Italia Capital | 7.175% | 6/18/19 | 125 | 128 |
Telecom Italia Capital S.A. | 6.200% | 7/18/11 | 765 | 795 |
Telecom Italia Capital S.A. | 5.250% | 11/15/13 | 220 | 217 |
Telecom Italia Capital S.A. | 6.175% | 6/18/14 | 50 | 51 |
Telecom Italia Capital S.A. | 4.950% | 9/30/14 | 110 | 106 |
Telecom Italia Capital S.A. | 5.250% | 10/1/15 | 150 | 145 |
Telecom Italia Capital S.A. | 6.375% | 11/15/33 | 1,285 | 1,147 |
Telecom Italia Capital S.A. | 6.000% | 9/30/34 | 25 | 21 |
Telecom Italia Capital S.A. | 7.200% | 7/18/36 | 305 | 297 |
Telecom Italia Capital S.A. | 7.721% | 6/4/38 | 45 | 46 |
Telefonica Emisiones SAU | 5.984% | 6/20/11 | 400 | 422 |
Telefonica Emisiones SAU | 4.949% | 1/15/15 | 575 | 587 |
Telefonica Emisiones SAU | 6.421% | 6/20/16 | 950 | 1,015 |
Telefonica Emisiones SAU | 5.877% | 7/15/19 | 325 | 335 |
Telefonica Emisiones SAU | 7.045% | 6/20/36 | 505 | 562 |
Telefonica Europe BV | 7.750% | 9/15/10 | 625 | 659 |
Telefonica Europe BV | 8.250% | 9/15/30 | 175 | 219 |
Telefonos de Mexico SA | 5.500% | 1/27/15 | 1,275 | 1,272 |
Telus Corp. | 8.000% | 6/1/11 | 500 | 536 |
Thomson Reuters Corp. | 6.200% | 1/5/12 | 200 | 207 |
Thomson Reuters Corp. | 5.950% | 7/15/13 | 165 | 168 |
Thomson Reuters Corp. | 5.700% | 10/1/14 | 475 | 477 |
Thomson Reuters Corp. | 6.500% | 7/15/18 | 50 | 52 |
Thomson Reuters Corp. | 5.500% | 8/15/35 | 100 | 79 |
Time Warner Cable Inc. | 5.400% | 7/2/12 | 250 | 260 |
Time Warner Cable Inc. | 6.200% | 7/1/13 | 775 | 816 |
Time Warner Cable Inc. | 8.250% | 2/14/14 | 150 | 168 |
Time Warner Cable Inc. | 7.500% | 4/1/14 | 175 | 193 |
Time Warner Cable Inc. | 5.850% | 5/1/17 | 300 | 298 |
Time Warner Cable Inc. | 6.750% | 7/1/18 | 925 | 961 |
Time Warner Cable Inc. | 8.750% | 2/14/19 | 400 | 466 |
Time Warner Cable Inc. | 8.250% | 4/1/19 | 225 | 255 |
Time Warner Cable Inc. | 6.550% | 5/1/37 | 250 | 237 |
Time Warner Cable Inc. | 6.750% | 6/15/39 | 925 | 894 |
Time Warner Entertainment | 10.150% | 5/1/12 | 150 | 165 |
Time Warner Entertainment | 8.875% | 10/1/12 | 300 | 331 |
Time Warner Entertainment | 8.375% | 3/15/23 | 150 | 165 |
Time Warner Entertainment | 8.375% | 7/15/33 | 875 | 973 |
US Cellular | 6.700% | 12/15/33 | 150 | 146 |
US West Communications Group | 7.500% | 6/15/23 | 300 | 240 |
US West Communications Group | 6.875% | 9/15/33 | 300 | 218 |
Verizon Communications Inc. | 5.350% | 2/15/11 | 100 | 105 |
Verizon Communications Inc. | 4.900% | 9/15/15 | 425 | 424 |
Verizon Communications Inc. | 5.550% | 2/15/16 | 950 | 978 |
Verizon Communications Inc. | 8.750% | 11/1/18 | 375 | 446 |
Verizon Communications Inc. | 6.350% | 4/1/19 | 650 | 677 |
Verizon Communications Inc. | 5.850% | 9/15/35 | 1,050 | 978 |
34
Institutional Total Bond Market Index Fund
| | | | Face | Market |
| | | Maturity | Amount | Value¥ |
| | Coupon | Date | ($000) | ($000) |
| Verizon Communications Inc. | 6.400% | 2/15/38 | 480 | 472 |
| Verizon Communications Inc. | 6.900% | 4/15/38 | 60 | 63 |
| Verizon Communications Inc. | 8.950% | 3/1/39 | 1,225 | 1,564 |
| Verizon Communications Inc. | 7.350% | 4/1/39 | 800 | 870 |
| Verizon Global Funding Corp. | 6.875% | 6/15/12 | 1,500 | 1,653 |
| Verizon Global Funding Corp. | 7.750% | 12/1/30 | 625 | 707 |
| Verizon Maryland, Inc. | 5.125% | 6/15/33 | 55 | 41 |
| Verizon New England, Inc. | 6.500% | 9/15/11 | 325 | 347 |
| Verizon New York, Inc. | 6.875% | 4/1/12 | 135 | 143 |
| Verizon New York, Inc. | 7.375% | 4/1/32 | 100 | 98 |
| Verizon Pennsylvania, Inc. | 5.650% | 11/15/11 | 375 | 396 |
| Verizon Virginia, Inc. | 4.625% | 3/15/13 | 125 | 125 |
4 | Verizon Wireless Capital LLC | 3.750% | 5/20/11 | 200 | 204 |
4 | Verizon Wireless Capital LLC | 5.250% | 2/1/12 | 550 | 577 |
4 | Verizon Wireless Capital LLC | 7.375% | 11/15/13 | 1,300 | 1,455 |
4 | Verizon Wireless Capital LLC | 5.550% | 2/1/14 | 1,225 | 1,296 |
4 | Verizon Wireless Capital LLC | 8.500% | 11/15/18 | 600 | 724 |
| Vodafone Group PLC | 5.350% | 2/27/12 | 825 | 869 |
| Vodafone Group PLC | 5.000% | 12/16/13 | 125 | 130 |
| Vodafone Group PLC | 5.375% | 1/30/15 | 350 | 364 |
| Vodafone Group PLC | 5.750% | 3/15/16 | 200 | 206 |
| Vodafone Group PLC | 5.625% | 2/27/17 | 425 | 434 |
| Vodafone Group PLC | 7.875% | 2/15/30 | 375 | 432 |
| Vodafone Group PLC | 6.250% | 11/30/32 | 550 | 569 |
| Vodafone Group PLC | 6.150% | 2/27/37 | 125 | 123 |
| Washington Post Co. | 7.250% | 2/1/19 | 150 | 156 |
| WPP Finance USA Corp. | 5.875% | 6/15/14 | 200 | 186 |
| WPP Finance USA Corp. | 8.000% | 9/15/14 | 75 | 76 |
| | | | | |
| Consumer Cyclical (1.0%) | | | | |
| Best Buy Co. | 6.750% | 7/15/13 | 200 | 207 |
| Costco Wholesale Corp. | 5.500% | 3/15/17 | 850 | 909 |
| CVS Caremark Corp. | 5.750% | 8/15/11 | 350 | 372 |
| CVS Caremark Corp. | 4.875% | 9/15/14 | 100 | 101 |
| CVS Caremark Corp. | 5.750% | 6/1/17 | 200 | 201 |
| CVS Caremark Corp. | 6.250% | 6/1/27 | 800 | 817 |
2 | CVS Caremark Corp. | 6.302% | 6/1/37 | 300 | 223 |
| Daimler Finanace North America LLC | 6.500% | 11/15/13 | 1,075 | 1,104 |
| DaimlerChrysler North America Holding Corp. | 7.300% | 1/15/12 | 1,675 | 1,729 |
| DaimlerChrysler North America Holding Corp. | 8.500% | 1/18/31 | 500 | 524 |
| Darden Restaurants Inc. | 5.625% | 10/15/12 | 275 | 279 |
| Darden Restaurants Inc. | 6.800% | 10/15/37 | 200 | 170 |
| Historic TW, Inc. | 9.125% | 1/15/13 | 1,000 | 1,107 |
| Historic TW, Inc. | 9.150% | 2/1/23 | 125 | 134 |
| Historic TW, Inc. | 6.625% | 5/15/29 | 700 | 623 |
| Home Depot Inc. | 4.625% | 8/15/10 | 450 | 460 |
| Home Depot Inc. | 5.250% | 12/16/13 | 525 | 539 |
| Home Depot Inc. | 5.400% | 3/1/16 | 1,375 | 1,362 |
| Johnson Controls, Inc. | 5.250% | 1/15/11 | 100 | 101 |
| Johnson Controls, Inc. | 6.000% | 1/15/36 | 125 | 87 |
| Kohl’s Corp. | 6.250% | 12/15/17 | 150 | 154 |
| Kohl’s Corp. | 6.000% | 1/15/33 | 100 | 89 |
| Kohl’s Corp. | 6.875% | 12/15/37 | 150 | 149 |
| Lowe’s Cos., Inc. | 5.600% | 9/15/12 | 100 | 108 |
| Lowe’s Cos., Inc. | 5.400% | 10/15/16 | 425 | 446 |
| Lowe’s Cos., Inc. | 6.100% | 9/15/17 | 200 | 216 |
35
Institutional Total Bond Market Index Fund
| | | Face | Market |
| | Maturity | Amount | Value¥ |
| Coupon | Date | ($000) | ($000) |
Lowe’s Cos., Inc. | 6.875% | 2/15/28 | 200 | 217 |
Lowe’s Cos., Inc. | 5.800% | 10/15/36 | 375 | 366 |
Marriott International | 4.625% | 6/15/12 | 125 | 124 |
Marriott International | 5.625% | 2/15/13 | 175 | 172 |
Marriott International | 6.200% | 6/15/16 | 175 | 164 |
Marriott International | 6.375% | 6/15/17 | 175 | 165 |
McDonald’s Corp. | 6.000% | 4/15/11 | 200 | 215 |
McDonald’s Corp. | 5.300% | 3/15/17 | 50 | 53 |
McDonald’s Corp. | 5.800% | 10/15/17 | 300 | 328 |
McDonald’s Corp. | 5.350% | 3/1/18 | 400 | 422 |
McDonald’s Corp. | 5.000% | 2/1/19 | 150 | 156 |
McDonald’s Corp. | 6.300% | 10/15/37 | 175 | 189 |
McDonald’s Corp. | 5.700% | 2/1/39 | 200 | 199 |
Nordstrom, Inc. | 6.250% | 1/15/18 | 75 | 74 |
Nordstrom, Inc. | 6.950% | 3/15/28 | 75 | 68 |
Nordstrom, Inc. | 7.000% | 1/15/38 | 125 | 113 |
Paccar Inc. | 6.875% | 2/15/14 | 200 | 221 |
Staples Inc. | 7.750% | 4/1/11 | 125 | 132 |
Staples Inc. | 9.750% | 1/15/14 | 800 | 896 |
Target Corp. | 7.500% | 8/15/10 | 100 | 106 |
Target Corp. | 6.350% | 1/15/11 | 125 | 133 |
Target Corp. | 5.875% | 3/1/12 | 350 | 378 |
Target Corp. | 5.125% | 1/15/13 | 425 | 452 |
Target Corp. | 4.000% | 6/15/13 | 160 | 162 |
Target Corp. | 6.000% | 1/15/18 | 425 | 452 |
Target Corp. | 7.000% | 7/15/31 | 600 | 615 |
Target Corp. | 6.350% | 11/1/32 | 50 | 49 |
Target Corp. | 6.500% | 10/15/37 | 75 | 75 |
Target Corp. | 7.000% | 1/15/38 | 675 | 716 |
The Walt Disney Co. | 5.700% | 7/15/11 | 550 | 592 |
The Walt Disney Co. | 6.375% | 3/1/12 | 300 | 330 |
The Walt Disney Co. | 4.500% | 12/15/13 | 325 | 339 |
The Walt Disney Co. | 5.625% | 9/15/16 | 600 | 652 |
The Walt Disney Co. | 5.875% | 12/15/17 | 400 | 443 |
Time Warner COS, Inc. | 7.570% | 2/1/24 | 40 | 38 |
Time Warner COS, Inc. | 6.950% | 1/15/28 | 80 | 74 |
Time Warner, Inc. | 6.750% | 4/15/11 | 350 | 366 |
Time Warner, Inc. | 6.875% | 5/1/12 | 225 | 240 |
Time Warner, Inc. | 7.625% | 4/15/31 | 610 | 591 |
Time Warner, Inc. | 7.700% | 5/1/32 | 770 | 752 |
TJX Companies, Inc. | 6.950% | 4/15/19 | 200 | 225 |
Toll Brothers Finance Corp. | 5.950% | 9/15/13 | 200 | 188 |
Toll Brothers Finance Corp. | 5.150% | 5/15/15 | 125 | 111 |
Toyota Motor Credit Corp. | 4.350% | 12/15/10 | 225 | 233 |
Toyota Motor Credit Corp. | 5.450% | 5/18/11 | 125 | 132 |
VF Corp. | 5.950% | 11/1/17 | 200 | 200 |
VF Corp. | 6.450% | 11/1/37 | 150 | 140 |
Viacom Inc. | 5.750% | 4/30/11 | 325 | 334 |
Viacom Inc. | 6.250% | 4/30/16 | 100 | 98 |
Viacom Inc. | 6.125% | 10/5/17 | 550 | 533 |
Wal-Mart Stores, Inc. | 4.125% | 7/1/10 | 225 | 231 |
Wal-Mart Stores, Inc. | 4.750% | 8/15/10 | 300 | 312 |
Wal-Mart Stores, Inc. | 4.550% | 5/1/13 | 1,100 | 1,158 |
Wal-Mart Stores, Inc. | 7.250% | 6/1/13 | 300 | 346 |
Wal-Mart Stores, Inc. | 3.200% | 5/15/14 | 275 | 274 |
Wal-Mart Stores, Inc. | 4.500% | 7/1/15 | 1,600 | 1,623 |
36
Institutional Total Bond Market Index Fund
| | | Face | Market |
| | Maturity | Amount | Value¥ |
| Coupon | Date | ($000) | ($000) |
Wal-Mart Stores, Inc. | 5.375% | 4/5/17 | 100 | 106 |
Wal-Mart Stores, Inc. | 5.800% | 2/15/18 | 175 | 191 |
Wal-Mart Stores, Inc. | 5.875% | 4/5/27 | 1,075 | 1,114 |
Wal-Mart Stores, Inc. | 7.550% | 2/15/30 | 375 | 473 |
Wal-Mart Stores, Inc. | 5.250% | 9/1/35 | 150 | 143 |
Wal-Mart Stores, Inc. | 6.500% | 8/15/37 | 550 | 614 |
Wal-Mart Stores, Inc. | 6.200% | 4/15/38 | 45 | 49 |
Walgreen Co. | 4.875% | 8/1/13 | 325 | 343 |
Walgreen Co. | 5.250% | 1/15/19 | 625 | 652 |
Western Union Co. | 5.400% | 11/17/11 | 100 | 104 |
Western Union Co. | 6.500% | 2/26/14 | 625 | 670 |
Western Union Co. | 5.930% | 10/1/16 | 225 | 227 |
Western Union Co. | 6.200% | 11/17/36 | 150 | 137 |
Yum! Brands, Inc. | 8.875% | 4/15/11 | 150 | 164 |
Yum! Brands, Inc. | 7.700% | 7/1/12 | 100 | 107 |
Yum! Brands, Inc. | 6.875% | 11/15/37 | 650 | 654 |
| | | | |
Consumer Noncyclical (2.5%) | | | | |
Abbott Laboratories | 3.750% | 3/15/11 | 300 | 310 |
Abbott Laboratories | 5.600% | 5/15/11 | 50 | 54 |
Abbott Laboratories | 5.150% | 11/30/12 | 250 | 271 |
Abbott Laboratories | 4.350% | 3/15/14 | 425 | 442 |
Abbott Laboratories | 5.875% | 5/15/16 | 450 | 488 |
Abbott Laboratories | 5.600% | 11/30/17 | 750 | 809 |
Abbott Laboratories | 5.125% | 4/1/19 | 825 | 850 |
Abbott Laboratories | 6.000% | 4/1/39 | 100 | 106 |
Allergan Inc. | 5.750% | 4/1/16 | 50 | 49 |
Altria Group, Inc. | 8.500% | 11/10/13 | 1,150 | 1,313 |
Altria Group, Inc. | 9.700% | 11/10/18 | 1,050 | 1,201 |
Altria Group, Inc. | 9.250% | 8/6/19 | 675 | 759 |
Altria Group, Inc. | 9.950% | 11/10/38 | 300 | 348 |
Altria Group, Inc. | 10.200% | 2/6/39 | 775 | 915 |
AmerisourceBergen Corp. | 5.625% | 9/15/12 | 100 | 103 |
AmerisourceBergen Corp. | 5.875% | 9/15/15 | 955 | 924 |
Amgen Inc. | 4.850% | 11/18/14 | 325 | 344 |
Amgen Inc. | 5.850% | 6/1/17 | 975 | 1,045 |
Amgen Inc. | 5.700% | 2/1/19 | 300 | 319 |
Amgen Inc. | 6.375% | 6/1/37 | 300 | 321 |
Amgen Inc. | 6.400% | 2/1/39 | 215 | 228 |
Anheuser-Busch Cos., Inc. | 6.000% | 4/15/11 | 300 | 315 |
Anheuser-Busch Cos., Inc. | 6.800% | 8/20/32 | 200 | 185 |
Anheuser-Busch Cos., Inc. | 5.750% | 4/1/36 | 575 | 447 |
Archer-Daniels-Midland Co. | 5.450% | 3/15/18 | 500 | 529 |
Archer-Daniels-Midland Co. | 7.000% | 2/1/31 | 200 | 220 |
Archer-Daniels-Midland Co. | 5.935% | 10/1/32 | 600 | 582 |
Archer-Daniels-Midland Co. | 5.375% | 9/15/35 | 150 | 141 |
Archer-Daniels-Midland Co. | 6.450% | 1/15/38 | 150 | 162 |
AstraZeneca PLC | 5.400% | 9/15/12 | 300 | 325 |
AstraZeneca PLC | 5.400% | 6/1/14 | 525 | 570 |
AstraZeneca PLC | 5.900% | 9/15/17 | 650 | 696 |
AstraZeneca PLC | 6.450% | 9/15/37 | 950 | 1,050 |
Baxter Finco, BV | 4.750% | 10/15/10 | 375 | 389 |
Baxter International, Inc. | 5.900% | 9/1/16 | 275 | 295 |
Baxter International, Inc. | 6.250% | 12/1/37 | 150 | 163 |
Becton, Dickinson & Co. | 5.000% | 5/15/19 | 50 | 51 |
Biogen Idec Inc. | 6.000% | 3/1/13 | 525 | 536 |
37
Institutional Total Bond Market Index Fund
| | | Face | Market |
| | Maturity | Amount | Value¥ |
| Coupon | Date | ($000) | ($000) |
Biogen Idec Inc. | 6.875% | 3/1/18 | 775 | 795 |
Bottling Group LLC | 4.625% | 11/15/12 | 1,025 | 1,093 |
Bottling Group LLC | 5.000% | 11/15/13 | 125 | 135 |
Bottling Group LLC | 6.950% | 3/15/14 | 675 | 774 |
Bottling Group LLC | 5.500% | 4/1/16 | 225 | 235 |
Bristol-Myers Squibb Co. | 5.250% | 8/15/13 | 425 | 456 |
Bristol-Myers Squibb Co. | 5.450% | 5/1/18 | 125 | 132 |
Bristol-Myers Squibb Co. | 5.875% | 11/15/36 | 600 | 638 |
Bristol-Myers Squibb Co. | 6.875% | 8/1/97 | 75 | 75 |
Bunge Ltd. Finance Corp. | 5.100% | 7/15/15 | 100 | 91 |
Bunge Ltd. Finance Corp. | 8.500% | 6/15/19 | 125 | 131 |
C.R. Bard, Inc. | 6.700% | 12/1/26 | 325 | 324 |
Campbell Soup Co. | 6.750% | 2/15/11 | 575 | 620 |
Cardinal Health, Inc. | 5.650% | 6/15/12 | 100 | 103 |
Cardinal Health, Inc. | 5.800% | 10/15/16 | 225 | 217 |
Cia. Brasil de Bebidas AmBev | 10.500% | 12/15/11 | 400 | 460 |
Cia. Brasil de Bebidas AmBev | 8.750% | 9/15/13 | 295 | 337 |
Clorox Co. | 4.200% | 1/15/10 | 25 | 25 |
Clorox Co. | 5.450% | 10/15/12 | 225 | 238 |
Coca-Cola Co. | 5.350% | 11/15/17 | 550 | 593 |
Coca-Cola Co. | 4.875% | 3/15/19 | 550 | 567 |
Coca-Cola Enterprises Inc. | 5.000% | 8/15/13 | 425 | 447 |
Coca-Cola Enterprises Inc. | 7.375% | 3/3/14 | 125 | 143 |
Coca-Cola Enterprises Inc. | 4.250% | 3/1/15 | 375 | 381 |
Coca-Cola Enterprises Inc. | 8.500% | 2/1/22 | 225 | 294 |
Coca-Cola Enterprises Inc. | 7.000% | 10/1/26 | 550 | 611 |
Coca-Cola Enterprises Inc. | 6.950% | 11/15/26 | 225 | 248 |
Coca-Cola Enterprises Inc. | 6.750% | 9/15/28 | 100 | 107 |
ConAgra Foods, Inc. | 7.875% | 9/15/10 | 52 | 55 |
ConAgra Foods, Inc. | 7.125% | 10/1/26 | 200 | 196 |
ConAgra Foods, Inc. | 7.000% | 10/1/28 | 50 | 48 |
ConAgra Foods, Inc. | 8.250% | 9/15/30 | 100 | 108 |
Covidien International | 6.000% | 10/15/17 | 500 | 533 |
Covidien International | 6.550% | 10/15/37 | 325 | 358 |
Delhaize America Inc. | 5.875% | 2/1/14 | 250 | 256 |
Diageo Capital PLC | 5.200% | 1/30/13 | 150 | 157 |
Diageo Capital PLC | 7.375% | 1/15/14 | 900 | 1,025 |
Diageo Capital PLC | 5.750% | 10/23/17 | 475 | 503 |
Diageo Finance BV | 5.300% | 10/28/15 | 50 | 51 |
Dr. Pepper Snapple Group | 6.120% | 5/1/13 | 75 | 79 |
Dr. Pepper Snapple Group | 6.820% | 5/1/18 | 225 | 239 |
Dr. Pepper Snapple Group | 7.450% | 5/1/38 | 50 | 53 |
Eli Lilly & Co. | 3.550% | 3/6/12 | 425 | 441 |
Eli Lilly & Co. | 6.000% | 3/15/12 | 400 | 440 |
Eli Lilly & Co. | 5.500% | 3/15/27 | 500 | 502 |
Express Scripts Inc. | 6.250% | 6/15/14 | 275 | 291 |
Express Scripts Inc. | 7.250% | 6/15/19 | 100 | 111 |
Express Scripts, Inc. | 5.250% | 6/15/12 | 250 | 258 |
Fortune Brands Inc. | 5.125% | 1/15/11 | 500 | 502 |
Fortune Brands Inc. | 6.375% | 6/15/14 | 200 | 199 |
Fortune Brands Inc. | 5.875% | 1/15/36 | 100 | 77 |
Genentech Inc. | 4.400% | 7/15/10 | 75 | 77 |
Genentech Inc. | 4.750% | 7/15/15 | 225 | 235 |
Genentech Inc. | 5.250% | 7/15/35 | 100 | 95 |
General Mills, Inc. | 6.000% | 2/15/12 | 1,508 | 1,622 |
General Mills, Inc. | 5.650% | 9/10/12 | 25 | 27 |
38
Institutional Total Bond Market Index Fund
| | | Face | Market |
| | Maturity | Amount | Value¥ |
| Coupon | Date | ($000) | ($000) |
General Mills, Inc. | 5.250% | 8/15/13 | 500 | 524 |
General Mills, Inc. | 5.200% | 3/17/15 | 135 | 143 |
GlaxoSmithKline Capital Inc. | 4.850% | 5/15/13 | 1,025 | 1,075 |
GlaxoSmithKline Capital Inc. | 4.375% | 4/15/14 | 400 | 409 |
GlaxoSmithKline Capital Inc. | 5.650% | 5/15/18 | 650 | 686 |
GlaxoSmithKline Capital Inc. | 6.375% | 5/15/38 | 1,125 | 1,211 |
Grand Metropolitan Investment Corp. | 9.000% | 8/15/11 | 775 | 870 |
H.J. Heinz Finance Co. | 6.625% | 7/15/11 | 475 | 505 |
H.J. Heinz Finance Co. | 6.750% | 3/15/32 | 375 | 378 |
Hasbro Inc. | 6.300% | 9/15/17 | 425 | 416 |
Hershey Foods Corp. | 5.450% | 9/1/16 | 50 | 51 |
Hospira, Inc. | 5.900% | 6/15/14 | 50 | 50 |
Hospira, Inc. | 6.400% | 5/15/15 | 75 | 77 |
Johnson & Johnson | 5.550% | 8/15/17 | 550 | 600 |
Johnson & Johnson | 5.150% | 7/15/18 | 100 | 107 |
Johnson & Johnson | 6.950% | 9/1/29 | 50 | 59 |
Johnson & Johnson | 4.950% | 5/15/33 | 200 | 189 |
Johnson & Johnson | 5.950% | 8/15/37 | 500 | 538 |
Johnson & Johnson | 5.850% | 7/15/38 | 475 | 512 |
Kellogg Co. | 6.600% | 4/1/11 | 1,225 | 1,317 |
Kellogg Co. | 4.250% | 3/6/13 | 175 | 180 |
Kimberly-Clark Corp. | 5.625% | 2/15/12 | 275 | 294 |
Kimberly-Clark Corp. | 4.875% | 8/15/15 | 375 | 390 |
Kimberly-Clark Corp. | 6.125% | 8/1/17 | 125 | 137 |
Kraft Foods, Inc. | 4.125% | 11/12/09 | 300 | 303 |
Kraft Foods, Inc. | 5.625% | 11/1/11 | 875 | 929 |
Kraft Foods, Inc. | 6.250% | 6/1/12 | 50 | 54 |
Kraft Foods, Inc. | 6.750% | 2/19/14 | 150 | 166 |
Kraft Foods, Inc. | 6.500% | 8/11/17 | 400 | 424 |
Kraft Foods, Inc. | 6.500% | 11/1/31 | 925 | 886 |
Kraft Foods, Inc. | 7.000% | 8/11/37 | 875 | 928 |
Kraft Foods, Inc. | 6.875% | 2/1/38 | 125 | 133 |
Kraft Foods, Inc. | 6.875% | 1/26/39 | 325 | 345 |
Kroger Co. | 6.800% | 4/1/11 | 550 | 585 |
Kroger Co. | 6.200% | 6/15/12 | 225 | 241 |
Kroger Co. | 6.400% | 8/15/17 | 10 | 11 |
Kroger Co. | 6.800% | 12/15/18 | 425 | 463 |
Kroger Co. | 6.150% | 1/15/20 | 370 | 379 |
Kroger Co. | 7.700% | 6/1/29 | 625 | 684 |
Kroger Co. | 8.000% | 9/15/29 | 500 | 564 |
Laboratory Corp. of America | 5.625% | 12/15/15 | 150 | 140 |
Lorillard Tobacco Co. | 8.125% | 6/23/19 | 525 | 541 |
McKesson Corp. | 7.750% | 2/1/12 | 200 | 219 |
McKesson Corp. | 5.250% | 3/1/13 | 625 | 641 |
Medco Health Solutions | 7.250% | 8/15/13 | 625 | 667 |
Medtronic Inc. | 4.750% | 9/15/15 | 575 | 609 |
Merck & Co. | 1.875% | 6/30/11 | 400 | 402 |
Merck & Co. | 4.375% | 2/15/13 | 150 | 157 |
Merck & Co. | 4.750% | 3/1/15 | 425 | 452 |
Merck & Co. | 4.000% | 6/30/15 | 300 | 305 |
Merck & Co. | 5.000% | 6/30/19 | 250 | 253 |
Merck & Co. | 6.400% | 3/1/28 | 550 | 572 |
Merck & Co. | 5.950% | 12/1/28 | 100 | 101 |
Merck & Co. | 5.850% | 6/30/39 | 250 | 255 |
Molson Coors Capital Finance | 4.850% | 9/22/10 | 150 | 152 |
Novartis Capital Corp. | 4.125% | 2/10/14 | 1,150 | 1,184 |
39
Institutional Total Bond Market Index Fund
| | | | Face | Market |
| | | Maturity | Amount | Value¥ |
| | Coupon | Date | ($000) | ($000) |
| Novartis Securities Investment Ltd. | 5.125% | 2/10/19 | 850 | 865 |
| Pepsi Bottling Group, Inc. | 7.000% | 3/1/29 | 200 | 234 |
| PepsiAmericas Inc. | 5.750% | 7/31/12 | 225 | 241 |
| PepsiAmericas Inc. | 4.375% | 2/15/14 | 50 | 50 |
| PepsiAmericas Inc. | 5.000% | 5/15/17 | 250 | 238 |
| PepsiCo, Inc. | 5.150% | 5/15/12 | 200 | 216 |
| PepsiCo, Inc. | 4.650% | 2/15/13 | 125 | 132 |
| PepsiCo, Inc. | 3.750% | 3/1/14 | 650 | 664 |
| PepsiCo, Inc. | 5.000% | 6/1/18 | 400 | 414 |
| PepsiCo, Inc. | 7.900% | 11/1/18 | 775 | 952 |
| Pfizer, Inc. | 4.450% | 3/15/12 | 1,450 | 1,525 |
| Pfizer, Inc. | 5.350% | 3/15/15 | 950 | 1,025 |
| Pfizer, Inc. | 6.200% | 3/15/19 | 1,325 | 1,449 |
| Pfizer, Inc. | 7.200% | 3/15/39 | 675 | 800 |
| Pharmacia Corp. | 6.600% | 12/1/28 | 325 | 364 |
| Philip Morris International Inc | 5.650% | 5/16/18 | 230 | 239 |
| Philip Morris International Inc. | 4.875% | 5/16/13 | 650 | 681 |
| Philip Morris International Inc. | 6.875% | 3/17/14 | 600 | 672 |
| Philip Morris International Inc. | 6.375% | 5/16/38 | 505 | 540 |
| Philips Electronics NV | 4.625% | 3/11/13 | 200 | 205 |
| Philips Electronics NV | 5.750% | 3/11/18 | 475 | 479 |
| Philips Electronics NV | 6.875% | 3/11/38 | 100 | 107 |
| Procter & Gamble Co. | 4.950% | 8/15/14 | 425 | 457 |
| Procter & Gamble Co. | 3.500% | 2/15/15 | 300 | 303 |
| Procter & Gamble Co. | 4.700% | 2/15/19 | 225 | 226 |
| Procter & Gamble Co. | 6.450% | 1/15/26 | 1,000 | 1,087 |
| Procter & Gamble Co. | 5.800% | 8/15/34 | 225 | 239 |
2 | Procter & Gamble Co. ESOP | 9.360% | 1/1/21 | 418 | 529 |
| Quest Diagnostic, Inc. | 6.400% | 7/1/17 | 65 | 65 |
| Quest Diagnostic, Inc. | 6.950% | 7/1/37 | 470 | 474 |
| Reynolds American, Inc. | 6.500% | 7/15/10 | 150 | 152 |
| Reynolds American, Inc. | 7.250% | 6/1/12 | 500 | 515 |
| Reynolds American, Inc. | 7.250% | 6/15/37 | 365 | 301 |
| Safeway, Inc. | 4.950% | 8/16/10 | 300 | 308 |
| Safeway, Inc. | 6.500% | 3/1/11 | 1,150 | 1,221 |
| Safeway, Inc. | 5.800% | 8/15/12 | 100 | 107 |
| Safeway, Inc. | 6.350% | 8/15/17 | 100 | 105 |
| Safeway, Inc. | 7.250% | 2/1/31 | 400 | 446 |
| Schering-Plough Corp. | 5.550% | 12/1/13 | 225 | 242 |
| Schering-Plough Corp. | 6.750% | 12/1/33 | 340 | 374 |
| Sysco Corp. | 4.200% | 2/12/13 | 50 | 51 |
| Sysco Corp. | 5.250% | 2/12/18 | 850 | 879 |
| Sysco Corp. | 5.375% | 9/21/35 | 225 | 213 |
| Teva Pharmaceutical Finance LLC | 5.550% | 2/1/16 | 325 | 335 |
| Unilever Capital Corp. | 7.125% | 11/1/10 | 775 | 828 |
| Unilever Capital Corp. | 3.650% | 2/15/14 | 275 | 280 |
| Unilever Capital Corp. | 4.800% | 2/15/19 | 125 | 126 |
| UST, Inc. | 5.750% | 3/1/18 | 225 | 210 |
| Whirlpool Corp. | 5.500% | 3/1/13 | 800 | 765 |
| Wyeth | 6.950% | 3/15/11 | 275 | 298 |
| Wyeth | 5.500% | 2/15/16 | 75 | 78 |
| Wyeth | 6.450% | 2/1/24 | 75 | 81 |
| Wyeth | 6.500% | 2/1/34 | 775 | 859 |
| Wyeth | 6.000% | 2/15/36 | 175 | 182 |
| Wyeth | 5.950% | 4/1/37 | 1,050 | 1,098 |
40
Institutional Total Bond Market Index Fund
| | | Face | Market |
| | Maturity | Amount | Value¥ |
| Coupon | Date | ($000) | ($000) |
Energy (1.2%) | | | | |
Alberta Energy Co. Ltd. | 7.375% | 11/1/31 | 175 | 189 |
Amerada Hess Corp. | 6.650% | 8/15/11 | 125 | 133 |
Amerada Hess Corp. | 7.875% | 10/1/29 | 670 | 727 |
Anadarko Finance Co. | 6.750% | 5/1/11 | 550 | 577 |
Anadarko Finance Co. | 7.500% | 5/1/31 | 10 | 10 |
Anadarko Petroleum Corp. | 5.750% | 6/15/14 | 100 | 102 |
Anadarko Petroleum Corp. | 7.950% | 6/15/39 | 125 | 130 |
Apache Corp. | 6.250% | 4/15/12 | 350 | 379 |
Apache Corp. | 5.250% | 4/15/13 | 100 | 105 |
Apache Corp. | 6.000% | 9/15/13 | 225 | 245 |
Apache Corp. | 5.625% | 1/15/17 | 50 | 52 |
Apache Corp. | 6.900% | 9/15/18 | 525 | 601 |
Apache Corp. | 6.000% | 1/15/37 | 150 | 158 |
Apache Finance Canada Corp. | 7.750% | 12/15/29 | 50 | 60 |
Baker Hughes, Inc. | 6.875% | 1/15/29 | 75 | 79 |
BJ Services Co. | 6.000% | 6/1/18 | 50 | 48 |
BP Capital Markets PLC | 5.250% | 11/7/13 | 750 | 806 |
BP Capital Markets PLC | 3.625% | 5/8/14 | 900 | 905 |
BP Capital Markets PLC | 4.750% | 3/10/19 | 1,050 | 1,053 |
Burlington Resources, Inc. | 6.680% | 2/15/11 | 325 | 347 |
Burlington Resources, Inc. | 6.500% | 12/1/11 | 425 | 466 |
Burlington Resources, Inc. | 7.200% | 8/15/31 | 100 | 104 |
Burlington Resources, Inc. | 7.400% | 12/1/31 | 650 | 705 |
Canadian Natural Resources | 5.150% | 2/1/13 | 50 | 51 |
Canadian Natural Resources | 4.900% | 12/1/14 | 325 | 327 |
Canadian Natural Resources | 7.200% | 1/15/32 | 575 | 628 |
Canadian Natural Resources | 6.450% | 6/30/33 | 425 | 426 |
Canadian Natural Resources | 6.500% | 2/15/37 | 300 | 303 |
Canadian Natural Resources | 6.250% | 3/15/38 | 150 | 150 |
Canadian Natural Resources | 6.750% | 2/1/39 | 25 | 26 |
Chevron Corp. | 3.450% | 3/3/12 | 425 | 438 |
Chevron Corp. | 3.950% | 3/3/14 | 500 | 515 |
Chevron Corp. | 4.950% | 3/3/19 | 625 | 648 |
Conoco Funding Co. | 6.350% | 10/15/11 | 550 | 599 |
Conoco Funding Co. | 7.250% | 10/15/31 | 75 | 82 |
Conoco, Inc. | 6.950% | 4/15/29 | 25 | 27 |
ConocoPhillips | 4.750% | 2/1/14 | 300 | 312 |
ConocoPhillips | 5.750% | 2/1/19 | 1,000 | 1,051 |
ConocoPhillips | 6.000% | 1/15/20 | 75 | 80 |
ConocoPhillips | 6.500% | 2/1/39 | 600 | 635 |
ConocoPhillips Canada Funding Co I | 5.300% | 4/15/12 | 675 | 721 |
ConocoPhillips Canada Funding Co I | 5.950% | 10/15/36 | 425 | 431 |
Devon Energy Corp. | 5.625% | 1/15/14 | 500 | 529 |
Devon Energy Corp. | 7.950% | 4/15/32 | 75 | 89 |
Devon Financing Corp. | 6.875% | 9/30/11 | 600 | 653 |
Devon Financing Corp. | 7.875% | 9/30/31 | 400 | 472 |
Diamond Offshore Drilling | 4.875% | 7/1/15 | 25 | 24 |
Diamond Offshore Drilling | 5.875% | 5/1/19 | 225 | 228 |
EnCana Corp. | 4.750% | 10/15/13 | 75 | 76 |
EnCana Corp. | 7.200% | 11/1/31 | 200 | 222 |
EnCana Corp. | 6.500% | 8/15/34 | 550 | 558 |
EnCana Corp. | 6.625% | 8/15/37 | 625 | 645 |
EnCana Holdings Finance Corp. | 5.800% | 5/1/14 | 325 | 344 |
EOG Resources Inc. | 6.125% | 10/1/13 | 350 | 380 |
Halliburton Co. | 5.500% | 10/15/10 | 225 | 236 |
41
Institutional Total Bond Market Index Fund
| | | | Face | Market |
| | | Maturity | Amount | Value¥ |
| | Coupon | Date | ($000) | ($000) |
| Halliburton Co. | 6.150% | 9/15/19 | 150 | 163 |
| Halliburton Co. | 6.700% | 9/15/38 | 600 | 647 |
| Halliburton Co. | 7.450% | 9/15/39 | 650 | 758 |
| Hess Corp. | 8.125% | 2/15/19 | 600 | 679 |
| Husky Energy Inc. | 6.250% | 6/15/12 | 75 | 76 |
| Husky Energy Inc. | 5.900% | 6/15/14 | 325 | 339 |
| Husky Energy Inc. | 6.800% | 9/15/37 | 300 | 303 |
| Kerr McGee Corp. | 6.875% | 9/15/11 | 375 | 394 |
| Kerr McGee Corp. | 6.950% | 7/1/24 | 585 | 545 |
| Kerr McGee Corp. | 7.875% | 9/15/31 | 350 | 348 |
| Lasmo Inc. | 7.300% | 11/15/27 | 55 | 63 |
| Marathon Oil Corp. | 6.125% | 3/15/12 | 200 | 211 |
| Marathon Oil Corp. | 6.000% | 7/1/12 | 225 | 237 |
| Marathon Oil Corp. | 6.600% | 10/1/37 | 145 | 140 |
| Nabors Industries Inc. | 6.150% | 2/15/18 | 100 | 95 |
4 | Nabors Industries Inc. | 9.250% | 1/15/19 | 600 | 685 |
| Nexen, Inc. | 5.050% | 11/20/13 | 150 | 147 |
| Nexen, Inc. | 5.650% | 5/15/17 | 225 | 216 |
| Nexen, Inc. | 7.875% | 3/15/32 | 100 | 105 |
| Noble Energy, Inc. | 8.000% | 4/1/27 | 275 | 289 |
| Norsk Hydro | 7.250% | 9/23/27 | 675 | 786 |
| Norsk Hydro | 7.150% | 1/15/29 | 125 | 139 |
| Occidental Petroleum | 4.250% | 3/15/10 | 425 | 436 |
| Occidental Petroleum | 6.750% | 1/15/12 | 150 | 164 |
| Ocean Energy, Inc. | 7.250% | 10/1/11 | 50 | 55 |
| PC Financial Partnership | 5.000% | 11/15/14 | 450 | 437 |
| Petro-Canada | 4.000% | 7/15/13 | 100 | 97 |
| Petro-Canada | 6.050% | 5/15/18 | 425 | 425 |
| Petro-Canada | 7.875% | 6/15/26 | 150 | 162 |
| Petro-Canada | 7.000% | 11/15/28 | 125 | 124 |
| Petro-Canada | 5.350% | 7/15/33 | 125 | 101 |
| Petro-Canada | 5.950% | 5/15/35 | 150 | 131 |
| Questar Market Resources | 6.050% | 9/1/16 | 150 | 136 |
| Shell International Finance BV | 5.625% | 6/27/11 | 275 | 295 |
| Shell International Finance BV | 4.950% | 3/22/12 | 200 | 215 |
| Shell International Finance BV | 4.000% | 3/21/14 | 625 | 641 |
| Shell International Finance BV | 5.200% | 3/22/17 | 175 | 178 |
| Shell International Finance BV | 6.375% | 12/15/38 | 550 | 597 |
| Statoilhydro ASA | 3.875% | 4/15/14 | 75 | 76 |
| Statoilhydro ASA | 5.250% | 4/15/19 | 75 | 77 |
| Suncor Energy, Inc. | 6.100% | 6/1/18 | 200 | 201 |
| Suncor Energy, Inc. | 5.950% | 12/1/34 | 100 | 88 |
| Suncor Energy, Inc. | 6.850% | 6/1/39 | 700 | 684 |
| Sunoco, Inc. | 4.875% | 10/15/14 | 50 | 47 |
| Sunoco, Inc. | 5.750% | 1/15/17 | 150 | 141 |
| Talisman Energy, Inc. | 5.125% | 5/15/15 | 50 | 46 |
| Talisman Energy, Inc. | 5.850% | 2/1/37 | 650 | 551 |
| Tosco Corp. | 8.125% | 2/15/30 | 675 | 767 |
| Transocean Inc. | 5.250% | 3/15/13 | 125 | 130 |
| Transocean Inc. | 6.000% | 3/15/18 | 375 | 385 |
| Transocean Inc. | 7.500% | 4/15/31 | 200 | 220 |
| Transocean Inc. | 6.800% | 3/15/38 | 160 | 169 |
| Valero Energy Corp. | 6.875% | 4/15/12 | 375 | 397 |
| Valero Energy Corp. | 9.375% | 3/15/19 | 400 | 456 |
| Valero Energy Corp. | 7.500% | 4/15/32 | 475 | 454 |
| Valero Energy Corp. | 6.625% | 6/15/37 | 675 | 567 |
42
Institutional Total Bond Market Index Fund
| | | Face | Market |
| | Maturity | Amount | Value¥ |
| Coupon | Date | ($000) | ($000) |
Weatherford International Inc. | 5.500% | 2/15/16 | 40 | 39 |
Weatherford International Inc. | 6.350% | 6/15/17 | 350 | 348 |
Weatherford International Inc. | 9.625% | 3/1/19 | 375 | 439 |
Weatherford International Inc. | 6.500% | 8/1/36 | 425 | 382 |
Weatherford International Inc. | 6.800% | 6/15/37 | 100 | 94 |
XTO Energy, Inc. | 5.900% | 8/1/12 | 200 | 213 |
XTO Energy, Inc. | 6.250% | 4/15/13 | 225 | 240 |
XTO Energy, Inc. | 5.750% | 12/15/13 | 725 | 765 |
XTO Energy, Inc. | 4.900% | 2/1/14 | 375 | 382 |
XTO Energy, Inc. | 5.000% | 1/31/15 | 50 | 51 |
XTO Energy, Inc. | 5.300% | 6/30/15 | 100 | 102 |
XTO Energy, Inc. | 6.250% | 8/1/17 | 750 | 795 |
XTO Energy, Inc. | 6.500% | 12/15/18 | 300 | 322 |
XTO Energy, Inc. | 6.100% | 4/1/36 | 50 | 48 |
| | | | |
Other Industrial (0.0%) | | | | |
Cintas Corp. | 6.125% | 12/1/17 | 200 | 183 |
| | | | |
Technology (0.7%) | | | | |
Agilent Technologies Inc. | 6.500% | 11/1/17 | 575 | 496 |
Analog Devices Inc. | 5.000% | 7/1/14 | 250 | 251 |
Avnet Inc. | 6.625% | 9/15/16 | 235 | 219 |
BMC Software Inc. | 7.250% | 6/1/18 | 150 | 152 |
Cisco Systems Inc. | 5.250% | 2/22/11 | 1,250 | 1,324 |
Cisco Systems Inc. | 5.500% | 2/22/16 | 600 | 637 |
Cisco Systems Inc. | 4.950% | 2/15/19 | 325 | 325 |
Cisco Systems Inc. | 5.900% | 2/15/39 | 950 | 934 |
Corning Inc. | 6.625% | 5/15/19 | 50 | 51 |
Dell Inc. | 4.700% | 4/15/13 | 350 | 362 |
Dell Inc. | 5.650% | 4/15/18 | 200 | 202 |
Dell Inc. | 5.875% | 6/15/19 | 125 | 128 |
Dell Inc. | 6.500% | 4/15/38 | 250 | 240 |
Electronic Data Systems | 7.125% | 10/15/09 | 190 | 193 |
Electronic Data Systems | 6.000% | 8/1/13 | 325 | 352 |
Equifax Inc. | 6.300% | 7/1/17 | 100 | 99 |
Equifax Inc. | 7.000% | 7/1/37 | 125 | 120 |
Fiserv, Inc. | 6.125% | 11/20/12 | 325 | 338 |
Fiserv, Inc. | 6.800% | 11/20/17 | 450 | 454 |
Harris Corp. | 5.000% | 10/1/15 | 225 | 221 |
Hewlett-Packard Co. | 2.250% | 5/27/11 | 125 | 126 |
Hewlett-Packard Co. | 4.250% | 2/24/12 | 325 | 339 |
Hewlett-Packard Co. | 4.500% | 3/1/13 | 325 | 339 |
Hewlett-Packard Co. | 6.125% | 3/1/14 | 600 | 661 |
Hewlett-Packard Co. | 4.750% | 6/2/14 | 500 | 522 |
Hewlett-Packard Co. | 5.400% | 3/1/17 | 425 | 442 |
Hewlett-Packard Co. | 5.500% | 3/1/18 | 975 | 1,018 |
IBM International Group Capital | 5.050% | 10/22/12 | 325 | 349 |
International Business Machines Corp. | 4.950% | 3/22/11 | 150 | 159 |
International Business Machines Corp. | 7.500% | 6/15/13 | 325 | 367 |
International Business Machines Corp. | 5.700% | 9/14/17 | 2,325 | 2,469 |
International Business Machines Corp. | 7.000% | 10/30/25 | 200 | 220 |
International Business Machines Corp. | 6.220% | 8/1/27 | 500 | 525 |
International Business Machines Corp. | 5.875% | 11/29/32 | 100 | 101 |
International Business Machines Corp. | 8.000% | 10/15/38 | 500 | 648 |
International Business Machines Corp. | 7.125% | 12/1/96 | 50 | 53 |
International Game Technology | 7.500% | 6/15/19 | 100 | 100 |
43
Institutional Total Bond Market Index Fund
| | | | Face | Market |
| | | Maturity | Amount | Value¥ |
| | Coupon | Date | ($000) | ($000) |
| Intuit Inc. | 5.400% | 3/15/12 | 200 | 203 |
| Intuit Inc. | 5.750% | 3/15/17 | 100 | 95 |
| Lexmark International Inc. | 5.900% | 6/1/13 | 125 | 120 |
| Lexmark International Inc. | 6.650% | 6/1/18 | 325 | 283 |
| Microsoft Corp. | 2.950% | 6/1/14 | 400 | 398 |
| Microsoft Corp. | 4.200% | 6/1/19 | 50 | 49 |
| Microsoft Corp. | 5.200% | 6/1/39 | 450 | 435 |
| Motorola, Inc. | 7.625% | 11/15/10 | 101 | 103 |
| Motorola, Inc. | 5.375% | 11/15/12 | 225 | 210 |
| Motorola, Inc. | 7.500% | 5/15/25 | 50 | 39 |
| Motorola, Inc. | 6.500% | 9/1/25 | 25 | 18 |
| Motorola, Inc. | 6.500% | 11/15/28 | 100 | 71 |
| Motorola, Inc. | 6.625% | 11/15/37 | 250 | 174 |
| Nokia Corp. | 5.375% | 5/15/19 | 225 | 226 |
| Nokia Corp. | 6.625% | 5/15/39 | 175 | 183 |
| Oracle Corp. | 5.000% | 1/15/11 | 500 | 524 |
| Oracle Corp. | 4.950% | 4/15/13 | 1,750 | 1,840 |
| Oracle Corp. | 5.250% | 1/15/16 | 500 | 519 |
| Oracle Corp. | 5.750% | 4/15/18 | 425 | 450 |
| Oracle Corp. | 5.000% | 7/8/19 | 350 | 349 |
| Oracle Corp. | 6.125% | 7/8/39 | 450 | 447 |
| Pitney Bowes, Inc. | 3.875% | 6/15/13 | 225 | 228 |
| Pitney Bowes, Inc. | 4.750% | 1/15/16 | 1,200 | 1,205 |
| Science Applications International Corp. | 6.250% | 7/1/12 | 50 | 51 |
| Science Applications International Corp. | 5.500% | 7/1/33 | 50 | 42 |
| Xerox Capital Trust I | 8.000% | 2/1/27 | 225 | 171 |
| Xerox Corp. | 7.125% | 6/15/10 | 425 | 440 |
| Xerox Corp. | 6.875% | 8/15/11 | 125 | 129 |
| Xerox Corp. | 5.500% | 5/15/12 | 290 | 289 |
| Xerox Corp. | 7.625% | 6/15/13 | 125 | 126 |
| Xerox Corp. | 8.250% | 5/15/14 | 400 | 415 |
| Xerox Corp. | 6.400% | 3/15/16 | 295 | 273 |
| Xerox Corp. | 6.750% | 2/1/17 | 200 | 183 |
| | | | | |
| Transportation (0.4%) | | | | |
2 | American Airlines, Inc. | 10.375% | 7/2/19 | 150 | 151 |
| Burlington Northern Santa Fe Corp. | 6.750% | 7/15/11 | 225 | 242 |
| Burlington Northern Santa Fe Corp. | 5.650% | 5/1/17 | 1,025 | 1,043 |
| Burlington Northern Santa Fe Corp. | 7.000% | 12/15/25 | 225 | 240 |
| Burlington Northern Santa Fe Corp. | 6.200% | 8/15/36 | 325 | 329 |
| Canadian National Railway Co. | 6.375% | 10/15/11 | 200 | 217 |
| Canadian National Railway Co. | 4.400% | 3/15/13 | 125 | 126 |
| Canadian National Railway Co. | 5.850% | 11/15/17 | 50 | 53 |
| Canadian National Railway Co. | 6.800% | 7/15/18 | 525 | 588 |
| Canadian National Railway Co. | 6.250% | 8/1/34 | 125 | 132 |
| Canadian National Railway Co. | 6.200% | 6/1/36 | 275 | 289 |
| Canadian Pacific Railway Co. | 7.125% | 10/15/31 | 75 | 70 |
| Canadian Pacific Railway Co. | 5.950% | 5/15/37 | 100 | 79 |
| CNF, Inc. | 6.700% | 5/1/34 | 225 | 144 |
| Continental Airlines, Inc. | 6.563% | 2/15/12 | 225 | 204 |
2 | Continental Airlines, Inc. | 6.648% | 9/15/17 | 684 | 575 |
2 | Continental Airlines, Inc. | 5.983% | 4/19/22 | 105 | 89 |
| CSX Corp. | 6.750% | 3/15/11 | 525 | 550 |
| CSX Corp. | 6.300% | 3/15/12 | 200 | 209 |
| CSX Corp. | 5.600% | 5/1/17 | 50 | 49 |
| CSX Corp. | 7.900% | 5/1/17 | 125 | 139 |
44
Institutional Total Bond Market Index Fund
| | | | Face | Market |
| | | Maturity | Amount | Value¥ |
| | Coupon | Date | ($000) | ($000) |
| CSX Corp. | 7.375% | 2/1/19 | 1,250 | 1,362 |
| CSX Corp. | 6.150% | 5/1/37 | 225 | 201 |
| Delta Air Lines, Inc. | 7.111% | 9/18/11 | 225 | 212 |
2 | Delta Air Lines, Inc. | 6.821% | 8/10/22 | 489 | 413 |
| Norfolk Southern Corp. | 6.750% | 2/15/11 | 875 | 922 |
4 | Norfolk Southern Corp. | 5.750% | 1/15/16 | 300 | 307 |
| Norfolk Southern Corp. | 7.700% | 5/15/17 | 125 | 141 |
| Norfolk Southern Corp. | 9.750% | 6/15/20 | 283 | 379 |
| Norfolk Southern Corp. | 7.050% | 5/1/37 | 30 | 33 |
| Norfolk Southern Corp. | 7.900% | 5/15/97 | 150 | 154 |
| Ryder System Inc. | 5.950% | 5/2/11 | 150 | 150 |
| Ryder System Inc. | 5.850% | 3/1/14 | 150 | 143 |
| Ryder System Inc. | 7.200% | 9/1/15 | 225 | 216 |
| Ryder System Inc. | 5.850% | 11/1/16 | 50 | 43 |
| Southwest Airlines Co. | 6.500% | 3/1/12 | 475 | 493 |
| Southwest Airlines Co. | 5.750% | 12/15/16 | 200 | 183 |
| Southwest Airlines Co. | 5.125% | 3/1/17 | 50 | 43 |
2 | Southwest Airlines Co. 2007-1 | | | | |
| Pass Through Trust | 6.150% | 8/1/22 | 349 | 329 |
| Union Pacific Corp. | 6.125% | 1/15/12 | 50 | 53 |
| Union Pacific Corp. | 6.500% | 4/15/12 | 125 | 133 |
| Union Pacific Corp. | 5.450% | 1/31/13 | 550 | 568 |
| Union Pacific Corp. | 5.375% | 5/1/14 | 325 | 333 |
| Union Pacific Corp. | 5.750% | 11/15/17 | 200 | 202 |
| Union Pacific Corp. | 5.700% | 8/15/18 | 225 | 226 |
| Union Pacific Corp. | 6.625% | 2/1/29 | 250 | 250 |
2 | Union Pacific Railroad Co. 2007-3 | | | | |
| Pass Through Trust | 6.176% | 1/2/31 | 121 | 123 |
| United Parcel Service of America | 3.875% | 4/1/14 | 300 | 310 |
| United Parcel Service of America | 5.500% | 1/15/18 | 150 | 160 |
| United Parcel Service of America | 5.125% | 4/1/19 | 225 | 236 |
| United Parcel Service of America | 6.200% | 1/15/38 | 300 | 324 |
| | | | | 344,081 |
Utilities (2.0%) | | | | |
| Electric (1.4%) | | | | |
| AEP Texas Central Co. | 6.650% | 2/15/33 | 150 | 148 |
| Alabama Power Co. | 5.500% | 10/15/17 | 375 | 396 |
| Alabama Power Co. | 6.000% | 3/1/39 | 25 | 26 |
| American Water Capital Corp. | 6.593% | 10/15/37 | 375 | 330 |
| Arizona Public Service Co. | 4.650% | 5/15/15 | 150 | 143 |
| Baltimore Gas & Electric Co. | 5.900% | 10/1/16 | 225 | 226 |
| Baltimore Gas & Electric Co. | 6.350% | 10/1/36 | 100 | 97 |
| Carolina Power & Light Co. | 6.500% | 7/15/12 | 650 | 708 |
| Carolina Power & Light Co. | 5.125% | 9/15/13 | 325 | 346 |
| CenterPoint Energy Houston | 5.700% | 3/15/13 | 450 | 452 |
| CenterPoint Energy Houston | 7.000% | 3/1/14 | 225 | 244 |
| CenterPoint Energy Inc. | 6.500% | 5/1/18 | 70 | 62 |
| Cincinnati Gas & Electric Co. | 5.700% | 9/15/12 | 100 | 101 |
| Cleveland Electric Illumination Co. | 7.880% | 11/1/17 | 75 | 85 |
| Columbus Southern Power | 5.850% | 10/1/35 | 225 | 201 |
| Commonwealth Edison Co. | 6.150% | 3/15/12 | 150 | 159 |
| Commonwealth Edison Co. | 5.950% | 8/15/16 | 500 | 518 |
| Commonwealth Edison Co. | 6.150% | 9/15/17 | 700 | 728 |
| Commonwealth Edison Co. | 5.800% | 3/15/18 | 150 | 153 |
| Connecticut Light & Power Co. | 6.350% | 6/1/36 | 600 | 643 |
| Consolidated Edison Co. of New York | 4.875% | 2/1/13 | 75 | 78 |
45
Institutional Total Bond Market Index Fund
| | | | Face | Market |
| | | Maturity | Amount | Value¥ |
| | Coupon | Date | ($000) | ($000) |
| Consolidated Edison Co. of New York | 5.375% | 12/15/15 | 125 | 130 |
| Consolidated Edison Co. of New York | 5.500% | 9/15/16 | 650 | 680 |
| Consolidated Edison Co. of New York | 6.650% | 4/1/19 | 200 | 222 |
| Consolidated Edison Co. of New York | 5.300% | 3/1/35 | 25 | 23 |
| Consolidated Edison Co. of New York | 5.850% | 3/15/36 | 125 | 128 |
| Consolidated Edison Co. of New York | 6.200% | 6/15/36 | 175 | 188 |
| Consolidated Edison Co. of New York | 6.300% | 8/15/37 | 400 | 423 |
| Constellation Energy Group, Inc. | 6.125% | 9/1/09 | 125 | 125 |
| Constellation Energy Group, Inc. | 7.000% | 4/1/12 | 25 | 26 |
| Constellation Energy Group, Inc. | 4.550% | 6/15/15 | 625 | 544 |
| Constellation Energy Group, Inc. | 7.600% | 4/1/32 | 150 | 135 |
| Consumers Energy Co. | 5.000% | 2/15/12 | 150 | 154 |
| Consumers Energy Co. | 5.375% | 4/15/13 | 75 | 76 |
| Consumers Energy Co. | 5.500% | 8/15/16 | 300 | 302 |
| Detroit Edison Co. | 6.125% | 10/1/10 | 125 | 130 |
| Detroit Edison Co. | 5.700% | 10/1/37 | 150 | 145 |
| Dominion Resources, Inc. | 4.750% | 12/15/10 | 300 | 311 |
| Dominion Resources, Inc. | 6.250% | 6/30/12 | 110 | 118 |
| Dominion Resources, Inc. | 5.700% | 9/17/12 | 80 | 85 |
| Dominion Resources, Inc. | 6.000% | 11/30/17 | 475 | 492 |
| Dominion Resources, Inc. | 6.400% | 6/15/18 | 290 | 310 |
| Dominion Resources, Inc. | 6.300% | 3/15/33 | 50 | 50 |
| Dominion Resources, Inc. | 5.250% | 8/1/33 | 75 | 72 |
| Dominion Resources, Inc. | 5.950% | 6/15/35 | 225 | 220 |
2 | Dominion Resources, Inc. | 6.300% | 9/30/66 | 150 | 101 |
| DTE Energy Co. | 7.050% | 6/1/11 | 75 | 79 |
| Duke Energy Carolinas LLC | 6.100% | 6/1/37 | 600 | 625 |
| Duke Energy Carolinas LLC | 6.000% | 1/15/38 | 50 | 53 |
| Duke Energy Carolinas LLC | 6.050% | 4/15/38 | 25 | 27 |
| Duke Energy Corp. | 6.250% | 1/15/12 | 525 | 565 |
| Duke Energy Corp. | 6.450% | 10/15/32 | 400 | 445 |
| Duke Energy Indiana Inc. | 6.350% | 8/15/38 | 375 | 409 |
| El Paso Electric Co. | 6.000% | 5/15/35 | 50 | 38 |
| Energy East Corp. | 6.750% | 6/15/12 | 225 | 244 |
| Energy East Corp. | 6.750% | 7/15/36 | 325 | 328 |
| Entergy Gulf States, Inc. | 6.000% | 5/1/18 | 475 | 476 |
| Entergy Louisiana LLC | 6.500% | 9/1/18 | 100 | 102 |
| Exelon Corp. | 4.900% | 6/15/15 | 225 | 212 |
| Exelon Corp. | 5.625% | 6/15/35 | 20 | 17 |
| FirstEnergy Corp. | 6.450% | 11/15/11 | 1,190 | 1,247 |
| FirstEnergy Corp. | 7.375% | 11/15/31 | 30 | 29 |
| Florida Power & Light Co. | 5.550% | 11/1/17 | 100 | 108 |
| Florida Power & Light Co. | 5.950% | 10/1/33 | 175 | 186 |
| Florida Power & Light Co. | 5.625% | 4/1/34 | 325 | 336 |
| Florida Power & Light Co. | 4.950% | 6/1/35 | 75 | 70 |
| Florida Power & Light Co. | 5.650% | 2/1/37 | 300 | 308 |
| Florida Power & Light Co. | 5.850% | 5/1/37 | 225 | 234 |
| Florida Power Corp. | 4.800% | 3/1/13 | 325 | 340 |
| Florida Power Corp. | 5.650% | 6/15/18 | 225 | 241 |
| Florida Power Corp. | 6.350% | 9/15/37 | 150 | 168 |
| FPL Group Capital, Inc. | 5.625% | 9/1/11 | 100 | 107 |
| FPL Group Capital, Inc. | 5.350% | 6/15/13 | 300 | 318 |
2 | FPL Group Capital, Inc. | 6.350% | 10/1/66 | 100 | 80 |
2 | FPL Group Capital, Inc. | 6.650% | 6/15/67 | 275 | 219 |
| Illinois Power Co. | 6.125% | 11/15/17 | 150 | 142 |
| Indiana Michigan Power Co. | 7.000% | 3/15/19 | 350 | 377 |
46
Institutional Total Bond Market Index Fund
| | | | Face | Market |
| | | Maturity | Amount | Value¥ |
| | Coupon | Date | ($000) | ($000) |
| Indiana Michigan Power Co. | 6.050% | 3/15/37 | 1,000 | 946 |
2 | Integrys Energy Group | 6.110% | 12/1/66 | 350 | 227 |
| Jersey Central Power & Light | 5.625% | 5/1/16 | 200 | 198 |
| Jersey Central Power & Light | 5.650% | 6/1/17 | 200 | 199 |
| Kansas City Power & Light | 6.050% | 11/15/35 | 75 | 66 |
| MidAmerican Energy Co. | 5.650% | 7/15/12 | 150 | 162 |
| MidAmerican Energy Co. | 5.950% | 7/15/17 | 475 | 504 |
| MidAmerican Energy Co. | 6.750% | 12/30/31 | 325 | 369 |
| MidAmerican Energy Co. | 5.750% | 11/1/35 | 125 | 120 |
| MidAmerican Energy Holdings Co. | 5.875% | 10/1/12 | 400 | 424 |
| MidAmerican Energy Holdings Co. | 5.000% | 2/15/14 | 75 | 78 |
| MidAmerican Energy Holdings Co. | 6.125% | 4/1/36 | 1,400 | 1,391 |
| MidAmerican Energy Holdings Co. | 5.950% | 5/15/37 | 425 | 418 |
| National Rural Utilities Cooperative Finance Corp. | 7.250% | 3/1/12 | 1,425 | 1,554 |
| National Rural Utilities Cooperative Finance Corp. | 5.500% | 7/1/13 | 225 | 235 |
| National Rural Utilities Cooperative Finance Corp. | 4.750% | 3/1/14 | 550 | 550 |
| National Rural Utilities Cooperative Finance Corp. | 5.450% | 2/1/18 | 300 | 303 |
| National Rural Utilities Cooperative Finance Corp. | 8.000% | 3/1/32 | 100 | 112 |
| Nevada Power Co. | 7.125% | 3/15/19 | 500 | 538 |
| NiSource Finance Corp. | 5.400% | 7/15/14 | 75 | 71 |
| NiSource Finance Corp. | 5.250% | 9/15/17 | 225 | 194 |
| NiSource Finance Corp. | 5.450% | 9/15/20 | 250 | 210 |
| Northern States Power Co. | 5.250% | 3/1/18 | 75 | 78 |
| Northern States Power Co. | 6.250% | 6/1/36 | 50 | 54 |
| NStar Electric Co. | 4.875% | 4/15/14 | 75 | 79 |
| NStar Electric Co. | 5.625% | 11/15/17 | 450 | 482 |
| Ohio Edison | 6.400% | 7/15/16 | 200 | 204 |
| Ohio Power Co. | 5.750% | 9/1/13 | 100 | 102 |
| Ohio Power Co. | 6.000% | 6/1/16 | 150 | 153 |
| Oncor Electric Delivery Co. | 6.375% | 5/1/12 | 300 | 317 |
| Oncor Electric Delivery Co. | 6.375% | 1/15/15 | 485 | 504 |
| Oncor Electric Delivery Co. | 7.000% | 5/1/32 | 425 | 451 |
| Oncor Electric Delivery Co. | 7.250% | 1/15/33 | 155 | 167 |
| Pacific Gas & Electric Co. | 4.200% | 3/1/11 | 100 | 103 |
| Pacific Gas & Electric Co. | 4.800% | 3/1/14 | 600 | 630 |
| Pacific Gas & Electric Co. | 5.625% | 11/30/17 | 125 | 133 |
| Pacific Gas & Electric Co. | 8.250% | 10/15/18 | 175 | 216 |
| Pacific Gas & Electric Co. | 6.050% | 3/1/34 | 1,295 | 1,356 |
| Pacific Gas & Electric Co. | 5.800% | 3/1/37 | 325 | 328 |
| PacifiCorp | 6.900% | 11/15/11 | 225 | 251 |
| PacifiCorp | 7.700% | 11/15/31 | 100 | 123 |
| PacifiCorp | 5.250% | 6/15/35 | 50 | 47 |
| PECO Energy Co. | 5.350% | 3/1/18 | 100 | 102 |
| Pennsylvania Electric Co. | 6.050% | 9/1/17 | 100 | 98 |
| Pepco Holdings, Inc. | 6.450% | 8/15/12 | 350 | 364 |
| Pepco Holdings, Inc. | 7.450% | 8/15/32 | 75 | 70 |
| PPL Electric Utilities Corp. | 6.250% | 5/15/39 | 525 | 557 |
| PPL Energy Supply LLC | 6.400% | 11/1/11 | 600 | 628 |
| PPL Energy Supply LLC | 6.300% | 7/15/13 | 100 | 105 |
| PPL Energy Supply LLC | 6.200% | 5/15/16 | 226 | 222 |
| Progress Energy, Inc. | 7.100% | 3/1/11 | 630 | 671 |
| Progress Energy, Inc. | 6.050% | 3/15/14 | 300 | 320 |
| Progress Energy, Inc. | 5.625% | 1/15/16 | 225 | 231 |
| Progress Energy, Inc. | 7.050% | 3/15/19 | 75 | 83 |
| Progress Energy, Inc. | 7.750% | 3/1/31 | 150 | 176 |
| Progress Energy, Inc. | 7.000% | 10/30/31 | 25 | 27 |
47
Institutional Total Bond Market Index Fund
| | | | Face | Market |
| | | Maturity | Amount | Value¥ |
| | Coupon | Date | ($000) | ($000) |
| PSE&G Power LLC | 7.750% | 4/15/11 | 375 | 401 |
| PSE&G Power LLC | 6.950% | 6/1/12 | 475 | 521 |
| PSE&G Power LLC | 5.000% | 4/1/14 | 175 | 178 |
| PSE&G Power LLC | 5.500% | 12/1/15 | 200 | 198 |
| PSE&G Power LLC | 8.625% | 4/15/31 | 50 | 59 |
| PSI Energy Inc. | 5.000% | 9/15/13 | 225 | 233 |
| Public Service Co. of Colorado | 7.875% | 10/1/12 | 825 | 955 |
| Public Service Co. of Colorado | 5.500% | 4/1/14 | 100 | 108 |
| Public Service Co. of Colorado | 5.125% | 6/1/19 | 125 | 128 |
| Public Service Co. of Colorado | 6.250% | 9/1/37 | 50 | 55 |
| Public Service Co. of Oklahoma | 6.625% | 11/15/37 | 300 | 284 |
| Puget Sound Energy Inc. | 5.483% | 6/1/35 | 50 | 40 |
| Puget Sound Energy Inc. | 6.274% | 3/15/37 | 300 | 266 |
| SCANA Corp. | 6.875% | 5/15/11 | 600 | 626 |
| Sierra Pacific Power Co. | 6.000% | 5/15/16 | 150 | 151 |
| Sierra Pacific Power Co. | 6.750% | 7/1/37 | 300 | 309 |
| South Carolina Electric & Gas Co. | 6.500% | 11/1/18 | 100 | 113 |
| South Carolina Electric & Gas Co. | 6.050% | 1/15/38 | 50 | 55 |
| Southern California Edison Co. | 5.000% | 1/15/14 | 500 | 526 |
| Southern California Edison Co. | 4.650% | 4/1/15 | 25 | 26 |
| Southern California Edison Co. | 5.000% | 1/15/16 | 50 | 51 |
| Southern California Edison Co. | 6.650% | 4/1/29 | 100 | 107 |
| Southern California Edison Co. | 5.750% | 4/1/35 | 100 | 105 |
| Southern California Edison Co. | 5.350% | 7/15/35 | 100 | 99 |
| Southern California Edison Co. | 5.625% | 2/1/36 | 50 | 51 |
| Southern California Edison Co. | 5.550% | 1/15/37 | 600 | 611 |
| Southern California Edison Co. | 6.050% | 3/15/39 | 100 | 107 |
| Southern Co. | 5.300% | 1/15/12 | 600 | 631 |
| Southern Co. | 4.150% | 5/15/14 | 300 | 302 |
| Southern Power Co. | 6.250% | 7/15/12 | 75 | 81 |
| Southern Power Co. | 4.875% | 7/15/15 | 325 | 314 |
| Tampa Electric Co. | 6.550% | 5/15/36 | 175 | 165 |
| Toledo Edison Co. | 6.150% | 5/15/37 | 125 | 119 |
| TransAlta Corp. | 6.650% | 5/15/18 | 100 | 96 |
| Union Electric Co. | 5.400% | 2/1/16 | 125 | 120 |
| Virginia Electric & Power Co. | 5.100% | 11/30/12 | 225 | 238 |
| Virginia Electric & Power Co. | 5.400% | 1/15/16 | 425 | 441 |
| Virginia Electric & Power Co. | 5.000% | 6/30/19 | 800 | 805 |
| Virginia Electric & Power Co. | 6.000% | 5/15/37 | 250 | 256 |
| Virginia Electric & Power Co. | 6.350% | 11/30/37 | 100 | 107 |
| Wisconsin Electric Power Co. | 6.000% | 4/1/14 | 575 | 630 |
| Wisconsin Electric Power Co. | 5.625% | 5/15/33 | 75 | 73 |
| Wisconsin Energy Corp. | 6.500% | 4/1/11 | 175 | 186 |
2 | Wisconsin Energy Corp. | 6.250% | 5/15/67 | 775 | 580 |
| Wisconsin Power & Light Co. | 6.375% | 8/15/37 | 250 | 230 |
| Xcel Energy, Inc. | 5.613% | 4/1/17 | 56 | 56 |
| Xcel Energy, Inc. | 6.500% | 7/1/36 | 200 | 207 |
| | | | | |
| Natural Gas (0.6%) | | | | |
| AGL Capital Corp. | 7.125% | 1/14/11 | 125 | 131 |
| Atmos Energy Corp. | 4.950% | 10/15/14 | 200 | 197 |
| Atmos Energy Corp. | 8.500% | 3/15/19 | 100 | 116 |
| Boardwalk Pipelines LLC | 5.500% | 2/1/17 | 50 | 46 |
| CenterPoint Energy Resources | 7.875% | 4/1/13 | 325 | 346 |
| CenterPoint Energy Resources | 6.150% | 5/1/16 | 300 | 282 |
| Consolidated Natural Gas Co. | 6.250% | 11/1/11 | 600 | 643 |
48
Institutional Total Bond Market Index Fund
| | | | Face | Market |
| | | Maturity | Amount | Value¥ |
| | Coupon | Date | ($000) | ($000) |
| Duke Energy Field Services | 7.875% | 8/16/10 | 100 | 104 |
| Duke Energy Field Services | 8.125% | 8/16/30 | 100 | 99 |
| El Paso Natural Gas Co. | 5.950% | 4/15/17 | 125 | 120 |
| Enbridge Energy Partners | 9.875% | 3/1/19 | 600 | 718 |
| Energy Transfer Partners LP | 5.650% | 8/1/12 | 600 | 616 |
| Energy Transfer Partners LP | 8.500% | 4/15/14 | 50 | 57 |
| Energy Transfer Partners LP | 5.950% | 2/1/15 | 75 | 75 |
| Energy Transfer Partners LP | 6.125% | 2/15/17 | 125 | 124 |
| Energy Transfer Partners LP | 9.000% | 4/15/19 | 675 | 765 |
| Energy Transfer Partners LP | 6.625% | 10/15/36 | 225 | 213 |
| Enterprise Products Operating LP | 4.950% | 6/1/10 | 300 | 304 |
| Enterprise Products Operating LP | 4.600% | 8/1/12 | 250 | 251 |
| Enterprise Products Operating LP | 9.750% | 1/31/14 | 500 | 575 |
| Enterprise Products Operating LP | 5.600% | 10/15/14 | 375 | 383 |
| Enterprise Products Operating LP | 6.300% | 9/15/17 | 325 | 327 |
| Enterprise Products Operating LP | 6.875% | 3/1/33 | 50 | 52 |
| EQT Corp. | 8.125% | 6/1/19 | 325 | 347 |
| KeySpan Corp. | 7.625% | 11/15/10 | 50 | 53 |
| KeySpan Corp. | 8.000% | 11/15/30 | 50 | 54 |
| Kinder Morgan Energy Partners LP | 6.750% | 3/15/11 | 100 | 105 |
| Kinder Morgan Energy Partners LP | 7.125% | 3/15/12 | 250 | 268 |
| Kinder Morgan Energy Partners LP | 5.850% | 9/15/12 | 420 | 440 |
| Kinder Morgan Energy Partners LP | 5.000% | 12/15/13 | 235 | 235 |
| Kinder Morgan Energy Partners LP | 5.125% | 11/15/14 | 200 | 200 |
| Kinder Morgan Energy Partners LP | 5.625% | 2/15/15 | 300 | 307 |
| Kinder Morgan Energy Partners LP | 6.000% | 2/1/17 | 110 | 108 |
| Kinder Morgan Energy Partners LP | 5.950% | 2/15/18 | 125 | 122 |
| Kinder Morgan Energy Partners LP | 6.850% | 2/15/20 | 350 | 359 |
| Kinder Morgan Energy Partners LP | 7.300% | 8/15/33 | 200 | 193 |
| Kinder Morgan Energy Partners LP | 5.800% | 3/15/35 | 100 | 85 |
| Kinder Morgan Energy Partners LP | 6.500% | 2/1/37 | 90 | 82 |
| Kinder Morgan Energy Partners LP | 6.950% | 1/15/38 | 25 | 24 |
| Magellan Midstream Partners, LP | 5.650% | 10/15/16 | 50 | 49 |
| Magellan Midstream Partners, LP | 6.550% | 7/15/19 | 125 | 128 |
| National Grid PLC | 6.300% | 8/1/16 | 300 | 311 |
| NuStar Energy LP | 7.650% | 4/15/18 | 325 | 313 |
| ONEOK Inc. | 5.200% | 6/15/15 | 200 | 188 |
| ONEOK Inc. | 6.000% | 6/15/35 | 100 | 83 |
| ONEOK Partners, LP | 5.900% | 4/1/12 | 400 | 423 |
| ONEOK Partners, LP | 6.150% | 10/1/16 | 325 | 323 |
| ONEOK Partners, LP | 6.650% | 10/1/36 | 1,000 | 932 |
| ONEOK Partners, LP | 6.850% | 10/15/37 | 300 | 287 |
| Panhandle Eastern Pipeline | 6.200% | 11/1/17 | 625 | 604 |
| Plains All American Pipeline LP | 6.500% | 5/1/18 | 75 | 76 |
| Plains All American Pipeline LP | 8.750% | 5/1/19 | 125 | 142 |
| San Diego Gas & Electric | 5.300% | 11/15/15 | 100 | 101 |
| San Diego Gas & Electric | 5.350% | 5/15/35 | 50 | 49 |
| San Diego Gas & Electric | 6.125% | 9/15/37 | 25 | 27 |
| San Diego Gas & Electric | 6.000% | 6/1/39 | 50 | 54 |
| Southern California Gas Co. | 5.750% | 11/15/35 | 150 | 151 |
4 | Southern Natural Gas | 5.900% | 4/1/17 | 880 | 827 |
| Spectra Energy Capital LLC | 5.500% | 3/1/14 | 150 | 151 |
| Spectra Energy Capital LLC | 6.750% | 2/15/32 | 75 | 70 |
| Teppco Partners, LP | 6.650% | 4/15/18 | 225 | 227 |
| Texas Gas Transmission | 4.600% | 6/1/15 | 425 | 387 |
| TransCanada PipeLines Ltd. | 4.000% | 6/15/13 | 650 | 659 |
49
Institutional Total Bond Market Index Fund
| | | | Face | Market |
| | | Maturity | Amount | Value¥ |
| | Coupon | Date | ($000) | ($000) |
| TransCanada PipeLines Ltd. | 6.500% | 8/15/18 | 600 | 650 |
| TransCanada PipeLines Ltd. | 7.125% | 1/15/19 | 50 | 56 |
| TransCanada PipeLines Ltd. | 5.600% | 3/31/34 | 550 | 531 |
| TransCanada PipeLines Ltd. | 5.850% | 3/15/36 | 350 | 335 |
| TransCanada PipeLines Ltd. | 6.200% | 10/15/37 | 100 | 102 |
| TransCanada PipeLines Ltd. | 7.625% | 1/15/39 | 50 | 58 |
2 | TransCanada PipeLines Ltd. | 6.350% | 5/15/67 | 225 | 159 |
| Williams Cos., Inc. | 7.125% | 9/1/11 | 325 | 332 |
| Williams Cos., Inc. | 7.625% | 7/15/19 | 600 | 594 |
| Williams Cos., Inc. | 7.500% | 1/15/31 | 303 | 270 |
| Williams Cos., Inc. | 7.750% | 6/15/31 | 160 | 143 |
| Williams Cos., Inc. | 8.750% | 3/15/32 | 569 | 578 |
| | | | | 69,361 |
Total Corporate Bonds (Cost $850,643) | | | | 823,507 |
Sovereign Bonds (U.S. Dollar-Denominated) (3.1%) | | | | |
| African Development Bank | 3.000% | 5/27/14 | 200 | 196 |
| Asian Development Bank | 4.125% | 9/15/10 | 100 | 103 |
| Asian Development Bank | 2.125% | 3/15/12 | 300 | 302 |
| Asian Development Bank | 3.625% | 9/5/13 | 825 | 848 |
| Asian Development Bank | 2.750% | 5/21/14 | 800 | 785 |
| Asian Development Bank | 5.593% | 7/16/18 | 750 | 818 |
| Canada Mortgage & Housing Corp. | 4.800% | 10/1/10 | 25 | 26 |
| China Development Bank Corp. | 4.750% | 10/8/14 | 225 | 231 |
| China Development Bank Corp. | 5.000% | 10/15/15 | 75 | 77 |
| Corp. Andina de Fomento | 5.200% | 5/21/13 | 150 | 151 |
| Corp. Andina de Fomento | 5.750% | 1/12/17 | 625 | 593 |
| Corp. Andina de Fomento | 8.125% | 6/4/19 | 200 | 215 |
| Development Bank of Japan | 4.250% | 6/9/15 | 75 | 76 |
| Eksportfinans | 5.500% | 5/25/16 | 350 | 353 |
| Eksportfinans | 5.500% | 6/26/17 | 375 | 373 |
| European Investment Bank | 4.625% | 9/15/10 | 875 | 912 |
| European Investment Bank | 3.250% | 2/15/11 | 1,475 | 1,514 |
| European Investment Bank | 5.250% | 6/15/11 | 1,950 | 2,086 |
| European Investment Bank | 3.125% | 7/15/11 | 950 | 982 |
| European Investment Bank | 2.000% | 2/10/12 | 2,600 | 2,597 |
| European Investment Bank | 2.875% | 3/15/13 | 600 | 597 |
| European Investment Bank | 3.250% | 5/15/13 | 1,225 | 1,234 |
| European Investment Bank | 4.250% | 7/15/13 | 2,525 | 2,640 |
| European Investment Bank | 4.625% | 5/15/14 | 1,325 | 1,405 |
| European Investment Bank | 3.125% | 6/4/14 | 1,525 | 1,515 |
| European Investment Bank | 4.875% | 2/16/16 | 225 | 237 |
| European Investment Bank | 5.125% | 9/13/16 | 125 | 134 |
| European Investment Bank | 4.875% | 1/17/17 | 775 | 813 |
| European Investment Bank | 5.125% | 5/30/17 | 1,325 | 1,416 |
| Export Development Canada | 2.375% | 3/19/12 | 675 | 680 |
| Export Development Canada | 3.125% | 4/24/14 | 225 | 224 |
| Export-Import Bank of Korea | 5.125% | 2/14/11 | 625 | 634 |
| Export-Import Bank of Korea | 5.500% | 10/17/12 | 725 | 744 |
| Export-Import Bank of Korea | 8.125% | 1/21/14 | 50 | 54 |
| Export-Import Bank of Korea | 5.125% | 3/16/15 | 175 | 163 |
| Federation of Malaysia | 7.500% | 7/15/11 | 900 | 985 |
| Federative Republic of Brazil | 9.250% | 10/22/10 | 225 | 246 |
| Federative Republic of Brazil | 11.000% | 1/11/12 | 275 | 326 |
| Federative Republic of Brazil | 7.875% | 3/7/15 | 425 | 473 |
| Federative Republic of Brazil | 6.000% | 1/17/17 | 875 | 899 |
50
Institutional Total Bond Market Index Fund
| | | | Face | Market |
| | | Maturity | Amount | Value¥ |
| | Coupon | Date | ($000) | ($000) |
2 | Federative Republic of Brazil | 8.000% | 1/15/18 | 1,450 | 1,613 |
| Federative Republic of Brazil | 5.875% | 1/15/19 | 725 | 733 |
| Federative Republic of Brazil | 8.875% | 10/14/19 | 700 | 847 |
| Federative Republic of Brazil | 8.875% | 4/15/24 | 300 | 370 |
| Federative Republic of Brazil | 8.750% | 2/4/25 | 725 | 884 |
| Federative Republic of Brazil | 10.125% | 5/15/27 | 800 | 1,088 |
| Federative Republic of Brazil | 8.250% | 1/20/34 | 225 | 268 |
| Federative Republic of Brazil | 7.125% | 1/20/37 | 775 | 841 |
| Federative Republic of Brazil | 11.000% | 8/17/40 | 1,675 | 2,152 |
| Financement Quebec | 5.000% | 10/25/12 | 225 | 235 |
| Hydro Quebec | 6.300% | 5/11/11 | 550 | 583 |
| Hydro Quebec | 7.500% | 4/1/16 | 575 | 647 |
| Hydro Quebec | 8.050% | 7/7/24 | 600 | 716 |
| Inter-American Development Bank | 8.500% | 3/15/11 | 225 | 245 |
| Inter-American Development Bank | 1.500% | 6/23/11 | 150 | 150 |
| Inter-American Development Bank | 4.750% | 10/19/12 | 675 | 723 |
| Inter-American Development Bank | 3.000% | 4/22/14 | 350 | 344 |
| Inter-American Development Bank | 4.250% | 9/14/15 | 50 | 51 |
| Inter-American Development Bank | 4.250% | 9/10/18 | 1,475 | 1,450 |
| Inter-American Development Bank | 7.000% | 6/15/25 | 325 | 374 |
| International Bank for | | | | |
| Reconstruction & Development | 3.125% | 11/15/11 | 225 | 232 |
| International Bank for | | | | |
| Reconstruction & Development | 2.000% | 4/2/12 | 3,200 | 3,177 |
| International Bank for | | | | |
| Reconstruction & Development | 8.875% | 3/1/26 | 200 | 286 |
| International Finance Corp. | 3.000% | 4/22/14 | 350 | 349 |
| Japan Bank International | 4.750% | 5/25/11 | 100 | 103 |
| Japan Bank International | 4.375% | 11/26/12 | 425 | 430 |
| Japan Bank International | 4.250% | 6/18/13 | 400 | 410 |
| Japan Finance Corp. | 4.625% | 4/21/15 | 250 | 256 |
| Japan Finance Organization for Munis. | 5.875% | 3/14/11 | 675 | 721 |
| Japan Finance Organization for Munis. | 5.000% | 5/16/17 | 50 | 52 |
| Korea Development Bank | 4.625% | 9/16/10 | 275 | 277 |
| Korea Development Bank | 5.300% | 1/17/13 | 425 | 418 |
| Korea Development Bank | 5.750% | 9/10/13 | 550 | 557 |
| Korea Development Bank | 8.000% | 1/23/14 | 400 | 433 |
| Korea Electric Power Corp. | 7.750% | 4/1/13 | 600 | 632 |
| Kreditanstalt fur Wiederaufbau | 3.125% | 11/15/10 | 1,600 | 1,642 |
| Kreditanstalt fur Wiederaufbau | 4.625% | 1/20/11 | 225 | 236 |
| Kreditanstalt fur Wiederaufbau | 3.250% | 2/15/11 | 300 | 310 |
| Kreditanstalt fur Wiederaufbau | 1.875% | 3/15/11 | 300 | 303 |
| Kreditanstalt fur Wiederaufbau | 3.750% | 6/27/11 | 1,425 | 1,489 |
| Kreditanstalt fur Wiederaufbau | 3.250% | 10/14/11 | 875 | 907 |
| Kreditanstalt fur Wiederaufbau | 2.000% | 1/17/12 | 600 | 604 |
| Kreditanstalt fur Wiederaufbau | 2.250% | 4/16/12 | 1,075 | 1,085 |
| Kreditanstalt fur Wiederaufbau | 4.750% | 5/15/12 | 775 | 832 |
| Kreditanstalt fur Wiederaufbau | 3.250% | 3/15/13 | 3,325 | 3,368 |
| Kreditanstalt fur Wiederaufbau | 3.500% | 5/16/13 | 625 | 638 |
| Kreditanstalt fur Wiederaufbau | 4.000% | 10/15/13 | 950 | 991 |
| Kreditanstalt fur Wiederaufbau | 4.125% | 10/15/14 | 125 | 132 |
| Kreditanstalt fur Wiederaufbau | 5.125% | 3/14/16 | 1,165 | 1,238 |
| Kreditanstalt fur Wiederaufbau | 4.500% | 7/16/18 | 600 | 615 |
| Kreditanstalt fur Wiederaufbau | 4.875% | 6/17/19 | 575 | 607 |
| Landeskreditbank | | | | |
| Baden-Wuerttemberg-Foerderbank | 4.250% | 9/15/10 | 100 | 102 |
51
Institutional Total Bond Market Index Fund
| | | | Face | Market |
| | | Maturity | Amount | Value¥ |
| | Coupon | Date | ($000) | ($000) |
| Landwirtschaftliche Rentenbank | 5.250% | 7/2/12 | 600 | 629 |
| Landwirtschaftliche Rentenbank | 3.250% | 3/15/13 | 1,175 | 1,164 |
| Landwirtschaftliche Rentenbank | 4.875% | 11/16/15 | 125 | 132 |
| Mass Transit Railway Corp. | 7.500% | 11/8/10 | 300 | 320 |
| Oesterreichische Kontrollbank | 2.875% | 3/15/11 | 200 | 203 |
| Oesterreichische Kontrollbank | 3.125% | 10/14/11 | 2,225 | 2,277 |
| Oesterreichische Kontrollbank | 1.875% | 3/21/12 | 475 | 460 |
| Oesterreichische Kontrollbank | 4.500% | 3/9/15 | 125 | 127 |
| Oesterreichische Kontrollbank | 5.000% | 4/25/17 | 325 | 329 |
| Ontario Electricity Financial Corp. | 7.450% | 3/31/13 | 300 | 338 |
| Pemex Project Funding Master Trust | 9.125% | 10/13/10 | 40 | 43 |
| Pemex Project Funding Master Trust | 5.750% | 3/1/18 | 1,400 | 1,289 |
| Pemex Project Funding Master Trust | 6.625% | 6/15/35 | 1,231 | 1,111 |
| Pemex Project Funding Master Trust | 6.625% | 6/15/38 | 350 | 297 |
| People’s Republic of China | 4.750% | 10/29/13 | 150 | 158 |
| Petrobras International Finance Co. | 6.125% | 10/6/16 | 1,013 | 1,040 |
| Petrobras International Finance Co. | 5.875% | 3/1/18 | 100 | 98 |
| Petrobras International Finance Co. | 8.375% | 12/10/18 | 250 | 284 |
| Petrobras International Finance Co. | 7.875% | 3/15/19 | 225 | 243 |
4 | Petroleos Mexicanos | 8.000% | 5/3/19 | 125 | 133 |
| Province of Manitoba | 4.900% | 12/6/16 | 950 | 964 |
| Province of Nova Scotia | 5.750% | 2/27/12 | 100 | 105 |
| Province of Ontario | 3.125% | 9/8/10 | 775 | 790 |
| Province of Ontario | 2.750% | 2/22/11 | 1,075 | 1,082 |
| Province of Ontario | 3.375% | 5/20/11 | 900 | 917 |
| Province of Ontario | 5.000% | 10/18/11 | 225 | 237 |
| Province of Ontario | 4.100% | 6/16/14 | 400 | 408 |
| Province of Ontario | 4.750% | 1/19/16 | 400 | 400 |
| Province of Ontario | 5.450% | 4/27/16 | 1,050 | 1,089 |
| Province of Quebec | 6.125% | 1/22/11 | 375 | 395 |
| Province of Quebec | 4.875% | 5/5/14 | 300 | 314 |
| Province of Quebec | 4.600% | 5/26/15 | 125 | 129 |
| Province of Quebec | 5.125% | 11/14/16 | 1,075 | 1,095 |
| Province of Quebec | 4.625% | 5/14/18 | 225 | 222 |
| Province of Quebec | 7.500% | 9/15/29 | 750 | 898 |
| Province of Saskatchewan | 7.375% | 7/15/13 | 100 | 115 |
| Region of Lombardy, Italy | 5.804% | 10/25/32 | 325 | 318 |
| Republic of Chile | 7.125% | 1/11/12 | 350 | 389 |
| Republic of Chile | 5.500% | 1/15/13 | 125 | 134 |
| Republic of Italy | 6.000% | 2/22/11 | 1,225 | 1,272 |
| Republic of Italy | 3.500% | 7/15/11 | 475 | 483 |
| Republic of Italy | 5.625% | 6/15/12 | 450 | 483 |
| Republic of Italy | 4.750% | 1/25/16 | 1,875 | 1,867 |
| Republic of Italy | 5.250% | 9/20/16 | 775 | 781 |
| Republic of Italy | 6.875% | 9/27/23 | 1,350 | 1,514 |
| Republic of Italy | 5.375% | 6/15/33 | 275 | 256 |
| Republic of Korea | 4.250% | 6/1/13 | 675 | 663 |
| Republic of Korea | 5.750% | 4/16/14 | 500 | 512 |
| Republic of Korea | 7.125% | 4/16/19 | 325 | 350 |
| Republic of Korea | 5.625% | 11/3/25 | 100 | 85 |
| Republic of Peru | 9.875% | 2/6/15 | 475 | 577 |
| Republic of Peru | 7.125% | 3/30/19 | 1,325 | 1,411 |
| Republic of Peru | 7.350% | 7/21/25 | 200 | 212 |
2 | Republic of Peru | 6.550% | 3/14/37 | 300 | 288 |
| Republic of Poland | 6.250% | 7/3/12 | 600 | 637 |
| Republic of Poland | 5.250% | 1/15/14 | 425 | 435 |
52
Institutional Total Bond Market Index Fund
| | | Face | Market |
| | Maturity | Amount | Value¥ |
| Coupon | Date | ($000) | ($000) |
Republic of South Africa | 7.375% | 4/25/12 | 425 | 455 |
Republic of South Africa | 6.875% | 5/27/19 | 650 | 668 |
Republic of South Africa | 5.875% | 5/30/22 | 175 | 162 |
State of Israel | 4.625% | 6/15/13 | 100 | 104 |
State of Israel | 5.500% | 11/9/16 | 675 | 694 |
State of Israel | 5.125% | 3/26/19 | 900 | 877 |
Swedish Export Credit Corp. | 4.000% | 6/15/10 | 200 | 202 |
Swedish Export Credit Corp. | 4.500% | 9/27/10 | 350 | 363 |
Swedish Export Credit Corp. | 5.125% | 3/1/17 | 175 | 176 |
United Mexican States | 8.375% | 1/14/11 | 300 | 330 |
United Mexican States | 7.500% | 1/14/12 | 103 | 113 |
United Mexican States | 6.375% | 1/16/13 | 2,066 | 2,223 |
United Mexican States | 5.875% | 2/17/14 | 275 | 288 |
United Mexican States | 6.625% | 3/3/15 | 347 | 374 |
United Mexican States | 11.375% | 9/15/16 | 50 | 68 |
United Mexican States | 5.625% | 1/15/17 | 1,150 | 1,161 |
United Mexican States | 5.950% | 3/19/19 | 400 | 404 |
United Mexican States | 8.300% | 8/15/31 | 500 | 590 |
United Mexican States | 6.750% | 9/27/34 | 2,052 | 2,059 |
Total Sovereign Bonds (Cost $109,535) | | | | 110,216 |
Taxable Municipal Bonds (0.3%) | | | | |
California GO | 5.250% | 4/1/14 | 225 | 220 |
California GO | 7.500% | 4/1/34 | 1,275 | 1,172 |
California GO | 5.650% | 4/1/39 | 225 | 223 |
Chicago IL Transit Auth. Rev. | 6.899% | 12/1/40 | 325 | 344 |
Connecticut GO | 5.850% | 3/15/32 | 425 | 432 |
Dartmouth College | 4.750% | 6/1/19 | 50 | 50 |
Illinois (Taxable Pension) GO | 4.950% | 6/1/23 | 1,350 | 1,302 |
Illinois (Taxable Pension) GO | 5.100% | 6/1/33 | 2,400 | 2,137 |
John Hopkins Univ. | 5.250% | 7/1/19 | 425 | 427 |
Kansas Dev. Finance Auth. Rev. | | | | |
(Public Employee Retirement System) | 5.501% | 5/1/34 | 300 | 276 |
New Jersey Econ. Dev. Auth. State Pension Rev. | 7.425% | 2/15/29 | 500 | 546 |
New Jersey Turnpike Auth. Rev. | 4.252% | 1/1/16 | 10 | 10 |
New Jersey Turnpike Auth. Rev. | 4.252% | 1/1/16 | 140 | 138 |
New Jersey Turnpike Auth. Rev. | 7.414% | 1/1/40 | 675 | 800 |
New York Metro. Transp. Auth. Rev. | 7.336% | 11/15/39 | 150 | 178 |
Oregon (Taxable Pension) GO | 5.762% | 6/1/23 | 100 | 103 |
Oregon (Taxable Pension) GO | 5.892% | 6/1/27 | 200 | 192 |
Oregon School Board Assn. | 4.759% | 6/30/28 | 125 | 102 |
Oregon School Board Assn. | 5.528% | 6/30/28 | 50 | 47 |
Port Auth. of New York & New Jersey Rev. | 6.040% | 12/1/29 | 175 | 180 |
San Antonio TX Electric & Gas Rev. | 5.985% | 2/1/39 | 250 | 259 |
Stanford Univ. | 3.625% | 5/1/14 | 550 | 555 |
Stanford Univ. | 4.250% | 5/1/16 | 150 | 151 |
Tobacco Settlement Finance Auth. Rev. | 7.467% | 6/1/47 | 285 | 182 |
Univ. of Texas Permanent Univ. Fund Rev. | 6.276% | 8/15/41 | 100 | 104 |
Wisconsin Public Service Rev. | 4.800% | 5/1/13 | 125 | 130 |
Wisconsin Public Service Rev. | 5.700% | 5/1/26 | 125 | 119 |
Total Taxable Municipal Bonds (Cost $10,776) | | | | 10,379 |
53
Institutional Total Bond Market Index Fund
| | | Market |
| | | Value¥ |
| Coupon | Shares | ($000) |
Temporary Cash Investment (4.7%) | | | |
Money Market Fund (4.7%) | | | |
6 Vanguard Market Liquidity Fund | | | |
(Cost $164,791) | 0.395% | 164,791,000 | 164,791 |
Total Investments (103.3%) (Cost $3,597,708) | | 3,622,066 |
Other Assets and Liabilities (-3.3%) | | | |
Other Assets | | | 83,718 |
Liabilities | | | (198,095) |
| | | (114,377) |
Net Assets (100%) | | | |
Applicable to 68,692,008 outstanding $.001 par value shares of | |
beneficial interest (unlimited authorization) | | | 3,507,689 |
Net Asset Value Per Share | | | $51.06 |
| | | |
| | | |
| | | |
At June 30, 2009, net assets consisted of: | | |
| | | Amount |
| | | ($000) |
Paid-in Capital | | | 3,496,842 |
Undistributed Net Investment Income | | | - |
Accumulated Net Realized Losses | | | (13,511) |
Unrealized Appreciation (Depreciation) | | | 24,358 |
Net Assets | | | 3,507,689 |
¥ See Note A in Notes to Financial Statements.
1 The issuer operates under a congressional charter; its securities are not backed by the full faith and credit of the U.S. government.
2 The average or expected maturity is shorter than the final maturity shown because of the possibility of interim principal payments and prepayments or the possibility of the issue being called.
3 Adjustable-rate security.
4 Security exempt from registration under Rule 144A of the Securities Act of 1933. Such securities may be sold in transactions exempt from registration, normally to qualified institutional buyers. At June 30, 2009, the aggregate value of these securities was $15,577,000, representing 0.4% of net assets.
5 Guaranteed by the Federal Deposit Insurance Corporation (FDIC) as part of the Temporary Liquidity Guarantee Program.
6 Affiliated money market fund available only to Vanguard funds and certain trusts and accounts managed by Vanguard. Rate shown is the 7-day yield.
GO-General Obligation Bond.
See accompanying Notes, which are an integral part of the Financial Statements.
54
Institutional Total Bond Market Index Fund
Statement of Operations
| Six Months Ended |
| June 30, 2009 |
| ($000) |
Investment Income | |
Income | |
Interest1 | 128,590 |
Total Income | 128,590 |
Expenses | |
The Vanguard Group-Note B | |
Management and Administrative | 1,455 |
Total Expenses | 1,455 |
Net Investment Income | 127,135 |
Realized Net Gain (Loss) | |
Investment Securities Sold | 27,452 |
Swap Contracts | 1,751 |
Realized Net Gain (Loss) | 29,203 |
Change in Unrealized Appreciation (Depreciation) of Investment Securities | (55,401) |
Net Increase (Decrease) in Net Assets Resulting from Operations | 100,937 |
1 Interest income from an affiliated company of the fund was $352,000. | |
See accompanying Notes, which are an integral part of the Financial Statements.
55
Institutional Total Bond Market Index Fund
Statement of Changes in Net Assets
| Six Months Ended | | Year Ended |
| June 30, | | December 31, |
| 2009 | | 2008 |
| ($000) | | ($000) |
Increase (Decrease) in Net Assets | | | |
Operations | | | |
Net Investment Income | 127,135 | | 372,841 |
Realized Net Gain (Loss) | 29,203 | | 13,983 |
Change in Unrealized Appreciation (Depreciation) | (55,401) | | (18,217) |
Net Increase (Decrease) in Net Assets Resulting from Operations | 100,937 | | 368,607 |
Distributions | | | |
Net Investment Income | (134,384) | | (351,110) |
Realized Capital Gain1 | (21,216) | | - |
Total Distributions | (155,600) | | (351,110) |
Capital Share Transactions | | | |
Issued | 1,523,552 | | 3,315,056 |
Issued in Lieu of Cash Distributions | 125,420 | | 322,797 |
Redeemed | (5,523,792) | | (3,816,520) |
Net Increase (Decrease) from Capital Share Transactions | (3,874,820) | | (178,667) |
Total Increase (Decrease) | (3,929,483) | | (161,170) |
Net Assets | | | |
Beginning of Period | 7,437,172 | | 7,598,342 |
End of Period2 | 3,507,689 | | 7,437,172 |
1 Includes fiscal 2009 short-term gain distributions totaling $21,216,000. Short-term gain distributions are treated as ordinary income dividends for tax purposes.
2 Net Assets-End of Period includes undistributed net investment income of $0 and $5,025,000.
See accompanying Notes, which are an integral part of the Financial Statements.
56
Institutional Total Bond Market Index Fund
Financial Highlights
| | | | | | |
| Six Months | | | | | |
| Ended | | | |
For a Share Outstanding | June 30, | Year Ended December 31, |
Throughout Each Period | 2009 | 2008 | 2007 | 2006 | 2005 | 2004 |
Net Asset Value, Beginning of Period | $51.33 | $51.19 | $50.32 | $50.79 | $51.79 | $51.80 |
Investment Operations | | | | | | |
Net Investment Income | 1.166 | 2.508 | 2.596 | 2.540 | 2.263 | 2.104 |
Net Realized and Unrealized Gain (Loss) | | | | | | |
on Investments | (.120) | (.008) | .830 | (.429) | (1.007) | .106 |
Total from Investment Operations | 1.046 | 2.500 | 3.426 | 2.111 | 1.256 | 2.210 |
Distributions | | | | | | |
Dividends from Net Investment Income | (1.166) | (2.360) | (2.556) | (2.581) | (2.256) | (2.193) |
Distributions from Realized Capital Gains | (.150) | - | - | - | - | (.027) |
Total Distributions | (1.316) | (2.360) | (2.556) | (2.581) | (2.256) | (2.220) |
Net Asset Value, End of Period | $51.06 | $51.33 | $51.19 | $50.32 | $50.79 | $51.79 |
| | | | | | |
| | | | | | |
Total Return | 2.08% | 5.05% | 7.01% | 4.30% | 2.47% | 4.36% |
| | | | | | |
| | | | | | |
Ratios/Supplemental Data | | | | | | |
Net Assets, End of Period (Millions) | $3,508 | $7,437 | $7,598 | $4,826 | $2,861 | $1,170 |
Ratio of Total Expenses to | | | | | | |
Average Net Assets | 0.05%1 | 0.05% | 0.05% | 0.05% | 0.05% | 0.05% |
Ratio of Net Investment Income to | | | | | | |
Average Net Assets | 4.53%1 | 4.88% | 5.17% | 5.08% | 4.47% | 4.08% |
Portfolio Turnover Rate2 | 108%1 | 88% | 62% | 63% | 68% | 88% |
1 Annualized.
2 Excludes the value of portfolio securities received or delivered as a result of in-kind purchases or redemptions of the fund’s capital shares.
See accompanying Notes, which are an integral part of the Financial Statements.
57
Institutional Total Bond Market Index Fund
Notes to Financial Statements
Vanguard Institutional Total Bond Market Index Fund is registered under the Investment Company Act of 1940 as an open-end investment company, or mutual fund. The fund is offered to investors who meet certain administrative and service criteria and invest a minimum of $100 million. Certain of the fund’s investments are in corporate debt instruments; the issuers’ abilities to meet their obligations may be affected by economic developments in their respective industries.
A. The following significant accounting policies conform to generally accepted accounting principles for U.S. mutual funds. The fund consistently follows such policies in preparing its financial statements.
1. Security Valuation: Bonds, and temporary cash investments acquired over 60 days to maturity, are valued using the latest bid prices or using valuations based on a matrix system (which considers such factors as security prices, yields, maturities, and ratings), both as furnished by independent pricing services. Investments in Vanguard Market Liquidity Fund are valued at that fund’s net asset value. Other temporary cash investments are valued at amortized cost, which approximates market value. Securities for which market quotations are not readily available, or whose values have been affected by events occurring before the fund’s pricing time but after the close of the securities’ primary markets, are valued by methods deemed by the board of trustees to represent fair value.
2. Swap Contracts: The fund is subject to credit risk through its investment in swap transactions to earn the total return on the Commercial Mortgage-Backed Securities (CMBS) Index. Under the terms of the swaps, the fund receives the total return (either receiving the increase or paying the decrease) on the CMBS index, applied to a notional principal amount. In return, the fund agrees to pay the counterparty a floating rate, which is reset periodically based on short-term interest rates, applied to the same notional amount. At the same time, the fund invests an amount equal to the notional amount of the swaps in high-quality floating-rate securities.
The notional amounts of swap contracts are not recorded in the Statement of Net Assets. Swaps are valued daily and the change in value is recorded as unrealized appreciation (depreciation) until periodic payments are made, or the swap terminates, at which time realized gain (loss) is recorded. A primary risk for all types of swaps is that a counterparty will default on its obligation to pay net amounts due to the fund. The fund’s maximum risk of loss from counterparty credit risk is the amount of unrealized appreciation on the swap contract. This risk is mitigated by entering into swaps only with highly rated counterparties, by a master netting arrangement between the fund and the counterparty, and by the posting of collateral by the counterparty. The swap contracts contain provisions whereby a counter-party may terminate open contracts if the fund’s net assets decline below a certain level, triggering a payment by the fund if the fund is in a net liability position at the time of the termination. The payment amount would be reduced by any collateral the fund has posted. Any securities posted as collateral for open contracts are noted in the Statement of Net Assets.
3. Mortgage Dollar Rolls: The fund has entered into mortgage-dollar-roll transactions, in which the fund sells mortgage-backed securities to a dealer and simultaneously agrees to purchase similar securities in the future at a predetermined price. The proceeds of the securities sold in mortgage-dollar-roll transactions are invested in high-quality short-term fixed income securities. The fund forgoes principal and interest paid on the securities, and is compensated by interest earned on the proceeds of the initial sale and by a lower price on the securities to be repurchased. The fund accounts for mortgage-dollar-roll transactions as purchases and sales; as such, these transactions may increase the fund’s portfolio turnover rate. Amounts to be received or paid in connection with open mortgage dollar rolls are included in Receivables for Investment Securities Sold (Other Assets) or Payables for Investment Securities Purchased (Liabilities) in the Statement of Net Assets. The primary risk associated with mortgage dollar rolls is that a counterparty will default on its obligations to deliver purchased securities.
58
Institutional Total Bond Market Index Fund
4. Federal Income Taxes: The fund intends to continue to qualify as a regulated investment company and distribute all of its taxable income. Management has analyzed the fund’s tax positions taken on federal income tax returns for all open tax years (tax years ended December 31, 2005-2008) and for the period ended June 30, 2009, and has concluded that no provision for federal income tax is required in the fund’s financial statements.
5. Distributions: Distributions from net investment income are declared daily and paid on the first business day of the following month. Annual distributions from realized capital gains, if any, are recorded on the ex-dividend date.
6. Other: Interest income includes income distributions received from Vanguard Market Liquidity Fund and is accrued daily. Premiums and discounts on debt securities purchased are amortized and accreted, respectively, to interest income over the lives of the respective securities. Security transactions are accounted for on the date securities are bought or sold. Costs used to determine realized gains (losses) on the sale of investment securities are those of the specific securities sold.
B. The Vanguard Group provides investment advisory, corporate management, administrative, marketing, and distribution services and pays for all other operating expenses, except for taxes, in return for a fee calculated at an annual percentage rate of the average net assets of the fund. The fund’s trustees and officers are also directors and officers of Vanguard.
C. Various inputs may be used to determine the value of the fund’s investments. These inputs are summarized in three broad levels for financial statement purposes. The inputs or methodologies used to value securities are not necessarily an indication of the risk associated with investing in those securities.
Level 1-Quoted prices in active markets for identical securities.
Level 2-Other significant observable inputs (including quoted prices for similar securities, interest rates, prepayment speeds, credit risk, etc.).
Level 3-Significant unobservable inputs (including the fund’s own assumptions used to determine the fair value of investments).
The following table summarizes the fund’s investments as of June 30, 2009, based on the inputs used to value them:
| Level 1 | Level 2 | Level 3 |
Investments | ($000) | ($000) | ($000) |
U.S. Government and Agency Obligations | - | 2,513,173 | - |
Corporate Bonds | - | 823,507 | - |
Sovereign Bonds | - | 110,216 | - |
Taxable Municipal Bonds | - | 10,379 | - |
Temporary Cash Investments | 164,791 | - | - |
Total | 164,791 | 3,457,275 | - |
D. Capital gain distributions are determined on a tax basis and may differ from realized capital gains for financial reporting purposes. Differences may be permanent or temporary. Permanent differences are reclassified among capital accounts in the financial statements to reflect their tax character. Temporary differences arise when gains or losses are recognized in different periods for financial statement and tax purposes; these differences will reverse at some time in the future. The fund’s tax-basis capital gains and losses are determined only at the end of each fiscal year.
59
Institutional Total Bond Market Index Fund
During the six months ended June 30, 2009, the fund realized $39,508,000 of net capital gains resulting from in-kind redemptions-in which shareholders exchanged fund shares for securities held by the fund rather than for cash. Because such gains are not taxable to the fund, and are not distributed to shareholders, they have been reclassified from accumulated net realized losses to paid-in capital.
Realized and unrealized gains (losses) on certain of the fund’s swap contracts are treated as ordinary income (loss) for tax purposes; the effect on the fund’s income dividends to shareholders is offset by a change in principal return. Realized gains of $1,751,000 on swap contracts have been reclassified from accumulated net realized losses to undistributed net investment income.
Certain of the fund’s U.S. Treasury Inflation-Indexed securities experienced deflation adjustments that reduced interest income and the cost of investments for financial statement purposes by an amount greater than the reduction of taxable income; the additional income reduction will be deferred for tax purposes until it is used to offset future inflation adjustments that increase taxable income. The difference becomes permanent if the securities are sold. During the six months ended June 30, 2009, the fund realized gains of $473,000 that were included in ordinary income for tax purposes as a result of deferred deflation adjustments; accordingly such gains have been reclassified from accumulated net realized losses to undistributed net investment income.
At June 30, 2009, the cost of investment securities for tax purposes was $3,597,708,000. Net unrealized appreciation of investment securities for tax purposes was $24,358,000, consisting of unrealized gains of $82,809,000 on securities that had risen in value since their purchase and $58,451,000 in unrealized losses on securities that had fallen in value since their purchase.
E. During the six months ended June 30, 2009, the fund purchased $338,287,000 of investment securities and sold $1,517,729,000 of investment securities, other than U.S. government securities and temporary cash investments. Purchases and sales of U.S. government securities were $2,906,644,000 and $5,488,527,000, respectively.
F. Capital shares issued and redeemed were:
| Six Months Ended | Year Ended |
| June 30, 2009 | December 31, 2008 |
| Shares | Shares |
| (000) | (000) |
Issued | 29,914 | 65,984 |
Issued in Lieu of Cash Distributions | 2,472 | 6,374 |
Redeemed | (108,585) | (75,914) |
Net Increase (Decrease) in Shares Outstanding | (76,199) | (3,556) |
G. In preparing the financial statements as of June 30, 2009, management considered the impact of subsequent events occurring through August 5, 2009, for potential recognition or disclosure in these financial statements.
60
About Your Fund’s Expenses
As a shareholder of the fund, you incur ongoing costs, which include costs for portfolio management, administrative services, and shareholder reports (like this one), among others. Operating expenses, which are deducted from a fund’s gross income, directly reduce the investment return of the fund.
A fund’s expenses are expressed as a percentage of its average net assets. This figure is known as the expense ratio. The following examples are intended to help you understand the ongoing costs (in dollars) of investing in your fund and to compare these costs with those of other mutual funds. The examples are based on an investment of $1,000 made at the beginning of the period shown and held for the entire period.
The accompanying table illustrates your fund’s costs in two ways:
• Based on actual fund return. This section helps you to estimate the actual expenses that you paid over the period. The ”Ending Account Value“ shown is derived from the fund‘s actual return, and the third column shows the dollar amount that would have been paid by an investor who started with $1,000 in the fund. You may use the information here, together with the amount you invested, to estimate the expenses that you paid over the period.
To do so, simply divide your account value by $1,000 (for example, an $8,600 account value divided by $1,000 = 8.6), then multiply the result by the number given for your fund under the heading ”Expenses Paid During Period.“
• Based on hypothetical 5% yearly return. This section is intended to help you compare your fund‘s costs with those of other mutual funds. It assumes that the fund had a yearly return of 5% before expenses, but that the expense ratio is unchanged. In this case—because the return used is not the fund’s actual return—the results do not apply to your investment. The example is useful in making comparisons because the Securities and Exchange Commission requires all mutual funds to calculate expenses based on a 5% return. You can assess your fund’s costs by comparing this hypothetical example with the hypothetical examples that appear in shareholder reports of other funds.
Note that the expenses shown in the table are meant to highlight and help you compare ongoing costs only and do not reflect transaction costs incurred by the fund for buying and selling securities. Your fund does not charge transaction fees, such as purchase or redemption fees, nor does it carry a “sales load.”
The calculations assume no shares were bought or sold during the period. Your actual costs may have been higher or lower, depending on the amount of your investment and the timing of any purchases or redemptions.
You can find more information about the fund’s expenses, including annual expense ratios, in the Financial Statements section of this report. For additional information on operating expenses and other shareholder costs, please refer to your fund’s current prospectus.
61
Six Months Ended June 30, 2009 | | | |
| Beginning | Ending | Expenses |
| Account Value | Account Value | Paid During |
Institutional Total Bond Market Index Fund | 12/31/2008 | 6/30/2009 | Period |
Based on Actual Fund Return | $1,000.00 | $1,020.81 | $0.25 |
Based on Hypothetical 5% Yearly Return | 1,000.00 | 1,024.55 | 0.25 |
The calculations are based on expenses incurred in the most recent six-month period. The fund’s annualized six-month expense ratio for that period is 0.05%. The dollar amounts shown as “Expenses Paid” are equal to the annualized expense ratio multiplied by the average account value over the period, multiplied by the number of days in the most recent six-month period, then divided by the number of days in the most recent 12-month period.
62
Trustees Approve Advisory Arrangement
The board of trustees of Vanguard Institutional Total Bond Market Index Fund has renewed the fund’s investment advisory arrangement with The Vanguard Group, Inc. Vanguard-through its Fixed Income Group-serves as the investment advisor for the fund. The board determined that continuing the fund’s internalized management structure was in the best interests of the fund and its shareholders.
The board based its decision upon an evaluation of the advisor’s investment staff, portfolio management process, and performance. The trustees considered the factors discussed below, among others. However, no single factor determined whether the board approved the arrangement. Rather, it was the totality of the circumstances that drove the board’s decision.
Nature, extent, and quality of services
The board considered the quality of the fund’s investment management over both the short and long term, and took into account the organizational depth and stability of the advisor. The board noted that Vanguard has been managing investments for more than three decades. The Fixed Income Group adheres to a sound, disciplined investment management process; the team has considerable experience, stability, and depth.
The board concluded that Vanguard’s experience, stability, depth, and performance, among other factors, warranted continuation of the advisory arrangement.
Investment performance
The board considered the short- and long-term performance of the fund, including any periods of outperformance or underperformance of its target index and peer group. The board concluded that the fund has performed in line with expectations, and that its results have been consistent with its investment strategies. Information about the fund’s most recent performance can be found in the Performance Summary section of this report.
Cost
The board concluded that the fund’s expense ratio was well below the average expense ratio charged by funds in its peer group. The board noted that the fund’s advisory expense ratio was also well below its peer-group average. Information about the fund’s expense ratio appears in the About Your Fund’s Expenses section of this report as well as in the Financial Statements section.
The board does not conduct a profitability analysis of Vanguard, because of Vanguard’s unique “at-cost” structure. Unlike most other mutual fund management companies, Vanguard is owned by the funds it oversees, and produces “profits“ only in the form of reduced expenses for fund shareholders.
The benefit of economies of scale
The board concluded that the fund’s low-cost arrangement with Vanguard reflects economies of scale for the benefit of the fund’s shareholders.
The board will consider whether to renew the advisory arrangement again after a one-year period.
63
Glossary
30-Day SEC Yield. A fund’s 30-day SEC yield is derived using a formula specified by the U.S. Securities and Exchange Commission. Under the formula, data related to the fund’s security holdings in the previous 30 days are used to calculate the fund’s hypothetical net income for that period, which is then annualized and divided by the fund’s estimated average net assets over the calculation period. For the purposes of this calculation, a security’s income is based on its current market yield to maturity (in the case of bonds) or its projected dividend yield (for stocks). Because the SEC yield represents hypothetical annualized income, it will differ—at times significantly—from the fund’s actual experience. As a result, the fund’s income distributions may be higher or lower than implied by the SEC yield.
Average Coupon. The average interest rate paid on the fixed income securities held by a fund. It is expressed as a percentage of face value.
Average Duration. An estimate of how much the value of the bonds held by a fund will fluctuate in response to a change in interest rates. To see how the value could change, multiply the average duration by the change in rates. If interest rates rise by 1 percentage point, the value of the bonds in a fund with an average duration of five years would decline by about 5%. If rates decrease by a percentage point, the value would rise by 5%.
Average Effective Maturity. The average length of time until fixed income securities held by a fund reach maturity and are repaid, taking into consideration the possibility that the issuer may call the bond before its maturity date. The figure reflects the proportion of fund assets represented by each security; it also reflects any futures contracts held. In general, the longer the average effective maturity, the more a fund’s share price will fluctuate in response to changes in market interest rates.
Average Quality. An indicator of credit risk, this figure is the average of the ratings assigned to a fund’s fixed income holdings by credit-rating agencies. The agencies make their judgment after appraising an issuer’s ability to meet its obligations. Quality is graded on a scale, with Aaa or AAA indicating the most creditworthy bond issuers. U.S. Treasury securities are considered to have the highest credit quality.
Beta. A measure of the magnitude of a fund’s past share-price fluctuations in relation to the ups and downs of a given market index. The index is assigned a beta of 1.00. Compared with a given index, a fund with a beta of 1.20 typically would have seen its share price rise or fall by 12% when the index rose or fell by 10%. For this report, beta is based on returns over the past 36 months for both the fund and the index. Note that a fund’s beta should be reviewed in conjunction with its R-squared (see definition). The lower the R-squared, the less correlation there is between the fund and the index, and the less reliable beta is as an indicator of volatility.
Expense Ratio. The percentage of a fund’s average net assets used to pay its annual administrative and advisory expenses. These expenses directly reduce returns to investors.
Inception Date. The date on which the assets of a fund (or one of its share classes) are first invested in accordance with the fund’s investment objective. For funds with a subscription period, the inception date is the day after that period ends. Investment performance is measured from the inception date.
64
R-Squared. A measure of how much of a fund’s past returns can be explained by the returns from the market in general, as measured by a given index. If a fund’s total returns were precisely synchronized with an index’s returns, its R-squared would be 1.00. If the fund’s returns bore no relationship to the index’s returns, its R-squared would be 0. For this report, R-squared is based on returns over the past 36 months for both the fund and the index.
Short-Term Reserves. The percentage of a fund invested in highly liquid, short-term securities that can be readily converted to cash.
Yield to Maturity. The rate of return an investor would receive if the fixed income securities held by a fund were held to their maturity dates.
65
This page intentionally left blank.
The People Who Govern Your Fund
The trustees of your mutual fund are there to see that the fund is operated and managed in your best interests since, as a shareholder, you are a part owner of the fund. Your fund’s trustees also serve on the board of directors of The Vanguard Group, Inc., which is owned by the Vanguard funds and provides services to them on an at-cost basis.
A majority of Vanguard’s board members are independent, meaning that they have no affiliation with Vanguard or the funds they oversee, apart from the sizable personal investments they have made as private individuals. The independent board members have distinguished backgrounds in business, academia, and public service. Each of the trustees and executive officers oversees 157 Vanguard funds.
The following table provides information for each trustee and executive officer of the fund. More information about the trustees is in the Statement of Additional Information, which can be obtained, without charge, by contacting Vanguard at 800-662-7447, or online at www.vanguard.com.
Interested Trustees
John J. Brennan1
Born 1954. Trustee Since May 1987. Chairman of the Board. Principal Occupation(s) During the Past Five Years: Chairman of the Board and Director/Trustee of The Vanguard Group, Inc., and of each of the investment companies served by The Vanguard Group; Chief Executive Officer and President of The Vanguard Group and of each of the investment companies served by The Vanguard Group (1996-2008); Chairman of the Financial Accounting Foundation; Governor of the Financial Industry Regulatory Authority (FINRA); Director of United Way of Southeastern Pennsylvania.
F. William McNabb III1
Born 1957. Trustee Since July 2009. Principal Occupation(s) During the Past Five Years: Director of The Vanguard Group, Inc., since 2008; Chief Executive Officer and President of The Vanguard Group and of each of the investment companies served by The Vanguard Group since 2008; Director of Vanguard Marketing Corporation; Managing Director of The Vanguard Group (1995-2008).
Independent Trustees
Charles D. Ellis
Born 1937. Trustee Since January 2001. Principal Occupation(s) During the Past Five Years: Applecore Partners (pro bono ventures in education); Senior Advisor to Greenwich Associates (international business strategy consulting); Successor Trustee of Yale University; Overseer of the Stern School of Business at New York University; Trustee of the Whitehead Institute for Biomedical Research.
Emerson U. Fullwood
Born 1948. Trustee Since January 2008. Principal Occupation(s) During the Past Five Years: Retired Executive Chief Staff and Marketing Officer for North America and Corporate Vice President of Xerox Corporation (photocopiers and printers); Director of SPX Corporation (multi-industry manufacturing), the United Way of Rochester, the Boy Scouts of America, Amerigroup Corporation (direct health and medical insurance carriers), and Monroe Community College Foundation.
Rajiv L. Gupta
Born 1945. Trustee Since December 2001.2 Principal Occupation(s) During the Past Five Years: Retired Chairman and Chief Executive Officer of Rohm and Haas Co. (chemicals); President of Rohm and Haas Co. (2006-2008); Board Member of American Chemistry Council; Director of Tyco International, Ltd. (diversified manufacturing and services) and Hewlett-Packard Co. (electronic computer manufacturing); Trustee of The Conference Board.
Amy Gutmann
Born 1949. Trustee Since June 2006. Principal Occupation(s) During the Past Five Years: President of the University of Pennsylvania; Christopher H. Browne Distinguished Professor of Political Science in the School of Arts and Sciences with Secondary Appointments at the Annenberg School for Communication and the Graduate School of Education of the University of Pennsylvania; Director of Carnegie Corporation of New York, Schuylkill River Development Corporation, and Greater Philadelphia Chamber of Commerce; Trustee of the National Constitution Center.
JoAnn Heffernan Heisen
Born 1950. Trustee Since July 1998. Principal Occupation(s) During the Past Five Years: Retired Corporate Vice President, Chief Global Diversity Officer, and Member of the Executive Committee of Johnson & Johnson (pharmaceuticals/consumer products); Vice President and Chief Information Officer of Johnson & Johnson (1997-2005); Director of the University Medical Center at Princeton and Women’s Research and Education Institute.
André F. Perold
Born 1952. Trustee Since December 2004. Principal Occupation(s) During the Past Five Years: George Gund Professor of Finance and Banking, Harvard Business School; Director and Chairman of UNX, Inc. (equities trading firm); Chair of the Investment Committee of HighVista Strategies LLC (private investment firm).
Alfred M. Rankin, Jr.
Born 1941. Trustee Since January 1993. Principal Occupation(s) During the Past Five Years: Chairman, President, Chief Executive Officer, and Director of NACCO Industries, Inc. (forklift trucks/housewares/ lignite); Director of Goodrich Corporation (industrial products/aircraft systems and services).
Peter F. Volanakis
Born 1955. Trustee Since July 2009. Principal Occupations During the Past Five Years: President since 2007 and Chief Operating Officer since 2005 of Corning Incorporated (communications equipment); President of Corning Technologies (2001-2005); Director of Corning Incorporated and Dow Corning; Trustee of the Corning Incorporated Foundation and the Corning Museum of Glass; Overseer of the Amos Tuck School of Business Administration at Dartmouth College.
Executive Officers
Thomas J. Higgins1
Born 1957. Chief Financial Officer Since September 2008. Principal Occupation(s) During the Past Five Years: Principal of The Vanguard Group, Inc.; Chief Financial Officer of each of the investment companies served by The Vanguard Group since 2008; Treasurer of each of the investment companies served by The Vanguard Group (1998-2008).
Kathryn J. Hyatt1
Born 1955. Treasurer Since November 2008. Principal Occupation(s) During the Past Five Years: Principal of The Vanguard Group, Inc.; Treasurer of each of the investment companies served by The Vanguard Group since 2008; Assistant Treasurer of each of the investment companies served by The Vanguard Group (1988-2008).
Heidi Stam1
Born 1956. Secretary Since July 2005. Principal Occupation(s) During the Past Five Years: Managing Director of The Vanguard Group, Inc., since 2006; General Counsel of The Vanguard Group since 2005; Secretary of The Vanguard Group and of each of the investment companies served by The Vanguard Group since 2005; Director and Senior Vice President of Vanguard Marketing Corporation since 2005; Principal of The Vanguard Group (1997-2006).
Vanguard Senior Management Team |
| |
R. Gregory Barton | Michael S. Miller |
Mortimer J. Buckley | James M. Norris |
Kathleen C. Gubanich | Glenn W. Reed |
Paul A. Heller | George U. Sauter |
Founder
John C. Bogle
Chairman and Chief Executive Officer, 1974-1996
1 These individuals are “interested persons” as defined in the Investment Company Act of 1940.
2 December 2002 for Vanguard Equity Income Fund, Vanguard Growth Equity Fund, the Vanguard Municipal Bond Funds, and the Vanguard State Tax-Exempt Funds.

P.O. Box 2600
Valley Forge, PA 19482-2600
Connect with Vanguard® > www.vanguard.com
Fund Information > 800-662-7447 | CFA® is a trademark owned by CFA Institute. |
| |
Direct Investor Account Services > 800-662-2739 | |
| |
Institutional Investor Services > 800-523-1036 | |
| |
Text Telephone for People | |
With Hearing Impairment > 800-952-3335 | |
| |
This material may be used in conjunction | |
with the offering of shares of any Vanguard | |
fund only if preceded or accompanied by | |
the fund’s current prospectus. | |
| |
All comparative mutual fund data are from Lipper Inc. or | |
Morningstar, Inc., unless otherwise noted. | |
| |
You can obtain a free copy of Vanguard’s proxy voting | |
guidelines by visiting our website, www.vanguard.com, | |
and searching for “proxy voting guidelines,” or by calling | |
Vanguard at 800-662-2739. The guidelines are also | |
available from the SEC’s website, www.sec.gov. In | |
addition, you may obtain a free report on how your fund | |
voted the proxies for securities it owned during the 12 | |
months ended June 30. To get the report, visit either | |
www.vanguard.com or www.sec.gov. | |
| |
You can review and copy information about your fund at | |
the SEC’s Public Reference Room in Washington, D.C. To | |
find out more about this public service, call the SEC at | |
202-551-8090. Information about your fund is also | |
available on the SEC’s website, and you can receive | |
copies of this information, for a fee, by sending a | |
request in either of two ways: via e-mail addressed to | |
publicinfo@sec.gov or via regular mail addressed to the | © 2009 The Vanguard Group, Inc. |
Public Reference Section, Securities and Exchange | All rights reserved. |
Commission, Washington, DC 20549-0102. | Vanguard Marketing Corporation, Distributor. |
| |
| Q3372 082009 |
1

> In the first half of 2009, Vanguard Institutional Total Stock Market Index Fund returned about 4% and closely tracked its target index.
> Although the global financial crisis continued to weigh on equities early in 2009, stocks rallied throughout the spring and generally posted gains for the half-year.
> Information technology stocks were the market’s best performers, while industrials and financials were among the weakest.
Contents | |
| |
Your Fund’s Total Returns | 1 |
President’s Letter | 2 |
Fund Profile | 6 |
Performance Summary | 7 |
Financial Statements | 8 |
About Your Fund’s Expenses | 51 |
Trustees Approve Advisory Arrangement | 53 |
Glossary | 54 |

Institutional Total Stock Market Index Fund
Please note: The opinions expressed in this report are just that—informed opinions. They should not be considered promises or advice. Also, please keep in mind that the information and opinions cover the period through the date on the front of this report. Of course, the risks of investing in your fund are spelled out in the prospectus.
Your Fund’s Total Returns
Six Months Ended June 30, 2009 | | |
| Ticker | Total |
| Symbol | Returns |
Vanguard Institutional Total Stock Market Index Fund | | |
Institutional Shares1 | VITNX | 4.41% |
Institutional Plus Shares2 | VITPX | 4.47 |
MSCI® US Broad Market Index | | 4.43 |
Average Multi-Cap Core Fund3 | | 7.28 |
Your Fund’s Performance at a Glance |
December 31, 2008–June 30, 2009 | | | | |
| | | Distributions Per Share |
| Starting | Ending | Income | Capital |
| Share Price | Share Price | Dividends | Gains |
Vanguard Institutional Total Stock Market | | | | |
Index Fund | | | | |
Institutional Shares | $19.68 | $20.32 | $0.211 | $0.000 |
Institutional Plus Shares | 19.68 | 20.33 | 0.213 | 0.000 |
1 This class of shares carries low expenses and is available for a minimum investment of $100 million.
2 This class of shares also carries low expenses and is available for a minimum investment of $200 million.
3 Derived from data provided by Lipper Inc.
1

President’s Letter
Dear Shareholder,
The year began ominously with stock prices laid low by the global financial crisis. Then stocks soared in the second quarter of 2009 as consumer confidence improved and investors reacted positively to small signs that the economy was healing.
Despite the market volatility, Vanguard Institutional Total Stock Market Index Fund met its primary objective of closely tracking its benchmark—the Morgan Stanley Capital International® (MSCI) US Broad Market Index—in the six months ended June 30. The fund returned 4.41% for Institutional Shares and 4.47% for Institutional Plus Shares.
The Institutional Total Stock Market Index Fund is heavily weighted in large-capitalization stocks. However, the fund’s mandate ensures exposure to mid- and small-cap companies, which nudged its return higher by outperforming their large-cap brethren.
Stock gains petered out by the end of the period
For the six months, the broad U.S. stock market returned 5%. The market began the period in negative territory, rallied through much of the spring, but then lost steam in June. Although the April–June period was the strongest quarter for U.S. stocks since 2003, equity gains fizzled in mid-June as investors were taken aback by a drop in consumer confidence, a decline in home prices, and a larger-than-expected rise in the unemployment rate.
2
International stocks did better, returning about 14% for the half-year after a very rocky start. Emerging markets posted the best results as investors poured money into countries with strong growth prospects. Higher commodity prices and a slight rebound in manufacturing orders helped reverse the earlier steep declines in international stocks.
Still, pockets of the developed and developing markets, particularly in Europe, continued to struggle amid the global recession. After three consecutive monthly gains, the MSCI All Country World Index ex USA returned –1.07% for June, perhaps signaling a bumpy road ahead.
Newly confident bond investors sought out higher yields
As the fiscal half-year began, investors panicked by the credit-market crisis sought shelter in U.S. Treasury bonds, considered the safest of all securities. The difference between the yields of Treasuries and those of corporate bonds surged to levels not seen since the 1930s.
By mid-March, investors had gained confidence from the federal government’s efforts to thaw the credit market and stimulate the economy. Bond investors were more optimistic and more willing to take on risk; they shifted their focus away from Treasuries to higher-yielding corporate bonds. For the six months,
Market Barometer | | | |
| | | Total Returns |
| Periods Ended June 30, 2009 |
| Six Months | One Year | Five Years1 |
Stocks | | | |
Russell 1000 Index (Large-caps) | 4.32% | –26.69% | –1.85% |
Russell 2000 Index (Small-caps) | 2.64 | –25.01 | –1.71 |
Dow Jones U.S. Total Stock Market Index | 5.00 | –26.11 | –1.47 |
MSCI All Country World Index ex USA (International) | 14.35 | –30.54 | 4.95 |
| | | |
| | | |
Bonds | | | |
Barclays Capital U.S. Aggregate Bond Index | | | |
(Broad taxable market) | 1.90% | 6.05% | 5.01% |
Barclays Capital Municipal Bond Index | 6.43 | 3.77 | 4.14 |
Citigroup 3-Month Treasury Bill Index | 0.10 | 0.78 | 3.02 |
| | | |
| | | |
CPI | | | |
Consumer Price Index | 2.60% | –1.43% | 2.60% |
1 Annualized.
3
the Barclays Capital U.S. Aggregate Bond Index returned 1.90%, while high-yield bonds, as measured by the Barclays Capital U.S. Corporate High Yield Bond Index, returned about 30%.
Despite some murmurs in the market about longer-term inflation risks, in March the Federal Reserve unveiled plans to purchase Treasury and mortgage-backed securities. The Fed hopes to drive up the securities’ prices and push down yields, and thus keep borrowing costs, such as mortgage rates, low. Government initiatives also helped bring down municipal bond yields, which had risen above those of Treasuries, a reversal in the traditional relationship between taxable and tax-exempt yields. For the six months, the tax-exempt bond market returned 6.43%.
The Fed kept the target for short-term interest rates at an all-time low of 0% to 0.25% throughout the period.
Growth stocks benefited most from the market rally
During the first six months of 2009, growth stocks regained favor with investors, who gravitated toward profitable companies with little debt. The technology sector largely powered the index’s return as corporations began spending again on computer hardware, computer software, and communications equipment. During 2008, many had trimmed their technology budgets in response to the worldwide recession.
The consumer discretionary and materials sectors both produced double-digit gains, but their impact in the fund was lessened by its relatively light exposure to these groups. Energy stocks advanced slightly in aggregate, with mixed results inside the sector. A rally in oil prices boosted some holdings, but weak demand for gasoline hurt the return of others.
The fund’s performance was dampened by the industrial sector, where manufacturers dealt with shrinking orders and output as well as high inventories. Financials also hurt the fund’s return as banks and insurance companies continued to struggle with issues related to the credit crunch.
Despite periods of pronounced volatility, the fund stayed within a few basis points of the index return, a tribute to Vanguard Quantitative Equity Group, the advisor. The group relies on skilled portfolio management, sophisticated risk-control and trading systems, and low expense ratios as it seeks to deliver market-tracking results.
In evaluating risk, it’s wise to take a long-term view
Investors’ resolve was tested multiple times over the past year. In 2008, the U.S. financial markets endured their worst calendar year since the 1930s. The first two months of 2009 brought more bad news and falling prices before stocks rebounded to turn in their best quarter since 2003. Nobody can predict how the markets will perform for the remainder of the year.
4
The magnitude and speed of the stock market’s recent swings underscore the market’s constants: change and risk. Large-cap stocks with staying power were generally preferred by investors during the market’s steep descent, but more nimble small-cap stocks gained favor during the spring rebound. Meanwhile, growth- and value-oriented stocks shifted in and out of favor. And even conservative, high-quality bonds have struggled.
That’s why Vanguard encourages investors large and small to address risk by maintaining a balanced portfolio of stock, bond, and money market funds. By offering the opportunity for broad, cost-effective diversification and market-tracking returns, even during periods of significant volatility, the Institutional Total Stock Market Index Fund can play a valuable role within such a portfolio.
Thank you for entrusting your institution’s assets to Vanguard.
Sincerely,

F. William McNabb III
President and Chief Executive Officer
July 20, 2009
5
Institutional Total Stock Market Index Fund
Fund Profile
As of June 30, 2009
Portfolio Characteristics | | |
| | Target |
| Fund | Index1 |
Number of Stocks | 3,216 | 3,592 |
Median Market Cap | $24.2B | $24.2B |
Price/Earnings Ratio | 18.5x | 18.5x |
Price/Book Ratio | 1.9x | 1.9x |
Yield2 | | 2.2% |
Institutional Shares | 2.3% | |
Institutional Plus Shares | 2.3% | |
Return on Equity | 19.8% | 19.8% |
Earnings Growth Rate | 13.7% | 13.8% |
Foreign Holdings | 0.0% | 0.0% |
Turnover Rate3 | 20% | — |
Expense Ratio4 | | — |
Institutional Shares | 0.045% | |
Institutional Plus Shares | 0.025% | |
Short-Term Reserves | 0.0% | — |
Sector Diversification (% of equity exposure) |
| | Target |
| Fund | Index1 |
Consumer Discretionary | 9.8% | 9.8% |
Consumer Staples | 10.4 | 10.4 |
Energy | 11.6 | 11.6 |
Financials | 14.5 | 14.5 |
Health Care | 13.8 | 13.8 |
Industrials | 10.5 | 10.5 |
Information Technology | 18.5 | 18.5 |
Materials | 3.6 | 3.6 |
Telecommunication Services | 3.2 | 3.2 |
Utilities | 4.1 | 4.1 |
Volatility Measures5 | |
| Fund Versus |
| Target Index1 |
R-Squared | 1.00 |
Beta | 1.00 |
Ten Largest Holdings6 (% of total net assets) |
| | |
ExxonMobil Corp. | integrated oil | |
| and gas | 3.4% |
Microsoft Corp. | systems software | 1.9 |
Johnson & Johnson | pharmaceuticals | 1.6 |
The Procter & Gamble Co. | household products | 1.5 |
AT&T Inc. | integrated | |
| telecommunication | |
| services | 1.5 |
International Business | computer | |
Machines Corp. | hardware | 1.4 |
Chevron Corp. | integrated oil | |
| and gas | 1.3 |
JPMorgan Chase & Co. | diversified | |
| financial services | 1.3 |
Apple Inc. | computer hardware | 1.3 |
General Electric Co. | industrial | |
| conglomerates | 1.2 |
Top Ten | | 16.4% |
Investment Focus
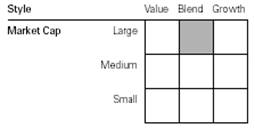
1 MSCI US Broad Market Index.
2 30-day SEC yield for the fund; annualized dividend yield for the index. See the Glossary.
3 Annualized.
4 The expense ratios shown are from the prospectus dated April 29, 2009, and represent estimated costs for the current fiscal year based on the fund’s net assets as of the prospectus date. For the six months ended June 30, 2009, the fund’s annualized expense ratios were 0.045% for Institutional Shares and 0.025% for Institutional Plus Shares.
5 For an explanation of R-squared, beta, and other terms used here, see the Glossary.
6 The holdings listed exclude any temporary cash investments and equity index products.
6
Institutional Total Stock Market Index Fund
Performance Summary
All of the returns in this report represent past performance, which is not a guarantee of future results that may be achieved by the fund. (Current performance may be lower or higher than the performance data cited. For performance data current to the most recent month-end, visit our website at www.vanguard.com/performance.) Note, too, that both investment returns and principal value can fluctuate widely, so an investor’s shares, when sold, could be worth more or less than their original cost. The returns shown do not reflect taxes that a shareholder would pay on fund distributions or on the sale of fund shares.
Fiscal-Year Total Returns (%): August 31, 2001–June 30, 2009
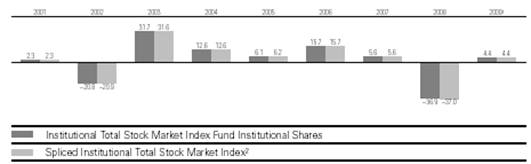
Average Annual Total Returns: Periods Ended June 30, 2009 |
| | | | Since |
| Inception Date | One Year | Five Years | Inception |
Institutional Shares | 8/31/2001 | –26.13% | –1.53% | 0.35% |
Institutional Plus Shares | 5/31/2001 | –26.08 | –1.50 | –0.80 |
1 Six months ended June 30, 2009.
2 Dow Jones Wilshire 5000 Index through April 8, 2005; MSCI US Broad Market Index thereafter.
Note: See Financial Highlights tables for dividend and capital gains information.
7
Institutional Total Stock Market Index Fund
Financial Statements (unaudited)
Statement of Net Assets
As of June 30, 2009
The fund provides a complete list of its holdings four times in each fiscal year, at the quarter-ends. For the second and fourth fiscal quarters, the lists appear in the fund’s semiannual and annual reports to shareholders. For the first and third fiscal quarters, the fund files the lists with the Securities and Exchange Commission on Form N-Q. Shareholders can look up the fund’s Forms N-Q on the SEC’s website at www.sec.gov. Forms N-Q may also be reviewed and copied at the SEC’s Public Reference Room (see the back cover of this report for further information).
| | | Market |
| | | Value• |
| | Shares | ($000) |
Common Stocks (99.2%)1 | | |
Consumer Discretionary (9.7%) | | |
| McDonald’s Corp. | 1,005,709 | 57,818 |
| The Walt Disney Co. | 1,593,564 | 37,178 |
| Home Depot, Inc. | 1,532,067 | 36,203 |
| Comcast Corp. Class A | 2,301,655 | 33,351 |
| Time Warner Inc. | 1,080,703 | 27,223 |
* | Amazon.com, Inc. | 309,766 | 25,915 |
| Lowe’s Cos., Inc. | 1,328,341 | 25,783 |
| Target Corp. | 646,188 | 25,505 |
| News Corp., Class A | 2,031,226 | 18,504 |
| NIKE, Inc. Class B | 333,029 | 17,244 |
* | Ford Motor Co. | 2,523,224 | 15,316 |
| Yum! Brands, Inc. | 415,631 | 13,857 |
| Staples, Inc. | 644,644 | 13,002 |
* | Liberty Media Corp. | 445,739 | 11,924 |
| TJX Cos., Inc. | 375,934 | 11,827 |
| Johnson Controls, Inc. | 536,663 | 11,656 |
* | DIRECTV Group, Inc. | 459,648 | 11,358 |
* | Viacom Inc. Class B | 495,752 | 11,254 |
* | Kohl’s Corp. | 261,347 | 11,173 |
| Best Buy Co., Inc. | 317,302 | 10,626 |
| Carnival Corp. | 395,535 | 10,193 |
| Time Warner Cable Inc. | 318,321 | 10,081 |
* | Starbucks Corp. | 663,804 | 9,220 |
| Omnicom Group Inc. | 280,831 | 8,869 |
* | Apollo Group, Inc. Class A | 122,129 | 8,686 |
| The McGraw-Hill Cos., Inc. | 284,185 | 8,557 |
| Coach, Inc. | 289,870 | 7,792 |
| The Gap, Inc. | 446,922 | 7,330 |
* | Bed Bath & Beyond, Inc. | 234,682 | 7,216 |
| Marriott International, Inc. | | |
| Class A | 270,240 | 5,964 |
| J.C. Penney Co., Inc. | | |
| (Holding Co.) | 191,272 | 5,491 |
| H & R Block, Inc. | 307,375 | 5,296 |
| Mattel, Inc. | 324,799 | 5,213 |
| Sherwin-Williams Co. | 90,349 | 4,856 |
| Genuine Parts Co. | 144,616 | 4,853 |
| Fortune Brands, Inc. | 135,964 | 4,723 |
| | | Market |
| | | Value• |
| | Shares | ($000) |
* | AutoZone Inc. | 31,061 | 4,694 |
* | O’Reilly Automotive, Inc. | 122,372 | 4,660 |
| Ross Stores, Inc. | 117,362 | 4,530 |
| Macy’s Inc. | 381,048 | 4,481 |
| VF Corp. | 79,853 | 4,420 |
| International | | |
| Game Technology | 268,117 | 4,263 |
| Cablevision Systems | | |
| NY Group Class A | 219,502 | 4,261 |
| Tim Hortons, Inc. | 164,714 | 4,042 |
* | Priceline.com, Inc. | 35,260 | 3,933 |
| Darden Restaurants Inc. | 118,015 | 3,892 |
| CBS Corp. | 536,161 | 3,710 |
| Starwood Hotels & | | |
| Resorts Worldwide, Inc. | 166,293 | 3,692 |
| BorgWarner, Inc. | 104,992 | 3,585 |
| Advance Auto Parts, Inc. | 85,829 | 3,561 |
* | ITT Educational | | |
| Services, Inc. | 35,225 | 3,546 |
* | Dollar Tree, Inc. | 81,785 | 3,443 |
| Harley-Davidson, Inc. | 210,882 | 3,418 |
| Family Dollar Stores, Inc. | 120,528 | 3,411 |
*,^ | Sears Holdings Corp. | 50,441 | 3,355 |
* | GameStop Corp. Class A | 141,262 | 3,109 |
* | DISH Network Corp. | 189,162 | 3,066 |
| Limited Brands, Inc. | 247,971 | 2,968 |
* | CarMax, Inc. | 200,584 | 2,949 |
| DeVry, Inc. | 58,560 | 2,930 |
| Nordstrom, Inc. | 146,691 | 2,918 |
| Whirlpool Corp. | 66,826 | 2,844 |
| Tiffany & Co. | 111,713 | 2,833 |
| Comcast Corp. Special | | |
| Class A | 199,815 | 2,817 |
| Strayer Education, Inc. | 12,794 | 2,790 |
| Hasbro, Inc. | 113,705 | 2,756 |
* | Discovery | | |
| Communications Inc. | | |
| Class A | 121,609 | 2,742 |
| Polo Ralph Lauren Corp. | 50,736 | 2,716 |
* | Expedia, Inc. | 178,000 | 2,690 |
8
Institutional Total Stock Market Index Fund
| | | Market |
| | | Value• |
| | Shares | ($000) |
* | Discovery | | |
| Communications Inc. | | |
| Class C | 127,629 | 2,620 |
| Newell Rubbermaid, Inc. | 251,475 | 2,618 |
| Garmin Ltd. | 109,040 | 2,597 |
* | Liberty Media Corp.- | | |
| Interactive Series A | 511,462 | 2,562 |
| PetSmart, Inc. | 115,607 | 2,481 |
| D. R. Horton, Inc. | 258,942 | 2,424 |
| American Eagle | | |
| Outfitters, Inc. | 168,523 | 2,388 |
* | Urban Outfitters, Inc. | 114,134 | 2,382 |
| Virgin Media Inc. | 251,841 | 2,355 |
*,^ | Wynn Resorts Ltd. | 66,486 | 2,347 |
* | The Goodyear Tire & | | |
| Rubber Co. | 208,311 | 2,346 |
*,^ | Las Vegas Sands Corp. | 290,655 | 2,285 |
| Scripps Networks Interactive | 80,960 | 2,253 |
| Autoliv, Inc. | 76,463 | 2,200 |
* | Interpublic Group of | | |
| Cos., Inc. | 433,164 | 2,187 |
| The Stanley Works | 64,586 | 2,186 |
* | Toll Brothers, Inc. | 124,332 | 2,110 |
* | Aeropostale, Inc. | 60,939 | 2,088 |
* | NVR, Inc. | 4,150 | 2,085 |
| Leggett & Platt, Inc. | 135,185 | 2,059 |
* | Career Education Corp. | 81,677 | 2,033 |
| Abercrombie & Fitch Co. | 79,148 | 2,010 |
* | Liberty Global, Inc. Class A | 124,063 | 1,971 |
| Wyndham Worldwide Corp. | 161,657 | 1,959 |
| Washington Post Co. | | |
| Class B | 5,513 | 1,942 |
* | Mohawk Industries, Inc. | 53,153 | 1,896 |
* | LKQ Corp. | 115,063 | 1,893 |
*,^ | Netflix.com, Inc. | 45,390 | 1,876 |
* | AutoNation, Inc. | 104,166 | 1,807 |
* | Liberty Global, Inc. | | |
| Series C | 114,290 | 1,807 |
* | DreamWorks | | |
| Animation SKG, Inc. | 63,844 | 1,761 |
| Pulte Homes, Inc. | 199,250 | 1,759 |
* | Penn National Gaming, Inc. | 60,106 | 1,750 |
| Royal Caribbean | | |
| Cruises, Ltd. | 127,065 | 1,720 |
* | Marvel Entertainment, Inc. | 46,404 | 1,652 |
| RadioShack Corp. | 114,581 | 1,600 |
* | Chico’s FAS, Inc. | 162,340 | 1,580 |
* | Big Lots Inc. | 74,757 | 1,572 |
| Brinker International, Inc. | 92,310 | 1,572 |
| Black & Decker Corp. | 54,748 | 1,569 |
| Snap-On Inc. | 52,395 | 1,506 |
* | Jarden Corp. | 80,127 | 1,502 |
* | Sirius XM Radio Inc. | 3,466,679 | 1,491 |
| Tupperware Brands Corp. | 57,073 | 1,485 |
| Burger King Holdings Inc. | 85,964 | 1,485 |
| Foot Locker, Inc. | 141,325 | 1,480 |
| | | Market |
| | | Value• |
| | Shares | ($000) |
| Wendy’s/Arby’s Group, Inc. | 361,695 | 1,447 |
| Gentex Corp. | 124,677 | 1,446 |
* | WMS Industries, Inc. | 45,283 | 1,427 |
* | Bally Technologies Inc. | 47,362 | 1,417 |
* | The Warnaco Group, Inc. | 42,617 | 1,381 |
| Phillips-Van Heusen Corp. | 47,123 | 1,352 |
* | Dick’s Sporting Goods, Inc. | 78,284 | 1,346 |
| John Wiley & Sons Class A | 40,456 | 1,345 |
* | MGM Mirage, Inc. | 208,334 | 1,331 |
* | Panera Bread Co. | 26,632 | 1,328 |
| Guess ?, Inc. | 51,368 | 1,324 |
* | Hanesbrands Inc. | 86,006 | 1,291 |
* | Carter’s, Inc. | 51,861 | 1,276 |
* | Corinthian Colleges, Inc. | 74,533 | 1,262 |
| Service Corp. International | 226,694 | 1,242 |
| Aaron Rents, Inc. | 41,292 | 1,231 |
* | J. Crew Group, Inc. | 45,422 | 1,227 |
* | Tractor Supply Co. | 29,187 | 1,206 |
* | Chipotle Mexican Grill, Inc. | | |
| Class B | 17,040 | 1,189 |
* | Brink’s Home | | |
| Security Holdings, Inc. | 41,926 | 1,187 |
* | Jack in the Box Inc. | 52,308 | 1,174 |
| Harman International | | |
| Industries, Inc. | 60,529 | 1,138 |
* | Liberty Media Corp.- | | |
| Capital Series A | 83,729 | 1,135 |
* | Office Depot, Inc. | 248,160 | 1,132 |
* | Rent-A-Center, Inc. | 60,363 | 1,076 |
*,^ | Chipotle Mexican Grill, Inc. | 13,052 | 1,044 |
| WABCO Holdings Inc. | 58,734 | 1,040 |
| Regal Entertainment Group | | |
| Class A | 77,640 | 1,032 |
| MDC Holdings, Inc. | 34,126 | 1,028 |
* | Fossil, Inc. | 42,666 | 1,027 |
* | Lamar Advertising Co. | | |
| Class A | 66,363 | 1,013 |
* | Scientific Games Corp. | 63,662 | 1,004 |
| Wolverine World Wide, Inc. | 45,030 | 993 |
* | Iconix Brand Group Inc. | 63,831 | 982 |
| Centex Corp. | 114,217 | 966 |
| Williams-Sonoma, Inc. | 81,078 | 962 |
| Hillenbrand Inc. | 56,959 | 948 |
* | The Gymboree Corp. | 26,365 | 935 |
| Lennar Corp. Class A | 93,609 | 907 |
| Polaris Industries, Inc. | 28,134 | 904 |
* | The Cheesecake Factory Inc. | 52,062 | 901 |
| Matthews International Corp. | 28,170 | 877 |
| Men’s Wearhouse, Inc. | 45,333 | 869 |
| Sotheby’s | 60,831 | 858 |
* | Collective Brands, Inc. | 57,774 | 842 |
| Jones Apparel Group, Inc. | 78,312 | 840 |
| Meredith Corp. | 32,750 | 837 |
* | Deckers Outdoor Corp. | 11,854 | 833 |
| KB Home | 59,992 | 821 |
9
Institutional Total Stock Market Index Fund
| | | Market |
| | | Value• |
| | Shares | ($000) |
| Choice Hotels | | |
| International, Inc. | 30,687 | 817 |
| Tempur-Pedic | | |
| International Inc. | 62,035 | 811 |
| Weight Watchers | | |
| International, Inc. | 31,347 | 808 |
| The Buckle, Inc. | 25,423 | 808 |
| Interactive Data Corp. | 34,575 | 800 |
| Bob Evans Farms, Inc. | 27,662 | 795 |
* | Capella Education Co. | 12,700 | 761 |
| Gannett Co., Inc. | 208,975 | 746 |
| Eastman Kodak Co. | 249,216 | 738 |
| American Greetings Corp. | | |
| Class A | 62,522 | 730 |
| Barnes & Noble, Inc. | 35,089 | 724 |
| Pool Corp. | 43,445 | 719 |
* | Morningstar, Inc. | 17,326 | 714 |
| New York Times Co. | | |
| Class A | 125,753 | 693 |
| Regis Corp. | 39,772 | 692 |
* | Coinstar, Inc. | 25,863 | 691 |
*,^ | Under Armour, Inc. | 30,627 | 685 |
* | P.F. Chang’s | | |
| China Bistro, Inc. | 20,918 | 671 |
* | Life Time Fitness, Inc. | 33,141 | 663 |
| Ryland Group, Inc. | 39,530 | 663 |
| International | | |
| Speedway Corp. | 25,597 | 656 |
| Penske Automotive | | |
| Group Inc. | 38,466 | 640 |
| Cooper Tire & Rubber Co. | 63,601 | 631 |
* | The Dress Barn, Inc. | 44,107 | 631 |
* | Vail Resorts Inc. | 23,380 | 627 |
* | American Public | | |
| Education, Inc. | 15,688 | 621 |
* | 99 Cents Only Stores | 45,582 | 619 |
* | CEC Entertainment Inc. | 20,882 | 616 |
| Thor Industries, Inc. | 33,330 | 612 |
* | The Children’s Place | | |
| Retail Stores, Inc. | 22,959 | 607 |
* | Lions Gate | | |
| Entertainment Corp. | 107,957 | 605 |
* | AnnTaylor Stores Corp. | 74,011 | 591 |
| Scholastic Corp. | 29,690 | 588 |
| Ameristar Casinos, Inc. | 30,583 | 582 |
| Cracker Barrel Old | | |
| Country Store Inc. | 20,719 | 578 |
* | Blue Nile Inc. | 13,404 | 576 |
* | Jos. A. Bank Clothiers, Inc. | 16,665 | 574 |
| Group 1 Automotive, Inc. | 21,869 | 569 |
* | Timberland Co. | 42,317 | 562 |
* | Charming Shoppes, Inc. | 148,492 | 552 |
| Dillard’s Inc. | 59,248 | 545 |
* | Saks Inc. | 122,918 | 545 |
* | Sonic Corp. | 53,122 | 533 |
| National CineMedia Inc. | 38,137 | 525 |
| | | Market |
| | | Value• |
| | Shares | ($000) |
* | Buffalo Wild Wings Inc. | 16,080 | 523 |
* | Pinnacle Entertainment, Inc. | 54,706 | 508 |
* | Cabela’s Inc. | 41,200 | 507 |
* | Papa John’s | | |
| International, Inc. | 20,405 | 506 |
| Arbitron Inc. | 31,617 | 502 |
* | BJ’s Restaurants Inc. | 28,800 | 486 |
* | California Pizza Kitchen, Inc. | 36,166 | 481 |
| Asbury Automotive | | |
| Group, Inc. | 46,572 | 477 |
* | Hibbett Sports Inc. | 26,392 | 475 |
* | Pre-Paid Legal Services, Inc. | 10,816 | 471 |
* | Gaylord Entertainment Co. | 37,085 | 471 |
| ArvinMeritor, Inc. | 105,643 | 464 |
* | Crocs, Inc. | 134,294 | 457 |
* | TRW Automotive | | |
| Holdings Corp. | 40,195 | 454 |
| Cato Corp. Class A | 25,674 | 448 |
* | Boyd Gaming Corp. | 51,745 | 440 |
| Brunswick Corp. | 100,637 | 435 |
| OfficeMax, Inc. | 68,609 | 431 |
| Churchill Downs, Inc. | 12,751 | 429 |
| Christopher & Banks Corp. | 63,496 | 426 |
| Brown Shoe Co., Inc. | 58,603 | 424 |
| Finish Line, Inc. | 56,854 | 422 |
| Fred’s, Inc. | 33,324 | 420 |
* | CTC Media, Inc. | 35,029 | 414 |
* | Ascent Media Corp. | 15,278 | 406 |
* | America’s Car-Mart, Inc. | 19,787 | 406 |
| Harte-Hanks, Inc. | 41,026 | 379 |
| K-Swiss, Inc. | 44,251 | 376 |
| DineEquity, Inc. | 11,924 | 372 |
| Orient-Express Hotel Ltd. | 43,724 | 371 |
* | HSN, Inc. | 34,846 | 368 |
| Big 5 Sporting Goods Corp. | 32,711 | 362 |
| CKE Restaurants Inc. | 42,327 | 359 |
| Liz Claiborne, Inc. | 123,094 | 355 |
| Ethan Allen Interiors, Inc. | 33,984 | 352 |
* | Maidenform Brands, Inc. | 30,629 | 351 |
*,^ | Fuel Systems Solutions, Inc. | 17,372 | 351 |
* | Helen of Troy Ltd. | 20,799 | 349 |
| NutriSystem, Inc. | 24,008 | 348 |
| O’Charley’s Inc. | 37,481 | 347 |
* | Texas Roadhouse, Inc. | 31,594 | 345 |
* | Steiner Leisure Ltd. | 11,193 | 342 |
* | Tenneco Automotive, Inc. | 32,088 | 340 |
| Blyth, Inc. | 10,311 | 338 |
* | Meritage Corp. | 17,747 | 335 |
* | AFC Enterprises, Inc. | 48,608 | 328 |
* | G-III Apparel Group, Ltd. | 28,230 | 324 |
* | Universal Technical | | |
| Institute Inc. | 21,627 | 323 |
| American Axle & | | |
| Manufacturing | | |
| Holdings, Inc. | 93,363 | 321 |
* | Sally Beauty Co. Inc. | 49,812 | 317 |
Institutional Total Stock Market Index Fund
| | | Market |
| | | Value• |
| | Shares | ($000) |
* | Steven Madden, Ltd. | 12,440 | 317 |
* | Jo-Ann Stores, Inc. | 15,150 | 313 |
| UniFirst Corp. | 8,388 | 312 |
| Cherokee Inc. | 15,426 | 306 |
* | Pacific Sunwear of | | |
| California, Inc. | 90,288 | 304 |
| Stewart Enterprises, Inc. | | |
| Class A | 62,350 | 301 |
* | True Religion Apparel, Inc. | 13,429 | 299 |
| bebe stores, inc. | 43,036 | 296 |
* | Live Nation, Inc. | 60,277 | 293 |
* | JAKKS Pacific, Inc. | 22,642 | 290 |
* | Clear Channel Outdoor | | |
| Holdings, Inc. Class A | 54,625 | 290 |
| The Pep Boys | | |
| (Manny, Moe & Jack) | 28,458 | 289 |
| CSS Industries, Inc. | 14,138 | 288 |
* | Skechers U.S.A., Inc. | 29,448 | 288 |
* | Lululemon Athletica, Inc. | 21,815 | 284 |
* | Borders Group, Inc. | 75,910 | 279 |
* | Denny’s Corp. | 122,825 | 264 |
| Monro Muffler Brake, Inc. | 10,111 | 260 |
| Callaway Golf Co. | 51,087 | 259 |
* | Audiovox Corp. | 44,054 | 258 |
* | Amerigon Inc. | 42,240 | 258 |
* | Genesco, Inc. | 13,688 | 257 |
| CPI Corp. | 14,827 | 252 |
* | Peet’s Coffee & Tea Inc. | 9,986 | 252 |
| Belo Corp. Class A | 140,343 | 251 |
* | Interval Leisure Group, Inc. | 26,726 | 249 |
*,^ | Conn’s, Inc. | 19,627 | 245 |
* | Volcom, Inc. | 19,619 | 245 |
* | Overstock.com, Inc. | 20,227 | 242 |
* | Domino’s Pizza, Inc. | 31,893 | 239 |
* | Coldwater Creek Inc. | 39,334 | 238 |
* | Red Robin Gourmet | | |
| Burgers, Inc. | 12,644 | 237 |
* | Isle of Capri Casinos, Inc. | 17,407 | 232 |
* | Mediacom | | |
| Communications Corp. | 44,567 | 228 |
* | Hot Topic, Inc. | 30,863 | 226 |
| Stage Stores, Inc. | 20,124 | 223 |
| Winnebago Industries, Inc. | 29,881 | 222 |
* | Krispy Kreme | | |
| Doughnuts, Inc. | 73,070 | 219 |
* | Ruby Tuesday, Inc. | 32,815 | 219 |
| Columbia Sportswear Co. | 6,993 | 216 |
| World Wrestling | | |
| Entertainment, Inc. | 17,192 | 216 |
| Standard Motor | | |
| Products, Inc. | 25,851 | 214 |
| Carmike Cinemas, Inc. | 25,465 | 213 |
* | CKX, Inc. | 29,954 | 212 |
* | Build-A-Bear-Workshop, Inc. | 47,226 | 211 |
* | PetMed Express, Inc. | 14,028 | 211 |
| | | Market |
| | | Value• |
| | Shares | ($000) |
| Jackson Hewitt | | |
| Tax Service Inc. | 33,332 | 209 |
| Books-a-Million Inc. | 29,271 | 208 |
* | Shutterfly, Inc. | 14,800 | 206 |
* | Kirkland’s, Inc. | 17,131 | 206 |
* | Charlotte Russe Holding Inc. | 15,924 | 205 |
* | Ticketmaster | | |
| Entertainment Inc. | 31,426 | 202 |
* | Cavco Industries, Inc. | 7,936 | 201 |
* | Carriage Services, Inc. | 56,184 | 201 |
* | Exide Technologies | 53,574 | 200 |
* | Hovnanian Enterprises Inc. | | |
| Class A | 84,670 | 200 |
* | Valassis | | |
| Communications, Inc. | 31,959 | 195 |
* | Alloy, Inc. | 36,292 | 192 |
* | Drew Industries, Inc. | 15,500 | 189 |
| Lennar Corp. Class B | 24,500 | 186 |
* | Learning Tree | | |
| International, Inc. | 17,883 | 184 |
*,^ | Blockbuster Inc. Class A | 268,851 | 177 |
* | RC2 Corp. | 13,295 | 176 |
* | The Wet Seal, Inc. Class A | 56,797 | 174 |
* | Systemax Inc. | 14,469 | 172 |
| Arctic Cat, Inc. | 42,344 | 171 |
* | Standard Pacific Corp. | 84,249 | 171 |
| Ambassadors Group, Inc. | 12,322 | 170 |
| Haverty Furniture Cos., Inc. | 18,470 | 169 |
* | Quiksilver, Inc. | 90,129 | 167 |
| National Presto | | |
| Industries, Inc. | 2,179 | 166 |
| Oxford Industries, Inc. | 14,152 | 165 |
| The Marcus Corp. | 15,543 | 164 |
* | Citi Trends Inc. | 6,222 | 161 |
* | Shuffle Master, Inc. | 23,868 | 158 |
| Movado Group, Inc. | 14,819 | 156 |
| Sonic Automotive, Inc. | 15,339 | 156 |
| Superior Industries | | |
| International, Inc. | 10,943 | 154 |
* | The Princeton Review, Inc. | 28,495 | 154 |
| La-Z-Boy Inc. | 32,196 | 152 |
| Lithia Motors, Inc. | 16,224 | 150 |
*,^ | K12 Inc. | 6,900 | 149 |
* | Dorman Products, Inc. | 10,525 | 146 |
| Modine Manufacturing Co. | 30,120 | 145 |
* | Tuesday Morning Corp. | 42,595 | 144 |
* | Dolan Media Co. | 11,192 | 143 |
| Cinemark Holdings Inc. | 12,600 | 143 |
*,^ | Gander Mountain Co. | 23,201 | 139 |
* | Warner Music Group Corp. | 23,513 | 138 |
| Fisher Communications, Inc. | 10,632 | 136 |
* | A.C. Moore | | |
| Arts & Crafts, Inc. | 35,590 | 134 |
* | drugstore.com, Inc. | 72,369 | 132 |
* | Knology, Inc. | 15,002 | 129 |
* | Tween Brands, Inc. | 19,204 | 128 |
11
Institutional Total Stock Market Index Fund
| | | Market |
| | | Value• |
| | Shares | ($000) |
* | Core-Mark Holding Co., Inc. | 4,915 | 128 |
| Marine Products Corp. | 34,069 | 128 |
* | dELiA*S, Inc. | 53,372 | 127 |
* | hhgregg, Inc. | 8,130 | 123 |
| Sturm, Ruger & Co., Inc. | 9,785 | 122 |
* | Benihana Inc. Class A | 19,113 | 121 |
*,^ | Brookfield Homes Corp. | 29,518 | 118 |
| Furniture Brands | | |
| International Inc. | 38,959 | 118 |
* | Midas Inc. | 11,109 | 116 |
* | Stamps.com Inc. | 13,613 | 115 |
* | Multimedia Games Inc. | 23,244 | 115 |
| Spartan Motors, Inc. | 10,012 | 113 |
* | Gaiam, Inc. | 20,429 | 112 |
* | Bluegreen Corp. | 43,238 | 109 |
| Dover Downs Gaming & | | |
| Entertainment, Inc. | 23,170 | 108 |
* | Smith & Wesson | | |
| Holding Corp. | 18,860 | 107 |
* | Beazer Homes USA, Inc. | 58,376 | 107 |
* | RCN Corp. | 17,787 | 106 |
* | Leapfrog Enterprises, Inc. | 44,628 | 102 |
* | Luby’s, Inc. | 24,996 | 101 |
* | Unifi, Inc. | 71,192 | 101 |
| Speedway Motorsports, Inc. | 7,331 | 101 |
* | Cache, Inc. | 25,650 | 100 |
* | Morgans Hotel Group | 25,940 | 99 |
* | Universal Electronics, Inc. | 4,809 | 97 |
| Hooker Furniture Corp. | 8,400 | 96 |
* | 1-800-FLOWERS.COM, Inc. | 49,903 | 96 |
* | Zale Corp. | 26,866 | 92 |
* | Rentrak Corp. | 5,600 | 92 |
* | DSW Inc. Class A | 9,000 | 89 |
| Kenneth Cole | | |
| Productions, Inc. | 12,581 | 88 |
* | Landry’s Restaurants, Inc. | 10,282 | 88 |
* | MarineMax, Inc. | 25,490 | 88 |
* | Perry Ellis | | |
| International Corp. | 11,978 | 87 |
| Stanley Furniture Co., Inc. | 7,945 | 86 |
* | Martha Stewart Living | | |
| Omnimedia, Inc. | 27,691 | 85 |
* | Town Sports International | | |
| Holdings, Inc. | 22,000 | 83 |
*,^ | Quantum Fuel Systems | | |
| Technologies | | |
| Worldwide, Inc. | 106,553 | 82 |
* | Caribou Coffee Co. | 12,577 | 81 |
| Talbots Inc. | 14,765 | 80 |
* | Russ Berrie and Co., Inc. | 20,250 | 79 |
| Weyco Group, Inc. | 3,422 | 79 |
* | Pier 1 Imports Inc. | 39,247 | 78 |
* | Cost Plus, Inc. | 52,236 | 77 |
| M/I Homes, Inc. | 7,750 | 76 |
* | Casual Male | | |
| Retail Group, Inc. | 33,081 | 72 |
| | | Market |
| | | Value• |
| | Shares | ($000) |
* | Stein Mart, Inc. | 8,072 | 72 |
* | Retail Ventures, Inc. | 31,829 | 69 |
* | iRobot Corp. | 5,008 | 65 |
| News Corp., Class B | 6,073 | 64 |
* | Steinway Musical | | |
| Instruments Inc. | 5,874 | 63 |
| Bassett Furniture | | |
| Industries, Inc. | 22,650 | 62 |
* | Lincoln Educational Services | 2,900 | 61 |
* | ValueVision Media, Inc. | 30,783 | 60 |
* | Steak n Shake Co. | 6,891 | 60 |
* | New York & Co., Inc. | 19,325 | 60 |
* | Monarch Casino & | | |
| Resort, Inc. | 8,027 | 59 |
| Strattec Security Corp. | 4,111 | 57 |
* | Destination Maternity Corp. | 3,380 | 56 |
*,^ | Raser Technologies, Inc. | 20,100 | 56 |
* | Century Casinos, Inc. | 18,779 | 56 |
* | Navarre Corp. | 32,814 | 54 |
* | West Marine, Inc. | 9,677 | 53 |
* | Zumiez Inc. | 6,580 | 53 |
* | Cumulus Media Inc. | 56,253 | 52 |
* | Playboy Enterprises, Inc. | | |
| Class B | 20,792 | 52 |
* | Bidz.com, Inc. | 18,299 | 52 |
^ | Bon-Ton Stores, Inc. | 14,510 | 49 |
| Skyline Corp. | 2,242 | 49 |
*,^ | Cosi, Inc. | 77,053 | 49 |
* | 4Kids Entertainment Inc. | 22,543 | 47 |
* | Shoe Carnival, Inc. | 3,817 | 46 |
| Sinclair Broadcast Group, Inc. | 23,450 | 45 |
* | Dana Holding Corp. | 34,600 | 44 |
* | LodgeNet Interactive Corp. | 12,943 | 44 |
| E.W. Scripps Co. Class A | 20,460 | 43 |
* | REX Stores Corp. | 4,209 | 42 |
| AH Belo Corp. | 41,521 | 41 |
* | Sealy Corp. Rights | | |
| Exp. 7/2/09 | 19,178 | 41 |
* | Youbet.com, Inc. | 11,828 | 39 |
| Entercom | | |
| Communications Corp. | 24,735 | 38 |
* | Sealy Corp. | 19,178 | 38 |
* | Ulta Salon, Cosmetics & | | |
| Fragrance, Inc. | 3,376 | 38 |
* | Shiloh Industries, Inc. | 10,059 | 37 |
* | Pomeroy IT Solutions, Inc. | 6,047 | 36 |
* | MTR Gaming Group Inc. | 14,457 | 36 |
| PRIMEDIA Inc. | 17,570 | 35 |
* | Duckwall-ALCO Stores, Inc. | 2,152 | 35 |
* | Benihana Inc. | 5,006 | 34 |
* | Nautilus Inc. | 28,920 | 33 |
* | Global Traffic Network, Inc. | 8,486 | 32 |
* | Empire Resorts Inc. | 17,520 | 32 |
| Beasley Broadcast | | |
| Group, Inc. | 14,447 | 32 |
* | Lear Corp. | 62,591 | 31 |
12
Institutional Total Stock Market Index Fund
| | | Market |
| | | Value• |
| | Shares | ($000) |
* | Entravision | | |
| Communications Corp. | 64,225 | 31 |
| Journal | | |
| Communications, Inc. | 28,701 | 30 |
* | Harris Interactive Inc. | 73,072 | 30 |
| Heelys Inc. | 13,600 | 27 |
* | Reading International Inc. | | |
| Class A | 5,900 | 27 |
* | The Dixie Group, Inc. | 8,586 | 25 |
* | Fuqi International, Inc. | 1,200 | 25 |
* | Maxxam Inc. | 2,278 | 25 |
* | Lazare Kaplan | | |
| International, Inc. | 9,594 | 25 |
| Gray Television, Inc. | 48,812 | 24 |
| The McClatchy Co. Class A | 45,433 | 23 |
* | Einstein Noah | | |
| Restaurant Group Inc. | 2,600 | 22 |
* | EDCI Holdings, Inc. | 4,094 | 21 |
* | Lodgian, Inc. | 15,697 | 20 |
* | Stoneridge, Inc. | 4,152 | 20 |
* | Palm Harbor Homes, Inc. | 9,203 | 20 |
* | McCormick & Schmick’s | | |
| Seafood Restaurants, Inc. | 2,500 | 19 |
* | Emmis Communications, Inc. | 63,231 | 19 |
* | Select Comfort Corp. | 22,497 | 19 |
^ | Media General, Inc. Class A | 8,580 | 18 |
* | Champion Enterprises, Inc. | 55,389 | 18 |
* | Lin TV Corp. | 9,610 | 16 |
| Lifetime Brands, Inc. | 3,800 | 16 |
| Lee Enterprises, Inc. | 29,094 | 15 |
* | Orleans Homebuilders, Inc. | 8,178 | 14 |
* | Red Lion Hotels Corp. | 2,812 | 13 |
* | Daily Journal Corp. | 260 | 12 |
* | Hastings Entertainment, Inc. | 2,708 | 12 |
* | California Coastal | | |
| Communities, Inc. | 7,820 | 11 |
* | Trans World | | |
| Entertainment Corp. | 8,888 | 10 |
* | Outdoor Channel | | |
| Holdings Inc. | 1,667 | 10 |
* | Escalade, Inc. | 10,730 | 9 |
* | Salem Communications Corp. | 9,254 | 9 |
* | Craftmade International, Inc. | 4,100 | 9 |
* | Blockbuster Inc. Class B | 21,904 | 9 |
* | Hollywood Media Corp. | 5,240 | 8 |
* | Lumber Liquidators, Inc. | 500 | 8 |
* | Atrinsic, Inc. | 5,453 | 7 |
| Dover Motorsports, Inc. | 4,394 | 6 |
* | Jamba Inc. | 5,000 | 6 |
* | Radio One, Inc. Class D | 22,460 | 6 |
* | Emerson Radio Corp. | 8,900 | 5 |
| Johnson Outdoors Inc. | 900 | 5 |
* | Great Wolf Resorts, Inc. | 2,310 | 5 |
* | Saga Communications Inc. | 825 | 4 |
* | Ruth’s Hospitality Group Inc. | 1,000 | 4 |
| | | Market |
| | | Value• |
| | Shares | ($000) |
* | Spanish Broadcasting | | |
| System, Inc. | 16,763 | 3 |
| Sport Supply Group Inc. | 300 | 3 |
| Flexsteel Industries, Inc. | 300 | 3 |
* | Nexstar Broadcasting | | |
| Group, Inc. | 2,995 | 2 |
* | Gaming Partners International | 282 | 1 |
* | Radio One, Inc. | 1,680 | 1 |
* | Krispy Kreme Doughnuts, Inc. | |
| Warrants Exp. 3/2/12 | 332 | — |
* | Gadzooks, Inc. | 3,843 | — |
| | | 878,346 |
Consumer Staples (10.4%) | | |
| The Procter & | | |
| Gamble Co. | 2,646,897 | 135,256 |
| Wal-Mart Stores, Inc. | 2,125,559 | 102,962 |
| The Coca-Cola Co. | 1,881,370 | 90,287 |
| Philip Morris | | |
| International Inc. | 1,809,778 | 78,943 |
| PepsiCo, Inc. | 1,405,599 | 77,252 |
| CVS Caremark Corp. | 1,297,066 | 41,338 |
| Kraft Foods Inc. | 1,327,598 | 33,641 |
| Colgate-Palmolive Co. | 456,020 | 32,259 |
| Altria Group, Inc. | 1,861,884 | 30,516 |
| Walgreen Co. | 891,632 | 26,214 |
| Kimberly-Clark Corp. | 373,711 | 19,594 |
| Costco Wholesale Corp. | 391,472 | 17,890 |
| General Mills, Inc. | 296,226 | 16,595 |
| Archer-Daniels-Midland Co. | 521,963 | 13,973 |
| The Kroger Co. | 560,062 | 12,349 |
| Sysco Corp. | 532,381 | 11,968 |
| Kellogg Co. | 241,557 | 11,249 |
| Lorillard, Inc. | 151,835 | 10,290 |
| H.J. Heinz Co. | 284,266 | 10,148 |
| Avon Products, Inc. | 385,209 | 9,931 |
| Safeway, Inc. | 387,575 | 7,895 |
| ConAgra Foods, Inc. | 403,886 | 7,698 |
| The Clorox Co. | 125,590 | 7,012 |
| Bunge Ltd. | 110,129 | 6,635 |
| Reynolds American Inc. | 158,333 | 6,115 |
| Sara Lee Corp. | 598,480 | 5,841 |
| Molson Coors Brewing Co. | | |
| Class B | 136,787 | 5,790 |
| Campbell Soup Co. | 194,830 | 5,732 |
| J.M. Smucker Co. | 107,359 | 5,224 |
| The Hershey Co. | 143,094 | 5,151 |
* | Dr. Pepper Snapple | | |
| Group, Inc. | 229,878 | 4,871 |
| The Pepsi Bottling | | |
| Group, Inc. | 134,185 | 4,541 |
| Coca-Cola Enterprises, Inc. | 265,421 | 4,419 |
| McCormick & Co., Inc. | 106,351 | 3,460 |
| Church & Dwight, Inc. | 63,535 | 3,451 |
| Tyson Foods, Inc. | 265,248 | 3,345 |
| The Estee Lauder Cos. Inc. | | |
| Class A | 101,694 | 3,322 |
13
Institutional Total Stock Market Index Fund
| | | Market |
| | | Value• |
| | Shares | ($000) |
* | Dean Foods Co. | 163,739 | 3,142 |
| Brown-Forman Corp. | | |
| Class B | 72,348 | 3,110 |
* | Ralcorp Holdings, Inc. | 51,029 | 3,109 |
* | Energizer Holdings, Inc. | 58,435 | 3,053 |
| SUPERVALU Inc. | 192,162 | 2,489 |
| Whole Foods Market, Inc. | 127,467 | 2,419 |
| Hormel Foods Corp. | 67,293 | 2,324 |
* | Constellation Brands, Inc. | | |
| Class A | 177,482 | 2,250 |
* | Hansen Natural Corp. | 71,215 | 2,195 |
| Alberto-Culver Co. | 80,504 | 2,047 |
| Corn Products | | |
| International, Inc. | 67,449 | 1,807 |
| Herbalife Ltd. | 55,450 | 1,749 |
* | BJ’s Wholesale Club, Inc. | 53,593 | 1,727 |
| Del Monte Foods Co. | 178,990 | 1,679 |
| Flowers Foods, Inc. | 75,591 | 1,651 |
* | Smithfield Foods, Inc. | 117,015 | 1,635 |
* | Green Mountain Coffee | | |
| Roasters, Inc. | 27,105 | 1,602 |
| PepsiAmericas, Inc. | 57,619 | 1,545 |
* | NBTY, Inc. | 50,333 | 1,415 |
| Casey’s General Stores, Inc. | 46,549 | 1,196 |
* | Chattem, Inc. | 15,752 | 1,073 |
* | Central European | | |
| Distribution Corp. | 38,556 | 1,024 |
* | United Natural Foods, Inc. | 37,601 | 987 |
* | Mead Johnson Nutrition Co. | 29,974 | 952 |
| Ruddick Corp. | 37,893 | 888 |
* | Rite Aid Corp. | 546,010 | 824 |
* | TreeHouse Foods Inc. | 28,582 | 822 |
| Lancaster Colony Corp. | 17,994 | 793 |
| Universal Corp. (VA) | 23,114 | 765 |
| Nu Skin Enterprises, Inc. | 47,859 | 732 |
| Sanderson Farms, Inc. | 16,007 | 720 |
| The Andersons, Inc. | 22,563 | 676 |
* | Winn-Dixie Stores, Inc. | 49,440 | 620 |
| Vector Group Ltd. | 43,112 | 616 |
* | Chiquita Brands | | |
| International, Inc. | 55,646 | 571 |
* | Hain Celestial Group, Inc. | 35,424 | 553 |
| Lance, Inc. | 23,878 | 552 |
| J & J Snack Foods Corp. | 15,376 | 552 |
* | Darling International, Inc. | 74,656 | 493 |
| Tootsie Roll Industries, Inc. | 19,704 | 447 |
| Cal-Maine Foods, Inc. | 17,353 | 433 |
* | American Italian Pasta Co. | 14,100 | 411 |
* | The Pantry, Inc. | 24,627 | 409 |
* | Bare Escentuals, Inc. | 44,247 | 392 |
* | Central Garden & Pet Co. | 33,486 | 368 |
| WD-40 Co. | 11,954 | 347 |
| Coca-Cola Bottling Co. | 6,035 | 333 |
| Ingles Markets, Inc. | 20,750 | 316 |
| Nash-Finch Co. | 11,629 | 315 |
| | | Market |
| | | Value• |
| | Shares | ($000) |
* | American Oriental | | |
| Bioengineering, Inc. | 58,561 | 310 |
* | Central Garden & Pet Co. | | |
| Class A | 29,492 | 291 |
* | Alliance One | | |
| International, Inc. | 68,293 | 260 |
* | Medifast, Inc. | 21,662 | 248 |
| Diamond Foods, Inc. | 8,351 | 233 |
| Arden Group Inc. Class A | 1,822 | 228 |
* | Boston Beer Co., Inc. | | |
| Class A | 7,607 | 225 |
* | Prestige Brands | | |
| Holdings Inc. | 36,362 | 224 |
* | Smart Balance Inc. | 30,900 | 210 |
| Inter Parfums, Inc. | 28,460 | 209 |
| Weis Markets, Inc. | 5,993 | 201 |
* | Lifeway Foods, Inc. | 15,308 | 197 |
* | Heckmann Corp. | 49,300 | 185 |
| PriceSmart, Inc. | 10,647 | 178 |
| Alico, Inc. | 5,705 | 171 |
| B&G Foods Inc. | 20,000 | 168 |
* | American Dairy, Inc. | 3,546 | 141 |
* | John B. Sanfilippo & | | |
| Son, Inc. | 19,363 | 138 |
| Spartan Stores, Inc. | 11,063 | 137 |
* | Elizabeth Arden, Inc. | 14,537 | 127 |
| Imperial Sugar Co. | 10,200 | 124 |
* | Susser Holdings Corp. | 10,675 | 119 |
* | Zapata Corp. | 17,400 | 119 |
| Farmer Brothers, Inc. | 4,856 | 111 |
* | Omega Protein Corp. | 26,265 | 107 |
| Griffin Land & | | |
| Nurseries, Inc. | 3,328 | 104 |
* | The Great Atlantic & | | |
| Pacific Tea Co., Inc. | 23,973 | 102 |
* | USANA Health | | |
| Sciences, Inc. | 3,274 | 97 |
| Mannatech, Inc. | 28,460 | 94 |
*,^ | Star Scientific, Inc. | 94,615 | 84 |
* | HQ Sustainable Maritime | | |
| Industries, Inc. | 7,200 | 66 |
| Oil-Dri Corp. of America | 4,218 | 63 |
* | Overhill Farms Inc. | 9,500 | 50 |
* | Revlon, Inc. | 8,572 | 47 |
* | Parlux Fragrances, Inc. | 20,700 | 36 |
* | National Beverage Corp. | 3,040 | 32 |
* | Nutraceutical | | |
| International Corp. | 2,905 | 30 |
* | Physicians Formula | | |
| Holdings, Inc. | 11,700 | 22 |
| Reddy Ice Holdings, Inc. | 9,960 | 16 |
* | MGP Ingredients, Inc. | 4,634 | 13 |
* | Inventure Group, Inc. | 5,177 | 13 |
* | Jones Soda Co. | 10,640 | 12 |
| Tasty Baking Co. Class A | 1,568 | 11 |
| Calavo Growers, Inc. | 498 | 10 |
14
Institutional Total Stock Market Index Fund
| | | Market |
| | | Value• |
| | Shares | ($000) |
* | Female Health Co. | 1,857 | 9 |
| Village Super Market Inc. | | |
| Class A | 200 | 6 |
* | Schiff Nutrition | | |
| International, Inc. | 484 | 2 |
* | Monterey Pasta Co. | 1,069 | 2 |
* | Cusine Solutions, Inc. | 700 | 1 |
| | | 938,868 |
Energy (11.5%) | | |
| ExxonMobil Corp. | 4,463,001 | 312,008 |
| Chevron Corp. | 1,810,350 | 119,936 |
| Schlumberger Ltd. | 1,080,132 | 58,446 |
| ConocoPhillips Co. | 1,269,982 | 53,415 |
| Occidental | | |
| Petroleum Corp. | 732,166 | 48,184 |
| Apache Corp. | 302,404 | 21,818 |
* | Transocean Ltd. | 288,817 | 21,456 |
| Devon Energy Corp. | 380,991 | 20,764 |
| Anadarko Petroleum Corp. | 451,068 | 20,474 |
| Marathon Oil Corp. | 637,576 | 19,210 |
| XTO Energy, Inc. | 497,567 | 18,977 |
| Halliburton Co. | 810,689 | 16,781 |
| EOG Resources, Inc. | 225,628 | 15,325 |
| Hess Corp. | 265,182 | 14,254 |
* | Weatherford | | |
| International Ltd. | 630,541 | 12,333 |
* | National Oilwell Varco Inc. | 377,068 | 12,315 |
* | Southwestern Energy Co. | 310,454 | 12,061 |
| Chesapeake Energy Corp. | 520,757 | 10,327 |
| Baker Hughes Inc. | 277,858 | 10,125 |
| Spectra Energy Corp. | 581,361 | 9,837 |
| Noble Energy, Inc. | 156,181 | 9,210 |
| Murphy Oil Corp. | 163,484 | 8,880 |
| Valero Energy Corp. | 502,755 | 8,492 |
| Williams Cos., Inc. | 523,394 | 8,170 |
| Peabody Energy Corp. | 240,859 | 7,264 |
* | Noble Corp. | 236,427 | 7,152 |
| Range Resources Corp. | 141,094 | 5,843 |
| El Paso Corp. | 631,271 | 5,827 |
* | Cameron | | |
| International Corp. | 196,474 | 5,560 |
| CONSOL Energy, Inc. | 163,542 | 5,554 |
* | Petrohawk Energy Corp. | 248,445 | 5,540 |
* | Ultra Petroleum Corp. | 136,487 | 5,323 |
| Diamond Offshore | | |
| Drilling, Inc. | 63,022 | 5,234 |
| Smith International, Inc. | 198,152 | 5,102 |
| ENSCO International, Inc. | 128,637 | 4,486 |
* | FMC Technologies Inc. | 112,885 | 4,242 |
* | Nabors Industries, Inc. | 258,322 | 4,025 |
* | Pride International, Inc. | 157,681 | 3,951 |
* | Newfield Exploration Co. | 119,728 | 3,912 |
| BJ Services Co. | 264,888 | 3,610 |
* | Denbury Resources, Inc. | 223,065 | 3,286 |
* | Plains Exploration & | | |
| Production Co. | 108,454 | 2,967 |
| | | Market |
| | | Value• |
| | Shares | ($000) |
* | Kinder Morgan | | |
| Management, LLC | 65,563 | 2,961 |
| Helmerich & Payne, Inc. | 95,336 | 2,943 |
| Cabot Oil & Gas Corp. | 93,755 | 2,873 |
| Pioneer Natural | | |
| Resources Co. | 104,960 | 2,676 |
| Sunoco, Inc. | 106,142 | 2,462 |
* | Oceaneering | | |
| International, Inc. | 49,523 | 2,238 |
| Cimarex Energy Co. | 75,697 | 2,145 |
* | EXCO Resources, Inc. | 163,481 | 2,112 |
| Tidewater Inc. | 46,911 | 2,011 |
| Arch Coal, Inc. | 129,925 | 1,997 |
| Rowan Cos., Inc. | 102,851 | 1,987 |
* | Dresser Rand Group, Inc. | 74,793 | 1,952 |
| Southern Union Co. | 101,124 | 1,860 |
| Patterson-UTI Energy, Inc. | 138,218 | 1,777 |
| Core Laboratories N.V. | 19,789 | 1,725 |
* | Alpha Natural | | |
| Resources, Inc. | 64,543 | 1,696 |
* | Concho Resources, Inc. | 58,147 | 1,668 |
* | Whiting Petroleum Corp. | 46,209 | 1,625 |
| Tesoro Corp. | 126,072 | 1,605 |
| Massey Energy Co. | 77,833 | 1,521 |
* | Forest Oil Corp. | 94,368 | 1,408 |
* | Comstock Resources, Inc. | 42,287 | 1,398 |
* | Encore Acquisition Co. | 44,596 | 1,376 |
* | SEACOR Holdings Inc. | 17,488 | 1,316 |
* | Atwood Oceanics, Inc. | 52,755 | 1,314 |
| Frontier Oil Corp. | 95,483 | 1,252 |
* | Superior Energy | | |
| Services, Inc. | 70,240 | 1,213 |
| St. Mary Land & | | |
| Exploration Co. | 57,303 | 1,196 |
| Foundation Coal | | |
| Holdings, Inc. | 40,528 | 1,139 |
* | Unit Corp. | 40,736 | 1,123 |
* | Arena Resources, Inc. | 34,931 | 1,113 |
* | Oil States International, Inc. | 45,401 | 1,099 |
* | Dril-Quip, Inc. | 28,621 | 1,090 |
* | Mariner Energy Inc. | 91,217 | 1,072 |
| World Fuel Services Corp. | 25,289 | 1,043 |
* | Bill Barrett Corp. | 36,972 | 1,015 |
* | Quicksilver Resources, Inc. | 106,914 | 993 |
* | SandRidge Energy, Inc. | 114,834 | 978 |
* | Helix Energy Solutions | | |
| Group, Inc. | 79,588 | 865 |
* | Continental Resources, Inc. | 31,077 | 862 |
* | Exterran Holdings, Inc. | 53,435 | 857 |
| Overseas Shipholding | | |
| Group Inc. | 24,400 | 831 |
* | Bristow Group, Inc. | 25,671 | 761 |
* | CNX Gas Corp. | 27,928 | 734 |
| Holly Corp. | 38,747 | 697 |
| Penn Virginia Corp. | 41,114 | 673 |
| CARBO Ceramics Inc. | 19,362 | 662 |
15
Institutional Total Stock Market Index Fund
| | | Market |
| | | Value• |
| | Shares | ($000) |
* | Key Energy Services, Inc. | 110,787 | 638 |
| Atlas America, Inc. | 34,627 | 619 |
| Berry Petroleum Class A | 33,007 | 614 |
* | NATCO Group Inc. | 18,527 | 610 |
| Lufkin Industries, Inc. | 13,870 | 583 |
* | Goodrich Petroleum Corp. | 22,478 | 553 |
* | Contango Oil & Gas Co. | 12,800 | 544 |
* | USEC Inc. | 101,909 | 542 |
* | TETRA Technologies, Inc. | 67,753 | 539 |
* | Global Industries Ltd. | 93,625 | 530 |
* | International Coal | | |
| Group, Inc. | 183,283 | 524 |
* | Gulfmark Offshore, Inc. | 18,522 | 511 |
* | Patriot Coal Corp. | 78,136 | 498 |
* | Enbridge Energy | | |
| Management LLC | 13,179 | 478 |
* | Hornbeck Offshore | | |
| Services, Inc. | 21,036 | 450 |
| General Maritime Corp. | 45,348 | 448 |
* | BPZ Energy, Inc. | 90,630 | 443 |
* | Matrix Service Co. | 37,240 | 428 |
* | Swift Energy Co. | 25,463 | 424 |
* | Carrizo Oil & Gas, Inc. | 24,016 | 412 |
* | ATP Oil & Gas Corp. | 57,390 | 399 |
* | McMoRan Exploration Co. | 66,536 | 397 |
* | Brigham Exploration Co. | 111,766 | 390 |
* | Parker Drilling Co. | 88,256 | 383 |
* | Complete Production | | |
| Services, Inc. | 59,757 | 380 |
* | Cal Dive International, Inc. | 41,768 | 360 |
* | Willbros Group, Inc. | 28,800 | 360 |
* | ION Geophysical Corp. | 130,403 | 335 |
* | Hercules Offshore, Inc. | 84,243 | 334 |
* | Rosetta Resources, Inc. | 38,008 | 333 |
* | Dawson Geophysical Co. | 11,031 | 329 |
* | Stone Energy Corp. | 42,866 | 318 |
| Delek US Holdings, Inc. | 35,706 | 303 |
* | Vaalco Energy, Inc. | 70,465 | 298 |
* | James River Coal Co. | 18,749 | 284 |
* | Oilsands Quest, Inc. | 284,358 | 273 |
| Alon USA Energy, Inc. | 26,356 | 273 |
* | Allis-Chalmers Energy Inc. | 115,942 | 268 |
* | Basic Energy Services Inc. | 38,009 | 260 |
| Gulf Island Fabrication, Inc. | 15,184 | 240 |
* | Newpark Resources, Inc. | 80,183 | 229 |
* | Pioneer Drilling Co. | 45,533 | 218 |
^ | W&T Offshore, Inc. | 22,294 | 217 |
* | Western Refining, Inc. | 28,427 | 201 |
* | FX Energy, Inc. | 52,935 | 201 |
* | Approach Resources Inc. | 27,348 | 189 |
* | Credo Pete Corp. | 16,225 | 173 |
* | Endeavor International Corp. | 127,292 | 173 |
* | GMX Resources Inc. | 15,735 | 167 |
* | Petroleum | | |
| Development Corp. | 10,533 | 165 |
| RPC Inc. | 19,518 | 163 |
| | | Market |
| | | Value• |
| | Shares | ($000) |
* | Clayton Williams Energy, Inc. | 8,511 | 161 |
* | Geokinetics Inc. | 11,700 | 160 |
* | Delta Petroleum Corp. | 81,449 | 157 |
* | Evergreen Energy, Inc. | 154,122 | 151 |
* | PetroQuest Energy, Inc. | 38,060 | 140 |
| Crosstex Energy, Inc. | 33,324 | 139 |
* | Clean Energy Fuels Corp. | 16,100 | 139 |
* | Bronco Drilling Co., Inc. | 31,240 | 134 |
* | Natural Gas Services Group | 9,200 | 122 |
* | ENGlobal Corp. | 24,700 | 122 |
* | PHI Inc. Non-Voting Shares | 6,963 | 119 |
* | Harvest Natural | | |
| Resources, Inc. | 26,088 | 115 |
* | Abraxas Petroleum Corp. | 113,976 | 108 |
* | T-3 Energy Services, Inc. | 9,000 | 107 |
* | Veneco Inc. | 13,285 | 102 |
* | Double Eagle Petroleum Co. | 19,340 | 96 |
* | Cheniere Energy, Inc. | 31,466 | 93 |
* | Tesco Corp. | 10,100 | 80 |
* | Union Drilling, Inc. | 12,040 | 80 |
* | OYO Geospace Corp. | 2,929 | 75 |
* | Callon Petroleum Co. | 37,149 | 74 |
| Toreador Resources Corp. | 10,900 | 73 |
* | CVR Energy, Inc. | 9,600 | 70 |
* | Warren Resources Inc. | 26,047 | 64 |
* | Syntroleum Corp. | 28,304 | 63 |
* | Bolt Technology Corp. | 4,999 | 56 |
* | Gulfport Energy Corp. | 8,000 | 55 |
*,^ | SulphCo, Inc. | 53,850 | 50 |
* | Parallel Petroleum Corp. | 22,879 | 44 |
* | Harken Energy Corp. | 16,344 | 42 |
* | Boots & Coots International | | |
| Well Control, Inc. | 27,400 | 38 |
* | Westmoreland Coal Co. | 3,998 | 32 |
* | Rentech, Inc. | 52,445 | 30 |
* | Superior Well Services, Inc. | 4,900 | 29 |
* | American Oil & Gas Inc. | 26,800 | 27 |
* | The Meridian | | |
| Resource Corp. | 72,640 | 25 |
* | Verenium Corp. | 31,133 | 24 |
* | Mitcham Industries, Inc. | 4,000 | 21 |
* | Kodiak Oil & Gas Corp. | 17,400 | 19 |
* | Gasco Energy Inc. | 64,680 | 18 |
* | Trico Marine Services, Inc. | 4,901 | 17 |
| Panhandle Royalty Co. | 600 | 12 |
* | Cano Petroleum Inc. | 12,200 | 12 |
* | Pacific Ethanol, Inc. | 26,820 | 10 |
* | Uranium Resources Inc. | 7,500 | 10 |
| Barnwell Industries, Inc. | 1,802 | 7 |
* | RAM Energy Resources, Inc. | 3,700 | 3 |
| | | 1,043,916 |
Financials (14.3%) | | |
| JPMorgan Chase & Co. | 3,371,179 | 114,991 |
| Bank of America Corp. | 7,723,284 | 101,947 |
| Wells Fargo & Co. | 3,950,856 | 95,848 |
16
Institutional Total Stock Market Index Fund
| | | Market |
| | | Value• |
| | Shares | ($000) |
| The Goldman Sachs | | |
| Group, Inc. | 431,323 | 63,594 |
| U.S. Bancorp | 1,714,768 | 30,729 |
| Bank of New York | | |
| Mellon Corp. | 1,037,845 | 30,419 |
| Morgan Stanley | 1,063,782 | 30,328 |
* | Berkshire Hathaway Inc. | | |
| Class B | 8,636 | 25,008 |
| American Express Co. | 943,259 | 21,921 |
| The Travelers Cos., Inc. | 528,506 | 21,690 |
| MetLife, Inc. | 717,113 | 21,521 |
| State Street Corp. | 439,247 | 20,732 |
| CME Group, Inc. | 54,469 | 16,946 |
| Charles Schwab Corp. | 888,888 | 15,591 |
| PNC Financial | | |
| Services Group | 400,328 | 15,537 |
| Prudential Financial, Inc. | 412,032 | 15,336 |
| ACE Ltd. | 301,423 | 13,332 |
| AFLAC Inc. | 422,472 | 13,135 |
| Simon Property Group, Inc. | | |
| REIT | 250,912 | 12,904 |
| The Chubb Corp. | 321,382 | 12,817 |
| BB&T Corp. | 574,332 | 12,624 |
| The Allstate Corp. | 459,848 | 11,220 |
| Franklin Resources, Inc. | 147,298 | 10,607 |
| Northern Trust Corp. | 194,002 | 10,414 |
| T. Rowe Price Group Inc. | 231,271 | 9,637 |
| Marsh & McLennan | | |
| Cos., Inc. | 464,533 | 9,351 |
| Capital One Financial Corp. | 408,061 | 8,928 |
* | Progressive Corp. of Ohio | 580,902 | 8,777 |
| Loews Corp. | 314,532 | 8,618 |
| Aon Corp. | 219,226 | 8,302 |
^ | Citigroup Inc. | 2,768,537 | 8,223 |
| Public Storage, Inc. REIT | 114,788 | 7,516 |
| Annaly Capital | | |
| Management Inc. REIT | 491,800 | 7,446 |
| SunTrust Banks, Inc. | 420,030 | 6,909 |
| Invesco, Ltd. | 371,600 | 6,622 |
| NYSE Euronext | 239,398 | 6,524 |
| Vornado Realty Trust REIT | 142,495 | 6,417 |
* | Intercontinental- | | |
| Exchange Inc. | 55,752 | 6,369 |
| Boston Properties, Inc. | | |
| REIT | 123,475 | 5,890 |
| Hudson City Bancorp, Inc. | 426,887 | 5,673 |
| Ameriprise Financial, Inc. | 231,169 | 5,610 |
| Equity Residential REIT | 246,960 | 5,490 |
| The Principal Financial | | |
| Group, Inc. | 281,427 | 5,302 |
| HCP, Inc. REIT | 246,898 | 5,232 |
| Unum Group | 300,095 | 4,760 |
| Moody’s Corp. | 180,534 | 4,757 |
| People’s United | | |
| Financial Inc. | 315,355 | 4,743 |
| Fifth Third Bancorp | 656,487 | 4,661 |
| | | Market |
| | | Value• |
| | Shares | ($000) |
| Lincoln National Corp. | 267,500 | 4,604 |
| Host Hotels & Resorts Inc. | | |
| REIT | 537,589 | 4,510 |
| Plum Creek Timber Co. Inc. | | |
| REIT | 150,483 | 4,481 |
| Discover Financial Services | 435,199 | 4,469 |
* | SLM Corp. | 421,973 | 4,334 |
| Ventas, Inc. REIT | 141,057 | 4,212 |
* | TD Ameritrade | | |
| Holding Corp. | 237,144 | 4,159 |
| Avalonbay | | |
| Communities, Inc. REIT | 72,525 | 4,057 |
| Regions Financial Corp. | 994,158 | 4,016 |
| Everest Re Group, Ltd. | 55,673 | 3,985 |
| Willis Group Holdings Ltd. | 150,607 | 3,875 |
* | Berkshire Hathaway Inc. | | |
| Class A | 43 | 3,870 |
* | Leucadia National Corp. | 172,394 | 3,636 |
^ | M & T Bank Corp. | 68,836 | 3,506 |
| The Hartford Financial | | |
| Services Group Inc. | 293,705 | 3,486 |
| BlackRock, Inc. | 19,655 | 3,448 |
| XL Capital Ltd. Class A | 300,203 | 3,440 |
| Health Care Inc. REIT | 98,685 | 3,365 |
| KeyCorp | 635,801 | 3,332 |
| PartnerRe Ltd. | 51,230 | 3,327 |
| Axis Capital Holdings Ltd. | 121,725 | 3,187 |
| New York Community | | |
| Bancorp, Inc. | 295,895 | 3,163 |
| Kimco Realty Corp. REIT | 312,283 | 3,138 |
| Cincinnati Financial Corp. | 140,009 | 3,129 |
| Legg Mason Inc. | 127,887 | 3,118 |
| ProLogis REIT | 380,936 | 3,070 |
| Comerica, Inc. | 137,602 | 2,910 |
| Torchmark Corp. | 76,758 | 2,843 |
| W.R. Berkley Corp. | 131,610 | 2,826 |
| Federal Realty | | |
| Investment Trust REIT | 53,518 | 2,757 |
| Genworth Financial Inc. | 392,491 | 2,744 |
* | Nasdaq OMX Group, Inc. | 127,285 | 2,712 |
| Fidelity National | | |
| Financial, Inc. Class A | 200,413 | 2,712 |
| Eaton Vance Corp. | 99,785 | 2,669 |
| RenaissanceRe | | |
| Holdings Ltd. | 55,844 | 2,599 |
| Rayonier Inc. REIT | 71,497 | 2,599 |
| Assurant, Inc. | 106,928 | 2,576 |
| American International | | |
| Group, Inc. | 2,204,139 | 2,557 |
| HCC Insurance | | |
| Holdings, Inc. | 104,170 | 2,501 |
| Regency Centers Corp. | | |
| REIT | 71,617 | 2,500 |
| AMB Property Corp. REIT | 127,444 | 2,397 |
| Nationwide Health | | |
| Properties, Inc. REIT | 92,911 | 2,392 |
17
Institutional Total Stock Market Index Fund
| | | Market |
| | | Value• |
| | Shares | ($000) |
* | Markel Corp. | 8,482 | 2,389 |
| Digital Realty Trust, Inc. | | |
| REIT | 65,402 | 2,345 |
| First Horizon National Corp. | 194,581 | 2,335 |
| Reinsurance Group of | | |
| America, Inc. | 66,179 | 2,310 |
* | Arch Capital Group Ltd. | 38,454 | 2,253 |
| Cullen/Frost Bankers, Inc. | 48,705 | 2,246 |
* | The St. Joe Co. | 84,060 | 2,227 |
* | MSCI, Inc.-Class A Shares | 90,720 | 2,217 |
| SEI Investments Co. | 121,845 | 2,198 |
| Brown & Brown, Inc. | 109,647 | 2,185 |
* | Affiliated Managers | | |
| Group, Inc. | 37,427 | 2,178 |
| Old Republic | | |
| International Corp. | 213,232 | 2,100 |
| Transatlantic Holdings, Inc. | 48,064 | 2,083 |
| Realty Income Corp. REIT | 95,009 | 2,083 |
| Liberty Property Trust REIT | 89,496 | 2,062 |
| Huntington Bancshares Inc. | 493,159 | 2,061 |
| Waddell & Reed | | |
| Financial, Inc. | 77,177 | 2,035 |
| Federated Investors, Inc. | 83,481 | 2,011 |
| Chimera Investment Corp. | | |
| REIT | 552,242 | 1,927 |
* | Jefferies Group, Inc. | 89,078 | 1,900 |
| Arthur J. Gallagher & Co. | 88,035 | 1,879 |
| Commerce Bancshares, Inc. | 58,816 | 1,872 |
| First American Corp. | 71,293 | 1,847 |
* | CB Richard Ellis Group, Inc. | 195,702 | 1,832 |
| Senior Housing | | |
| Properties Trust REIT | 109,218 | 1,782 |
| The Hanover Insurance | | |
| Group Inc. | 46,225 | 1,762 |
| Duke Realty Corp. REIT | 193,152 | 1,694 |
| Aspen Insurance | | |
| Holdings Ltd. | 74,466 | 1,664 |
| White Mountains | | |
| Insurance Group Inc. | 7,225 | 1,654 |
| Janus Capital Group Inc. | 143,812 | 1,639 |
| Camden Property Trust REIT | 59,359 | 1,638 |
* | AmeriCredit Corp. | 120,403 | 1,631 |
| Mack-Cali Realty Corp. REIT | 69,203 | 1,578 |
| Bank of Hawaii Corp. | 43,501 | 1,559 |
| Allied World Assurance | | |
| Holdings, Ltd. | 38,173 | 1,559 |
| SL Green Realty Corp. REIT | 67,304 | 1,544 |
| Raymond James | | |
| Financial, Inc. | 89,701 | 1,544 |
| Essex Property Trust, Inc. | | |
| REIT | 24,265 | 1,510 |
| First Niagara Financial | | |
| Group, Inc. | 131,944 | 1,507 |
| American Financial | | |
| Group, Inc. | 68,078 | 1,469 |
| Marshall & Ilsley Corp. | 304,564 | 1,462 |
| | | Market |
| | | Value• |
| | Shares | ($000) |
| Weingarten Realty | | |
| Investors REIT | 99,837 | 1,449 |
| Corporate Office Properties | | |
| Trust, Inc. REIT | 49,364 | 1,448 |
| City National Corp. | 39,284 | 1,447 |
| Valley National Bancorp | 122,762 | 1,436 |
| Highwood Properties, Inc. | | |
| REIT | 63,719 | 1,425 |
| MFA Mortgage | | |
| Investments, Inc. REIT | 203,879 | 1,411 |
| TCF Financial Corp. | 104,273 | 1,394 |
| UDR, Inc. REIT | 134,828 | 1,393 |
| BancorpSouth, Inc. | 67,768 | 1,391 |
| Associated Banc-Corp. | 109,712 | 1,371 |
* | Alleghany Corp. | 4,973 | 1,348 |
* | ProAssurance Corp. | 28,771 | 1,330 |
* | Knight Capital Group, Inc. | | |
| Class A | 77,224 | 1,317 |
| Taubman Co. REIT | 48,690 | 1,308 |
| Endurance Specialty | | |
| Holdings Ltd. | 44,438 | 1,302 |
| Westamerica Bancorporation | 26,188 | 1,299 |
| Alexandria Real Estate | | |
| Equities, Inc. REIT | 35,853 | 1,283 |
| StanCorp Financial | | |
| Group, Inc. | 44,499 | 1,276 |
| FirstMerit Corp. | 74,473 | 1,265 |
| Assured Guaranty Ltd. | 101,044 | 1,251 |
| National Retail Properties | | |
| REIT | 71,988 | 1,249 |
| Jones Lang LaSalle Inc. | 37,717 | 1,234 |
| The Macerich Co. REIT | 70,085 | 1,234 |
| Platinum Underwriters | | |
| Holdings, Ltd. | 43,154 | 1,234 |
| Hospitality Properties Trust | | |
| REIT | 102,264 | 1,216 |
* | E*TRADE Financial Corp. | 949,061 | 1,215 |
| Washington REIT | 52,872 | 1,183 |
| IPC Holdings Ltd. | 42,518 | 1,162 |
| Zions Bancorp | 100,424 | 1,161 |
| Omega Healthcare | | |
| Investors, Inc. REIT | 74,606 | 1,158 |
| Prosperity Bancshares, Inc. | 38,156 | 1,138 |
| BRE Properties Inc. | | |
| Class A REIT | 46,748 | 1,111 |
| UMB Financial Corp. | 28,359 | 1,078 |
| Montpelier Re Holdings Ltd. | 80,050 | 1,064 |
| Washington Federal Inc. | 80,594 | 1,048 |
| American Campus | | |
| Communities, Inc. REIT | 46,300 | 1,027 |
* | Stifel Financial Corp. | 21,294 | 1,024 |
| Greenhill & Co., Inc. | 14,179 | 1,024 |
| Erie Indemnity Co. Class A | 28,288 | 1,012 |
| Home Properties, Inc. REIT | 29,557 | 1,008 |
| NewAlliance | | |
| Bancshares, Inc. | 87,308 | 1,004 |
18
Institutional Total Stock Market Index Fund
| | | Market |
| | | Value• |
| | Shares | ($000) |
* | Signature Bank | 36,461 | 989 |
| Redwood Trust, Inc. REIT | 65,563 | 968 |
| Apartment Investment & | | |
| Management Co. Class A | | |
| REIT | 108,126 | 957 |
| Mid-America Apartment | | |
| Communities, Inc. REIT | 26,018 | 955 |
| CapitalSource Inc. | 195,541 | 954 |
| Hatteras Financial Corp. | | |
| REIT | 33,168 | 948 |
| Tanger Factory Outlet | | |
| Centers, Inc. REIT | 29,183 | 946 |
| Healthcare Realty Trust Inc. | | |
| REIT | 54,895 | 924 |
| TFS Financial Corp. | 85,820 | 911 |
* | PHH Corp. | 49,882 | 907 |
| BioMed Realty Trust, Inc. | | |
| REIT | 87,945 | 900 |
| Equity Lifestyle | | |
| Properties, Inc. REIT | 23,991 | 892 |
| Protective Life Corp. | 77,367 | 885 |
| Potlatch Corp. REIT | 35,801 | 870 |
| Trustmark Corp. | 44,833 | 866 |
| Wilmington Trust Corp. | 63,401 | 866 |
| Brandywine Realty Trust | | |
| REIT | 113,658 | 847 |
| HRPT Properties Trust | | |
| REIT | 207,407 | 842 |
| Mercury General Corp. | 25,091 | 839 |
| Glacier Bancorp, Inc. | 56,776 | 839 |
| Fulton Financial Corp. | 160,760 | 838 |
* | KBW Inc. | 29,116 | 837 |
| Tower Group, Inc. | 33,593 | 832 |
| PrivateBancorp, Inc. | 36,793 | 818 |
* | SVB Financial Group | 29,860 | 813 |
| Max Re Capital Ltd. | 43,888 | 810 |
| BOK Financial Corp. | 21,466 | 809 |
* | Investment Technology | | |
| Group, Inc. | 39,484 | 805 |
| Douglas Emmett, Inc. REIT | 89,530 | 805 |
| Kilroy Realty Corp. REIT | 38,668 | 794 |
| Apollo Investment Corp. | 131,455 | 789 |
| Delphi Financial Group, Inc. | 40,378 | 785 |
* | Argo Group | | |
| International Holdings | 27,711 | 782 |
| Odyssey Re Holdings Corp. | 19,471 | 778 |
| First Financial | | |
| Bankshares, Inc. | 15,395 | 775 |
| Capitol Federal Financial | 20,198 | 774 |
| Synovus Financial Corp. | 257,692 | 770 |
| EastGroup Properties, Inc. | | |
| REIT | 23,278 | 769 |
| CIT Group Inc. | 352,466 | 758 |
| DCT Industrial Trust Inc. | | |
| REIT | 184,998 | 755 |
| | | Market |
| | | Value• |
| | Shares | ($000) |
| Zenith National | | |
| Insurance Corp. | 34,697 | 754 |
| R.L.I. Corp. | 16,700 | 748 |
| Capstead Mortgage Corp. | | |
| REIT | 58,446 | 743 |
* | Piper Jaffray Cos., Inc. | 16,969 | 741 |
| Franklin Street | | |
| Properties Corp. REIT | 55,317 | 733 |
| United Bankshares, Inc. | 37,443 | 732 |
| Ares Capital Corp. | 90,439 | 729 |
| Allied Capital Corp. | 207,574 | 722 |
^ | Validus Holdings, Ltd. | 32,687 | 718 |
| Hancock Holding Co. | 21,853 | 710 |
| LaSalle Hotel Properties | | |
| REIT | 57,231 | 706 |
| PS Business Parks, Inc. | | |
| REIT | 14,173 | 687 |
| Forest City Enterprise | | |
| Class A | 102,447 | 676 |
| Entertainment | | |
| Properties Trust REIT | 32,321 | 666 |
| NBT Bancorp, Inc. | 30,319 | 658 |
| Anworth Mortgage | | |
| Asset Corp. REIT | 90,725 | 654 |
* | MBIA, Inc. | 150,753 | 653 |
| optionsXpress Holdings Inc. | 41,602 | 646 |
| Astoria Financial Corp. | 75,300 | 646 |
| F.N.B. Corp. | 102,927 | 637 |
| IBERIABANK Corp. | 16,029 | 632 |
| Extra Space Storage Inc. | | |
| REIT | 75,285 | 629 |
| Selective Insurance Group | 49,011 | 626 |
* | Ocwen Financial Corp. | 48,194 | 625 |
^ | American Capital Ltd. | 193,484 | 621 |
| National Health Investors | | |
| REIT | 23,188 | 619 |
| Cash America | | |
| International Inc. | 26,327 | 616 |
| Employers Holdings, Inc. | 45,411 | 615 |
| CBL & Associates | | |
| Properties, Inc. REIT | 114,078 | 615 |
| City Holding Co. | 20,218 | 614 |
| DiamondRock | | |
| Hospitality Co. REIT | 96,247 | 602 |
| Old National Bancorp | 60,373 | 593 |
| Community Bank | | |
| System, Inc. | 40,593 | 591 |
| Fannie Mae | 1,018,833 | 591 |
| Developers Diversified | | |
| Realty Corp. REIT | 120,369 | 587 |
^ | Park National Corp. | 10,265 | 580 |
* | Navigators Group, Inc. | 12,995 | 577 |
* | Interactive Brokers | | |
| Group, Inc. | 37,000 | 575 |
| Cathay General Bancorp | 60,356 | 574 |
| Acadia Realty Trust REIT | 43,751 | 571 |
19
Institutional Total Stock Market Index Fund
| | | Market |
| | | Value• |
| | Shares | ($000) |
| Whitney Holdings Corp. | 60,978 | 559 |
| Chemical Financial Corp. | 28,018 | 558 |
| Unitrin, Inc. | 46,316 | 557 |
| First Citizens BancShares | | |
| Class A | 4,149 | 555 |
* | MF Global Ltd. | 92,707 | 550 |
^ | Popular, Inc. | 246,500 | 542 |
^ | Equity One, Inc. REIT | 40,572 | 538 |
| Post Properties, Inc. REIT | 40,008 | 538 |
| Bank Mutual Corp. | 61,593 | 537 |
* | Dollar Financial Corp. | 38,921 | 537 |
| TrustCo Bank NY | 90,418 | 534 |
| First Midwest Bancorp, Inc. | 72,558 | 530 |
| Brookline Bancorp, Inc. | 56,295 | 525 |
| Independent Bank Corp. | | |
| (MA) | 26,455 | 521 |
* | Conseco, Inc. | 217,069 | 514 |
| International | | |
| Bancshares Corp. | 49,647 | 512 |
* | Hilltop Holdings Inc. | 42,437 | 504 |
| MGIC Investment Corp. | 113,085 | 498 |
| Community Trust | | |
| Bancorp Inc. | 18,565 | 497 |
| MB Financial, Inc. | 48,294 | 492 |
| East West Bancorp, Inc. | 74,879 | 486 |
| National Penn | | |
| Bancshares Inc. | 104,655 | 482 |
| Sovran Self Storage, Inc. | | |
| REIT | 19,581 | 482 |
| Investors Real Estate Trust | | |
| REIT | 54,171 | 482 |
* | Portfolio Recovery | | |
| Associates, Inc. | 12,395 | 480 |
| Cousins Properties, Inc. REIT | 55,553 | 472 |
| Financial Federal Corp. | 22,958 | 472 |
| Infinity Property & | | |
| Casualty Corp. | 12,841 | 468 |
| Bank of the Ozarks, Inc. | 21,556 | 466 |
* | PICO Holdings, Inc. | 16,146 | 463 |
| First BanCorp Puerto Rico | 113,643 | 449 |
| Provident Financial | | |
| Services Inc. | 48,800 | 444 |
| Provident New York | | |
| Bancorp, Inc. | 54,391 | 442 |
| First Commonwealth | | |
| Financial Corp. | 69,580 | 441 |
| Arrow Financial Corp. | 16,317 | 441 |
| American Physicians | | |
| Capital, Inc. | 11,082 | 434 |
| Calamos Asset | | |
| Management, Inc. | 30,527 | 431 |
| Umpqua Holdings Corp. | 55,252 | 429 |
| Boston Private Financial | | |
| Holdings, Inc. | 95,653 | 429 |
* | Amerisafe Inc. | 27,389 | 426 |
| Saul Centers, Inc. REIT | 14,379 | 425 |
| | | Market |
| | | Value• |
| | Shares | ($000) |
| Alexander’s, Inc. REIT | 1,558 | 420 |
| American Equity Investment | | |
| Life Holding Co. | 74,687 | 417 |
| Southside Bancshares, Inc. | 18,197 | 416 |
| Sterling Bancshares, Inc. | 64,609 | 409 |
| Camden National Corp. | 12,006 | 409 |
| Wintrust Financial Corp. | 25,395 | 408 |
| GFI Group Inc. | 58,296 | 393 |
| Susquehanna | | |
| Bancshares, Inc. | 78,809 | 385 |
| Home Bancshares Inc. | 20,228 | 385 |
| Gamco Investors Inc. Class A | 7,908 | 384 |
* | Investors Bancorp, Inc. | 41,463 | 380 |
| Amtrust Financial | | |
| Services Inc. | 32,638 | 372 |
| Dime Community | | |
| Bancshares | 40,724 | 371 |
| Inland Real Estate Corp. | | |
| REIT | 52,924 | 370 |
* | Freddie Mac | 593,998 | 368 |
| CVB Financial Corp. | 61,576 | 368 |
| Republic Bancorp, Inc. | | |
| Class A | 16,188 | 366 |
| Evercore Partners Inc. | 18,600 | 365 |
| Renasant Corp. | 24,182 | 363 |
| BancFirst Corp. | 10,479 | 362 |
| Ambac Financial Group, Inc. | 391,920 | 361 |
| Berkshire Hills Bancorp, Inc. | 17,290 | 359 |
| Harleysville Group, Inc. | 12,715 | 359 |
^ | United Community | | |
| Banks, Inc. | 59,869 | 359 |
| First Financial Bancorp | 47,456 | 357 |
* | First Cash Financial | | |
| Services, Inc. | 20,300 | 356 |
^ | First Busey Corp. | 48,074 | 353 |
^ | Capital City Bank Group, Inc. | 20,948 | 353 |
| Cohen & Steers, Inc. | 23,459 | 351 |
| Horace Mann | | |
| Educators Corp. | 35,092 | 350 |
* | World Acceptance Corp. | 17,421 | 347 |
| BGC Partners, Inc. | 90,743 | 344 |
* | LaBranche & Co. Inc. | 79,493 | 342 |
| Webster Financial Corp. | 42,354 | 341 |
| Northwest Bancorp, Inc. | 17,916 | 338 |
| ViewPoint Financial Group | 21,833 | 333 |
* | Encore Capital Group, Inc. | 24,807 | 329 |
| Ames National Corp. | 13,400 | 327 |
| Columbia Banking | | |
| System, Inc. | 31,800 | 325 |
| Advance America, | | |
| Cash Advance Centers, Inc. | 72,407 | 321 |
| Capital Southwest Corp. | 4,399 | 318 |
^ | iStar Financial Inc. REIT | 111,398 | 316 |
| Ashford Hospitality Trust | | |
| REIT | 112,378 | 316 |
* | Citizens, Inc. | 51,630 | 314 |
20
Institutional Total Stock Market Index Fund
| | | Market |
| | | Value• |
| | Shares | ($000) |
| Abington Community | | |
| Bancorp Inc. | 38,972 | 310 |
| Safety Insurance Group, Inc. | 10,094 | 308 |
| BankFinancial Corp. | 34,189 | 303 |
| WesBanco, Inc. | 20,721 | 301 |
* | Beneficial Mutual | | |
| Bancorp, Inc. | 31,324 | 301 |
| BlackRock Kelso | | |
| Capital Corp. | 48,184 | 300 |
| Cardinal Financial Corp. | 38,323 | 300 |
| SWS Group, Inc. | 21,292 | 297 |
* | EZCORP, Inc. | 27,565 | 297 |
| Bryn Mawr Bank Corp. | 15,734 | 297 |
* | Riskmetrics Group Inc. | 16,736 | 296 |
| United Fire & Casualty Co. | 17,068 | 293 |
| Baldwin & Lyons, Inc. | | |
| Class B | 14,729 | 290 |
| FBL Financial Group, Inc. | | |
| Class A | 35,122 | 290 |
| Presidential Life Corp. | 38,193 | 289 |
* | FPIC Insurance Group, Inc. | 9,419 | 288 |
| Hercules Technology | | |
| Growth Capital, Inc. | 34,214 | 286 |
* | Texas Capital | | |
| Bancshares, Inc. | 18,457 | 286 |
| Harleysville National Corp. | 60,687 | 285 |
| Kearny Financial Corp. | 24,900 | 285 |
| CoBiz Inc. | 44,119 | 283 |
| S & T Bancorp, Inc. | 22,862 | 278 |
| PacWest Bancorp | 21,027 | 277 |
| Radian Group, Inc. | 101,046 | 275 |
* | Forestar Real Estate | | |
| Group, Inc. | 22,964 | 273 |
| Gladstone Capital Corp. | 35,385 | 266 |
| Oriental Financial Group Inc. | 27,085 | 263 |
| Simmons First National Corp. | 9,812 | 262 |
* | Asset Acceptance | | |
| Capital Corp. | 34,066 | 262 |
| First Merchants Corp. | 32,178 | 258 |
| Medical Properties Trust Inc. | | |
| REIT | 42,292 | 257 |
| First Financial Holdings, Inc. | 26,844 | 252 |
| The Phoenix Cos., Inc. | 149,330 | 249 |
* | Avatar Holding, Inc. | 13,699 | 249 |
| Walter Investment | | |
| Management Corp. REIT | 18,301 | 243 |
* | Pinnacle Financial | | |
| Partners, Inc. | 18,204 | 242 |
* | Cowen Group, Inc. | 28,197 | 235 |
| Colonial Properties Trust | | |
| REIT | 31,351 | 232 |
| S.Y. Bancorp, Inc. | 9,597 | 232 |
| Clifton Savings Bancorp, Inc. | 21,108 | 227 |
| LTC Properties, Inc. REIT | 11,070 | 226 |
| Heartland Financial USA, Inc. | 15,845 | 226 |
| Ameris Bancorp | 34,951 | 221 |
| | | Market |
| | | Value• |
| | Shares | ($000) |
| Sunstone Hotel | | |
| Investors, Inc. REIT | 41,216 | 220 |
| Sierra Bancorp | 17,176 | 217 |
* | TradeStation Group, Inc. | 25,140 | 213 |
| Agree Realty Corp. REIT | 11,533 | 211 |
* | Nelnet, Inc. | 15,546 | 211 |
* | United America | | |
| Indemnity, Ltd. | 43,942 | 210 |
| Meadowbrook Insurance | | |
| Group, Inc. | 32,135 | 210 |
| Cedar Shopping | | |
| Centers, Inc. REIT | 46,020 | 208 |
| American National | | |
| Bankshares Inc. | 10,649 | 205 |
* | MarketAxess Holdings, Inc. | 21,512 | 205 |
| Bancorp Rhode Island Inc. | 10,295 | 203 |
| EMC Insurance Group, Inc. | 9,739 | 203 |
| Consolidated-Tomoka | | |
| Land Co. | 5,767 | 202 |
| Lakeland Financial Corp. | 10,564 | 201 |
| Central Pacific Financial Co. | 53,485 | 201 |
| U.S. Global Investors, Inc. | | |
| Class A | 21,126 | 196 |
| First Source Corp. | 11,321 | 196 |
| Donegal Group Inc. Class A | 12,779 | 194 |
| SCBT Financial Corp. | 8,135 | 193 |
| DuPont Fabros | | |
| Technology Inc. REIT | 20,057 | 189 |
| Lakeland Bancorp, Inc. | 20,733 | 186 |
| StellarOne Corp. | 14,325 | 186 |
| Getty Realty Holding Corp. | | |
| REIT | 9,776 | 184 |
| National Financial | | |
| Partners Corp. | 25,138 | 184 |
^ | Colonial BancGroup, Inc. | 293,432 | 182 |
| Sanders Morris Harris | | |
| Group Inc. | 33,002 | 182 |
| National Western Life | | |
| Insurance Co. Class A | 1,554 | 181 |
| Strategic Hotels and | | |
| Resorts, Inc. REIT | 160,573 | 178 |
| Associated Estates | | |
| Realty Corp. REIT | 29,102 | 173 |
| Essa Bancorp Inc. | 12,601 | 172 |
| First Bancorp (NC) | 10,861 | 170 |
| Medallion Financial Corp. | 22,087 | 169 |
| First Industrial Realty Trust | | |
| REIT | 38,550 | 168 |
* | Western Alliance Bancorp | 24,363 | 167 |
| First Community | | |
| Bancshares, Inc. | 12,944 | 166 |
| First Financial Corp. (IN) | 5,230 | 165 |
* | FCStone Group, Inc. | 41,370 | 163 |
| Flagstone Reinsurance | | |
| Holdings Ltd. | 15,819 | 163 |
* | Greenlight Capital Re. Ltd. | 9,349 | 162 |
21
Institutional Total Stock Market Index Fund
| | | Market |
| | | Value• |
| | Shares | ($000) |
| Universal Health | | |
| Realty Income REIT | 5,061 | 160 |
| Prospect Energy Corp. | 17,300 | 159 |
* | eHealth, Inc. | 8,900 | 157 |
| Stewart Information | | |
| Services Corp. | 10,956 | 156 |
| Lexington Realty Trust REIT | 45,690 | 155 |
| Westfield Financial, Inc. | 17,135 | 155 |
| Enterprise Financial | | |
| Services Corp. | 16,823 | 153 |
| Flushing Financial Corp. | 16,352 | 153 |
| TowneBank | 10,801 | 151 |
| Great Southern | | |
| Bancorp, Inc. | 7,353 | 151 |
* | CNA Surety Corp. | 10,946 | 148 |
| MCG Capital Corp. | 59,899 | 146 |
| Banner Corp. | 38,092 | 146 |
| Ameriserv Financial Inc. | 80,052 | 144 |
| TriCo Bancshares | 9,242 | 143 |
* | FBR Capital Markets Corp. | 30,106 | 141 |
| Danvers Bancorp, Inc. | 10,509 | 141 |
| Pacific Capital Bancorp | 64,227 | 137 |
| Tompkins Trustco, Inc. | 2,860 | 137 |
* | Republic First Bancorp, Inc. | 17,473 | 136 |
| First Potomac REIT | 13,781 | 134 |
| Pennsylvania REIT | 26,850 | 134 |
| Duff & Phelps Corp. | 7,500 | 133 |
* | Tejon Ranch Co. | 4,965 | 132 |
| First of Long Island Corp. | 5,666 | 131 |
| Sandy Spring Bancorp, Inc. | 8,852 | 130 |
| First Mercury Financial Corp. | 9,448 | 130 |
^ | Life Partners Holdings | 9,150 | 130 |
| Compass Diversified Trust | 15,947 | 129 |
| OneBeacon Insurance | | |
| Group Ltd. | 11,000 | 129 |
| BRT Realty Trust REIT | 28,113 | 127 |
* | Marlin Business | | |
| Services Inc. | 22,538 | 126 |
* | Guaranty Bancorp | 65,579 | 125 |
^ | UCBH Holdings, Inc. | 98,218 | 124 |
| Washington Trust | | |
| Bancorp, Inc. | 6,878 | 123 |
| Alesco Financial, Inc. REIT | 153,542 | 121 |
| Resource America, Inc. | 22,502 | 121 |
| Center Bancorp, Inc. | 14,729 | 120 |
| The PMI Group Inc. | 60,473 | 120 |
* | Citizens Banking Corp. | 165,257 | 117 |
| State Auto Financial Corp. | 6,702 | 117 |
| NYMAGIC, Inc. | 8,297 | 115 |
* | Metro Bancorp Inc. | 5,972 | 115 |
* | Crawford & Co. Class B | 23,931 | 115 |
| U-Store-It Trust REIT | 23,422 | 115 |
* | International Assets | | |
| Holding Corp. | 7,661 | 114 |
| FelCor Lodging Trust, Inc. | | |
| REIT | 46,270 | 114 |
| | | Market |
| | | Value• |
| | Shares | ($000) |
| Parkway Properties Inc. | | |
| REIT | 8,710 | 113 |
| The South Financial | | |
| Group, Inc. | 92,293 | 110 |
| Urstadt Biddle Properties | | |
| Class A REIT | 7,698 | 108 |
| Suffolk Bancorp | 4,176 | 107 |
*,^ | CompuCredit Corp. | 46,124 | 106 |
* | Safeguard Scientifics, Inc. | 80,067 | 106 |
| OceanFirst Financial Corp. | 8,524 | 102 |
| Education Realty Trust, Inc. | | |
| REIT | 23,305 | 100 |
| American Capital | | |
| Agency Corp. REIT | 4,300 | 99 |
| Capitol Bancorp Ltd. | 37,216 | 99 |
| German American Bancorp | 6,816 | 98 |
| Sterling Financial Corp. | 32,946 | 96 |
| First Defiance Financial Corp. | 7,312 | 95 |
* | Rewards Network Inc. | 24,822 | 94 |
| Univest Corp. | | |
| of Pennsylvania | 4,594 | 93 |
* | American Safety Insurance | | |
| Holdings, Ltd. | 6,800 | 93 |
| Merchants Bancshares, Inc. | 4,126 | 92 |
* | The First Marblehead Corp. | 44,916 | 91 |
| Sun Communities, Inc. REIT | 6,380 | 88 |
* | Penson Worldwide, Inc. | 9,728 | 87 |
* | Oritani Financial Corp. | 6,311 | 87 |
* | Bank of Florida Corp. | 27,322 | 86 |
| Financial Institutions, Inc. | 6,247 | 85 |
| Cascade Financial Corp. | 36,647 | 79 |
| Northfield Bancorp, Inc. | 6,797 | 79 |
| ASTA Funding, Inc. | 14,455 | 79 |
| Alliance Financial Corp. | 2,711 | 77 |
^ | Arbor Realty Trust, Inc. REIT | 43,381 | 76 |
| Century Bancorp, Inc. | | |
| Class A | 4,105 | 76 |
| WSFS Financial Corp. | 2,698 | 74 |
* | American | | |
| Independence Corp. | 15,579 | 72 |
^ | City Bank Lynnwood (WA) | 30,530 | 72 |
* | PMA Capital Corp. Class A | 15,832 | 72 |
^ | BancTrust Financial | | |
| Group, Inc. | 23,803 | 71 |
| BankAtlantic Bancorp, Inc. | | |
| Class A | 18,338 | 71 |
| MVC Capital, Inc. | 8,360 | 71 |
* | Ladenburg Thalmann | | |
| Financial Services, Inc. | 129,695 | 70 |
^ | Frontier Financial Corp. | 57,565 | 70 |
| Comm Bancorp, Inc. | 1,769 | 69 |
| CFS Bancorp, Inc. | 16,281 | 69 |
| Hanmi Financial Corp. | 39,333 | 69 |
| Investors Title Co. | 2,504 | 67 |
| Union Bankshares Corp. | 4,439 | 66 |
22
Institutional Total Stock Market Index Fund
| | | Market |
| | | Value• |
| | Shares | ($000) |
| Eastern Virginia | | |
| Bankshares, Inc. | 7,487 | 65 |
| Anthracite Capital Inc. REIT | 103,015 | 64 |
| Citizens & Northern Corp. | 3,103 | 64 |
* | Broadpoint Gleacher | | |
| Securities Inc. | 11,238 | 63 |
| NorthStar Realty | | |
| Finance Corp. REIT | 22,084 | 62 |
* | First Acceptance Corp. | 28,851 | 61 |
| Amcore Financial, Inc. | 74,930 | 61 |
* | Credit Acceptance Corp. | 2,800 | 61 |
| Kite Realty Group Trust REIT | 20,750 | 61 |
| CapLease, Inc. REIT | 21,720 | 60 |
| Sterling Bancorp | 7,171 | 60 |
| Student Loan Corp. | 1,609 | 60 |
* | Virtus Investment | | |
| Partners Inc. | 4,016 | 59 |
* | United PanAm | | |
| Financial Corp. | 16,541 | 59 |
| First Financial Northwest, Inc. | 7,500 | 59 |
^ | Cascade Bancorp | 41,579 | 59 |
| Mission West Properties Inc. | | |
| REIT | 8,567 | 59 |
| Federal Agricultural | | |
| Mortgage Corp. Class C | 12,037 | 58 |
* | Ampal-American Israel Corp. | 23,328 | 57 |
| Anchor Bancorp | | |
| Wisconsin Inc. | 42,747 | 56 |
| Glimcher Realty Trust REIT | 18,562 | 54 |
* | Reis, Inc. | 13,650 | 53 |
| Peoples Bancorp, Inc. | 3,062 | 52 |
| K-Fed Bancorp | 5,582 | 51 |
| LSB Corp. | 4,999 | 51 |
| Mainsource Financial | | |
| Group, Inc. | 6,687 | 50 |
| Ramco-Gershenson | | |
| Properties Trust REIT | 4,805 | 48 |
| Colony Bankcorp, Inc. | 6,706 | 48 |
| Capital Bank Corp. | 10,018 | 48 |
* | Seabright Insurance | | |
| Holdings, Inc. | 4,633 | 47 |
| ESB Financial Corp. | 3,558 | 47 |
| First Place Financial Corp. | 14,747 | 46 |
| Winthrop Realty Trust REIT | 5,127 | 46 |
| Atlantic Coast Federal Corp. | 22,599 | 43 |
* | Tree.com, Inc. | 4,454 | 43 |
| Shore Bancshares, Inc. | 2,379 | 43 |
| Ameriana Bancorp | 11,143 | 43 |
| VIST Financial Corp. | 6,411 | 42 |
| Southwest Bancorp, Inc. | 4,254 | 42 |
| Cadence Financial Corp. | 18,300 | 41 |
| Gramercy Capital Corp. REIT | 24,868 | 40 |
| Center Financial Corp. | 15,249 | 38 |
* | First State Bancorporation | 19,054 | 37 |
| Smithtown Bancorp, Inc. | 2,863 | 37 |
| RAIT Financial Trust REIT | 26,606 | 36 |
| | | Market |
| | | Value• |
| | Shares | ($000) |
| First South Bancorp, Inc. | 3,129 | 36 |
* | Meridian Interstate | | |
| Bancorp, Inc. | 4,724 | 35 |
* | Arlington Asset | | |
| Investment Corp. | | |
| Class A Shares REIT | 92,285 | 35 |
| Nara Bancorp, Inc. | 6,629 | 34 |
| Centerstate Banks of Florida | 4,571 | 34 |
| Westwood Holdings | | |
| Group, Inc. | 777 | 32 |
^ | Capital Trust Class A REIT | 22,139 | 32 |
| North Valley Bancorp | 6,436 | 32 |
| Bank of Granite Corp. | 9,915 | 30 |
| Farmers Capital Bank Corp. | 1,180 | 30 |
| Kayne Anderson Energy | | |
| Development Co. | 2,200 | 29 |
* | Primus Guaranty, Ltd. | 12,300 | 29 |
| Monmouth Real Estate | | |
| Investment Corp. REIT | 4,736 | 28 |
| Wilshire Bancorp Inc. | 4,798 | 28 |
| PMC Commercial Trust REIT | 3,875 | 26 |
^ | Old Second Bancorp, Inc. | 4,202 | 25 |
| Hersha Hospitality Trust REIT | 9,885 | 25 |
| UMH Properties, Inc. REIT | 3,070 | 24 |
| Peapack Gladstone | | |
| Financial Corp. | 1,263 | 24 |
* | Sun Bancorp, Inc. (NJ) | 4,671 | 24 |
* | NewStar Financial, Inc. | 12,108 | 23 |
| Greene County Bancshares | 5,147 | 23 |
| Meta Financial Group, Inc. | 1,049 | 23 |
^ | W Holding Co., Inc. | 1,569 | 22 |
| PremierWest Bancorp | 6,453 | 22 |
* | Waterstone Financial, Inc. | 7,200 | 21 |
| Gladstone Investment Corp. | 4,400 | 21 |
| NGP Capital Resources Co. | 3,600 | 21 |
* | Maguire Properties, Inc. | | |
| REIT | 24,623 | 21 |
* | Flagstar Bancorp, Inc. | 30,609 | 21 |
| First United Corp. | 1,815 | 20 |
| Camco Financial Corp. | 8,512 | 20 |
*,^ | Corus Bankshares Inc. | 72,982 | 20 |
^ | Newcastle Investment Corp. | | |
| REIT | 30,001 | 20 |
| Citizens South Banking Corp. | 3,809 | 20 |
| Rome Bancorp, Inc. | 2,312 | 19 |
* | First Keystone Financial, Inc. | 2,063 | 19 |
| First M&F Corp. | 4,667 | 19 |
| Heritage Commerce Corp. | 5,040 | 19 |
| Heritage Financial Corp. | 1,610 | 19 |
| NewBridge Bancorp. | 8,425 | 17 |
| West Bancorporation | 3,478 | 17 |
* | The Bancorp Inc. | 2,757 | 17 |
* | Consumer Portfolio | | |
| Services, Inc. | 27,451 | 16 |
* | Pacific Mercantile Bancorp | 3,238 | 14 |
| Mercantile Bank Corp. | 4,011 | 13 |
23
Institutional Total Stock Market Index Fund
| | | Market |
| | | Value• |
| | Shares | ($000) |
* | Irwin Financial Corp. | 18,070 | 13 |
* | Maui Land & | | |
| Pineapple Co., Inc. | 1,676 | 13 |
* | Macatawa Bank Corp. | 4,554 | 13 |
| Independent Bank Corp. (MI) | 9,627 | 13 |
| Provident Financial | | |
| Holdings, Inc. | 2,290 | 13 |
| Wainwright Bank & Trust Co. | 1,613 | 13 |
| Grubb & Ellis Co. | 15,294 | 12 |
| Fifth Street Finance Corp. | 1,216 | 12 |
* | Deerfield Capital Corp. | 2,543 | 11 |
* | AmericanWest | | |
| Bancorporation | 20,121 | 11 |
| Pulaski Financial Corp. | 1,691 | 11 |
| TF Financial Corp. | 616 | 11 |
| Preferred Bank | 2,850 | 11 |
| Kansas City Life | | |
| Insurance Co. | 400 | 11 |
| TierOne Corp. | 5,200 | 11 |
| Seacoast Banking Corp. | | |
| of Florida | 4,404 | 11 |
* | Stratus Properties Inc. | 1,599 | 10 |
| National Interstate Corp. | 660 | 10 |
* | First Regional Bancorp | 7,914 | 10 |
| HopFed Bancorp, Inc. | 1,005 | 10 |
* | BCSB Bancorp, Inc. | 1,195 | 10 |
| West Coast Bancorp | 4,749 | 10 |
* | Community Bancorp | 10,370 | 10 |
* | Virginia Commerce | | |
| Bancorp, Inc. | 4,186 | 10 |
| Advanta Corp. Class B | 22,200 | 9 |
| Jefferson Bancshares, Inc. | 1,600 | 9 |
* | Citizens First Bancorp, Inc. | 11,243 | 9 |
* | Guaranty Financial | | |
| Group, Inc. | 47,664 | 9 |
* | United Community | | |
| Financial Corp. | 7,545 | 8 |
| First Financial Service Corp. | 438 | 8 |
| Codorus Valley Bancorp, Inc. | 1,184 | 7 |
| Hampton Roads | | |
| Bankshares, Inc. | 900 | 7 |
| Resource Capital Corp. REIT | 2,172 | 7 |
| Middleburg Financial Corp. | 500 | 7 |
| First Federal Bancshares of | | |
| Arkansas, Inc. | 1,606 | 6 |
| One Liberty Properties, Inc. | | |
| REIT | 1,086 | 6 |
| Cogdell Spencer Inc. REIT | 1,400 | 6 |
| HMN Financial, Inc. | 1,711 | 6 |
| Firstbank Corp. | 820 | 6 |
| Integra Bank Corp. | 4,988 | 6 |
| Indiana Community Bancorp | 438 | 6 |
| Bridge Bancorp, Inc. | 200 | 5 |
| Midwest Banc Holdings, Inc. | 6,867 | 5 |
| Unity Bancorp, Inc. | 1,310 | 5 |
| MutualFirst Financial Inc. | 500 | 4 |
| | | Market |
| | | Value• |
| | Shares | ($000) |
| FNB Corp. (NC) | 1,696 | 4 |
| Horizon Financial Corp. | 3,785 | 4 |
| HF Financial Corp. | 347 | 4 |
| Wayne Savings | | |
| Bancshares, Inc. | 673 | 4 |
* | AMV Liquidating Trust | 34,500 | 4 |
| Federal Agricultural | | |
| Mortgage Corp. Class A | 1,021 | 4 |
| Northrim Bancorp Inc. | 256 | 4 |
* | Royal Bancshares | | |
| of Pennsylvania, Inc. | 1,768 | 3 |
* | Northern States | | |
| Financial Corp. | 599 | 3 |
* | Specialty Underwriters’ | | |
| Alliance, Inc. | 500 | 3 |
* | Superior Bancorp | 1,211 | 3 |
| Peoples Financial Corp. | 166 | 3 |
| Timberland Bancorp, Inc. | 706 | 3 |
| Parkvale Financial Corp. | 316 | 3 |
| State Bancorp, Inc. | 330 | 2 |
| Thomas Properties | | |
| Group, Inc. | 1,100 | 2 |
| Advanta Corp. Class A | 3,855 | 2 |
| Princeton National | | |
| Bancorp, Inc. | 100 | 1 |
* | Security Bank Corp. | 2,998 | 1 |
| Habersham Bancorp | 395 | 1 |
* | TIB Financial Corp. | 391 | 1 |
| 21st Century Holding Co. | 282 | 1 |
| Brooklyn Federal Bancorp | 44 | — |
| MetroCorp Bancshares, Inc. | 159 | — |
* | Harrington West | | |
| Financial Group, Inc. | 351 | — |
* | Valley National Bankcorp | | |
| Warrants Exp. 6/30/15 | 240 | — |
* | Teton Advisors Inc. Class B | 143 | — |
| Patriot Capital Funding Inc. | 10 | — |
| | | 1,297,670 |
Health Care (13.7%) | | |
| Johnson & Johnson | 2,497,842 | 141,877 |
| Pfizer Inc. | 6,091,890 | 91,378 |
| Abbott Laboratories | 1,395,628 | 65,650 |
| Wyeth | 1,202,373 | 54,576 |
| Merck & Co., Inc. | 1,909,351 | 53,385 |
* | Amgen Inc. | 945,523 | 50,056 |
* | Gilead Sciences, Inc. | 822,801 | 38,540 |
| Schering-Plough Corp. | 1,469,292 | 36,909 |
| Bristol-Myers Squibb Co. | 1,788,762 | 36,330 |
| Medtronic, Inc. | 1,010,466 | 35,255 |
| Eli Lilly & Co. | 924,634 | 32,029 |
| Baxter International, Inc. | 554,656 | 29,375 |
| UnitedHealth Group Inc. | 1,098,470 | 27,440 |
* | WellPoint Inc. | 450,318 | 22,917 |
* | Medco Health | | |
| Solutions, Inc. | 443,637 | 20,234 |
* | Celgene Corp. | 415,156 | 19,861 |
24
Institutional Total Stock Market Index Fund
| | | Market |
| | | Value• |
| | Shares | ($000) |
* | Covidien PLC | 455,287 | 17,046 |
* | Express Scripts Inc. | 232,796 | 16,005 |
* | Thermo Fisher | | |
| Scientific, Inc. | 379,670 | 15,479 |
| Becton, Dickinson & Co. | 216,580 | 15,444 |
* | Boston Scientific Corp. | 1,356,842 | 13,758 |
* | Genzyme Corp. | 244,463 | 13,609 |
| Allergan, Inc. | 274,567 | 13,064 |
* | St. Jude Medical, Inc. | 310,828 | 12,775 |
* | Biogen Idec Inc. | 268,534 | 12,124 |
| McKesson Corp. | 247,367 | 10,884 |
| Stryker Corp. | 268,679 | 10,677 |
| Aetna Inc. | 416,678 | 10,438 |
| Cardinal Health, Inc. | 325,466 | 9,943 |
* | Zimmer Holdings, Inc. | 203,345 | 8,663 |
| Quest Diagnostics, Inc. | 146,524 | 8,268 |
* | Forest Laboratories, Inc. | 272,554 | 6,844 |
| C.R. Bard, Inc. | 89,843 | 6,689 |
* | Laboratory Corp. of | | |
| America Holdings | 97,798 | 6,630 |
* | Life Technologies Corp. | 156,990 | 6,550 |
| CIGNA Corp. | 244,921 | 5,900 |
* | Intuitive Surgical, Inc. | 35,320 | 5,780 |
* | Hospira, Inc. | 144,663 | 5,572 |
* | Vertex Pharmaceuticals, Inc. | 145,639 | 5,191 |
* | Humana Inc. | 153,200 | 4,942 |
| AmerisourceBergen Corp. | 275,786 | 4,892 |
* | DaVita, Inc. | 93,631 | 4,631 |
* | Waters Corp. | 88,776 | 4,569 |
* | Illumina, Inc. | 109,885 | 4,279 |
* | Varian Medical | | |
| Systems, Inc. | 112,775 | 3,963 |
| DENTSPLY | | |
| International Inc. | 127,481 | 3,891 |
* | Cerner Corp. | 62,397 | 3,887 |
* | Henry Schein, Inc. | 80,994 | 3,884 |
* | Cephalon, Inc. | 66,989 | 3,795 |
* | Mylan Inc. | 276,406 | 3,607 |
* | Millipore Corp. | 50,169 | 3,522 |
* | Edwards Lifesciences Corp. | 50,594 | 3,442 |
* | Hologic, Inc. | 232,231 | 3,305 |
| Beckman Coulter, Inc. | 57,058 | 3,260 |
* | Myriad Genetics, Inc. | 86,032 | 3,067 |
* | Alexion | | |
| Pharmaceuticals, Inc. | 74,052 | 3,045 |
* | Watson | | |
| Pharmaceuticals, Inc. | 90,203 | 3,039 |
* | Covance, Inc. | 57,598 | 2,834 |
* | ResMed Inc. | 68,807 | 2,803 |
| Omnicare, Inc. | 107,394 | 2,766 |
* | Coventry Health Care Inc. | 135,194 | 2,529 |
* | Dendreon Corp. | 100,743 | 2,503 |
* | IDEXX Laboratories, Inc. | 53,696 | 2,481 |
* | Inverness Medical | | |
| Innovations, Inc. | 67,198 | 2,391 |
| | | Market |
| | | Value• |
| | Shares | ($000) |
* | Mettler-Toledo | | |
| International Inc. | 30,479 | 2,351 |
| Pharmaceutical Product | | |
| Development, Inc. | 96,767 | 2,247 |
* | King Pharmaceuticals, Inc. | 224,247 | 2,160 |
* | Community Health | | |
| Systems, Inc. | 83,519 | 2,109 |
| IMS Health, Inc. | 165,423 | 2,101 |
| Techne Corp. | 32,261 | 2,059 |
* | Gen-Probe Inc. | 47,767 | 2,053 |
| Universal Health Services | | |
| Class B | 41,796 | 2,042 |
* | Charles River | | |
| Laboratories, Inc. | 60,455 | 2,040 |
* | VCA Antech, Inc. | 76,414 | 2,040 |
| Perrigo Co. (U.S.Shares) | 71,087 | 1,975 |
* | Endo Pharmaceuticals | | |
| Holdings, Inc. | 106,144 | 1,902 |
| PerkinElmer, Inc. | 105,996 | 1,844 |
* | Valeant Pharmaceuticals | | |
| International | 70,163 | 1,805 |
* | Patterson Companies, Inc. | 83,078 | 1,803 |
* | United Therapeutics Corp. | 21,472 | 1,789 |
* | MEDNAX, Inc. | 41,322 | 1,741 |
* | Sepracor Inc. | 98,752 | 1,710 |
* | Amylin | | |
| Pharmaceuticals, Inc. | 124,713 | 1,684 |
| Owens & Minor, Inc. | 37,456 | 1,641 |
| Teleflex Inc. | 36,153 | 1,621 |
* | Lincare Holdings, Inc. | 67,116 | 1,579 |
* | OSI Pharmaceuticals, Inc. | 51,991 | 1,468 |
* | Nuvasive, Inc. | 32,891 | 1,467 |
* | Health Net Inc. | 93,946 | 1,461 |
* | Onyx Pharmaceuticals, Inc. | 51,205 | 1,447 |
* | BioMarin | | |
| Pharmaceutical Inc. | 90,439 | 1,412 |
* | Isis Pharmaceuticals, Inc. | 84,307 | 1,391 |
| STERIS Corp. | 53,233 | 1,388 |
* | Thoratec Corp. | 51,197 | 1,371 |
* | Haemonetics Corp. | 23,154 | 1,320 |
* | AMERIGROUP Corp. | 48,671 | 1,307 |
* | Kinetic Concepts, Inc. | 47,919 | 1,306 |
* | Bio-Rad Laboratories, Inc. | | |
| Class A | 16,921 | 1,277 |
* | Tenet Healthcare Corp. | 437,598 | 1,234 |
* | Auxilium | | |
| Pharmaceuticals, Inc. | 39,079 | 1,226 |
* | Magellan Health | | |
| Services, Inc. | 36,854 | 1,210 |
* | Warner Chilcott Ltd. | 91,310 | 1,201 |
* | LifePoint Hospitals, Inc. | 45,011 | 1,182 |
* | HLTH Corp. | 88,855 | 1,164 |
* | HealthSouth Corp. | 79,419 | 1,147 |
* | Psychiatric Solutions, Inc. | 48,464 | 1,102 |
* | Health Management | | |
| Associates Class A | 221,026 | 1,092 |
25
Institutional Total Stock Market Index Fund
| | | Market |
| | | Value• |
| | Shares | ($000) |
* | Masimo Corp. | 44,522 | 1,073 |
* | American Medical Systems | | |
| Holdings, Inc. | 66,821 | 1,056 |
| West Pharmaceutical | | |
| Services, Inc. | 30,091 | 1,049 |
* | Varian, Inc. | 26,119 | 1,030 |
| The Cooper Companies, Inc. | 41,642 | 1,030 |
* | PSS World Medical, Inc. | 55,516 | 1,028 |
* | Regeneron | | |
| Pharmaceuticals, Inc. | 56,925 | 1,020 |
* | Dionex Corp. | 16,224 | 990 |
* | Medarex, Inc. | 118,122 | 986 |
* | Acorda Therapeutics Inc. | 34,729 | 979 |
* | Cubist Pharmaceuticals, Inc. | 52,732 | 967 |
^ | Quality Systems, Inc. | 16,890 | 962 |
| Allscripts Healthcare | | |
| Solutions, Inc. | 60,636 | 962 |
* | HMS Holdings Corp. | 23,586 | 960 |
* | Alkermes, Inc. | 85,818 | 929 |
* | Eclipsys Corp. | 51,800 | 921 |
| Hill-Rom Holdings, Inc. | 55,038 | 893 |
* | Immucor Inc. | 63,827 | 878 |
| PDL BioPharma Inc. | 109,919 | 868 |
* | Catalyst Health | | |
| Solutions, Inc. | 34,254 | 854 |
| Medicis | | |
| Pharmaceutical Corp. | 52,320 | 854 |
* | AMAG Pharmaceuticals, Inc. | 15,601 | 853 |
| Meridian Bioscience Inc. | 37,172 | 839 |
* | Amedisys Inc. | 25,135 | 830 |
| Chemed Corp. | 20,450 | 807 |
* | Centene Corp. | 39,619 | 792 |
* | Savient Pharmaceuticals Inc. | 55,719 | 772 |
* | PAREXEL International Corp. | 52,158 | 750 |
* | AthenaHealth Inc. | 20,000 | 740 |
* | WellCare Health Plans Inc. | 39,141 | 724 |
* | Alnylam Pharmaceuticals Inc. | 31,850 | 709 |
* | Cepheid, Inc. | 73,606 | 693 |
* | Cougar Biotechnology Inc. | 16,000 | 687 |
* | Allos Therapeutics Inc. | 81,469 | 675 |
* | Luminex Corp. | 36,155 | 670 |
* | Par Pharmaceutical Cos. Inc. | 44,129 | 669 |
* | Geron Corp. | 86,812 | 666 |
* | Conceptus, Inc. | 39,014 | 659 |
| Martek Biosciences Corp. | 30,699 | 649 |
| Analogic Corp. | 17,193 | 635 |
* | Theravance, Inc. | 43,297 | 634 |
* | Halozyme Therapeutics Inc. | 89,030 | 621 |
* | ev3 Inc. | 57,687 | 618 |
* | Abaxis, Inc. | 30,081 | 618 |
* | Seattle Genetics, Inc. | 62,669 | 609 |
* | AmSurg Corp. | 28,411 | 609 |
* | Phase Forward Inc. | 39,950 | 604 |
* | Affymetrix, Inc. | 100,164 | 594 |
* | CONMED Corp. | 38,236 | 593 |
* | Celera Corp. | 77,509 | 591 |
| | | Market |
| | | Value• |
| | Shares | ($000) |
* | Arena Pharmaceuticals, Inc. | 115,954 | 579 |
* | Wright Medical Group, Inc. | 34,953 | 568 |
* | PharMerica Corp. | 28,817 | 566 |
* | Cyberonics, Inc. | 34,012 | 566 |
* | Medivation Inc. | 25,100 | 563 |
* | Human Genome | | |
| Sciences, Inc. | 195,561 | 559 |
* | Volcano Corp. | 39,617 | 554 |
* | Align Technology, Inc. | 51,894 | 550 |
* | Bio-Reference | | |
| Laboratories, Inc. | 17,028 | 538 |
* | Nektar Therapeutics | 82,803 | 537 |
* | Cypress Bioscience, Inc. | 56,417 | 531 |
| Computer Programs and | | |
| Systems, Inc. | 13,788 | 528 |
| Landauer, Inc. | 8,578 | 526 |
| Invacare Corp. | 29,807 | 526 |
* | InterMune Inc. | 33,864 | 515 |
* | Xenoport Inc. | 21,700 | 503 |
* | Enzon Pharmaceuticals, Inc. | 63,727 | 502 |
* | Integra | | |
| LifeSciences Holdings | 18,821 | 499 |
*,^ | MannKind Corp. | 59,725 | 496 |
* | Greatbatch, Inc. | 21,698 | 491 |
* | Natus Medical Inc. | 42,455 | 490 |
* | Healthspring, Inc. | 44,080 | 479 |
* | Healthways, Inc. | 34,822 | 468 |
* | Air Methods Corp. | 17,090 | 468 |
* | Exelixis, Inc. | 95,881 | 467 |
* | ABIOMED, Inc. | 52,277 | 461 |
* | Accuray Inc. | 68,246 | 455 |
* | ArQule, Inc. | 73,907 | 454 |
* | Hanger Orthopedic | | |
| Group, Inc. | 33,098 | 450 |
* | ICU Medical, Inc. | 10,915 | 449 |
* | Gentiva Health Services, Inc. | 25,596 | 421 |
* | Cantel Medical Corp. | 25,330 | 411 |
* | The Medicines Co. | 48,640 | 408 |
* | BioScrip Inc. | 67,274 | 398 |
* | Genomic Health, Inc. | 21,681 | 376 |
* | Affymax Inc. | 20,208 | 372 |
* | Bruker BioSciences Corp. | 39,228 | 363 |
* | Alliance HealthCare | | |
| Services Inc. | 48,620 | 356 |
| Brookdale Senior Living Inc. | 36,563 | 356 |
* | Avanir Pharmaceuticals | | |
| Class A | 158,715 | 352 |
* | Incyte Corp. | 106,178 | 349 |
* | ViroPharma Inc. | 57,562 | 341 |
* | ATS Medical, Inc. | 102,631 | 338 |
* | Emeritus Corp. | 25,405 | 336 |
* | AMN Healthcare | | |
| Services, Inc. | 52,544 | 335 |
*,^ | GTx, Inc. | 36,079 | 333 |
* | Kindred Healthcare, Inc. | 26,919 | 333 |
26
Institutional Total Stock Market Index Fund
| | | Market |
| | | Value• |
| | Shares | ($000) |
* | Cadence | | |
| Pharmaceuticals, Inc. | 33,306 | 333 |
* | Kensey Nash Corp. | 12,689 | 333 |
* | Emergency Medical Services | | |
| LP Class A | 9,000 | 331 |
* | Albany Molecular | | |
| Research, Inc. | 39,452 | 331 |
* | Rigel Pharmaceuticals, Inc. | 27,200 | 330 |
* | Assisted Living | | |
| Concepts Inc. | 22,527 | 328 |
* | CorVel Corp. | 13,837 | 315 |
* | inVentiv Health, Inc. | 23,214 | 314 |
* | MedAssets, Inc. | 16,100 | 313 |
| Atrion Corp. | 2,308 | 309 |
* | Array BioPharma Inc. | 97,994 | 308 |
* | Momenta | | |
| Pharmaceuticals, Inc. | 25,120 | 302 |
* | Merit Medical Systems, Inc. | 18,487 | 301 |
*,^ | Antigenics, Inc. | 142,858 | 300 |
* | Salix Pharmaceuticals, Ltd. | 30,387 | 300 |
* | BioCryst | | |
| Pharmaceuticals, Inc. | 74,092 | 299 |
* | Noven Pharmaceuticals, Inc. | 20,877 | 299 |
* | Cross Country | | |
| Healthcare, Inc. | 43,133 | 296 |
* | SurModics, Inc. | 13,051 | 295 |
* | Universal American Corp. | 33,559 | 293 |
* | American Dental | | |
| Partners, Inc. | 31,734 | 288 |
* | AVI BioPharma, Inc. | 178,081 | 281 |
* | Orthofix International N.V. | 11,189 | 280 |
* | Capital Senior Living Corp. | 61,232 | 279 |
* | Abraxis BioScience | 7,431 | 274 |
* | Quidel Corp. | 18,805 | 274 |
* | eResearch Technology, Inc. | 43,862 | 272 |
* | America Service Group Inc. | 16,905 | 272 |
* | Questcor | | |
| Pharmaceuticals, Inc. | 54,200 | 271 |
* | Accelrys Inc. | 45,418 | 268 |
* | Amicas, Inc. | 95,849 | 266 |
* | ImmunoGen, Inc. | 29,817 | 257 |
* | Cutera, Inc. | 29,629 | 255 |
* | Vivus, Inc. | 41,684 | 253 |
* | ARIAD | | |
| Pharmaceuticals, Inc. | 158,169 | 252 |
* | Allied Healthcare | | |
| International Inc. | 115,012 | 250 |
* | DepoMed, Inc. | 76,566 | 249 |
* | Acadia Pharmaceuticals Inc. | 110,968 | 243 |
* | CryoLife Inc. | 41,290 | 229 |
* | Ligand Pharmaceuticals Inc. | | |
| Class B | 79,637 | 228 |
* | RehabCare Group, Inc. | 9,477 | 227 |
* | Symmetry Medical Inc. | 24,200 | 226 |
* | K-V Pharmaceutical Co. | | |
| Class A | 69,948 | 225 |
| | | Market |
| | | Value• |
| | Shares | ($000) |
* | Inspire Pharmaceuticals, Inc. | 39,086 | 217 |
* | Alphatec Holdings, Inc. | 64,572 | 214 |
* | LHC Group Inc. | 9,600 | 213 |
* | Anika Resh Inc. | 44,533 | 212 |
* | Sequenom, Inc. | 53,753 | 210 |
* | Zoll Medical Corp. | 10,774 | 208 |
* | Molina Healthcare Inc. | 8,500 | 203 |
* | Exactech, Inc. | 13,833 | 201 |
* | Almost Family Inc. | 7,662 | 200 |
* | Facet Biotech Corp. | 21,529 | 200 |
* | Emergent BioSolutions Inc. | 13,950 | 200 |
* | Biodel Inc. | 38,126 | 197 |
* | Adolor Corp. | 111,517 | 196 |
* | Sirona Dental Systems Inc. | 9,778 | 195 |
* | Genoptix, Inc. | 6,100 | 195 |
* | Neogen Corp. | 6,653 | 193 |
* | Palomar Medical | | |
| Technologies, Inc. | 12,812 | 188 |
* | Res-Care, Inc. | 13,019 | 186 |
* | Optimer Pharmaceuticals Inc. | 12,400 | 186 |
* | NPS Pharmaceuticals Inc. | 37,657 | 175 |
* | MWI Veterinary Supply Inc. | 5,000 | 174 |
* | Sun Healthcare Group Inc. | 20,200 | 170 |
* | DURECT Corp. | 71,573 | 170 |
| National Healthcare Corp. | 4,480 | 170 |
* | Aspect Medical | | |
| Systems, Inc. | 27,820 | 164 |
* | Akorn, Inc. | 136,684 | 164 |
* | Odyssey Healthcare, Inc. | 15,929 | 164 |
* | Pain Therapeutics, Inc. | 29,876 | 160 |
* | Idenix Pharmaceuticals Inc. | 42,528 | 157 |
* | Omnicell, Inc. | 14,338 | 154 |
| Merge Healthcare Inc. | 35,735 | 154 |
* | Medical Action Industries Inc. | 13,400 | 153 |
* | Cytokinetics, Inc. | 53,513 | 151 |
* | Pozen Inc. | 19,561 | 150 |
* | Continucare Corp. | 63,099 | 147 |
* | MedCath Corp. | 12,390 | 146 |
* | Alexza Pharmaceuticals, Inc. | 60,905 | 144 |
* | SonoSite, Inc. | 6,969 | 140 |
* | Zymogenetics, Inc. | 30,213 | 139 |
* | Orthovita, Inc. | 26,606 | 137 |
* | Cynosure Inc. | 17,900 | 137 |
* | IRIS International, Inc. | 11,438 | 135 |
* | Dexcom Inc. | 21,765 | 135 |
* | Biomimetic Therapeutics, Inc. | 14,542 | 134 |
* | Pharmasset, Inc. | 11,900 | 134 |
* | IPC The Hospitalist Co. | 4,993 | 133 |
* | Curis, Inc. | 83,605 | 133 |
*,^ | Celldex Therapeutics, Inc. | 16,848 | 132 |
* | Clarient, Inc. | 35,251 | 131 |
* | Columbia Laboratories Inc. | 112,196 | 128 |
* | Harvard Bioscience, Inc. | 32,348 | 128 |
* | Dyax Corp. | 58,248 | 125 |
* | Rochester Medical Corp. | 8,732 | 117 |
* | Maxygen Inc. | 16,575 | 111 |
27
Institutional Total Stock Market Index Fund
| | | Market |
| | | Value• |
| | Shares | ($000) |
* | US Physical Therapy, Inc. | 7,364 | 109 |
* | Anadys Pharmaceuticals Inc. | 57,338 | 107 |
* | Caliper Life Sciences, Inc. | 58,415 | 103 |
* | Five Star Quality Care, Inc. | 54,124 | 103 |
* | Bio Imaging Technologies | 28,729 | 103 |
* | Cardiac Science Corp. | 25,269 | 102 |
* | Triple-S Management Corp. | 6,460 | 101 |
*,^ | Hemispherx Biopharma, Inc. | 39,382 | 100 |
* | Myriad Pharmaceuticals Inc. | 21,508 | 100 |
* | Endologix, Inc. | 29,694 | 99 |
* | BMP Sunstone Corp. | 20,893 | 99 |
* | Immunomedics Inc. | 38,684 | 98 |
* | BioLase Technology, Inc. | 56,502 | 95 |
*,^ | Osiris Therapeutics, Inc. | 7,100 | 95 |
* | I-Flow Corp. | 13,685 | 95 |
* | MiddleBrook | | |
| Pharmaceuticals Inc. | 66,191 | 89 |
* | Progenics | | |
| Pharmaceuticals, Inc. | 17,277 | 89 |
* | Allion Healthcare Inc. | 14,690 | 87 |
* | Aastrom Biosciences, Inc. | 204,553 | 86 |
* | Clinical Data, Inc. | 7,800 | 86 |
* | Vital Images, Inc. | 7,125 | 81 |
* | Cambrex Corp. | 18,866 | 78 |
* | Caraco Pharmaceutical | | |
| Laboratories, Ltd. | 24,070 | 74 |
* | CardioNet, Inc. | 4,400 | 72 |
* | Discovery Laboratories, Inc. | 68,754 | 71 |
* | Kendle International Inc. | 5,707 | 70 |
* | Spectranetics Corp. | 14,143 | 70 |
* | Nabi Biopharmaceuticals | 28,374 | 69 |
* | BioSphere Medical Inc. | 27,491 | 66 |
* | Enzo Biochem, Inc. | 14,711 | 65 |
* | Idera Pharmaceuticals, Inc. | 10,285 | 60 |
* | CuraGen Corp. | 41,588 | 60 |
* | RTI Biologics, Inc. | 13,379 | 57 |
* | PDI, Inc. | 13,965 | 57 |
* | Nighthawk Radiology | | |
| Holdings, Inc. | 15,154 | 56 |
* | Icad Inc. | 42,753 | 56 |
* | Candela Corp. | 51,632 | 53 |
* | Sunrise Senior Living, Inc. | 31,787 | 52 |
* | Cerus Corp. | 50,588 | 52 |
* | Neurocrine Biosciences, Inc. | 15,959 | 52 |
* | Providence Service Corp. | 4,531 | 50 |
* | deCODE genetics, Inc. | 91,030 | 48 |
* | Sangamo BioSciences, Inc. | 9,647 | 48 |
* | Vanda Parmaceuticals, Inc. | 3,800 | 45 |
* | Vascular Solutions, Inc. | 5,686 | 44 |
* | LCA-Vision Inc. | 10,487 | 44 |
* | GenVec, Inc. | 60,242 | 44 |
* | Synovis Life | | |
| Technologies, Inc. | 2,100 | 44 |
* | Avigen, Inc. | 31,139 | 41 |
* | Ista Pharmaceuticals Inc. | 9,776 | 41 |
* | Hansen Medical Inc. | 8,149 | 40 |
| | | Market |
| | | Value• |
| | Shares | ($000) |
* | Peregrine | | |
| Pharmaceuticals, Inc. | 47,335 | 40 |
* | Opko Health, Inc. | 22,400 | 40 |
* | Osteotech, Inc. | 8,935 | 39 |
* | HealthTronics Surgical | | |
| Services, Inc. | 19,398 | 39 |
* | Penwest Pharmaceuticals Co. | 13,587 | 39 |
* | OraSure Technologies, Inc. | 15,609 | 39 |
* | Insmed Inc. | 37,750 | 38 |
* | Cytrx Corp. | 32,600 | 36 |
* | Novavax, Inc. | 10,811 | 35 |
* | SciClone | | |
| Pharmaceuticals, Inc. | 13,095 | 34 |
* | Lexicon Pharmaceuticals Inc. | 25,762 | 32 |
| Psychemedics Corp. | 4,628 | 32 |
* | StemCells, Inc. | 17,974 | 31 |
* | Repligen Corp. | 5,551 | 31 |
* | Infinity Pharmaceuticals, Inc. | 5,218 | 30 |
* | Monogram Biosciences Inc. | 6,692 | 30 |
*,^ | Cell Genesys, Inc. | 103,676 | 30 |
* | Somanetics Corp. | 1,801 | 30 |
* | SuperGen, Inc. | 14,785 | 30 |
* | Bovie Medical Corp. | 3,400 | 30 |
* | Animal Health | | |
| International, Inc. | 18,459 | 29 |
* | STAAR Surgical Co. | 11,213 | 27 |
* | American Caresource | | |
| Holding, Inc. | 7,200 | 27 |
* | CPEX Pharmaceuticals, Inc. | 2,615 | 26 |
* | Oxigene, Inc. | 11,910 | 26 |
* | Santarus Inc. | 9,196 | 26 |
* | National Dentex Corp. | 3,944 | 26 |
* | ThermoGenesis Corp. | 37,607 | 24 |
* | Theragenics Corp. | 18,231 | 24 |
* | MAKO Surgical Corp. | 2,600 | 23 |
* | XOMA Ltd. | 28,554 | 23 |
* | Arrowhead Research Corp. | 52,360 | 23 |
* | SIGA Technologies, Inc. | 2,700 | 23 |
* | Skilled Healthcare Group Inc. | 3,000 | 23 |
* | Chindex International, Inc. | 1,800 | 22 |
* | Vical, Inc. | 7,842 | 21 |
* | ADVENTRX | | |
| Pharmaceuticals, Inc. | 137,900 | 21 |
* | Corcept Therapeutics Inc. | 23,958 | 19 |
* | Hooper Holmes, Inc. | 42,124 | 19 |
* | Telik, Inc. | 21,589 | 18 |
* | Micrus Endovascular Corp. | 1,927 | 17 |
* | TomoTherapy, Inc. | 6,200 | 17 |
* | Life Sciences Research, Inc. | 2,300 | 17 |
* | Rural/Metro Corp. | 6,345 | 16 |
* | Hi-Tech Pharmacal Co., Inc. | 1,800 | 16 |
* | Metabolix Inc. | 1,900 | 16 |
* | Mediware Information | | |
| Systems, Inc. | 2,170 | 13 |
* | Orexigen Therapeutics Inc. | 2,550 | 13 |
* | Arca Biopharma Inc. | 3,931 | 13 |
28
Institutional Total Stock Market Index Fund
| | | Market |
| | | Value• |
| | Shares | ($000) |
* | Javelin Pharmaceuticals, Inc. | 9,800 | 12 |
* | Stereotaxis Inc. | 3,100 | 12 |
| Trimeris, Inc. | 5,826 | 12 |
* | EntreMed, Inc. | 23,118 | 12 |
* | Orchid Cellmark, Inc. | 6,213 | 10 |
* | Dynavax Technologies Corp. | 7,379 | 10 |
* | NMT Medical, Inc. | 3,896 | 9 |
| Young Innovations, Inc. | 377 | 8 |
* | Orthologic Corp. | 11,489 | 8 |
* | PhotoMedex, Inc. | 7,310 | 8 |
* | RXi Pharmaceuticals Corp. | 1,626 | 7 |
* | IVAX Diagnostics, Inc. | 10,266 | 7 |
* | OTIX Global, Inc. | 8,444 | 7 |
* | Pharmacyclics, Inc. | 4,319 | 6 |
* | Strategic Diagnostics Inc. | 3,632 | 4 |
* | Cardica, Inc. | 2,775 | 4 |
* | GTC Biotherapeutics, Inc. | 1,272 | 3 |
* | Dialysis Corp. of America | 665 | 3 |
* | Epicept Corp. | 3,977 | 3 |
* | Novamed, Inc. | 620 | 2 |
* | Matrixx Initiatives, Inc. | 418 | 2 |
* | Insulet Corp. | 200 | 2 |
* | Neurogen Corp. | 5,865 | 1 |
* | Interleukin Genetics, Inc. | 2,262 | 1 |
* | Heska Corp. | 2,582 | 1 |
* | Chelsea Therapeutics | | |
| International, Ltd. | 200 | 1 |
* | Neurobiological | | |
| Technolgoies, Inc. | 619 | — |
| | | 1,237,869 |
Industrials (10.4%) | | |
| General Electric Co. | 9,545,307 | 111,871 |
| United Technologies Corp. | 809,534 | 42,063 |
| 3M Co. | 595,569 | 35,794 |
| United Parcel Service, Inc. | 612,185 | 30,603 |
| The Boeing Co. | 623,287 | 26,490 |
| Lockheed Martin Corp. | 303,539 | 24,480 |
| Union Pacific Corp. | 454,683 | 23,671 |
| Burlington Northern | | |
| Santa Fe Corp. | 306,658 | 22,552 |
| Emerson Electric Co. | 682,274 | 22,106 |
| Honeywell International Inc. | 631,115 | 19,817 |
| Caterpillar, Inc. | 543,587 | 17,960 |
| General Dynamics Corp. | 296,460 | 16,421 |
| Raytheon Co. | 361,564 | 16,064 |
| Deere & Co. | 381,913 | 15,257 |
| Danaher Corp. | 244,785 | 15,113 |
| FedEx Corp. | 267,205 | 14,862 |
| Illinois Tool Works, Inc. | 383,335 | 14,314 |
| Northrop Grumman Corp. | 280,835 | 12,829 |
| CSX Corp. | 360,715 | 12,492 |
| Norfolk Southern Corp. | 331,080 | 12,472 |
| Waste Management, Inc. | 421,663 | 11,874 |
| Tyco International Ltd. | 427,600 | 11,109 |
| PACCAR, Inc. | 311,366 | 10,123 |
| Precision Castparts Corp. | 126,677 | 9,251 |
| | | Market |
| | | Value• |
| | Shares | ($000) |
| Fluor Corp. | 163,853 | 8,404 |
| Republic Services, Inc. | | |
| Class A | 341,159 | 8,328 |
| C.H. Robinson | | |
| Worldwide Inc. | 153,063 | 7,982 |
| L-3 Communications | | |
| Holdings, Inc. | 107,036 | 7,426 |
| ITT Industries, Inc. | 155,998 | 6,942 |
* | First Solar, Inc. | 40,534 | 6,571 |
| Expeditors International | | |
| of Washington, Inc. | 191,883 | 6,397 |
| Eaton Corp. | 141,866 | 6,329 |
| Parker Hannifin Corp. | 145,449 | 6,248 |
| Cummins Inc. | 172,860 | 6,086 |
| Ingersoll-Rand Co. | 288,072 | 6,021 |
| Rockwell Collins, Inc. | 142,784 | 5,958 |
| Goodrich Corp. | 111,816 | 5,587 |
| Dover Corp. | 168,025 | 5,560 |
* | Iron Mountain, Inc. | 164,710 | 4,735 |
| W.W. Grainger, Inc. | 57,691 | 4,724 |
| Cooper Industries, Inc. | | |
| Class A | 151,511 | 4,704 |
* | Jacobs Engineering | | |
| Group Inc. | 111,519 | 4,694 |
| Southwest Airlines Co. | 671,496 | 4,519 |
* | McDermott | | |
| International, Inc. | 205,896 | 4,182 |
| Rockwell Automation, Inc. | 127,968 | 4,110 |
* | Quanta Services, Inc. | 177,563 | 4,107 |
| Pitney Bowes, Inc. | 186,332 | 4,086 |
| Fastenal Co. | 121,098 | 4,017 |
| The Dun & Bradstreet Corp. | 48,403 | 3,931 |
* | Stericycle, Inc. | 73,445 | 3,785 |
* | URS Corp. | 75,585 | 3,743 |
| Roper Industries Inc. | 81,300 | 3,684 |
* | Delta Air Lines Inc. | 634,399 | 3,673 |
| Flowserve Corp. | 50,697 | 3,539 |
| AMETEK, Inc. | 96,746 | 3,345 |
| Joy Global Inc. | 92,473 | 3,303 |
| Masco Corp. | 326,414 | 3,127 |
| Robert Half | | |
| International, Inc. | 130,680 | 3,087 |
| Manpower Inc. | 71,197 | 3,014 |
| Equifax, Inc. | 114,629 | 2,992 |
| Cintas Corp. | 124,788 | 2,850 |
| Pall Corp. | 106,547 | 2,830 |
* | Foster Wheeler AG | 114,215 | 2,713 |
| KBR Inc. | 146,599 | 2,703 |
* | Navistar International Corp. | 58,289 | 2,541 |
* | Alliant Techsystems, Inc. | 29,791 | 2,454 |
| J.B. Hunt Transport | | |
| Services, Inc. | 80,048 | 2,444 |
* | Aecom Technology Corp. | 76,252 | 2,440 |
* | AGCO Corp. | 83,582 | 2,430 |
| SPX Corp. | 49,555 | 2,427 |
* | IHS Inc. Class A | 47,118 | 2,350 |
29
Institutional Total Stock Market Index Fund
| | | Market |
| | | Value• |
| | Shares | ($000) |
* | FTI Consulting, Inc. | 46,213 | 2,344 |
| Textron, Inc. | 240,828 | 2,326 |
| Donaldson Co., Inc. | 66,623 | 2,308 |
* | Copart, Inc. | 64,602 | 2,240 |
| Avery Dennison Corp. | 87,088 | 2,236 |
| Pentair, Inc. | 84,609 | 2,168 |
| R.R. Donnelley & Sons Co. | 186,427 | 2,166 |
* | Shaw Group, Inc. | 76,079 | 2,085 |
| Harsco Corp. | 73,300 | 2,074 |
| Bucyrus International, Inc. | 67,548 | 1,929 |
* | Covanta Holding Corp. | 111,453 | 1,890 |
* | Waste Connections, Inc. | 72,072 | 1,867 |
* | Corrections Corp. | | |
| of America | 108,612 | 1,845 |
| IDEX Corp. | 74,588 | 1,833 |
* | General Cable Corp. | 47,370 | 1,780 |
| Landstar System, Inc. | 46,851 | 1,682 |
* | Tetra Tech, Inc. | 55,124 | 1,579 |
* | Kirby Corp. | 46,350 | 1,473 |
| Con-way, Inc. | 41,609 | 1,469 |
| Watson Wyatt & | | |
| Co. Holdings | 38,770 | 1,455 |
| Hubbell Inc. Class B | 44,693 | 1,433 |
| MSC Industrial | | |
| Direct Co., Inc. Class A | 39,586 | 1,405 |
| Ryder System, Inc. | 50,174 | 1,401 |
| Lincoln Electric | | |
| Holdings, Inc. | 38,839 | 1,400 |
* | Thomas & Betts Corp. | 48,386 | 1,396 |
| Lennox International Inc. | 42,642 | 1,369 |
| CLARCOR Inc. | 46,524 | 1,358 |
* | Kansas City Southern | 84,111 | 1,355 |
| Wabtec Corp. | 41,705 | 1,342 |
| Carlisle Co., Inc. | 55,263 | 1,329 |
* | Hertz Global Holdings Inc. | 163,306 | 1,305 |
*,^ | SunPower Corp. Class A | 48,385 | 1,289 |
* | Spirit Aerosystems | | |
| Holdings Inc. | 93,549 | 1,285 |
| Regal-Beloit Corp. | 31,971 | 1,270 |
* | TransDigm Group, Inc. | 35,061 | 1,269 |
| The Timken Co. | 74,304 | 1,269 |
| Kennametal, Inc. | 65,946 | 1,265 |
* | Monster Worldwide Inc. | 106,204 | 1,254 |
* | BE Aerospace, Inc. | 87,108 | 1,251 |
* | GrafTech International Ltd. | 109,167 | 1,235 |
| Curtiss-Wright Corp. | 40,909 | 1,216 |
| Valmont Industries, Inc. | 16,762 | 1,208 |
* | EMCOR Group, Inc. | 59,441 | 1,196 |
| Graco, Inc. | 54,166 | 1,193 |
* | Gardner Denver Inc. | 47,254 | 1,189 |
| The Brink’s Co. | 40,741 | 1,183 |
* | Terex Corp. | 96,200 | 1,161 |
| GATX Corp. | 44,334 | 1,140 |
| Brady Corp. Class A | 44,558 | 1,119 |
| Woodward Governor Co. | 55,584 | 1,101 |
| Watsco, Inc. | 22,137 | 1,083 |
| | | Market |
| | | Value• |
| | Shares | ($000) |
* | ESCO Technologies Inc. | 23,945 | 1,073 |
* | Clean Harbors Inc. | 19,649 | 1,061 |
| Nordson Corp. | 27,269 | 1,054 |
| Granite Construction Co. | 31,584 | 1,051 |
* | AMR Corp. | 254,732 | 1,024 |
* | Teledyne Technologies, Inc. | 31,242 | 1,023 |
| Acuity Brands, Inc. | 36,430 | 1,022 |
* | Continental Airlines, Inc. | | |
| Class B | 113,102 | 1,002 |
| Kaydon Corp. | 30,637 | 998 |
| The Toro Co. | 33,356 | 997 |
* | UTI Worldwide, Inc. | 87,016 | 992 |
*,^ | American | | |
| Superconductor Corp. | 37,393 | 982 |
| Trinity Industries, Inc. | 72,022 | 981 |
| Oshkosh Truck Corp. | 67,404 | 980 |
| Baldor Electric Co. | 40,334 | 960 |
| Knight Transportation, Inc. | 57,926 | 959 |
| Crane Co. | 42,634 | 951 |
* | Genesee & Wyoming Inc. | | |
| Class A | 34,805 | 923 |
* | JetBlue Airways Corp. | 214,801 | 917 |
* | SunPower Corp. Class B | 38,227 | 916 |
* | WESCO International, Inc. | 36,391 | 911 |
* | Moog Inc. | 35,020 | 904 |
* | Owens Corning Inc. | 70,286 | 898 |
| Alexander & Baldwin, Inc. | 37,887 | 888 |
* | Geo Group Inc. | 46,477 | 864 |
* | Old Dominion | | |
| Freight Line, Inc. | 25,413 | 853 |
* | Hexcel Corp. | 87,755 | 836 |
* | Orbital Sciences Corp. | 54,469 | 826 |
| Heartland Express, Inc. | 55,042 | 810 |
* | Huron Consulting Group Inc. | 17,389 | 804 |
| Simpson Manufacturing Co. | 36,011 | 779 |
| Werner Enterprises, Inc. | 42,537 | 771 |
| Mine Safety Appliances Co. | 31,514 | 759 |
| Herman Miller, Inc. | 49,141 | 754 |
* | United Stationers, Inc. | 21,397 | 746 |
* | Esterline Technologies Corp. | 27,293 | 739 |
| Actuant Corp. | 60,010 | 732 |
| Rollins, Inc. | 41,840 | 724 |
| ABM Industries Inc. | 40,020 | 723 |
| Belden Inc. | 42,702 | 713 |
* | EnerSys | 39,100 | 711 |
| Mueller Industries Inc. | 34,132 | 710 |
* | Hub Group, Inc. | 34,009 | 702 |
| Badger Meter, Inc. | 16,984 | 696 |
* | CoStar Group, Inc. | 17,445 | 696 |
| Applied Industrial | | |
| Technology, Inc. | 34,690 | 683 |
* | Resources Connection, Inc. | 39,526 | 679 |
* | The Middleby Corp. | 15,423 | 677 |
| Otter Tail Corp. | 30,932 | 676 |
* | Mastec Inc. | 56,235 | 659 |
* | AirTran Holdings, Inc. | 105,385 | 652 |
30
Institutional Total Stock Market Index Fund
| | | Market |
| | | Value• |
| | Shares | ($000) |
* | MPS Group, Inc. | 85,100 | 650 |
* | USG Corp. | 63,793 | 642 |
| The Corporate | | |
| Executive Board Co. | 30,864 | 641 |
| The Manitowoc Co., Inc. | 120,333 | 633 |
| HNI Corp. | 34,819 | 629 |
| EnergySolutions | 67,900 | 625 |
* | Astec Industries, Inc. | 21,020 | 624 |
| Healthcare Services | | |
| Group, Inc. | 34,736 | 621 |
| Briggs & Stratton Corp. | 45,906 | 612 |
| Triumph Group, Inc. | 15,047 | 602 |
* | Alaska Air Group, Inc. | 32,780 | 599 |
| A.O. Smith Corp. | 18,294 | 596 |
* | Beacon Roofing Supply, Inc. | 41,143 | 595 |
| Deluxe Corp. | 46,409 | 595 |
| Arkansas Best Corp. | 22,326 | 588 |
* | Energy Conversion | | |
| Devices, Inc. | 41,506 | 587 |
* | Navigant Consulting, Inc. | 45,437 | 587 |
* | Insituform Technologies Inc. | | |
| Class A | 34,510 | 586 |
| Forward Air Corp. | 27,139 | 579 |
* | AAR Corp. | 35,864 | 576 |
| Genco Shipping and | | |
| Trading Ltd. | 26,375 | 573 |
| Watts Water | | |
| Technologies, Inc. | 26,563 | 572 |
* | AZZ Inc. | 16,578 | 570 |
| American Science & | | |
| Engineering, Inc. | 8,180 | 565 |
* | Sykes Enterprises, Inc. | 30,887 | 559 |
* | Dycom Industries, Inc. | 50,339 | 557 |
| Cubic Corp. | 15,367 | 550 |
* | The Advisory Board Co. | 21,212 | 545 |
| Skywest, Inc. | 52,847 | 539 |
| Franklin Electric, Inc. | 20,541 | 532 |
| Mueller Water | | |
| Products, Inc. Class A | 141,351 | 529 |
* | Allegiant Travel Co. | 13,036 | 517 |
* | Axsys Technologies, Inc. | 9,622 | 516 |
| Administaff, Inc. | 21,869 | 509 |
| Barnes Group, Inc. | 42,012 | 500 |
| Robbins & Myers, Inc. | 25,726 | 495 |
| Applied Signal | | |
| Technology, Inc. | 19,383 | 494 |
* | Blount International, Inc. | 57,251 | 493 |
| Aircastle Ltd. | 66,486 | 489 |
* | Michael Baker Corp. | 11,335 | 480 |
* | Evergreen Solar, Inc. | 220,798 | 479 |
* | Marten Transport, Ltd. | 22,926 | 476 |
* | Layne Christensen Co. | 23,256 | 476 |
| Comfort Systems USA, Inc. | 46,292 | 475 |
| Ameron International Corp. | 6,885 | 462 |
| Albany International Corp. | 39,695 | 452 |
* | II-VI, Inc. | 20,131 | 446 |
| | | Market |
| | | Value• |
| | Shares | ($000) |
* | FuelCell Energy, Inc. | 106,224 | 444 |
* | CBIZ Inc. | 62,126 | 442 |
| Raven Industries, Inc. | 17,235 | 441 |
| American Ecology Corp. | 24,019 | 430 |
* | ATC Technology Corp. | 29,441 | 427 |
* | Ceradyne, Inc. | 23,799 | 420 |
| Kaman Corp. Class A | 25,065 | 419 |
* | Avis Budget Group, Inc. | 73,715 | 417 |
* | Tutor Perini Corp. | 23,279 | 404 |
| Knoll, Inc. | 52,995 | 402 |
| Dynamic Materials Corp. | 20,727 | 400 |
| AAON, Inc. | 19,958 | 398 |
| Apogee Enterprises, Inc. | 32,178 | 396 |
| G & K Services, Inc. Class A | 18,555 | 392 |
* | UAL Corp. | 119,148 | 380 |
* | Force Protection, Inc. | 42,699 | 377 |
* | Korn/Ferry International | 35,417 | 377 |
* | Northwest Pipe Co. | 10,668 | 371 |
* | Chart Industries, Inc. | 20,380 | 371 |
| CIRCOR International, Inc. | 15,673 | 370 |
* | Altra Holdings Inc. | 47,276 | 354 |
* | CRA International Inc. | 12,694 | 352 |
| Universal Forest | | |
| Products, Inc. | 10,531 | 348 |
* | Acacia Research - | | |
| Acacia Technologies | 44,240 | 348 |
| Ducommun, Inc. | 18,084 | 340 |
| Ampco-Pittsburgh Corp. | 14,411 | 338 |
* | American Reprographics Co. | 40,370 | 336 |
| Quanex Building | | |
| Products Corp. | 29,348 | 329 |
| American Woodmark Corp. | 13,609 | 326 |
| International | | |
| Shipholding Corp. | 11,909 | 321 |
* | Consolidated Graphics, Inc. | 18,326 | 319 |
* | Powell Industries, Inc. | 8,430 | 313 |
* | Griffon Corp. | 37,335 | 311 |
| HEICO Corp. Class A | 10,479 | 307 |
| Interface, Inc. | 48,214 | 299 |
* | Cornell Cos., Inc. | 18,372 | 298 |
| CDI Corp. | 26,043 | 290 |
| Bowne & Co., Inc. | 44,381 | 289 |
* | Acco Brands Corp. | 102,098 | 288 |
| Aceto Corp. | 42,733 | 285 |
* | APAC Teleservices, Inc. | 54,276 | 278 |
* | H&E Equipment | | |
| Services, Inc. | 29,500 | 276 |
* | Mobile Mini, Inc. | 18,665 | 274 |
* | China BAK Battery, Inc. | 92,517 | 273 |
| Lindsay Manufacturing Co. | 8,123 | 269 |
*,^ | Advanced Battery | | |
| Technologies Inc. | 66,373 | 267 |
* | Armstrong Worldwide | | |
| Industries, Inc. | 16,158 | 266 |
* | DynCorp International Inc. | | |
| Class A | 15,600 | 262 |
31
Institutional Total Stock Market Index Fund
| | | Market |
| | | Value• |
| | Shares | ($000) |
* | Stanley Inc. | 7,960 | 262 |
* | Flanders Corp. | 41,851 | 256 |
| Tredegar Corp. | 18,885 | 252 |
* | TrueBlue, Inc. | 29,453 | 247 |
| The Greenbrier Cos., Inc. | 34,319 | 247 |
* | Colfax Corp. | 31,400 | 242 |
| American Railcar | | |
| Industries, Inc. | 29,081 | 240 |
| Steelcase Inc. | 41,242 | 240 |
* | US Airways Group Inc. | 98,520 | 239 |
* | Celadon Group Inc. | 28,255 | 237 |
| Macquarie | | |
| Infrastructure Co. LLC | 57,182 | 235 |
* | Trex Co., Inc. | 17,429 | 233 |
| Ennis, Inc. | 18,582 | 232 |
| McGrath RentCorp | 12,034 | 229 |
* | GeoEye Inc. | 9,700 | 229 |
* | Interline Brands, Inc. | 16,652 | 228 |
* | Aerovironment Inc. | 7,300 | 225 |
* | M&F Worldwide Corp. | 11,120 | 222 |
| Encore Wire Corp. | 10,181 | 217 |
* | United Rentals, Inc. | 33,385 | 217 |
| Federal Signal Corp. | 28,106 | 215 |
| Cascade Corp. | 13,637 | 215 |
* | Atlas Air Worldwide | | |
| Holdings, Inc. | 9,200 | 213 |
| Seaboard Corp. | 189 | 212 |
* | Orion Marine Group, Inc. | 11,100 | 211 |
* | Dollar Thrifty Automotive | | |
| Group, Inc. | 15,063 | 210 |
* | On Assignment, Inc. | 52,659 | 206 |
| Houston Wire & Cable Co. | 17,179 | 205 |
* | L.B. Foster Co. Class A | 6,800 | 204 |
* | Miller Industries, Inc. | 23,159 | 204 |
* | Polypore International Inc. | 18,091 | 201 |
* | Argon ST, Inc. | 9,740 | 200 |
* | RSC Holdings Inc. | 29,797 | 200 |
* | Rush Enterprises, Inc. | | |
| Class A | 16,932 | 197 |
* | Hawaiian Holdings, Inc. | 32,700 | 197 |
* | Amerco, Inc. | 5,279 | 196 |
| Heidrick & Struggles | | |
| International, Inc. | 10,744 | 196 |
* | Exponent, Inc. | 7,916 | 194 |
* | School Specialty, Inc. | 9,578 | 194 |
* | EnPro Industries, Inc. | 10,586 | 191 |
* | Furmanite Corp. | 42,405 | 189 |
| Kelly Services, Inc. Class A | 16,917 | 185 |
| Courier Corp. | 12,119 | 185 |
* | Air Transport Services | | |
| Group Inc. | 79,095 | 184 |
* | Ladish Co., Inc. | 13,856 | 180 |
* | Fuel-Tech N.V. | 18,500 | 179 |
* | Taser International Inc. | 38,898 | 177 |
* | MYR Group, Inc. | 8,700 | 176 |
| Titan International, Inc. | 23,447 | 175 |
* | Dynamex Inc. | 11,256 | 173 |
| | | Market |
| | | Value• |
| | Shares | ($000) |
*,^ | Microvision, Inc. | 54,605 | 168 |
* | American Commercial | | |
| Lines Inc. | 10,671 | 165 |
* | Columbus McKinnon Corp. | 13,025 | 165 |
| Viad Corp. | 9,499 | 164 |
* | COMSYS IT Partners Inc. | 27,425 | 160 |
| Eagle Bulk Shipping Inc. | 34,160 | 160 |
| Alamo Group, Inc. | 15,761 | 159 |
| John Bean | | |
| Technologies Corp. | 12,500 | 157 |
* | Republic Airways | | |
| Holdings Inc. | 23,766 | 155 |
| Great Lakes Dredge & | | |
| Dock Co. | 32,398 | 155 |
| Gorman-Rupp Co. | 7,647 | 154 |
* | Kforce Inc. | 18,575 | 154 |
* | ICT Group, Inc. | 17,578 | 153 |
* | GP Strategies Corp. | 25,900 | 153 |
* | Builders FirstSource, Inc. | 36,479 | 152 |
* | United Capital Corp. | 8,264 | 151 |
* | Cenveo Inc. | 35,380 | 150 |
* | GenCorp, Inc. | 77,714 | 148 |
| Diamond Management | | |
| and Technology | | |
| Consultants,Inc. | 34,547 | 145 |
| Tennant Co. | 7,615 | 140 |
* | Herley Industries Inc. | 12,694 | 139 |
* | Flow International Corp. | 57,133 | 134 |
*,^ | Ener1, Inc. | 24,414 | 133 |
| Barrett Business | | |
| Services, Inc. | 12,429 | 131 |
| Gibraltar Industries Inc. | 18,890 | 130 |
| Standex International Corp. | 11,055 | 128 |
* | Team, Inc. | 8,130 | 127 |
| LSI Industries Inc. | 23,206 | 126 |
| Graham Corp. | 9,500 | 126 |
* | Covenant Transport, Inc. | 22,375 | 123 |
| Met-Pro Corp. | 11,172 | 121 |
* | Active Power, Inc. | 135,830 | 118 |
* | Intersections Inc. | 24,856 | 115 |
*,^ | Capstone Turbine Corp. | 135,626 | 113 |
*,^ | C & D Technologies, Inc. | 54,659 | 109 |
* | Bluelinx Holdings Inc. | 35,311 | 106 |
* | EnerNOC Inc. | 4,880 | 106 |
* | Saia, Inc. | 5,787 | 104 |
| Kimball International, Inc. | | |
| Class B | 16,424 | 102 |
| TAL International Group, Inc. | 9,400 | 102 |
* | Kratos Defense & | | |
| Security Inc. | 113,628 | 101 |
* | Plug Power, Inc. | 109,686 | 100 |
| NACCO Industries, Inc. | | |
| Class A | 3,432 | 99 |
* | Kadant Inc. | 8,297 | 94 |
* | La Barge, Inc. | 10,000 | 93 |
| Horizon Lines Inc. | 23,792 | 92 |
32
Institutional Total Stock Market Index Fund
| | | Market |
| | | Value• |
| | Shares | ($000) |
* | PowerSecure | | |
| International, Inc. | 21,502 | 92 |
* | Lydall, Inc. | 25,403 | 86 |
* | Spherion Corp. | 20,596 | 85 |
* | Valence Technology Inc. | 47,372 | 85 |
* | Sterling | | |
| Construction Co., Inc. | 5,500 | 84 |
*,^ | Ascent Solar | | |
| Technologies, Inc. | 10,700 | 84 |
| Multi-Color Corp. | 6,796 | 83 |
* | Casella Waste Systems, Inc. | 41,353 | 82 |
* | Willis Lease Finance Corp. | 6,149 | 81 |
* | Pike Electric Corp. | 6,400 | 77 |
| Sun Hydraulics Corp. | 4,698 | 76 |
* | YRC Worldwide, Inc. | 41,484 | 72 |
* | AMREP Corp. | 6,452 | 71 |
| Todd Shipyards Corp. | 4,229 | 70 |
* | Ultralife Corp. | 9,557 | 69 |
| Lawson Products, Inc. | 4,805 | 68 |
| Sauer-Danfoss, Inc. | 11,064 | 68 |
* | Tecumseh Products Co. | | |
| Class A | 6,472 | 63 |
* | Pinnacle Airlines Corp. | 22,170 | 62 |
* | UQM Technologies, Inc. | 24,104 | 62 |
* | Magnatek, Inc. | 43,974 | 61 |
| Insteel Industries, Inc. | 7,400 | 61 |
* | P.A.M. Transportation | | |
| Services, Inc. | 11,085 | 61 |
| HEICO Corp. | 1,623 | 59 |
| Frozen Food Express | | |
| Industries, Inc. | 18,205 | 58 |
| Vicor Corp. | 7,786 | 56 |
| Hardinge, Inc. | 13,147 | 56 |
* | The Allied Defense | | |
| Group, Inc. | 12,200 | 54 |
| NN, Inc. | 31,792 | 53 |
| Freightcar America Inc. | 3,155 | 53 |
* | DXP Enterprises Inc | 4,544 | 52 |
* | Titan Machinery, Inc. | 4,100 | 52 |
* | Energy Recovery Inc. | 7,014 | 50 |
* | LMI Aerospace, Inc. | 4,860 | 49 |
* | Hudson Highland Group, Inc. | 24,935 | 49 |
* | Waste Services, Inc. | 9,297 | 48 |
* | Metalico, Inc. | 10,223 | 48 |
* | Astronics Corp. | 4,565 | 47 |
* | 3D Systems Corp. | 6,557 | 47 |
| L.S. Starrett Co. Class A | 6,936 | 47 |
* | Innotrac Corp. | 28,409 | 47 |
* | Innerworkings, Inc. | 9,500 | 45 |
* | Power-One, Inc. | 30,101 | 45 |
* | Ocean Power | | |
| Technologies, Inc. | 7,600 | 44 |
| Pacer International, Inc. | 19,398 | 43 |
* | Perma-Fix Environmental | | |
| Services, Inc. | 17,864 | 43 |
| Quixote Corp. | 14,944 | 42 |
* | WCA Waste Corp. | 11,166 | 42 |
| | | Market |
| | | Value• |
| | Shares | ($000) |
* | Arotech Corp. | 23,278 | 41 |
* | Protection One, Inc. | 9,526 | 41 |
* | K-Tron International, Inc | 501 | 40 |
* | TBS International Ltd. | 5,000 | 39 |
* | Park-Ohio Holdings Corp. | 11,101 | 38 |
* | Thermadyne Holdings Corp. | 10,400 | 37 |
* | Commercial Vehicle | | |
| Group Inc. | 25,191 | 36 |
* | ICF International, Inc. | 1,300 | 36 |
| Innovative Solutions and | | |
| Support, Inc. | 7,518 | 34 |
* | Standard Parking Corp. | 1,934 | 32 |
* | TRC Cos., Inc. | 7,654 | 31 |
| Schawk, Inc. | 3,900 | 29 |
* | Volt Information | | |
| Sciences Inc. | 4,579 | 29 |
*,^ | China Architectural | | |
| Engineering Inc. | 14,042 | 27 |
* | PMFG Inc. | 3,100 | 27 |
* | Fushi Copperweld, Inc. | 3,139 | 26 |
* | NCI Building Systems, Inc. | 9,794 | 26 |
* | GT Solar International Inc. | 4,700 | 25 |
* | Applied Energetics, Inc. | 50,645 | 24 |
* | Advanced Environmental | | |
| Recycling Technologies, Inc. | 78,462 | 23 |
* | Hill International Inc. | 5,000 | 22 |
* | LECG Corp. | 6,536 | 21 |
| The Standard Register Co. | 5,673 | 19 |
* | ExpressJet Holdings, Inc. | 13,282 | 18 |
| Virco Manufacturing Corp. | 5,113 | 18 |
* | First Advantage Corp. | | |
| Class A | 1,155 | 18 |
| Chase Corp. | 1,396 | 17 |
* | Quality Distribution Inc. | 8,134 | 16 |
* | Orion Energy Systems Inc. | 4,313 | 16 |
* | Hurco Cos., Inc. | 1,000 | 16 |
* | PRG-Schultz | | |
| International, Inc. | 5,568 | 15 |
| Sypris Solutions, Inc. | 10,878 | 13 |
*,^ | Document Security | | |
| Systems, Inc. | 6,900 | 13 |
*,^ | Medis Technology Ltd. | 26,088 | 13 |
* | Akeena Solar, Inc. | 8,400 | 11 |
| Omega Flex Inc. | 600 | 9 |
| Superior Uniform Group, Inc. | 1,093 | 8 |
| Wabash National Corp. | 10,509 | 7 |
* | Franklin Covey Co. | 929 | 6 |
| Twin Disc, Inc. | 600 | 4 |
* | A.T. Cross Co. Class A | 907 | 4 |
* | U.S. Home Systems, Inc. | 1,157 | 3 |
* | Argan Inc. | 200 | 3 |
* | Mesa Air Group Inc. | 25,176 | 3 |
* | Integrated Electrical | | |
| Services, Inc. | 200 | 2 |
* | BMC Industries, Inc. | 4,603 | — |
| | | 941,361 |
33
Institutional Total Stock Market Index Fund
| | | Market |
| | | Value• |
| | Shares | ($000) |
Information Technology (18.3%) | |
| Microsoft Corp. | 7,226,459 | 171,773 |
| International Business | | |
| Machines Corp. | 1,211,646 | 126,520 |
* | Apple Inc. | 804,283 | 114,554 |
* | Cisco Systems, Inc. | 5,271,631 | 98,263 |
* | Google Inc. | 217,014 | 91,491 |
| Hewlett-Packard Co. | 2,174,269 | 84,035 |
| Intel Corp. | 5,023,212 | 83,134 |
| Oracle Corp. | 3,645,947 | 78,096 |
| QUALCOMM Inc. | 1,489,670 | 67,333 |
| Visa Inc. | 405,600 | 25,253 |
| Texas Instruments, Inc. | 1,153,546 | 24,571 |
* | EMC Corp. | 1,844,183 | 24,159 |
| Corning, Inc. | 1,405,233 | 22,568 |
* | Dell Inc. | 1,581,352 | 21,712 |
* | Yahoo! Inc. | 1,191,347 | 18,656 |
| Accenture Ltd. | 548,804 | 18,363 |
* | eBay Inc. | 985,419 | 16,880 |
| Automatic Data | | |
| Processing, Inc. | 456,189 | 16,167 |
| Motorola, Inc. | 2,057,247 | 13,640 |
| MasterCard, Inc. Class A | 80,116 | 13,404 |
* | Adobe Systems, Inc. | 473,645 | 13,404 |
| Applied Materials, Inc. | 1,201,237 | 13,178 |
* | Symantec Corp. | 741,851 | 11,543 |
* | Juniper Networks, Inc. | 477,037 | 11,258 |
| Western Union Co. | 641,562 | 10,522 |
* | Broadcom Corp. | 385,057 | 9,546 |
* | Intuit, Inc. | 274,753 | 7,737 |
* | Tyco Electronics Ltd. | 413,563 | 7,688 |
| Paychex, Inc. | 293,375 | 7,393 |
* | Cognizant Technology | | |
| Solutions Corp. | 263,132 | 7,026 |
* | Activision Blizzard, Inc. | 539,826 | 6,818 |
* | Fiserv, Inc. | 144,688 | 6,612 |
| CA, Inc. | 375,113 | 6,538 |
| Analog Devices, Inc. | 263,125 | 6,520 |
* | Agilent Technologies, Inc. | 317,998 | 6,459 |
* | Electronic Arts Inc. | 290,779 | 6,316 |
* | Sun Microsystems, Inc. | 672,895 | 6,204 |
* | Computer Sciences Corp. | 136,894 | 6,064 |
* | NetApp, Inc. | 298,933 | 5,895 |
* | McAfee Inc. | 138,264 | 5,833 |
* | BMC Software, Inc. | 167,192 | 5,649 |
* | NVIDIA Corp. | 486,317 | 5,491 |
* | Marvell Technology | | |
| Group Ltd. | 470,809 | 5,480 |
* | Western Digital Corp. | 201,156 | 5,331 |
* | Citrix Systems, Inc. | 164,564 | 5,248 |
| Xilinx, Inc. | 248,281 | 5,080 |
| Xerox Corp. | 783,187 | 5,075 |
| Amphenol Corp. Class A | 154,973 | 4,903 |
| Linear Technology Corp. | 201,309 | 4,701 |
| Seagate Technology | 443,858 | 4,643 |
| Altera Corp. | 265,864 | 4,328 |
| | | Market |
| | | Value• |
| | Shares | ($000) |
| Maxim Integrated | | |
| Products, Inc. | 275,700 | 4,326 |
* | Autodesk, Inc. | 205,510 | 3,901 |
| KLA-Tencor Corp. | 153,356 | 3,872 |
* | Micron Technology, Inc. | 759,822 | 3,845 |
* | salesforce.com, inc. | 99,191 | 3,786 |
* | Teradata Corp. | 159,725 | 3,742 |
| Microchip Technology, Inc. | 164,939 | 3,719 |
* | Affiliated Computer | | |
| Services, Inc. Class A | 82,128 | 3,648 |
* | MEMC Electronic | | |
| Materials, Inc. | 203,916 | 3,632 |
* | Red Hat, Inc. | 172,626 | 3,475 |
| Fidelity National | | |
| Information Services, Inc. | 172,570 | 3,445 |
| Harris Corp. | 121,094 | 3,434 |
* | SAIC, Inc. | 183,075 | 3,396 |
* | VeriSign, Inc. | 173,612 | 3,208 |
* | Flextronics | | |
| International Ltd. | 734,498 | 3,019 |
* | SanDisk Corp. | 205,300 | 3,016 |
* | LAM Research Corp. | 114,201 | 2,969 |
* | Akamai Technologies, Inc. | 153,500 | 2,944 |
* | Avnet, Inc. | 136,345 | 2,867 |
* | FLIR Systems, Inc. | 125,941 | 2,841 |
* | Brocade Communications | | |
| Systems, Inc. | 350,855 | 2,744 |
| Global Payments Inc. | 72,876 | 2,730 |
* | LSI Corp. | 585,922 | 2,672 |
| National | | |
| Semiconductor Corp. | 207,946 | 2,610 |
* | ANSYS, Inc. | 81,392 | 2,536 |
* | Synopsys, Inc. | 129,261 | 2,522 |
* | Equinix, Inc. | 34,247 | 2,491 |
* | F5 Networks, Inc. | 71,745 | 2,482 |
* | ON Semiconductor Corp. | 355,146 | 2,436 |
* | Alliance Data Systems Corp. | 58,717 | 2,419 |
| Lender Processing | | |
| Services, Inc. | 86,484 | 2,402 |
* | Ingram Micro, Inc. Class A | 135,085 | 2,364 |
* | Sybase, Inc. | 73,676 | 2,309 |
* | Arrow Electronics, Inc. | 108,399 | 2,302 |
* | Hewitt Associates, Inc. | 76,503 | 2,278 |
* | Nuance | | |
| Communications, Inc. | 179,055 | 2,165 |
* | Trimble Navigation Ltd. | 109,040 | 2,140 |
* | Advanced Micro | | |
| Devices, Inc. | 552,469 | 2,138 |
* | Cree, Inc. | 72,551 | 2,132 |
* | Metavante Technologies | 81,840 | 2,116 |
| Broadridge Financial | | |
| Solutions LLC | 127,539 | 2,115 |
* | Macrovision Solutions Corp. | 94,035 | 2,051 |
| Total System Services, Inc. | 152,338 | 2,040 |
| FactSet Research | | |
| Systems Inc. | 40,589 | 2,024 |
34
Institutional Total Stock Market Index Fund
| | | Market |
| | | Value• |
| | Shares | ($000) |
* | Itron, Inc. | 35,924 | 1,978 |
* | Tellabs, Inc. | 344,396 | 1,973 |
* | CommScope, Inc. | 73,732 | 1,936 |
* | MICROS Systems, Inc. | 72,634 | 1,839 |
* | Dolby Laboratories Inc. | 47,786 | 1,781 |
* | Sohu.com Inc. | 27,730 | 1,742 |
* | Palm, Inc. | 103,934 | 1,722 |
* | NCR Corp. | 144,771 | 1,713 |
* | 3Com Corp. | 351,743 | 1,657 |
* | PMC Sierra Inc. | 202,128 | 1,609 |
* | Varian Semiconductor | | |
| Equipment Associates, Inc. | 66,606 | 1,598 |
* | NeuStar, Inc. Class A | 71,564 | 1,586 |
| Diebold, Inc. | 59,869 | 1,578 |
* | Polycom, Inc. | 76,378 | 1,548 |
* | VistaPrint Ltd. | 36,290 | 1,548 |
* | Compuware Corp. | 225,004 | 1,544 |
| Jack Henry & | | |
| Associates Inc. | 73,328 | 1,522 |
* | Solera Holdings, Inc. | 59,509 | 1,512 |
* | Tech Data Corp. | 45,676 | 1,494 |
* | Novellus Systems, Inc. | 89,194 | 1,490 |
| Molex, Inc. Class A | 102,692 | 1,477 |
* | Skyworks Solutions, Inc. | 150,650 | 1,473 |
* | Silicon Laboratories Inc. | 38,621 | 1,465 |
* | Atmel Corp. | 385,804 | 1,439 |
* | Novell, Inc. | 315,693 | 1,430 |
* | QLogic Corp. | 110,688 | 1,404 |
* | Rambus Inc. | 90,592 | 1,403 |
| Intersil Corp. | 111,318 | 1,399 |
* | IAC/InterActiveCorp | 86,829 | 1,394 |
* | Informatica Corp. | 79,691 | 1,370 |
* | Cadence Design | | |
| Systems, Inc. | 231,388 | 1,365 |
* | Arris Group Inc. | 112,256 | 1,365 |
* | DST Systems, Inc. | 36,406 | 1,345 |
* | Zebra Technologies Corp. | | |
| Class A | 55,315 | 1,309 |
* | VMware Inc. | 45,502 | 1,241 |
| National Instruments Corp. | 54,595 | 1,232 |
* | Parametric | | |
| Technology Corp. | 105,278 | 1,231 |
| Jabil Circuit, Inc. | 165,047 | 1,225 |
* | Digital River, Inc. | 33,574 | 1,219 |
* | Synaptics Inc. | 31,225 | 1,207 |
* | Perot Systems Corp. | 82,159 | 1,177 |
* | Riverbed Technology, Inc. | 50,306 | 1,167 |
* | CACI International, Inc. | 27,302 | 1,166 |
* | Cypress | | |
| Semiconductor Corp. | 125,707 | 1,157 |
* | Concur Technologies, Inc. | 37,145 | 1,154 |
* | TIBCO Software Inc. | 159,474 | 1,143 |
* | Lexmark International, Inc. | 71,475 | 1,133 |
* | JDS Uniphase Corp. | 197,818 | 1,132 |
* | Tessera Technologies, Inc. | 44,043 | 1,114 |
* | Data Domain, Inc. | 33,100 | 1,104 |
| | | Market |
| | | Value• |
| | Shares | ($000) |
| ADTRAN Inc. | 51,144 | 1,098 |
* | Vishay Intertechnology, Inc. | 158,285 | 1,075 |
* | Atheros | | |
| Communications, Inc. | 55,567 | 1,069 |
* | Teradyne, Inc. | 155,115 | 1,064 |
* | Anixter International Inc. | 27,579 | 1,037 |
* | Convergys Corp. | 111,343 | 1,033 |
* | Microsemi Corp. | 74,425 | 1,027 |
* | TiVo Inc. | 93,458 | 979 |
* | International Rectifier Corp. | 65,969 | 977 |
* | InterDigital, Inc. | 39,634 | 969 |
* | Starent Networks Corp. | 38,800 | 947 |
* | Tekelec | 54,725 | 921 |
* | CyberSource Corp. | 59,869 | 916 |
* | Integrated Device | | |
| Technology Inc. | 150,938 | 912 |
* | j2 Global | | |
| Communications, Inc. | 40,203 | 907 |
* | Semtech Corp. | 54,567 | 868 |
* | RF Micro Devices, Inc. | 228,171 | 858 |
* | Ciena Corp. | 82,441 | 853 |
* | Gartner, Inc. Class A | 55,844 | 852 |
* | Benchmark Electronics, Inc. | 59,000 | 850 |
* | Wright Express Corp. | 33,288 | 848 |
* | ManTech International Corp. | 19,636 | 845 |
* | Quest Software, Inc. | 60,516 | 844 |
| Plantronics, Inc. | 44,490 | 841 |
* | ValueClick, Inc. | 79,730 | 839 |
* | Genpact, Ltd. | 69,630 | 818 |
* | Euronet Worldwide, Inc. | 41,972 | 814 |
* | Fairchild Semiconductor | | |
| International, Inc. | 113,229 | 791 |
* | Blackboard Inc. | 27,423 | 791 |
* | FEI Co. | 34,472 | 789 |
* | Omniture, Inc. | 62,155 | 781 |
* | FormFactor Inc. | 45,236 | 780 |
* | Progress Software Corp. | 36,821 | 780 |
* | Ariba, Inc. | 79,077 | 778 |
* | Cymer, Inc. | 25,948 | 771 |
* | Plexus Corp. | 36,525 | 747 |
* | Checkpoint Systems, Inc. | 47,093 | 739 |
* | Websense, Inc. | 41,330 | 737 |
* | Emulex Corp. | 74,888 | 732 |
* | EarthLink, Inc. | 98,729 | 732 |
* | Wind River Systems Inc. | 63,397 | 727 |
* | Comtech | | |
| Telecommunications Corp. | 22,463 | 716 |
* | Infinera Corp. | 78,405 | 716 |
* | TriQuint Semiconductor, Inc. | 134,782 | 716 |
* | ADC | | |
| Telecommunications, Inc. | 89,322 | 711 |
| Syntel, Inc. | 22,426 | 705 |
* | SRA International, Inc. | 39,470 | 693 |
| Fair Isaac, Inc. | 44,361 | 686 |
* | Amkor Technology, Inc. | 144,894 | 685 |
* | Applied Micro Circuits Corp. | 84,007 | 683 |
35
Institutional Total Stock Market Index Fund
| | | Market |
| | | Value• |
| | Shares | ($000) |
| Take-Two Interactive | | |
| Software, Inc. | 71,615 | 678 |
* | Lawson Software, Inc. | 120,955 | 675 |
| Black Box Corp. | 20,098 | 673 |
* | Art Technology Group, Inc. | 176,197 | 670 |
* | Verigy Ltd. | 54,879 | 668 |
| MAXIMUS, Inc. | 16,141 | 666 |
* | VeriFone Holdings, Inc. | 88,397 | 664 |
* | ViaSat, Inc. | 25,891 | 664 |
* | Hittite Microwave Corp. | 18,482 | 642 |
* | Netlogic Microsystems Inc. | 17,377 | 634 |
| Blackbaud, Inc. | 40,218 | 625 |
* | EchoStar Corp. | 38,802 | 619 |
* | Cabot Microelectronics Corp. | 21,506 | 608 |
| Acxiom Corp. | 68,160 | 602 |
* | DTS Inc. | 22,219 | 601 |
* | Intermec, Inc. | 46,214 | 596 |
* | Coherent, Inc. | 28,775 | 595 |
* | ScanSource, Inc. | 24,069 | 590 |
* | Commvault Systems, Inc. | 35,588 | 590 |
* | L-1 Identity Solutions Inc. | 75,826 | 587 |
* | DealerTrack Holdings Inc. | 34,335 | 584 |
* | Blue Coat Systems, Inc. | 35,210 | 582 |
* | STEC Inc. | 24,917 | 578 |
* | Advent Software, Inc. | 17,599 | 577 |
* | Avocent Corp. | 41,239 | 576 |
* | SPSS, Inc. | 17,231 | 575 |
* | Sycamore Networks, Inc. | 182,604 | 572 |
* | JDA Software Group, Inc. | 38,018 | 569 |
* | Manhattan Associates, Inc. | 30,785 | 561 |
* | CSG Systems | | |
| International, Inc. | 42,295 | 560 |
* | AsiaInfo Holdings, Inc. | 31,200 | 537 |
* | Aruba Networks, Inc. | 61,000 | 533 |
* | Rofin-Sinar Technologies Inc. | 26,062 | 522 |
* | Harmonic, Inc. | 88,079 | 519 |
* | ACI Worldwide, Inc. | 36,610 | 511 |
* | Forrester Research, Inc. | 20,816 | 511 |
* | Tyler Technologies, Inc. | 32,584 | 509 |
* | MKS Instruments, Inc. | 38,408 | 507 |
* | Electronics for Imaging, Inc. | 47,099 | 502 |
* | Bankrate, Inc. | 19,725 | 498 |
* | Littelfuse, Inc. | 24,669 | 492 |
* | ATMI, Inc. | 31,464 | 489 |
* | Brightpoint, Inc. | 77,652 | 487 |
| Cognex Corp. | 34,097 | 482 |
* | Avid Technology, Inc. | 35,637 | 478 |
* | Unisys Corp. | 315,386 | 476 |
* | Insight Enterprises, Inc. | 48,332 | 467 |
* | Mentor Graphics Corp. | 85,308 | 467 |
* | OmniVision | | |
| Technologies, Inc. | 44,884 | 466 |
* | Constant Contact, Inc. | 23,413 | 465 |
* | Electro Scientific | | |
| Industries, Inc. | 41,302 | 462 |
* | Adaptec, Inc. | 172,673 | 458 |
| | | Market |
| | | Value• |
| | Shares | ($000) |
* | Advanced Energy | | |
| Industries, Inc. | 50,362 | 453 |
* | Cogent Inc. | 41,824 | 449 |
* | Harris Stratex Networks, Inc. | | |
| Class A | 68,427 | 443 |
* | ArcSight, Inc. | 24,840 | 441 |
* | TeleTech Holdings, Inc. | 28,827 | 437 |
* | EPIQ Systems, Inc. | 28,419 | 436 |
* | Echelon Corp. | 51,098 | 433 |
| NIC Inc. | 63,292 | 428 |
* | Anaren, Inc. | 23,350 | 413 |
* | ModusLink Global | | |
| Solutions, Inc. | 60,003 | 412 |
* | Epicor Software Corp. | 77,258 | 409 |
* | Actel Corp. | 37,853 | 406 |
* | Brooks Automation, Inc. | 89,710 | 402 |
* | Cirrus Logic, Inc. | 88,984 | 400 |
| AVX Corp. | 40,004 | 397 |
* | Comverge Inc. | 32,700 | 396 |
* | FARO Technologies, Inc. | 24,987 | 388 |
* | Sapient Corp. | 61,613 | 388 |
* | Rackspace Hosting, Inc. | 27,931 | 387 |
* | Cavium Networks, Inc. | 22,978 | 386 |
* | Monolithic Power Systems | 17,100 | 383 |
| IXYS Corp. | 37,753 | 382 |
* | GSI Commerce, Inc. | 26,799 | 382 |
* | THQ Inc. | 52,831 | 378 |
* | ANADIGICS, Inc. | 89,954 | 377 |
* | DG FastChannel Inc. | 19,962 | 365 |
* | Internet Capital Group Inc. | 53,998 | 363 |
| CTS Corp. | 55,417 | 363 |
| United Online, Inc. | 55,195 | 359 |
* | Diodes Inc. | 22,891 | 358 |
* | Digi International, Inc. | 36,332 | 354 |
* | RealNetworks, Inc. | 118,351 | 354 |
* | Cray, Inc. | 44,693 | 352 |
| Pegasystems Inc. | 13,340 | 352 |
* | The Knot, Inc. | 44,426 | 350 |
* | Actuate Software Corp. | 72,984 | 349 |
* | Novatel Wireless, Inc. | 38,498 | 347 |
* | Zoran Corp. | 31,584 | 344 |
* | Ciber, Inc. | 111,022 | 344 |
* | NETGEAR, Inc. | 23,864 | 344 |
* | Advanced Analogic | | |
| Technologies, Inc. | 74,401 | 342 |
* | FalconStor Software, Inc. | 70,336 | 334 |
| Cohu, Inc. | 36,880 | 331 |
| MTS Systems Corp. | 15,933 | 329 |
| Molex, Inc. | 21,054 | 327 |
| Park Electrochemical Corp. | 15,191 | 327 |
* | Sonus Networks, Inc. | 202,825 | 327 |
* | Rogers Corp. | 15,964 | 323 |
* | Sigma Designs, Inc. | 20,059 | 322 |
* | Ceva, Inc. | 36,858 | 320 |
* | The Ultimate Software | | |
| Group, Inc. | 13,196 | 320 |
36
Institutional Total Stock Market Index Fund
| | | Market |
| | | Value• |
| | Shares | ($000) |
* | Limelight Networks Inc. | 71,232 | 313 |
* | Bottomline | | |
| Technologies, Inc. | 34,162 | 308 |
* | Kulicke & Soffa | | |
| Industries, Inc. | 89,308 | 306 |
* | Computer Task Group, Inc. | 49,662 | 303 |
* | Entegris Inc. | 109,195 | 297 |
* | TNS Inc. | 15,491 | 290 |
* | MicroStrategy Inc. | 5,767 | 290 |
* | Multi-Fineline Electronix, Inc. | 13,280 | 284 |
* | Acme Packet, Inc. | 27,893 | 282 |
* | Liquidity Services, Inc. | 28,012 | 276 |
* | SYNNEX Corp. | 10,992 | 275 |
* | BigBand Networks Inc. | 52,311 | 270 |
* | NVE Corp. | 5,549 | 270 |
* | Kopin Corp. | 72,763 | 267 |
* | Double-Take Software Inc. | 30,755 | 266 |
* | Interactive Intelligence Inc. | 20,982 | 257 |
* | Borland Software Corp. | 199,305 | 257 |
| Electro Rent Corp. | 26,803 | 254 |
* | SAVVIS, Inc. | 22,147 | 254 |
| Micrel, Inc. | 34,524 | 253 |
* | Taleo Corp. Class A | 13,800 | 252 |
* | DSP Group Inc. | 36,852 | 249 |
* | Standard Microsystem Corp. | 12,109 | 248 |
* | InfoSpace, Inc. | 36,987 | 245 |
* | EMS Technologies, Inc. | 11,581 | 242 |
* | Exar Corp. | 33,606 | 242 |
| Heartland Payment | | |
| Systems, Inc. | 24,643 | 236 |
| Imation Corp. | 30,966 | 236 |
* | Radiant Systems, Inc. | 27,947 | 232 |
* | DivX, Inc. | 42,230 | 232 |
* | Extreme Networks, Inc. | 115,366 | 231 |
| Bel Fuse, Inc. Class B | 14,354 | 230 |
* | Lattice | | |
| Semiconductor Corp. | 120,194 | 226 |
| Methode Electronics, Inc. | | |
| Class A | 32,008 | 225 |
* | Oclaro Inc. | 347,987 | 222 |
* | Immersion Corp. | 44,631 | 220 |
* | ComScore Inc. | 16,510 | 220 |
* | Ebix, Inc. | 7,000 | 219 |
* | SonicWALL, Inc. | 39,618 | 217 |
* | Cogo Group, Inc. | 36,000 | 215 |
* | ActivIdentity Corp. | 84,209 | 213 |
* | Mercury Computer | | |
| Systems, Inc. | 22,853 | 211 |
| Agilysys, Inc. | 44,801 | 210 |
* | infoGROUP, Inc. | 36,494 | 208 |
* | KVH Industries, Inc. | 30,363 | 207 |
* | Global Cash Access, Inc. | 24,561 | 196 |
* | Globecomm Systems, Inc. | 26,984 | 194 |
* | The Hackett Group Inc. | 81,030 | 189 |
* | Entrust, Inc. | 104,287 | 189 |
* | Hypercom Corp. | 121,845 | 183 |
| | | Market |
| | | Value• |
| | Shares | ($000) |
* | Kenexa Corp. | 15,795 | 183 |
* | Loral Space and | | |
| Communications Ltd. | 7,036 | 181 |
| Renaissance Learning, Inc. | 19,631 | 181 |
* | Vignette Corp. | 13,645 | 179 |
* | MSC Software Corp. | 26,800 | 178 |
* | Keynote Systems Inc. | 23,286 | 178 |
* | Veeco Instruments, Inc. | 15,229 | 177 |
* | Openwave Systems Inc. | 78,483 | 176 |
| Imergent, Inc. | 25,067 | 175 |
| Daktronics, Inc. | 22,232 | 171 |
* | Dice Holdings Inc. | 36,707 | 171 |
* | Sanmina-SCI Corp. | 381,737 | 168 |
* | S1 Corp. | 24,148 | 167 |
* | Integral Systems, Inc. | 19,926 | 166 |
* | DDi Corp. | 36,156 | 164 |
| Technitrol, Inc. | 24,904 | 161 |
* | Internap Network | | |
| Services Corp. | 41,979 | 147 |
* | Chordiant Software, Inc. | 39,910 | 145 |
* | Isilon Systems Inc. | 34,077 | 144 |
* | TTM Technologies, Inc. | 17,959 | 143 |
* | Stratasys, Inc. | 12,934 | 142 |
* | CSR PLC | 24,411 | 141 |
* | Vocus, Inc. | 7,091 | 140 |
* | Callidus Software Inc. | 49,123 | 140 |
* | Integrated Silicon | | |
| Solution, Inc. | 52,648 | 140 |
* | Perficient, Inc. | 19,948 | 139 |
* | ExlService Holdings, Inc. | 12,319 | 138 |
* | California Micro | | |
| Devices Corp. | 56,097 | 138 |
| iGATE Corp. | 20,828 | 138 |
* | Finisar Corp. | 241,621 | 138 |
* | Soapstone Networks Inc. | 32,671 | 137 |
* | Move, Inc. | 61,912 | 134 |
* | American Technology Corp. | 69,381 | 132 |
* | Conexant Systems, Inc. | 90,185 | 132 |
* | OSI Systems Inc. | 6,300 | 131 |
* | Intevac, Inc. | 14,937 | 130 |
* | ShoreTel, Inc. | 16,180 | 129 |
* | LoJack Corp. | 30,792 | 129 |
* | Universal Display Corp. | 12,962 | 127 |
* | EMCORE Corp. | 97,668 | 123 |
* | Oplink Communications, Inc. | 10,658 | 122 |
* | Virage Logic Corp. | 26,890 | 121 |
* | Ixia | 17,492 | 118 |
* | Axcelis Technologies, Inc. | 248,409 | 114 |
* | Network Equipment | | |
| Technologies, Inc. | 26,765 | 114 |
* | Telecommunication | | |
| Systems, Inc. | 15,928 | 113 |
* | Netezza Corp. | 13,300 | 111 |
* | 3PAR, Inc. | 8,600 | 107 |
* | Synchronoss | | |
| Technologies, Inc. | 8,670 | 106 |
37
Institutional Total Stock Market Index Fund
| | | Market |
| | | Value• |
| | Shares | ($000) |
* | RadiSys Corp. | 11,734 | 106 |
* | Silicon Image, Inc. | 45,871 | 106 |
| American Software, Inc. | | |
| Class A | 18,264 | 105 |
* | Silicon Graphics | | |
| International Corp. | 23,021 | 105 |
* | Startek, Inc. | 12,679 | 102 |
* | Supertex, Inc. | 3,969 | 100 |
* | LoopNet, Inc. | 12,850 | 100 |
* | Terremark Worldwide, Inc. | 17,066 | 99 |
* | Volterra Semiconductor Corp. | 7,500 | 99 |
* | Concurrent Computer Corp. | 17,116 | 98 |
* | Ultratech, Inc. | 7,896 | 97 |
* | NetScout Systems, Inc. | 10,296 | 97 |
* | SuccessFactors Inc. | 10,500 | 96 |
* | MoneyGram | | |
| International, Inc. | 53,946 | 96 |
* | Newport Corp. | 16,557 | 96 |
* | Lionbridge Technologies, Inc. | 51,299 | 94 |
* | PC-Tel, Inc. | 17,396 | 93 |
* | AuthentiDate Holding Corp. | 76,876 | 92 |
* | Gerber Scientific, Inc. | 36,466 | 91 |
* | SeaChange International, Inc. | 11,274 | 91 |
* | Powerwave | | |
| Technologies, Inc. | 55,133 | 89 |
* | Maxwell Technologies, Inc. | 6,340 | 88 |
* | Saba Software, Inc. | 22,394 | 86 |
* | VASCO Data Security | | |
| International, Inc. | 11,679 | 85 |
* | Edgewater Technology, Inc. | 31,838 | 82 |
* | LTX-Credence Corp. | 173,661 | 82 |
| Cass Information | | |
| Systems, Inc. | 2,485 | 81 |
| OPNET Technologies, Inc. | 8,762 | 80 |
* | Smith Micro Software, Inc. | 8,157 | 80 |
* | Switch and Data Inc. | 6,809 | 80 |
* | Quantum Corp. | 93,687 | 78 |
* | Hughes Communications Inc. | 3,400 | 78 |
* | iPass Inc. | 48,300 | 77 |
* | NetSuite Inc. | 6,300 | 74 |
* | Sonic Solutions, Inc. | 24,739 | 73 |
* | Silicon Storage | | |
| Technology, Inc. | 38,096 | 71 |
* | Hutchinson Technology, Inc. | 36,235 | 71 |
* | IPG Photonics Corp. | 6,300 | 69 |
* | Aware, Inc. | 24,948 | 69 |
*,^ | Access Intergrated | | |
| Technologies Inc. | 66,166 | 67 |
* | AuthenTec, Inc. | 37,097 | 66 |
* | Measurement | | |
| Specialties, Inc. | 9,379 | 66 |
* | Dot Hill Systems Corp. | 81,746 | 66 |
* | Online Resources Corp. | 10,489 | 65 |
* | TranSwitch Corp. | 130,663 | 65 |
* | Symmetricom Inc. | 11,037 | 64 |
| | | Market |
| | | Value• |
| | Shares | ($000) |
* | Mindspeed | | |
| Technologies Inc. | 29,313 | 63 |
* | Support.com, Inc. | 28,656 | 62 |
* | LivePerson, Inc. | 15,595 | 62 |
* | Pericom | | |
| Semiconductor Corp. | 7,354 | 62 |
* | Dynamics Research Corp. | 6,159 | 62 |
* | UTStarcom, Inc. | 37,662 | 61 |
* | Symyx Technologies, Inc. | 10,375 | 61 |
* | Lasercard Corp. | 18,024 | 60 |
* | Super Micro Computer Inc. | 7,457 | 57 |
* | Presstek, Inc. | 40,414 | 56 |
* | Nu Horizons | | |
| Electronics Corp. | 16,256 | 54 |
* | MIPS Technologies, Inc. | 18,092 | 54 |
* | CyberOptics Corp. | 9,517 | 54 |
* | WebMD Health Corp. | | |
| Class A | 1,800 | 54 |
* | SRS Labs, Inc. | 7,958 | 53 |
* | Photronics, Inc. | 12,399 | 50 |
* | Sumtotal Systems Inc. | 10,284 | 49 |
* | SourceForge Inc. | 39,329 | 49 |
* | GSE Systems, Inc. | 7,184 | 48 |
* | RightNow Technologies Inc. | 4,100 | 48 |
* | Rudolph Technologies, Inc. | 8,740 | 48 |
* | Web.com Group, Inc. | 8,564 | 48 |
| Marchex, Inc. | 14,160 | 48 |
* | Entropic | | |
| Communications Inc. | 20,335 | 46 |
* | Magma Design | | |
| Automation, Inc. | 31,132 | 45 |
* | OpenTV Corp. | 32,700 | 43 |
* | On2 Technologies, Inc. | 101,265 | 43 |
* | PC Connection, Inc. | 7,935 | 42 |
* | PROS Holdings, Inc. | 5,100 | 41 |
* | Trident Microsystems, Inc. | 23,681 | 41 |
* | Autobytel Inc. | 95,503 | 41 |
* | Internet Brands Inc. | 5,800 | 41 |
* | Ness Technologies Inc. | 9,900 | 39 |
* | PLX Technology, Inc. | 10,154 | 38 |
* | Zygo Corp. | 7,741 | 36 |
* | Digital Angel Corp. | 24,338 | 35 |
* | Airvana, Inc. | 5,500 | 35 |
* | China Information Security | | |
| Technology, Inc. | 11,907 | 34 |
* | LookSmart, Ltd. | 24,938 | 33 |
* | Information Services | | |
| Group, Inc. | 11,000 | 33 |
* | Nanometrics Inc. | 12,155 | 33 |
* | DemandTec, Inc. | 3,692 | 32 |
* | PLATO Learning, Inc. | 8,094 | 32 |
* | RAE Systems, Inc. | 22,642 | 31 |
* | Spectrum Control, Inc. | 3,510 | 31 |
* | Smart Modular | | |
| Technologies Inc. | 13,386 | 30 |
| TheStreet.com, Inc. | 14,302 | 30 |
38
Institutional Total Stock Market Index Fund
| | | Market |
| | | Value• |
| | Shares | ($000) |
*,^ | Wave Systems Corp. | | |
| Class A | 27,132 | 30 |
* | Datalink Corp. | 6,944 | 30 |
* | Rimage Corp. | 1,773 | 29 |
* | Endwave Corp. | 11,401 | 29 |
*,^ | Superconductor | | |
| Technologies Inc. | 7,694 | 29 |
* | Phoenix Technologies Ltd. | 10,207 | 28 |
* | PAR Technology Corp. | 4,300 | 27 |
* | BSQUARE Corp. | 9,140 | 27 |
* | White Electronic | | |
| Designs Corp. | 5,637 | 26 |
* | Ditech Networks Inc. | 20,601 | 26 |
* | TechTeam Global, Inc. | 3,748 | 25 |
* | Analysts International Corp. | 43,421 | 24 |
* | NCI, Inc. | 800 | 24 |
* | Calamp Corp. | 29,196 | 23 |
* | ParkerVision, Inc. | 7,288 | 22 |
* | I.D. Systems, Inc. | 6,074 | 22 |
* | Rainmaker Systems, Inc. | 13,990 | 21 |
| Bel Fuse, Inc. Class A | 1,477 | 21 |
| Keithley Instruments Inc. | 5,060 | 20 |
* | MoSys, Inc. | 12,209 | 20 |
* | Leadis Technology Inc. | 31,952 | 20 |
* | WebMediaBrands Inc. | 36,066 | 20 |
* | Lantronix, Inc. | 41,675 | 19 |
* | Tollgrade | | |
| Communications, Inc. | 3,588 | 19 |
* | GSI Group, Inc. | 18,784 | 18 |
| QAD Inc. | 5,641 | 18 |
* | FSI International, Inc. | 43,508 | 18 |
* | QuickLogic Corp. | 11,838 | 17 |
* | Zhone Technologies | 51,901 | 17 |
* | Planar Systems, Inc. | 13,595 | 16 |
* | OpNext, Inc. | 7,514 | 16 |
* | Orbcomm, Inc. | 8,800 | 15 |
* | Convera Corp. | 81,202 | 15 |
* | Telular Corp. | 7,011 | 15 |
* | PDF Solutions, Inc. | 5,752 | 15 |
* | Mattson Technology, Inc. | 11,305 | 13 |
* | SCM Microsystems, Inc. | 5,161 | 12 |
* | Pixelworks, Inc. | 6,860 | 11 |
* | Comarco, Inc. | 6,117 | 11 |
* | Merix Corp. | 13,354 | 10 |
* | Digital Ally, Inc. | 4,500 | 10 |
* | X-Rite Inc. | 5,944 | 9 |
*,^ | Research Frontiers, Inc. | 2,434 | 9 |
| Richardson Electronics, Ltd. | 2,516 | 8 |
* | Network Engines, Inc. | 10,019 | 8 |
* | Zix Corp. | 4,904 | 7 |
* | Ramtron International Corp. | 6,348 | 7 |
* | Westell Technologies, Inc. | 12,309 | 7 |
* | Techwell, Inc. | 800 | 7 |
| Selectica, Inc. | 16,188 | 7 |
* | eLoyalty Corp. | 859 | 7 |
* | Evolving Systems, Inc. | 2,413 | 6 |
| | | Market |
| | | Value• |
| | Shares | ($000) |
* | Nextwave Wireless Inc. | 12,200 | 6 |
* | TransAct Technologies Inc. | 1,134 | 6 |
* | Vertro, Inc. | 24,139 | 5 |
* | EFJ, Inc. | 7,007 | 4 |
* | Allen Organ Co. | | |
| Escrow Shares | 283 | 3 |
* | Semitool, Inc. | 621 | 3 |
* | LeCroy Corp. | 387 | 1 |
* | Management Network | | |
| Group Inc. | 2,896 | 1 |
* | Frequency Electronics, Inc. | 283 | 1 |
* | iGo, Inc. | 1,228 | 1 |
* | Wireless Telecom Group, Inc. | 1,279 | 1 |
| | | 1,662,835 |
Materials (3.6%) | | |
| Monsanto Co. | 494,552 | 36,765 |
| E.I. du Pont de | | |
| Nemours & Co. | 815,572 | 20,895 |
| Praxair, Inc. | 277,475 | 19,720 |
| Freeport-McMoRan | | |
| Copper & Gold, Inc. | | |
| Class B | 371,982 | 18,640 |
| Newmont Mining Corp. | | |
| (Holding Co.) | 432,375 | 17,671 |
| Dow Chemical Co. | 954,186 | 15,401 |
| Nucor Corp. | 283,710 | 12,605 |
| Air Products & | | |
| Chemicals, Inc. | 189,368 | 12,231 |
| Alcoa Inc. | 858,721 | 8,871 |
| Ecolab, Inc. | 215,160 | 8,389 |
| PPG Industries, Inc. | 148,349 | 6,513 |
| The Mosaic Co. | 140,846 | 6,240 |
| Weyerhaeuser Co. | 191,304 | 5,821 |
| International Paper Co. | 368,144 | 5,570 |
| Sigma-Aldrich Corp. | 110,686 | 5,486 |
| Vulcan Materials Co. | 110,774 | 4,774 |
| United States Steel Corp. | 126,801 | 4,532 |
* | Owens-Illinois, Inc. | 151,705 | 4,249 |
| Ball Corp. | 80,785 | 3,648 |
* | Crown Holdings, Inc. | 144,517 | 3,489 |
| CF Industries Holdings, Inc. | 41,741 | 3,095 |
| Celanese Corp. Series A | 130,223 | 3,093 |
| Martin Marietta | | |
| Materials, Inc. | 37,626 | 2,968 |
| FMC Corp. | 62,651 | 2,963 |
| Lubrizol Corp. | 61,130 | 2,892 |
| Cliffs Natural | | |
| Resources Inc. | 116,700 | 2,856 |
| Allegheny Technologies Inc. | 79,628 | 2,781 |
| Airgas, Inc. | 66,072 | 2,678 |
| Sealed Air Corp. | 143,263 | 2,643 |
* | Pactiv Corp. | 119,320 | 2,589 |
| MeadWestvaco Corp. | 155,122 | 2,546 |
| Steel Dynamics, Inc. | 172,268 | 2,538 |
| Eastman Chemical Co. | 65,892 | 2,497 |
39
Institutional Total Stock Market Index Fund
| | | Market |
| | | Value• |
| | Shares | ($000) |
| International Flavors & | | |
| Fragrances, Inc. | 71,423 | 2,337 |
| Reliance Steel & | | |
| Aluminum Co. | 60,109 | 2,308 |
| Bemis Co., Inc. | 90,608 | 2,283 |
| Terra Industries, Inc. | 90,414 | 2,190 |
| Sonoco Products Co. | 90,907 | 2,177 |
| Nalco Holding Co. | 124,361 | 2,094 |
| AptarGroup Inc. | 60,927 | 2,058 |
| Valspar Corp. | 86,466 | 1,948 |
| AK Steel Holding Corp. | 100,774 | 1,934 |
| Ashland, Inc. | 63,795 | 1,789 |
| Walter Industries, Inc. | 49,262 | 1,785 |
| Albemarle Corp. | 66,019 | 1,688 |
| RPM International, Inc. | 116,614 | 1,637 |
| Compass Minerals | | |
| International, Inc. | 29,699 | 1,631 |
| Commercial Metals Co. | 101,665 | 1,630 |
| Packaging Corp. of America | 93,084 | 1,508 |
| Scotts Miracle-Gro Co. | 42,003 | 1,472 |
| Royal Gold, Inc. | 35,296 | 1,472 |
| Rock-Tenn Co. | 33,175 | 1,266 |
| Temple-Inland Inc. | 91,945 | 1,206 |
| Silgan Holdings, Inc. | 24,243 | 1,189 |
* | Intrepid Potash, Inc. | 41,109 | 1,154 |
| Schnitzer Steel | | |
| Industries, Inc. Class A | 19,699 | 1,041 |
| Sensient Technologies Corp. | 44,037 | 994 |
| Titanium Metals Corp. | 107,537 | 988 |
| Greif Inc. Class A | 22,016 | 974 |
| Eagle Materials, Inc. | 37,868 | 956 |
| Carpenter Technology Corp. | 40,609 | 845 |
| Olin Corp. | 70,822 | 842 |
| H.B. Fuller Co. | 44,412 | 834 |
* | OM Group, Inc. | 28,048 | 814 |
* | W.R. Grace & Co. | 65,632 | 812 |
| Cytec Industries, Inc. | 43,492 | 810 |
| Huntsman Corp. | 151,193 | 761 |
| Cabot Corp. | 59,745 | 752 |
| NewMarket Corp. | 11,100 | 747 |
| Worthington Industries, Inc. | 57,800 | 739 |
^ | Texas Industries, Inc. | 21,953 | 688 |
* | Calgon Carbon Corp. | 46,357 | 644 |
| Minerals Technologies, Inc. | 17,435 | 628 |
* | Coeur d’Alene Mines Corp. | 50,886 | 626 |
| AMCOL International Corp. | 28,531 | 616 |
* | Solutia Inc. | 106,851 | 615 |
* | Rockwood Holdings, Inc. | 41,289 | 605 |
| Arch Chemicals, Inc. | 22,656 | 557 |
| Balchem Corp. | 21,777 | 534 |
* | Hecla Mining Co. | 197,177 | 528 |
* | RTI International Metals, Inc. | 27,849 | 492 |
| Koppers Holdings, Inc. | 16,800 | 443 |
| Schweitzer-Mauduit | | |
| International, Inc. | 15,876 | 432 |
| | | Market |
| | | Value• |
| | Shares | ($000) |
* | Brush Engineered | | |
| Materials Inc. | 24,533 | 411 |
| Glatfelter | 43,143 | 384 |
| American Vanguard Corp. | 33,835 | 382 |
| Kaiser Aluminum Corp. | 10,537 | 378 |
* | Louisiana-Pacific Corp. | 109,946 | 376 |
* | Allied Nevada Gold Corp. | 42,450 | 342 |
| Deltic Timber Corp. | 8,800 | 312 |
* | Century Aluminum Co. | 45,855 | 286 |
| A.M. Castle & Co. | 22,366 | 270 |
| Innophos Holdings Inc. | 15,200 | 257 |
* | Buckeye Technology, Inc. | 54,398 | 244 |
| Myers Industries, Inc. | 29,257 | 243 |
| Ferro Corp. | 83,761 | 230 |
* | Zoltek Cos., Inc. | 23,175 | 225 |
| Stepan Co. | 5,080 | 224 |
* | Clearwater Paper Corp. | 8,760 | 222 |
| Zep, Inc. | 18,121 | 218 |
| Spartech Corp. | 23,395 | 215 |
| Innospec, Inc. | 19,088 | 205 |
| Olympic Steel, Inc. | 8,280 | 203 |
* | Haynes International, Inc. | 8,343 | 198 |
| Westlake Chemical Corp. | 9,319 | 190 |
* | Landec Corp. | 27,739 | 188 |
| A. Schulman Inc. | 12,164 | 184 |
* | Graphic Packaging | | |
| Holding Co. | 95,345 | 175 |
| Neenah Paper Inc. | 18,301 | 161 |
* | U.S. Concrete, Inc. | 79,696 | 158 |
* | General Moly, Inc. | 68,245 | 152 |
| Hawkins, Inc. | 6,649 | 150 |
| Wausau Paper Corp. | 22,140 | 149 |
* | Stillwater Mining Co. | 25,505 | 146 |
* | Omnova Solutions Inc. | 41,509 | 135 |
* | U.S. Gold Corp. | 47,800 | 126 |
* | LSB Industries, Inc. | 7,400 | 120 |
| Quaker Chemical Corp. | 8,828 | 117 |
* | U.S. Energy Corp. | 58,138 | 116 |
*,^ | Altair Nanotechnology Inc. | 115,825 | 110 |
* | GenTek, Inc. | 4,845 | 108 |
* | PolyOne Corp. | 38,843 | 105 |
* | Headwaters Inc. | 29,854 | 100 |
* | Horsehead Holding Corp. | 12,700 | 95 |
* | AEP Industries, Inc. | 2,619 | 69 |
| Penford Corp. | 10,007 | 58 |
* | Nonophase | | |
| Technologies Corp. | 45,851 | 50 |
* | Universal Stainless & | | |
| Alloy Products, Inc. | 3,011 | 49 |
* | Flotek Industries, Inc. | 24,106 | 49 |
* | American Pacific Corp. | 6,475 | 41 |
| Great Northern Iron | | |
| Ore Properties | 400 | 35 |
* | Mercer International Inc. | 31,581 | 18 |
| Georgia Gulf Corp. | 26,489 | 17 |
* | ADA-ES Inc. | 3,100 | 12 |
40
Institutional Total Stock Market Index Fund
| | | Market |
| | | Value• |
| | Shares | ($000) |
* | Senomyx, Inc. | 4,700 | 10 |
* | ICO, Inc. | 2,400 | 7 |
* | China Direct Industires | 2,234 | 4 |
| Verso Paper Corp. | 2,500 | 3 |
| | | 325,754 |
Other (0.1%) | | |
2 | Miscellaneous Securities | | 5,515 |
| | | |
Telecommunication Services (3.1%) | |
| AT&T Inc. | 5,322,430 | 132,209 |
| Verizon | | |
| Communications Inc. | 2,565,397 | 78,835 |
* | Sprint Nextel Corp. | 2,513,963 | 12,092 |
* | American Tower Corp. | | |
| Class A | 358,802 | 11,313 |
* | Crown Castle | | |
| International Corp. | 261,366 | 6,278 |
| Qwest Communications | | |
| International Inc. | 1,392,528 | 5,779 |
| Embarq Corp. | 129,078 | 5,429 |
| Windstream Corp. | 400,367 | 3,347 |
* | MetroPCS | | |
| Communications Inc. | 222,080 | 2,956 |
* | NII Holdings Inc. | 150,352 | 2,867 |
| CenturyTel, Inc. | 90,941 | 2,792 |
| Telephone & | | |
| Data Systems, Inc. | 83,593 | 2,366 |
* | SBA Communications Corp. | 96,380 | 2,365 |
* | Level 3 | | |
| Communications, Inc. | 1,458,193 | 2,202 |
| Frontier | | |
| Communications Corp. | 283,163 | 2,022 |
* | Leap Wireless | | |
| International, Inc. | 56,231 | 1,852 |
* | tw telecom inc. | 135,820 | 1,395 |
* | Syniverse Holdings Inc. | 59,500 | 954 |
* | U.S. Cellular Corp. | 17,417 | 670 |
* | Centennial Communications | | |
| Corp. Class A | 79,387 | 664 |
* | Neutral Tandem, Inc. | 20,500 | 605 |
* | Cincinnati Bell Inc. | 209,917 | 596 |
* | Premiere Global | | |
| Services, Inc. | 53,306 | 578 |
| Atlantic Tele-Network, Inc. | 14,100 | 554 |
| NTELOS Holdings Corp. | 29,864 | 550 |
| Shenandoah | | |
| Telecommunications Co. | 20,075 | 407 |
| Alaska Communications | | |
| Systems Holdings, Inc. | 54,957 | 402 |
* | General Communication, Inc. | 44,283 | 307 |
* | Cogent Communications | | |
| Group, Inc. | 37,241 | 303 |
| USA Mobility, Inc. | 20,210 | 258 |
* | Cbeyond Inc. | 17,185 | 247 |
| | | Market |
| | | Value• |
| | Shares | ($000) |
| Consolidated | | |
| Communications | | |
| Holdings, Inc. | 20,136 | 236 |
| D&E Communications, Inc. | 21,441 | 219 |
| Iowa Telecommunications | | |
| Services Inc. | 16,936 | 212 |
* | iPCS, Inc. | 13,308 | 199 |
| Telephone & | | |
| Data Systems, Inc. - | | |
| Special Common Shares | 7,633 | 198 |
| Hickory Tech Corp. | 22,563 | 173 |
* | PAETEC Holding Corp. | 56,943 | 154 |
* | Global Crossing Ltd. | 15,376 | 141 |
* | SureWest Communications | 9,822 | 103 |
* | Arbinet Holdings, Inc. | 42,059 | 73 |
* | Fibertower Corp. | 126,595 | 63 |
* | TerreStar Corp. | 41,208 | 63 |
| FairPoint | | |
| Communications, Inc. | 91,421 | 55 |
* | Vonage Holdings Corp. | 121,632 | 46 |
* | iBasis, Inc. | 31,232 | 41 |
* | ICO Global Communications | | |
| (Holdings) Ltd. | 60,605 | 38 |
* | 8X8 Inc. | 42,143 | 25 |
* | IDT Corp. Class B | 9,967 | 16 |
* | IDT Corp. | 552 | 1 |
| | | 285,250 |
Utilities (4.1%) | | |
| Exelon Corp. | 594,821 | 30,461 |
| Southern Co. | 702,639 | 21,894 |
| FPL Group, Inc. | 350,985 | 19,957 |
| Dominion Resources, Inc. | 527,212 | 17,619 |
| Duke Energy Corp. | 1,149,443 | 16,770 |
| Public Service Enterprise | | |
| Group, Inc. | 457,166 | 14,917 |
| Entergy Corp. | 171,069 | 13,261 |
| PG&E Corp. | 330,307 | 12,697 |
| American Electric | | |
| Power Co., Inc. | 420,831 | 12,158 |
| PPL Corp. | 338,455 | 11,155 |
| FirstEnergy Corp. | 275,413 | 10,672 |
| Sempra Energy | 208,940 | 10,370 |
| Progress Energy, Inc. | 249,387 | 9,434 |
| Consolidated Edison Inc. | 247,400 | 9,258 |
| Edison International | 279,645 | 8,798 |
| Xcel Energy, Inc. | 405,480 | 7,465 |
* | AES Corp. | 602,020 | 6,989 |
* | NRG Energy, Inc. | 214,050 | 5,557 |
| Questar Corp. | 157,156 | 4,881 |
| Ameren Corp. | 192,549 | 4,793 |
| DTE Energy Co. | 147,895 | 4,733 |
| Constellation Energy | | |
| Group, Inc. | 162,653 | 4,323 |
| Wisconsin Energy Corp. | 105,993 | 4,315 |
| Allegheny Energy, Inc. | 153,496 | 3,937 |
| EQT Corp. | 112,742 | 3,936 |
41
Institutional Total Stock Market Index Fund
| | | Market |
| | | Value• |
| | Shares | ($000) |
| Northeast Utilities | 156,501 | 3,492 |
* | Calpine Corp. | 311,824 | 3,477 |
| CenterPoint Energy Inc. | 299,237 | 3,316 |
| SCANA Corp. | 101,045 | 3,281 |
| NSTAR | 96,871 | 3,110 |
| MDU Resources Group, Inc. | 158,253 | 3,002 |
| NiSource, Inc. | 249,320 | 2,907 |
| Pinnacle West Capital Corp. | 91,469 | 2,758 |
| ONEOK, Inc. | 90,932 | 2,682 |
| Pepco Holdings, Inc. | 196,299 | 2,638 |
| Alliant Energy Corp. | 100,501 | 2,626 |
| UGI Corp. Holding Co. | 98,183 | 2,503 |
| CMS Energy Corp. | 205,504 | 2,482 |
| Energen Corp. | 62,072 | 2,477 |
| DPL Inc. | 105,524 | 2,445 |
| OGE Energy Corp. | 86,095 | 2,438 |
| National Fuel Gas Co. | 65,109 | 2,349 |
| NV Energy Inc. | 213,217 | 2,301 |
* | Mirant Corp. | 142,795 | 2,248 |
| AGL Resources Inc. | 70,081 | 2,229 |
| Aqua America, Inc. | 123,235 | 2,206 |
| TECO Energy, Inc. | 183,235 | 2,186 |
| Integrys Energy Group, Inc. | 69,710 | 2,091 |
| Atmos Energy Corp. | 83,258 | 2,085 |
| ITC Holdings Corp. | 44,817 | 2,033 |
| Great Plains Energy, Inc. | 120,537 | 1,874 |
| Westar Energy, Inc. | 99,067 | 1,859 |
| American Water | | |
| Works Co., Inc. | 87,112 | 1,665 |
| Vectren Corp. | 69,678 | 1,633 |
| Piedmont Natural Gas, Inc. | 66,840 | 1,611 |
* | RRI Energy, Inc. | 320,762 | 1,607 |
| Hawaiian Electric | | |
| Industries Inc. | 82,867 | 1,579 |
| WGL Holdings Inc. | 45,965 | 1,472 |
| New Jersey Resources Corp. | 38,320 | 1,419 |
| Nicor Inc. | 40,764 | 1,411 |
| Portland General Electric Co. | 67,496 | 1,315 |
| Cleco Corp. | 55,251 | 1,239 |
| IDACORP, Inc. | 42,877 | 1,121 |
| Northwest Natural Gas Co. | 24,319 | 1,078 |
* | Dynegy, Inc. | 455,106 | 1,033 |
| South Jersey Industries, Inc. | 27,272 | 951 |
| Avista Corp. | 50,008 | 891 |
| Southwest Gas Corp. | 39,761 | 883 |
| UniSource Energy Corp. | 32,571 | 864 |
| PNM Resources Inc. | 79,357 | 850 |
| Black Hills Corp. | 35,427 | 814 |
| Ormat Technologies Inc. | 18,867 | 761 |
| NorthWestern Corp. | 32,525 | 740 |
| ALLETE, Inc. | 25,614 | 736 |
| MGE Energy, Inc. | 21,399 | 718 |
| CH Energy Group, Inc. | 14,646 | 684 |
| California Water | | |
| Service Group | 18,053 | 665 |
| The Laclede Group, Inc. | 19,552 | 648 |
| | | Market |
| | | Value• |
| | Shares | ($000) |
* | El Paso Electric Co. | 41,759 | 583 |
| American States Water Co. | 16,127 | 559 |
| Empire District Electric Co. | 32,193 | 532 |
| UIL Holdings Corp. | 22,077 | 496 |
| SJW Corp. | 16,003 | 363 |
| Connecticut Water | | |
| Services, Inc. | 14,493 | 314 |
| Southwest Water Co. | 48,263 | 266 |
| Central Vermont Public | | |
| Service Corp. | 14,625 | 265 |
| Chesapeake Utilities Corp. | 8,046 | 262 |
| Consolidated Water Co., Ltd. | 11,813 | 187 |
| Maine & Maritimes Corp. | 3,424 | 119 |
| Middlesex Water Co. | 6,752 | 98 |
* | Cadiz Inc. | 9,506 | 92 |
| The York Water Co. | 1,850 | 28 |
| Unitil Corp. | 1,088 | 22 |
* | Synthesis Energy | | |
| Systems, Inc. | 15,100 | 17 |
| | | 372,036 |
Total Common Stocks | | |
(Cost $11,380,186) | | 8,989,420 |
Temporary Cash Investments (1.1%)1 | |
Money Market Fund (1.0%) | | |
3,4 | Vanguard Market | | |
| Liquidity Fund, 0.395% | 90,436,644 | 90,437 |
| | | |
| | | |
| | Face | |
| | Amount | |
| | ($000) | |
U.S. Government and Agency Obligations (0.1%) |
5,6 | Federal National | | |
| Mortgage Assn., | | |
| 0.531%, 7/31/09 | 2,000 | 2,000 |
5,6 | Federal Home Loan | | |
| Mortgage Corp., | | |
| 0.592%, 8/26/09 | 3,000 | 2,999 |
5,6 | Federal Home Loan | | |
| Mortgage Corp., | | |
| 0.391%, 9/21/09 | 5,000 | 4,998 |
| | | 9,997 |
Total Temporary Cash Investments | |
(Cost $100,428) | | 100,434 |
Total Investments (100.3%) | | |
(Cost $11,480,614) | | 9,089,854 |
Other Assets and Liabilities (–0.3%) | |
Other Assets | | 22,064 |
Liabilities4 | | (48,059) |
| | | (25,995) |
Net Assets (100%) | | 9,063,859 |
42
Institutional Total Stock Market Index Fund
At June 30, 2009, net assets consisted of: |
| Amount |
| ($000) |
Paid-in Capital | 11,913,975 |
Undistributed Net Investment Income | 5,070 |
Accumulated Net Realized Losses | (464,115) |
Unrealized Appreciation (Depreciation) | |
Investment Securities | (2,390,760) |
Futures Contracts | (311) |
Net Assets | 9,063,859 |
| |
| |
Institutional Shares—Net Assets | |
Applicable to 85,623,527 outstanding | |
$.001 par value shares of beneficial | |
interest (unlimited authorization) | 1,740,286 |
Net Asset Value Per Share— | |
Institutional Shares | $20.32 |
| |
| |
Institutional Plus Shares—Net Assets | |
Applicable to 360,284,791 outstanding | |
$.001 par value shares of beneficial | |
interest (unlimited authorization) | 7,323,573 |
Net Asset Value Per Share— | |
Institutional Plus Shares | $20.33 |
• See Note A in Notes to Financial Statements.
* Non-income-producing security.
^ Part of security position is on loan to broker-dealers. The total value of securities on loan is $26,875,000.
1 The fund invests a portion of its cash reserves in equity markets through the use of index futures contracts. After giving effect to futures investments, the fund’s effective common stock and temporary cash investment positions represent 100.0% and 0.3%, respectively, of net assets.
2 Securities representing up to 5% of the market value of unaffiliated securities are permitted to be combined and reported as “miscellaneous securities” provided that they have been held for less than one year and not previously reported by name.
3 Affiliated money market fund available only to Vanguard funds and certain trusts and accounts managed by Vanguard. Rate shown is the 7-day yield.
4 Includes $31,301,000 of collateral received for securities on loan.
5 The issuer operates under a congressional charter; its securities are not backed by the full faith and credit of the U.S. government.
6 Securities with a value of $9,997,000 have been segregated as initial margin for open futures contracts. REIT—Real Estate Investment Trust.
See accompanying Notes, which are an integral part of the Financial Statements.
43
Institutional Total Stock Market Index Fund
Statement of Operations
| Six Months Ended |
| June 30, 2009 |
| ($000) |
Investment Income | |
Income | |
Dividends | 94,160 |
Interest1 | 244 |
Security Lending | 3,279 |
Total Income | 97,683 |
Expenses | |
The Vanguard Group—Note B | |
Management and Administrative—Institutional Shares | 341 |
Management and Administrative—Institutional Plus Shares | 824 |
Total Expenses | 1,165 |
Net Investment Income | 96,518 |
Realized Net Gain (Loss) | |
Investment Securities Sold | (183,326) |
Futures Contracts | 5,087 |
Realized Net Gain (Loss) | (178,239) |
Change in Unrealized Appreciation (Depreciation) | |
Investment Securities | 643,533 |
Futures Contracts | (3,864) |
Change in Unrealized Appreciation (Depreciation) | 639,669 |
Net Increase (Decrease) in Net Assets Resulting from Operations | 557,948 |
1 Interest income from an affiliated company of the fund was $169,000.
See accompanying Notes, which are an integral part of the Financial Statements.
44
Institutional Total Stock Market Index Fund
Statement of Changes in Net Assets
| Six Months Ended | | Year Ended |
| June 30, | | December 31, |
| 2009 | | 2008 |
| ($000) | | ($000) |
Increase (Decrease) in Net Assets | | | |
Operations | | | |
Net Investment Income | 96,518 | | 197,362 |
Realized Net Gain (Loss) | (178,239) | | (175,332) |
Change in Unrealized Appreciation (Depreciation) | 639,669 | | (4,021,956) |
Net Increase (Decrease) in Net Assets Resulting from Operations | 557,948 | | (3,999,926) |
Distributions | | | |
Net Investment Income | | | |
Institutional Shares | (17,539) | | (29,244) |
Institutional Plus Shares | (75,271) | | (168,295) |
Realized Capital Gain | | | |
Institutional Shares | — | | — |
Institutional Plus Shares | — | | — |
Total Distributions | (92,810) | | (197,539) |
Capital Share Transactions | | | |
Institutional Shares | 477,972 | | 465,565 |
Institutional Plus Shares | 384,295 | | 1,597,986 |
Net Increase (Decrease) from Capital Share Transactions | 862,267 | | 2,063,551 |
Total Increase (Decrease) | 1,327,405 | | (2,133,914) |
Net Assets | | | |
Beginning of Period | 7,736,454 | | 9,870,368 |
End of Period1 | 9,063,859 | | 7,736,454 |
1 Net Assets—End of Period includes undistributed net investment income of $5,070,000 and $1,362,000. See accompanying Notes, which are an integral part of the Financial Statements.
45
Institutional Total Stock Market Index Fund
Financial Highlights
Institutional Shares | | | | | | |
| | | | | | |
| Six Months | | | | | |
| Ended | | | |
For a Share Outstanding | June 30, | Year Ended December 31, |
Throughout Each Period | 2009 | 2008 | 2007 | 2006 | 2005 | 2004 |
Net Asset Value, Beginning of Period | $19.68 | $31.89 | $30.71 | $27.00 | $25.83 | $23.33 |
Investment Operations | | | | | | |
Net Investment Income | .219 | .550 | .547 | .501 | .398 | .425 |
Net Realized and Unrealized Gain (Loss) | | | | | | |
on Investments | .632 | (12.208) | 1.179 | 3.710 | 1.169 | 2.498 |
Total from Investment Operations | .851 | (11.658) | 1.726 | 4.211 | 1.567 | 2.923 |
Distributions | | | | | | |
Dividends from Net Investment Income | (.211) | (.552) | (.546) | (.501) | (.397) | (.423) |
Distributions from Realized Capital Gains | — | — | — | — | — | — |
Total Distributions | (.211) | (.552) | (.546) | (.501) | (.397) | (.423) |
Net Asset Value, End of Period | $20.32 | $19.68 | $31.89 | $30.71 | $27.00 | $25.83 |
| | | | | | |
| | | | | | |
Total Return | 4.41% | –36.90% | 5.60% | 15.74% | 6.14% | 12.65% |
| | | | | | |
| | | | | | |
Ratios/Supplemental Data | | | | | | |
Net Assets, End of Period (Millions) | $1,740 | $1,106 | $1,271 | $939 | $129 | $789 |
Ratio of Total Expenses to | | | | | | |
Average Net Assets | 0.045%1 | 0.045% | 0.045% | 0.045% | 0.050% | 0.060% |
Ratio of Net Investment Income to | | | | | | |
Average Net Assets | 2.41%1 | 2.12% | 1.81% | 1.81% | 1.77% | 1.83% |
Portfolio Turnover Rate2 | 20%1 | 13% | 10% | 8% | 21%3 | 22% |
1 Annualized.
2 Excludes the value of portfolio securities received or delivered as a result of in-kind purchases or redemptions of the fund’s capital shares.
3 Includes activity related to a change in the fund’s target index.
See accompanying Notes, which are an integral part of the Financial Statements.
46
Institutional Total Stock Market Index Fund
Financial Highlights
Institutional Plus Shares | | | | | | |
| | | | | | |
| Six Months | | | | | |
| Ended | | | |
For a Share Outstanding | June 30, | Year Ended December 31, |
Throughout Each Period | 2009 | 2008 | 2007 | 2006 | 2005 | 2004 |
Net Asset Value, Beginning of Period | $19.68 | $31.89 | $30.71 | $27.00 | $25.83 | $23.33 |
Investment Operations | | | | | | |
Net Investment Income | .220 | .556 | .553 | .506 | .404 | .434 |
Net Realized and Unrealized Gain (Loss) | | | | | | |
on Investments | .643 | (12.209) | 1.179 | 3.710 | 1.169 | 2.498 |
Total from Investment Operations | .863 | (11.653) | 1.732 | 4.216 | 1.573 | 2.932 |
Distributions | | | | | | |
Dividends from Net Investment Income | (.213) | (.557) | (.552) | (.506) | (.403) | (.432) |
Distributions from Realized Capital Gains | — | — | — | — | — | — |
Total Distributions | (.213) | (.557) | (.552) | (.506) | (.403) | (.432) |
Net Asset Value, End of Period | $20.33 | $19.68 | $31.89 | $30.71 | $27.00 | $25.83 |
| | | | | | |
| | | | | | |
Total Return | 4.47% | –36.89% | 5.62% | 15.76% | 6.17% | 12.69% |
| | | | | | |
| | | | | | |
Ratios/Supplemental Data | | | | | | |
Net Assets, End of Period (Millions) | $7,324 | $6,631 | $8,599 | $4,615 | $3,587 | $451 |
Ratio of Total Expenses to | | | | | | |
Average Net Assets | 0.025%1 | 0.025% | 0.025% | 0.025% | 0.025% | 0.025% |
Ratio of Net Investment Income to | | | | | | |
Average Net Assets | 2.44%1 | 2.14% | 1.83% | 1.83% | 1.80% | 1.87% |
Portfolio Turnover Rate2 | 20%1 | 13% | 10% | 8% | 21%3 | 22% |
1 Annualized.
2 Excludes the value of portfolio securities received or delivered as a result of in-kind purchases or redemptions of the fund’s capital shares.
3 Includes activity related to a change in the fund’s target index.
See accompanying Notes, which are an integral part of the Financial Statements.
47
Institutional Total Stock Market Index Fund
Notes to Financial Statements
Vanguard Institutional Total Stock Market Index Fund is registered under the Investment Company Act of 1940 as an open-end investment company, or mutual fund. The fund offers two classes of shares, Institutional Shares and Institutional Plus Shares, to investors who invest minimum amounts of $100 million and $200 million, respectively.
A. The following significant accounting policies conform to generally accepted accounting principles for U.S. mutual funds. The fund consistently follows such policies in preparing its financial statements.
1. Security Valuation: Securities are valued as of the close of trading on the New York Stock Exchange (generally 4 p.m., Eastern time) on the valuation date. Equity securities are valued at the latest quoted sales prices or official closing prices taken from the primary market in which each security trades; such securities not traded on the valuation date are valued at the mean of the latest quoted bid and asked prices. Securities for which market quotations are not readily available, or whose values have been materially affected by events occurring before the fund’s pricing time but after the close of the securities’ primary markets, are valued by methods deemed by the board of trustees to represent fair value. Investments in Vanguard Market Liquidity Fund are valued at that fund’s net asset value. Temporary cash investments acquired over 60 days to maturity are valued using the latest bid prices or using valuations based on a matrix system (which considers such factors as security prices, yields, maturities, and ratings), both as furnished by independent pricing services. Other temporary cash investments are valued at amortized cost, which approximates market value.
2. Futures Contracts: The fund uses index futures contracts to a limited extent, with the objectives of maintaining full exposure to the stock market, enhancing returns, maintaining liquidity, and minimizing transaction costs. The fund may purchase futures contracts to immediately invest incoming cash in the market, or sell futures in response to cash outflows, thereby simulating a fully invested position in the underlying index while maintaining a cash balance for liquidity. The fund may seek to enhance returns by using futures contracts instead of the underlying securities when futures are believed to be priced more attractively than the underlying securities. The primary risks associated with the use of futures contracts are imperfect correlation between changes in market values of stocks held by the fund and the prices of futures contracts, and the possibility of an illiquid market.
Futures contracts are valued at their quoted daily settlement prices. The aggregate principal amounts of the contracts are not recorded in the Statement of Net Assets. Fluctuations in the value of the contracts are recorded in the Statement of Net Assets as an asset (liability) and in the Statement of Operations as unrealized appreciation (depreciation) until the contracts are closed, when they are recorded as realized futures gains (losses).
3. Federal Income Taxes: The fund intends to continue to qualify as a regulated investment company and distribute all of its taxable income. Management has analyzed the fund’s tax positions taken on federal income tax returns for all open tax years (tax years ended December 31, 2005–2008) and for the period ended June 30, 2009, and has concluded that no provision for federal income tax is required in the fund’s financial statements.
4. Distributions: Distributions to shareholders are recorded on the ex-dividend date.
5. Security Lending: The fund may lend its securities to qualified institutional borrowers to earn additional income. Security loans are required to be secured at all times by collateral at least equal to the market value of securities loaned. The fund invests cash collateral received in Vanguard Market Liquidity Fund, and records a liability for the return of the collateral, during the period the securities are on loan. Security lending income represents the income earned on investing cash collateral, less expenses associated with the loan.
48
Institutional Total Stock Market Index Fund
6. Other: Dividend income is recorded on the ex-dividend date. Interest income includes income distributions received from Vanguard Market Liquidity Fund and is accrued daily. Security transactions are accounted for on the date securities are bought or sold. Costs used to determine realized gains (losses) on the sale of investment securities are those of the specific securities sold. Class-specific shareholder servicing fees are charged to each class at the contractual rate. Income, expenses not attributable to a specific class, and realized and unrealized gains and losses on investments are allocated to each class of shares based on its relative net assets.
B. The Vanguard Group provides investment advisory, corporate management, administrative, marketing, and distribution services and pays for all other operating expenses, except for taxes, in return for a fee calculated at an annual percentage rate of the average net assets of the fund, or, for shareholder services, each class of shares. The fund’s trustees and officers are also directors and officers of Vanguard.
C. Various inputs may be used to determine the value of the fund’s investments. These inputs are summarized in three broad levels for financial statement purposes. The inputs or methodologies used to value securities are not necessarily an indication of the risk associated with investing in those securities.
Level 1—Quoted prices in active markets for identical securities.
Level 2—Other significant observable inputs (including quoted prices for similar securities, interest rates, prepayment speeds, credit risk, etc.).
Level 3—Significant unobservable inputs (including the fund’s own assumptions used to determine the fair value of investments).
The following table summarizes the fund’s investments as of June 30, 2009, based on the inputs used to value them:
| Level 1 | Level 2 | Level 3 |
Investments | ($000) | ($000) | ($000) |
Common Stocks | 8,989,416 | 4 | — |
Temporary Cash Investments | 90,437 | 9,997 | — |
Futures Contracts—Assets1 | 29 | — | — |
Futures Contracts—Liabilities1 | (459) | — | — |
Total | 9,079,423 | 10,001 | — |
1 Represents variation margin on the last day of the reporting period. |
D. At June 30, 2009, the aggregate settlement value of open futures contracts and the related unrealized appreciation (depreciation) were:
| | | | ($000) |
| | Number of | Aggregate | Unrealized |
| | Long (Short) | Settlement | Appreciation |
Futures Contracts | Expiration | Contracts | Value | (Depreciation) |
S&P 500 Index | September 2009 | 198 | 45,317 | (415) |
E-mini S&P 500 Index | September 2009 | 350 | 16,021 | 137 |
Russell 2000 Mini Index | September 2009 | 188 | 9,535 | (17) |
S&P MidCap 400 Index | September 2009 | 2 | 577 | (16) |
Unrealized appreciation (depreciation) on open futures contracts is required to be treated as realized gain (loss) for tax purposes.
49
Institutional Total Stock Market Index Fund
E. Distributions are determined on a tax basis and may differ from net investment income and realized capital gains for financial reporting purposes. Differences may be permanent or temporary. Permanent differences are reclassified among capital accounts in the financial statements to reflect their tax character. Temporary differences arise when certain items of income, expense, gain, or loss are recognized in different periods for financial statement and tax purposes; these differences will reverse at some time in the future. Differences in classification may also result from the treatment of short-term gains as ordinary income for tax purposes.
The fund’s tax-basis capital gains and losses are determined only at the end of each fiscal year. For tax purposes, at December 31, 2008, the fund had available realized losses of $217,081,000 to offset future net capital gains of $26,053,000 through December 31, 2010, $44,357,000 through December 31, 2011, $5,005,000 through December 31, 2012, $9,611,000 through December 31, 2013, $96,976,000 through December 31, 2016, and $35,079,000 through December 31, 2017. The fund will use these capital losses to offset net taxable capital gains, if any, realized during the year ending December 31, 2009; should the fund realize net capital losses for the year, the losses will be added to the loss carryforward balances above.
At June 30, 2009, the cost of investment securities for tax purposes was $11,480,614,000. Net unrealized depreciation of investment securities for tax purposes was $2,390,760,000, consisting of unrealized gains of $374,032,000 on securities that had risen in value since their purchase and $2,764,792,000 in unrealized losses on securities that had fallen in value since their purchase.
F. During the six months ended June 30, 2009, the fund purchased $1,671,354,000 of investment securities and sold $784,637,000 of investment securities, other than temporary cash investments.
G. Capital share transactions for each class of shares were:
| Six Months Ended | Year Ended |
| June 30, 2009 | December 31, 2008 |
| Amount | Shares | | Amount | Shares |
| ($000) | (000) | | ($000) | (000) |
Institutional Shares | | | | | |
Issued | 558,977 | 33,745 | | 620,253 | 22,203 |
Issued in Lieu of Cash Distributions | 16,343 | 863 | | 26,476 | 1,072 |
Redeemed | (97,348) | (5,190) | | (181,164) | (6,927) |
Net Increase (Decrease)—Institutional Shares | 477,972 | 29,418 | | 465,565 | 16,348 |
Institutional Plus Shares | | | | | |
Issued | 1,369,631 | 76,746 | | 3,068,668 | 128,801 |
Issued in Lieu of Cash Distributions | 70,414 | 3,724 | | 156,894 | 6,415 |
Redeemed | (1,055,750) | (57,151) | | (1,627,576) | (67,899) |
Net Increase (Decrease)—Institutional Plus Shares | 384,295 | 23,319 | | 1,597,986 | 67,317 |
H. In preparing the financial statements as of June 30, 2009, management considered the impact of subsequent events occurring through August 5, 2009, for potential recognition or disclosure in these financial statements.
50
About Your Fund’s Expenses
As a shareholder of the fund, you incur ongoing costs, which include costs for portfolio management, administrative services, and shareholder reports (like this one), among others. Operating expenses, which are deducted from a fund’s gross income, directly reduce the investment return of the fund.
A fund’s expenses are expressed as a percentage of its average net assets. This figure is known as the expense ratio. The following examples are intended to help you understand the ongoing costs (in dollars) of investing in your fund and to compare these costs with those of other mutual funds. The examples are based on an investment of $1,000 made at the beginning of the period shown and held for the entire period.
The accompanying table illustrates your fund’s costs in two ways:
• Based on actual fund return. This section helps you to estimate the actual expenses that you paid over the period. The “Ending Account Value” shown is derived from the fund’s actual return, and the third column shows the dollar amount that would have been paid by an investor who started with $1,000 in the fund. You may use the information here, together with the amount you invested, to estimate the expenses that you paid over the period.
To do so, simply divide your account value by $1,000 (for example, an $8,600 account value divided by $1,000 = 8.6), then multiply the result by the number given for your fund under the heading “Expenses Paid During Period.”
• Based on hypothetical 5% yearly return. This section is intended to help you compare your fund’s costs with those of other mutual funds. It assumes that the fund had a yearly return of 5% before expenses, but that the expense ratio is unchanged. In this case—because the return used is not the fund’s actual return—the results do not apply to your investment. The example is useful in making comparisons because the Securities and Exchange Commission requires all mutual funds to calculate expenses based on a 5% return. You can assess your fund’s costs by comparing this hypothetical example with the hypothetical examples that appear in shareholder reports of other funds.
Six Months Ended June 30, 2009 | | | |
| Beginning | Ending | Expenses |
| Account Value | Account Value | Paid During |
Institutional Total Stock Market Index Fund | 12/31/2008 | 6/30/2009 | Period1 |
Based on Actual Fund Return | | | |
Institutional Shares | $1,000.00 | $1,044.07 | $0.23 |
Institutional Plus Shares | 1,000.00 | 1,044.70 | 0.12 |
Based on Hypothetical 5% Yearly Return | | | |
Institutional Shares | $1,000.00 | $1,024.57 | $0.23 |
Institutional Plus Shares | 1,000.00 | 1,024.67 | 0.13 |
1 The calculations are based on expenses incurred in the most recent six-month period. The fund’s annualized six-month expense ratios for that period are 0.045% for Institutional Shares and 0.025% for Institutional Plus Shares. The dollar amounts shown as “Expenses Paid” are equal to the annualized expense ratio multiplied by the average account value over the period, multiplied by the number of days in the most recent six-month period, then divided by the number of days in the most recent 12-month period.
51
Note that the expenses shown in the table are meant to highlight and help you compare ongoing costs only and do not reflect transaction costs incurred by the fund for buying and selling securities. Your fund does not charge transaction fees, such as purchase or redemption fees, nor does it carry a “sales load.”
The calculations assume no shares were bought or sold during the period. Your actual costs may have been higher or lower, depending on the amount of your investment and the timing of any purchases or redemptions.
You can find more information about the fund’s expenses, including annual expense ratios, in the Financial Statements section of this report. For additional information on operating expenses and other shareholder costs, please refer to your fund’s current prospectus.
52
Trustees Approve Advisory Arrangement
The board of trustees of Vanguard Institutional Total Stock Market Index Fund has renewed the fund’s investment advisory arrangement with The Vanguard Group, Inc. Vanguard—through its Quantitative Equity Group—serves as the investment advisor for the fund. The board determined that continuing the fund’s internalized management structure was in the best interests of the fund and its shareholders.
The board based its decision upon an evaluation of the advisor’s investment staff, portfolio management process, and performance. The trustees considered the factors discussed below, among others. However, no single factor determined whether the board approved the arrangement. Rather, it was the totality of the circumstances that drove the board’s decision.
Nature, extent, and quality of services
The board considered the quality of the fund’s investment management over both the short and long term, and took into account the organizational depth and stability of the advisor. The board noted that Vanguard has been managing investments for more than three decades. The Quantitative Equity Group adheres to a sound, disciplined investment management process; the team has considerable experience, stability, and depth.
The board concluded that Vanguard’s experience, stability, depth, and performance, among other factors, warranted continuation of the advisory arrangement.
Investment performance
The board considered the short- and long-term performance of the fund, including any periods of outperformance or underperformance of its target index and peer group. The board concluded that the fund has performed in line with expectations, and that its results have been consistent with its investment strategies. Information about the fund’s most recent performance can be found in the Performance Summary section of this report.
Cost
The board concluded that the fund’s expense ratio was well below the average expense ratio charged by funds in its peer group. The board noted that the fund’s advisory expense ratio was also well below its peer-group average. Information about the fund’s expense ratio appears in the About Your Fund’s Expenses section of this report as well as in the Financial Statements section.
The board does not conduct a profitability analysis of Vanguard, because of Vanguard’s unique “at-cost” structure. Unlike most other mutual fund management companies, Vanguard is owned by the funds it oversees, and produces “profits” only in the form of reduced expenses for fund shareholders.
The benefit of economies of scale
The board concluded that the fund’s low-cost arrangement with Vanguard reflects economies of scale for the benefit of the fund’s shareholders.
The board will consider whether to renew the advisory arrangement again after a one-year period.
53
Glossary
Beta. A measure of the magnitude of a fund’s past share-price fluctuations in relation to the ups and downs of a given market index. The index is assigned a beta of 1.00. Compared with a given index, a fund with a beta of 1.20 typically would have seen its share price rise or fall by 12% when the index rose or fell by 10%. For this report, beta is based on returns over the past 36 months for both the fund and the index. Note that a fund’s beta should be reviewed in conjunction with its R-squared (see definition). The lower the R-squared, the less correlation there is between the fund and the index, and the less reliable beta is as an indicator of volatility.
Earnings Growth Rate. The average annual rate of growth in earnings over the past five years for the stocks now in a fund.
Equity Exposure. A measure that reflects a fund’s investments in stocks and stock futures. Any holdings in short-term reserves are excluded.
Expense Ratio. The percentage of a fund’s average net assets used to pay its annual administrative and advisory expenses. These expenses directly reduce returns to investors.
Foreign Holdings. The percentage of a fund represented by stocks or depositary receipts of companies based outside the United States.
Inception Date. The date on which the assets of a fund (or one of its share classes) are first invested in accordance with the fund’s investment objective. For funds with a subscription period, the inception date is the day after that period ends. Investment performance is measured from the inception date.
Median Market Cap. An indicator of the size of companies in which a fund invests; the midpoint of market capitalization (market price x shares outstanding) of a fund’s stocks, weighted by the proportion of the fund’s assets invested in each stock. Stocks representing half of the fund’s assets have market capitalizations above the median, and the rest are below it.
Price/Book Ratio. The share price of a stock divided by its net worth, or book value, per share. For a fund, the weighted average price/book ratio of the stocks it holds.
Price/Earnings Ratio. The ratio of a stock’s current price to its per-share earnings over the past year. For a fund, the weighted average P/E of the stocks it holds. P/E is an indicator of market expectations about corporate prospects; the higher the P/E, the greater the expectations for a company’s future growth.
R-Squared. A measure of how much of a fund’s past returns can be explained by the returns from the market in general, as measured by a given index. If a fund’s total returns were precisely synchronized with an index’s returns, its R-squared would be 1.00. If the fund’s returns bore no relationship to the index’s returns, its R-squared would be 0. For this report, R-squared is based on returns over the past 36 months for both the fund and the index.
Return on Equity. The annual average rate of return generated by a company during the past five years for each dollar of shareholder’s equity (net income divided by shareholder’s equity). For a fund, the weighted average return on equity for the companies whose stocks it holds.
Short-Term Reserves. The percentage of a fund invested in highly liquid, short-term securities that can be readily converted to cash.
54
Turnover Rate. An indication of the fund’s trading activity. Funds with high turnover rates incur higher transaction costs and may be more likely to distribute capital gains (which may be taxable to investors). The turnover rate excludes in-kind transactions, which have minimal impact on costs.
Yield. A fund’s 30-day SEC yield is derived using a formula specified by the U.S. Securities and Exchange Commission. Under the formula, data related to the fund’s security holdings in the previous 30 days are used to calculate the fund’s hypothetical net income for that period, which is then annualized and divided by the fund’s estimated average net assets over the calculation period. For the purposes of this calculation, a security’s income is based on its current market yield to maturity (in the case of bonds) or its projected dividend yield (for stocks). Because the SEC yield represents hypothetical annualized income, it will differ—at times significantly—from the fund’s actual experience. As a result, the fund’s income distributions may be higher or lower than implied by the SEC yield.
55
The People Who Govern Your Fund
The trustees of your mutual fund are there to see that the fund is operated and managed in your best interests since, as a shareholder, you are a part owner of the fund. Your fund’s trustees also serve on the board of directors of The Vanguard Group, Inc., which is owned by the Vanguard funds and provides services to them on an at-cost basis.
A majority of Vanguard’s board members are independent, meaning that they have no affiliation with Vanguard or the funds they oversee, apart from the sizable personal investments they have made as private individuals. The independent board members have distinguished backgrounds in business, academia, and public service. Each of the trustees and executive officers oversees 157 Vanguard funds.
The following table provides information for each trustee and executive officer of the fund. More information about the trustees is in the Statement of Additional Information, which can be obtained, without charge, by contacting Vanguard at 800-662-7447, or online at www.vanguard.com.
Interested Trustees
John J. Brennan1
Born 1954. Trustee Since May 1987. Chairman of the Board. Principal Occupation(s) During the Past Five Years: Chairman of the Board and Director/Trustee of The Vanguard Group, Inc., and of each of the investment companies served by The Vanguard Group; Chief Executive Officer and President of The Vanguard Group and of each of the investment companies served by The Vanguard Group (1996–2008); Chairman of the Financial Accounting Foundation; Governor of the Financial Industry Regulatory Authority (FINRA); Director of United Way of Southeastern Pennsylvania.
F. William McNabb III1
Born 1957. Trustee Since July 2009. Principal Occupation(s) During the Past Five Years: Director of The Vanguard Group, Inc., since 2008; Chief Executive Officer and President of The Vanguard Group and of each of the investment companies served by The Vanguard Group since 2008; Director of Vanguard Marketing Corporation; Managing Director of The Vanguard Group (1995–2008).
Independent Trustees
Charles D. Ellis
Born 1937. Trustee Since January 2001. Principal Occupation(s) During the Past Five Years: Applecore Partners (pro bono ventures in education); Senior Advisor to Greenwich Associates (international business strategy consulting); Successor Trustee of Yale University; Overseer of the Stern School of Business at New York University; Trustee of the Whitehead Institute for Biomedical Research.
Emerson U. Fullwood
Born 1948. Trustee Since January 2008. Principal Occupation(s) During the Past Five Years: Retired Executive Chief Staff and Marketing Officer for North America and Corporate Vice President of Xerox Corporation (photocopiers and printers); Director of SPX Corporation (multi-industry manufacturing), the United Way of Rochester, the Boy Scouts of America, Amerigroup Corporation (direct health and medical insurance carriers), and Monroe Community College Foundation.
Rajiv L. Gupta
Born 1945. Trustee Since December 2001.2 Principal Occupation(s) During the Past Five Years: Retired Chairman and Chief Executive Officer of Rohm and Haas Co. (chemicals); President of Rohm and Haas Co. (2006–2008); Board Member of American Chemistry Council; Director of Tyco International, Ltd. (diversified manufacturing and services) and Hewlett-Packard Co. (electronic computer manufacturing); Trustee of The Conference Board.
Amy Gutmann
Born 1949. Trustee Since June 2006. Principal
Occupation(s) During the Past Five Years: President of the University of Pennsylvania; Christopher H. Browne Distinguished Professor of Political Science in the School of Arts and Sciences with Secondary Appointments at the Annenberg School for Communication and the Graduate School of Education of the University of Pennsylvania; Director of Carnegie Corporation of New York, Schuylkill River Development Corporation, and Greater Philadelphia Chamber of Commerce; Trustee of the National Constitution Center.
JoAnn Heffernan Heisen
Born 1950. Trustee Since July 1998. Principal Occupation(s) During the Past Five Years: Retired Corporate Vice President, Chief Global Diversity Officer, and Member of the Executive Committee of Johnson & Johnson (pharmaceuticals/consumer products); Vice President and Chief Information Officer of Johnson & Johnson (1997–2005); Director of the University Medical Center at Princeton and Women’s Research and Education Institute.
André F. Perold
Born 1952. Trustee Since December 2004. Principal Occupation(s) During the Past Five Years: George Gund Professor of Finance and Banking, Harvard Business School; Director and Chairman of UNX, Inc. (equities trading firm); Chair of the Investment Committee of HighVista Strategies LLC (private investment firm).
Alfred M. Rankin, Jr.
Born 1941. Trustee Since January 1993. Principal Occupation(s) During the Past Five Years: Chairman, President, Chief Executive Officer, and Director of NACCO Industries, Inc. (forklift trucks/housewares/ lignite); Director of Goodrich Corporation (industrial products/aircraft systems and services).
Peter F. Volanakis
Born 1955. Trustee Since July 2009. Principal Occupations During the Past Five Years: President since 2007 and Chief Operating Officer since 2005 of Corning Incorporated (communications equipment); President of Corning Technologies (2001–2005); Director of Corning Incorporated and Dow Corning; Trustee of the Corning Incorporated Foundation and the Corning Museum of Glass; Overseer of the Amos Tuck School of Business Administration at Dartmouth College.
Executive Officers
Thomas J. Higgins1
Born 1957. Chief Financial Officer Since September 2008. Principal Occupation(s) During the Past Five Years: Principal of The Vanguard Group, Inc.; Chief Financial Officer of each of the investment companies served by The Vanguard Group since 2008; Treasurer of each of the investment companies served by The Vanguard Group (1998–2008).
Kathryn J. Hyatt1
Born 1955. Treasurer Since November 2008. Principal Occupation(s) During the Past Five Years: Principal of The Vanguard Group, Inc.; Treasurer of each of the investment companies served by The Vanguard Group since 2008; Assistant Treasurer of each of the investment companies served by The Vanguard Group (1988–2008).
Heidi Stam1
Born 1956. Secretary Since July 2005. Principal Occupation(s) During the Past Five Years: Managing Director of The Vanguard Group, Inc., since 2006; General Counsel of The Vanguard Group since 2005; Secretary of The Vanguard Group and of each of the investment companies served by The Vanguard Group since 2005; Director and Senior Vice President of Vanguard Marketing Corporation since 2005; Principal of The Vanguard Group (1997–2006).
Vanguard Senior Management Team |
| |
R. Gregory Barton | Michael S. Miller |
Mortimer J. Buckley | James M. Norris |
Kathleen C. Gubanich | Glenn W. Reed |
Paul A. Heller | George U. Sauter |
Founder
John C. Bogle
Chairman and Chief Executive Officer, 1974–1996
1 These individuals are “interested persons” as defined in the Investment Company Act of 1940.
2 December 2002 for Vanguard Equity Income Fund, Vanguard Growth Equity Fund, the Vanguard Municipal Bond Funds, and the Vanguard State Tax-Exempt Funds.

P.O. Box 2600
Valley Forge, PA 19482-2600
Connect with Vanguard® > www.vanguard.com
Fund Information > 800-662-7447 | All comparative mutual fund data are from Lipper Inc. |
| or Morningstar, Inc., unless otherwise noted. |
Direct Investor Account Services > 800-662-2739 | |
| You can obtain a free copy of Vanguard’s proxy voting |
Institutional Investor Services > 800-523-1036 | guidelines by visiting our website, www.vanguard.com, |
| and searching for “proxy voting guidelines,” or by |
Text Telephone for People | calling Vanguard at 800-662-2739. The guidelines are |
With Hearing Impairment > 800-952-3335 | also available from the SEC’s website, www.sec.gov. |
| In addition, you may obtain a free report on how your |
| fund voted the proxies for securities it owned during |
| the 12 months ended June 30. To get the report, visit |
This material may be used in conjunction | either www.vanguard.com or www.sec.gov. |
with the offering of shares of any Vanguard | |
fund only if preceded or accompanied by | |
the fund’s current prospectus. | |
| |
| You can review and copy information about your fund |
| at the SEC’s Public Reference Room in Washington, D.C. |
| To find out more about this public service, call the SEC |
The funds or securities referred to herein are not | at 202-551-8090. Information about your fund is also |
sponsored, endorsed, or promoted by MSCI, and MSCI | available on the SEC’s website, and you can receive |
bears no liability with respect to any such funds or | copies of this information, for a fee, by sending a |
securities. For any such funds or securities, the | request in either of two ways: via e-mail addressed to |
prospectus or the Statement of Additional Information | publicinfo@sec.gov or via regular mail addressed to the |
contains a more detailed description of the limited | Public Reference Section, Securities and Exchange |
relationship MSCI has with The Vanguard Group and | Commission, Washington, DC 20549-0102. |
any related funds. | |
| |
| |
| |
| |
| |
| |
| |
| |
| |
| © 2009 The Vanguard Group, Inc. |
| All rights reserved. |
| Vanguard Marketing Corporation, Distributor. |
| |
| Q8712 082009 |
1
Item 2: Not Applicable.
Item 3: Not Applicable.
Item 4: Not Applicable.
Item 5: Not Applicable.
Item 6: Not Applicable.
Item 7: Not Applicable.
Item 8: Not Applicable.
Item 9: Not Applicable.
Item 10: Not Applicable.
Item 11: Controls and Procedures.
(a) Disclosure Controls and Procedures. The Principal Executive and Financial Officers concluded that the Registrant's Disclosure Controls and Procedures are effective based on their evaluation of the Disclosure Controls and Procedures as of a date within 90 days of the filing date of this report.
(b) Internal Control Over Financial Reporting. There were no significant changes in Registrant’s Internal Control Over Financial Reporting or in other factors that could significantly affect this control subsequent to the date of the evaluation, including any corrective actions with regard to significant deficiencies and material weaknesses.
Item 12: Exhibits.
(a) Code of Ethics.
(b) Certifications.
Pursuant to the requirements of the Securities Exchange Act of 1934 and the Investment Company Act of 1940, the registrant has duly caused this report to be signed on its behalf by the undersigned, thereunto duly authorized.
VANGUARD INSTITUTIONAL INDEX FUNDS |
BY: | /s/ F. WILLIAM MCNABB III* |
F. WILLIAM MCNABB III |
CHIEF EXECUTIVE OFFICER |
Date: August 12, 2009
Pursuant to the requirements of the Securities Exchange Act of 1934 and the Investment Company Act of 1940, this report has been signed below by the following persons on behalf of the registrant and in the capacities and on the dates indicated.
VANGUARD INSTITUTIONAL INDEX FUNDS |
BY: | /s/ F. WILLIAM MCNABB III* |
F. WILLIAM MCNABB III |
CHIEF EXECUTIVE OFFICER |
Date: August 12, 2009
VANGUARD INSTITUTIONAL INDEX FUNDS |
BY: | /s/ THOMAS J. HIGGINS* |
THOMAS J. HIGGINS |
CHIEF FINANCIAL OFFICER |
Date: August 12, 2009
* By: /s/ Heidi Stam
Heidi Stam, pursuant to a Power of Attorney filed on July 24, 2009, see file Number 2-88373, Incorporated by Reference.