UNITED STATES SECURITIES AND EXCHANGE COMMISSION
Washington, D.C. 20549
FORM N-CSR
CERTIFIED SHAREHOLDER REPORT OF
REGISTERED MANAGEMENT INVESTMENT COMPANIES
| |
| Investment Company Act file number: | 811-6093 |
| Name of Registrant: | Vanguard Institutional Index Funds |
| Address of Registrant: | P.O. Box 2600 |
| | Valley Forge, PA 19482 |
Name and address of agent for service: Heidi Stam, Esquire P.O. Box 876 Valley Forge, PA 19482
Registrant’s telephone number, including area code: (610) 669-1000
Date of fiscal year end: December 31
Date of reporting period: January 1, 2009 December 31, 2009
Item 1: Reports to Shareholders

Vanguard Institutional Index Fund Annual Report

- After a dismal start to the year, stocks began a steady rise in March to finish 2009 with strong returns.
- For the fiscal year ended December 31, 2009, Vanguard Institutional Index Fund returned about 26% and closely tracked its target benchmark, the Standard & Poor’s 500 Index.
- Led by information technology stocks, all ten industry sectors posted gains.
| |
| Contents | |
| Your Fund’s Total Returns.......... | 1 |
| Chairman’s Letter....................... | 2 |
| Results of Proxy Voting.............. | 7 |
| Fund Profile.............................. | 9 |
| Performance Summary............. | 10 |
| Financial Statements............... | 12 |
| About Your Fund’s Expenses.... | 27 |
| Glossary................................... | 29 |
Please note: The opinions expressed in this report are just that—informed opinions. They should not be considered promises or advice. Also, please keep in mind that the information and opinions cover the period through the date on the front of this report. Of course, the risks of investing in your fund are spelled out in the prospectus.
See the Glossary for definitions of investment terms used in this report.
Cover photograph: Veronica Coia.
| | |
| Your Fund’s Total Returns | | |
| |
| |
| |
| |
| Fiscal Year Ended December 31, 2009 | | |
| | Total | |
| | Returns | |
| Vanguard Institutional Index Fund | | |
| Institutional Shares | 26.63 | % |
| Institutional Plus Shares | 26.66 | |
| S&P 500 Index | 26.46 | |
| Large-Cap Core Funds Average | 27.46 | |
| Large-Cap Core Funds Average: Derived from data provided by Lipper Inc. | | |
| | | | | | | | |
| Institutional Shares are available for a minimum initial investment of $5 million. Institutional Plus Shares are available for a minimum investment of $200 million. | | |
| | | | | | | | |
| |
| Your Fund’s Performance at a Glance | | | | | | | | |
| December 31, 2008 , Through December 31, 2009 | | | | | | | | |
| | | | | | | Distributions Per Share |
| | | Starting | | Ending | | Income | | Capital |
| | | Share Price | | Share Price | | Dividends | | Gains |
| Vanguard Institutional Index Fund | | | | | | | | |
| Institutional Shares | $ | 82.54 | $ | 101.98 | $ | 2.208 | $ | 0.000 |
| Institutional Plus Shares | | 82.54 | | 101.98 | | 2.230 | | 0.000 |
1

Chairman’s Letter
Dear Shareholder,
Vanguard Institutional Index Fund returned about 26% for the fiscal year ended December 31, 2009, as U.S. stocks rebounded off their March lows and advanced throughout the rest of the year. The fund met its objective of closely tracking its unmanaged benchmark, the Standard & Poor’s 500 Index. It slightly trailed the average return of its large-capitalization peers.
Impressive stock returns masked lingering uncertainties
For the 12 months ended December 31, 2009, the broad U.S. stock market returned more than 29%, its highest calendar-year return since 2003. The year began with the market searching for a bottom, and it finally hit a low point in early March. From there, stocks mounted one of their strongest rallies ever—in magnitude and duration—resulting in a check mark-shaped stock chart for 2009.
The market’s outsized result came against a backdrop of economic uncertainty. The economy, which struggled to regain its footing as the financial crisis abated, began to show signs of growth in the second half of the year, even as unemployment climbed to levels not seen since 1983.
Stock markets outside the United States fared even better during 2009, especially many emerging markets, which weathered the financial crisis in relatively better fiscal and economic shape than their developed-market counterparts.
2
Bond markets calmed down, money market funds endured
Compared with the last months of 2008, when credit markets seized up and investors fled to the safety of U.S. Treasuries, 2009 represented a return to normalcy for bonds. Investors’ appetite for risk returned, and the demand for corporate bonds increased, raising their prices and bringing down their yields. For the 12 months ended December 31, the broad taxable bond market returned about 6%, while municipal bonds returned about 13%.
Meanwhile, money market funds and other short-term savings vehicles did poorly in 2009. Interest rates at the shortest end of the maturity spectrum remained at historic lows, a casualty of the Federal Reserve Board’s efforts to revive the economy. The Fed kept its target for the federal funds rate between 0% and 0.25% for the entire year.
Broad-based recovery lifted fund’s returns
For the Vanguard Institutional Index Fund and the broader U.S. stock market, 2009 featured a momentous turnaround. Widespread pessimism stemming from the global financial crisis was followed by a historic rebound as government stimulus programs took hold and signs of recovery appeared on the distant horizon of the deepest economic downturn in a generation.
From the year’s start through early March, the benchmark Standard & Poor’s 500 Index declined nearly 25% before reversing
| | | | | | |
| Market Barometer | | | | | | |
| |
| | | | Average Annual Total Returns | |
| | | | Periods Ended December 31, 2009 | |
| | One | | Three | | Five | |
| | Year | | Years | | Years | |
| Stocks | | | | | | |
| Russell 1000 Index (Large-caps) | 28.43 | % | -5.36 | % | 0.79 | % |
| Russell 2000 Index (Small-caps) | 27.17 | | -6.07 | | 0.51 | |
| Dow Jones U.S. Total Stock Market Index | 29.35 | | -5.01 | | 1.09 | |
| MSCI All Country World Index ex USA (International) | 42.14 | | -3.04 | | 6.30 | |
| |
| Bonds | | | | | | |
| Barclays Capital U.S. Aggregate Bond Index (Broad | | | | | | |
| taxable market) | 5.93 | % | 6.04 | % | 4.97 | % |
| Barclays Capital Municipal Bond Index | 12.91 | | 4.41 | | 4.32 | |
| Citigroup Three-Month U.S. Treasury Bill Index | 0.16 | | 2.22 | | 2.88 | |
| |
| CPI | | | | | | |
| Consumer Price Index | 2.72 | % | 2.28 | % | 2.56 | % |
3
course and gaining almost 68% through the rest of the year. The recovery was broad-based as all ten sectors posted gains for the year—in striking contrast to 2008, when all ten sectors recorded losses.
Information technology, the largest sector in the index and the fund, returned more than 60% and contributed nearly 11 percentage points to the fund’s return. Having slashed their budgets during the financial crisis, many corporations resumed spending on communications equipment, computer hardware, and computer software. Consumers, too, gradually opened their wallets, and sales of home computers and electronic components helped lift the sector.
Although the downturn spurred an increase in the nationwide savings rate, certain consumer discretionary companies were well-positioned to benefit from cost-conscious customers. Internet retailers, media companies, home improvement retailers, and recreation-oriented companies were among the firms that bounced back and drove the sector’s return of nearly 42%.
Financial stocks, the index’s poorest-performing sector in 2008, were also instrumental in the recovery, posting a gain of about 17%. Giant banks passed the Treasury Department’s stress tests and began to regain investors’ confidence. Companies in the broader sector, including investment firms, consumer-finance firms, and insurance companies, took advantage of record-low interest rates to improve their balance sheets. Health care and industrials each returned about 20%. While the materials sector is one of the index’s smallest, its nearly 50% return provided a spark.
Fund has kept ahead of actively managed peers
Over the past ten years, Vanguard Institutional Index Fund recorded an average annual return of –0.92%, more than 1 percentage point better than the average result for its large-cap core peers (most of which are actively managed). Since their inception in 1997, the fund’s Institutional Plus Shares have also outperformed the peer-group average. As a group, institutional funds often have access to lower management fees than those available to retail funds, but the Institutional Index Fund’s combination of low costs and market-like returns have proved a tough foe for even its most attractively priced actively managed peers. This is in part a testament to the fund’s indexing strategy, but a sound strategy is worth little without excellent execution. Vanguard Quantitative Equity Group, the fund’s advisor, has more than 30 years of index-tracking experience. These long-tenured professionals have develope d sophisticated portfolio construction and trading methodologies to help Vanguard deliver sound index fund management in a variety of different marketplaces and market environments.
4
While equity returns for the decade were undoubtedly disappointing, it’s worthwhile to consider the investing environment, which included the bursting of the technology stock bubble and three straight years of negative returns from 2000 through 2002 as well as the global financial crisis of 2008–2009. Looking beyond the past decade, the fund’s 8.34% average annual return since its inception in 1990 comes closer to approaching the stock market’s results over the past 100 years.
We believe the reasons for long-term equity investing remain sound. History indicates that both the U.S. economy and stock market have been resilient over the years and have overcome many crises, including the Great Depression and two World Wars. The inherent risk in equity investments is, paradoxically, both why they sometimes generate poor returns, and why we expect them to outperform less-risky assets over time.
Staying the course counts in diverse market conditions
The unpredictability that underlies the stock market was abundantly clear in 2009. After returning about –37% for 2008, the worst calendar-year result since 1931, the broad U.S. stock market continued its sharp decline during the first two months of 2009. In March, even as credit markets hit another rough patch and economic reports signaled the deepening of the recession, the stock market began a recovery that lasted through year-end.
| | |
| Total Returns | | |
| Ten Years Ended December 31, 2009 | | |
| | Average | |
| | Annual Return | |
| Institutional Index Fund Institutional Shares | -0.92 | % |
| S&P 500 Index | -0.95 | |
| Large-Cap Core Funds Average | -2.21 | |
| Large-Cap Core Funds Average: Derived from data provided by Lipper Inc. | | |
The figures shown represent past performance, which is not a guarantee of future results. (Current performance may be lower or higher than the performance data cited. For performance data current to the most recent month-end, visit our website at www.vanguard.com/performance.) Note, too, that both investment returns and principal value can fluctuate widely, so an investor’s shares, when sold, could be worth more or less than their original cost.
5
The Institutional Index Fund’s history of tightly tracking the S&P 500 Index over long periods and its long-term record versus its peers offer strong evidence for indexing’s effectiveness. At Vanguard, we believe that the best way for your organization to withstand the inevitable market volatility and achieve long-term investment success is to maintain a carefully chosen portfolio of stocks, bonds, and short-term reserves tailored to the circumstances of your institution. We believe the Institutional Index Fund is a sensible investment for a core holding in an institutional portfolio.
On another matter, I would like to inform you that on January 1, 2010, we completed a leadership transition that began in March 2008. I succeeded Jack Brennan as chairman of Vanguard and each of the funds. Jack has agreed to serve as chairman emeritus and senior advisor.
Under Jack’s leadership, Vanguard has grown to become a preeminent firm in the mutual fund industry. Jack’s energy, his relentless pursuit of perfection, and his unwavering focus on always doing the right thing for our clients are evident in every facet of Vanguard policy today.
Thank you for entrusting your assets to Vanguard.

F. William McNabb III
Chairman and Chief Executive Officer
January 13, 2010
6
Results of Proxy Voting
At a special meeting of shareholders on July 2, 2009, fund shareholders approved the following two proposals:
Proposal 1—Elect trustees for each fund.*
The individuals listed in the table below were elected as trustees for each fund. All trustees with the exception of Messrs. McNabb and Volanakis (both of whom already served as directors of The Vanguard Group, Inc.) served as trustees to the funds prior to the shareholder meeting.
| | | | |
| | | | Percentage | |
| Trustee | For | Withheld | For | |
| John J. Brennan | 800,870,883 | 12,470,067 | 98.5 | % |
| Charles D. Ellis | 789,425,633 | 23,915,317 | 97.1 | % |
| Emerson U. Fullwood | 804,990,098 | 8,350,851 | 99.0 | % |
| Rajiv L. Gupta | 802,591,507 | 10,749,443 | 98.7 | % |
| Amy Gutmann | 805,052,646 | 8,288,304 | 99.0 | % |
| JoAnn Heffernan Heisen | 802,450,398 | 10,890,552 | 98.7 | % |
| F. William McNabb III | 803,031,309 | 10,309,641 | 98.7 | % |
| André F. Perold | 802,741,071 | 10,599,879 | 98.7 | % |
| Alfred M. Rankin, Jr. | 802,368,637 | 10,972,313 | 98.7 | % |
| Peter F. Volanakis | 805,004,858 | 8,336,092 | 99.0 | % |
| * Results are for all funds within the same trust. | | | | |
Proposal 2—Update and standardize the funds’ fundamental policies regarding:
| (a) | Purchasing and selling real estate. |
| (b) | Issuing senior securities. |
| (c) | Borrowing money. |
| (d) | Making loans. |
| (e) | Purchasing and selling commodities. |
| (f) | Concentrating investments in a particular industry or group of industries. |
| (g) | Eliminating outdated fundamental investment policies not required by law. |
7
The revised fundamental policies are clearly stated and simple, yet comprehensive, making oversight and compliance more efficient than under the former policies. The revised fundamental policies will allow the funds to respond more quickly to regulatory and market changes, while avoiding the costs and delays associated with successive shareholder meetings.
| | | | | | | |
| | | | | | Broker | Percentage | |
| Vanguard Fund | | For | Abstain | Against | Non-Votes | For | |
| Institutional Index Fund | | | | | | | |
| 2a | | 310,302,160 | 14,000,840 | 4,829,463 | 38,870,403 | 84.3 | % |
| 2b | | 307,774,109 | 14,072,301 | 7,286,057 | 38,870,398 | 83.6 | % |
| 2c | | 303,505,159 | 14,092,690 | 11,534,618 | 38,870,400 | 82.5 | % |
| 2d | | 304,306,414 | 15,670,873 | 9,155,180 | 38,870,399 | 82.7 | % |
| 2e | | 304,030,716 | 14,005,328 | 11,096,422 | 38,870,400 | 82.6 | % |
| 2f | | 307,687,882 | 14,329,653 | 7,114,932 | 38,870,399 | 83.6 | % |
| 2g | | 307,563,436 | 14,006,378 | 7,562,649 | 38,870,403 | 83.6 | % |
8
Institutional Index Fund
Fund Profile
As of December 31, 2009
| | | | | | | | |
| Share-Class Characteristics | | | | |
| | Institutional | | | Institutional | |
| | Shares | | | Plus Shares | |
| Ticker Symbol | | | | VINIX | | | VIIIX | |
| Expense Ratio1 | 0.05 | % | | 0.025 | % |
| 30-Day SEC Yield | 1.83 | % | | 1.85 | % |
| |
| Portfolio Characteristics | | | | | | | |
| | | | | | | | DJ | |
| | | | | | | | U.S. Total | |
| | | | | S&P 500 Market | |
| | Fund | | | Index | | | Index | |
| Number of Stocks | 502 | | | 500 | | | 4,201 | |
| Median Market Cap | $42.7B | | $ | 42.7 | B | $ | 30.7 | B |
| Price/Earnings Ratio | 30.3 | x | | 30.3 | x | | 35.7 | x |
| Price/Book Ratio | 2.2 | x | | 2.2 | x | | 2.1 | x |
| Return on Equity | 20.8 | % | | 20.8 | % | | 19.3 | % |
| Earnings Growth Rate | 8.2 | % | | 8.2 | % | | 8.1 | % |
| Dividend Yield | 1.9 | % | | 1.9 | % | | 1.8 | % |
| Foreign Holdings | 0.0 | % | | 0.0 | % | | 0.0 | % |
| Turnover Rate | 11 | % | | — | | | — | |
| Short-Term Reserves | -0.1 | % | | — | | | — | |
Sector Diversification (% of equity exposure)
| | | | | | |
| | | | | | DJ | |
| | | | | | U.S. Total | |
| | | | S&P 500 | | Market | |
| | Fund | | Index | | Index | |
| Consumer | | | | | | |
| Discretionary | 9.6 | % | 9.6 | % | 10.3 | % |
| Consumer Staples | 11.4 | | 11.4 | | 9.9 | |
| Energy | 11.5 | | 11.5 | | 10.6 | |
| Financials | 14.4 | | 14.4 | | 16.0 | |
| Health Care | 12.6 | | 12.6 | | 12.6 | |
| Industrials | 10.2 | | 10.2 | | 10.6 | |
| Information | | | | | | |
| Technology | 19.8 | | 19.8 | | 19.3 | |
| Materials | 3.6 | | 3.6 | | 4.0 | |
| Telecommunication | | | | | | |
| Services | 3.2 | | 3.2 | | 2.9 | |
| Utilities | 3.7 | | 3.7 | | 3.8 | |
| | |
| Volatility Measures | | |
| | | DJ |
| | | U.S. Total |
| | S&P 500 | Market |
| | Index | Index |
| R-Squared | 1.00 | 0.99 |
| Beta | 1.00 | 0.97 |
These measures show the degree and timing of the fund’s fluctuations compared with the indexes over 36 months.
Ten Largest Holdings (% of total net assets)
| | | |
| Exxon Mobil Corp. | Integrated Oil & | | |
| | Gas | 3.2 | % |
| Microsoft Corp. | Systems Software | 2.4 | |
| Apple Inc. | Computer | | |
| | Hardware | 1.9 | |
| Johnson & Johnson | Pharmaceuticals | 1.8 | |
| Procter & Gamble Co. | Household | | |
| | Products | 1.8 | |
| International Business | Computer | | |
| Machines Corp. | Hardware | 1.7 | |
| AT&T Inc. | Integrated | | |
| | Telecommunication | | |
| | Services | 1.7 | |
| JPMorgan Chase & Co. | Diversified Financial | | |
| | Services | 1.6 | |
| General Electric Co. | Industrial | | |
| | Conglomerates | 1.6 | |
| Chevron Corp. | Integrated Oil & | | |
| | Gas | 1.5 | |
| Top Ten | | 19.2 | % |
The holdings listed exclude any temporary cash investments and equity index products.
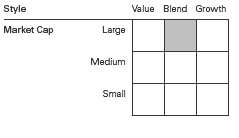
Investment Focus
1 The expense ratios shown are from the prospectus dated April 29, 2009. For the fiscal year ended December 31, 2009, the expense ratios were 0.05% for Institutional Shares and 0.025% for Institutional Plus Shares.
9
Institutional Index Fund
Performance Summary
All of the returns in this report represent past performance, which is not a guarantee of future results that may be achieved by the fund. (Current performance may be lower or higher than the performance data cited. For performance data current to the most recent month-end, visit our website at www.vanguard.com/performance.) Note, too, that both investment returns and principal value can fluctuate widely, so an investor’s shares, when sold, could be worth more or less than their original cost. The returns shown do not reflect taxes that a shareholder would pay on fund distributions or on the sale of fund shares.
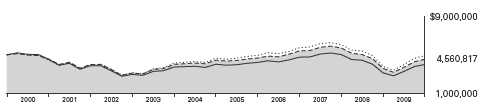
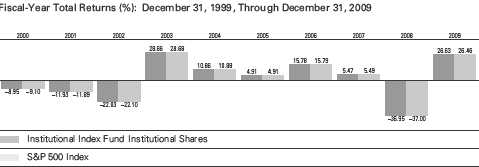
Cumulative Performance: December 31, 1999, Through December 31, 2009
Initial Investment of $5,000,000
| | | | | | | | |
| | Average Annual Total Returns | | | |
| | Periods Ended December 31, 2009 | | | |
| | | | | | | | | Final Value |
| | One | | Five | | Ten | | | of a $5,000,000 |
| | Year | | Years | | Years | | | Investment |
| Institutional Index Fund Institutional | | | | | | | | |
| Shares | 26.63 | % | 0.45 | % | -0.92 | % | $ | 4,560,817 |
| Dow Jones U.S. Total Stock Market | | | | | | | | |
| Index | 29.35 | | 1.09 | | -0.17 | | | 4,913,789 |
| S&P 500 Index | 26.46 | | 0.42 | | -0.95 | | | 4,545,113 |
| Large-Cap Core Funds Average | 27.46 | | -0.15 | | -2.21 | | | 4,000,300 |
Large-Cap Core Funds Average: Derived from data provided by Lipper Inc.
| | | | | | | | |
| | | | | | | | | Final Value |
| | One | | Five | | Ten | | | of a $200,000,000 |
| | Year | | Years | | Years | | | Investment |
| Institutional Index Fund Institutional | | | | | | | | |
| Plus Shares | 26.66 | % | 0.48 | % | -0.89 | % | $ | 182,916,568 |
| Dow Jones U.S. Total Stock Market | | | | | | | | |
| Index | 29.35 | | 1.09 | | -0.17 | | | 196,551,580 |
| S&P 500 Index | 26.46 | | 0.42 | | -0.95 | | | 181,804,501 |
See Financial Highlights for dividend and capital gains information.
10
Institutional Index Fund
11
Institutional Index Fund
Financial Statements
Statement of Net Assets
As of December 31, 2009
The fund reports a complete list of its holdings in regulatory filings four times in each fiscal year, at the quarter-ends. For the second and fourth fiscal quarters, the lists appear in the fund’s semiannual and annual reports to shareholders. For the first and third fiscal quarters, the fund files the lists with the Securities and Exchange Commission on Form N-Q. Shareholders can look up the fund’s Forms N-Q on the SEC’s website at www.sec.gov. Forms N-Q may also be reviewed and copied at the SEC’s Public Reference Room (see the back cover of this report for further information).
| | | | | |
| | | | | Market | |
| | | | | Value• | |
| | | Shares | ($ | 000 | ) |
| Common Stocks (99.6%)1 | | | | |
| Consumer Discretionary (9.6%) | | | |
| | McDonald’s Corp. | 7,483,194 | | 467,251 | |
| | Walt Disney Co. | 13,325,990 | | 429,763 | |
| | Home Depot Inc. | 11,790,714 | | 341,105 | |
| | Comcast Corp. Class A | 18,950,056 | | 319,498 | |
| * | Amazon.com Inc. | 2,311,763 | | 310,978 | |
| | Target Corp. | 5,216,510 | | 252,323 | |
| | Lowe’s Cos. Inc. | 10,207,067 | | 238,743 | |
| | Time Warner Inc. | 8,095,949 | | 235,916 | |
| * | Ford Motor Co. | 22,931,452 | | 229,314 | |
| * | DIRECTV Class A | 6,634,831 | | 221,272 | |
| | News Corp. Class A | 15,623,802 | | 213,890 | |
| | NIKE Inc. Class B | 2,701,484 | | 178,487 | |
| | Johnson Controls Inc. | 4,653,110 | | 126,751 | |
| * | Viacom Inc. Class B | 4,208,807 | | 125,128 | |
| | Staples Inc. | 5,019,372 | | 123,426 | |
| * | Starbucks Corp. | 5,151,057 | | 118,783 | |
| * | Kohl’s Corp. | 2,125,903 | | 114,650 | |
| | Yum! Brands Inc. | 3,242,910 | | 113,405 | |
| | TJX Cos. Inc. | 2,910,162 | | 106,366 | |
| | Time Warner Cable Inc. | 2,443,631 | | 101,142 | |
| * | Carnival Corp. | 3,029,890 | | 96,017 | |
| | Best Buy Co. Inc. | 2,368,261 | | 93,452 | |
| | Omnicom Group Inc. | 2,157,965 | | 84,484 | |
| | Coach Inc. | 2,211,307 | | 80,779 | |
| | McGraw-Hill Cos. Inc. | 2,183,356 | | 73,164 | |
| * | Bed Bath & Beyond Inc. | 1,821,279 | | 70,356 | |
| | Gap Inc. | 3,301,015 | | 69,156 | |
| * | priceline.com Inc. | 304,726 | | 66,583 | |
| | CBS Corp. Class B | 4,695,139 | | 65,967 | |
| * | Apollo Group Inc. Class A | 890,992 | | 53,976 | |
| | H&R Block Inc. | 2,324,733 | | 52,585 | |
| | Mattel Inc. | 2,506,219 | | 50,074 | |
| | Macy’s Inc. | 2,918,932 | | 48,921 | |
| | Marriott International Inc. | | | | |
| | Class A | 1,758,515 | | 47,920 | |
| | Starwood Hotels & | | | | |
| | Resorts Worldwide Inc. | 1,296,527 | | 47,414 | |
| | VF Corp. | 615,567 | | 45,084 | |
| | | | | |
| | | | | Market | |
| | | | | Value• | |
| | | Shares | ($ | 000 | ) |
| | Fortune Brands Inc. | 1,042,285 | | 45,027 | |
| | JC Penney Co. Inc. | 1,635,249 | | 43,514 | |
| | Nordstrom Inc. | 1,145,919 | | 43,064 | |
| | Genuine Parts Co. | 1,106,157 | | 41,990 | |
| | Whirlpool Corp. | 514,943 | | 41,535 | |
| | Harley-Davidson Inc. | 1,625,375 | | 40,959 | |
| | Sherwin-Williams Co. | 659,989 | | 40,688 | |
| | International Game | | | | |
| | Technology | 2,059,049 | | 38,648 | |
| * | Expedia Inc. | 1,461,335 | | 37,571 | |
| | Tiffany & Co. | 862,742 | | 37,098 | |
| | Ross Stores Inc. | 867,242 | | 37,040 | |
| * | O’Reilly Automotive Inc. | 951,063 | | 36,254 | |
| | Ltd Brands Inc. | 1,854,529 | | 35,681 | |
| | Darden Restaurants Inc. | 967,929 | | 33,945 | |
| * | AutoZone Inc. | 207,370 | | 32,779 | |
| | Polo Ralph Lauren Corp. | | | | |
| | Class A | 398,234 | | 32,249 | |
| | Newell Rubbermaid Inc. | 1,925,152 | | 28,897 | |
| *,^ | Sears Holdings Corp. | 336,409 | | 28,073 | |
| | Wynn Resorts Ltd. | 477,938 | | 27,830 | |
| | Hasbro Inc. | 863,504 | | 27,684 | |
| | Black & Decker Corp. | 417,512 | | 27,067 | |
| | Family Dollar Stores Inc. | 962,120 | | 26,776 | |
| | Scripps Networks | | | | |
| | Interactive Inc. Class A | 621,922 | | 25,810 | |
| * | GameStop Corp. Class A | 1,145,113 | | 25,124 | |
| | Wyndham | | | | |
| | Worldwide Corp. | 1,242,122 | | 25,054 | |
| * | Interpublic Group of | | | | |
| | Cos. Inc. | 3,380,467 | | 24,948 | |
| | DeVry Inc. | 429,644 | | 24,374 | |
| | Gannett Co. Inc. | 1,637,652 | | 24,319 | |
| * | Goodyear Tire & | | | | |
| | Rubber Co. | 1,683,939 | | 23,744 | |
| | Pulte Homes Inc. | 2,195,462 | | 21,955 | |
| | Leggett & Platt Inc. | 1,057,726 | | 21,578 | |
| | Abercrombie & Fitch Co. | 611,802 | | 21,321 | |
| | DR Horton Inc. | 1,921,950 | | 20,892 | |
| | Washington Post Co. | | | | |
| | Class B | 43,137 | | 18,963 | |
12
| | | | | |
| Institutional Index Fund | | | | |
| |
| |
| |
| | | | | Market | |
| | | | | Value• | |
| | | Shares | ($ | 000 | ) |
| | Harman International | | | | |
| | Industries Inc. | 482,341 | | 17,017 | |
| | RadioShack Corp. | 870,555 | | 16,976 | |
| * | Big Lots Inc. | 574,539 | | 16,650 | |
| | Lennar Corp. Class A | 1,121,945 | | 14,327 | |
| | Comcast Corp. | 844,535 | | 13,521 | |
| * | Office Depot Inc. | 1,910,439 | | 12,322 | |
| * | AutoNation Inc. | 643,061 | | 12,315 | |
| * | New York Times Co. | | | | |
| | Class A | 804,050 | | 9,938 | |
| * | Eastman Kodak Co. | 1,865,013 | | 7,870 | |
| | Meredith Corp. | 255,028 | | 7,868 | |
| | | | | 6,605,378 | |
| Consumer Staples (11.3%) | | | | |
| | Procter & Gamble Co. | 20,259,809 | | 1,228,352 | |
| | Coca-Cola Co. | 16,067,710 | | 915,859 | |
| | Wal-Mart Stores Inc. | 14,795,356 | | 790,812 | |
| | PepsiCo Inc. | 10,820,277 | | 657,873 | |
| | Philip Morris | | | | |
| | International Inc. | 13,207,334 | | 636,461 | |
| | CVS Caremark Corp. | 9,780,770 | | 315,039 | |
| | Colgate-Palmolive Co. | 3,447,506 | | 283,213 | |
| | Altria Group Inc. | 14,368,834 | | 282,060 | |
| | Kraft Foods Inc. | 10,242,677 | | 278,396 | |
| | Walgreen Co. | 6,856,476 | | 251,770 | |
| | Kimberly-Clark Corp. | 2,880,137 | | 183,494 | |
| | Costco Wholesale Corp. | 3,023,068 | | 178,875 | |
| | General Mills Inc. | 2,264,482 | | 160,348 | |
| | Archer-Daniels- | | | | |
| | Midland Co. | 4,453,983 | | 139,454 | |
| | Sysco Corp. | 4,103,633 | | 114,655 | |
| | Kellogg Co. | 1,762,577 | | 93,769 | |
| | HJ Heinz Co. | 2,188,558 | | 93,583 | |
| | Avon Products Inc. | 2,961,055 | | 93,273 | |
| | Kroger Co. | 4,512,511 | | 92,642 | |
| | Lorillard Inc. | 1,113,821 | | 89,362 | |
| | ConAgra Foods Inc. | 3,070,975 | | 70,786 | |
| | Reynolds American Inc. | 1,171,738 | | 62,067 | |
| | Mead Johnson | | | | |
| | Nutrition Co. Class A | 1,417,868 | | 61,961 | |
| | Safeway Inc. | 2,817,717 | | 59,989 | |
| | Clorox Co. | 969,279 | | 59,126 | |
| | Sara Lee Corp. | 4,834,627 | | 58,886 | |
| | JM Smucker Co. | 825,160 | | 50,954 | |
| | Dr Pepper Snapple | | | | |
| | Group Inc. | 1,761,497 | | 49,850 | |
| | Molson Coors Brewing Co. | | | |
| | Class B | 1,090,389 | | 49,242 | |
| | Coca-Cola Enterprises Inc. | 2,203,319 | | 46,710 | |
| | Campbell Soup Co. | 1,316,733 | | 44,506 | |
| | Hershey Co. | 1,152,788 | | 41,258 | |
| | Brown-Forman Corp. | | | | |
| | Class B | 761,710 | | 40,805 | |
| | Estee Lauder Cos. Inc. | | | | |
| | Class A | 818,347 | | 39,575 | |
| | Pepsi Bottling Group Inc. | 998,592 | | 37,447 | |
| | | | | |
| | | | | Market | |
| | | | | Value• | |
| | | Shares | ($ | 000 | ) |
| | McCormick & Co. Inc. | 907,648 | | 32,793 | |
| * | Whole Foods Market Inc. | 974,960 | | 26,763 | |
| | Tyson Foods Inc. Class A | 2,115,044 | | 25,952 | |
| * | Dean Foods Co. | 1,255,161 | | 22,643 | |
| * | Constellation Brands Inc. | | | | |
| | Class A | 1,386,776 | | 22,091 | |
| | SUPERVALU Inc. | 1,474,298 | | 18,738 | |
| | Hormel Foods Corp. | 485,256 | | 18,658 | |
| | | | | 7,820,090 | |
| Energy (11.4%) | | | | |
| | Exxon Mobil Corp. | 32,918,562 | | 2,244,717 | |
| | Chevron Corp. | 13,911,815 | | 1,071,071 | |
| | Schlumberger Ltd. | 8,326,206 | | 541,953 | |
| | ConocoPhillips | 10,288,077 | | 525,412 | |
| | Occidental | | | | |
| | Petroleum Corp. | 5,628,193 | | 457,853 | |
| | Apache Corp. | 2,330,975 | | 240,487 | |
| | Devon Energy Corp. | 3,079,347 | | 226,332 | |
| | Anadarko Petroleum Corp. | 3,408,129 | | 212,735 | |
| | Halliburton Co. | 6,253,886 | | 188,179 | |
| | XTO Energy Inc. | 4,023,964 | | 187,235 | |
| | EOG Resources Inc. | 1,749,814 | | 170,257 | |
| | Marathon Oil Corp. | 4,908,084 | | 153,230 | |
| | National Oilwell Varco Inc. | 2,900,659 | | 127,890 | |
| | Hess Corp. | 2,018,336 | | 122,109 | |
| | Chesapeake Energy Corp. | 4,491,089 | | 116,229 | |
| * | Southwestern Energy Co. | 2,394,169 | | 115,399 | |
| | Spectra Energy Corp. | 4,484,411 | | 91,975 | |
| | Baker Hughes Inc. | 2,148,558 | | 86,974 | |
| | Noble Energy Inc. | 1,202,746 | | 85,660 | |
| | Williams Cos. Inc. | 4,043,158 | | 85,230 | |
| | Peabody Energy Corp. | 1,857,034 | | 83,956 | |
| | Murphy Oil Corp. | 1,323,813 | | 71,751 | |
| * | Cameron International | | | | |
| | Corp. | 1,694,635 | | 70,836 | |
| | Valero Energy Corp. | 3,912,867 | | 65,540 | |
| | Consol Energy Inc. | 1,253,769 | | 62,438 | |
| | Range Resources Corp. | 1,093,615 | | 54,517 | |
| * | FMC Technologies Inc. | 847,016 | | 48,991 | |
| | El Paso Corp. | 4,862,016 | | 47,794 | |
| | Diamond Offshore | | | | |
| | Drilling Inc. | 481,865 | | 47,425 | |
| | Smith International Inc. | 1,715,301 | | 46,605 | |
| * | Nabors Industries Ltd. | 1,964,009 | | 42,992 | |
| | Pioneer Natural | | | | |
| | Resources Co. | 799,472 | | 38,511 | |
| | BJ Services Co. | 2,034,691 | | 37,845 | |
| | Cabot Oil & Gas Corp. | 718,533 | | 31,321 | |
| * | Denbury Resources Inc. | 1,731,842 | | 25,631 | |
| | Massey Energy Co. | 594,807 | | 24,988 | |
| | Sunoco Inc. | 812,942 | | 21,218 | |
| * | Rowan Cos. Inc. | 791,018 | | 17,909 | |
| | Tesoro Corp. | 974,913 | | 13,210 | |
| | | | | 7,904,405 | |
13
| | | | | |
| Institutional Index Fund | | | | |
| |
| |
| |
| | | | | Market | |
| | | | | Value• | |
| | | Shares | ($ | 000 | ) |
| Financials (14.3%) | | | | |
| | JPMorgan Chase & Co. | 27,325,197 | | 1,138,641 | |
| | Bank of America Corp. | 68,903,224 | | 1,037,683 | |
| | Wells Fargo & Co. | 35,440,944 | | 956,551 | |
| | Goldman Sachs | | | | |
| | Group Inc. | 3,564,719 | | 601,867 | |
| | Citigroup Inc. | 135,214,867 | | 447,561 | |
| | American Express Co. | 8,245,742 | | 334,117 | |
| | US Bancorp | 13,260,820 | | 298,501 | |
| | Morgan Stanley | 9,426,310 | | 279,019 | |
| | Bank of New York | | | | |
| | Mellon Corp. | 8,350,190 | | 233,555 | |
| | MetLife Inc. | 5,677,447 | | 200,698 | |
| | Travelers Cos. Inc. | 3,788,471 | | 188,893 | |
| | PNC Financial Services | | | | |
| | Group Inc. | 3,199,343 | | 168,893 | |
| | Prudential Financial Inc. | 3,217,248 | | 160,090 | |
| | Simon Property Group Inc. | 1,976,950 | | 157,761 | |
| | CME Group Inc. | 461,236 | | 154,952 | |
| | Aflac Inc. | 3,244,282 | | 150,048 | |
| | State Street Corp. | 3,429,961 | | 149,341 | |
| | Charles Schwab Corp. | 6,607,509 | | 124,353 | |
| | BB&T Corp. | 4,767,730 | | 120,957 | |
| | Capital One | | | | |
| | Financial Corp. | 3,119,643 | | 119,607 | |
| | Chubb Corp. | 2,368,336 | | 116,475 | |
| | Allstate Corp. | 3,719,789 | | 111,742 | |
| | Franklin Resources Inc. | 1,033,162 | | 108,844 | |
| �� | T Rowe Price Group Inc. | 1,785,441 | | 95,075 | |
| | Loews Corp. | 2,502,244 | | 90,957 | |
| | Northern Trust Corp. | 1,674,507 | | 87,744 | |
| * | Progressive Corp. | 4,674,784 | | 84,099 | |
| | Marsh & McLennan | | | | |
| | Cos. Inc. | 3,657,496 | | 80,758 | |
| | Public Storage | 940,375 | | 76,594 | |
| | Vornado Realty Trust | 1,087,134 | | 76,034 | |
| | AON Corp. | 1,899,231 | | 72,817 | |
| | SunTrust Banks Inc. | 3,460,855 | | 70,221 | |
| | Ameriprise Financial Inc. | 1,768,010 | | 68,634 | |
| | Invesco Ltd. | 2,915,842 | | 68,493 | |
| | Equity Residential | 1,914,561 | | 64,674 | |
| | Boston Properties Inc. | 961,745 | | 64,504 | |
| | HCP Inc. | 2,032,377 | | 62,069 | |
| | Hartford Financial | | | | |
| | Services Group Inc. | 2,655,526 | | 61,768 | |
| * | IntercontinentalExchange | | | | |
| | Inc. | 507,873 | | 57,034 | |
| | Discover Financial | | | | |
| | Services | 3,763,486 | | 55,361 | |
| | Fifth Third Bancorp | 5,514,175 | | 53,763 | |
| | Principal Financial | | | | |
| | Group Inc. | 2,211,280 | | 53,159 | |
| | Lincoln National Corp. | 2,094,345 | | 52,107 | |
| | Host Hotels & | | | | |
| | Resorts Inc. | 4,375,843 | | 51,066 | |
| | Ventas Inc. | 1,085,728 | | 47,490 | |
| | | | | |
| | | | | Market | |
| | | | | Value• | |
| | | Shares | ($ | 000 | ) |
| | AvalonBay | | | | |
| | Communities Inc. | 564,517 | | 46,352 | |
| | NYSE Euronext | 1,802,579 | | 45,605 | |
| | Hudson City Bancorp Inc. | 3,277,861 | | 45,005 | |
| | ProLogis | 3,280,776 | | 44,914 | |
| | Unum Group | 2,300,159 | | 44,899 | |
| | Regions Financial Corp. | 8,236,741 | | 43,572 | |
| | XL Capital Ltd. Class A | 2,372,014 | | 43,479 | |
| | Plum Creek | | | | |
| | Timber Co. Inc. | 1,128,751 | | 42,622 | |
| | People’s United | | | | |
| | Financial Inc. | 2,414,365 | | 40,320 | |
| * | Genworth Financial Inc. | | | | |
| | Class A | 3,387,125 | | 38,444 | |
| ^ | M&T Bank Corp. | 573,065 | | 38,332 | |
| | Health Care REIT Inc. | 852,822 | | 37,797 | |
| | Kimco Realty Corp. | 2,785,140 | | 37,683 | |
| * | SLM Corp. | 3,290,262 | | 37,081 | |
| | Moody’s Corp. | 1,360,817 | | 36,470 | |
| | Legg Mason Inc. | 1,126,261 | | 33,968 | |
| | KeyCorp | 6,090,719 | | 33,803 | |
| * | Leucadia National Corp. | 1,314,627 | | 31,275 | |
| | Comerica Inc. | 1,047,608 | | 30,978 | |
| | Cincinnati Financial Corp. | 1,127,940 | | 29,597 | |
| *,^ | American International | | | | |
| | Group Inc. | 933,117 | | 27,975 | |
| * | CB Richard Ellis | | | | |
| | Group Inc. Class A | 1,869,876 | | 25,374 | |
| | Torchmark Corp. | 575,637 | | 25,299 | |
| | Assurant Inc. | 812,249 | | 23,945 | |
| | | |
| | National Corp. | 1,543,194 | 20,679 |
| * | NASDAQ OMX Group Inc. | 1,027,492 | 20,365 |
| | Marshall & Ilsley Corp. | 3,528,583 | 19,231 |
| * | E*Trade Financial Corp. | 10,767,585 | 18,843 |
| | Huntington | | |
| | Bancshares Inc. | 4,972,592 | 18,150 |
| | Janus Capital Group Inc. | 1,265,773 | 17,025 |
| | Federated Investors Inc. | | |
| | Class B | 612,615 | 16,847 |
| | Apartment Investment & | | |
| | Management Co. | 813,621 | 12,953 |
| ^ | Zions Bancorporation | 961,051 | 12,330 |
| | | | 9,895,782 |
| Health Care (12.6%) | | |
| | Johnson & Johnson | 19,132,064 | 1,232,296 |
| | Pfizer Inc. | 55,955,622 | 1,017,833 |
| | Merck & Co. Inc. | 21,180,195 | 773,924 |
| | Abbott Laboratories | 10,725,242 | 579,056 |
| * | Amgen Inc. | 7,018,232 | 397,021 |
| | Medtronic Inc. | 7,674,633 | 337,530 |
| | Bristol-Myers Squibb Co. | 11,868,935 | 299,691 |
| * | Gilead Sciences Inc. | 6,240,067 | 270,070 |
| | Eli Lilly & Co. | 7,011,232 | 250,371 |
| | UnitedHealth Group Inc. | 8,057,396 | 245,589 |
| | Baxter International Inc. | 4,180,195 | 245,294 |
14
| | | | | |
| Institutional Index Fund | | | | |
| |
| |
| |
| | | | | Market | |
| | | | | Value• | |
| | | Shares | ($ | 000 | ) |
| * | Medco Health | | | | |
| | Solutions Inc. | 3,305,815 | | 211,275 | |
| * | WellPoint Inc. | 3,178,089 | | 185,251 | |
| * | Celgene Corp. | 3,186,822 | | 177,442 | |
| * | Express Scripts Inc. | 1,904,804 | | 164,670 | |
| * | Thermo Fisher | | | | |
| | Scientific Inc. | 2,831,188 | | 135,019 | |
| | Allergan Inc. | 2,132,196 | | 134,350 | |
| | Becton Dickinson and Co. | 1,644,150 | | 129,658 | |
| | McKesson Corp. | 1,858,090 | | 116,131 | |
| * | Biogen Idec Inc. | 2,005,183 | | 107,277 | |
| | Stryker Corp. | 1,958,024 | | 98,626 | |
| | Aetna Inc. | 3,005,726 | | 95,282 | |
| * | Boston Scientific Corp. | 10,472,850 | | 94,256 | |
| * | Genzyme Corp. | 1,840,086 | | 90,183 | |
| * | Zimmer Holdings Inc. | 1,476,717 | | 87,289 | |
| * | St Jude Medical Inc. | 2,317,561 | | 85,240 | |
| | Cardinal Health Inc. | 2,514,800 | | 81,077 | |
| * | Intuitive Surgical Inc. | 264,801 | | 80,319 | |
| * | Forest Laboratories Inc. | 2,092,246 | | 67,182 | |
| | CIGNA Corp. | 1,895,867 | | 66,867 | |
| | Quest Diagnostics Inc. | 1,076,815 | | 65,018 | |
| * | Life Technologies Corp. | 1,236,409 | | 64,578 | |
| * | Hospira Inc. | 1,124,277 | | 57,338 | |
| * | Laboratory Corp. of | | | | |
| | America Holdings | 736,293 | | 55,104 | |
| | CR Bard Inc. | 669,297 | | 52,138 | |
| | AmerisourceBergen Corp. | | | | |
| | Class A | 1,997,344 | | 52,071 | |
| * | Humana Inc. | 1,177,444 | | 51,678 | |
| * | DaVita Inc. | 708,533 | | 41,619 | |
| * | Waters Corp. | 656,487 | | 40,676 | |
| * | Varian Medical | | | | |
| | Systems Inc. | 862,831 | | 40,424 | |
| * | Mylan Inc. | 2,118,586 | | 39,046 | |
| | DENTSPLY | | | | |
| | International Inc. | 1,053,978 | | 37,068 | |
| * | Cephalon Inc. | 517,537 | | 32,299 | |
| * | CareFusion Corp. | 1,227,791 | | 30,707 | |
| * | Watson | | | | |
| | Pharmaceuticals Inc. | 735,732 | | 29,142 | |
| * | Millipore Corp. | 385,482 | | 27,890 | |
| | IMS Health Inc. | 1,264,673 | | 26,634 | |
| * | Coventry Health Care Inc. | 1,029,047 | | 24,996 | |
| * | King Pharmaceuticals Inc. | 1,726,303 | | 21,182 | |
| * | Patterson Cos. Inc. | 647,252 | | 18,110 | |
| | PerkinElmer Inc. | 811,971 | | 16,718 | |
| * | Tenet Healthcare Corp. | 3,011,204 | | 16,230 | |
| | | | | 8,696,735 | |
| Industrials (10.2%) | | | | |
| | General Electric Co. | 73,831,671 | | 1,117,073 | |
| | United Technologies Corp. | 6,500,925 | | 451,229 | |
| | 3M Co. | 4,909,054 | | 405,831 | |
| | United Parcel Service Inc. | | | | |
| | Class B | 6,884,122 | | 394,942 | |
| | Boeing Co. | 5,038,252 | | 272,721 | |
| | | | | |
| | | | | Market | |
| | | | | Value• | |
| | | Shares | ($ | 000 | ) |
| | Caterpillar Inc. | 4,317,969 | | 246,081 | |
| | Union Pacific Corp. | 3,498,484 | | 223,553 | |
| | Emerson Electric Co. | 5,215,401 | | 222,176 | |
| | Honeywell | | | | |
| | International Inc. | 5,290,936 | | 207,405 | |
| | General Dynamics Corp. | 2,675,115 | | 182,363 | |
| | FedEx Corp. | 2,166,950 | | 180,832 | |
| | Burlington Northern | | | | |
| | Santa Fe Corp. | 1,817,542 | | 179,246 | |
| | Lockheed Martin Corp. | 2,217,801 | | 167,111 | |
| | Deere & Co. | 2,932,618 | | 158,625 | |
| | Raytheon Co. | 2,636,123 | | 135,813 | |
| | Danaher Corp. | 1,804,182 | | 135,674 | |
| | Norfolk Southern Corp. | 2,550,907 | | 133,719 | |
| | CSX Corp. | 2,721,945 | | 131,987 | |
| | Illinois Tool Works Inc. | 2,674,321 | | 128,341 | |
| | Northrop Grumman Corp. | 2,175,500 | | 121,502 | |
| | Waste Management Inc. | 3,395,095 | | 114,788 | |
| | Precision Castparts Corp. | 975,711 | | 107,670 | |
| | PACCAR Inc. | 2,520,453 | | 91,417 | |
| | Eaton Corp. | 1,149,563 | | 73,135 | |
| | L-3 Communications | | | | |
| | Holdings Inc. | 805,811 | | 70,065 | |
| | CH Robinson | | | | |
| | Worldwide Inc. | 1,163,032 | | 68,305 | |
| | Cummins Inc. | 1,399,096 | | 64,163 | |
| | Republic Services Inc. | | | | |
| | Class A | 2,240,312 | | 63,423 | |
| | ITT Corp. | 1,266,720 | | 63,007 | |
| | Rockwell Collins Inc. | 1,090,140 | | 60,350 | |
| | Parker Hannifin Corp. | 1,114,130 | | 60,029 | |
| | Southwest Airlines Co. | 5,144,157 | | 58,798 | |
| | Fluor Corp. | 1,240,911 | | 55,891 | |
| | Goodrich Corp. | 862,192 | | 55,396 | |
| | Dover Corp. | 1,290,733 | | 53,707 | |
| | Expeditors International | | | | |
| | of Washington Inc. | 1,470,151 | | 51,058 | |
| | Rockwell Automation Inc. | 986,199 | | 46,332 | |
| *,^ | First Solar Inc. | 336,251 | | 45,528 | |
| | WW Grainger Inc. | 437,917 | | 42,403 | |
| | Fastenal Co. | 915,199 | | 38,109 | |
| | Flowserve Corp. | 387,136 | | 36,596 | |
| | Textron Inc. | 1,879,526 | | 35,354 | |
| | Masco Corp. | 2,489,524 | | 34,380 | |
| | Roper Industries Inc. | 631,191 | | 33,055 | |
| | Pitney Bowes Inc. | 1,435,975 | | 32,683 | |
| * | Jacobs Engineering | | | | |
| | Group Inc. | 861,996 | | 32,420 | |
| * | Stericycle Inc. | 583,905 | | 32,214 | |
| | RR Donnelley & Sons Co. | 1,423,202 | | 31,695 | |
| | Dun & Bradstreet Corp. | 360,280 | | 30,397 | |
| * | Quanta Services Inc. | 1,454,687 | | 30,316 | |
| | Pall Corp. | 810,308 | | 29,333 | |
| | Stanley Works | 557,501 | | 28,717 | |
| * | Iron Mountain Inc. | 1,254,695 | | 28,557 | |
| | Avery Dennison Corp. | 781,583 | | 28,520 | |
15
| | | | | |
| Institutional Index Fund | | | | |
| |
| |
| |
| | | | | Market | |
| | | | | Value• | |
| | | Shares | ($ | 000 | ) |
| | Robert Half | | | | |
| | International Inc. | 1,046,522 | | 27,974 | |
| | Equifax Inc. | 876,694 | | 27,081 | |
| | Cintas Corp. | 914,170 | | 23,814 | |
| | Snap-On Inc. | 401,443 | | 16,965 | |
| | Ryder System Inc. | 389,703 | | 16,044 | |
| * | Monster Worldwide Inc. | 874,059 | | 15,209 | |
| * | Raytheon Co. | | | | |
| | Warrants Exp. 6/16/2011 | 20,998 | | 304 | |
| | | | | 7,051,426 | |
| Information Technology (19.8%) | | | |
| | Microsoft Corp. | 53,565,525 | | 1,633,213 | |
| * | Apple Inc. | 6,245,468 | | 1,316,919 | |
| | International Business | | | | |
| | Machines Corp. | 9,108,741 | | 1,192,334 | |
| * | Google Inc. Class A | 1,672,002 | | 1,036,608 | |
| * | Cisco Systems Inc. | 39,889,448 | | 954,953 | |
| | Hewlett-Packard Co. | 16,441,396 | | 846,896 | |
| | Intel Corp. | 38,290,451 | | 781,125 | |
| | Oracle Corp. | 27,114,419 | | 665,388 | |
| | QUALCOMM Inc. | 11,582,157 | | 535,791 | |
| | Visa Inc. Class A | 3,105,898 | | 271,642 | |
| * | EMC Corp. | 14,144,153 | | 247,098 | |
| | Texas Instruments Inc. | 8,687,410 | | 226,394 | |
| | Corning Inc. | 10,789,941 | | 208,354 | |
| * | eBay Inc. | 7,799,779 | | 183,607 | |
| * | Dell Inc. | 11,939,204 | | 171,447 | |
| | Mastercard Inc. Class A | 665,771 | | 170,424 | |
| | Automatic Data | | | | |
| | Processing Inc. | 3,499,055 | | 149,830 | |
| * | Yahoo! Inc. | 8,257,467 | | 138,560 | |
| * | Adobe Systems Inc. | 3,631,631 | | 133,571 | |
| | Applied Materials Inc. | 9,247,738 | | 128,913 | |
| | Motorola Inc. | 16,023,673 | | 124,344 | |
| * | Symantec Corp. | 5,620,151 | | 100,545 | |
| * | Juniper Networks Inc. | 3,643,193 | | 97,164 | |
| * | Broadcom Corp. Class A | 2,986,519 | | 93,926 | |
| * | Cognizant Technology | | | | |
| | Solutions Corp. Class A | 2,043,385 | | 92,565 | |
| | Western Union Co. | 4,798,832 | | 90,458 | |
| * | NetApp Inc. | 2,349,807 | | 80,810 | |
| * | Agilent Technologies Inc. | 2,392,860 | | 74,346 | |
| * | NVIDIA Corp. | 3,847,385 | | 71,869 | |
| * | Western Digital Corp. | 1,562,656 | | 68,991 | |
| | Paychex Inc. | 2,229,997 | | 68,327 | |
| * | IntuitInc. | 2,196,209 | | 67,446 | |
| | Analog Devices Inc. | 2,023,593 | | 63,905 | |
| * | Micron Technology Inc. | 5,892,354 | | 62,223 | |
| | CA Inc. | 2,749,117 | | 61,745 | |
| * | ComputerSciences Corp. | 1,056,749 | | 60,795 | |
| * | Salesforce.com Inc. | 762,003 | | 56,213 | |
| | Amphenol Corp. Class A | 1,188,958 | | 54,906 | |
| | Fidelity National | | | | |
| | Information Services Inc. | 2,272,544 | | 53,268 | |
| * | CitrixSystems Inc. | 1,268,596 | | 52,786 | |
| * | FiservInc. | 1,067,004 | | 51,728 | |
| | | | | |
| | | | | Market | |
| | | | | Value• | |
| | | Shares | ($ | 000 | ) |
| * | BMC Software Inc. | 1,271,469 | | 50,986 | |
| | Xerox Corp. | 6,026,675 | | 50,986 | |
| * | Sun Microsystems Inc. | 5,223,238 | | 48,942 | |
| | Xilinx Inc. | 1,919,467 | | 48,102 | |
| | Linear Technology Corp. | 1,546,834 | | 47,240 | |
| | Altera Corp. | 2,047,832 | | 46,342 | |
| * | SanDisk Corp. | 1,582,217 | | 45,869 | |
| * | McAfee Inc. | 1,093,521 | | 44,364 | |
| | Harris Corp. | 913,149 | | 43,420 | |
| | KLA-Tencor Corp. | 1,184,791 | | 42,842 | |
| * | Autodesk Inc. | 1,592,646 | | 40,469 | |
| * | Affiliated Computer | | | | |
| | Services Inc. Class A | 676,920 | | 40,405 | |
| * | Red Hat Inc. | 1,301,854 | | 40,227 | |
| * | SAIC Inc. | 2,122,783 | | 40,206 | |
| * | Electronic Arts Inc. | 2,256,504 | | 40,053 | |
| * | Advanced Micro | | | | |
| | Devices Inc. | 3,903,551 | | 37,786 | |
| * | Teradata Corp. | 1,186,849 | | 37,303 | |
| | Microchip Technology Inc. | 1,272,833 | | 36,989 | |
| * | FLIR Systems Inc. | 1,052,252 | | 34,430 | |
| * | VeriSign Inc. | 1,333,399 | | 32,322 | |
| * | Akamai Technologies Inc. | 1,187,323 | | 30,075 | |
| * | LSI Corp. | 4,527,917 | | 27,213 | |
| | National | | | | |
| | Semiconductor Corp. | 1,640,242 | | 25,194 | |
| | Total System Services Inc. | 1,371,216 | | 23,681 | |
| | Jabil Circuit Inc. | 1,325,656 | | 23,027 | |
| * | MEMC Electronic | | | | |
| | Materials Inc. | 1,554,683 | | 21,175 | |
| | Molex Inc. | 942,385 | | 20,308 | |
| * | Novellus Systems Inc. | 674,511 | | 15,743 | |
| * | Tellabs Inc. | 2,685,511 | | 15,254 | |
| * | QLogic Corp. | 796,928 | | 15,038 | |
| * | Lexmark International Inc. | | | | |
| | Class A | 543,040 | | 14,108 | |
| * | Teradyne Inc. | 1,216,096 | | 13,049 | |
| * | JDS Uniphase Corp. | 1,548,159 | | 12,772 | |
| * | Compuware Corp. | 1,602,746 | | 11,588 | |
| * | Novell Inc. | 2,411,689 | | 10,009 | |
| | | | | 13,668,944 | |
| Materials (3.6%) | | | | |
| | Monsanto Co. | 3,779,367 | | 308,963 | |
| * | Freeport-McMoRan | | | | |
| | Copper & Gold Inc. | 2,980,786 | | 239,327 | |
| | Dow Chemical Co. | 7,930,575 | | 219,122 | |
| | EI du Pont de Nemours | | | | |
| | & Co. | 6,266,460 | | 210,992 | |
| | Praxair Inc. | 2,127,312 | | 170,844 | |
| | Newmont Mining Corp. | 3,398,736 | | 160,794 | |
| | Air Products & | | | | |
| | Chemicals Inc. | 1,467,851 | | 118,984 | |
| | Alcoa Inc. | 6,756,122 | | 108,909 | |
| | Nucor Corp. | 2,182,831 | | 101,829 | |
| | International Paper Co. | 3,002,877 | | 80,417 | |
| | Ecolab Inc. | 1,647,079 | | 73,427 | |
16
| | | | | |
| Institutional Index Fund | | | | |
| |
| |
| |
| | | | | Market | |
| | | | | Value• | |
| | | Shares | ($ | 000 | ) |
| | PPG Industries Inc. | 1,157,785 | | 67,777 | |
| | Weyerhaeuser Co. | 1,465,354 | | 63,215 | |
| | United States Steel Corp. | 993,805 | | 54,779 | |
| | Vulcan Materials Co. | 869,360 | | 45,789 | |
| | Sigma-Aldrich Corp. | 843,680 | | 42,631 | |
| | Cliffs Natural | | | | |
| | Resources Inc. | 908,025 | | 41,851 | |
| * | Owens-Illinois Inc. | 1,168,211 | | 38,399 | |
| | MeadWestvaco Corp. | 1,186,465 | | 33,969 | |
| | Ball Corp. | 652,329 | | 33,725 | |
| | CF Industries | | | | |
| | Holdings Inc. | 336,628 | | 30,559 | |
| | Allegheny | | | | |
| | Technologies Inc. | 679,863 | | 30,438 | |
| | Eastman Chemical Co. | 503,969 | | 30,359 | |
| | FMC Corp. | 501,206 | | 27,947 | |
| | Airgas Inc. | 569,106 | | 27,089 | |
| | Sealed Air Corp. | 1,105,399 | | 24,164 | |
| | International Flavors & | | | | |
| | Fragrances Inc. | 549,633 | | 22,612 | |
| | Bemis Co. Inc. | 752,411 | | 22,309 | |
| * | Pactiv Corp. | 920,083 | | 22,211 | |
| | AK Steel Holding Corp. | 760,533 | | 16,237 | |
| * | Titanium Metals Corp. | 588,304 | | 7,366 | |
| | | | | 2,477,034 | |
| Telecommunication Services (3.1%) | | | |
| | AT&T Inc. | 40,918,615 | | 1,146,949 | |
| | Verizon | | | | |
| | Communications Inc. | 19,697,432 | | 652,576 | |
| * | American Tower Corp. | | | | |
| | Class A | 2,783,544 | | 120,277 | |
| * | Sprint Nextel Corp. | 20,585,612 | | 75,343 | |
| | CenturyTel Inc. | 2,062,829 | | 74,695 | |
| | Qwest Communications | | | | |
| | International Inc. | 10,294,974 | | 43,342 | |
| | Windstream Corp. | 3,027,812 | | 33,275 | |
| | Frontier | | | | |
| | Communications Corp. | 2,171,953 | | 16,963 | |
| * | MetroPCS | | | | |
| | Communications Inc. | 1,813,467 | | 13,837 | |
| | | | | 2,177,257 | |
| Utilities (3.7%) | | | | |
| | Exelon Corp. | 4,572,041 | | 223,436 | |
| | Southern Co. | 5,548,632 | | 184,880 | |
| | Dominion Resources Inc. | 4,141,155 | | 161,174 | |
| | Duke Energy Corp. | 9,045,996 | | 155,682 | |
| | FPL Group Inc. | 2,866,067 | | 151,386 | |
| | Public Service Enterprise | | | | |
| | Group Inc. | 3,508,282 | | 116,650 | |
| | American Electric | | | | |
| | Power Co. Inc. | 3,311,914 | | 115,221 | |
| | PG&E Corp. | 2,572,135 | | 114,846 | |
| | Entergy Corp. | 1,309,953 | | 107,207 | |
| | | | | | | |
| | | | | | | Market | |
| | | | | | | Value• | |
| | | | Shares | | ($ | 000 | ) |
| | FirstEnergy Corp. | | 2,113,596 | | | 98,176 | |
| | Sempra Energy | | 1,708,724 | | | 95,654 | |
| | Consolidated Edison Inc. | | 1,945,577 | | | 88,388 | |
| | PPL Corp. | | 2,614,467 | | | 84,473 | |
| | Progress Energy Inc. | | 1,938,764 | | | 79,509 | |
| | Edison International | | 2,258,995 | | | 78,568 | |
| | Xcel Energy Inc. | | 3,166,151 | | | 67,186 | |
| * | AES Corp. | | 4,628,571 | | | 61,606 | |
| | Questar Corp. | | 1,208,900 | | | 50,254 | |
| | DTE Energy Co. | | 1,143,405 | | | 49,841 | |
| | Constellation Energy | | | | | | |
| | Group Inc. | | 1,392,846 | | | 48,986 | |
| | Ameren Corp. | | 1,642,560 | | | 45,910 | |
| | Wisconsin Energy Corp. | | 810,510 | | | 40,388 | |
| | EQT Corp. | | 907,635 | | | 39,863 | |
| | CenterPoint Energy Inc. | | 2,706,412 | | | 39,270 | |
| | Northeast Utilities | | 1,216,426 | | | 31,372 | |
| | NiSource Inc. | | 1,911,660 | | | 29,401 | |
| | SCANA Corp. | | 768,263 | | | 28,948 | |
| | Allegheny Energy Inc. | | 1,175,466 | | | 27,600 | |
| | Pepco Holdings Inc. | | 1,536,148 | | | 25,884 | |
| | Pinnacle West | | | | | | |
| | Capital Corp. | | 703,872 | | | 25,748 | |
| | CMS Energy Corp. | | 1,596,683 | | | 25,004 | |
| | TECO Energy Inc. | | 1,486,559 | | | 24,112 | |
| | Integrys Energy | | | | | | |
| | Group Inc. | | 531,373 | | | 22,312 | |
| | Nicor Inc. | | 314,504 | | | 13,241 | |
| | | | | | | 2,552,176 | |
| Total Common Stocks | | | | | | |
| (Cost $68,852,127) | | | | | 68,849,227 | |
| Temporary Cash Investments (0.5%)1 | | | | |
| Money Market Fund (0.5%) | | | | | | |
| 2,3 | Vanguard Market Liquidity | | | | |
| | Fund, 0.187% | | 342,767,665 | | | 342,768 | |
| |
| | | | Face | | | | |
| | | | Amount | | | | |
| | | ($ | 000 | ) | | | |
| U.S. Government and Agency Obligations (0.0%) | |
| 4,5 | Federal Home Loan | | | | | | |
| | Bank Discount Notes, | | | | | | |
| | 0.220%, 3/26/10 | | 10,000 | | | 9,997 | |
| 4,5 | Freddie Mac Discount | | | | | | |
| | Notes, 0.230%, 6/21/10 | | 17,000 | | | 16,983 | |
| | | | | | | 26,980 | |
| Total Temporary Cash Investments | | | | |
| (Cost $369,744) | | | | | 369,748 | |
| Total Investments (100.1%) | | | | | | |
| (Cost $69,221,871) | | | | | 69,218,975 | |
| | | |
| Institutional Index Fund | | | |
| |
| |
| | | Market | |
| | | Value• | |
| | ($ | 000 | ) |
| Other Assets and Liabilities (-0.1%) | | | |
| Other Assets | | 716,019 | |
| Liabilities3 | | (766,916 | ) |
| | | (50,897 | ) |
| Net Assets (100%) | | 69,168,078 | |
| | | |
| At December 31, 2009, net assets consisted of: | |
| | | Amount | |
| | ($ | 000 | ) |
| Paid-in Capital | | 70,503,967 | |
| Undistributed Net Investment Income | | 9,972 | |
| Accumulated Net Realized Losses | | (1,344,013 | ) |
| Unrealized Appreciation (Depreciation) | | | |
| Investment Securities | | (2,896 | ) |
| Futures Contracts | | 1,048 | |
| Net Assets | | 69,168,078 | |
| |
| |
| |
| Institutional Shares—Net Assets | | | |
| Applicable to 435,390,760 outstanding | | | |
| $.001 par value shares of beneficial | | | |
| interest (unlimited authorization) | | 44,401,040 | |
| Net Asset Value Per Share— | | | |
| Institutional Shares | $ | 101.98 | |
| |
| |
| Institutional Plus Shares—Net Assets | | | |
| Applicable to 242,857,138 outstanding | | | |
| $.001 par value shares of beneficial | | | |
| interest (unlimited authorization) | | 24,767,038 | |
| Net Asset Value Per Share— | | | |
| Institutional Plus Shares | $ | 101.98 | |
• See Note A in Notes to Financial Statements.
* Non-income-producing security.
^ Part of security position is on loan to broker-dealers. The total value of securities on loan is $100,731,000.
1 The fund invests a portion of its cash reserves in equity markets through the use of index futures contracts. After giving effect to futures investments, the fund’s effective common stock and temporary cash investment positions represent 100.0% and 0.1%, respectively, of net assets.
2 Affiliated money market fund available only to Vanguard funds and certain trusts and accounts managed by Vanguard. Rate shown is the 7-day yield.
3 Includes $105,494,000 of collateral received for securities on loan.
4 The issuer operates under a congressional charter; its securities are not backed by the full faith and credit of the U.S. government.
5 Securities with a value of $26,980,000 have been segregated as initial margin for open futures contracts.
REIT—Real Estate Investment Trust.
See accompanying Notes, which are an integral part of the Financial Statements.
18
| | | |
| Institutional Index Fund | | | |
| |
| |
| Statement of Operations | | | |
| |
| | | Year Ended | |
| | | December 31, 2009 | |
| | ($ | 000 | ) |
| Investment Income | | | |
| Income | | | |
| Dividends | | 1,435,305 | |
| Interest1 | | 1,697 | |
| Security Lending | | 38,627 | |
| Total Income | | 1,475,629 | |
| Expenses | | | |
| The Vanguard Group—Note B | | | |
| Management and Administrati ve—Institutional Shares | | 17,962 | |
| Management and Administrative—Institutional Plus Shares | | 5,170 | |
| Total Expenses | | 23,132 | |
| Net Investment Income | | 1,452,497 | |
| Realized Net Gain (Loss) | | | |
| Investment Securities Sold | | 3,179,801 | |
| Futures Contracts | | 105,379 | |
| Realized Net Gain (Loss) | | 3,285,180 | |
| Change in Unrealized Appreciation (Depreciation) | | | |
| Investment Securities | | 9,842,252 | |
| Futures Contracts | | (11,337 | ) |
| Change in Unrealized Appreciation (Depreciation) | | 9,830,915 | |
| Net Increase (Decrease) in Net Assets Resulting from Operations | | 14,568,592 | |
| 1 Interest income from an affiliated company of the fund was $1,402,000. | | | |
| |
| |
| |
| |
| See accompanying Notes, which are an integral part of the Financial Statements. | | | |
19
| | | | | | |
| Institutional Index Fund | | | | | | |
| |
| |
| Statement of Changes in Net Assets | | | | | | |
| |
| | | Year Ended December 31, | |
| | | 2009 | | | 2008 | |
| | ($ | 000 | ) | ($ | 000 | ) |
| Increase (Decrease) in Net Assets | | | | | | |
| Operations | | | | | | |
| Net Investment Income | | 1,452,497 | | | 1,436,285 | |
| Realized Net Gain (Loss) | | 3,285,180 | | | (732,143 | ) |
| Change in Unrealized Appreciation (Depreciation) | | 9,830,915 | | | (28,467,348 | ) |
| Net Increase (Decrease) in Net Assets Resulting from Operations | | 14,568,592 | | | (27,763,206 | ) |
| Distributions | | | | | | |
| Net Investment Income | | | | | | |
| Institutional Shares | | (922,489 | ) | | (911,292 | ) |
| Institutional Plus Shares | | (529,650 | ) | | (524,799 | ) |
| Realized Capital Gain | | | | | | |
| Institutional Shares | | — | | | — | |
| Institutional Plus Shares | | — | | | — | |
| Total Distributions | | (1,452,139 | ) | | (1,436,091 | ) |
| Capital Share Transactions | | | | | | |
| Institutional Shares | | 4,601,659 | | | 4,295,881 | |
| Institutional Plus Shares | | 2,263,207 | | | 2,467,315 | |
| Net Increase (Decrease) from Capital Share Transactions | | 6,864,866 | | | 6,763,196 | |
| Total Increase (Decrease) | | 19,981,319 | | | (22,436,101 | ) |
| Net Assets | | | | | | |
| Beginning of Period | | 49,186,759 | | | 71,622,860 | |
| End of Period1 | | 69,168,078 | | | 49,186,759 | |
| 1 Net Assets—End of Period includes undistributed net investment income of $9,972,000 and $9,614,000. | | | | |
See accompanying Notes, which are an integral part of the Financial Statements.
20
| | | | | | | | | | | | | | | |
| Institutional Index Fund | | | | | | | | | | | | | | | |
| |
| |
| Financial Highlights | | | | | | | | | | | | | | | |
| |
| |
| Institutional Shares | | | | | | | | | | | | | | | |
| |
| For a Share Outstanding | | | | | | | | Year Ended December 31, | |
| Throughout Each Period | | 2009 | | | 2008 | | | 2007 | | | 2006 | | | 2005 | |
| Net Asset Value, Beginning of Period | $ | 82.54 | | $ | 134.14 | | $ | 129.59 | | $ | 114.01 | | $ | 110.70 | |
| Investment Operations | | | | | | | | | | | | | | | |
| Net Investment Income | | 2.207 | | | 2.521 | | | 2.560 | | | 2.240 | | | 2.050 | |
| Net Realized and Unrealized Gain (Loss) | | | | | | | | | | | | | | | |
| on Investments | | 19.441 | | | (51.599 | ) | | 4.550 | | | 15.580 | | | 3.310 | |
| Total from Investment Operations | | 21.648 | | | (49.078 | ) | | 7.110 | | | 17.820 | | | 5.360 | |
| Distributions | | | | | | | | | | | | | | | |
| Dividends from Net Investment Income | | (2.208 | ) | | (2.522 | ) | | (2.560 | ) | | (2.240 | ) | | (2.050 | ) |
| Distributions from Realized Capital Gains | | — | | | — | | | — | | | — | | | — | |
| Total Distributions | | (2.208 | ) | | (2.522 | ) | | (2.560 | ) | | (2.240 | ) | | (2.050 | ) |
| Net Asset Value, End of Period | $ | 101.98 | | $ | 82.54 | | $ | 134.14 | | $ | 129.59 | | $ | 114.01 | |
| |
| Total Return | | 26.63 | % | | -36.95 | % | | 5.47 | % | | 15.78 | % | | 4.91 | % |
| |
| Ratios/Supplemental Data | | | | | | | | | | | | | | | |
| Net Assets, End of Period (Millions) | $ | 44,401 | | $ | 31,543 | | $ | 45,847 | | $ | 45,243 | | $ | 39,154 | |
| Ratio of Total Expenses to | | | | | | | | | | | | | | | |
| Average Net Assets | | 0.05 | % | | 0.05 | % | | 0.05 | % | | 0.05 | % | | 0.05 | % |
| Ratio of Net Investment Income to | | | | | | | | | | | | | | | |
| Average Net Assets | | 2.56 | % | | 2.28 | % | | 1.90 | % | | 1.87 | % | | 1.87 | % |
| Portfolio Turnover Rate1 | | 11 | % | | 7 | % | | 7 | % | | 8 | % | | 8 | % |
1 Excludes the value of portfolio securities received or delivered as a result of in-kind purchases or redemptions of the fund’s capital shares.
See accompanying Notes, which are an integral part of the Financial Statements.
21
| | | | | | | | | | | | | | | |
| Institutional Index Fund | | | | | | | | | | | | | | | |
| |
| |
| Financial Highlights | | | | | | | | | | | | | | | |
| |
| |
| Institutional Plus Shares | | | | | | | | | | | | | | | |
| |
| For a Share Outstanding | | | | | | | | Year Ended December 31, | |
| Throughout Each Period | | 2009 | | | 2008 | | | 2007 | | | 2006 | | | 2005 | |
| Net Asset Value, Beginning of Period | $ | 82.54 | | $ | 134.14 | | $ | 129.59 | | $ | 114.01 | | $ | 110.71 | |
| Investment Operations | | | | | | | | | | | | | | | |
| Net Investment Income | | 2.229 | | | 2.548 | | | 2.597 | | | 2.269 | | | 2.068 | |
| Net Realized and Unrealized Gain (Loss) | | | | | | | | | | | | | | | |
| on Investments | | 19.441 | | | (51.598 | ) | | 4.548 | | | 15.580 | | | 3.310 | |
| Total from Investment Operations | | 21.670 | | | (49.050 | ) | | 7.145 | | | 17.849 | | | 5.378 | |
| Distributions | | | | | | | | | | | | | | | |
| Dividends from Net Investment Income | | (2.230 | ) | | (2.550 | ) | | (2.595 | ) | | (2.269 | ) | | (2.078 | ) |
| Distributions from Realized Capital Gains | | — | | | — | | | — | | | — | | | — | |
| Total Distributions | | (2.230 | ) | | (2.550 | ) | | (2.595 | ) | | (2.269 | ) | | (2.078 | ) |
| Net Asset Value, End of Period | $ | 101.98 | | $ | 82.54 | | $ | 134.14 | | $ | 129.59 | | $ | 114.01 | |
| |
| Total Return | | 26.66 | % | | -36.94 | % | | 5.50 | % | | 15.81 | % | | 4.93 | % |
| |
| Ratios/Supplemental Data | | | | | | | | | | | | | | | |
| Net Assets, End of Period (Millions) | $ | 24,767 | | $ | 17,643 | | $ | 25,776 | | $ | 20,294 | | $ | 17,095 | |
| Ratio of Total Expenses to Average Net Assets | | 0.025 | % | | 0.025 | % | | 0.025 | % | | 0.025 | % | | 0.025 | % |
| Ratio of Net Investment Income to | | | | | | | | | | | | | | | |
| Average Net Assets | | 2.59 | % | | 2.30 | % | | 1.93 | % | | 1.90 | % | | 1.90 | % |
| Portfolio Turnover Rate1 | | 11 | % | | 7 | % | | 7 | % | | 8 | % | | 8 | % |
1 Excludes the value of portfolio securities received or delivered as a result of in-kind purchases or redemptions of the fund’s capital shares.
See accompanying Notes, which are an integral part of the Financial Statements.
22
Institutional Index Fund
Notes to Financial Statements
Vanguard Institutional Index Fund is registered under the Investment Company Act of 1940 as an open-end investment company, o r mutual fund. The fund offers two classes of shares, Institutional
Shares and Institutional Plus Shares, to investors who invest minimum amounts of $5 million and $200 million, respectively.
A. The following significant accounting policies conform to generally accepted accounting principles for U.S. mutual funds. The fund consistently follows such policies in preparing its financial statements.
1. Security Valuation: Securities are valued as of the close of trading on the New York Stock Exchange (generally 4 p.m., Eastern time) on the valuation date. Equity securities are valued at the latest quoted sales prices or official closing prices taken from the primary market in which each security trades; such securities not traded on the valuation date are valued at the mean of the latest quoted bid and asked pric es. Securities for which market quotations are not readily availabl e, or whose values have been materially affected by events occurring before the fund’s pricing time but after the close of the securities’ primary markets, are valued by methods deemed by the board of trustees to represent fair value. Investments in Vanguard Market Liquidity Fund are value d at that fund’s net asset value.
Temporary cash investments acquired over 60 days to maturity are valued using the latest bid prices or using valuations based on a matrix system (which considers such factors as security prices, yields, maturities, and ratings), both as furnished by independent pricing services. Other temporary cash investments are valued at amortized cost, which approximates market value.
2. Futures Contracts: The fund uses index futures contracts to a limited extent, with the objectives of maintaining full e xposure to the stock market, enhancing returns, maintaining liquidity, and minimizing transaction costs. The fund may purchase futures con tracts to immediately invest incoming cash in the market, or sell futures in response to cash outflows, thereby simulating a fully invested position in the underlying index while maintaining a cash balance for liquidity. The fund may seek to enhance returns by using futures contracts instead of the underlying securities when futures are believed to be priced more attractively than the underlying securities. The primary risks associated with the use of futures contracts are imperfect correlation between changes in market va lues of stocks held by the fund and the prices of futures contracts, and the possibility of an illiquid market.
Futures contracts are valued at their quoted daily settlement prices. The aggregate principal amounts of the contracts are not recorded in the Statement of Net Assets. Fluctuations in the value of the contracts are recorded in the Statement of Net Assets as an asset (liability) and in the Statement of Operations as unrealized appreciation (depreciation) until the contracts are closed, when they are recorded as realized futures gains (losses).
3. Federal Income Taxes: The fund intends to continue to qualify as a regulated investment company and distribute all of its taxable income. Management has analyzed the fund’s tax positions take n for all open federal income tax years (December 31, 2006–2009), and has concluded that no provision for federal income tax is required in the fund’s financial statements.
4. Distributions: Distributions to shareholders are recorded on the ex-dividend date.
5. Security Lending: The fund may lend its securities to qualified institutional borrowers to earn additional income. Security loans are required to be secured at all times by collateral at least equal to the market value of securities loaned. The fund invests cash collateral received in Vanguard Market Liquidity Fund, and records a liability for the return of the collateral, during the period the securities are on loan. Security lending income represents the income earned on investing c ash collateral, less expenses associated with the loan.
23
Institutional Index Fund
6. Other: Dividend income is recorded on the ex-dividend date. Interest income includes income distributions received from Vanguard Market Liquidity Fund and is accrued daily. Security transactions are accounted for on the date securities are bought or sold. Costs used to determine realized gains (losses) on the sale of investment securities are those of the specific securities sold. Class-specific shareholder servicing fees are charged to each class at the contractual rate. Income, expenses not attributable to a specific class, and realized and unrealized gains and losses on investments are allocated to each class of shares based on its relative net assets.
B. The Vanguard Group provides investment advisory, corporate management, administrative, marketing, and distribution services and pays for all other operating expenses, except for taxes, in return for a fee calculated at an annual percentage rate of the average net assets of the fund, or, for shareholder services, each class of shares. The fund’s trustees and officers are also directors and officers of Vanguard.
C. Various inputs may be used to determine the value of the fund’s investments. These inputs are summarized in three broad levels for financial statement purposes. The inputs or methodologies used to value securities are not necessarily an indication of the risk associated with investing in those securities.
Level 1—Quoted prices in active markets for identical securities.
Level 2—Other significant observable inputs (including quo ted prices for similar securities, interest rates, prepayment speeds, credit risk, etc.).
Level 3—Significant unobservable inputs (including the fund’s own assumptions used to determine the fair value of investments).
The following table summarizes the fund’s investments as of December 31, 2009, based on the inputs used to value them:
| | | | | | | | | |
| | | Level 1 | | | Level 2 | | | Level 3 | |
| Investments | | ($000 | ) | | ($000 | ) | | ($000 | ) |
| Common Stocks | | 68,849,227 | | | — | | | — | |
| Temporary Cash Investments | | 342,768 | | | 26,980 | | | — | |
| Futures Contracts—Liabilities1 | | (3,121 | ) | | — | | | — | |
| Total | | 69,188,874 | | | 26,980 | | | — | |
| 1 Represents variation margin on the last day of the reporting period. | | | | | | | | | |
D. At December 31, 2009, the aggregate settlement value of open futures contracts and the related unrealized appreciation (depreciation) were:
| | | | | | |
| | | | | ($ | 000 | ) |
| | | Number of | Aggregate | | Unrealized | |
| | | Long (Short) | Settlement | | Appreciation | |
| Futures Contracts | Expiration | Contracts | Value | | (Depreciation) | |
| E-mini S&P 500 Index | March 2010 | 3,236 | 179,711 | | (61 | ) |
| S&P 500 Index | March 2010 | 448 | 124,398 | | 1,109 | |
Unrealized appreciation (depreciation) on open futures contracts is required t o be treated as realized gain (loss) for tax purposes.
24
Institutional Index Fund
E. Distributions are determined on a tax basis and may differ from net investment income and realized capital gains for financial reporting purposes. Differences may be permanent or temporary. Permanent differences are reclassified among capital accounts in the financial sta tements to reflect their tax character. Temporary differences arise when certain items of income, expense, gain, or loss are recognized in different periods for financial statement and tax purposes; these differences will reverse at some time in the future. Differences in classification may also result from the treatment of short-term gains as ordinary income for tax purposes.
During the year ended December 31, 2009, the fund realized $626,072,000 of net capital gains resulting from in-kind redemptions—in which shareholders exchanged fund shares for securities held by the fund rather than for cash. Because such gains are not taxable to the fund, and are not distributed to shareholders, they have been reclassified from accumulated net realized losses to paid-in capital.
For tax purposes, at December 31, 2009, the fund had $9,535,000 of ordinary income available for distribution. The fund had available capital loss carryforwards totaling $1,342,501,000 to offset future net capital gains of $631,487,000 through December 31, 2014, $54,429,000 through December 31, 2015, and $656,585,000 through December 31, 2016.
At December 31, 2009, the cost of investment sec urities for tax purposes was $69,221,899,000. Net unrealized depreciation of investment securities for tax purposes was $2,924,000, consisting of unrealized gains of $11,019,613,000 on securities that had risen in value since their purchase and $11,022,537,000 in unrealized losses on securities that had fallen in value since their purchase.
F. During the year ended December 31, 2009, the fund purchased $14,525,791,000 of investment securities and sold $7,434,272,000 of investment securities, other than temporary cash investments.
| | | | | | | | | | |
| G. Capital share transactions for each class of shares w ere: | | | | | | | | |
| | | | | | | | Year Ended December 31, | |
| | | | | 2009 | | | | | 2008 | |
| | | Amount | | Shares | | | Amount | | Shares | |
| | ($ | 000 | ) | (000 | ) | ($ | 000 | ) | (000 | ) |
| Institutional Shares | | | | | | | | | | |
| Issued | | 10,784,824 | | 125,715 | | | 10,979,735 | | 100,686 | |
| Issued in Lieu of Cash Distributions | | 832,657 | | 9,266 | | | 827,364 | | 8,027 | |
| Redeemed | | (7,015,822 | ) | (81,732 | ) | | (7,511,218 | ) | (68,358 | ) |
| Net Increase (Decrease)—Institutional Shares | | 4,601,659 | | 53,249 | | | 4,295,881 | | 40,355 | |
| Institutional Plus Shares | | | | | | | | | | |
| Issued | | 5,888,812 | | 71,004 | | | 5,751,623 | | 52,099 | |
| Issued in Lieu of Cash Distributions | | 509,495 | | 5,659 | | | 506,788 | | 4,911 | |
| Redeemed | | (4,135,100 | ) | (47,550 | ) | | (3,791,096 | ) | (35,416 | ) |
| Net Increase (Decrease)—Institutional Plus Shares | | 2,263,207 | | 29,113 | | | 2,467,315 | | 21,594 | |
H. In preparing the financial statements as of December 31, 2009, management considered the impact of subsequent events occurring through February 10, 2010, for potential recognition or disclosure in these financial statements.
25
Report of Independent Registered Public Accounting Firm
To the Trustees of Vanguard Institutional Index Funds and the Shareholders of Vanguard Institutional
Index Fund:
In our opinion, the accompanying statement of net assets and the related statements of operations and of changes in net assets and the financial highlights present fairly, in all material respects, the financial position of Vanguard Institutional Index Fund (constituting a separate portfolio of Vanguard
Institutional Index Funds, hereafter referred to as the “Fund”) at December 31, 2009, the results of its operations for the year then ended, the changes in its net assets for each of the two years in the period then ended and the financial highlights for each of the five years in the period then ended, in conformity with accounting principles generally accepted in the United States of America. These financial statements and financial highlights (hereafter referred to as “financial statements”) are the responsibility of the Fund’s management; our responsibility is to express an opinion on these financial statements based on our audits. We conducted our audits of these financial statements in accordance with the standards of the Public Company Accounting Oversight Board (United States). Those standards require that we plan and perform the audit to obtain reasonable assurance about whether the financial statements are free of material misstatement. An audit includes examining, on a test basis, evidence supporting the amounts and disclosures in the financial statements, assessing the accounting principles used and significant estimates made by management, and evaluating the overall financial statement presentation. We believe that our audits, which included confirmation of securities at December 31, 2009 by correspondence with the custodian and broker and by agreement to the underlying ownership records of Vanguard Market Liquidity Fund, provide a reasonable basis for our opinion.
PricewaterhouseCoopers LLP
Philadelphia, Pennsylvania
February 10, 2010
Special 2009 tax information (unaudited) for Vanguard Institutional Index Fund
This information for the fiscal year ended December 31, 2009, is included pursuant to provisions of the Internal Revenue Code.
The fund distributed $1,452,139,000 of qualified dividend income to shareholders during the fiscal year.
For corporate shareholders, 96.9% of investment income (dividend income plus short-term gains, if any) qualifies for the dividends-received deduction.
26
About Your Fund’s Expenses
As a shareholder of the fund, you incur ongoing costs, which include costs for portfolio management, administrative services, and shareholder reports (like this one), among others. Operating expenses, which are deducted from a fund’s gross income, directly reduce the investment return of the fund.
A fund’s expenses are expressed as a percentage of its average net assets. This figure is known as the expense ratio. The following examples are intended to help you understand the ongoing costs (in dollars) of investing in your fund and to compare these costs with those of other mutual funds. The examples are based on an investment of $1,000 made at the beginning of the period shown and held for the entire period.
The accompanying table illustrates your fund’s costs in two ways:
• Based on actual fund return. This section helps you to estimate the actual expenses that you paid over the period. The ”Ending Account Value“ shown is derived from the fund‘s actual return, and the third column shows the dollar amount that would have been paid by an investor who started with $1,000 in the fund. You may use the information here, together with the amount you invested, to estimate the expenses that you paid over the period.
To do so, simply divide your account value by $1,000 (for example, an $8,600 account value divided by $1,000 = 8.6), then multiply the result by the number given for your fund under the heading ”Expenses Paid During Period.“
• Based on hypothetical 5% yearly return. This section is intended to help you compare your fund‘s costs with those of other mutual funds. It assumes that the fund had a yearly return of 5% before expenses, but that the expense ratio is unchanged. In this case—because the return used is not the fund’s actual return—the results do not apply to your investment. The example is useful in making comparisons because the Securities and Exchange Commission requires all mutual funds to calculate expenses based on a 5% return. You can assess your fund’s costs by comparing this hypothetical example with the hypothetical examples that appear in shareholder reports of other funds.
Note that the expenses shown in the table are meant to highlight and help you compare ongoing costs only and do not reflect transaction costs incurred by the fund for buying and selling securities. Your fund does not charge transaction fees, such as purchase or redemption fees, nor does it carry a “sales load.” The calculations assume no shares were bought or sold during the period. Your actual costs may have been higher or lower, depending on the amount of your investment and the timing of any purchases or redemptions.
You can find more information about the fund’s expenses, including annual expense ratios, in the Financial Statements section of this report. For additional information on operating expenses and other shareholder costs, please refer to your fund’s current prospectus.
27
| | | | | | |
| Six Months Ended December 31, 2009 | | | | | | |
| | | Beginning | | Ending | | Expenses |
| | | Account Value | | Account Value | | Paid During |
| Institutional Index Fund | | 6/30/2009 | | 12/31/2009 | | Period |
| Based on Actual Fund Return | | | | | | |
| Institutional Shares | | $1,000.00 | | $1,226.16 | | $0.28 |
| Institutional Plus Shares | | 1,000.00 | | 1,226.31 | | 0.14 |
| Based on Hypothetical 5% Yearly Return | | | | | | |
| Institutional Shares | | $1,000.00 | | $1,024.95 | | $0.26 |
| Institutional Plus Shares | | 1,000.00 | | 1,025.08 | | 0.13 |
The calculations are based on expenses incurred in the most recent six-month period. The fund’s annualized six-month expense ratios for that period are 0.05% for Institutional Shares and 0.025% for Institutional Plus Shares. The dollar amounts shown as “Expenses Paid” are equal to the annualized expense ratio multiplied by the average account value over the period, multiplied by the number of days in the most recent six-month period, then divided by the number of days in the most recent 12-month period.
28
Glossary
30-Day SEC Yield. A fund’s 30-day SEC yield is derived using a formula specified by the U.S. Securities and Exchange Commission. Under the formula, data related to the fund’s security holdings in the previous 30 days are used to calculate the fund’s hypothetical net income for that period, which is then annualized and divided by the fund’s estimated average net assets over the calculation period. For the purposes of this calculation, a security’s income is based on its current market yield to maturity (in the case of bonds) or its projected dividend yield (for stocks). Because the SEC yield represents hypothetical annualized income, it will differ—at times significantly—from the fund’s actual experience. As a result, the fund’s income distributions may be higher or lower than implied by the SEC yield.
Beta. A measure of the magnitude of a fund’s past share-price fluctuations in relation to the ups and downs of a given market index. The index is assigned a beta of 1.00. Compared with a given index, a fund with a beta of 1.20 typically would have seen its share price rise or fall by 12% when the index rose or fell by 10%. For this report, beta is based on returns over the past 36 months for both the fund and the index. Note that a fund’s beta should be reviewed in conjunction with its R-squared (see definition). The lower the R-squared, the less correlation there is between the fund and the index, and the less reliable beta is as an indicator of volatility.
Dividend Yield. Dividend income earned by stocks, expressed as a percentage of the aggregate market value (or of net asset value, for a fund). The yield is determined by dividing the amount of the annual dividends by the aggregate value (or net asset value) at the end of the period. For a fund, the dividend yield is based solely on stock holdings and does not include any income produced by other investments.
Earnings Growth Rate. The average annual rate of growth in earnings over the past five years for the stocks now in a fund.
Equity Exposure. A measure that reflects a fund’s investments in stocks and stock futures. Any holdings in short-term reserves are excluded.
Expense Ratio. The percentage of a fund’s average net assets used to pay its annual administrative and advisory expenses. These expenses directly reduce returns to investors.
Foreign Holdings. The percentage of a fund represented by stocks or depositary receipts of companies based outside the United States.
Inception Date. The date on which the assets of a fund (or one of its share classes) are first invested in accordance with the fund’s investment objective. For funds with a subscription period, the inception date is the day after that period ends. Investment performance is measured from the inception date.
Median Market Cap. An indicator of the size of companies in which a fund invests; the midpoint of market capitalization (market price x shares outstanding) of a fund’s stocks, weighted by the proportion of the fund’s assets invested in each stock. Stocks representing half of the fund’s assets have market capitalizations above the median, and the rest are below it.
Price/Book Ratio. The share price of a stock divided by its net worth, or book value, per share. For a fund, the weighted average price/book ratio of the stocks it holds.
29
Price/Earnings Ratio. The ratio of a stock’s current price to its per-share earnings over the past year. For a fund, the weighted average P/E of the stocks it holds. P/E is an indicator of market expectations about corporate prospects; the higher the P/E, the greater the expectations for a company’s future growth.
R-Squared. A measure of how much of a fund’s past returns can be explained by the returns from the market in general, as measured by a given index. If a fund’s total returns were precisely synchronized with an index’s returns, its R-squared would be 1.00. If the fund’s returns bore no relationship to the index’s returns, its R-squared would be 0. For this report, R-squared is based on returns over the past 36 months for both the fund and the index.
Return on Equity. The annual average rate of return generated by a company during the past five years for each dollar of shareholder’s equity (net income divided by shareholder’s equity). For a fund, the weighted average return on equity for the companies whose stocks it holds.
Short-Term Reserves. The percentage of a fund invested in highly liquid, short-term securities that can be readily converted to cash.
Turnover Rate. An indication of the fund’s trading activity. Funds with high turnover rates incur higher transaction costs and may be more likely to distribute capital gains (which may be taxable to investors). The turnover rate excludes in-kind transactions, which have minimal impact on costs.
30
This page intentionally left blank.
The People Who Govern Your Fund
The trustees of your mutual fund are there to see that the fund is operated and managed in your best interests since, as a shareholder, you are a part owner of the fund. Your fund’s trustees also serve on the board of directors of The Vanguard Group, Inc., which is owned by the Vanguard funds and provides services to them on an at-cost basis.
A majority of Vanguard’s board members are independent, meaning that they have no affiliation with Vanguard or the funds they oversee, apart from the sizable personal investments they have made as private individuals. The independent board members have distinguished backgrounds in business, academia, and public service. Each of the trustees and executive officers oversees 163 Vanguard funds.
The following table provides information for each trustee and executive officer of the fund. More information about the trustees is in the Statement of Additional Informatio n, which can be obtained, wit hout charge, by contacting Vanguard at 800-662-7447, or online at www.vanguard.com.
Interested Trustee1
F. William McNabb III
Born 1957. Trustee Since July 2009. Chairman of the Board. Principal Occupation(s) During the Past Five Years: Chairman of the Board of The Vanguard Group, Inc., and of each of the investment companies served by The Vanguard Group, since January 2010; Director of The Vanguard Group since 2008; Chief Executive Officer and President of The Vanguard Group and of each of the investment companies served by The Vanguard Group since 2008; Director of Vanguard Marketing Corporation; Managing Director of The Vanguard Group (1995–2008).
Independent Trustees
Emerson U. Fullwood
Born 1948. Trustee Since January 2008. Principal Occupation(s) During the Past Five Years: Executive Chief Staff and Marketing Officer for North America and Corporate Vice President (retired 2008) of Xerox Corporation (photocopiers and printers); Director of SPX Corporation (multi-industry manufacturing), the United Way of Rochester, the Boy Scouts of America, Amerigroup Corporation (direct health and medical insurance carriers), and Monroe Community College Foundation.
Rajiv L. Gupta
Born 1945. Trustee Since December 2001.2 Principal Occupation(s) During the Past Five Years: Chairman and Chief Executive Officer (retired 2009) and President (2006–2008) of Rohm and Haas Co. (c hemicals); Board Member of American Chemistry Council; Director of Tyco International, Ltd. (diversified manufacturing and se rvices) and Hewlett-Packard Co. (electronic computer manufacturing); Trus tee of The Conference Board.
Amy Gutmann
Born 1949. Trustee Since June 2006. Principal Occupation(s) During the Past Five Years: President of the University of Pennsylvania; Christopher H. Browne Distinguished Professor of Political Science in the School of Arts and Sciences with secondary appointments at the Annenberg School for Communication and the Graduate School of Education of the University of Pennsylvania; Director of Carnegie Corporation of New York, Schuylkill River Development Corporation, and Greater Philadelphia Chamber of Commerce; Trustee of the National Constitution Center.
JoAnn Heffernan Heisen
Born 1950. Trustee Since July 1998. Principal Occupation(s) During the Past Five Years: Corporate Vice President and Chief Global Diversity Officer since 2006 (retired 2008) and Member of the Executive Committee (retired 2008) of Johnson & Johnson (pharmaceuticals/consumer products); Vice President and Chief Information Officer of Johnson & Johnson (1997–2005); Director of the University Medical Center at Princeton and Women’s Research and Education Institute; Member of the Advisory Board of the Maxwell School of Citizenship and Public Affairs at Syracuse University.
F. Joseph Loughrey
Born 1949. Trustee Since October 2009. Principal Occupation(s) During the Past Five Years: President and Chief Operating Officer since 2005 (retired 2009) and Vice Chairman of the Board (2008–2009) of Cummins Inc. (industrial machinery); Director of SKF AB (industrial machinery), Hillenbrand, Inc. (specialized consumer services), Sauer-Danfoss Inc. (machinery), the Lumina Foundation for Education, and the Columbus Community Education Coalition; Chairman of the Advisory Council for the College of Arts and Letters at the University of Notre Dame.
André F. Perold
Born 1952. Trustee Since December 2004. Principal Occupation(s) During the Past Five Years: George Gund Professor of Finance and Banking, Harvard Business School; Chair of the Investment Committee of HighVista Strategies LLC (private in vestment firm).
Alfred M. Rankin, Jr.
Born 1941. Trustee Since January 1993. Principal Occupation(s) During the Past Five Years: Chairman, President, and Chief Executive Officer of NACCO Industries, Inc. (forklift trucks/housewares/lignite); Director of Goodrich Corporation (industrial products/ aircraft systems and services); Deputy Chairman of the Federal Reserve Bank of Cleveland; Trustee of University Hospitals of Cleveland, The Cleveland Museum of Art, and Case Western Reserve University.
Peter F. Volanakis
Born 1955. Trustee Since July 2009. Principal Occupation(s) During the Past Five Years: President since 2007 and Chief Operating Officer since 2005 of Corning Incorporated (communications equipment); President of Corning Technologies (2001–2005); Director of Corning Inco rporated and Dow Corning; Trustee of the Corning Incorporated Foundation and the Corning Museum of Glass; Overseer of the Amos Tuck School of Business Administration at Dartmouth College.
Executive Officers
Thomas J. Higgins
Born 1957. Chief Financial Officer Since September 2008. Principal Occupation(s) During the Past Five Years: Principal of The Vanguard Group, Inc.; Chief Financial Officer of each of the investment companies served by The Vanguard Group since 2008; Treasurer of each of the investment companies served by The Vanguard Group (1998–2008).
Kathryn J. Hyatt
Born 1955. Treasurer Since November 2008. Principal Occupation(s) During the Past Five Years: Principal of The Vanguard Group, Inc.; Treasurer of each of the investment companies served by The Vanguard Group since 2008; Assistant Treasurer of each of the investment companies served by The Vanguard Group (1988–2008).
Heidi Stam
Born 1956. Secretary Since July 2005. Principal Occupation(s) During the Past Five Years: Managing Director of The Vanguard Group, Inc., since 2006; General Counsel of The Vanguard Group since 2005; Secretary of The Vanguard Group and of each of the investment companies serve d by The Vanguard Group since 2005; Director and Senior Vice President of Vanguard Marketing Corporation since 2005; Principal of The Vanguard Group (1997–2006).
Vanguard Senior Management Team
R. Gregory Barton
Mortimer J. Buckley
Kathleen C. Gubanich
Paul A. Heller
Michael S. Miller
James M. Norris
Glenn W. Reed
George U. Sauter
Chairman Emeritus and Senior Advisor
John J. Brennan
Chairman, 1996–2009
Chief Executive Officer and President, 1996–2008
Founder
John C. Bogle
Chairman and Chief Executive Officer, 1974–1996
1 Mr. McNabb is considered an “interested person,” as defined in the Investment Company Act of 1940, because he is an officer of the Vanguard funds.
2 December 2002 for Vanguard Equity Income Fund, Vanguard Growth Equity Fund, the Vanguard Municipal Bond Funds, and the Vanguard State Tax-Exempt Funds.

P.O. Box 2600
Valley Forge, PA 19482-2600
Connect with Vanguard® > www.vanguard.com
| |
| Fund Information > 800-662-7447 | Standard & Poor’s 500 ®, S&P 500®, and 500 are |
| Direct Investor Account Services > 800-662-2739 | trademarks of The McGraw-Hill Companies, Inc., and |
| | have been licensed for use by The Vanguard Group, Inc. |
| Institutional Investor Services > 800-523-1036 | Vanguard mutual funds are not sponsored, endorsed, |
| Text Telephone for People | sold, or promoted by Standard & Poor’s, and Standard |
| With Hearing Impairment > 800-749-7273 | & Poor’s makes no representation regarding the |
| | advisability of investing in the funds. |
| This material may be used in conjunction | |
| with the offering of shares of any Vanguard | |
| fund only if preceded or accompanied by | |
| the fund’s current prospectus. | |
| |
| All comparative mutual fund data are from Lipper Inc. or | |
| Morningstar, Inc., unless otherwise noted. | |
| |
| You can obtain a free copy of Vanguard’s proxy voting | |
| guidelines by visiting our website, www.vanguard.com, | |
| and searching for “proxy voting guidelines,” or by calling | |
| Vanguard at 800-662-2739. The guidelines are also | |
| available from the SEC’s website, www.sec.gov. In | |
| addition, you may obtain a free report on how your fund | |
| voted the proxies for securities it owned during the 12 | |
| months ended June 30. To get the report, visit either | |
| www.vanguard.com or www.sec.gov. | |
| |
| You can review and copy information about your fund at | |
| the SEC’s Public Reference Room in Washington, D.C. To | |
| find out more about this public service, call the SEC at | |
| 202-551-8090. Information about your fund is also | |
| available on the SEC’s website, and you can receive | |
| copies of this information, for a fee, by sending a | |
| request in either of two ways: via e-mail addressed to | |
| publicinfo@sec.gov or via regular mail addressed to the | |
| Public Reference Section, Securities and Exchange | |
| Commission, Washington, DC 20549-1520. | |
| |
| | © 2010 The Vanguard Group, Inc. |
| |
| Vanguard All rights reserved. |
| Marketing Corporation, Distributor. |
| |
| Q940 022010 |

Vanguard Institutional
Total Bond Market Index Fund Annual Report

- Investors began to regain their appetite for risk and reward in early 2009, helping to fuel a rally in the corporate bond market.
- For the year ended December 31, 2009, Vanguard Institutional Total Bond Market Index Fund returned about 6%, closely tracking its target benchmark.
- In a year when lower-quality, riskier bonds were among the best performers, the fund’s return lagged the average return of its peer group.
| |
| Contents | |
| Your Fund’s Total Returns....... | 1 |
| Chairman’s Letter................... | 2 |
| Results of Proxy Voting........... | 7 |
| Fund Profile............................ | 8 |
| Performance Summary............ | 9 |
| Financial Statements............... | 11 |
| About Your Fund’s Expenses.... | 73 |
| Glossary................................... | 75 |
Please note: The opinions expressed in this report are just that—informed opinions. They should not be considered promises or advice. Also, please keep in mind that the information and opinions cover the period through the date on the front of this report. Of course, the risks of investing in your fund are spelled out in the prospectus.
See the Glossary for definitions of investment terms used in this report.
Cover photograph: Veronica Coia.
| | | | | | | | | | | | |
| Your Fund’s Total Returns | | | | | | | | | | | | |
| |
| |
| |
| |
| Fiscal Year Ended December 31, 2009 | | | | | | | | | | | | |
| |
| | | 30-Day SEC | | | Income | | | Capital | | | Total | |
| | | Yields | | | Returns | | | Returns | | | Returns | |
| Vanguard Institutional Total Bond Market | | | | | | | | | | | | |
| Index Fund | | 3.47 | % | | 4.44 | % | | 1.62 | % | | 6.06 | % |
| Barclays Capital U.S. Aggregate Bond Index | | | | | | | | | | | 5.93 | |
| Spliced Intermediate Investment-Grade Funds | | | | | | | | | | | | |
| Average | | | | | | | | | | | 12.49 | |
| Spliced Intermediate Investment-Grade Funds Average: Derived from data provided by Lipper Inc. | | | | | | | |
| |
| Your Fund’s Performance at a Glance | | | | | | | | | | | | |
| December 31, 2008 , Through December 31, 2009 | | | | | | | | | | | | |
| | | | | | | | | Distributions Per Share | |
| | | Starting | | | Ending | | | Income | | | Capital | |
| | | Share Price | | | Share Price | | | Dividends | | | Gains | |
| Vanguard Institutional Total Bond Market Index | | | | | | | | | | | | |
| Fund | $ | 51.33 | | $ | 52.01 | | $ | 2.205 | | $ | 0.150 | |
1

Chairman’s Letter
Dear Shareholder,
As credit markets returned to normal, Vanguard Institutional Total Bond Market Index Fund returned 6.06% for the year ended December 31, 2009, the second-highest fiscal-year return since the fund’s inception in 2002. The fund closely tracked its benchmark index, the Barclays Capital U.S. Aggregate Bond Index.
However, amid a low-quality bond rally, the fund’s high-quality portfolio trailed the average return of peer funds by more than 6 percentage points. In contrast, in 2008, when the highest-quality bonds were the best performers, the fund returned 5.05% while the average return of the peer group was –4.43%.
On December 31, the fund’s 30-day SEC yield was 3.47%, down from 4.48% a year ago.
Please note that this is our last stand-alone report for this fund. In early February, the fund merged with Vanguard Total Bond Market Index Fund, which has a similar portfolio and now offers six share classes, including new Institutional Plus Shares. As we announced last autumn, the merger is expected to result in greater efficiencies in the administration and investment management of the fund—developments that will ultimately benefit fund shareholders.
Also, as of January 1, 2010, both funds adopted a new float-adjusted version of their former benchmark index. Float-adjusted indexes better represent the liquidity in the marketplace by including
2
only those bonds that are actually available to investors. The Federal Reserve Board’s extraordinary efforts to stabilize the credit markets included plans to purchase more than $1 trillion in U.S. agency mortgage-backed securities, effectively removing these bonds from the investable universe. Barclays Capital updates its float-adjusted indexes as such bonds are taken out of the public supply, and then again when they are sold back.
Bond markets calmed down, money market funds endured
Compared with the last months of 2008, when credit markets seized up and investors fled to the safety of U.S. Treasuries, 2009 represented a return to normalcy for bonds. Investors’ appetite for risk returned, and the demand for corporate bonds increased, raising their prices and bringing down their yields. For the 12 months ended December 31, the broad taxable bond market returned about 6%, while municipal bonds returned about 13%.
Meanwhile, money market funds and other short-term savings vehicles did poorly in 2009. Interest rates at the shortest end of the maturity spectrum remained at historic lows, a casualty of the Federal Reserve Board’s efforts to revive the economy.
The Fed kept its target for the federal funds rate between 0% and 0.25% for the entire year.
| | | | | | |
| Market Barometer | | | | | | |
| | | | Average Annual Total Returns | |
| | | | Periods Ended December 31, 2009 | |
| | One | | Three | | Five | |
| | Year | | Years | | Years | |
| Bonds | | | | | | |
| Barclays Capital U.S. Aggregate Bond Index (Broad | | | | | | |
| taxable market) | 5.93 | % | 6.04 | % | 4.97 | % |
| Barclays Capital Municipal Bond Index | 12.91 | | 4.41 | | 4.32 | |
| Citigroup Three-Month U.S. Treasury Bill Index | 0.16 | | 2.22 | | 2.88 | |
| |
| Stocks | | | | | | |
| Russell 1000 Index (Large-caps) | 28.43 | % | -5.36 | % | 0.79 | % |
| Russell 2000 Index (Small-caps) | 27.17 | | -6.07 | | 0.51 | |
| Dow Jones U.S. Total Stock Market Index | 29.35 | | -5.01 | | 1.09 | |
| MSCI All Country World Index ex USA (International) | 42.14 | | -3.04 | | 6.30 | |
| |
| CPI | | | | | | |
| Consumer Price Index | 2.72 | % | 2.28 | % | 2.56 | % |
3
Impressive stock returns masked lingering uncertainties
For the 12 months, the broad U.S. stock market returned more than 29%, its highest calendar-year return since 2003. The year began with the market searching for a bottom, and it finally hit a low point in early March. From there, stocks mounted one of their strongest rallies ever—in magnitude and duration—resulting in a check mark-shaped stock chart for 2009.
The market’s outsized result came against a backdrop of economic uncertainty. The economy, which struggled to regain its footing as the financial crisis abated, began to show signs of growth in the second half of the year, even as unemployment climbed to levels not seen since 1983.
Stock markets outside the United States fared even better during 2009, especially many emerging markets, which weathered the financial crisis in relatively better fiscal and economic shape than their developed-market counterparts.
Corporate bonds rallied as confidence returned
In the bond market, as in the stock market, 2009 stood in sharp contrast to 2008. In 2008, investors’ customary desire to earn a return on capital was trumped by a panic to preserve it. Strong demand pushed Treasury yields down (and prices up) to near-record lows, boosting returns to exceptional levels.
But by early 2009, as government rescue programs started to take hold, investors began seeking rewards again, favoring return “on” capital in the form of the higher yields offered by corporate bonds. With the Federal Reserve Board holding short-term interest rates near zero, and investors selling Treasuries, the yield curve steepened. By December, the difference between the yields of 2-year and 10-year Treasury notes approached 3 percentage points, near levels last seen in the 1992 and 2003 economic recoveries. As a result, Treasuries lagged while the riskiest, lowest-quality bonds significantly outperformed. (The government’s sale of a record $2.1 trillion in new securities also pushed down Treasury prices.)
For the fund, these dynamics produced an income return of 4.44% (similar to 4.78% in 2008) and a capital return of 1.62%—up more than a percentage point from 2008.
Treasury and agency bonds represent a substantial portion of the broad U.S. bond market, and can have a significant influence on its return. The Treasury component of the benchmark index finished 2009 in negative territory, pulling down the index’s return. In contrast, in 2008, Treasuries’ double-digit gain helped lift the index into positive territory in an otherwise dismal year.
Corporate bonds—a smaller slice of the fixed income market—experienced a dramatic turnaround. After returning
4
–4.94% in 2008 (the worst annual return for this component of the benchmark since 1974), corporate bonds enjoyed double-digit gains in 2009. Some of the best performers were bonds of lower credit quality.
In addition to the divergent returns of low- and high-quality bonds, investors’ renewed appetite for risk led to significant differences in bond returns by maturity. In general, intermediate-maturity bonds outperformed those at the short end of the yield curve. Bonds at the long end posted the lowest returns as their yields rose, reflecting investors’ concern about potential inflation down the road.
Close tracking of the index is a hallmark of the fund’s advisor
As a concept, indexing may sound simple: Match the return of a target benchmark. In practice, however, several hurdles must be overcome to accomplish this objective. Cost is the most obvious hurdle, because an index incurs no transaction or other costs. The less obvious challenges test the skill and experience of the advisor, especially since the fund is managed using a sampling strategy (to select about 2,700 of the more than 8,000 bonds in the index).
Vanguard Fixed Income Group has a seasoned team of portfolio managers, traders, risk managers, and credit analysts, supported by state-of-the-art technology. These resources are critical to the day-today management of the fund and to the
| | |
| Total Returns | | |
| Inception Through December 31, 2009 | | |
| | Average | |
| | Annual Return | |
| Institutional Total Bond Market Index Fund (Returns since inception: 4/26/2002) | 5.28 | % |
| Barclays Capital U.S. Aggregate Bond Index | 5.37 | |
| Spliced Intermediate Investment-Grade Funds Average | 4.17 | |
| Spliced Intermediate Investment-Grade Funds Average: Derived from data provided by Lipper Inc. | | |
The figures shown represent past performance, which is not a guarantee of future results. (Current performance may be lower or higher than the performance data cited. For performance data current to the most recent month-end, visit our website at www.vanguard.com/performance.) Note, too, that both investment returns and principal value can fluctuate widely, so an investor’s shares, when sold, could be worth more or less than their original cost.
5
effort to capture the key characteristics—such as credit quality, duration, and yield to maturity—and returns of the benchmark.
From the fund’s inception on April 26, 2002, through December 31, 2009, its average annual return was 5.28%, compared with 5.37% for its benchmark index—enabling your institution to capture the return of the broad U.S. bond market less nominal expenses. And the fund’s performance compared favorably with the 4.17% average annual return of the peer group.
On another matter, I would like to inform you that on January 1, 2010, we completed a leadership transition that began in March 2008. I succeeded Jack Brennan as chairman of Vanguard and each of the funds. Jack has agreed to serve as chairman emeritus and senior advisor.
Under Jack’s leadership, Vanguard has grown to become a preeminent firm in the mutual fund industry. Jack’s energy, his relentless pursuit of perfection, and his unwavering focus on always doing the right thing for our clients are evident in every facet of Vanguard policy today.
Thank you for entrusting your assets to Vanguard.
Sincerely,
F. William McNabb III
Chairman and Chief Executive Officer
February 8, 2010
6
Results of Proxy Voting
At a special meeting of shareholders on July 2, 2009, fund shareholders approved the following two proposals:
Proposal 1—Elect trustees for each fund.*
The individuals listed in the table below were elected as trustees for each fund. All trustees with the exception of Messrs. McNabb and Volanakis (both of whom already served as directors of The Vanguard Group, Inc.) served as trustees to the funds prior to the shareholder meeting.
| | | | |
| | | | Percentage | |
| Trustee | For | Withheld | For | |
| John J. Brennan | 800,870,883 | 12,470,067 | 98.5 | % |
| Charles D. Ellis | 789,425,633 | 23,915,317 | 97.1 | % |
| Emerson U. Fullwood | 804,990,098 | 8,350,851 | 99.0 | % |
| Rajiv L. Gupta | 802,591,507 | 10,749,443 | 98.7 | % |
| Amy Gutmann | 805,052,646 | 8,288,304 | 99.0 | % |
| JoAnn Heffernan Heisen | 802,450,398 | 10,890,552 | 98.7 | % |
| F. William McNabb III | 803,031,309 | 10,309,641 | 98.7 | % |
| André F. Perold | 802,741,071 | 10,599,879 | 98.7 | % |
| Alfred M. Rankin, Jr. | 802,368,637 | 10,972,313 | 98.7 | % |
| Peter F. Volanakis | 805,004,858 | 8,336,092 | 99.0 | % |
| * Results are for all funds within the same trust. | | | | |
| |
| Proposal 2—Update and standardize the funds’ fundamental policies regarding: | | |
| (a) Purchasing and selling real estate. | | | | |
| (b) Issuing senior securities. | | | | |
| (c) Borrowing money. | | | | |
| (d) Making loans. | | | | |
| (e) Purchasing and selling commodities. | | | | |
| (f) Concentrating investments in a particular industry or group of industries. | | | |
| (g) Eliminating outdated fundamental investment policies not required by law. | | | |
The revised fundamental policies are clearly stated and simple, yet comprehensive, making oversight and compliance more efficient than under the former policies. The revised fundamental policies will allow the funds to respond more quickly to regulatory and market changes, while avoiding the costs and delays associated with successive shareholder meetings.
| | | | | | | |
| | | | | | Broker | Percentage | |
| Vanguard Fund | | For | Abstain | Against | Non-Votes | For | |
| Institutional Total Bond Market Index Fund | | | | | |
| 2a | | 87,110,502 | 367,079 | 35,009 | 1 | 99.5 | % |
| 2b | | 87,110,287 | 367,523 | 34,780 | 0 | 99.5 | % |
| 2c | | 87,100,394 | 364,387 | 47,808 | 1 | 99.5 | % |
| 2d | | 87,101,362 | 363,960 | 47,267 | 2 | 99.5 | % |
| 2e | | 87,101,115 | 362,885 | 48,589 | 1 | 99.5 | % |
| 2f | | 87,104,593 | 364,056 | 43,941 | 1 | 99.5 | % |
| 2g | | 87,113,977 | 368,669 | 29,944 | 1 | 99.5 | % |
7
Institutional Total Bond Market Index Fund
| | | | |
| Fund Profile | | | | |
| As of December 31, 2009 | | | | |
| |
| Financial Attributes | | | | |
| | | | Barclays | |
| | | | U.S. | |
| | | | Aggregate | |
| | Fund | | Bond Index | |
| Number of Bonds | 2,672 | | 8,413 | |
| Average Quality | Aa1 | /Aa2 | Aa1 | /Aa2 |
| Yield to Maturity | | | | |
| (before expenses) | 3.6 | % | 3.7 | % |
| Average Coupon | 4.7 | % | 4.7 | % |
| Average Duration | 4.5 years | | 4.6 years | |
| Average Effective | | | | |
| Maturity | 6.6 years | | 6.8 years | |
| Ticker Symbol | VITBX | | — | |
| Expense Ratio1 | 0.05 | % | — | |
| 30-Day SEC Yield | 3.47 | % | — | |
| Short-Term | | | | |
| Reserves | 0.2 | % | — | |
Average quality: Moody’s Investors Service.
| | |
| Sector Diversification (% of portfolio) | | |
| Asset-Backed | 0.5 | % |
| Commercial Mortgage-Backed | 3.0 | |
| Finance | 7.2 | |
| Foreign | 3.9 | |
| Government Mortgage-Backed | 32.7 | |
| Industrial | 10.5 | |
| Treasury/Agency | 39.8 | |
| Utilities | 2.2 | |
| Other | 0.2 | |
The agency and mortgage-backed securities sectors may include issues from government-sponsored enterprises; such issues are not backed by the full faith and credit of the U.S. government.
| |
| Volatility Measures | |
| | Barclays |
| | U.S. |
| | Aggregate |
| | Bond Index |
| R-Squared | 0.99 |
| Beta | 1.01 |
These measures show the degree and timing of the fund’s fluctuations compared with the index over 36 months.
Distribution by Maturity (% of portfolio)
| | |
| Under 1 Year | 1.8 | % |
| 1 - 3 Years | 24.3 | |
| 3 - 5 Years | 23.3 | |
| 5 - 10 Years | 38.4 | |
| 10 - 20 Years | 5.7 | |
| 20 - 30 Years | 6.4 | |
| Over 30 Years | 0.1 | |
Distribution by Credit Quality (% of portfolio)
| | |
| Aaa | 77.3 | % |
| Aa | 4.0 | |
| A | 10.2 | |
| Baa | 8.5 | |
| Ratings: Moody’s Investors Service. | | |
Investment Focus
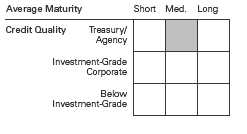
1 The expense ratio shown is from the prospectus dated April 29, 2009. For the fiscal year ended December 31, 2009, the expense ratio was 0.05%.
8
Institutional Total Bond Market Index Fund
Performance Summary
All of the returns in this report represent past performance, which is not a guarantee of future results that may be achieved by the fund. (Current performance may be lower or higher than the performance data cited. For performance data current to the most recent month-end, visit our website at www.vanguard.com/performance.) Note, too, that both investment returns and principal value can fluctuate widely, so an investor’s shares, when sold, could be worth more or less than their original cost. The returns shown do not reflect taxes that a shareholder would pay on fund distributions or on the sale of fund shares.
Cumulative Performance: April 26, 2002, Through December 31, 2009
Initial Investment of $100,000,000

| | | | | | | | |
| | Average Annual Total Returns | | | |
| | Periods Ended December 31, 2009 | | | |
| | | | | | | | | Final Value |
| | One | | Five | | Since | | | of a $100,000,000 |
| | Year | | Years | | Inception | | | Investment |
| Institutional Total Bond Market Index | | | | | | | | |
| Fund | 6.06 | % | 4.97 | % | 5.28 | % | $ | 148,521,633 |
| Barclays Capital U.S. Aggregate Bond | | | | | | | | |
| Index | 5.93 | | 4.97 | | 5.37 | | | 149,423,575 |
| Spliced Intermediate Investment-Grade | | | | | | | | |
| Funds Average | 12.49 | | 3.48 | | 4.17 | | | 136,903,599 |
Spliced Intermediate Investment-Grade Funds Average: Derived from data provided by Lipper Inc.
Performance for the fund’s Institutional Shares and comparative standards is calculated since the Institutional Shares’ inception.
See Financial Highlights for dividend and capital gains information.
9
Institutional Total Bond Market Index Fund
| | | | | | | | |
| Fiscal-Year Total Returns (%): April 26, 2002, Through December 31, 2009 | | | |
| | | | | | | | Barclays Capital U.S. | |
| | | | | | | | Aggregate Bond | |
| | | | | | | | Index | |
| Fiscal Year | Income Returns | | Capital Returns | | Total Returns | | Total Returns | |
| 2002 | 3.50 | % | 3.80 | % | 7.30 | % | 7.95 | % |
| 2003 | 3.91 | | 0.17 | | 4.08 | | 4.10 | |
| 2004 | 4.33 | | 0.03 | | 4.36 | | 4.34 | |
| 2005 | 4.40 | | -1.93 | | 2.47 | | 2.43 | |
| 2006 | 5.23 | | -0.93 | | 4.30 | | 4.33 | |
| 2007 | 5.28 | | 1.73 | | 7.01 | | 6.97 | |
| 2008 | 4.78 | | 0.27 | | 5.05 | | 5.24 | |
| 2009 | 4.44 | | 1.62 | | 6.06 | | 5.93 | |
10
Institutional Total Bond Market Index Fund
Financial Statements
Statement of Net Assets
As of December 31, 2009
The fund reports a complete list of its holdings in regulatory filings four times in each fiscal year, at the quarter-ends. For the second and fourth fiscal quarters, the lists appear in the fund’s semiannual and annual reports to shareholders. For the first and third fiscal quarters, the fund files the lists with the Securities and Exc hange Commission on Form N-Q. Shareholders can look up the fund’s Forms
N-Q on the SEC’s website at www.sec.gov. Forms N-Q may also be reviewed and copied at the SEC’s Public Reference Room (see the back cover of this report for further information).
| | | | | | | | | |
| | | | | | Face | | | Market | |
| | | | Maturity | | Amount | | | Value• | |
| | Coupon | | Date | ($ | 000 | ) | ($ | 000 | ) |
| U.S. Government and Agency Obligations (72.9%) | | | | | | | | | |
| U.S. Government Securities (33.0%) | | | | | | | | | |
| United States Treasury Inflation Indexed Bonds | 3.500 | % | 1/15/11 | | 2,250 | | | 2,899 | |
| United States Treasury Note/Bond | 1.250 | % | 11/30/10 | | 15,375 | | | 15,486 | |
| United States Treasury Note/Bond | 4.375 | % | 12/15/10 | | 6,195 | | | 6,421 | |
| United States Treasury Note/Bond | 0.875 | % | 12/31/10 | | 23,770 | | | 23,855 | |
| United States Treasury Note/Bond | 4.250 | % | 1/15/11 | | 27,000 | | | 28,012 | |
| United States Treasury Note/Bond | 0.875 | % | 1/31/11 | | 6,800 | | | 6,820 | |
| United States Treasury Note/Bond | 5.000 | % | 2/15/11 | | 1,350 | | | 1,415 | |
| United States Treasury Note/Bond | 0.875 | % | 2/28/11 | | 31,805 | | | 31,879 | |
| United States Treasury Note/Bond | 0.875 | % | 3/31/11 | | 9,475 | | | 9,491 | |
| United States Treasury Note/Bond | 4.875 | % | 4/30/11 | | 4,675 | | | 4,923 | |
| United States Treasury Note/Bond | 0.875 | % | 5/31/11 | | 1,470 | | | 1,472 | |
| United States Treasury Note/Bond | 1.125 | % | 6/30/11 | | 24,425 | | | 24,520 | |
| United States Treasury Note/Bond | 1.000 | % | 7/31/11 | | 18,225 | | | 18,251 | |
| United States Treasury Note/Bond | 4.875 | % | 7/31/11 | | 1,225 | | | 1,301 | |
| United States Treasury Note/Bond | 1.000 | % | 8/31/11 | | 13,697 | | | 13,701 | |
| United States Treasury Note/Bond | 1.000 | % | 9/30/11 | | 1,100 | | | 1,099 | |
| United States Treasury Note/Bond | 4.500 | % | 9/30/11 | | 732 | | | 776 | |
| United States Treasury Note/Bond | 1.000 | % | 10/31/11 | | 24,975 | | | 24,952 | |
| United States Treasury Note/Bond | 1.750 | % | 11/15/11 | | 9,615 | | | 9,737 | |
| United States Treasury Note/Bond | 0.750 | % | 11/30/11 | | 37,925 | | | 37,676 | |
| United States Treasury Note/Bond | 4.500 | % | 11/30/11 | | 2,975 | | | 3,167 | |
| United States Treasury Note/Bond | 1.125 | % | 12/15/11 | | 50 | | | 50 | |
| United States Treasury Note/Bond | 4.625 | % | 12/31/11 | | 1,750 | | | 1,870 | |
| United States Treasury Note/Bond | 1.125 | % | 1/15/12 | | 2,745 | | | 2,742 | |
| United States Treasury Note/Bond | 4.750 | % | 1/31/12 | | 1,750 | | | 1,878 | |
| United States Treasury Note/Bond | 4.500 | % | 3/31/12 | | 26,000 | | | 27,828 | |
| United States Treasury Note/Bond | 1.375 | % | 4/15/12 | | 7,050 | | | 7,058 | |
| United States Treasury Note/Bond | 4.500 | % | 4/30/12 | | 1,600 | | | 1,715 | |
| United States Treasury Note/Bond | 1.375 | % | 5/15/12 | | 38,400 | | | 38,406 | |
| United States Treasury Note/Bond | 4.750 | % | 5/31/12 | | 12,775 | | | 13,797 | |
| United States Treasury Note/Bond | 1.875 | % | 6/15/12 | | 10,750 | | | 10,868 | |
| United States Treasury Note/Bond | 4.875 | % | 6/30/12 | | 150 | | | 163 | |
| United States Treasury Note/Bond | 1.500 | % | 7/15/12 | | 3,000 | | | 3,005 | |
| United States Treasury Note/Bond | 4.625 | % | 7/31/12 | | 76,000 | | | 82,092 | |
| United States Treasury Note/Bond | 1.750 | % | 8/15/12 | | 39,735 | | | 39,996 | |
| United States Treasury Note/Bond | 4.375 | % | 8/15/12 | | 40 | | | 43 | |
| United States Treasury Note/Bond | 1.375 | % | 9/15/12 | | 6,850 | | | 6,820 | |
| United States Treasury Note/Bond | 4.250 | % | 9/30/12 | | 600 | | | 644 | |
11
| | | | | | | | | |
| Institutional Total Bond Market Index Fund | | | | | | | | | |
| |
| |
| |
| | | | | | Face | | | Market | |
| | | | Maturity | | Amount | | | Value• | |
| | Coupon | | Date | ($ | 000 | ) | ($ | 000 | ) |
| United States Treasury Note/Bond | 1.375 | % | 10/15/12 | | 11,450 | | | 11,389 | |
| United States Treasury Note/Bond | 1.375 | % | 11/15/12 | | 27,750 | | | 27,559 | |
| United States Treasury Note/Bond | 4.000 | % | 11/15/12 | | 50 | | | 53 | |
| United States Treasury Note/Bond | 3.375 | % | 11/30/12 | | 1,250 | | | 1,313 | |
| United States Treasury Note/Bond | 1.125 | % | 12/15/12 | | 37,575 | | | 36,982 | |
| United States Treasury Note/Bond | 3.875 | % | 2/15/13 | | 18,275 | | | 19,469 | |
| United States Treasury Note/Bond | 3.500 | % | 5/31/13 | | 10,800 | | | 11,384 | |
| United States Treasury Note/Bond | 3.375 | % | 7/31/13 | | 1,250 | | | 1,312 | |
| United States Treasury Note/Bond | 3.125 | % | 8/31/13 | | 16,725 | | | 17,386 | |
| United States Treasury Note/Bond | 3.125 | % | 9/30/13 | | 9,775 | | | 10,161 | |
| United States Treasury Note/Bond | 2.750 | % | 10/31/13 | | 36,845 | | | 37,743 | |
| United States Treasury Note/Bond | 4.250 | % | 11/15/13 | | 1,850 | | | 1,999 | |
| United States Treasury Note/Bond | 2.000 | % | 11/30/13 | | 350 | | | 348 | |
| United States Treasury Note/Bond | 1.500 | % | 12/31/13 | | 150 | | | 146 | |
| United States Treasury Note/Bond | 1.750 | % | 1/31/14 | | 1,300 | | | 1,276 | |
| United States Treasury Note/Bond | 4.000 | % | 2/15/14 | | 1,025 | | | 1,096 | |
| United States Treasury Note/Bond | 1.875 | % | 2/28/14 | | 10,475 | | | 10,305 | |
| United States Treasury Note/Bond | 1.750 | % | 3/31/14 | | 7,875 | | | 7,689 | |
| United States Treasury Note/Bond | 1.875 | % | 4/30/14 | | 11,875 | | | 11,632 | |
| United States Treasury Note/Bond | 4.750 | % | 5/15/14 | | 1,825 | | | 2,009 | |
| United States Treasury Note/Bond | 2.625 | % | 7/31/14 | | 30,265 | | | 30,426 | |
| United States Treasury Note/Bond | 2.375 | % | 8/31/14 | | 15,350 | | | 15,240 | |
| United States Treasury Note/Bond | 2.375 | % | 9/30/14 | | 26,325 | | | 26,107 | |
| United States Treasury Note/Bond | 2.375 | % | 10/31/14 | | 1,225 | | | 1,212 | |
| United States Treasury Note/Bond | 2.125 | % | 11/30/14 | | 21,350 | | | 20,853 | |
| United States Treasury Note/Bond | 2.625 | % | 12/31/14 | | 30,200 | | | 30,047 | |
| United States Treasury Note/Bond | 4.000 | % | 2/15/15 | | 365 | | | 388 | |
| United States Treasury Note/Bond | 4.125 | % | 5/15/15 | | 14,775 | | | 15,756 | |
| United States Treasury Note/Bond | 10.625 | % | 8/15/15 | | 160 | | | 225 | |
| United States Treasury Note/Bond | 4.500 | % | 11/15/15 | | 2,600 | | | 2,816 | |
| United States Treasury Note/Bond | 9.875 | % | 11/15/15 | | 6,675 | | | 9,172 | |
| United States Treasury Note/Bond | 9.250 | % | 2/15/16 | | 85 | | | 114 | |
| United States Treasury Note/Bond | 2.625 | % | 2/29/16 | | 25,450 | | | 24,766 | |
| United States Treasury Note/Bond | 2.375 | % | 3/31/16 | | 14,950 | | | 14,305 | |
| United States Treasury Note/Bond | 2.625 | % | 4/30/16 | | 3,775 | | | 3,659 | |
| United States Treasury Note/Bond | 5.125 | % | 5/15/16 | | 28,425 | | | 31,703 | |
| United States Treasury Note/Bond | 3.250 | % | 5/31/16 | | 2,925 | | | 2,938 | |
| United States Treasury Note/Bond | 4.875 | % | 8/15/16 | | 6,350 | | | 6,984 | |
| United States Treasury Note/Bond | 3.000 | % | 9/30/16 | | 9,950 | | | 9,768 | |
| United States Treasury Note/Bond | 3.125 | % | 10/31/16 | | 825 | | | 815 | |
| United States Treasury Note/Bond | 7.500 | % | 11/15/16 | | 675 | | | 851 | |
| United States Treasury Note/Bond | 2.750 | % | 11/30/16 | | 2,850 | | | 2,744 | |
| United States Treasury Note/Bond | 4.625 | % | 2/15/17 | | 50 | | | 54 | |
| United States Treasury Note/Bond | 4.500 | % | 5/15/17 | | 150 | | | 160 | |
| United States Treasury Note/Bond | 8.750 | % | 5/15/17 | | 9,725 | | | 13,151 | |
| United States Treasury Note/Bond | 4.750 | % | 8/15/17 | | 400 | | | 434 | |
| United States Treasury Note/Bond | 8.875 | % | 8/15/17 | | 17,530 | | | 23,904 | |
| United States Treasury Note/Bond | 4.250 | % | 11/15/17 | | 5,800 | | | 6,082 | |
| United States Treasury Note/Bond | 3.500 | % | 2/15/18 | | 19,350 | | | 19,199 | |
| United States Treasury Note/Bond | 3.875 | % | 5/15/18 | | 53,600 | | | 54,446 | |
| United States Treasury Note/Bond | 9.125 | % | 5/15/18 | | 425 | | | 597 | |
| United States Treasury Note/Bond | 4.000 | % | 8/15/18 | | 54,675 | | | 55,863 | |
| United States Treasury Note/Bond | 9.000 | % | 11/15/18 | | 25 | | | 35 | |
| United States Treasury Note/Bond | 8.875 | % | 2/15/19 | | 4,575 | | | 6,392 | |
| United States Treasury Note/Bond | 3.625 | % | 8/15/19 | | 2,625 | | | 2,582 | |
| United States Treasury Note/Bond | 8.125 | % | 8/15/19 | | 30 | | | 40 | |
12
| | | | | | | | | |
| Institutional Total Bond Market Index Fund | | | | | | | | | |
| |
| |
| |
| | | | | | Face | | | Market | |
| | | | Maturity | | Amount | | | Value• | |
| | Coupon | | Date | ($ | 000 | ) | ($ | 000 | ) |
| United States Treasury Note/Bond | 3.375 | % | 11/15/19 | | 34,225 | | | 32,936 | |
| United States Treasury Note/Bond | 8.750 | % | 8/15/20 | | 14,015 | | | 19,831 | |
| United States Treasury Note/Bond | 7.875 | % | 2/15/21 | | 9,155 | | | 12,311 | |
| United States Treasury Note/Bond | 8.125 | % | 5/15/21 | | 35 | | | 48 | |
| United States Treasury Note/Bond | 8.125 | % | 8/15/21 | | 5,550 | | | 7,615 | |
| United States Treasury Note/Bond | 8.000 | % | 11/15/21 | | 580 | | | 790 | |
| United States Treasury Note/Bond | 7.250 | % | 8/15/22 | | 2,545 | | | 3,299 | |
| United States Treasury Note/Bond | 7.625 | % | 11/15/22 | | 95 | | | 127 | |
| United States Treasury Note/Bond | 7.125 | % | 2/15/23 | | 1,550 | | | 1,989 | |
| United States Treasury Note/Bond | 6.250 | % | 8/15/23 | | 32,045 | | | 38,289 | |
| United States Treasury Note/Bond | 6.875 | % | 8/15/25 | | 1,625 | | | 2,063 | |
| United States Treasury Note/Bond | 6.750 | % | 8/15/26 | | 155 | | | 196 | |
| United States Treasury Note/Bond | 6.500 | % | 11/15/26 | | 25 | | | 31 | |
| United States Treasury Note/Bond | 6.625 | % | 2/15/27 | | 10,405 | | | 12,998 | |
| United States Treasury Note/Bond | 6.375 | % | 8/15/27 | | 2,000 | | | 2,443 | |
| United States Treasury Note/Bond | 5.500 | % | 8/15/28 | | 8,700 | | | 9,699 | |
| United States Treasury Note/Bond | 5.250 | % | 11/15/28 | | 275 | | | 298 | |
| United States Treasury Note/Bond | 5.250 | % | 2/15/29 | | 225 | | | 244 | |
| United States Treasury Note/Bond | 6.125 | % | 8/15/29 | | 4,685 | | | 5,627 | |
| United States Treasury Note/Bond | 6.250 | % | 5/15/30 | | 2,155 | | | 2,634 | |
| United States Treasury Note/Bond | 5.375 | % | 2/15/31 | | 160 | | | 177 | |
| United States Treasury Note/Bond | 4.500 | % | 2/15/36 | | 8,500 | | | 8,378 | |
| United States Treasury Note/Bond | 4.750 | % | 2/15/37 | | 23,175 | | | 23,700 | |
| United States Treasury Note/Bond | 5.000 | % | 5/15/37 | | 1,655 | | | 1,759 | |
| United States Treasury Note/Bond | 4.375 | % | 2/15/38 | | 7,850 | | | 7,542 | |
| United States Treasury Note/Bond | 4.250 | % | 5/15/39 | | 12,350 | | | 11,594 | |
| United States Treasury Note/Bond | 4.500 | % | 8/15/39 | | 9,320 | | | 9,117 | |
| | | | | | | | | 1,367,642 | |
| Agency Bonds and Notes (7.2%) | | | | | | | | | |
| 1 American Express Bank FSB | 3.150 | % | 12/9/11 | | 975 | | | 1,009 | |
| 1 Bank of America Corp. | 2.100 | % | 4/30/12 | | 3,050 | | | 3,085 | |
| 1 Bank of America Corp. | 3.125 | % | 6/15/12 | | 1,500 | | | 1,557 | |
| 1 Bank of America Corp. | 2.375 | % | 6/22/12 | | 225 | | | 229 | |
| 1 Bank of America NA | 1.700 | % | 12/23/10 | | 750 | | | 757 | |
| 1 Bank of the West | 2.150 | % | 3/27/12 | | 675 | | | 684 | |
| 1 Citibank NA | 1.625 | % | 3/30/11 | | 550 | | | 555 | |
| 1 Citibank NA | 1.500 | % | 7/12/11 | | 600 | | | 603 | |
| 1 Citibank NA | 1.375 | % | 8/10/11 | | 550 | | | 552 | |
| 1 Citibank NA | 1.250 | % | 9/22/11 | | 300 | | | 300 | |
| 1 Citibank NA | 1.875 | % | 5/7/12 | | 1,225 | | | 1,234 | |
| 1 Citibank NA | 1.750 | % | 12/28/12 | | 1,200 | | | 1,193 | |
| 1 Citigroup Funding Inc. | 1.375 | % | 5/5/11 | | 1,925 | | | 1,936 | |
| 1 Citigroup Funding Inc. | 2.000 | % | 3/30/12 | | 550 | | | 555 | |
| 1 Citigroup Funding Inc. | 2.125 | % | 7/12/12 | | 725 | | | 732 | |
| 1 Citigroup Funding Inc. | 1.875 | % | 10/22/12 | | 1,019 | | | 1,017 | |
| 1 Citigroup Funding Inc. | 2.250 | % | 12/10/12 | | 275 | | | 277 | |
| 1 Citigroup Inc. | 2.875 | % | 12/9/11 | | 1,150 | | | 1,183 | |
| 1 Citigroup Inc. | 2.125 | % | 4/30/12 | | 2,650 | | | 2,683 | |
| Egypt Government AID Bonds | 4.450 | % | 9/15/15 | | 350 | | | 365 | |
| 2 Federal Farm Credit Bank | 2.625 | % | 4/21/11 | | 850 | | | 870 | |
| 2 Federal Farm Credit Bank | 5.375 | % | 7/18/11 | | 1,125 | | | 1,198 | |
| 2 Federal Farm Credit Bank | 3.875 | % | 8/25/11 | | 825 | | | 862 | |
| 2 Federal Farm Credit Bank | 2.000 | % | 1/17/12 | | 1,325 | | | 1,342 | |
| 2 Federal Farm Credit Bank | 2.250 | % | 4/24/12 | | 375 | | | 381 | |
| 2 Federal Farm Credit Bank | 2.125 | % | 6/18/12 | | 850 | | | 861 | |
| 2 Federal Farm Credit Bank | 4.500 | % | 10/17/12 | | 1,325 | | | 1,419 | |
13
| | | | | | | | | | |
| Institutional Total Bond Market Index Fund | | | | | | | | | |
| |
| |
| |
| | | | | | | Face | | | Market | |
| | | | | Maturity | | Amount | | | Value• | |
| | | Coupon | | Date | ($ | 000 | ) | ($ | 000 | ) |
| 2 | Federal Farm Credit Bank | 1.875 | % | 12/7/12 | | 525 | | | 523 | |
| 2 | Federal Farm Credit Bank | 3.875 | % | 10/7/13 | | 575 | | | 605 | |
| 2 | Federal Farm Credit Bank | 2.625 | % | 4/17/14 | | 1,225 | | | 1,222 | |
| 2 | Federal Farm Credit Bank | 3.000 | % | 9/22/14 | | 650 | | | 655 | |
| 2 | Federal Farm Credit Bank | 4.875 | % | 12/16/15 | | 350 | | | 375 | |
| 2 | Federal Farm Credit Bank | 5.125 | % | 8/25/16 | | 975 | | | 1,056 | |
| 2 | Federal Farm Credit Bank | 4.875 | % | 1/17/17 | | 500 | | | 532 | |
| 2 | Federal Home Loan Bank of Chicago | 5.625 | % | 6/13/16 | | 150 | | | 151 | |
| 2 | Federal Home Loan Banks | 2.625 | % | 3/11/11 | | 4,375 | | | 4,467 | |
| 2 | Federal Home Loan Banks | 1.625 | % | 3/16/11 | | 1,050 | | | 1,061 | |
| 2 | Federal Home Loan Banks | 1.375 | % | 5/16/11 | | 875 | | | 881 | |
| 2 | Federal Home Loan Banks | 3.125 | % | 6/10/11 | | 1,200 | | | 1,235 | |
| 2 | Federal Home Loan Banks | 1.625 | % | 7/27/11 | | 575 | | | 581 | |
| 2 | Federal Home Loan Banks | 5.375 | % | 8/19/11 | | 9,900 | | | 10,591 | |
| 2 | Federal Home Loan Banks | 3.750 | % | 9/9/11 | | 300 | | | 313 | |
| 2 | Federal Home Loan Banks | 3.625 | % | 9/16/11 | | 600 | | | 626 | |
| 2 | Federal Home Loan Banks | 1.000 | % | 12/28/11 | | 200 | | | 199 | |
| 2 | Federal Home Loan Banks | 1.875 | % | 6/20/12 | | 825 | | | 832 | |
| 2 | Federal Home Loan Banks | 1.750 | % | 8/22/12 | | 700 | | | 701 | |
| 2 | Federal Home Loan Banks | 1.625 | % | 9/26/12 | | 2,500 | | | 2,490 | |
| 2,3 | Federal Home Loan Banks | 2.000 | % | 10/5/12 | | 1,240 | | | 1,238 | |
| 2,3 | Federal Home Loan Banks | 2.000 | % | 11/9/12 | | 475 | | | 473 | |
| 2 | Federal Home Loan Banks | 1.750 | % | 12/14/12 | | 1,000 | | | 993 | |
| 2 | Federal Home Loan Banks | 1.500 | % | 1/16/13 | | 1,150 | | | 1,135 | |
| 2 | Federal Home Loan Banks | 3.375 | % | 2/27/13 | | 325 | | | 339 | |
| 2 | Federal Home Loan Banks | 3.625 | % | 5/29/13 | | 150 | | | 157 | |
| 2 | Federal Home Loan Banks | 5.375 | % | 6/14/13 | | 425 | | | 469 | |
| 2 | Federal Home Loan Banks | 5.125 | % | 8/14/13 | | 1,625 | | | 1,788 | |
| 2 | Federal Home Loan Banks | 4.000 | % | 9/6/13 | | 900 | | | 955 | |
| 2 | Federal Home Loan Banks | 5.250 | % | 9/13/13 | | 2,075 | | | 2,283 | |
| 2 | Federal Home Loan Banks | 4.500 | % | 9/16/13 | | 1,500 | | | 1,617 | |
| 2 | Federal Home Loan Banks | 3.625 | % | 10/18/13 | | 1,275 | | | 1,336 | |
| 2 | Federal Home Loan Banks | 4.875 | % | 11/27/13 | | 925 | | | 1,012 | |
| 2 | Federal Home Loan Banks | 5.500 | % | 8/13/14 | | 2,925 | | | 3,278 | |
| 2 | Federal Home Loan Banks | 5.375 | % | 5/18/16 | | 5,950 | | | 6,591 | |
| 2 | Federal Home Loan Banks | 5.125 | % | 10/19/16 | | 300 | | | 326 | |
| 2 | Federal Home Loan Banks | 4.750 | % | 12/16/16 | | 950 | | | 1,016 | |
| 2 | Federal Home Loan Banks | 4.875 | % | 5/17/17 | | 300 | | | 322 | |
| 2 | Federal Home Loan Banks | 5.000 | % | 11/17/17 | | 575 | | | 620 | |
| 2 | Federal Home Loan Banks | 5.250 | % | 12/11/20 | | 1,175 | | | 1,255 | |
| 2 | Federal Home Loan Banks | 5.625 | % | 6/11/21 | | 75 | | | 82 | |
| 2 | Federal Home Loan Banks | 5.500 | % | 7/15/36 | | 1,325 | | | 1,360 | |
| 2 | Federal Home Loan Mortgage Corp. | 4.125 | % | 7/12/10 | | 900 | | | 918 | |
| 2 | Federal Home Loan Mortgage Corp. | 4.750 | % | 1/18/11 | | 1,475 | | | 1,534 | |
| 2 | Federal Home Loan Mortgage Corp. | 3.250 | % | 2/25/11 | | 1,075 | | | 1,106 | |
| 2 | Federal Home Loan Mortgage Corp. | 1.625 | % | 4/26/11 | | 1,425 | | | 1,440 | |
| 2 | Federal Home Loan Mortgage Corp. | 6.000 | % | 6/15/11 | | 4,970 | | | 5,334 | |
| 2 | Federal Home Loan Mortgage Corp. | 3.875 | % | 6/29/11 | | 160 | | | 167 | |
| 2 | Federal Home Loan Mortgage Corp. | 5.250 | % | 7/18/11 | | 5,700 | | | 6,070 | |
| 2 | Federal Home Loan Mortgage Corp. | 5.750 | % | 1/15/12 | | 5,700 | | | 6,211 | |
| 2 | Federal Home Loan Mortgage Corp. | 2.125 | % | 3/23/12 | | 1,775 | | | 1,804 | |
| 2 | Federal Home Loan Mortgage Corp. | 1.750 | % | 6/15/12 | | 1,725 | | | 1,736 | |
| 2 | Federal Home Loan Mortgage Corp. | 5.500 | % | 8/20/12 | | 2,200 | | | 2,415 | |
| 2 | Federal Home Loan Mortgage Corp. | 2.125 | % | 9/21/12 | | 575 | | | 581 | |
| 2 | Federal Home Loan Mortgage Corp. | 4.625 | % | 10/25/12 | | 1,525 | | | 1,642 | |
| 2 | Federal Home Loan Mortgage Corp. | 4.125 | % | 12/21/12 | | 1,075 | | | 1,142 | |
14
| | | | | | | | | |
| Institutional Total Bond Market Index Fund | | | | | | | | | |
| |
| |
| |
| | | | | | Face | | | Market | |
| | | | Maturity | | Amount | | | Value• | |
| | Coupon | | Date | ($ | 000 | ) | ($ | 000 | ) |
| 2 Federal Home Loan Mortgage Corp. | 4.500 | % | 1/15/13 | | 425 | | | 457 | |
| 2 Federal Home Loan Mortgage Corp. | 3.750 | % | 6/28/13 | | 3,900 | | | 4,110 | |
| 2 Federal Home Loan Mortgage Corp. | 4.500 | % | 7/15/13 | | 425 | | | 459 | |
| 2 Federal Home Loan Mortgage Corp. | 4.125 | % | 9/27/13 | | 400 | | | 426 | |
| 2 Federal Home Loan Mortgage Corp. | 4.875 | % | 11/15/13 | | 4,550 | | | 4,976 | |
| 2 Federal Home Loan Mortgage Corp. | 4.500 | % | 1/15/14 | | 1,275 | | | 1,374 | |
| 2 Federal Home Loan Mortgage Corp. | 2.500 | % | 4/23/14 | | 4,975 | | | 4,958 | |
| 2 Federal Home Loan Mortgage Corp. | 5.000 | % | 7/15/14 | | 2,975 | | | 3,266 | |
| 2 Federal Home Loan Mortgage Corp. | 3.000 | % | 7/28/14 | | 8,200 | | | 8,299 | |
| 2 Federal Home Loan Mortgage Corp. | 4.500 | % | 1/15/15 | | 2,700 | | | 2,901 | |
| 2 Federal Home Loan Mortgage Corp. | 5.050 | % | 1/26/15 | | 600 | | | 657 | |
| 2 Federal Home Loan Mortgage Corp. | 5.250 | % | 4/18/16 | | 550 | | | 607 | |
| 2 Federal Home Loan Mortgage Corp. | 5.500 | % | 7/18/16 | | 325 | | | 363 | |
| 2 Federal Home Loan Mortgage Corp. | 5.125 | % | 10/18/16 | | 875 | | | 957 | |
| 2 Federal Home Loan Mortgage Corp. | 5.000 | % | 2/16/17 | | 4,375 | | | 4,749 | |
| 2 Federal Home Loan Mortgage Corp. | 5.000 | % | 4/18/17 | | 2,200 | | | 2,386 | |
| 2 Federal Home Loan Mortgage Corp. | 5.500 | % | 8/23/17 | | 2,200 | | | 2,454 | |
| 2 Federal Home Loan Mortgage Corp. | 4.875 | % | 6/13/18 | | 1,350 | | | 1,445 | |
| 2 Federal Home Loan Mortgage Corp. | 3.750 | % | 3/27/19 | | 850 | | | 833 | |
| 2 Federal Home Loan Mortgage Corp. | 6.750 | % | 9/15/29 | | 425 | | | 511 | |
| 2 Federal Home Loan Mortgage Corp. | 6.750 | % | 3/15/31 | | 2,214 | | | 2,712 | |
| 2 Federal Home Loan Mortgage Corp. | 6.250 | % | 7/15/32 | | 52 | | | 61 | |
| 2 Federal National Mortgage Assn. | 6.250 | % | 2/1/11 | | 210 | | | 220 | |
| 2 Federal National Mortgage Assn. | 1.750 | % | 3/23/11 | | 1,225 | | | 1,238 | |
| 2 Federal National Mortgage Assn. | 2.750 | % | 4/11/11 | | 9,650 | | | 9,878 | |
| 2 Federal National Mortgage Assn. | 5.125 | % | 4/15/11 | | 1,425 | | | 1,502 | |
| 2 Federal National Mortgage Assn. | 1.375 | % | 4/28/11 | | 1,850 | | | 1,863 | |
| 2 Federal National Mortgage Assn. | 6.000 | % | 5/15/11 | | 2,200 | | | 2,352 | |
| 2 Federal National Mortgage Assn. | 5.000 | % | 10/15/11 | | 825 | | | 881 | |
| 2 Federal National Mortgage Assn. | 1.000 | % | 11/23/11 | | 325 | | | 324 | |
| 2 Federal National Mortgage Assn. | 2.000 | % | 1/9/12 | | 3,500 | | | 3,552 | |
| 2 Federal National Mortgage Assn. | 0.875 | % | 1/12/12 | | 1,500 | | | 1,490 | |
| 2 Federal National Mortgage Assn. | 1.875 | % | 4/20/12 | | 12,475 | | | 12,596 | |
| 2 Federal National Mortgage Assn. | 4.875 | % | 5/18/12 | | 8,320 | | | 8,973 | |
| 2 Federal National Mortgage Assn. | 5.250 | % | 8/1/12 | | 315 | | | 337 | |
| 2 Federal National Mortgage Assn. | 1.750 | % | 8/10/12 | | 1,100 | | | 1,102 | |
| 2 Federal National Mortgage Assn. | 4.375 | % | 9/15/12 | | 475 | | | 508 | |
| 2 Federal National Mortgage Assn. | 3.625 | % | 2/12/13 | | 1,075 | | | 1,128 | |
| 2 Federal National Mortgage Assn. | 4.750 | % | 2/21/13 | | 450 | | | 486 | |
| 2 Federal National Mortgage Assn. | 4.375 | % | 3/15/13 | | 625 | | | 671 | |
| 2 Federal National Mortgage Assn. | 4.625 | % | 5/1/13 | | 1,950 | | | 2,050 | |
| 2 Federal National Mortgage Assn. | 3.875 | % | 7/12/13 | | 4,700 | | | 4,969 | |
| 2 Federal National Mortgage Assn. | 4.625 | % | 10/15/13 | | 4,700 | | | 5,094 | |
| 2 Federal National Mortgage Assn. | 2.875 | % | 12/11/13 | | 1,850 | | | 1,887 | |
| 2 Federal National Mortgage Assn. | 5.125 | % | 1/2/14 | | 225 | | | 237 | |
| 2 Federal National Mortgage Assn. | 2.750 | % | 2/5/14 | | 1,150 | | | 1,160 | |
| 2 Federal National Mortgage Assn. | 2.750 | % | 3/13/14 | | 1,425 | | | 1,436 | |
| 2 Federal National Mortgage Assn. | 2.500 | % | 5/15/14 | | 3,000 | | | 2,987 | |
| 2 Federal National Mortgage Assn. | 3.000 | % | 9/16/14 | | 1,000 | | | 1,011 | |
| 2 Federal National Mortgage Assn. | 2.625 | % | 11/20/14 | | 875 | | | 866 | |
| 2 Federal National Mortgage Assn. | 5.000 | % | 4/15/15 | | 875 | | | 960 | |
| 2 Federal National Mortgage Assn. | 5.250 | % | 9/15/16 | | 2,975 | | | 3,277 | |
| 2 Federal National Mortgage Assn. | 4.875 | % | 12/15/16 | | 2,075 | | | 2,241 | |
| 2 Federal National Mortgage Assn. | 5.000 | % | 2/13/17 | | 6,450 | | | 6,997 | |
| 2 Federal National Mortgage Assn. | 5.375 | % | 6/12/17 | | 2,200 | | | 2,434 | |
| 2 Federal National Mortgage Assn. | 6.250 | % | 5/15/29 | | 50 | | | 58 | |
15
| | | | | | | | | | |
| Institutional Total Bond Market Index Fund | | | | | | | | | |
| |
| |
| |
| | | | | | | Face | | | Market | |
| | | | | Maturity | | Amount | | | Value• | |
| | | Coupon | | Date | ($ | 000 | ) | ($ | 000 | ) |
| 2 | Federal National Mortgage Assn. | 7.125 | % | 1/15/30 | | 925 | | | 1,170 | |
| 2 | Federal National Mortgage Assn. | 7.250 | % | 5/15/30 | | 3,825 | | | 4,902 | |
| 2 | Federal National Mortgage Assn. | 5.625 | % | 7/15/37 | | 350 | | | 369 | |
| 2 | Financing Corp. Fico | 9.800 | % | 4/6/18 | | 425 | | | 581 | |
| 2 | Financing Corp. Fico | 9.650 | % | 11/2/18 | | 525 | | | 735 | |
| 1 | General Electric Capital Corp. | 1.625 | % | 1/7/11 | | 1,325 | | | 1,337 | |
| 1 | General Electric Capital Corp. | 3.000 | % | 12/9/11 | | 2,525 | | | 2,604 | |
| 1 | General Electric Capital Corp. | 2.250 | % | 3/12/12 | | 2,700 | | | 2,745 | |
| 1 | General Electric Capital Corp. | 2.200 | % | 6/8/12 | | 1,950 | | | 1,976 | |
| 1 | General Electric Capital Corp. | 2.125 | % | 12/21/12 | | 825 | | | 829 | |
| 1 | General Electric Capital Corp. | 2.625 | % | 12/28/12 | | 775 | | | 790 | |
| 1 | Goldman Sachs Group Inc. | 1.700 | % | 3/15/11 | | 450 | | | 455 | |
| 1 | Goldman Sachs Group Inc. | 1.625 | % | 7/15/11 | | 650 | | | 656 | |
| 1 | Goldman Sachs Group Inc. | 2.150 | % | 3/15/12 | | 425 | | | 431 | |
| 1 | Goldman Sachs Group Inc. | 3.250 | % | 6/15/12 | | 1,425 | | | 1,482 | |
| 1 | HSBC USA Inc. | 3.125 | % | 12/16/11 | | 850 | | | 880 | |
| | Israel Government AID Bond | 5.500 | % | 9/18/23 | | 200 | | | 213 | |
| | Israel Government AID Bond | 5.500 | % | 12/4/23 | | 150 | | | 159 | |
| | Israel Government AID Bond | 5.500 | % | 4/26/24 | | 1,000 | | | 1,062 | |
| 1 | JPMorgan Chase & Co. | 1.650 | % | 2/23/11 | | 1,175 | | | 1,188 | |
| 1 | JPMorgan Chase & Co. | 3.125 | % | 12/1/11 | | 375 | | | 388 | |
| 1 | JPMorgan Chase & Co. | 2.200 | % | 6/15/12 | | 1,150 | | | 1,167 | |
| 1 | JPMorgan Chase & Co. | 2.125 | % | 6/22/12 | | 800 | | | 812 | |
| 1 | JPMorgan Chase & Co. | 2.125 | % | 12/26/12 | | 2,200 | | | 2,213 | |
| 1 | Morgan Stanley | 2.900 | % | 12/1/10 | | 675 | | | 689 | |
| 1 | Morgan Stanley | 3.250 | % | 12/1/11 | | 1,850 | | | 1,919 | |
| 1 | Morgan Stanley | 1.950 | % | 6/20/12 | | 1,550 | | | 1,564 | |
| 1 | PNC Funding Corp. | 2.300 | % | 6/22/12 | | 1,025 | | | 1,042 | |
| | Private Export Funding Corp. | 3.050 | % | 10/15/14 | | 600 | | | 596 | |
| | Private Export Funding Corp. | 4.375 | % | 3/15/19 | | 375 | | | 370 | |
| | Private Export Funding Corp. | 4.300 | % | 12/15/21 | | 150 | | | 141 | |
| 1 | Regions Bank | 3.250 | % | 12/9/11 | | 1,150 | | | 1,192 | |
| 1 | Sovereign Bank | 2.750 | % | 1/17/12 | | 375 | | | 385 | |
| 2 | Tennessee Valley Authority | 5.625 | % | 1/18/11 | | 1,750 | | | 1,840 | |
| 2 | Tennessee Valley Authority | 5.500 | % | 7/18/17 | | 1,625 | | | 1,786 | |
| 2 | Tennessee Valley Authority | 4.500 | % | 4/1/18 | | 375 | | | 385 | |
| 2 | Tennessee Valley Authority | 6.750 | % | 11/1/25 | | 100 | | | 115 | |
| 2 | Tennessee Valley Authority | 7.125 | % | 5/1/30 | | 1,475 | | | 1,810 | |
| 2 | Tennessee Valley Authority | 4.650 | % | 6/15/35 | | 375 | | | 332 | |
| 2 | Tennessee Valley Authority | 5.500 | % | 6/15/38 | | 150 | | | 149 | |
| 2 | Tennessee Valley Authority | 5.250 | % | 9/15/39 | | 300 | | | 295 | |
| 2 | Tennessee Valley Authority | 4.875 | % | 1/15/48 | | 125 | | | 112 | |
| 2 | Tennessee Valley Authority | 5.375 | % | 4/1/56 | | 675 | | | 666 | |
| 1 | US Central Federal Credit Union | 1.900 | % | 10/19/12 | | 525 | | | 525 | |
| 1 | Wells Fargo & Co. | 3.000 | % | 12/9/11 | | 1,750 | | | 1,804 | |
| 1 | Wells Fargo & Co. | 2.125 | % | 6/15/12 | | 775 | | | 786 | |
| 1 | Western Corporate Federal Credit Union | 1.750 | % | 11/2/12 | | 250 | | | 249 | |
| | | | | | | | | | 300,902 | |
| Conventional Mortgage-Backed Securities (31.1%) | | | | | | | | | |
| 2,3 | Fannie Mae Pool | 4.000 | % | 9/1/10–1/1/40 | | 35,901 | | | 35,762 | |
| 2,3 | Fannie Mae Pool | 4.500 | % | 6/1/10–1/1/40 | | 83,701 | | | 85,467 | |
| 2,3 | Fannie Mae Pool | 5.000 | % | 4/1/10–1/1/40 | | 149,671 | | | 154,984 | |
| 2,3 | Fannie Mae Pool | 5.500 | % | 11/1/16–1/1/40 | | 173,513 | | | 182,566 | |
| 2,3 | Fannie Mae Pool | 6.000 | % | 11/1/13–1/1/40 | | 131,528 | | | 140,074 | |
| 2,3 | Fannie Mae Pool | 6.500 | % | 1/1/12–1/1/39 | | 36,735 | | | 39,472 | |
| 2,3 | Fannie Mae Pool | 7.000 | % | 7/1/14–11/1/38 | | 12,066 | | | 13,248 | |
16
| | | | | | | | | | |
| Institutional Total Bond Market Index Fu nd | | | | | | | | | |
| |
| |
| |
| | | | | | | Face | | | Market | |
| | | | | Maturity | | Amount | | | Value• | |
| | | Coupon | | Date | ($ | 000 | ) | ($ | 000 | ) |
| 2,3 | Fannie Mae Pool | 7.500 | % | 11/1/11–4/1/32 | | 687 | | | 759 | |
| 2,3 | Fannie Mae Pool | 8.000 | % | 12/1/29–6/1/31 | | 116 | | | 127 | |
| 2,3 | Fannie Mae Pool | 8.500 | % | 4/1/30–4/1/31 | | 46 | | | 52 | |
| 2,3 | Fannie Mae Pool | 9.000 | % | 8/1/30 | | 2 | | | 3 | |
| 2,3 | Fannie Mae Pool | 9.500 | % | 11/1/25 | | 5 | | | 5 | |
| 2,3 | Freddie Mac Gold Pool | 4.000 | % | 7/1/10–1/1/40 | | 21,775 | | | 21,776 | |
| 2,3 | Freddie Mac Gold Pool | 4.500 | % | 7/1/10–1/1/40 | | 61,606 | | | 62,885 | |
| 2,3 | Freddie Mac Gold Pool | 5.000 | % | 10/1/11–1/1/40 | | 105,128 | | | 108,687 | |
| 2,3 | Freddie Mac Gold Pool | 5.500 | % | 12/1/13–1/1/40 | | 117,350 | | | 123,410 | |
| 2,3 | Freddie Mac Gold Pool | 6.000 | % | 4/1/13–1/1/40 | | 71,372 | | | 76,042 | |
| 2,3 | Freddie Mac Gold Pool | 6.500 | % | 1/1/13–2/1/39 | | 24,257 | | | 26,162 | |
| 2,3 | Freddie Mac Gold Pool | 7.000 | % | 2/1/11–2/1/37 | | 5,175 | | | 5,644 | |
| 2,3 | Freddie Mac Gold Pool | 7.500 | % | 10/1/12–2/1/32 | | 225 | | | 246 | |
| 2,3 | Freddie Mac Gold Pool | 8.000 | % | 6/1/12–11/1/31 | | 199 | | | 218 | |
| 2,3 | Freddie Mac Gold Pool | 8.500 | % | 6/1/25–5/1/30 | | 127 | | | 140 | |
| 2,3 | Freddie Mac Gold Pool | 9.000 | % | 2/1/25–9/1/30 | | 7 | | | 8 | |
| 3 | Ginnie Mae I Pool | 4.000 | % | 9/15/18–8/15/39 | | 4,124 | | | 3,992 | |
| 3 | Ginnie Mae I Pool | 4.500 | % | 8/15/18 –1/1/40 | | 36,910 | | | 36,961 | |
| 3 | Ginnie Mae I Pool | 5.000 | % | 1/15/18 –1/1/40 | | 35,912 | | | 37,030 | |
| 3 | Ginnie Mae I Pool | 5.500 | % | 2/15/17–1/1/40 | | 45,927 | | | 48,238 | |
| 3 | Ginnie Mae I Pool | 6.000 | % | 5/15/14–11/15/38 | | 16,106 | | | 17,101 | |
| 3 | Ginnie Mae I Pool | 6.500 | % | 5/15/13–12/15/38 | | 7,614 | | | 8,168 | |
| 3 | Ginnie Mae I Pool | 7.000 | % | 10/15/10–9/15/36 | | 1,998 | | | 2,195 | |
| 3 | Ginnie Mae I Pool | 7.500 | % | 5/15/23–10/15/31 | | 301 | | | 332 | |
| 3 | Ginnie Mae I Pool | 8.000 | % | 7/15/25 –11/15/30 | | 297 | | | 328 | |
| 3 | Ginnie Mae I Pool | 8.500 | % | 12/15/24–7/15/30 | | 18 | | | 20 | |
| 3 | Ginnie Mae I Pool | 9.000 | % | 5/15/25–8/15/30 | | 10 | | | 11 | |
| 3 | Ginnie Mae I Pool | 9.500 | % | 11/15/17 | | 7 | | | 7 | |
| 3 | Ginnie Mae II Pool | 4.500 | % | 11/20/35–12/20/39 | | 3,108 | | | 3,115 | |
| 3 | Ginnie Mae II Pool | 5.000 | % | 12/20/32–1/1/40 | | 13,378 | | | 13,770 | |
| 3 | Ginnie Mae II Pool | 5.500 | % | 12/20/34–11/20/38 | | 13,985 | | | 14,684 | |
| 3 | Ginnie Mae II Pool | 6.000 | % | 3/20/31–1/20/39 | | 18,394 | | | 19,479 | |
| 3 | Ginnie Mae II Pool | 6.500 | % | 6/20/35–11/20/37 | | 5,683 | | | 6,064 | |
| 3 | Ginnie Mae II Pool | 7.000 | % | 8/20/36–4/20/38 | | 160 | | | 176 | |
| | | | | | | | | | 1,289,408 | |
| Nonconventional Mortgage-Backed Securities (1.6%) | | | | | | | | | |
| 2,3 | Fannie Mae Pool | 2.701 | % | 12/1/34 | | 532 | | | 540 | |
| 2,3 | Fannie Mae Pool | 2.799 | % | 10/1/34 | | 725 | | | 742 | |
| 2,3 | Fannie Mae Pool | 2.808 | % | 11/1/34 | | 228 | | | 231 | |
| 2,3 | Fannie Mae Pool | 3.126 | % | 9/1/34 | | 204 | | | 209 | |
| 2,3 | Fannie Mae Pool | 3.973 | % | 7/1/35 | | 1,460 | | | 1,504 | |
| 2,3 | Fannie Mae Pool | 4.132 | % | 5/1/34 | | 465 | | | 482 | |
| 2,3 | Fannie Mae Pool | 4.413 | % | 8/1/35 | | 1,119 | | | 1,156 | |
| 2,3 | Fannie Mae Pool | 4.421 | % | 7/1/35 | | 194 | | | 201 | |
| 2,3 | Fannie Mae Pool | 4.485 | % | 4/1/37 | | 493 | | | 513 | |
| 2,3 | Fannie Mae Pool | 4.498 | % | 1/1/35 | | 367 | | | 375 | |
| 2,3 | Fannie Mae Pool | 4.505 | % | 10/1/36 | | 1,060 | | | 1,097 | |
| 2,3 | Fannie Mae Pool | 4.508 | % | 4/1/36 | | 992 | | | 1,024 | |
| 2,3 | Fannie Mae Pool | 4.549 | % | 11/1/34 | | 1,415 | | | 1,473 | |
| 2,3 | Fannie Mae Pool | 4.605 | % | 12/1/35 | | 500 | | | 521 | |
| 2,3 | Fannie Mae Pool | 4.610 | % | 8/1/35 | | 570 | | | 593 | |
| 2,3 | Fannie Mae Pool | 4.613 | % | 11/1/33 | | 182 | | | 189 | |
| 2,3 | Fannie Mae Pool | 4.629 | % | 9/1/34 | | 304 | | | 316 | |
| 2,3 | Fannie Mae Pool | 4.721 | % | 8/1/35 | | 350 | | | 366 | |
| 2,3 | Fannie Mae Pool | 4.766 | % | 5/1/35 | | 852 | | | 883 | |
17
| | | | | | | | | | |
| Institutional Total Bond Market Index Fu nd | | | | | | | | | |
| |
| |
| |
| | | | | | | Face | | | Market | |
| | | | | Maturity | | Amount | | | Value• | |
| | | Coupon | | Date | ($ | 000 | ) | ($ | 000 | ) |
| 2,3 | Fannie Mae Pool | 4.784 | % | 6/1/34 | | 515 | | | 536 | |
| 2,3 | Fannie Mae Pool | 4.852 | % | 9/1/35 | | 705 | | | 738 | |
| 2,3 | Fannie Mae Pool | 4.866 | % | 7/1/35 | | 793 | | | 819 | |
| 2,3 | Fannie Mae Pool | 4.959 | % | 7/1/35 | | 373 | | | 388 | |
| 2,3 | Fannie Mae Pool | 4.966 | % | 10/1/35 | | 1,060 | | | 1,107 | |
| 2,3 | Fannie Mae Pool | 4.992 | % | 11/1/33 | | 171 | | | 180 | |
| 2,3 | Fannie Mae Pool | 5.015 | % | 12/1/33 | | 240 | | | 252 | |
| 2,3 | Fannie Mae Pool | 5.035 | % | 2/1/36 | | 182 | | | 189 | |
| 2,3 | Fannie Mae Pool | 5.039 | % | 11/1/35 | | 1,354 | | | 1,409 | |
| 2,3 | Fannie Mae Pool | 5.062 | % | 8/1/37 | | 2,234 | | | 2,338 | |
| 2,3 | Fannie Mae Pool | 5.075 | % | 12/1/35 | | 975 | | | 1,023 | |
| 2,3 | Fannie Mae Pool | 5.109 | % | 1/1/36 | | 554 | | | 579 | |
| 2,3 | Fannie Mae Pool | 5.128 | % | 12/1/35 | | 985 | | | 1,031 | |
| 2,3 | Fannie Mae Pool | 5.186 | % | 3/1/37 | | 686 | | | 718 | |
| 2,3 | Fannie Mae Pool | 5.204 | % | 8/1/38 | | 45 | | | 47 | |
| 2,3 | Fannie Mae Pool | 5.301 | % | 7/1/38 | | 125 | | | 130 | |
| 2,3 | Fannie Mae Pool | 5.347 | % | 12/1/35 | | 714 | | | 746 | |
| 2,3 | Fannie Mae Pool | 5.450 | % | 2/1/36 | | 864 | | | 903 | |
| 2,3 | Fannie Mae Pool | 5.495 | % | 5/1/37 | | 528 | | | 543 | |
| 2,3 | Fannie Mae Pool | 5.547 | % | 1/1/37 | | 776 | | | 817 | |
| 2,3 | Fannie Mae Pool | 5.617 | % | 7/1/36 | | 367 | | | 383 | |
| 2,3 | Fannie Mae Pool | 5.645 | % | 3/1/37 | | 641 | | | 675 | |
| 2,3 | Fannie Mae Pool | 5.665 | % | 6/1/36 | | 248 | | | 262 | |
| 2,3 | Fannie Mae Pool | 5.675 | % | 3/1/37 | | 1,059 | | | 1,117 | |
| 2,3 | Fannie Mae Pool | 5.676 | % | 2/1/37 | | 446 | | | 468 | |
| 2,3 | Fannie Mae Pool | 5.729 | % | 3/1/37 | | 3,112 | | | 3,287 | |
| 2,3 | Fannie Mae Pool | 5.756 | % | 1/1/36 | | 435 | | | 461 | |
| 2,3 | Fannie Mae Pool | 5.756 | % | 4/1/37 | | 3,655 | | | 3,836 | |
| 2,3 | Fannie Mae Pool | 5.764 | % | 4/1/36 | | 843 | | | 890 | |
| 2,3 | Fannie Mae Pool | 5.793 | % | 4/1/37 | | 1,063 | | | 1,121 | |
| 2,3 | Fannie Mae Pool | 5.838 | % | 9/1/36 | | 328 | | | 344 | |
| 2,3 | Fannie Mae Pool | 5.893 | % | 11/1/36 | | 546 | | | 578 | |
| 2,3 | Fannie Mae Pool | 6.045 | % | 6/1/36 | | 74 | | | 78 | |
| 2,3 | Fannie Mae Pool | 6.062 | % | 8/1/37 | | 360 | | | 376 | |
| 2,3 | Fannie Mae Pool | 6.499 | % | 9/1/37 | | 492 | | | 522 | |
| 2,3 | Freddie Mac Non Gold Pool | 2.691 | % | 12/1/34 | | 337 | | | 342 | |
| 2,3 | Freddie Mac Non Gold Pool | 3.072 | % | 9/1/34 | | 201 | | | 207 | |
| 2,3 | Freddie Mac Non Gold Pool | 3.160 | % | 12/1/34 | | 393 | | | 406 | |
| 2,3 | Freddie Mac Non Gold Pool | 3.448 | % | 12/1/36 | | 237 | | | 244 | |
| 2,3 | Freddie Mac Non Gold Pool | 4.358 | % | 1/1/35 | | 33 | | | 34 | |
| 2,3 | Freddie Mac Non Gold Pool | 4.590 | % | 4/1/35 | | 763 | | | 784 | |
| 2,3 | Freddie Mac Non Gold Pool | 4.594 | % | 11/1/34 | | 659 | | | 685 | |
| 2,3 | Freddie Mac Non Gold Pool | 4.660 | % | 7/1/35 | | 296 | | | 306 | |
| 2,3 | Freddie Mac Non Gold Pool | 4.688 | % | 12/1/35 | | 838 | | | 875 | |
| 2,3 | Freddie Mac Non Gold Pool | 4.693 | % | 6/1/37 | | 941 | | | 974 | |
| 2,3 | Freddie Mac Non Gold Pool | 4.738 | % | 3/1/36 | | 362 | | | 374 | |
| 2,3 | Freddie Mac Non Gold Pool | 4.766 | % | 1/1/37 | | 442 | | | 461 | |
| 2,3 | Freddie Mac Non Gold Pool | 4.789 | % | 7/1/35 | | 1,271 | | | 1,316 | |
| 2,3 | Freddie Mac Non Gold Pool | 5.024 | % | 5/1/35 | | 415 | | | 432 | |
| 2,3 | Freddie Mac Non Gold Pool | 5.260 | % | 3/1/37 | | 373 | | | 382 | |
| 2,3 | Freddie Mac Non Gold Pool | 5.287 | % | 3/1/36 | | 849 | | | 888 | |
| 2,3 | Freddie Mac Non Gold Pool | 5.329 | % | 12/1/35 | | 833 | | | 873 | |
| 2,3 | Freddie Mac Non Gold Pool | 5.428 | % | 3/1/37 | | 468 | | | 491 | |
| 2,3 | Freddie Mac Non Gold Pool | 5.435 | % | 4/1/37 | | 1,095 | | | 1,151 | |
| 2,3 | Freddie Mac Non Gold Pool | 5.502 | % | 2/1/36 | | 344 | | | 359 | |
| 2,3 | Freddie Mac Non Gold Pool | 5.568 | % | 5/1/36 | | 1,069 | | | 1,117 | |
18
| | | | | | | | | | | |
| | Institutional Total Bond Market Index Fu nd | | | | | | | | | |
| |
| |
| |
| | | | | | | | Face | | | Market | |
| | | | | | Maturity | | Amount | | | Value• | |
| | | | Coupon | | Date | ($ | 000 | ) | ($ | 000 | ) |
| | 2,3 | Freddie Mac Non Gold Pool | 5.582 | % | 4/1/37 | | 853 | | | 894 | |
| | 2,3 | Freddie Mac Non Gold Pool | 5.656 | % | 12/1/36 | | 790 | | | 832 | |
| | 2,3 | Freddie Mac Non Gold Pool | 5.711 | % | 11/1/36 | | 330 | | | 346 | |
| | 2,3 | Freddie Mac Non Gold Pool | 5.714 | % | 9/1/36 | | 1,710 | | | 1,804 | |
| | 2,3 | Freddie Mac Non Gold Pool | 5.749 | % | 4/1/37 | | 1,632 | | | 1,701 | |
| | 2,3 | Freddie Mac Non Gold Pool | 5.770 | % | 5/1/36 | | 433 | | | 454 | |
| | 2,3 | Freddie Mac Non Gold Pool | 5.772 | % | 3/1/37 | | 366 | | | 387 | |
| | 2,3 | Freddie Mac Non Gold Pool | 5.796 | % | 6/1/37 | | 596 | | | 630 | |
| | 2,3 | Freddie Mac Non Gold Pool | 5.797 | % | 3/1/37 | | 259 | | | 272 | |
| | 2,3 | Freddie Mac Non Gold Pool | 5.878 | % | 12/1/36 | | 733 | | | 776 | |
| | 2,3 | Freddie Mac Non Gold Pool | 5.892 | % | 5/1/37 | | 1,395 | | | 1,472 | |
| | 2,3 | Freddie Mac Non Gold Pool | 5.973 | % | 10/1/37 | | 394 | | | 418 | |
| | 2,3 | Freddie Mac Non Gold Pool | 6.064 | % | 8/1/37 | | 524 | | | 554 | |
| | 2,3 | Freddie Mac Non Gold Pool | 6.105 | % | 8/1/37 | | 291 | | | 308 | |
| | 2,3 | Freddie Mac Non Gold Pool | 6.480 | % | 2/1/37 | | 1,036 | | | 1,106 | |
| | | | | | | | | | | 65,961 | |
| | Total U.S. Government and Agency Obligations (Cost $2,976,637) | | | | | | | 3,023,913 | |
| Asset-Backed/Commercial Mortgage-Backed Securities (3.5%) | | | | | | | | |
| | 3 | Banc of America Commercial Mortgage Inc. | 6.503 | % | 4/15/36 | | 1,236 | | | 1,278 | |
| | 3 | Banc of America Commercial Mortgage Inc. | 4.050 | % | 11/10/38 | | 214 | | | 213 | |
| | 3 | Banc of America Commercial Mortgage Inc. | 4.153 | % | 11/10/38 | | 300 | | | 294 | |
| | 3 | Banc of America Commercial Mortgage Inc. | 4.877 | % | 7/10/42 | | 1,045 | | | 996 | |
| | 3 | Banc of America Commercial Mortgage Inc. | 4.727 | % | 7/10/43 | | 500 | | | 417 | |
| | 3 | Banc of America Commercial Mortgage Inc. | 5.372 | % | 9/10/45 | | 1,585 | | | 1,497 | |
| | 3,4 | Banc of America Commercial Mortgage Inc. | 5.421 | % | 9/10/45 | | 25 | | | 19 | |
| | 3 | Banc of America Commercial Mortgage Inc. | 5.115 | % | 10/10/45 | | 875 | | | 844 | |
| | 3,4 | Banc of America Commercial Mortgage Inc. | 5.120 | % | 10/10/45 | | 875 | | | 856 | |
| | 3,4 | Banc of America Commercial Mortgage Inc. | 5.176 | % | 10/10/45 | | 40 | | | 33 | |
| | 3 | Banc of America Commercial Mortgage Inc. | 5.634 | % | 7/10/46 | | 1,275 | | | 1,186 | |
| | 3 | Banc of America Commercial Mortgage Inc. | 5.675 | % | 7/10/46 | | 250 | | | 197 | |
| | 3,4 | Banc of America Commercial Mortgage Inc. | 5.179 | % | 9/10/47 | | 100 | | | 88 | |
| | 3 | Banc of America Commercial Mortgage Inc. | 5.414 | % | 9/10/47 | | 800 | | | 745 | |
| | 3 | Banc of America Commercial Mortgage Inc. | 5.448 | % | 9/10/47 | | 125 | | | 100 | |
| | 3,4 | Banc of America Commercial Mortgage Inc. | 6.166 | % | 2/10/51 | | 1,525 | | | 1,366 | |
| | 3 | Bear Stearns Commercial Mortgage Securities | 5.610 | % | 11/15/33 | | 1,180 | | | 1,220 | |
| | 3 | Bear Stearns Commercial Mortgage Securities | 5.462 | % | 4/12/38 | | 677 | | | 673 | |
| | 3,4 | Bear Stearns Commercial Mortgage Securities | 5.463 | % | 4/12/38 | | 250 | | | 191 | |
| | 3 | Bear Stearns Commercial Mortgage Securities | 4.830 | % | 8/15/38 | | 125 | | | 128 | |
| | 3,4 | Bear Stearns Commercial Mortgage Securities | 5.758 | % | 9/11/38 | | 300 | | | 240 | |
| | 3 | Bear Stearns Commercial Mortgage Securities | 5.455 | % | 3/11/39 | | 1,685 | | | 1,638 | |
| | 3 | Bear Stearns Commercial Mortgage Securities | 4.680 | % | 8/13/39 | | 705 | | | 701 | |
| | 3 | Bear Stearns Commercial Mortgage Securities | 4.740 | % | 3/13/40 | | 205 | | | 211 | |
| | 3 | Bear Stearns Commercial Mortgage Securities | 5.666 | % | 6/11/40 | | 2,300 | | | 2,319 | |
| | 3 | Bear Stearns Commercial Mortgage Securities | 5.582 | % | 9/11/41 | | 170 | | | 136 | |
| | 3 | Bear Stearns Commercial Mortgage Securities | 4.521 | % | 11/11/41 | | 275 | | | 276 | |
| | 3 | Bear Stearns Commercial Mortgage Securities | 5.742 | % | 9/11/42 | | 1,250 | | | 1,185 | |
| | 3 | Bear Stearns Commercial Mortgage Securities | 5.793 | % | 9/11/42 | | 350 | | | 333 | |
| | 3 | Bear Stearns Commercial Mortgage Securities | 5.127 | % | 10/12/42 | | 575 | | | 575 | |
| | 3 | Bear Stearns Commercial Mortgage Securities | 5.149 | % | 10/12/42 | | 615 | | | 610 | |
| | 3,4 | Bear Stearns Commercial Mortgage Securities | 5.513 | % | 1/12/45 | | 220 | | | 178 | |
| | 3 | Bear Stearns Commercial Mortgage Securities | 5.613 | % | 6/11/50 | | 700 | | | 698 | |
| | 3 | Bear Stearns Commercial Mortgage Securities | 5.694 | % | 6/11/50 | | 2,725 | | | 2,313 | |
| | 3 | Bear Stearns Commercial Mortgage Securities | 5.700 | % | 6/11/50 | | 500 | | | 427 | |
| | 3,4 | Bear Stearns Commercial Mortgage Securities | 5.915 | % | 6/11/50 | | 450 | | | 329 | |
| | 3 | Capital Auto Receivables Asset Trust | 4.680 | % | 10/15/12 | | 1,150 | | | 1,188 | |
19
| | | | | | | | | | |
| Institutional Total Bond Market Index Fu nd | | | | | | | | | |
| |
| |
| |
| | | | | | | Face | | | Market | |
| | | | | Maturity | | Amount | | | Value• | |
| | | Coupon | | Date | ($ | 000 | ) | ($ | 000 | ) |
| 3 | Capital One Multi-Asset Execution Trust | 5.300 | % | 2/18/14 | | 425 | | | 444 | |
| 3 | Capital One Multi-Asset Execution Trust | 5.050 | % | 12/17/18 | | 2,695 | | | 2,797 | |
| 3 | Capital One Multi-Asset Execution Trust | 5.750 | % | 7/15/20 | | 200 | | | 217 | |
| 3 | CDC Commercial Mortgage Trust | 5.676 | % | 11/15/30 | | 600 | | | 618 | |
| 3 | Chase Issuance Trust | 4.650 | % | 12/17/12 | | 575 | | | 591 | |
| 3 | Chase Issuance Trust | 4.650 | % | 3/15/15 | | 2,300 | | | 2,443 | |
| 3 | Chase Issuance Trust | 5.400 | % | 7/15/15 | | 425 | | | 462 | |
| 3 | Citibank Credit Card Issuance Trust | 5.450 | % | 5/10/13 | | 435 | | | 458 | |
| 3 | Citibank Credit Card Issuance Trust | 4.900 | % | 6/23/16 | | 850 | | | 916 | |
| 3 | Citibank Credit Card Issuance Trust | 4.150 | % | 7/7/17 | | 225 | | | 227 | |
| 3 | Citibank Credit Card Issuance Trust | 5.650 | % | 9/20/19 | | 175 | | | 189 | |
| 3 | Citigroup Commercial Mortgage Trust | 4.623 | % | 10/15/41 | | 225 | | | 225 | |
| 3 | Citigroup Commercial Mortgage Trust | 4.830 | % | 5/15/43 | | 45 | | | 39 | |
| 3,4 | Citigroup Commercial Mortgage Trust | 5.725 | % | 3/15/49 | | 950 | | | 903 | |
| 3,4 | Citigroup Commercial Mortgage Trust | 5.700 | % | 12/10/49 | | 525 | | | 452 | |
| 3,4 | Citigroup Commercial Mortgage Trust | 5.700 | % | 12/10/49 | | 300 | | | 202 | |
| 3,4 | Citigroup Commercial Mortgage Trust | 6.092 | % | 12/10/49 | | 100 | | | 76 | |
| 3 | Citigroup/Deutsche Bank | | | | | | | | | |
| | Commercial Mortgage Trust | 5.224 | % | 7/15/44 | | 2,165 | | | 2,157 | |
| 3,4 | Citigroup/Deutsche Bank | | | | | | | | | |
| | Commercial Mortgage Trust | 5.224 | % | 7/15/44 | | 500 | | | 433 | |
| 3 | Citigroup/Deutsche Bank | | | | | | | | | |
| | Commercial Mortgage Trust | 5.886 | % | 11/15/44 | | 1,290 | | | 1,138 | |
| 3 | Citigroup/Deutsche Bank | | | | | | | | | |
| | Commercial Mortgage Trust | 5.648 | % | 10/15/48 | | 500 | | | 383 | |
| 3 | Citigroup/Deutsche Bank | | | | | | | | | |
| | Commercial Mortgage Trust | 5.205 | % | 12/11/49 | | 1,450 | | | 1,454 | |
| 3 | Citigroup/Deutsche Bank | | | | | | | | | |
| | Commercial Mortgage Trust | 5.322 | % | 12/11/49 | | 1,025 | | | 878 | |
| 3,5 | Commercial Mortgage Lease-Backed Certificates | 6.746 | % | 6/20/31 | | 293 | | | 307 | |
| 3 | Commercial Mortgage Pass Through Certificates | 5.116 | % | 6/10/44 | | 1,151 | | | 1,092 | |
| 3 | Commercial Mortgage Pass Through Certificates | 5.767 | % | 6/10/46 | | 1,690 | | | 1,664 | |
| 3 | Commercial Mortgage Pass Through Certificates | 5.248 | % | 12/10/46 | | 175 | | | 176 | |
| 3,4 | Commercial Mortgage Pass Through Certificates | 5.816 | % | 12/10/49 | | 1,225 | | | 1,112 | |
| 3,4 | Countrywide Home Loan | | | | | | | | | |
| | Mortgage Pass Through Trust | 4.065 | % | 5/25/33 | | 76 | | | 65 | |
| 3,4 | Credit Suisse First Boston | | | | | | | | | |
| | Mortgage Securities Corp. | 4.750 | % | 1/15/37 | | 525 | | | 509 | |
| 3 | Credit Suisse First Boston | | | | | | | | | |
| | Mortgage Securities Corp. | 4.877 | % | 4/15/37 | | 50 | | | 37 | |
| 3 | Credit Suisse First Boston | | | | | | | | | |
| | Mortgage Securities Corp. | 3.936 | % | 5/15/38 | | 800 | | | 789 | |
| 3,4 | Credit Suisse First Boston | | | | | | | | | |
| Mortgage Securities Corp. | 5.100 | % | 8/15/38 | | 65 | | | 55 | |
| | | | | | |
| 3 | Credit Suisse First Boston | | | | | |
| | Mortgage Securities Corp. | 5.100 | % | 8/15/38 | 2,025 | 1,950 |
| 3 | Credit Suisse Mortgage Capital Certificates | 5.825 | % | 6/15/38 | 1,325 | 1,143 |
| 3 | Credit Suisse Mortgage Capital Certificates | 5.825 | % | 6/15/38 | 64 | 50 |
| 3 | Credit Suisse Mortgage Capital Certificates | 5.548 | % | 2/15/39 | 2,425 | 2,360 |
| 3,4 | Credit Suisse Mortgage Capital Certificates | 5.548 | % | 2/15/39 | 375 | 306 |
| 3,4 | Credit Suisse Mortgage Capital Certificates | 5.723 | % | 6/15/39 | 2,050 | 1,643 |
| 3 | Credit Suisse Mortgage Capital Certificates | 5.509 | % | 9/15/39 | 100 | 55 |
| 3 | Credit Suisse Mortgage Capital Certificates | 5.311 | % | 12/15/39 | 425 | 350 |
| 3 | Credit Suisse Mortgage Capital Certificates | 5.343 | % | 12/15/39 | 60 | 42 |
| 3 | Credit Suisse Mortgage Capital Certificates | 5.383 | % | 2/15/40 | 425 | 351 |
| 3,4 | CW Capital Cobalt Ltd. | 5.820 | % | 5/15/46 | 1,475 | 1,162 |
20
| | | | | | | | | | |
| Institutional Total Bond Market Index Fu nd | | | | | | | | | |
| |
| |
| |
| | | | | | | Face | | | Market | |
| | | | | Maturity | | Amount | | | Value• | |
| | | Coupon | | Date | ($ | 000 | ) | ($ | 000 | ) |
| 3 | Daimler Chrysler Auto Trust | 3.700 | % | 6/8/12 | | 871 | | | 882 | |
| 3 | Discover Card Master Trust | 5.650 | % | 12/15/15 | | 1,525 | | | 1,652 | |
| 3 | Discover Card Master Trust | 5.650 | % | 3/16/20 | | 425 | | | 453 | |
| 3,4 | First Union Commercial Mortgage Trust | 6.638 | % | 10/15/35 | | 369 | | | 372 | |
| 3 | Ford Credit Auto Owner Trust | 4.370 | % | 10/15/12 | | 1,075 | | | 1,114 | |
| 3 | Ford Credit Auto Owner Trust | 2.420 | % | 11/15/14 | | 250 | | | 246 | |
| 3 | GE Capital Commercial Mortgage Corp. | 5.994 | % | 12/10/35 | | 35 | | | 35 | |
| 3,4 | GE Capital Commercial Mortgage Corp. | 5.336 | % | 3/10/44 | | 1,625 | | | 1,539 | |
| 3,4 | GE Capital Commercial Mortgage Corp. | 5.334 | % | 11/10/45 | | 320 | | | 264 | |
| 3 | GMAC Commercial Mortgage Securities Inc. | 7.455 | % | 8/16/33 | | 147 | | | 150 | |
| 3 | GMAC Commercial Mortgage Securities Inc. | 4.908 | % | 3/10/38 | | 100 | | | 98 | |
| 3 | GMAC Commercial Mortgage Securities Inc. | 4.646 | % | 4/10/40 | | 245 | | | 249 | |
| 3 | GMAC Commercial Mortgage Securities Inc. | 4.864 | % | 12/10/41 | | 450 | | | 441 | |
| 3 | GMAC Commercial Mortgage Securities Inc. | 4.754 | % | 5/10/43 | | 100 | | | 87 | |
| 3 | Greenwich Capital Commercial Funding Corp. | 4.948 | % | 1/11/35 | | 475 | | | 487 | |
| 3 | Greenwich Capital Commercial Funding Corp. | 5.317 | % | 6/10/36 | | 875 | | | 888 | |
| 3 | Greenwich Capital Commercial Funding Corp. | 5.117 | % | 4/10/37 | | 325 | | | 327 | |
| 3 | Greenwich Capital Commercial Funding Corp. | 5.224 | % | 4/10/37 | | 1,400 | | | 1,310 | |
| 3,4 | Greenwich Capital Commercial Funding Corp. | 5.277 | % | 4/10/37 | | 290 | | | 244 | |
| 3,4 | Greenwich Capital Commercial Funding Corp. | 5.918 | % | 7/10/38 | | 150 | | | 120 | |
| 3 | Greenwich Capital Commercial Funding Corp. | 5.475 | % | 3/10/39 | | 100 | | | 71 | |
| 3 | Greenwich Capital Commercial Funding Corp. | 4.799 | % | 8/10/42 | | 600 | | | 556 | |
| 3 | GS Mortgage Securities Corp. II | 5.506 | % | 4/10/38 | | 925 | | | 935 | |
| 3,4 | GS Mortgage Securities Corp. II | 5.553 | % | 4/10/38 | | 300 | | | 273 | |
| 3,4 | GS Mortgage Securities Corp. II | 5.622 | % | 4/10/38 | | 275 | | | 219 | |
| 3 | GS Mortgage Securities Corp. II | 5.396 | % | 8/10/38 | | 1,600 | | | 1,514 | |
| 3 | Harley-Davidson Motorcycle Trust | 5.210 | % | 6/17/13 | | 2,815 | | | 2,898 | |
| 3 | Honda Auto Receivables Owner Trust | 4.880 | % | 9/18/14 | | 525 | | | 553 | |
| 3 | JP Morgan Chase Commercial | | | | | | | | | |
| | Mortgage Securities Corp. | 6.260 | % | 3/15/33 | | 220 | | | 224 | |
| 3 | JP Morgan Chase Commercial | | | | | | | | | |
| | Mortgage Securities Corp. | 5.050 | % | 12/12/34 | | 250 | | | 257 | |
| 3 | JP Morgan Chase Commercial | | | | | | | | | |
| | Mortgage Securities Corp. | 4.824 | % | 9/12/37 | | 150 | | | 151 | |
| 3,4 | JP Morgan Chase Commercial | | | | | | | | | |
| | Mortgage Securities Corp. | 4.948 | % | 9/12/37 | | 40 | | | 32 | |
| 3 | JP Morgan Chase Commercial | | | | | | | | | |
| Mortgage Securities Corp. | 4.404 | % | 1/12/39 | | 1,120 | | | 1,065 | |
| 3,4 | JP Morgan Chase Commercial | | | | | | | | | |
| Mortgage Securities Corp. | 5.377 | % | 6/12/41 | | 1,615 | | | 1,626 | |
| 3 | JP Morgan Chase Commercial | | | | | | | | | |
| Mortgage Securities Corp. | 4.780 | % | 7/15/42 | | 135 | | | 105 | |
| 3,4 | JP Morgan Chase Commercial | | | | | | | | | |
| Mortgage Securities Corp. | 5.321 | % | 1/12/43 | | 25 | | | 19 | |
| 3 | JP Morgan Chase Commercial | | | | | | | | | |
| Mortgage Securities Corp. | 5.160 | % | 4/15/43 | | 857 | | | 861 | |
| 3,4 | JP Morgan Chase Commercial | | | | | | | | | |
| Mortgage Securities Corp. | 5.444 | % | 12/12/44 | | 200 | | | 154 | |
| 3,4 | JP Morgan Chase Commercial | | | | | | | | | |
| Mortgage Securities Corp. | 5.221 | % | 12/15/44 | | 200 | | | 174 | |
| 3 | JP Morgan Chase Commercial | | | | | | | | | |
| Mortgage Securities Corp. | 5.874 | % | 4/15/45 | | 1,600 | | | 1,524 | |
| 3,4 | JP Morgan Chase Commercial | | | | | | | | | |
| Mortgage Securities Corp. | 5.875 | % | 4/15/45 | | 85 | | | 65 | |
| 3 | JP Morgan Chase Commercial | | | | | | | | | |
| Mortgage Securities Corp. | 5.593 | % | 5/12/45 | | 400 | | | 327 | |
21
| | | | | | | | | | |
| Institutional Total Bond Market Index Fu nd | | | | | | | | | |
| |
| |
| |
| | | | | | | Face | | | Market | |
| | | | | Maturity | | Amount | | | Value• | |
| | | Coupon | | Date | ($ | 000 | ) | ($ | 000 | ) |
| 3 | JP Morgan Chase Commercial | | | | | | | | | |
| | Mortgage Securities Corp. | 5.440 | % | 5/15/45 | | 155 | | | 128 | |
| 3 | JP Morgan Chase Commercial | | | | | | | | | |
| | Mortgage Securities Corp. | 5.447 | % | 5/15/45 | | 350 | | | 350 | |
| 3 | JP Morgan Chase Commercial | | | | | | | | | |
| | Mortgage Securities Corp. | 5.803 | % | 6/15/49 | | 625 | | | 627 | |
| 3 | JP Morgan Chase Commercial | | | | | | | | | |
| | Mortgage Securities Corp. | 5.818 | % | 6/15/49 | | 600 | | | 533 | |
| 3 | JP Morgan Chase Commercial | | | | | | | | | |
| | Mortgage Securities Corp. | 5.794 | % | 2/12/51 | | 2,300 | | | 1,953 | |
| 3 | JP Morgan Chase Commercial | | | | | | | | | |
| | Mortgage Securities Corp. | 5.855 | % | 2/12/51 | | 600 | | | 598 | |
| 3,4 | JP Morgan Chase Commercial | | | | | | | | | |
| | Mortgage Securities Corp. | 5.882 | % | 2/15/51 | | 1,425 | | | 1,221 | |
| 3,4 | LB Commercial Conduit Mortgage Trust | 5.950 | % | 7/15/44 | | 655 | | | 446 | |
| 3 | LB-UBS Commercial Mortgage Trust | 7.370 | % | 8/15/26 | | 286 | | | 290 | |
| 3 | LB-UBS Commercial Mortgage Trust | 4.786 | % | 10/15/29 | | 1,050 | | | 1,013 | |
| 3 | LB-UBS Commercial Mortgage Trust | 4.742 | % | 2/15/30 | | 695 | | | 675 | |
| 3 | LB-UBS Commercial Mortgage Trust | 4.553 | % | 7/15/30 | | 74 | | | 74 | |
| 3 | LB-UBS Commercial Mortgage Trust | 5.197 | % | 11/15/30 | | 775 | | | 754 | |
| 3 | LB-UBS Commercial Mortgage Trust | 5.217 | % | 2/15/31 | | 135 | | | 114 | |
| 3 | LB-UBS Commercial Mortgage Trust | 4.853 | % | 9/15/31 | | 1,075 | | | 1,095 | |
| 3 | LB-UBS Commercial Mortgage Trust | 4.960 | % | 12/15/31 | | 1,075 | | | 1,094 | |
| 3 | LB-UBS Commercial Mortgage Trust | 4.166 | % | 5/15/32 | | 325 | | | 321 | |
| 3,4 | LB-UBS Commercial Mortgage Trust | 5.661 | % | 3/15/39 | | 1,720 | | | 1,629 | |
| 3 | LB-UBS Commercial Mortgage Trust | 5.413 | % | 9/15/39 | | 100 | | | 76 | |
| 3 | LB-UBS Commercial Mortgage Trust | 5.424 | % | 2/15/40 | | 275 | | | 229 | |
| 3 | LB-UBS Commercial Mortgage Trust | 5.430 | % | 2/15/40 | | 1,555 | | | 1,327 | |
| 3 | LB-UBS Commercial Mortgage Trust | 5.455 | % | 2/15/40 | | 175 | | | 116 | |
| 3,4 | LB-UBS Commercial Mortgage Trust | 5.493 | % | 2/15/40 | | 125 | | | 85 | |
| 3,4 | LB-UBS Commercial Mortgage Trust | 5.263 | % | 11/15/40 | | 40 | | | 35 | |
| 3,4 | LB-UBS Commercial Mortgage Trust | 6.149 | % | 4/15/41 | | 140 | | | 103 | |
| 3,4 | LB-UBS Commercial Mortgage Trust | 6.149 | % | 4/15/41 | | 1,675 | | | 1,609 | |
| 3 | LB-UBS Commercial Mortgage Trust | 5.866 | % | 9/15/45 | | 1,595 | | | 1,358 | |
| 3 | Merrill Lynch Mortgage Trust | 5.236 | % | 11/12/35 | | 645 | | | 646 | |
| 3 | Merrill Lynch Mortgage Trust | 5.107 | % | 7/12/38 | | 90 | | | 75 | |
| 3 | Merrill Lynch Mortgage Trust | 5.655 | % | 5/12/39 | | 1,140 | | | 1,073 | |
| 3,4 | Merrill Lynch Mortgage Trust | 5.656 | % | 5/12/39 | | 100 | | | 77 | |
| 3 | Merrill Lynch Mortgage Trust | 5.782 | % | 8/12/43 | | 205 | | | 167 | |
| 3,4 | Merrill Lynch Mortgage Trust | 5.291 | % | 1/12/44 | | 825 | | | 795 | |
| 3,4 | Merrill Lynch Mortgage Trust | 5.828 | % | 6/12/50 | | 185 | | | 121 | |
| 3 | Merrill Lynch Mortgage Trust | 5.425 | % | 2/12/51 | | 225 | | | 219 | |
| 3 | Merrill Lynch Mortgage Trust | 5.690 | % | 2/12/51 | | 750 | | | 648 | |
| 3,4 | Merrill Lynch/Countrywide | | | | | | | | | |
| Commercial Mortgage Trust | 5.517 | % | 2/12/39 | | 25 | | | 13 | |
| | | | | | |
| 3 | Merrill Lynch/Countrywide | | | | | |
| | Commercial Mortgage Trust | 5.456 | % | 7/12/46 | 160 | 109 |
| 3 | Merrill Lynch/Countrywide | | | | | |
| | Commercial Mortgage Trust | 5.378 | % | 8/12/48 | 1,350 | 1,026 |
| 3 | Merrill Lynch/Countrywide | | | | | |
| | Commercial Mortgage Trust | 5.590 | % | 9/12/49 | 675 | 668 |
| 3 | Merrill Lynch/Countrywide | | | | | |
| | Commercial Mortgage Trust | 5.700 | % | 9/12/49 | 1,875 | 1,528 |
| 3 | Morgan Stanley Capital I | 4.970 | % | 4/14/40 | 455 | 453 |
| 3,4 | Morgan Stanley Capital I | 5.110 | % | 6/15/40 | 500 | 495 |
| 3 | Morgan Stanley Capital I | 5.270 | % | 6/13/41 | 750 | 739 |
22
| | | | | | | | | | |
| Institutional Total Bond Market Index Fund | | | | | | | | | |
| |
| |
| |
| | | | | | | Face | | | Market | |
| | | | | Maturity | | Amount | | | Value• | |
| | | Coupon | | Date | ($ | 000 | ) | ($ | 000 | ) |
| 3,4 | Morgan Stanley Capital I | 5.810 | % | 8/12/41 | | 125 | | | 100 | |
| 3 | Morgan Stanley Capital I | 5.360 | % | 11/12/41 | | 400 | | | 297 | |
| 3 | Morgan Stanley Capital I | 4.970 | % | 12/15/41 | | 600 | | | 599 | |
| 3 | Morgan Stanley Capital I | 5.168 | % | 1/14/42 | | 350 | | | 351 | |
| 3,4 | Morgan Stanley Capital I | 5.649 | % | 6/11/42 | | 25 | | | 18 | |
| 3,4 | Morgan Stanley Capital I | 5.649 | % | 6/11/42 | | 375 | | | 363 | |
| 3 | Morgan Stanley Capital I | 4.989 | % | 8/13/42 | | 1,605 | | | 1,571 | |
| 3 | Morgan Stanley Capital I | 5.230 | % | 9/15/42 | | 1,500 | | | 1,465 | |
| 3 | Morgan Stanley Capital I | 5.769 | % | 10/15/42 | | 500 | | | 485 | |
| 3,4 | Morgan Stanley Capital I | 5.774 | % | 10/15/42 | | 45 | | | 36 | |
| 3,4 | Morgan Stanley Capital I | 5.207 | % | 11/14/42 | | 1,125 | | | 1,131 | |
| 3,4 | Morgan Stanley Capital I | 5.207 | % | 11/14/42 | | 50 | | | 43 | |
| 3 | Morgan Stanley Capital I | 6.280 | % | 1/11/43 | | 1,250 | | | 1,161 | |
| 3 | Morgan Stanley Capital I | 5.332 | % | 12/15/43 | | 355 | | | 325 | |
| 3,4 | Morgan Stanley Capital I | 5.385 | % | 3/12/44 | | 1,850 | | | 1,767 | |
| 3,4 | Morgan Stanley Capital I | 5.773 | % | 7/12/44 | | 271 | | | 216 | |
| 3 | Morgan Stanley Capital I | 4.660 | % | 9/13/45 | | 1,045 | | | 1,006 | |
| 3,4 | Morgan Stanley Capital I | 5.691 | % | 4/15/49 | | 325 | | | 192 | |
| 3,4 | Morgan Stanley Capital I | 5.544 | % | 11/12/49 | | 425 | | | 311 | |
| 3 | Morgan Stanley Capital I | 5.809 | % | 12/12/49 | | 800 | | | 677 | |
| 3 | Morgan Stanley Capital I | 5.090 | % | 10/12/52 | | 500 | | | 505 | |
| 3,4 | Morgan Stanley Capital I | 5.204 | % | 10/12/52 | | 325 | | | 255 | |
| 3 | Morgan Stanley Capital I | 4.770 | % | 7/15/56 | | 100 | | | 74 | |
| 3 | Morgan Stanley Dean Witter Capital I | 6.660 | % | 2/15/33 | | 193 | | | 198 | |
| 3 | Morgan Stanley Dean Witter Capital I | 6.390 | % | 7/15/33 | | 237 | | | 247 | |
| 3 | Morgan Stanley Dean Witter Capital I | 6.390 | % | 10/15/35 | | 197 | | | 208 | |
| 3 | Morgan Stanley Dean Witter Capital I | 4.740 | % | 11/13/36 | | 195 | | | 191 | |
| 3 | Morgan Stanley Dean Witter Capital I | 5.980 | % | 1/15/39 | | 1,485 | | | 1,522 | |
| 3 | Nissan Auto Receivables Owner Trust | 5.050 | % | 11/17/14 | | 425 | | | 451 | |
| 3 | PG&E Energy Recovery Funding LLC | 4.140 | % | 9/25/12 | | 74 | | | 75 | |
| 3 | PG&E Energy Recovery Funding LLC | 5.030 | % | 3/25/14 | | 246 | | | 256 | |
| 3 | PSE&G Transition Funding LLC | 6.890 | % | 12/15/17 | | 1,075 | | | 1,249 | |
| 3 | Public Service New Hampshire Funding LLC | 6.480 | % | 5/1/15 | | 221 | | | 239 | |
| 3,4 | Salomon Brothers Mortgage Securities VII Inc. | 3.688 | % | 9/25/33 | | 142 | | | 136 | |
| 3 | USAA Auto Owner Trust | 4.710 | % | 2/18/14 | | 825 | | | 870 | |
| 3,4 | Wachovia Bank Commercial Mortgage Trust | 5.125 | % | 8/15/35 | | 250 | | | 255 | |
| 3 | Wachovia Bank Commercial Mortgage Trust | 4.719 | % | 1/15/41 | | 225 | | | 226 | |
| 3 | Wachovia Bank Commercial Mortgage Trust | 4.748 | % | 2/15/41 | | 1,850 | | | 1,820 | |
| 3 | Wachovia Bank Commercial Mortgage Trust | 5.001 | % | 7/15/41 | | 471 | | | 475 | |
| 3,4 | Wachovia Bank Commercial Mortgage Trust | 5.237 | % | 7/15/41 | | 1,150 | | | 1,152 | |
| 3 | Wachovia Bank Commercial Mortgage Trust | 4.803 | % | 10/15/41 | | 600 | | | 576 | |
| 3,4 | Wachovia Bank Commercial Mortgage Trust | 5.083 | % | 3/15/42 | | 1,200 | | | 1,188 | |
| 3 | Wachovia Bank Commercial Mortgage Trust | 5.118 | % | 7/15/42 | | 879 | | | 849 | |
| 3,4 | Wachovia Bank Commercial Mortgage Trust | 5.740 | % | 5/15/43 | | 375 | | | 292 | |
| 3,4 | Wachovia Bank Commercial Mortgage Trust | 5.740 | % | 5/15/43 | | 900 | | | 872 | |
| 3 | Wachovia Bank Commercial Mortgage Trust | 4.699 | % | 5/15/44 | | 950 | | | 906 | |
| 3,4 | Wachovia Bank Commercial Mortgage Trust | 5.209 | % | 10/15/44 | | 1,975 | | | 1,951 | |
| 3,4 | Wachovia Bank Commercial Mortgage Trust | 5.265 | % | 12/15/44 | | 2,225 | | | 2,224 | |
| 3,4 | Wachovia Bank Commercial Mortgage Trust | 5.315 | % | 12/15/44 | | 15 | | | 13 | |
| 3,4 | Wachovia Bank Commercial Mortgage Trust | 5.956 | % | 6/15/45 | | 65 | | | 50 | |
| 3,4 | Wachovia Bank Commercial Mortgage Trust | 5.765 | % | 7/15/45 | | 1,100 | | | 997 | |
| 3,4 | Wachovia Bank Commercial Mortgage Trust | 5.818 | % | 5/15/46 | | 305 | | | 202 | |
| 3 | Wachovia Bank Commercial Mortgage Trust | 5.313 | % | 11/15/48 | | 650 | | | 616 | |
| 3 | Wachovia Bank Commercial Mortgage Trust | 5.339 | % | 11/15/48 | | 800 | | | 599 | |
| 3 | World Omni Auto Receivables Trust | 3.940 | % | 10/15/12 | | 1,075 | | | 1,096 | |
| Total Asset-Backed/Commercial Mortgage-Backed Securities (Cost $145,344) | | | | | 144,833 | |
23
| | | | | | | | | |
| Institutional Total Bond Market Index Fund | | | | | | | | | |
| |
| |
| |
| | | | | | Face | | | Market | |
| | | | Maturity | | Amount | | | Value• | |
| | Coupon | | Date | ($ | 000 | ) | ($ | 000 | ) |
| Corporate Bonds (19.1%) | | | | | | | | | |
| Finance (7.0%) | | | | | | | | | |
| Banking (4.7%) | | | | | | | | | |
| Abbey National PLC | 7.950 | % | 10/26/29 | | 550 | | | 613 | |
| American Express Bank FSB | 5.550 | % | 10/17/12 | | 300 | | | 319 | |
| American Express Bank FSB | 5.500 | % | 4/16/13 | | 875 | | | 929 | |
| American Express Bank FSB | 6.000 | % | 9/13/17 | | 225 | | | 232 | |
| American Express Centurion Bank | 5.550 | % | 10/17/12 | | 300 | | | 320 | |
| American Express Centurion Bank | 5.950 | % | 6/12/17 | | 150 | | | 156 | |
| American Express Centurion Bank | 6.000 | % | 9/13/17 | | 325 | | | 337 | |
| American Express Co. | 7.250 | % | 5/20/14 | | 500 | | | 564 | |
| American Express Co. | 5.500 | % | 9/12/16 | | 225 | | | 232 | |
| American Express Co. | 6.150 | % | 8/28/17 | | 500 | | | 522 | |
| American Express Co. | 7.000 | % | 3/19/18 | | 2,100 | | | 2,316 | |
| American Express Co. | 8.125 | % | 5/20/19 | | 500 | | | 594 | |
| 3 American Express Co. | 6.800 | % | 9/1/66 | | 355 | | | 307 | |
| American Express Credit Co rp. | 5.000 | % | 12/2/10 | | 425 | | | 439 | |
| American Express Credit Co rp. | 5.875 | % | 5/2/13 | | 600 | | | 642 | |
| American Express Credit Co rp. | 7.300 | % | 8/20/13 | | 100 | | | 112 | |
| American Express Credit Co rp. | 5.125 | % | 8/25/14 | | 100 | | | 105 | |
| 5 American Express Travel Related Services Co. Inc. | 5.250 | % | 11/21/11 | | 550 | | | 574 | |
| Amsouth Bank | 5.200 | % | 4/1/15 | | 325 | | | 280 | |
| Banco Santander Chile | 2.875 | % | 11/13/12 | | 300 | | | 302 | |
| Bank of America Corp. | 4.250 | % | 10/1/10 | | 350 | | | 359 | |
| Bank of America Corp. | 4.375 | % | 12/1/10 | | 490 | | | 505 | |
| Bank of America Corp. | 5.375 | % | 8/15/11 | | 525 | | | 554 | |
| Bank of America Corp. | 5.375 | % | 9/11/12 | | 675 | | | 716 | |
| Bank of America Corp. | 4.875 | % | 9/15/12 | | 675 | | | 706 | |
| Bank of America Corp. | 4.875 | % | 1/15/13 | | 250 | | | 261 | |
| Bank of America Corp. | 4.900 | % | 5/1/13 | | 675 | | | 699 | |
| Bank of America Corp. | 7.375 | % | 5/15/14 | | 1,000 | | | 1,134 | |
| Bank of America Corp. | 5.375 | % | 6/15/14 | | 150 | | | 156 | |
| Bank of America Corp. | 5.125 | % | 11/15/14 | | 775 | | | 802 | |
| Bank of America Corp. | 4.750 | % | 8/1/15 | | 225 | | | 228 | |
| Bank of America Corp. | 5.250 | % | 12/1/15 | | 125 | | | 126 | |
| Bank of America Corp. | 6.500 | % | 8/1/16 | | 350 | | | 377 | |
| Bank of America Corp. | 5.750 | % | 8/15/16 | | 150 | | | 151 | |
| Bank of America Corp. | 5.625 | % | 10/14/16 | | 425 | | | 432 | |
| Bank of America Corp. | 5.420 | % | 3/15/17 | | 900 | | | 892 | |
| Bank of America Corp. | 6.000 | % | 9/1/17 | | 50 | | | 52 | |
| Bank of America Corp. | 5.750 | % | 12/1/17 | | 75 | | | 77 | |
| Bank of America Corp. | 5.650 | % | 5/1/18 | | 3,125 | | | 3,179 | |
| Bank of America Corp. | 7.625 | % | 6/1/19 | | 600 | | | 694 | |
| Bank of America Corp. | 6.800 | % | 3/15/28 | | 400 | | | 391 | |
| Bank of America Corp. | 6.500 | % | 9/15/37 | | 210 | | | 204 | |
| Bank of America NA | 6.100 | % | 6/15/17 | | 400 | | | 407 | |
| Bank of America NA | 6.000 | % | 10/15/36 | | 400 | | | 387 | |
| Bank of New York Mellon Corp. | 4.950 | % | 1/14/11 | | 475 | | | 493 | |
| Bank of New York Mellon Corp. | 4.950 | % | 11/1/12 | | 1,225 | | | 1,319 | |
| Bank of New York Mellon Corp. | 5.125 | % | 8/27/13 | | 50 | | | 54 | |
| Bank of New York Mellon Corp. | 4.300 | % | 5/15/14 | | 325 | | | 342 | |
| Bank of New York Mellon Corp. | 4.950 | % | 3/15/15 | | 600 | | | 632 | |
| Bank of New York Mellon Corp. | 5.450 | % | 5/15/19 | | 350 | | | 367 | |
| 5 Bank of Scotland PLC | 5.250 | % | 2/21/17 | | 700 | | | 696 | |
| Bank of Tokyo-Mitsubishi UFJ Ltd. | 7.400 | % | 6/15/11 | | 300 | | | 324 | |
| Bank One Corp. | 5.900 | % | 11/15/11 | | 445 | | | 476 | |
24
| | | | | | | | | | |
| Institutional Total Bond Market Index Fu nd | | | | | | | | | |
| |
| |
| |
| | | | | | | Face | | | Market | |
| | | | | Maturity | | Amount | | | Value• | |
| | | Coupon | | Date | ($ | 000 | ) | ($ | 000 | ) |
| | Bank One Corp. | 5.250 | % | 1/30/13 | | 325 | | | 344 | |
| | Bank One Corp. | 4.900 | % | 4/30/15 | | 350 | | | 361 | |
| | Bank One Corp. | 7.625 | % | 10/15/26 | | 75 | | | 85 | |
| | Barclays Bank PLC | 5.450 | % | 9/12/12 | | 150 | | | 162 | |
| | Barclays Bank PLC | 2.500 | % | 1/23/13 | | 450 | | | 450 | |
| | Barclays Bank PLC | 5.200 | % | 7/10/14 | | 225 | | | 240 | |
| | Barclays Bank PLC | 5.000 | % | 9/22/16 | | 900 | | | 921 | |
| | Barclays Bank PLC | 6.750 | % | 5/22/19 | | 400 | | | 449 | |
| | BB&T Capital Trust II | 6.750 | % | 6/7/36 | | 450 | | | 419 | |
| | BB&T Corp. | 6.500 | % | 8/1/11 | | 50 | | | 53 | |
| | BB&T Corp. | 3.850 | % | 7/27/12 | | 225 | | | 233 | |
| | BB&T Corp. | 4.750 | % | 10/1/12 | | 625 | | | 652 | |
| | BB&T Corp. | 5.700 | % | 4/30/14 | | 150 | | | 162 | |
| | BB&T Corp. | 5.200 | % | 12/23/15 | | 325 | | | 339 | |
| | BB&T Corp. | 6.850 | % | 4/30/19 | | 125 | | | 142 | |
| | BB&T Corp. | 5.250 | % | 11/1/19 | | 500 | | | 491 | |
| | Bear Stearns Cos. LLC | 4.500 | % | 10/28/10 | | 175 | | | 181 | |
| | Bear Stearns Cos. LLC | 5.350 | % | 2/1/12 | | 1,550 | | | 1,648 | |
| | Bear Stearns Cos. LLC | 6.950 | % | 8/10/12 | | 205 | | | 229 | |
| | Bear Stearns Cos. LLC | 5.700 | % | 11/15/14 | | 1,350 | | | 1,476 | |
| | Bear Stearns Cos. LLC | 5.300 | % | 10/30/15 | | 175 | | | 186 | |
| | Bear Stearns Cos. LLC | 5.550 | % | 1/22/17 | | 550 | | | 562 | |
| | Bear Stearns Cos. LLC | 6.400 | % | 10/2/17 | | 755 | | | 830 | |
| | Bear Stearns Cos. LLC | 7.250 | % | 2/1/18 | | 775 | | | 893 | |
| | BNP Paribas US Medium-Term | | | | | | | | | |
| | Note Program LLC | 2.125 | % | 12/21/12 | | 100 | | | 100 | |
| | Branch Banking & Trust Co. | 5.625 | % | 9/15/16 | | 300 | | | 296 | |
| | Capital One Bank USA NA | 8.800 | % | 7/15/19 | | 1,100 | | | 1,307 | |
| | Capital One Capital III | 7.686 | % | 8/15/36 | | 250 | | | 220 | |
| | Capital One Capital IV | 6.745 | % | 2/17/37 | | 150 | | | 124 | |
| | Capital One Capital V | 10.250 | % | 8/15/39 | | 100 | | | 117 | |
| | Capital One Capital VI | 8.875 | % | 5/15/40 | | 75 | | | 80 | |
| | Capital One Financial Corp. | 5.700 | % | 9/15/11 | | 175 | | | 185 | |
| | Capital One Financial Corp. | 4.800 | % | 2/21/12 | | 75 | | | 78 | |
| | Capital One Financial Corp. | 7.375 | % | 5/23/14 | | 350 | | | 396 | |
| | Capital One Financial Corp. | 5.500 | % | 6/1/15 | | 200 | | | 209 | |
| | Capital One Financial Corp. | 6.150 | % | 9/1/16 | | 400 | | | 403 | |
| | Capital One Financial Corp. | 5.250 | % | 2/21/17 | | 500 | | | 492 | |
| | Charter One Bank NA | 5.500 | % | 4/26/11 | | 425 | | | 435 | |
| 3,5 | Citicorp Lease Pass-Through Trust 1999-1 | 8.040 | % | 12/15/19 | | 100 | | | 98 | |
| | Citigroup Inc. | 6.500 | % | 1/18/11 | | 575 | | | 601 | |
| | Citigroup Inc. | 5.125 | % | 2/14/11 | | 175 | | | 180 | |
| | Citigroup Inc. | 5.100 | % | 9/29/11 | | 1,100 | | | 1,140 | |
| | Citigroup Inc. | 6.000 | % | 2/21/12 | | 125 | | | 132 | |
| | Citigroup Inc. | 5.250 | % | 2/27/12 | | 875 | | | 910 | |
| | Citigroup Inc. | 5.500 | % | 8/27/12 | | 310 | | | 322 | |
| | Citigroup Inc. | 5.625 | % | 8/27/12 | | 1,350 | | | 1,390 | |
| | Citigroup Inc. | 5.300 | % | 10/17/12 | | 650 | | | 680 | |
| | Citigroup Inc. | 5.500 | % | 4/11/13 | | 230 | | | 239 | |
| | Citigroup Inc. | 6.500 | % | 8/19/13 | | 1,025 | | | 1,093 | |
| | Citigroup Inc. | 5.125 | % | 5/5/14 | | 350 | | | 352 | |
| | Citigroup Inc. | 5.000 | % | 9/15/14 | | 3,259 | | | 3,149 | |
| | Citigroup Inc. | 5.500 | % | 10/15/14 | | 800 | | | 811 | |
| | Citigroup Inc. | 6.010 | % | 1/15/15 | | 1,350 | | | 1,387 | |
| | Citigroup Inc. | 4.700 | % | 5/29/15 | | 125 | | | 121 | |
| | Citigroup Inc. | 5.300 | % | 1/7/16 | | 150 | | | 147 | |
25
| | | | | | | | | |
| Institutional Total Bond Market Index Fund | | | | | | | | | |
| |
| |
| |
| | | | | | Face | | | Market | |
| | | | Maturity | | Amount | | | Value• | |
| | Coupon | | Date | ($ | 000 | ) | ($ | 000 | ) |
| Citigroup Inc. | 6.000 | % | 8/15/17 | | 825 | | | 825 | |
| Citigroup Inc. | 6.125 | % | 11/21/17 | | 875 | | | 888 | |
| Citigroup Inc. | 6.125 | % | 5/15/18 | | 550 | | | 551 | |
| Citigroup Inc. | 8.500 | % | 5/22/19 | | 925 | | | 1,072 | |
| Citigroup Inc. | 6.625 | % | 6/15/32 | | 1,275 | | | 1,183 | |
| Citigroup Inc. | 5.875 | % | 2/22/33 | | 750 | | | 630 | |
| Citigroup Inc. | 6.000 | % | 10/31/33 | | 625 | | | 529 | |
| Citigroup Inc. | 5.850 | % | 12/11/34 | | 175 | | | 151 | |
| Citigroup Inc. | 5.875 | % | 5/29/37 | | 50 | | | 45 | |
| Citigroup Inc. | 6.875 | % | 3/5/38 | | 400 | | | 399 | |
| Citigroup Inc. | 8.125 | % | 7/15/39 | | 1,075 | | | 1,227 | |
| Comerica Bank | 5.750 | % | 11/21/16 | | 825 | | | 796 | |
| Comerica Bank | 5.200 | % | 8/22/17 | | 200 | | | 187 | |
| Compass Bank | 6.400 | % | 10/1/17 | | 200 | | | 200 | |
| Compass Bank | 5.900 | % | 4/1/26 | | 100 | | | 83 | |
| 5 Corestates Capital I | 8.000 | % | 12/15/26 | | 325 | | | 322 | |
| Countrywide Financial Corp. | 6.250 | % | 5/15/16 | | 45 | | | 46 | |
| Countrywide Home Loans Inc. | 4.000 | % | 3/22/11 | | 425 | | | 436 | |
| Credit Suisse | 5.000 | % | 5/15/13 | | 325 | | | 346 | |
| Credit Suisse | 5.500 | % | 5/1/14 | | 675 | | | 733 | |
| Credit Suisse | 6.000 | % | 2/15/18 | | 500 | | | 525 | |
| Credit Suisse | 5.300 | % | 8/13/19 | | 750 | | | 776 | |
| 3 Credit Suisse | 5.860 | % | 5/15/49 | | 350 | | | 311 | |
| Credit Suisse USA Inc. | 4.875 | % | 8/15/10 | | 1,050 | | | 1,078 | |
| Credit Suisse USA Inc. | 5.250 | % | 3/2/11 | | 400 | | | 419 | |
| Credit Suisse USA Inc. | 5.500 | % | 8/16/11 | | 225 | | | 239 | |
| Credit Suisse USA Inc. | 6.125 | % | 11/15/11 | | 325 | | | 352 | |
| Credit Suisse USA Inc. | 6.500 | % | 1/15/12 | | 290 | | | 316 | |
| Credit Suisse USA Inc. | 5.500 | % | 8/15/13 | | 1,475 | | | 1,593 | |
| Credit Suisse USA Inc. | 5.125 | % | 1/15/14 | | 75 | | | 80 | |
| Credit Suisse USA Inc. | 4.875 | % | 1/15/15 | | 1,080 | | | 1,133 | |
| Credit Suisse USA Inc. | 5.125 | % | 8/15/15 | | 495 | | | 527 | |
| Credit Suisse USA Inc. | 7.125 | % | 7/15/32 | | 600 | | | 706 | |
| Deutsche Bank AG | 5.375 | % | 10/12/12 | | 1,025 | | | 1,107 | |
| Deutsche Bank AG | 4.875 | % | 5/20/13 | | 750 | | | 798 | |
| Deutsche Bank AG | 6.000 | % | 9/1/17 | | 1,425 | | | 1,554 | |
| Deutsche Bank Financial LLC | 5.375 | % | 3/2/15 | | 500 | | | 520 | |
| FIA Card Services NA | 6.625 | % | 6/15/12 | | 300 | | | 319 | |
| Fifth Third Bancorp | 4.500 | % | 6/1/18 | | 300 | | | 244 | |
| Fifth Third Bancorp | 8.250 | % | 3/1/38 | | 525 | | | 493 | |
| Fifth Third Bank | 4.750 | % | 2/1/15 | | 300 | | | 286 | |
| First Tennessee Bank NA | 5.050 | % | 1/15/15 | | 50 | | | 44 | |
| First Union Institutional Capital I | 8.040 | % | 12/1/26 | | 75 | | | 75 | |
| Golden West Financial Corp. | 4.750 | % | 10/1/12 | | 200 | | | 210 | |
| Goldman Sachs Capital I | 6.345 | % | 2/15/34 | | 500 | | | 466 | |
| 3 Goldman Sachs Capital II | 5.793 | % | 12/29/49 | | 495 | | | 381 | |
| Goldman Sachs Group Inc. | 4.500 | % | 6/15/10 | | 835 | | | 850 | |
| Goldman Sachs Group Inc. | 6.875 | % | 1/15/11 | | 260 | | | 276 | |
| Goldman Sachs Group Inc. | 6.600 | % | 1/15/12 | | 150 | | | 163 | |
| Goldman Sachs Group Inc. | 5.300 | % | 2/14/12 | | 75 | | | 80 | |
| Goldman Sachs Group Inc. | 3.625 | % | 8/1/12 | | 550 | | | 566 | |
| Goldman Sachs Group Inc. | 5.700 | % | 9/1/12 | | 50 | | | 54 | |
| Goldman Sachs Group Inc. | 5.450 | % | 11/1/12 | | 595 | | | 640 | |
| Goldman Sachs Group Inc. | 5.250 | % | 4/1/13 | | 550 | | | 581 | |
| Goldman Sachs Group Inc. | 4.750 | % | 7/15/13 | | 1,075 | | | 1,124 | |
| Goldman Sachs Group Inc. | 5.250 | % | 10/15/13 | | 875 | | | 929 | |
26
| | | | | | | | | |
| Institutional Total Bond Market Index Fund | | | | | | | | | |
| |
| |
| |
| | | | | | Face | | | Market | |
| | | | Maturity | | Amount | | | Value• | |
| | Coupon | | Date | ($ | 000 | ) | ($ | 000 | ) |
| Goldman Sachs Group Inc. | 5.150 | % | 1/15/14 | | 1,100 | | | 1,166 | |
| Goldman Sachs Group Inc. | 6.000 | % | 5/1/14 | | 1,100 | | | 1,205 | |
| Goldman Sachs Group Inc. | 5.000 | % | 10/1/14 | | 1,125 | | | 1,184 | |
| Goldman Sachs Group Inc. | 5.125 | % | 1/15/15 | | 1,800 | | | 1,892 | |
| Goldman Sachs Group Inc. | 5.350 | % | 1/15/16 | | 1,075 | | | 1,118 | |
| Goldman Sachs Group Inc. | 5.750 | % | 10/1/16 | | 300 | | | 317 | |
| Goldman Sachs Group Inc. | 5.625 | % | 1/15/17 | | 775 | | | 797 | |
| Goldman Sachs Group Inc. | 6.250 | % | 9/1/17 | | 875 | | | 939 | |
| Goldman Sachs Group Inc. | 5.950 | % | 1/18/18 | | 1,800 | | | 1,900 | |
| Goldman Sachs Group Inc. | 6.150 | % | 4/1/18 | | 660 | | | 707 | |
| Goldman Sachs Group Inc. | 7.500 | % | 2/15/19 | | 125 | | | 146 | |
| Goldman Sachs Group Inc. | 5.950 | % | 1/15/27 | | 1,160 | | | 1,117 | |
| Goldman Sachs Group Inc. | 6.125 | % | 2/15/33 | | 150 | | | 154 | |
| Goldman Sachs Group Inc. | 6.450 | % | 5/1/36 | | 535 | | | 527 | |
| Goldman Sachs Group Inc. | 6.750 | % | 10/1/37 | | 1,630 | | | 1,664 | |
| 5 HBOS PLC | 6.750 | % | 5/21/18 | | 400 | | | 370 | |
| HSBC Bank PLC | 6.950 | % | 3/15/11 | | 150 | | | 157 | |
| HSBC Bank USA NA | 4.625 | % | 4/1/14 | | 500 | | | 522 | |
| HSBC Bank USA NA | 5.875 | % | 11/1/34 | | 550 | | | 531 | |
| HSBC Bank USA NA | 5.625 | % | 8/15/35 | | 625 | | | 573 | |
| HSBC Holdings PLC | 7.350 | % | 11/27/32 | | 50 | | | 54 | |
| HSBC Holdings PLC | 6.500 | % | 5/2/36 | | 145 | | | 152 | |
| HSBC Holdings PLC | 6.500 | % | 9/15/37 | | 1,090 | | | 1,140 | |
| HSBC Holdings PLC | 6.800 | % | 6/1/38 | | 160 | | | 173 | |
| 5 ICICI Bank Ltd. | 6.625 | % | 10/3/12 | | 325 | | | 342 | |
| JP Morgan Chase Capital XV | 5.875 | % | 3/15/35 | | 760 | | | 673 | |
| JP Morgan Chase Capital XVII | 5.850 | % | 8/1/35 | | 50 | | | 43 | |
| JP Morgan Chase Capital XX | 6.550 | % | 9/29/36 | | 300 | | | 277 | |
| JP Morgan Chase Capital XXII | 6.450 | % | 2/2/37 | | 1,175 | | | 1,079 | |
| JP Morgan Chase Capital XXV | 6.800 | % | 10/1/37 | | 500 | | | 495 | |
| JPMorgan Chase & Co. | 6.750 | % | 2/1/11 | | 610 | | | 646 | |
| JPMorgan Chase & Co. | 4.500 | % | 1/15/12 | | 1,350 | | | 1,421 | |
| JPMorgan Chase & Co. | 6.625 | % | 3/15/12 | | 175 | | | 191 | |
| JPMorgan Chase & Co. | 5.375 | % | 10/1/12 | | 145 | | | 157 | |
| JPMorgan Chase & Co. | 5.750 | % | 1/2/13 | | 475 | | | 511 | |
| JPMorgan Chase & Co. | 4.750 | % | 5/1/13 | | 1,120 | | | 1,182 | |
| JPMorgan Chase & Co. | 4.875 | % | 3/15/14 | | 885 | | | 923 | |
| JPMorgan Chase & Co. | 5.125 | % | 9/15/14 | | 495 | | | 523 | |
| JPMorgan Chase & Co. | 4.750 | % | 3/1/15 | | 1,050 | | | 1,099 | |
| JPMorgan Chase & Co. | 5.250 | % | 5/1/15 | | 475 | | | 494 | |
| JPMorgan Chase & Co. | 5.150 | % | 10/1/15 | | 750 | | | 778 | |
| JPMorgan Chase & Co. | 6.125 | % | 6/27/17 | | 300 | | | 316 | |
| JPMorgan Chase & Co. | 6.300 | % | 4/23/19 | | 1,750 | | | 1,936 | |
| JPMorgan Chase & Co. | 6.400 | % | 5/15/38 | | 1,050 | | | 1,157 | |
| JPMorgan Chase Bank NA | 5.875 | % | 6/13/16 | | 225 | | | 236 | |
| KeyBank NA | 7.000 | % | 2/1/11 | | 125 | | | 130 | |
| KeyBank NA | 5.500 | % | 9/17/12 | | 425 | | | 441 | |
| KeyBank NA | 4.950 | % | 9/15/15 | | 350 | | | 327 | |
| KeyBank NA | 5.450 | % | 3/3/16 | | 675 | | | 621 | |
| KeyCorp | 6.500 | % | 5/14/13 | | 50 | | | 52 | |
| M&I Marshall & Ilsley Bank | 4.850 | % | 6/16/15 | | 200 | | | 156 | |
| Manufacturers & Traders Trust Co. | 6.625 | % | 12/4/17 | | 500 | | | 511 | |
| MBNA Corp. | 7.500 | % | 3/15/12 | | 325 | | | 356 | |
| MBNA Corp. | 6.125 | % | 3/1/13 | | 225 | | | 237 | |
| MBNA Corp. | 5.000 | % | 6/15/15 | | 350 | | | 349 | |
| Mellon Funding Corp. | 5.000 | % | 12/1/14 | | 150 | | | 160 | |
27
| | | | | | | | | | |
| Institutional Total Bond Market Index Fu nd | | | | | | | | | |
| |
| |
| |
| | | | | | | Face | | | Market | |
| | | | | Maturity | | Amount | | | Value• | |
| | | Coupon | | Date | ($ | 000 | ) | ($ | 000 | ) |
| | Merrill Lynch & Co. Inc. | 5.770 | % | 7/25/11 | | 300 | | | 317 | |
| | Merrill Lynch & Co. Inc. | 6.050 | % | 8/15/12 | | 500 | | | 537 | |
| | Merrill Lynch & Co. Inc. | 5.450 | % | 2/5/13 | | 235 | | | 247 | |
| | Merrill Lynch & Co. Inc. | 6.150 | % | 4/25/13 | | 1,275 | | | 1,385 | |
| | Merrill Lynch & Co. Inc. | 5.000 | % | 2/3/14 | | 225 | | | 231 | |
| | Merrill Lynch & Co. Inc. | 5.450 | % | 7/15/14 | | 200 | | | 210 | |
| | Merrill Lynch & Co. Inc. | 5.000 | % | 1/15/15 | | 2,125 | | | 2,167 | |
| | Merrill Lynch & Co. Inc. | 6.050 | % | 5/16/16 | | 25 | | | 25 | |
| | Merrill Lynch & Co. Inc. | 5.700 | % | 5/2/17 | | 1,025 | | | 1,006 | |
| | Merrill Lynch & Co. Inc. | 6.400 | % | 8/28/17 | | 1,225 | | | 1,282 | |
| | Merrill Lynch & Co. Inc. | 6.875 | % | 4/25/18 | | 2,105 | | | 2,271 | |
| | Merrill Lynch & Co. Inc. | 6.220 | % | 9/15/26 | | 325 | | | 309 | |
| | Merrill Lynch & Co. Inc. | 6.110 | % | 1/29/37 | | 875 | | | 801 | |
| | Merrill Lynch & Co. Inc. | 7.750 | % | 5/14/38 | | 1,015 | | | 1,118 | |
| | Morgan Stanley | 4.000 | % | 1/15/10 | | 600 | | | 601 | |
| | Morgan Stanley | 5.050 | % | 1/21/11 | | 50 | | | 52 | |
| | Morgan Stanley | 5.625 | % | 1/9/12 | | 2,425 | | | 2,570 | |
| | Morgan Stanley | 6.600 | % | 4/1/12 | | 215 | | | 233 | |
| | Morgan Stanley | 5.750 | % | 8/31/12 | | 250 | | | 270 | |
| | Morgan Stanley | 4.750 | % | 4/1/14 | | 2,690 | | | 2,707 | |
| | Morgan Stanley | 6.000 | % | 5/13/14 | | 800 | | | 859 | |
| | Morgan Stanley | 4.200 | % | 11/20/14 | | 1,350 | | | 1,349 | |
| | Morgan Stanley | 6.000 | % | 4/28/15 | | 75 | | | 80 | |
| | Morgan Stanley | 5.375 | % | 10/15/15 | | 400 | | | 417 | |
| | Morgan Stanley | 5.750 | % | 10/18/16 | | 550 | | | 574 | |
| | Morgan Stanley | 5.450 | % | 1/9/17 | | 600 | | | 609 | |
| | Morgan Stanley | 5.550 | % | 4/27/17 | | 430 | | | 437 | |
| | Morgan Stanley | 6.250 | % | 8/28/17 | | 50 | | | 53 | |
| | Morgan Stanley | 5.950 | % | 12/28/17 | | 425 | | | 441 | |
| | Morgan Stanley | 6.625 | % | 4/1/18 | | 2,655 | | | 2,880 | |
| | Morgan Stanley | 7.300 | % | 5/13/19 | | 1,650 | | | 1,854 | |
| | Morgan Stanley | 5.625 | % | 9/23/19 | | 550 | | | 554 | |
| | Morgan Stanley | 6.250 | % | 8/9/26 | | 1,050 | | | 1,079 | |
| | Morgan Stanley | 7.250 | % | 4/1/32 | | 525 | | | 607 | |
| | National City Bank | 6.250 | % | 3/15/11 | | 400 | | | 417 | |
| | National City Corp. | 4.900 | % | 1/15/15 | | 325 | | | 333 | |
| | National City Corp. | 6.875 | % | 5/15/19 | | 225 | | | 243 | |
| 5 | Nationwide Building Society | 5.500 | % | 7/18/12 | | 1,500 | | | 1,601 | |
| 5 | Northern Rock PLC | 5.625 | % | 6/22/17 | | 2,950 | | | 2,827 | |
| | Northern Trust Co. | 6.500 | % | 8/15/18 | | 50 | | | 55 | |
| | Northern Trust Corp. | 5.500 | % | 8/15/13 | | 100 | | | 109 | |
| | Northern Trust Corp. | 4.625 | % | 5/1/14 | | 225 | | | 240 | |
| | PNC Bank NA | 4.875 | % | 9/21/17 | | 600 | | | 568 | |
| | PNC Funding Corp. | 5.125 | % | 12/14/10 | | 125 | | | 130 | |
| | PNC Funding Corp. | 5.250 | % | 11/15/15 | | 475 | | | 487 | |
| | PNC Funding Corp. | 5.625 | % | 2/1/17 | | 100 | | | 100 | |
| | PNC Funding Corp. | 6.700 | % | 6/10/19 | | 75 | | | 84 | |
| | Regions Financial Corp. | 7.750 | % | 11/10/14 | | 425 | | | 426 | |
| | Royal Bank of Scotland Group PLC | 6.400 | % | 10/21/19 | | 1,425 | | | 1,411 | |
| 5 | Royal Bank of Scotland PLC | 4.875 | % | 8/25/14 | | 700 | | | 703 | |
| | Santander Financial Issuances Ltd. | 6.375 | % | 2/15/11 | | 200 | | | 208 | |
| | SouthTrust Corp. | 5.800 | % | 6/15/14 | | 100 | | | 104 | |
| | Sovereign Bank | 8.750 | % | 5/30/18 | | 270 | | | 311 | |
| 3,5 | Standard Chartered PLC | 6.409 | % | 12/31/49 | | 300 | | | 243 | |
| | State Street Bank and Trust Co. | 5.300 | % | 1/15/16 | | 125 | | | 127 | |
| | State Street Corp. | 4.300 | % | 5/30/14 | | 400 | | | 416 | |
28
| | | | | | | | | |
| Institutional Total Bond Market Index Fund | | | | | | | | | |
| |
| |
| |
| | | | | | Face | | | Market | |
| | | | Maturity | | Amount | | | Value• | |
| | Coupon | | Date | ($ | 000 | ) | ($ | 000 | ) |
| Sumitomo Mitsui Banking Corp. | 8.000 | % | 6/15/12 | | 490 | | | 548 | |
| SunTrust Bank | 6.375 | % | 4/1/11 | | 100 | | | 104 | |
| SunTrust Bank | 7.250 | % | 3/15/18 | | 125 | | | 130 | |
| SunTrust Banks Inc. | 6.000 | % | 9/11/17 | | 350 | | | 347 | |
| SunTrust Banks Inc. | 6.000 | % | 2/15/26 | | 475 | | | 385 | |
| SunTrust Capital VIII | 6.100 | % | 12/15/36 | | 132 | | | 92 | |
| UBS AG | 7.000 | % | 10/15/15 | | 300 | | | 318 | |
| UBS AG | 5.875 | % | 7/15/16 | | 1,350 | | | 1,370 | |
| UBS AG | 7.375 | % | 6/15/17 | | 75 | | | 79 | |
| UBS AG | 5.875 | % | 12/20/17 | | 675 | | | 695 | |
| UBS AG | 5.750 | % | 4/25/18 | | 475 | | | 485 | |
| UFJ Finance Aruba AEC | 6.750 | % | 7/15/13 | | 1,350 | | | 1,482 | |
| Union Bank NA | 5.950 | % | 5/11/16 | | 225 | | | 225 | |
| Union Planters Corp. | 7.750 | % | 3/1/11 | | 500 | | | 490 | |
| UnionBanCal Corp. | 5.250 | % | 12/16/13 | | 50 | | | 51 | |
| US Bank NA | 6.375 | % | 8/1/11 | | 550 | | | 591 | |
| US Bank NA | 6.300 | % | 2/4/14 | | 875 | | | 966 | |
| US Bank NA | 4.950 | % | 10/30/14 | | 400 | | | 426 | |
| 3 USB Capital IX | 6.189 | % | 4/15/49 | | 300 | | | 241 | |
| USB Capital XIII Trust | 6.625 | % | 12/15/39 | | 175 | | | 176 | |
| Wachovia Bank NA | 4.875 | % | 2/1/15 | | 1,750 | | | 1,789 | |
| Wachovia Bank NA | 5.000 | % | 8/15/15 | | 75 | | | 76 | |
| Wachovia Bank NA | 6.000 | % | 11/15/17 | | 300 | | | 315 | |
| Wachovia Bank NA | 5.850 | % | 2/1/37 | | 1,425 | | | 1,377 | |
| Wachovia Bank NA | 6.600 | % | 1/15/38 | | 425 | | | 448 | |
| 3 Wachovia Capital Trust III | 5.800 | % | 3/15/11 | | 1,010 | | | 768 | |
| Wachovia Corp. | 5.300 | % | 10/15/11 | | 175 | | | 186 | |
| Wachovia Corp. | 4.875 | % | 2/15/14 | | 750 | | | 763 | |
| Wachovia Corp. | 5.250 | % | 8/1/14 | | 225 | | | 233 | |
| Wachovia Corp. | 5.625 | % | 10/15/16 | | 275 | | | 280 | |
| Wachovia Corp. | 5.750 | % | 6/15/17 | | 1,450 | | | 1,510 | |
| Wachovia Corp. | 7.500 | % | 4/15/35 | | 50 | | | 52 | |
| Wachovia Corp. | 5.500 | % | 8/1/35 | | 475 | | | 425 | |
| Wachovia Corp. | 6.550 | % | 10/15/35 | | 50 | | | 47 | |
| Wells Fargo & Co. | 4.200 | % | 1/15/10 | | 775 | | | 776 | |
| Wells Fargo & Co. | 4.875 | % | 1/12/11 | | 375 | | | 389 | |
| Wells Fargo & Co. | 5.300 | % | 8/26/11 | | 450 | | | 476 | |
| Wells Fargo & Co. | 5.125 | % | 9/1/12 | | 300 | | | 316 | |
| Wells Fargo & Co. | 5.250 | % | 10/23/12 | | 1,275 | | | 1,364 | |
| Wells Fargo & Co. | 4.375 | % | 1/31/13 | | 100 | | | 104 | |
| Wells Fargo & Co. | 4.950 | % | 10/16/13 | | 100 | | | 104 | |
| Wells Fargo & Co. | 5.625 | % | 12/11/17 | | 325 | | | 337 | |
| Wells Fargo & Co. | 5.375 | % | 2/7/35 | | 325 | | | 302 | |
| Wells Fargo Bank NA | 6.450 | % | 2/1/11 | | 500 | | | 525 | |
| Wells Fargo Bank NA | 4.750 | % | 2/9/15 | | 1,275 | | | 1,304 | |
| Wells Fargo Bank NA | 5.750 | % | 5/16/16 | | 1,500 | | | 1,536 | |
| Wells Fargo Bank NA | 5.950 | % | 8/26/36 | | 350 | | | 337 | |
| Wells Fargo Capital X | 5.950 | % | 12/15/36 | | 50 | | | 43 | |
| 3 Wells Fargo Capital XIII | 7.700 | % | 12/29/49 | | 400 | | | 388 | |
| 3 Wells Fargo Capital XV | 9.750 | % | 12/29/49 | | 425 | | | 459 | |
| Wells Fargo Financial Inc. | 5.500 | % | 8/1/12 | | 300 | | | 321 | |
| Westpac Banking Corp. | 2.250 | % | 11/19/12 | | 550 | | | 548 | |
| Westpac Banking Corp. | 4.200 | % | 2/27/15 | | 825 | | | 838 | |
| Westpac Banking Corp. | 4.875 | % | 11/19/19 | | 525 | | | 518 | |
29
| | | | | | | | | |
| Institutional Total Bond Market Index Fund | | | | | | | | | |
| |
| |
| |
| | | | | | Face | | | Market | |
| | | | Maturity | | Amount | | | Value• | |
| | Coupon | | Date | ($ | 000 | ) | ($ | 000 | ) |
| Brokerage (0.1%) | | | | | | | | | |
| Ameriprise Financial Inc. | 5.650 | % | 11/15/15 | | 375 | | | 398 | |
| BlackRock Inc. | 2.250 | % | 12/10/12 | | 300 | | | 299 | |
| BlackRock Inc. | 3.500 | % | 12/10/14 | | 200 | | | 198 | |
| BlackRock Inc. | 6.250 | % | 9/15/17 | | 225 | | | 242 | |
| BlackRock Inc. | 5.000 | % | 12/10/19 | | 75 | | | 74 | |
| Charles Schwab Corp. | 4.950 | % | 6/1/14 | | 700 | | | 740 | |
| Invesco Ltd. | 5.375 | % | 2/27/13 | | 25 | | | 25 | |
| Jefferies Group Inc. | 8.500 | % | 7/15/19 | | 325 | | | 348 | |
| Jefferies Group Inc. | 6.450 | % | 6/8/27 | | 475 | | | 399 | |
| Jefferies Group Inc. | 6.250 | % | 1/15/36 | | 400 | | | 317 | |
| Lazard Group LLC | 6.850 | % | 6/15/17 | | 775 | | | 780 | |
| TD Ameritrade Holding Corp. | 2.950 | % | 12/1/12 | | 100 | | | 99 | |
| TD Ameritrade Holding Corp. | 4.150 | % | 12/1/14 | | 175 | | | 173 | |
| TD Ameritrade Holding Corp. | 5.600 | % | 12/1/19 | | 125 | | | 124 | |
| |
| Finance Companies (0.9%) | | | | | | | | | |
| Block Financial LLC | 7.875 | % | 1/15/13 | | 100 | | | 111 | |
| GATX Corp. | 4.750 | % | 10/1/12 | | 150 | | | 154 | |
| General Electric Capital Corp. | 5.200 | % | 2/1/11 | | 125 | | | 130 | |
| General Electric Capital Corp. | 6.125 | % | 2/22/11 | | 645 | | | 681 | |
| General Electric Capital Corp. | 5.500 | % | 4/28/11 | | 325 | | | 342 | |
| General Electric Capital Corp. | 5.000 | % | 11/15/11 | | 275 | | | 291 | |
| General Electric Capital Corp. | 4.375 | % | 11/21/11 | | 100 | | | 104 | |
| General Electric Capital Corp. | 5.875 | % | 2/15/12 | | 1,575 | | | 1,688 | |
| General Electric Capital Corp. | 4.375 | % | 3/3/12 | | 675 | | | 701 | |
| General Electric Capital Corp. | 6.000 | % | 6/15/12 | | 2,375 | | | 2,564 | |
| General Electric Capital Corp. | 3.500 | % | 8/13/12 | | 900 | | | 917 | |
| General Electric Capital Corp. | 5.250 | % | 10/19/12 | | 3,600 | | | 3,834 | |
| General Electric Capital Corp. | 5.450 | % | 1/15/13 | | 500 | | | 533 | |
| General Electric Capital Corp. | 4.800 | % | 5/1/13 | | 400 | | | 419 | |
| General Electric Capital Corp. | 5.900 | % | 5/13/14 | | 325 | | | 354 | |
| General Electric Capital Corp. | 5.500 | % | 6/4/14 | | 1,325 | | | 1,408 | |
| General Electric Capital Corp. | 5.650 | % | 6/9/14 | | 350 | | | 375 | |
| General Electric Capital Corp. | 3.750 | % | 11/14/14 | | 700 | | | 695 | |
| General Electric Capital Corp. | 5.400 | % | 2/15/17 | | 1,075 | | | 1,092 | |
| General Electric Capital Corp. | 5.625 | % | 9/15/17 | | 250 | | | 251 | |
| General Electric Capital Corp. | 5.625 | % | 5/1/18 | | 325 | | | 332 | |
| General Electric Capital Corp. | 6.000 | % | 8/7/19 | | 1,500 | | | 1,557 | |
| General Electric Capital Corp. | 6.750 | % | 3/15/32 | | 1,350 | | | 1,376 | |
| General Electric Capital Corp. | 6.150 | % | 8/7/37 | | 925 | | | 877 | |
| General Electric Capital Corp. | 5.875 | % | 1/14/38 | | 3,050 | | | 2,829 | |
| General Electric Capital Corp. | 6.875 | % | 1/10/39 | | 675 | | | 696 | |
| 3 General Electric Capital Corp. | 6.375 | % | 11/15/67 | | 725 | | | 631 | |
| 3 HSBC Finance Capital Trust IX | 5.911 | % | 11/30/35 | | 50 | | | 41 | |
| HSBC Finance Corp. | 5.250 | % | 1/14/11 | | 675 | | | 702 | |
| HSBC Finance Corp. | 5.700 | % | 6/1/11 | | 1,150 | | | 1,202 | |
| HSBC Finance Corp. | 6.375 | % | 10/15/11 | | 50 | | | 53 | |
| HSBC Finance Corp. | 7.000 | % | 5/15/12 | | 645 | | | 702 | |
| HSBC Finance Corp. | 5.900 | % | 6/19/12 | | 300 | | | 320 | |
| HSBC Finance Corp. | 6.375 | % | 11/27/12 | | 295 | | | 323 | |
| HSBC Finance Corp. | 4.750 | % | 7/15/13 | | 150 | | | 156 | |
| HSBC Finance Corp. | 5.250 | % | 1/15/14 | | 375 | | | 393 | |
| HSBC Finance Corp. | 5.000 | % | 6/30/15 | | 2,075 | | | 2,153 | |
| International Lease Finance Corp. | 4.950 | % | 2/1/11 | | 825 | | | 767 | |
| International Lease Finance Corp. | 5.450 | % | 3/24/11 | | 150 | | | 138 | |
30
| | | | | | | | | |
| Institutional Total Bond Market Index Fund | | | | | | | | | |
| |
| |
| |
| | | | | | Face | | | Market | |
| | | | Maturity | | Amount | | | Value• | |
| | Coupon | | Date | ($ | 000 | ) | ($ | 000 | ) |
| International Lease Finance Corp. | 5.750 | % | 6/15/11 | | 1,075 | | | 984 | |
| International Lease Finance Corp. | 5.300 | % | 5/1/12 | | 225 | | | 191 | |
| International Lease Finance Corp. | 5.625 | % | 9/20/13 | | 225 | | | 176 | |
| International Lease Finance Corp. | 5.650 | % | 6/1/14 | | 325 | | | 247 | |
| SLM Corp. | 5.400 | % | 10/25/11 | | 1,800 | | | 1,799 | |
| SLM Corp. | 5.000 | % | 10/1/13 | | 85 | | | 78 | |
| SLM Corp. | 5.375 | % | 5/15/14 | | 110 | | | 100 | |
| SLM Corp. | 5.050 | % | 11/14/14 | | 360 | | | 325 | |
| SLM Corp. | 5.000 | % | 4/15/15 | | 10 | | | 9 | |
| SLM Corp. | 5.625 | % | 8/1/33 | | 495 | | | 376 | |
| |
| Insurance (1.0%) | | | | | | | | | |
| ACE Capital Trust II | 9.700 | % | 4/1/30 | | 360 | | | 411 | |
| ACE INA Holdings Inc. | 5.600 | % | 5/15/15 | | 125 | | | 137 | |
| ACE INA Holdings Inc. | 5.700 | % | 2/15/17 | | 505 | | | 536 | |
| AEGON Funding Co. LLC | 5.750 | % | 12/15/20 | | 50 | | | 46 | |
| Aegon NV | 4.750 | % | 6/1/13 | | 200 | | | 204 | |
| Aetna Inc. | 7.875 | % | 3/1/11 | | 50 | | | 53 | |
| Aetna Inc. | 5.750 | % | 6/15/11 | | 125 | | | 131 | |
| Aetna Inc. | 6.000 | % | 6/15/16 | | 50 | | | 52 | |
| Aetna Inc. | 6.500 | % | 9/15/18 | | 275 | | | 295 | |
| Aetna Inc. | 6.625 | % | 6/15/36 | | 875 | | | 880 | |
| Aflac Inc. | 6.900 | % | 12/17/39 | | 75 | | | 74 | |
| Allied World Assurance Co. Holdings Ltd. | 7.500 | % | 8/1/16 | | 1,060 | | | 1,097 | |
| Allstate Corp. | 6.125 | % | 2/15/12 | | 225 | | | 244 | |
| Allstate Corp. | 5.000 | % | 8/15/14 | | 575 | | | 607 | |
| Allstate Corp. | 6.125 | % | 12/15/32 | | 225 | | | 223 | |
| Allstate Corp. | 5.550 | % | 5/9/35 | | 100 | | | 94 | |
| 3 Allstate Corp. | 6.125 | % | 5/15/37 | | 150 | | | 132 | |
| 3 Allstate Corp. | 6.500 | % | 5/15/57 | | 200 | | | 167 | |
| Allstate Life Global Funding Trusts | 5.375 | % | 4/30/13 | | 375 | | | 401 | |
| American Financial Group Inc. | 9.875 | % | 6/15/19 | | 125 | | | 140 | |
| American International Group Inc. | 5.375 | % | 10/18/11 | | 225 | | | 226 | |
| American International Group Inc. | 4.950 | % | 3/20/12 | | 225 | | | 218 | |
| American International Group Inc. | 4.250 | % | 5/15/13 | | 600 | | | 558 | |
| American International Group Inc. | 5.050 | % | 10/1/15 | | 1,025 | | | 852 | |
| American International Group Inc. | 5.600 | % | 10/18/16 | | 550 | | | 451 | |
| American International Group Inc. | 5.850 | % | 1/16/18 | | 25 | | | 21 | |
| American International Group Inc. | 6.250 | % | 5/1/36 | | 150 | | | 110 | |
| AON Corp. | 8.205 | % | 1/1/27 | | 50 | | | 50 | |
| Arch Capital Group Ltd. | 7.350 | % | 5/1/34 | | 350 | | | 339 | |
| Assurant Inc. | 5.625 | % | 2/15/14 | | 225 | | | 228 | |
| Assurant Inc. | 6.750 | % | 2/15/34 | | 465 | | | 416 | |
| AXA SA | 8.600 | % | 12/15/30 | | 770 | | | 874 | |
| Axis Capital Holdings Ltd. | 5.750 | % | 12/1/14 | | 75 | | | 76 | |
| Berkshire Hathaway Finance Corp. | 4.200 | % | 12/15/10 | | 100 | | | 103 | |
| Berkshire Hathaway Finance Corp. | 4.000 | % | 4/15/12 | | 100 | | | 104 | |
| Berkshire Hathaway Finance Corp. | 5.000 | % | 8/15/13 | | 775 | | | 831 | |
| Berkshire Hathaway Finance Corp. | 5.400 | % | 5/15/18 | | 1,450 | | | 1,511 | |
| Chubb Corp. | 5.750 | % | 5/15/18 | | 150 | | | 160 | |
| Chubb Corp. | 6.000 | % | 5/11/37 | | 550 | | | 569 | |
| Chubb Corp. | 6.500 | % | 5/15/38 | | 125 | | | 137 | |
| 3 Chubb Corp. | 6.375 | % | 3/29/67 | | 125 | | | 116 | |
| CIGNA Corp. | 7.875 | % | 5/15/27 | | 50 | | | 50 | |
| CIGNA Corp. | 6.150 | % | 11/15/36 | | 475 | | | 415 | |
| Cincinnati Financial Corp. | 6.920 | % | 5/15/28 | | 175 | | | 164 | |
31
| | | | | | | | | |
| Institutional Total Bond Market Index Fund | | | | | | | | | |
| |
| |
| |
| | | | | | Face | | | Market | |
| | | | Maturity | | Amount | | | Value• | |
| | Coupon | | Date | ($ | 000 | ) | ($ | 000 | ) |
| Cincinnati Financial Corp. | 6.125 | % | 11/1/34 | | 150 | | | 133 | |
| CNA Financial Corp. | 6.000 | % | 8/15/11 | | 100 | | | 102 | |
| CNA Financial Corp. | 5.850 | % | 12/15/14 | | 750 | | | 739 | |
| CNA Financial Corp. | 6.500 | % | 8/15/16 | | 200 | | | 194 | |
| CNA Financial Corp. | 7.350 | % | 11/15/19 | | 25 | | | 25 | |
| Commerce Group Inc. | 5.950 | % | 12/9/13 | | 50 | | | 50 | |
| Coventry Health Care Inc. | 6.300 | % | 8/15/14 | | 700 | | | 685 | |
| Genworth Financial Inc. | 5.750 | % | 6/15/14 | | 75 | | | 72 | |
| Genworth Financial Inc. | 4.950 | % | 10/1/15 | | 50 | | | 46 | |
| Genworth Financial Inc. | 8.625 | % | 12/15/16 | | 100 | | | 104 | |
| Genworth Financial Inc. | 6.500 | % | 6/15/34 | | 150 | | | 122 | |
| Genworth Global Funding Trusts | 5.125 | % | 3/15/11 | | 300 | | | 304 | |
| Hartford Financial Services Group Inc. | 5.250 | % | 10/15/11 | | 275 | | | 284 | |
| Hartford Financial Services Group Inc. | 5.500 | % | 10/15/16 | | 175 | | | 167 | |
| Hartford Financial Services Group Inc. | 5.375 | % | 3/15/17 | | 125 | | | 121 | |
| Hartford Financial Services Group Inc. | 6.000 | % | 1/15/19 | | 100 | | | 97 | |
| Hartford Financial Services Group Inc. | 6.100 | % | 10/1/41 | | 600 | | | 473 | |
| HCC Insurance Holdings Inc. | 6.300 | % | 11/15/19 | | 250 | | | 253 | |
| Humana Inc. | 6.450 | % | 6/1/16 | | 175 | | | 177 | |
| Humana Inc. | 6.300 | % | 8/1/18 | | 50 | | | 48 | |
| Humana Inc. | 8.150 | % | 6/15/38 | | 300 | | | 286 | |
| 5 Liberty Mutual Group Inc. | 4.875 | % | 2/1/10 | | 100 | | | 100 | |
| Lincoln National Corp. | 5.650 | % | 8/27/12 | | 50 | | | 52 | |
| Lincoln National Corp. | 6.150 | % | 4/7/36 | | 675 | | | 594 | |
| Loews Corp. | 6.000 | % | 2/1/35 | | 75 | | | 71 | |
| Markel Corp. | 7.125 | % | 9/30/19 | | 125 | | | 128 | |
| Marsh & McLennan Cos. Inc. | 5.150 | % | 9/15/10 | | 50 | | | 51 | |
| Marsh & McLennan Cos. Inc. | 6.250 | % | 3/15/12 | | 400 | | | 423 | |
| Marsh & McLennan Cos. Inc. | 5.750 | % | 9/15/15 | | 325 | | | 339 | |
| Marsh & McLennan Cos. Inc. | 9.250 | % | 4/15/19 | | 300 | | | 368 | |
| MetLife Inc. | 5.375 | % | 12/15/12 | | 150 | | | 160 | |
| MetLife Inc. | 5.000 | % | 11/24/13 | | 100 | | | 105 | |
| MetLife Inc. | 5.000 | % | 6/15/15 | | 500 | | | 529 | |
| MetLife Inc. | 7.717 | % | 2/15/19 | | 125 | | | 146 | |
| MetLife Inc. | 6.375 | % | 6/15/34 | | 350 | | | 375 | |
| MetLife Inc. | 5.700 | % | 6/15/35 | | 125 | | | 124 | |
| MetLife Inc. | 6.400 | % | 12/15/36 | | 435 | | | 381 | |
| 5 Metropolitan Life Global Funding I | 2.875 | % | 9/17/12 | | 200 | | | 202 | |
| 5 Metropolitan Life Global Funding I | 5.125 | % | 6/10/14 | | 775 | | | 820 | |
| OneBeacon US Holdings Inc. | 5.875 | % | 5/15/13 | | 100 | | | 99 | |
| Principal Financial Group Inc. | 7.875 | % | 5/15/14 | | 450 | | | 504 | |
| Principal Financial Group Inc. | 6.050 | % | 10/15/36 | | 225 | | | 199 | |
| Principal Life Income Funding Trusts | 5.300 | % | 4/24/13 | | 300 | | | 317 | |
| Principal Life Income Funding Trusts | 5.100 | % | 4/15/14 | | 150 | | | 154 | |
| Progressive Corp. | 6.375 | % | 1/15/12 | | 225 | | | 242 | |
| Progressive Corp. | 6.625 | % | 3/1/29 | | 100 | | | 102 | |
| 3 Progressive Corp. | 6.700 | % | 6/15/37 | | 300 | | | 266 | |
| Protective Life Corp. | 7.375 | % | 10/15/19 | | 100 | | | 100 | |
| Protective Life Corp. | 8.450 | % | 10/15/39 | | 75 | | | 72 | |
| Protective Life Secured Trusts | 4.850 | % | 8/16/10 | | 225 | | | 230 | |
| Prudential Financial Inc. | 5.100 | % | 12/14/11 | | 35 | | | 37 | |
| Prudential Financial Inc. | 5.800 | % | 6/15/12 | | 325 | | | 345 | |
| Prudential Financial Inc. | 3.625 | % | 9/17/12 | | 300 | | | 307 | |
| Prudential Financial Inc. | 5.150 | % | 1/15/13 | | 345 | | | 364 | |
| Prudential Financial Inc. | 4.500 | % | 7/15/13 | | 100 | | | 101 | |
| Prudential Financial Inc. | 4.750 | % | 4/1/14 | | 175 | | | 180 | |
32
| | | | | | | | | |
| Institutional Total Bond Market Index Fund | | | | | | | | | |
| |
| |
| |
| | | | | | Face | | | Market | |
| | | | Maturity | | Amount | | | Value• | |
| | Coupon | | Date | ($ | 000 | ) | ($ | 000 | ) |
| Prudential Financial Inc. | 5.100 | % | 9/20/14 | | 375 | | | 391 | |
| Prudential Financial Inc. | 6.200 | % | 1/15/15 | | 625 | | | 670 | |
| Prudential Financial Inc. | 5.500 | % | 3/15/16 | | 50 | | | 51 | |
| Prudential Financial Inc. | 6.100 | % | 6/15/17 | | 75 | | | 77 | |
| Prudential Financial Inc. | 6.000 | % | 12/1/17 | | 225 | | | 231 | |
| Prudential Financial Inc. | 5.750 | % | 7/15/33 | | 200 | | | 180 | |
| Prudential Financial Inc. | 5.400 | % | 6/13/35 | | 200 | | | 171 | |
| Prudential Financial Inc. | 5.900 | % | 3/17/36 | | 300 | | | 278 | |
| Prudential Financial Inc. | 5.700 | % | 12/14/36 | | 225 | | | 203 | |
| Swiss Re Solutions Holding Corp. | 6.450 | % | 3/1/19 | | 225 | | | 224 | |
| Swiss Re Solutions Holding Corp. | 7.000 | % | 2/15/26 | | 200 | | | 197 | |
| Swiss Re Solutions Holding Corp. | 7.750 | % | 6/15/30 | | 150 | | | 152 | |
| Torchmark Corp. | 6.375 | % | 6/15/16 | | 225 | | | 226 | |
| Transatlantic Holdings Inc. | 8.000 | % | 11/30/39 | | 350 | | | 351 | |
| Travelers Cos. Inc. | 5.500 | % | 12/1/15 | | 150 | | | 162 | |
| Travelers Cos. Inc. | 6.250 | % | 6/20/16 | | 375 | | | 409 | |
| Travelers Cos. Inc. | 5.750 | % | 12/15/17 | | 325 | | | 343 | |
| Travelers Cos. Inc. | 5.900 | % | 6/2/19 | | 275 | | | 299 | |
| 3 Travelers Cos. Inc. | 6.250 | % | 3/15/37 | | 135 | | | 122 | |
| Travelers Cos. Inc. | 6.250 | % | 6/15/37 | | 250 | | | 263 | |
| UnitedHealth Group Inc. | 5.500 | % | 11/15/12 | | 50 | | | 54 | |
| UnitedHealth Group Inc. | 4.875 | % | 2/15/13 | | 275 | | | 289 | |
| UnitedHealth Group Inc. | 4.875 | % | 4/1/13 | | 250 | | | 263 | |
| UnitedHealth Group Inc. | 5.000 | % | 8/15/14 | | 100 | | | 105 | |
| UnitedHealth Group Inc. | 4.875 | % | 3/15/15 | | 250 | | | 259 | |
| UnitedHealth Group Inc. | 6.000 | % | 6/15/17 | | 525 | | | 547 | |
| UnitedHealth Group Inc. | 6.000 | % | 11/15/17 | | 100 | | | 104 | |
| UnitedHealth Group Inc. | 5.800 | % | 3/15/36 | | 1,000 | | | 893 | |
| UnitedHealth Group Inc. | 6.500 | % | 6/15/37 | | 150 | | | 147 | |
| UnitedHealth Group Inc. | 6.625 | % | 11/15/37 | | 300 | | | 305 | |
| UnitedHealth Group Inc. | 6.875 | % | 2/15/38 | | 325 | | | 337 | |
| Unum Group | 7.125 | % | 9/30/16 | | 200 | | | 207 | |
| WellPoint Health Networks Inc. | 6.375 | % | 1/15/12 | | 125 | | | 135 | |
| WellPoint Inc. | 5.000 | % | 1/15/11 | | 475 | | | 493 | |
| WellPoint Inc. | 6.000 | % | 2/15/14 | | 150 | | | 163 | |
| WellPoint Inc. | 5.000 | % | 12/15/14 | | 225 | | | 234 | |
| WellPoint Inc. | 5.250 | % | 1/15/16 | | 50 | | | 50 | |
| WellPoint Inc. | 5.875 | % | 6/15/17 | | 20 | | | 21 | |
| WellPoint Inc. | 5.950 | % | 12/15/34 | | 550 | | | 521 | |
| WellPoint Inc. | 5.850 | % | 1/15/36 | | 725 | | | 678 | |
| Willis North America Inc. | 5.625 | % | 7/15/15 | | 225 | | | 221 | |
| Willis North America Inc. | 6.200 | % | 3/28/17 | | 370 | | | 355 | |
| XL Capital Ltd. | 5.250 | % | 9/15/14 | | 475 | | | 473 | |
| XL Capital Ltd. | 6.375 | % | 11/15/24 | | 50 | | | 45 | |
| XL Capital Ltd. | 6.250 | % | 5/15/27 | | 400 | | | 361 | |
| 3 XL Capital Ltd. | 6.500 | % | 12/15/49 | | 225 | | | 171 | |
| |
| Other Finance (0.0%) | | | | | | | | | |
| CME Group Inc. | 5.400 | % | 8/1/13 | | 500 | | | 536 | |
| CME Group Inc. | 5.750 | % | 2/15/14 | | 175 | | | 191 | |
| ORIX Corp. | 5.480 | % | 11/22/11 | | 325 | | | 326 | |
| XTRA Finance Corp. | 5.150 | % | 4/1/17 | | 900 | | | 915 | |
| |
| Real Estate Investment Trusts (0.3%) | | | | | | | | | |
| AMB Property LP | 6.625 | % | 12/1/19 | | 150 | | | 147 | |
| Arden Realty LP | 5.250 | % | 3/1/15 | | 50 | | | 52 | |
33
| | | | | | | | | |
| Institutional Total Bond Market Index Fund | | | | | | | | | |
| |
| |
| |
| | | | | | Face | | | Market | |
| | | | Maturity | | Amount | | | Value• | |
| | Coupon | | Date | ($ | 000 | ) | ($ | 000 | ) |
| AvalonBay Communities Inc. | 5.500 | % | 1/15/12 | | 66 | | | 69 | |
| AvalonBay Communities Inc. | 5.750 | % | 9/15/16 | | 50 | | | 51 | |
| Boston Properties LP | 6.250 | % | 1/15/13 | | 250 | | | 267 | |
| Boston Properties LP | 5.625 | % | 4/15/15 | | 150 | | | 154 | |
| Brandywine Operating Partnership LP | 5.750 | % | 4/1/12 | | 137 | | | 138 | |
| Brandywine Operating Partnership LP | 5.400 | % | 11/1/14 | | 50 | | | 47 | |
| Brandywine Operating Partnership LP | 5.700 | % | 5/1/17 | | 305 | | | 274 | |
| Camden Property Trust | 5.700 | % | 5/15/17 | | 225 | | | 215 | |
| Duke Realty LP | 6.250 | % | 5/15/13 | | 400 | | | 409 | |
| Duke Realty LP | 7.375 | % | 2/15/15 | | 150 | | | 159 | |
| Duke Realty LP | 5.950 | % | 2/15/17 | | 100 | | | 93 | |
| Duke Realty LP | 8.250 | % | 8/15/19 | | 125 | | | 131 | |
| ERP Operating LP | 6.625 | % | 3/15/12 | | 75 | | | 80 | |
| ERP Operating LP | 5.500 | % | 10/1/12 | | 300 | | | 316 | |
| ERP Operating LP | 5.125 | % | 3/15/16 | | 475 | | | 463 | |
| ERP Operating LP | 5.375 | % | 8/1/16 | | 100 | | | 98 | |
| ERP Operating LP | 5.750 | % | 6/15/17 | | 200 | | | 200 | |
| HCP Inc. | 6.450 | % | 6/25/12 | | 775 | | | 806 | |
| HCP Inc. | 5.650 | % | 12/15/13 | | 105 | | | 105 | |
| HCP Inc. | 6.300 | % | 9/15/16 | | 165 | | | 162 | |
| HCP Inc. | 6.700 | % | 1/30/18 | | 175 | | | 170 | |
| Health Care REIT Inc. | 6.200 | % | 6/1/16 | | 725 | | | 709 | |
| Healthcare Realty Trust Inc. | 6.500 | % | 1/17/17 | | 250 | | | 244 | |
| Hospitality Properties Trust | 7.875 | % | 8/15/14 | | 200 | | | 207 | |
| Hospitality Properties Trust | 5.125 | % | 2/15/15 | | 300 | | | 271 | |
| HRPT Properties Trust | 6.250 | % | 8/15/16 | | 100 | | | 95 | |
| HRPT Properties Trust | 6.250 | % | 6/15/17 | | 275 | | | 248 | |
| Kimco Realty Corp. | 5.783 | % | 3/15/16 | | 50 | | | 50 | |
| Kimco Realty Corp. | 6.875 | % | 10/1/19 | | 150 | | | 153 | |
| Liberty Property LP | 5.125 | % | 3/2/15 | | 875 | | | 831 | |
| Liberty Property LP | 5.500 | % | 12/15/16 | | 75 | | | 69 | |
| Mack-Cali Realty LP | 7.750 | % | 8/15/19 | | 125 | | | 130 | |
| National Retail Properties Inc. | 6.875 | % | 10/15/17 | | 200 | | | 193 | |
| Nationwide Health Properties Inc. | 6.250 | % | 2/1/13 | | 300 | | | 307 | |
| ProLogis | 5.625 | % | 11/15/15 | | 325 | | | 309 | |
| ProLogis | 5.750 | % | 4/1/16 | | 225 | | | 211 | |
| ProLogis | 5.625 | % | 11/15/16 | | 225 | | | 208 | |
| ProLogis | 7.375 | % | 10/30/19 | | 100 | | | 99 | |
| Realty Income Corp. | 6.750 | % | 8/15/19 | | 860 | | | 841 | |
| Regency Centers LP | 6.750 | % | 1/15/12 | | 600 | | | 630 | |
| Simon Property Group LP | 4.875 | % | 8/15/10 | | 125 | | | 127 | |
| Simon Property Group LP | 5.600 | % | 9/1/11 | | 225 | | | 236 | |
| Simon Property Group LP | 5.000 | % | 3/1/12 | | 150 | | | 155 | |
| Simon Property Group LP | 5.300 | % | 5/30/13 | | 610 | | | 629 | |
| Simon Property Group LP | 6.750 | % | 5/15/14 | | 775 | | | 826 | |
| Simon Property Group LP | 5.750 | % | 12/1/15 | | 425 | | | 433 | |
| Simon Property Group LP | 6.100 | % | 5/1/16 | | 50 | | | 51 | |
| Simon Property Group LP | 5.875 | % | 3/1/17 | | 425 | | | 429 | |
| Simon Property Group LP | 6.125 | % | 5/30/18 | | 425 | | | 432 | |
| Tanger Properties LP | 6.150 | % | 11/15/15 | | 225 | | | 220 | |
| | | | | | | | | 289,620 | |
| Industrial (10.0%) | | | | | | | | | |
| Basic Industry (0.9%) | | | | | | | | | |
| Agrium Inc. | 6.750 | % | 1/15/19 | | 100 | | | 107 | |
| Airgas Inc. | 4.500 | % | 9/15/14 | | 125 | | | 127 | |
| Alcoa Inc. | 5.720 | % | 2/23/19 | | 790 | | | 764 | |
34
| | | | | | | | | |
| Institutional Total Bond Market Index Fund | | | | | | | | | |
| |
| |
| |
| | | | | | Face | | | Market | |
| | | | Maturity | | Amount | | | Value• | |
| | Coupon | | Date | ($ | 000 | ) | ($ | 000 | ) |
| Alcoa Inc. | 5.870 | % | 2/23/22 | | 185 | | | 172 | |
| Alcoa Inc. | 5.900 | % | 2/1/27 | | 450 | | | 402 | |
| Alcoa Inc. | 5.950 | % | 2/1/37 | | 500 | | | 432 | |
| ArcelorMittal | 5.375 | % | 6/1/13 | | 825 | | | 865 | |
| ArcelorMittal | 9.000 | % | 2/15/15 | | 225 | | | 262 | |
| ArcelorMittal | 6.125 | % | 6/1/18 | | 350 | | | 358 | |
| ArcelorMittal | 9.850 | % | 6/1/19 | | 175 | | | 225 | |
| ArcelorMittal | 7.000 | % | 10/15/39 | | 350 | | | 369 | |
| Barrick Australian Finance Pty Ltd. | 5.950 | % | 10/15/39 | | 600 | | | 586 | |
| Barrick Gold Corp. | 6.950 | % | 4/1/19 | | 150 | | | 170 | |
| Barrick Gold Finance Co. | 4.875 | % | 11/15/14 | | 100 | | | 105 | |
| Barrick North America Finance LLC | 6.800 | % | 9/15/18 | | 225 | | | 251 | |
| Barrick North America Finance LLC | 7.500 | % | 9/15/38 | | 300 | | | 346 | |
| BHP Billiton Finance USA Ltd. | 8.500 | % | 12/1/12 | | 125 | | | 146 | |
| BHP Billiton Finance USA Ltd. | 4.800 | % | 4/15/13 | | 325 | | | 345 | |
| BHP Billiton Finance USA Ltd. | 5.500 | % | 4/1/14 | | 765 | | | 839 | |
| BHP Billiton Finance USA Ltd. | 5.250 | % | 12/15/15 | | 325 | | | 352 | |
| BHP Billiton Finance USA Ltd. | 5.400 | % | 3/29/17 | | 135 | | | 144 | |
| BHP Billiton Finance USA Ltd. | 6.500 | % | 4/1/19 | | 450 | | | 517 | |
| Celulosa Arauco y Constitucion SA | 5.625 | % | 4/20/15 | | 350 | | | 367 | |
| Commercial Metals Co. | 6.500 | % | 7/15/17 | | 125 | | | 127 | |
| Commercial Metals Co. | 7.350 | % | 8/15/18 | | 350 | | | 373 | |
| Cytec Industries Inc. | 8.950 | % | 7/1/17 | | 100 | | | 119 | |
| Dow Chemical Co. | 6.125 | % | 2/1/11 | | 675 | | | 705 | |
| Dow Chemical Co. | 4.850 | % | 8/15/12 | | 550 | | | 578 | |
| Dow Chemical Co. | 6.000 | % | 10/1/12 | | 50 | | | 54 | |
| Dow Chemical Co. | 7.600 | % | 5/15/14 | | 675 | | | 768 | |
| Dow Chemical Co. | 5.900 | % | 2/15/15 | | 1,675 | | | 1,802 | |
| Dow Chemical Co. | 8.550 | % | 5/15/19 | | 700 | | | 835 | |
| Dow Chemical Co. | 7.375 | % | 11/1/29 | | 500 | | | 543 | |
| Dow Chemical Co. | 9.400 | % | 5/15/39 | | 125 | | | 167 | |
| Eastman Chemical Co. | 7.250 | % | 1/15/24 | | 225 | | | 244 | |
| Eastman Chemical Co. | 7.600 | % | 2/1/27 | | 125 | | | 137 | |
| EI du Pont de Nemours & Co. | 4.750 | % | 11/15/12 | | 425 | | | 458 | |
| EI du Pont de Nemours & Co. | 5.000 | % | 1/15/13 | | 50 | | | 54 | |
| EI du Pont de Nemours & Co. | 5.000 | % | 7/15/13 | | 525 | | | 569 | |
| EI du Pont de Nemours & Co. | 5.875 | % | 1/15/14 | | 225 | | | 249 | |
| EI du Pont de Nemours & Co. | 5.250 | % | 12/15/16 | | 50 | | | 53 | |
| EI du Pont de Nemours & Co. | 6.000 | % | 7/15/18 | | 1,275 | | | 1,394 | |
| EI du Pont de Nemours & Co. | 6.500 | % | 1/15/28 | | 75 | | | 81 | |
| Freeport-McMoRan Copper & Gold Inc. | 8.250 | % | 4/1/15 | | 770 | | | 834 | |
| Freeport-McMoRan Copper & Gold Inc. | 8.375 | % | 4/1/17 | | 825 | | | 902 | |
| International Paper Co. | 5.300 | % | 4/1/15 | | 225 | | | 231 | |
| International Paper Co. | 9.375 | % | 5/15/19 | | 600 | | | 745 | |
| International Paper Co. | 7.500 | % | 8/15/21 | | 1,325 | | | 1,479 | |
| International Paper Co. | 7.300 | % | 11/15/39 | | 325 | | | 344 | |
| Lubrizol Corp. | 8.875 | % | 2/1/19 | | 850 | | | 1,047 | |
| Lubrizol Corp. | 6.500 | % | 10/1/34 | | 750 | | | 770 | |
| Monsanto Co. | 7.375 | % | 8/15/12 | | 225 | | | 255 | |
| Newmont Mining Corp. | 5.125 | % | 10/1/19 | | 900 | | | 903 | |
| Newmont Mining Corp. | 5.875 | % | 4/1/35 | | 100 | | | 95 | |
| Newmont Mining Corp. | 6.250 | % | 10/1/39 | | 275 | | | 276 | |
| Nucor Corp. | 5.750 | % | 12/1/17 | | 100 | | | 107 | |
| Nucor Corp. | 5.850 | % | 6/1/18 | | 325 | | | 350 | |
| Nucor Corp. | 6.400 | % | 12/1/37 | | 225 | | | 243 | |
| Placer Dome Inc. | 6.450 | % | 10/15/35 | | 425 | | | 426 | |
35
| | | | | | | | | |
| Institutional Total Bond Market Index Fund | | | | | | | | | |
| |
| |
| |
| | | | | | Face | | | Market | |
| | | | Maturity | | Amount | | | Value• | |
| | Coupon | | Date | ($ | 000 | ) | ($ | 000 | ) |
| Plum Creek Timberlands LP | 5.875 | % | 11/15/15 | | 225 | | | 230 | |
| Potash Corp. of Saskatchewan Inc. | 7.750 | % | 5/31/11 | | 775 | | | 840 | |
| Potash Corp. of Saskatchewan Inc. | 3.750 | % | 9/30/15 | | 300 | | | 299 | |
| Potash Corp. of Saskatchewan Inc. | 4.875 | % | 3/30/20 | | 300 | | | 294 | |
| PPG Industries Inc. | 6.650 | % | 3/15/18 | | 675 | | | 735 | |
| Praxair Inc. | 1.750 | % | 11/15/12 | | 125 | | | 124 | |
| Praxair Inc. | 4.375 | % | 3/31/14 | | 375 | | | 396 | |
| Praxair Inc. | 5.250 | % | 11/15/14 | | 325 | | | 355 | |
| Praxair Inc. | 5.200 | % | 3/15/17 | | 25 | | | 26 | |
| Praxair Inc. | 4.500 | % | 8/15/19 | | 150 | | | 151 | |
| Rio Tinto Alcan Inc. | 6.450 | % | 3/15/11 | | 250 | | | 262 | |
| Rio Tinto Alcan Inc. | 4.875 | % | 9/15/12 | | 300 | | | 317 | |
| Rio Tinto Alcan Inc. | 4.500 | % | 5/15/13 | | 225 | | | 231 | |
| Rio Tinto Alcan Inc. | 5.000 | % | 6/1/15 | | 50 | | | 51 | |
| Rio Tinto Alcan Inc. | 6.125 | % | 12/15/33 | | 700 | | | 699 | |
| Rio Tinto Finance USA Ltd. | 5.875 | % | 7/15/13 | | 510 | | | 551 | |
| Rio Tinto Finance USA Ltd. | 8.950 | % | 5/1/14 | | 900 | | | 1,078 | |
| Rio Tinto Finance USA Ltd. | 6.500 | % | 7/15/18 | | 375 | | | 410 | |
| Rio Tinto Finance USA Ltd. | 9.000 | % | 5/1/19 | | 625 | | | 791 | |
| Rio Tinto Finance USA Ltd. | 7.125 | % | 7/15/28 | | 175 | | | 196 | |
| 3 Rohm & Haas Holdings Ltd. | 9.800 | % | 4/15/20 | | 113 | | | 126 | |
| Sherwin-Williams Co. | 3.125 | % | 12/15/14 | | 200 | | | 199 | |
| Southern Copper Corp. | 7.500 | % | 7/27/35 | | 375 | | | 362 | |
| Vale Inco Ltd. | 7.750 | % | 5/15/12 | | 100 | | | 109 | |
| Vale Inco Ltd. | 5.700 | % | 10/15/15 | | 200 | | | 202 | |
| Vale Overseas Ltd. | 6.250 | % | 1/11/16 | | 50 | | | 53 | |
| Vale Overseas Ltd. | 6.250 | % | 1/23/17 | | 200 | | | 210 | |
| Vale Overseas Ltd. | 8.250 | % | 1/17/34 | | 150 | | | 173 | |
| Vale Overseas Ltd. | 6.875 | % | 11/21/36 | | 1,424 | | | 1,436 | |
| Valspar Corp. | 7.250 | % | 6/15/19 | | 50 | | | 54 | |
| WMC Finance USA Ltd. | 5.125 | % | 5/15/13 | | 425 | | | 455 | |
| Xstrata Canada Corp. | 7.350 | % | 6/5/12 | | 125 | | | 135 | |
| Xstrata Canada Corp. | 7.250 | % | 7/15/12 | | 425 | | | 459 | |
| Xstrata Canada Corp. | 5.500 | % | 6/15/17 | | 400 | | | 386 | |
| |
| Capital Goods (1.0%) | | | | | | | | | |
| 3M Co. | 4.500 | % | 11/1/11 | | 425 | | | 450 | |
| 3M Co. | 6.375 | % | 2/15/28 | | 275 | | | 305 | |
| 5 Acuity Brands Lighting Inc. | 6.000 | % | 12/15/19 | | 125 | | | 120 | |
| Allied Waste North America Inc. | 7.125 | % | 5/15/16 | | 975 | | | 1,038 | |
| Bemis Co. Inc. | 4.875 | % | 4/1/12 | | 200 | | | 207 | |
| Bemis Co. Inc. | 5.650 | % | 8/1/14 | | 50 | | | 53 | |
| Black & Decker Corp. | 7.125 | % | 6/1/11 | | 225 | | | 240 | |
| Boeing Capital Corp. | 6.500 | % | 2/15/12 | | 875 | | | 956 | |
| Boeing Co. | 1.875 | % | 11/20/12 | | 300 | | | 299 | |
| Boeing Co. | 3.500 | % | 2/15/15 | | 600 | | | 603 | |
| Boeing Co. | 4.875 | % | 2/15/20 | | 150 | | | 151 | |
| Boeing Co. | 7.250 | % | 6/15/25 | | 375 | | | 419 | |
| Boeing Co. | 8.750 | % | 9/15/31 | | 75 | | | 100 | |
| Boeing Co. | 6.125 | % | 2/15/33 | | 50 | | | 52 | |
| Boeing Co. | 5.875 | % | 2/15/40 | | 150 | | | 155 | |
| Caterpillar Financial Services Corp. | 1.900 | % | 12/17/12 | | 1,100 | | | 1,093 | |
| Caterpillar Financial Services Corp. | 4.250 | % | 2/8/13 | | 500 | | | 517 | |
| Caterpillar Financial Services Corp. | 6.125 | % | 2/17/14 | | 975 | | | 1,088 | |
| Caterpillar Financial Services Corp. | 4.750 | % | 2/17/15 | | 50 | | | 52 | |
| Caterpillar Financial Services Corp. | 4.625 | % | 6/1/15 | | 125 | | | 129 | |
36
| | | | | | | | | |
| Institutional Total Bond Market Index Fund | | | | | | | | | |
| |
| |
| |
| | | | | | Face | | | Market | |
| | | | Maturity | | Amount | | | Value• | |
| | Coupon | | Date | ($ | 000 | ) | ($ | 000 | ) |
| Caterpillar Financial Services Corp. | 7.150 | % | 2/15/19 | | 900 | | | 1,037 | |
| Caterpillar Inc. | 7.300 | % | 5/1/31 | | 425 | | | 505 | |
| Caterpillar Inc. | 7.375 | % | 3/1/97 | | 325 | | | 344 | |
| Cooper US Inc. | 5.250 | % | 11/15/12 | | 225 | | | 242 | |
| CRH America Inc. | 5.625 | % | 9/30/11 | | 225 | | | 236 | |
| CRH America Inc. | 6.950 | % | 3/15/12 | | 350 | | | 378 | |
| CRH America Inc. | 5.300 | % | 10/15/13 | | 200 | | | 209 | |
| CRH America Inc. | 6.000 | % | 9/30/16 | | 475 | | | 494 | |
| Danaher Corp. | 5.625 | % | 1/15/18 | | 150 | | | 161 | |
| Deere & Co. | 6.950 | % | 4/25/14 | | 150 | | | 174 | |
| Deere & Co. | 4.375 | % | 10/16/19 | | 350 | | | 351 | |
| Deere & Co. | 5.375 | % | 10/16/29 | | 250 | | | 250 | |
| Deere & Co. | 8.100 | % | 5/15/30 | | 500 | | | 637 | |
| Deere & Co. | 7.125 | % | 3/3/31 | | 300 | | | 355 | |
| Dover Corp. | 5.450 | % | 3/15/18 | | 350 | | | 369 | |
| Dover Corp. | 6.600 | % | 3/15/38 | | 200 | | | 227 | |
| Eaton Corp. | 5.600 | % | 5/15/18 | | 525 | | | 552 | |
| Embraer Overseas Ltd. | 6.375 | % | 1/24/17 | | 125 | | | 126 | |
| Embraer Overseas Ltd. | 6.375 | % | 1/15/20 | | 175 | | | 174 | |
| Emerson Electric Co. | 7.125 | % | 8/15/10 | | 375 | | | 390 | |
| Emerson Electric Co. | 4.500 | % | 5/1/13 | | 175 | | | 185 | |
| Emerson Electric Co. | 5.250 | % | 10/15/18 | | 400 | | | 422 | |
| Emerson Electric Co. | 4.875 | % | 10/15/19 | | 375 | | | 386 | |
| Emerson Electric Co. | 4.250 | % | 11/15/20 | | 25 | | | 24 | |
| Emerson Electric Co. | 5.250 | % | 11/15/39 | | 325 | | | 314 | |
| General Dynamics Corp. | 4.250 | % | 5/15/13 | | 750 | | | 793 | |
| General Electric Co. | 5.000 | % | 2/1/13 | | 1,325 | | | 1,403 | |
| General Electric Co. | 5.250 | % | 12/6/17 | | 2,880 | | | 2,938 | |
| Goodrich Corp. | 6.125 | % | 3/1/19 | | 550 | | | 601 | |
| Goodrich Corp. | 6.800 | % | 7/1/36 | | 80 | | | 87 | |
| Harsco Corp. | 5.750 | % | 5/15/18 | | 325 | | | 320 | |
| Honeywell International Inc. | 6.125 | % | 11/1/11 | | 150 | | | 164 | |
| Honeywell International Inc. | 5.625 | % | 8/1/12 | | 300 | | | 328 | |
| Honeywell International Inc. | 4.250 | % | 3/1/13 | | 125 | | | 132 | |
| Honeywell International Inc. | 3.875 | % | 2/15/14 | | 425 | | | 443 | |
| Honeywell International Inc. | 5.300 | % | 3/1/18 | | 50 | | | 53 | |
| Honeywell International Inc. | 5.000 | % | 2/15/19 | | 325 | | | 337 | |
| Honeywell International Inc. | 5.700 | % | 3/15/36 | | 50 | | | 51 | |
| Illinois Tool Works Inc. | 5.150 | % | 4/1/14 | | 375 | | | 409 | |
| Illinois Tool Works Inc. | 6.250 | % | 4/1/19 | | 225 | | | 253 | |
| Ingersoll-Rand Global Holding Co. Ltd. | 6.000 | % | 8/15/13 | | 200 | | | 215 | |
| Ingersoll-Rand Global Holding Co. Ltd. | 9.500 | % | 4/15/14 | | 250 | | | 300 | |
| Ingersoll-Rand Global Holding Co. Ltd. | 6.875 | % | 8/15/18 | | 200 | | | 222 | |
| John Deere Capital Corp. | 5.400 | % | 10/17/11 | | 625 | | | 667 | |
| John Deere Capital Corp. | 5.350 | % | 1/17/12 | | 200 | | | 214 | |
| John Deere Capital Corp. | 5.250 | % | 10/1/12 | | 550 | | | 592 | |
| John Deere Capital Corp. | 4.950 | % | 12/17/12 | | 50 | | | 54 | |
| John Deere Capital Corp. | 4.900 | % | 9/9/13 | | 150 | | | 161 | |
| John Deere Capital Corp. | 5.500 | % | 4/13/17 | | 50 | | | 53 | |
| Joy Global Inc. | 6.000 | % | 11/15/16 | | 100 | | | 102 | |
| 5 L-3 Communications Corp. | 5.200 | % | 10/15/19 | | 225 | | | 225 | |
| Lafarge SA | 6.150 | % | 7/15/11 | | 50 | | | 52 | |
| Lafarge SA | 6.500 | % | 7/15/16 | | 400 | | | 423 | |
| Lafarge SA | 7.125 | % | 7/15/36 | | 325 | | | 343 | |
| Lockheed Martin Corp. | 7.650 | % | 5/1/16 | | 625 | | | 750 | |
| Lockheed Martin Corp. | 4.250 | % | 11/15/19 | | 75 | | | 73 | |
37
| | | | | | | | | | |
| Institutional Total Bond Market Index Fu nd | | | | | | | | | |
| |
| |
| |
| | | | | | | Face | | | Market | |
| | | | | Maturity | | Amount | | | Value• | |
| | | Coupon | | Date | ($ | 000 | ) | ($ | 000 | ) |
| | Lockheed Martin Corp. | 6.150 | % | 9/1/36 | | 325 | | | 346 | |
| | Lockheed Martin Corp. | 5.500 | % | 11/15/39 | | 50 | | | 49 | |
| | Martin Marietta Materials Inc. | 6.600 | % | 4/15/18 | | 375 | | | 386 | |
| | Northrop Grumman Systems Corp. | 7.125 | % | 2/15/11 | | 450 | | | 477 | |
| | Northrop Grumman Systems Corp. | 7.750 | % | 3/1/16 | | 125 | | | 149 | |
| | Northrop Grumman Systems Corp. | 7.750 | % | 2/15/31 | | 100 | | | 123 | |
| | Parker Hannifin Corp. | 5.500 | % | 5/15/18 | | 100 | | | 106 | |
| | Parker Hannifin Corp. | 6.250 | % | 5/15/38 | | 100 | | | 108 | |
| | Raytheon Co. | 5.500 | % | 11/15/12 | | 325 | | | 356 | |
| | Raytheon Co. | 7.200 | % | 8/15/27 | | 225 | | | 267 | |
| | Republic Services Inc. | 6.750 | % | 8/15/11 | | 150 | | | 158 | |
| 5 | Republic Services Inc. | 5.250 | % | 11/15/21 | | 450 | | | 441 | |
| | Republic Services Inc. | 6.086 | % | 3/15/35 | | 150 | | | 143 | |
| | Rockwell Automation Inc. | 5.650 | % | 12/1/17 | | 125 | | | 133 | |
| | Rockwell Automation Inc. | 6.700 | % | 1/15/28 | | 75 | | | 80 | |
| | Rockwell Automation Inc. | 6.250 | % | 12/1/37 | | 325 | | | 337 | |
| | Rockwell Collins Inc. | 5.250 | % | 7/15/19 | | 50 | | | 53 | |
| | Roper Industries Inc. | 6.625 | % | 8/15/13 | | 600 | | | 655 | |
| | Roper Industries Inc. | 6.250 | % | 9/1/19 | | 50 | | | 52 | |
| 3,5 | Systems 2001 AT LLC | 7.156 | % | 12/15/11 | | 23 | | | 24 | |
| | Tyco International Finance SA | 6.750 | % | 2/15/11 | | 1,200 | | | 1,261 | |
| | Tyco International Ltd./ | | | | | | | | | |
| | Tyco International Finance SA | 7.000 | % | 12/15/19 | | 500 | | | 563 | |
| | United Technologies Corp. | 6.350 | % | 3/1/11 | | 450 | | | 477 | |
| | United Technologies Corp. | 6.100 | % | 5/15/12 | | 125 | | | 137 | |
| | United Technologies Corp. | 4.875 | % | 5/1/15 | | 125 | | | 135 | |
| | United Technologies Corp. | 5.375 | % | 12/15/17 | | 300 | | | 321 | |
| | United Technologies Corp. | 6.125 | % | 2/1/19 | | 725 | | | 803 | |
| | United Technologies Corp. | 7.500 | % | 9/15/29 | | 150 | | | 183 | |
| | United Technologies Corp. | 5.400 | % | 5/1/35 | | 225 | | | 224 | |
| | Vulcan Materials Co. | 6.300 | % | 6/15/13 | | 150 | | | 160 | |
| | Vulcan Materials Co. | 7.000 | % | 6/15/18 | | 300 | | | 325 | |
| | Waste Management Inc. | 6.375 | % | 11/15/12 | | 100 | | | 110 | |
| | Waste Management Inc. | 5.000 | % | 3/15/14 | | 775 | | | 820 | |
| | Waste Management Inc. | 6.375 | % | 3/11/15 | | 150 | | | 167 | |
| | Waste Management Inc. | 7.375 | % | 3/11/19 | | 125 | | | 145 | |
| | Waste Management Inc. | 7.000 | % | 7/15/28 | | 80 | | | 87 | |
| | Waste Management Inc. | 6.125 | % | 11/30/39 | | 350 | | | 352 | |
| |
| | Communication (2.3%) | | | | | | | | | |
| | America Movil SAB de CV | 5.500 | % | 3/1/14 | | 100 | | | 107 | |
| | America Movil SAB de CV | 5.750 | % | 1/15/15 | | 650 | | | 688 | |
| | America Movil SAB de CV | 6.375 | % | 3/1/35 | | 300 | | | 312 | |
| | America Movil SAB de CV | 6.125 | % | 11/15/37 | | 325 | | | 325 | |
| 5 | American Tower Corp. | 4.625 | % | 4/1/15 | | 75 | | | 76 | |
| | AT&T Corp. | 7.300 | % | 11/15/11 | | 1,375 | | | 1,516 | |
| | AT&T Corp. | 8.000 | % | 11/15/31 | | 1,475 | | | 1,803 | |
| | AT&T Inc. | 6.250 | % | 3/15/11 | | 175 | | | 185 | |
| | AT&T Inc. | 5.875 | % | 2/1/12 | | 385 | | | 417 | |
| | AT&T Inc. | 5.875 | % | 8/15/12 | | 615 | | | 674 | |
| | AT&T Inc. | 4.950 | % | 1/15/13 | | 460 | | | 492 | |
| | AT&T Inc. | 4.850 | % | 2/15/14 | | 675 | | | 721 | |
| | AT&T Inc. | 5.100 | % | 9/15/14 | | 1,885 | | | 2,038 | |
| | AT&T Inc. | 5.625 | % | 6/15/16 | | 520 | | | 557 | |
| | AT&T Inc. | 5.800 | % | 2/15/19 | | 950 | | | 1,017 | |
| | AT&T Inc. | 6.450 | % | 6/15/34 | | 425 | | | 436 | |
38
| | | | | | | | | |
| Institutional Total Bond Market Index Fund | | | | | | | | | |
| |
| |
| |
| | | | | | Face | | | Market | |
| | | | Maturity | | Amount | | | Value• | |
| | Coupon | | Date | ($ | 000 | ) | ($ | 000 | ) |
| AT&T Inc. | 6.500 | % | 9/1/37 | | 1,750 | | | 1,813 | |
| AT&T Inc. | 6.300 | % | 1/15/38 | | 525 | | | 534 | |
| AT&T Inc. | 6.400 | % | 5/15/38 | | 425 | | | 440 | |
| AT&T Inc. | 6.550 | % | 2/15/39 | | 375 | | | 396 | |
| AT&T Mobility LLC | 6.500 | % | 12/15/11 | | 950 | | | 1,034 | |
| AT&T Mobility LLC | 7.125 | % | 12/15/31 | | 645 | | | 726 | |
| Bellsouth Capital Funding Corp. | 7.875 | % | 2/15/30 | | 300 | | | 341 | |
| BellSouth Corp. | 5.200 | % | 9/15/14 | | 25 | | | 27 | |
| BellSouth Corp. | 5.200 | % | 12/15/16 | | 225 | | | 232 | |
| BellSouth Corp. | 6.875 | % | 10/15/31 | | 200 | | | 208 | |
| BellSouth Corp. | 6.550 | % | 6/15/34 | | 225 | | | 225 | |
| BellSouth Corp. | 6.000 | % | 11/15/34 | | 230 | | | 222 | |
| BellSouth Telecommunications Inc. | 6.375 | % | 6/1/28 | | 735 | | | 730 | |
| British Telecommunications PLC | 9.125 | % | 12/15/10 | | 640 | | | 685 | |
| British Telecommunications PLC | 5.150 | % | 1/15/13 | | 290 | | | 302 | |
| British Telecommunications PLC | 5.950 | % | 1/15/18 | | 325 | | | 330 | |
| British Telecommunications PLC | 9.625 | % | 12/15/30 | | 875 | | | 1,121 | |
| CBS Corp. | 6.625 | % | 5/15/11 | | 570 | | | 597 | |
| CBS Corp. | 5.625 | % | 8/15/12 | | 210 | | | 218 | |
| CBS Corp. | 7.875 | % | 7/30/30 | | 255 | | | 275 | |
| CBS Corp. | 5.500 | % | 5/15/33 | | 75 | | | 63 | |
| Cellco Partnership/Verizon Wireless Capital LLC | 3.750 | % | 5/20/11 | | 200 | | | 206 | |
| Cellco Partnership/Verizon Wireless Capital LLC | 5.250 | % | 2/1/12 | | 550 | | | 583 | |
| Cellco Partnership/Verizon Wireless Capital LLC | 7.375 | % | 11/15/13 | | 1,300 | | | 1,495 | |
| Cellco Partnership/Verizon Wireless Capital LLC | 5.550 | % | 2/1/14 | | 1,225 | | | 1,335 | |
| Cellco Partnership/Verizon Wireless Capital LLC | 8.500 | % | 11/15/18 | | 600 | | | 749 | |
| CenturyTel Inc. | 6.150 | % | 9/15/19 | | 50 | | | 52 | |
| CenturyTel Inc. | 6.875 | % | 1/15/28 | | 75 | | | 70 | |
| CenturyTel Inc. | 7.600 | % | 9/15/39 | | 275 | | | 284 | |
| Comcast Cable Communications Holdings Inc. | 8.375 | % | 3/15/13 | | 15 | | | 17 | |
| Comcast Cable Communications Holdings Inc. | 9.455 | % | 11/15/22 | | 75 | | | 98 | |
| Comcast Cable Communications LLC | 6.750 | % | 1/30/11 | | 1,550 | | | 1,637 | |
| Comcast Cable Communications LLC | 8.875 | % | 5/1/17 | | 275 | | | 331 | |
| Comcast Corp. | 5.500 | % | 3/15/11 | | 315 | | | 329 | |
| Comcast Corp. | 5.300 | % | 1/15/14 | | 675 | | | 722 | |
| Comcast Corp. | 6.500 | % | 1/15/15 | | 110 | | | 123 | |
| Comcast Corp. | 5.900 | % | 3/15/16 | | 125 | | | 134 | |
| Comcast Corp. | 6.500 | % | 1/15/17 | | 100 | | | 111 | |
| Comcast Corp. | 6.300 | % | 11/15/17 | | 50 | | | 55 | |
| Comcast Corp. | 5.700 | % | 5/15/18 | | 325 | | | 343 | |
| Comcast Corp. | 5.700 | % | 7/1/19 | | 450 | | | 471 | |
| Comcast Corp. | 6.500 | % | 11/15/35 | | 3,300 | | | 3,411 | |
| Comcast Corp. | 6.400 | % | 5/15/38 | | 75 | | | 77 | |
| COX Communications Inc. | 7.125 | % | 10/1/12 | | 200 | | | 221 | |
| COX Communications Inc. | 5.450 | % | 12/15/14 | | 760 | | | 815 | |
| Deutsche Telekom International Finance BV | 5.875 | % | 8/20/13 | | 350 | | | 378 | |
| Deutsche Telekom International Finance BV | 4.875 | % | 7/8/14 | | 425 | | | 447 | |
| Deutsche Telekom International Finance BV | 5.750 | % | 3/23/16 | | 370 | | | 395 | |
| Deutsche Telekom International Finance BV | 6.000 | % | 7/8/19 | | 575 | | | 612 | |
| Deutsche Telekom International Finance BV | 8.750 | % | 6/15/30 | | 950 | | | 1,232 | |
| 5 DirecTV Holdings LLC/ | | | | | | | | | |
| DirecTV Financing Co. Inc. | 4.750 | % | 10/1/14 | | 200 | | | 203 | |
| DirecTV Holdings LLC/ | | | | | | | | | |
| DirecTV Financing Co. Inc. | 7.625 | % | 5/15/16 | | 100 | | | 109 | |
| 5 DirecTV Holdings LLC/ | | | | | | | | | |
| DirecTV Financing Co. Inc. | 5.875 | % | 10/1/19 | | 1,950 | | | 1,970 | |
39
| | | | | | | | | |
| Institutional Total Bond Market Index Fund | | | | | | | | | |
| |
| |
| |
| | | | | | Face | | | Market | |
| | | | Maturity | | Amount | | | Value• | |
| | Coupon | | Date | ($ | 000 | ) | ($ | 000 | ) |
| Embarq Corp. | 7.082 | % | 6/1/16 | | 1,175 | | | 1,286 | |
| Embarq Corp. | 7.995 | % | 6/1/36 | | 500 | | | 544 | |
| France Telecom SA | 7.750 | % | 3/1/11 | | 1,075 | | | 1,156 | |
| France Telecom SA | 4.375 | % | 7/8/14 | | 75 | | | 79 | |
| France Telecom SA | 8.500 | % | 3/1/31 | | 675 | | | 897 | |
| Grupo Televisa SA | 6.625 | % | 3/18/25 | | 275 | | | 272 | |
| 5 Grupo Televisa SA | 6.625 | % | 1/15/40 | | 75 | | | 74 | |
| GTE Corp. | 8.750 | % | 11/1/21 | | 75 | | | 93 | |
| Koninklijke KPN NV | 8.375 | % | 10/1/30 | | 225 | | | 284 | |
| McGraw-Hill Cos. Inc. | 5.375 | % | 11/15/12 | | 325 | | | 343 | |
| McGraw-Hill Cos. Inc. | 5.900 | % | 11/15/17 | | 350 | | | 358 | |
| New Cingular Wireless Services Inc. | 7.875 | % | 3/1/11 | | 615 | | | 661 | |
| New Cingular Wireless Services Inc. | 8.125 | % | 5/1/12 | | 325 | | | 367 | |
| New Cingular Wireless Services Inc. | 8.750 | % | 3/1/31 | | 440 | | | 569 | |
| News America Holdings Inc. | 8.000 | % | 10/17/16 | | 365 | | | 432 | |
| News America Holdings Inc. | 8.150 | % | 10/17/36 | | 75 | | | 84 | |
| News America Inc. | 5.300 | % | 12/15/14 | | 375 | | | 407 | |
| News America Inc. | 6.550 | % | 3/15/33 | | 325 | | | 337 | |
| News America Inc. | 6.200 | % | 12/15/34 | | 1,125 | | | 1,120 | |
| News America Inc. | 6.400 | % | 12/15/35 | | 1,475 | | | 1,516 | |
| Omnicom Group Inc. | 5.900 | % | 4/15/16 | | 25 | | | 26 | |
| Qwest Corp. | 7.875 | % | 9/1/11 | | 325 | | | 340 | |
| Qwest Corp. | 8.875 | % | 3/15/12 | | 325 | | | 350 | |
| Qwest Corp. | 7.500 | % | 10/1/14 | | 300 | | | 310 | |
| Qwest Corp. | 6.500 | % | 6/1/17 | | 225 | | | 219 | |
| Qwest Corp. | 7.500 | % | 6/15/23 | | 300 | | | 282 | |
| Qwest Corp. | 6.875 | % | 9/15/33 | | 300 | | | 259 | |
| Reed Elsevier Capital Inc. | 4.625 | % | 6/15/12 | | 50 | | | 52 | |
| Reed Elsevier Capital Inc. | 7.750 | % | 1/15/14 | | 225 | | | 254 | |
| Reed Elsevier Capital Inc. | 8.625 | % | 1/15/19 | | 225 | | | 276 | |
| Rogers Communications Inc. | 6.375 | % | 3/1/14 | | 1,400 | | | 1,548 | |
| Rogers Communications Inc. | 5.500 | % | 3/15/14 | | 400 | | | 432 | |
| Rogers Communications Inc. | 6.800 | % | 8/15/18 | | 975 | | | 1,090 | |
| RR Donnelley & Sons Co. | 4.950 | % | 4/1/14 | | 50 | | | 49 | |
| RR Donnelley & Sons Co. | 5.500 | % | 5/15/15 | | 75 | | | 74 | |
| RR Donnelley & Sons Co. | 8.600 | % | 8/15/16 | | 600 | | | 649 | |
| TCI Communications Inc. | 8.750 | % | 8/1/15 | | 300 | | | 359 | |
| TCI Communications Inc. | 7.875 | % | 2/15/26 | | 155 | | | 175 | |
| Telecom Italia Capital SA | 6.200 | % | 7/18/11 | | 765 | | | 811 | |
| Telecom Italia Capital SA | 5.250 | % | 11/15/13 | | 220 | | | 232 | |
| Telecom Italia Capital SA | 6.175 | % | 6/18/14 | | 25 | | | 27 | |
| Telecom Italia Capital SA | 4.950 | % | 9/30/14 | | 135 | | | 140 | |
| Telecom Italia Capital SA | 5.250 | % | 10/1/15 | | 1,775 | | | 1,861 | |
| Telecom Italia Capital SA | 7.175 | % | 6/18/19 | | 125 | | | 140 | |
| Telecom Italia Capital SA | 6.375 | % | 11/15/33 | | 1,285 | | | 1,268 | |
| Telecom Italia Capital SA | 6.000 | % | 9/30/34 | | 25 | | | 23 | |
| Telecom Italia Capital SA | 7.200 | % | 7/18/36 | | 305 | | | 328 | |
| Telecom Italia Capital SA | 7.721 | % | 6/4/38 | | 45 | | | 52 | |
| Telefonica Emisiones SAU | 5.984 | % | 6/20/11 | | 400 | | | 424 | |
| Telefonica Emisiones SAU | 4.949 | % | 1/15/15 | | 575 | | | 619 | |
| Telefonica Emisiones SAU | 6.421 | % | 6/20/16 | | 950 | | | 1,058 | |
| Telefonica Emisiones SAU | 5.877 | % | 7/15/19 | | 325 | | | 348 | |
| Telefonica Emisiones SAU | 7.045 | % | 6/20/36 | | 505 | | | 576 | |
| Telefonica Europe BV | 8.250 | % | 9/15/30 | | 175 | | | 219 | |
| Telefonos de Mexico SAB de CV | 5.500 | % | 1/27/15 | | 1,275 | | | 1,320 | |
| TELUS Corp. | 8.000 | % | 6/1/11 | | 350 | | | 379 | |
40
| | | | | | | | | |
| Institutional Total Bond Market Index Fund | | | | | | | | | |
| |
| |
| |
| | | | | | Face | | | Market | |
| | | | Maturity | | Amount | | | Value• | |
| | Coupon | | Date | ($ | 000 | ) | ($ | 000 | ) |
| Thomson Reuters Corp. | 6.200 | % | 1/5/12 | | 200 | | | 216 | |
| Thomson Reuters Corp. | 5.950 | % | 7/15/13 | | 165 | | | 181 | |
| Thomson Reuters Corp. | 5.700 | % | 10/1/14 | | 475 | | | 522 | |
| Thomson Reuters Corp. | 6.500 | % | 7/15/18 | | 50 | | | 56 | |
| Thomson Reuters Corp. | 4.700 | % | 10/15/19 | | 275 | | | 272 | |
| Thomson Reuters Corp. | 5.500 | % | 8/15/35 | | 100 | | | 96 | |
| Time Warner Cable Inc. | 5.400 | % | 7/2/12 | | 250 | | | 267 | |
| Time Warner Cable Inc. | 6.200 | % | 7/1/13 | | 775 | | | 848 | |
| Time Warner Cable Inc. | 8.250 | % | 2/14/14 | | 150 | | | 175 | |
| Time Warner Cable Inc. | 7.500 | % | 4/1/14 | | 175 | | | 202 | |
| Time Warner Cable Inc. | 3.500 | % | 2/1/15 | | 175 | | | 173 | |
| Time Warner Cable Inc. | 5.850 | % | 5/1/17 | | 650 | | | 682 | |
| Time Warner Cable Inc. | 6.750 | % | 7/1/18 | | 1,275 | | | 1,406 | |
| Time Warner Cable Inc. | 8.750 | % | 2/14/19 | | 400 | | | 488 | |
| Time Warner Cable Inc. | 8.250 | % | 4/1/19 | | 225 | | | 268 | |
| Time Warner Cable Inc. | 5.000 | % | 2/1/20 | | 425 | | | 413 | |
| Time Warner Cable Inc. | 6.550 | % | 5/1/37 | | 550 | | | 562 | |
| Time Warner Cable Inc. | 6.750 | % | 6/15/39 | | 925 | | | 969 | |
| Time Warner Entertainment Co. LP | 10.150 | % | 5/1/12 | | 150 | | | 172 | |
| Time Warner Entertainment Co. LP | 8.875 | % | 10/1/12 | | 300 | | | 345 | |
| Time Warner Entertainment Co. LP | 8.375 | % | 3/15/23 | | 150 | | | 179 | |
| Time Warner Entertainment Co. LP | 8.375 | % | 7/15/33 | | 875 | | | 1,043 | |
| United States Cellular Corp. | 6.700 | % | 12/15/33 | | 150 | | | 147 | |
| Verizon Communications Inc. | 5.350 | % | 2/15/11 | | 100 | | | 105 | |
| Verizon Communications Inc. | 5.250 | % | 4/15/13 | | 350 | | | 379 | |
| Verizon Communications Inc. | 4.900 | % | 9/15/15 | | 425 | | | 456 | |
| Verizon Communications Inc. | 5.550 | % | 2/15/16 | | 950 | | | 1,016 | |
| Verizon Communications Inc. | 8.750 | % | 11/1/18 | | 375 | | | 475 | |
| Verizon Communications Inc. | 6.350 | % | 4/1/19 | | 650 | | | 720 | |
| Verizon Communications Inc. | 5.850 | % | 9/15/35 | | 1,050 | | | 1,021 | |
| Verizon Communications Inc. | 6.400 | % | 2/15/38 | | 480 | | | 507 | |
| Verizon Communications Inc. | 6.900 | % | 4/15/38 | | 60 | | | 67 | |
| Verizon Communications Inc. | 8.950 | % | 3/1/39 | | 1,225 | | | 1,669 | |
| Verizon Communications Inc. | 7.350 | % | 4/1/39 | | 800 | | | 931 | |
| Verizon Global Funding Corp. | 6.875 | % | 6/15/12 | | 1,500 | | | 1,667 | |
| Verizon Global Funding Corp. | 7.375 | % | 9/1/12 | | 300 | | | 339 | |
| Verizon Global Funding Corp. | 7.750 | % | 12/1/30 | | 625 | | | 739 | |
| Verizon Maryland Inc. | 5.125 | % | 6/15/33 | | 55 | | | 43 | |
| Verizon New England Inc. | 6.500 | % | 9/15/11 | | 325 | | | 349 | |
| Verizon New England Inc. | 7.875 | % | 11/15/29 | | 810 | | | 882 | |
| Verizon New York Inc. | 6.875 | % | 4/1/12 | | 135 | | | 147 | |
| Verizon New York Inc. | 7.375 | % | 4/1/32 | | 100 | | | 106 | |
| Verizon Pennsylvania Inc. | 5.650 | % | 11/15/11 | | 375 | | | 398 | |
| Verizon Virginia Inc. | 4.625 | % | 3/15/13 | | 125 | | | 130 | |
| Vodafone Group PLC | 5.350 | % | 2/27/12 | | 825 | | | 881 | |
| Vodafone Group PLC | 5.000 | % | 12/16/13 | | 800 | | | 846 | |
| Vodafone Group PLC | 5.375 | % | 1/30/15 | | 350 | | | 376 | |
| Vodafone Group PLC | 5.750 | % | 3/15/16 | | 200 | | | 216 | |
| Vodafone Group PLC | 5.625 | % | 2/27/17 | | 425 | | | 453 | |
| Vodafone Group PLC | 7.875 | % | 2/15/30 | | 375 | | | 450 | |
| Vodafone Group PLC | 6.250 | % | 11/30/32 | | 550 | | | 554 | |
| Vodafone Group PLC | 6.150 | % | 2/27/37 | | 125 | | | 129 | |
| Washington Post Co. | 7.250 | % | 2/1/19 | | 150 | | | 165 | |
| WPP Finance UK | 5.875 | % | 6/15/14 | | 200 | | | 203 | |
| WPP Finance UK | 8.000 | % | 9/15/14 | | 75 | | | 84 | |
41
| | | | | | | | | |
| Institutional Total Bond Market Index Fund | | | | | | | | | |
| |
| |
| |
| | | | | | Face | | | Market | |
| | | | Maturity | | Amount | | | Value• | |
| | Coupon | | Date | ($ | 000 | ) | ($ | 000 | ) |
| Consumer Cyclical (1.0%) | | | | | | | | | |
| AutoZone Inc. | 5.750 | % | 1/15/15 | | 375 | | | 402 | |
| Best Buy Co. Inc. | 6.750 | % | 7/15/13 | | 200 | | | 220 | |
| Costco Wholesale Corp. | 5.500 | % | 3/15/17 | | 850 | | | 913 | |
| CVS Caremark Corp. | 5.750 | % | 8/15/11 | | 350 | | | 372 | |
| CVS Caremark Corp. | 4.875 | % | 9/15/14 | | 100 | | | 106 | |
| CVS Caremark Corp. | 6.125 | % | 8/15/16 | | 350 | | | 377 | |
| CVS Caremark Corp. | 5.750 | % | 6/1/17 | | 200 | | | 211 | |
| CVS Caremark Corp. | 6.250 | % | 6/1/27 | | 800 | | | 814 | |
| 3 CVS Caremark Corp. | 6.302 | % | 6/1/37 | | 300 | | | 258 | |
| CVS Caremark Corp. | 6.125 | % | 9/15/39 | | 400 | | | 394 | |
| Daimler Finance North America LLC | 7.300 | % | 1/15/12 | | 1,675 | | | 1,820 | |
| Daimler Finance North America LLC | 6.500 | % | 11/15/13 | | 1,075 | | | 1,180 | |
| Daimler Finance North America LLC | 8.500 | % | 1/18/31 | | 500 | | | 608 | |
| Darden Restaurants Inc. | 5.625 | % | 10/15/12 | | 275 | | | 294 | |
| Darden Restaurants Inc. | 6.200 | % | 10/15/17 | | 200 | | | 212 | |
| Darden Restaurants Inc. | 6.800 | % | 10/15/37 | | 200 | | | 207 | |
| Historic TW Inc. | 9.125 | % | 1/15/13 | | 1,000 | | | 1,163 | |
| Historic TW Inc. | 9.150 | % | 2/1/23 | | 125 | | | 153 | |
| Historic TW Inc. | 6.625 | % | 5/15/29 | | 700 | | | 734 | |
| Home Depot Inc. | 5.250 | % | 12/16/13 | | 925 | | | 990 | |
| Home Depot Inc. | 5.400 | % | 3/1/16 | | 1,375 | | | 1,435 | |
| Johnson Controls Inc. | 5.250 | % | 1/15/11 | | 100 | | | 104 | |
| Johnson Controls Inc. | 6.000 | % | 1/15/36 | | 125 | | | 107 | |
| Kohl's Corp. | 6.250 | % | 12/15/17 | | 150 | | | 165 | |
| Kohl's Corp. | 6.000 | % | 1/15/33 | | 100 | | | 101 | |
| Kohl's Corp. | 6.875 | % | 12/15/37 | | 150 | | | 170 | |
| Lowe's Cos. Inc. | 5.600 | % | 9/15/12 | | 100 | | | 110 | |
| Lowe's Cos. Inc. | 5.400 | % | 10/15/16 | | 425 | | | 456 | |
| Lowe's Cos. Inc. | 6.100 | % | 9/15/17 | | 200 | | | 222 | |
| Lowe's Cos. Inc. | 6.875 | % | 2/15/28 | | 200 | | | 224 | |
| Lowe's Cos. Inc. | 5.800 | % | 10/15/36 | | 375 | | | 383 | |
| Marriott International Inc | 4.625 | % | 6/15/12 | | 125 | | | 126 | |
| Marriott International Inc. | 5.625 | % | 2/15/13 | | 175 | | | 180 | |
| Marriott International Inc. | 6.200 | % | 6/15/16 | | 175 | | | 178 | |
| Marriott International Inc. | 6.375 | % | 6/15/17 | | 175 | | | 181 | |
| McDonald's Corp. | 6.000 | % | 4/15/11 | | 200 | | | 212 | |
| McDonald's Corp. | 5.300 | % | 3/15/17 | | 50 | | | 54 | |
| McDonald's Corp. | 5.800 | % | 10/15/17 | | 300 | | | 333 | |
| McDonald's Corp. | 5.350 | % | 3/1/18 | | 400 | | | 430 | |
| McDonald's Corp. | 5.000 | % | 2/1/19 | | 150 | | | 159 | |
| McDonald's Corp. | 6.300 | % | 10/15/37 | | 175 | | | 192 | |
| McDonald's Corp. | 5.700 | % | 2/1/39 | | 200 | | | 205 | |
| Nordstrom Inc. | 6.250 | % | 1/15/18 | | 75 | | | 81 | |
| Nordstrom Inc. | 6.950 | % | 3/15/28 | | 75 | | | 81 | |
| Nordstrom Inc. | 7.000 | % | 1/15/38 | | 125 | | | 139 | |
| PACCAR Financial Corp. | 1.950 | % | 12/17/12 | | 275 | | | 272 | |
| PACCAR Inc. | 6.875 | % | 2/15/14 | | 200 | | | 227 | |
| Staples Inc. | 7.750 | % | 4/1/11 | | 875 | | | 940 | |
| Staples Inc. | 9.750 | % | 1/15/14 | | 800 | | | 976 | |
| Target Corp. | 6.350 | % | 1/15/11 | | 125 | | | 132 | |
| Target Corp. | 5.875 | % | 3/1/12 | | 350 | | | 380 | |
| Target Corp. | 5.125 | % | 1/15/13 | | 425 | | | 462 | |
| Target Corp. | 4.000 | % | 6/15/13 | | 160 | | | 166 | |
| Target Corp. | 6.000 | % | 1/15/18 | | 425 | | | 468 | |
| Target Corp. | 7.000 | % | 7/15/31 | | 1,025 | | | 1,170 | |
42
| | | | | | | | | |
| Institutional Total Bond Market Index Fund | | | | | | | | | |
| |
| |
| |
| | | | | | Face | | | Market | |
| | | | Maturity | | Amount | | | Value• | |
| | Coupon | | Date | ($ | 000 | ) | ($ | 000 | ) |
| Target Corp. | 6.350 | % | 11/1/32 | | 50 | | | 54 | |
| Target Corp. | 6.500 | % | 10/15/37 | | 75 | | | 83 | |
| Target Corp. | 7.000 | % | 1/15/38 | | 325 | | | 379 | |
| Time Warner Cos. Inc. | 7.570 | % | 2/1/24 | | 40 | | | 44 | |
| Time Warner Cos. Inc. | 6.950 | % | 1/15/28 | | 80 | | | 86 | |
| Time Warner Inc. | 6.750 | % | 4/15/11 | | 350 | | | 371 | |
| Time Warner Inc. | 6.875 | % | 5/1/12 | | 225 | | | 246 | |
| Time Warner Inc. | 7.625 | % | 4/15/31 | | 610 | | | 713 | |
| Time Warner Inc. | 7.700 | % | 5/1/32 | | 770 | | | 900 | |
| TJX Cos. Inc. | 6.950 | % | 4/15/19 | | 850 | | | 983 | |
| Toll Brothers Finance Corp. | 5.950 | % | 9/15/13 | | 16 | | | 16 | |
| Toll Brothers Finance Corp. | 5.150 | % | 5/15/15 | | 125 | | | 119 | |
| Toll Brothers Finance Corp. | 6.750 | % | 11/1/19 | | 100 | | | 96 | |
| Toyota Motor Credit Corp. | 4.350 | % | 12/15/10 | | 225 | | | 233 | |
| Toyota Motor Credit Corp. | 5.450 | % | 5/18/11 | | 125 | | | 132 | |
| VF Corp. | 5.950 | % | 11/1/17 | | 200 | | | 216 | |
| VF Corp. | 6.450 | % | 11/1/37 | | 150 | | | 157 | |
| Viacom Inc. | 6.250 | % | 4/30/16 | | 100 | | | 110 | |
| Viacom Inc. | 6.125 | % | 10/5/17 | | 550 | | | 593 | |
| Viacom Inc. | 5.625 | % | 9/15/19 | | 750 | | | 778 | |
| Wal-Mart Stores Inc. | 4.550 | % | 5/1/13 | | 1,100 | | | 1,169 | |
| Wal-Mart Stores Inc. | 7.250 | % | 6/1/13 | | 300 | | | 345 | |
| Wal-Mart Stores Inc. | 3.200 | % | 5/15/14 | | 275 | | | 279 | |
| Wal-Mart Stores Inc. | 4.500 | % | 7/1/15 | | 1,600 | | | 1,707 | |
| Wal-Mart Stores Inc. | 5.375 | % | 4/5/17 | | 100 | | | 108 | |
| Wal-Mart Stores Inc. | 5.800 | % | 2/15/18 | | 175 | | | 196 | |
| Wal-Mart Stores Inc. | 5.875 | % | 4/5/27 | | 1,075 | | | 1,159 | |
| Wal-Mart Stores Inc. | 7.550 | % | 2/15/30 | | 375 | | | 469 | |
| Wal-Mart Stores Inc. | 5.250 | % | 9/1/35 | | 150 | | | 149 | |
| Wal-Mart Stores Inc. | 6.500 | % | 8/15/37 | | 1,350 | | | 1,552 | |
| Wal-Mart Stores Inc. | 6.200 | % | 4/15/38 | | 45 | | | 50 | |
| Walgreen Co. | 4.875 | % | 8/1/13 | | 325 | | | 348 | |
| Walgreen Co. | 5.250 | % | 1/15/19 | | 625 | | | 665 | |
| Walt Disney Co. | 5.700 | % | 7/15/11 | | 550 | | | 588 | |
| Walt Disney Co. | 6.375 | % | 3/1/12 | | 300 | | | 329 | |
| Walt Disney Co. | 4.500 | % | 12/15/13 | | 325 | | | 345 | |
| Walt Disney Co. | 5.625 | % | 9/15/16 | | 600 | | | 652 | |
| Walt Disney Co. | 5.875 | % | 12/15/17 | | 400 | | | 432 | |
| Western Union Co. | 5.400 | % | 11/17/11 | | 100 | | | 107 | |
| Western Union Co. | 6.500 | % | 2/26/14 | | 625 | | | 701 | |
| Western Union Co. | 5.930 | % | 10/1/16 | | 225 | | | 244 | |
| Western Union Co. | 6.200 | % | 11/17/36 | | 150 | | | 151 | |
| Yum! Brands Inc. | 8.875 | % | 4/15/11 | | 150 | | | 163 | |
| Yum! Brands Inc. | 7.700 | % | 7/1/12 | | 100 | | | 112 | |
| Yum! Brands Inc. | 6.875 | % | 11/15/37 | | 650 | | | 705 | |
| |
| Consumer Noncyclical (2.3%) | | | | | | | | | |
| Abbott Laboratories | 3.750 | % | 3/15/11 | | 300 | | | 310 | |
| Abbott Laboratories | 5.600 | % | 5/15/11 | | 50 | | | 53 | |
| Abbott Laboratories | 5.150 | % | 11/30/12 | | 250 | | | 274 | |
| Abbott Laboratories | 4.350 | % | 3/15/14 | | 425 | | | 449 | |
| Abbott Laboratories | 5.875 | % | 5/15/16 | | 450 | | | 499 | |
| Abbott Laboratories | 5.600 | % | 11/30/17 | | 750 | | | 820 | |
| Abbott Laboratories | 5.125 | % | 4/1/19 | | 825 | | | 864 | |
| Abbott Laboratories | 6.150 | % | 11/30/37 | | 350 | | | 378 | |
| Abbott Laboratories | 6.000 | % | 4/1/39 | | 100 | | | 107 | |
43
| | | | | | | | | |
| Institutional Total Bond Market Index Fund | | | | | | | | | |
| |
| |
| |
| | | | | | Face | | | Market | |
| | | | Maturity | | Amount | | | Value• | |
| | Coupon | | Date | ($ | 000 | ) | ($ | 000 | ) |
| Allergan Inc. | 5.750 | % | 4/1/16 | | 50 | | | 54 | |
| Altria Group Inc. | 8.500 | % | 11/10/13 | | 1,150 | | | 1,332 | |
| Altria Group Inc. | 9.700 | % | 11/10/18 | | 1,050 | | | 1,301 | |
| Altria Group Inc. | 9.250 | % | 8/6/19 | | 675 | | | 822 | |
| Altria Group Inc. | 9.950 | % | 11/10/38 | | 300 | | | 396 | |
| Altria Group Inc. | 10.200 | % | 2/6/39 | | 775 | | | 1,037 | |
| AmerisourceBergen Corp. | 5.625 | % | 9/15/12 | | 100 | | | 107 | |
| AmerisourceBergen Corp. | 5.875 | % | 9/15/15 | | 955 | | | 1,042 | |
| Amgen Inc. | 4.850 | % | 11/18/14 | | 325 | | | 350 | |
| Amgen Inc. | 5.850 | % | 6/1/17 | | 975 | | | 1,069 | |
| Amgen Inc. | 5.700 | % | 2/1/19 | | 300 | | | 324 | |
| Amgen Inc. | 6.375 | % | 6/1/37 | | 300 | | | 328 | |
| Amgen Inc. | 6.400 | % | 2/1/39 | | 215 | | | 236 | |
| Anheuser-Busch Cos. Inc. | 6.000 | % | 4/15/11 | | 300 | | | 317 | |
| Anheuser-Busch Cos. Inc. | 6.800 | % | 8/20/32 | | 200 | | | 214 | |
| Anheuser-Busch Cos. Inc. | 5.750 | % | 4/1/36 | | 575 | | | 550 | |
| 5 Anheuser-Busch InBev Worldwide Inc. | 3.000 | % | 10/15/12 | | 1,050 | | | 1,059 | |
| 5 Anheuser-Busch InBev Worldwide Inc. | 4.125 | % | 1/15/15 | | 600 | | | 608 | |
| 5 Anheuser-Busch InBev Worldwide Inc. | 5.375 | % | 1/15/20 | | 1,100 | | | 1,118 | |
| 5 Anheuser-Busch InBev Worldwide Inc. | 6.375 | % | 1/15/40 | | 50 | | | 52 | |
| Archer-Daniels-Midland Co. | 5.450 | % | 3/15/18 | | 500 | | | 533 | |
| Archer-Daniels-Midland Co. | 7.000 | % | 2/1/31 | | 200 | | | 231 | |
| Archer-Daniels-Midland Co. | 5.935 | % | 10/1/32 | | 600 | | | 609 | |
| Archer-Daniels-Midland Co. | 5.375 | % | 9/15/35 | | 150 | | | 145 | |
| Archer-Daniels-Midland Co. | 6.450 | % | 1/15/38 | | 150 | | | 167 | |
| AstraZeneca PLC | 5.400 | % | 9/15/12 | | 300 | | | 328 | |
| AstraZeneca PLC | 5.400 | % | 6/1/14 | | 525 | | | 576 | |
| AstraZeneca PLC | 5.900 | % | 9/15/17 | | 650 | | | 720 | |
| AstraZeneca PLC | 6.450 | % | 9/15/37 | | 950 | | | 1,065 | |
| Baxter FinCo BV | 4.750 | % | 10/15/10 | | 375 | | | 387 | |
| Baxter International Inc. | 5.900 | % | 9/1/16 | | 275 | | | 305 | |
| Baxter International Inc. | 6.250 | % | 12/1/37 | | 500 | | | 543 | |
| Becton Dickinson and Co. | 5.000 | % | 5/15/19 | | 50 | | | 52 | |
| Biogen Idec Inc. | 6.000 | % | 3/1/13 | | 525 | | | 565 | |
| Biogen Idec Inc. | 6.875 | % | 3/1/18 | | 775 | | | 827 | |
| Bottling Group LLC | 4.625 | % | 11/15/12 | | 1,025 | | | 1,103 | |
| Bottling Group LLC | 5.000 | % | 11/15/13 | | 125 | | | 135 | |
| Bottling Group LLC | 6.950 | % | 3/15/14 | | 675 | | | 782 | |
| Bottling Group LLC | 5.500 | % | 4/1/16 | | 225 | | | 243 | |
| Bristol-Myers Squibb Co. | 5.250 | % | 8/15/13 | | 425 | | | 463 | |
| Bristol-Myers Squibb Co. | 5.450 | % | 5/1/18 | | 125 | | | 135 | |
| Bristol-Myers Squibb Co. | 5.875 | % | 11/15/36 | | 600 | | | 629 | |
| Bristol-Myers Squibb Co. | 6.875 | % | 8/1/97 | | 75 | | | 82 | |
| Bunge Ltd. Finance Corp. | 5.350 | % | 4/15/14 | | 375 | | | 383 | |
| Bunge Ltd. Finance Corp. | 5.100 | % | 7/15/15 | | 100 | | | 99 | |
| Bunge Ltd. Finance Corp. | 8.500 | % | 6/15/19 | | 125 | | | 142 | |
| Campbell Soup Co. | 6.750 | % | 2/15/11 | | 575 | | | 613 | |
| Cardinal Health Inc. | 5.650 | % | 6/15/12 | | 9 | | | 10 | |
| 5 CareFusion Corp. | 4.125 | % | 8/1/12 | | 50 | | | 52 | |
| 5 CareFusion Corp. | 5.125 | % | 8/1/14 | | 125 | | | 131 | |
| 5 CareFusion Corp. | 6.375 | % | 8/1/19 | | 75 | | | 81 | |
| Cia de Bebidas das Americas | 10.500 | % | 12/15/11 | | 400 | | | 461 | |
| Cia de Bebidas das Americas | 8.750 | % | 9/15/13 | | 295 | | | 343 | |
| Clorox Co. | 4.200 | % | 1/15/10 | | 25 | | | 25 | |
| Clorox Co. | 5.450 | % | 10/15/12 | | 625 | | | 675 | |
| Clorox Co. | 3.550 | % | 11/1/15 | | 225 | | | 224 | |
44
| | | | | | | | | |
| Institutional Total Bond Market Index Fund | | | | | | | | | |
| |
| |
| |
| | | | | | Face | | | Market | |
| | | | Maturity | | Amount | | | Value• | |
| | Coupon | | Date | ($ | 000 | ) | ($ | 000 | ) |
| Coca-Cola Co. | 5.350 | % | 11/15/17 | | 550 | | | 597 | |
| Coca-Cola Co. | 4.875 | % | 3/15/19 | | 550 | | | 575 | |
| Coca-Cola Enterprises Inc. | 5.000 | % | 8/15/13 | | 425 | | | 459 | |
| Coca-Cola Enterprises Inc. | 7.375 | % | 3/3/14 | | 125 | | | 146 | |
| Coca-Cola Enterprises Inc. | 4.250 | % | 3/1/15 | | 375 | | | 395 | |
| Coca-Cola Enterprises Inc. | 4.500 | % | 8/15/19 | | 75 | | | 75 | |
| Coca-Cola Enterprises Inc. | 8.500 | % | 2/1/22 | | 225 | | | 288 | |
| Coca-Cola Enterprises Inc. | 7.000 | % | 10/1/26 | | 550 | | | 640 | |
| Coca-Cola Enterprises Inc. | 6.950 | % | 11/15/26 | | 225 | | | 255 | |
| Coca-Cola Enterprises Inc. | 6.750 | % | 9/15/28 | | 100 | | | 113 | |
| ConAgra Foods Inc. | 7.125 | % | 10/1/26 | | 200 | | | 217 | |
| ConAgra Foods Inc. | 7.000 | % | 10/1/28 | | 50 | | | 53 | |
| ConAgra Foods Inc. | 8.250 | % | 9/15/30 | | 100 | | | 120 | |
| Covidien International Finance SA | 6.000 | % | 10/15/17 | | 500 | | | 539 | |
| Covidien International Finance SA | 6.550 | % | 10/15/37 | | 325 | | | 363 | |
| CR Bard Inc. | 6.700 | % | 12/1/26 | | 325 | | | 346 | |
| Delhaize Group SA | 5.875 | % | 2/1/14 | | 250 | | | 268 | |
| Diageo Capital PLC | 5.200 | % | 1/30/13 | | 150 | | | 161 | |
| Diageo Capital PLC | 7.375 | % | 1/15/14 | | 900 | | | 1,040 | |
| Diageo Capital PLC | 5.750 | % | 10/23/17 | | 475 | | | 512 | |
| Diageo Finance BV | 5.300 | % | 10/28/15 | | 50 | | | 54 | |
| Diageo Investment Corp. | 9.000 | % | 8/15/11 | | 775 | | | 862 | |
| Dr Pepper Snapple Group Inc. | 1.700 | % | 12/21/11 | | 175 | | | 175 | |
| Dr Pepper Snapple Group Inc. | 2.350 | % | 12/21/12 | | 200 | | | 200 | |
| Dr Pepper Snapple Group Inc. | 6.120 | % | 5/1/13 | | 75 | | | 82 | |
| Dr Pepper Snapple Group Inc. | 6.820 | % | 5/1/18 | | 225 | | | 254 | |
| Dr Pepper Snapple Group Inc. | 7.450 | % | 5/1/38 | | 50 | | | 59 | |
| Eli Lilly & Co. | 3.550 | % | 3/6/12 | | 425 | | | 442 | |
| Eli Lilly & Co. | 6.000 | % | 3/15/12 | | 400 | | | 437 | |
| Eli Lilly & Co. | 5.500 | % | 3/15/27 | | 500 | | | 505 | |
| Express Scripts Inc. | 5.250 | % | 6/15/12 | | 250 | | | 266 | |
| Express Scripts Inc. | 6.250 | % | 6/15/14 | | 275 | | | 301 | |
| Express Scripts Inc. | 7.250 | % | 6/15/19 | | 100 | | | 114 | |
| Fortune Brands Inc. | 5.125 | % | 1/15/11 | | 500 | | | 515 | |
| Fortune Brands Inc. | 3.000 | % | 6/1/12 | | 425 | | | 422 | |
| Fortune Brands Inc. | 6.375 | % | 6/15/14 | | 200 | | | 214 | |
| Fortune Brands Inc. | 5.875 | % | 1/15/36 | | 100 | | | 86 | |
| Genentech Inc. | 4.750 | % | 7/15/15 | | 225 | | | 240 | |
| Genentech Inc. | 5.250 | % | 7/15/35 | | 100 | | | 96 | |
| General Mills Inc. | 6.000 | % | 2/15/12 | | 1,508 | | | 1,632 | |
| General Mills Inc. | 5.650 | % | 9/10/12 | | 25 | | | 27 | |
| General Mills Inc. | 5.250 | % | 8/15/13 | | 500 | | | 540 | |
| General Mills Inc. | 5.200 | % | 3/17/15 | | 135 | | | 145 | |
| GlaxoSmithKline Capital Inc. | 4.850 | % | 5/15/13 | | 1,025 | | | 1,095 | |
| GlaxoSmithKline Capital Inc. | 4.375 | % | 4/15/14 | | 400 | | | 422 | |
| GlaxoSmithKline Capital Inc. | 5.650 | % | 5/15/18 | | 650 | | | 700 | |
| GlaxoSmithKline Capital Inc. | 6.375 | % | 5/15/38 | | 1,125 | | | 1,251 | |
| Hasbro Inc. | 6.300 | % | 9/15/17 | | 425 | | | 449 | |
| Hershey Co. | 5.450 | % | 9/1/16 | | 50 | | | 52 | |
| HJ Heinz Finance Co. | 6.625 | % | 7/15/11 | | 475 | | | 509 | |
| HJ Heinz Finance Co. | 6.750 | % | 3/15/32 | | 375 | | | 393 | |
| Hospira Inc. | 5.900 | % | 6/15/14 | | 50 | | | 54 | |
| Hospira Inc. | 6.400 | % | 5/15/15 | | 75 | | | 83 | |
| Johnson & Johnson | 5.550 | % | 8/15/17 | | 225 | | | 249 | |
| Johnson & Johnson | 5.150 | % | 7/15/18 | | 100 | | | 107 | |
| Johnson & Johnson | 6.950 | % | 9/1/29 | | 50 | | | 60 | |
45
| | | | | | | | | |
| Institutional Total Bond Market Index Fund | | | | | | | | | |
| |
| |
| |
| | | | | | Face | | | Market | |
| | | | Maturity | | Amount | | | Value• | |
| | Coupon | | Date | ($ | 000 | ) | ($ | 000 | ) |
| Johnson & Johnson | 4.950 | % | 5/15/33 | | 600 | | | 585 | |
| Johnson & Johnson | 5.950 | % | 8/15/37 | | 500 | | | 553 | |
| Johnson & Johnson | 5.850 | % | 7/15/38 | | 125 | | | 135 | |
| Kellogg Co. | 4.250 | % | 3/6/13 | | 175 | | | 185 | |
| Kellogg Co. | 4.150 | % | 11/15/19 | | 475 | | | 464 | |
| Kimberly-Clark Corp. | 5.625 | % | 2/15/12 | | 275 | | | 295 | |
| Kimberly-Clark Corp. | 4.875 | % | 8/15/15 | | 375 | | | 404 | |
| Kimberly-Clark Corp. | 6.125 | % | 8/1/17 | | 125 | | | 138 | |
| Koninklijke Philips Electronics NV | 4.625 | % | 3/11/13 | | 200 | | | 210 | |
| Koninklijke Philips Electronics NV | 5.750 | % | 3/11/18 | | 475 | | | 505 | |
| Koninklijke Philips Electronics NV | 6.875 | % | 3/11/38 | | 425 | | | 482 | |
| Kraft Foods Inc. | 5.625 | % | 11/1/11 | | 875 | | | 931 | |
| Kraft Foods Inc. | 6.250 | % | 6/1/12 | | 50 | | | 54 | |
| Kraft Foods Inc. | 6.750 | % | 2/19/14 | | 150 | | | 167 | |
| Kraft Foods Inc. | 6.500 | % | 8/11/17 | | 400 | | | 434 | |
| Kraft Foods Inc. | 6.500 | % | 11/1/31 | | 925 | | | 932 | |
| Kraft Foods Inc. | 7.000 | % | 8/11/37 | | 875 | | | 932 | |
| Kraft Foods Inc. | 6.875 | % | 2/1/38 | | 300 | | | 315 | |
| Kraft Foods Inc. | 6.875 | % | 1/26/39 | | 150 | | | 158 | |
| Kroger Co. | 6.800 | % | 4/1/11 | | 550 | | | 584 | |
| Kroger Co. | 6.200 | % | 6/15/12 | | 225 | | | 245 | |
| Kroger Co. | 6.400 | % | 8/15/17 | | 10 | | | 11 | |
| Kroger Co. | 6.800 | % | 12/15/18 | | 425 | | | 475 | |
| Kroger Co. | 6.150 | % | 1/15/20 | | 370 | | | 396 | |
| Kroger Co. | 7.700 | % | 6/1/29 | | 625 | | | 731 | |
| Kroger Co. | 8.000 | % | 9/15/29 | | 500 | | | 599 | |
| Laboratory Corp. of America Holdings | 5.625 | % | 12/15/15 | | 150 | | | 157 | |
| Lorillard Tobacco Co. | 8.125 | % | 6/23/19 | | 525 | | | 577 | |
| McKesson Corp. | 7.750 | % | 2/1/12 | | 200 | | | 221 | |
| McKesson Corp. | 5.250 | % | 3/1/13 | | 625 | | | 664 | |
| 5 Mead Johnson Nutrition Co. | 3.500 | % | 11/1/14 | | 75 | | | 74 | |
| 5 Mead Johnson Nutrition Co. | 4.900 | % | 11/1/19 | | 150 | | | 147 | |
| 5 Mead Johnson Nutrition Co. | 5.900 | % | 11/1/39 | | 175 | | | 171 | |
| Medco Health Solutions Inc. | 7.250 | % | 8/15/13 | | 625 | | | 694 | |
| Medtronic Inc. | 4.750 | % | 9/15/15 | | 575 | | | 620 | |
| Merck & Co. Inc. | 1.875 | % | 6/30/11 | | 400 | | | 405 | |
| Merck & Co. Inc. | 4.375 | % | 2/15/13 | | 150 | | | 159 | |
| Merck & Co. Inc. | 5.300 | % | 12/1/13 | | 225 | | | 248 | |
| Merck & Co. Inc. | 4.750 | % | 3/1/15 | | 425 | | | 459 | |
| Merck & Co. Inc. | 4.000 | % | 6/30/15 | | 300 | | | 315 | |
| Merck & Co. Inc. | 5.000 | % | 6/30/19 | | 250 | | | 262 | |
| Merck & Co. Inc. | 6.400 | % | 3/1/28 | | 550 | | | 602 | |
| Merck & Co. Inc. | 5.950 | % | 12/1/28 | | 100 | | | 107 | |
| Merck & Co. Inc. | 6.500 | % | 12/1/33 | | 515 | | | 583 | |
| Merck & Co. Inc. | 6.550 | % | 9/15/37 | | 450 | | | 516 | |
| Merck & Co. Inc. | 5.850 | % | 6/30/39 | | 250 | | | 267 | |
| Novant Health Inc. | 5.850 | % | 11/1/19 | | 325 | | | 323 | |
| Novartis Capital Corp. | 4.125 | % | 2/10/14 | | 1,150 | | | 1,206 | |
| Novartis Securities Investment Ltd. | 5.125 | % | 2/10/19 | | 850 | | | 887 | |
| Pepsi Bottling Group Inc. | 7.000 | % | 3/1/29 | | 200 | | | 233 | |
| PepsiAmericas Inc. | 5.750 | % | 7/31/12 | | 225 | | | 245 | |
| PepsiAmericas Inc. | 4.375 | % | 2/15/14 | | 50 | | | 52 | |
| PepsiAmericas Inc. | 5.000 | % | 5/15/17 | | 250 | | | 263 | |
| PepsiCo Inc. | 5.150 | % | 5/15/12 | | 200 | | | 216 | |
| PepsiCo Inc. | 4.650 | % | 2/15/13 | | 125 | | | 134 | |
| PepsiCo Inc. | 3.750 | % | 3/1/14 | | 650 | | | 674 | |
46
| | | | | | | | | |
| Institutional Total Bond Market Index Fund | | | | | | | | | |
| |
| |
| |
| | | | | | Face | | | Market | |
| | | | Maturity | | Amount | | | Value• | |
| | Coupon | | Date | ($ | 000 | ) | ($ | 000 | ) |
| PepsiCo Inc. | 5.000 | % | 6/1/18 | | 750 | | | 783 | |
| PepsiCo Inc. | 7.900 | % | 11/1/18 | | 775 | | | 950 | |
| Pfizer Inc. | 4.450 | % | 3/15/12 | | 1,450 | | | 1,535 | |
| Pfizer Inc. | 5.350 | % | 3/15/15 | | 950 | | | 1,041 | |
| Pfizer Inc. | 6.200 | % | 3/15/19 | | 1,325 | | | 1,475 | |
| Pfizer Inc. | 7.200 | % | 3/15/39 | | 1,300 | | | 1,600 | |
| Pharmacia Corp. | 6.600 | % | 12/1/28 | | 325 | | | 361 | |
| Philip Morris International Inc. | 4.875 | % | 5/16/13 | | 650 | | | 691 | |
| Philip Morris International Inc. | 6.875 | % | 3/17/14 | | 600 | | | 683 | |
| Philip Morris International Inc. | 5.650 | % | 5/16/18 | | 230 | | | 242 | |
| Philip Morris International Inc. | 6.375 | % | 5/16/38 | | 505 | | | 546 | |
| 3 Procter & Gamble - Esop | 9.360 | % | 1/1/21 | | 409 | | | 511 | |
| Procter & Gamble Co. | 4.950 | % | 8/15/14 | | 425 | | | 462 | |
| Procter & Gamble Co. | 3.500 | % | 2/15/15 | | 300 | | | 307 | |
| Procter & Gamble Co. | 4.700 | % | 2/15/19 | | 225 | | | 230 | |
| Procter & Gamble Co. | 6.450 | % | 1/15/26 | | 1,000 | | | 1,129 | |
| Procter & Gamble Co. | 5.800 | % | 8/15/34 | | 225 | | | 238 | |
| Quest Diagnostics Inc. | 6.400 | % | 7/1/17 | | 65 | | | 72 | |
| Quest Diagnostics Inc. | 6.950 | % | 7/1/37 | | 470 | | | 524 | |
| Reynolds American Inc. | 7.250 | % | 6/1/12 | | 500 | | | 544 | |
| Reynolds American Inc. | 7.250 | % | 6/15/37 | | 365 | | | 368 | |
| Safeway Inc. | 6.500 | % | 3/1/11 | | 1,150 | | | 1,213 | |
| Safeway Inc. | 5.800 | % | 8/15/12 | | 100 | | | 109 | |
| Safeway Inc. | 6.350 | % | 8/15/17 | | 100 | | | 109 | |
| Safeway Inc. | 7.250 | % | 2/1/31 | | 400 | | | 457 | |
| St. Jude Medical Inc. | 3.750 | % | 7/15/14 | | 475 | | | 483 | |
| St. Jude Medical Inc. | 4.875 | % | 7/15/19 | | 75 | | | 76 | |
| Sysco Corp. | 4.200 | % | 2/12/13 | | 50 | | | 52 | |
| Sysco Corp. | 5.250 | % | 2/12/18 | | 850 | | | 900 | |
| Sysco Corp. | 5.375 | % | 9/21/35 | | 225 | | | 224 | |
| Teva Pharmaceutical Finance Co. LLC | 5.550 | % | 2/1/16 | | 325 | | | 343 | |
| 5 Thermo Fisher Scientific Inc. | 2.150 | % | 12/28/12 | | 125 | | | 124 | |
| 5 Thermo Fisher Scientific Inc. | 3.250 | % | 11/18/14 | | 125 | | | 124 | |
| Unilever Capital Corp. | 7.125 | % | 11/1/10 | | 775 | | | 816 | |
| Unilever Capital Corp. | 3.650 | % | 2/15/14 | | 275 | | | 283 | |
| Unilever Capital Corp. | 4.800 | % | 2/15/19 | | 125 | | | 128 | |
| UST Inc. | 5.750 | % | 3/1/18 | | 225 | | | 221 | |
| Watson Pharmaceuticals Inc. | 5.000 | % | 8/15/14 | | 600 | | | 614 | |
| Whirlpool Corp. | 5.500 | % | 3/1/13 | | 800 | | | 825 | |
| Wyeth | 6.950 | % | 3/15/11 | | 275 | | | 295 | |
| Wyeth | 5.500 | % | 2/15/16 | | 75 | | | 81 | |
| Wyeth | 6.450 | % | 2/1/24 | | 75 | | | 84 | |
| Wyeth | 6.500 | % | 2/1/34 | | 775 | | | 852 | |
| Wyeth | 6.000 | % | 2/15/36 | | 175 | | | 182 | |
| Wyeth | 5.950 | % | 4/1/37 | | 1,050 | | | 1,100 | |
| Zimmer Holdings Inc. | 5.750 | % | 11/30/39 | | 125 | | | 123 | |
| |
| Energy (1.4%) | | | | | | | | | |
| Alberta Energy Co. Ltd. | 7.375 | % | 11/1/31 | | 175 | | | 195 | |
| Anadarko Finance Co. | 6.750 | % | 5/1/11 | | 550 | | | 584 | |
| Anadarko Finance Co. | 7.500 | % | 5/1/31 | | 10 | | | 11 | |
| Anadarko Petroleum Corp. | 7.625 | % | 3/15/14 | | 350 | | | 402 | |
| Anadarko Petroleum Corp. | 5.750 | % | 6/15/14 | | 100 | | | 108 | |
| Anadarko Petroleum Corp. | 5.950 | % | 9/15/16 | | 500 | | | 537 | |
| Anadarko Petroleum Corp. | 6.450 | % | 9/15/36 | | 725 | | | 755 | |
| Anadarko Petroleum Corp. | 7.950 | % | 6/15/39 | | 125 | | | 154 | |
47
| | | | | | | | | |
| Institutional Total Bond Market Index Fund | | | | | | | | | |
| |
| |
| |
| | | | | | Face | | | Market | |
| | | | Maturity | | Amount | | | Value• | |
| | Coupon | | Date | ($ | 000 | ) | ($ | 000 | ) |
| Apache Corp. | 6.250 | % | 4/15/12 | | 350 | | | 382 | |
| Apache Corp. | 5.250 | % | 4/15/13 | | 100 | | | 107 | |
| Apache Corp. | 6.000 | % | 9/15/13 | | 225 | | | 247 | |
| Apache Corp. | 5.625 | % | 1/15/17 | | 50 | | | 54 | |
| Apache Corp. | 6.900 | % | 9/15/18 | | 525 | | | 615 | |
| Apache Corp. | 6.000 | % | 1/15/37 | | 150 | | | 159 | |
| Apache Finance Canada Corp. | 7.750 | % | 12/15/29 | | 50 | | | 61 | |
| Baker Hughes Inc. | 6.875 | % | 1/15/29 | | 75 | | | 83 | |
| BJ Services Co. | 6.000 | % | 6/1/18 | | 50 | | | 54 | |
| BP Capital Markets PLC | 5.250 | % | 11/7/13 | | 750 | | | 817 | |
| BP Capital Markets PLC | 3.625 | % | 5/8/14 | | 900 | | | 920 | |
| BP Capital Markets PLC | 4.750 | % | 3/10/19 | | 1,050 | | | 1,071 | |
| Burlington Resources Finance Co. | 6.680 | % | 2/15/11 | | 325 | | | 345 | |
| Burlington Resources Finance Co. | 6.500 | % | 12/1/11 | | 425 | | | 465 | |
| Burlington Resources Finance Co. | 7.200 | % | 8/15/31 | | 100 | | | 112 | |
| Burlington Resources Finance Co. | 7.400 | % | 12/1/31 | | 650 | | | 744 | |
| Canadian Natural Resources Ltd. | 5.150 | % | 2/1/13 | | 50 | | | 53 | |
| Canadian Natural Resources Ltd. | 4.900 | % | 12/1/14 | | 1,075 | | | 1,131 | |
| Canadian Natural Resources Ltd. | 7.200 | % | 1/15/32 | | 575 | | | 648 | |
| Canadian Natural Resources Ltd. | 6.450 | % | 6/30/33 | | 425 | | | 442 | |
| Canadian Natural Resources Ltd. | 6.500 | % | 2/15/37 | | 300 | | | 316 | |
| Canadian Natural Resources Ltd. | 6.250 | % | 3/15/38 | | 150 | | | 155 | |
| Canadian Natural Resources Ltd. | 6.750 | % | 2/1/39 | | 25 | | | 28 | |
| 5 Cenovus Energy Inc. | 4.500 | % | 9/15/14 | | 1,050 | | | 1,077 | |
| 5 Cenovus Energy Inc. | 5.700 | % | 10/15/19 | | 475 | | | 481 | |
| 5 Cenovus Energy Inc. | 6.750 | % | 11/15/39 | | 1,525 | | | 1,607 | |
| Chevron Corp. | 3.450 | % | 3/3/12 | | 425 | | | 443 | |
| Chevron Corp. | 3.950 | % | 3/3/14 | | 500 | | | 526 | |
| Chevron Corp. | 4.950 | % | 3/3/19 | | 625 | | | 658 | |
| Conoco Funding Co. | 6.350 | % | 10/15/11 | | 550 | | | 601 | |
| Conoco Funding Co. | 7.250 | % | 10/15/31 | | 75 | | | 87 | |
| ConocoPhillips | 4.750 | % | 2/1/14 | | 300 | | | 322 | |
| ConocoPhillips | 5.750 | % | 2/1/19 | | 1,000 | | | 1,097 | |
| ConocoPhillips | 6.000 | % | 1/15/20 | | 75 | | | 83 | |
| ConocoPhillips | 6.500 | % | 2/1/39 | | 450 | | | 500 | |
| ConocoPhillips Canada Funding Co. I | 5.300 | % | 4/15/12 | | 675 | | | 726 | |
| ConocoPhillips Canada Funding Co. I | 5.950 | % | 10/15/36 | | 425 | | | 423 | |
| ConocoPhillips Holding Co. | 6.950 | % | 4/15/29 | | 225 | | | 255 | |
| Devon Energy Corp. | 5.625 | % | 1/15/14 | | 500 | | | 544 | |
| Devon Energy Corp. | 7.950 | % | 4/15/32 | | 75 | | | 95 | |
| Devon Financing Corp. ULC | 6.875 | % | 9/30/11 | | 600 | | | 651 | |
| Devon Financing Corp. ULC | 7.875 | % | 9/30/31 | | 400 | | | 497 | |
| Devon OEI Operating Inc. | 7.250 | % | 10/1/11 | | 50 | | | 55 | |
| Diamond Offshore Drilling Inc. | 4.875 | % | 7/1/15 | | 25 | | | 27 | |
| Diamond Offshore Drilling Inc. | 5.875 | % | 5/1/19 | | 225 | | | 240 | |
| Diamond Offshore Drilling Inc. | 5.700 | % | 10/15/39 | | 175 | | | 172 | |
| EnCana Corp. | 4.750 | % | 10/15/13 | | 75 | | | 79 | |
| EnCana Corp. | 7.200 | % | 11/1/31 | | 200 | | | 216 | |
| EnCana Corp. | 6.500 | % | 8/15/34 | | 550 | | | 590 | |
| EnCana Corp. | 6.625 | % | 8/15/37 | | 625 | | | 683 | |
| EnCana Holdings Finance Corp. | 5.800 | % | 5/1/14 | | 325 | | | 356 | |
| EOG Resources Inc. | 6.125 | % | 10/1/13 | | 350 | | | 387 | |
| Halliburton Co. | 6.150 | % | 9/15/19 | | 150 | | | 168 | |
| Halliburton Co. | 6.700 | % | 9/15/38 | | 600 | | | 672 | |
| Halliburton Co. | 7.450 | % | 9/15/39 | | 650 | | | 803 | |
| Hess Corp. | 8.125 | % | 2/15/19 | | 600 | | | 724 | |
48
| | | | | | | | | |
| Institutional Total Bond Market Index Fund | | | | | | | | | |
| |
| |
| |
| | | | | | Face | | | Market | |
| | | | Maturity | | Amount | | | Value• | |
| | Coupon | | Date | ($ | 000 | ) | ($ | 000 | ) |
| Hess Corp. | 7.875 | % | 10/1/29 | | 670 | | | 798 | |
| Husky Energy Inc. | 6.250 | % | 6/15/12 | | 75 | | | 81 | |
| Husky Energy Inc. | 5.900 | % | 6/15/14 | | 325 | | | 354 | |
| Husky Energy Inc. | 7.250 | % | 12/15/19 | | 350 | | | 404 | |
| Husky Energy Inc. | 6.800 | % | 9/15/37 | | 300 | | | 314 | |
| Kerr-McGee Corp. | 6.875 | % | 9/15/11 | | 375 | | | 404 | |
| Kerr-McGee Corp. | 6.950 | % | 7/1/24 | | 585 | | | 636 | |
| Kerr-McGee Corp. | 7.875 | % | 9/15/31 | | 350 | | | 399 | |
| Lasmo USA Inc. | 7.300 | % | 11/15/27 | | 55 | | | 65 | |
| Marathon Global Funding Corp. | 6.000 | % | 7/1/12 | | 225 | | | 243 | |
| Marathon Oil Corp. | 6.125 | % | 3/15/12 | | 200 | | | 216 | |
| Marathon Oil Corp. | 6.600 | % | 10/1/37 | | 145 | | | 154 | |
| Nabors Industries Inc. | 6.150 | % | 2/15/18 | | 100 | | | 104 | |
| Nabors Industries Inc. | 9.250 | % | 1/15/19 | | 600 | | | 737 | |
| Nexen Inc. | 5.050 | % | 11/20/13 | | 150 | | | 158 | |
| Nexen Inc. | 5.650 | % | 5/15/17 | | 225 | | | 234 | |
| Nexen Inc. | 7.875 | % | 3/15/32 | | 100 | | | 116 | |
| Nexen Inc. | 7.500 | % | 7/30/39 | | 950 | | | 1,068 | |
| Noble Energy Inc. | 8.000 | % | 4/1/27 | | 275 | | | 307 | |
| Occidental Petroleum Corp. | 4.250 | % | 3/15/10 | | 425 | | | 428 | |
| Occidental Petroleum Corp. | 6.750 | % | 1/15/12 | | 150 | | | 164 | |
| PC Financial Partnership | 5.000 | % | 11/15/14 | | 450 | | | 467 | |
| Petro-Canada | 4.000 | % | 7/15/13 | | 100 | | | 103 | |
| Petro-Canada | 6.050 | % | 5/15/18 | | 425 | | | 454 | |
| Petro-Canada | 7.875 | % | 6/15/26 | | 150 | | | 173 | |
| Petro-Canada | 7.000 | % | 11/15/28 | | 125 | | | 134 | |
| Petro-Canada | 5.350 | % | 7/15/33 | | 125 | | | 113 | |
| Petro-Canada | 5.950 | % | 5/15/35 | | 150 | | | 143 | |
| Questar Market Resources Inc. | 6.050 | % | 9/1/16 | | 150 | | | 153 | |
| Questar Market Resources Inc. | 6.800 | % | 3/1/20 | | 150 | | | 157 | |
| Rowan Cos. Inc. | 7.875 | % | 8/1/19 | | 150 | | | 167 | |
| Shell International Finance BV | 5.625 | % | 6/27/11 | | 275 | | | 293 | |
| Shell International Finance BV | 4.950 | % | 3/22/12 | | 200 | | | 214 | |
| Shell International Finance BV | 4.000 | % | 3/21/14 | | 625 | | | 654 | |
| Shell International Finance BV | 3.250 | % | 9/22/15 | | 750 | | | 751 | |
| Shell International Finance BV | 5.200 | % | 3/22/17 | | 175 | | | 188 | |
| Shell International Finance BV | 4.300 | % | 9/22/19 | | 1,125 | | | 1,113 | |
| Shell International Finance BV | 6.375 | % | 12/15/38 | | 925 | | | 1,029 | |
| Smith International Inc. | 9.750 | % | 3/15/19 | | 700 | | | 887 | |
| Statoil ASA | 3.875 | % | 4/15/14 | | 75 | | | 78 | |
| Statoil ASA | 2.900 | % | 10/15/14 | | 25 | | | 25 | |
| Statoil ASA | 5.250 | % | 4/15/19 | | 425 | | | 451 | |
| Statoil ASA | 7.250 | % | 9/23/27 | | 675 | | | 796 | |
| Statoil ASA | 7.150 | % | 1/15/29 | | 125 | | | 147 | |
| Suncor Energy Inc. | 6.100 | % | 6/1/18 | | 200 | | | 215 | |
| Suncor Energy Inc. | 5.950 | % | 12/1/34 | | 100 | | | 99 | |
| Suncor Energy Inc. | 6.500 | % | 6/15/38 | | 725 | | | 762 | |
| Suncor Energy Inc. | 6.850 | % | 6/1/39 | | 700 | | | 778 | |
| Sunoco Inc. | 4.875 | % | 10/15/14 | | 50 | | | 50 | |
| Sunoco Inc. | 5.750 | % | 1/15/17 | | 150 | | | 153 | |
| Talisman Energy Inc. | 5.125 | % | 5/15/15 | | 50 | | | 52 | |
| Talisman Energy Inc. | 7.750 | % | 6/1/19 | | 325 | | | 381 | |
| Talisman Energy Inc. | 5.850 | % | 2/1/37 | | 650 | | | 617 | |
| Tosco Corp. | 8.125 | % | 2/15/30 | | 675 | | | 820 | |
| Total Capital SA | 3.125 | % | 10/2/15 | | 25 | | | 25 | |
| Transocean Inc. | 5.250 | % | 3/15/13 | | 125 | | | 134 | |
49
| | | | | | | | | |
| Institutional Total Bond Market Index Fund | | | | | | | | | |
| |
| |
| |
| | | | | | Face | | | Market | |
| | | | Maturity | | Amount | | | Value• | |
| | Coupon | | Date | ($ | 000 | ) | ($ | 000 | ) |
| Transocean Inc. | 6.000 | % | 3/15/18 | | 375 | | | 400 | |
| Transocean Inc. | 7.500 | % | 4/15/31 | | 200 | | | 232 | |
| Transocean Inc. | 6.800 | % | 3/15/38 | | 160 | | | 178 | |
| Valero Energy Corp. | 6.875 | % | 4/15/12 | | 375 | | | 403 | |
| Valero Energy Corp. | 9.375 | % | 3/15/19 | | 400 | | | 477 | |
| Valero Energy Corp. | 7.500 | % | 4/15/32 | | 475 | | | 486 | |
| Valero Energy Corp. | 6.625 | % | 6/15/37 | | 675 | | | 630 | |
| Weatherford International Inc. | 6.350 | % | 6/15/17 | | 350 | | | 367 | |
| Weatherford International Inc. | 6.800 | % | 6/15/37 | | 100 | | | 100 | |
| Weatherford International Ltd. | 5.500 | % | 2/15/16 | | 40 | | | 41 | |
| Weatherford International Ltd. | 9.625 | % | 3/1/19 | | 375 | | | 468 | |
| Weatherford International Ltd. | 6.500 | % | 8/1/36 | | 425 | | | 405 | |
| Weatherford International Ltd. | 7.000 | % | 3/15/38 | | 350 | | | 355 | |
| XTO Energy Inc. | 5.900 | % | 8/1/12 | | 200 | | | 218 | |
| XTO Energy Inc. | 6.250 | % | 4/15/13 | | 225 | | | 251 | |
| XTO Energy Inc. | 5.750 | % | 12/15/13 | | 725 | | | 806 | |
| XTO Energy Inc. | 4.900 | % | 2/1/14 | | 375 | | | 403 | |
| XTO Energy Inc. | 5.000 | % | 1/31/15 | | 50 | | | 54 | |
| XTO Energy Inc. | 5.300 | % | 6/30/15 | | 100 | | | 110 | |
| XTO Energy Inc. | 6.250 | % | 8/1/17 | | 750 | | | 852 | |
| XTO Energy Inc. | 6.500 | % | 12/15/18 | | 950 | | | 1,090 | |
| XTO Energy Inc. | 6.100 | % | 4/1/36 | | 50 | | | 54 | |
| |
| Other Industrial (0.0%) | | | | | | | | | |
| Cintas Corp. | 6.125 | % | 12/1/17 | | 200 | | | 213 | |
| |
| Technology (0.7%) | | | | | | | | | |
| Agilent Technologies Inc. | 4.450 | % | 9/14/12 | | 25 | | | 26 | |
| Agilent Technologies Inc. | 5.500 | % | 9/14/15 | | 50 | | | 52 | |
| Agilent Technologies Inc. | 6.500 | % | 11/1/17 | | 950 | | | 1,007 | |
| Amphenol Corp. | 4.750 | % | 11/15/14 | | 425 | | | 425 | |
| Analog Devices Inc. | 5.000 | % | 7/1/14 | | 250 | | | 262 | |
| Avnet Inc. | 6.625 | % | 9/15/16 | | 235 | | | 240 | |
| BMC Software Inc. | 7.250 | % | 6/1/18 | | 150 | | | 163 | |
| CA Inc. | 5.375 | % | 12/1/19 | | 575 | | | 581 | |
| Cisco Systems Inc. | 5.250 | % | 2/22/11 | | 1,250 | | | 1,312 | |
| Cisco Systems Inc. | 2.900 | % | 11/17/14 | | 450 | | | 452 | |
| Cisco Systems Inc. | 5.500 | % | 2/22/16 | | 600 | | | 662 | |
| Cisco Systems Inc. | 4.950 | % | 2/15/19 | | 325 | | | 335 | |
| Cisco Systems Inc. | 4.450 | % | 1/15/20 | | 75 | | | 74 | |
| Cisco Systems Inc. | 5.900 | % | 2/15/39 | | 1,750 | | | 1,766 | |
| Cisco Systems Inc. | 5.500 | % | 1/15/40 | | 375 | | | 360 | |
| Corning Inc. | 6.625 | % | 5/15/19 | | 50 | | | 54 | |
| Dell Inc. | 4.700 | % | 4/15/13 | | 350 | | | 369 | |
| Dell Inc. | 5.650 | % | 4/15/18 | | 200 | | | 210 | |
| Dell Inc. | 5.875 | % | 6/15/19 | | 125 | | | 133 | |
| Dell Inc. | 6.500 | % | 4/15/38 | | 250 | | | 255 | |
| Electronic Data Systems LLC | 6.000 | % | 8/1/13 | | 325 | | | 361 | |
| Equifax Inc. | 4.450 | % | 12/1/14 | | 50 | | | 50 | |
| Equifax Inc. | 6.300 | % | 7/1/17 | | 100 | | | 103 | |
| Equifax Inc. | 7.000 | % | 7/1/37 | | 125 | | | 124 | |
| Fiserv Inc. | 6.125 | % | 11/20/12 | | 325 | | | 354 | |
| Fiserv Inc. | 6.800 | % | 11/20/17 | | 450 | | | 495 | |
| Harris Corp. | 5.000 | % | 10/1/15 | | 225 | | | 233 | |
| Hewlett-Packard Co. | 2.250 | % | 5/27/11 | | 125 | | | 127 | |
| Hewlett-Packard Co. | 4.250 | % | 2/24/12 | | 325 | | | 342 | |
50
| | | | | | | | | |
| Institutional Total Bond Market Index Fund | | | | | | | | | |
| |
| |
| |
| | | | | | Face | | | Market | |
| | | | Maturity | | Amount | | | Value• | |
| | Coupon | | Date | ($ | 000 | ) | ($ | 000 | ) |
| Hewlett-Packard Co. | 4.500 | % | 3/1/13 | | 325 | | | 346 | |
| Hewlett-Packard Co. | 6.125 | % | 3/1/14 | | 950 | | | 1,062 | |
| Hewlett-Packard Co. | 4.750 | % | 6/2/14 | | 500 | | | 534 | |
| Hewlett-Packard Co. | 5.400 | % | 3/1/17 | | 425 | | | 452 | |
| Hewlett-Packard Co. | 5.500 | % | 3/1/18 | | 975 | | | 1,035 | |
| IBM International Group Capital LLC | 5.050 | % | 10/22/12 | | 325 | | | 351 | |
| International Business Machines Corp. | 4.950 | % | 3/22/11 | | 150 | | | 157 | |
| International Business Machines Corp. | 7.500 | % | 6/15/13 | | 325 | | | 378 | |
| International Business Machines Corp. | 5.700 | % | 9/14/17 | | 2,325 | | | 2,543 | |
| International Business Machines Corp. | 7.000 | % | 10/30/25 | | 200 | | | 231 | |
| International Business Machines Corp. | 6.220 | % | 8/1/27 | | 500 | | | 531 | |
| International Business Machines Corp. | 5.875 | % | 11/29/32 | | 100 | | | 103 | |
| International Business Machines Corp. | 5.600 | % | 11/30/39 | | 600 | | | 606 | |
| International Game Technology | 7.500 | % | 6/15/19 | | 100 | | | 109 | |
| Intuit Inc. | 5.400 | % | 3/15/12 | | 200 | | | 213 | |
| Intuit Inc. | 5.750 | % | 3/15/17 | | 100 | | | 104 | |
| Lexmark International Inc. | 5.900 | % | 6/1/13 | | 125 | | | 128 | |
| Lexmark International Inc. | 6.650 | % | 6/1/18 | | 325 | | | 320 | |
| Microsoft Corp. | 2.950 | % | 6/1/14 | | 400 | | | 405 | |
| Microsoft Corp. | 4.200 | % | 6/1/19 | | 50 | | | 50 | |
| Microsoft Corp. | 5.200 | % | 6/1/39 | | 450 | | | 441 | |
| Motorola Inc. | 5.375 | % | 11/15/12 | | 225 | | | 229 | |
| Motorola Inc. | 7.500 | % | 5/15/25 | | 50 | | | 48 | |
| Motorola Inc. | 6.500 | % | 9/1/25 | | 25 | | | 22 | |
| Motorola Inc. | 6.500 | % | 11/15/28 | | 100 | | | 86 | |
| Motorola Inc. | 6.625 | % | 11/15/37 | | 250 | | | 216 | |
| Nokia Oyj | 5.375 | % | 5/15/19 | | 225 | | | 231 | |
| Nokia Oyj | 6.625 | % | 5/15/39 | | 175 | | | 190 | |
| Oracle Corp. | 5.000 | % | 1/15/11 | | 500 | | | 522 | |
| Oracle Corp. | 4.950 | % | 4/15/13 | | 1,750 | | | 1,888 | |
| Oracle Corp. | 5.250 | % | 1/15/16 | | 500 | | | 540 | |
| Oracle Corp. | 5.750 | % | 4/15/18 | | 425 | | | 461 | |
| Oracle Corp. | 5.000 | % | 7/8/19 | | 875 | | | 905 | |
| Oracle Corp. | 6.125 | % | 7/8/39 | | 450 | | | 474 | |
| Pitney Bowes Inc. | 3.875 | % | 6/15/13 | | 225 | | | 231 | |
| Pitney Bowes Inc. | 4.750 | % | 1/15/16 | | 1,200 | | | 1,246 | |
| Science Applications International Corp. | 6.250 | % | 7/1/12 | | 50 | | | 55 | |
| Science Applications International Corp. | 5.500 | % | 7/1/33 | | 50 | | | 45 | |
| Xerox Capital Trust I | 8.000 | % | 2/1/27 | | 225 | | | 222 | |
| Xerox Corp. | 7.125 | % | 6/15/10 | | 425 | | | 437 | |
| Xerox Corp. | 6.875 | % | 8/15/11 | | 125 | | | 134 | |
| Xerox Corp. | 5.500 | % | 5/15/12 | | 290 | | | 307 | |
| Xerox Corp. | 7.625 | % | 6/15/13 | | 125 | | | 128 | |
| Xerox Corp. | 8.250 | % | 5/15/14 | | 400 | | | 462 | |
| Xerox Corp. | 4.250 | % | 2/15/15 | | 50 | | | 50 | |
| Xerox Corp. | 6.400 | % | 3/15/16 | | 295 | | | 312 | |
| Xerox Corp. | 6.750 | % | 2/1/17 | | 200 | | | 215 | |
| Xerox Corp. | 6.350 | % | 5/15/18 | | 375 | | | 394 | |
| Xerox Corp. | 5.625 | % | 12/15/19 | | 75 | | | 75 | |
| |
| Transportation (0.4%) | | | | | | | | | |
| 3 American Airlines Pass Through Trust 2009-1A | 10.375 | % | 7/2/19 | | 150 | | | 168 | |
| Burlington Northern Santa Fe Corp. | 6.750 | % | 7/15/11 | | 225 | | | 243 | |
| Burlington Northern Santa Fe Corp. | 5.650 | % | 5/1/17 | | 1,025 | | | 1,089 | |
| Burlington Northern Santa Fe Corp. | 7.000 | % | 12/15/25 | | 225 | | | 247 | |
| Burlington Northern Santa Fe Corp. | 6.200 | % | 8/15/36 | | 325 | | | 343 | |
51
| | | | | | | | | |
| Institutional Total Bond Market Index Fund | | | | | | | | | |
| |
| |
| |
| | | | | | Face | | | Market | |
| | | | Maturity | | Amount | | | Value• | |
| | Coupon | | Date | ($ | 000 | ) | ($ | 000 | ) |
| Canadian National Railway Co. | 6.375 | % | 10/15/11 | | 200 | | | 217 | |
| Canadian National Railway Co. | 4.400 | % | 3/15/13 | | 125 | | | 131 | |
| Canadian National Railway Co. | 5.850 | % | 11/15/17 | | 50 | | | 54 | |
| Canadian National Railway Co. | 6.250 | % | 8/1/34 | | 125 | | | 135 | |
| Canadian National Railway Co. | 6.200 | % | 6/1/36 | | 275 | | | 298 | |
| Canadian Pacific Railway Co. | 7.125 | % | 10/15/31 | | 75 | | | 79 | |
| Canadian Pacific Railway Co. | 5.950 | % | 5/15/37 | | 100 | | | 95 | |
| Con-way Inc. | 6.700 | % | 5/1/34 | | 225 | | | 176 | |
| 3 Continental Airlines Inc. | 6.648 | % | 9/15/17 | | 660 | | | 631 | |
| 3 Continental Airlines Inc. | 5.983 | % | 4/19/22 | | 105 | | | 101 | |
| CSX Corp. | 6.750 | % | 3/15/11 | | 525 | | | 557 | |
| CSX Corp. | 6.300 | % | 3/15/12 | | 200 | | | 216 | |
| CSX Corp. | 5.600 | % | 5/1/17 | | 50 | | | 52 | |
| CSX Corp. | 7.900 | % | 5/1/17 | | 425 | | | 492 | |
| CSX Corp. | 6.250 | % | 3/15/18 | | 475 | | | 515 | |
| CSX Corp. | 7.375 | % | 2/1/19 | | 1,250 | | | 1,436 | |
| CSX Corp. | 6.150 | % | 5/1/37 | | 225 | | | 229 | |
| 3 Delta Air Lines Inc. | 7.750 | % | 12/17/19 | | 100 | | | 103 | |
| 3 Delta Air Lines Inc. | 6.821 | % | 8/10/22 | | 712 | | | 684 | |
| Norfolk Southern Corp. | 6.750 | % | 2/15/11 | | 875 | | | 923 | |
| Norfolk Southern Corp. | 5.750 | % | 1/15/16 | | 300 | | | 318 | |
| Norfolk Southern Corp. | 7.700 | % | 5/15/17 | | 125 | | | 147 | |
| Norfolk Southern Corp. | 5.750 | % | 4/1/18 | | 75 | | | 80 | |
| Norfolk Southern Corp. | 5.900 | % | 6/15/19 | | 400 | | | 430 | |
| Norfolk Southern Corp. | 7.050 | % | 5/1/37 | | 30 | | | 36 | |
| Norfolk Southern Corp. | 7.900 | % | 5/15/97 | | 150 | | | 175 | |
| Norfolk Southern Railway Co. | 9.750 | % | 6/15/20 | | 283 | | | 377 | |
| Ryder System Inc. | 5.950 | % | 5/2/11 | | 68 | | | 70 | |
| Ryder System Inc. | 5.850 | % | 3/1/14 | | 150 | | | 157 | |
| Ryder System Inc. | 7.200 | % | 9/1/15 | | 225 | | | 244 | |
| Ryder System Inc. | 5.850 | % | 11/1/16 | | 50 | | | 50 | |
| Southwest Airlines Co. | 6.500 | % | 3/1/12 | | 475 | | | 496 | |
| Southwest Airlines Co. | 5.750 | % | 12/15/16 | | 200 | | | 194 | |
| Southwest Airlines Co. | 5.125 | % | 3/1/17 | | 50 | | | 47 | |
| 3 Southwest Airlines Co. 2007-1 | | | | | | | | | |
| Pass Through Trust 3 | 6.150 | % | 8/1/22 | | 343 | | | 343 | |
| Union Pacific Corp. | 6.125 | % | 1/15/12 | | 50 | | | 54 | |
| Union Pacific Corp. | 6.500 | % | 4/15/12 | | 125 | | | 136 | |
| Union Pacific Corp. | 5.450 | % | 1/31/13 | | 550 | | | 592 | |
| Union Pacific Corp. | 5.375 | % | 5/1/14 | | 325 | | | 348 | |
| Union Pacific Corp. | 5.750 | % | 11/15/17 | | 200 | | | 213 | |
| Union Pacific Corp. | 5.700 | % | 8/15/18 | | 225 | | | 236 | |
| Union Pacific Corp. | 7.875 | % | 1/15/19 | | 625 | | | 752 | |
| Union Pacific Corp. | 6.625 | % | 2/1/29 | | 250 | | | 270 | |
| 3 Union Pacific Railroad Co. 2007-3 | | | | | | | | | |
| Pass Through Trust | 6.176 | % | 1/2/31 | | 121 | | | 127 | |
| United Parcel Service Inc. | 3.875 | % | 4/1/14 | | 300 | | | 312 | |
| United Parcel Service Inc. | 5.500 | % | 1/15/18 | | 150 | | | 161 | |
| United Parcel Service Inc. | 5.125 | % | 4/1/19 | | 225 | | | 239 | |
| United Parcel Service Inc. | 6.200 | % | 1/15/38 | | 300 | | | 333 | |
| | | | | | | | | 415,571 | |
| Utilities (2.1%) | | | | | | | | | |
| Electric (1.6%) | | | | | | | | | |
| AEP Texas Central Co. | 6.650 | % | 2/15/33 | | 150 | | | 154 | |
| Alabama Power Co. | 5.500 | % | 10/15/17 | | 375 | | | 395 | |
| Alabama Power Co. | 6.000 | % | 3/1/39 | | 25 | | | 27 | |
52
| | | | | | | | | |
| Institutional Total Bond Market Index Fund | | | | | | | | | |
| |
| |
| |
| | | | | | Face | | | Market | |
| | | | Maturity | | Amount | | | Value• | |
| | Coupon | | Date | ($ | 000 | ) | ($ | 000 | ) |
| American Water Capital Corp. | 6.593 | % | 10/15/37 | | 375 | | | 372 | |
| Arizona Public Service Co. | 4.650 | % | 5/15/15 | | 150 | | | 151 | |
| Baltimore Gas & Electric Co. | 5.900 | % | 10/1/16 | | 225 | | | 240 | |
| Baltimore Gas & Electric Co. | 6.350 | % | 10/1/36 | | 100 | | | 103 | |
| Carolina Power & Light Co. | 6.500 | % | 7/15/12 | | 650 | | | 717 | |
| Carolina Power & Light Co. | 5.125 | % | 9/15/13 | | 325 | | | 350 | |
| Carolina Power & Light Co. | 5.300 | % | 1/15/19 | | 350 | | | 364 | |
| CenterPoint Energy Houston Electric LLC | 5.700 | % | 3/15/13 | | 450 | | | 480 | |
| CenterPoint Energy Houston Electric LLC | 7.000 | % | 3/1/14 | | 225 | | | 257 | |
| CenterPoint Energy Inc. | 6.500 | % | 5/1/18 | | 70 | | | 71 | |
| Cleveland Electric Illuminating Co. | 7.880 | % | 11/1/17 | | 75 | | | 88 | |
| Cleveland Electric Illuminating Co. | 5.500 | % | 8/15/24 | | 900 | | | 892 | |
| Columbus Southern Power Co. | 5.850 | % | 10/1/35 | | 225 | | | 213 | |
| Commonwealth Edison Co. | 6.150 | % | 3/15/12 | | 150 | | | 162 | |
| Commonwealth Edison Co. | 5.950 | % | 8/15/16 | | 500 | | | 544 | |
| Commonwealth Edison Co. | 6.150 | % | 9/15/17 | | 700 | | | 761 | |
| Commonwealth Edison Co. | 5.800 | % | 3/15/18 | | 150 | | | 160 | |
| Commonwealth Edison Co. | 5.900 | % | 3/15/36 | | 100 | | | 100 | |
| Connecticut Light & Power Co. | 6.350 | % | 6/1/36 | | 600 | | | 650 | |
| Consolidated Edison Co. of New York Inc. | 4.875 | % | 2/1/13 | | 75 | | | 80 | |
| Consolidated Edison Co. of New York Inc. | 5.375 | % | 12/15/15 | | 125 | | | 134 | |
| Consolidated Edison Co. of New York Inc. | 5.500 | % | 9/15/16 | | 650 | | | 679 | |
| Consolidated Edison Co. of New York Inc. | 6.650 | % | 4/1/19 | | 200 | | | 227 | |
| Consolidated Edison Co. of New York Inc. | 5.300 | % | 3/1/35 | | 25 | | | 24 | |
| Consolidated Edison Co. of New York Inc. | 5.850 | % | 3/15/36 | | 125 | | | 129 | |
| Consolidated Edison Co. of New York Inc. | 6.200 | % | 6/15/36 | | 175 | | | 187 | |
| Consolidated Edison Co. of New York Inc. | 6.300 | % | 8/15/37 | | 400 | | | 434 | |
| Consolidated Edison Co. of New York Inc. | 5.500 | % | 12/1/39 | | 225 | | | 222 | |
| Consolidated Natural Gas Co. | 6.250 | % | 11/1/11 | | 600 | | | 647 | |
| Consolidated Natural Gas Co. | 5.000 | % | 12/1/14 | | 375 | | | 401 | |
| Constellation Energy Group Inc. | 7.000 | % | 4/1/12 | | 25 | | | 27 | |
| Constellation Energy Group Inc. | 4.550 | % | 6/15/15 | | 625 | | | 625 | |
| Constellation Energy Group Inc. | 7.600 | % | 4/1/32 | | 150 | | | 162 | |
| Consumers Energy Co. | 5.000 | % | 2/15/12 | | 150 | | | 158 | |
| Consumers Energy Co. | 5.375 | % | 4/15/13 | | 75 | | | 80 | |
| Consumers Energy Co. | 5.500 | % | 8/15/16 | | 300 | | | 321 | |
| Detroit Edison Co. | 6.125 | % | 10/1/10 | | 125 | | | 130 | |
| Detroit Edison Co. | 5.700 | % | 10/1/37 | | 150 | | | 145 | |
| Dominion Resources Inc. | 4.750 | % | 12/15/10 | | 300 | | | 310 | |
| Dominion Resources Inc. | 6.250 | % | 6/30/12 | | 110 | | | 119 | |
| Dominion Resources Inc. | 5.700 | % | 9/17/12 | | 80 | | | 86 | |
| Dominion Resources Inc. | 6.000 | % | 11/30/17 | | 475 | | | 514 | |
| Dominion Resources Inc. | 6.400 | % | 6/15/18 | | 290 | | | 319 | |
| Dominion Resources Inc. | 6.300 | % | 3/15/33 | | 50 | | | 51 | |
| Dominion Resources Inc. | 5.250 | % | 8/1/33 | | 75 | | | 78 | |
| Dominion Resources Inc. | 5.950 | % | 6/15/35 | | 225 | | | 225 | |
| 3 Dominion Resources Inc. | 6.300 | % | 9/30/66 | | 150 | | | 133 | |
| DTE Energy Co. | 7.050 | % | 6/1/11 | | 75 | | | 80 | |
| Duke Energy Carolinas LLC | 6.250 | % | 1/15/12 | | 525 | | | 569 | |
| Duke Energy Carolinas LLC | 6.450 | % | 10/15/32 | | 400 | | | 434 | |
| Duke Energy Carolinas LLC | 6.100 | % | 6/1/37 | | 600 | | | 639 | |
| Duke Energy Carolinas LLC | 6.000 | % | 1/15/38 | | 50 | | | 53 | |
| Duke Energy Carolinas LLC | 6.050 | % | 4/15/38 | | 25 | | | 26 | |
| Duke Energy Carolinas LLC | 5.300 | % | 2/15/40 | | 150 | | | 145 | |
| Duke Energy Corp. | 3.950 | % | 9/15/14 | | 300 | | | 306 | |
| Duke Energy Indiana Inc. | 5.000 | % | 9/15/13 | | 225 | | | 235 | |
53
| | | | | | | | | |
| Institutional Total Bond Market Index Fund | | | | | | | | | |
| |
| |
| |
| | | | | | Face | | | Market | |
| | | | Maturity | | Amount | | | Value• | |
| | Coupon | | Date | ($ | 000 | ) | ($ | 000 | ) |
| Duke Energy Indiana Inc. | 6.350 | % | 8/15/38 | | 375 | | | 410 | |
| Duke Energy Ohio Inc. | 5.700 | % | 9/15/12 | | 100 | | | 109 | |
| Duke Energy Ohio Inc. | 2.100 | % | 6/15/13 | | 425 | | | 420 | |
| El Paso Electric Co. | 6.000 | % | 5/15/35 | | 50 | | | 45 | |
| Energy East Corp. | 6.750 | % | 6/15/12 | | 225 | | | 245 | |
| Energy East Corp. | 6.750 | % | 7/15/36 | | 325 | | | 362 | |
| Entergy Gulf States Louisiana LLC | 6.000 | % | 5/1/18 | | 475 | | | 496 | |
| Entergy Louisiana LLC | 6.500 | % | 9/1/18 | | 100 | | | 106 | |
| Exelon Corp. | 4.900 | % | 6/15/15 | | 225 | | | 233 | |
| Exelon Corp. | 5.625 | % | 6/15/35 | | 20 | | | 18 | |
| Exelon Generation Co. LLC | 5.200 | % | 10/1/19 | | 375 | | | 375 | |
| Exelon Generation Co. LLC | 6.250 | % | 10/1/39 | | 375 | | | 381 | |
| FirstEnergy Corp. | 6.450 | % | 11/15/11 | | 53 | | | 57 | |
| FirstEnergy Corp. | 7.375 | % | 11/15/31 | | 30 | | | 33 | |
| FirstEnergy Solutions Corp. | 4.800 | % | 2/15/15 | | 750 | | | 765 | |
| Florida Power & Light Co. | 5.550 | % | 11/1/17 | | 100 | | | 108 | |
| Florida Power & Light Co. | 5.950 | % | 10/1/33 | | 175 | | | 182 | |
| Florida Power & Light Co. | 5.625 | % | 4/1/34 | | 325 | | | 325 | |
| Florida Power & Light Co. | 4.950 | % | 6/1/35 | | 75 | | | 68 | |
| Florida Power & Light Co. | 5.400 | % | 9/1/35 | | 1,100 | | | 1,065 | |
| Florida Power & Light Co. | 5.650 | % | 2/1/37 | | 300 | | | 299 | |
| Florida Power & Light Co. | 5.850 | % | 5/1/37 | | 225 | | | 233 | |
| Florida Power Corp. | 4.800 | % | 3/1/13 | | 325 | | | 345 | |
| Florida Power Corp. | 5.650 | % | 6/15/18 | | 225 | | | 242 | |
| Florida Power Corp. | 6.350 | % | 9/15/37 | | 650 | | | 700 | |
| FPL Group Capital Inc. | 5.625 | % | 9/1/11 | | 100 | | | 107 | |
| FPL Group Capital Inc. | 5.350 | % | 6/15/13 | | 300 | | | 323 | |
| 3 FPL Group Capital Inc. | 6.350 | % | 10/1/66 | | 100 | | | 92 | |
| 3 FPL Group Capital Inc. | 6.650 | % | 6/15/67 | | 275 | | | 255 | |
| Georgia Power Co. | 5.700 | % | 6/1/17 | | 325 | | | 351 | |
| Illinois Power Co. | 6.125 | % | 11/15/17 | | 150 | | | 158 | |
| Indiana Michigan Power Co. | 7.000 | % | 3/15/19 | | 350 | | | 390 | |
| Indiana Michigan Power Co. | 6.050 | % | 3/15/37 | | 1,000 | | | 982 | |
| 3 Integrys Energy Group Inc. | 6.110 | % | 12/1/66 | | 350 | | | 290 | |
| Interstate Power & Light Co. | 6.250 | % | 7/15/39 | | 150 | | | 155 | |
| Jersey Central Power & Light Co. | 5.625 | % | 5/1/16 | | 200 | | | 208 | |
| Jersey Central Power & Light Co. | 5.650 | % | 6/1/17 | | 200 | | | 206 | |
| Kansas City Power & Light Co. | 6.050 | % | 11/15/35 | | 75 | | | 70 | |
| MidAmerican Energy Co. | 5.650 | % | 7/15/12 | | 150 | | | 162 | |
| MidAmerican Energy Co. | 5.950 | % | 7/15/17 | | 475 | | | 501 | |
| MidAmerican Energy Co. | 6.750 | % | 12/30/31 | | 325 | | | 364 | |
| MidAmerican Energy Co. | 5.750 | % | 11/1/35 | | 125 | | | 124 | |
| Midamerican Energy Holdings Co. | 5.875 | % | 10/1/12 | | 400 | | | 436 | |
| Midamerican Energy Holdings Co. | 5.000 | % | 2/15/14 | | 75 | | | 79 | |
| Midamerican Energy Holdings Co. | 6.125 | % | 4/1/36 | | 1,525 | | | 1,553 | |
| Midamerican Energy Holdings Co. | 5.950 | % | 5/15/37 | | 1,225 | | | 1,236 | |
| National Rural Utilities Cooperative Finance Corp. | 7.250 | % | 3/1/12 | | 1,425 | | | 1,570 | |
| National Rural Utilities Cooperative Finance Corp. | 2.625 | % | 9/16/12 | | 225 | | | 227 | |
| National Rural Utilities Cooperative Finance Corp. | 5.500 | % | 7/1/13 | | 225 | | | 245 | |
| National Rural Utilities Cooperative Finance Corp. | 4.750 | % | 3/1/14 | | 550 | | | 585 | |
| National Rural Utilities Cooperative Finance Corp. | 5.450 | % | 2/1/18 | | 300 | | | 311 | |
| National Rural Utilities Cooperative Finance Corp. | 8.000 | % | 3/1/32 | | 100 | | | 118 | |
| Nevada Power Co. | 7.125 | % | 3/15/19 | | 850 | | | 955 | |
| 5 Niagara Mohawk Power Corp. | 4.881 | % | 8/15/19 | | 575 | | | 573 | |
| Nisource Finance Corp. | 5.400 | % | 7/15/14 | | 75 | | | 78 | |
| Nisource Finance Corp. | 5.250 | % | 9/15/17 | | 225 | | | 222 | |
54
| | | | | | | | | |
| Institutional Total Bond Market Index Fund | | | | | | | | | |
| |
| |
| |
| | | | | | Face | | | Market | |
| | | | Maturity | | Amount | | | Value• | |
| | Coupon | | Date | ($ | 000 | ) | ($ | 000 | ) |
| Nisource Finance Corp. | 5.450 | % | 9/15/20 | | 250 | | | 242 | |
| Northern States Power Co. | 5.250 | % | 3/1/18 | | 75 | | | 79 | |
| Northern States Power Co. | 6.250 | % | 6/1/36 | | 50 | | | 55 | |
| NSTAR Electric Co. | 4.875 | % | 4/15/14 | | 75 | | | 80 | |
| NSTAR Electric Co. | 5.625 | % | 11/15/17 | | 450 | | | 479 | |
| 5 Oglethorpe Power Corp. | 5.950 | % | 11/1/39 | | 100 | | | 99 | |
| Ohio Edison Co. | 6.400 | % | 7/15/16 | | 200 | | | 216 | |
| Ohio Power Co. | 5.750 | % | 9/1/13 | | 100 | | | 106 | |
| Ohio Power Co. | 6.000 | % | 6/1/16 | | 150 | | | 161 | |
| Oncor Electric Delivery Co. LLC | 6.375 | % | 5/1/12 | | 300 | | | 324 | |
| Oncor Electric Delivery Co. LLC | 6.375 | % | 1/15/15 | | 485 | | | 530 | |
| Oncor Electric Delivery Co. LLC | 7.000 | % | 5/1/32 | | 425 | | | 469 | |
| Oncor Electric Delivery Co. LLC | 7.250 | % | 1/15/33 | | 155 | | | 178 | |
| Pacific Gas & Electric Co. | 4.200 | % | 3/1/11 | | 100 | | | 103 | |
| Pacific Gas & Electric Co. | 4.800 | % | 3/1/14 | | 975 | | | 1,040 | |
| Pacific Gas & Electric Co. | 5.625 | % | 11/30/17 | | 125 | | | 133 | |
| Pacific Gas & Electric Co. | 8.250 | % | 10/15/18 | | 475 | | | 580 | |
| Pacific Gas & Electric Co. | 6.050 | % | 3/1/34 | | 1,295 | | | 1,356 | |
| Pacific Gas & Electric Co. | 5.800 | % | 3/1/37 | | 700 | | | 710 | |
| PacifiCorp | 6.900 | % | 11/15/11 | | 225 | | | 247 | |
| PacifiCorp | 7.700 | % | 11/15/31 | | 100 | | | 123 | |
| PacifiCorp | 5.250 | % | 6/15/35 | | 50 | | | 47 | |
| PacifiCorp | 6.250 | % | 10/15/37 | | 750 | | | 809 | |
| Peco Energy Co. | 5.350 | % | 3/1/18 | | 100 | | | 106 | |
| Pennsylvania Electric Co. | 6.050 | % | 9/1/17 | | 100 | | | 105 | |
| Pennsylvania Electric Co. | 5.200 | % | 4/1/20 | | 125 | | | 124 | |
| Pennsylvania Electric Co. | 6.150 | % | 10/1/38 | | 125 | | | 121 | |
| Pepco Holdings Inc. | 6.450 | % | 8/15/12 | | 350 | | | 376 | |
| Pepco Holdings Inc. | 7.450 | % | 8/15/32 | | 75 | | | 79 | |
| Potomac Electric Power Co. | 6.500 | % | 11/15/37 | | 400 | | | 442 | |
| PPL Electric Utilities Corp. | 6.250 | % | 5/15/39 | | 525 | | | 552 | |
| PPL Energy Supply LLC | 6.400 | % | 11/1/11 | | 600 | | | 647 | |
| PPL Energy Supply LLC | 6.300 | % | 7/15/13 | | 100 | | | 107 | |
| PPL Energy Supply LLC | 6.200 | % | 5/15/16 | | 226 | | | 237 | |
| Progress Energy Inc. | 7.100 | % | 3/1/11 | | 630 | | | 667 | |
| Progress Energy Inc. | 6.050 | % | 3/15/14 | | 300 | | | 327 | |
| Progress Energy Inc. | 5.625 | % | 1/15/16 | | 225 | | | 239 | |
| Progress Energy Inc. | 7.050 | % | 3/15/19 | | 75 | | | 84 | |
| Progress Energy Inc. | 4.875 | % | 12/1/19 | | 1,000 | | | 980 | |
| Progress Energy Inc. | 7.750 | % | 3/1/31 | | 150 | | | 177 | |
| Progress Energy Inc. | 7.000 | % | 10/30/31 | | 25 | | | 27 | |
| PSEG Power LLC | 7.750 | % | 4/15/11 | | 375 | | | 401 | |
| PSEG Power LLC | 6.950 | % | 6/1/12 | | 475 | | | 519 | |
| PSEG Power LLC | 5.000 | % | 4/1/14 | | 175 | | | 183 | |
| PSEG Power LLC | 5.500 | % | 12/1/15 | | 1,200 | | | 1,267 | |
| PSEG Power LLC | 8.625 | % | 4/15/31 | | 50 | | | 65 | |
| Public Service Co. of Colorado | 7.875 | % | 10/1/12 | | 825 | | | 947 | |
| Public Service Co. of Colorado | 5.500 | % | 4/1/14 | | 100 | | | 108 | |
| Public Service Co. of Colorado | 5.125 | % | 6/1/19 | | 800 | | | 829 | |
| Public Service Co. of Colorado | 6.250 | % | 9/1/37 | | 50 | | | 55 | |
| Public Service Co. of Oklahoma | 5.150 | % | 12/1/19 | | 100 | | | 100 | |
| Public Service Co. of Oklahoma | 6.625 | % | 11/15/37 | | 300 | | | 311 | |
| Puget Sound Energy Inc. | 5.483 | % | 6/1/35 | | 50 | | | 48 | |
| Puget Sound Energy Inc. | 6.274 | % | 3/15/37 | | 300 | | | 318 | |
| Puget Sound Energy Inc. | 5.757 | % | 10/1/39 | | 150 | | | 148 | |
| San Diego Gas & Electric Co. | 5.300 | % | 11/15/15 | | 100 | | | 110 | |
55
| | | | | | | | | |
| Institutional Total Bond Market Index Fund | | | | | | | | | |
| |
| |
| |
| | | | | | Face | | | Market | |
| | | | Maturity | | Amount | | | Value• | |
| | Coupon | | Date | ($ | 000 | ) | ($ | 000 | ) |
| San Diego Gas & Electric Co. | 5.350 | % | 5/15/35 | | 50 | | | 48 | |
| San Diego Gas & Electric Co. | 6.125 | % | 9/15/37 | | 25 | | | 27 | |
| San Diego Gas & Electric Co. | 6.000 | % | 6/1/39 | | 50 | | | 53 | |
| SCANA Corp. | 6.875 | % | 5/15/11 | | 600 | | | 638 | |
| Sierra Pacific Power Co. | 6.000 | % | 5/15/16 | | 200 | | | 215 | |
| Sierra Pacific Power Co. | 6.750 | % | 7/1/37 | | 300 | | | 318 | |
| South Carolina Electric & Gas Co. | 6.500 | % | 11/1/18 | | 100 | | | 113 | |
| South Carolina Electric & Gas Co. | 6.050 | % | 1/15/38 | | 50 | | | 53 | |
| Southern California Edison Co. | 5.000 | % | 1/15/14 | | 500 | | | 541 | |
| Southern California Edison Co. | 4.650 | % | 4/1/15 | | 25 | | | 27 | |
| Southern California Edison Co. | 5.000 | % | 1/15/16 | | 50 | | | 53 | |
| Southern California Edison Co. | 6.650 | % | 4/1/29 | | 100 | | | 109 | |
| Southern California Edison Co. | 6.000 | % | 1/15/34 | | 100 | | | 104 | |
| Southern California Edison Co. | 5.750 | % | 4/1/35 | | 100 | | | 101 | |
| Southern California Edison Co. | 5.350 | % | 7/15/35 | | 100 | | | 95 | |
| Southern California Edison Co. | 5.550 | % | 1/15/36 | | 100 | | | 99 | |
| Southern California Edison Co. | 5.625 | % | 2/1/36 | | 50 | | | 50 | |
| Southern California Edison Co. | 5.550 | % | 1/15/37 | | 500 | | | 501 | |
| Southern Co. | 5.300 | % | 1/15/12 | | 600 | | | 641 | |
| Southern Co. | 4.150 | % | 5/15/14 | | 300 | | | 309 | |
| Southern Power Co. | 6.250 | % | 7/15/12 | | 75 | | | 82 | |
| Southern Power Co. | 4.875 | % | 7/15/15 | | 325 | | | 340 | |
| Tampa Electric Co. | 6.100 | % | 5/15/18 | | 275 | | | 293 | |
| Tampa Electric Co. | 6.550 | % | 5/15/36 | | 175 | | | 182 | |
| Toledo Edison Co. | 6.150 | % | 5/15/37 | | 125 | | | 124 | |
| TransAlta Corp. | 4.750 | % | 1/15/15 | | 25 | | | 25 | |
| TransAlta Corp. | 6.650 | % | 5/15/18 | | 100 | | | 105 | |
| Union Electric Co. | 5.400 | % | 2/1/16 | | 125 | | | 128 | |
| United Utilities PLC | 5.375 | % | 2/1/19 | | 350 | | | 348 | |
| Virginia Electric and Power Co. | 5.100 | % | 11/30/12 | | 225 | | | 244 | |
| Virginia Electric and Power Co. | 5.400 | % | 1/15/16 | | 425 | | | 444 | |
| Virginia Electric and Power Co. | 5.000 | % | 6/30/19 | | 800 | | | 807 | |
| Virginia Electric and Power Co. | 6.000 | % | 5/15/37 | | 250 | | | 263 | |
| Virginia Electric and Power Co. | 6.350 | % | 11/30/37 | | 100 | | | 110 | |
| Wisconsin Electric Power Co. | 6.000 | % | 4/1/14 | | 575 | | | 644 | |
| Wisconsin Electric Power Co. | 4.250 | % | 12/15/19 | | 25 | | | 25 | |
| Wisconsin Electric Power Co. | 5.625 | % | 5/15/33 | | 75 | | | 74 | |
| Wisconsin Energy Corp. | 6.500 | % | 4/1/11 | | 175 | | | 185 | |
| 3 Wisconsin Energy Corp. | 6.250 | % | 5/15/67 | | 775 | | | 683 | |
| Wisconsin Power & Light Co. | 5.000 | % | 7/15/19 | | 75 | | | 75 | |
| Wisconsin Power & Light Co. | 6.375 | % | 8/15/37 | | 250 | | | 267 | |
| Xcel Energy Inc. | 5.613 | % | 4/1/17 | | 56 | | | 58 | |
| Xcel Energy Inc. | 6.500 | % | 7/1/36 | | 200 | | | 212 | |
| |
| Natural Gas (0.5%) | | | | | | | | | |
| AGL Capital Corp. | 7.125 | % | 1/14/11 | | 125 | | | 131 | |
| Atmos Energy Corp. | 4.950 | % | 10/15/14 | | 540 | | | 564 | |
| Atmos Energy Corp. | 8.500 | % | 3/15/19 | | 100 | | | 121 | |
| Boardwalk Pipelines LP | 5.500 | % | 2/1/17 | | 50 | | | 50 | |
| CenterPoint Energy Resources Corp. | 7.875 | % | 4/1/13 | | 325 | | | 364 | |
| CenterPoint Energy Resources Corp. | 6.150 | % | 5/1/16 | | 300 | | | 310 | |
| DCP Midstream LLC | 8.125 | % | 8/16/30 | | 100 | | | 109 | |
| El Paso Natural Gas Co. | 5.950 | % | 4/15/17 | | 125 | | | 128 | |
| Enbridge Energy Partners LP | 9.875 | % | 3/1/19 | | 600 | | | 760 | |
| Energy Transfer Partners LP | 5.650 | % | 8/1/12 | | 600 | | | 645 | |
| Energy Transfer Partners LP | 8.500 | % | 4/15/14 | | 50 | | | 58 | |
56
| | | | | | | | | |
| Institutional Total Bond Market Index Fund | | | | | | | | | |
| |
| |
| |
| | | | | | Face | | | Market | |
| | | | Maturity | | Amount | | | Value• | |
| | Coupon | | Date | ($ | 000 | ) | ($ | 000 | ) |
| Energy Transfer Partners LP | 5.950 | % | 2/1/15 | | 75 | | | 80 | |
| Energy Transfer Partners LP | 6.125 | % | 2/15/17 | | 125 | | | 130 | |
| Energy Transfer Partners LP | 9.000 | % | 4/15/19 | | 675 | | | 810 | |
| Energy Transfer Partners LP | 6.625 | % | 10/15/36 | | 225 | | | 225 | |
| Enterprise Products Operating LLC | 4.950 | % | 6/1/10 | | 300 | | | 305 | |
| Enterprise Products Operating LLC | 4.600 | % | 8/1/12 | | 250 | | | 262 | |
| Enterprise Products Operating LLC | 9.750 | % | 1/31/14 | | 500 | | | 597 | |
| Enterprise Products Operating LLC | 5.600 | % | 10/15/14 | | 1,100 | | | 1,176 | |
| Enterprise Products Operating LLC | 6.300 | % | 9/15/17 | | 325 | | | 351 | |
| Enterprise Products Operating LLC | 6.650 | % | 4/15/18 | | 225 | | | 245 | |
| Enterprise Products Operating LLC | 6.875 | % | 3/1/33 | | 50 | | | 53 | |
| EQT Corp. | 8.125 | % | 6/1/19 | | 325 | | | 379 | |
| KeySpan Corp. | 8.000 | % | 11/15/30 | | 50 | | | 59 | |
| Kinder Morgan Energy Partners LP | 6.750 | % | 3/15/11 | | 100 | | | 106 | |
| Kinder Morgan Energy Partners LP | 7.125 | % | 3/15/12 | | 250 | | | 272 | |
| Kinder Morgan Energy Partners LP | 5.850 | % | 9/15/12 | | 420 | | | 450 | |
| Kinder Morgan Energy Partners LP | 5.000 | % | 12/15/13 | | 235 | | | 245 | |
| Kinder Morgan Energy Partners LP | 5.125 | % | 11/15/14 | | 200 | | | 208 | |
| Kinder Morgan Energy Partners LP | 5.625 | % | 2/15/15 | | 300 | | | 323 | |
| Kinder Morgan Energy Partners LP | 6.000 | % | 2/1/17 | | 110 | | | 119 | |
| Kinder Morgan Energy Partners LP | 5.950 | % | 2/15/18 | | 125 | | | 133 | |
| Kinder Morgan Energy Partners LP | 6.850 | % | 2/15/20 | | 350 | | | 391 | |
| Kinder Morgan Energy Partners LP | 7.300 | % | 8/15/33 | | 200 | | | 218 | |
| Kinder Morgan Energy Partners LP | 5.800 | % | 3/15/35 | | 100 | | | 93 | |
| Kinder Morgan Energy Partners LP | 6.500 | % | 2/1/37 | | 90 | | | 91 | |
| Kinder Morgan Energy Partners LP | 6.500 | % | 9/1/39 | | 25 | | | 25 | |
| Magellan Midstream Partners LP | 5.650 | % | 10/15/16 | | 50 | | | 51 | |
| Magellan Midstream Partners LP | 6.550 | % | 7/15/19 | | 250 | | | 271 | |
| National Grid PLC | 6.300 | % | 8/1/16 | | 300 | | | 327 | |
| NuStar Logistics LP | 7.650 | % | 4/15/18 | | 325 | | | 353 | |
| Oneok Inc. | 5.200 | % | 6/15/15 | | 200 | | | 207 | |
| Oneok Inc. | 6.000 | % | 6/15/35 | | 100 | | | 94 | |
| ONEOK Partners LP | 5.900 | % | 4/1/12 | | 400 | | | 422 | |
| ONEOK Partners LP | 6.150 | % | 10/1/16 | | 325 | | | 339 | |
| ONEOK Partners LP | 6.650 | % | 10/1/36 | | 1,000 | | | 1,014 | |
| ONEOK Partners LP | 6.850 | % | 10/15/37 | | 300 | | | 314 | |
| Panhandle Eastern Pipeline Co. LP | 6.200 | % | 11/1/17 | | 625 | | | 657 | |
| Plains All American Pipeline LP/ | | | | | | | | | |
| PAA Finance Corp. | 6.500 | % | 5/1/18 | | 75 | | | 80 | |
| Plains All American Pipeline LP/ | | | | | | | | | |
| PAA Finance Corp. | 8.750 | % | 5/1/19 | | 125 | | | 148 | |
| Southern California Gas Co. | 5.750 | % | 11/15/35 | | 150 | | | 154 | |
| 5 Southern Natural Gas Co. | 5.900 | % | 4/1/17 | | 880 | | | 896 | |
| Southern Natural Gas Co. | 8.000 | % | 3/1/32 | | 320 | | | 370 | |
| Spectra Energy Capital LLC | 5.500 | % | 3/1/14 | | 150 | | | 154 | |
| Spectra Energy Capital LLC | 6.750 | % | 2/15/32 | | 75 | | | 76 | |
| Texas Gas Transmission LLC | 4.600 | % | 6/1/15 | | 425 | | | 433 | |
| TransCanada PipeLines Ltd. | 4.000 | % | 6/15/13 | | 650 | | | 665 | |
| TransCanada PipeLines Ltd. | 6.500 | % | 8/15/18 | | 600 | | | 674 | |
| TransCanada PipeLines Ltd. | 7.125 | % | 1/15/19 | | 50 | | | 59 | |
| TransCanada PipeLines Ltd. | 5.600 | % | 3/31/34 | | 550 | | | 530 | |
| TransCanada PipeLines Ltd. | 5.850 | % | 3/15/36 | | 350 | | | 348 | |
| TransCanada PipeLines Ltd. | 6.200 | % | 10/15/37 | | 100 | | | 106 | |
| TransCanada PipeLines Ltd. | 7.625 | % | 1/15/39 | | 50 | | | 61 | |
| 3 TransCanada PipeLines Ltd. | 6.350 | % | 5/15/67 | | 225 | | | 208 | |
| Williams Cos. Inc. | 7.125 | % | 9/1/11 | | 325 | | | 345 | |
57
| | | | | | | | | |
| Institutional Total Bond Market Index Fund | | | | | | | | | |
| |
| |
| |
| | | | | | Face | | | Market | |
| | | | Maturity | | Amount | | | Value• | |
| | Coupon | | Date | ($ | 000 | ) | ($ | 000 | ) |
| Williams Cos. Inc. | 7.625 | % | 7/15/19 | | 600 | | | 666 | |
| Williams Cos. Inc. | 7.500 | % | 1/15/31 | | 303 | | | 327 | |
| Williams Cos. Inc. | 7.750 | % | 6/15/31 | | 160 | | | 175 | |
| Williams Cos. Inc. | 8.750 | % | 3/15/32 | | 569 | | | 681 | |
| | | | | | | | | 87,509 | |
| Total Corporate Bonds (Cost $765,785) | | | | | | | | 792,700 | |
| Sovereign Bonds (U.S. Dollar-Denominated) (3.6%) | | | | | | | | | |
| African Development Bank | 1.000 | % | 11/23/11 | | 300 | | | 298 | |
| African Development Bank | 1.750 | % | 10/1/12 | | 250 | | | 249 | |
| African Development Bank | 3.000 | % | 5/27/14 | | 1,000 | | | 995 | |
| Asian Development Bank | 2.125 | % | 3/15/12 | | 300 | | | 305 | |
| Asian Development Bank | 3.625 | % | 9/5/13 | | 825 | | | 869 | |
| Asian Development Bank | 2.750 | % | 5/21/14 | | 800 | | | 799 | |
| Asian Development Bank | 5.500 | % | 6/27/16 | | 750 | | | 830 | |
| Asian Development Bank | 5.593 | % | 7/16/18 | | 750 | | | 811 | |
| Brazilian Government International Bond | 11.000 | % | 1/11/12 | | 275 | | | 325 | |
| Brazilian Government International Bond | 10.250 | % | 6/17/13 | | 150 | | | 185 | |
| Brazilian Government International Bond | 7.875 | % | 3/7/15 | | 425 | | | 496 | |
| Brazilian Government International Bond | 6.000 | % | 1/17/17 | | 950 | | | 1,017 | |
| 3 Brazilian Government International Bond | 8.000 | % | 1/15/18 | | 1,369 | | | 1,561 | |
| Brazilian Government International Bond | 5.875 | % | 1/15/19 | | 1,975 | | | 2,098 | |
| Brazilian Government International Bond | 8.875 | % | 10/14/19 | | 700 | | | 900 | |
| Brazilian Government International Bond | 8.875 | % | 4/15/24 | | 300 | | | 389 | |
| Brazilian Government International Bond | 8.750 | % | 2/4/25 | | 725 | | | 935 | |
| Brazilian Government International Bond | 10.125 | % | 5/15/27 | | 800 | | | 1,174 | |
| Brazilian Government International Bond | 8.250 | % | 1/20/34 | | 225 | | | 286 | |
| Brazilian Government International Bond | 7.125 | % | 1/20/37 | | 775 | | | 887 | |
| Brazilian Government International Bond | 11.000 | % | 8/17/40 | | 1,950 | | | 2,598 | |
| Brazilian Government International Bond | 5.625 | % | 1/7/41 | | 600 | | | 563 | |
| Canada Mortgage & Housing Corp. | 4.800 | % | 10/1/10 | | 25 | | | 26 | |
| Chile Government International Bond | 7.125 | % | 1/11/12 | | 350 | | | 390 | |
| Chile Government International Bond | 5.500 | % | 1/15/13 | | 125 | | | 138 | |
| China Development Bank Corp. | 4.750 | % | 10/8/14 | | 225 | | | 231 | |
| China Development Bank Corp. | 5.000 | % | 10/15/15 | | 75 | | | 81 | |
| China Government International Bond | 4.750 | % | 10/29/13 | | 150 | | | 159 | |
| Corp Andina de Fomento | 8.125 | % | 6/4/19 | | 825 | | | 942 | |
| Corp. Andina de Fomento | 5.200 | % | 5/21/13 | | 150 | | | 158 | |
| Corp. Andina de Fomento | 5.750 | % | 1/12/17 | | 800 | | | 799 | |
| Development Bank of Japan | 4.250 | % | 6/9/15 | | 75 | | | 78 | |
| Eksportfinans ASA | 3.000 | % | 11/17/14 | | 600 | | | 591 | |
| Eksportfinans ASA | 5.500 | % | 5/25/16 | | 350 | | | 377 | |
| Eksportfinans ASA | 5.500 | % | 6/26/17 | | 375 | | | 398 | |
| European Investment Bank | 3.250 | % | 2/15/11 | | 1,475 | | | 1,504 | |
| European Investment Bank | 5.250 | % | 6/15/11 | | 1,950 | | | 2,056 | |
| European Investment Bank | 3.125 | % | 7/15/11 | | 950 | | | 980 | |
| European Investment Bank | 2.000 | % | 2/10/12 | | 4,000 | | | 4,044 | |
| European Investment Bank | 1.750 | % | 9/14/12 | | 250 | | | 249 | |
| European Investment Bank | 2.875 | % | 3/15/13 | | 600 | | | 604 | |
| European Investment Bank | 3.250 | % | 5/15/13 | | 1,225 | | | 1,248 | |
| European Investment Bank | 4.250 | % | 7/15/13 | | 2,525 | | | 2,660 | |
| European Investment Bank | 4.625 | % | 5/15/14 | | 1,325 | | | 1,424 | |
| European Investment Bank | 3.125 | % | 6/4/14 | | 2,525 | | | 2,560 | |
| European Investment Bank | 4.875 | % | 2/16/16 | | 1,200 | | | 1,285 | |
| European Investment Bank | 5.125 | % | 9/13/16 | | 125 | | | 137 | |
| European Investment Bank | 4.875 | % | 1/17/17 | | 1,525 | | | 1,631 | |
58
| | | | | | | | | |
| Institutional Total Bond Market Index Fund | | | | | | | | | |
| |
| |
| |
| | | | | | Face | | | Market | |
| | | | Maturity | | Amount | | | Value• | |
| | Coupon | | Date | ($ | 000 | ) | ($ | 000 | ) |
| European Investment Bank | 5.125 | % | 5/30/17 | | 1,325 | | | 1,435 | |
| Export Development Canada | 2.375 | % | 3/19/12 | | 675 | | | 688 | |
| Export Development Canada | 1.750 | % | 9/24/12 | | 1,100 | | | 1,096 | |
| Export Development Canada | 3.125 | % | 4/24/14 | | 225 | | | 229 | |
| Export-Import Bank of Korea | 5.125 | % | 2/14/11 | | 625 | | | 642 | |
| Export-Import Bank of Korea | 5.500 | % | 10/17/12 | | 725 | | | 756 | |
| Export-Import Bank of Korea | 8.125 | % | 1/21/14 | | 700 | | | 814 | |
| Export-Import Bank of Korea | 5.875 | % | 1/14/15 | | 200 | | | 215 | |
| Export-Import Bank of Korea | 5.125 | % | 3/16/15 | | 175 | | | 179 | |
| Financement-Quebec | 5.000 | % | 10/25/12 | | 225 | | | 240 | |
| Hydro Quebec | 6.300 | % | 5/11/11 | | 550 | | | 587 | |
| Hydro Quebec | 7.500 | % | 4/1/16 | | 575 | | | 680 | |
| Hydro Quebec | 8.050 | % | 7/7/24 | | 600 | | | 735 | |
| Inter-American Development Bank | 8.500 | % | 3/15/11 | | 225 | | | 243 | |
| Inter-American Development Bank | 1.500 | % | 6/23/11 | | 150 | | | 151 | |
| Inter-American Development Bank | 4.750 | % | 10/19/12 | | 675 | | | 724 | |
| Inter-American Development Bank | 3.000 | % | 4/22/14 | | 1,300 | | | 1,308 | |
| Inter-American Development Bank | 4.250 | % | 9/14/15 | | 50 | | | 52 | |
| Inter-American Development Bank | 4.250 | % | 9/10/18 | | 1,475 | | | 1,512 | |
| Inter-American Development Bank | 3.875 | % | 9/17/19 | | 1,700 | | | 1,684 | |
| Inter-American Development Bank | 7.000 | % | 6/15/25 | | 325 | | | 386 | |
| International Bank for | | | | | | | | | |
| Reconstruction & Development | 3.125 | % | 11/15/11 | | 225 | | | 231 | |
| International Bank for | | | | | | | | | |
| Reconstruction & Development | 2.000 | % | 4/2/12 | | 3,750 | | | 3,791 | |
| International Bank for | | | | | | | | | |
| Reconstruction & Development | 3.500 | % | 10/8/13 | | 575 | | | 599 | |
| International Bank for | | | | | | | | | |
| Reconstruction & Development | 8.875 | % | 3/1/26 | | 200 | | | 276 | |
| International Finance Corp. | 3.500 | % | 5/15/13 | | 400 | | | 408 | |
| International Finance Corp. | 3.000 | % | 4/22/14 | | 925 | | | 924 | |
| Israel Government International Bond | 4.625 | % | 6/15/13 | | 100 | | | 106 | |
| Israel Government International Bond | 5.500 | % | 11/9/16 | | 675 | | | 725 | |
| Israel Government International Bond | 5.125 | % | 3/26/19 | | 900 | | | 914 | |
| Italian Republic | 6.000 | % | 2/22/11 | | 1,225 | | | 1,291 | |
| Italian Republic | 3.500 | % | 7/15/11 | | 475 | | | 490 | |
| Italian Republic | 5.625 | % | 6/15/12 | | 250 | | | 272 | |
| Italian Republic | 2.125 | % | 10/5/12 | | 200 | | | 200 | |
| Italian Republic | 4.750 | % | 1/25/16 | | 1,875 | | | 1,947 | |
| Italian Republic | 5.250 | % | 9/20/16 | | 1,525 | | | 1,625 | |
| Italian Republic | 6.875 | % | 9/27/23 | | 1,350 | | | 1,524 | |
| Italian Republic | 5.375 | % | 6/15/33 | | 775 | | | 759 | |
| Japan Bank for International Cooperation | 4.750 | % | 5/25/11 | | 100 | | | 105 | |
| Japan Bank for International Cooperation | 2.125 | % | 11/5/12 | | 1,400 | | | 1,395 | |
| Japan Bank for International Cooperation | 4.375 | % | 11/26/12 | | 425 | | | 451 | |
| Japan Bank for International Cooperation | 4.250 | % | 6/18/13 | | 400 | | | 423 | |
| Japan Finance Organization for Municipalities | 5.875 | % | 3/14/11 | | 675 | | | 713 | |
| Japan Finance Organization for Municipalities | 4.625 | % | 4/21/15 | | 250 | | | 262 | |
| Japan Finance Organization for Municipalities | 5.000 | % | 5/16/17 | | 50 | | | 53 | |
| Korea Development Bank | 5.300 | % | 1/17/13 | | 425 | | | 444 | |
| Korea Development Bank | 5.750 | % | 9/10/13 | | 550 | | | 577 | |
| Korea Development Bank | 8.000 | % | 1/23/14 | | 400 | | | 455 | |
| Korea Electric Power Corp. | 7.750 | % | 4/1/13 | | 600 | | | 662 | |
| Kreditanstalt fuer Wiederaufbau | 3.125 | % | 11/15/10 | | 1,600 | | | 1,635 | |
| Kreditanstalt fuer Wiederaufbau | 4.625 | % | 1/20/11 | | 225 | | | 233 | |
| Kreditanstalt fuer Wiederaufbau | 3.250 | % | 2/15/11 | | 300 | | | 308 | |
59
| | | | | | | | | |
| Institutional Total Bond Market Index Fund | | | | | | | | | |
| |
| |
| |
| | | | | | Face | | | Market | |
| | | | Maturity | | Amount | | | Value• | |
| | Coupon | | Date | ($ | 000 | ) | ($ | 000 | ) |
| Kreditanstalt fuer Wiederaufbau | 1.875 | % | 3/15/11 | | 300 | | | 303 | |
| Kreditanstalt fuer Wiederaufbau | 3.750 | % | 6/27/11 | | 1,425 | | | 1,478 | |
| Kreditanstalt fuer Wiederaufbau | 3.250 | % | 10/14/11 | | 875 | | | 904 | |
| Kreditanstalt fuer Wiederaufbau | 2.000 | % | 1/17/12 | | 500 | | | 506 | |
| Kreditanstalt fuer Wiederaufbau | 2.250 | % | 4/16/12 | | 1,175 | | | 1,186 | |
| Kreditanstalt fuer Wiederaufbau | 4.750 | % | 5/15/12 | | 775 | | | 824 | |
| Kreditanstalt fuer Wiederaufbau | 3.250 | % | 3/15/13 | | 3,325 | | | 3,370 | |
| Kreditanstalt fuer Wiederaufbau | 3.500 | % | 5/16/13 | | 625 | | | 638 | |
| Kreditanstalt fuer Wiederaufbau | 4.000 | % | 10/15/13 | | 950 | | | 989 | |
| Kreditanstalt fuer Wiederaufbau | 4.125 | % | 10/15/14 | | 125 | | | 132 | |
| Kreditanstalt fuer Wiederaufbau | 2.750 | % | 10/21/14 | | 475 | | | 470 | |
| Kreditanstalt fuer Wiederaufbau | 5.125 | % | 3/14/16 | | 1,165 | | | 1,270 | |
| Kreditanstalt fuer Wiederaufbau | 4.375 | % | 3/15/18 | | 650 | | | 661 | |
| Kreditanstalt fuer Wiederaufbau | 4.500 | % | 7/16/18 | | 600 | | | 616 | |
| Kreditanstalt fuer Wiederaufbau | 4.875 | % | 6/17/19 | | 4,125 | | | 4,364 | |
| Landwirtschaftliche Rentenbank | 5.250 | % | 7/2/12 | | 600 | | | 644 | |
| Landwirtschaftliche Rentenbank | 1.875 | % | 9/24/12 | | 1,425 | | | 1,421 | |
| Landwirtschaftliche Rentenbank | 3.250 | % | 3/15/13 | | 1,175 | | | 1,195 | |
| Landwirtschaftliche Rentenbank | 4.125 | % | 7/15/13 | | 400 | | | 419 | |
| Landwirtschaftliche Rentenbank | 4.875 | % | 11/16/15 | | 125 | | | 134 | |
| Malaysia Government International Bond | 7.500 | % | 7/15/11 | | 900 | | | 976 | |
| Mexico Government International Bond | 8.375 | % | 1/14/11 | | 300 | | | 323 | |
| Mexico Government International Bond | 7.500 | % | 1/14/12 | | 103 | | | 114 | |
| Mexico Government International Bond | 6.375 | % | 1/16/13 | | 2,066 | | | 2,270 | |
| Mexico Government International Bond | 6.625 | % | 3/3/15 | | 347 | | | 386 | |
| Mexico Government International Bond | 11.375 | % | 9/15/16 | | 50 | | | 69 | |
| Mexico Government International Bond | 5.625 | % | 1/15/17 | | 1,900 | | | 1,993 | |
| Mexico Government International Bond | 8.300 | % | 8/15/31 | | 500 | | | 619 | |
| Mexico Government International Bond | 6.750 | % | 9/27/34 | | 2,052 | | | 2,175 | |
| Nordic Investment Bank | 2.625 | % | 10/6/14 | | 225 | | | 222 | |
| Nordic Investment Bank | 5.000 | % | 2/1/17 | | 1,000 | | | 1,069 | |
| Oesterreichische Kontrollbank AG | 2.875 | % | 3/15/11 | | 200 | | | 202 | |
| Oesterreichische Kontrollbank AG | 3.125 | % | 10/14/11 | | 2,225 | | | 2,276 | |
| Oesterreichische Kontrollbank AG | 1.875 | % | 3/21/12 | | 475 | | | 475 | |
| Oesterreichische Kontrollbank AG | 4.500 | % | 3/9/15 | | 125 | | | 130 | |
| Oesterreichische Kontrollbank AG | 5.000 | % | 4/25/17 | | 325 | | | 339 | |
| Ontario Electricity Financial Corp. | 7.450 | % | 3/31/13 | | 300 | | | 341 | |
| Pemex Project Funding Master Trust | 9.125 | % | 10/13/10 | | 40 | | | 42 | |
| Pemex Project Funding Master Trust | 5.750 | % | 3/1/18 | | 1,400 | | | 1,410 | |
| Pemex Project Funding Master Trust | 6.625 | % | 6/15/35 | | 1,231 | | | 1,168 | |
| Pemex Project Funding Master Trust | 6.625 | % | 6/15/38 | | 350 | | | 325 | |
| Peruvian Government International Bond | 9.875 | % | 2/6/15 | | 475 | | | 600 | |
| Peruvian Government International Bond | 7.125 | % | 3/30/19 | | 1,550 | | | 1,783 | |
| Peruvian Government International Bond | 7.350 | % | 7/21/25 | | 200 | | | 229 | |
| 3 Peruvian Government International Bond | 6.550 | % | 3/14/37 | | 300 | | | 312 | |
| Petrobras International Finance Co. | 6.125 | % | 10/6/16 | | 1,013 | | | 1,087 | |
| Petrobras International Finance Co. | 5.875 | % | 3/1/18 | | 100 | | | 101 | |
| Petrobras International Finance Co. | 8.375 | % | 12/10/18 | | 650 | | | 769 | |
| Petrobras International Finance Co. | 7.875 | % | 3/15/19 | | 1,050 | | | 1,212 | |
| Petrobras International Finance Co. | 5.750 | % | 1/20/20 | | 300 | | | 303 | |
| Petrobras International Finance Co. | 6.875 | % | 1/20/40 | | 300 | | | 305 | |
| Petroleos Mexicanos | 8.000 | % | 5/3/19 | | 125 | | | 144 | |
| Poland Government International Bond | 6.250 | % | 7/3/12 | | 600 | | | 649 | |
| Poland Government International Bond | 5.250 | % | 1/15/14 | | 425 | | | 455 | |
| Poland Government International Bond | 6.375 | % | 7/15/19 | | 975 | | | 1,060 | |
| Province of Manitoba Canada | 4.900 | % | 12/6/16 | | 950 | | | 996 | |
60
| | | | | | | | | |
| Institutional Total Bond Market Index Fund | | | | | | | | | |
| |
| |
| |
| | | | | | Face | | | Market | |
| | | | Maturity | | Amount | | | Value• | |
| | Coupon | | Date | ($ | 000 | ) | ($ | 000 | ) |
| Province of Nova Scotia Canada | 5.750 | % | 2/27/12 | | 100 | | | 107 | |
| Province of Ontario Canada | 2.750 | % | 2/22/11 | | 1,075 | | | 1,094 | |
| Province of Ontario Canada | 3.375 | % | 5/20/11 | | 900 | | | 927 | |
| Province of Ontario Canada | 5.000 | % | 10/18/11 | | 225 | | | 239 | |
| Province of Ontario Canada | 1.875 | % | 11/19/12 | | 1,250 | | | 1,242 | |
| Province of Ontario Canada | 4.100 | % | 6/16/14 | | 900 | | | 938 | |
| Province of Ontario Canada | 4.750 | % | 1/19/16 | | 400 | | | 419 | |
| Province of Ontario Canada | 5.450 | % | 4/27/16 | | 1,050 | | | 1,142 | |
| Province of Ontario Canada | 4.000 | % | 10/7/19 | | 1,000 | | | 954 | |
| Province of Quebec Canada | 4.875 | % | 5/5/14 | | 300 | | | 319 | |
| Province of Quebec Canada | 4.600 | % | 5/26/15 | | 125 | | | 130 | |
| Province of Quebec Canada | 5.125 | % | 11/14/16 | | 1,075 | | | 1,157 | |
| Province of Quebec Canada | 4.625 | % | 5/14/18 | | 225 | | | 228 | |
| Province of Quebec Canada | 7.500 | % | 9/15/29 | | 750 | | | 940 | |
| Province of Saskatchewan Canada | 7.375 | % | 7/15/13 | | 100 | | | 114 | |
| Region of Lombardy Italy | 5.804 | % | 10/25/32 | | 325 | | | 318 | |
| Republic of Korea | 4.250 | % | 6/1/13 | | 675 | | | 695 | |
| Republic of Korea | 5.750 | % | 4/16/14 | | 900 | | | 978 | |
| Republic of Korea | 7.125 | % | 4/16/19 | | 475 | | | 546 | |
| Republic of Korea | 5.625 | % | 11/3/25 | | 100 | | | 101 | |
| South Africa Government International Bond | 7.375 | % | 4/25/12 | | 425 | | | 467 | |
| South Africa Government International Bond | 6.875 | % | 5/27/19 | | 825 | | | 926 | |
| South Africa Government International Bond | 5.875 | % | 5/30/22 | | 175 | | | 179 | |
| Svensk Exportkredit AB | 4.000 | % | 6/15/10 | | 200 | | | 203 | |
| Svensk Exportkredit AB | 3.250 | % | 9/16/14 | | 775 | | | 775 | |
| Svensk Exportkredit AB | 5.125 | % | 3/1/17 | | 175 | | | 185 | |
| United Mexican States | 5.875 | % | 2/17/14 | | 275 | | | 299 | |
| United Mexican States | 5.950 | % | 3/19/19 | | 1,650 | | | 1,745 | |
| Total Sovereign Bonds (Cost $143,841) | | | | | | | | 147,294 | |
| Taxable Municipal Bonds (0.4%) | | | | | | | | | |
| American Muni. Power Ohio Inc. | 6.053 | % | 2/15/43 | | 50 | | | 47 | |
| Bay Area Toll Auth. CA Toll Bridge Rev. | 6.263 | % | 4/1/49 | | 350 | | | 336 | |
| Board of Trustees of The Leland | | | | | | | | | |
| Stanford Junior University | 3.625 | % | 5/1/14 | | 550 | | | 566 | |
| Board of Trustees of The Leland | | | | | | | | | |
| Stanford Junior University | 4.250 | % | 5/1/16 | | 150 | | | 153 | |
| California GO | 5.250 | % | 4/1/14 | | 225 | | | 228 | |
| California GO | 6.200 | % | 10/1/19 | | 675 | | | 657 | |
| California GO | 7.500 | % | 4/1/34 | | 1,275 | | | 1,247 | |
| California GO | 5.650 | % | 4/1/39 | | 225 | | | 233 | |
| California GO | 7.300 | % | 10/1/39 | | 175 | | | 165 | |
| California GO | 7.350 | % | 11/1/39 | | 1,200 | | | 1,169 | |
| Central Puget Sound WA Regional Transit Auth. | | | | | | | | | |
| Sales & Use Tax Rev. | 5.491 | % | 11/1/39 | | 100 | | | 97 | |
| Chicago IL Board of Educ. GO | 6.138 | % | 12/1/39 | | 50 | | | 50 | |
| Chicago IL Metro. Water Reclamation Dist. GO | 5.720 | % | 12/1/38 | | 200 | | | 201 | |
| Chicago IL Transit Auth. Rev. | 6.899 | % | 12/1/40 | | 325 | | | 339 | |
| Clark County NV Airport Improvement Rev. | 6.881 | % | 7/1/42 | | 75 | | | 74 | |
| Commonwealth Financing Auth. Pennsylvania Rev. | 6.218 | % | 6/1/39 | | 350 | | | 349 | |
| Connecticut GO | 5.850 | % | 3/15/32 | | 425 | | | 430 | |
61
| | | | | | | | | |
| Institutional Total Bond Market Index Fund | | | | | | | | | |
| |
| |
| |
| | | | | | Face | | | Market | |
| | | | Maturity | | Amount | | | Value• | |
| | Coupon | | Date | ($ | 000 | ) | ($ | 000 | ) |
| Dallas County Hosp. Dist. GO | 5.621 | % | 8/15/44 | | 100 | | | 98 | |
| Dartmouth College | 4.750 | % | 6/1/19 | | 50 | | | 51 | |
| Denver CO City & County School Dist. | 5.664 | % | 12/1/33 | | 75 | | | 73 | |
| District of Columbia Income Tax Rev. | 5.591 | % | 12/1/34 | | 75 | | | 73 | |
| Georgia GO | 4.503 | % | 11/1/25 | | 350 | | | 336 | |
| Howard Hughes Medical Institute | 3.450 | % | 9/1/14 | | 225 | | | 228 | |
| Illinois GO | 4.950 | % | 6/1/23 | | 1,350 | | | 1,263 | |
| Illinois GO | 5.100 | % | 6/1/33 | | 2,400 | | | 2,006 | |
| Illinois State Tollway Highway Auth. | | | | | | | | | |
| Toll Highway Rev. | 5.851 | % | 12/1/34 | | 100 | | | 97 | |
| Johns Hopkins University | 5.250 | % | 7/1/19 | | 425 | | | 439 | |
| Kansas Dev. Finance Auth. Rev. | | | | | | | | | |
| (Public Employee Retirement System) | 5.501 | % | 5/1/34 | | 300 | | | 286 | |
| Las Vegas Valley Water Dist. Nevada GO | 7.013 | % | 6/1/39 | | 100 | | | 106 | |
| Los Angeles CA Dept. of Water & Power Rev. | 6.008 | % | 7/1/39 | | 350 | | | 343 | |
| Los Angeles CA USD GO | 5.750 | % | 7/1/34 | | 300 | | | 276 | |
| Maryland Transp. Auth. Rev. | 5.888 | % | 7/1/43 | | 100 | | | 101 | |
| Massachusetts GO | 5.456 | % | 12/1/39 | | 300 | | | 289 | |
| Massachusetts School Building Auth. | | | | | | | | | |
| Dedicated Sales Tax Rev. | 5.715 | % | 8/15/39 | | 150 | | | 148 | |
| Metro. New York Transp. Auth. Rev. | 5.871 | % | 11/15/39 | | 125 | | | 119 | |
| Metro. Washington DC Airports Auth. Rev. | 7.462 | % | 10/1/46 | | 75 | | | 76 | |
| Missouri Highways & Transp. | | | | | | | | | |
| Comm. State Road Rev. | 5.445 | % | 5/1/33 | | 100 | | | 96 | |
| New Jersey Econ. Dev. Auth. | 7.425 | % | 2/15/29 | | 500 | | | 538 | |
| New Jersey Turnpike Auth. Rev. | 4.252 | % | 1/1/16 | | 10 | | | 10 | |
| New Jersey Turnpike Auth. Rev. | 4.252 | % | 1/1/16 | | 140 | | | 141 | |
| New Jersey Turnpike Auth. Rev. | 7.414 | % | 1/1/40 | | 675 | | | 761 | |
| New York City NY GO | 5.985 | % | 12/1/36 | | 100 | | | 98 | |
| New York City NY Muni. Water Finance Auth. | | | | | | | | | |
| Water & Sewer System Rev. | 5.750 | % | 6/15/41 | | 100 | | | 97 | |
| New York City NY Transitional Finance Auth. Rev. | 5.767 | % | 8/1/36 | | 125 | | | 121 | |
| New York Metro. Transp. Auth. Rev. | 7.336 | % | 11/15/39 | | 150 | | | 168 | |
| New York State Urban Dev. Corp. Rev. | 5.770 | % | 3/15/39 | | 325 | | | 322 | |
| North Texas Tollway Auth. Rev. | 6.718 | % | 1/1/49 | | 200 | | | 210 | |
| Oregon (Taxable Pension) GO | 5.762 | % | 6/1/23 | | 100 | | | 102 | |
| Oregon (Taxable Pension) GO | 5.892 | % | 6/1/27 | | 200 | | | 201 | |
| Oregon GO | 4.759 | % | 6/30/28 | | 125 | | | 103 | |
| Oregon GO | 5.528 | % | 6/30/28 | | 50 | | | 48 | |
| Port Auth. of New York & New Jersey Rev. | 6.040 | % | 12/1/29 | | 175 | | | 174 | |
| San Antonio TX Electric & Gas Rev. | 5.985 | % | 2/1/39 | | 250 | | | 255 | |
| Tobacco Settlement Finance Auth. Rev. | 7.467 | % | 6/1/47 | | 285 | | | 225 | |
| Univ. of California Regents | 6.583 | % | 5/15/49 | | 150 | | | 150 | |
| Univ. of Texas Permanent Univ. Fund Rev. | 5.262 | % | 7/1/39 | | 100 | | | 96 | |
| Univ. of Texas Permanent Univ. Fund Rev. | 6.276 | % | 8/15/41 | | 100 | | | 101 | |
| Utah GO | 4.554 | % | 7/1/24 | | 150 | | | 147 | |
| Washington GO | 5.481 | % | 8/1/39 | | 50 | | | 48 | |
| Wisconsin GO | 4.800 | % | 5/1/13 | | 125 | | | 135 | |
| Wisconsin GO | 5.700 | % | 5/1/26 | | 125 | | | 121 | |
| Total Taxable Municipal Bonds (Cost $17,844) | | | | | | | | 17,217 | |
62
| | | | | | |
| Institutional Total Bond Market Index Fund | | | | | | |
| |
| |
| | | | | | Market | |
| | | | | | Value• | |
| | Coupon | | Shares | ($ | 000 | ) |
| Temporary Cash Investment (4.1%) | | | | | | |
| Money Market Fund (4.1%) | | | | | | |
| 6 Vanguard Market Liquidity Fund | | | | | | |
| (Cost $170,921) | 0.187 | % | 170,920,676 | | 170,921 | |
| Total Investments (103.6%) (Cost $4,220,372) | | | | | 4,296,878 | |
| Other Assets and Liabilities (-3.6%) | | | | | | |
| Other Assets | | | | | 400,728 | |
| Liabilities | | | | | (548,878 | ) |
| | | | | | (148,150 | ) |
| Net Assets (100%) | | | | | | |
| Applicable to 79,762,331 outstanding $.0 01 par value shares of | | | | | |
| beneficial interest (unlimited authorization) | | | | | 4,148,728 | |
| Net Asset Value Per Share | | | | $ | 52.01 | |
| |
| |
| At December 31, 2009, net assets consisted of: | | | | | | |
| | | | | | Amount | |
| | | | | ($ | 000 | ) |
| Paid-in Capital | | | | | 4,074,386 | |
| Undistributed Net Investment Income | | | | | — | |
| Accumulated Net Realized Losses | | | | | (2,164 | ) |
| Unrealized Appreciation (Depreciation) | | | | | 76,506 | |
| Net Assets | | | | | 4,148,728 | |
• See Note A in Notes to Financial Statements.
1 Guaranteed by the Federal Deposit Insurance Corporation (FDIC) as part of the Temporary Liquidity Guarantee Program.
2 The issuer operates under a congressional charter; its securities are not backed by the full faith and credit of the U.S. government.
3 The average or expected maturity is shorter than the final maturity shown because of the possibility of interim principal payments and prepayments or the possibility of the issue being called.
4 Adjustable-rate security.
5 Security exempt from registration under Rule 144A of the Securities Act of 1933. Such securities may be sold in transactions exempt from registration, normally to qualified institutional buyers. At December 31, 2009, the aggregate value of these securities was $20,812,000, representing 0.5% of net assets.
6 Affiliated money market fund available only to Vanguard funds and certain trusts and accounts managed by Vanguard. Rate shown is the 7-day yield.
GO—General Obligation Bond.
REIT—Real Estate Investment Trust.
USD—United School District.
See accompanying Notes, which are an integral part of the Financial Statements.
63
| | | |
| Institutional Total Bond Market Index Fund | | | |
| |
| |
| Statement of Assets and Liabilities | | | |
| As of December 31, 2009 | | | |
| |
| | | Market Value | |
| | ($ | 000 | ) |
| Assets | | | |
| Investments in Securities, at Value | | 4,296,878 | |
| Receivables for Investment Securities Sold | | 103,619 | |
| Receivables for Capital Shares Issued | | 261,038 | |
| Other Assets | | 36,071 | |
| Total Assets | | 4,697,606 | |
| Liabilities | | | |
| Payables for Investment Securities Purchased | | 396,406 | |
| Payables for Capital Shares Redeemed | | 146,801 | |
| Other Liabilities | | 5,671 | |
| Total Liabilities | | 548,878 | |
| Net Assets | | 4,148,728 | |
See accompanying Notes, which are an integral part of the Financial Statements.
64
| | | |
| Institutional Total Bond Market Index Fund | | | |
| |
| |
| Statement of Operations | | | |
| |
| | | Year Ended | |
| | | December 31, 2009 | |
| | ($ | 000 | ) |
| Investment Income | | | |
| Income | | | |
| Interest1 | | 204,896 | |
| Total Income | | 204,896 | |
| Expenses | | | |
| The Vanguard Group—Note B | | | |
| Management and Administrati ve | | 2,409 | |
| Total Expenses | | 2,409 | |
| Net Investment Income | | 202,487 | |
| Realized Net Gain (Loss) | | | |
| Investment Securities Sold | | 38,799 | |
| Swap Contracts | | 1,751 | |
| Realized Net Gain (Loss) | | 40,550 | |
| Change in Unrealized Appreciation (Depreciation) of Investment Securities | | (3,253 | ) |
| Net Increase (Decrease) in Net Assets Resulting from Operations | | 239,784 | |
| 1 Interest income from an affiliated company of the fund was $639,000. | | | |
| |
| |
| |
| |
| See accompanying Notes, which are an integral part of the Financial Statements. | | | |
65
| | | | | | |
| Institutional Total Bond Market Index Fund | | | | | | |
| |
| |
| Statement of Changes in Net Assets | | | | | | |
| |
| | | Year Ended December 31, | |
| | | 2009 | | | 2008 | |
| | ($ | 000 | ) | ($ | 000 | ) |
| Increase (Decrease) in Net Assets | | | | | | |
| Operations | | | | | | |
| Net Investment Income | | 202,487 | | | 372,841 | |
| Realized Net Gain (Loss) | | 40,550 | | | 13,983 | |
| Change in Unrealized Appreciation (Depreciation) | | (3,253 | ) | | (18,217 | ) |
| Net Increase (Decrease) in Net Assets Resulting from Operations | | 239,784 | | | 368,607 | |
| Distributions | | | | | | |
| Net Investment Income | | (209,736 | ) | | (351,110 | ) |
| Realized Capital Gain1 | | (21,216 | ) | | — | |
| Total Distributions | | (230,952 | ) | | (351,110 | ) |
| Capital Share Transactions | | | | | | |
| Issued | | 2,582,590 | | | 3,315,056 | |
| Issued in Lieu of Cash Distributions | | 190,116 | | | 322,797 | |
| Redeemed | | (6,069,982 | ) | | (3,816,520 | ) |
| Net Increase (Decrease) from Capital Share Transactions | | (3,297,276 | ) | | (178,667 | ) |
| Total Increase (Decrease) | | (3,288,444 | ) | | (161,170 | ) |
| Net Assets | | | | | | |
| Beginning of Period | | 7,437,172 | | | 7,598,342 | |
| End of Period2 | | 4,148,728 | | | 7,437,172 | |
| 1 | Includes fiscal 2009 short-term gain distributions totaling $21,216,000. Short-term gain distributions are treated as ordinary income dividends for tax purposes. |
| 2 | Net Assets—End of Period includes undistributed net investment income of $0 and $5,025,000. |
See accompanying Notes, which are an integral part of the Financial Statements.
66
| | | | | | | | | | | | | | | |
| Institutional Total Bond Market Index Fund | | | | | | | | | | | | | | | |
| |
| |
| Financial Highlights | | | | | | | | | | | | | | | |
| |
| |
| For a Share Outstanding | | | | | | | | Year Ended December 31, | |
| Throughout Each Period | | 2009 | | | 2008 | | | 2007 | | | 2006 | | | 2005 | |
| Net Asset Value, Beginning of Period | $ | 51.33 | | $ | 51.19 | | $ | 50.32 | | $ | 50.79 | | $ | 51.79 | |
| Investment Operations | | | | | | | | | | | | | | | |
| Net Investment Income | | 2.176 | | | 2.508 | | | 2.596 | | | 2.540 | | | 2.263 | |
| Net Realized and Unrealized Gain (Loss) | | | | | | | | | | | | | | | |
| on Investments | | .859 | | | (.008 | ) | | .830 | | | (.429 | ) | | (1.007 | ) |
| Total from Investment Operations | | 3.035 | | | 2.500 | | | 3.426 | | | 2.111 | | | 1.256 | |
| Distributions | | | | | | | | | | | | | | | |
| Dividends from Net Investment Income | | (2.205 | ) | | (2.360 | ) | | (2.556 | ) | | (2.581 | ) | | (2.256 | ) |
| Distributions from Realized Capital Gains | | (.150 | ) | | — | | | — | | | — | | | — | |
| Total Distributions | | (2.355 | ) | | (2.360 | ) | | (2.556 | ) | | (2.581 | ) | | (2.256 | ) |
| Net Asset Value, End of Period | $ | 52.01 | | $ | 51.33 | | $ | 51.19 | | $ | 50.32 | | $ | 50.79 | |
| |
| Total Return | | 6.06 | % | | 5.05 | % | | 7.01 | % | | 4.30 | % | | 2.47 | % |
| |
| Ratios/Supplemental Data | | | | | | | | | | | | | | | |
| Net Assets, End of Period (Millions) | $ | 4,149 | | $ | 7,437 | | $ | 7,598 | | $ | 4,826 | | $ | 2,861 | |
| Ratio of Total Expenses to | | | | | | | | | | | | | | | |
| Average Net Assets | | 0.05 | % | | 0.05 | % | | 0.05 | % | | 0.05 | % | | 0.05 | % |
| Ratio of Net Investment Income to | | | | | | | | | | | | | | | |
| Average Net Assets | | 4.30 | % | | 4.88 | % | | 5.17 | % | | 5.08 | % | | 4.47 | % |
| Portfolio Turnover Rate1&nb sp; | | 104 | % | | 88 | % | | 62 | % | | 63 | % | | 68 | % |
1 Excludes the value of portfolio securities received or delivered as a result of in-kind purchases or redemptions of the fund’s capital shares.
See accompanying Notes, which are an integral part of the Financial Statements.
67
Institutional Total Bond Market Index Fund
Notes to Financial Statements
Vanguard Institutional Total Bond Market Index Fund is registered under the Investment Company Act of 1940 as an open-end investment company, or mutual fund. The fund is offered to investors who meet certain administrative and service criteria and invest a minimum of $100 million. Certain of the fund’s investments are in corporate debt instruments; the issuers’ abilities to meet their obligations may be affected by economic developments in their respective industries.
A. The following significant accounting policies conform to generally accepted accounting principles for U.S. mutual funds. The fund consistently follows such policies in preparing its financial statements.
1. Security Valuation: Bonds, and temporary cash investments acquired over 60 days to maturity, are valued using the latest bid prices or using valuations based on a matrix system (which considers such factors as security prices, yields, maturities, and ratings), both as furnished by independent pricing services. Investments in Vanguard Market Liquidity Fund are valued at that fund’s net asset value. Other temporary cash investments are valued at amortized cost, which approximates market value. Securities for which market quotations are not readily available, or whose values have been affected by events occurring before the fund’s pricing time but after the close of the securities’ primary markets, are valued by methods deemed by the board of trustees to represent fair value.
2. Swap Contracts: The fund is subject to credit risk through its investment in swap transactions to earn the total return on the Commercial Mortgage-Backed Securities (CMBS) Index. Under the terms of the swaps, the fund receives the total return (either receiving the increase or paying the decrease) on the CMBS index, applied to a notional principal amount. In return, the fund agrees to pay the counterparty a floating rate, which is reset periodically based on short-term interest rates, applied to the same notional amount. At the same time, the fund invests an amount equal to the notional amount of the swaps in high-quality floating-rate securities.
The notional amounts of swap contracts are not recorded in the Statement of Net Assets. Swaps are valued daily and the change in value is recorded as unrealized appreciation (depreciation) until periodic payments are made, or the swap terminates, at which time realized gain (loss) is recorded. A primary risk for all types of swaps is that a counterparty will default on its obligation to pay net amounts due to the fund. The fund’s maximum risk of loss from counterparty credit risk is the amount of unrealized appreciation on the swap contract. This risk is mitigated by entering into swaps only with highly rated counterparties, by a master netting arrangement between the fund and the counterparty and by the posting of collateral by the counterparty. The swap contracts contain provisions whereby a counter-party may terminate open contracts if the fund’s net assets decline below a certain level, triggering a payment b y the fund if the fund is in a net liability position at the time of the termination. The payment amount would be reduced by any collateral the fund has posted. Any securities posted as collateral for open contracts are noted in the Statement of Net Assets.
3. Mortgage Dollar Rolls: The fund has entered into mortgage-dollar-roll transactions, in which the fund sells mortgage-backed securities to a dealer and simultaneously agrees to purchase similar securities in the future at a predetermined price. The proceeds of the securities sold in mortgage-dollar-roll transactions are invested in high-quality short-term fixed income securities. The fund forgoes principal and interest paid on the securities, and is compensated by interest earned on the proceeds of the initial sale and by a lower price on the securities to be repurchased. The fund accounts for mortgage-dollar-roll transactions as purchases and sales; as such, these transactions may increase the fund’s portfolio turnover rate. Amounts to be received or paid in connection with open mortgage dollar rolls
68
Institutional Total Bond Market Index Fund
are included in Receivables for Investment Securities Sold or Payables for Investment Securities Purchased in the Statement of Assets and Liabilities. The primary risk associated with mortgage dollar rolls is t hat a counterparty will default on its obligations to deliver purchased securities.
4. Federal Income Taxes: The fund intends to continue to qualify as a regulated investment company and distribute all of its taxable income. Management has analyzed the fund’s tax positions taken for all open federal income tax years (December 31, 2006–2009), and has concluded that no provision for federal income tax is required in the fund’s financial statements.
5. Distributions: Distributions from net investment income are declared daily and paid on the first business day of the following month. Annual distributions from realized capit al gains, if any, are recorded on the ex-dividend date.
6. Other: Interest income includes income distributions received from Vanguard Market Liquidity
Fund and is accrued daily. Premiums and discounts on debt securities purchased are amortized and accreted, respectively, to interest income over the lives of the respective securities. Security transactions are accounted for on the date securities are bought or sold. Costs used to determine realized gains (losses) on the sale of investment securities are those of the specific securities sold.
B. The Vanguard Group provides investment advisory, corporate management, administrative, marketing, and distribution services and pays for all other operating expenses, except for ta xes, in return for a fee calculated at an annual percentage rate of the average net assets of the fund. The fund’s trustees and officers are also directors and officers of Vanguard.
C. Various inputs may be used to determine the value of the fund’s investments. These inputs are summarized in three broad levels for financial statement purposes. The inputs or methodologies used to value securities are not necessarily an indi cation of the risk associated with investing in those securities.
Level 1—Quoted prices in activ e markets for identical securitie s.
Level 2—Other significant observable inputs (including quoted prices for similar securities, interest rates, prepayment speeds, credit risk, etc.).
Level 3—Significant unobservable inputs (including the fund’s own assumptions used to determine the fair value of investment s).
The following table summarizes the fund’s investments as of December 31, 2009, based on the inputs used to value them:
| | | | | | | | | |
| | | Level 1 | | | Level 2 | | | Level 3 | |
| Investments | ($ | 000 | ) | ($ | 000 | ) | ($ | 000 | ) |
| U.S. Government and Agency Obligations | | — | | | 3,023,913 | | | — | |
| Asset-Backed/Commercial Mortgage-Backed Securities | | — | | | 144,833 | | | — | |
| Corporate Bonds | | — | | | 792,700 | | | — | |
| Sovereign Bonds | | — | | | 147,294 | | | — | |
| Taxable Municipal Bonds | | — | | | 17,217 | | | — | |
| Temporary Cash Investments | | 170,921 | | | — | | | — | |
| Total | | 170,921 | | | 4,125,957 | | | — | |
69
Institutional Total Bond Market Index Fund
D. Capital gain distributions are determined on a tax basis and may differ from realized capital gains for financial reporting purposes. Differences may be permanent or temporary. Permanent differences are reclassified among capital accounts in the financial statements to reflect their tax character. Temporary differences arise when gains or losses are recognized in different pe riods for financial statement and tax purposes; these differences will reverse at some time in the future.
Realized and unrealized gains (losses) on certain of the fund’s swap contracts are treated as ordinary income (loss) for tax purposes; the effect on the fund’s income dividends to shareholders is offset by a change in principal return. Realized gains of $1,751,000 on swap contracts have been reclassified from accumulated net realized losses to undistributed net investment income.
During the year ended December 31, 2009, the fund realized $39,508,000 of net capital gains resulting from in-kind redemptions—in which shareholders exchanged fund shares for securities held by the fund rather than for cash. Because such gains are not taxable to the fund, and are not distributed to shareholders, they have been reclassified from accumulated net realized losses to paid-in capital.
For tax purposes, at December 31, 2009, the fund had available capital loss carryforwards totaling $747,000 to offset future net capital gains through December 31, 2017.
Certain of the fund’s U.S. Treasury Inflation-Indexed securities experienced deflation adjustments that reduced interest income and the cost of investments for financial st atement purposes by an amount greater than the reduction of taxable income; the additional income reduction was deferred for tax pur-poses until it was used to offset future inflation adjustments that increase taxable income. The difference became permanent when the securities were sold. During the year ended December 31, 2009, the fund realized gains of $473,000 that were included in ordinary income for tax purposes as a result of deferred deflation adjustments; accordingly such gains have been reclassified from accumulated net realized gains to undistributed net investment income.
At December 31, 2009, the cost of investment securities for tax purposes was $4,221,801,000. Net unrealized appreciation of investment securities for tax purposes was $75,077,000, consisting of unrealized gains of $109,958,000 on securities that had risen in value since their purchase and $34,881,000 in unrealized losses on securities that had fallen in value since their purchase.
E. During the year ended December 31, 2009, the fund purchased $467,267,000 of investment securities and sold $1,290,427,000 of investment securities, other than U.S. government securities and temporary cash investments. Purchases and sales of U.S. government securities were $5,303,560,000 and $7,630,124,000, respectively.
| F. | Capital shares issued and redeemed were: |
| | | | |
| | Year Ended December 31, | |
| | 2009 | | 2008 | |
| | Shares | | Shares | |
| | (000 | ) | (000 | ) |
| Issued | 50,225 | | 65,984 | |
| Issued in Lieu of Cash Distributions | 3,710 | | 6,374 | |
| Redeemed | (119,063 | ) | (75,914 | ) |
| Net Increase (Decrease) in Shares Outstanding | (65,128 | ) | (3,556 | ) |
70
Institutional Total Bond Market Index Fund
G. In preparing the financial statements as of December 31, 2009, management considered the impact of subsequent events occurring through February 16, 2010, for potential recognition or disclosure in these financial statements.
As of the close of business on February 5, 2010, all the net assets of the fund were acquired by Vanguard Total Bond Market Index Fund pursuant to a plan of reorganization approved by the funds’ board of trustees and shareholders at a meeting held on February 3, 2010. The acquisition was accomplished by a tax-free exchange of 403,613,000 of the Total Bond Market Index Fund’s capital shares for the 80,272,000 shares of the fund outstanding as of the close of business on February 5, 2010. Shares of the fund were exchanged for new Institutional Plus Shares of Total Bond Market Index Fund. The fund’s net assets of $4,235,240,000, including $134,921,000 of unrealized appreciation, were combined with Total Bond Market I ndex Fund’s net assets of $70,363,886,000, resulting in combined net assets of $74,599,126,000 immediately following the acquis ition of the fund.
71
Report of Independent Registered Public A ccounting Firm
To the Trustees of Vanguard Institutional Index Funds and the Shareholders of Vanguard Institutional Total Bond Market Index Fund:
In our opinion, the accompanying statement of net assets and statement of assets and liabilities, and the related statements of operations and of changes in net assets and the financial highlights present fairly, in all material respects, the financial position of Vanguard Institutional Total Bond Market Index Fund (constituting a separate portfolio of Vanguard Institutional Index Funds, hereafter referred to as the “Fund”) at December 31, 2009, the results of its operations for the year then ended, the changes in its net assets for each of the two years in the period then ended and the financial highlights for each of the five years in the period then ended, in conformity with accounting principles generally accepted in the United States of America. These financial statements and financial highlights (hereafter referred to as “financial statements”) are the responsibility of the Fund’s management; our responsibility is to express an opinion on these financial statements based on our audits. We conducted our audits of these financial statements in accordance with the standards of the Public Company Accounting Oversight Board (United States). Those standards require that we plan and perform the audit to obtain reasonable assurance about whether the financial statements are free of material misstatement. An audit includes examining, on a test basis, evi dence supporting the amounts and disclosures in the financial statements, assessing the accounting principles used and significant estimates made by management, and evaluating the overall financial statement presentation. We believe that our audits, which included confirmation of securities at December 31, 2009 by correspondence with the custodian and brokers and by agreement to the underlying ownership records of Vanguard Market Liquidity Fund, provide a reasonable basis for our opinion.
PricewaterhouseCoopers LLP
Philadelphia, Pennsylvania
February 16, 2010
72
About Your Fund’s Expenses
As a shareholder of the fund, you incur ongoing costs, which include costs for portfolio management, administrative services, and shareholder reports (like this one), among others. Operating expenses, which are deducted from a fund’s gross income, directly reduce the investment return of the fund.
A fund’s expenses are expressed as a percentage of its average net assets. This figure is known as the expense ratio. The following examples are intended to help you understand the ongoing costs (in dollars) of investing in your fund and to compare these costs with those of other mutual funds. The examples are based on an investment of $1,000 made at the beginning of the period shown and held for the entire period.
The accompanying table illustrates your fund’s costs in two ways:
• Based on actual fund return. This section helps you to estimate the actual expenses that you paid over the period. The ”Ending Account Value“ shown is derived from the fund‘s actual return, and the third column shows the dollar amount that would have been paid by an investor who started with $1,000 in the fund. You may use the information here, together with the amount you invested, to estimate the expenses that you paid over the period.
To do so, simply divide your account value by $1,000 (for example, an $8,600 account value divided by $1,000 = 8.6), then multiply the result by the number given for your fund under the heading ”Expenses Paid During Period.“
• Based on hypothetical 5% yearly return. This section is intended to help you compare your fund‘s costs with those of other mutual funds. It assumes that the fund had a yearly return of 5% before expenses, but that the expense ratio is unchanged. In this case—because the return used is not the fund’s actual return—the results do not apply to your investment. The example is useful in making comparisons because the Securities and Exchange Commission requires all mutual funds to calculate expenses based on a 5% return. You can assess your fund’s costs by comparing this hypothetical example with the hypothetical examples that appear in shareholder reports of other funds.
Note that the expenses shown in the table are meant to highlight and help you compare ongoing costs only and do not reflect transaction costs incurred by the fund for buying and selling securities. Your fund does not charge transaction fees, such as purchase or redemption fees, nor does it carry a “sales load.” The calculations assume no shares were bought or sold during the period. Your actual costs may have been higher or lower, depending on the amount of your investment and the timing of any purchases or redemptions.
You can find more information about the fund’s expenses, including annual expense ratios, in the Financial Statements section of this report. For additional information on operating expenses and other shareholder costs, please refer to your fund’s current prospectus.
73
| | | | | | |
| Six Months Ended December 31, 2009 | | | | | | |
| | | Beginning | | Ending | | Expenses |
| | | Account Value | | Account Value | | Paid During |
| Institutional Total Bond Market Index Fund | | 6/30/2009 | | 12/31/2009 | | Period |
| Based on Actual Fund Return | $ | 1,000.00 | $ | 1,039.02 | $ | 0.26 |
| Based on Hypothetical 5% Yearly Return | | 1,000.00 | | 1,024.95 | | 0.26 |
The calculations are based on expenses incurred in the most recent six-month period. The fund’s annualized six-month expense ratio for that period is 0.05%. The dollar amounts shown as “Expenses Paid” are equal to the annualized expense ratio multiplied by the average account value over the period, multiplied by the number of days in the most recent six-month period, then divided by the number of days in the most recent 12-month period.
74
Glossary
30-Day SEC Yield. A fund’s 30-day SEC yield is derived using a formula specified by the U.S. Securities and Exchange Commission. Under the formula, data related to the fund’s security holdings in the previous 30 days are used to calculate the fund’s hypothetical net income for that period, which is then annualized and divided by the fund’s estimated average net assets over the calculation period. For the purposes of this calculation, a security’s income is based on its current market yield to maturity (in the case of bonds) or its projected dividend yield (for stocks). Because the SEC yield represents hypothetical annualized income, it will differ—at times significantly—from the fund’s actual experience. As a result, the fund’s income distributions may be higher or lower than implied by the SEC yield.
Average Coupon. The average interest rate paid on the fixed income securities held by a fund. It is expressed as a percentage of face value.
Average Duration. An estimate of how much the value of the bonds held by a fund will fluctuate in response to a change in interest rates. To see how the value could change, multiply the average duration by the change in rates. If interest rates rise by 1 percentage point, the value of the bonds in a fund with an average duration of five years would decline by about 5%. If rates decrease by a percentage point, the value would rise by 5%.
Average Effective Maturity. The average length of time until fixed income securities held by a fund reach maturity and are repaid, taking into consideration the possibility that the issuer may call the bond before its maturity date. The figure reflects the proportion of fund assets represented by each security; it also reflects any futures contracts held. In general, the longer the average effective maturity, the more a fund’s share price will fluctuate in response to changes in market interest rates.
Average Quality. An indicator of credit risk, this figure is the average of the ratings assigned to a fund’s fixed income holdings by credit-rating agencies. The agencies make their judgment after appraising an issuer’s ability to meet its obligations. Quality is graded on a scale, with Aaa or AAA indicating the most creditworthy bond issuers. U.S. Treasury securities are considered to have the highest credit quality.
Beta. A measure of the magnitude of a fund’s past share-price fluctuations in relation to the ups and downs of a given market index. The index is assigned a beta of 1.00. Compared with a given index, a fund with a beta of 1.20 typically would have seen its share price rise or fall by 12% when the index rose or fell by 10%. For this report, beta is based on returns over the past 36 months for both the fund and the index. Note that a fund’s beta should be reviewed in conjunction with its R-squared (see definition). The lower the R-squared, the less correlation there is between the fund and the index, and the less reliable beta is as an indicator of volatility.
Expense Ratio. The percentage of a fund’s average net assets used to pay its annual administrative and advisory expenses. These expenses directly reduce returns to investors.
Inception Date. The date on which the assets of a fund (or one of its share classes) are first invested in accordance with the fund’s investment objective. For funds with a subscription period, the inception date is the day after that period ends. Investment performance is measured from the inception date.
75
R-Squared. A measure of how much of a fund’s past returns can be explained by the returns from the market in general, as measured by a given index. If a fund’s total returns were precisely synchronized with an index’s returns, its R-squared would be 1.00. If the fund’s returns bore no relationship to the index’s returns, its R-squared would be 0. For this report, R-squared is based on returns over the past 36 months for both the fund and the index.
Short-Term Reserves. The percentage of a fund invested in highly liquid, short-term securities that can be readily converted to cash.
Yield to Maturity. The rate of return an investor would receive if the fixed income securities held by a fund were held to their maturity dates.
76
This page intentionally left blank.
This page intentionally left blank.
This page intentionally left blank.
The People Who Govern Your Fund
The trustees of your mutual fund are there to see that the fund is operated and managed in your best interests since, as a shareholder, you are a part owner of the fund. Your fund’s trustees also serve on the board of directors of The Vanguard Group, Inc., which is owned by the Vanguard funds and provides services to them on an at-cost basis.
A majority of Vanguard’s board members are independent, meaning that they have no affiliation with Vanguard or the funds they oversee, apart from the sizable personal investments they have made as private individuals. The independent board members have distinguished backgrounds in business, academia, and public service. Each of the trustees and executive office rs oversees 163 Vanguard funds.
The following table provides information for each trustee and executive officer of the fund. More information about the trustees is in the Statement of Additional Information, which can be obtained, without charge, by contacting Vanguard at 800-662-7447, or online at www.vanguard.com.
Interested Trustee1
F. William McNabb III
Born 1957. Trustee Since July 2009. Chairman of the Board. Principal Occupation(s) During the Past Five Years: Chairman of the Board of The Vanguard Group, Inc., and of each of the investment companies served by The Vanguard Group, since January 2010; Director of The Vanguard Group since 2008; Chief Executive Officer and President of The Vanguard Group and of each of the investment companies served by The Vanguard Group since 2008 ; Director of Vanguard Marketing Corporation; Managing Director of The Vanguard Group (1995–2008).
Independent Trustees
Emerson U. Fullwood
Born 1948. Trustee Since January 2008. Principal Occupation(s) During the Past Five Years: Executive Chief Staff and Marketing Officer for North America and Corporate Vice President (retired 2008) of Xerox Corporation (photocopiers and printers); Director of SPX Corporation (multi-industry manufacturing), the United Way of Rochester, the Boy Scouts of America, Amerigroup Corporation (direct health and medical insurance carriers), and Monroe Community College Foundation.
Rajiv L. Gupta
Born 1945. Trustee Since December 2001.2 Principal Occupation(s) During the Past Five Years: Chairman and Chief Executive Officer (retired 2009) and President (2006–2008) of Rohm and Haas Co. (chemicals); Board Member of American Chemistry Council; Director of Tyco International, Ltd. (diversified manufacturing and services) and Hewlett-Packard Co. (electronic computer manufacturing); Trustee of The Conference Board.
Amy Gutmann
Born 1949. Trustee Since June 2006. Principal Occupation(s) During the Past Five Years: President of the University of Pennsylvania; Christopher H. Browne Distinguished Professor of Political Science in the School of Arts and Sciences with secondary appointments at the Annenberg School for Communication and the Graduate School of Education of the University of Pennsylvania; Director of Carnegie Corporation of New York, Schuylkill River Development Corporation, and Greater Philadelphia Chamber of Commerce;
Trustee of the National Constitution Center.
JoAnn Heffernan Heisen
Born 1950. Trustee Since July 1998. Principal Occupation(s) During the Past Five Years: Corporate Vice President and Chief Global Diversity Officer since 2006 (retired 2008) and Member of the Executive Committee (retired 2008) of Johnson & Johnson (pharmaceuticals/consumer products); Vice President and Chief Information Officer of Johnson & Johnson (1997–2005); Director of the University Medical Center at Princeton and Women’s Research and Education Institute; Member of the Advisory Board of the Maxwell School of Citizenship and Public Affairs at Syracuse University.
F. Joseph Loughrey
Born 1949. Trustee Since October 2009. Principal Occupation(s) During the Past Five Years: President and Chief Operating Officer since 2005 (retired 2009) and Vice Chairman of the Board (2008–2009) of Cummins Inc. (industrial machinery); Director of SKF AB (industrial machinery), Hillenbrand, Inc. (specialized consumer services), Sauer-Danfoss Inc. (machinery), the Lumina Foundation for Education, and the Columbus Community Education Coalition; Chairman of t he Advisory Council for the College of Arts and Letters at the Uni versity of Notre Dame.
André F. Perold
Born 1952. Trustee Since December 2004. Principal Occupation(s) During the Past Five Years: George Gund Professor of Finance and Banking, Harvard Business School; Chair of the Investment Committee of HighVista Strategies LLC (private investment firm).
Alfred M. Rankin, Jr.
Born 1941. Trustee Since January 1993. Principal Occupation(s) During the Past Five Years: Chairman, President, and Chief Executive Officer of NACCO Industries, Inc. (forklift trucks/housewares/lignite); Director of Goodrich Corporation (industrial products/ aircraft systems and services); Deputy Chairman of the Federal Reserve Bank of Cleveland; Trustee of University Hospitals of Cleveland, The Cleveland Museum of Art, and Case Western Reserve University.
Peter F. Volanakis
Born 1955. Trustee Since July 2009. Principal Occupation(s) During the Past Five Years: President since 2007 and Chief Operating Officer since 2005 of Corning Incorporated (communications equipment); President of Corning Technologies (2001–2005); Director of Corning Incorporated and Dow Corning; Trustee of the Corning Incorporated Foundation and the Corning Museum of Glass; Overseer of the Amos Tuck School of Business Administration at Dartmouth College.
Executive Officers
Thomas J. Higgins
Born 1957. Chief Financial Officer Since September 2008. Principal Occupation(s) During the Past Five Years: Principal of The Vanguard Group, Inc.; Chief Financial Officer of each of the investment companies served by The Vanguard Group since 2008; Treasurer of each of the investment companies served by The Vanguard Group (1998–2008).
Kathryn J. Hyatt
Born 1955. Treasurer Since November 2008. Principal Occupation(s) During the Past Five Years: Principal of The Vanguard Group, Inc.; Treasurer of each of the investment companies served by The Vanguard Group since 2008; Assistant Treasurer of each of the investment companiesserved by The Vanguard Group
(1988–2008).
Heidi Stam
Born 1956. Secretary Since July 2005. Principal Occupation(s) During the Past Five Years: Managing Director of The Vanguard Group, Inc., since 2006; General Counsel of The Vanguard Group since 2005; Secretary of The Vanguard Group and of each of the investment companie s served by The Vanguard Group since 2005; Director and Senior Vice President of Vanguard Marketing Corporation since 2005; Principal of The Vanguard Group (1997–2006).
Vanguard Senior Management Team
R. Gregory Barton
Mortimer J. Buckley
Kathleen C. Gubanich
Paul A. Heller
Michael S. Miller
James M. Norris
Glenn W. Reed
George U. Sauter
Chairman Emeritus and Senior Advisor
John J. Brennan
Chairman, 1996–2009
Chief Executive Officer and President, 1996–2008
Founder
John C. Bogle
Chairman and Chief Executive Officer, 1974–1996
1 Mr. McNabb is considered an “interested person,” as defined in the Investment Company Act of 1940, because he is an officer of the Vanguard funds.
2 December 2002 for Vanguard Equity Income Fund, Vanguard Growth Equity Fund, the Vanguard Municipal Bond Funds, and the Vanguard State Tax-Exempt Funds.

P.O. Box 2600
Valley Forge, PA 19482-2600
Connect with Vanguard® > www.vanguard.com
Fund Information > 800-662-7447
Direct Investor Account Services > 800-662-2739
Institutional Investor Services > 800-523-1036
Text Telephone for People
With Hearing Impairment > 800-749-7273
This material may be used in conjunction
with the offering of shares of any Vanguard
fund only if preceded or accompanied by
the fund’s current prospectus.
All comparative mutual fund data are from Lipper Inc. or
Morningstar, Inc., unless otherwise noted.
You can obtain a free copy of Vanguard’s proxy voting
guidelines by visiting our website, www.vanguard.com,
and searching for “proxy voting guidelines,” or by calling
Vanguard at 800-662-2739. The guidelines are also
available from the SEC’s website, www.sec.gov. In
addition, you may obtain a free report on how your fund
voted the proxies for securities it owned during the 12
months ended June 30. To get the report, visit either
www.vanguard.com or www.sec.gov.
You can review and copy information about your fund at
the SEC’s Public Reference Room in Washington, D.C. To
find out more about this public service, call the SEC at
202-551-8090. Information about your fund is also
available on the SEC’s website, and you can receive
copies of this information, for a fee, by sending a
request in either of two ways: via e-mail addressed to
publicinfo@sec.gov or via regular mail addressed to the
Public Reference Section, Securities and Exchange
Commission, Washington, DC 20549-1520.

© 2010 The Vanguard Group, Inc.
All rights reserved.
Vanguard Marketing Corporation, Distributor.
Q3370 022010

Vanguard Institutional Total Stock Market Index Fund Annual Report

- For the fiscal year ended December 31, 2009, the broad U.S. stock market returned about 29%, with all market sectors producing positive results.
- The Institutional Total Stock Market Index Fund, which invests in large-, mid-, and small-capitalization stocks, closely tracked its broad-market benchmark.
- The index’s biggest gains came from the information technology and consumer discretionary sectors.
| |
| Contents | |
| Your Fund’s Total Returns......... | 1 |
| Chairman’s Letter...................... | 2 |
| Results of Proxy Voting............ | 7 |
| Fund Profile.............................. | 8 |
| Performance Summary............. | 9 |
| Financial Statements................. | 11 |
| About Your Fund’s Expenses...... | 56 |
| Glossary..................................... | 58 |

Institutional Total Stock Market Index Fund
Please note: The opinions expressed in this report are just that—informed opinions. They should not be considered promises or advice. Also, please keep in mind that the information and opinions cover the period through the date on the front of this report. Of course, the risks of investing in your fund are spelled out in the prospectus.
See the Glossary for definitions of investment terms used in this report.
Cover photograph: Veronica Coia.
| | |
| Your Fund’s Total Returns | | |
| |
| |
| |
| |
| Fiscal Year Ended December 31, 2009 | | |
| | Total | |
| | Returns | |
| Vanguard Institutional Total Stock Market Index Fund | | |
| Institutional Shares | 28.84 | % |
| Institutional Plus Shares | 28.92 | |
| MSCI US Broad Market Index | 28.76 | |
| Multi-Cap Core Funds Average | 30.88 | |
| Multi-Cap Core Funds Average: Derived from data provided by Lipper Inc. | | |
Institutional Shares are available for a minimum initial investment of $100 million. Institutional Plus Shares are available for a minimum investment of $200 million.
| | | | | | | | |
| Your Fund’s Performance at a Glance | | | | | | | | |
| December 31, 2008 , Through December 31, 2009 | | | | | | | | |
| | | | | | | Distributions Per Share |
| | | Starting | | Ending | | Income | | Capital |
| | | Share Price | | Share Price | | Dividends | | Gains |
| Vanguard Institutional Total Stock Market Index | | | | | | | | |
| Fund | | | | | | | | |
| Institutional Shares | $ | 19.68 | $ | 24.80 | $ | 0.483 | $ | 0.000 |
| Institutional Plus Shares | | 19.68 | | 24.81 | | 0.487 | | 0.000 |
1

Chairman’s Letter
Dear Shareholder,
At the start of 2009, the United States was in the midst of the biggest economic crisis in decades and stock prices had fallen to historic lows. However, in mid-March, the market staged an impressive rally and stock prices began to soar. As of December 31, the broad U.S. stock market had gained nearly 29%. All sectors of the market posted positive returns for the period.
Vanguard Institutional Total Stock Market Index Fund—which holds both growth and value stocks of all market capitalizations—closely tracked the performance of the MSCI US Broad Market Index, which returned 28.76% in the period. The average return of the fund’s peer group, multi-cap core funds, was 30.88%.
Impressive stock returns masked lingering uncertainties
The U.S. market’s gain for the 12 months ended December 31 was its highest calendar-year return since 2003. The year began with the market searching for a bottom, and it finally hit a low point in early March. From there, stocks mounted one of their strongest rallies ever—in magnitude and duration—resulting in a check mark-shaped stock chart for 2009.
The market’s outsized result came against a backdrop of economic uncertainty. The economy, which struggled to regain its footing as the financial crisis abated, began to show signs of growth in
2
the second half of the year, even as unemployment climbed to levels not seen since 1983.
Stock markets outside the United States fared even better during 2009, especially many emerging markets, which weathered the financial crisis in relatively better fiscal and economic shape than their developed-market counterparts.
Bond markets calmed down, money market funds endured
Compared with the last months of 2008, when credit markets seized up and investors fled to the safety of U.S. Treasuries, 2009 represented a return to normalcy for bonds. Investors’ appetite for risk returned, and the demand for corporate bonds increased, raising their prices and bringing down their yields. For the 12 months ended December 31, the broad taxable bond market returned about 6%, while municipal bonds returned about 13%.
Meanwhile, money market funds and other short-term savings vehicles did poorly in 2009. Interest rates at the shortest end of the maturity spectrum remained at historic lows, a casualty of the Federal Reserve Board’s efforts to revive the economy. The Fed kept its target for the federal funds rate between 0% and 0.25% for the entire year.
| | | | | | |
| Market Barometer | | | | | | |
| |
| | | | Average Annual Total Returns | |
| | | | Periods Ended December 31, 2009 | |
| | One | | Three | | Five | |
| | Year | | Years | | Years | |
| Stocks | | | | | | |
| Russell 1000 Index (Large-caps) | 28.43 | % | -5.36 | % | 0.79 | % |
| Russell 2000 Index (Small-caps) | 27.17 | | -6.07 | | 0.51 | |
| Dow Jones U.S. Total Stock Market Index | 29.35 | | -5.01 | | 1.09 | |
| MSCI All Country World Index ex USA (International) | 42.14 | | -3.04 | | 6.30 | |
| |
| Bonds | | | | | | |
| Barclays Capital U.S. Aggregate Bond Index (Broad | | | | | | |
| taxable market) | 5.93 | % | 6.04 | % | 4.97 | % |
| Barclays Capital Municipal Bond Index | 12.91 | | 4.41 | | 4.32 | |
| Citigroup Three-Month U.S. Treasury Bill Index | 0.16 | | 2.22 | | 2.88 | |
| |
| CPI | | | | | | |
| Consumer Price Index | 2.72 | % | 2.28 | % | 2.56 | % |
3
Growth in all sectors boosted the fund’s return
The Institutional Total Stock Market Index Fund, a reflection of the broad U.S. market, saw a huge turn of fortune in 2009, as the stock market experienced a historic comeback. After one of the worst global recessions in decades, the economy began to show signs of recovery as government stimulus programs took hold and investors slowly regained confidence.
The recovery was broad-based, and all ten market sectors posted gains for the year—in stark contrast to 2008, when all ten recorded losses. The biggest gains came from the information technology and consumer discretionary sectors.
Information technology stocks returned more than 60% for the year, adding about 11 percentage points to the index’s return. After being hit hard during the financial crisis, technology stocks spiked significantly when corporations and consumers resumed spending on computer hardware, software, and electronics. In the consumer discretionary sector, retailers, media companies, hotels, and restaurants started to bounce back as consumers slowly began opening their wallets again. The sector added more than 4 percentage points to the fund’s total return for the year.
The financial sector—the area of the market that was hit hardest by the global credit crisis—was also one of the fund’s top performers for the period. Financial companies, including big banks, investment firms, and insurance companies, began to win back investors’ confidence as their balance sheets showed signs of improvement. Health care and energy stocks were also noteworthy contributors for the period.
Recent volatility has taken a toll on long-term results
Since their inception in 2001, the Institutional Shares of Vanguard Institutional Total Stock Market Index Fund have recorded an average annual return of 2.90%, almost 1 percentage point better than the average result for the fund’s multi-cap core peers—many of which are actively managed.
As a group, institutional funds often have access to lower management fees than those available to retail funds, but the Institutional Total Stock Market Index Fund’s combination of low costs and market-like returns has proved a tough foe for even its most attractively priced actively managed peers. This is a testament, in part, to the indexing strategy. Without excellent execution, however, a good strategy is worth little. Vanguard Quantitative Equity Group, the fund’s advisor, has more than 30 years of index-tracking experience.
4
These long-tenured professionals have developed sophisticated portfolio construction and trading methodologies to help Vanguard deliver sound index fund management in a variety of different marketplaces and market environments.
While equity returns for the decade were undoubtedly disappointing, it’s worthwhile to consider the investing environment, which included the bursting of the technology stock bubble and three straight years of negative returns from 2000 through 2002 as well as the global financial crisis of 2008–2009. We believe the reasons for long-term equity investing remain sound. History indicates that both the U.S. economy and stock market have been resilient over the years and have overcome many crises, including the
Great Depression and two World Wars. The inherent risk in equity investments is, paradoxically, both why they sometimes generate poor returns and why we expect them to outperform less risky assets over time.
A solid core holding in all market weathers
The unpredictability that underlies the stock market was abundantly clear in 2009. After returning about –37% for 2008, the worst calendar-year result since 1931, the broad U.S. stock market continued its sharp decline during the first two months of 2009. In March, even as credit markets hit another rough patch and economic reports signaled the deepening of the recession, the stock market began a recovery that lasted through year-end.
| | | |
| Total Returns | | | |
| Inception Through December 31, 2009 | | | |
| | | Average | |
| | | Annual Return | |
| Institutional Total Stock Market Index Fund Institutional Shares (Returns since inception: | | | |
| 8/31/2001) | | 2.90 | % |
| Spliced Institutional Total Stock Market Index | | 2.83 | |
| Multi-Cap Core Funds Average | | 1.92 | |
Spliced Institutional Total Stock Market Index: Dow Jones Wilshire 5000 Index through April 8, 2005; MSCI US Broad Market Index thereafter. Multi-Cap Core Funds Average: Derived from data provided by Lipper Inc.
The figures shown represent past performance, which is not a guarantee of future results. (Current performance may be lower or higher than the performance data cited. For performance data current to the most recent month-end, visit our website at www.vanguard.com/performance.) Note, too, that both investment returns and principal value can fluctuate widely, so an investor’s shares, when sold, could be worth more or less than their original cost.
5
The Institutional Total Stock Market Index Fund’s history of tightly tracking its benchmark index over long periods and its long-term record versus its peers offer strong evidence that indexing is effective. At Vanguard, we believe that the best way for your organization to withstand the inevitable market volatility and pursue long-term investment success is to maintain a carefully chosen portfolio of stocks, bonds, and short-term reserves tailored to the circumstances of your institution. We believe the Institutional Total Stock Market Index Fund is a sensible investment for a core holding in an institutional portfolio.
On another matter, I would like to inform you that as of January 1, 2010, we completed a leadership transition that began in March 2008. I succeeded Jack Brennan as chairman of Vanguard and each of its funds. Jack has agreed to serve as chairman emeritus and senior advisor.
Under Jack’s leadership, Vanguard has grown to become a preeminent firm in the mutual fund industry. Jack’s energy, his relentless pursuit of perfection, and his unwavering focus on always doing the right thing for our clients are evident in every facet of Vanguard policy today.
As always, thank you for entrusting your assets to Vanguard.
Sincerely,

F. William McNabb III
Chairman and Chief Executive Officer
January 13, 2010
6
Results of Proxy Voting
At a special meeting of shareholders on July 2, 2009, fund shareholders approved the following two proposals:
Proposal 1—Elect trustees for each fund.*
The individuals listed in the table below were elected as trustees for each fund. All trustees with the exception of Messrs. McNabb and Volanakis (both of whom already served as directors of The Vanguard Group, Inc.) served as trustees to the funds prior to the shareholder meeting.
| | | | |
| | | | Percentage | |
| Trustee | For | Withheld | For | |
| John J. Brennan | 800,870,883 | 12,470,067 | 98.5 | % |
| Charles D. Ellis | 789,425,633 | 23,915,317 | 97.1 | % |
| Emerson U. Fullwood | 804,990,098 | 8,350,851 | 99.0 | % |
| Rajiv L. Gupta | 802,591,507 | 10,749,443 | 98.7 | % |
| Amy Gutmann | 805,052,646 | 8,288,304 | 99.0 | % |
| JoAnn Heffernan Heisen | 802,450,398 | 10,890,552 | 98.7 | % |
| F. William McNabb III | 803,031,309 | 10,309,641 | 98.7 | % |
| André F. Perold | 802,741,071 | 10,599,879 | 98.7 | % |
| Alfred M. Rankin, Jr. | 802,368,637 | 10,972,313 | 98.7 | % |
| Peter F. Volanakis | 805,004,858 | 8,336,092 | 99.0 | % |
| * Results are for all funds within the same trust. | | | | |
| |
| Proposal 2—Update and standardize the funds’ fundamental policies regarding: | | |
| (a) Purchasing and selling real estate. | | | | |
| (b) Issuing senior securities. | | | | |
| (c) Borrowing money. | | | | |
| (d) Making loans. | | | | |
| (e) Purchasing and selling commodities. | | | | |
| (f) Concentrating investments in a particular industry or group of industries. | | | |
| (g) Eliminating outdated fundamental investment policies not required by law. | | | |
The revised fundamental policies are clearly stated and simple, yet comprehensive, making oversight and compliance more efficient than under the former policies. The revised fundamental policies will allow the funds to respond more quickly to regulatory and market changes, while avoiding the costs and delays associated with successive shareholder meetings.
| | | | | | | |
| | | | | | Broker | Percentage | |
| Vanguard Fund | | For | Abstain | Against | Non-Votes | For | |
| Institutional Total Stock Market Index Fund | | | | | |
| 2a | | 337,275,080 | 14,899,556 | 130,492 | 5,520,366 | 94.3 | % |
| 2b | | 337,237,388 | 14,922,391 | 145,350 | 5,520,365 | 94.2 | % |
| 2c | | 337,260,619 | 14,899,723 | 144,786 | 5,520,366 | 94.3 | % |
| 2d | | 337,257,239 | 14,897,411 | 150,476 | 5,520,368 | 94.3 | % |
| 2e | | 337,262,198 | 14,897,623 | 145,309 | 5,520,364 | 94.3 | % |
| 2f | | 337,269,468 | 14,908,149 | 127,511 | 5,520,366 | 94.3 | % |
| 2g | | 337,256,740 | 14,908,812 | 139,576 | 5,520,366 | 94.3 | % |
7
Institutional Total Stock Market Index Fund
| | | | | | |
| Fund Profile | | | | | | |
| As of December 31, 2009 | | | | | | |
| |
| Share-Class Characteristics | | | | |
| Institutional | | | Institutional | |
| | | Shares | | | Plus Shares | |
| Ticker Symbol | | VITNX | | | VITPX | |
| Expense Ratio1 | | 0.045 | % | | 0.025 | % |
| 30-Day SEC Yield | | 1.73 | % | | 1.75 | % |
| |
| Portfolio Characteristics | | | | | | |
| | | | | | MSCI US | |
| | | | | | Broad Market | |
| | | Fund | | | Index | |
| Number of Stocks | | 3,240 | | | 3,560 | |
| Median Market Cap | $ | 30.0 | B | $ | 30.0 | B |
| Price/Earnings Ratio | | 35.4 | x | | 35.4 | x |
| Price/Book Ratio | | 2.1 | x | | 2.1 | x |
| Return on Equity | | 19.4 | % | | 19.3 | % |
| Earnings Growth Rate | | 8.4 | % | | 8.4 | % |
| Dividend Yield | | 1.8 | % | | 1.8 | % |
| Foreign Holdings | | 0.0 | % | | 0.0 | % |
| Turnover Rate | | 13 | % | | — | |
| Short-Term Reserves | | 0.2 | % | | — | |
Sector Diversification (% of equity exposure)
| | | | |
| | | | MSCI US | |
| | | | Broad Market | |
| | Fund | | Index | |
| Consumer Discretionary | 10.2 | % | 10.2 | % |
| Consumer Staples | 9.8 | | 9.8 | |
| Energy | 11.0 | | 11.0 | |
| Financials | 15.2 | | 15.3 | |
| Health Care | 12.6 | | 12.6 | |
| Industrials | 11.0 | | 10.9 | |
| Information Technology | 19.6 | | 19.6 | |
| Materials | 3.9 | | 3.9 | |
| Telecommunication | | | | |
| Services | 2.9 | | 2.9 | |
| Utilities | 3.8 | | 3.8 | |
| |
| Volatility Measures | |
| | MSCI US |
| | Broad Market |
| | Index |
| R-Squared | 1.00 |
| Beta | 1.00 |
These measures show the degree and timing of the fund’s fluctuations compared with the index over 36 months.
Ten Largest Holdings (% of total net assets)
| | | |
| Exxon Mobil Corp. | Integrated Oil & | | |
| | Gas | 2.7 | % |
| Microsoft Corp. | Systems Software | 2.0 | |
| Apple Inc. | Computer | | |
| | Hardware | 1.5 | |
| Johnson & Johnson | Pharmaceuticals | 1.4 | |
| Procter & Gamble Co. | Household | | |
| | Products | 1.4 | |
| International Business | Computer | | |
| Machines Corp. | Hardware | 1.4 | |
| AT&T Inc. | Integrated | | |
| | Telecommunication | | |
| | Services | 1.3 | |
| JPMorgan Chase & Co. | Diversified Financial | | |
| | Services | 1.3 | |
| General Electric Co. | Industrial | | |
| | Conglomerates | 1.3 | |
| Chevron Corp. | Integrated Oil & | | |
| | Gas | 1.3 | |
| Top Ten | | 15.6 | % |
The holdings listed exclude any temporary cash investments and equity index products.
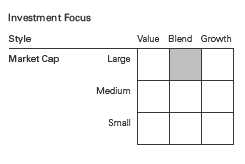
1 The expense ratios shown are from the prospectus dated April 29, 2009. For the fiscal year ended December 31, 2009, the expense ratios were 0.045% for Institutional Shares and 0.025% for Institutional Plus Shares.
8
Institutional Total Stock Market Index Fund
Performance Summary
All of the returns in this report represent past performance, which is not a guarantee of future results that may be achieved by the fund. (Current performance may be lower or higher than the performance data cited. For performance data current to the most recent month-end, visit our website at www.vanguard.com/performance.) Note, too, that both investment returns and principal value can fluctuate widely, so an investor’s shares, when sold, could be worth more or less than their original cost. The returns shown do not reflect taxes that a shareholder would pay on fund distributions or on the sale of fund shares.
Cumulative Performance: August 31, 2001, Through December 31, 2009
Initial Investment of $100,000,000
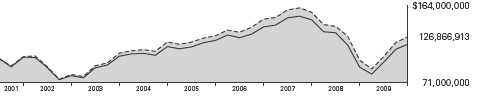
| | | | | | | | |
| | Average Annual Total Returns | | | |
| | Periods Ended December 31, 2009 | | | |
| | | | | | | | | Final Value |
| | One | | Five | | Since | | | of a $100,000,000 |
| | Year | | Years | | Inception | | | Investment |
| Institutional Total Stock Market Index | | | | | | | | |
| Fund Institutional Shares | 28.84 | % | 1.07 | % | 2.90 | % | $ | 126,866,913 |
| Spliced Institutional Total Stock Market | | | | | | | | |
| Index | 28.76 | | 1.01 | | 2.83 | | | 126,188,760 |
Spliced Institutional Total Stock Market Index: Dow Jones Wilshire 5000 Index through April 8, 2005; MSCI US Broad Market Index thereafter.
Multi-Cap Core Funds Average: Derived from data provided by Lipper Inc.
Performance for the fund’s Institutional Shares and comparative standards is calculated since the Institutional Shares’ inception.
| | | | | | | | |
| | | | | | Since | | | Final Value |
| | One | | Five | | Inception | | of a $ | 200,000,000 |
| | Year | | Years | | (5/31/2001 | ) | | Investment |
| Institutional Total Stock Market | | | | | | | | |
| Index Fund Institutional Plus Shares | 28.92 | % | 1.10 | % | 1.71 | % | $ | 231,269,198 |
| Spliced Institutional Total Stock | | | | | | | | |
| Market Index | 28.76 | | 1.01 | | 1.60 | | | 229,281,384 |
Performance for the fund’s Institutional Plus Shares and comparative standards is calculated since the Institutional Plus Shares’ inception.
See Financial Highlights for dividend and capital gains information.
9
Institutional Total Stock Market Index Fund
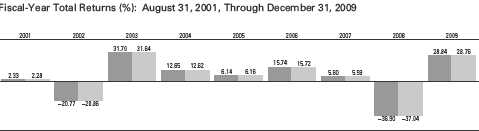
Institutional Total Stock Market Index Fund Institutional Shares Spliced Institutional Total Stock Market Index
10
Institutional Total Stock Market Index Fund
Financial Statements
Statement of Net Assets
As of December 31, 2009
The fund reports a complete list of its holdings in regulatory filings four times in each fiscal year, at the quarter-ends. For the second and fourth fiscal quarters, the lists appear in the fund’s semiannual and annual reports to shareholders. For the first and third fiscal quarters, the fund files the lists with the Securities and Exchange Commission on Form N-Q. Shareholders can look up the fund’s Forms N-Q on the SEC’s website at www.sec.gov. Forms N-Q may also be reviewed and copied at the SEC’s Public Reference Room (see the back cover of this report for further information).
| | | | | |
| | | | | Market | |
| | | | | Value• | |
| | | Shares | ($ | 000 | ) |
| Common Stocks (99.4%)1 | | | | |
| Consumer Discretionary (10.2%) | | | |
| | McDonald’s Corp. | 1,083,621 | | 67,661 | |
| | Walt Disney Co. | 1,775,477 | | 57,259 | |
| | Home Depot Inc. | 1,691,070 | | 48,923 | |
| * | Amazon.com Inc. | 343,072 | | 46,150 | |
| | Comcast Corp. Class A | 2,537,471 | | 42,782 | |
| | Target Corp. | 709,223 | | 34,305 | |
| | Time Warner Inc. | 1,177,229 | | 34,304 | |
| | Lowe’s Cos. Inc. | 1,466,610 | | 34,304 | |
| | News Corp. Class A | 2,236,829 | | 30,622 | |
| * | DIRECTV Class A | 902,315 | | 30,092 | |
| * | Ford Motor Co. | 2,815,331 | | 28,153 | |
| | NIKE Inc. Class B | 368,629 | | 24,355 | |
| | Johnson Controls Inc. | 667,240 | | 18,176 | |
| | Staples Inc. | 717,383 | | 17,640 | |
| * | Starbucks Corp. | 732,177 | | 16,884 | |
| * | Viacom Inc. Class B | 545,850 | | 16,228 | |
| | Yum! Brands Inc. | 463,250 | | 16,200 | |
| * | Kohl’s Corp. | 288,193 | | 15,542 | |
| | TJX Cos. Inc. | 421,076 | | 15,390 | |
| | Time Warner Cable Inc. | 350,067 | | 14,489 | |
| | Best Buy Co. Inc. | 351,631 | | 13,875 | |
| * | Carnival Corp. | 435,442 | | 13,799 | |
| | Omnicom Group Inc. | 308,690 | | 12,085 | |
| | Coach Inc. | 315,917 | | 11,540 | |
| | McGraw-Hill Cos. Inc. | 312,761 | | 10,481 | |
| | Gap Inc. | 484,658 | | 10,154 | |
| * | Bed Bath & Beyond Inc. | 260,101 | | 10,048 | |
| * | priceline.com Inc. | 39,936 | | 8,726 | |
| | CBS Corp. Class B | 585,610 | | 8,228 | |
| | Marriott International Inc. | | | | |
| | Class A | 300,941 | | 8,201 | |
| * | Apollo Group Inc. Class A | 129,610 | | 7,852 | |
| | H&R Block Inc. | 333,023 | | 7,533 | |
| | Mattel Inc. | 357,529 | | 7,143 | |
| | Macy’s Inc. | 418,379 | | 7,012 | |
| | Starwood Hotels & | | | | |
| | Resorts Worldwide Inc. | 185,978 | | 6,801 | |
| | VF Corp. | 88,753 | | 6,500 | |
| | | | | |
| | | | | Market | |
| | | | | Value• | |
| | | Shares | ($ | 000 | ) |
| | Fortune Brands Inc. | 149,578 | | 6,462 | |
| | Cablevision Systems Corp. | | | | |
| | Class A | 245,311 | | 6,334 | |
| * | Liberty Media Corp.- | | | | |
| | Interactive | 564,034 | | 6,114 | |
| | Nordstrom Inc. | 161,527 | | 6,070 | |
| | Sherwin-Williams Co. | 98,234 | | 6,056 | |
| | Genuine Parts Co. | 158,812 | | 6,028 | |
| | Whirlpool Corp. | 73,600 | | 5,937 | |
| | Harley-Davidson Inc. | 233,186 | | 5,876 | |
| | JC Penney Co. Inc. | 211,234 | | 5,621 | |
| | International Game | | | | |
| | Technology | 294,759 | | 5,533 | |
| | Ross Stores Inc. | 125,893 | | 5,377 | |
| * | CarMax Inc. | 219,254 | | 5,317 | |
| | Tiffany & Co. | 123,547 | | 5,313 | |
| | Ltd Brands Inc. | 272,298 | | 5,239 | |
| * | O’Reilly Automotive Inc. | 136,054 | | 5,186 | |
| * | AutoZone Inc. | 32,071 | | 5,069 | |
| * | Expedia Inc. | 196,305 | | 5,047 | |
| * | Las Vegas Sands Corp. | 328,638 | | 4,910 | |
| | Virgin Media Inc. | 277,879 | | 4,677 | |
| | Darden Restaurants Inc. | 131,753 | | 4,621 | |
| *,^ | Sears Holdings Corp. | 55,287 | | 4,614 | |
| | Polo Ralph Lauren Corp. | | | | |
| | Class A | 56,486 | | 4,574 | |
| * | Urban Outfitters Inc. | 125,398 | | 4,388 | |
| | DISH Network Corp. | | | | |
| | Class A | 207,175 | | 4,303 | |
| * | Dollar Tree Inc. | 89,015 | | 4,299 | |
| | Wynn Resorts Ltd. | 73,449 | | 4,277 | |
| | Newell Rubbermaid Inc. | 276,441 | | 4,149 | |
| * | Discovery | | | | |
| | Communications Inc. | | | | |
| | Class A | 134,195 | | 4,116 | |
| | Hasbro Inc. | 125,205 | | 4,014 | |
| | Black & Decker Corp. | 59,861 | | 3,881 | |
| | BorgWarner Inc. | 115,968 | | 3,852 | |
| | Advance Auto Parts Inc. | 95,081 | | 3,849 | |
11
| | | | | |
| Institutional Total Stock Market Index Fund | | | |
| |
| |
| |
| | | | | Market | |
| | | | | Value• | |
| | | Shares | ($ | 000 | ) |
| * | Discovery | | | | |
| | Communications Inc. | 140,404 | | 3,724 | |
| | Scripps Networks | | | | |
| | Interactive Inc. Class A | 89,558 | | 3,717 | |
| ^ | Garmin Ltd. | 119,696 | | 3,675 | |
| | Autoliv Inc. | 84,714 | | 3,673 | |
| | Family Dollar Stores Inc. | 131,819 | | 3,669 | |
| | DeVry Inc. | 63,847 | | 3,622 | |
| * | ITT Educational | | | | |
| | Services Inc. | 37,495 | | 3,598 | |
| | Wyndham Worldwide Corp. | 178,169 | | 3,594 | |
| * | Interpublic Group | | | | |
| | of Cos. Inc. | 483,538 | | 3,569 | |
| * | Royal Caribbean | | | | |
| | Cruises Ltd. | 138,145 | | 3,492 | |
| | Gannett Co. Inc. | 233,931 | | 3,474 | |
| * | GameStop Corp. Class A | 155,818 | | 3,419 | |
| | Pulte Homes Inc. | 341,837 | | 3,418 | |
| | PetSmart Inc. | 124,729 | | 3,329 | |
| * | NVR Inc. | 4,636 | | 3,295 | |
| * | Goodyear Tire & | | | | |
| | Rubber Co. | 228,798 | | 3,226 | |
| | Comcast Corp. | 199,815 | | 3,199 | |
| | American Eagle | | | | |
| | Outfitters Inc. | 185,621 | | 3,152 | |
| | DR Horton Inc. | 284,378 | | 3,091 | |
| | Abercrombie & Fitch Co. | 87,335 | | 3,044 | |
| | Leggett & Platt Inc. | 148,093 | | 3,021 | |
| | Strayer Education In c. | 13,951 | | 2,964 | |
| | Tupperware Brands Corp. | 62,927 | | 2,931 | |
| * | Liberty Global Inc. Class A | 130,859 | | 2,867 | |
| * | Chipotle Mexican Grill Inc. | | | | |
| | Class A | 31,531 | | 2,780 | |
| * | Mohawk Industries Inc. | 58,016 | | 2,762 | |
| * | Marvel Entertainment Inc. | 50,874 | | 2,751 | |
| | Jarden Corp. | 88,398 | | 2,732 | |
| * | DreamWorks Animation | | | | |
| | SKG Inc. Class A | 67,400 | | 2,693 | |
| * | NetFlix Inc. | 48,821 | | 2,692 | |
| | Washington Post Co. | | | | |
| | Class B | 6,060 | | 2,664 | |
| * | Liberty Global Inc. | 118,861 | | 2,597 | |
| * | Toll Brothers Inc. | 136,323 | | 2,564 | |
| * | Chico’s FAS Inc. | 177,178 | | 2,489 | |
| * | LKQ Corp. | 125,902 | | 2,466 | |
| | Gentex Corp. | 137,748 | | 2,459 | |
| | RadioShack Corp. | 124,946 | | 2,436 | |
| * | MGM Mirage | 263,633 | | 2,404 | |
| * | Big Lots Inc. | 82,403 | | 2,388 | |
| | Guess? Inc. | 55,156 | | 2,333 | |
| * | Sirius XM Radio Inc. | 3,879,866 | | 2,328 | |
| | Harman International | | | | |
| | Industries Inc. | 65,798 | | 2,321 | |
| * | Aeropostale Inc. | 67,179 | | 2,287 | |
| * | Liberty Media Corp.-Starz | 49,520 | | 2,285 | |
| * | Hanesbrands Inc. | 94,499 | | 2,278 | |
| | | |
| * | Lamar Advertising Co. | | |
| | Class A | 72,669 | 2,259 |
| * | J Crew Group Inc. | 50,104 | 2,242 |
| * | AutoNation Inc. | 115,245 | 2,207 |
| * | Dick’s Sporting Goods Inc. | 87,336 | 2,172 |
| * | Liberty Media Corp.-Capital | 89,849 | 2,146 |
| * | Bally Technologies Inc. | 51,752 | 2,137 |
| | Phillips-Van Heusen Corp. | 51,496 | 2,095 |
| | Service Corp. International | 250,297 | 2,050 |
| * | WMS Industries Inc. | 50,490 | 2,020 |
| * | Panera Bread Co. Class A | 29,794 | 1,995 |
| * | Career Education Cor p. | 85,030 | 1,982 |
| * | Warnaco Group Inc. | 45,879 | 1,936 |
| | Wendy’s/Arby’s Group Inc. | | |
| | Class A | 399,207 | 1,872 |
| | Williams-Sonoma Inc. | 89,900 | 1,868 |
| | John Wiley & Sons Inc. | | |
| | Class A | 43,982 | 1,842 |
| * | Penn National Gaming Inc. | 66,301 | 1,802 |
| | Burger King Holdings Inc. | 94,731 | 1,783 |
| * | Office Depot Inc. | 275,947 | 1,780 |
| | Foot Locker Inc. | 155,665 | 1,734 |
| * | Tractor Supply Co. | 32,558 | 1,724 |
| * | New York Times Co. | | |
| | Class A | 136,049 | 1,682 |
| * | TRW Automotive | | |
| | Holdings Corp. | 69,479 | 1,659 |
| | WABCO Holdings Inc. | 63,767 | 1,645 |
| * | Tempur-Pedic | | |
| | International Inc. | 67,284 | 1,590 |
| * | Fossil Inc. | 46,474 | 1,560 |
| | Brinker International Inc. | 102,856 | 1,535 |
| | Lennar Corp. Class A | 119,427 | 1,525 |
| | Sotheby’s | 66,793 | 1,501 |
| * | Carter’s Inc. | 56,965 | 1,495 |
| * | Brink’s Home Security | | |
| | Holdings Inc. | 45,524 | 1,486 |
| * | Collective Brands Inc. | 64,642 | 1,472 |
| * | Dana Holding Corp. | 134,425 | 1,457 |
| | Jones Apparel Group Inc. | 84,842 | 1,363 |
| | Wolverine World Wide Inc. | 49,612 | 1,350 |
| | Polaris Industries Inc. | 30,812 | 1,344 |
| * | Deckers Outdoor Corp. | 13,141 | 1,337 |
| * | Dress Barn Inc. | 57,725 | 1,333 |
| | Aaron’s Inc. | 46,639 | 1,293 |
| * | Gymboree Corp. | 29,491 | 1,283 |
| * | Cheesecake Factory Inc. | 57,828 | 1,248 |
| | Regal Entertainment Group | | |
| | Class A | 84,244 | 1,216 |
| | MDC Holdings Inc. | 37,885 | 1,176 |
| * | Lululemon Athletica Inc. | 38,699 | 1,165 |
| * | Rent-A-Center Inc. | 65,659 | 1,163 |
| | Hillenbrand Inc. | 61,647 | 1,161 |
| * | Eastman Kodak Co. | 270,556 | 1,142 |
| * | Corinthian Colleges Inc. | 82,738 | 1,139 |
| * | Jack in the Box Inc. | 57,707 | 1,135 |
12
Institutional Total Stock Market Index Fund
| | | | | |
| | | | | Market | |
| | | | | Value• | |
| | | Shares | ($ | 000 | ) |
| | Brunswick Corp. | 89,065 | | 1,132 | |
| | Thor Industries Inc. | 35,994 | | 1,130 | |
| * | Hyatt Hotels Corp. Class A | 37,829 | | 1,128 | |
| | Cooper Tire & Rubber Co. | 55,827 | | 1,119 | |
| | KB Home | 81,035 | | 1,109 | |
| | Meredith Corp. | 35,813 | | 1,105 | |
| * | ArvinMeritor Inc. | 98,546 | | 1,102 | |
| | Matthews International Corp. | | | | |
| | Class A | 30,448 | | 1,079 | |
| * | Tenneco Inc. | 60,070 | | 1,065 | |
| * | Capella Education Co. | 14,115 | | 1,063 | |
| | Choice Hotels | | | | |
| | International Inc. | 33,250 | | 1,053 | |
| | Dillard’s Inc. Class A | 56,195 | | 1,037 | |
| | Men’s Wearhouse Inc. | 49,225 | | 1,037 | |
| | Weight Watchers | | | | |
| | International Inc. | 35,061 | | 1,022 | |
| * | Scientific Games Corp. | | | | |
| | Class A | 69,362 | | 1,009 | |
| * | Charming Shoppes Inc. | 155,552 | | 1,006 | |
| * | Skechers U.S.A. Inc. | | | | |
| | Class A | 34,156 | | 1,005 | |
| * | OfficeMax Inc. | 76,281 | | 968 | |
| * | Vail Resorts Inc. | 25,607 | | 968 | |
| * | Jo-Ann Stores Inc. | 26,677 | | 967 | |
| * | HSN Inc. | 47,710 | | 963 | |
| | Interactive Data Corp. | 37,760 | | 955 | |
| * | Morningstar Inc. | 19,638 | | 949 | |
| | Scholastic Corp. | 31,719 | | 946 | |
| | Pool Corp. | 48,856 | | 932 | |
| *,^ | Under Armour Inc. Class A | 33,866 | | 924 | |
| * | Life Time Fitness Inc. | 36,977 | | 922 | |
| * | Blue Nile Inc. | 14,533 | | 920 | |
| * | Gaylord Entertainmen t Co. | 46,562 | | 920 | |
| * | Saks Inc. | 138,517 | | 909 | |
| | Bob Evans Farms Inc. | 31,295 | | 906 | |
| * | Iconix Brand Group Inc. | 71,336 | | 902 | |
| * | Valassis | | | | |
| | Communications Inc. | 48,624 | | 888 | |
| | Regis Corp. | 56,776 | | 884 | |
| | Cracker Barrel Old | | | | |
| | Country Store Inc. | 22,714 | | 863 | |
| | Ryland Group Inc. | 43,791 | | 863 | |
| | NutriSystem Inc. | 27,654 | | 862 | |
| | Arbitron Inc. | 36,556 | | 856 | |
| * | PF Chang’s China Bistro Inc. | 22,170 | | 840 | |
| * | Coinstar Inc. | 30,201 | | 839 | |
| * | Childrens Place | | | | |
| | Retail Stores Inc. | 25,064 | | 827 | |
| * | Fuel Systems Solutions Inc. | 19,777 | | 816 | |
| ^ | Buckle Inc. | 27,594 | | 808 | |
| * | AnnTaylor Stores Corp. | 58,896 | | 803 | |
| | International Speedway Corp. | | | | |
| | Class A | 27,708 | | 788 | |
| * | Orient-Express Hotels Ltd. | | | | |
| | Class A | 77,433 | | 785 | |
| | | | | |
| | | | | Market | |
| | | | | Value• | |
| | | Shares | ($ | 000 | ) |
| * | Timberland Co. Class A | 43,376 | | 778 | |
| * | JOS A Bank Clothiers Inc. | 18,407 | | 777 | |
| | American Greetings Corp. | | | | |
| | Class A | 35,538 | | 774 | |
| * | American Public | | | | |
| | Education Inc. | 22,201 | | 763 | |
| ^ | Barnes & Noble Inc. | 39,670 | | 757 | |
| * | Buffalo Wild Wings Inc. | 18,692 | | 753 | |
| | Finish Line Inc. Class A | 59,831 | | 751 | |
| | Belo Corp. Class A | 136,485 | | 742 | |
| * | CEC Entertainment Inc. | 22,933 | | 732 | |
| * | Liz Claiborne Inc. | 125,389 | | 706 | |
| * | American Axle & | | | | |
| | Manufacturing | | | | |
| | Holdings Inc. | 87,063 | | 698 | |
| * | CROCS Inc. | 118,519 | | 681 | |
| * | Live Nation Inc. | 79,510 | | 677 | |
| * | Group 1 Automotive Inc. | 23,751 | | 673 | |
| | National CineMedia Inc. | 40,252 | | 667 | |
| * | Lions Gate | | | | |
| | Entertainment Corp. | 114,557 | | 666 | |
| | Brown Shoe Co. Inc. | 65,112 | | 643 | |
| * | 99 Cents Only Stores | 48,369 | | 632 | |
| * | Asbury Automotive | | | | |
| | Group Inc. | 53,947 | | 622 | |
| * | Clear Channel Outdoor | | | | |
| | Holdings Inc. Class A | 59,512 | | 618 | |
| * | Penske Auto Group Inc. | 40,266 | | 611 | |
| * | Cabela’s Inc. | 42,173 | | 601 | |
| * | BJ’s Restaurants Inc. | 31,905 | | 600 | |
| * | Hibbett Sports Inc. | 27,083 | | 596 | |
| | Big 5 Sporting Goods Corp. | 34,175 | | 587 | |
| * | G-III Apparel Group Ltd. | 26,530 | | 575 | |
| | Cato Corp. Class A | 28,544 | | 573 | |
| * | CTC Media Inc. | 37,849 | | 564 | |
| * | Steven Madden Ltd. | 13,430 | | 554 | |
| * | Pre-Paid Legal Services Inc. | 13,364 | | 549 | |
| * | Sonic Corp. | 54,517 | | 549 | |
| * | Helen of Troy Ltd. | 22,393 | | 548 | |
| | Christopher & Banks Corp. | 71,856 | | 548 | |
| * | California Pizza Kitchen Inc. | 39,921 | | 537 | |
| | Churchill Downs Inc. | 14,283 | | 533 | |
| | Ameristar Casinos Inc. | 34,508 | | 526 | |
| * | Maidenform Brands Inc. | 31,094 | | 519 | |
| * | America’s Car-Mart Inc. | 19,487 | | 513 | |
| * | Pinnacle Entertainment Inc. | 56,160 | | 504 | |
| * | Papa John’s International Inc. | 20,945 | | 489 | |
| | Ethan Allen Interiors Inc. | 36,112 | | 485 | |
| * | Universal Technical | | | | |
| | Institute Inc. | 23,644 | | 478 | |
| | Callaway Golf Co. | 63,049 | | 475 | |
| | Harte-Hanks Inc. | 43,240 | | 466 | |
| * | Genesco Inc. | 16,961 | | 466 | |
| * | AFC Enterprises Inc. | 56,708 | | 463 | |
| * | Ticketmaster | | | | |
| | Entertainment Inc. | 37,436 | | 457 | |
13
Institutional Total Stock Market Index Fund
| | | | | |
| | | | | Market | |
| | | | | Value• | |
| | | Shares | ($ | 000 | ) |
| | CKE Restaurants Inc. | 53,653 | | 454 | |
| | K-Swiss Inc. Class A | 44,900 | | 446 | |
| * | Steiner Leisure Ltd. | 11,193 | | 445 | |
| * | Boyd Gaming Corp. | 53,129 | | 445 | |
| * | Drew Industries Inc. | 21,443 | | 443 | |
| | Stewart Enterprises Inc. | | | | |
| | Class A | 85,095 | | 438 | |
| * | Peet’s Coffee & Tea Inc. | 13,073 | | 436 | |
| | Unifirst Corp. | 8,937 | | 430 | |
| | Bebe Stores Inc. | 68,525 | | 430 | |
| * | Sally Beauty Holdings Inc. | 54,898 | | 420 | |
| * | Beazer Homes USA Inc. | 86,676 | | 420 | |
| * | Ascent Media Corp. Class A | 16,187 | | 413 | |
| * | Arctic Cat Inc. | 43,949 | | 403 | |
| * | Amerigon Inc. | 50,640 | | 402 | |
| * | Exide Technologies | 55,403 | | 394 | |
| * | Meritage Homes Corp. | 19,954 | | 386 | |
| * | Winnebago Industries | 30,586 | | 373 | |
| * | Texas Roadhouse Inc. | | | | |
| | Class A | 32,851 | | 369 | |
| * | Pacific Sunwear Of California | 91,880 | | 366 | |
| * | Modine Manufacturing Co. | 30,875 | | 366 | |
| * | Interval Leisure Group Inc. | 29,280 | | 365 | |
| | Haverty Furniture Cos. Inc. | 26,570 | | 365 | |
| | Blyth Inc. | 10,662 | | 360 | |
| | Cinemark Holdings Inc. | 24,788 | | 356 | |
| | Monro Muffler Brake Inc. | 10,557 | | 353 | |
| * | La-Z-Boy Inc. | 36,944 | | 352 | |
| * | True Religion Apparel Inc. | 18,992 | | 351 | |
| * | Hovnanian Enterprises Inc. | | | | |
| | Class A | 91,158 | | 350 | |
| | Fred’s Inc. Class A | 34,245 | | 349 | |
| | Cherokee Inc. | 19,226 | | 343 | |
| * | Domino’s Pizza Inc. | 40,333 | | 338 | |
| * | Volcom Inc. | 20,033 | | 335 | |
| * | Standard Pacific Corp. | 86,688 | | 324 | |
| | Columbia Sportswear Co. | 8,121 | | 317 | |
| * | Audiovox Corp. Class A | 44,054 | | 312 | |
| * | MarineMax Inc. | 33,690 | | 310 | |
| | CPI Corp. | 24,629 | | 302 | |
| *,^ | Brookfield Homes Corp. | 37,318 | | 299 | |
| * | DineEquity Inc. | 12,283 | | 298 | |
| * | Standard Motor | | | | |
| | Products Inc. | 34,960 | | 298 | |
| * | Kirkland’s Inc. | 17,131 | | 298 | |
| * | Denny’s Corp. | 134,245 | | 294 | |
| | Oxford Industries Inc. | 14,152 | | 293 | |
| * | Overstock.com Inc. | 21,395 | | 290 | |
| | CSS Industries Inc. | 14,838 | | 288 | |
| * | O’Charleys Inc. | 43,633 | | 286 | |
| * | Ruby Tuesday Inc. | 39,678 | | 286 | |
| * | Cavco Industries Inc. | 7,936 | | 285 | |
| | National Presto | | | | |
| | Industries Inc. | 2,595 | | 283 | |
| * | Retail Ventures Inc. | 31,829 | | 283 | |
| * | Jakks Pacific Inc. | 23,309 | | 282 | |
| | | | | |
| | | | | Market | |
| | | | | Value• | |
| | | Shares | ($ | 000 | ) |
| * | Alloy Inc. | 36,292 | | 282 | |
| | PetMed Express Inc. | 15,794 | | 278 | |
| * | Unifi Inc. | 71,192 | | 276 | |
| | Ambassadors Group In c. | 20,541 | | 273 | |
| | Stage Stores Inc. | 22,045 | | 272 | |
| | World Wrestling | | | | |
| | Entertainment Inc. | | | | |
| | Class A | 17,739 | | 272 | |
| * | Shutterfly Inc. | 15,257 | | 272 | |
| | PEP Boys-Manny | | | | |
| | Moe & Jack | 32,022 | | 271 | |
| * | Federal Mogul Corp. | 15,554 | | 269 | |
| * | RC2 Corp. | 17,934 | | 265 | |
| * | HOT Topic Inc. | 40,325 | | 256 | |
| * | Furniture Brands | | | | |
| | International Inc. | 45,759 | | 250 | |
| * | Drugstore.Com Inc. | 79,869 | | 247 | |
| | Lennar Corp. Class B | 24,500 | | 241 | |
| * | Landry’s Restaurants Inc. | 11,282 | | 240 | |
| * | AH Belo Corp. Class A | 41,521 | | 239 | |
| * | Red Robin Gourmet | | | | |
| | Burgers Inc. | 13,019 | | 233 | |
| * | Shuffle Master Inc. | 28,268 | | 233 | |
| * | DSW Inc. Class A | 9,000 | | 233 | |
| *,^ | Blockbuster Inc. Class A | 345,251 | | 231 | |
| * | Build-A-Bear Workshop Inc. | 47,226 | | 231 | |
| | Systemax Inc. | 14,469 | | 227 | |
| * | Carriage Services Inc. | | | | |
| | Class A | 57,154 | | 225 | |
| * | Entravision | | | | |
| | Communications Corp. | | | | |
| | Class A | 64,225 | | 218 | |
| * | Wet Seal Inc. Class A | 63,178 | | 218 | |
| * | Citi Trends Inc. | 7,881 | | 218 | |
| * | Ulta Salon Cosmetics & | | | | |
| | Fragrance Inc. | 11,905 | | 216 | |
| * | Krispy Kreme | | | | |
| | Doughnuts Inc. | 73,070 | | 216 | |
| * | Learning Tree | | | | |
| | International Inc. | 17,883 | | 214 | |
| * | Pier 1 Imports Inc. | 41,411 | | 211 | |
| | Sonic Automotive Inc. | | | | |
| | Class A | 20,119 | | 209 | |
| | Marcus Corp. | 16,048 | | 206 | |
| * | Mediacom | | | | |
| | Communications Corp. | | | | |
| | Class A | 45,523 | | 203 | |
| * | RCN Corp. | 18,677 | | 203 | |
| | Superior Industries | | | | |
| | International Inc. | 12,893 | | 197 | |
| * | Carmike Cinemas Inc. | 25,465 | | 193 | |
| * | Knology Inc. | 17,561 | | 192 | |
| * | hhgregg Inc. | 8,586 | | 189 | |
| * | Quiksilver Inc. | 93,233 | | 188 | |
| | Movado Group Inc. | 19,250 | | 187 | |
| | Marine Products Corp. | 37,869 | | 187 | |
14
Institutional Total Stock Market Index Fund
| | | | | |
| | | | | Market | |
| | | | | Value• | |
| | | Shares | ($ | 000 | ) |
| * | Coldwater Creek Inc. | 40,771 | | 182 | |
| * | Perry Ellis International Inc. | 11,978 | | 180 | |
| | Books-A-Million Inc. | 26,571 | | 179 | |
| * | Isle of Capri Casinos Inc. | 23,807 | | 178 | |
| * | Lithia Motors Inc. Class A | 21,630 | | 178 | |
| * | Leapfrog Enterprises Inc. | 45,463 | | 178 | |
| * | Valuevision Media Inc. | | | | |
| | Class A | 36,883 | | 177 | |
| * | Entercom Communications | | | | |
| | Corp. Class A | 24,735 | | 175 | |
| * | Fisher Communications Inc. | 10,632 | | 173 | |
| * | K12 Inc. | 8,520 | | 173 | |
| * | Lincoln Educational | | | | |
| | Services Corp. | 7,914 | | 171 | |
| * | Core-Mark Holding Co. Inc. | 5,149 | | 170 | |
| * | Cache Inc. | 36,890 | | 169 | |
| * | Martha Stewart Living | | | | |
| | Omnimedia Class A | 33,957 | | 168 | |
| * | Dorman Products Inc. | 10,525 | | 165 | |
| * | CKX Inc. | 31,017 | | 163 | |
| * | Gaiam Inc. Class A | 20,924 | | 161 | |
| | McClatchy Co. Class A | 45,433 | | 161 | |
| * | iRobot Corp. | 8,361 | | 147 | |
| * | Select Comfort Corp. | 22,497 | | 147 | |
| | Jackson Hewitt | | | | |
| | Tax Service Inc. | 33,332 | | 147 | |
| * | Stamps.com Inc. | 16,013 | | 144 | |
| * | Universal Electronics Inc. | 6,148 | | 143 | |
| * | EW Scripps Co. Class A | 20,460 | | 142 | |
| | Bon-Ton Stores Inc. | 14,510 | | 142 | |
| * | Fuqi International Inc. | 7,784 | | 140 | |
| * | Multimedia Games Inc. | 23,244 | | 140 | |
| * | Warner Music Group Corp. | 24,636 | | 139 | |
| *,^ | Quantum Fuel | | | | |
| | Systems Technologies | | | | |
| | Worldwide Inc. | 125,153 | | 139 | |
| * | 1-800-Flowers.com Inc. | | | | |
| | Class A | 52,007 | | 138 | |
| * | AC Moore Arts & Crafts Inc. | 46,240 | | 136 | |
| | Speedway Motorsports Inc. | 7,697 | | 136 | |
| * | Kenneth Cole | | | | |
| | Productions Inc. Class A | 13,837 | | 134 | |
| * | Bluegreen Corp. | 55,088 | | 133 | |
| * | Talbots Inc. | 14,765 | | 132 | |
| | Journal Communications Inc. | | | | |
| | Class A | 33,154 | | 129 | |
| * | ChinaCast Education Corp. | 17,000 | | 129 | |
| * | Cumulus Media Inc. Class A | 56,253 | | 128 | |
| * | Lumber Liquidators Inc. | 4,625 | | 124 | |
| * | Steak N Shake Co. | 374 | | 121 | |
| * | Dolan Media Co. | 11,737 | | 120 | |
| * | Gander Mountain Co. | 23,201 | | 118 | |
| * | Benihana Inc. Class A | 31,213 | | 118 | |
| * | Morgans Hotel Group Co. | 25,940 | | 118 | |
| * | Bassett Furniture | | | | |
| | Industries Inc. | 33,302 | | 117 | |
| | | | | |
| | | | | Market | |
| | | | | Value• | |
| | | Shares | ($ | 000 | ) |
| * | Stanley Furniture Co. Inc. | 11,489 | | 117 | |
| * | Princeton Review Inc. | 28,495 | | 116 | |
| *,^ | Conn’s Inc. | 19,627 | | 115 | |
| * | Smith & Wesson | | | | |
| | Holding Corp. | 27,010 | | 110 | |
| * | Tuesday Morning Corp. | 42,595 | | 110 | |
| | Dover Downs Gaming & | | | | |
| | Entertainment Inc. | 28,470 | | 108 | |
| | Hooker Furniture Corp. | 8,400 | | 104 | |
| * | Lee Enterprises Inc. | 29,094 | | 101 | |
| * | Midas Inc. | 11,909 | | 101 | |
| * | Media General Inc. Class A | 12,780 | | 100 | |
| * | dELiA*s Inc. | 53,372 | | 100 | |
| | Sturm Ruger & Co. Inc. | 10,247 | | 99 | |
| * | Rentrak Corp. | 5,600 | | 99 | |
| * | Nautilus Inc. | 48,102 | | 98 | |
| * | Caribou Coffee Co. Inc. | 12,577 | | 97 | |
| | News Corp. Class B | 6,073 | | 97 | |
| * | Luby’s Inc. | 25,857 | | 95 | |
| | Sinclair Broadcast | | | | |
| | Group Inc. Class A | 23,450 | | 94 | |
| * | Steinway Musical | | | | |
| | Instruments | 5,874 | | 93 | |
| * | Stein Mart Inc. | 8,688 | | 93 | |
| * | Borders Group Inc. | 77,377 | | 91 | |
| * | Zumiez Inc. | 7,082 | | 90 | |
| * | Kid Brands Inc. | 20,250 | | 89 | |
| * | Harris Interactive Inc. | 73,072 | | 87 | |
| * | M/I Homes Inc. | 8,173 | | 85 | |
| * | New York & Co. Inc. | 19,325 | | 83 | |
| | Weyco Group Inc. | 3,422 | | 81 | |
| * | Cost Plus Inc. | 78,228 | | 80 | |
| * | Shoe Carnival Inc. | 3,817 | | 78 | |
| * | West Marine Inc. | 9,677 | | 78 | |
| * | Casual Male Retail | | | | |
| | Group Inc. | 33,081 | | 77 | |
| * | Shiloh Industries Inc. | 14,359 | | 76 | |
| * | Strattec Security Corp. | 4,111 | | 76 | |
| * | Gray Television Inc. | 48,812 | | 74 | |
| * | Destination Maternity Corp. | 3,852 | | 73 | |
| * | Zale Corp. | 26,866 | | 73 | |
| * | Emmis Communications | | | | |
| | Corp. Class A | 63,231 | | 73 | |
| * | LodgeNet Interactive Corp. | 12,943 | | 72 | |
| * | Bridgepoint Education Inc. | 4,682 | | 70 | |
| * | Navarre Corp. | 32,814 | | 70 | |
| * | Town Sports International | | | | |
| | Holdings Inc. | 29,558 | | 69 | |
| * | Grand Canyon Education Inc. | 3,600 | | 68 | |
| * | Playboy Enterprises Inc. | | | | |
| | Class B | 20,792 | | 67 | |
| * | Radio One Inc. | 22,460 | | 65 | |
| * | Monarch Casino & Resort Inc. | 8,027 | | 65 | |
| | Primedia Inc. | 17,570 | | 63 | |
| * | Sealy Corp. | 19,178 | | 61 | |
| * | Rex Stores Corp. | 4,209 | | 59 | |
15
Institutional Total Stock Market Index Fund
| | | | | |
| | | | | Market | |
| | | | | Value• | |
| | | Shares | ($ | 000 | ) |
| | Spartan Motors Inc. | 10,012 | | 56 | |
| * | Salem Communications | | | | |
| | Corp. Class A | 9,254 | | 55 | |
| * | Century Casinos Inc. | 19,979 | | 54 | |
| * | Carrols Restaurant | | | | |
| | Group Inc. | 7,300 | | 52 | |
| * | Beasley Broadcasting | | | | |
| | Group Inc. Class A | 14,447 | | 51 | |
| * | Jamba Inc. | 28,900 | | 49 | |
| * | Cosi Inc. | 77,053 | | 46 | |
| | Flexsteel Industries | 4,500 | | 46 | |
| * | LIN TV Corp. Class A | 9,610 | | 43 | |
| | Skyline Corp. | 2,242 | | 41 | |
| * | Wonder Auto Technology Inc. | 3,400 | | 40 | |
| * | Orbitz Worldwide Inc. | 5,400 | | 40 | |
| * | Stoneridge Inc. | 4,152 | | 37 | |
| * | Empire Resorts Inc. | 17,520 | | 37 | |
| * | Bidz.com Inc. | 18,299 | | 37 | |
| * | 4Kids Entertainment Inc. | 22,543 | | 36 | |
| | Heelys Inc. | 16,400 | | 36 | |
| * | Global Traffic Network Inc. | 8,486 | | 35 | |
| * | Youbet.com Inc. | 11,828 | | 34 | |
| * | Duckwall-ALCO Stores Inc. | 2,152 | | 33 | |
| | Hallwood Group Inc. | 800 | | 31 | |
| * | Raser Technologies Inc. | 23,723 | | 29 | |
| * | FGX International | | | | |
| | Holdings Ltd. | 1,400 | | 27 | |
| * | Lifetime Brands Inc. | 3,800 | | 27 | |
| * | Escalade Inc. | 10,730 | | 26 | |
| * | Einstein Noah | | | | |
| | Restaurant Group Inc. | 2,600 | | 26 | |
| * | Lodgian Inc. | 16,897 | | 25 | |
| * | EDCI Holdings Inc. | 4,094 | | 24 | |
| * | Lazare Kaplan | | | | |
| | International Inc. | 9,594 | | 24 | |
| * | Reading International Inc. | | | | |
| | Class A | 5,900 | | 24 | |
| * | MAXXAM Inc. | 9 | | 23 | |
| * | Dixie Group Inc. | 8,586 | | 23 | |
| * | Famous Dave’s Of | | | | |
| | America Inc. | 3,695 | | 22 | |
| * | Benihana Inc. Class A | 5,006 | | 21 | |
| * | Emerson Radio Corp. | 8,900 | | 21 | |
| * | Palm Harbor Homes Inc. | 9,203 | | 19 | |
| * | MTR Gaming Group Inc. | 14,457 | | 19 | |
| * | McCormick & Schmick’s | | | | |
| | Seafood Restaurants Inc. | 2,500 | | 17 | |
| * | Daily Journal Corp. | 260 | | 15 | |
| * | Red Lion Hotels Corp. | 2,812 | | 14 | |
| * | Trans World Entertainment | 8,888 | | 13 | |
| * | Orleans Homebuilders Inc. | 8,178 | | 13 | |
| * | Spanish Broadcasting | | | | |
| | System Inc. | 16,763 | | 13 | |
| * | Blockbuster Inc. Class B | 21,904 | | 13 | |
| * | Nexstar Broadcasting | | | | |
| | Group Inc. Class A | 2,995 | | 12 | |
| | | | | |
| | | | | Market | |
| | | | | Value• | |
| | | Shares | ($ | 000 | ) |
| * | Hastings Entertainment Inc. | 2,708 | | 12 | |
| * | Saga Communications Inc. |
| | | | |
| | Class A | | 825 | 10 |
| * | Outdoor Channel Holdings Inc. | 1,667 | 10 |
| | Dover Motorsports Inc. | | 4,394 | 9 |
| * | Johnson Outdoors Inc. Class A | 900 | 9 |
| | Collectors Universe | | 800 | 7 |
| * | Hollywood Media Corp. | | 5,340 | 7 |
| * | Lakes Entertainment Inc. | | 2,600 | 7 |
| * | Great Wolf Resorts Inc. | | 2,310 | 5 |
| * | US Auto Parts Network Inc. | | 1,000 | 5 |
| * | Radio One Inc. Class A | | 1,680 | 5 |
| * | Craftmade International Inc. | | 2,548 | 5 |
| | Sport Supply Group Inc. | | 300 | 4 |
| * | Atrinsic Inc. | | 5,453 | 4 |
| * | Ruth’s Hospitality Group Inc. | 1,000 | 2 |
| * | Cosi Inc. Rights Exp. | | | |
| | 1/6/2010 | 77,053 | 2 |
| | Gaming Partners | | | |
| | International Corp. | | 282 | 2 |
| * | Krispy Kreme | | | |
| | Doughnuts Inc. | | | |
| | Warrants Exp. 3/2/2012 | | 332 | — |
| | | | | 1,244,494 |
| Consumer Staples (9.8%) | | | |
| | Procter & Gamble Co. | 2,898,324 | 175,725 |
| | Wal-Mart Stores Inc. | 2,320,952 | 124,055 |
| | Coca-Cola Co. | 2,070,981 | 118,046 |
| | PepsiCo Inc. | 1,546,975 | 94,056 |
| | Philip Morris | | | |
| | International Inc. | 1,920,790 | 92,563 |
| | CVS Caremark Corp. | 1,433,065 | 46,159 |
| | Colgate-Palmolive Co. | 494,945 | 40,660 |
| | Altria Group Inc. | 2,056,301 | 40,365 |
| | Kraft Foods Inc. | 1,464,577 | 39,807 |
| | Walgreen Co. | 985,244 | 36,178 |
| | Kimberly-Clark Corp. | 411,688 | 26,229 |
| | Costco Wholesale Corp. | 431,809 | 25,550 |
| | General Mills Inc. | 323,333 | 22,895 |
| | Archer-Daniels-Midland Co. | 573,915 | 17,969 |
| | Sysco Corp. | 587,089 | 16,403 |
| | Kellogg Co. | 266,422 | 14,174 |
| | HJ Heinz Co. | 313,295 | 13,397 |
| | Avon Products Inc. | 424,305 | 13,366 |
| | Lorillard Inc. | 164,128 | 13,168 |
| | Kroger Co. | 614,846 | 12,623 |
| | ConAgra Foods Inc. | 440,477 | 10,153 |
| | Reynolds American Inc. | 173,858 | 9,209 |
| | Mead Johnson Nutrition Co. | | | |
| | Class A | 203,321 | 8,885 |
| | Safeway Inc. | 414,203 | 8,818 |
| | Clorox Co. | 138,617 | 8,456 |
| | Bunge Ltd. | 131,870 | 8,417 |
| | Sara Lee Corp. | 657,503 | 8,008 |
| | JM Smucker Co. | 118,115 | 7,294 |
16
Institutional Total Stock Market Index Fund
| | | | | |
| | | | | Market | |
| | | | | Value• | |
| | | Shares | ($ | 000 | ) |
| | Dr Pepper Snapple | | | | |
| | Group Inc. | 252,752 | | 7,153 | |
| | Campbell Soup Co. | 208,951 | | 7,063 | |
| | Molson Coors Brewing Co. | | | | |
| | Class B | 151,151 | | 6,826 | |
| | Coca-Cola Enterprises Inc. | 290,838 | | 6,166 | |
| | Pepsi Bottling Group Inc. | 150,279 | | 5,635 | |
| | Hershey Co. | 157,397 | | 5,633 | |
| | Estee Lauder Cos. Inc. | | | | |
| | Class A | 112,013 | | 5,417 | |
| | Brown-Forman Corp. | | | | |
| | Class B | 79,267 | | 4,246 | |
| | McCormick & Co. Inc. | 117,487 | | 4,245 | |
| | Church & Dwight Co. Inc. | 69,929 | | 4,227 | |
| * | Energizer Holdings Inc. | 65,624 | | 4,021 | |
| * | Whole Foods Market Inc. | 139,694 | | 3,835 | |
| | Tyson Foods Inc. Class A | 290,812 | | 3,568 | |
| * | Ralcorp Holdings Inc. | 56,215 | | 3,357 | |
| * | Dean Foods Co. | 179,701 | | 3,242 | |
| * | Constellation Brands Inc. | | | | |
| | Class A | 196,068 | | 3,123 | |
| * | Hansen Natural Corp. | 76,737 | | 2,947 | |
| * | Green Mountain | | | | |
| | Coffee Roasters Inc. | 34,736 | | 2,830 | |
| | Hormel Foods Corp. | 73,564 | | 2,829 | |
| | SUPERVALU Inc. | 211,801 | | 2,692 | |
| | Alberto-Culver Co. Class B | 88,120 | | 2,581 | |
| | Herbalife Ltd. | 61,590 | | 2,499 | |
| * | NBTY Inc. | 55,678 | | 2,424 | |
| * | Smithfield Foods Inc. | 148,766 | | 2,260 | |
| | Del Monte Foods Co. | 197,835 | | 2,243 | |
| | Corn Products | | | | |
| | International Inc. | 74,494 | | 2,177 | |
| | Flowers Foods Inc. | 83,372 | | 1,981 | |
| * | Central European | | | | |
| | Distribution Corp. | 65,165 | | 1,851 | |
| | PepsiAmericas Inc. | 62,367 | | 1,825 | |
| * | BJ’s Wholesale Club Inc. | 55,657 | | 1,821 | |
| * | Chattem Inc. | 17,505 | | 1,633 | |
| | Casey’s General Stores Inc. | 50,540 | | 1,613 | |
| | Nu Skin Enterprises Inc. | | | | |
| | Class A | 50,702 | | 1,362 | |
| * | TreeHouse Foods Inc. | 32,052 | | 1,246 | |
| | Universal Corp. | 25,299 | | 1,154 | |
| * | United Natural Foods Inc. | 40,755 | | 1,090 | |
| | Ruddick Corp. | 41,167 | | 1,059 | |
| * | Fresh Del Monte | | | | |
| | Produce Inc. | 45,002 | | 995 | |
| | Lancaster Colony Corp. | 19,610 | | 975 | |
| * | Rite Aid Corp. | 628,235 | | 949 | |
| * | American Italian Pasta Co. | 23,295 | | 810 | |
| * | Chiquita Brands | | | | |
| | International Inc. | 44,120 | | 796 | |
| * | Bare Escentuals Inc. | 64,802 | | 793 | |
| | Sanderson Farms Inc. | 16,925 | | 714 | |
| | Andersons Inc. | 26,882 | | 694 | |
| | | | | |
| | | | | Market | |
| | | | | Value• | |
| | | Shares | ($ | 000 | ) |
| * | Medifast Inc. | 22,362 | | 684 | |
| | Vector Group Ltd. | 46,359 | | 649 | |
| | Lance Inc. | 24,490 | | 644 | |
| * | Darling International Inc. | 76,640 | | 642 | |
| | J&J Snack Foods Corp. | 15,732 | | 629 | |
| * | Hain Celestial Group Inc. | 36,356 | | 618 | |
| | Cal-Maine Foods Inc. | 17,664 | | 602 | |
| * | Winn-Dixie Stores Inc. | 57,521 | | 578 | |
| | Tootsie Roll Industries Inc. | 20,239 | | 554 | |
| | Coca-Cola Bottling Co. | | | | |
| | Consolidated | 9,640 | | 521 | |
| | Diamond Foods Inc. | 12,632 | | 449 | |
| | Nash Finch Co. | 11,939 | | 443 | |
| | WD-40 Co. | 13,545 | | 438 | |
| * | Great Atlantic & | | | | |
| | Pacific Tea Co. | 36,212 | | 427 | |
| * | Central Garden and | | | | |
| | Pet Co. Class A | 39,898 | | 397 | |
| * | Central Garden and Pet Co. | 36,886 | | 395 | |
| *,^ | American Oriental | | | | |
| | Bioengineering Inc. | 80,961 | | 376 | |
| * | Boston Beer Co. Inc. | | | | |
| | Class A | 7,839 | | 365 | |
| * | Pantry Inc. | 26,671 | | 362 | |
| | Inter Parfums Inc. | 28,460 | | 346 | |
| * | Prestige Brands | | | | |
| | Holdings Inc. | 43,870 | | 345 | |
| | | |
| | International Inc. | 70,342 | 343 |
| | Ingles Markets Inc. Class A | 21,650 | 328 |
| * | John B. Sanfilippo & Son Inc. | 20,611 | 321 |
| * | Elizabeth Arden Inc. | 19,328 | 279 |
| *,^ | American Dairy Inc. | 12,468 | 270 |
| * | Heckmann Corp. | 54,100 | 270 |
| * | Smart Balance Inc. | 44,578 | 267 |
| | Alico Inc. | 8,259 | 235 |
| | B&G Foods Inc. Class A | 25,592 | 235 |
| | Weis Markets Inc. | 6,287 | 229 |
| | Pricesmart Inc. | 11,006 | 225 |
| * | Lifeway Foods Inc. | 15,308 | 182 |
| | Imperial Sugar Co. | 10,200 | 178 |
| | Arden Group Inc. | 1,822 | 174 |
| * | Zhongpin Inc. | 10,800 | 169 |
| | Spartan Stores Inc. | 11,601 | 166 |
| * | National Beverage Corp. | 11,297 | 157 |
| * | Revlon Inc. Class A | 8,572 | 146 |
| | Mannatech Inc. | 44,016 | 137 |
| | Farmer Bros Co. | 6,656 | 131 |
| * | USANA Health Sciences Inc. | 3,935 | 126 |
| * | Omega Protein Corp. | 28,743 | 125 |
| * | Harbinger Group Inc. | 17,400 | 122 |
| * | Reddy Ice Holdings Inc. | 26,460 | 114 |
| * | Susser Holdings Corp. | 13,075 | 112 |
| | Griffin Land & Nurseries Inc. | 3,583 | 104 |
| * | Overhill Farms Inc. | 19,000 | 92 |
17
| | | | | | |
| Institutional Total Stock Market Index Fund | |
| |
| |
| |
| | | | | | Market | |
| | | | | | Value• | |
| | | | Shares | ($ | 000 | ) |
| * | HQ Sustainable Maritime | | | | | |
| | Industries Inc. | | 12,000 | | 84 | |
| * | Star Scientific Inc. | | 94,615 | | 66 | |
| | Oil-Dri Corp. of America | | 4,218 | | 65 | |
| * | Parlux Fragrances Inc. | | 20,700 | | 43 | |
| * | Female Health Co. | | 8,774 | | 42 | |
| * | MGP Ingredients Inc. | | 4,834 | | 37 | |
| * | Nutraceutical | | | | | |
| | International Corp. | | 2,905 | | 36 | |
| * | Physicians Formula | | | | | |
| | Holdings Inc. | | 11,700 | | 32 | |
| * | Inventure Group Inc. | | 10,712 | | 25 | |
| * | Bridgford Foods Corp. | | 2,000 | | 22 | |
| * | Diedrich Coffee Inc. | | 600 | | 21 | |
| * | Seneca Foods Corp. Class A | 800 | | 19 | |
| | Tasty Baking Co. | | 1,568 | | 11 | |
| | Calavo Growers Inc. | | 498 | | 8 | |
| | Village Super Market Inc. | | | | | |
| | Class A | | 200 | | 5 | |
| * | Jones Soda Co. | | 12,240 | | 5 | |
| | Schiff Nutrition | | | | | |
| | International Inc. | | 484 | | 4 | |
| | | | | | 1,195,454 | |
| Energy (10.9%) | | | | | |
| | Exxon Mobil Corp. | 4,771,763 | | 325,387 | |
| | Chevron Corp. | 1,991,347 | | 153,314 | |
| | Schlumberger Ltd. | 1,189,103 | | 77,399 | |
| | ConocoPhillips | 1,398,830 | | 71,438 | |
| | Occidental | | | | | |
| | Petroleum Corp. | | 805,071 | | 65,493 | |
| | Apache Corp. | | 333,392 | | 34,396 | |
| | Devon Energy Corp. | | 418,670 | | 30,772 | |
| | Anadarko Petroleum Corp. | | 487,136 | | 30,407 | |
| | Halliburton Co. | | 895,185 | | 26,936 | |
| * | Transocean Ltd. | | 318,821 | | 26,398 | |
| | XTO Energy Inc. | | 547,358 | | 25,469 | |
| | EOG Resources Inc. | | 250,273 | | 24,352 | |
| | Marathon Oil Corp. | | 702,877 | | 21,944 | |
| | National Oilwell Varco Inc. | | 415,233 | | 18,308 | |
| | Hess Corp. | | 292,377 | | 17,689 | |
| * | Southwestern Energy Co. | | 342,242 | | 16,496 | |
| | Chesapeake Energy Corp. | | 605,559 | | 15,672 | |
| | Spectra Energy Corp. | | 641,480 | | 13,157 | |
| * | Weatherford | | | | | |
| | International Ltd. | | 722,284 | | 12,936 | |
| | Baker Hughes Inc. | | 307,831 | | 12,461 | |
| | Noble Energy Inc. | | 172,390 | | 12,278 | |
| | Williams Cos. Inc. | | 579,158 | | 12,209 | |
| | Peabody Energy Corp. | | 265,957 | | 12,024 | |
| | Noble Corp. | | 259,956 | | 10,580 | |
| * | Cameron | | | | | |
| | International Corp. | | 242,954 | | 10,156 | |
| | Murphy Oil Corp. | | 180,057 | | 9,759 | |
| | Valero Energy Corp. | | 559,465 | | 9,371 | |
| | Consol Energy Inc. | | 179,643 | | 8,946 | |
| | Range Resources Corp. | | 156,297 | | 7,791 | |
| | | | | |
| | | | | Market | |
| | | | | Value• | |
| | | Shares | ($ | 000 | ) |
| * | Ultra Petroleum Corp. | 150,587 | | 7,508 | |
| * | Petrohawk Energy Corp. | 299,257 | | 7,179 | |
| * | FMC Technologies Inc. | 121,867 | | 7,049 | |
| | El Paso Corp. | 697,411 | | 6,856 | |
| | Diamond Offshore | | | | |
| | Drilling Inc. | 69,139 | | 6,805 | |
| | Smith International Inc. | 245,747 | | 6,677 | |
| * | Newfield Exploration Co. | 131,756 | | 6,355 | |
| * | Nabors Industries Ltd. | 282,248 | | 6,178 | |
| * | Pride International Inc. | 172,900 | | 5,517 | |
| | Pioneer Natural | | | | |
| | Resources Co. | 114,281 | | 5,505 | |
| | BJ Services Co. | 290,176 | | 5,397 | |
| * | Alpha Natural | | | | |
| | Resources Inc. | 119,162 | | 5,169 | |
| | Cabot Oil & Gas Corp. | 103,076 | | 4,493 | |
| | Cimarex Energy Co. | 83,107 | | 4,402 | |
| | Helmerich & Payne Inc. | 105,023 | | 4,188 | |
| * | Kinder Morgan | | | | |
| | Management LLC | 74,896 | | 4,092 | |
| | EXCO Resources Inc. | 178,536 | | 3,790 | |
| * | Plains Exploration & | | | | |
| | Production Co. | 136,409 | | 3,773 | |
| * | Denbury Resources Inc. | 248,103 | | 3,672 | |
| * | Whiting Petroleum Corp. | 50,679 | | 3,621 | |
| | Arch Coal Inc. | 161,628 | | 3,596 | |
| | Massey Energy Co. | 85,089 | | 3,575 | |
| * | Oceaneering | | | | |
| | International Inc. | 54,825 | | 3,208 | |
| | Sunoco Inc. | 116,591 | | 3,043 | |
| * | Concho Resources Inc. | 63,816 | | 2,865 | |
| * | Dresser-Rand Group Inc. | 82,162 | | 2,597 | |
| * | Rowan Cos. Inc. | 113,419 | | 2,568 | |
| | Core Laboratories NV | 21,718 | | 2,565 | |
| | Southern Union Co. | 111,574 | | 2,533 | |
| * | Encore Acquisition Co. | 52,671 | | 2,529 | |
| | Tidewater Inc. | 51,713 | | 2,480 | |
| * | Forest Oil Corp. | 106,465 | | 2,369 | |
| | Patterson-UTI Energy Inc. | 153,060 | | 2,349 | |
| * | Atlas Energy Inc. | 73,703 | | 2,224 | |
| | St Mary Land & | | | | |
| | Exploration Co. | 62,419 | | 2,137 | |
| * | Atwood Oceanics Inc. | 57,747 | | 2,070 | |
| * | Oil States International Inc. | 49,861 | | 1,959 | |
| * | Unit Corp. | 45,225 | | 1,922 | |
| * | Superior Energy | | | | |
| | Services Inc. | 78,182 | | 1,899 | |
| | Tesoro Corp. | 139,886 | | 1,895 | |
| * | Comstock Resources Inc. | 46,542 | | 1,888 | |
| * | Quicksilver Resources Inc. | 118,926 | | 1,785 | |
| * | Dril-Quip Inc. | 31,042 | | 1,753 | |
| * | Arena Resources Inc. | 38,099 | | 1,643 | |
| | World Fuel Services Corp. | 56,530 | | 1,514 | |
| * | SEACOR Holdings Inc. | 19,233 | | 1,467 | |
| * | Continental Resources Inc. | 34,184 | | 1,466 | |
| * | SandRidge Energy Inc. | 154,635 | | 1,458 | |
18
Institutional Total Stock Market Index Fund
| | | | | |
| | | | | Market | |
| | | | | Value• | |
| | | Shares | ($ | 000 | ) |
| | CARBO Ceramics Inc. | 19,830 | | 1,352 | |
| * | Brigham Exploration Co. | 99,573 | | 1,349 | |
| * | Patriot Coal Corp. | 85,657 | | 1,324 | |
| * | Bill Barrett Corp. | 41,147 | | 1,280 | |
| * | Exterran Holdings Inc. | 59,555 | | 1,277 | |
| | Frontier Oil Corp. | 104,863 | | 1,263 | |
| * | Gran Tierra Energy Inc. | 211,960 | | 1,215 | |
| * | Mariner Energy Inc. | 101,514 | | 1,179 | |
| * | Helix Energy Solutions | | | | |
| | Group Inc. | 98,918 | | 1,162 | |
| | Overseas Shipholding | | | | |
| | Group Inc. | 25,735 | | 1,131 | |
| | Lufkin Industries Inc. | 15,030 | | 1,100 | |
| * | Key Energy Services Inc. | 124,459 | | 1,094 | |
| | Holly Corp. | 42,511 | | 1,090 | |
| * | Bristow Group Inc. | 28,271 | | 1,087 | |
| | Berry Petroleum Co. | | | | |
| | Class A | 36,443 | | 1,062 | |
| * | Rosetta Resources Inc. | 52,585 | | 1,048 | |
| | Penn Virginia Corp. | 45,114 | | 960 | |
| * | Carrizo Oil & Gas Inc. | 34,687 | | 919 | |
| * | BPZ Resources Inc. | 95,621 | | 908 | |
| * | CNX Gas Corp. | 30,039 | | 887 | |
| * | Swift Energy Co. | 36,750 | | 881 | |
| * | Tetra Technologies Inc. | 76,072 | | 843 | |
| * | ATP Oil & Gas Corp. | 45,412 | | 830 | |
| * | Clean Energy Fuels Corp. | 53,479 | | 824 | |
| * | Complete Production | | | | |
| | Services Inc. | 61,210 | | 796 | |
| * | ION Geophysical Corp. | 132,576 | | 785 | |
| * | Cal Dive International Inc. | 101,456 | | 767 | |
| * | Enbridge Energy | | | | |
| | Management LLC | 14,281 | | 759 | |
| * | James River Coal Co. | 40,365 | | 748 | |
| * | Cobalt International | | | | |
| | Energy Inc. | 53,705 | | 743 | |
| * | Stone Energy Corp. | 40,634 | | 733 | |
| * | Global Industries Ltd. | 102,555 | | 731 | |
| * | International Coal Group Inc. | 187,841 | | 725 | |
| * | Contango Oil & Gas Co. | 13,116 | | 617 | |
| * | McMoRan Exploration Co. | 76,390 | | 613 | |
| * | Parker Drilling Co. | 121,003 | | 599 | |
| | General Maritime Corp. | 84,240 | | 589 | |
| * | Goodrich Petroleum Corp. | 23,069 | | 562 | |
| * | Gulfmark Offshore Inc. | 19,014 | | 538 | |
| * | Hornbeck Offshore | | | | |
| | Services Inc. | 21,600 | | 503 | |
| * | Pioneer Drilling Co. | 62,709 | | 495 | |
| * | Oilsands Quest Inc. | 430,658 | | 495 | |
| * | Hercules Offshore Inc. | 103,316 | | 494 | |
| * | Willbros Group Inc. | 28,800 | | 486 | |
| * | Allis-Chalmers Energy Inc. | 126,617 | | 477 | |
| * | Matrix Service Co. | 40,074 | | 427 | |
| * | USEC Inc. | 108,108 | | 416 | |
| * | Clayton Williams Energy Inc. | 10,911 | | 382 | |
| | Vaalco Energy Inc. | 83,943 | | 382 | |
| | | | | |
| | | | | Market | |
| | | | | Value• | |
| | | Shares | ($ | 000 | ) |
| * | Seahawk Drilling Inc. | 15,785 | | 356 | |
| * | Newpark Resources Inc. | 82,326 | | 348 | |
| | Gulf Island Fabrication Inc. | 16,184 | | 340 | |
| * | Basic Energy Services Inc. | 38,009 | | 338 | |
| | Energy XXI Bermuda Ltd. | 139,861 | | 323 | |
| * | GMX Resources Inc. | 23,054 | | 317 | |
| * | Approach Resources Inc. | 39,048 | | 301 | |
| | W&T Offshore Inc. | 25,526 | | 299 | |
| | Delek US Holdings Inc. | 41,823 | | 285 | |
| * | Venoco Inc. | 21,297 | | 278 | |
| * | Dawson Geophysical Co. | 11,220 | | 259 | |
| * | American Oil & Gas Inc. | 61,693 | | 259 | |
| | Alon USA Energy Inc. | 37,062 | | 254 | |
| * | Petroquest Energy Inc. | 39,386 | | 241 | |
| * | Western Refining Inc. | 50,739 | | 239 | |
| * | T 3 Energy Services Inc. | 9,304 | | 237 | |
| * | Delta Petroleum Corp. | 225,048 | | 234 | |
| * | Harvest Natural | | | | |
| | Resources Inc. | 43,588 | | 231 | |
| * | Abraxas Petroleum Corp. | 115,876 | | 223 | |
| * | Natural Gas Services | | | | |
| | Group Inc. | 11,400 | | 215 | |
| | RPC Inc. | 20,231 | | 210 | |
| * | Bronco Drilling Co. Inc. | 41,040 | | 208 | |
| | Crosstex Energy Inc. | 33,324 | | 202 | |
| * | Petroleum Development Corp. 10,985 | | 200 | |
| * | FX Energy Inc. | 67,836 | | 193 | |
| * | Endeavour | | | | |
| | International Corp. | 165,325 | | 179 | |
| * | Tesco Corp. | 12,700 | | 164 | |
| * | CREDO Petroleum Corp. | 16,623 | | 155 | |
| * | CVR Energy Inc. | 21,126 | | 145 | |
| * | PHI Inc. | 6,963 | | 144 | |
| * | Bolt Technology Corp. | 12,231 | | 135 | |
| | Toreador Resources Corp. | 12,850 | | 127 | |
| * | OYO Geospace Corp. | 2,929 | | 126 | |
| * | Geokinetics Inc. | 11,700 | | 113 | |
| * | Gastar Exploration Ltd. | 21,500 | | 103 | |
| * | Gulfport Energy Corp. | 8,672 | | 99 | |
| * | Double Eagle Petroleum Co. | 19,340 | | 84 | |
| * | ENGlobal Corp. | 26,500 | | 83 | |
| * | Cheniere Energy Inc. | 31,466 | | 76 | |
| * | Syntroleum Corp. | 28,304 | | 75 | |
| * | Union Drilling Inc. | 12,040 | | 75 | |
| * | Superior Well Services Inc. | 4,900 | | 70 | |
| * | Rentech Inc. | 56,482 | | 69 | |
| * | Evergreen Energy Inc. | 187,936 | | 64 | |
| * | Warren Resources Inc. | 26,047 | | 64 | |
| * | HKN Inc. | 16,344 | | 60 | |
| * | Northern Oil And Gas Inc. | 5,000 | | 59 | |
| * | Callon Petroleum Co. | 37,149 | | 56 | |
| * | Rex Energy Corp. | 4,500 | | 54 | |
| * | Mitcham Industries Inc. | 6,904 | | 51 | |
| * | Boots & Coots Inc. | 27,400 | | 45 | |
| * | Kodiak Oil & Gas Corp. | 17,400 | | 39 | |
| *,^ | Sulphco Inc. | 53,850 | | 36 | |
19
Institutional Total Stock Market Index Fund
| | | | | | |
| | | | | | Market | |
| | | | | | Value• | |
| | | | Shares | ($ | 000 | ) |
| * | Westmoreland Coal Co. | 3,998 | | 36 | |
| * | Gasco Energy Inc. | | 64,680 | | 34 | |
| * | Trico Marine Services Inc. | 4,901 | | 22 | |
| * | Pacific Ethanol Inc. | | 26,820 | | 19 | |
| * | Meridian Resource Corp. | 72,640 | | 19 | |
| | Panhandle Oil and Gas Inc. | | | | |
| | Class A | | 600 | | 16 | |
| * | Verenium Corp. | | 2,894 | | 13 | |
| * | GeoGlobal Resources Inc. | 5,959 | | 12 | |
| * | Cano Petroleum Inc. | | 12,200 | | 12 | |
| * | Barnwell Industries Inc. | 2,002 | | 9 | |
| * | RAM Energy Resources Inc. | | 3,700 | | 8 | |
| * | Uranium Resources Inc. | 7,500 | | 6 | |
| * | TGC Industries Inc. | | 287 | | 1 | |
| | | | | | 1,335,395 | |
| Financials (15.2%) | | | | | |
| | JPMorgan Chase & Co. | 3,904,697 | | 162,709 | |
| | Wells Fargo & Co. | | 4,821,880 | | 130,143 | |
| | Bank of America Corp. | 8,590,254 | | 129,369 | |
| | Goldman Sachs | | | | | |
| | Group Inc. | | 482,260 | | 81,425 | |
| | Citigroup Inc. | 21,047,529 | | 69,667 | |
| | American Express Co. | 1,062,520 | | 43,053 | |
| | US Bancorp | | 1,898,074 | | 42,726 | |
| | Morgan Stanley | | 1,214,582 | | 35,952 | |
| | Bank of New York | | | | | |
| | Mellon Corp. | | 1,194,344 | | 33,406 | |
| * | Berkshire Hathaway Inc. | | | | |
| | Class B | | 9,763 | | 32,081 | |
| | MetLife Inc. | | 812,857 | | 28,735 | |
| | Travelers Cos. Inc. | | 563,575 | | 28,100 | |
| | PNC Financial Services | | | | |
| | Group Inc. | | 458,072 | | 24,182 | |
| | Prudential Financial Inc. | 457,716 | | 22,776 | |
| | Simon Property Group Inc. | 282,945 | | 22,579 | |
| | Aflac Inc. | | 464,386 | | 21,478 | |
| | State Street Corp. | | 490,974 | | 21,377 | |
| | CME Group Inc. | | 59,369 | | 19,945 | |
| | Charles Schwab Corp. | 979,979 | | 18,443 | |
| | Capital One Financial Corp. | 451,903 | | 17,326 | |
| | BB&T Corp. | | 676,999 | | 17,175 | |
| | Chubb Corp. | | 347,639 | | 17,097 | |
| | Franklin Resources Inc. | 160,156 | | 16,872 | |
| | ACE Ltd. | | 333,930 | | 16,830 | |
| | Allstate Corp. | | 506,216 | | 15,207 | |
| | T Rowe Price Group Inc. | 254,452 | | 13,550 | |
| | Loews Corp. | | 344,222 | | 12,512 | |
| * | Progressive Corp. | | 640,525 | | 11,523 | |
| | Marsh & McLennan | | | | | |
| | Cos. Inc. | | 520,680 | | 11,497 | |
| | Northern Trust Corp. | | 215,926 | | 11,315 | |
| | Vornado Realty Trust | | 161,191 | | 11,274 | |
| | Public Storage | | 126,302 | | 10,287 | |
| | SunTrust Banks Inc. | | 495,842 | | 10,061 | |
| | Ameriprise Financial Inc. | 253,642 | | 9,846 | |
| | Invesco Ltd. | | 413,609 | | 9,716 | |
| | | | | |
| | | | | Market | |
| | | | | Value• | |
| | | Shares | ($ | 000 | ) |
| | AON Corp. | 245,630 | | 9,417 | |
| | Annaly Capital | | | | |
| | Management Inc. | 540,699 | | 9,381 | |
| | Boston Properties Inc. | 137,795 | | 9,242 | |
| | Equity Residential | 272,311 | | 9,199 | |
| | Hartford Financial | | | | |
| | Services Group Inc. | 381,693 | | 8,878 | |
| | HCP Inc. | 289,195 | | 8,832 | |
| | Discover Financial Services | 534,320 | | 7,860 | |
| | Principal Financial | | | | |
| | Group Inc. | 316,900 | | 7,618 | |
| | Lincoln National Corp. | 300,355 | | 7,473 | |
| | Fifth Third Bancorp | 751,776 | | 7,330 | |
| | Host Hotels & Resorts Inc. | 617,906 | | 7,211 | |
| * | IntercontinentalExchange Inc. | 61,888 | | 6,950 | |
| | Ventas Inc. | 155,833 | | 6,816 | |
| | NYSE Euronext | 258,454 | | 6,539 | |
| | AvalonBay Communities Inc. | 79,576 | | 6,534 | |
| | Hudson City Bancorp Inc. | 469,222 | | 6,442 | |
| | Unum Group | 329,645 | | 6,435 | |
| | Regions Financial Corp. | 1,182,599 | | 6,256 | |
| | XL Capital Ltd. Class A | 340,102 | | 6,234 | |
| | Plum Creek Timber Co. Inc. | 162,051 | | 6,119 | |
| | ProLogis | 440,550 | | 6,031 | |
| | New York Community | | | | |
| | Bancorp Inc. | 399,947 | | 5,803 | |
| | People’s United | | | | |
| | Financial Inc. | 346,061 | | 5,779 | |
| * | Genworth Financial Inc. | | | | |
| | Class A | 478,146 | | 5,427 | |
| | Kimco Realty Corp. | 399,860 | | 5,410 | |
| | Moody’s Corp. | 199,780 | | 5,354 | |
| | BlackRock Inc. | 22,786 | | 5,291 | |
| | Health Care REIT Inc. | 119,055 | | 5,277 | |
| * | SLM Corp. | 464,532 | | 5,235 | |
| | Everest Re Group Ltd. | 60,607 | | 5,193 | |
| ^ | M&T Bank Corp. | 76,330 | | 5,106 | |
| * | TD Ameritrade | | | | |
| | Holding Corp. | 262,159 | | 5,081 | |
| | PartnerRe Ltd. | 66,692 | | 4,979 | |
| | KeyCorp | 874,430 | | 4,853 | |
| * | Leucadia National Corp. | 193,637 | | 4,607 | |
| | Comerica Inc. | 150,328 | | 4,445 | |
| | Willis Group Holdings Ltd. | 167,161 | | 4,410 | |
| | Legg Mason Inc. | 142,236 | | 4,290 | |
| * | Berkshire Hathaway Inc. | | | | |
| | Class A | 43 | | 4,266 | |
| | Federal Realty | | | | |
| | Investment Trust | 60,686 | | 4,110 | |
| | Cincinnati Financial Corp. | 153,840 | | 4,037 | |
| | SL Green Realty Corp. | 76,439 | | 3,840 | |
| | Axis Capital Holdings Ltd. | 134,624 | | 3,825 | |
| | Nationwide Health | | | | |
| | Properties Inc. | 106,696 | | 3,754 | |
| | AMB Property Corp. | 145,736 | | 3,724 | |
| | Torchmark Corp. | 82,444 | | 3,623 | |
20
Institutional Total Stock Market Index Fund
| | | | | |
| | | | | Market | |
| | | | | Value• | |
| | | Shares | ($ | 000 | ) |
| | Digital Realty Trust Inc. | 71,878 | | 3,614 | |
| *,^ | American International | | | | |
| | Group Inc. | 120,321 | | 3,607 | |
| | Liberty Property Trust | 111,114 | | 3,557 | |
| | WR Berkley Corp. | 143,371 | | 3,533 | |
| | Assurant Inc. | 117,226 | | 3,456 | |
| | Reinsurance Group of | | | | |
| | America Inc. Class A | 72,343 | | 3,447 | |
| | Macerich Co. | 94,190 | | 3,386 | |
| | Eaton Vance Corp. | 110,533 | | 3,361 | |
| | Rayonier Inc. | 78,969 | | 3,329 | |
| | RenaissanceRe | | | | |
| | Holdings Ltd. | 62,049 | | 3,298 | |
| * | CB Richard Ellis Group Inc. | | | | |
| | Class A | 242,013 | | 3,284 | |
| * | MSCI Inc. Class A | 99,548 | | 3,166 | |
| * | Markel Corp. | 9,266 | | 3,150 | |
| | HCC Insurance Holdings Inc. | 111,780 | | 3,127 | |
| | Regency Centers Corp. | 87,946 | | 3,083 | |
| * | Arch Capital Group Ltd. | 42,488 | | 3,040 | |
| | First American Corp. | 90,404 | | 2,993 | |
| * | First Horizon National Corp. | 220,603 | | 2,956 | |
| | Fidelity National | | | | |
| | Financial Inc. Class A | 218,028 | | 2,935 | |
| | Transatlantic Holdings Inc. | 56,234 | | 2,930 | |
| | Hospitality Properties Trust | 122,026 | | 2,893 | |
| * | NASDAQ OMX Group Inc. | 141,804 | | 2,811 | |
| * | Affiliated Managers | | | | |
| | Group Inc. | 41,503 | | 2,795 | |
| | Alexandria Real Estate | | | | |
| | Equities Inc. | 43,154 | | 2,774 | |
| | Senior Housing | | | | |
| | Properties Trust | 126,733 | | 2,772 | |
| | Assured Guaranty Ltd. | 126,048 | | 2,743 | |
| | Commerce Bancshares Inc. | 70,298 | | 2,722 | |
| | Duke Realty Corp. | 222,801 | | 2,712 | |
| | Camden Property Trust | 63,833 | | 2,705 | |
| | Mack-Cali Realty Corp. | 78,146 | | 2,702 | |
| ^ | Realty Income Corp. | 103,996 | | 2,695 | |
| | Cullen/Frost Bankers Inc. | 53,392 | | 2,670 | |
| * | St Joe Co. | 92,260 | | 2,665 | |
| | White Mountains | | | | |
| | Insurance Group Ltd. | 7,943 | | 2,642 | |
| | Waddell & Reed | | | | |
| | Financial Inc. | 85,847 | | 2,622 | |
| | Marshall & Ilsley Corp. | 477,466 | | 2,602 | |
| | First Niagara Financial | | | | |
| | Group Inc. | 182,864 | | 2,544 | |
| | Federated Investors Inc. | | | | |
| | Class B | 92,136 | | 2,534 | |
| * | AmeriCredit Corp. | 133,065 | | 2,534 | |
| | Jones Lang LaSalle Inc. | 41,775 | | 2,523 | |
| | Validus Holdings Ltd. | 92,921 | | 2,503 | |
| | UDR Inc. | 150,357 | | 2,472 | |
| | Chimera Investment Corp. | 634,256 | | 2,461 | |
| | Huntington Bancshares Inc. | 673,998 | | 2,460 | |
| | | | | |
| | | | | Market | |
| | | | | Value• | |
| | | Shares | ($ | 000 | ) |
| * | Jefferies Group Inc. | 103,287 | | 2,451 | |
| | Janus Capital Group Inc. | 181,979 | | 2,448 | |
| | Old Republic | | | | |
| | International Corp. | 239,570 | | 2,405 | |
| | Essex Property Trust Inc. | 28,247 | | 2,363 | |
| | Highwoods Properties Inc. | 70,766 | | 2,360 | |
| | Raymond James | | | | |
| | Financial Inc. | 98,181 | | 2,334 | |
| | SEI Investments Co. | 133,132 | | 2,332 | |
| | Arthur J Gallagher & Co. | 100,978 | | 2,273 | |
| | Hanover Insurance | | | | |
| | Group Inc. | 51,073 | | 2,269 | |
| | Bank of Hawaii Corp. | 47,839 | | 2,251 | |
| | Weingarten Realty | | | | |
| | Investors | 113,662 | | 2,249 | |
| | Brown & Brown Inc. | 119,774 | | 2,152 | |
| | Corporate Office | | | | |
| | Properties Trust SBI | 58,063 | | 2,127 | |
| | Aspen Insurance | | | | |
| | Holdings Ltd. | 82,901 | | 2,110 | |
| | Washington Federal Inc. | 108,339 | | 2,095 | |
| | MFA Financial Inc. | 272,657 | | 2,004 | |
| | City National Corp. | 43,633 | | 1,990 | |
| | StanCorp Financial | | | | |
| | Group Inc. | 48,961 | | 1,959 | |
| * | E*Trade Financial Corp. | 1,115,720 | | 1,953 | |
| | Allied World | | | | |
| | Assurance Co. | | | | |
| | Holdings Ltd. | 42,194 | | 1,944 | |
| | Valley National Bancorp | 135,178 | | 1,910 | |
| | Taubman Centers Inc. | 53,104 | | 1,907 | |
| | Platinum Underwriters | | | | |
| | Holdings Ltd. | 49,733 | | 1,904 | |
| | American Financial | | | | |
| | Group Inc. | 75,395 | | 1,881 | |
| | Apartment Investment & | | | | |
| | Management Co. | 117,131 | | 1,865 | |
| | Endurance Specialty | | | | |
| | Holdings Ltd. | 49,039 | | 1,826 | |
| | Greenhill & Co. Inc. | 22,685 | | 1,820 | |
| | BancorpSouth Inc. | 74,873 | | 1,757 | |
| | BRE Properties Inc. | 52,953 | | 1,752 | |
| | National Retail | | | | |
| | Properties Inc. | 80,548 | | 1,709 | |
| * | SVB Financial Group | 40,927 | | 1,706 | |
| | Prosperity Bancshares Inc. | 41,694 | | 1,687 | |
| | Apollo Investment Corp. | 176,010 | | 1,677 | |
| * | ProAssurance Corp. | 31,040 | | 1,667 | |
| | FirstMerit Corp. | 82,026 | | 1,652 | |
| * | Alleghany Corp. | 5,870 | | 1,620 | |
| | Omega Healthcare | | | | |
| | Investors Inc. | 83,159 | | 1,617 | |
| | Westamerica | | | | |
| | Bancorporation | 29,134 | | 1,613 | |
| | Washington Real Estate | | | | |
| | Investment Trust | 58,474 | | 1,611 | |
21
Institutional Total Stock Market Index Fund
| | | | | | |
| | | | | | Market | |
| | | | | | Value• | |
| | | | Shares | ($ | 000 | ) |
| * | Stifel Financial Corp. | | 26,889 | | 1,593 | |
| | Home Properties Inc. | | 33,203 | | 1,584 | |
| | TCF Financial Corp. | | 115,958 | | 1,579 | |
| | Tanger Factory | | | | | |
| | Outlet Centers | | 39,950 | | 1,558 | |
| | Zions Bancorporation | | 120,354 | | 1,544 | |
| | BioMed Realty Trust Inc. | 97,733 | | 1,542 | |
| | Fulton Financial Corp. | | 176,731 | | 1,541 | |
| | Brandywine Realty Trust | 129,172 | | 1,473 | |
| | American Campus | | | | | |
| | Communities Inc. | | 52,394 | | 1,472 | |
| | Entertainment | | | | | |
| | Properties Trust | | 41,740 | | 1,472 | |
| | Equity Lifestyle | | | | | |
| | Properties Inc. | | 28,886 | | 1,458 | |
| | Popular Inc. | | 640,133 | | 1,447 | |
| | HRPT Properties Trust | | 222,350 | | 1,439 | |
| * | Forest City Enterprises Inc. | | | | |
| | Class A | | 120,833 | | 1,423 | |
| | Montpelier Re Holdings Ltd. | 82,040 | | 1,421 | |
| | Protective Life Corp. | | 85,070 | | 1,408 | |
| | Douglas Emmett Inc. | | 96,681 | | 1,378 | |
| * | Knight Capital Group Inc. | | | | |
| | Class A | | 89,194 | | 1,374 | |
| | Mid-America Apartment | | | | |
| | Communities Inc. | | 28,208 | | 1,362 | |
| | LaSalle Hotel Properties | 63,915 | | 1,357 | |
| | Trustmark Corp. | | 60,004 | | 1,353 | |
| | Ares Capital Corp. | | 107,568 | | 1,339 | |
| | Kilroy Realty Corp. | | 43,384 | | 1,331 | |
| | Associated Banc-Corp | | 120,801 | | 1,330 | |
| *,^ | Federal National | | | | | |
| | Mortgage Assn. | 1,116,647 | | 1,318 | |
| * | Signature Bank | | 40,789 | | 1,301 | |
| | BOK Financial Corp. | | 27,256 | | 1,295 | |
| | Healthcare Realty Trust Inc. | 59,899 | | 1,285 | |
| | CBL & Associates | | | | | |
| | Properties Inc. | | 131,646 | | 1,273 | |
| | Developers Diversified | | | | | |
| | Realty Corp. | | 137,280 | | 1,271 | |
| | Hancock Holding Co. | | 29,025 | | 1,271 | |
| | Potlatch Corp. | | 39,728 | | 1,267 | |
| | Erie Indemnity Co. Class A | 30,762 | | 1,200 | |
| | UMB Financial Corp. | | 30,460 | | 1,199 | |
| * | Conseco Inc. | | 235,647 | | 1,178 | |
| | East West Bancorp Inc. | 74,024 | | 1,170 | |
| | NewAlliance Bancshares Inc. | 95,833 | | 1,151 | |
| | Northwest Bancshares Inc. | 99,847 | | 1,130 | |
| | Umpqua Holdings Corp. | 84,268 | | 1,130 | |
| | TFS Financial Corp. | | 92,792 | | 1,127 | |
| | Unitrin Inc. | | 50,456 | | 1,113 | |
| | Zenith National | | | | | |
| | Insurance Corp. | | 37,318 | | 1,111 | |
| | Max Capital Group Ltd. | 48,774 | | 1,088 | |
| | Redwood Trust Inc. | | 74,513 | | 1,077 | |
| | Mercury General Corp. | 27,418 | | 1,076 | |
| | | | | |
| | | | | Market | |
| | | | | Value• | |
| | | Shares | ($ | 000 | ) |
| | Delphi Financial Group Inc. | 47,623 | | 1,065 | |
| | Old National Bancorp | 84,785 | | 1,054 | |
| | Iberiabank Corp. | 19,423 | | 1,045 | |
| | Cash America | | | | |
| | International Inc. | 29,871 | | 1,044 | |
| | Franklin Street | | | | |
| | Properties Corp. | 70,818 | | 1,035 | |
| | Astoria Financial Corp. | 82,938 | | 1,031 | |
| | DCT Industrial Trust Inc. | 204,471 | | 1,026 | |
| | CapitalSource Inc. | 257,268 | | 1,021 | |
| | Hatteras Financial Corp. | 36,238 | | 1,013 | |
| | EastGroup Properties Inc. | 26,167 | | 1,002 | |
| | Tower Group Inc. | 42,667 | | 999 | |
| * | Piper Jaffray Cos. | 19,689 | | 996 | |
| | International | | | | |
| | Bancshares Corp. | 51,716 | | 979 | |
| | RLI Corp. | 18,285 | | 974 | |
| | Sovran Self Storage Inc. | 27,215 | | 972 | |
| *,^ | Federal Home Loan | | | | |
| | Mortgage Corp. | 658,896 | | 969 | |
| | Extra Space Storage Inc. | 83,524 | | 965 | |
| | American National | | | | |
| | Insurance Co. | 7,995 | | 955 | |
| | PS Business Parks Inc. | 19,067 | | 954 | |
| | CVB Financial Corp. | 109,974 | | 950 | |
| | Post Properties Inc. | 48,439 | | 949 | |
| | First Financial Bancorp | 64,735 | | 943 | |
| | DiamondRock | | | | |
| | Hospitality Co. | 109,125 | | 924 | |
| | First Financial | | | | |
| | Bankshares Inc. | 16,817 | | 912 | |
| | MB Financial Inc. | 46,100 | | 909 | |
| | Equity One Inc. | 56,015 | | 906 | |
| | FNB Corp. | 133,337 | | 905 | |
| * | Allied Capital Corp. | 248,665 | | 898 | |
| * | Argo Group International | | | | |
| | Holdings Ltd. | 30,785 | | 897 | |
| | Capstead Mortgage Corp. | 65,352 | | 892 | |
| | Community Bank | | | | |
| | System Inc. | 45,884 | | 886 | |
| | Synovus Financial Corp. | 429,762 | | 881 | |
| * | PHH Corp. | 54,168 | | 873 | |
| * | Investment Technology | | | | |
| | Group Inc. | 44,218 | | 871 | |
| | Selective Insurance Group | 52,902 | | 870 | |
| | Acadia Realty Trust | 51,447 | | 868 | |
| | National Health | | | | |
| | Investors Inc. | 23,417 | | 866 | |
| | Glacier Bancorp Inc. | 62,539 | | 858 | |
| | Whitney Holding Corp. | 94,110 | | 857 | |
| * | KBW Inc. | 31,281 | | 856 | |
| | Wilmington Trust Corp. | 69,270 | | 855 | |
| | Sunstone Hotel | | | | |
| | Investors Inc. | 94,473 | | 839 | |
| | American Capital | | | | |
| | Agency Corp. | 31,156 | | 827 | |
22
Institutional Total Stock Market Index Fund
| | | | | |
| | | | | Market | |
| | | | | Value• | |
| | | Shares | ($ | 000 | ) |
| ^ | United Bankshares Inc. | 41,364 | | 826 | |
| | PacWest Bancorp | 40,748 | | 821 | |
| | Wintrust Financial Corp. | 25,971 | | 800 | |
| * | Dollar Financial Corp. | 33,704 | | 797 | |
| | Medical Properties Trust Inc. | 79,357 | | 794 | |
| * | MF Global Ltd. | 113,707 | | 790 | |
| | NBT Bancorp Inc. | 38,708 | | 788 | |
| | American Capital Ltd. | 319,946 | | 781 | |
| | Webster Financial Corp. | 65,578 | | 778 | |
| * | MGIC Investment Corp. | 134,060 | | 775 | |
| * | World Acceptance Corp. | 21,358 | | 765 | |
| | First Midwest Bancorp Inc. | 68,637 | | 747 | |
| | National Penn | | | | |
| | Bancshares Inc. | 128,114 | | 742 | |
| | City Holding Co. | 22,910 | | 741 | |
| | Employers Holdings Inc. | 47,895 | | 735 | |
| | Chemical Financial Corp. | 31,139 | | 734 | |
| * | Interactive Brokers | | | | |
| | Group Inc. | 40,787 | | 723 | |
| | Brookline Bancorp Inc. | 71,610 | | 710 | |
| | Columbia Banking | | | | |
| | System Inc. | 43,350 | | 701 | |
| | Anworth Mortgage | | | | |
| | Asset Corp. | 99,725 | | 698 | |
| | First Citizens | | | | |
| | BancShares Inc. Class A | 4,255 | | 698 | |
| * | Ocwen Financial Corp. | 72,430 | | 693 | |
| | Capitol Federal Financial | 21,875 | | 688 | |
| | Home Bancshares Inc. | 28,525 | | 687 | |
| * | Navigators Group Inc. | 14,531 | | 685 | |
| | optionsXpress Holdings Inc. | 44,092 | | 681 | |
| * | Portfolio Recovery | | | | |
| | Associates Inc. | 14,868 | | 667 | |
| * | MBIA Inc. | 165,958 | | 661 | |
| | Financial Federal Corp. | 23,553 | | 648 | |
| | American Equity Investment | | | | |
| | Life Holding Co. | 86,696 | | 645 | |
| | Park National Corp. | 10,936 | | 644 | |
| | Bank of the Ozarks Inc. | 21,883 | | 641 | |
| | Boston Private Financial | | | | |
| | Holdings Inc. | 109,198 | | 630 | |
| | Independent Bank Corp. | 29,611 | | 619 | |
| | First Commonwealth | | | | |
| | Financial Corp. | 131,316 | | 611 | |
| | Radian Group Inc. | 82,413 | | 602 | |
| | Evercore Partners Inc. | | | | |
| | Class A | 19,642 | | 597 | |
| | Colonial Properties Trust | 50,295 | | 590 | |
| * | Investors Bancorp Inc. | 53,223 | | 582 | |
| | Trustco Bank Corp. | 92,265 | | 581 | |
| * | Ezcorp Inc. Class A | 33,246 | | 572 | |
| | Saul Centers Inc. | 17,315 | | 567 | |
| | Infinity Property & | | | | |
| | Casualty Corp. | 13,684 | | 556 | |
| | Provident Financial | | | | |
| | Services Inc. | 52,100 | | 555 | |
| | | | | |
| | | | | Market | |
| | | | | Value• | |
| | | Shares | ($ | 000 | ) |
| ^ | Prospect Capital Corp. | 46,953 | | 555 | |
| | BlackRock Kelso | | | | |
| | Capital Corp. | 64,983 | | 554 | |
| | Duff & Phelps Corp. Class A | 30,090 | | 549 | |
| | Cohen & Steers Inc. | 23,862 | | 545 | |
| * | Pico Holdings Inc. | 16,624 | | 544 | |
| | American Physicians | | | | |
| | Capital Inc. | 17,932 | | 544 | |
| | Susquehanna | | | | |
| | Bancshares Inc. | 91,696 | | 540 | |
| | Cathay General Bancorp | 70,036 | | 529 | |
| * | Forestar Group Inc. | 23,786 | | 523 | |
| * | Ashford Hospitality | | | | |
| | Trust Inc. | 111,253 | | 516 | |
| | FBL Financial Group Inc. | | | | |
| | Class A | 27,873 | | 516 | |
| | Berkshire Hills Bancorp Inc. | 24,933 | | 516 | |
| * | Alexander’s Inc. | 1,687 | | 514 | |
| * | Hilltop Holdings Inc. | 43,532 | | 507 | |
| | Community Trust | | | | |
| | Bancorp Inc. | 20,691 | | 506 | |
| | Dime Community | | | | |
| | Bancshares | 43,104 | | 505 | |
| | Investors Real Estate Trust | 55,708 | | 501 | |
| * | AMERISAFE Inc. | 27,846 | | 500 | |
| | Bank Mutual Corp. | 71,957 | | 498 | |
| * | Ambac Financial Group Inc. | 590,774 | | 490 | |
| * | First Cash Financial | | | | |
| | Services Inc. | 21,867 | | 485 | |
| | Calamos Asset | | | | |
| | Management Inc. | | | | |
| | Class A | 42,000 | | 484 | |
| | Arrow Financial Corp. | 19,269 | | 482 | |
| | Safety Insurance Group Inc. | 13,230 | | 479 | |
| | DuPont Fabros | | | | |
| | Technology Inc. | 26,447 | | 476 | |
| * | Broadpoint Gleacher | | | | |
| | Securities Inc. | 105,893 | | 472 | |
| | Provident New York Bancorp | 55,261 | | 466 | |
| * | Beneficial Mutual | | | | |
| | Bancorp Inc. | 46,444 | | 457 | |
| | Bancfirst Corp. | 12,276 | | 455 | |
| * | Texas Capital | | | | |
| | Bancshares Inc. | 32,563 | | 455 | |
| | Sterling Bancshares Inc. | 87,860 | | 451 | |
| | Associated Estates | | | | |
| | Realty Corp. | 39,983 | | 451 | |
| | Horace Mann | | | | |
| | Educators Corp. | 36,039 | | 451 | |
| | Inland Real Estate Corp. | 54,734 | | 446 | |
| | Cousins Properties Inc. | 57,731 | | 441 | |
| | Advance America Cash | | | | |
| | Advance Centers Inc. | 79,007 | | 439 | |
| * | Encore Capital Group Inc. | 25,226 | | 439 | |
| | BGC Partners Inc. Class A | 92,843 | | 429 | |
| | Phoenix Cos. Inc. | 152,103 | | 423 | |
23
Institutional Total Stock Market Index Fund
| | | | | |
| | | | | Market | |
| | | | | Value• | |
| | | Shares | ($ | 000 | ) |
| | Amtrust Financial | | | | |
| | Services Inc. | 35,468 | | 419 | |
| | Harleysville Group Inc. | 13,056 | | 415 | |
| | GAMCO Investors Inc. | 8,532 | | 412 | |
| | Camden National Corp. | 12,379 | | 405 | |
| | S&T Bancorp Inc. | 23,431 | | 399 | |
| | Harleysville National Corp. | 61,673 | | 397 | |
| | Capital Southwest Corp. | 5,032 | | 397 | |
| | Northfield Bancorp Inc. | 28,905 | | 391 | |
| | BankFinancial Corp. | 39,427 | | 390 | |
| | Hercules Technology | | | | |
| | Growth Capital Inc. | 37,116 | | 386 | |
| | PrivateBancorp Inc. Class A | 42,963 | | 385 | |
| * | Altisource Portfolio | | | | |
| | Solutions SA | 18,264 | | 383 | |
| | Ames National Corp. | 18,000 | | 380 | |
| * | FPIC Insurance Group Inc. | 9,614 | | 371 | |
| | Southside Bancshares Inc. | 18,609 | | 365 | |
| | Baldwin & Lyons Inc. | 14,729 | | 362 | |
| | Cardinal Financial Corp. | 41,327 | | 361 | |
| | Cedar Shopping Centers Inc. | 53,098 | | 361 | |
| | Ameris Bancorp | 50,075 | | 359 | |
| | Presidential Life Corp. | 38,731 | | 354 | |
| * | Enstar Group Ltd. | 4,850 | | 354 | |
| | Getty Realty Corp. | 15,026 | | 354 | |
| * | United America | | | | |
| | Indemnity Ltd. Class A | 43,942 | | 348 | |
| | Gladstone Capital Corp. | 44,785 | | 345 | |
| * | Citizens Inc. | 52,626 | | 344 | |
| | U-Store-It Trust | 46,744 | | 342 | |
| | Republic Bancorp Inc. | | | | |
| | Class A | 16,432 | | 339 | |
| | Renasant Corp. | 24,667 | | 335 | |
| | Kearny Financial Corp. | 32,558 | | 328 | |
| | Flushing Financial Corp. | 29,062 | | 327 | |
| | Agree Realty Corp. | 14,023 | | 327 | |
| * | International Assets | | | | |
| | Holding Corp. | 22,346 | | 325 | |
| | Abington Bancorp Inc. | 47,077 | | 324 | |
| | United Fire & Casualty Co. | 17,619 | | 321 | |
| | LTC Properties Inc. | 11,775 | | 315 | |
| | ViewPoint Financial Group | 21,833 | | 315 | |
| | Capital City Bank Group Inc. | 22,509 | | 312 | |
| | Lexington Realty Trust | 51,107 | | 311 | |
| | MarketAxess Holdings Inc. | 22,227 | | 309 | |
| * | Citizens Republic | | | | |
| | Bancorp Inc. | 444,457 | | 307 | |
| * | MCG Capital Corp. | 70,444 | | 304 | |
| * | Cowen Group Inc. Class A | 51,197 | | 303 | |
| | Simmons First | | | | |
| | National Corp. Class A | 10,883 | | 303 | |
| | First Financial Holdings Inc. | 23,144 | | 301 | |
| * | Riskmetrics Group Inc. | 18,881 | | 300 | |
| * | Strategic Hotels & | | | | |
| | Resorts Inc. | 160,573 | | 299 | |
| | Oriental Financial Group Inc. | 27,644 | | 299 | |
| | | | | |
| | | | | Market | |
| | | | | Value• | |
| | | Shares | ($ | 000 | ) |
| *,^ | iStar Financial Inc. | 114,565 | | 293 | |
| | First BanCorp | 125,149 | | 288 | |
| | First Busey Corp. | 72,274 | | 281 | |
| | National Western Life | | | | |
| | Insurance Co. Class A | 1,612 | | 280 | |
| | Nelnet Inc. Class A | 16,237 | | 280 | |
| | GFI Group Inc. | 60,017 | | 274 | |
| * | Avatar Holdings Inc. | 15,983 | | 272 | |
| | Bancorp Rhode Island Inc. | 10,511 | | 270 | |
| * | Pinnacle Financial | | | | |
| | Partners Inc. | 18,936 | | 269 | |
| * | LaBranche & Co. Inc. | 94,409 | | 268 | |
| | SWS Group Inc. | 21,891 | | 265 | |
| * | FBR Capital Markets Corp. | 42,822 | | 265 | |
| | WesBanco Inc. | 21,268 | | 262 | |
| | Walter Investment | | | | |
| | Management Corp. | 18,302 | | 262 | |
| | US Global Investors Inc. | | | | |
| | Class A | 21,126 | | 260 | |
| * | Greenlight Capital Re Ltd. | | | | |
| | Class A | 10,752 | | 253 | |
| | Meadowbrook Insurance | | | | |
| | Group Inc. | 33,455 | | 248 | |
| * | TradeStation Group Inc. | 30,577 | | 241 | |
| ^ | Banner Corp. | 89,836 | | 241 | |
| | Bryn Mawr Bank Corp. | 15,734 | | 237 | |
| | BRT Realty Trust | 46,295 | | 236 | |
| | Pennsylvania Real Estate | | | | |
| | Investment Trust | 27,759 | | 235 | |
| | Compass Diversified | | | | |
| | Holdings | 18,347 | | 234 | |
| | SCBT Financial Corp. | 8,441 | | 234 | |
| | American National | | | | |
| | Bankshares Inc. | 10,649 | | 233 | |
| * | Asset Acceptance | | | | |
| | Capital Corp. | 34,066 | | 231 | |
| | Parkway Properties Inc. | 10,986 | | 229 | |
| | Heartland Financial USA Inc. | 15,845 | | 227 | |
| | First Industrial Realty | | | | |
| | Trust Inc. | 43,370 | | 227 | |
| | Alliance Financial Corp. | 8,325 | | 226 | |
| | Nara Bancorp Inc. | 19,829 | | 225 | |
| | Consolidated-Tomoka | | | | |
| | Land Co. | 6,367 | | 222 | |
| ^ | Life Partners Holdings Inc. | 10,450 | | 221 | |
| | Donegal Group Inc. Class A | 14,079 | | 219 | |
| * | National Financial | | | | |
| | Partners Corp. | 26,105 | | 211 | |
| | SY Bancorp Inc. | 9,875 | | 211 | |
| | CoBiz Financial Inc. | 44,119 | | 210 | |
| | EMC Insurance Group Inc. | 9,739 | | 209 | |
| * | Credit Acceptance Corp. | 4,960 | | 209 | |
| * | United Community Banks Inc. | 61,281 | | 208 | |
| | Clifton Savings Bancorp Inc. | 21,524 | | 202 | |
| * | PMA Capital Corp. Class A | 31,932 | | 201 | |
24
Institutional Total Stock Market Index Fund
| | | | | |
| | | | | Market | |
| | | | | Value• | |
| | | Shares | ($ | 000 | ) |
| | Flagstone Reinsurance | | | | |
| | Holdings Ltd. | 17,819 | | 195 | |
| * | Arbor Realty Trust Inc. | 96,126 | | 191 | |
| | First Merchants Corp. | 32,178 | | 191 | |
| | Stewart Information | | | | |
| | Services Corp. | 16,796 | | 189 | |
| | CompuCredit Holdings Corp. | 56,824 | | 189 | |
| | Sanders Morris | | | | |
| | Harris Group Inc. | 34,402 | | 189 | |
| | Education Realty Trust Inc. | 38,992 | | 189 | |
| | 1st Source Corp. | 11,673 | | 188 | |
| | Lakeland Financial Corp. | 10,847 | | 187 | |
| | First Potomac Realty Trust | 14,444 | | 182 | |
| * | FelCor Lodging Trust Inc. | 50,358 | | 181 | |
| | Medallion Financial Corp. | 22,087 | | 180 | |
| * | Marlin Business | | | | |
| | Services Corp. | 22,538 | | 179 | |
| * | eHealth Inc. | 10,617 | | 174 | |
| | First Bancorp | 12,323 | | 172 | |
| | Universal Health Realty | | | | |
| | Income Trust | 5,334 | | 171 | |
| * | Arlington Asset | | | | |
| | Investment Corp. | | | | |
| | Class A | 11,149 | | 170 | |
| | ESSA Bancorp Inc. | 14,509 | | 170 | |
| * | CNA Surety Corp. | 11,374 | | 169 | |
| | First Financial Corp. | 5,468 | | 167 | |
| * | Safeguard Scientifics Inc. | 15,832 | | 163 | |
| | OneBeacon Insurance | | | | |
| | Group Ltd. Class A | 11,566 | | 159 | |
| | Trico Bancshares | 9,567 | | 159 | |
| * | GLG Partners Inc. | 49,442 | | 159 | |
| | First Mercury Financial Corp. | 11,473 | | 157 | |
| | Great Southern Bancorp Inc. | 7,353 | | 157 | |
| | Maiden Holdings Ltd. | 21,319 | | 156 | |
| | First Community | | | | |
| | Bancshares Inc. | 12,944 | | 156 | |
| | Cogdell Spencer Inc. | 27,300 | | 155 | |
| * | Tejon Ranch Co. | 5,274 | | 154 | |
| | BankAtlantic Bancorp Inc. | | | | |
| | Class A | 117,578 | | 153 | |
| | PMI Group Inc. | 60,473 | | 152 | |
| | Fifth Street Finance Corp. | 14,031 | | 151 | |
| | StellarOne Corp. | 14,873 | | 148 | |
| | Center Bancorp Inc. | 16,521 | | 147 | |
| | Westfield Financial Inc. | 17,819 | | 147 | |
| | Sierra Bancorp | 19,076 | | 146 | |
| | First of Long Island Corp. | 5,666 | | 143 | |
| | Danvers Bancorp Inc. | 10,898 | | 142 | |
| * | AmeriServ Financial Inc. | 83,468 | | 139 | |
| | NYMAGIC Inc. | 8,297 | | 138 | |
| | Sun Communities Inc. | 6,804 | | 134 | |
| | Lakeland Bancorp Inc. | 20,733 | | 132 | |
| ^ | TowneBank | 11,296 | | 132 | |
| | State Auto Financial Corp. | 7,086 | | 131 | |
| | Suffolk Bancorp | 4,408 | | 131 | |
| | | | | | |
| | | | | | Market | |
| | | | | | Value• | |
| | | | Shares | ($ | 000 | ) |
| | Enterprise Financial | | | | | |
| | Services Corp. | | 16,823 | | 130 | |
| | Rewards Network Inc. | | 9,974 | | 126 | |
| | Urstadt Biddle Properties Inc. | | | | |
| | Class A | | 8,198 | | 125 | |
| | MVC Capital Inc. | | 10,560 | | 125 | |
| | Tompkins Financial Corp. | 3,024 | | 122 | |
| | Federal Agricultural | | | | | |
| | Mortgage Corp. | | 16,837 | | 118 | |
| *,^ | Cohen & Co. Inc. | | 23,178 | | 114 | |
| | Washington Trust | | | | | |
| | Bancorp Inc. | | 7,226 | | 113 | |
| | German American | | | | | |
| | Bancorp Inc. | | 6,816 | | 111 | |
| | American Physicians | | | | | |
| | Service Group Inc. | | 4,797 | | 111 | |
| *,^ | Amcore Financial Inc. | | 88,192 | | 109 | |
| | Asta Funding Inc. | | 14,455 | | 102 | |
| ^ | Capitol Bancorp Ltd. | | 52,169 | | 102 | |
| * | First Marblehead Corp. | | 46,816 | | 100 | |
| * | American Safety Insurance | | | | |
| | Holdings Ltd. | | 6,800 | | 98 | |
| | OceanFirst Financial Corp. | 8,624 | | 97 | |
| * | Western Alliance Bancorp | 25,685 | | 97 | |
| | Oritani Financial Corp. | | 6,931 | | 95 | |
| | CapLease Inc. | | 21,720 | | 95 | |
| | NorthStar Realty | | | | | |
| | Finance Corp. | | 27,684 | | 95 | |
| * | Crawford & Co. Class B | | 23,931 | | 94 | |
| ^ | Bridge Bancorp Inc. | | 3,894 | | 94 | |
| | Merchants Bancshares Inc. | 4,126 | | 93 | |
| * | American | | | | | |
| | Independence Corp. | | 20,279 | | 92 | |
| | Resource America Inc. | | | | | |
| | Class A | | 22,502 | | 91 | |
| | Century Bancorp Inc. Class A | 4,105 | | 90 | |
| * | Penson Worldwide Inc. | | 9,728 | | 88 | |
| | Gladstone Investment Corp. | 19,136 | | 87 | |
| | Univest Corp. of Pennsylvania | 4,943 | | 87 | |
| * | Guaranty Bancorp | | 65,579 | | 87 | |
| | First Defiance Financial Corp. | 7,612 | | 86 | |
| | Kite Realty Group Trust | | 20,750 | | 84 | |
| * | Reis Inc. | | 13,650 | | 84 | |
| * | Ladenburg Thalmann | | | | | |
| | Financial Services Inc. | 129,695 | | 83 | |
| | Sandy Spring Bancorp Inc. | 9,250 | | 82 | |
| * | HFF Inc. Class A | | 13,063 | | 82 | |
| | Cascade Financial Corp. | | 36,647 | | 81 | |
| | Oppenheimer Holdings Inc. | | | | |
| | Class A | | 2,406 | | 80 | |
| | Investors Title Co. | | 2,504 | | 78 | |
| * | Metro Bancorp Inc. | | 5,972 | | 75 | |
| | Student Loan Corp. | | 1,609 | | 75 | |
| * | Republic First Bancorp Inc. | 17,473 | | 75 | |
| | Financial Institutions Inc. | 6,247 | | 74 | |
| | Center Financial Corp. | | 15,249 | | 70 | |
25
Institutional Total Stock Market Index Fund
| | | | | |
| | | | | Market | |
| | | | | Value• | |
| | | Shares | ($ | 000 | ) |
| *,^ | Central Pacific Financial Corp. | 53,485 | | 70 | |
| ^ | BancTrust Financial Group Inc. | 24,403 | | 70 | |
| | WSFS Financial Corp. | 2,698 | | 69 | |
| | | |
| | Holdings Inc. | 16,500 | 67 |
| | First Financial Northwest Inc. | 10,000 | 66 |
| | Centerstate Banks Inc. | 6,471 | 65 |
| * | Gramercy Capital Corp. | 24,868 | 64 |
| * | Virtus Investment | | |
| | Partners Inc. | 4,016 | 64 |
| * | Newcastle Investment Corp. | 30,001 | 63 |
| | South Financial Group Inc. | 96,177 | 62 |
| | Pacific Capital Bancorp NA | 64,227 | 62 |
| | Mission West Properties Inc. | 8,567 | 62 |
| | CFS Bancorp Inc. | 18,970 | 61 |
| | K-Fed Bancorp | 6,943 | 61 |
| *,^ | Capital Trust Inc. Class A | 46,239 | 59 |
| * | First Acceptance Corp. | 28,851 | 56 |
| | Winthrop Realty Trust | 5,127 | 56 |
| | Union Bankshares Corp. | 4,439 | 55 |
| * | SeaBright Insurance | | |
| | Holdings Inc. | 4,633 | 53 |
| | Eastern Virginia | | |
| | Bankshares Inc. | 7,487 | 53 |
| ^ | City Bank | 30,530 | 53 |
| | Sterling Bancorp | 7,171 | 51 |
| * | Cape Bancorp Inc. | 7,560 | 51 |
| | Glimcher Realty Trust | 18,562 | 50 |
| | Bar Harbor Bankshares | 1,800 | 49 |
| | LSB Corp. | 4,999 | 49 |
| | Monmouth Real Estate | | |
| | Investment Corp. Class A | 6,436 | 48 |
| * | NewStar Financial Inc. | 12,108 | 47 |
| * | Hanmi Financial Corp. | 39,333 | 47 |
| | ESB Financial Corp. | 3,558 | 47 |
| | Ramco-Gershenson | | |
| | Properties Trust | 4,805 | 46 |
| * | Firstcity Financial Corp. | 6,000 | 45 |
| * | Meridian Interstate | | |
| | Bancorp Inc. | 4,724 | 41 |
| | First Place Financial Corp. | 14,747 | 41 |
| * | Tree.com Inc. | 4,454 | 41 |
| | Colony Bankcorp Inc. | 8,706 | 40 |
| | Wilshire Bancorp Inc. | 4,798 | 39 |
| | Comm Bancorp Inc. | 1,769 | 39 |
| | Capital Bank Corp. | 10,018 | 39 |
| | Government Properties | | |
| | Income Trust | 1,655 | 38 |
| * | Primus Guaranty Ltd. | 12,300 | 38 |
| * | Maguire Properties Inc. | 24,623 | 37 |
| ^ | W Holding Co. Inc. | 1,569 | 36 |
| * | RAIT Financial Trust | 26,606 | 35 |
| | Shore Bancshares Inc. | 2,379 | 34 |
| | Atlantic Coast Federal Corp. | 22,599 | 34 |
| | PennantPark Investment Corp. | 3,800 | 34 |
| | VIST Financial Corp. | 6,411 | 33 |
| | | | | |
| | | | | Market | |
| | | | | Value• | |
| | | Shares | ($ | 000 | ) |
| | Westwood Holdings | | | | |
| | Group Inc. | 916 | | 33 | |
| | Diamond Hill Investment | | | | |
| | Group Inc. | 512 | | 33 | |
| | First South Bancorp Inc. | 3,129 | | 32 | |
| | Cadence Financial Corp. | 18,300 | | 32 | |
| | MainSource Financial | | | | |
| | Group Inc. | 6,687 | | 32 | |
| * | Consumer Portfolio | | | | |
| | Services Inc. | 27,451 | | 31 | |
| | Hersha Hospitality Trust | 9,885 | | 31 | |
| | One Liberty Properties Inc. | 3,442 | | 30 | |
| * | Crawford & Co. Class A | 9,000 | | 30 | |
| | Ameriana Bancorp | 11,143 | | 30 | |
| | Peoples Bancorp Inc. | 3,062 | | 30 | |
| | Citizens & Northern Corp. | 3,103 | | 30 | |
| | Southwest Bancorp Inc. | 4,254 | | 30 | |
| | NGP Capital Resources Co. | 3,600 | | 29 | |
| *,^ | Anchor Bancorp | | | | |
| | Wisconsin Inc. | 46,214 | | 29 | |
| | PMC Commercial Trust | 3,875 | | 29 | |
| ^ | Old Second Bancorp Inc. | 4,202 | | 29 | |
| ^ | Cascade Bancorp | 41,579 | | 29 | |
| | Pulaski Financial Corp. | 4,191 | | 28 | |
| | Kansas City Life | | | | |
| | Insurance Co. | 900 | | 27 | |
| | UMH Properties Inc. | 3,070 | | 26 | |
| * | First Keystone Financial Inc. | 2,063 | | 24 | |
| * | Bank of Florida Corp. | 27,322 | | 22 | |
| | Heritage Financial Corp. | 1,610 | | 22 | |
| | Meta Financial Group Inc. | 1,049 | | 22 | |
| | Peapack Gladstone | | | | |
| | Financial Corp. | 1,726 | | 22 | |
| * | Grubb & Ellis Co. | 16,894 | | 22 | |
| *,^ | Sterling Financial Corp. | 32,946 | | 20 | |
| | Heritage Commerce Corp. | 5,040 | | 20 | |
| *,^ | Frontier Financial Corp. | 5,756 | | 20 | |
| * | Bancorp Inc. | 2,757 | | 19 | |
| * | NewBridge Bancorp | 8,425 | | 19 | |
| | Rome Bancorp Inc. | 2,312 | | 18 | |
| ^ | Green Bankshares Inc. | 5,147 | | 18 | |
| * | Stratus Properties Inc. | 1,599 | | 18 | |
| * | Sun Bancorp Inc. | 4,671 | | 18 | |
| | Citizens South Banking Corp. | 3,809 | | 17 | |
| | West Bancorporation Inc. | 3,478 | | 17 | |
| | Smithtown Bancorp Inc. | 2,863 | | 17 | |
| | Gladstone Commercial Corp. | 1,223 | | 16 | |
| | Camco Financial Corp. | 8,512 | | 16 | |
| * | Virginia Commerce Bancorp | 4,186 | | 16 | |
| * | Waterstone Financial Inc. | 7,200 | | 15 | |
| | North Valley Bancorp | 6,436 | | 13 | |
| | Bank of Marin Bancorp | 400 | | 13 | |
| | HopFed Bancorp Inc. | 1,305 | | 12 | |
| | Farmers Capital Bank Corp. | 1,180 | | 12 | |
| | Mercantile Bank Corp. | 4,011 | | 12 | |
| | Wainwright Bank & Trust Co. | 1,613 | | 12 | |
26
Institutional Total Stock Market Index Fund
| | | | | |
| | | | | Market | |
| | | | | Value• | |
| | | Shares | ($ | 000 | ) |
| * | Deerfield Capital Corp. | 2,543 | | 12 | |
| | TF Financial Corp. | 616 | | 12 | |
| | National Interstate Corp. | 660 | | 11 | |
| * | United Community | | | | |
| | Financial Corp. | 7,545 | | 11 | |
| | First United Corp. | 1,815 | | 11 | |
| | Resource Capital Corp. | 2,172 | | 11 | |
| | First M&F Corp. | 4,667 | | 10 | |
| | West Coast Bancorp | 4,749 | | 10 | |
| * | Macatawa Bank Corp. | 4,554 | | 10 | |
| * | Pacific Mercantile Bancorp | 3,238 | | 10 | |
| * | BCSB Bancorp Inc. | 1,195 | | 10 | |
| * | Maui Land & | | | | |
| | Pineapple Co. Inc. | 1,676 | | 9 | |
| | Premierwest Bancorp | 6,453 | | 9 | |
| * | First State Bancorporation | 19,054 | | 8 | |
| * | HMN Financial Inc. | 1,711 | | 7 | |
| | Jefferson Bancshares Inc. | 1,600 | | 7 | |
| | Seacoast Banking Corp. | | | | |
| | of Florida | 4,404 | | 7 | |
| | Firstbank Corp. | 820 | | 7 | |
| | Independent Bank Corp. | 9,627 | | 7 | |
| | Preferred Bank | 3,847 | | 7 | |
| | Federal Agricultural | | | | |
| | Mortgage Corp. Class A | 1,021 | | 7 | |
| | Provident Financial | | | | |
| | Holdings Inc. | 2,290 | | 6 | |
| | Middleburg Financial Corp. | 500 | | 6 | |
| | Codorus Valley Bancorp Inc. | 1,184 | | 6 | |
| * | Nicholas Financial Inc. | 800 | | 6 | |
| * | Unity Bancorp Inc. | 1,310 | | 5 | |
| * | Bank of Granite Corp. | 9,915 | | 5 | |
| | Northrim BanCorp Inc. | 256 | | 4 | |
| * | Superior Bancorp | 1,211 | | 4 | |
| | First Financial Service Corp. | 438 | | 4 | |
| | Wayne Savings | | | | |
| | Bancshares Inc. | 673 | | 4 | |
| * | AMV Liquidating Trust | 34,500 | | 4 | |
| | Integra Bank Corp. | 4,988 | | 4 | |
| | First Federal Bancshares | | | | |
| | of Arkansas Inc. | 1,606 | | 4 | |
| * | TierOne Corp. | 5,200 | | 4 | |
| | Peoples Financial Corp. | 166 | | 3 | |
| | Indiana Community Bancorp | 438 | | 3 | |
| | HF Financial Corp. | 347 | | 3 | |
| | Thomas Properties Group Inc. | 1,100 | | 3 | |
| | Timberland Bancorp Inc. | 706 | | 3 | |
| | MutualFirst Financial Inc. | 500 | | 3 | |
| * | Midwest Banc Holdings Inc. | 6,867 | | 2 | |
| * | Northern States Financial Corp. | 599 | | 2 | |
| | State Bancorp Inc. | 330 | | 2 | |
| * | Royal Bancshares of | | | | |
| | Pennsylvania Inc. | 1,768 | | 2 | |
| | Parkvale Financial Corp. | 316 | | 2 | |
| | FNB United Corp. | 1,696 | | 2 | |
| | | | | | |
| | | | | | Market | |
| | | | | | Value• | |
| | | | Shares | ($ | 000 | ) |
| ^ | Hampton Roads | | | | | |
| | Bankshares Inc. | | 900 | | 2 | |
| | United Security Bancshares | | 86 | | 1 | |
| | 21st Century Holding Co. | | 282 | | 1 | |
| | Princeton National | | | | | |
| | Bancorp Inc. | | 100 | | 1 | |
| | Kohlberg Capital Corp. | | 200 | | 1 | |
| * | Valley National Bancorp | | | | | |
| | Warrants Exp. 6/30/2015 | | 240 | | 1 | |
| | MetroCorp Bancshares Inc. | | 159 | | 1 | |
| * | American Realty Investors Inc. | 40 | | 1 | |
| | Brooklyn Federal Bancorp Inc. | 44 | | — | |
| * | ZipRealty Inc. | | 100 | | — | |
| | Teton Advisors Inc. Class B | | 143 | | — | |
| * | TIB Financial Corp. | | 394 | | — | |
| | | | | | 1,852,540 | |
| Health Care (12.5%) | | | | | |
| | Johnson & Johnson | 2,736,270 | | 176,243 | |
| | Pfizer Inc. | 8,006,943 | | 145,646 | |
| | Merck & Co. Inc. | 3,032,850 | | 110,820 | |
| | Abbott Laboratories | 1,535,003 | | 82,875 | |
| * | Amgen Inc. | 1,008,343 | | 57,042 | |
| | Medtronic Inc. | 1,101,712 | | 48,453 | |
| | Bristol-Myers Squibb Co. | 1,699,601 | | 42,915 | |
| * | Gilead Sciences Inc. | 897,918 | | 38,862 | |
| | Eli Lilly & Co. | 1,026,856 | | 36,669 | |
| | UnitedHealth Group Inc. | 1,153,987 | | 35,174 | |
| | Baxter International Inc. | 598,383 | | 35,113 | |
| * | Medco Health | | | | | |
| | Solutions Inc. | 470,435 | | 30,066 | |
| * | WellPoint Inc. | 471,603 | | 27,490 | |
| * | Celgene Corp. | 455,426 | | 25,358 | |
| | Covidien PLC | 498,967 | | 23,896 | |
| * | Express Scripts Inc. | 258,912 | | 22,383 | |
| * | Thermo Fisher | | | | | |
| | Scientific Inc. | 405,390 | | 19,333 | |
| | Allergan Inc. | 302,028 | | 19,031 | |
| | Becton Dickinson and Co. | 237,842 | | 18,756 | |
| | McKesson Corp. | 264,402 | | 16,525 | |
| * | Biogen Idec Inc. | 286,848 | | 15,346 | |
| | Stryker Corp. | 296,296 | | 14,924 | |
| | Aetna Inc. | 433,963 | | 13,757 | |
| * | Boston Scientific Corp. | 1,497,562 | | 13,478 | |
| * | Genzyme Corp. | 268,731 | | 13,171 | |
| * | St Jude Medical Inc. | 345,649 | | 12,713 | |
| * | Zimmer Holdings Inc. | 212,960 | | 12,588 | |
| | Cardinal Health Inc. | 358,014 | | 11,542 | |
| * | Intuitive Surgical Inc. | | 37,702 | | 11,436 | |
| * | Forest Laboratories Inc. | 299,918 | | 9,630 | |
| | CIGNA Corp. | 271,165 | | 9,564 | |
| | Quest Diagnostics Inc. | 157,052 | | 9,483 | |
| * | Life Technologies Corp. | 175,198 | | 9,151 | |
| * | Vertex Pharmaceuticals Inc. | 191,319 | | 8,198 | |
| * | Hospira Inc. | 160,158 | | 8,168 | |
27
Institutional Total Stock Market Index Fund
| | | | | |
| | | | | Market | |
| | | | | Value• | |
| | | Shares | ($ | 000 | ) |
| * | Laboratory Corp. of | | | | |
| | America Holdings | 107,697 | | 8,060 | |
| | AmerisourceBergen Corp. | | | | |
| | Class A | 295,555 | | 7,705 | |
| | CR Bard Inc. | 97,097 | | 7,564 | |
| * | Humana Inc. | 168,611 | | 7,400 | |
| * | DaVita Inc. | 103,525 | | 6,081 | |
| * | Waters Corp. | 95,182 | | 5,898 | |
| * | Varian Medical Systems Inc. | 124,684 | | 5,841 | |
| * | Cerner Corp. | 68,563 | | 5,652 | |
| * | Mylan Inc. | 303,772 | | 5,599 | |
| * | Human Genome | | | | |
| | Sciences Inc. | 179,296 | | 5,486 | |
| | DENTSPLY International Inc. | 140,223 | | 4,932 | |
| * | Edwards Lifesciences Corp. | 56,141 | | 4,876 | |
| * | Henry Schein Inc. | 89,568 | | 4,711 | |
| * | Cephalon Inc. | 74,168 | | 4,629 | |
| * | CareFusion Corp. | 179,262 | | 4,483 | |
| | Beckman Coulter Inc. | 68,104 | | 4,457 | |
| * | Alexion Pharmaceuticals Inc. | 87,537 | | 4,274 | |
| * | Millipore Corp. | 55,207 | | 3,994 | |
| * | Watson Pharmaceuticals Inc. 100,095 | | 3,965 | |
| * | ResMed Inc. | 75,312 | | 3,937 | |
| | IMS Health Inc. | 181,784 | | 3,828 | |
| * | Illumina Inc. | 123,692 | | 3,791 | |
| * | Hologic Inc. | 255,426 | | 3,704 | |
| * | Coventry Health Care Inc. | 149,131 | | 3,622 | |
| * | Mettler-Toledo | | | | |
| | International Inc. | 33,556 | | 3,523 | |
| * | Covance Inc. | 63,849 | | 3,484 | |
| * | Dendreon Corp. | 130,316 | | 3,425 | |
| * | Community Health | | | | |
| | Systems Inc. | 92,476 | | 3,292 | |
| * | Warner Chilcott PLC | | | | |
| | Class A | 112,843 | | 3,213 | |
| * | Inverness Medical | | | | |
| | Innovations Inc. | 76,031 | | 3,156 | |
| * | IDEXX Laboratories Inc. | 58,601 | | 3,132 | |
| | Perrigo Co. | 77,872 | | 3,102 | |
| * | King Pharmaceuticals Inc. | 246,961 | | 3,030 | |
| | Omnicare Inc. | 118,941 | | 2,876 | |
| * | Mednax Inc. | 46,095 | | 2,771 | |
| | Universal Health | | | | |
| | Services Inc. Class B | 90,552 | | 2,762 | |
| * | Tenet Healthcare Corp. | 477,735 | | 2,575 | |
| * | Patterson Cos. Inc. | 91,290 | | 2,554 | |
| * | Lincare Holdings Inc. | 67,630 | | 2,510 | |
| * | United Therapeutics Corp. | 47,548 | | 2,503 | |
| * | Myriad Genetics Inc. | 95,801 | | 2,500 | |
| | Pharmaceutical Product | | | | |
| | Development Inc. | 106,002 | | 2,485 | |
| * | Valeant Pharmaceuticals | | | | |
| | International | 76,909 | | 2,445 | |
| * | Health Net Inc. | 104,271 | | 2,428 | |
| | Techne Corp. | 35,399 | | 2,427 | |
| | PerkinElmer Inc. | 116,471 | | 2,398 | |
| | | | | |
| | | | | Market | |
| | | | | Value• | |
| | | Shares | ($ | 000 | ) |
| * | Endo Pharmaceuticals | | | | |
| | Holdings Inc. | 116,641 | | 2,392 | |
| * | Charles River Laboratories | | | | |
| | International Inc. | 65,993 | | 2,223 | |
| * | Gen-Probe Inc. | 50,278 | | 2,157 | |
| | Teleflex Inc. | 39,835 | | 2,147 | |
| * | VCA Antech Inc. | 84,672 | | 2,110 | |
| * | Kinetic Concepts Inc. | 53,362 | | 2,009 | |
| * | Amylin Pharmaceuticals Inc. | 141,556 | | 2,009 | |
| * | BioMarin Pharmaceutical Inc. | 100,424 | | 1,889 | |
| * | Bio-Rad Laboratories Inc. | | | | |
| | Class A | 18,957 | | 1,829 | |
| * | Health Management | | | | |
| | Associates Inc. Class A | 247,984 | | 1,803 | |
| * | OSI Pharmaceuticals Inc. | 58,005 | | 1,800 | |
| * | Onyx Pharmaceuticals Inc. | 61,188 | | 1,795 | |
| | Owens & Minor Inc. | 41,818 | | 1,795 | |
| | Cooper Cos. Inc. | 44,902 | | 1,712 | |
| * | LifePoint Hospitals Inc. | 52,044 | | 1,692 | |
| * | Healthsouth Corp. | 88,889 | | 1,668 | |
| | STERIS Corp. | 58,854 | | 1,646 | |
| | Medicis Pharmaceutical | | | | |
| | Corp. Class A | 59,459 | | 1,608 | |
| * | WellCare Health Plans Inc. | 42,175 | | 1,550 | |
| * | Thoratec Corp. | 56,931 | | 1,533 | |
| * | Emergency Medical | | | | |
| | Services Corp. Class A | 28,066 | | 1,520 | |
| * | Varian Inc. | 29,070 | | 1,498 | |
| * | Regeneron | | | | |
| | Pharmaceuticals Inc. | 61,955 | | 1,498 | |
| * | Masimo Corp. | 49,184 | | 1,496 | |
| * | Magellan Health | | | | |
| | Services Inc. | 35,422 | | 1,443 | |
| * | American Medical | | | | |
| | Systems Holdings Inc. | 74,525 | | 1,438 | |
| | Hill-Rom Holdings Inc. | 59,919 | | 1,437 | |
| * | Haemonetics Corp. | 25,750 | | 1,420 | |
| * | AMERIGROUP Corp. | 52,635 | | 1,419 | |
| * | Immucor Inc. | 70,057 | | 1,418 | |
| * | Salix Pharmaceuticals Ltd. | 55,211 | | 1,402 | |
| * | Auxilium Pharmaceuticals Inc. | 46,033 | | 1,380 | |
| * | Catalyst Health Solutions Inc. | 37,461 | | 1,366 | |
| *,^ | Amedisys Inc. | 27,583 | | 1,339 | |
| * | PSS World Medical Inc. | 59,274 | | 1,338 | |
| * | Allscripts-Misys Healthcare | | | | |
| | Solutions Inc. | 65,040 | | 1,316 | |
| * | Dionex Corp. | 17,686 | | 1,306 | |
| * | Brookdale Senior Living Inc. | 71,693 | | 1,304 | |
| | West Pharmaceutical | | | | |
| | Services Inc. | 33,070 | | 1,296 | |
| * | HMS Holdings Corp. | 26,131 | | 1,272 | |
| * | NuVasive Inc. | 38,032 | | 1,216 | |
| | Quality Systems Inc. | 18,483 | | 1,161 | |
| * | Sirona Dental Systems Inc. | 36,078 | | 1,145 | |
| * | Psychiatric Solutions Inc. | 53,855 | | 1,139 | |
| * | Cubist Pharmaceuticals Inc. | 58,098 | | 1,102 | |
28
Institutional Total Stock Market Index Fund
| | | | | |
| | | | | Market | |
| | | | | Value• | |
| | | Shares | ($ | 000 | ) |
| | Chemed Corp. | 22,886 | | 1,098 | |
| * | Medivation Inc. | 28,277 | | 1,065 | |
| * | Isis Pharmaceuticals Inc. | 93,881 | | 1,042 | |
| * | Eclipsys Corp. | 56,114 | | 1,039 | |
| * | Align Technology Inc. | 57,235 | | 1,020 | |
| * | athenahealth Inc. | 22,042 | | 997 | |
| * | Centene Corp. | 45,863 | | 971 | |
| * | Incyte Corp. Ltd. | 105,153 | | 958 | |
| * | Acorda Therapeutics Inc. | 37,923 | | 956 | |
| | Invacare Corp. | 38,322 | | 956 | |
| * | Par Pharmaceutical Cos. Inc. | 35,265 | | 954 | |
| * | Cepheid Inc. | 76,330 | | 953 | |
| * | Exelixis Inc. | 128,261 | | 945 | |
| * | Conmed Corp. | 40,940 | | 933 | |
| * | ev3 Inc. | 68,085 | | 908 | |
| * | AMAG Pharmaceuticals Inc. | 23,878 | | 908 | |
| * | Savient Pharmaceuticals Inc. | 66,231 | | 901 | |
| * | Alkermes Inc. | 94,454 | | 889 | |
| * | Alnylam Pharmaceuticals Inc. | 49,659 | | 875 | |
| * | Healthspring Inc. | 49,664 | | 875 | |
| | Meridian Bioscience Inc. | 40,583 | | 875 | |
| * | Nektar Therapeutics | 93,044 | | 867 | |
| * | Seattle Genetics Inc. | 83,996 | | 853 | |
| * | Gentiva Health Servi ces Inc. | 30,961 | | 836 | |
| * | Volcano Corp. | 47,658 | | 828 | |
| | PDL BioPharma Inc. | 119,885 | | 822 | |
| * | Parexel International Corp. | 58,154 | | 820 | |
| * | Cyberonics Inc. | 40,075 | | 819 | |
| * | Celera Corp. | 118,340 | | 818 | |
| * | Conceptus Inc. | 43,126 | | 809 | |
| * | Wright Medical Group Inc. | 40,970 | | 776 | |
| * | Abaxis Inc. | 30,112 | | 769 | |
| * | Allos Therapeutics Inc. | 116,081 | | 763 | |
| | Analogic Corp. | 19,752 | | 761 | |
| *,^ | Enzon Pharmaceuticals Inc. | 69,718 | | 734 | |
| * | Bio-Reference Labs Inc. | 18,612 | | 729 | |
| * | Cell Therapeutics Inc. | 637,779 | | 727 | |
| * | Integra LifeSciences | | | | |
| | Holdings Corp. | 19,324 | | 711 | |
| * | Amsurg Corp. Class A | 32,222 | | 710 | |
| * | Geron Corp. | 126,007 | | 699 | |
| * | Vivus Inc. | 76,081 | | 699 | |
| * | Martek Biosciences Corp. | 36,739 | | 696 | |
| * | Theravance Inc. | 51,754 | | 676 | |
| | Computer Programs & | | | | |
| | Systems Inc. | 14,526 | | 669 | |
| * | Healthways Inc. | 35,638 | | 654 | |
| * | Affymax Inc. | 26,268 | | 650 | |
| * | Natus Medical Inc. | 43,833 | | 648 | |
| * | Phase Forward Inc. | 40,989 | | 629 | |
| * | Kindred Healthcare Inc. | 34,073 | | 629 | |
| * | Viropharma Inc. | 71,669 | | 601 | |
| * | Halozyme Therapeutics Inc. | 101,188 | | 594 | |
| * | Air Methods Corp. | 17,155 | | 577 | |
| * | MedAssets Inc. | 26,654 | | 565 | |
| * | BioScrip Inc. | 67,312 | | 563 | |
| | | | | |
| | | | | Market | |
| | | | | Value• | |
| | | Shares | ($ | 000 | ) |
| * | Affymetrix Inc. | 95,466 | | 558 | |
| * | Impax Laboratories Inc. | 40,875 | | 556 | |
| * | Luminex Corp. | 37,110 | | 554 | |
| | Landauer Inc. | 8,804 | | 541 | |
| * | AMN Healthcare | | | | |
| | Services Inc. | 59,586 | | 540 | |
| *,^ | MannKind Corp. | 61,340 | | 537 | |
| * | Bruker Corp. | 44,520 | | 537 | |
| * | ABIOMED Inc. | 61,333 | | 536 | |
| * | Arena Pharmaceuticals Inc. | 150,899 | | 536 | |
| * | Medicines Co. | 63,007 | | 526 | |
| * | Assisted Living | | | | |
| | Concepts Inc. Class A | 19,727 | | 520 | |
| * | Cantel Medical Corp. | 25,669 | | 518 | |
| * | Genomic Health Inc. | 25,889 | | 506 | |
| * | AMICAS Inc. | 91,649 | | 499 | |
| * | InterMune Inc. | 37,402 | | 488 | |
| * | RehabCare Group Inc. | 16,015 | | 487 | |
| * | Emeritus Corp. | 25,927 | | 486 | |
| * | Merit Medical Systems Inc. | 25,133 | | 485 | |
| * | Almost Family Inc. | 12,240 | | 484 | |
| * | Momenta | | | | |
| | Pharmaceuticals Inc. | 38,342 | | 484 | |
| * | Clinical Data Inc. | 26,300 | | 480 | |
| * | Immunogen Inc. | 59,965 | | 471 | |
| * | Corvel Corp. | 14,041 | | 471 | |
| * | PharMerica Corp. | 29,556 | | 469 | |
| * | Ariad Pharmaceuticals Inc. | 205,447 | | 468 | |
| * | Hanger Orthopedic | | | | |
| | Group Inc. | 33,845 | | 468 | |
| * | Cadence | | | | |
| | Pharmaceuticals Inc. | 47,971 | | 464 | |
| * | XenoPort Inc. | 24,550 | | 456 | |
| * | Greatbatch Inc. | 23,353 | | 449 | |
| * | Curis Inc. | 137,305 | | 446 | |
| * | American Dental | | | | |
| | Partners Inc. | 34,134 | | 440 | |
| *,^ | BioCryst | | | | |
| | Pharmaceuticals Inc. | 68,034 | | 440 | |
| * | Cross Country | | | | |
| | Healthcare Inc. | 43,804 | | 434 | |
| * | ICU Medical Inc. | 11,836 | | 431 | |
| * | Emergent Biosolution s Inc. | 31,678 | | 431 | |
| * | Orthofix International NV | 13,889 | | 430 | |
| * | Facet Biotech Corp. | 24,208 | | 426 | |
| * | Accuray Inc. | 74,837 | | 420 | |
| * | Universal American Corp. | 34,737 | | 406 | |
| * | ATS Medical Inc. | 125,131 | | 404 | |
| * | inVentiv Health Inc. | 24,020 | | 388 | |
| * | Array Biopharma Inc. | 137,494 | | 386 | |
| * | Alphatec Holdings Inc. | 70,472 | | 376 | |
| * | Allied Healthcare | | | | |
| | International Inc. | 127,012 | | 370 | |
| * | Akorn Inc. | 205,127 | | 367 | |
| * | AVANIR | | | | |
| | Pharmaceuticals Inc. | 191,215 | | 363 | |

Institutional Total Stock Market Index Fund
| | | | | |
| | | | | Market | |
| | | | | Value• | |
| | | Shares | ($ | 000 | ) |
| | Atrion Corp. | 2,308 | | 359 | |
| * | Albany Molecular | | | | |
| | Research Inc. | 39,452 | | 358 | |
| * | Abraxis Bioscience Inc. | 8,353 | | 339 | |
| * | Kensey Nash Corp. | 13,231 | | 337 | |
| * | LHC Group Inc. | 9,997 | | 336 | |
| *,^ | AVI BioPharma Inc. | 229,679 | | 335 | |
| * | CryoLife Inc. | 52,153 | | 335 | |
| * | Rigel Pharmaceuticals Inc. | 34,789 | | 331 | |
| * | Cypress Bioscience Inc. | 57,335 | | 330 | |
| * | Zoll Medical Corp. | 12,185 | | 326 | |
| * | Inspire Pharmaceuticals Inc. | 56,736 | | 313 | |
| * | Exactech Inc. | 17,833 | | 309 | |
| * | Capital Senior Living Corp. | 61,232 | | 307 | |
| * | SurModics Inc. | 13,410 | | 304 | |
| * | Anika Therapeutics Inc. | 39,233 | | 299 | |
| * | Alliance HealthCare | | | | |
| | Services Inc. | 52,420 | | 299 | |
| * | Neogen Corp. | 12,588 | | 297 | |
| * | Genoptix Inc. | 8,344 | | 296 | |
| * | Anadys Pharmaceuticals Inc. | 134,872 | | 285 | |
| | America Service Grou p Inc. | 17,781 | | 282 | |
| * | Questcor | | | | |
| | Pharmaceuticals Inc. | 59,339 | | 282 | |
| * | Depomed Inc. | 82,966 | | 278 | |
| * | Arqule Inc. | 74,924 | | 276 | |
| * | Continucare Corp. | 63,099 | | 276 | |
| * | eResearchTechnology Inc. | 44,910 | | 270 | |
| * | Quidel Corp. | 19,515 | | 269 | |
| * | Odyssey HealthCare Inc. | 17,024 | | 265 | |
| * | Cerus Corp. | 131,438 | | 262 | |
| * | Accelrys Inc. | 45,418 | | 260 | |
| * | Pharmasset Inc. | 12,410 | | 257 | |
| * | KV Pharmaceutical Co. | | | | |
| | Class A | 69,948 | | 257 | |
| * | Cutera Inc. | 29,629 | | 252 | |
| * | Sequenom Inc. | 55,150 | | 228 | |
| * | MWI Veterinary Supply Inc. | 5,979 | | 225 | |
| * | Dyax Corp. | 66,289 | | 225 | |
| * | Zymogenetics Inc. | 34,713 | | 222 | |
| * | Durect Corp. | 87,225 | | 215 | |
| * | Medical Action Industries Inc. | 13,400 | | 215 | |
| * | IPC The Hospitalist Co. Inc. | 6,324 | | 210 | |
| * | Five Star Quality Care Inc. | 59,524 | | 207 | |
| * | Cynosure Inc. Class A | 17,900 | | 206 | |
| * | DexCom Inc. | 25,208 | | 204 | |
| * | Molina Healthcare Inc. | 8,837 | | 202 | |
| * | Symmetry Medical Inc. | 25,069 | | 202 | |
| * | SonoSite Inc. | 8,482 | | 200 | |
| * | Insulet Corp. | 14,000 | | 200 | |
| * | Sun Healthcare Group Inc. | 21,255 | | 195 | |
| * | Candela Corp. | 60,532 | | 183 | |
| * | Allion Healthcare Inc. | 27,890 | | 183 | |
| * | Targacept Inc. | 8,620 | | 180 | |
| * | Ligand Pharmaceuticals Inc. | | | | |
| | Class B | 82,454 | | 179 | |
| | | | | |
| | | | | Market | |
| | | | | Value• | |
| | | Shares | ($ | 000 | ) |
| * | Omnicell Inc. | 15,060 | | 176 | |
| * | Cytokinetics Inc. | 60,413 | | 176 | |
| * | BioMimetic Therapeutics Inc. | 14,542 | | 174 | |
| * | Optimer Pharmaceuticals Inc. | 15,349 | | 173 | |
| | National Healthcare Corp. | 4,638 | | 168 | |
| * | Biodel Inc. | 38,126 | | 165 | |
| *,^ | Discovery Laboratories Inc. | 259,554 | | 163 | |
| * | Adolor Corp. | 111,517 | | 163 | |
| * | Endologix Inc. | 30,806 | | 163 | |
| * | Pain Therapeutics Inc. | 29,876 | | 160 | |
| *,^ | GTx Inc. | 38,110 | | 160 | |
| * | OraSure Technologies Inc. | 31,409 | | 160 | |
| * | Celldex Therapeutics Inc. | 34,038 | | 159 | |
| * | Res-Care Inc. | 13,626 | | 153 | |
| * | Immunomedics Inc. | 47,045 | | 151 | |
| * | Antigenics Inc. | 235,293 | | 151 | |
| * | Caliper Life Sciences Inc. | 58,415 | | 150 | |
| * | Alexza Pharmaceuticals Inc. | 60,905 | | 146 | |
| * | BMP Sunstone Corp. | 25,593 | | 146 | |
| * | Caraco Pharmaceutical | | | | |
| | Laboratories Ltd. | 24,070 | | 145 | |
| * | Triple-S Management Corp. | | | | |
| | Class B | 8,176 | | 144 | |
| * | BioClinica Inc. | 33,629 | | 143 | |
| * | IRIS International Inc. | 11,438 | | 141 | |
| * | Nabi Biopharmaceuticals | 28,374 | | 139 | |
| * | Columbia Laboratories Inc. | 126,396 | | 137 | |
| * | Acadia Pharmaceuticals Inc. | 101,568 | | 134 | |
| * | Palomar Medical | | | | |
| | Technologies Inc. | 13,230 | | 133 | |
| * | NPS Pharmaceuticals Inc. | 38,805 | | 132 | |
| * | Opko Health Inc. | 69,547 | | 127 | |
| * | US Physical Therapy Inc. | 7,364 | | 125 | |
| * | Angiodynamics Inc. | 7,692 | | 124 | |
| * | Protalix BioTherapeutics Inc. | 18,675 | | 124 | |
| * | Merge Healthcare Inc. | 35,735 | | 120 | |
| * | Novavax Inc. | 44,611 | | 119 | |
| * | Pozen Inc. | 19,561 | | 117 | |
| * | Micromet Inc. | 17,349 | | 116 | |
| * | Harvard Bioscience Inc. | 32,348 | | 116 | |
| * | Chelsea Therapeutics | | | | |
| | International Inc. | 41,466 | | 112 | |
| * | Biolase Technology Inc. | 57,602 | | 109 | |
| * | Myriad Pharmaceuticals Inc. | 21,508 | | 108 | |
| * | Clarient Inc. | 39,851 | | 106 | |
| * | Cambrex Corp. | 18,866 | | 105 | |
| * | Maxygen Inc. | 17,251 | | 105 | |
| * | Kendle International Inc. | 5,707 | | 105 | |
| * | GenVec Inc. | 86,742 | | 104 | |
| * | CytRx Corp. | 91,582 | | 103 | |
| * | Sunrise Senior Living Inc. | 31,787 | | 102 | |
| * | LCA-Vision Inc. | 19,487 | | 100 | |
| * | Orthovita Inc. | 28,262 | | 99 | |
| * | Spectranetics Corp. | 14,143 | | 98 | |
| * | Medcath Corp. | 12,390 | | 98 | |
| * | Rochester Medical Corp. | 8,732 | | 97 | |
30
Institutional Total Stock Market Index Fund
| | | | | |
| | | | | Market | |
| | | | | Value• | |
| | | Shares | ($ | 000 | ) |
| * | Idenix Pharmaceuticals Inc. | 42,528 | | 91 | |
| * | Vital Images Inc. | 7,125 | | 90 | |
| * | Bovie Medical Corp. | 11,000 | | 86 | |
| * | Matrixx Initiatives Inc. | 19,418 | | 82 | |
| * | Insmed Inc. | 104,650 | | 81 | |
| * | Enzo Biochem Inc. | 14,711 | | 79 | |
| * | RTI Biologics Inc. | 20,090 | | 77 | |
| * | Progenics | | | | |
| | Pharmaceuticals Inc. | 17,277 | | 77 | |
| * | BioSphere Medical Inc. | 27,491 | | 75 | |
| * | Providence Service Corp. | 4,531 | | 72 | |
| * | Nighthawk Radiology | | | | |
| | Holdings Inc. | 15,154 | | 69 | |
| * | PDI Inc. | 13,965 | | 67 | |
| * | Corcept Therapeutics Inc. | 23,958 | | 67 | |
| * | Icad Inc. | 42,953 | | 65 | |
| * | Aastrom Biosciences Inc. | 204,553 | | 63 | |
| * | Sangamo Biosciences Inc. | 9,647 | | 57 | |
| * | Cardiac Science Corp. | 25,269 | | 56 | |
| *,^ | Cytori Therapeutics Inc. | 9,200 | | 56 | |
| * | Idera Pharmaceuticals Inc. | 10,285 | | 53 | |
| * | HealthTronics Inc. | 19,398 | | 51 | |
| * | Osiris Therapeutics Inc. | 7,100 | | 51 | |
| * | Hi-Tech Pharmacal Co. Inc. | 1,800 | | 51 | |
| * | Animal Health | | | | |
| | International Inc. | 20,454 | | 49 | |
| * | Ardea Biosciences Inc. | 3,492 | | 49 | |
| * | ADVENTRX | | | | |
| | Pharmaceuticals Inc. | 137,900 | | 48 | |
| * | Vanda Pharmaceuticals Inc. | 4,252 | | 48 | |
| * | Vascular Solutions Inc. | 5,686 | | 48 | |
| * | ISTA Pharmaceuticals Inc. | 9,776 | | 45 | |
| * | Hooper Holmes Inc. | 42,124 | | 44 | |
| * | Lexicon Pharmaceuticals Inc. | 25,762 | | 44 | |
| * | Neurocrine Biosciences Inc. | 15,959 | | 43 | |
| * | Santarus Inc. | 9,196 | | 43 | |
| * | National Dentex Corp. | 3,944 | | 40 | |
| * | SuperGen Inc. | 14,785 | | 39 | |
| * | Rural/Metro Corp. | 6,345 | | 38 | |
| *,^ | Hemispherx Biopharma Inc. | 65,582 | | 37 | |
| * | Penwest Pharmaceuticals Co. | 13,587 | | 35 | |
| * | Staar Surgical Co. | 11,213 | | 35 | |
| *,^ | Biosante Pharmaceuticals Inc. | 23,828 | | 35 | |
| | Psychemedics Corp. | 4,628 | | 34 | |
| * | MiddleBrook | | | | |
| | Pharmaceuticals Inc. | 66,191 | | 34 | |
| * | Metabolix Inc. | 3,000 | | 33 | |
| * | Stereotaxis Inc. | 8,300 | | 33 | |
| | Ensign Group Inc. | 2,100 | | 32 | |
| * | Infinity Pharmaceuticals Inc. | 5,218 | | 32 | |
| * | Somanetics Corp. | 1,801 | | 32 | |
| * | American Caresource | | | | |
| | Holdings Inc. | 12,800 | | 31 | |
| * | Sciclone | | | | |
| | Pharmaceuticals Inc. | 13,095 | | 31 | |
| | | | | |
| | | | | Market | |
| | | | | Value• | |
| | | Shares | ($ | 000 | ) |
| * | Spectrum | | | | |
| | Pharmaceuticals Inc. | 6,800 | | 30 | |
| * | CPEX Pharmaceuticals Inc. | 2,615 | | 30 | |
| * | Micrus Endovascular Corp. | 1,927 | | 29 | |
| * | MAKO Surgical Corp. | 2,600 | | 29 | |
| * | Osteotech Inc. | 8,935 | | 29 | |
| * | Peregrine | | | | |
| | Pharmaceuticals Inc. | 9,467 | | 28 | |
| * | Arrowhead Research Corp. | 52,360 | | 28 | |
| * | Digirad Corp. | 13,188 | | 28 | |
| * | Synovis Life Technologies Inc. | 2,100 | | 27 | |
| * | CardioNet Inc. | 4,400 | | 26 | |
| * | Vical Inc. | 7,842 | | 26 | |
| * | Transcend Services Inc. | 1,200 | | 26 | |
| * | Chindex International Inc. | 1,800 | | 25 | |
| * | Hansen Medical Inc. | 8,149 | | 25 | |
| * | Theragenics Corp. | 18,231 | | 24 | |
| * | TomoTherapy Inc. | 6,200 | | 24 | |
| * | Orexigen Therapeutic s Inc. | 3,200 | | 24 | |
| * | Repligen Corp. | 5,551 | | 23 | |
| * | Pharmacyclics Inc. | 7,259 | | 23 | |
| * | StemCells Inc. | 17,974 | | 23 | |
| * | Skilled Healthcare Group Inc. | 3,000 | | 22 | |
| * | ThermoGenesis Corp. | 37,607 | | 22 | |
| * | AtriCure Inc. | 3,400 | | 21 | |
| * | XOMA Ltd. | 28,554 | | 20 | |
| * | SIGA Technologies Inc. | 3,397 | | 20 | |
| * | Entremed Inc. | 23,118 | | 19 | |
| * | Telik Inc. | 21,589 | | 17 | |
| * | Mediware Information | | | | |
| | Systems | 2,170 | | 15 | |
| | Trimeris Inc. | 5,826 | | 15 | |
| * | OXiGENE Inc. | 11,910 | | 14 | |
| * | ARCA Biopharma Inc. | 3,931 | | 13 | |
| * | Javelin Pharmaceuticals Inc. | 9,800 | | 13 | |
| * | Orthologic Corp. | 14,989 | | 11 | |
| * | Orchid Cellmark Inc. | 6,213 | | 11 | |
| * | Dynavax Technologies Corp. | 7,379 | | 11 | |
| * | NMT Medical Inc. | 3,896 | | 10 | |
| | Young Innovations Inc. | 377 | | 9 | |
| * | Metropolitan Health | | | | |
| | Networks Inc. | 4,186 | | 8 | |
| * | RXi Pharmaceuticals Corp. | 1,626 | | 7 | |
| * | BioForm Medical Inc. | 2,150 | | 7 | |
| * | OTIX Global Inc. | 8,644 | | 7 | |
| * | RadNet Inc. | 2,600 | | 5 | |
| * | IVAX Diagnostics Inc. | 10,266 | | 5 | |
| * | Strategic Diagnostics Inc. | 3,632 | | 5 | |
| * | Dialysis Corp. Of America | 665 | | 5 | |
| * | Cardica Inc. | 2,775 | | 3 | |
| * | NovaMed Inc. | 620 | | 2 | |
| * | EpiCept Corp. | 3,977 | | 2 | |
| * | Interleukin Genetics Inc. | 2,262 | | 2 | |
| * | Combinatorx Inc. | 2,231 | | 2 | |
| * | Heska Corp. | 2,582 | | 1 | |
31
Institutional Total Stock Market Index Fund
| | | | | | |
| | | | | | Market | |
| | | | | | Value• | |
| | | | Shares | ($ | 000 | ) |
| * | GTC Biotherapeutics Inc. | 1,272 | | 1 | |
| * | Quigley Corp. | | 400 | | 1 | |
| | | | | | 1,533,053 | |
| Industrials (10.9%) | | | | | |
| | General Electric Co. | 10,549,427 | | 159,613 | |
| | United Technologies Corp. | 887,715 | | 61,616 | |
| | 3M Co. | | 658,610 | | 54,447 | |
| | United Parcel Service Inc. | | | | |
| | Class B | | 697,352 | | 40,007 | |
| | Boeing Co. | | 685,235 | | 37,092 | |
| | Caterpillar Inc. | | 616,786 | | 35,151 | |
| | Burlington Northern | | | | | |
| | Santa Fe Corp. | | 337,600 | | 33,294 | |
| | Union Pacific Corp. | | 500,802 | | 32,001 | |
| | Emerson Electric Co. | | 746,313 | | 31,793 | |
| | Honeywell International Inc. | 709,289 | | 27,804 | |
| | FedEx Corp. | | 294,720 | | 24,594 | |
| | Lockheed Martin Corp. | 324,394 | | 24,443 | |
| | Deere & Co. | | 420,017 | | 22,719 | |
| | General Dynamics Corp. | 324,946 | | 22,152 | |
| | Danaher Corp. | | 269,809 | | 20,290 | |
| | Illinois Tool Works Inc. | 422,278 | | 20,265 | |
| | Raytheon Co. | | 386,717 | | 19,924 | |
| | Norfolk Southern Corp. | 364,966 | | 19,131 | |
| | CSX Corp. | | 389,349 | | 18,880 | |
| | Tyco International Ltd. | 470,914 | | 16,802 | |
| | Northrop Grumman Corp. | 300,174 | | 16,765 | |
| | Waste Management Inc. | 465,008 | | 15,722 | |
| | Precision Castparts Corp. | 139,362 | | 15,379 | |
| | PACCAR Inc. | | 343,015 | | 12,441 | |
| | Ingersoll-Rand PLC | | 317,323 | | 11,341 | |
| | Republic Services Inc. | | | | |
| | Class A | | 376,847 | | 10,669 | |
| | L-3 Communications | | | | | |
| | Holdings Inc. | | 115,887 | | 10,076 | |
| | Eaton Corp. | | 156,443 | | 9,953 | |
| | CH Robinson | | | | | |
| | Worldwide Inc. | | 167,329 | | 9,827 | |
| * | Delta Air Lines Inc. | | 772,947 | | 8,796 | |
| | Cummins Inc. | | 190,608 | | 8,741 | |
| | Rockwell Collins Inc. | | 156,558 | | 8,667 | |
| | Parker Hannifin Corp. | | 159,649 | | 8,602 | |
| | ITT Corp. | | 172,309 | | 8,571 | |
| | Southwest Airlines Co. | 737,159 | | 8,426 | |
| | Fluor Corp. | | 178,937 | | 8,059 | |
| | Goodrich Corp. | | 123,374 | | 7,927 | |
| | Dover Corp. | | 185,176 | | 7,705 | |
| | Expeditors International | | | | |
| | of Washington Inc. | | 210,762 | | 7,320 | |
| | Cooper Industries PLC | 165,715 | | 7,066 | |
| | Rockwell Automation Inc. | 141,279 | | 6,637 | |
| *,^ | First Solar Inc. | | 46,367 | | 6,278 | |
| | WW Grainger Inc. | | 62,182 | | 6,021 | |
| | Fastenal Co. | | 132,777 | | 5,529 | |
| * | McDermott International Inc. | 228,797 | | 5,493 | |
| | | | | |
| | | | | Market | |
| | | | | Value• | |
| | | Shares | ($ | 000 | ) |
| | Flowserve Corp. | 55,731 | | 5,268 | |
| | Joy Global Inc. | 101,622 | | 5,243 | |
| | Textron Inc. | 269,176 | | 5,063 | |
| | Masco Corp. | 358,075 | | 4,945 | |
| | Roper Industries Inc. | 90,363 | | 4,732 | |
| | Pitney Bowes Inc. | 206,094 | | 4,691 | |
| * | Jacobs Engineering | | | | |
| | Group Inc. | 123,503 | | 4,645 | |
| | RR Donnelley & Sons Co. | 204,000 | | 4,543 | |
| * | Stericycle Inc. | 80,460 | | 4,439 | |
| | Dun & Bradstreet Corp. | 52,606 | | 4,438 | |
| | Manpower Inc. | 77,921 | | 4,253 | |
| | Pall Corp. | 117,189 | | 4,242 | |
| | Bucyrus International Inc. | | | | |
| | Class A | 74,709 | | 4,211 | |
| * | Iron Mountain Inc. | 181,693 | | 4,135 | |
| * | Quanta Services Inc. | 196,673 | | 4,099 | |
| | AMETEK Inc. | 106,896 | | 4,088 | |
| | Equifax Inc. | 125,651 | | 3,881 | |
| | Robert Half | | | | |
| | International Inc. | 143,645 | | 3,840 | |
| * | URS Corp. | 83,905 | | 3,735 | |
| * | Foster Wheeler AG | 125,836 | | 3,705 | |
| | Avery Dennison Corp. | 100,959 | | 3,684 | |
| | Stanley Works | 71,165 | | 3,666 | |
| | Cintas Corp. | 136,786 | | 3,563 | |
| | Oshkosh Corp. | 87,123 | | 3,226 | |
| * | Kansas City Southern | 95,643 | | 3,184 | |
| | Donaldson Co. Inc. | 73,048 | | 3,107 | |
| | KBR Inc. | 159,295 | | 3,027 | |
| | Pentair Inc. | 92,987 | | 3,003 | |
| * | AGCO Corp. | 92,150 | | 2,980 | |
| * | Alliant Techsystems Inc. | 32,731 | | 2,889 | |
| | JB Hunt Transport | | | | |
| | Services Inc. | 88,462 | | 2,855 | |
| * | Corrections Corp. | | | | |
| | of America | 114,884 | | 2,820 | |
| * | IHS Inc. Class A | 50,234 | | 2,753 | |
| * | Verisk Analytics Inc. Class A | 90,300 | | 2,734 | |
| | SPX Corp. | 48,783 | | 2,668 | |
| * | Waste Connections Inc. | 79,824 | | 2,661 | |
| * | Copart Inc. | 71,089 | | 2,604 | |
| | Harsco Corp. | 80,072 | | 2,581 | |
| * | AMR Corp. | 329,320 | | 2,546 | |
| | IDEX Corp. | 80,160 | | 2,497 | |
| * | Continental Airlines Inc. | | | | |
| | Class B | 138,202 | | 2,477 | |
| * | Navistar International Corp. | 63,311 | | 2,447 | |
| | Hubbell Inc. Class B | 51,568 | | 2,439 | |
| * | FTI Consulting Inc. | 51,685 | | 2,437 | |
| | Snap-On Inc. | 57,557 | | 2,432 | |
| * | Aecom Technology Corp. | 88,107 | | 2,423 | |
| * | Shaw Group Inc. | 83,317 | | 2,395 | |
| | Ryder System Inc. | 55,855 | | 2,300 | |
| | Lincoln Electric Holdings Inc. | 42,551 | | 2,275 | |
32
Institutional Total Stock Market Index Fund
| | | | | |
| | | | | Market | |
| | | | | Value• | |
| | | Shares | ($ | 000 | ) |
| * | BE Aerospace Inc. | 96,351 | | 2,264 | |
| * | Covanta Holding Corp. | 123,788 | | 2,239 | |
| | Gardner Denver Inc. | 51,913 | | 2,209 | |
| * | Hertz Global Holdings Inc. | 183,646 | | 2,189 | |
| * | UAL Corp. | 166,980 | | 2,156 | |
| * | Terex Corp. | 107,899 | | 2,137 | |
| | Carlisle Cos. Inc. | 61,423 | | 2,104 | |
| | Kennametal Inc. | 81,052 | | 2,101 | |
| * | Monster Worldwide Inc. | 120,196 | | 2,091 | |
| * | Spirit Aerosystems | | | | |
| | Holdings Inc. Class A | 104,625 | | 2,078 | |
| | MSC Industrial Direct Co. | | | | |
| | Class A | 43,928 | | 2,065 | |
| | Towers Watson & Co. | | | | |
| | Class A | 42,584 | | 2,024 | |
| | Landstar System Inc. | 51,433 | | 1,994 | |
| * | Owens Corning | 76,825 | | 1,970 | |
| | Timken Co. | 82,498 | | 1,956 | |
| * | Thomas & Betts Corp. | 52,484 | | 1,878 | |
| * | GrafTech International Ltd. | 120,365 | | 1,872 | |
| | Regal-Beloit Corp. | 35,866 | | 1,863 | |
| | Nordson Corp. | 30,347 | | 1,857 | |
| | TransDigm Group Inc. | 38,800 | | 1,843 | |
| | Wabtec Corp. | 45,042 | | 1,839 | |
| | Lennox International Inc. | 47,115 | | 1,839 | |
| * | Kirby Corp. | 51,291 | | 1,786 | |
| * | EMCOR Group Inc. | 66,148 | | 1,779 | |
| | Con-way Inc. | 49,164 | | 1,716 | |
| | Graco Inc. | 60,008 | | 1,714 | |
| * | American | | | | |
| | Superconductor Corp. | 41,690 | | 1,705 | |
| | CLARCOR Inc. | 51,045 | | 1,656 | |
| * | Tetra Tech Inc. | 60,248 | | 1,637 | |
| | Woodward Governor Co. | 60,765 | | 1,566 | |
| | Acuity Brands Inc. | 43,296 | | 1,543 | |
| * | General Cable Corp. | 52,056 | | 1,531 | |
| | Toro Co. | 35,674 | | 1,492 | |
| | Brady Corp. Class A | 48,486 | | 1,455 | |
| | Valmont Industries Inc. | 18,478 | | 1,450 | |
| | Crane Co. | 46,621 | | 1,428 | |
| | Curtiss-Wright Corp. | 45,473 | | 1,424 | |
| | Alexander & Baldwin Inc. | 40,851 | | 1,398 | |
| * | Clean Harbors Inc. | 23,429 | | 1,397 | |
| | Trinity Industries Inc. | 79,219 | | 1,382 | |
| | Watsco Inc. | 27,995 | | 1,371 | |
| | UTi Worldwide Inc. | 94,699 | | 1,356 | |
| * | United Stationers Inc. | 23,584 | | 1,341 | |
| * | Avis Budget Group Inc. | 101,312 | | 1,329 | |
| | GATX Corp. | 46,132 | | 1,326 | |
| * | JetBlue Airways Corp. | 241,071 | | 1,314 | |
| * | Teledyne Technologies Inc. | 34,135 | | 1,309 | |
| | Manitowoc Co. Inc. | 131,023 | | 1,306 | |
| *,^ | SunPower Corp. Class A | 55,070 | | 1,304 | |
| * | MPS Group Inc. | 93,209 | | 1,281 | |
| | Baldor Electric Co. | 44,626 | | 1,254 | |
| | | | | |
| | | | | Market | |
| | | | | Value• | |
| | | Shares | ($ | 000 | ) |
| * | Genesee & Wyoming Inc. | | | | |
| | Class A | 38,353 | | 1,252 | |
| * | Hexcel Corp. | 96,405 | | 1,251 | |
| | Actuant Corp. Class A | 67,082 | | 1,243 | |
| * | Esterline Technologies Corp. | 29,982 | | 1,222 | |
| * | Alaska Air Group Inc. | 35,313 | | 1,220 | |
| | Knight Transportation Inc. | 62,239 | | 1,201 | |
| * | Moog Inc. Class A | 40,976 | | 1,198 | |
| | Granite Construction Inc. | 35,191 | | 1,185 | |
| | Kaydon Corp. | 33,108 | | 1,184 | |
| * | Geo Group Inc. | 51,173 | | 1,120 | |
| * | WESCO International Inc. | 39,879 | | 1,077 | |
| | Simpson | | | | |
| | Manufacturing Co. Inc. | 39,600 | | 1,065 | |
| | HNI Corp. | 38,452 | | 1,062 | |
| | Brink’s Co. | 43,279 | | 1,053 | |
| * | AAR Corp. | 44,801 | | 1,030 | |
| | AO Smith Corp. | 23,652 | | 1,026 | |
| | Belden Inc. | 46,551 | | 1,020 | |
| * | HUB Group Inc. Class A | 37,380 | | 1,003 | |
| * | EnerSys | 45,753 | | 1,001 | |
| | Mueller Water Products Inc. | | | | |
| | Class A | 191,253 | | 994 | |
| * | USG Corp. | 69,230 | | 973 | |
| | Briggs & Stratton Corp. | 50,668 | | 948 | |
| | Skywest Inc. | 55,641 | | 941 | |
| | ESCO Technologies Inc. | 26,219 | | 940 | |
| | Mueller Industries Inc. | 37,401 | | 929 | |
| | Werner Enterprises Inc. | 46,633 | | 923 | |
| | Mine Safety Appliances Co. | 34,690 | | 920 | |
| | ABM Industries Inc. | 44,204 | | 913 | |
| * | Resources Connection Inc. | 42,960 | | 912 | |
| * | SYKES Enterprises Inc. | 35,637 | | 908 | |
| | Watts Water | | | | |
| | Technologies Inc. Class A | 29,317 | | 906 | |
| | Heartland Express Inc. | 59,172 | | 904 | |
| | Herman Miller Inc. | 56,494 | | 903 | |
| * | Insituform Technologies Inc. | | | | |
| | Class A | 39,306 | | 893 | |
| | Healthcare Services | | | | |
| | Group Inc. | 41,348 | | 887 | |
| * | SunPower Corp. Class B | 42,055 | | 881 | |
| | Albany International Corp. | 39,020 | | 876 | |
| | Rollins Inc. | 45,187 | | 871 | |
| * | Orbital Sciences Corp. | 56,822 | | 867 | |
| * | Old Dominion | | | | |
| | Freight Line Inc. | 27,965 | | 859 | |
| | Applied Industrial | | | | |
| | Technologies Inc. | 38,170 | | 842 | |
| | Otter Tail Corp. | 33,949 | | 842 | |
| * | Middleby Corp. | 17,010 | | 834 | |
| | Triumph Group Inc. | 16,949 | | 818 | |
| | American Science & | | | | |
| | Engineering Inc. | 10,586 | | 803 | |
| * | Armstrong World | | | | |
| | Industries Inc. | 20,442 | | 796 | |
33
Institutional Total Stock Market Index Fund
| | | | | |
| | | | | Market | |
| | | | | Value• | |
| | | Shares | ($ | 000 | ) |
| | Franklin Electric Co. Inc. | 26,987 | | 785 | |
| | Corporate Executive | | | | |
| | Board Co. | 34,337 | | 784 | |
| * | CoStar Group Inc. | 18,499 | | 773 | |
| | Barnes Group Inc. | 45,490 | | 769 | |
| * | MasTec Inc. | 61,303 | | 766 | |
| | Deluxe Corp. | 51,207 | | 757 | |
| * | Advisory Board Co. | 24,672 | | 756 | |
| * | Beacon Roofing Supply Inc. | 46,130 | | 738 | |
| | Aircastle Ltd. | 73,886 | | 728 | |
| * | US Airways Group Inc. | 150,087 | | 726 | |
| * | Layne Christensen Co. | 25,040 | | 719 | |
| * | Navigant Consulting Inc. | 48,125 | | 715 | |
| * | Macquarie | | | | |
| | Infrastructure Co. LLC | 57,182 | | 702 | |
| | Arkansas Best Corp. | 23,708 | | 698 | |
| | Forward Air Corp. | 27,840 | | 697 | |
| * | ATC Technology Corp. | 29,020 | | 692 | |
| | Badger Meter Inc. | 17,325 | | 690 | |
| | Administaff Inc. | 28,409 | | 670 | |
| * | ACCO Brands Corp. | 90,912 | | 662 | |
| * | II-VI Inc. | 20,739 | | 659 | |
| | EnergySolutions Inc. | 77,519 | | 658 | |
| *,^ | Allegiant Travel Co. Class A | 13,832 | | 652 | |
| * | Blount International Inc. | 64,532 | | 652 | |
| * | Astec Industries Inc. | 24,182 | | 651 | |
| | Robbins & Myers Inc. | 27,301 | | 642 | |
| | Universal Forest | | | | |
| | Products Inc. | 17,133 | | 631 | |
| *,^ | Genco Shipping & | | | | |
| | Trading Ltd. | 27,963 | | 626 | |
| * | Consolidated Graphics Inc. | 17,826 | | 624 | |
| * | CBIZ Inc. | 81,031 | | 624 | |
| * | AZZ Inc. | 18,984 | | 621 | |
| | Raven Industries Inc. | 19,488 | | 619 | |
| * | Korn/Ferry International | 36,502 | | 602 | |
| | Comfort Systems USA Inc. | 48,469 | | 598 | |
| * | AirTran Holdings Inc. | 114,337 | | 597 | |
| | Kaman Corp. | 25,683 | | 593 | |
| | Cubic Corp. | 15,756 | | 588 | |
| | Knoll Inc. | 56,337 | | 582 | |
| * | Altra Holdings Inc. | 46,684 | | 577 | |
| *,^ | Evergreen Solar Inc. | 362,748 | | 548 | |
| * | Acacia Research-Acacia | | | | |
| | Technologies | 59,763 | | 544 | |
| * | Ceradyne Inc. | 27,994 | | 538 | |
| * | Atlas Air Worldwide | | | | |
| | Holdings Inc. | 14,434 | | 538 | |
| *,^ | Energy Conversion | | | | |
| | Devices Inc. | 50,715 | | 536 | |
| | Quanex Building | | | | |
| | Products Corp. | 31,461 | | 534 | |
| * | Mobile Mini Inc. | 37,671 | | 531 | |
| * | Chart Industries Inc. | 31,868 | | 527 | |
| | Ampco-Pittsburgh Corp. | 16,367 | | 516 | |
| * | GenCorp Inc. | 72,514 | | 508 | |
| | | | | |
| | | | | Market | |
| | | | | Value• | |
| | | Shares | ($ | 000 | ) |
| * | Michael Baker Corp. | 12,128 | | 502 | |
| * | Cornell Cos. Inc. | 21,621 | | 491 | |
| * | Dollar Thrifty Automotive |
| | | |
| | Group Inc. | 18,809 | 482 |
| | G&K Services Inc. Class A | 19,003 | 478 |
| | Ameron International Corp. | 7,497 | 476 |
| * | Griffon Corp. | 38,628 | 472 |
| | CIRCOR International Inc. | 18,683 | 470 |
| * | Huron Consulting Group Inc. | 20,149 | 464 |
| | Apogee Enterprises Inc. | 32,853 | 460 |
| * | Marten Transport Ltd. | 25,623 | 460 |
| * | TrueBlue Inc. | 30,502 | 452 |
| * | M&F Worldwide Corp. | 11,401 | 450 |
| | Dynamic Materials Corp. | 21,983 | 441 |
| | Applied Signal | | |
| | Technology Inc. | 22,582 | 436 |
| * | Tutor Perini Corp. | 23,950 | 433 |
| * | FuelCell Energy Inc. | 113,930 | 428 |
| * | Orion Marine Group Inc. | 19,889 | 419 |
| | American Ecology Corp. | 24,441 | 416 |
| | AAON Inc. | 21,271 | 415 |
| * | Dycom Industries Inc. | 51,293 | 412 |
| | Interface Inc. Class A | 49,377 | 410 |
| * | EnerNOC Inc. | 13,377 | 407 |
| * | Colfax Corp. | 33,740 | 406 |
| * | On Assignment Inc. | 56,765 | 406 |
| *,^ | Broadwind Energy Inc. | 50,004 | 405 |
| * | GeoEye Inc. | 14,243 | 397 |
| * | United Rentals Inc. | 40,244 | 395 |
| | HEICO Corp. Class A | 10,879 | 391 |
| | Ducommun Inc. | 20,417 | 382 |
| | Cascade Corp. | 13,847 | 381 |
| * | Celadon Group Inc. | 34,555 | 375 |
| | Ennis Inc. | 22,309 | 375 |
| | CDI Corp. | 28,343 | 367 |
| | International | | |
| | Shipholding Corp. | 11,809 | 367 |
| * | DynCorp International Inc. | | |
| | Class A | 24,786 | 356 |
| * | CRA International Inc. | 13,235 | 353 |
| | Greenbrier Cos. Inc. | 33,819 | 351 |
| | Heidrick & Struggles | | |
| | International Inc. | 11,140 | 348 |
| * | Trex Co. Inc. | 17,726 | 347 |
| * | Cenveo Inc. | 39,080 | 342 |
| | American Railcar | | |
| | Industries Inc. | 30,581 | 337 |
| * | Interline Brands Inc. | 19,453 | 336 |
| | Lindsay Corp. | 8,406 | 335 |
| * | China BAK Battery Inc. | 118,917 | 331 |
| * | H&E Equipment | | |
| | Services Inc. | 31,465 | 330 |
| | Bowne & Co. Inc. | 48,889 | 327 |
| | | |
| | Services Inc. | 54,276 | 323 |
| * | American Reprographics Co. | 45,756 | 321 |
34
Institutional Total Stock Market Index Fund
| | | | | |
| | | | | Market | |
| | | | | Value• | |
| | | Shares | ($ | 000 | ) |
| | Tredegar Corp. | 19,501 | | 308 | |
| * | Advanced Battery | | | | |
| | Technologies Inc. | 76,773 | | 307 | |
| | Gibraltar Industries Inc. | 19,471 | | 306 | |
| * | Kforce Inc. | 24,373 | | 305 | |
| | American Woodmark Corp. | 15,430 | | 304 | |
| * | Amerco Inc. | 6,045 | | 301 | |
| * | EnPro Industries Inc. | 11,077 | | 293 | |
| * | Northwest Pipe Co. | 10,891 | | 293 | |
| * | Powell Industries Inc. | 9,238 | | 291 | |
| | Standex International Corp. | 14,478 | | 291 | |
| * | Hawaiian Holdings Inc. | 41,383 | | 290 | |
| * | ICT Group Inc. | 17,578 | | 287 | |
| | Alamo Group Inc. | 16,566 | | 284 | |
| | McGrath Rentcorp | 12,580 | | 281 | |
| * | Ladish Co. Inc. | 18,441 | | 278 | |
| | Seaboard Corp. | 204 | | 275 | |
| * | RBC Bearings Inc. | 11,257 | | 274 | |
| | Steelcase Inc. Class A | 42,852 | | 273 | |
| | Graham Corp. | 12,900 | | 267 | |
| | Encore Wire Corp. | 12,628 | | 266 | |
| * | Miller Industries Inc. | 23,159 | | 263 | |
| * | Polypore International Inc. | 22,083 | | 263 | |
| * | Force Protection Inc. | 48,955 | | 255 | |
| | Diamond Management & | | | | |
| | Technology Consultants Inc. | | | | |
| | Class A | 34,547 | | 255 | |
| | John Bean Technologies Corp. 14,868 | | 253 | |
| * | DigitalGlobe Inc. | 10,413 | | 252 | |
| * | COMSYS IT Partners Inc. | 27,425 | | 244 | |
| * | Aerovironment Inc. | 8,358 | | 243 | |
| | Aceto Corp. | 46,552 | | 240 | |
| * | School Specialty Inc. | 10,033 | | 235 | |
| * | Rush Enterprises Inc. | | | | |
| | Class A | 19,569 | | 233 | |
| * | LB Foster Co. Class A | 7,748 | | 231 | |
| * | Exponent Inc. | 8,248 | | 230 | |
| * | Air Transport | | | | |
| | Services Group Inc. | 86,695 | | 229 | |
| * | Stanley Inc. | 8,302 | | 228 | |
| | Houston Wire & Cable Co. | 18,879 | | 225 | |
| | Gorman-Rupp Co. | 8,011 | | 221 | |
| | Courier Corp. | 15,462 | | 220 | |
| * | Argon ST Inc. | 10,082 | | 219 | |
| | Tennant Co. | 8,314 | | 218 | |
| | Great Lakes Dredge & | | | | |
| | Dock Corp. | 33,390 | | 216 | |
| * | RSC Holdings Inc. | 30,424 | | 214 | |
| * | United Capital Corp. | 8,877 | | 211 | |
| * | Republic Airways | | | | |
| | Holdings Inc. | 28,594 | | 211 | |
| * | Kelly Services Inc. Class A | 17,600 | | 210 | |
| *,^ | Capstone Turbine Corp. | 161,626 | | 208 | |
| * | Flow International Corp. | 67,513 | | 208 | |
| | Viad Corp. | 9,995 | | 206 | |
| * | Dynamex Inc. | 11,256 | | 204 | |
| | | | | |
| | | | | Market | |
| | | | | Value• | |
| | | Shares | ($ | 000 | ) |
| | Titan International Inc. | 24,257 | | 197 | |
| * | American Commercial | | | | |
| | Lines Inc. | 10,671 | | 196 | |
| * | GP Strategies Corp. | 25,900 | | 195 | |
| | TAL International Group Inc. | 14,700 | | 194 | |
| * | Flanders Corp. | 43,451 | | 194 | |
| * | ICF International Inc. | 7,116 | | 191 | |
| * | Kratos Defense & Security | | | | |
| | Solutions Inc. | 17,702 | | 187 | |
| * | Columbus McKinnon Corp. | 13,464 | | 184 | |
| | LSI Industries Inc. | 23,206 | | 183 | |
| * | Harbin Electric Inc. | 8,900 | | 183 | |
| * | Herley Industries Inc. | 12,997 | | 181 | |
| | Pacer International Inc. | 56,698 | | 179 | |
| *,^ | Microvision Inc. | 56,255 | | 178 | |
| | NACCO Industries Inc. | | | | |
| | Class A | 3,562 | | 177 | |
| * | Pinnacle Airlines Corp. | 25,710 | | 177 | |
| * | Taser International Inc. | 40,319 | | 177 | |
| | Federal Signal Corp. | 29,198 | | 176 | |
| * | Active Power Inc. | 159,376 | | 175 | |
| | Barrett Business | | | | |
| | Services Inc. | 14,235 | | 175 | |
| * | Eagle Bulk Shipping Inc. | 35,296 | | 175 | |
| * | Commercial Vehicle | | | | |
| | Group Inc. | 29,130 | | 174 | |
| * | Power-One Inc. | 40,101 | | 174 | |
| * | Furmanite Corp. | 43,935 | | 167 | |
| * | Casella Waste Systems Inc. | | | | |
| | Class A | 41,353 | | 166 | |
| * | MYR Group Inc. | 9,154 | | 165 | |
| * | UQM Technologies Inc. | 24,104 | | 165 | |
| * | Ener1 Inc. | 25,510 | | 162 | |
| * | Team Inc. | 8,564 | | 161 | |
| * | PAM Transportation | | | | |
| | Services Inc. | 15,285 | | 158 | |
| * | PowerSecure | | | | |
| | International Inc. | 21,502 | | 155 | |
| *,^ | Builders FirstSource Inc. | 39,526 | | 152 | |
| * | Fuel Tech Inc. | 18,500 | | 151 | |
| | Kimball International Inc. | | | | |
| | Class B | 16,424 | | 140 | |
| * | Sterling Construction Co. Inc. | 7,103 | | 136 | |
| * | Lydall Inc. | 25,901 | | 135 | |
| *,^ | Ascent Solar | | | | |
| | Technologies Inc. | 25,100 | | 133 | |
| | Sauer-Danfoss Inc. | 11,064 | | 133 | |
| | Horizon Lines Inc. Class A | 23,792 | | 132 | |
| * | Kadant Inc. | 8,297 | | 132 | |
| | Sun Hydraulics Corp. | 5,001 | | 131 | |
| * | Intersections Inc. | 26,006 | | 127 | |
| *,^ | China Fire & Security | | | | |
| | Group Inc. | 9,400 | | 127 | |
| * | NN Inc. | 31,792 | | 126 | |
| * | Amrep Corp. | 9,002 | | 123 | |
| * | ExpressJet Holdings Inc. | 25,542 | | 123 | |
35
Institutional Total Stock Market Index Fund
| | | | | |
| | | | | Market | |
| | | | | Value• | |
| | | Shares | ($ | 000 | ) |
| * | Covenant Transportation | | | | |
| | Group Inc. Class A | 29,175 | | 123 | |
| | Hardinge Inc. | 22,327 | | 123 | |
| * | Spherion Corp. | 21,844 | | 123 | |
| * | LaBarge Inc. | 10,000 | | 120 | |
| * | BlueLinx Holdings Inc. | 43,233 | | 120 | |
| | Met-Pro Corp. | 11,172 | | 119 | |
| * | Hudson Highland Group Inc. | 24,935 | | 118 | |
| | Todd Shipyards Corp. | 6,829 | | 114 | |
| * | DXP Enterprises Inc. | 8,744 | | 114 | |
| * | Pike Electric Corp. | 11,260 | | 104 | |
| | Insteel Industries Inc. | 7,400 | | 96 | |
| * | Quixote Corp. | 14,944 | | 95 | |
| * | Willis Lease Finance Corp. | 6,149 | | 92 | |
| * | Saia Inc. | 6,115 | | 91 | |
| | Lawson Products Inc. | 4,805 | | 85 | |
| *,^ | C&D Technologies Inc. | 54,659 | | 85 | |
| * | Waste Services Inc. | 9,297 | | 85 | |
| * | Park-Ohio Holdings Corp. | 14,701 | | 83 | |
| | Multi-Color Corp. | 6,796 | | 83 | |
| | Frozen Food Express | | | | |
| | Industries | 24,405 | | 81 | |
| * | Vicor Corp. | 8,386 | | 78 | |
| * | Plug Power Inc. | 109,686 | | 78 | |
| * | Tecumseh Products Co. | | | | |
| | Class A | 6,472 | | 76 | |
| * | Thermadyne Holdings Corp. | 10,400 | | 76 | |
| * | 3D Systems Corp. | 6,557 | | 74 | |
| * | SmartHeat Inc. | 5,100 | | 74 | |
| * | Innovative Solutions & | | | | |
| | Support Inc. | 16,018 | | 74 | |
| * | Protection One Inc. | 11,226 | | 72 | |
| * | GT Solar International Inc. | 12,966 | | 72 | |
| | HEICO Corp. | 1,623 | | 72 | |
| * | Quality Distribution Inc. | 18,134 | | 72 | |
| *,^ | Ocean Power | | | | |
| | Technologies Inc. | 7,600 | | 68 | |
| | FreightCar America Inc. | 3,443 | | 68 | |
| * | Magnetek Inc. | 43,974 | | 68 | |
| | Preformed Line | | | | |
| | Products Co. | 1,500 | | 66 | |
| * | LMI Aerospace Inc. | 4,860 | | 65 | |
| * | Allied Defense Group Inc. | 13,400 | | 64 | |
| * | Ceco Environmental Corp. | 15,932 | | 63 | |
| * | Astronics Corp. | 7,165 | | 61 | |
| * | K-Tron International Inc. | 562 | | 61 | |
| | LS Starrett Co. Class A | 6,936 | | 61 | |
| * | Beacon Power Corp. | 122,700 | | 61 | |
| * | Fushi Copperweld Inc. | 5,739 | | 58 | |
| * | Innerworkings Inc. | 9,500 | | 56 | |
| | Chase Corp. | 4,696 | | 55 | |
| | Schawk Inc. Class A | 3,900 | | 53 | |
| * | Metalico Inc. | 10,223 | | 50 | |
| * | PMFG Inc. | 3,100 | | 50 | |
| * | NCI Building Systems Inc. | 27,194 | | 49 | |
| * | Franklin Covey Co. | 7,729 | | 49 | |
| | | | | | |
| | | | | | Market | |
| | | | | | Value• | |
| | | | Shares | ($ | 000 | ) |
| * | Hill International Inc. | | 7,800 | | 49 | |
| * | Energy Recovery Inc. | | 7,014 | | 48 | |
| * | WCA Waste Corp. | | 11,166 | | 48 | |
| * | Titan Machinery Inc. | | 4,100 | | 47 | |
| *,^ | Akeena Solar Inc. | | 37,733 | | 47 | |
| * | Innotrac Corp. | | 28,417 | | 46 | |
| * | Volt Information | | | | | |
| | Sciences Inc. | | 4,579 | | 46 | |
| *,^ | YRC Worldwide Inc. | | 53,784 | | 45 | |
| *,^ | Valence Technology Inc. | | 47,372 | | 43 | |
| * | Perma-Fix Environmental | | | | | |
| | Services | | 18,664 | | 42 | |
| * | Ultralife Corp. | | 9,557 | | 41 | |
| * | PRG-Schultz International Inc. | 6,968 | | 41 | |
| *,^ | Arotech Corp. | | 23,278 | | 39 | |
| * | TBS International Ltd. | | | | | |
| | Class A | | 5,000 | | 37 | |
| * | Hurco Cos. Inc. | | 2,300 | | 34 | |
| * | Standard Parking Corp. | | 1,934 | | 31 | |
| | Sypris Solutions Inc. | | 10,878 | | 31 | |
| | Standard Register Co. | | 5,673 | | 29 | |
| * | Advanced Environmental | | | | | |
| | Recycling Technologies Inc. | | | | |
| | Class A | | 78,462 | | 25 | |
| * | TRC Cos. Inc. | | 7,654 | | 23 | |
| | Eastern Co. | | 1,500 | | 20 | |
| * | Wabash National Corp. | | 10,509 | | 20 | |
| * | LECG Corp. | | 6,536 | | 20 | |
| * | Orion Energy Systems Inc. | | 4,313 | | 19 | |
| * | USA Truck Inc. | | 1,500 | | 19 | |
| | Virco Manufacturing | | 5,113 | | 19 | |
| *,^ | Document Security | | | | | |
| | Systems Inc. | | 6,900 | | 17 | |
| * | Applied Energetics Inc. | | 50,645 | | 17 | |
| *,^ | Builders FirstSource Inc. | | | | | |
| | Rights Exp. 1/14/2010 | | 63,681 | | 16 | |
| * | China Architectural | | | | | |
| | Engineering Inc. | | 14,042 | | 15 | |
| | Superior Uniform Group Inc. | 1,093 | | 11 | |
| | Omega Flex Inc. | | 600 | | 8 | |
| | Twin Disc Inc. | | 600 | | 6 | |
| * | Wuhan General Group | | | | | |
| | China Inc. | | 2,400 | | 5 | |
| * | AT Cross Co. Class A | | 907 | | 5 | |
| * | Mesa Air Group Inc. | | 25,176 | | 3 | |
| * | US Home Systems Inc. | | 1,157 | | 3 | |
| * | Argan Inc. | | 200 | | 3 | |
| * | Integrated Electrical | | | | | |
| | Services Inc. | | 200 | | 1 | |
| | Universal Truckload | | | | | |
| | Services Inc. | | 57 | | 1 | |
| * | BMC Industries Inc. | | 4,603 | | — | |
| | | | | | 1,330,472 | |
| Information Technology (19.3%) | | | | |
| | Microsoft Corp. | 7,962,738 | | 242,784 | |
| * | Apple Inc. | 889,464 | | 187,552 | |
36
Institutional Total Stock Market Index Fund
| | | | | |
| | | | | Market | |
| | | | | Value• | |
| | | Shares | ($ | 000 | ) |
| | International Business | | | | |
| | Machines Corp. | 1,301,615 | | 170,381 | |
| * | Google Inc. Class A | 240,257 | | 148,955 | |
| * | Cisco Systems Inc. | 5,726,985 | | 137,104 | |
| | Hewlett-Packard Co. | 2,369,387 | | 122,047 | |
| | Intel Corp. | 5,557,297 | | 113,369 | |
| | Oracle Corp. | 3,983,674 | | 97,759 | |
| | QUALCOMM Inc. | 1,650,534 | | 76,354 | |
| | Visa Inc. Class A | 456,798 | | 39,952 | |
| * | EMC Corp. | 2,007,369 | | 35,069 | |
| | Texas Instruments Inc. | 1,252,541 | | 32,641 | |
| | Corning Inc. | 1,543,635 | | 29,808 | |
| * | eBay Inc. | 1,089,158 | | 25,639 | |
| | Accenture PLC Class A | 609,961 | | 25,313 | |
| | Mastercard Inc. Class A | 98,004 | | 25,087 | |
| * | Dell Inc. | 1,745,780 | | 25,069 | |
| * | Yahoo! Inc. | 1,323,881 | | 22,215 | |
| | Automatic Data | | | | |
| | Processing Inc. | 498,688 | | 21,354 | |
| * | Adobe Systems Inc. | 521,395 | | 19,177 | |
| | Applied Materials Inc. | 1,323,884 | | 18,455 | |
| | Motorola Inc. | 2,279,691 | | 17,690 | |
| * | Symantec Corp. | 809,173 | | 14,476 | |
| * | Juniper Networks Inc. | 520,845 | | 13,891 | |
| * | Broadcom Corp. Class A | 433,348 | | 13,629 | |
| * | Cognizant Technology | | | | |
| | Solutions Corp. Class A | 291,381 | | 13,200 | |
| | Western Union Co. | 697,073 | | 13,140 | |
| * | NetApp Inc. | 334,083 | | 11,489 | |
| | Tyco Electronics Ltd. | 455,826 | | 11,191 | |
| * | Marvell Technology | | | | |
| | Group Ltd. | 523,089 | | 10,854 | |
| * | Agilent Technologies Inc. | 341,278 | | 10,604 | |
| * | NVIDIA Corp. | 544,737 | | 10,176 | |
| | Paychex Inc. | 322,839 | | 9,892 | |
| * | Western Digital Corp. | 223,481 | | 9,867 | |
| * | Intuit Inc. | 305,154 | | 9,371 | |
| | CA Inc. | 416,668 | | 9,358 | |
| | Analog Devices Inc. | 289,698 | | 9,149 | |
| | Seagate Technology | 492,056 | | 8,951 | |
| * | Micron Technology Inc. | 841,536 | | 8,887 | |
| * | Computer Sciences Corp. | 150,734 | | 8,672 | |
| * | Salesforce.com Inc. | 110,992 | | 8,188 | |
| | Amphenol Corp. Class A | 170,501 | | 7,874 | |
| * | Citrix Systems Inc. | 181,985 | | 7,572 | |
| * | Fiserv Inc. | 153,628 | | 7,448 | |
| | Fidelity National | | | | |
| | Information Services Inc. | 313,443 | | 7,347 | |
| * | BMC Software Inc. | 183,043 | | 7,340 | |
| | Xerox Corp. | 863,771 | | 7,308 | |
| * | Sun Microsystems Inc. | 749,391 | | 7,022 | |
| | Xilinx Inc. | 274,430 | | 6,877 | |
| | Linear Technology Corp. | 220,996 | | 6,749 | |
| | Altera Corp. | 292,492 | | 6,619 | |
| * | SanDisk Corp. | 226,013 | | 6,552 | |
| * | McAfee Inc. | 156,376 | | 6,344 | |
| | | | | |
| | | | | Market | |
| | | | | Value• | |
| | | Shares | ($ | 000 | ) |
| * | Activision Blizzard Inc. | 569,103 | | 6,323 | |
| | Harris Corp. | 131,872 | | 6,271 | |
| | Maxim Integrated | | | | |
| | Products Inc. | 304,655 | | 6,185 | |
| | KLA-Tencor Corp. | 169,924 | | 6,144 | |
| * | Flextronics | | | | |
| | International Ltd. | 806,759 | | 5,897 | |
| * | Autodesk Inc. | 228,740 | | 5,812 | |
| * | Red Hat Inc. | 187,156 | | 5,783 | |
| * | Electronic Arts Inc. | 322,057 | | 5,717 | |
| * | Advanced Micro | | | | |
| | Devices Inc. | 563,763 | | 5,457 | |
| * | Cree Inc. | 95,894 | | 5,406 | |
| * | Affiliated Computer | | | | |
| | Services Inc. Class A | 90,474 | | 5,400 | |
| * | Teradata Corp. | 171,047 | | 5,376 | |
| | Microchip Technology Inc. | 181,934 | | 5,287 | |
| * | Lam Research Corp. | 126,185 | | 4,948 | |
| * | FLIR Systems Inc. | 150,931 | | 4,938 | |
| * | VeriSign Inc. | 191,580 | | 4,644 | |
| * | Avnet Inc. | 150,153 | | 4,529 | |
| * | Akamai Technologies Inc. | 171,810 | | 4,352 | |
| | Global Payments Inc. | 80,366 | | 4,329 | |
| * | F5 Networks Inc. | 78,203 | | 4,143 | |
| * | Equinix Inc. | 38,398 | | 4,076 | |
| * | LSI Corp. | 647,820 | | 3,893 | |
| | Lender Processing | | | | |
| | Services Inc. | 95,561 | | 3,886 | |
| * | SAIC Inc. | 202,659 | | 3,838 | |
| * | ANSYS Inc. | 87,743 | | 3,813 | |
| | National | | | | |
| | Semiconductor Corp. | 235,007 | | 3,610 | |
| * | ON Semiconductor Corp. | 399,419 | | 3,519 | |
| * | Hewitt Associates Inc. | | | | |
| | Class A | 83,255 | | 3,518 | |
| * | Arrow Electronics Inc. | 118,814 | | 3,518 | |
| * | Sybase Inc. | 80,480 | | 3,493 | |
| * | Alliance Data Systems Corp. | 52,795 | | 3,410 | |
| * | Rovi Corp. | 101,465 | | 3,234 | |
| * | Synopsys Inc. | 143,376 | | 3,194 | |
| | Broadridge Financial | | | | |
| | Solutions Inc. | 139,583 | | 3,149 | |
| | Jabil Circuit Inc. | 181,086 | | 3,145 | |
| * | Nuance | | | | |
| | Communications Inc. | 200,840 | | 3,121 | |
| * | MEMC Electronic | | | | |
| | Materials Inc. | 223,084 | | 3,038 | |
| * | Brocade Communications | | | | |
| | Systems Inc. | 396,512 | | 3,025 | |
| * | Trimble Navigation Ltd. | 119,034 | | 3,000 | |
| | Factset Research | | | | |
| | Systems Inc. | 44,724 | | 2,946 | |
| * | 3Com Corp. | 390,512 | | 2,929 | |
| | Total System Services Inc. | 166,742 | | 2,880 | |
| * | Itron Inc. | 39,832 | | 2,691 | |
37
Institutional Total Stock Market Index Fund
| | | | | |
| | | | | Market | |
| | | | | Value• | |
| | | Shares | ($ | 000 | ) |
| * | Varian Semiconductor | | | | |
| | Equipment Associates Inc. | 73,088 | | 2,622 | |
| * | Ingram Micro Inc. | 146,375 | | 2,554 | |
| * | Dolby Laboratories Inc. | | | | |
| | Class A | 53,120 | | 2,535 | |
| * | AOL Inc. | 107,409 | | 2,500 | |
| * | MICROS Systems Inc. | 80,308 | | 2,492 | |
| * | CommScope Inc. | 93,064 | | 2,469 | |
| * | Rambus Inc. | 99,672 | | 2,432 | |
| * | Skyworks Solutions Inc. | 170,949 | | 2,426 | |
| | Solera Holdings Inc. | 66,059 | | 2,379 | |
| * | Tech Data Corp. | 50,285 | | 2,346 | |
| * | VistaPrint NV | 40,607 | | 2,301 | |
| * | Informatica Corp. | 88,279 | | 2,283 | |
| * | Novellus Systems Inc. | 97,676 | | 2,280 | |
| * | Atheros | | | | |
| | Communications Inc. | 66,166 | | 2,266 | |
| * | QLogic Corp. | 118,933 | | 2,244 | |
| * | VMware Inc. Class A | 52,878 | | 2,241 | |
| | Molex Inc. Class A | 114,597 | | 2,192 | |
| * | Tellabs Inc. | 375,219 | | 2,131 | |
| * | Polycom Inc. | 83,864 | | 2,094 | |
| * | Silicon Laboratories Inc. | 42,532 | | 2,056 | |
| * | Lexmark International Inc. | | | | |
| | Class A | 77,950 | | 2,025 | |
| * | Atmel Corp. | 429,904 | | 1,982 | |
| * | IAC/InterActiveCorp | 95,587 | | 1,958 | |
| * | PMC-Sierra Inc. | 225,060 | | 1,949 | |
| * | Parametric Technology Corp. | 116,192 | | 1,899 | |
| | Diebold Inc. | 66,250 | | 1,885 | |
| | Intersil Corp. Class A | 122,746 | | 1,883 | |
| * | WebMD Health Corp. | 48,887 | | 1,882 | |
| * | Teradyne Inc. | 174,250 | | 1,870 | |
| | Jack Henry & Associates Inc. | 79,833 | | 1,846 | |
| * | Concur Technologies Inc. | 41,471 | | 1,773 | |
| * | NCR Corp. | 158,935 | | 1,769 | |
| * | Sohu.com Inc. | 30,645 | | 1,755 | |
| * | JDS Uniphase Corp. | 212,399 | | 1,752 | |
| * | DST Systems Inc. | 39,798 | | 1,733 | |
| * | Compuware Corp. | 237,520 | | 1,717 | |
| * | NeuStar Inc. Class A | 74,444 | | 1,715 | |
| | National Instruments Corp. | 57,958 | | 1,707 | |
| * | TIBCO Software Inc. | 175,904 | | 1,694 | |
| * | Zebra Technologies Corp. | 59,114 | | 1,676 | |
| * | Cypress | | | | |
| | Semiconductor Corp. | 155,186 | | 1,639 | |
| * | Unisys Corp. | 42,474 | | 1,638 | |
| * | Cadence Design | | | | |
| | Systems Inc. | 264,670 | | 1,585 | |
| * | International Rectifier Corp. | 71,482 | | 1,581 | |
| *,^ | Palm Inc. | 154,882 | | 1,555 | |
| * | CACI International Inc. | | | | |
| | Class A | 30,166 | | 1,474 | |
| * | Novell Inc. | 347,220 | | 1,441 | |
| * | Microsemi Corp. | 80,841 | | 1,435 | |
| * | Arris Group Inc. | 125,368 | | 1,433 | |
| | | | | |
| | | | | Market | |
| | | | | Value• | |
| | | Shares | ($ | 000 | ) |
| * | Vishay Intertechnology Inc. | 171,260 | | 1,430 | |
| * | Anixter International Inc. | 29,920 | | 1,409 | |
| * | Gartner Inc. | 77,042 | | 1,390 | |
| * | Blackboard Inc. | 30,354 | | 1,378 | |
| * | MercadoLibre Inc. | 26,536 | | 1,376 | |
| * | Cybersource Corp. | 66,413 | | 1,336 | |
| * | Convergys Corp. | 123,237 | | 1,325 | |
| | ADTRAN Inc. | 56,734 | | 1,279 | |
| * | Riverbed Technology Inc. | 55,538 | | 1,276 | |
| | Plantronics Inc. | 48,560 | | 1,262 | |
| * | Veeco Instruments Inc. | 38,094 | | 1,259 | |
| * | VeriFone Holdings Inc. | 75,997 | | 1,245 | |
| * | Fairchild Semiconductor | | | | |
| | International Inc. Class A | 123,310 | | 1,232 | |
| * | Benchmark Electronics Inc. | 64,827 | | 1,226 | |
| * | RF Micro Devices Inc. | 255,255 | | 1,218 | |
| * | Progress Software Corp. | 40,010 | | 1,169 | |
| * | InterDigital Inc. | 43,821 | | 1,163 | |
| * | Wright Express Corp. | 36,277 | | 1,156 | |
| * | Tessera Technologies Inc. | 49,232 | | 1,146 | |
| * | Quest Software Inc. | 62,142 | | 1,143 | |
| * | Mentor Graphics Corp. | 128,390 | | 1,134 | |
| * | Genpact Ltd. | 75,684 | | 1,128 | |
| * | Blue Coat Systems Inc. | 39,456 | | 1,126 | |
| * | Plexus Corp. | 39,234 | | 1,118 | |
| * | TiVo Inc. | 109,189 | | 1,112 | |
| * | Ariba Inc. | 88,590 | | 1,109 | |
| * | FormFactor Inc. | 49,796 | | 1,084 | |
| * | Integrated Device | | | | |
| | Technology Inc. | 167,452 | | 1,083 | |
| * | Cymer Inc. | 28,208 | | 1,083 | |
| * | Mantech International Corp. | | | | |
| | Class A | 21,863 | | 1,056 | |
| * | Digital River Inc. | 38,720 | | 1,045 | |
| *,^ | Synaptics Inc. | 34,087 | | 1,045 | |
| * | Semtech Corp. | 61,066 | | 1,039 | |
| | Fair Isaac Corp. | 48,739 | | 1,039 | |
| | Blackbaud Inc. | 43,900 | | 1,037 | |
| * | GSI Commerce Inc. | 40,058 | | 1,017 | |
| * | JDA Software Group Inc. | 39,735 | | 1,012 | |
| * | Acxiom Corp. | 75,158 | | 1,009 | |
| * | Rackspace Hosting Inc. | 48,364 | | 1,008 | |
| * | Euronet Worldwide Inc. | 45,937 | | 1,008 | |
| * | Ciena Corp. | 92,170 | | 999 | |
| * | Comtech | | | | |
| | Telecommunications Corp. | 28,276 | | 991 | |
| | Power Integrations Inc. | 26,445 | | 962 | |
| * | Coherent Inc. | 32,065 | | 953 | |
| | Syntel Inc. | 24,908 | | 947 | |
| * | CommVault Systems Inc. | 39,546 | | 937 | |
| * | Tekelec | 61,063 | | 933 | |
| * | CSG Systems | | | | |
| | International Inc. | 48,237 | | 921 | |
| * | Viasat Inc. | 28,767 | | 914 | |
| * | AsiaInfo Holdings Inc. | 30,000 | | 914 | |
38
Institutional Total Stock Market Index Fund
| | | | | |
| | | | | Market | |
| | | | | Value• | |
| | | Shares | ($ | 000 | ) |
| * | j2 Global | | | | |
| | Communications Inc. | 44,868 | | 913 | |
| * | Emulex Corp. | 83,322 | | 908 | |
| * | TriQuint Semiconductor Inc. | 151,013 | | 906 | |
| * | Sanmina-SCI Corp. | 82,043 | | 905 | |
| * | Cavium Networks Inc. | 37,677 | | 898 | |
| * | Netlogic Microsystems Inc. | 19,165 | | 887 | |
| | Earthlink Inc. | 106,086 | | 882 | |
| * | ValueClick Inc. | 86,957 | | 880 | |
| | MAXIMUS Inc. | 17,563 | | 878 | |
| * | FEI Co. | 37,549 | | 877 | |
| * | Sapient Corp. | 105,383 | | 872 | |
| * | MicroStrategy Inc. Class A | 9,248 | | 870 | |
| * | Littelfuse Inc. | 26,995 | | 868 | |
| * | Lawson Software Inc. | 130,424 | | 867 | |
| * | Avago Technologies Ltd. | 47,403 | | 867 | |
| * | Amkor Technology Inc. | 120,178 | | 860 | |
| * | Tyler Technologies Inc. | 42,696 | | 850 | |
| * | SRA International Inc. | | | | |
| | Class A | 43,609 | | 833 | |
| * | ACI Worldwide Inc. | 47,928 | | 822 | |
| * | Art Technology Group Inc. | 182,138 | | 821 | |
| * | MKS Instruments Inc. | 46,811 | | 815 | |
| * | DTS Inc. | 23,806 | | 814 | |
| * | Cabot Microelectronics Corp. | 24,622 | | 812 | |
| * | Brooks Automation Inc. | 94,354 | | 810 | |
| * | Take-Two Interactive | | | | |
| | Software Inc. | 80,488 | | 809 | |
| * | Advanced Energy | | | | |
| | Industries Inc. | 53,233 | | 803 | |
| * | Hittite Microwave Corp. | 19,562 | | 797 | |
| * | EchoStar Corp. Class A | 39,166 | | 789 | |
| | Cognex Corp. | 43,910 | | 778 | |
| * | Aruba Networks Inc. | 72,430 | | 772 | |
| * | Manhattan Associates Inc. | 31,859 | | 766 | |
| * | Websense Inc. | 43,717 | | 763 | |
| * | DealerTrack Holdings Inc. | 40,378 | | 759 | |
| * | Infinera Corp. | 82,762 | | 734 | |
| * | Advent Software Inc. | 18,023 | | 734 | |
| * | Checkpoint Systems Inc. | 48,034 | | 733 | |
| * | Omnivision | | | | |
| | Technologies Inc. | 50,397 | | 732 | |
| * | Brightpoint Inc. | 99,530 | | 732 | |
| * | Verigy Ltd. | 56,679 | | 729 | |
| * | Scansource Inc. | 26,715 | | 713 | |
| * | Applied Micro Circuits Corp. | 95,292 | | 712 | |
| * | Bottomline Technologies Inc. | 39,639 | | 696 | |
| * | Harmonic Inc. | 108,482 | | 687 | |
| * | ATMI Inc. | 36,324 | | 676 | |
| * | ArcSight Inc. | 25,924 | | 663 | |
| * | Monolithic Power | | | | |
| | Systems Inc. | 27,593 | | 661 | |
| * | Epicor Software Corp. | 86,241 | | 657 | |
| * | ModusLink Global | | | | |
| | Solutions Inc. | 69,810 | | 657 | |
| | Black Box Corp. | 23,075 | | 654 | |
| | | | | |
| | | | | Market | |
| | | | | Value• | |
| | | Shares | ($ | 000 | ) |
| * | Entegris Inc. | 123,530 | | 652 | |
| * | ADC | | | | |
| | Telecommunications Inc. | 102,810 | | 638 | |
| * | Forrester Research Inc. | 24,541 | | 637 | |
| * | Rofin-Sinar Technologies Inc. | 26,763 | | 632 | |
| * | Adaptec Inc. | 187,725 | | 629 | |
| * | Cirrus Logic Inc. | 90,487 | | 617 | |
| | NIC Inc. | 66,883 | | 611 | |
| * | Intermec Inc. | 47,403 | | 610 | |
| *,^ | STEC Inc. | 36,867 | | 602 | |
| * | L-1 Identity Solutio ns Inc. | 80,417 | | 602 | |
| * | TeleTech Holdings Inc. | 29,755 | | 596 | |
| * | i2 Technologies Inc. | 31,000 | | 593 | |
| * | Echelon Corp. | 49,933 | | 577 | |
| * | DG FastChannel Inc. | 20,444 | | 571 | |
| * | Taleo Corp. Class A | 24,019 | | 565 | |
| * | Insight Enterprises Inc. | 49,437 | | 565 | |
| * | Netgear Inc. | 25,919 | | 562 | |
| | CTS Corp. | 57,214 | | 550 | |
| * | FARO Technologies Inc. | 25,371 | | 544 | |
| * | Harris Stratex Networks Inc. | 78,605 | | 543 | |
| | Cohu Inc. | 37,775 | | 527 | |
| | United Online Inc. | 72,685 | | 523 | |
| | AVX Corp. | 41,244 | | 523 | |
| * | Oclaro Inc. | 348,687 | | 513 | |
| * | EPIQ Systems Inc. | 36,555 | | 511 | |
| * | Avid Technology Inc. | 39,936 | | 510 | |
| * | Electronics for Imaging Inc. | 38,785 | | 505 | |
| * | Constant Contact Inc. | 31,484 | | 504 | |
| * | Anadigics Inc. | 119,130 | | 503 | |
| * | Rogers Corp. | 16,401 | | 497 | |
| * | Electro Scientific | | | | |
| | Industries Inc. | 45,659 | | 494 | |
| * | Net 1 UEPS | | | | |
| | Technologies Inc. | 25,410 | | 493 | |
| * | Kulicke & Soffa | | | | |
| | Industries Inc. | 90,964 | | 490 | |
| * | SuccessFactors Inc. | 29,449 | | 488 | |
| * | Diodes Inc. | 23,694 | | 485 | |
| * | Actel Corp. | 40,665 | | 483 | |
| * | Netscout Systems Inc. | 32,677 | | 478 | |
| * | Ceva Inc. | 36,858 | | 474 | |
| * | KVH Industries Inc. | 32,029 | | 472 | |
| | MTS Systems Corp. | 16,301 | | 468 | |
| | Pegasystems Inc. | 13,733 | | 467 | |
| * | Ebix Inc. | 9,471 | | 462 | |
| * | Sonus Networks Inc. | 218,943 | | 462 | |
| * | Knot Inc. | 45,091 | | 454 | |
| | Molex Inc. | 21,054 | | 454 | |
| | Agilysys Inc. | 49,801 | | 453 | |
| | Park Electrochemical Corp. | 16,392 | | 453 | |
| * | RealNetworks Inc. | 120,642 | | 448 | |
| * | Cogent Inc. | 42,911 | | 446 | |
| * | Multi-Fineline Electronix Inc. | 15,523 | | 440 | |
| * | Ultimate Software Group Inc. | 14,816 | | 435 | |
| * | Actuate Corp. | 101,183 | | 433 | |
39
Institutional Total Stock Market Index Fund
| | | | | |
| | | | | Market | |
| | | | | Value• | |
| | | Shares | ($ | 000 | ) |
| * | Axcelis Technologies Inc. | 303,237 | | 428 | |
| * | Double-Take Software Inc. | 42,775 | | 427 | |
| * | TNS Inc. | 16,597 | | 426 | |
| * | Interactive Intelligence Inc. | 22,392 | | 413 | |
| * | SolarWinds Inc. | 17,700 | | 407 | |
| * | Sycamore Networks Inc. | 19,362 | | 405 | |
| * | Anaren Inc. | 26,484 | | 399 | |
| * | Internet Capital Group Inc. | 58,611 | | 390 | |
| * | Ciber Inc. | 112,590 | | 388 | |
| * | Hypercom Corp. | 121,962 | | 387 | |
| * | SYNNEX Corp. | 12,568 | | 385 | |
| * | Comverge Inc. | 33,735 | | 379 | |
| * | Hutchinson Technology Inc. | 36,235 | | 372 | |
| * | Quantum Corp. | 126,581 | | 371 | |
| * | Computer Task Group Inc. | 45,724 | | 366 | |
| * | Zoran Corp. | 32,825 | | 363 | |
| * | Cogo Group Inc. | 49,000 | | 361 | |
| * | Acme Packet Inc. | 32,715 | | 360 | |
| * | Digi International Inc. | 39,209 | | 358 | |
| * | Imation Corp. | 40,897 | | 357 | |
| * | Cray Inc. | 55,404 | | 356 | |
| * | SAVVIS Inc. | 25,154 | | 353 | |
| * | SonicWALL Inc. | 46,317 | | 352 | |
| * | Advanced Analogic | | | | |
| | Technologies Inc. | 89,104 | | 351 | |
| * | Radiant Systems Inc. | 32,979 | | 343 | |
| * | Extreme Networks | 117,515 | | 337 | |
| | Bel Fuse Inc. Class B | 15,679 | | 337 | |
| * | Lattice Semiconductor Corp. | 122,992 | | 332 | |
| | Heartland Payment | | | | |
| | Systems Inc. | 25,191 | | 331 | |
| * | Infospace Inc. | 37,825 | | 324 | |
| * | comScore Inc. | 18,468 | | 324 | |
| * | LTX-Credence Corp. | 180,861 | | 322 | |
| * | DivX Inc. | 56,604 | | 319 | |
| * | Novatel Wireless Inc. | 39,233 | | 313 | |
| * | Kopin Corp. | 74,406 | | 311 | |
| | Electro Rent Corp. | 26,803 | | 309 | |
| * | RightNow Technologies Inc. | 17,355 | | 301 | |
| * | infoGROUP Inc. | 37,322 | | 299 | |
| * | Integrated Silicon | | | | |
| | Solution Inc. | 52,648 | | 297 | |
| * | Dice Holdings Inc. | 45,307 | | 297 | |
| * | Sonic Solutions Inc. | 24,739 | | 293 | |
| | Micrel Inc. | 35,633 | | 292 | |
| * | FalconStor Software Inc. | 71,636 | | 291 | |
| * | THQ Inc. | 57,256 | | 289 | |
| | Methode Electronics Inc. | 32,925 | | 286 | |
| * | Liquidity Services Inc. | 28,012 | | 282 | |
| * | Finisar Corp. | 31,420 | | 280 | |
| * | Sourcefire Inc. | 10,474 | | 280 | |
| * | IXYS Corp. | 37,753 | | 280 | |
| * | Limelight Networks Inc. | 71,232 | | 280 | |
| | Daktronics Inc. | 29,888 | | 275 | |
| | Keynote Systems Inc. | 25,186 | | 275 | |
| * | Sigma Designs Inc. | 24,899 | | 266 | |
| | | | | |
| | | | | Market | |
| | | | | Value• | |
| | | Shares | ($ | 000 | ) |
| * | California Micro | | | | |
| | Devices Corp. | 56,393 | | 266 | |
| * | Compellent Technologies Inc. | 11,635 | | 264 | |
| * | Standard Microsystems Corp. | 12,640 | | 263 | |
| * | Mercury Computer | | | | |
| | Systems Inc. | 23,375 | | 257 | |
| * | Global Cash Access | | | | |
| | Holdings Inc. | 34,342 | | 257 | |
| * | DDi Corp. | 52,401 | | 256 | |
| * | ActivIdentity Corp. | 106,709 | | 251 | |
| * | ExlService Holdings Inc. | 13,560 | | 246 | |
| * | Exar Corp. | 34,490 | | 245 | |
| * | Loral Space & | | | | |
| | Communications Inc. | 7,630 | | 241 | |
| * | TTM Technologies Inc. | 20,797 | | 240 | |
| * | DSP Group Inc. | 41,552 | | 234 | |
| * | NVE Corp. | 5,662 | | 234 | |
| * | Isilon Systems Inc. | 34,077 | | 234 | |
| * | Switch & Data | | | | |
| | Facilities Co. Inc. | 11,513 | | 233 | |
| * | EMS Technologies Inc. | 16,026 | | 232 | |
| * | Stratasys Inc. | 13,400 | | 232 | |
| * | MoneyGram | | | | |
| | International Inc. | 80,296 | | 231 | |
| * | Hackett Group Inc. | 81,930 | | 228 | |
| | Renaissance Learning Inc. | 19,631 | | 223 | |
| * | Emcore Corp. | 206,703 | | 221 | |
| * | BigBand Networks Inc. | 62,211 | | 214 | |
| * | Kenexa Corp. | 16,286 | | 213 | |
| * | Globecomm Systems Inc. | 26,984 | | 211 | |
| * | TeleCommunication | | | | |
| | Systems Inc. Class A | 21,624 | | 209 | |
| * | China Security & | | | | |
| | Surveillance Technology Inc. | 27,396 | | 209 | |
| * | Conexant Systems Inc. | 90,185 | | 209 | |
| | iGate Corp. | 20,828 | | 208 | |
| * | Immersion Corp. | 44,631 | | 204 | |
| * | Internap Network | | | | |
| | Services Corp. | 41,979 | | 197 | |
| * | Intevac Inc. | 17,050 | | 196 | |
| * | Volterra Semiconductor Corp. | 9,648 | | 184 | |
| * | Gerber Scientific In c. | 36,466 | | 184 | |
| * | Openwave Systems Inc. | 80,502 | | 184 | |
| * | FSI International Inc. | 62,208 | | 183 | |
| * | Oplink Communications Inc. | 11,154 | | 183 | |
| * | Callidus Software Inc. | 60,415 | | 182 | |
| * | OSI Systems Inc. | 6,677 | | 182 | |
| * | Maxwell Technologies Inc. | 9,989 | | 178 | |
| * | Integral Systems Inc. | 20,283 | | 176 | |
| * | Perficient Inc. | 20,733 | | 175 | |
| * | Universal Display Corp. | 13,749 | | 170 | |
| * | S1 Corp. | 25,446 | | 166 | |
| * | Chordiant Software Inc. | 60,010 | | 165 | |
| * | LaserCard Corp. | 28,524 | | 165 | |
| * | Netezza Corp. | 16,838 | | 163 | |
| | Imergent Inc. | 26,593 | | 161 | |
40
Institutional Total Stock Market Index Fund
| | | | | |
| | | | | Market | |
| | | | | Value• | |
| | | Shares | ($ | 000 | ) |
| * | Silicon Graphics | | | | |
| | International Corp. | 23,021 | | 161 | |
| * | Lionbridge Technologies Inc. | 70,099 | | 161 | |
| * | LivePerson Inc. | 23,085 | | 161 | |
| * | Newport Corp. | 17,430 | | 160 | |
| * | CalAmp Corp. | 45,896 | | 158 | |
| * | Dot Hill Systems Corp. | 81,746 | | 155 | |
| * | Virage Logic Corp. | 26,890 | | 148 | |
| * | Synchronoss | | | | |
| | Technologies Inc. | 9,156 | | 145 | |
| * | IPG Photonics Corp. | 8,444 | | 141 | |
| * | Nanometrics Inc. | 12,155 | | 138 | |
| * | Mindspeed | | | | |
| | Technologies Inc. | 29,313 | | 137 | |
| * | Ixia | 18,337 | | 136 | |
| * | Vocus Inc. | 7,529 | | 136 | |
| * | LoopNet Inc. | 13,515 | | 134 | |
| * | 3PAR Inc. | 11,163 | | 132 | |
| * | Supertex Inc. | 4,234 | | 126 | |
| * | Ultratech Inc. | 8,439 | | 125 | |
| * | LoJack Corp. | 30,792 | | 124 | |
| * | Terremark Worldwide Inc. | 18,078 | | 124 | |
| * | Airvana Inc. | 16,201 | | 123 | |
| * | American Technology Corp. | 82,441 | | 122 | |
| * | MIPS Technologies Inc. | | | | |
| | Class A | 27,892 | | 122 | |
| * | Network Equipment | | | | |
| | Technologies Inc. | 29,565 | | 120 | |
| | American Software Inc. | | | | |
| | Class A | 19,899 | | 119 | |
| * | Move Inc. | 71,496 | | 119 | |
| * | Silicon Image Inc. | 45,871 | | 118 | |
| * | Measurement | | | | |
| | Specialties Inc. | 11,379 | | 114 | |
| * | PC-Tel Inc. | 19,282 | | 114 | |
| * | StarTek Inc. | 15,179 | | 114 | |
| | Technitrol Inc. | 25,898 | | 113 | |
| * | Radisys Corp. | 11,734 | | 112 | |
| | Opnet Technologies Inc. | 8,782 | | 107 | |
| * | Edgewater Technology Inc. | 35,278 | | 106 | |
| | Cass Information | | | | |
| | Systems Inc. | 3,441 | | 105 | |
| * | SMART Modular | | | | |
| | Technologies WWH Inc. | 16,486 | | 104 | |
| * | Hughes Communications Inc. | 3,935 | | 102 | |
| * | Autobytel Inc. | 100,903 | | 101 | |
| * | NetSuite Inc. | 6,300 | | 101 | |
| | Marchex Inc. Class B | 19,772 | | 100 | |
| * | ShoreTel Inc. | 17,242 | | 100 | |
| * | Silicon Storage | | | | |
| | Technology Inc. | 38,496 | | 99 | |
| * | VASCO Data Security | | | | |
| | International Inc. | 15,503 | | 97 | |
| * | Smith Micro Software Inc. | 10,254 | | 94 | |
| * | Saba Software Inc. | 22,394 | | 93 | |
| * | Pericom Semiconductor Corp. | 7,966 | | 92 | |
| | | | | |
| | | | | Market | |
| | | | | Value• | |
| | | Shares | ($ | 000 | ) |
| * | Authentidate Holding Corp. | 84,076 | | 88 | |
| * | Presstek Inc. | 40,414 | | 86 | |
| * | Entropic Communications Inc. | 28,035 | | 86 | |
| * | Cyberoptics Corp. | 12,617 | | 85 | |
| * | AuthenTec Inc. | 37,634 | | 83 | |
| * | Super Micro Computer Inc. | 7,457 | | 83 | |
| * | Utstarcom Inc. | 37,662 | | 82 | |
| * | Cinedigm Digital | | | | |
| | Cinema Corp. Class A | 66,166 | | 82 | |
| * | Spectrum Control Inc. | 8,322 | | 79 | |
| * | Seachange International Inc. | 11,978 | | 79 | |
| * | Aware Inc. | 27,498 | | 77 | |
| * | support.com Inc. | 28,656 | | 76 | |
| * | Concurrent Computer Corp. | 18,716 | | 75 | |
| * | China Information Security | | | | |
| | Technology Inc. | 11,907 | | 73 | |
| * | Zygo Corp. | 10,741 | | 72 | |
| * | Magma Design | | | | |
| | Automation Inc. | 31,132 | | 72 | |
| * | Powerwave | | | | |
| | Technologies Inc. | 55,133 | | 69 | |
| * | NU Horizons | | | | |
| | Electronics Corp. | 16,256 | | 67 | |
| * | Internet Brands Inc. Class A | 8,358 | | 65 | |
| * | Evolving Systems Inc. | 10,456 | | 65 | |
| * | Dynamics Research Corp. | 6,159 | | 65 | |
| * | Rudolph Technologies Inc. | 9,446 | | 63 | |
| * | Symmetricom Inc. | 12,104 | | 63 | |
| * | On2 Technologies Inc. | 101,265 | | 62 | |
| * | Symyx Technologies Inc. | 11,194 | | 62 | |
| * | Mattson Technology Inc. | 17,005 | | 61 | |
| * | Information Services | | | | |
| | Group Inc. | 18,500 | | 59 | |
| * | SRS Labs Inc. | 7,958 | | 58 | |
| * | Web.com Group Inc. | 8,564 | | 56 | |
| * | Photronics Inc. | 12,399 | | 55 | |
| * | Online Resources Corp. | 10,489 | | 55 | |
| * | PC Connection Inc. | 7,935 | | 54 | |
| | TheStreet.com Inc. | 22,202 | | 53 | |
| * | PROS Holdings Inc. | 5,100 | | 53 | |
| | Ipass Inc.�� | 48,300 | | 50 | |
| * | Ness Technologies Inc. | 9,900 | | 49 | |
| * | MoSys Inc. | 12,209 | | 48 | |
| * | Geeknet Inc. | 39,329 | | 47 | |
| * | NCI Inc. Class A | 1,600 | | 44 | |
| * | Trident Microsystems Inc. | 23,681 | | 44 | |
| * | QuickLogic Corp. | 20,338 | | 43 | |
| * | GSE Systems Inc. | 7,184 | | 39 | |
| * | Planar Systems Inc. | 13,595 | | 39 | |
| * | Wave Systems Corp. | | | | |
| | Class A | 27,132 | | 39 | |
| * | DemandTec Inc. | 4,299 | | 38 | |
| * | PLATO Learning Inc. | 8,094 | | 35 | |
| | QAD Inc. | 5,641 | | 34 | |
| * | Transwitch Corp. | 16,332 | | 34 | |
| * | PLX Technology Inc. | 10,154 | | 33 | |
41
Institutional Total Stock Market Index Fund
| | | | | |
| | | | | Market | |
| | | | | Value• | |
| | | Shares | ($ | 000 | ) |
| * | Merix Corp. | 13,354 | | 33 | |
| * | Rimage Corp. | 1,873 | | 32 | |
| * | WebMediaBrands Inc. | 36,066 | | 32 | |
| * | Datalink Corp. | 6,944 | | 30 | |
| * | TechTeam Global Inc. | 3,948 | | 30 | |
| * | Analysts International Corp. | 43,421 | | 29 | |
| * | Ditech Networks Inc. | 22,501 | | 29 | |
| | Bel Fuse Inc. Class A | 1,477 | | 29 | |
| * | Phoenix Technologies Ltd. | 10,207 | | 28 | |
| * | EndWave Corp. | 11,401 | | 28 | |
| * | White Electronic | | | | |
| | Designs Corp. | 5,637 | | 26 | |
| * | Telular Corp. | 7,011 | | 26 | |
| * | Orbcomm Inc. | 9,500 | | 26 | |
| * | Looksmart Ltd. | 24,938 | | 25 | |
| * | RAE Systems Inc. | 22,642 | | 25 | |
| * | PAR Technology Corp. | 4,300 | | 25 | |
| | Keithley Instruments Inc. | 5,060 | | 24 | |
| * | Bsquare Corp. | 9,265 | | 23 | |
| * | Lantronix Inc. | 6,945 | | 23 | |
| * | PDF Solutions Inc. | 5,752 | | 22 | |
| * | Tollgrade | | | | |
| | Communications Inc. | 3,588 | | 22 | |
| * | Zhone Technologies Inc. | 51,901 | | 21 | |
| * | CPI International Inc. | 1,600 | | 21 | |
| * | Pixelworks Inc. | 6,860 | | 21 | |
| * | Rainmaker Systems Inc. | 13,990 | | 21 | |
| * | China TransInfo | | | | |
| | Technology Corp. | 2,500 | | 20 | |
| * | Convera Corp. Class A | 81,202 | | 20 | |
| * | ID Systems Inc. | 6,074 | | 20 | |
| * | Digital Angel Corp. | 25,038 | | 19 | |
| * | Superconductor | | | | |
| | Technologies Inc. | 7,694 | | 18 | |
| * | Comarco Inc. | 6,117 | | 17 | |
| * | Westell Technologies Inc. | | | | |
| | Class A | 12,309 | | 15 | |
| | Richardson Electronics Ltd. | 2,516 | | 15 | |
| * | Opnext Inc. | 7,514 | | 14 | |
| * | Network Engines Inc. | 10,019 | | 13 | |
| * | Parkervision Inc. | 7,288 | | 13 | |
| * | X-Rite Inc. | 5,944 | | 13 | |
| * | SCM Microsystems Inc. | 5,161 | | 12 | |
| * | Ramtron International Corp. | 6,348 | | 11 | |
| * | Techwell Inc. | 800 | | 11 | |
| * | Vertro Inc. | 24,139 | | 10 | |
| * | Transact Technologies Inc. | 1,434 | | 10 | |
| * | Digital Ally Inc. | 4,500 | | 9 | |
| * | Research Frontiers Inc. | 2,434 | | 9 | |
| * | Zix Corp. | 4,904 | | 8 | |
| * | EF Johnson | | | | |
| | Technologies Inc. | 7,007 | | 8 | |
| * | Elixir Gaming | | | | |
| | Technologies Inc. | 27,761 | | 7 | |
| * | eLoyalty Corp. | 859 | | 6 | |
| * | Nextwave Wireless Inc. | 12,200 | | 5 | |
| | | | | | |
| | | | | | Market | |
| | | | | | Value• | |
| | | | Shares | ($ | 000 | ) |
| | Selectica Inc. | | 16,188 | | 4 | |
| * | iGO Inc. | | 1,228 | | 2 | |
| * | Frequency Electronics Inc. | 283 | | 1 | |
| * | LeCroy Corp. | | 387 | | 1 | |
| * | Management | | | | | |
| | Network Group Inc. | | 2,896 | | 1 | |
| * | Ikanos Communications Inc. | 600 | | 1 | |
| * | ICx Technologies Inc. | | 100 | | 1 | |
| * | Wireless Telecom Group Inc. | 1,279 | | 1 | |
| * | Allen Organ Co. | | | | | |
| | Escrow Shares | | 283 | | 1 | |
| | | | | | 2,364,455 | |
| Materials (3.9%) | | | | | |
| | Monsanto Co. | | 542,105 | | 44,317 | |
| * | Freeport-McMoRan | | | | | |
| | Copper & Gold Inc. | | 408,949 | | 32,835 | |
| | Dow Chemical Co. | 1,135,574 | | 31,376 | |
| | EI du Pont de | | | | | |
| | Nemours & Co. | | 897,217 | | 30,209 | |
| | Praxair Inc. | | 304,600 | | 24,462 | |
| | Newmont Mining Corp. | 476,465 | | 22,542 | |
| | Air Products & | | | | | |
| | Chemicals Inc. | | 208,577 | | 16,907 | |
| | Alcoa Inc. | | 967,963 | | 15,604 | |
| | Nucor Corp. | | 312,827 | | 14,593 | |
| | International Paper Co. | | 408,580 | | 10,942 | |
| | Ecolab Inc. | | 235,409 | | 10,495 | |
| | PPG Industries Inc. | | 163,990 | | 9,600 | |
| | Mosaic Co. | | 154,797 | | 9,246 | |
| | Weyerhaeuser Co. | | 210,168 | | 9,067 | |
| | United States Steel Corp. | 142,531 | | 7,856 | |
| | Vulcan Materials Co. | | 124,326 | | 6,548 | |
| | Sigma-Aldrich Corp. | | 121,239 | | 6,126 | |
| | Cliffs Natural Resources Inc. | 130,345 | | 6,008 | |
| * | Owens-Illinois Inc. | | 167,383 | | 5,502 | |
| | Lubrizol Corp. | | 67,326 | | 4,911 | |
| | MeadWestvaco Corp. | | 170,108 | | 4,870 | |
| | Ball Corp. | | 88,895 | | 4,596 | |
| | Celanese Corp. Class A | 142,705 | | 4,581 | |
| | Eastman Chemical Co. | | 72,273 | | 4,354 | |
| | CF Industries Holdings Inc. | 45,810 | | 4,159 | |
| * | Crown Holdings Inc. | | 159,213 | | 4,073 | |
| | Walter Energy Inc. | | 52,648 | | 3,965 | |
| | Martin Marietta | | | | | |
| | Materials Inc. | | 44,308 | | 3,962 | |
| | Allegheny Technologies Inc. | 87,700 | | 3,926 | |
| | FMC Corp. | | 68,791 | | 3,836 | |
| | Nalco Holding Co. | | 137,502 | | 3,508 | |
| | Airgas Inc. | | 73,361 | | 3,492 | |
| | Sealed Air Corp. | | 158,360 | | 3,462 | |
| | Steel Dynamics Inc. | | 192,617 | | 3,413 | |
| | International Flavors & | | | | | |
| | Fragrances Inc. | | 78,730 | | 3,239 | |
| | Terra Industries Inc. | | 99,683 | | 3,209 | |
| | Bemis Co. Inc. | | 107,673 | | 3,192 | |
| * | Pactiv Corp. | | 131,482 | | 3,174 | |
42
Institutional Total Stock Market Index Fund
| | | | | |
| | | | | Market | |
| | | | | Value• | |
| | | Shares | ($ | 000 | ) |
| | Sonoco Products Co. | 99,367 | | 2,906 | |
| | Reliance Steel & | | | | |
| | Aluminum Co. | 65,712 | | 2,840 | |
| | Ashland Inc. | 70,645 | | 2,799 | |
| | Albemarle Corp. | 72,991 | | 2,655 | |
| | RPM International Inc. | 129,039 | | 2,623 | |
| | Valspar Corp. | 94,876 | | 2,575 | |
| | Aptargroup Inc. | 67,696 | | 2,419 | |
| | Packaging Corp. | | | | |
| | of America | 102,651 | | 2,362 | |
| | AK Steel Holding Corp. | 109,502 | | 2,338 | |
| * | Domtar Corp. | 41,700 | | 2,311 | |
| | Compass Minerals | | | | |
| | International Inc. | 32,518 | | 2,185 | |
| | Temple-Inland Inc. | 100,487 | | 2,121 | |
| | Huntsman Corp. | 166,835 | | 1,884 | |
| | Rock-Tenn Co. Class A | 36,617 | | 1,846 | |
| * | WR Grace & Co. | 72,201 | | 1,830 | |
| | Royal Gold Inc. | 38,641 | | 1,820 | |
| | Scotts Miracle-Gro Co. | | | | |
| | Class A | 45,833 | | 1,802 | |
| | Cytec Industries Inc. | 48,523 | | 1,767 | |
| | Commercial Metals Co. | 112,818 | | 1,766 | |
| | Cabot Corp. | 65,087 | | 1,707 | |
| | Silgan Holdings Inc. | 26,889 | | 1,556 | |
| * | Solutia Inc. | 119,498 | | 1,518 | |
| * | Titanium Metals Corp. | 117,641 | | 1,473 | |
| * | Hecla Mining Co. | 236,937 | | 1,464 | |
| | NewMarket Corp. | 12,147 | | 1,394 | |
| | Olin Corp. | 78,605 | | 1,377 | |
| * | Coeur d’Alene Mines Corp. | 75,679 | | 1,367 | |
| | Greif Inc. Class A | 24,454 | | 1,320 | |
| * | Intrepid Potash Inc. | 44,742 | | 1,305 | |
| | Sensient Technologies Corp. | 48,920 | | 1,287 | |
| | Schweitzer-Mauduit | | | | |
| | International Inc. | 17,549 | | 1,235 | |
| | Carpenter Technology Corp. | 43,722 | | 1,178 | |
| | HB Fuller Co. | 48,625 | | 1,106 | |
| | Eagle Materials Inc. | 41,349 | | 1,077 | |
| | Schnitzer Steel Industries Inc. | 22,135 | | 1,056 | |
| * | Rockwood Holdings Inc. | 44,618 | | 1,051 | |
| | Arch Chemicals Inc. | 34,007 | | 1,050 | |
| | Minerals Technologies Inc. | 19,012 | | 1,036 | |
| * | OM Group Inc. | 30,682 | | 963 | |
| * | Allied Nevada Gold Corp. | 62,463 | | 942 | |
| * | Century Aluminum Co. | 58,114 | | 941 | |
| | Balchem Corp. | 26,386 | | 884 | |
| | AMCOL International Corp. | 30,784 | | 875 | |
| * | Louisiana-Pacific Corp. | 124,400 | | 868 | |
| | Texas Industries Inc. | 24,039 | | 841 | |
| | Worthington Industries Inc. | 63,407 | | 829 | |
| * | Calgon Carbon Corp. | 53,602 | | 745 | |
| * | RTI International Metals Inc. | 28,409 | | 715 | |
| * | Buckeye Technologies Inc. | 63,535 | | 620 | |
| | Ferro Corp. | 75,121 | | 619 | |
| | | | | |
| | | | | Market | |
| | | | | Value• | |
| | | Shares | ($ | 000 | ) |
| * | Clearwater Paper Corp. | 11,234 | | 618 | |
| | Glatfelter | 49,041 | | 596 | |
| * | Brush Engineered | | | | |
| | Materials Inc. | 29,625 | | 549 | |
| | Koppers Holdings Inc. | 17,995 | | 548 | |
| * | Graphic Packaging | | | | |
| | Holding Co. | 149,571 | | 519 | |
| | Kaiser Aluminum Corp. | 10,901 | | 454 | |
| | Deltic Timber Corp. | 9,556 | | 441 | |
| | Innophos Holdings Inc. | 18,709 | | 430 | |
| | American Vanguard Corp. | 51,614 | | 428 | |
| * | PolyOne Corp. | 56,660 | | 423 | |
| * | Stillwater Mining Co. | 38,336 | | 363 | |
| * | US Energy Corp. Wyoming | 59,038 | | 350 | |
| | Westlake Chemical Corp. | 13,796 | | 344 | |
| | A Schulman Inc. | 16,922 | | 341 | |
| | Stepan Co. | 5,267 | | 341 | |
| | Neenah Paper Inc. | 23,778 | | 332 | |
| | AM Castle & Co. | 23,627 | | 323 | |
| | Zep Inc. | 18,632 | | 323 | |
| * | Headwaters Inc. | 49,154 | | 320 | |
| | Myers Industries Inc. | 34,683 | | 316 | |
| * | Omnova Solutions Inc. | 49,972 | | 306 | |
| * | Horsehead Holding Corp. | 23,554 | | 300 | |
| | Olympic Steel Inc. | 9,204 | | 300 | |
| | Haynes International Inc. | 8,633 | | 285 | |
| | Wausau Paper Corp. | 24,064 | | 279 | |
| | Hawkins Inc. | 11,452 | | 250 | |
| * | Zoltek Cos. Inc. | 26,084 | | 248 | |
| | Spartech Corp. | 24,140 | | 248 | |
| | Innospec Inc. | 24,208 | | 244 | |
| | Quaker Chemical Corp. | 10,875 | | 224 | |
| * | Landec Corp. | 34,836 | | 217 | |
| * | General Moly Inc. | 96,245 | | 200 | |
| * | US Gold Corp. | 63,862 | | 158 | |
| * | Mercer International Inc. | 49,123 | | 151 | |
| * | LSB Industries Inc. | 10,487 | | 148 | |
| * | China Green Agriculture Inc. | 9,400 | | 138 | |
| * | AEP Industries Inc. | 3,419 | | 131 | |
| *,^ | Altair Nanotechnologies Inc. | 140,448 | | 124 | |
| * | Bway Holding Co. | 5,722 | | 110 | |
| | Penford Corp. | 10,007 | | 87 | |
| * | Boise Inc. | 15,652 | | 83 | |
| * | Ampal American Israel | | | | |
| | Class A | 30,549 | | 82 | |
| * | US Concrete Inc. | 82,936 | | 75 | |
| * | American Pacific Cor p. | 9,521 | | 74 | |
| *,^ | Flotek Industries Inc. | 48,352 | | 65 | |
| * | General Steel Holdings Inc. | 14,370 | | 63 | |
| * | Universal Stainless & Alloy | 3,011 | | 57 | |
| * | Nanophase | | | | |
| | Technologies Corp. | 45,851 | | 40 | |
| * | Georgia Gulf Corp. | 1,935 | | 34 | |
| | ICO Inc. | 4,163 | | 30 | |
| * | China Precision Steel Inc. | 14,137 | | 29 | |
43
Institutional Total Stock Market Index Fund
| | | | | |
| | | | | Market | |
| | | | | Value• | |
| | | Shares | ($ | 000 | ) |
| * | China Direct Industries Inc. | 23,899 | | 28 | |
| * | United States Lime & | | | | |
| | Minerals Inc. | 600 | | 21 | |
| * | ADA-ES Inc. | 3,100 | | 19 | |
| * | Senomyx Inc. | 4,700 | | 18 | |
| * | Verso Paper Corp. | 2,500 | | 7 | |
| | | | | 478,637 | |
| Telecommunication Services (2.9%) | | | |
| | AT&T Inc. | 5,858,161 | | 164,204 | |
| | Verizon | | | | |
| | Communications Inc. | 2,820,519 | | 93,444 | |
| * | American Tower Corp. | | | | |
| | Class A | 392,021 | | 16,939 | |
| * | Crown Castle | | | | |
| | International Corp. | 289,450 | | 11,300 | |
| | CenturyTel Inc. | 295,467 | | 10,699 | |
| * | Sprint Nextel Corp. | 2,890,619 | | 10,580 | |
| | Qwest Communications | | | | |
| | International Inc. | 1,543,152 | | 6,497 | |
| * | NII Holdings Inc. | 165,194 | | 5,547 | |
| | Windstream Corp. | 434,960 | | 4,780 | |
| * | SBA Communications | | | | |
| | Corp. Class A | 104,305 | | 3,563 | |
| | Telephone & Data | | | | |
| | Systems Inc. | 89,306 | | 3,029 | |
| * | tw telecom inc Class A | 149,106 | | 2,556 | |
| * | Level 3 | | | | |
| | Communications Inc. | 1,628,680 | | 2,492 | |
| | Frontier | | | | |
| | Communications Corp. | 311,826 | | 2,435 | |
| * | MetroPCS | | | | |
| | Communications Inc. | 247,277 | | 1,887 | |
| * | Syniverse Holdings Inc. | 65,055 | | 1,137 | |
| * | Leap Wireless | | | | |
| | International Inc. | 61,587 | | 1,081 | |
| * | Cincinnati Bell Inc. | 249,712 | | 861 | |
| | Atlantic Tele-Network Inc. | 14,340 | | 789 | |
| * | United States Cellular Corp. | 18,477 | | 784 | |
| | NTELOS Holdings Corp. | 34,231 | | 610 | |
| * | AboveNet Inc. | 8,559 | | 557 | |
| * | Neutral Tandem Inc. | 21,849 | | 497 | |
| * | Premiere Global | | | | |
| | Services Inc. | 58,706 | | 484 | |
| | Alaska Communications | | | | |
| | Systems Group Inc. | 56,014 | | 447 | |
| | Shenandoah | | | | |
| | Telecommunications Co. | 21,717 | | 442 | |
| * | Cogent Communications | | | | |
| | Group Inc. | 40,662 | | 401 | |
| | Consolidated | | | | |
| | Communications | | | | |
| | Holdings Inc. | 22,508 | | 394 | |
| * | Cbeyond Inc. | 20,336 | | 320 | |
| * | PAETEC Holding Corp. | 72,817 | | 302 | |
| | | | | |
| | | | | Market | |
| | | | | Value• | |
| | | Shares | ($ | 000 | ) |
| | Iowa Telecommunications | | | | |
| | Services Inc. | 17,711 | | 297 | |
| * | General Communication Inc. | | | |
| | Class A | 45,071 | | 288 | |
| * | Global Crossing Ltd. | 20,176 | | 287 | |
| | Telephone & Data | | | | |
| | Systems Inc.- | | | | |
| | Special Common Shares | 7,633 | | 231 | |
| | USA Mobility Inc. | 20,773 | | 229 | |
| | HickoryTech Corp. | 22,563 | | 199 | |
| * | Vonage Holdings Corp. | 121,632 | | 170 | |
| * | 8x8 Inc. | 70,343 | | 106 | |
| * | Arbinet Corp. | 42,059 | | 104 | |
| * | SureWest | | | | |
| | Communications | 9,822 | | 98 | |
| * | ICO Global | | | | |
| | Communications | | | | |
| | Holdings Ltd. | 74,963 | | 81 | |
| * | TerreStar Corp. | 82,047 | | 77 | |
| * | FiberTower Corp. | 16,179 | | 68 | |
| * | IDT Corp. Class B | 9,967 | | 48 | |
| * | IDT Corp. | 552 | | 2 | |
| | | | | 351,343 | |
| Utilities (3.8%) | | | | |
| | Exelon Corp. | 654,357 | | 31,979 | |
| | Southern Co. | 790,452 | | 26,338 | |
| | Dominion Resources Inc. | 591,151 | | 23,008 | |
| | Duke Energy Corp. | 1,287,701 | | 22,161 | |
| | FPL Group Inc. | 388,200 | | 20,505 | |
| | Public Service | | | | |
| | Enterprise Group Inc. | 502,556 | | 16,710 | |
| | American Electric | | | | |
| | Power Co. Inc. | 473,587 | | 16,476 | |
| | PG&E Corp. | 368,276 | | 16,444 | |
| | Entergy Corp. | 194,419 | | 15,911 | |
| | FirstEnergy Corp. | 303,062 | | 14,077 | |
| | Sempra Energy | 231,517 | | 12,960 | |
| | Consolidated Edison Inc. | 273,128 | | 12,408 | |
| | PPL Corp. | 374,225 | | 12,091 | |
| | Progress Energy Inc. | 277,557 | | 11,383 | |
| | Edison International | 307,799 | | 10,705 | |
| | Xcel Energy Inc. | 453,079 | | 9,614 | |
| * | AES Corp. | 663,308 | | 8,829 | |
| | Questar Corp. | 173,250 | | 7,202 | |
| | DTE Energy Co. | 163,663 | | 7,134 | |
| | Ameren Corp. | 232,172 | | 6,489 | |
| | Constellation Energy | | | | |
| | Group Inc. | 179,612 | | 6,317 | |
| * | NRG Energy Inc. | 263,929 | | 6,231 | |
| | Wisconsin Energy Corp. | 116,127 | | 5,787 | |
| | EQT Corp. | 123,772 | | 5,436 | |
| | CenterPoint Energy Inc. | 365,729 | | 5,307 | |
| | Northeast Utilities | 174,420 | | 4,498 | |
| | Oneok Inc. | 99,513 | | 4,435 | |
| | SCANA Corp. | 115,850 | | 4,365 | |
44
Institutional Total Stock Market Index Fund
| | | | | |
| | | | | Market | |
| | | | | Value• | |
| | | Shares | ($ | 000 | ) |
| | NiSource Inc. | 273,756 | | 4,210 | |
| | MDU Resources | | | | |
| | Group Inc. | 173,847 | | 4,103 | |
| | Allegheny Energy Inc. | 168,675 | | 3,961 | |
| | NSTAR | 106,443 | | 3,917 | |
| | American Water | | | | |
| | Works Co. Inc. | 173,839 | | 3,896 | |
| * | Calpine Corp. | 351,340 | | 3,865 | |
| | Pepco Holdings Inc. | 219,702 | | 3,702 | |
| | Pinnacle West Capital Corp. | 100,499 | | 3,676 | |
| | National Fuel Gas Co. | 72,055 | | 3,603 | |
| | CMS Energy Corp. | 228,226 | | 3,574 | |
| | OGE Energy Corp. | 95,966 | | 3,540 | |
| | Alliant Energy Corp. | 109,926 | | 3,326 | |
| | TECO Energy Inc. | 202,406 | | 3,283 | |
| | Integrys Energy Group Inc. | 76,001 | | 3,191 | |
| | DPL Inc. | 115,189 | | 3,179 | |
| | Energen Corp. | 67,767 | | 3,172 | |
| | NV Energy Inc. | 233,124 | | 2,886 | |
| | AGL Resources Inc. | 77,151 | | 2,814 | |
| | Atmos Energy Corp. | 91,721 | | 2,697 | |
| | Great Plains Energy Inc. | 135,211 | | 2,622 | |
| | UGI Corp. | 107,830 | | 2,608 | |
| | ITC Holdings Corp. | 49,740 | | 2,591 | |
| | Aqua America Inc. | 135,379 | | 2,371 | |
| | Westar Energy Inc. | 108,508 | | 2,357 | |
| * | Mirant Corp. | 144,925 | | 2,213 | |
| * | RRI Energy Inc. | 350,305 | | 2,004 | |
| | Piedmont Natural | | | | |
| | Gas Co. Inc. | 73,682 | | 1,971 | |
| | Hawaiian Electric | | | | |
| | Industries Inc. | 91,873 | | 1,920 | |
| | Vectren Corp. | 77,277 | | 1,907 | |
| | Nicor Inc. | 44,926 | | 1,891 | |
| | WGL Holdings Inc. | 50,199 | | 1,684 | |
| | Cleco Corp. | 60,823 | | 1,662 | |
| | New Jersey | | | | |
| | Resources Corp. | 41,896 | | 1,567 | |
| | Portland General Electric Co. | 75,290 | | 1,537 | |
| | IDACORP Inc. | 47,298 | | 1,511 | |
| | Southwest Gas Corp. | 44,624 | | 1,273 | |
| | Northwest Natural Gas Co. | 26,434 | | 1,191 | |
| | Avista Corp. | 54,377 | | 1,174 | |
| | Unisource Energy Corp. | 36,123 | | 1,163 | |
| | South Jersey Industries Inc. | 29,701 | | 1,134 | |
| | PNM Resources Inc. | 86,354 | | 1,092 | |
| | | | | |
| | | | | Market | |
| | | | | Value• | |
| | | Shares | ($ | 000 | ) |
| | Black Hills Corp. | 38,580 | | 1,027 | |
| | Allete Inc. | 28,818 | | 942 | |
| | NorthWestern Corp. | 35,885 | | 934 | |
| * | El Paso Electric Co. | 45,147 | | 916 | |
| * | Dynegy Inc. Class A | 502,998 | | 910 | |
| | Laclede Group Inc. | 25,062 | | 846 | |
| | MGE Energy Inc. | 22,995 | | 822 | |
| | Ormat Technologies Inc. | 20,562 | | 778 | |
| | UIL Holdings Corp. | 26,952 | | 757 | |
| | American States Water Co. | 20,109 | | 712 | |
| | California Water | | | | |
| | Service Group | 18,768 | | 691 | |
| | CH Energy Group Inc. | 15,832 | | 673 | |
| | Empire District Electric Co. | 33,018 | | 619 | |
| | Connecticut Water | | | | |
| | Service Inc. | 17,283 | | 428 | |
| | SJW Corp. | 17,108 | | 386 | |
| | Central Vermont | | | | |
| | Public Service Corp. | 14,906 | | 310 | |
| | Southwest Water Co. | 51,788 | | 305 | |
| | Chesapeake Utilities Corp. | 8,911 | | 286 | |
| | Consolidated Water Co. Ltd. | 11,813 | | 169 | |
| * | Cadiz Inc. | 13,055 | | 156 | |
| | Maine & Maritimes Corp. | 3,424 | | 119 | |
| | Middlesex Water Co. | 6,752 | | 119 | |
| * | China Natural Gas Inc. | 3,800 | | 42 | |
| | Unitil Corp. | 1,343 | | 31 | |
| | York Water Co. | 1,850 | | 27 | |
| * | Synthesis Energy | | | | |
| | Systems Inc. | 15,100 | | 14 | |
| | Artesian Resources Corp. | | | | |
| | Class A | 619 | | 11 | |
| | Pennichuck Corp. | 102 | | 2 | |
| * | Purecycle Corp. | 100 | | — | |
| | | | | 463,870 | |
| Total Common Stocks | | | | |
| (Cost $12,470,323) | | | 12,149,713 | |
| Convertible Preferred Stock (0.0%) | | | |
| Consumer Discretionary (0.0%) | | | | |
| 2 | Sealy Corp., 8.000% | | | | |
| | (Cost $55) | 430 | | 37 | |
| Temporary Cash Investments (1.0%)1 | | | |
| Money Market Fund (0.9%) | | | | |
| 3,4 | Vanguard Market | | | | |
| | Liquidity Fund, 0.187% | 110,261,835 | | 110,262 | |
45
Institutional Total Stock Market Index Fund
| | | | | | | |
| | | | Face | | | Market | |
| | | | Amount | | | Value• | |
| | | ($ | 000 | ) | ($ | 000 | ) |
| U.S. Government and Agency Obligations (0.1%) | |
| 5,6 | Fannie Mae | | | | | | |
| | Discount Notes, | | | | | | |
| | 0.200%, 2/24/10 | | 3,000 | | | 2,999 | |
| 5,6 | Federal Home Loan | | | | | | |
| | Bank Discount Notes, | | | | | | |
| | 0.275%, 2/19/10 | | 3,000 | | | 3,000 | |
| | | | | | | 5,999 | |
| Total Temporary Cash Investments | | | | |
| (Cost $116,260) | | | | | 116,261 | |
| Total Investments (100.4%) | | | | | | |
| (Cost $12,586,638) | | | | | 12,266,011 | |
| Other Assets and Liabilities (-0.4%) | | | | |
| Other Assets | | | | | 35,804 | |
| Liabilities4 | | | | | (81,502 | ) |
| | | | | | | (45,698 | ) |
| Net Assets (100%) | | | | | 12,220,313 | |
| | | |
| At December 31, 2009, net assets consisted of: | |
| | | Amount | |
| | ($ | 000 | ) |
| Paid-in Capital | | 12,947,331 | |
| Undistributed Net Investment Income | | 1,838 | |
| Accumulated Net Realized Losses | | (408,730 | ) |
| Unrealized Appreciation (Depreciation) | | | |
| Investment Securities | | (320,627 | ) |
| Futures Contracts | | 501 | |
| Net Assets | | 12,220,313 | |
| |
| |
| Institutional Shares—Net Assets | | | |
| Applicable to 68,539,814 outstanding | | | |
| $.001 par value shares of beneficial | | | |
| interest (unlimited authorization) | | 1,699,998 | |
| Net Asset Value Per Share— | | | |
| Institutional Shares | $ | 24.80 | |
| |
| |
| Institutional Plus Shares—Net Assets | | | |
| Applicable to 424,104,077 outstanding | | | |
| $.001 par value shares of beneficial | | | |
| interest (unlimited authorization) | | 10,520,315 | |
| Net Asset Value Per Share— | | | |
| Institutional Plus Shares | $ | 24.81 | |
• See Note A in Notes to Financial Statements. * Non-income-producing security.
^ Part of security position is on loan to broker-dealers. The total value of securities on loan is $29,466,000.
1 The fund invests a portion of its cash reserves in equity markets through the use of index futures contracts. After giving effect to futures investments, the fund’s effective common stock and temporary cash investment positions represent 100.0% and 0.4%, respectively, of net assets.
2 Non-income-producing security—new issue that has not paid a dividend as of December 31, 2009.
3 Affiliated money market fund available only to Vanguard funds and certain trusts and accounts managed by Vanguard. Rate shown is the 7-day yield.
4 Includes $32,811,000 of collateral received for securities on loan.
5 The issuer operates under a congressional charter; its securities are not backed by the full faith and credit of the U.S. government.
6 Securities with a value of $5,999,000 have been segregated as initial margin for open futures contracts.
REIT—Real Estate Investment Trust.
See accompanying Notes, which are an integral part of the Financial Statements.
46
| | | |
| Institutional Total Stock Market Index Fund | | | |
| |
| |
| Statement of Operations | | | |
| |
| | | Year Ended | |
| | | December 31, 2009 | |
| | ($ | 000 | ) |
| Investment Income | | | |
| Income | | | |
| Dividends | | 222,426 | |
| Interest1 | | 319 | |
| Security Lending | | 6,345 | |
| Total Income | | 229,090 | |
| Expenses | | | |
| The Vanguard Group—Note B | | | |
| Management and Administrati ve—Institutional Shares | | 728 | |
| Management and Administrative—Institutional Plus Shares | | 1,984 | |
| Total Expenses | | 2,712 | |
| Net Investment Income | | 226,378 | |
| Realized Net Gain (Loss) | | | |
| Investment Securities Sold | | (139,699 | ) |
| Futures Contracts | | 16,845 | |
| Realized Net Gain (Loss) | | (122,854 | ) |
| Change in Unrealized Appreciation (Depreciation) | | | |
| Investment Securities | | 2,713,666 | |
| Futures Contracts | | (3,052 | ) |
| Change in Unrealized Appreciation (Depreciation) | | 2,710,614 | |
| Net Increase (Decrease) in Net Assets Resulting from Operations | | 2,814,138 | |
| 1 Interest income from an affiliated company of the fund was $243,000. | | | |
| |
| |
| |
| |
| See accompanying Notes, which are an integral part of the Financial Statements. | | | |
47
| | | | | | |
| Institutional Total Stock Market Index Fund | | | | | | |
| |
| |
| Statement of Changes in Net Assets | | | | | | |
| |
| | | Year Ended December 31, | |
| | | 2009 | | | 2008 | |
| | ($ | 000 | ) | ($ | 000 | ) |
| Increase (Decrease) in Net Assets | | | | | | |
| Operations | | | | | | |
| Net Investment Income | | 226,378 | | | 197,362 | |
| Realized Net Gain (Loss) | | (122,854 | ) | | (175,332 | ) |
| Change in Unrealized Appreciation (Depreciation) | | 2,710,614 | | | (4,021,956 | ) |
| Net Increase (Decrease) in Net Assets Resulting from Operations | | 2,814,138 | | | (3,999,926 | ) |
| Distributions | | | | | | |
| Net Investment Income | | | | | | |
| Institutional Shares | | (37,609 | ) | | (29,244 | ) |
| Institutional Plus Shares | | (188,293 | ) | | (168,295 | ) |
| Realized Capital Gain | | | | | | |
| Institutional Shares | | — | | | — | |
| Institutional Plus Shares | | — | | | — | |
| Total Distributions | | (225,902 | ) | | (197,539 | ) |
| Capital Share Transactions | | | | | | |
| Institutional Shares | | 66,331 | | | 465,565 | |
| Institutional Plus Shares | | 1,829,292 | | | 1,597,986 | |
| Net Increase (Decrease) from Capital Share Transactions | | 1,895,623 | | | 2,063,551 | |
| Total Increase (Decrease) | | 4,483,859 | | | (2,133,914 | ) |
| Net Assets | | | | | | |
| Beginning of Period | | 7,736,454 | | | 9,870,368 | |
| End of Period1 | | 12,220,313 | | | 7,736,454 | |
| 1 Net Assets—End of Period includes undistributed net investment income of $1,838,000 and $1,362,000. | | | | |
See accompanying Notes, which are an integral part of the Financial Statements.
48
| | | | | | | | | | | | | | | |
| Institutional Total Stock Market Index Fund | | | | | | | | | | | | | | | |
| |
| |
| Financial Highlights | | | | | | | | | | | | | | | |
| |
| |
| Institutional Shares | | | | | | | | | | | | | | | |
| |
| For a Share Outstanding | | | | | | | | Year Ended December 31, | |
| Throughout Each Period | | 2009 | | | 2008 | | | 2007 | | | 2006 | | | 2005 | |
| Net Asset Value, Beginning of Period | $ | 19.68 | | $ | 31.89 | | $ | 30.71 | | $ | 27.00 | | $ | 25.83 | |
| Investment Operations | | | | | | | | | | | | | | | |
| Net Investment Income | | .483 | | | .550 | | | .547 | | | .501 | | | .398 | |
| Net Realized and Unrealized Gain (Loss) | | | | | | | | | | | | | | | |
| on Investments | | 5.120 | | | (12.208 | ) | | 1.179 | | | 3.710 | | | 1.169 | |
| Total from Investment Operations | | 5.603 | | | (11.658 | ) | | 1.726 | | | 4.211 | | | 1.567 | |
| Distributions | | | | | | | | | | | | | | | |
| Dividends from Net Investment Income | | (.483 | ) | | (.552 | ) | | (.546 | ) | | (.501 | ) | | (.397 | ) |
| Distributions from Realized Capital Gains | | — | | | — | | | — | | | — | | | — | |
| Total Distributions | | (.483 | ) | | (.552 | ) | | (.546 | ) | | (.501 | ) | | (.397 | ) |
| Net Asset Value, End of Period | $ | 24.80 | | $ | 19.68 | | $ | 31.89 | | $ | 30.71 | | $ | 27.00 | |
| |
| Total Return | | 28.84 | % | | -36.90 | % | | 5.60 | % | | 15.74 | % | | 6.14 | % |
| |
| Ratios/Supplemental Data | | | | | | | | | | | | | | | |
| Net Assets, End of Period (Millions) | $ | 1,700 | | $ | 1,106 | | $ | 1,271 | | $ | 939 | | $ | 129 | |
| Ratio of Total Expenses to | | | | | | | | | | | | | | | |
| Average Net Assets | | 0.045 | % | | 0.045 | % | | 0.045 | % | | 0.045 | % | | 0.050 | % |
| Ratio of Net Investment Income to | | | | | | | | | | | | | | | |
| Average Net Assets | | 2.36 | % | | 2.12 | % | | 1.81 | % | | 1.81 | % | | 1.77 | % |
| Portfolio Turnover Rate1 | | 13 | % | | 13 | % | | 10 | % | | 8 | % | | 21 | %2 |
| 1 | Excludes the value of portfolio securities received or delivered as a result of in-kind purchases or redemptions of the fund’s capital shares. |
| 2 | Includes activity related to a change in the fund’s target index. |
See accompanying Notes, which are an integral part of the Financial Statements.
49
| | | | | | | | | | | | | | | |
| Institutional Total Stock Market Index Fund | | | | | | | | | | | | | | | |
| |
| |
| Financial Highlights | | | | | | | | | | | | | | | |
| |
| |
| Institutional Plus Shares | | | | | | | | | | | | | | | |
| |
| For a Share Outstanding | | | | | | | | Year Ended December 31, | |
| Throughout Each Period | | 2009 | | | 2008 | | | 2007 | | | 2006 | | | 2005 | |
| Net Asset Value, Beginning of Period | $ | 19.68 | | $ | 31.89 | | $ | 30.71 | | $ | 27.00 | | $ | 25.83 | |
| Investment Operations | | | | | | | | | | | | | | | |
| Net Investment Income | | .487 | | | .556 | | | .553 | | | .506 | | | .404 | |
| Net Realized and Unrealized Gain (Loss) | | | | | | | | | | | | | | | |
| on Investments | | 5.130 | | | (12.209 | ) | | 1.179 | | | 3.710 | | | 1.169 | |
| Total from Investment Operations | | 5.617 | | | (11.653 | ) | | 1.732 | | | 4.216 | | | 1.573 | |
| Distributions | | | | | | | | | | | | | | | |
| Dividends from Net Investment Income | | (.487 | ) | | (.557 | ) | | (.552 | ) | | (.506 | ) | | (.403 | ) |
| Distributions from Realized Capital Gains | | — | | | — | | | — | | | — | | | — | |
| Total Distributions | | (.487 | ) | | (.557 | ) | | (.552 | ) | | (.506 | ) | | (.403 | ) |
| Net Asset Value, End of Period | $ | 24.81 | | $ | 19.68 | | $ | 31.89 | | $ | 30.71 | | $ | 27.00 | |
| |
| Total Return | | 28.92 | % | | -36.89 | % | | 5.62 | % | | 15.76 | % | | 6.17 | % |
| |
| Ratios/Supplemental Data | | | | | | | | | | | | | | | |
| Net Assets, End of Period (Millions) | $ | 10,520 | | $ | 6,631 | | $ | 8,599 | | $ | 4,615 | | $ | 3,587 | |
| Ratio of Total Expenses to | | | | | | | | | | | | | | | |
| Average Net Assets | | 0.025 | % | | 0.025 | % | | 0.025 | % | | 0.025 | % | | 0.025 | % |
| Ratio of Net Investment Income to | | | | | | | | | | | | | | | |
| Average Net Assets | | 2.38 | % | | 2.14 | % | | 1.83 | % | | 1.83 | % | | 1.80 | % |
| Portfolio Turnover Rate1 | | 13 | % | | 13 | % | | 10 | % | | 8 | % | | 21 | %2 |
| 1 | Excludes the value of portfolio securities received or delivered as a result of in-kind purchases or redemptions of the fund’s capital shares. |
| 2 | Includes activity related to a change in the fund’s target index. |
See accompanying Notes, which are an integral part of the Financial Statements.
50
Institutional Total Stock Market Index Fund
Notes to Financial Statements
Vanguard Institutional Total Stock Market Index Fund is registered under the Investment Company Act of 1940 as an open-end investment company, or mutual fund. The fund offers two classes of shares, Institutional Shares and Institutional Plus Shares, to investors who invest minimum amounts of $100 million and $200 million, respectively.
A. The following significant accounting policies conform to generally accepted accounting principles for
U.S. mutual funds. The fund consistently follows such policies in preparing its financial statements.
1. Security Valuation: Securities are valued as of the close of trading on the New York Stock Exchange (generally 4 p.m., Eastern time) on the valuation date. Equity securities are valued at the latest quoted sales prices or official closing prices taken from the primary market in which each security trades; such securities not traded on the valuation date are valued at the mean of the latest quoted bid and asked pric es. Securities for which market quotations are not readily availabl e, or whose values have been materially affected by events occurring before the fund’s pricing time but after the close of the securities’ primary markets, are valued by methods deemed by the board of trustees to represent fair value. Investments in Vanguard Market Liquidity Fund are value d at that fund’s net asset value. Temporary cash investments acquired over 60 days to maturity are valued using the latest bid prices or using valuations based on a matrix system (which considers such factors as security prices, yields, maturities, and ratings), both as furnished by independent pricing services. Other temporary cash investments are valued at amortized cost, which approximates market value.
2. Futures Contracts: The fund uses index futures contracts to a limited extent, with the objectives of maintaining full e xposure to the stock market, enhancing returns, maintaining liquidity, and minimizing transaction costs. The fund may purchase futures con tracts to immediately invest incoming cash in the market, or sell futures in response to cash outflows, thereby simulating a fully invested position in the underlying index while maintaining a cash balance for liquidity. The fund may seek to enhance returns by using futures contracts instead of the underlying securities when futures are believed to be priced more attractively than the underlying securities. The primary risks associated with the use of futures contracts are imperfect correlation between changes in market va lues of stocks held by the fund and the prices of futures contracts, and the possibility of an illiquid market.
Futures contracts are valued at their quoted daily settlement prices. The aggregate principal amounts of the contracts are not recorded in the Statement of Net Assets. Fluctuations in the value of the contracts are recorded in the Statement of Net Assets as an asset (liability) and in the Statement of Operations as unrealized appreciation (depreciation) until the contracts are closed, when they are recorded as realized futures gains (losses).
3. Federal Income Taxes: The fund intends to continue to qualify as a regulated investment company and distribute all of its taxable income. Management has analyzed the fund’s tax positions take n for all open federal income tax years (December 31, 2006–2009), and has concluded that no provision for federal income tax is required in the fund’s financial statements.
4. Distributions: Distributions to shareholders are recorded on the ex-dividend date.
5. Security Lending: The fund may lend its securities to qualified institutional borrowers to earn additional income. Security loans are required to be secured at all times by collateral at least equal to the market value of securities loaned. The fund invests cash collateral received in Vanguard Market Liquidity Fund, and records a liability for the return of the collateral, during the period the securities are on loan. Security lending income represents the income earned on investing c ash collateral, less expenses associated with the loan.
51
Institutional Total Stock Market Index Fund
6. Other: Dividend income is recorded on the ex-dividend date. Interest income includes income distributions received from Vanguard Market Liquidity Fund and is accrued daily. Security transactions are accounted for on the date securities are bought or sold. Costs used to determine realized gains (losses) on the sale of investment securities are those of the specific securities sold. Class-specific shareholder servicing fees are charged to each class at the contractual rate. Income, expenses not attributable to a specific class, and realized and unrealized gains and losses on investments are allocated to each class of shares based on its relative net assets.
B. The Vanguard Group provides investment advisory, corpo rate management, administrative, marketing, and distribution services and pays for all other operating expenses, except for taxes, in return for a fee calculated at an annual percentage rate of the average net assets of the fund, or, for shareholder services, each class of shares. The fund’s trustees and officers are also directors and officers of Vanguard.
C. Various inputs may be used to determine the value of the fund’s investments. These inputs are summarized in three broad levels for financial statement purposes. The inputs or methodologies used to value securities are not necessarily an indication of the risk associated with investing in those securities.
Level 1—Quoted prices in active markets for identical securities.
Level 2—Other significant observable inputs (including qu oted prices for similar securities, interest rates, prepayment speeds, credit risk, etc.).
Level 3—Significant unobservable inputs (including the fund’s own assumptions used to determine the fair value of investments).
The following table summarizes the fund’s investments as of December 31, 2009, based on the inputs used to value them:
| | | | | | | | | |
| | | Level 1 | | | Level 2 | | | Level 3 | |
| Investments | ($ | 000 | ) | ($ | 000 | ) | ($ | 000 | ) |
| Common Stocks | | 12,149,659 | | | 25 | | | 29 | |
| Convertible Preferred Stocks | | 37 | | | — | | | — | |
| Temporary Cash Investments | | 110,262 | | | 5,999 | | | — | |
| Futures Contracts—Liabilities1 | | (660 | ) | | — | | | — | |
| Total | | 12,259,298 | | | 6,024 | | | 29 | |
| 1 Represents variation margin on the last day of the reporting period. | | | | | | | | | |
The following table summarizes changes in investments valued based on Level 3 inputs during the year ended December 31, 2009:
| | | |
| | | Investments in | |
| | | Common Stocks | |
| Amount Valued Based on Level 3 Inputs | ($ | 000 | ) |
| Balance as of December 31, 2008 | | — | |
| Transfers into Level 3 | | 45 | |
| Change in Unrealized Appreciation (Depreciation) | | (16 | ) |
| Balance as of December 31, 2009 | | 29 | |
52
Institutional Total Stock Market Index Fund
D. At December 31, 2009, the aggregate settlement value of open futures contracts and the related unrealized appreciation (deprecia tion) were:
| | | | | | |
| | | | | ($ | 000 | ) |
| | | Number of | Aggregate | | Unrealized | |
| | | Long (Short) | Settlement | | Appreciation | |
| Futures Contracts | Expiration | Contracts | Value | | (Depreciation) | |
| S&P 500 Index | March 2010 | 98 | 27,212 | | 139 | |
| E-mini S&P 500 Index | March 2010 | 455 | 25,268 | | 75 | |
| Russell 2000 Mini Index | March 2010 | 138 | 8,610 | | 246 | |
| S&P MidCap 400 Index | March 2010 | 6 | 2,175 | | 41 | |
Unrealized appreciation (depreciation) on open futures contracts is required to be treated as realized gain (loss) for tax purposes.
E. Distributions are determined on a tax basis and may differ from net investment income and realized capital gains for financial reporting purposes. Differences may be permanent or temporary. Permanent differences are reclassified among capital accounts in the financial sta tements to reflect their tax character. Temporary differences arise when certain items of income, expense, gain, or loss are recognized in different periods for financial statement and tax purposes; these differences will reverse at some time in the future. Differences in classification may also result from the treatment of short-term gains as ordinary income for tax purposes.
For tax purposes, at December 31, 2009, the fund had $1,838,000 of ordinary income available for distribution. The fund had available capital loss carryforwards totaling $389,387,000 to offset future net capital gains of $26,053,000 through December 31, 2010, $44,357,000 through December 31, 2011, $5,005,000 through December 31, 2012, $9,611,000 through December 31, 2013, $96,976,000 through December 31, 2016, and $207,385,000 through December 31, 2017. In addition, the fund realized losses of $8,450,000 during the period from November 1, 2009, through December 31, 2009, which are deferred and will be treated as realized for tax purposes in fiscal 2010.
At December 31, 2009, the cost of investment sec urities for tax purposes was $12,597,030,000. Net unrealized depreciation of investment securities for tax purposes was $331,019,000, consisting of unrealized gains of $1,361,978,000 on securities that had risen in value since their purchase and $1,692,997,000 in unrealized losses on securities that had fallen in value since their purchase.
53
Institutional Total Stock Market Index Fund
F. During the year ended December 31, 2009, the fund purchased $3,162,562,000 of investment securities and sold $1,227,607,000 of investment securities, other than temporary cash investments.
| | | | | | | | | | |
| G. Capital share transactions for each class of shares w ere: | | | | | | | | |
| | | | | | | | Year Ended December 31, | |
| | | | | 2009 | | | | | 2008 | |
| | | Amount | | Shares | | | Amount | | Shares | |
| | ($ | 000 | ) | (000 | ) | ($ | 000 | ) | (000 | ) |
| Institutional Shares | | | | | | | | | | |
| Issued | | 616,126 | | 36,199 | | | 620,253 | | 22,203 | |
| Issued in Lieu of Cash Distributions | | 35,139 | | 1,632 | | | 26,476 | | 1,072 | |
| Redeemed | | (584,934 | ) | (25,497 | ) | | (181,164 | ) | (6,927 | ) |
| Net Increase (Decrease)—Institutional Shares | | 66,331 | | 12,334 | | | 465,565 | | 16,348 | |
| Institutional Plus Shares | | | | | | | | | | |
| Issued | | 3,248,471 | | 159,817 | | | 3,068,668 | | 128,801 | |
| Issued in Lieu of Cash Distributions | | 164,499 | | 7,560 | | | 156,894 | | 6,415 | |
| Redeemed | | (1,583,678 | ) | (80,238 | ) | | (1,627,576 | ) | (67,899 | ) |
| Net Increase (Decrease)—Institutional Plus Shares | | 1,829,292 | | 87,139 | | | 1,597,986 | | 67,317 | |
H. In preparing the financial statements as of December 31, 2009, management considered the impact of subsequent events occurring through February 10, 2010, for potential recognition or disclosure in these financial statements.
54
Report of Independent Registered Public Accounting Firm
To the Trustees of Vanguard Institutional Index Funds and the Shareholders of Vanguard Institutional
Total Stock Market Index Fund:
In our opinion, the accompanying statement of net a ssets and the related statements of operations and of changes in net assets and the financial highlights present fairly, in all material respects, the financial position of Vanguard Institutional Total Stock Market Index Fund (constituting a separate portfolio of Vanguard Institutional Index Funds, hereafter referred to as the “Fund”) at December 31, 2009, the results of its operations for the year then ended, the changes in its net assets for each of the two years in the period then ended and the finan cial highlights for each of the five years in the period then ended, in conformity with accounting principles generally accepted in the United States of America.
These financial statements and financial highlights (hereafter referred to as “financial statements”) are the responsibility of the Fund’s management; our responsibility is to express an opinion on these financial statements based on our audits. We conducted our audits of these financial statements in accordance with the standards of the Public Company Accounting Oversight Board (United States). Those standards require that we plan and perform the audit to obtain reasonable assurance about whether the financial statements are free of material misstatement. An audit includes examining, on a test basis, evidence supporting the amounts and disclosures in the financial statements, assessing the accounting principles used and significant estimates made by manageme nt, and evaluating the overall financial statement presentation. We believe that our audits, which included confirmation of securities at December 31, 2009 by correspondence with the custodian and broker and by agreement to the underlying ownership records of Vanguard Market Liquidity Fund, provide a reasonable basis for our opinion.
PricewaterhouseCoopers LLP
Philadelphia, Pennsylvania
February 10, 2010

Special 2009 tax information (unaudited) for Vanguard Institutional Total Stock Market Index Fund
This information for the fiscal year ended December 31, 2009, is included pursuant to provisions of the Internal Revenue Code.
The fund distributed $213,545,000 of qualified dividend income to shareholders during the fiscal year.
For corporate shareholders, 92.6% of investment income (dividend income plus short-term gains, if any) qualifies for the dividends-received deduction.
55
About Your Fund’s Expenses
As a shareholder of the fund, you incur ongoing costs, which include costs for portfolio management, administrative services, and shareholder reports (like this one), among others. Operating expenses, which are deducted from a fund’s gross income, directly reduce the investment return of the fund.
A fund’s expenses are expressed as a percentage of its average net assets. This figure is known as the expense ratio. The following examples are intended to help you understand the ongoing costs (in dollars) of investing in your fund and to compare these costs with those of other mutual funds. The examples are based on an investment of $1,000 made at the beginning of the period shown and held for the entire period.
The accompanying table illustrates your fund’s costs in two ways:
• Based on actual fund return. This section helps you to estimate the actual expenses that you paid over the period. The ”Ending Account Value“ shown is derived from the fund‘s actual return, and the third column shows the dollar amount that would have been paid by an investor who started with $1,000 in the fund. You may use the information here, together with the amount you invested, to estimate the expenses that you paid over the period.
To do so, simply divide your account value by $1,000 (for example, an $8,600 account value divided by $1,000 = 8.6), then multiply the result by the number given for your fund under the heading ”Expenses Paid During Period.“
• Based on hypothetical 5% yearly return. This section is intended to help you compare your fund‘s costs with those of other mutual funds. It assumes that the fund had a yearly return of 5% before expenses, but that the expense ratio is unchanged. In this case—because the return used is not the fund’s actual return—the results do not apply to your investment. The example is useful in making comparisons because the Securities and Exchange Commission requires all mutual funds to calculate expenses based on a 5% return. You can assess your fund’s costs by comparing this hypothetical example with the hypothetical examples that appear in shareholder reports of other funds.
Note that the expenses shown in the table are meant to highlight and help you compare ongoing costs only and do not reflect transaction costs incurred by the fund for buying and selling securities. Your fund does not charge transaction fees, such as purchase or redemption fees, nor does it carry a “sales load.” The calculations assume no shares were bought or sold during the period. Your actual costs may have been higher or lower, depending on the amount of your investment and the timing of any purchases or redemptions.
You can find more information about the fund’s expenses, including annual expense ratios, in the Financial Statements section of this report. For additional information on operating expenses and other shareholder costs, please refer to your fund’s current prospectus.
56
| | | | | | |
| Six Months Ended December 31, 2009 | | | | | | |
| | | Beginning | | Ending | | Expenses |
| | | Account Value | | Account Value | | Paid During |
| Institutional Total Stock Market Index Fund | | 6/30/2009 | | 12/31/2009 | | Period |
| Based on Actual Fund Return | | | | | | |
| Institutional Shares | $ | 1,000.00 | $ | 1,234.05 | $ | 0.25 |
| Institutional Plus Shares | | 1,000.00 | | 1,234.04 | | 0.14 |
| Based on Hypothetical 5% Yearly Return | | | | | | |
| Institutional Shares | $ | 1,000.00 | $ | 1,024.98 | $ | 0.23 |
| Institutional Plus Shares | | 1,000.00 | | 1,025.08 | | 0.13 |
The calculations are based on expenses incurred in the most recent six-month period. The fund’s annualized six-month expense ratios for that period are 0.045% for Institutional Shares and 0.025% for Institutional Plus Shares. The dollar amounts shown as “Expenses Paid” are equal to the annualized expense ratio multiplied by the average account value over the period, multiplied by the number of days in the most recent six-month period, then divided by the number of days in the most recent 12-month period.
57
Glossary
30-Day SEC Yield. A fund’s 30-day SEC yield is derived using a formula specified by the U.S. Securities and Exchange Commission. Under the formula, data related to the fund’s security holdings in the previous 30 days are used to calculate the fund’s hypothetical net income for that period, which is then annualized and divided by the fund’s estimated average net assets over the calculation period. For the purposes of this calculation, a security’s income is based on its current market yield to maturity (in the case of bonds) or its projected dividend yield (for stocks). Because the SEC yield represents hypothetical annualized income, it will differ—at times significantly—from the fund’s actual experience. As a result, the fund’s income distributions may be higher or lower than implied by the SEC yield.
Beta. A measure of the magnitude of a fund’s past share-price fluctuations in relation to the ups and downs of a given market index. The index is assigned a beta of 1.00. Compared with a given index, a fund with a beta of 1.20 typically would have seen its share price rise or fall by 12% when the index rose or fell by 10%. For this report, beta is based on returns over the past 36 months for both the fund and the index. Note that a fund’s beta should be reviewed in conjunction with its R-squared (see definition). The lower the R-squared, the less correlation there is between the fund and the index, and the less reliable beta is as an indicator of volatility.
Dividend Yield. Dividend income earned by stocks, expressed as a percentage of the aggregate market value (or of net asset value, for a fund). The yield is determined by dividing the amount of the annual dividends by the aggregate value (or net asset value) at the end of the period. For a fund, the dividend yield is based solely on stock holdings and does not include any income produced by other investments.
Earnings Growth Rate. The average annual rate of growth in earnings over the past five years for the stocks now in a fund.
Equity Exposure. A measure that reflects a fund’s investments in stocks and stock futures. Any holdings in short-term reserves are excluded.
Expense Ratio. The percentage of a fund’s average net assets used to pay its annual administrative and advisory expenses. These expenses directly reduce returns to investors.
Foreign Holdings. The percentage of a fund represented by stocks or depositary receipts of companies based outside the United States.
Inception Date. The date on which the assets of a fund (or one of its share classes) are first invested in accordance with the fund’s investment objective. For funds with a subscription period, the inception date is the day after that period ends. Investment performance is measured from the inception date.
Median Market Cap. An indicator of the size of companies in which a fund invests; the midpoint of market capitalization (market price x shares outstanding) of a fund’s stocks, weighted by the proportion of the fund’s assets invested in each stock. Stocks representing half of the fund’s assets have market capitalizations above the median, and the rest are below it.
Price/Book Ratio. The share price of a stock divided by its net worth, or book value, per share. For a fund, the weighted average price/book ratio of the stocks it holds.
58
Price/Earnings Ratio. The ratio of a stock’s current price to its per-share earnings over the past year. For a fund, the weighted average P/E of the stocks it holds. P/E is an indicator of market expectations about corporate prospects; the higher the P/E, the greater the expectations for a company’s future growth.
R-Squared. A measure of how much of a fund’s past returns can be explained by the returns from the market in general, as measured by a given index. If a fund’s total returns were precisely synchronized with an index’s returns, its R-squared would be 1.00. If the fund’s returns bore no relationship to the index’s returns, its R-squared would be 0. For this report, R-squared is based on returns over the past 36 months for both the fund and the index.
Return on Equity. The annual average rate of return generated by a company during the past five years for each dollar of shareholder’s equity (net income divided by shareholder’s equity). For a fund, the weighted average return on equity for the companies whose stocks it holds.
Short-Term Reserves. The percentage of a fund invested in highly liquid, short-term securities that can be readily converted to cash.
Turnover Rate. An indication of the fund’s trading activity. Funds with high turnover rates incur higher transaction costs and may be more likely to distribute capital gains (which may be taxable to investors). The turnover rate excludes in-kind transactions, which have minimal impact on costs.
59
The People Who Govern Your Fund
The trustees of your mutual fund are there to see that the fund is operated and managed in your best interests since, as a shareholder, you are a part owner of the fund. Your fund’s trustees also serve on the board of directors of The Vanguard Group, Inc., which is owned by the Vanguard funds and provides services to them on an at-cost basis.
A majority of Vanguard’s board members are independent, meaning that they have no affiliation with Vanguard or the funds they oversee, apart from the sizable personal investments they have made as private individuals. The independent board members have distinguished backgrounds in business, academia, and public service. Each of the trustees and executive officers oversees 163 Vanguard funds.
The following table provides information for each trustee and executive officer of the fund. More information about the trustees is in the Statement of Additional Informatio n, which can be obtained, wit hout charge, by contacting Vanguard at 800-662-7447, or online at www.vanguard.com.
Interested Trustee1
F. William McNabb III
Born 1957. Trustee Since July 2009. Chairman of the Board. Principal Occupation(s) During the Past Five Years: Chairman of the Board of The Vanguard Group, Inc., and of each of the investment companies served by The Vanguard Group, since January 2010; Director of The Vanguard Group since 2008; Chief Executive Officer and President of The Vanguard Group and of each of the investment companies served by The Vanguard Group since 2008; Director of Vanguard Marketing Corporation; Managing Director of The Vanguard Group (1995–2008).
Independent Trustees
Emerson U. Fullwood
Born 1948. Trustee Since January 2008. Principal
Occupation(s) During the Past Five Years: Executive Chief Staff and Marketing Officer for North America and Corporate Vice President (retired 2008) of Xerox Corporation (photocopiers and printers); Director of SPX Corporation (multi-industry manufacturing), the United Way of Rochester, the Boy Scouts of America, Amerigroup Corporation (direct health and medical insurance carriers), and Monroe Community College Foundation.
Rajiv L. Gupta
Born 1945. Trustee Since December 2001.2 Principal Occupation(s) During the Past Five Years: Chairman and Chief Executive Officer (retired 2009) and President (2006–2008) of Rohm and Haas Co. (c hemicals); Board Member of American Chemistry Council; Director of Tyco International, Ltd. (diversified manufacturing and se rvices) and Hewlett-Packard Co. (electronic computer manufacturing); Trus tee of The Conference Board.
Amy Gutmann
Born 1949. Trustee Since June 2006. Principal
Occupation(s) During the Past Five Years: President of the University of Pennsylvania; Christopher H. Browne Distinguished Professor of Political Science in the School of Arts and Sciences with secondary appointments at the Annenberg School for Communication and the Graduate School of Education of the University of Pennsylvania; Director of Carnegie Corporation of New York, Schuylkill River Development Corporation, and Greater Philadelphia Chamber of Commerce; Trustee of the National Constitution Center.
JoAnn Heffernan Heisen
Born 1950. Trustee Since July 1998. Principal Occupation(s) During the Past Five Years: Corporate Vice President and Chief Global Diversity Officer since 2006 (retired 2008) and Member of the Executive Committee (retired 2008) of Johnson & Johnson (pharmaceuticals/consumer products); Vice President and Chief Information Officer of Johnson & Johnson (1997–2005); Director of the University Medical Center at Princeton and Women’s Research and Education
Institute; Member of the Advisory Board of the Maxwell School of Citizenship and Public Affairs at Syracuse Uni versity.
F. Joseph Loughrey
Born 1949. Trustee Since October 2009. Principal Occupation(s) During the Past Five Years: President and Chief Operating Officer since 2005 (retired 2009) and Vice Chairman of the Board (2008–2009) of Cummins Inc. (industrial machinery); Director of SKF AB (industrial machinery), Hillenbrand, Inc. (specialized consumer services), Sauer-Danfoss Inc. (machinery), the Lumina Foundation for Education, and the Columbus Community Education Coalition; Chairman of the Advisory Council for the College of Arts and Letters at the University of Notre Dame.
André F. Perold
Born 1952. Trustee Since December 2004. Principal Occupation(s) During the Past Five Years: George Gund Professor of Finance and Banking, Harvard Business School; Chair of the Investment Committee of HighVista Strategies LLC (private in vestment firm).
Alfred M. Rankin, Jr.
Born 1941. Trustee Since January 1993. Principal Occupation(s) During the Past Five Years: Chairman, President, and Chief Executive Officer of NACCO Industries, Inc. (forklift trucks/housewares/lignite); Director of Goodrich Corporation (industrial products/ aircraft systems and services); Deputy Chairman of the Federal Reserve Bank of Cleveland; Trustee of University Hospitals of Cleveland, The Cleveland Museum of Art, and Case Western Reserve University.
Peter F. Volanakis
Born 1955. Trustee Since July 2009. Principal Occupation(s) During the Past Five Years: President since 2007 and Chief Operating Officer since 2005 of Corning Incorporated (communications equipment); President of Corning Technologies (2001–2005); Director of Corning Inco rporated and Dow Corning; Trustee of the Corning Incorporated Foundation and the Corning Museum of Glass; Overseer of the Amos Tuck School of Business Administration at Dartmouth College.
Executive Officers
Thomas J. Higgins
Born 1957. Chief Financial Officer Since September 2008. Principal Occupation(s) During the Past Five Years: Principal of The Vanguard Group, Inc.; Chief Financial Officer of each of the investment companies served by The Vanguard Group since 2008; Treasurer of each of the investment companies served by The Vanguard Group (1998–2008).
Kathryn J. Hyatt
Born 1955. Treasurer Since November 2008. Principal Occupation(s) During the Past Five Years: Principal of The Vanguard Group, Inc.; Treasurer of each of the investment companies served by The Vanguard Group since 2008; Assistant Treasurer of each of the investment companies served by The Vanguard Group (1988–2008).
Heidi Stam
Born 1956. Secretary Since July 2005. Principal Occupation(s) During the Past Five Years: Managing Director of The Vanguard Group, Inc., since 2006; General Counsel of The Vanguard Group since 2005; Secretary of The Vanguard Group and of each of the investment companies serve d by The Vanguard Group since 2005; Director and Senior Vice President of Vanguard Marketing Corporation since 2005; Principal of The Vanguard Group (1997–2006).
Vanguard Senior Management Team
R. Gregory Barton
Mortimer J. Buckley
Kathleen C. Gubanich
Paul A. Heller
Michael S. Miller
James M. Norris
Glenn W. Reed
George U. Sauter
Chairman Emeritus and Senior Advisor
John J. Brennan
Chairman, 1996–2009
Chief Executive Officer and President, 1996–2008
Founder
John C. Bogle
Chairman and Chief Executive Officer, 1974–1996
1 Mr. McNabb is considered an “interested person,” as defined in the Investment Company Act of 1940, because he is an officer of the Vanguard funds.
2 December 2002 for Vanguard Equity Income Fund, Vanguard Growth Equity Fund, the Vanguard Municipal Bond Funds, and the Vanguard State Tax-Exempt Funds.

P.O. Box 2600
Valley Forge, PA 19482-2600
Connect with Vanguard® > www.vanguard.com
Fund Information > 800-662-7447
Direct Investor Account Services > 800-662-2739
Institutional Investor Services > 800-523-1036
Text Telephone for People With Hearing Impairment > 800-749-7273
This material may be used in conjunction with the offering of shares of any Vanguard fund only if preceded or accompanied by the fund’s current prospectus.
All comparative mutual fund data are from Lipper Inc. or Morningstar, Inc., unless otherwise noted.
You can obtain a free copy of Vanguard’s proxy voting guidelines by visiting our website, www.vanguard.com, and searching for “proxy voting guidelines,” or by calling Vanguard at 800-662-2739. The guidelines are also available from the SEC’s website, www.sec.gov. In addition, you may obtain a free report on how your fund voted the proxies for securities it owned during the 12 months ended June 30. To get the report, visit either www.vanguard.com or www.sec.gov.
You can review and copy information about your fund at the SEC’s Public Reference Room in Washington, D.C. To find out more about this public service, call the SEC at 202-551-8090. Information about your fund is also available on the SEC’s website, and you can receive copies of this information, for a fee, by sending a request in either of two ways: via e-mail addressed to publicinfo@sec.gov or via regular mail addressed to the Public Reference Section, Securities and Exchange Commission, Washington, DC 20549-1520.
The funds or securities referred to herein are not sponsored, endorsed, or promoted by MSCI, and MSCI bears no liability with respect to any such funds or securities. For any such funds or securities, the prospectus or the Statement of Additional Information contains a more detailed description of the limited relationship MSCI has with The Vanguard Group and any related funds.
© 2010 The Vanguard Group, Inc. All rights reserved.
Vanguard Marketing Corporation, Distributor.
Q8710 022010
Item 2: Code of Ethics. The Registrant has adopted a code of ethics that applies to the Registrant’s principal executive officer, principal financial officer, principal accounting officer or controller or persons performing similar functions. The Code of Ethics was amended during the reporting period covered by this report to make certain technical, non-material changes.
Item 3: Audit Committee Financial Expert. The following members of the Audit Committee have been determined by the Registrant’s Board of Trustees to be Audit Committee Financial Experts serving on its Audit Committee, and to be independent: Charles D. Ellis, Rajiv L. Gupta, JoAnn Heffernan Heisen, André F. Perold, and Alfred M. Rankin, Jr.
Item 4: Principal Accountant Fees and Services.
(a) Audit Fees.
Audit Fees of the Registrant
Fiscal Year Ended December 31, 2009: $67,500
Fiscal Year Ended December 31, 2008: $64,000
Aggregate Audit Fees of Registered Investment Companies in the Vanguard Group.
Fiscal Year Ended December 31, 2009: $3,354,640
Fiscal Year Ended December 31, 2008: $3,055,590
(b) Audit-Related Fees.
Fiscal Year Ended December 31, 2009: $876,210
Fiscal Year Ended December 31, 2008: $626,240
Includes fees billed in connection with assurance and related services provided to the Registrant, The Vanguard Group, Inc., Vanguard Marketing Corporation, and other registered investment companies in the Vanguard Group.
Doc#0217642
(c) Tax Fees.
Fiscal Year Ended December 31, 2009: $423,070
Fiscal Year Ended December 31, 2008: $230,400
Includes fees billed in connection with tax compliance, planning and advice services provided to the Registrant, The Vanguard Group, Inc., Vanguard Marketing Corporation, and other registered investment companies in the Vanguard Group and related to income and excise taxes.
(d) All Other Fees.
Fiscal Year Ended December 31, 2009: $0
Fiscal Year Ended December 31, 2008: $0
Includes fees billed for services related to risk management and privacy matters. Services were provided to the Registrant, The Vanguard Group, Inc., Vanguard Marketing Corporation, and other registered investment companies in the Vanguard Group.
(e) (1) Pre-Approval Policies. The policy of the Registrant’s Audit Committee is to consider and, if appropriate, approve before the principal accountant is engaged for such services, all specific audit and non-audit services provided to: (1) the Registrant; (2) The Vanguard Group, Inc.; (3) other entities controlled by The Vanguard Group, Inc. that provide ongoing services to the Registrant; and (4) other registered investment companies in the Vanguard Group. In making a determination, the Audit Committee considers whether the services are consistent with maintaining the principal accountant’s independence.
In the event of a contingency situation in which the principal accountant is needed to provide services in between scheduled Audit Committee meetings, the Chairman of the Audit Committee would be called on to consider and, if appropriate, pre-approve audit or permitted non-audit services in an amount sufficient to complete services through the next Audit Committee meeting, and to determine if such services would be consistent with maintaining the accountant’s independence.
Doc#0217642
At the next scheduled Audit Committee meeting, services and fees would be presented to the Audit Committee for formal consideration, and, if appropriate, approval by the entire Audit Committee. The Audit Committee would again consider whether such services and fees are consistent with maintaining the principal accountant’s independence.
The Registrant’s Audit Committee is informed at least annually of all audit and non-audit services provided by the principal accountant to the Vanguard complex, whether such services are provided to: (1) the Registrant; (2) The Vanguard Group, Inc.; (3) other entities controlled by The Vanguard Group, Inc. that provide ongoing services to the Registrant; or (4) other registered investment companies in the Vanguard Group.
(2) No percentage of the principal accountant’s fees or services were approved pursuant to the waiver provision of paragraph (c)(7)(i)(C) of Rule 2-01 of Regulation S-X.
(f) For the most recent fiscal year, over 50% of the hours worked under the principal accountant’s engagement were not performed by persons other than full-time, permanent employees of the principal accountant.
(g) Aggregate Non-Audit Fees.
Fiscal Year Ended December 31, 2009: $423,070
Fiscal Year Ended December 31, 2008: $230,400
Includes fees billed for non-audit services provided to the Registrant, The Vanguard Group, Inc., Vanguard Marketing Corporation, and other registered investment companies in the Vanguard Group.
(h) For the most recent fiscal year, the Audit Committee has determined that the provision of all non-audit services was consistent with maintaining the principal accountant’s independence.
Doc#0217642
Item 5: Not Applicable.
Item 6: Not Applicable.
Item 7: Not Applicable.
Item 8: Not Applicable.
Item 9: Not Applicable.
Item 10: Not Applicable.
Item 11: Controls and Procedures.
(a) Disclosure Controls and Procedures. The Principal Executive and Financial Officers concluded that the Registrant's Disclosure Controls and Procedures are effective based on their evaluation of the Disclosure Controls and Procedures as of a date within 90 days of the filing date of this report.
(b) Internal Control Over Financial Reporting. There were no significant changes in Registrant’s Internal Control Over Financial Reporting or in other factors that could significantly affect this control subsequent to the date of the evaluation, including any corrective actions with regard to significant deficiencies and material weaknesses.
Item 12: Exhibits.
| (a) | Code of Ethics. |
| (b) | Certifications. |
Pursuant to the requirements of the Securities Exchange Act of 1934 and the Investment Company Act of 1940, the registrant has duly caused this report to be signed on its behalf by the undersigned, thereunto duly authorized.
Doc#0217642
| |
| | VANGUARD INSTITUTIONAL INDEX FUNDS |
| |
BY: | /s/ F. WILLIAM MCNABB III* F. WILLIAM MCNABB III* CHIEF EXECUTIVE OFFICER |
Pursuant to the requirements of the Securities Exchange Act of 1934 and the Investment Company Act of 1940, this report has been signed below by the following persons on behalf of the registrant and in the capacities and on the dates indicated.
| |
| | VANGUARD INSTITUTIONAL INDEX FUNDS |
| |
BY: | /s/ F. WILLIAM MCNABB III* F. WILLIAM MCNABB III* CHIEF EXECUTIVE OFFICER |
Date: February 22, 2010
| |
| | VANGUARD INSTITUTIONAL INDEX FUNDS |
| |
BY: | /s/ THOMAS J. HIGGINS* THOMAS J. HIGGINS CHIEF FINANCIAL OFFICER |
Date: February 22, 2010
* By: /s/ Heidi Stam
Heidi Stam, pursuant to a Power of Attorney filed on July 24, 2009, see file Number 2-88373, and a Power of Attorney filed on October 16, 2009, see File Number 2-52698, both Incorporated by Reference.
Doc#0217642