UNITED STATES
SECURITIES AND EXCHANGE COMMISSION
WASHINGTON, D. C. 20549
FORM N-CSR
Investment Company Act file number: 811-06071
Deutsche DWS Institutional Funds
(Exact Name of Registrant as Specified in Charter)
875 Third Avenue
New York, NY 10022-6225
(Address of Principal Executive Offices) (Zip Code)
Registrant’s Telephone Number, including Area Code: (212) 454-4500
Diane Kenneally
100 Summer Street
Boston, MA 02110
(Name and Address of Agent for Service)
| Date of fiscal year end: | 12/31 |
| | |
| Date of reporting period: | 12/31/2023 |
| ITEM 1. | REPORT TO STOCKHOLDERS |
| | |
| | (a) |
December 31, 2023
Annual Report
to Shareholders
This report must be preceded or accompanied by a prospectus. To obtain a summary prospectus, if available, or prospectus for any of our funds, refer to the Account Management Resources information provided in the back of this booklet. We advise you to consider the Fund’s objectives, risks, charges and expenses carefully before investing. The summary prospectus and prospectus contain this and other important information about the Fund. Please read the prospectus carefully before you invest.
The brand DWS represents DWS Group GmbH & Co. KGaA and any of its subsidiaries such as DWS Distributors, Inc. which offers investment products or DWS Investment Management Americas, Inc. and RREEF America L.L.C. which offer advisory services.NOT FDIC/NCUA INSURED NO BANK GUARANTEE MAY LOSE VALUE
NOT A DEPOSIT NOT INSURED BY ANY FEDERAL GOVERNMENT AGENCY
Stocks may decline in value. Various factors, including costs, cash flows and security selection, may cause the Fund’s performance to differ from that of the index. Investing in derivatives entails special risks relating to liquidity, leverage and credit that may reduce returns and/or increase volatility. The Fund may lend securities to approved institutions. Please read the prospectus for details.
War, terrorism, sanctions, economic uncertainty, trade disputes, public health crises, natural disasters, climate change and related geopolitical events have led and, in the future, may lead to significant disruptions in U.S. and world economies and markets, which may lead to increased market volatility and may have significant adverse effects on the Fund and its investments.
The S&P 500® Index is a product of S&P Dow Jones Indices LLC or its affiliates (“SPDJI” ), and has been licensed for use by DWS Investment Management Americas, Inc. (“DIMA” ). Standard & Poor’s®, S&P® and S&P 500® are registered trademarks of Standard & Poor’s Financial Services LLC (“S&P” ); Dow Jones® is a registered trademark of Dow Jones Trademark Holdings LLC (“Dow Jones” ); and these trademarks have been licensed for use by SPDJI and sublicensed for certain purposes by DIMA. The Fund and the Portfolio are not sponsored, endorsed, sold or promoted by SPDJI, Dow Jones, S&P or their respective affiliates and none of such parties make any representation regarding the advisability of investing in such product(s) nor do they have any liability for any errors, omissions, or interruptions of the S&P 500 Index.
Portfolio Management Review(Unaudited)
Market Overview and Fund Performance
All performance information below is historical and does not guarantee future results. Returns shown are for Class A shares, unadjusted for sales charges. Investment return and principal fluctuate, so your shares may be worth more or less when redeemed. Current performance may be lower or higher than the performance data quoted. Please visit dws.com for the most recent month-end performance of all share classes. Fund performance includes reinvestment of all distributions. Unadjusted returns do not reflect sales charges and would have been lower if they had. Please refer to pages 9 through 10 for more complete performance information.
DWS S&P 500 Index Fund returned 25.63% in 2023, while the Standard & Poor’s 500® (S&P 500) Index returned 26.29%. Since the Fund’s investment strategy is to replicate the performance of the index, its return is normally close to that of the index. The difference in performance is typically driven by transaction costs and Fund expenses.
The Fund periodically invested in equity index futures to keep the portfolio’s positioning in line with that of the index. This strategy had a neutral impact on results.
Market Overview
The S&P 500 Index posted a robust total return in 2023, marking the third calendar year of the past five in which it has produced a gain north of 20%. Although returns were impressive when measured over the full year, the equity market took an uneven path on the way to the favorable end result. After a strong start to the year, stocks turned lower in the latter half of the first calendar quarter in response to a regional banking crisis that led to the failure of several institutions. This issue proved short-lived, however, due in part to the U.S. Federal Reserve’s decision to provide liquidity in order to stabilize the financial sector. The market proceeded to move steadily higher in the span from April to July as the issues with
Investment Objective
The Fund seeks to provide investment results that, before expenses, correspond to the total return of common stocks publicly traded in the United States, as represented by the Standard & Poor’s 500® Composite Stock Price Index (S&P 500® Index).
banks faded from the headlines and investors began to anticipate an end to the Fed’s long series of interest rate hikes.
The backdrop shifted yet again in August, leading to a protracted downturn that lasted until late October. During this time, the market came under pressure as a sharp increase in oil prices fueled concerns that inflation, which had been moving lower through the first half of the year, was set to accelerate. Investors began to anticipate that the Fed would need to keep interest rates elevated for an extended period to combat the trend, causing expectations for the first interest rate cut to move from late 2023 into late 2024 (as gauged by the futures markets) and leading to a spike in bond yields. At its low on October 27, the S&P 500 Index had fallen nearly 10% from its high of just three months earlier amid rising fears about the “higher for longer” interest rate scenario.
The environment quickly changed for the better in November as declining oil prices and a series of reports showing that inflation was continuing to cool caused bond yields to fall from their highs. Equities surged in response, and the rally accelerated in December after Fed Chairman Jerome Powell indicated the central bank may begin to cut interest rates in the first half of 2024. These developments occurred against a backdrop of positive economic data, raising hopes that the Fed had succeeded in engineering a “soft landing” for the U.S. economy. Since investors had been cautiously positioned coming into the quarter, their ensuing efforts to play catch-up with the rising market fueled a self-reinforcing rally that helped the S&P 500 Index finish 2023 just short of an all-time high.
Technology-Related Stocks Lead the Way
Leadership was very narrow in 2023, with only three of the market’s 11 sectors — technology, communication services, and consumer discretionary — outperforming the index. The extent of the gains in these areas vastly outweighed the impact of more muted returns elsewhere, with the three sectors accounting for over 80% of the gain for the broader index. Within these categories, performance was led by a very small group of companies that came to be known as “The Magnificent Seven” : Apple, Inc., Microsoft Corp., Alphabet, Inc. (parent of Google), Amazon.com, Inc., Meta Platforms, Inc. (formerly Facebook), Tesla, Inc., and NVIDIA Corp. Notably, just this cohort of stocks alone accounted for more than half of the index’s total return for the year. While these companies were boosted by their generally positive fundamentals (and in
NVIDIA’s case, optimism about the outlook for artificial intelligence), they were also viewed as relative “safe havens” in a challenging environment due to their stable earnings and robust balance sheets. A broad range of other stocks in these sectors performed very well, including semiconductor stocks within technology and travel-related companies in consumer discretionary. Still, their collective impact on headline returns was much lower than that of the “Magnificent Seven” due to their smaller weightings.
Industrials Register Strong Gains; Energy and Materials Lag
Better-than-expected economic growth contributed to robust absolute returns for the industrials sector. This market segment lost ground and underperformed the index by a wide margin in 2022 on anticipation that rising interest rates would crimp economic growth. As it became apparent through 2023 that the economy was in fact holding up quite well, a number of stocks in the sector experienced meaningful relief rallies. In terms of performance contribution, General Electric Co., Boeing Co., and the power-management equipment maker Eaton Corp. were the most notable winners in the sector.
“Leadership was very narrow in 2023, with only three of the market’s 11 sectors — technology, communication services, and consumer discretionary — outperforming the index.”
While industrials performed well, the materials sector — which also tends to benefit from positive growth trends — produced a solid gain but trailed the broader market due to volatility in commodity prices and underperformance for agricultural chemical companies. The energy sector, which was the top performer by a wide margin in 2022, lagged significantly and was one of only two sectors to suffer a negative absolute return. Oil prices declined for the first time since 2020, and natural gas experienced its worst showing in a calendar year since 2001. All but two stocks in energy trailed the S&P 500 Index as a result, and over one-third of the companies in the sector closed the year in the red.
Financials and Real Estate Recover from Early Weakness to Log Double-Digit Gains
Financials were one of the worst performing segments of the market in the first quarter, as the banking crisis — while confined to regional banks — nonetheless weighed on returns across the entire sector. The negative headlines led to the failure of three banks that were represented in the S&P 500 Index at the start of the year: Signature Bank,* First Republic Bank,* and SVB Financial Group.* However, as it became apparent that the crisis was contained, investors gradually returned to the larger stocks in the sector. Financials were particularly strong performers in the final two months of the year as interest-rate fears began to abate.
Similarly, much of the gain for the real estate sector occurred in the November-December time frame. Rising-rate environments tend to hurt real estate companies by increasing their cost of capital and making their dividend yields less attractive for income-oriented investors. Once the rate outlook started to improve in the fourth quarter, the sector moved sharply higher and finished the year with a double-digit gain.
Defensive Market Segments Underperform
In a year in which investors had a clear preference for faster-growing companies, such as those in the technology sector, the market’s traditionally defensive areas — consumer staples, healthcare, and utilities — were unable to keep pace with the index. Many stocks in the staples category were hurt by concerns that they would be unable to continue passing on rising input costs to consumers. In addition, many food and beverage producers were pressured by worries that the rollout of GLP-1 weight-management drugs could lead to reduced sales volumes. A number of healthcare companies that stand to lose business from GLP-1s also underperformed, as did large-cap pharmaceutical stocks — including Pfizer, Inc. — that lack any high-potential products in this area. On the other hand, Eli Lilly & Co. — which was seen as likely to emerge as one of the most important winners in the market for GLP-1 treatments — was a top performer. Utilities, for their part, lagged for most of the year due to the more generalized weakness in rate-sensitive, slower-growth market segments.
*
Not held at December 31, 2023; the stocks were removed from the index.
Portfolio Manager
Brent Reeder. Senior Vice President of Northern Trust Investments, Inc.
Portfolio Manager of the Fund. Began managing the Fund in 2007.
—Joined Northern Trust Investments, Inc. in 1993 and is responsible for the management of quantitative equity portfolios.
The views expressed reflect those of the portfolio management team only through the end of the period of the report as stated on the cover. The management team’s views are subject to change at any time based on market and other conditions and should not be construed as a recommendation. Past performance is no guarantee of future results. Current and future portfolio holdings are subject to risk.
Terms to Know
The Standard & Poor’s 500 (S&P 500) Index is an unmanaged, capitalization weighted index of 500 stocks. The index is designed to measure performance of the broad domestic economy through changes in the aggregate market value of 500 stocks representing all major industries. Index returns do not reflect any fees or expenses and it is not possible to invest directly into an index.
Futures contracts are contractual agreements to buy or sell a particular commodity or financial instrument at a predetermined price in the future.
Contribution and detraction incorporate both an investment’s total return and its weighting in the Fund.
Consumer discretionary stocks represent companies that make and market goods and services that are considered non-essential. Sub-categories within the consumer discretionary sector include retailers, media, consumer services, consumer durables & apparel, and automobiles.
Consumer staples stocks represent companies that make products purchased by consumers on a regular basis, such as food and beverages, prescription drugs, and household products. In the aggregate, sales of consumer staples tend to be steady and less sensitive to economic fluctuations.
Performance SummaryDecember 31, 2023 (Unaudited)
| | | |
Average Annual Total Returns as of 12/31/23 |
Unadjusted for Sales Charge | | | |
Adjusted for the Maximum Sales Charge
(max 4.50% load) | | | |
| | | |
| | | |
Average Annual Total Returns as of 12/31/23 |
Unadjusted for Sales Charge | | | |
Adjusted for the Maximum Sales Charge
(max 1.00% CDSC) | | | |
| | | |
| | | |
Average Annual Total Returns as of 12/31/23 |
| | | |
| | | |
| | | |
Average Annual Total Returns as of 12/31/23 |
| | | |
| | | |
Performance in the Average Annual Total Returns table above and the Growth of an Assumed $10,000 Investment line graph that follows is historical and does not guarantee future results. Investment return and principal fluctuate, so your shares may be worth more or less when redeemed. Current performance may be lower or higher than the performance data quoted. Please visit dws.com for the Fund’s most recent month-end performance. Fund performance includes reinvestment of all distributions. Unadjusted returns do not reflect sales charges and would have been lower if they had.
The gross expense ratios of the Fund, as stated in the fee table of the prospectus dated May 1, 2023 are 0.55%, 1.26%, 0.23% and 0.30% for Class A, Class C, Class R6 and Class S shares, respectively, and may differ from the expense ratios disclosed in the Financial Highlights tables in this report.
Index returns do not reflect any fees or expenses and it is not possible to invest directly into an index.
Performance figures do not reflect the deduction of taxes that a shareholder would pay on fund distributions or the redemption of fund shares.
Generally accepted accounting principles require adjustments to be made to the net assets of the Fund at period end for financial reporting purposes only, and as such, the total return based on the unadjusted net asset value per share may differ from the total return reported in the financial highlights.
Growth of an Assumed $10,000 Investment
(Adjusted for Maximum Sales Charge)
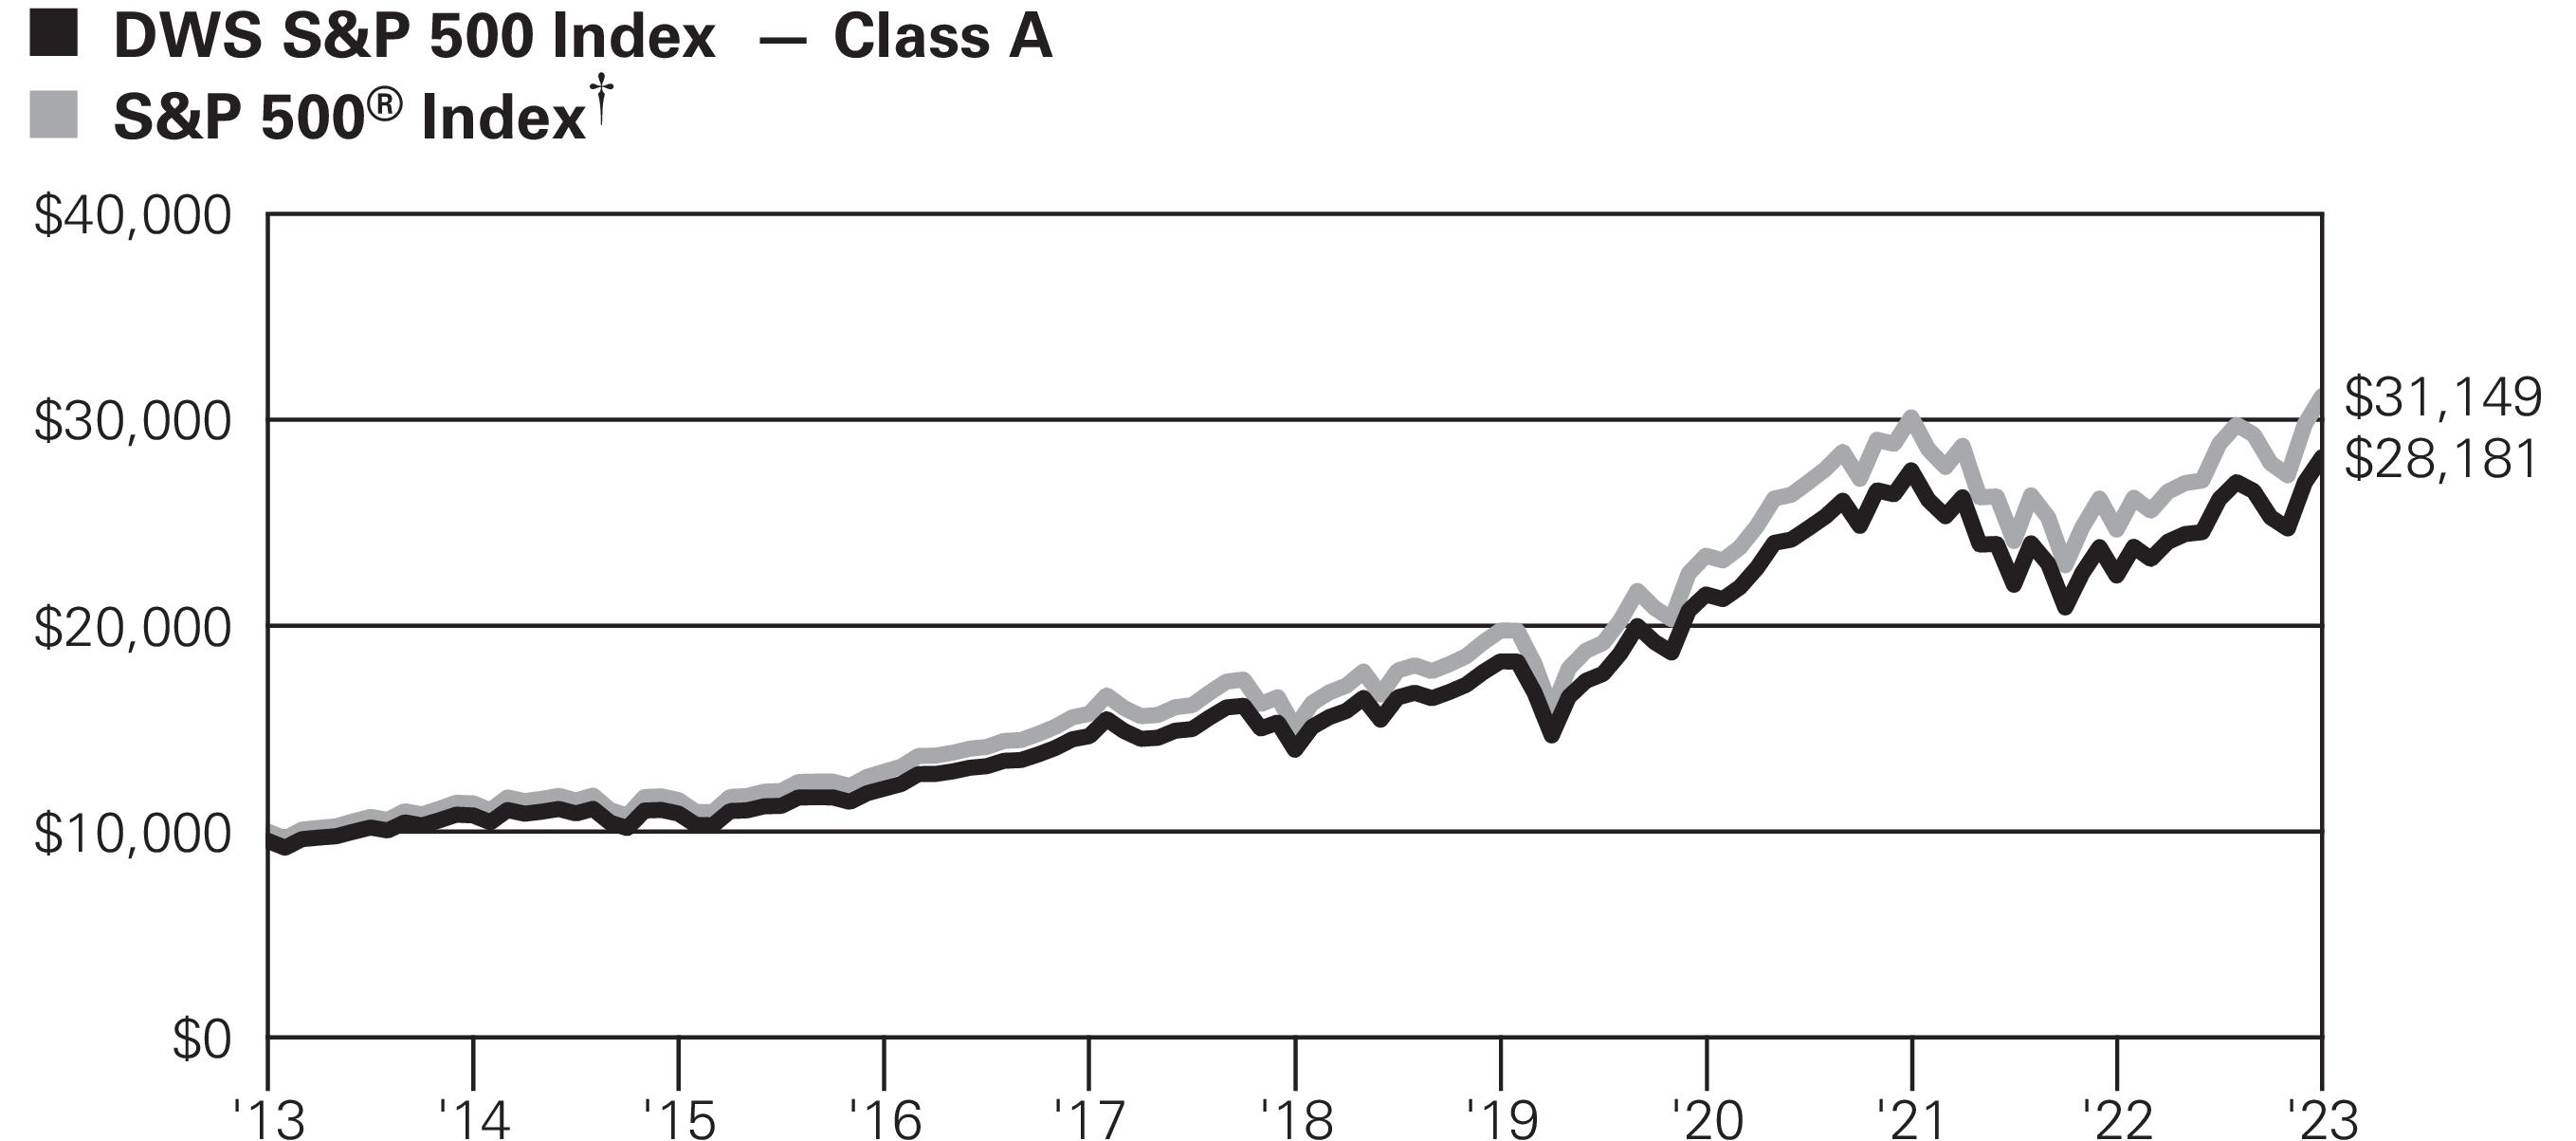 Yearly periods ended December 31
The Fund’s growth of an assumed $10,000 investment is adjusted for the maximum sales charge of 4.50%. This results in a net initial investment of $9,550.
The growth of $10,000 is cumulative.
Performance of other share classes will vary based on the sales charges and the fee structure of those classes.
| Class R6 shares commenced operations on March 31, 2017. |
| The S&P 500 Index is an unmanaged, capitalization-weighted index of 500 stocks. The index is designed to measure performance of the broad domestic economy through changes in the aggregate market value of 500 stocks representing all major industries. |
| | | | |
|
| | | | |
| | | | |
Distribution Information as of 12/31/23 |
Income Dividends, Twelve Months | | | | |
Capital Gain Distributions | | | | |
Portfolio Summary(Unaudited)
Asset Allocation (As a % of Investment Portfolio excluding Securities Lending Collateral) | | |
| | |
| | |
Government & Agency Obligations | | |
| | |
Sector Diversification (As a % of Common Stocks) | | |
| | |
| | |
| | |
| | |
| | |
| | |
| | |
| | |
| | |
| | |
| | |
| | |
Ten Largest Equity Holdings at December 31, 2023 (32.0% of Net Assets) |
| |
Designs, manufactures and markets personal computers and related computing and mobile-communication devices | |
| |
Develops, manufactures, licenses, sells and supports software products | |
| |
Holding company with subsidiaries that provide web-based search, maps, hardware products and various software applications | |
| |
Online retailer offering a wide range of products | |
| |
Designs, develops and markets three dimensional (3D) graphic processors | |
| |
Operator of social networking web site | |
| |
Designs,manufactures and sells high-perfomance electric vehicles and electric vehicle powertrain components | |
8Berkshire Hathaway, Inc. | |
Holding company of insurance business and a variety of other businesses | |
| |
Provider of global financial services | |
| |
Designs, develops and markets digital analog semiconductors | |
Portfolio holdings and characteristics are subject to change.
DWS S&P 500 Index Fund (the “Fund” ) is a feeder fund that invests substantially all of its assets in a “master portfolio,” the Deutsche DWS Equity 500 Index Portfolio (the “Portfolio” ), and owns a pro rata interest in the Portfolio’s net assets. The Asset Allocation, Sector Diversification and Ten Largest Equity Holdings at December 31, 2023 are based on the holdings of Deutsche DWS Equity 500 Index Portfolio.
For more complete details about the Portfolio’s investment portfolio, see page 33. A quarterly Fact Sheet is available on dws.com or upon request. Please see the Account Management Resources section on page 76 for contact information.
Statement of Assets and Liabilities
as of December 31, 2023
| |
Investments in Deutsche DWS Equity 500 Index Portfolio, at value | |
Receivable for Fund shares sold | |
| |
| |
| |
Payable for Fund shares redeemed | |
| |
Other accrued expenses and payables | |
| |
| |
| |
Distributable earnings (loss) | |
| |
| |
| |
| |
Net Asset Value and redemption price per share
($225,335,206 ÷ 5,548,793 outstanding shares of beneficial interest, $.01 par value, unlimited number of shares authorized) | |
Maximum offering price per share (100 ÷ 95.50 of $40.61) | |
| |
Net Asset Value, offering and redemption price
(subject to contingent deferred sales charge) per share per share ($64,189,207 ÷ 1,585,019 outstanding shares of beneficial interest, $.01 par value, unlimited number of shares authorized) | |
| |
Net Asset Value, offering and redemption price per share ($3,929,505 ÷ 96,513 outstanding shares of beneficial interest, $.01 par value, unlimited number of shares authorized) | |
| |
Net Asset Value, offering and redemption price per share ($909,430,342 ÷ 22,335,312 outstanding shares of beneficial interest, $.01 par value, unlimited number of shares authorized) | |
The accompanying notes are an integral part of the financial statements.
Statement of Operations
for the year ended December 31, 2023
| |
Income and expenses allocated from Deutsche DWS Equity 500 Index Portfolio: | |
Dividends (net of foreign taxes withheld of $91,939) | |
| |
Income distributions — DWS Central Cash Management Government Fund | |
Securities lending income, net of borrower rebates | |
| |
Net investment income allocated from Deutsche DWS Equity 500 Index Portfolio | |
| |
| |
| |
Distribution and service fees | |
| |
| |
| |
Trustees' fees and expenses | |
| |
Total expenses before expense reductions | |
| |
Total expenses after expense reductions | |
| |
Realized and Unrealized Gain (Loss) | |
Net realized gain (loss) allocated from Deutsche DWS Equity 500 Index Portfolio: | |
| |
| |
| |
Change in net unrealized appreciation (depreciation) allocated from Deutsche DWS Equity 500 Index Portfolio: | |
| |
| |
| |
| |
Net increase (decrease) in net assets resulting from operations | |
The accompanying notes are an integral part of the financial statements.
Statements of Changes in Net Assets
| |
Increase (Decrease) in Net Assets | | |
| | |
| | |
| | |
Change in net unrealized appreciation
(depreciation) | | |
Net increase (decrease) in net assets resulting from operations | | |
Distributions to shareholders: | | |
| | |
| | |
| | |
| | |
| | |
| | |
Proceeds from shares sold | | |
Reinvestment of distributions | | |
Payments for shares redeemed | | |
Net increase (decrease) in net assets from Fund share transactions | | |
Increase (decrease) in net assets | | |
Net assets at beginning of period | | |
Net assets at end of period | | |
The accompanying notes are an integral part of the financial statements.
Financial Highlights
DWS S&P 500 Index Fund — Class A |
| |
| | | | | |
|
Net asset value, beginning of period | | | | | |
Income (loss) from investment operations: | | | | | |
| | | | | |
Net realized and unrealized gain (loss) | | | | | |
Total from investment operations | | | | | |
| | | | | |
| | | | | |
| | | | | |
| | | | | |
Net asset value, end of period | | | | | |
| | | | | |
Ratios to Average Net Assets and Supplemental Data |
Net assets, end of period ($ millions) | | | | | |
Ratio of expenses before expense reductions, including expenses allocated from Deutsche DWS Equity 500 Index Portfolio (%) | | | | | |
Ratio of expenses after expense reductions, including expenses allocated from Deutsche DWS Equity 500 Index Portfolio (%) | | | | | |
Ratio of net investment income (%) | | | | | |
Portfolio turnover rate for Deutsche DWS Equity 500 Index Portfolio (%) | | | | | |
| Based on average shares outstanding during the period. |
| Total return does not reflect the effect of any sales charges. |
| Total return would have been lower had certain expenses not been reduced. |
The accompanying notes are an integral part of the financial statements.
DWS S&P 500 Index Fund — Class C |
| |
| | | | | |
|
Net asset value, beginning of period | | | | | |
Income (loss) from investment operations: | | | | | |
| | | | | |
Net realized and unrealized gain (loss) | | | | | |
Total from investment operations | | | | | |
| | | | | |
| | | | | |
| | | | | |
| | | | | |
Net asset value, end of period | | | | | |
| | | | | |
Ratios to Average Net Assets and Supplemental Data |
Net assets, end of period ($ millions) | | | | | |
Ratio of expenses including expenses allocated from Deutsche DWS Equity 500 Index Portfolio (%) | | | | | |
Ratio of net investment income (%) | | | | | |
Portfolio turnover rate for Deutsche DWS Equity 500 Index Portfolio (%) | | | | | |
| Based on average shares outstanding during the period. |
| Total return does not reflect the effect of any sales charges. |
The accompanying notes are an integral part of the financial statements.
DWS S&P 500 Index Fund — Class R6 |
| |
| | | | | |
| | | | | |
Net asset value, beginning of period | | | | | |
Income (loss) from investment operations: | | | | | |
| | | | | |
Net realized and unrealized gain (loss) | | | | | |
Total from investment operations | | | | | |
| | | | | |
| | | | | |
| | | | | |
| | | | | |
Net asset value, end of period | | | | | |
| | | | | |
Ratios to Average Net Assets and Supplemental Data |
Net assets, end of period ($ millions) | | | | | |
Ratio of expenses including expenses allocated from Deutsche DWS Equity 500 Index Portfolio (%) | | | | | |
Ratio of net investment income (%) | | | | | |
Portfolio turnover rate for Deutsche DWS Equity 500 Index Portfolio (%) | | | | | |
| Based on average shares outstanding during the period. |
The accompanying notes are an integral part of the financial statements.
DWS S&P 500 Index Fund — Class S |
| |
| | | | | |
|
Net asset value, beginning of period | | | | | |
Income (loss) from investment operations: | | | | | |
| | | | | |
Net realized and unrealized gain (loss) | | | | | |
Total from investment operations | | | | | |
| | | | | |
| | | | | |
| | | | | |
| | | | | |
Net asset value, end of period | | | | | |
| | | | | |
Ratios to Average Net Assets and Supplemental Data |
Net assets, end of period ($ millions) | | | | | |
Ratio of expenses before expense reductions, including expenses allocated from Deutsche DWS Equity 500 Index Portfolio (%) | | | | | |
Ratio of expenses after expense reductions, including expenses allocated from Deutsche DWS Equity 500 Index Portfolio (%) | | | | | |
Ratio of net investment income (%) | | | | | |
Portfolio turnover rate for Deutsche DWS Equity 500 Index Portfolio (%) | | | | | |
| Based on average shares outstanding during the period. |
| Total return would have been lower had certain expenses not been reduced. |
The accompanying notes are an integral part of the financial statements.
Notes to Financial Statements
A.
Organization and Significant Accounting Policies
DWS S&P 500 Index Fund (the “Fund” ) is a diversified series of Deutsche DWS Institutional Funds (the “Trust” ), which is registered under the Investment Company Act of 1940, as amended (the “1940 Act” ), as an open-end management investment company organized as a Massachusetts business trust.
The Fund, a feeder fund, seeks to achieve its investment objective by investing all of its investable assets in a master portfolio, Deutsche DWS Equity 500 Index Portfolio (the “Portfolio” ), a diversified open-end management investment company registered under the 1940 Act and organized as a New York trust advised by DWS Investment Management Americas, Inc. (“DIMA” or the “Advisor” ), an indirect, wholly owned subsidiary of DWS Group GmbH & Co. KGaA (“DWS Group” ). A master/ feeder fund structure is one in which a fund (a “feeder fund” ), instead of investing directly in a portfolio of securities, invests most or all of its investment assets in a separate registered investment company (the “master fund” ) with substantially the same investment objective and policies as the feeder fund. Such a structure permits the pooling of assets of two or more feeder funds, preserving separate identities or distribution channels at the feeder fund level. At December 31, 2023, the Fund owned approximately 76% of the Portfolio.
The Fund offers multiple classes of shares which provide investors with different purchase options. Class A shares are subject to an initial sales charge. Class C shares are not subject to an initial sales charge but are subject to higher ongoing expenses than Class A shares and a contingent deferred sales charge payable upon certain redemptions within one year of purchase. Class C shares automatically convert to Class A shares in the same fund after 8 years, provided that the Fund or the financial intermediary through which the shareholder purchased the Class C shares has records verifying that the Class C shares have been held for at least 8 years. Class R6 shares are not subject to initial or contingent deferred sales charges and are generally available only to certain qualifying plans and programs. Class S shares are not subject to initial or contingent deferred sales charges and are available through certain intermediary relationships with financial services firms, or can be purchased by establishing an account directly with the Fund’s transfer agent.
Investment income, realized and unrealized gains and losses, and certain fund-level expenses and expense reductions, if any, are borne pro rata on the basis of relative net assets by the holders of all classes of shares, except that each class bears certain expenses unique to that class such as distribution and services fees, services to shareholders and certain other class specific expenses. Differences in class-level expenses may result in
payment of different per share dividends by class. All shares of the Fund have equal rights with respect to voting subject to class-specific arrangements.
The Fund’s financial statements are prepared in accordance with accounting principles generally accepted in the United States of America (“U.S. GAAP” ) which require the use of management estimates. Actual results could differ from those estimates. The Fund qualifies as an investment company under Topic 946 of Accounting Standards Codification of U.S. GAAP. The policies described below are followed consistently by the Fund in the preparation of its financial statements. The financial statements of the Portfolio, including the Investment Portfolio, are contained elsewhere in this report and should be read in conjunction with the Fund’s financial statements.
Security Valuation. The Fund records its investment in the Portfolio at value, which reflects its proportionate interest in the net assets of the Portfolio and is categorized as Level 1. Valuation of the securities held by the Portfolio is discussed in the notes to the Portfolio’s financial statements included elsewhere in this report.
Disclosure about the classification of fair value measurements is included in a table following the Portfolio’s Investment Portfolio.
Federal Income Taxes. The Fund’s policy is to comply with the requirements of the Internal Revenue Code of 1986, as amended, which are applicable to regulated investment companies, and to distribute all of its taxable income to its shareholders. Accordingly, the Fund paid no federal income taxes and no federal income tax provision was required.
The Fund has reviewed the tax positions for the open tax years as of December 31, 2023, and has determined that no provision for income tax and/or uncertain tax positions is required in the Fund’s financial statements. The Fund’s federal tax returns for the prior three fiscal years remain open subject to examination by the Internal Revenue Service.
Distribution of Income and Gains. Distributions from net investment income of the Fund are declared and distributed to shareholders quarterly. Net realized gains from investment transactions, in excess of available capital loss carryforwards, would be taxable to the Fund if not distributed, and, therefore, will be distributed to shareholders at least annually. The Fund may also make additional distributions for tax purposes if necessary.
The timing and characterization of certain income and capital gain distributions are determined annually in accordance with federal tax regulations which may differ from accounting principles generally accepted in the United States of America. These differences primarily relate to investments in derivatives and the realized tax character on distributions from certain securities. The Fund may utilize a portion of the proceeds from capital shares redeemed as a distribution from net
investment income and realized capital gains. As a result, net investment income (loss) and net realized gain (loss) on investment transactions for a reporting period may differ significantly from distributions during such period. Accordingly, the Fund may periodically make reclassifications among certain of its capital accounts without impacting the net asset value of the Fund.
At December 31, 2023, the Fund’s components of distributable earnings (accumulated losses) on a net tax basis were as follows:
Undistributed ordinary income* | |
Undistributed long-term capital gains | |
In addition, the tax character of distributions paid to shareholders by the Funds are summarized as follows:
| |
| | |
Distributions from ordinary income* | | |
Distributions from long-term capital gains | | |
| For tax purposes, short-term capital gain distributions are considered ordinary income distributions. |
Contingencies. In the normal course of business, the Fund may enter into contracts with service providers that contain general indemnification clauses. The Fund’s maximum exposure under these arrangements is unknown, as this would involve future claims that may be made against the Fund that have not yet been made. However, based on experience, the Fund expects the risk of loss to be remote.
Other. The Fund receives a daily allocation of the Portfolio’s income, expenses and net realized and unrealized gains and losses in proportion to its investment in the Portfolio. Expenses directly attributed to a fund are charged to that fund, while expenses which are attributable to the Trust are allocated among the funds in the Trust on the basis of relative net assets.
Management Agreement. Under its Investment Management Agreement with the Fund, the Advisor serves as investment manager to the Fund. The Advisor receives a management fee from the Portfolio pursuant to the master/feeder structure noted above in Note A.
Under the Investment Management Agreement, the Fund pays no management fee to the Advisor so long as the Fund is a feeder fund that invests substantially all of its assets in the Portfolio. In the event the Board of Trustees determines it is in the best interests of the Fund to withdraw
its investment from the Portfolio, the Advisor may become responsible for directly managing the assets of the Fund under the Investment Management Agreement. In such event, the Fund would pay the Advisor an annual fee (exclusive of any applicable waivers/reimbursements) of 0.15% of the Fund’s average daily net assets, accrued daily and payable monthly.
For the period from January 1, 2023 through April 30, 2024 (through September 30, 2023 for Class C and Class R6 shares), the Advisor has contractually agreed to waive its fees and/or reimburse fund expenses, including expenses of the Portfolio allocated to the Fund, to the extent necessary to maintain the total annual operating expenses (excluding certain expenses such as extraordinary expenses, taxes, brokerage, interest expense and acquired fund fees and expenses) of each class as follows:
Effective October 1, 2023 through September 30, 2024, the Advisor has contractually agreed to waive its fees and/or reimburse fund expenses, including expenses of the Portfolio allocated to the Fund, to the extent necessary to maintain the total annual operating expenses (excluding certain expenses such as extraordinary expenses, taxes, brokerage, interest expense and acquired fund fees and expenses) of certain classes as follows:
For the year ended December 31, 2023, fees waived and/or expenses reimbursed for certain classes are as follows:
Administration Fee. Pursuant to an Administrative Services Agreement, DIMA provides most administrative services to the Fund. For all services provided under the Administrative Services Agreement, the Fund pays the Advisor an annual fee (“Administration Fee” ) of 0.097% of the Fund’s average daily net assets, computed and accrued daily and payable
monthly. For the year ended December 31, 2023, the Administration Fee was $1,075,330, of which $97,489 is unpaid.
Service Provider Fees. DWS Service Company (“DSC” ), an affiliate of the Advisor, is the transfer agent, dividend-paying agent and shareholder service agent for the Fund. Pursuant to a sub-transfer agency agreement between DSC and SS&C GIDS, Inc. (“SS&C” ), DSC has delegated certain transfer agent, dividend-paying agent and shareholder service agent functions to SS&C. DSC compensates SS&C out of the shareholder servicing fee it receives from the Fund. For the year ended December 31, 2023, the amounts charged to the Fund by DSC were as follows:
| | Unpaid at
December 31, 2023 |
| | |
| | |
| | |
| | |
| | |
In addition, for the year ended December 31, 2023, the amounts charged to the Fund for recordkeeping and other administrative services provided by unaffiliated third parties, included in the Statement of Operations under “Services to shareholders,” were as follows:
Distribution and Service Agreement. Under the Fund’s Class C 12b-1 Plan, DWS Distributors, Inc. (“DDI” ), a subsidiary of the Advisor, receives a fee (“Distribution Fee” ) of 0.75% of the average daily net assets of Class C shares. In accordance with the Fund’s Underwriting and Distribution Services Agreement, DDI enters into related selling group agreements with various firms at various rates for sales of Class C shares. For the year ended December 31, 2023, the Distribution Fees were as follows:
| | Unpaid at
December 31, 2023 |
| | |
In addition, DDI provides information and administrative services for a fee (“Service Fee” ) to Class A and C shareholders at an annual rate of up to 0.25% of the average daily net assets for each such class. DDI in turn has various agreements with financial services firms that provide these services and pays these fees based upon the assets of shareholder accounts the firms service. For the year ended December 31, 2023, the Service Fee was as follows:
| | Unpaid at
December 31, 2023 | |
| | | |
| | | |
| | | |
Underwriting Agreement and Contingent Deferred Sales Charge. DDI is the principal underwriter for the Fund. Underwriting commissions paid in connection with the distribution of Class A shares for the year ended December 31, 2023 aggregated $5,005.
In addition, DDI receives any contingent deferred sales charge (“CDSC” ) from Class C share redemptions occurring within one year of purchase. There is no such charge upon redemption of any share appreciation or reinvested dividends. The CDSC is 1% of the value of the shares redeemed for Class C. For the year ended December 31, 2023, the CDSC for Class C shares aggregated $3,481. A deferred sales charge of up to 1% is assessed on certain redemptions of Class A shares. For the year ended December 31, 2023, DDI received $869 for Class A shares.
Other Service Fees. Under an agreement with the Fund, DIMA is compensated for providing regulatory filing services to the Fund. For the year ended December 31, 2023, the amount charged to the Fund by DIMA included in the Statement of Operations under “Reports to shareholders” aggregated $1,740, of which $210 is unpaid.
Trustees’ Fees and Expenses. The Fund paid retainer fees to each Trustee not affiliated with the Advisor, plus specified amounts to the Board Chairperson and to each committee Chairperson.
C.
Fund Share Transactions
The following table summarizes share and dollar activity in the Fund:
| Year Ended
December 31, 2023 | Year Ended
December 31, 2022 |
| | | | |
|
| | | | |
| | | | |
| | | | |
| | | | |
| | | | |
Shares issued to shareholders in reinvestment of distributions |
| | | | |
| | | | |
| | | | |
| | | | |
| | | | |
|
| | | | |
| | | | |
| | | | |
| | | | |
| | | | |
|
| | | | |
| | | | |
| | | | |
| | | | |
| | | | |
Report of Independent Registered Public Accounting Firm
To the Board of Trustees of Deutsche DWS Institutional Funds and Shareholders of DWS S&P 500 Index Fund:
Opinion on the Financial Statements
We have audited the accompanying statement of assets and liabilities of DWS S&P 500 Index Fund (the “Fund” ) (one of the funds constituting Deutsche DWS Institutional Funds) (the “Trust” ) as of December 31, 2023, and the related statement of operations for the year then ended, the statements of changes in net assets for each of the two years in the period then ended, the financial highlights for each of the five years in the period then ended and the related notes (collectively referred to as the “financial statements” ). In our opinion, the financial statements present fairly, in all material respects, the financial position of the Fund (one of the funds constituting Deutsche DWS Institutional Funds) at December 31, 2023, the results of its operations for the year then ended, the statements of changes in net assets for each of the two years in the period then ended, and its financial highlights for each of the five years in the period then ended, in conformity with U.S. generally accepted accounting principles.
Basis for Opinion
These financial statements are the responsibility of the Trust’s management. Our responsibility is to express an opinion on the Fund’s financial statements based on our audits. We are a public accounting firm registered with the Public Company Accounting Oversight Board (United States) (“PCAOB” ) and are required to be independent with respect to the Trust in accordance with the U.S. federal securities laws and the applicable rules and regulations of the Securities and Exchange Commission and the PCAOB.
We conducted our audits in accordance with the standards of the PCAOB. Those standards require that we plan and perform the audit to obtain reasonable assurance about whether the financial statements are free of material misstatement, whether due to error or fraud. The Trust is not required to have, nor were we engaged to perform, an audit of the Trust’s internal control over financial reporting. As part of our audits, we are required to obtain an understanding of internal control over financial reporting, but not for the purpose of expressing an opinion on the effectiveness of the Trust’s internal control over financial reporting. Accordingly, we express no such opinion.
Our audits included performing procedures to assess the risks of material misstatement of the financial statements, whether due to error or fraud, and performing procedures that respond to those risks. Such procedures included examining, on a test basis, evidence regarding the amounts and disclosures in the financial statements. Our procedures included confirmation of securities owned as of December 31, 2023, by correspondence with the custodian, brokers, and others; when replies were not received from brokers and others, we performed other auditing procedures. Our audits also included evaluating the accounting principles used and significant estimates made by management, as well as evaluating the overall presentation of the financial statements. We believe that our audits provide a reasonable basis for our opinion.
We have served as the auditor of one or more investment companies in the DWS family of funds since at least 1979, but we are unable to determine the specific year.
Boston, Massachusetts
February 22, 2024
Other Information (Unaudited)
Regulatory Update — Tailored Shareholder Report
Effective January 24, 2023, the SEC amended the rules for mutual fund and exchange-traded fund (“ETF” ) annual and semi-annual shareholder reports. The amended rules apply to mutual funds and ETFs that are registered on Form N-1A (i.e., open-end funds) and implement a new streamlined disclosure framework requiring “concise and visually engaging” shareholder reports highlighting key information, including a simplified expense presentation, performance information, portfolio holdings and certain fund statistics. The amended rules seek to simplify shareholder reporting by consolidating investor friendly data in one report and moving other data to Form N-CSR, creating a layered disclosure framework. Certain information from the Fund’s current shareholder reports, including the Fund’s investment portfolio, financial statements and financial highlights, will move to Form N-CSR. This information must be available online, delivered free of charge upon request and filed on a semiannual basis on Form N-CSR. Notably, the amended rules will require mutual funds and ETFs to prepare separate individual shareholder reports for each fund share class. The amendments also include a revised definition of “appropriate broad-based securities market index” that will affect performance presentations in the new streamlined reports and mutual fund and ETF prospectuses. The amended rules and related form amendments have a compliance date of July 24, 2024. At this time, management is evaluating the impact of the amended rules and form amendments on the content of the Fund’s current shareholder reports.
Deutsche DWS Equity 500 Index Portfolio | | |
Information About Your Fund’s Expenses
As an investor of the Fund, you incur two types of costs: ongoing expenses and transaction costs. Ongoing expenses include management fees, distribution and service (12b-1) fees and other Fund expenses. Examples of transaction costs include sales charges (loads) and account maintenance fees, which are not shown in this section. The following tables are intended to help you understand your ongoing expenses (in dollars) of investing in the Fund and to help you compare these expenses
with the ongoing expenses of investing in other mutual funds. In the most recent six-month period, the Fund limited these expenses for Class A and
Class S shares; had it not done so, expenses would have been higher. The example in the table is based on an investment of $1,000 invested at the beginning of the six-month period and held for the entire period (July 1, 2023 to December 31, 2023).
The tables illustrate your Fund’s expenses in two ways:
—
Actual Fund Return. This helps you estimate the actual dollar amount of ongoing expenses (but not transaction costs) paid on a $1,000 investment in the Fund using the Fund’s actual return during the period. To estimate the expenses you paid over the period, simply divide your account value by $1,000 (for example, an $8,600 account value divided by $1,000 = 8.6), then multiply the result by the number in the “Expenses Paid per $1,000” line under the share class you hold.
—
Hypothetical 5% Fund Return. This helps you to compare your Fund’s ongoing expenses (but not transaction costs) with those of other mutual funds using the Fund’s actual expense ratio and a hypothetical rate of return of 5% per year before expenses. Examples using a 5% hypothetical fund return may be found in the shareholder reports of other mutual funds. The hypothetical account values and expenses may not be used to estimate the actual ending account balance or expenses you paid for the period.
Please note that the expenses shown in these tables are meant to highlight your ongoing expenses only and do not reflect any transaction costs. The “Expenses Paid per $1,000” line of the tables is useful in comparing ongoing expenses only and will not help you determine the
relative total expense of owning different funds. Subject to certain exceptions, an account maintenance fee of $20.00 assessed once per calendar year for Classes A, C and S shares may apply for accounts with balances less than $10,000. This fee is not included in these tables. If it was, the estimate of expenses paid for Classes A, C and S shares during the period would be higher, and account value during the period would be lower, by this amount.
Expenses and Value of a $1,000 Investment
for the six months ended December 31, 2023 (Unaudited)
| | | | |
Beginning Account Value 7/1/23 | | | | |
Ending Account Value 12/31/23 | | | | |
Expenses Paid per $1,000** | | | | |
Hypothetical 5% Fund Return | | | | |
Beginning Account Value 7/1/23 | | | | |
Ending Account Value 12/31/23 | | | | |
Expenses Paid per $1,000** | | | | |
| Expenses include amounts allocated proportionally from the master portfolio. |
| Expenses are equal to the Fund’s annualized expense ratio for each share class, multiplied by the average account value over the period, multiplied by 184 (the number of days in the most recent six-month period), then divided by 365. |
Annualized Expense Ratios | | | | |
| | | | |
For more information, please refer to the Fund’s prospectus.
For an analysis of the fees associated with an investment in the Fund or similar funds, please refer to tools.finra.org/fund_analyzer/.
Tax Information (Unaudited)
The Fund paid distributions of $2.41 per share from net long-term capital gains during its year ended December 31, 2023.
Pursuant to Section 852 of the Internal Revenue Code, the Fund designates $79,610,095 as capital gain dividends for its year ended December 31, 2023.
For corporate shareholders, 100% of the ordinary dividends (i.e., income dividends plus short-term capital gains) paid during the Fund’s fiscal year ended December 31, 2023, qualified for the dividends received deduction.
For federal income tax purposes, the Fund designates approximately $17,527,000, or the maximum amount allowable under tax law, as qualified dividend income.
Please consult a tax advisor if you have questions about federal or state income tax laws, or on how to prepare your tax returns. If you have specific questions about your account, please call (800) 728-3337.
(The following financial statements of the Deutsche DWS Equity 500 Index Portfolio should be read in conjunction with the Fund’s financial statements.)
| | Deutsche DWS Equity 500 Index Portfolio |
Investment Portfolioas of December 31, 2023
| | |
| |
Communication Services 8.6% | |
Diversified Telecommunication Services 0.7% | |
| | | |
Verizon Communications, Inc. | | | |
| | | |
| |
| | | |
Live Nation Entertainment, Inc.* | | | |
| | | |
Take-Two Interactive Software, Inc.* | | | |
| | | |
Warner Bros Discovery, Inc.* | | | |
| | | |
Interactive Media & Services 5.8% | |
| | | |
| | | |
| | | |
Meta Platforms, Inc. “A” * | | | |
| | | |
| |
Charter Communications, Inc. “A” * | | | |
| | | |
| | | |
| | | |
Interpublic Group of Companies, Inc. | | | |
| | | |
| | | |
| | | |
| | | |
| | | |
Wireless Telecommunication Services 0.2% | |
| | | |
The accompanying notes are an integral part of the financial statements.
Deutsche DWS Equity 500 Index Portfolio | | |
| | |
Consumer Discretionary 10.8% | |
Automobile Components 0.1% | |
| | | |
| | | |
| | | |
| |
| | | |
| | | |
| | | |
| | | |
| |
| | | |
| | | |
| | | |
| | | |
| |
| | | |
| | | |
| | | |
| | | |
Hotels, Restaurants & Leisure 2.2% | |
| | | |
| | | |
Caesars Entertainment, Inc.* | | | |
| | | |
Chipotle Mexican Grill, Inc.* | | | |
| | | |
| | | |
| | | |
Hilton Worldwide Holdings, Inc. | | | |
| | | |
Marriott International, Inc. “A” | | | |
| | | |
MGM Resorts International* | | | |
Norwegian Cruise Line Holdings Ltd.* | | | |
Royal Caribbean Cruises Ltd.* | | | |
| | | |
| | | |
| | | |
| | | |
The accompanying notes are an integral part of the financial statements.
| | Deutsche DWS Equity 500 Index Portfolio |
| | |
| |
| | | |
| | | |
| | | |
| | | |
| | | |
| | | |
| | | |
| | | |
| |
| | | |
| |
| | | |
| | | |
| | | |
| | | |
| | | |
| | | |
O’Reilly Automotive, Inc.* | | | |
| | | |
| | | |
| | | |
| | | |
| | | |
Textiles, Apparel & Luxury Goods 0.5% | |
Lululemon Athletica, Inc.* | | | |
| | | |
| | | |
| | | |
| | | |
| | | |
| |
| |
| | | |
| | | |
Constellation Brands, Inc. “A” | | | |
| | | |
Molson Coors Beverage Co. “B” | | | |
The accompanying notes are an integral part of the financial statements.
Deutsche DWS Equity 500 Index Portfolio | | |
| | |
| | | |
| | | |
| | | |
Consumer Staples Distribution & Retail 1.8% | |
| | | |
| | | |
| | | |
| | | |
| | | |
| | | |
Walgreens Boots Alliance, Inc. | | | |
| | | |
| | | |
| |
Archer-Daniels-Midland Co. | | | |
| | | |
| | | |
| | | |
| | | |
| | | |
| | | |
| | | |
Lamb Weston Holdings, Inc. | | | |
| | | |
Mondelez International, Inc. “A” | | | |
| | | |
| | | |
| | | |
| | | |
| |
Church & Dwight Co., Inc. | | | |
| | | |
| | | |
| | | |
| | | |
| | | |
Personal Care Products 0.2% | |
Estee Lauder Companies, Inc. “A” | | | |
| | | |
| | | |
The accompanying notes are an integral part of the financial statements.
| | Deutsche DWS Equity 500 Index Portfolio |
| | |
| |
| | | |
Philip Morris International, Inc. | | | |
| | | |
| |
Energy Equipment & Services 0.4% | |
| | | |
| | | |
| | | |
| | | |
Oil, Gas & Consumable Fuels 3.5% | |
| | | |
| | | |
| | | |
| | | |
| | | |
| | | |
| | | |
| | | |
| | | |
| | | |
| | | |
| | | |
| | | |
Occidental Petroleum Corp. | | | |
| | | |
| | | |
Pioneer Natural Resources Co. | | | |
| | | |
| | | |
| | | |
| | | |
| |
| |
| | | |
| | | |
Citizens Financial Group, Inc. | | | |
| | | |
| | | |
Huntington Bancshares, Inc. | | | |
| | | |
The accompanying notes are an integral part of the financial statements.
Deutsche DWS Equity 500 Index Portfolio | | |
| | |
| | | |
| | | |
PNC Financial Services Group, Inc. | | | |
| | | |
| | | |
| | | |
| | | |
| | | |
| | | |
| |
Ameriprise Financial, Inc. | | | |
Bank of New York Mellon Corp. | | | |
| | | |
| | | |
Cboe Global Markets, Inc. | | | |
| | | |
| | | |
FactSet Research Systems, Inc. | | | |
| | | |
Intercontinental Exchange, Inc. | | | |
| | | |
MarketAxess Holdings, Inc. | | | |
| | | |
| | | |
| | | |
| | | |
| | | |
Raymond James Financial, Inc. | | | |
| | | |
| | | |
T. Rowe Price Group, Inc. | | | |
The Goldman Sachs Group, Inc. | | | |
| | | |
| |
| | | |
Capital One Financial Corp. | | | |
Discover Financial Services | | | |
| | | |
| | | |
| |
Berkshire Hathaway, Inc. “B” * | | | |
Fidelity National Information Services, Inc. | | | |
The accompanying notes are an integral part of the financial statements.
| | Deutsche DWS Equity 500 Index Portfolio |
| | |
| | | |
FleetCor Technologies, Inc.* | | | |
| | | |
Jack Henry & Associates, Inc. | | | |
| | | |
| | | |
| | | |
| | | |
| |
| | | |
| | | |
American International Group, Inc. | | | |
| | | |
| | | |
Arthur J. Gallagher & Co. | | | |
| | | |
| | | |
| | | |
Cincinnati Financial Corp. | | | |
| | | |
| | | |
Hartford Financial Services Group, Inc. | | | |
| | | |
Marsh & McLennan Companies, Inc. | | | |
| | | |
Principal Financial Group, Inc. | | | |
| | | |
Prudential Financial, Inc. | | | |
Travelers Companies, Inc. | | | |
| | | |
| | | |
| | | |
| |
| |
| | | |
| | | |
| | | |
| | | |
| | | |
| | | |
The accompanying notes are an integral part of the financial statements.
Deutsche DWS Equity 500 Index Portfolio | | |
| | |
Regeneron Pharmaceuticals, Inc.* | | | |
Vertex Pharmaceuticals, Inc.* | | | |
| | | |
Health Care Equipment & Supplies 2.6% | |
| | | |
| | | |
Baxter International, Inc. | | | |
| | | |
| | | |
| | | |
| | | |
Edwards Lifesciences Corp.* | | | |
GE HealthCare Technologies, Inc. | | | |
| | | |
IDEXX Laboratories, Inc.* | | | |
| | | |
Intuitive Surgical, Inc.* | | | |
| | | |
| | | |
| | | |
| | | |
| | | |
The Cooper Companies, Inc. | | | |
Zimmer Biomet Holdings, Inc. | | | |
| | | |
Health Care Providers & Services 2.8% | |
| | | |
| | | |
| | | |
| | | |
| | | |
| | | |
| | | |
| | | |
| | | |
| | | |
Laboratory Corp. of America Holdings | | | |
| | | |
| | | |
| | | |
The accompanying notes are an integral part of the financial statements.
| | Deutsche DWS Equity 500 Index Portfolio |
| | |
| | | |
Universal Health Services, Inc. “B” | | | |
| | | |
Life Sciences Tools & Services 1.5% | |
Agilent Technologies, Inc. | | | |
Bio-Rad Laboratories, Inc. “A” * | | | |
| | | |
Charles River Laboratories International, Inc.* | | | |
| | | |
| | | |
| | | |
Mettler-Toledo International, Inc.* | | | |
| | | |
Thermo Fisher Scientific, Inc. | | | |
| | | |
West Pharmaceutical Services, Inc. | | | |
| | | |
| |
| | | |
| | | |
| | | |
| | | |
| | | |
| | | |
| | | |
| | | |
| | | |
| |
| |
| | | |
| | | |
| | | |
| | | |
Huntington Ingalls Industries, Inc. | | | |
L3Harris Technologies, Inc. | | | |
| | | |
| | | |
| | | |
| | | |
| | | |
| | | |
The accompanying notes are an integral part of the financial statements.
Deutsche DWS Equity 500 Index Portfolio | | |
| | |
Air Freight & Logistics 0.5% | |
C.H. Robinson Worldwide, Inc. | | | |
Expeditors International of Washington, Inc. | | | |
| | | |
United Parcel Service, Inc. “B” | | | |
| | | |
| |
| | | |
| | | |
Builders FirstSource, Inc.* | | | |
| | | |
Johnson Controls International PLC | | | |
| | | |
| | | |
| | | |
Commercial Services & Supplies 0.6% | |
| | | |
| | | |
| | | |
| | | |
| | | |
| | | |
| | | |
Construction & Engineering 0.1% | |
| | | |
Electrical Equipment 0.6% | |
| | | |
| | | |
| | | |
| | | |
| | | |
Rockwell Automation, Inc. | | | |
| | | |
Ground Transportation 1.1% | |
| | | |
J.B. Hunt Transport Services, Inc. | | | |
| | | |
Old Dominion Freight Line, Inc. | | | |
The accompanying notes are an integral part of the financial statements.
| | Deutsche DWS Equity 500 Index Portfolio |
| | |
| | | |
| | | |
| | | |
Industrial Conglomerates 0.8% | |
| | | |
| | | |
Honeywell International, Inc. | | | |
| | | |
| |
| | | |
| | | |
| | | |
| | | |
| | | |
| | | |
Illinois Tool Works, Inc. | | | |
| | | |
| | | |
| | | |
| | | |
| | | |
| | | |
| | | |
Stanley Black & Decker, Inc. | | | |
Westinghouse Air Brake Technologies Corp. | | | |
| | | |
| | | |
| |
American Airlines Group, Inc.* | | | |
| | | |
| | | |
United Airlines Holdings, Inc.* | | | |
| | | |
Professional Services 0.7% | |
Automatic Data Processing, Inc. | | | |
Broadridge Financial Solutions, Inc. | | | |
Ceridian HCM Holding, Inc.* | | | |
| | | |
| | | |
| | | |
| | | |
The accompanying notes are an integral part of the financial statements.
Deutsche DWS Equity 500 Index Portfolio | | |
| | |
| | | |
| | | |
| | | |
| | | |
Trading Companies & Distributors 0.3% | |
| | | |
| | | |
| | | |
| | | |
Information Technology 28.8% | |
Communications Equipment 0.9% | |
| | | |
| | | |
| | | |
| | | |
| | | |
| | | |
Electronic Equipment, Instruments & Components 0.6% | |
| | | |
| | | |
| | | |
| | | |
Keysight Technologies, Inc.* | | | |
| | | |
Teledyne Technologies, Inc.* | | | |
| | | |
Zebra Technologies Corp. “A” * | | | |
| | | |
| |
| | | |
Akamai Technologies, Inc.* | | | |
Cognizant Technology Solutions Corp. “A” | | | |
| | | |
| | | |
International Business Machines Corp. | | | |
| | | |
| | | |
Semiconductors & Semiconductor Equipment 8.1% | |
Advanced Micro Devices, Inc.* | | | |
| | | |
The accompanying notes are an integral part of the financial statements.
| | Deutsche DWS Equity 500 Index Portfolio |
| | |
| | | |
| | | |
| | | |
| | | |
| | | |
| | | |
| | | |
Microchip Technology, Inc. | | | |
| | | |
Monolithic Power Systems, Inc. | | | |
| | | |
| | | |
| | | |
| | | |
| | | |
| | | |
| | | |
| | | |
| | | |
| |
| | | |
| | | |
| | | |
Cadence Design Systems, Inc.* | | | |
| | | |
| | | |
| | | |
| | | |
| | | |
| | | |
Palo Alto Networks, Inc.* | | | |
| | | |
| | | |
| | | |
| | | |
| | | |
Tyler Technologies, Inc.* | | | |
| | | |
Technology Hardware, Storage & Peripherals 7.3% | |
| | | |
Hewlett Packard Enterprise Co. | | | |
| | | |
The accompanying notes are an integral part of the financial statements.
Deutsche DWS Equity 500 Index Portfolio | | |
| | |
| | | |
Seagate Technology Holdings PLC | | | |
| | | |
| | | |
| |
| |
Air Products & Chemicals, Inc. | | | |
| | | |
| | | |
CF Industries Holdings, Inc. | | | |
| | | |
| | | |
| | | |
| | | |
| | | |
| | | |
International Flavors & Fragrances, Inc. | | | |
| | | |
LyondellBasell Industries NV “A” | | | |
| | | |
| | | |
| | | |
| | | |
Construction Materials 0.2% | |
Martin Marietta Materials, Inc. | | | |
| | | |
| | | |
Containers & Packaging 0.2% | |
| | | |
| | | |
| | | |
| | | |
Packaging Corp. of America | | | |
| | | |
| | | |
| |
| | | |
| | | |
The accompanying notes are an integral part of the financial statements.
| | Deutsche DWS Equity 500 Index Portfolio |
| | |
| | | |
| | | |
| | | |
| |
| |
Healthpeak Properties, Inc. | | | |
| | | |
| | | |
| | | |
Hotel & Resort REITs 0.0% | |
Host Hotels & Resorts, Inc. | | | |
| |
| | | |
| |
Alexandria Real Estate Equities, Inc. | | | |
| | | |
| | | |
Real Estate Management & Development 0.2% | |
| | | |
| | | |
| | | |
| |
AvalonBay Communities, Inc. | | | |
| | | |
| | | |
Essex Property Trust, Inc. | | | |
| | | |
Mid-America Apartment Communities, Inc. | | | |
| | | |
| | | |
| |
Federal Realty Investment Trust | | | |
| | | |
| | | |
| | | |
Simon Property Group, Inc. | | | |
| | | |
| |
| | | |
The accompanying notes are an integral part of the financial statements.
Deutsche DWS Equity 500 Index Portfolio | | |
| | |
| | | |
Digital Realty Trust, Inc. | | | |
| | | |
Extra Space Storage, Inc. | | | |
| | | |
| | | |
| | | |
| | | |
| | | |
| | | |
| |
| |
| | | |
American Electric Power Co., Inc. | | | |
Constellation Energy Corp. | | | |
| | | |
| | | |
| | | |
| | | |
| | | |
| | | |
| | | |
| | | |
| | | |
| | | |
Pinnacle West Capital Corp. | | | |
| | | |
| | | |
| | | |
| | | |
| |
| | | |
Independent Power & Renewable Electricity Producers 0.0% | |
| | | |
| |
| | | |
| | | |
| | | |
Consolidated Edison, Inc. | | | |
| | | |
| | | |
The accompanying notes are an integral part of the financial statements.
| | Deutsche DWS Equity 500 Index Portfolio |
| | |
| | | |
Public Service Enterprise Group, Inc. | | | |
| | | |
| | | |
| | | |
| |
American Water Works Co., Inc. | | | |
Total Common Stocks (Cost $372,701,542) | |
| | |
Government & Agency Obligations 0.0% |
U.S. Treasury Obligations | |
U.S. Treasury Bills, 5.183% (a), 4/11/2024 (b) (Cost $98,510) | | | |
| | |
|
DWS Central Cash Management Government Fund, 5.38% (c) (Cost $3,866,583) | | | |
| | | |
Total Investment Portfolio (Cost $376,666,635) | | | |
Other Assets and Liabilities, Net | | | |
| | | |
The accompanying notes are an integral part of the financial statements.
Deutsche DWS Equity 500 Index Portfolio | | |
A summary of the Fund’s transactions with affiliated investments during the year ended December 31, 2023 are as follows:
| | | Net
Real-
ized
Gain/
(Loss)
($) | Net
Change
in
Unreal-
ized
Appreci-
ation
(Depreci-
ation)
($) | | Capital
Gain
Distri-
butions
($) | Number of
Shares at
12/31/2023 | |
Securities Lending Collateral 0.0% |
DWS Government & Agency Securities Portfolio “DWS Government Cash Institutional Shares” ,
5.27% (c) (d) |
| | | | | | | | |
|
DWS Central Cash Management Government Fund, 5.38% (c) |
| | | | | | | | |
| | | | | | | | |
| Non-income producing security. |
| Annualized yield at time of purchase; not a coupon rate. |
| At December 31, 2023, this security has been pledged, in whole or in part, to cover initial margin requirements for open futures contracts. |
| Affiliated fund managed by DWS Investment Management Americas, Inc. The rate shown is the annualized seven-day yield at period end. |
| Represents cash collateral held in connection with securities lending. Income earned by the Fund is net of borrower rebates. |
| Represents the net increase (purchase cost) or decrease (sales proceeds) in the amount invested in cash collateral for the year ended December 31, 2023. |
REIT: Real Estate Investment Trust |
At December 31, 2023, open futures contracts purchased were as follows:
| | | | | | Unrealized
Appreciation ($) |
| | | | | | |
Currency Abbreviation(s)
For information on the Fund’s policy and additional disclosures regarding futures contracts, please refer to the Derivatives section of Note B in the accompanying Notes to Financial Statements.
The accompanying notes are an integral part of the financial statements.
| | Deutsche DWS Equity 500 Index Portfolio |
Fair Value Measurements
Various inputs are used in determining the value of the Portfolio’s investments. These inputs are summarized in three broad levels. Level 1 includes quoted prices in active markets for identical securities. Level 2 includes other significant observable inputs (including quoted prices for similar securities, interest rates, prepayment speeds and credit risk). Level 3 includes significant unobservable inputs (including the Portfolio’s own assumptions in determining the fair value of investments). The level assigned to the securities valuations may not be an indication of the risk or liquidity associated with investing in those securities.
The following is a summary of the inputs used as of December 31, 2023 in valuing the Portfolio’s investments. For information on the Portfolio’s policy regarding the valuation of investments, please refer to the Security Valuation section of Note A in the accompanying Notes to Financial Statements.
| | | | |
| | | | |
Government & Agency Obligations | | | | |
| | | | |
| | | | |
| | | | |
| | | | |
| See Investment Portfolio for additional detailed categorizations. |
| Derivatives include unrealized appreciation (depreciation) on open futures contracts. |
The accompanying notes are an integral part of the financial statements.
Deutsche DWS Equity 500 Index Portfolio | | |
Statement of Assets and Liabilities
as of December 31, 2023
| |
Investments in non-affiliated securities, at value (cost $372,800,052) | |
Investment in DWS Central Cash Management Government Fund (cost $3,866,583) | |
| |
Receivable for investments sold | |
| |
| |
Receivable for variation margin on futures contracts | |
| |
| |
| |
Payable for investments purchased | |
| |
| |
Other accrued expenses and payables | |
| |
| |
The accompanying notes are an integral part of the financial statements.
| | Deutsche DWS Equity 500 Index Portfolio |
Statement of Operations
for the year ended December 31, 2023
| |
| |
Dividends (net of foreign taxes withheld of $125,793) | |
| |
Income distributions — DWS Central Cash Management Government Fund | |
Securities lending income, net of borrower rebates | |
| |
| |
| |
| |
| |
| |
| |
Trustees' fees and expenses | |
| |
| |
| |
Realized and Unrealized Gain (Loss) | |
Net realized gain (loss) from: | |
| |
| |
| |
Change in net unrealized appreciation (depreciation) on: | |
| |
| |
| |
| |
Net increase (decrease) in net assets resulting from operations | |
The accompanying notes are an integral part of the financial statements.
Deutsche DWS Equity 500 Index Portfolio | | |
Statements of Changes in Net Assets
Deutsche DWS Equity 500 Index Portfolio |
| |
Increase (Decrease) in Net Assets | | |
| | |
| | |
| | |
Change in net unrealized appreciation
(depreciation) | | |
Net increase (decrease) in net assets resulting from operations | | |
Capital transactions in shares of beneficial interest: | | |
Proceeds from capital invested | | |
Value of capital withdrawn | | |
Net increase (decrease) in net assets from capital transactions in shares of beneficial interest | | |
Increase (decrease) in net assets | | |
Net assets at beginning of period | | |
Net assets at end of period | | |
The accompanying notes are an integral part of the financial statements.
| | Deutsche DWS Equity 500 Index Portfolio |
Financial Highlights
Deutsche DWS Equity 500 Index Portfolio |
| |
| | | | | |
Ratios to Average Net Assets and Supplemental Data |
Net assets, end of period ($ millions) | | | | | |
| | | | | |
Ratio of net investment income (%) | | | | | |
Portfolio turnover rate (%) | | | | | |
Total investment return (%)a | | | | | |
| Total investment return for the Portfolio was derived from the performance of the Institutional Class of DWS Equity 500 Index Fund. |
The accompanying notes are an integral part of the financial statements.
Deutsche DWS Equity 500 Index Portfolio | | |
Notes to Financial Statements
A.
Organization and Significant Accounting Policies
Deutsche DWS Equity 500 Index Portfolio (the “Portfolio” ) is registered under the Investment Company Act of 1940, as amended (the “1940 Act” ), as a diversified open-end management investment company organized as a New York trust.
The Portfolio is a master fund; a master/feeder fund structure is one in which a fund (a “feeder fund” ), instead of investing directly in a portfolio of securities, invests most or all of its investment assets in a separate registered investment company (the “master fund” ) with substantially the same investment objective and policies as the feeder fund. Such a structure permits the pooling of assets of two or more feeder funds, preserving separate identities or distribution channels at the feeder fund level. The Portfolio has two affiliated DWS feeder funds, with a significant ownership percentage of the Portfolio’s net assets. Investment activities of these feeder funds could have a material impact on the Portfolio. As of December 31, 2023, DWS S&P 500 Index Fund and DWS Equity 500 Index Fund owned approximately 76% and 24%, respectively, of the Portfolio.
The Portfolio’s financial statements are prepared in accordance with accounting principles generally accepted in the United States of America (“U.S. GAAP” ) which require the use of management estimates. Actual results could differ from those estimates. The Portfolio qualifies as an investment company under Topic 946 of Accounting Standards Codification of U.S. GAAP. The policies described below are followed consistently by the Portfolio in the preparation of its financial statements.
Security Valuation. Investments are stated at value determined as of the close of regular trading on the New York Stock Exchange on each day the exchange is open for trading.
The Fund’s Board has designated DWS Investment Management Americas, Inc. (the “Advisor” ) as the valuation designee for the Fund pursuant to Rule 2a-5 under the 1940 Act. The Advisor’s Pricing Committee (the “Pricing Committee” ) typically values securities using readily available market quotations or prices supplied by independent pricing services (which are considered fair values under Rule 2a-5). The Advisor has adopted fair valuation procedures that provide methodologies for fair valuing securities.
Various inputs are used in determining the value of the Portfolio’s investments. These inputs are summarized in three broad levels. Level 1 includes quoted prices in active markets for identical securities. Level 2 includes other significant observable inputs (including quoted prices for similar securities, interest rates, prepayment speeds and credit risk). Level 3 includes significant unobservable inputs (including the Portfolio’s
| | Deutsche DWS Equity 500 Index Portfolio |
own assumptions in determining the fair value of investments). The level assigned to the securities valuations may not be an indication of the risk or liquidity associated with investing in those securities.
Equity securities are valued at the most recent sale price or official closing price reported on the exchange (U.S. or foreign) or over-the-counter market on which they trade. Securities for which no sales are reported are valued at the calculated mean between the most recent bid and asked quotations on the relevant market or, if a mean cannot be determined, at the most recent bid quotation. Equity securities are generally categorized as Level 1.
Debt securities are valued at prices supplied by independent pricing services approved by the Pricing Committee. Such services may use various pricing techniques which take into account appropriate factors such as yield, quality, coupon rate, maturity, type of issue, trading characteristics, prepayment speeds and other data, as well as broker quotes. If the pricing services are unable to provide valuations, debt securities are valued at the average of the most recent reliable bid quotations or evaluated prices, as applicable, obtained from broker-dealers. These securities are generally categorized as Level 2.
Investments in open-end investment companies are valued at their net asset value each business day and are categorized as Level 1.
Futures contracts are generally valued at the settlement prices established each day on the exchange on which they are traded and are categorized as Level 1.
Securities and other assets for which market quotations are not readily available or for which the above valuation procedures are deemed not to reflect fair value are valued in a manner that is intended to reflect their fair value as determined in accordance with procedures approved by the Pricing Committee and are generally categorized as Level 3. In accordance with the Portfolio’s valuation procedures, factors considered in determining value may include, but are not limited to, the type of the security; the size of the holding; the initial cost of the security; the existence of any contractual restrictions on the security’s disposition; the price and extent of public trading in similar securities of the issuer or of comparable companies; quotations or evaluated prices from broker-dealers and/or pricing services; information obtained from the issuer, analysts, and/or the appropriate stock exchange (for exchange-traded securities); an analysis of the company’s or issuer’s financial statements; an evaluation of the forces that influence the issuer and the market(s) in which the security is purchased and sold; and with respect to debt securities, the maturity, coupon, creditworthiness, currency denomination and the movement of the market in which the security is normally traded. The value determined under these procedures may differ from published values for the same securities.
Deutsche DWS Equity 500 Index Portfolio | | |
Securities Lending. Prior to June 23, 2023, Brown Brothers Harriman & Co. served as securities lending agent for the Fund. Effective June 23, 2023, Deutsche Bank AG, as securities lending agent, lends securities of the Portfolio to certain financial institutions under the terms of its securities lending agreement. During the term of the loans, the Portfolio continues to receive interest and dividends generated by the securities and to participate in any changes in their market value. The Portfolio requires the borrowers of the securities to maintain collateral with the Portfolio consisting of either cash or liquid, unencumbered assets having a value at least equal to the value of the securities loaned. When the collateral falls below specified amounts, the securities lending agent will use its best efforts to obtain additional collateral on the next business day to meet required amounts under the securities lending agreement. During the year ended December 31, 2023, the Fund invested the cash collateral, if any, into a joint trading account in affiliated money market funds, including DWS Government & Agency Securities Portfolio, managed by DWS Investment Management Americas, Inc. DWS Investment Management Americas, Inc. receives a management/administration fee (0.11% annualized effective rate as of December 31, 2023) on the cash collateral invested in DWS Government & Agency Securities Portfolio. The Portfolio receives compensation for lending its securities either in the form of fees or by earning interest on invested cash collateral net of borrower rebates and fees paid to a securities lending agent. Either the Portfolio or the borrower may terminate the loan at any time, and the borrower, after notice, is required to return borrowed securities within a standard time period. There may be risks of delay and costs in recovery of securities or even loss of rights in the collateral should the borrower of the securities fail financially. If the Portfolio is not able to recover securities lent, the Portfolio may sell the collateral and purchase a replacement investment in the market, incurring the risk that the value of the replacement security is greater than the value of the collateral. The Portfolio is also subject to all investment risks associated with the reinvestment of any cash collateral received, including, but not limited to, interest rate, credit and liquidity risk associated with such investments.
As of December 31, 2023, the Fund had no securities on loan.
Federal Income Taxes. The Portfolio is considered a partnership under the Internal Revenue Code of 1986, as amended. Therefore, no federal income tax provision is necessary.
It is intended that the Portfolio’s assets, income and distributions will be managed in such a way that an investor in the Portfolio will be able to satisfy the requirements of Subchapter M of the Code, assuming that the investor invested all of its assets in the Portfolio.
At December 31, 2023, the aggregate cost of investments for federal income tax purposes was $398,678,862. The net unrealized appreciation
| | Deutsche DWS Equity 500 Index Portfolio |
for all investments based on tax cost was $1,180,594,735. This consisted of aggregate gross unrealized appreciation for all investments for which there was an excess of value over tax cost of $1,219,912,943 and aggregate gross unrealized depreciation for all investments for which there was an excess of tax cost over value of $39,318,208.
The Portfolio has reviewed the tax positions for the open tax years as of December 31, 2023 and has determined that no provision for income tax and/or uncertain tax positions is required in the Portfolio’s financial statements. The Portfolio’s federal tax returns for the prior three fiscal years remain open subject to examination by the Internal Revenue Service.
Contingencies. In the normal course of business, the Portfolio may enter into contracts with service providers that contain general indemnification clauses. The Portfolio’s maximum exposure under these arrangements is unknown, as this would involve future claims that may be made against the Portfolio that have not yet been made. However, based on experience, the Portfolio expects the risk of loss to be remote.
Other. Investment transactions are accounted for on a trade date plus one basis for daily net asset value calculations. However, for financial reporting purposes, investment transactions are reported on trade date. Interest income is recorded on the accrual basis. Dividend income is recorded on the ex-dividend date net of foreign withholding taxes. Realized gains and losses from investment transactions are recorded on an identified cost basis. Proceeds from litigation payments, if any, are included in net realized gain (loss) from investments.
The Portfolio makes a daily allocation of its net investment income and realized and unrealized gains and losses from securities, futures and foreign currency transactions to its investors in proportion to their investment in the Portfolio.
A futures contract is an agreement between a buyer or seller and an established futures exchange or its clearinghouse in which the buyer or seller agrees to take or make a delivery of a specific amount of a financial instrument at a specified price on a specific date (settlement date). For the year ended December 31, 2023, the Portfolio invested in futures contracts to keep cash on hand to meet shareholder redemptions or other needs while maintaining exposure to the stock market.
Upon entering into a futures contract, the Portfolio is required to deposit with a financial intermediary cash or securities (“initial margin” ) in an amount equal to a certain percentage of the face value indicated in the futures contract. Subsequent payments (“variation margin” ) are made or received by the Portfolio dependent upon the daily fluctuations in the value and are recorded for financial reporting purposes as unrealized gains
Deutsche DWS Equity 500 Index Portfolio | | |
or losses by the Portfolio. Gains or losses are realized when the contract expires or is closed. Since all futures contracts are exchange-traded, counterparty risk is minimized as the exchange’s clearinghouse acts as the counterparty, and guarantees the futures against default.
Certain risks may arise upon entering into futures contracts, including the risk that an illiquid market will limit the Portfolio’s ability to close out a futures contract prior to the settlement date and the risk that the futures contract is not well correlated with the security, index or currency to which it relates. Risk of loss may exceed amounts disclosed in the Statement of Assets and Liabilities.
A summary of the open futures contracts as of December 31, 2023, is included in a table following the Portfolio’s Investment Portfolio. For the year ended December 31, 2023, the investment in futures contracts purchased had a total notional value generally indicative of a range from approximately $4,579,000 to $19,075,000.
The following table summarizes the value of the Portfolio’s derivative instruments held as of December 31, 2023, presented by primary underlying risk exposure:
| |
| |
The above derivative is located in the following Statement of Assets and Liabilities account: |
| Includes cumulative appreciation of futures contracts as disclosed in the Investment Portfolio. Unsettled variation margin is disclosed separately within the Statement of Assets and Liabilities. |
Additionally, the amount of unrealized and realized gains and losses on derivative instruments recognized in Portfolio earnings during the year ended December 31, 2023 and the related location in the accompanying Statement of Operations is summarized in the following tables by primary underlying risk exposure:
| |
| |
The above derivative is located in the following Statement of Operations account: |
| Net realized gain (loss) from futures contracts |
| | Deutsche DWS Equity 500 Index Portfolio |
Change in Net Unrealized Appreciation (Depreciation) | |
| |
The above derivative is located in the following Statement of Operations account: |
| Change in net unrealized appreciation (depreciation) on futures contracts |
C.
Purchases and Sales of Securities
During the year ended December 31, 2023, purchases and sales of investment securities (excluding short-term investments and U.S. Treasury securities) aggregated $28,098,539 and $252,588,031, respectively.
DWS Investment Management Americas, Inc. (“DIMA” or the “Advisor” ), an indirect, wholly owned subsidiary of DWS Group GmbH & Co. KGaA (“DWS Group” ), serves as the investment manager to the Portfolio.
Management Agreement. Under its Investment Management Agreement with the Portfolio, the Advisor determines the securities, instruments and other contracts relating to investments to be purchased, sold or entered into by the Portfolio or delegates such responsibility to the Portfolio’s sub-advisor. Northern Trust Investments, Inc. (“NTI” ) serves as sub-advisor to the Portfolio and is paid by the Advisor for its services. NTI is responsible for the day-to-day management of the Portfolio.
The management fee payable under the Investment Management Agreement is equal to an annual rate (exclusive of any applicable waivers/reimbursements) of 0.05% of the Portfolio’s average daily net assets, computed and accrued daily and payable monthly.
Administration Fee. Pursuant to an Administrative Services Agreement, DIMA provides most administrative services to the Portfolio. For all services provided under the Administrative Services Agreement, the Portfolio pays the Advisor an annual fee (“Administration Fee” ) of 0.03% of the Portfolio’s average daily net assets, computed and accrued daily and payable monthly. For the year ended December 31, 2023, the Administration Fee was $454,785, of which $39,797 is unpaid.
Other Service Fee. Under an agreement with the Portfolio, DIMA is compensated for providing regulatory filing services to the Portfolio. For the year ended December 31, 2023, the amount charged to the Portfolio by DIMA included in the Statement of Operations under “Reports to shareholders” aggregated $2,810, of which $230 is unpaid.
Trustees’ Fees and Expenses. The Portfolio paid retainer fees to each Trustee not affiliated with the Advisor, plus specified amounts to the Board Chairperson and to each committee Chairperson.
Deutsche DWS Equity 500 Index Portfolio | | |
Affiliated Cash Management Vehicles. The Portfolio may invest uninvested cash balances in DWS Central Cash Management Government Fund and DWS ESG Liquidity Fund, affiliated money market funds which are managed by the Advisor. Each affiliated money market fund is managed in accordance with Rule 2a-7 under the 1940 Act, which governs the quality, maturity, diversity and liquidity of instruments in which a money market fund may invest. DWS Central Cash Management Government Fund seeks to maintain a stable net asset value, and DWS ESG Liquidity Fund maintains a floating net asset value. The Portfolio indirectly bears its proportionate share of the expenses of each affiliated money market fund in which it invests. DWS Central Cash Management Government Fund does not pay the Advisor an investment management fee.To the extent that DWS ESG Liquidity Fund pays an investment management fee to the Advisor, the Advisor will waive an amount of the investment management fee payable to the Advisor by the Portfolio equal to the amount of the investment management fee payable on the Portfolio’s assets invested in DWS ESG Liquidity Fund.
The Portfolio and other affiliated funds (the “Participants” ) share in a $375 million revolving credit facility provided by a syndication of banks. The Portfolio may borrow for temporary or emergency purposes, including the meeting of redemption requests that otherwise might require the untimely disposition of securities. The Participants are charged an annual commitment fee, which is allocated based on net assets, among each of the Participants. Interest is calculated at a daily fluctuating rate per annum equal to the sum of 0.10% plus the higher of the Federal Funds Effective Rate and the Overnight Bank Funding Rate, plus 1.25%. The Portfolio may borrow up to a maximum of 33 percent of its net assets under the agreement. The Portfolio had no outstanding loans at December 31, 2023.
| | Deutsche DWS Equity 500 Index Portfolio |
Report of Independent Registered Public Accounting Firm
To the Board of Trustees and Holders of Beneficial Interest in Deutsche DWS Equity 500 Index Portfolio:
Opinion on the Financial Statements
We have audited the accompanying statement of assets and liabilities of Deutsche DWS Equity 500 Index Portfolio (the “Portfolio” ), including the investment portfolio, as of December 31, 2023, and the related statement of operations for the year then ended, the statements of changes in net assets for each of the two years in the period then ended, the financial highlights for each of the five years in the period then ended and the related notes (collectively referred to as the “financial statements” ). In our opinion, the financial statements present fairly, in all material respects, the financial position of the Portfolio at December 31, 2023, the results of its operations for the year then ended, the changes in its net assets for each of the two years in the period then ended and its financial highlights for each of the five years in the period then ended, in conformity with U.S. generally accepted accounting principles.
Basis for Opinion
These financial statements are the responsibility of the Portfolio’s management. Our responsibility is to express an opinion on the Portfolio’s financial statements based on our audits. We are a public accounting firm registered with the Public Company Accounting Oversight Board (United States) (“PCAOB” ) and are required to be independent with respect to the Portfolio in accordance with the U.S. federal securities laws and the applicable rules and regulations of the Securities and Exchange Commission and the PCAOB.
We conducted our audits in accordance with the standards of the PCAOB. Those standards require that we plan and perform the audit to obtain reasonable assurance about whether the financial statements are free of material misstatement, whether due to error or fraud. The Portfolio is not required to have, nor were we engaged to perform, an audit of the Portfolio’s internal control over financial reporting. As part of our audits, we are required to obtain an understanding of internal control over financial reporting, but not for the purpose of expressing an opinion on the effectiveness of the Portfolio’s internal control over financial reporting. Accordingly, we express no such opinion.
Our audits included performing procedures to assess the risks of material misstatement of the financial statements, whether due to error or fraud,
Deutsche DWS Equity 500 Index Portfolio | | |
and performing procedures that respond to those risks. Such procedures included examining, on a test basis, evidence regarding the amounts and disclosures in the financial statements. Our procedures included confirmation of securities owned as of December 31, 2023, by correspondence with the custodian, brokers, and others; when replies were not received from brokers and others, we performed other auditing procedures. Our audits also included evaluating the accounting principles used and significant estimates made by management, as well as evaluating the overall presentation of the financial statements. We believe that our audits provide a reasonable basis for our opinion. We have served as the auditor of one or more investment companies in the DWS family of funds since at least 1979, but we are unable to determine the specific year.
Boston, Massachusetts
February 22, 2024
| | Deutsche DWS Equity 500 Index Portfolio |
Advisory Agreement Board Considerations and Fee Evaluation
DWS S&P 500 Index Fund (the “Fund” ), a series of Deutsche DWS Institutional Funds, invests substantially all of its assets in Deutsche DWS Equity 500 Index Portfolio (the “Portfolio” ) in order to achieve its investment objective. The Portfolio’s Board of Trustees approved the renewal of the Portfolio’s investment management agreement (the “Portfolio Agreement” ) with DWS Investment Management Americas, Inc. (“DIMA” ) and the sub-advisory agreement (the “Sub-Advisory Agreement” ) between DIMA and Northern Trust Investments, Inc. (“NTI” ), and the Fund’s Board of Trustees (which consists of the same members as the Board of Trustees of the Portfolio) approved the renewal of the Fund’s investment management agreement with DIMA (the “Fund Agreement” and together with the Portfolio Agreement and the Sub-Advisory Agreement, the “Agreements” ) in September 2023. The Portfolio’s Board of Trustees and the Fund’s Board of Trustees are collectively referred to as the “Board” or “Trustees.”
In terms of the process that the Board followed prior to approving the Agreements, shareholders should know that:
—
During the entire process, all of the Portfolio’s and the Fund’s Trustees were independent of DIMA and its affiliates (the “Independent Trustees” ).
—
The Board met frequently during the past year to discuss fund matters and dedicated a substantial amount of time to contract review matters. Over the course of several months, the Board reviewed extensive materials received from DIMA, independent third parties and independent counsel. These materials included an analysis of performance, fees and expenses, profitability, economies of scale, and fall-out benefits from a fee consultant retained by the Independent Trustees (the “Fee Consultant” ).
—
The Board also received extensive information throughout the year regarding performance of the Portfolio and the Fund.
—
The Independent Trustees regularly met privately with counsel to discuss contract review and other matters. In addition, the Independent Trustees were advised by the Fee Consultant as part of their review of the Portfolio’s and the Fund’s contractual arrangements and considered a comprehensive report prepared by the Fee Consultant in connection with their deliberations.
—
In connection with reviewing the Agreements, the Board also reviewed the terms of the Fund’s Rule 12b-1 plan, distribution agreement,
administrative services agreement, transfer agency agreement and other material service agreements.
In connection with the contract review process, the Board considered the factors discussed below, among others. The Board also considered that DIMA and its predecessors have managed the Portfolio and the Fund since their inception, and the Board believes that a long-term relationship with a capable, conscientious advisor is in the best interests of the Portfolio and the Fund. The Board considered, generally, that shareholders chose to invest or remain invested in the Fund knowing that DIMA managed the Portfolio and the Fund. DIMA is part of DWS Group GmbH & Co. KGaA (“DWS Group” ). DWS Group is a global asset management business that offers a wide range of investing expertise and resources, including research capabilities in many countries throughout the world. DWS Group is majority-owned by Deutsche Bank AG, with approximately 20% of its shares publicly traded.
As part of the contract review process, the Board carefully considered the fees and expenses of each DWS fund overseen by the Board in light of the fund’s performance. In many cases, this led to the negotiation and implementation of expense caps.
While shareholders may focus primarily on fund performance and fees, the Board considers these and many other factors, including the quality and integrity of DIMA’s and NTI’s personnel and administrative support services provided by DIMA, such as back-office operations, fund valuations, and compliance policies and procedures.
Nature, Quality and Extent of Services. The Board considered the terms of the Agreements, including the scope of advisory services provided under the Agreements. The Board noted that, under the Agreements, DIMA and NTI provide portfolio management services to the Portfolio and the Fund and that, pursuant to separate administrative services agreements, DIMA provides administrative services to the Portfolio and the Fund. The Board considered the experience and skills of senior management and investment personnel and the resources made available to such personnel. The Board also considered the risks to DIMA in sponsoring or managing the Portfolio and the Fund, including financial, operational and reputational risks, the potential economic impact to DIMA from such risks and DIMA’s approach to addressing such risks. Throughout the course of the year, the Board also received information regarding DIMA’s oversight of fund sub-advisors, including NTI. The Board reviewed the Portfolio’s and the Fund’s performance over short-term and long-term periods and compared those returns to various agreed-upon performance measures, including market index(es) and a peer universe compiled using information supplied by Morningstar Direct (“Morningstar” ), an independent fund data service. The Board also noted that it has put into place a process of identifying “Funds in Review” (e.g., funds performing
poorly relative to a peer universe), and receives additional reporting from DIMA regarding such funds and, where appropriate, DIMA’s plans to address underperformance. The Board believes this process is an effective manner of identifying and addressing underperforming funds. Based on the information provided, the Board noted that, for the one-, three- and five-year periods ended December 31, 2022, the Fund’s performance (Class A shares) was in the 3rd quartile, 2nd quartile and 2nd quartile, respectively, of the applicable Morningstar universe (the 1st quartile being the best performers and the 4th quartile being the worst performers).
Fees and Expenses. The Board considered the Portfolio’s and the Fund’s investment management fee schedules, the Portfolio’s sub-advisory fee schedule, the Fund’s operating expenses and total expense ratios, and comparative information provided by Broadridge Financial Solutions, Inc. (“Broadridge” ) and the Fee Consultant regarding investment management fee rates paid to other investment advisors by similar funds (1st quartile being the most favorable and 4th quartile being the least favorable). With respect to management fees paid to other investment advisors by similar funds, the Board noted that the contractual fee rates paid by the Portfolio and the Fund, which include 0.03% and 0.097% fees paid to DIMA under the respective administrative services agreements, were higher than the median (4th quartile) of the applicable Broadridge peer group (based on Broadridge data provided as of December 31, 2022). The Board noted that, although shareholders of the Fund indirectly bear the Portfolio’s management fee, the Fund does not charge an additional investment management fee. With respect to the sub-advisory fee paid to NTI, the Board noted that the fee is paid by DIMA out of its fee and not directly by the Portfolio. The Board noted that the Fund’s Class A shares total (net) operating expenses (excluding 12b-1 fees), which include Portfolio expenses allocated to the Fund, were expected to be higher than the median (3rd quartile) of the applicable Broadridge expense universe (based on Broadridge data provided as of December 31, 2022, and analyzing Broadridge expense universe Class A (net) expenses less any applicable 12b-1 fees) (“Broadridge Universe Expenses” ). The Board also reviewed data comparing each other operational share class’s total (net) operating expenses to the applicable Broadridge Universe Expenses. The Board noted that the expense limitations agreed to by DIMA were expected to help the Fund’s total (net) operating expenses remain competitive. The Board considered the management fee rate as compared to fees charged by DIMA to comparable DWS U.S. registered funds (“DWS Funds” ) and considered differences between the Portfolio and the Fund and the comparable DWS Funds. The information requested by the Board as part of its review of fees and expenses also included information about institutional accounts (including any sub-advised funds and accounts) and funds offered primarily to European investors (“DWS Europe Funds” ) managed by DWS Group. The Board noted that DIMA
indicated that DWS Group does not manage any institutional accounts or DWS Europe Funds comparable to the Portfolio and the Fund.
On the basis of the information provided, the Board concluded that management fees were reasonable and appropriate in light of the nature, quality and extent of services provided by DIMA and NTI.
Profitability. The Board reviewed detailed information regarding revenues received by DIMA under the Agreements. The Board considered the estimated costs to DIMA, and pre-tax profits realized by DIMA, from advising the DWS Funds, as well as estimates of the pre-tax profits attributable to managing the Fund in particular. The Board also received information regarding the estimated enterprise-wide profitability of DIMA and its affiliates with respect to all fund services in totality and by fund. The Board and the Fee Consultant reviewed DIMA’s methodology in allocating its costs to the management of the Fund. Based on the information provided, the Board concluded that the pre-tax profits realized by DIMA in connection with the management of the Fund were not unreasonable. The Board also reviewed certain publicly available information regarding the profitability of certain similar investment management firms. The Board noted that, while information regarding the profitability of such firms is limited (and in some cases is not necessarily prepared on a comparable basis), DIMA and its affiliates’ overall profitability with respect to the DWS Funds (after taking into account distribution and other services provided to the funds by DIMA and its affiliates) was lower than the overall profitability levels of most comparable firms for which such data was available. The Board did not consider the profitability of NTI with respect to the Portfolio. The Board noted that DIMA pays NTI’s fee out of its management fee, and its understanding that the Portfolio’s sub-advisory fee schedule was the product of an arm’s length negotiation with DIMA.
Economies of Scale. The Board considered whether there are economies of scale with respect to the management of the Portfolio and the Fund and whether the Portfolio and the Fund benefit from any economies of scale. In this regard, the Board observed that while the Portfolio’s and the Fund’s current investment management fee schedule does not include breakpoints, the Portfolio’s and the Fund’s fee schedule represents an appropriate sharing between the Portfolio and the Fund and DIMA of such economies of scale as may exist in the management of the Portfolio and the Fund at current asset levels.
Other Benefits to DIMA and NTI and Their Affiliates. The Board also considered the character and amount of other incidental or “fall-out” benefits received by DIMA and NTI and their affiliates, including any fees received by DIMA for administrative services provided to the Portfolio and to the Fund, any fees received by an affiliate of DIMA for transfer agency
services provided to the Fund and any fees received by an affiliate of DIMA for distribution services. The Board also considered benefits to DIMA related to brokerage and soft-dollar allocations, including allocating brokerage to pay for research generated by parties other than the executing broker dealers, which pertain primarily to funds investing in equity securities. In addition, the Board considered the incidental public relations benefits to DIMA related to DWS Funds advertising and cross-selling opportunities among DIMA products and services. The Board considered these benefits in reaching its conclusion that the Portfolio’s and the Fund’s management fees were reasonable.
Compliance. The Board considered the significant attention and resources dedicated by DIMA to its compliance processes in recent years. The Board noted in particular (i) the experience, seniority and time commitment of the individuals serving as DIMA’s and the Fund’s chief compliance officers; (ii) the substantial commitment of resources by DIMA and its affiliates to compliance matters, including the retention of compliance personnel; and (iii) ongoing efforts to enhance the compliance program. The Board also considered the attention and resources dedicated by DIMA to the oversight of the investment sub-advisor’s compliance program and compliance with the applicable fund policies and procedures.
Based on all of the information considered and the conclusions reached, the Board determined that the continuation of the Agreements is in the best interests of the Portfolio and the Fund. In making this determination, the Board did not give particular weight to any single factor identified above. The Board considered these factors over the course of numerous meetings, certain of which were in executive session with only the Independent Trustees and counsel present. It is possible that individual Independent Trustees may have weighed these factors differently in reaching their individual decisions to approve the continuation of the Agreements.
Board Members and Officers
The following table presents certain information regarding the Board Members and Officers of the Trust/Corporation. Each Board Member’s year of birth is set forth in parentheses after his or her name. Unless otherwise noted, (i) each Board Member has engaged in the principal occupation(s) noted in the table for at least the most recent five years, although not necessarily in the same capacity; and (ii) the address of each Independent Board Member is c/o Keith R. Fox, DWS Funds Board Chair, c/o Thomas R. Hiller, Ropes & Gray LLP, Prudential Tower, 800 Boylston
Street, Boston, MA 02199-3600. Except as otherwise noted below, the term of office for each Board Member is until the election and qualification of a successor, or until such Board Member sooner dies, resigns, is removed or as otherwise provided in the governing documents of the Trust/Corporation. Because the Fund does not hold an annual meeting of shareholders, each Board Member will hold office for an indeterminate period.
The Board Members may also serve in similar capacities with other funds in the fund complex. The number of funds in the DWS fund complex shown in the table below includes all registered open- and closed-end funds (including all of their portfolios) advised by the Advisor and any registered funds that have an investment advisor that is an affiliated person of the Advisor.
Independent Board Members/Independent Advisory Board Members
Name, Year of
Birth, Position
with the Trust/
Corporation
and Length of
| Business Experience and Directorships
During the Past Five Years | Number of
Funds in
DWS Fund
Complex
Overseen | Other
Directorships
Held by Board
Member |
Keith R. Fox, CFA (1954) Chairperson since 2017, and Board Member since 1996 | Managing General Partner, Exeter Capital Partners (a series of private investment funds) (since 1986); Former Chairman, National Association of Small Business Investment Companies; Former Directorships: ICI Mutual Insurance Company; BoxTop Media Inc. (advertising); Sun Capital Advisers Trust (mutual funds); Progressive International Corporation (kitchen goods designer and distributor) | | |
Name, Year of Birth, Position with the Trust/ Corporation and Length of Time Served1 | Business Experience and Directorships During the Past Five Years | Number of Funds in DWS Fund Complex Overseen | Other Directorships Held by Board Member |
John W. Ballantine (1946) Board Member since 1999 | Retired; formerly: Executive Vice President and Chief Risk Management Officer, First Chicago NBD Corporation/The First National Bank of Chicago (1996–1998); Executive Vice President and Head of International Banking (1995–1996); Not-for-Profit Directorships: Window to the World Communications (public media); Life Director of Harris Theater for Music and Dance (Chicago); Life Director of Hubbard Street Dance Chicago; Former Directorships: Director and Chairman of the Board, Healthways Inc.2(population well-being and wellness services) (2003–2014); Stockwell Capital Investments PLC (private equity); Enron Corporation; FNB Corporation; Tokheim Corporation; First Oak Brook Bancshares, Inc.; Oak Brook Bank; Portland General Electric2 (utility company) (2003–2021); and Prisma Energy International; Former Not-for-Profit Directorships: Public Radio International; Palm Beach Civic Assn. | | |
Mary Schmid Daugherty, NACD.DC, PHD, CFA (1958) Board Member or Advisory Board Member | Senior Fellow in Applied Finance, Department of Finance, Opus College of Business at the University of St. Thomas (1987–present); Directorships: The Meritex Company (2017–present); Driessen Water, Inc. (2016–present); and The Hardenbergh Foundation (2021–present); Former Directorships: Mairs & Power Funds Trust (mutual funds) (2010–2022); and Crescent Electric Supply Company (2010–2019) | | |
Dawn-Marie Driscoll (1946) Board Member since 1987 | Emeritus Advisory Board and former Executive Fellow, Hoffman Center for Business Ethics, Bentley University; formerly: Partner, Palmer & Dodge (law firm) (1988–1990); Vice President of Corporate Affairs and General Counsel, Filene’s (retail) (1978–1988); Directorships: Trustee and former Chairman of the Board, Southwest Florida Community Foundation (charitable organization); Former Directorships: ICI Mutual Insurance Company (2007–2015); Sun Capital Advisers Trust (mutual funds) (2007–2012); Investment Company Institute (audit, executive, nominating committees) and Independent Directors Council (governance, executive committees) | | |
Name, Year of Birth, Position with the Trust/ Corporation and Length of Time Served1 | Business Experience and Directorships During the Past Five Years | Number of Funds in DWS Fund Complex Overseen | Other Directorships Held by Board Member |
Richard J. Herring (1946) Board Member since 1990 | Jacob Safra Professor of International Banking and Professor of Finance, The Wharton School, University of Pennsylvania (1972–present); formerly: Director, The Wharton Financial Institutions Center (1994–2020); Vice Dean and Director, Wharton Undergraduate Division (1995–2000) and Director, The Lauder Institute of International Management Studies (2000–2006); Member FDIC Systemic Risk Advisory Committee (2011–present), member Systemic Risk Council (2012–present) and member of the Advisory Board of the Yale Program on Financial Stability (2013–present); Former Directorships: Co-Chair of the Shadow Financial Regulatory Committee (2003–2015), Executive Director of The Financial Economists Roundtable (2008–2015), Director of The Thai Capital Fund (2007–2013), Director of The Aberdeen Singapore Fund (2007–2018), Director, The Aberdeen Japan Fund (2007–2021) and Nonexecutive Director of Barclays Bank DE (2010–2018) | | |
Chad D. Perry (1972) Board Member or Advisory Board Member | Executive Vice President and General Counsel, RLJ Lodging Trust2 (since 2023); formerly Executive Vice President, General Counsel and Secretary, Tanger Factory Outlet Centers, Inc.2 (2011–2023); Executive Vice President and Deputy General Counsel, LPL Financial Holdings Inc.2 (2006–2011); Senior Corporate Counsel, EMC Corporation (2005–2006); Associate, Ropes & Gray LLP (1997–2005) | | Director, Great Elm Capital Corp. (business development company) (since 2022) |
Rebecca W. Rimel (1951) Board Member since 1995 | Directorships: Washington College (since July 2023); Formerly: Executive Vice President, The Glenmede Trust Company (investment trust and wealth management) (1983–2004); Board Member, Investor Education (charitable organization) (2004–2005); Former Directorships: Trustee, Executive Committee, Philadelphia Chamber of Commerce (2001–2007); Director, Viasys Health Care2 (January 2007–June 2007); Trustee, Thomas Jefferson Foundation (charitable organization) (1994–2012); President, Chief Executive Officer and Director (1994–2020) and Senior Advisor (2020–2021), The Pew Charitable Trusts (charitable organization); Director, BioTelemetry Inc.2 (acquired by Royal Philips in 2021) (healthcare) (2009–2021); Director, Becton Dickinson and Company2 (medical technology company) (2012–2022) | | Director, The Bridgespan Group (nonprofit organization) (since October 2020) |
Name, Year of Birth, Position with the Trust/ Corporation and Length of Time Served1 | Business Experience and Directorships During the Past Five Years | Number of Funds in DWS Fund Complex Overseen | Other Directorships Held by Board Member |
Catherine Schrand (1964) Board Member since 2021 | Celia Z. Moh Professor of Accounting (2016–present) and Professor of Accounting (1994–present); Directorships: Advisory Board Member, the Jacobs Levy Center, The Wharton School, University of Pennsylvania (since 2023); Former positions: Vice Dean, Wharton Doctoral Programs, The Wharton School, University of Pennsylvania (2016–2019) | | |
William N. Searcy, Jr. (1946) Board Member since 1993 | Private investor since October 2003; formerly: Pension & Savings Trust Officer, Sprint Corporation2 (telecommunications) (November 1989–September 2003); Former Directorships: Trustee, Sun Capital Advisers Trust (mutual funds) (1998–2012) | | |
Officers5
Name, Year of Birth, Position
with the Trust/Corporation
and Length of Time Served6 | Business Experience and Directorships During the
Past Five Years |
Hepsen Uzcan7 (1974) President and Chief Executive Officer, 2017–present | Head of Americas CEO Office, DWS (2023–present), Head of Fund Administration, Head of Product Americas and Head of U.S. Mutual Funds, DWS (2017–present); Vice President, DWS Service Company (2018–present); President, DB Investment Managers, Inc. (2018–present); President and Chief Executive Officer, The European Equity Fund, Inc., The New Germany Fund, Inc. and The Central and Eastern Europe Fund, Inc. (2017–present); Vice President, DWS Investment Management Americas, Inc. (2023–present); formerly: Vice President for the Deutsche funds (2016–2017); Assistant Secretary for the DWS funds (2013–2019); Secretary, DWS USA Corporation (2018–2023); Assistant Secretary, DWS Investment Management Americas, Inc. (2018–2023); Assistant Secretary, DWS Trust Company (2018–2023); Assistant Secretary, The European Equity Fund, Inc., The New Germany Fund, Inc. and The Central and Eastern Europe Fund, Inc. (2013–2020); Assistant Secretary, DWS Distributors, Inc. (2018–2023); Directorships: Director of DWS Service Company (2018–present); Director of DB Investment Managers, Inc. (2018–present); Director of Episcopalian Charities of New York (2018–present); Interested Director of The European Equity Fund, Inc., The New Germany Fund, Inc. and The Central and Eastern Europe Fund, Inc. (2020–present); Director of ICI Mutual Insurance Company (2020–present); Director of DWS USA Corporation (2023–present); Director of DWS Investment Management Americas, Inc. (2023–present); and Manager of DBX Advisors LLC. (2023–present) |
Name, Year of Birth, Position with the Trust/Corporation and Length of Time Served6 | Business Experience and Directorships During the Past Five Years |
John Millette8 (1962) Vice President and Secretary, 1999–present | Legal (Associate General Counsel), DWS; Chief Legal Officer, DWS Investment Management Americas, Inc. (2015–present); Director and Vice President, DWS Trust Company (2016–present); Secretary, DBX ETF Trust (2020–present); Vice President, DBX Advisors LLC (2021–present); Secretary, The European Equity Fund, Inc., The New Germany Fund, Inc. and The Central and Eastern Europe Fund, Inc. (2011–present); formerly: Secretary, Deutsche Investment Management Americas Inc. (2015–2017); and Assistant Secretary, DBX ETF Trust (2019–2020) |
Ciara Crawford9 (1984) Assistant Secretary, 2019–present | Fund Administration (Specialist), DWS (2015–present); Assistant Secretary, DWS Service Company (2018–present); Assistant Secretary of U.S. Mutual Funds, DWS (2019–present); Assistant Secretary, DWS USA Corporation (2023–present); Assistant Secretary, DBX Advisors, LLC (2023–present); Assistant Secretary, DWS Investment Management Americas, Inc. (2023–present); Assistant Clerk, DWS Trust Company (2023–present); formerly, Legal Assistant at Accelerated Tax Solutions |
Diane Kenneally8 (1966) Chief Financial Officer and Treasurer, 2018–present | Fund Administration Treasurer’s Office (Co-Head since 2018), DWS; Treasurer, Chief Financial Officer and Controller, DBX ETF Trust (2019–present); Treasurer and Chief Financial Officer, The European Equity Fund, Inc., The New Germany Fund, Inc. and The Central and Eastern Europe Fund, Inc. (2018–present); formerly: Assistant Treasurer for the DWS funds (2007–2018) |
Yvonne Wong8 (1960) Assistant Treasurer, since December 1, 2023 | Fund Administration (Senior Analyst), DWS; Assistant Treasurer, DBX ETF Trust (since November 14, 2023) |
Sheila Cadogan8 (1966) Assistant Treasurer, 2017–present | Fund Administration Treasurer’s Office (Co-Head since 2018), DWS; Director and Vice President, DWS Trust Company (2018–present); Assistant Treasurer, DBX ETF Trust (2019–present); Assistant Treasurer, The European Equity Fund, Inc., The New Germany Fund, Inc. and The Central and Eastern Europe Fund, Inc. (2018–present) |
Scott D. Hogan8 (1970) Chief Compliance Officer, 2016–present | Anti-Financial Crime & Compliance US (Senior Team Lead), DWS; Chief Compliance Officer, The European Equity Fund, Inc., The New Germany Fund, Inc. and The Central and Eastern Europe Fund, Inc. (2016–present) |
Caroline Pearson8 (1962) Chief Legal Officer, 2010–present | Legal (Senior Team Lead), DWS; Assistant Secretary, DBX ETF Trust (2020–present); Chief Legal Officer, DBX Advisors LLC (2020–present); Chief Legal Officer, The European Equity Fund, Inc., The New Germany Fund, Inc. and The Central and Eastern Europe Fund, Inc. (2012–present); formerly: Secretary, Deutsche AM Distributors, Inc. (2002–2017); Secretary, Deutsche AM Service Company (2010–2017); and Chief Legal Officer, DBX Strategic Advisors LLC (2020–2021) |
Name, Year of Birth, Position with the Trust/Corporation and Length of Time Served6 | Business Experience and Directorships During the Past Five Years |
Christian Rijs7 (1980) Anti-Money Laundering
Compliance Officer, 2021–present | Senior Team Lead Anti-Financial Crime and Compliance, DWS; AML Officer, DWS Trust Company (2021–present); AML Officer, DBX ETF Trust (2021–present); AML Officer, The European Equity Fund, Inc., The New Germany Fund, Inc. and The Central and Eastern Europe Fund, Inc. (2021–present); formerly: DWS UK & Ireland Head of Anti-Financial Crime and MLRO |
| The length of time served represents the year in which the Board Member joined the board of one or more DWS funds currently overseen by the Board. |
| A publicly held company with securities registered pursuant to Section 12 of the Securities Exchange Act of 1934. |
| Mr. Perry and Ms. Daugherty are each an Advisory Board Member of Deutsche DWS Asset Allocation Trust, Deutsche DWS Equity 500 Index Portfolio, Deutsche DWS Global/International Fund, Inc., Deutsche DWS Income Trust, Deutsche DWS Institutional Funds, Deutsche DWS International Fund, Inc., Deutsche DWS Investment Trust, Deutsche DWS Investments VIT Funds, Deutsche DWS Money Market Trust, Deutsche DWS Municipal Trust, Deutsche DWS Portfolio Trust, Deutsche DWS Securities Trust, Deutsche DWS Tax Free Trust, Deutsche DWS Variable Series I and Government Cash Management Portfolio. Mr. Perry and Ms. Daugherty are each a Board Member of each other Trust. |
| Mr. Perry and Ms. Daugherty each oversees 21 funds in the DWS Fund Complex as a Board Member of various Trusts. Mr. Perry and Ms. Daugherty are each an Advisory Board Member of various Trusts/Corporations comprised of 47 funds in the DWS Fund Complex. |
| As a result of their respective positions held with the Advisor or its affiliates, these individuals are considered “interested persons” of the Advisor within the meaning of the 1940 Act. Interested persons receive no compensation from the Fund. |
| The length of time served represents the year in which the officer was first elected in such capacity for one or more DWS funds. |
| Address: 875 Third Avenue, New York, New York 10022. |
| Address: 100 Summer Street, Boston, MA 02110. |
| Address: 5201 Gate Parkway, Jacksonville, FL 32256. |
Certain officers hold similar positions for other investment companies for which DIMA or an affiliate serves as the Advisor.
The Fund’s Statement of Additional Information (“SAI” ) includes additional information about the Board Members. The SAI is available, without charge, upon request. If you would like to request a copy of the SAI, you may do so by calling the following toll-free number: (800) 728-3337.
Account Management Resources
| The automated telephone system allows you to access personalized account information and obtain information on other DWS funds using either your voice or your telephone keypad. Certain account types within Class A, C and S also have the ability to purchase, exchange or redeem shares using this system. |
For more information, contact your financial representative. You may also access our automated telephone system or speak with a Shareholder Service representative by calling: (800) 728-3337 |
| dws.com View your account transactions and balances, trade shares, monitor your asset allocation, subscribe to fund and account updates by e-mail, and change your address, 24 hours a day. |
Obtain prospectuses and applications, news about DWS funds, insight from DWS economists and investment specialists and access to DWS fund account information. |
| DWS PO Box 219151 Kansas City, MO 64121-9151 |
| The Fund’s policies and procedures for voting proxies for portfolio securities and information about how the Fund voted proxies related to its portfolio securities during the most recent 12-month period ended June 30 are available on our Web site — dws.com/en-us/resources/proxy-voting — or on the SEC’s Web site — sec.gov. To obtain a written copy of the Fund’s policies and procedures without charge, upon request, call us toll free at (800) 728-3337. |
| Following the Fund’s fiscal first and third quarter-end, a complete portfolio holdings listing is posted on dws.com and is available free of charge by contacting your financial intermediary or, if you are a direct investor, by calling (800) 728-3337. In addition, the portfolio holdings listing is filed with the SEC on the Fund’s Form N-PORT and will be available on the SEC’s Web site at sec.gov. Additional portfolio holdings for the Fund are also posted on dws.com from time to time. Please see the Fund’s current prospectus for more information. |
| If you have questions, comments or complaints, contact: DWS Distributors, Inc. 222 South Riverside Plaza Chicago, IL 60606-5808 (800) 621-1148 |
| DWS Investment Management Americas, Inc. (“DIMA” or the “Advisor” ), which is part of the DWS Group GmbH & Co. KGaA (“DWS Group” ), is the investment advisor for the Fund. DIMA and its predecessors have more than 90 years of experience managing mutual funds and DIMA provides a full range of investment advisory services to both institutional and retail clients. DIMA is an indirect, wholly owned subsidiary of DWS Group. |
| DWS Group is a global organization that offers a wide range of investing expertise and resources, including hundreds of portfolio managers and analysts and an office network that reaches the world’s major investment centers. This well-resourced global investment platform brings together a wide variety of experience and investment insight across industries, regions, asset classes and investing styles. |
For shareholders of Class R6 |
Automated Information Line | DWS/Ascensus Plan Access (800) 728-3337 |
24-hour access to your retirement plan account. |
| |
Obtain prospectuses and applications, news about DWS funds,
insight from DWS economists and investment specialists and access
to DWS fund account information. |
Log in/register to manage retirement account assets at
https://www.mykplan.com/participantsecure_net/login.aspx. |
| |
To speak with a service representative. |
| DWS Service Company 222 South Riverside Plaza Chicago, IL 60606-5806 |
222 South Riverside Plaza
Chicago, IL 60606-5808
DSPF500IF-2(R-025784-13 2/24)
| | |
| | (b) Not applicable |
| | |
| ITEM 2. | CODE OF ETHICS |
| | |
| | As of the end of the period covered by this report, the registrant has adopted a code of ethics, as defined in Item 2 of Form N-CSR that applies to its Principal Executive Officer and Principal Financial Officer. There have been no amendments to, or waivers from, a provision of the code of ethics during the period covered by this report that would require disclosure under Item 2. A copy of the code of ethics is filed as an exhibit to this Form N-CSR. |
| | |
| ITEM 3. | AUDIT COMMITTEE FINANCIAL EXPERT |
| | |
| | The fund’s audit committee is comprised solely of trustees who are "independent" (as such term has been defined by the Securities and Exchange Commission ("SEC") in regulations implementing Section 407 of the Sarbanes-Oxley Act (the "Regulations")). The fund’s Board of Trustees has determined that there are several "audit committee financial experts" (as such term has been defined by the Regulations) serving on the fund’s audit committee including Ms. Catherine Schrand, the chair of the fund’s audit committee. An “audit committee financial expert” is not an “expert” for any purpose, including for purposes of Section 11 of the Securities Act of 1933 and the designation or identification of a person as an “audit committee financial expert” does not impose on such person any duties, obligations or liability that are greater than the duties, obligations and liability imposed on such person as a member of the audit committee and board of directors in the absence of such designation or identification. |
| | |
| ITEM 4. | PRINCIPAL ACCOUNTANT FEES AND SERVICES |
| | |
DWS S&P 500 Index Fund
form n-csr disclosure re: AUDIT FEES
The following table shows the amount of fees that Ernst & Young LLP (“EY”), the Fund’s Independent Registered Public Accounting Firm, billed to the Fund during the Fund’s last two fiscal years. The Audit Committee approved in advance all audit services and non-audit services that EY provided to the Fund.
Services that the Fund’s Independent Registered Public Accounting Firm Billed to the Fund
Fiscal Year
Ended
December 31, | Audit Fees Billed to Fund | Audit-Related
Fees Billed to Fund | Tax Fees Billed to Fund | All
Other Fees Billed to Fund |
| 2023 | $31,531 | $0 | $8,948 | $0 |
| 2022 | $31,531 | $0 | $10,366 | $0 |
The above “Tax Fees” were billed for professional services rendered for tax preparation.
Services that the Fund’s Independent Registered Public Accounting Firm Billed to the Adviser and Affiliated Fund Service Providers
The following table shows the amount of fees billed by EY to DWS Investment Management Americas, Inc. (“DIMA” or the “Adviser”), and any entity controlling, controlled by or under common control with DIMA (“Control Affiliate”) that provides ongoing services to the Fund (“Affiliated Fund Service Provider”), for engagements directly related to the Fund’s operations and financial reporting, during the Fund’s last two fiscal years.
Fiscal Year
Ended
December 31, | Audit-Related
Fees Billed to Adviser and Affiliated Fund Service Providers | Tax Fees Billed to Adviser and Affiliated Fund Service Providers | All
Other Fees Billed to Adviser and Affiliated Fund Service Providers |
| 2023 | $0 | $424,143 | $0 |
| 2022 | $0 | $148,212 | $0 |
The above “Tax Fees” were billed in connection with tax compliance services and agreed upon procedures.
Non-Audit Services
The following table shows the amount of fees that EY billed during the Fund’s last two fiscal years for non-audit services. The Audit Committee pre-approved all non-audit services that EY provided to the Adviser and any Affiliated Fund Service Provider that related directly to the Fund’s operations and financial reporting. The Audit Committee requested and received information from EY about any non-audit services that EY rendered during the Fund’s last fiscal year to the Adviser and any Affiliated Fund Service Provider. The Committee considered this information in evaluating EY’s independence.
Fiscal Year
Ended
December 31 | Total
Non-Audit Fees Billed to Fund
(A) | Total Non-Audit Fees billed to Adviser and Affiliated Fund Service Providers (engagements related directly to the operations and financial reporting of the Fund)
(B) | Total Non-Audit Fees billed to Adviser and Affiliated Fund Service Providers (all other engagements)
(C) | Total of
(A), (B) and (C) |
| 2023 | $8,948 | $424,143 | $0 | $433,091 |
| 2022 | $10,366 | $148,212 | $0 | $158,578 |
All other engagement fees were billed for services in connection with agreed upon procedures and tax compliance for DIMA and other related entities.
Audit Committee Pre-Approval Policies and Procedures. Generally, each Fund’s Audit Committee must pre approve (i) all services to be performed for a Fund by a Fund’s Independent Registered Public Accounting Firm and (ii) all non-audit services to be performed by a Fund’s Independent Registered Public Accounting Firm for the DIMA Entities with respect to operations and financial reporting of the Fund, except that the Chairperson or Vice Chairperson of each Fund’s Audit Committee may grant the pre-approval for non-audit services described in items (i) and (ii) above for non-prohibited services for engagements of less than $100,000. All such delegated pre approvals shall be presented to each Fund’s Audit Committee no later than the next Audit Committee meeting.
There were no amounts that were approved by the Audit Committee pursuant to the de minimis exception under Rule 2-01 of Regulation S-X.
According to the registrant’s principal Independent Registered Public Accounting Firm, substantially all of the principal Independent Registered Public Accounting Firm's hours spent on auditing the registrant's financial statements were attributed to work performed by full-time permanent employees of the principal Independent Registered Public Accounting Firm and (i) and (j) are not applicable.
***
In connection with the audit of the 2022 and 2023 financial statements, the Fund entered into an engagement letter with EY. The terms of the engagement letter required by EY, and agreed to by the Audit Committee, include a provision mandating the use of mediation and arbitration to resolve any controversy or claim between the parties arising out of or relating to the engagement letter or services provided thereunder.
***
Pursuant to PCAOB Rule 3526, EY is required to describe in writing to the Fund’s Audit Committee, on at least an annual basis, all relationships between EY, or any of its affiliates, and the DWS Funds, including the Fund, or persons in financial reporting oversight roles at the DWS Funds that, as of the date of the communication, may reasonably be thought to bear on EY’s independence. Pursuant to PCAOB Rule 3526, EY has reported the matters set forth below that may reasonably be thought to bear on EY’s independence. With respect to each reported matter in the aggregate, EY advised the Audit Committee that, after careful consideration of the facts and circumstances and the applicable independence rules, it concluded that the matters do not and will not impair EY’s ability to exercise objective and impartial judgement in connection with the audits of the financial statements for the Fund and a reasonable investor with knowledge of all relevant facts and circumstances would conclude that EY has been and is capable of exercising objective and impartial judgment on all issues encompassed within EY’s audit engagements. EY also confirmed to the Audit Committee that it can continue to act as the Independent Registered Public Accounting Firm for the Fund.
| · | EY advised the Fund’s Audit Committee that various covered persons within EY and EY’s affiliates held investments in, or had other financial relationships with, entities within the DWS Funds “investment company complex” (as defined in Regulation S-X) (the “DWS Funds Complex”). EY informed the Audit Committee that these investments and financial relationships were inconsistent with Rule 2-01(c)(1) of Regulation S-X. EY reported that all breaches have been resolved and that none of the breaches involved any professionals who were part of the audit engagement team for the Fund or in the position to influence the audit engagement team for the Fund. |
| | |
| ITEM 5. | AUDIT COMMITTEE OF LISTED REGISTRANTS |
| | |
| | Not applicable |
| | |
| ITEM 6. | INVESTMENTS |
| | |
| | Not applicable |
| | |
| ITEM 7. | DISCLOSURE OF PROXY VOTING POLICIES AND PROCEDURES FOR CLOSED-END MANAGEMENT INVESTMENT COMPANIES |
| | |
| | Not applicable |
| | |
| ITEM 8. | PORTFOLIO MANAGERS OF CLOSED-END MANAGEMENT INVESTMENT COMPANIES |
| | |
| | Not applicable |
| | |
| ITEM 9. | PURCHASES OF EQUITY SECURITIES BY CLOSED-END MANAGEMENT INVESTMENT COMPANY AND AFFILIATED PURCHASERS |
| | |
| | Not applicable |
| | |
| ITEM 10. | SUBMISSION OF MATTERS TO A VOTE OF SECURITY HOLDERS |
| | |
| | There were no material changes to the procedures by which shareholders may recommend nominees to the Fund’s Board. The primary function of the Nominating and Governance Committee is to identify and recommend individuals for membership on the Board and oversee the administration of the Board Governance Guidelines. Shareholders may recommend candidates for Board positions by forwarding their correspondence by U.S. mail or courier service to Keith R. Fox, DWS Funds Board Chair, c/o Thomas R. Hiller, Ropes & Gray LLP, Prudential Tower, 800 Boylston Street, Boston, MA 02199-3600. |
| | |
| ITEM 11. | CONTROLS AND PROCEDURES |
| | |
| | (a) | The Chief Executive and Financial Officers concluded that the Registrant’s Disclosure Controls and Procedures are effective based on the evaluation of the Disclosure Controls and Procedures as of a date within 90 days of the filing date of this report. |
| | |
| | (b) | There have been no changes in the registrant’s internal control over financial reporting that occurred during the period covered by this report that has materially affected, or is reasonably likely to materially affect, the registrant’s internal controls over financial reporting. |
| | |
| ITEM 12. | Disclosure of Securities Lending Activities for Closed-End Management Investment Companies |
| | |
| | Not applicable |
| | |
| ITEM 13. | EXHIBITS |
| | |
| | (a)(1) | Code of Ethics pursuant to Item 2 of Form N-CSR is filed and attached hereto as EX-99.CODE ETH. |
| | |
| | (a)(2) | Certification pursuant to Rule 30a-2(a) under the Investment Company Act of 1940 (17 CFR 270.30a-2(a)) is filed and attached hereto as Exhibit 99.CERT. |
| | |
| | (b) | Certification pursuant to Rule 30a-2(b) under the Investment Company Act of 1940 (17 CFR 270.30a-2(b)) is furnished and attached hereto as Exhibit 99.906CERT. |
SIGNATURES
Pursuant to the requirements of the Securities Exchange Act of 1934 and the Investment Company Act of 1940, the registrant has duly caused this report to be signed on its behalf by the undersigned, thereunto duly authorized.
| Registrant: | DWS S&P 500 Index Fund, a series of Deutsche DWS Institutional Funds |
| | |
| | |
| By: | /s/Hepsen Uzcan Hepsen Uzcan President |
| | |
| Date: | 2/29/2024 |
Pursuant to the requirements of the Securities Exchange Act of 1934 and the Investment Company Act of 1940, this report has been signed below by the following persons on behalf of the registrant and in the capacities and on the dates indicated.
| By: | /s/Hepsen Uzcan Hepsen Uzcan President |
| | |
| Date: | 2/29/2024 |
| | |
| | |
| | |
| By: | /s/Diane Kenneally Diane Kenneally Chief Financial Officer and Treasurer |
| | |
| Date: | 2/29/2024 |