FORM 18-K
For Foreign Governments and Political Subdivisions Thereof
SECURITIES AND EXCHANGE COMMISSION
Washington, D.C. 20549
ANNUAL REPORT
of
PROVINCE OF NEW BRUNSWICK
CANADA
(Name of Registrant)
Date of end of last fiscal year: March 31, 2004
SECURITIES REGISTERED *
(As of close of fiscal year)
Title of issue | Amounts as to which registration is effective | Names of exchanges on which registered |
N/A | N/A | N/A |
Names and addresses of persons authorized to receive notices
and communications from the Securities and Exchange Commission:
HON. PAMELA WALLIN
Canadian Consulate General
1251 Avenue of the Americas
New York, NY 10020
or
or
BRIAN SCHUMACHER DAVID MURCHISON
Canadian Consulate General
Canadian Consulate General
1251 Avenue of the Americas
1251 Avenue of the Americas
New York, NY 10020
New York, NY 10020
Copies to:
JOHN W. WHITE
JOHN DICAIRE
Cravath, Swaine & Moore
Assistant Deputy Minister
Worldwide Plaza
Treasury Division
825 Eighth Avenue
Province of New Brunswick
New York, NY 10019
P.O. Box 6000
Fredericton, NB, Canada E3B 5H1
* The Registrant is filing this annual report on a voluntary basis.
The information set forth below is to be furnished:
1.
In respect of each issue of securities of the registrant registered, a brief statement as to:
(a)
The general effect of any material modifications, not previously reported, on the rights of the holders of such securities.
None.
(b)
The title and the material provisions of any law, decree or administrative action, not previously reported, by reason of which the security is not being serviced in accordance with the terms thereof.
None.
(c)
The circumstances of any other failure, not previously reported, to pay principal, interest, or any sinking fund or amortization installment.
None.
2.
A statement as of the close of the last fiscal year of the registrant giving the total outstanding of:
(a)
Internal funded debt of the registrant. (Total to be stated in the currency of the registrant. If any internal funded debt is payable in a foreign currency, it should not be included under this paragraph (a), but under paragraph (b) of this item).
Reference is made to page 29 of Exhibit (d) hereto.
(b)
External funded debt of the registrant. (Totals to be stated in the respective currencies in which payable. No statement needs to be furnished as to intergovernmental debt.)
Reference is made to page 29 of Exhibit (d) hereto.
3.
A statement giving the title, date of issue, date of maturity, interest rate and amount outstanding, together with the currency or currencies in which payable, of each issue of funded debt of the registrant outstanding as of the close of the last fiscal year of the registrant.
Reference is made to pages 48 and 49 of Exhibit (d) hereto.
4.
(a)
As to each issue of securities of the registrant which is registered, there should be furnished a break-down of the total amount outstanding, as shown in Item 3, into the following:
(1)
Total amount held by or for the account of the registrant.
As at March 31, 2004, the total amount held by or for the account of the registrant was as follows:
Date of Maturity | Interest Rate (%) | Series | Amount Outstanding | Amount held in Sinking Fund | Date Issued |
| | | | | | |
29 June 2004 | 7 5/8 | EY | 200,000,000 | 18,892,000 | June 1994 |
20 June 2005 | 6 1/2 | FH | 150,000,000 | 56,030,000 | June 1995 |
23 Oct. 2007 | 3 1/2 | GA | 500,000,000 | -- | Oct. 2002 |
15 Feb. 2013 | 7 5/8 | EO | 200,000,000 | 12,400,000 | Feb. 1993 |
15 Aug. 2013 | 6 3/4 | ET | 200,000,000 | 56,998,000 | Sept. 1993 |
15 May 2020 | 9 3/4 | DU | 200,000,000 | 9,065,000 | May 1990 |
1 May 2022 | 8 3/4 | EI | 200,000,000 | -- | May 1992 |
2
(2)
Total estimated amount held by nationals of the registrant (or if registrant is other than a national government by the nationals of its national government); this estimate need be furnished only if it is practicable to do so.
Not practicable to furnish.
(3)
Total amount otherwise outstanding.
Date of Maturity |
Interest Rate (%) |
Series | Amount Otherwise Outstanding |
Date Issued |
| | | | | |
29 June 2004 | 7 5/8 | EY | 181,108,000 | June 1994 |
20 June 2005 | 6 ½ | FH | 93,970,000 | June 1995 |
23 Oct 2007 | 3 ½ | GA | 500,000,000 | Oct. 2002 |
15 Feb 2013 | 7 5/8 | EO | 187,600,000 | Feb. 1993 |
15 Aug 2013 | 6 ¾ | ET | 143,002,000 | Sept. 1993 |
15 May 2020 | 9 ¾ | DU | 190,935,000 | May 1990 |
1 May 2022 | 8 ¾ | EI | 200,000,000 | May 1992 |
(b)
If a substantial amount is set forth in answer to paragraph (a)(1) above, describe briefly the method employed by the registrant to reacquire such securities.
The Province of New Brunswick sinking fund is a general investment type fund. The Provincial Loans Act and in some cases the terms and conditions of the debenture issue specify the minimum rate at which sinking fund installments will be made. Purchases of bonds into the fund are generally discretionary. Many of the bonds purchased into the fund are New Brunswick or New Brunswick guaranteed bonds. The Province is also permitted to buy debt instruments issued or guaranteed by the Government of Canada or any Province of Canada and other debt instruments defined by the Provincial Loans Act.
5.
A statement as of the close of the last fiscal year of the registrant giving the estimated total of:
(a)
Internal floating indebtedness of the registrant. (Total to be stated in the currency of the registrant.)
Reference is made to pages 29, 48 and 49 of Exhibit (d) hereto.
(b)
External floating indebtedness of the registrant. (Total to be stated in the respective currencies in which payable.)
Reference is made to page 48 of Exhibit (d) hereto.
6.
Statements of the receipts, classified by source, and of the expenditures, classified by purpose, of the registrant for each fiscal year of the registrant ended since the close of the latest fiscal year for which such information was previously reported. These statements should be so itemized as to be reasonably informative and should cover both ordinary and extraordinary receipts and expenditures; there should be indicated separately, if practicable, the amount of receipts pledged or otherwise specifically allocated to any issue registered, indicating the issue.
Reference is made to pages 17 to 26 and 45 to 47 of Exhibit (d) hereto.
7.
(a)
If any foreign exchange control, not previously reported, has been established by the registrant (or if the registrant is other than a national government, by its national government), briefly describe such foreign exchange control.
None.
3
(b)
If any foreign exchange control previously reported has been discontinued or materially modified, briefly describe the effect of any such action, not previously reported.
Not applicable.
This annual report comprises:
(a)
Pages numbered 1 to 5 consecutively.
(b)
The following exhibits:
(d)
Current Province of New Brunswick Description.
(e)
Audited Financial Statements of the Province of New Brunswick for the fiscal year ended March 31, 2004, as published in the Public Accounts.
(f)
Consent of the Auditor General of the Province of New Brunswick.
(g)
Audited Financial Statements of New Brunswick Power Corporation for the fiscal year ended March 31, 2004, as published in its annual report.
(h)
Consent of Deloitte & Touche.
This annual report is filed subject to the Instructions for Form 18-K for Foreign Governments and Political Subdivisions Thereof.
4
SIGNATURE
Pursuant to the requirements of the Securities Exchange Act of 1934, the registrant has duly caused this annual report to be signed on its behalf by the undersigned, thereunto duly authorized, at Fredericton, Canada on the 23rd day of December, 2004.
Province of New Brunswick
By: /s/ John Dicaire
John Dicaire
Assistant Deputy Minister
Treasury Division
Department of Finance
5
EXHIBIT INDEX
(d)
Current Province of New Brunswick Description.
(e)
Audited Financial Statements of the Province of New Brunswick for the fiscal year ended March 31, 2004 as published in the Public Accounts.
(f)
Consent of the Auditor General of the Province of New Brunswick.
(g)
Audited Financial Statements of New Brunswick Power Corporation for the fiscal year ended March 31, 2004 as published in its annual report.
(h)
Consent of Deloitte & Touche.
6
Exhibit "d" Current Province of New Brunswick Description

December 2004
1
Exhibit "d" Current Province of New Brunswick Description
TABLE OF CONTENTS
Page
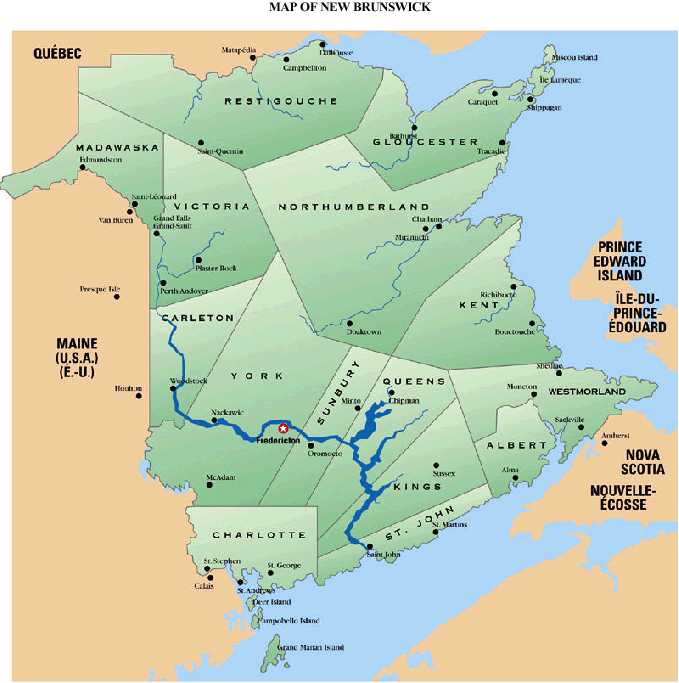
Map of the Province
3
Province of New Brunswick
4
General Information
5
The Economy
6
Revenue and Expenditure of the Province
17
Financing
27
Consolidation of New Brunswick Public Sector Debt
32
Public Sector Pension Liabilities
32
New Brunswick Power Corporation
34
Tables and Supplementary Information of the Province
45
Funded Debt Outstanding at March 31, 2004
48
Foreign Exchange
51
Sources of Information
51
All dollar amounts herein are in Canadian dollars unless otherwise specified. On December 6, 2004, the noon buying rate in the City of New York for cable transfers payable in Canadian dollars, as reported by The Federal Reserve Bank of New York, was $1.2012 per U.S. dollar.
Financial data for the Province of New Brunswick ("New Brunswick" or the "Province") have been rounded. Certain information presented in tabular form may not add to the total presented due to such rounding.
Certain historical financial data for the Province have been restated to reflect several accounting changes including the adoption by NB Power of a new accounting policy requiring immediate recognition of foreign exchange gains or losses (fiscal year ended March 31, 2002), and the change by NB Power in its method of accounting for asset retirement obligations and the removal of the Workplace Health Safety and Compensation Commission from the Reporting Entity (fiscal year ended March 31, 2003.)
Compound annual rates of growth are computed by using the "geometric average method", which is based on first and last year observations of the variables rather than all observations over the period concerned.
2
Exhibit "d" Current Province of New Brunswick Description
3
Exhibit "d" Current Province of New Brunswick Description
PROVINCE OF NEW BRUNSWICK
The following summary information is qualified in its entirety by the information contained herein.
| | | | | | | |
| | | | | | | | |
| | | Year ended December 31, (Canadian dollars in millions where applicable) | | Compound Annual Growth Rate % |
| | | |
| | | 1999 | 2000 | 2001 | 2002 | 2003 |
1999-2003 | Economy1 | | | | | | | |
Gross Domestic Product at market prices | | 19,041 | 20,085 | 20,689 | 21,168 | 22,452 | 4.2 |
Personal Income | | 16,635 | 17,434 | 17,856 | 18,251 | 18,802 | 3.1 |
Retail Trade | | 6,970 | 7,282 | 7,498 | 7,787 | 7,797 | 2.8 |
Manufacturing Shipments | | 9,155 | 10,944 | 12,083 | 12,531 | 12,864 | 8.9 |
Foreign Commodity Exports | | 6,086 | 7,403 | 8,271 | 8,161 | 8,513 | 8.8 |
Population at July 1 (in thousands) | | 751 | 751 | 750 | 750 | 751 | 0.0 |
Unemployment Rate | | 10.2% | 10.0% | 11.2% | 10.4% | 10.6% | --- |
Change in Consumer Price Index | | 1.6% | 3.3% | 1.7% | 3.4% | 3.4% | --- |
| | Year ended March 31, (Canadian dollars in millions) | Budget Estimates |
| |
| | | 2001 | 2002 | 2003 | 2004 | 2005 |
| | | | | | | |
Government Finance | | | | | | |
Ordinary Account (Surplus) Deficit |
| 54.0 | (32.4) | 57.7 | (2.4) | (98.3) |
Net Capital Expenditure |
| 141.9 | 183.0 | 207.3 | 233.1 | 324.7 |
(Surplus) Deficit on Special Purpose Account |
| (6.7) | (3.6) | (8.0) | (4.2) | (0.4) |
(Surplus) Deficit on Special Operating Agency |
| (6.0) | 2.6 | (8.6) | (4.5) | (3.7) |
Earnings from Sinking Fund |
| (220.0) | (230.9) | (243.0) | (222.5) | (228.0) |
Increase (Decrease) in Net Debt |
| (143.3) | (178.5) | 109.4 | 103.2 | (2.4) |
| |
| | | | | |
| |
| | | | | |
| | | Year ended March 31, (Canadian dollars in millions) |
| | |
| | | 2000 | 2001 | 2002 | 2003 | 2004 |
| | | | | | | |
Provincial Purpose Funded Debt and Capital Loans 2 | | | | | | |
Gross Provincial Purpose Funded Debt and Capital Loans | | 7,408.5 | 7,656.2 | 8,004.7 | 8,418.7 | 8,485.8 |
Less Sinking Funds | | 2,925.5 | 3,130.2 | 3,358.8 | 3,543.0 | 3,716.2 |
Net Provincial Purpose Funded Debt and Capital Loans | | 4,483.0 | 4,526.0 | 4,645.9 | 4,875.7 | 4,769.6 |
| | | Year ended March 31, (Canadian dollars in millions) |
| | | 2000 | 2001 | 2002 | 2003 | 2004 |
Advances to New Brunswick Power Corporation 3 | | | | | | |
Gross Advances | | 2,930.3 | 3,061.1 | 3,121.7 | 2,972.8 | 3,098.0 |
Less Sinking Funds | | 295.2 | 297.3 | 327.4 | 351.3 | 363.7 |
Net Advances | | 2,635.1 | 2,763.8 | 2,794.3 | 2,621.5 | 2,734.3 |
| | Year ended March 31, (Canadian dollars in millions) |
| | 2000 | 2001 | 2002 | 2003 | 2004 |
Contingent Liabilities | | | | | |
Gross Contingent Liabilities | 50.6 | 135.7 | 151.4 | 196.5 | 263.5 |
Less Sinking Funds | --- | --- | --- | --- | --- |
Net Contingent Liabilities | 50.6 | 135.7 | 151.4 | 196.5 | 263.5 |
1Source: Statistics Canada - - Numbers are subject to adjustment.
2Foreign currency issues are expressed as the Canadian dollar equivalent at fiscal year end rates of exchange or, where hedges are in place, at the rates
of exchange established by such hedges.
3Foreign currency issues are expressed as the Canadian dollar equivalent at fiscal year end rates of exchange.
4
Exhibit "d" Current Province of New Brunswick Description
PROVINCE OF NEW BRUNSWICK
GENERAL INFORMATION
Introduction
The Province of New Brunswick is located on the eastern seaboard of Canada and has a total area of 28,355 square miles of which about 12,877 square miles is Crown land owned by the Province. The St. John River flows for a distance of over 300 miles through the province to its mouth on the Bay of Fundy. The province's population is concentrated principally in the valleys of the St. John and other rivers.
A large part of New Brunswick is covered by forests, which constitute a major natural resource. Other natural resources include fish and shellfish, farmland and base metals, coal, potash, limestone and other minerals. The location of the province provides the advantage of cost effective water transportation for its products to export markets in the eastern U.S., Great Britain and Western Europe. Saint John, New Brunswick's largest city, located at the mouth of the St. John River on the Bay of Fundy, is home to one of North America's largest oil refineries and is one of the two principal seaports in eastern Canada that remain open throughout the year. Consequently, some Canadian shipping, which would otherwise pass through the St. Lawrence River, is diverted to the Saint John port during the winter months.
According to Statistics Canada, the population of the province on July 1, 2004 was estimated at 751,384. The three largest urban areas of New Brunswick and their respective populations based on 2001 census figures are Saint John (122,678), Moncton (117,727) and Fredericton (81,346), the capital of the province.
Government
Canada consists of a federation of provinces and federal territories with a constitutional division of powers between the federal and provincial governments established by the Constitution Act, 1867 and the Constitution Act, 1982. Under these Acts the Provinces are assigned jurisdiction over health, social services, education, municipal institutions, property and civil rights, natural resources and other matters of purely private or local concern. The Parliament of Canada has jurisdiction over all areas not assigned exclusively to the provincial legislatures, including such matters as the federal public debt and property, the regulation of trade and commerce, currency and coinage, banks and banking, national defense, the postal services, railways and navigation and employment insurance.
The Constitution Act, 1982 provides for enlarged provincial jurisdiction over and taxation of certain natural resources and electrical energy, a Charter of Rights and Freedoms, including language rights, the principles of the reduction of regional economic disparities and the making of fiscal equalization payments to certain Provinces by the Government of Canada, and for the amendment of the constitution in Canada. Each Province owns mineral and other resources on its provincial Crown Lands and may own sub-surface resources on its other lands.
The executive power in New Brunswick is vested in the Lieutenant-Governor acting on the advice of the Executive Council. The Executive Council is responsible to the Legislative Assembly. The Lieutenant-Governor, who is the representative of the Queen, is appointed by the Governor-General of Canada in Council on the recommendation of the Prime Minister of Canada. The current Lieutenant-Governor is His Honour Hermenegilde Chiasson. Members of the Executive Council are appointed by the Lieutenant-Governor on the nomination of the Premier from members of the Legislative Assembly. There are presently 18 members of the Executive Council, including the Premier, the Honourable Bernard Lord.
Legislative power is exercised by the Legislative Assembly and legislation becomes effective upon the assent of the Lieutenant-Governor unless otherwise specified in the legislation. The Legislative Assembly is elected for a term of five years and may be dissolved at any time by the Lieutenant-Governor on the advice of the Premier. Twenty-eight members of the Legislative Assembly are from the Progressive Conservative Party, 26 members are from the Liberal Party and one member is from the New Democratic Party. The last provincial general election was held on June 9, 2003.
5
Exhibit "d" Current Province of New Brunswick Description
International Trade Agreements
The Government of New Brunswick believes that Canada's participation in the Canada-U.S. Free Trade Agreement and North American Free Trade Agreement improves the province's international trade opportunities, particularly with neighbouring US states. The conclusion of the Uruguay Round of GATT, and the subsequent formation of the World Trade Organization, is beneficial for the export-oriented economies of both Canada and New Brunswick. The launch of another round of WTO negotiations in November 2001 is seen as complimentary to bilateral agreements with the U.S. Secure access to U.S. markets for the vast majority of the province's exports continues. The Province participates actively on Federal/Provincial consultative committees concerned with implementation, dispute settlement and future negotiation issues.
On March 22, 2002, the U.S. Department of Commerce (DOC) found that Canadian softwood lumber producers, other than those from Atlantic Canada, had benefited from countervailable subsidies, and also found that Canadian producers of softwood lumber had sold their product below fair market value. The DOC set the Countervailing Duty (CVD) rate at 18.79% and the "all others" Anti-Dumping (AD) rate at 8.43%. As a result of the exemption from the subsidies case, New Brunswick and all other Atlantic Canada softwood lumber producers are paying only the 8.3% AD rate at the US-Canada border. An attempt to arrive at a negotiated solution between the US and Canada broke down in January 2004 when Ministers agreed that a December, 2003 US proposal was not acceptable. Meetings between Canadian federal and provincial, "Heads of Delegation" and US DOC representatives have continued. New Brunswick will continue to support the Canadian federal government on both the litigation track, as cases move forward before both WTO and NAFTA panels, and in pursuing political discussions and negotiations towards a long-term solution so long as any settlement of the current dispute clearly excludes Atlantic Canada from restrictions or penalties.
THE ECONOMY
Recent Developments
A year of recovery in 2002 was followed by a setback in 2003 as the Canadian economy stumbled through a series of unfortunate events. The impacts of SARS, Bovine Spongiform Encephalopathy (BSE or mad cow disease), appreciation of the Canadian dollar, fires in British Columbia, Hurricane Juan and the Ontario power outage took their tolls on the Canadian economy. Consequently, real domestic product at market prices ("Real GDP") growth for Canada was estimated to have increased by 2.0% in 2003, down from a 3.4% increase in 2002. Economic growth in New Brunswick also decreased from the previous year due to lower-than-expected growth in employment and the rapid appreciation of the Canadian dollar. Real GDP in New Brunswick increased an estimated 2.5% in 2003 over the previous year. Nationally, Newfoundland and Labrador led economic growth among the Provinces with gains due to continued strength in oil production, followed by Saskatchewan, which recovered after two years of contraction. For New Brunswick, growth was realized in all sectors except in the manufacturing, the agriculture, forestry, fishing and hunting, the accommodation and food, and the other services (except public administration) industries. Output from the goods producing sector rose 2.1%, while output from the service sector increased 2.4%.
In 2003, retail sales in New Brunswick increased 0.1% over the year 2002 level, compared to a 3.8% national increase. Following strong sales in 2002, new motor vehicle sales posted an 8.6% decrease year-over-year. New Brunswick's Consumer Price Index increased 3.4%, compared to a 2.8% increase for Canada. Despite the appreciation of the Canadian dollar, New Brunswick manufacturing shipments in 2003 increased 2.7% over 2002, compared to the national decrease of 0.8%. Wages and salaries earned in New Brunswick increased 4.5% to $11.6 billion in 2003, above the national rate of 3.5%. New Brunswick's housing starts in 2003 totaled 4,489, a 16.2% increase from 2002. Capital investment in the province increased by 13.3% from 2002, with construction investment outpacing that of machinery and equipment due to the brisk housing market. Capital investment in Canada increased by 3.8% in 2003. In the agriculture sector, farm cash receipts decreased 6.4% in 2003 with potato receipts down 23.9%. The value of mineral production in New Brunswick increased 5.4%, as a substantial increase in the non-metallic minerals sector was more than sufficient to offset a drop in the value of fuels products.
Foreign exports increased 4.3% in 2003 to $8.5 billion. The value of energy products exports increased 16.9% over the 2002 level while agriculture and fishing products decreased 4.4%. Declines in world commodity prices led to a 2.9% drop in the export value of forestry products.
New Brunswick's employment level in 2003 decreased 0.2% from its 2002 level. With the labour force remaining virtually unchanged, the unemployment rate increased from 10.4% in 2002 to 10.6% in 2003.
6
Exhibit "d" Current Province of New Brunswick Description
Economic Activity
In 2003, the nominal value of New Brunswick's GDP was estimated at $22,452 million or $29,896 per capita. Over the 1999 to 2003 period, real GDP grew at a compound annual growth rate of 2.7% compared to a national rate of growth of 3.1%
Between 1999 and 2003, the real GDP from goods producing industries increased at a compound annual growth rate of 2.2% to $5,809.5 million (chained 1997 dollars), while the real GDP from the service producing industries increased at a compound annual growth rate of 3.0% to $13,028.6 million (chained 1997 dollars).
The gross value of manufacturing shipments increased at a compound annual growth rate of 8.9% (in current prices) over the 1999 to 2003 period, while foreign exports of commodities rose at a compound annual growth rate of 8.8% (in current prices).
Personal income has increased from $16,635 million in 1999 to $18,802 million in 2003 (in current prices), a compound annual growth rate of 3.1%. On a per capita basis, personal income increased from $22,150 to $25,036 (in current prices) over the same period, growing at a compound annual growth rate of 3.1%, modestly slower than the national compound annual growth rate of 3.2%. Retail sales for New Brunswick increased at a compound annual growth rate of 2.8% (in current prices) over the same period.
The following table sets forth selected indices of economic activity for New Brunswick and for Canada as a whole for the years 1999 through 2003.
| | | | | | | | | | | | | | | | | Compound | |
| | | | | | | | | | | | | | | | | Annual | |
| | | Year Ended December 31, | | | | | Growth Rate | |
| | | (millions) | | | | | % | |
| | | 1999 | | | 2000 | | | 2001 | | | 2002 | | | 2003 | | 1999-2003 | |
| Gross Domestic Product at market | $ | 19,041 | | $ | 20,085 | | $ | 20,689 | | $ | 21,168 | | $ | 22,452 | | 4.2 | |
| prices | | | | | | | | | | | | | | | | | |
| Gross Domestic Product (Canada) at | | | | | | | | | | | | | | | | | |
| market prices | 982,441 | | 1,076,577 | | 1,108,200 | | 1,157,968 | | 1,218,772 | | 5.5 | |
| Per Capita Gross Domestic Product | | | | | | | | | | | | | | | | | |
| (in dollars) | | 25,354 | | | 26,744 | | | 27,585 | | | 28,224 | | | 29,896 | | 4.2 | |
| Per Capita Gross Domestic Product | | | | | | | | | | | | | | | | | |
| (Canada) (in dollars) | | 32,313 | | | 35,080 | | | 35,724 | | | 36,910 | | | 38,496 | | 4.5 | |
| Personal Income | | 16,635 | | | 17,434 | | | 17,856 | | | 18,251 | | | 18,802 | | 3.1 | |
| Per Capita Personal Income (in dollars) | | 22,150 | | | 23,214 | | | 23,808 | | | 24,335 | | | 25,036 | | 3.1 | |
| Per Capita Personal Income (Canada) | | | | | | | | | | | | | | | | | |
| (in dollars) | | 25,755 | | | 27,384 | | | 28,196 | | | 28,620 | | | 29,204 | | 3.2 | |
| Private and Public Investment (new) | | 3,913 | | | 3,942 | | | 3,426 | | | 3,466 | | | 3,926 | | 0.01 | |
| Retail Trade | | 6,970 | | | 7,282 | | | 7,498 | | | 7,787 | | | 7,797 | | 2.8 | |
| Manufacturing Shipments | | 9,155 | | | 10,944 | | | 12,083 | | | 12,531 | | | 12,864 | | 8.9 | |
| | | | | | | | | | | | | | | | | | |
| Foreign Commodity Exports | | 6,086 | | | 7,403 | | | 8,271 | | | 8,161 | | | 8,513 | | 8.8 | |
| Real Gross Domestic Product (chained | | | | | | | | | | | | | | | | | |
| 1997 dollars) | | 18,553 | | | 18,942 | | | 19,181 | | | 20,108 | | | 20,618 | | 2.7 | |
| Real Gross Domestic Product (Canada) | | | | | | | | | | | | | | | | | |
| at market prices (chained 1997 dollars) | 969,750 | | 1,020,488 | | 1,038,845 | | 1,074,621 | | 1,096,359 | | 3.1 | |
| Change in Consumer Price Index | | 1.6% | | | 3.3% | | | 1.7% | | | 3.4% | | | 3.4% | | | |
| Change in Consumer Price Index (Canada) | | 1.7% | | | 2.7% | | | 2.6% | | | 2.2% | | | 2.8% | | | |
| | | | | | | | | | | | | | | | | | |
| Source: Statistics Canada. | | | | | | | | | | | | | | | | | |
7
Exhibit "d" Current Province of New Brunswick Description
New Investment
The following table sets forth statistics regarding new investment in New Brunswick, by sector, and compares total new investment with Canada as a whole.
NEW INVESTMENT |
| | Year Ended December 31, |
| | 1999 | 2000 | 2001 | 2002 | 20031 |
| | |
Construction Investment | (millions) |
Housing | $632.2 | $789.5 | $885.2 | $989.1 | $1,107.0 |
Transportation and Warehousing | 420.1 | nd | 56.2 | 48.0 | 22.0 |
Manufacturing | 375.7 | nd | 88.7 | 55.8 | 72.7 |
Public Administration | 595.0 | 485.3 | 378.3 | 370.1 | 381.0 |
Utilities | 101.2 | 135.2 | 141.3 | 192.4 | 513.2 |
Finance and Insurance | 34.6 | 14.8 | 10.3 | 19.6 | 23.3 |
Mining and Oil and Gas Extraction | nd | 89.6 | nd | 65.0 | nd |
Agriculture, Forestry, Fishing and Hunting | 31.4 | 33.1 | 32.1 | 36.4 | 34.9 |
Educational Services | 45.8 | 51.1 | 50.8 | 49.2 | 54.9 |
Retail Trade | 18.9 | 22.4 | 48.9 | 38.6 | 42.6 |
Information and Cultural Industries | nd | 26.5 | nd | 60.0 | 39.6 |
Health Care and Social Assistance | 31.5 | 14.9 | 38.6 | 25.0 | 24.6 |
Construction | 9.1 | 9.5 | 7.6 | 7.8 | 9.5 |
Real Estate and Rental and Leasing | 29.1 | 22.0 | 38.7 | 51.6 | 43.4 |
Professional, Scientific & Technical Services | 2.8 | 3.9 | 2.0 | 3.6 | 2.0 |
Administrative & Support, Waste | | | | | |
Management & Remediation Services | 8.6 | 10.0 | 10.8 | 1.1 | 3.1 |
Accommodation and Food Services | 5.4 | 4.5 | 4.4 | 12.2 | 7.8 |
Wholesale Trade | 8.7 | 13.2 | 10.9 | 6.0 | 15.1 |
Other Services | 6.7 | 5.5 | 7.5 | 10.2 | 16.3 |
Management of Companies & Enterprises | 0.1 | 2.8 | 2.4 | 1.0 | nd |
Arts, Entertainment and Recreation | 1.8 | 1.9 | 1.1 | 1.0 | 3.0 |
Total Construction2 | 2,450.5 | 2,421.5 | 1,977.4 | 2,043.7 | 2,461.4 |
| | | | | | |
Machinery Equipment Investment | | | | | |
Manufacturing | 437.4 | nd | 308.8 | 282.9 | 350.1 |
Finance and Insurance | 153.5 | 184.1 | 177.5 | 175.8 | 142.6 |
Information and Cultural Industries | nd | 138.2 | nd | 199.3 | 183.0 |
Transportation and Warehousing | 98.1 | nd | 91.1 | 107.0 | 108.8 |
Construction | 71.5 | 73.3 | 59.0 | 60.7 | 73.1 |
Agriculture, Forestry, Fishing and Hunting | 56.9 | 57.1 | 45.2 | 54.9 | 53.6 |
Utilities | 55.6 | 105.0 | 52.7 | 37.9 | 29.5 |
Retail Trade | 43.0 | 51.7 | 79.3 | 80.1 | 76.3 |
Professional, Scientific & Technical Services | 36.1 | 44.2 | 32.5 | 35.5 | 36.1 |
Public Administration | 108.7 | 119.0 | 135.4 | 114.3 | 120.4 |
Real Estate and Rental and Leasing | 66.4 | 95.0 | 78.1 | 110.3 | 99.8 |
Wholesale Trade | 83.6 | 45.0 | 47.8 | 40.1 | 41.6 |
Mining and Oil and Gas Extraction | nd | 41.6 | nd | 17.9 | nd |
Health Care and Social Assistance | 20.0 | 28.2 | 42.8 | 36.7 | 30.0 |
Educational Services | 24.8 | 20.6 | 24.7 | 24.3 | 26.4 |
Administrative & Support,Waste Management & Remediation Services | | | | | |
11.3 | 20.6 | 21.8 | 13.8 | 16.6 |
Accommodation and Food Services | 26.3 | 10.2 | 9.0 | 6.4 | 8.3 |
Other Services | 12.9 | 14.0 | 14.5 | 12.9 | 14.0 |
Management of Companies & Enterprises | 2.3 | 7.4 | 5.6 | 7.5 | nd |
Arts, Entertainment and Recreation | 2.9 | 2.9 | 2.4 | 3.4 | 2.7 |
Total Machinery and Equipment2 | 1,462.8 | 1,520.2 | 1,448.5 | 1,421.8 | 1,464.6 |
Total New Investment | $3,913.3 | $3,941.8 | $3,425.9 | $3,465.5 | $3,926.0 |
| | | | | | |
| Total New Investment (Canada) | $176,869.4 | $185,957.1 | $200,311.9 | $209,266.1 | $217,182.3 |
1Preliminary actual.
2Total investments include amounts, which are not separately disclosed by Statistics Canada.
nd: not disclosed
Source: Statistics Canada.
8
Exhibit "d" Current Province of New Brunswick Description
Capital investment increased 13.3% in 2003 from the 2002 level, to $3,926.0 million. Investment in 2003 represents the second highest annual investment total in provincial history. Major investments since the mid-1990s included projects in the refined petroleum products, power generation, real estate, retailing, food processing, electronic products, communications, transportation, health, recreation, education and forestry-related industries.
In 1999, Enbridge Gas New Brunswick, a joint venture between Enbridge Inc. and New Brunswick investors, was awarded the province's natural gas distribution franchise. Over the life of the 20-year contract, Enbridge Gas New Brunswick intends to spend $300 million in capital investment in building a 1,450-km natural gas distribution system, and plans on having 70,000 customers at the end of this period. Construction on the distribution pipeline began in the spring of 2000, with an estimated 3,400 construction jobs to be created over the next 20 years, a large proportion of these occurring over the first five years of the project. In 2003, Enbridge Gas New Brunswick continued developing the natural gas distribution system in the province, which is available in Fredericton, Moncton, Saint John, St. George and Oromocto. Enbridge has about 2,100 customers in New Brunswick and plans to continue expanding its customer base. Plans for St. Stephen, which was originally scheduled to have access in 2003, have been delayed. Several marketer firms serve the Saint John, Moncton, Fredericton and St. George areas with emphasis on the large industrial and commercial customers.
In recent years, Aliant (owner of NBTel) and Rogers Communications Inc. have made significant investments in the province's telecommunications system, increasing access to high-speed Internet and wireless communications. Rogers Cable has enhanced its New Brunswick network system through a $5.5-million project to connect with its system in Ontario and announced a $2.5-million cable network upgrade in the municipality of Shediac that gives access to high definition and digital television to residents. Rogers AT&T Wireless is now offering data service wherever it's offering voice service, following a $3-$4 million investment. Rogers High-speed Internet service is available in Moncton, Fredericton and Saint John areas. Since the summer of 2003, Rogers is rolling out the service in Edmundston, Bathurst and Miramichi. The federal and provincial governments, along with Aliant, announced they would invest $44.6 million before the end of 2006 to increase access to broadband Internet service in the province. Currently, only 54% of New Brunswickers and 72% of businesses have access to the service. By the end of 2006, these are expected to increase to 90% of New Brunswickers, 95% of businesses and 100% of regional health centres, industrial parks and First Nation communities. In the Atlantic Provinces Economic Council (APEC) annual major project inventory report for 2003, Aliant was reported as planning to invest $124 million in New Brunswick for network upgrades such as the delivery of Voice over IP (VoIP) and other revolutionary Internet protocol-based services, the improvement and expansion of its digital wireless service and network and the increased accessibility to high-speed Internet.
In August 2003, the federal and New Brunswick governments announced an agreement to complete the twinning of the Trans-Canada Highway between Fredericton and the Quebec border by 2007. The $400-million project involves the twinning of 130 kilometres and will be done over five years. The costs will be split 50-50 between the two levels of government. Once completed, the four-lane Trans-Canada Highway will extend from the Quebec border in the northwest to the Nova Scotia border in the southeast.
In 2002, the New Brunswick Power Corporation (NB Power), began a $750-million upgrade of the Coleson Cove power plant. The upgrade will allow the power plant to extend its life to 2030. The project, which is expected to be completed in November 2004, will also allow the power plant to reduce emission of certain pollutants, including sulphuric anhydrides, particulate matter and nitrogen oxides. Construction of the new 90-megawatt co-generation plant in Saint John by Irving Oil Limited and TransCanada Pipelines Ltd. has started. The $80-million project is to go on line in 2004.
Foreign Exports of Commodities
Foreign exports of commodities have become increasingly important to both the New Brunswick and Canadian economies. In 2003, foreign exports were equivalent to 44.9% of Real GDP, compared to 40.1% for Canada. New Brunswick's foreign exports of commodities, estimated at $8,512.6 million in 2003 (in current dollars), increased at a compound annual growth rate of 8.8% over the 1999 to 2003 period.
Due to the significance of commodity exports, the economic performance of the province is highly dependent on international economic conditions, particularly in the U.S. In 2003, the U.S. purchased an aggregate of 89% of the province's foreign commodity exports. Energy products (mostly refined petroleum products and some electricity) accounted for 45.5% of all commodity exports that year, followed by forest products (lumber, pulp and paper) with 23.8%, and agricultural and fishing products (15.7% of total). Other important commodity exports are fertilizers, plastic products, electronic parts and components, potash and metallic ores (mostly zinc).
9
Exhibit "d" Current Province of New Brunswick Description
The table below shows foreign exports of commodities from New Brunswick for the years 1999 to 2003. The largest component, energy products, increased at a compound annual growth rate of 27.0% during that time, due to an increase in energy prices and a major upgrade at the Irving Oil refinery. Exports of forest products decreased at a compound annual growth rate of 5.5%, as the effects of price declines and weak markets led to a decline in exports of these commodities over the past three years. Increasing at a compound annual growth rate of 4.1%, exports of agricultural and fishing products have reported strong increases in recent years to diverse markets such as the U.S., Japan and Europe.
FOREIGN EXPORTS OF COMMODITIES |
| |
| | | Compound Annual Growth Rate % |
| |
Year Ended December 31, |
| | 1999 | 2000 | 2001 | 2002 | 2003 | 1999-2003 |
| | (millions) | | |
| | | | | | | | |
Forest Products | $2,537.4 | $2,764.7 | $2,319.8 | $2,087.5 | $2,026.4 | -5.5 | |
Energy Products | 1,488.9 | 2,351.1 | 3,379.8 | 3,312.2 | 3,871.1 | 27.0 | |
Agriculture and Fishing Products | 1,140.4 | 1,243.6 | 1,352.2 | 1,399.1 | 1,337.1 | 4.1 | |
Industrial Goods | 452.0 | 464.6 | 584.1 | 595.0 | 587.1 | 6.8 | |
Machinery and Equipment | 306.6 | 412.8 | 465.7 | 576.0 | 514.7 | 13.8 | |
Other | 160.3 | 165.8 | 169.4 | 191.3 | 176.2 | 2.4 | |
| | | | | | | | |
Total | $6,085.6 | $7,402.6 | $8,271.0 | $8,161.1 | $8,512.6 | 8.8 | |
Source: Statistics Canada.
10
Exhibit "d" Current Province of New Brunswick Description
Structure of the Economy
The New Brunswick economy receives a large contribution from natural resources, especially forestry and forestry-related industries. The provincial economy shows a larger concentration of service industries than goods producing industries compared to Canada as a whole. During the 1999 to 2003 period, GDP in the service industries accounted for 69.8% of total GDP compared to 68.8% for Canada. The following table shows Real GDP by industry in New Brunswick for the years 1999 to 2003, valued in chained 1997 dollars.
GROSS DOMESTIC PRODUCT BY INDUSTRY1 |
| | Year Ended December 31, |
| |
1999 |
2000 |
2001 |
2002 |
2003 | Compound Annual Real Growth Rate % 1999-2003 |
| | (millions of 1997 dollars) |
Goods Producing Industries | | | | | | |
Manufacturing2 | $2,558.0 | $2,734.6 | $2,639.6 | $2,863.9 | $2,834.4 | 2.6 | |
Construction | 1,112.6 | 1,126.9 | 1,006.4 | 1,032.2 | 1,189.9 | 1.7 | |
Utilities | 660.3 | 605.3 | 605.9 | 551.6 | 552.2 | -4.4 | |
Agriculture, Forestry, Fishing and Hunting | 708.2 | 721.6 | 829.5 | 871.2 | 840.1 | 4.4 | |
Mining and Oil and Gas Extraction | 279.4 | 266.1 | 259.0 | 234.0 | 258.2 | -2.0 | |
| | | | | | | | |
Total Goods Producing Industries | 5,333.2 | 5,458.6 | 5,394.6 | 5,690.7 | 5,809.5 | 2.2 | |
| | | | | | | | |
Service Producing Industries | | | | | | | |
Transportation and Warehousing | 942.7 | 973.0 | 1,000.0 | 1,008.4 | 1,035.0 | 2.4 | |
Information and Cultural Industries | 614.1 | 668.5 | 720.6 | 781.6 | 792.3 | 6.6 | |
Retail Trade | 998.1 | 1,080.3 | 1,115.3 | 1,151.4 | 1,161.1 | 3.9 | |
Wholesale Trade | 754.7 | 774.0 | 817.5 | 843.3 | 870.6 | 3.6 | |
Finance, Insurance and Real Estate | 2,828.8 | 2,899.6 | 3,051.2 | 3,247.8 | 3,376.6 | 4.5 | |
Public Administration | 1,655.8 | 1,670.5 | 1,675.0 | 1,716.9 | 1,774.2 | 1.7 | |
Educational Services | 895.8 | 893.4 | 884.0 | 889.9 | 895.5 | -0.01 | |
Health Care and Social Assistance | 1,221.7 | 1,224.5 | 1,299.4 | 1,331.4 | 1,366.5 | 2.8 | |
Professional, Scientific and Technical Services | | | | | | | |
484.4 | 454.5 | 446.9 | 484.3 | 485.8 | 0.1 | |
Administrative and Waste Management Services | | | | | | | |
231.9 | 290.0 | 303.5 | 310.8 | 322.4 | 8.6 | |
Accommodation and Food Services | 406.7 | 410.8 | 410.8 | 410.0 | 398.3 | -0.5 | |
Arts, Entertainment and Recreation | 104.7 | 98.7 | 103.2 | 108.3 | 109.6 | 1.2 | |
Other Services (except Public Administration) | | | | | | | |
426.3 | 439.8 | 456.1 | 472.6 | 461.0 | 2.0 | |
| | | | | | | | |
Total Service Producing Industries | 11,558.4 | 11,871.9 | 12,252.4 | 12,727.2 | 13,028.6 | 3.0 | |
| | | | | | | | |
Total Real Domestic Product (at basic prices) | $16,874.2 | $17,316.9 | $17,590.3 | $18,258.6 | $18,666.0 | 2.6 | |
1
Totals may not add up due to the adoption of the chain Fisher deflation methodology.
2
Includes natural resources processing: output of forestry-related products accounted for approximately 46.6% of manufacturing GDP at basic prices during the years 1999 through 2003.
Source: Statistics Canada.
Primary Industries
Mining. The New Brunswick mining sector has benefited from the development of base metal deposits (zinc, lead, copper and silver ores), potash and peat with increases in employment both directly from and through the development and operation of related smelting, and land and water transportation facilities. The New Brunswick mining industry employs approximately 3,200 people.
11
Exhibit "d" Current Province of New Brunswick Description
A rise in base metals prices in 2003 from the 2002 level was largely offset by a rise in the value of the Canadian dollar. As a result, the total value of mineral production in New Brunswick (including downstream manufacturing) was not much changed from that in the previous year (increased by 5.4% to $689.0 from a final value of $653.4 million in 2002). Metals, which accounted for 64% of the total value of the Province's mineral production, remained within a percentage point of their 2002 level, while non-metallics (33% of total production) increased by 19%, chiefly on the strength of higher potash values. Among the metals, zinc continued to be the dominant commodity (over 46% of total production). However the province's only zinc producer, Noranda's Brunswick mine, is expected to run out of mineable reserves by 2009.
The main non-metal commodities are potash, peat, salt and sulphur in smelter gas. In contrast to 2002, when the Potash Corporation of Saskatchewan (PCS) was obliged to shut down for 72 days for inventory reduction, PCS operated normally in 2003, with only the regular one-month maintenance shutdown. The workforce remains at its usual level of approximately 350.
Structural materials such as lime, stone, sand and gravel contributed about 7% to the value of production. Several limestone quarries were active, as were areas producing marl and silica.
One firm was active in oil and gas projects in southeastern New Brunswick in 2003. Corridor Resources Inc. completed construction of twin pipelines and related infrastructure to pipe natural gas from its first two wells (drilled in conjunction with joint-venture partner PCS) to the nearby PCS potash mine.
The Province has established a number of initiatives to improve and expand the viability of the mining industry, as recommended in a major study presented in 2000. In addition to the Prospector Development Program and the Junior Mining Assistance Program, there are two new initiatives to assist the exploration and mining industries: an 18% tax credit to companies that undertake advanced exploration and a new mine reclamation fund. In 2003, investment in mining exploration in the metallic and industrial minerals sector totaled $2.5 million (preliminary estimates indicate a substantially higher total in 2004). A further $1.5 million was invested in the exploration for natural gas and other hydrocarbons. The reduction from previous years was associated with Corridor Resources' focus on construction of production facilities, as described above. In October 2003 an annual grant program wa s announced by the Province for the Bathurst Mining Camp. Fifteen million dollars will be invested in advanced exploration over the next three years and the terms of the program may be extended for two additional years and a further $10 million.
The following table sets forth the total selling value of mineral production in New Brunswick (including the value of concentrating and smelting) for the years 1999 through 2003.
MINERAL PRODUCTION |
| | Year Ended December 31, |
| | | | | | |
| 1999 | 2000 | 2001 | 2002 | 2003 |
| (millions) |
Base Metals | $595.4 | $520.5 | $580.2 | $440.3 | $441.3 |
Fuels, including Coal | 20.9 | 22.8 | 19.9 | 19.9 | 17.1 |
Non-Metallic Minerals | 234.5 | 229.2 | 207.1 | 193.2 | 230.6 |
Total | $850.8 | $772.5 | $807.2 | 653.4 | $689.0 |
Source: Statistics Canada.
Forestry. Approximately 83.5% of the land area of New Brunswick is forested and roughly one-half of the forested land is owned by the Province as Crown land. Nearly all Crown land is subject to timber licenses and the Province received $55 million from crown land stumpage for the fiscal year ending March 31, 2003. Harvesting of the province's wood resources on Crown lands and industrial freehold lands is in balance with current growth on a sustainable-yield basis. The province's yearly harvest level is estimated at 10.5 million cubic metres, comprised of 64% softwood and 36% hardwood fibre.
12
Exhibit "d" Current Province of New Brunswick Description
The following table sets forth the most recently published estimates of forest production in New Brunswick for the years 1997 through 2001.
FOREST PRODUCTION |
| | Year Ended December 31, |
| | 1997 | 1998 | 1999 | 2000 | 2001 |
| | (thousands of cubic metres) |
Pulpwood | 4,542 | 4,427 | 3,752 | 3,573 | 2,799 |
Logs | 6,683 | 7,075 | 7,486 | 8,231 | 7,308 |
Other | 27 | 33 | 20 | 33 | 44 |
Total | 11,252 | 11,535 | 11,258 | 11,837 | 10,151 |
| | | | | | |
Source: Statistics Canada.
Information regarding New Brunswick's pulp and paper and wood manufacturing industries is set forth below under "Manufacturing". Pulpwood production from year to year is affected by, among other things, weather conditions for harvesting and bears a fluctuating relationship to shipments by the pulp and paper industry.
Agriculture. The 2001 Census of Agriculture indicated that New Brunswick had 3,034 farms and 388,061 hectares of farmland. The comparable figures from the 1996 census were 3,405 farms and 386,027 hectares. Cattle farms accounted for 26% of all farms in New Brunswick in 2001, followed by fruit operations (13%) and dairy farms (11%). Total farm cash receipts in the province were $396.9 million in 2003, down 6.4% from the previous year. Receipts for potatoes, the largest crop, decreased 23.9% to $96.5 million.
Fishing. Lobster, crab, herring, shrimp, scallops and sea urchin have been the species most important to the primary fishing industry, accounting for nearly 96% of the value of landings estimated at $169 million in 2003, a 14.6% decrease from 2002. The average annual value of fish landings during the 1999-2003 period was $179 million. New methods of processing and marketing frozen and pre-cooked fish and shellfish have expanded market opportunities and increased the competitiveness of the industry. Shipments of processed fish products for 2003 rose 1.2% from 2002 to $1,090.8 million, a dramatic increase over the 1999-2003 average of $899 million. Exports of fish products reached $798 million in 2003, a 9.7% decrease from 2002.
Due to low prices for farmed salmon, a strengthening Canadian dollar and outbreaks of disease, sales of New Brunswick aquaculture products decreased 4.6% to $269.2 million in 2003. New Brunswick sales accounted for 37.7% of the Canadian total in 2003, not far behind first-ranked British Columbia. The industry is developing new value-added products and is diversifying its product mix, thus creating further value-added products and extending employment levels in processing plants in the province.
Secondary Industries
Manufacturing. Manufacturing activity in New Brunswick employed approximately 41,900 people in 2003, providing $1,264.9 million in wages and salaries compared to $1,253.4 million in 2002.
In 2003, the value of manufacturing shipments increased by 2.7% to $12,864.2 million from $12,530.5 million in 2002. The miscellaneous group of manufacturing industries (which includes diverse groups of small plants as well as large producers such as the Irving Oil refinery and Brunswick Mining and Smelting), accounted for 54.9% of total shipments in 2003 and reported a 4.8% increase in the value of shipments over 2003. Shipments from the wood products, machinery products and food industries also increased from the previous year, while those from the paper industry showed a slight decline.
13
Exhibit "d" Current Province of New Brunswick Description
The table below sets forth the leading industrial groups in New Brunswick's manufacturing sector, according to gross selling value of factory shipments, for the years 1999 through 2003.
GROSS SELLING VALUE OF FACTORY SHIPMENTS |
| | Year Ended December 31, |
| | | | | | | Compound Annual Growth Rate % |
| | 1999 | 2000 | 2001 | 2002 | 2003 | 1999-2003 |
Industry | (millions) | |
Paper Manufacturing | $1,990.3 | $2,463.3 | $2,191.7 | $2,212.8 | $2,083.5 | 1.2 | |
Food Manufacturing | 1,729.7 | 1,799.6 | 1,913.6 |
2,022.6 | 2,034.6 | 4.1 | | Wood Product Manufacturing | 1,477.5 | 1,354.7 | 1,399.4 | 1,559.9 | 1,684.8 | 3.3 | |
Miscellaneous Manufacturing1 | 3,957.6 | 5,325.9 | 6,578.6 | 6,735.2 | 7,061.3 | 15.6 | |
Total | $9,155.2 | $10,943.6 | $12,083.3 | $12,530.5 | $12,864.2 | 8.9 | |
1The principal components of "Miscellaneous" are petroleum products, lead smelting and electrical and electronics commodities.
Source: Statistics Canada.
Construction. The construction industry is the second largest of the goods-producing industries in terms of contribution to GDP. Spending on construction activity in 2003 increased 20.4% from the 2002 level to $2,461.4 million. The two main contributors to the increase were strong residential construction activity in the province and an increase in activity at the Coleson Cove power plant project, which entered its first full year. Construction activity in Canada reported an increase of 7.1% in 2003. Residential construction, the largest component of investment, accounted for 28.2% of capital investment in 2003. Housing starts in the province reached 4,489 in 2003, a 20-year high. At the same time, construction investment in the utilities industry surged 166.7% to $513.2 million in 2003. According to preliminary estimates, construction investment in New Brunswick in 2004 is expected to reach $2,711.3 million, up 10.2% from 2003.
Service Industries
Trade. Retail trade amounted to $7,796.9 million in 2003, an increase of 0.1% from 2002, compared to the national rate of increase of 3.8%. Between 1999 and 2003, New Brunswick's compound annual growth rate for retail trade was 2.8%. On a per capita basis, the value of retail sales was $10,384 for New Brunswick and $10,439 for Canada as a whole.
Transportation. New Brunswick has an extensive infrastructure of road, rail, water and air transportation services. In addition, the province has an area air traffic control centre that controls aircraft within the Maritime Provinces, plus a part of Quebec and Labrador. Passengers using New Brunswick's three main airports increased 18.4% in 2003 from the previous year while there was minimal growth at the national level (+0.1%). The expansion of the terminal ($1.5 million) and parking apron ($1.5 million) at the Greater Fredericton Airport was completed in 2003; and Delta Airlines started a twice-daily jet service from Boston. The Saint John Airport Authority started a $2-million upgrade to its airfield lighting systems (scheduled for completion in 2004) and Pan Am Airlines added a non-stop service from Manchester, New Hampshire. The Greater Moncton International Airport will benefit fro m new agreements for direct flights from Germany and Paris in 2004.
A major ice-free port in Saint John handled a record 26.1 million metric tonnes of cargo in 2003, an increase of 1.4% from 2002; liquid bulk (includes petroleum) rose 1%, dry bulk products (includes potash, salt and fish meal) grew 13%, container traffic increased 20% and forest products decreased 7%. Marine traffic increased 10% while passenger traffic was up 18% to 83,000 passengers.
The port of Belledune handled 2.3 million metric tonnes of goods in 2003, an increase of 2.6% from the previous year. Capital investment worth $310,000 was carried out at the port in 2003.
14
Exhibit "d" Current Province of New Brunswick Description
Communications and Technology. Employment in communications and technology averaged 49,300 in 2003, an increase of 3.4% over the previous year.
Several customer contact centres announced new jobs in 2003 or expansion plans for 2004 including: Archway Marketing Services, Asurion, Cendant, CorporaTel, Help Desk Now, Home Town Communications, ICT Group, Iron Mountain, Moneris Solutions Corporation, Results Technology, The Spiegel Group and Virtual-Agent Services. Air Canada and Purolator Courier had job losses while Star Choice closed. The industry consists of 100 centres employing close to 18,000 contact centre workers.
Aliant and Rogers continued to improve high-speed Internet access and digital wireless service by expanding into smaller communities throughout the province in 2003. A partnership involving the Province, the federal government and Aliant will see the investment of over $40 million before the end of 2006 and result in 90% of New Brunswickers having access to high-speed Internet.
The National Research Council Institute for Information Technology (NRC-IIT) - - e-Business, officially opened in 2003; the facility has 65 people working at the Fredericton laboratory and three satellite locations in Saint John, Moncton and Miramichi. The institute will build research and working relationships with companies, universities and other partners across the province and is expected to be an incubator for e-commerce concepts and initiatives. Positive developments in New Brunswick's information technology sector included announcements of new contracts and/or expansion plans by Anyware Group, CGI Group, Q1 Labs, SG5 Innovation, Spielo, T4G, TSi Auto Solutions, OAO Technology Solutions and Whitehill Technologies.
Tourism. In recent years, tourism has made a significant contribution to the economy of New Brunswick. Revenues in 2003 decreased 7% from the previous year's record to $1.1 billion and visitation declined 7% to 1.86 million visitors. Travelers to Canada were negatively influenced by the media coverage of SARS, BSE and West Nile, plus a wet spring and strong Canadian dollar offered other challenges.
Labour Force
Following a strong performance the previous year, employment in New Brunswick for 2003 fell marginally (-0.2%), to 345,000. Nationally, the number of employed persons increased 2.2%. Employment declines, coupled with negligible labour force growth, served to push the province's unemployment rate up 0.2 percentage points to 10.6%. Unemployed New Brunswickers numbered 40,800, a 1.7% increase from 2002. Nationally, despite a 1.8% rise in the number of unemployed, the unemployment rate improved, falling to 7.6%.
The following table sets forth certain information concerning New Brunswick's labour market.
LABOUR FORCE |
| | Average for Year Ended December 31, |
| | 1999 | 2000 | 2001 | 2002 | 2003 |
| | (thousands) |
Population 15 years and over | 599.5 | 603.5 | 605.7 | 607.6 | 609.5 |
Labour Force | 365.7 | 371.7 | 376.7 | 385.7 | 385.8 |
Labour Force Employed | 328.4 | 334.4 | 334.4 | 345.6 | 345.0 |
Labour Force Unemployed | 37.3 | 37.3 | 42.2 | 40.1 | 40.8 |
Unemployment Rate | | | | | |
New Brunswick | 10.2% | 10.0% | 11.2% | 10.4% | 10.6% |
Canada | 7.6% | 6.8% | 7.2% | 7.7% | 7.6% |
Participation Rate | | | | | |
New Brunswick | 61.0% | 61.6% | 62.2% | 63.5% | 63.3% |
Canada | 65.6% | 65.9% | 66.0% | 66.9% | 67.5% |
Source: Statistics Canada.
From 1999 to 2003, the number of persons employed in New Brunswick increased 5.1%. Job growth in 2003 was concentrated in the goods producing sector, demonstrating a shift from the service sector for the first time since 2000. Two industries realized gains of more than 2,000: manufacturing added 2,400 jobs to the economy, and health care and social assistance added 2,200.
15
Exhibit "d" Current Province of New Brunswick Description
The following table indicates employment by industry in New Brunswick for the years 1999 through 2003.
EMPLOYMENT BY INDUSTRY |
| | Average for Year Ended December 31, |
| |
| | 1999 | 2000 | 2001 | 2002 | 2003 |
Goods Producing Sector | (thousands) |
Agriculture | 5.8 | 6.1 | 6.0 | 5.1 | 5.3 |
Forestry, Fishing, Mining, Oil and Gas | 12.1 | 13.2 | 12.0 | 11.2 | 11.9 |
Manufacturing | 39.3 | 41.1 | 39.0 | 39.5 | 41.9 |
Utilities | 3.7 | 4.3 | 4.6 | 4.6 | 3.7 |
Construction | 19.3 | 19.6 | 19.2 | 19.3 | 18.9 |
Service Producing Sector | | | | | |
Trade | 54.5 | 55.1 | 55.0 | 53.4 | 54.1 |
Transportation and Warehousing | 19.0 | 19.8 | 19.0 | 20.2 | 18.4 |
Professional, Scientific and Technical Services | 10.6 | 11.3 | 13.1 | 14.3 | 15.3 |
Business, Building and Other Support Services | 11.3 | 13.1 | 16.3 | 20.6 | 22.0 |
Educational Services | 22.5 | 23.2 | 23.2 | 21.6 | 22.4 |
Health Care and Social Assistance | 38.7 | 40.4 | 40.3 | 42.7 | 44.9 |
Information, Culture and Recreation | 13.6 | 12.4 | 12.2 | 12.8 | 12.0 |
Accommodation and Food Services | 21.7 | 22.4 | 24.3 | 26.1 | 22.4 |
Other Services | 19.7 | 16.9 | 15.7 | 18.1 | 17.4 |
Finance, Insurance, Real Estate and Leasing | 13.6 | 12.7 | 12.8 | 14.5 | 14.3 |
Public Administration | 22.9 | 22.9 | 21.8 | 21.6 | 20.0 |
Total | 328.4 | 334.4 | 334.4 | 345.6 | 345.0 |
Source: Statistics Canada.
Economic Development
Economic growth is assisted by the federal government's Atlantic Canada Opportunities Agency ("ACOA"), which was launched in June 1987 with a mandate to stimulate economic development in the Atlantic Provinces.
The Canada-New Brunswick Infrastructure Program Agreement was established in 2000 to improve urban and rural municipal infrastructure in New Brunswick. Canada and New Brunswick are each contributing $54.4 million to be matched by municipalities for a total fund of $163.2 million. As at March 31, 2004 $59.6 million of federal/provincial funding has been expended under this Agreement. This initiative will continue until March 31, 2007.
In 1999 the Government of New Brunswick established the $25 million Acadian Peninsula Economic Development Fund to provide additional economic stimulation to the northeast region of the province. As at March 31, 2004, $21.5 million has been advanced under this initiative. In 2002, a similar $25 million fund was established to support the Restigouche-Chaleur Economic Development Initiative in the northern part of the province. As at March 31, 2004, $3.9 million has been advanced under this initiative.
In 2001 the $30 million Total Development Fund was established by the Government of New Brunswick to provide financial support for the implementation of Total Development Strategies in the forestry, mining, energy, aquaculture, agriculture, new technology and tourism sectors. As at March 31, 2004, $14.0 million has been advanced under this program.
16
Exhibit "d" Current Province of New Brunswick Description
REVENUE AND EXPENDITURE OF THE PROVINCE
General Information
Under the Constitution Act, 1867 and the Constitution Act, 1982 provincial legislatures are given certain exclusive powers, including the power to impose direct taxation within the provinces to raise revenue for provincial purposes, and the power to borrow money on the sole credit of the provinces.
The Financial Administration Act governs the receipt of public money, the disbursement of public funds, the control of expenditures and the keeping and auditing of public accounts of the Province. All public monies are to be deposited to the credit of the Province and constitute the Consolidated Fund of the Province. Monies necessary for the carrying out of the operations of the Provincial Government for each fiscal year are voted by the Legislative Assembly, with the exception of those expenditures for which provision has already been made through existing legislative authority. In addition, under the authority of the Financial Administration Act, should the occasion arise when the Legislative Assembly is not in session, the Lieutenant-Governor in Council may order the issue of a special warrant authorizing payment out of the Consolidated Fund for an expenditure required urgently for the public good which was not provided for by the Legislative Assembly. Amounts appropriated under special warrant must be approved at the next session of the Legislative Assembly.
In accordance with the Financial Administration Act and certain other Acts, funds received for a special purpose are to be disbursed for that purpose. Unlike regular appropriations, any unspent balance of these funds may be carried forward to subsequent fiscal years. At March 31, 2004, the balance of unspent special purpose funds was $72.2 million.
Funds may also be considered as Special Operating Agency Funds. Revenue may be generated by the Agencies or from transfers from other budgetary accounts. Any unspent balance of these funds may, with permission from the Board of Management as per the Financial Administration Act, be carried forward to subsequent fiscal years. At March 31, 2004, the balance of unspent special operating funds, was $22.9 million. All transactions between the Special Operating Agencies and Provincial departments are eliminated from the Province's combined statement of revenue and expenditure.
During the 2001 fiscal year, the Fiscal Stabilization Fund Act was enacted. The Act establishes a fund separate from the Consolidated Fund, for the purpose of assisting in stabilizing the fiscal position of the Province from year to year and to improve long term fiscal planning. Any transfers into the Fiscal Stabilization Fund are authorized by an appropriation in accordance with the Financial Administration Act. Transfers out of the Fund are made with the approval of the Lieutenant-Governor in Council.
For the year ending March 31, 2004 an amount of $104.2 million was transferred from the Fiscal Stabilization Fund to the Consolidated Fund.
Volume 1 of the public accounts are subject to review by the Auditor General, an official responsible under the provisions of the Auditor General Act for the examination of the accounts of the Province and for reporting thereon annually to the Legislative Assembly.
For each fiscal year, the Minister of Finance delivers a budget and the Estimates of Revenue and Expenditure (the "Budget Estimates") to the Legislative Assembly. As part of the Province's financial reporting system, the Minister of Finance reports on the status of the budget plan during the year. The Budget Estimates include the revenue and expenses of some Provincially-created Boards, Commissions and Crown corporations, or the net profits of such entities, or the Provincial contribution towards the operations of such entities, as well as funds advanced through such entities to various individuals and enterprises in the form of repayable loans and investments.
The Provincial Reporting Entity is comprised of certain organizations that are accountable to the Provincial Legislature. Transactions and balances of these organizations are included in the Province's financial statements through different accounting methods as outlined in Note 1(a) of Volume 1 of the Public Accounts.
In May 1993, An Act Respecting the Balancing of the Ordinary Expenditures and Ordinary Revenues of the Province was enacted. The Act, which was amended in April 1995 and renamed the Balanced Budget Act, states that "It is the objective of the Government of New Brunswick that (a) in respect of the first fiscal period, the total amount of the ordinary expenditures for that fiscal period not exceed the total amount of the ordinary revenues for that fiscal period, and (b) in respect of each subsequent fiscal period, the total amount of the expenditures for that fiscal period not exceed the total amount of the revenues for that fiscal period".
17
Exhibit "d" Current Province of New Brunswick Description
The first fiscal period under the Act was the three fiscal years ended on March 31, 1996 and the second fiscal period the four consecutive fiscal years. In the second fiscal period, the Province did not meet the requirements of the Balanced Budget Act. The cumulative difference between total expenditures and total revenues during the period was a deficit of $1,236.5 million. Major factors explaining the result are the booking of a $450 million write down of New Brunswick Power Corporation asset values in 1998-99 and recognition of the total net present value of the Fredericton-Moncton Highway, $903.8 million, as a result of eliminating the tolls in March 2000 and the consequent change in the lease arrangement from an operating to a capital lease. As at March 31, 2004 revenues of the Province exceed expenditures by $247.2 million for the balanced budget period of 2000-01 to 2003-04.
18
Exhibit "d" Current Province of New Brunswick Description
Changes in Cash Flow
The following table sets forth the changes in cash flow of the Province for the four fiscal years ended March 31, 2004 and the Budget Estimates for the fiscal year ending March 31, 2005.
COMPARATIVE STATEMENT OF CASH FLOW (millions) |
| | | | | | | | | | | | | | Budget Estimates1 |
| | | 2001 | | | 2002 | | | 2003 | | | 2004 | | | 2005 |
Operating Activities | | | | | | | | | | | | | | |
(Increase) Decrease in Net Debt for the Year2 | $ | 143.3 | | $ | 178.4 | | $ | (109.4) | | $ | (103.2) | | $ | 2.4 |
Non-Cash Items | | | | | | | | | | | | | | |
Amortization of Premiums, Discounts and Issue Expenses | | 7.8 | | | 7.5 | | | 7.9 | | | 7.4 | | | 8.5 |
Foreign Exchange Expense | | 44.5 | | | 56.7 | | | 35.4 | | | (40.3) | | | --- |
Increase in Allowance for Doubtful Accounts | | 65.3 | | | 43.2 | | | 33.1 | | | 71.2 | | | 32.3 |
Sinking Fund Earnings | | (220.0) | | | (230.9) | | | (243.1) | | | (222.5) | | | (228.0) |
Actual Losses Due to Foreign Exchange | | (20.5) | | | (23.7) | | | (76.6) | | | (25.8) | | | |
Decrease in Pension Liability | | (153.3) | | | (70.1) | | | (10.5) | | | (90.6) | | | --- |
Increase (Decrease) in Deferred Revenue | | (15.6) | | | (39.1) | | | 1.7 | | | 6.7 | | | |
Capital Asset Acquisition Charged to Operations | | 154.6 | | | 198.8 | | | 201.0 | | | 233.6 | | | --- |
Proceeds from Disposal of Capital Assets | | (2.1) | | | (2.4) | | | (3.6) | | | (2.0) | | | --- |
Decrease (Increase) in Working Capital | | (75.8) | | | 5.6 | | | 18.1 | | | 124.1 | | | --- |
| | | | | | | | | | | | | | | |
Net Cash from (used in) Operating Activities | | (71.8) | | | 124.0 | | | (146.0) | | | (41.3) | | | (184.8) |
| | | | | | | | | | | | | | | |
Investing Activities | | | | | | | | | | | | | | |
Purchase of Capital Assets | | (154.7) | | | (198.8) | | | (201.0) | | | (233.6) | | | --- |
Proceeds from Disposal of Capital Assets | | 2.0 | | | 2.4 | | | 3.6 | | | 2.0 | | | --- |
(Increase) Decrease in Investments, Loans and Advances | | 34.6 | | | (96.8) | | | 64.5 | | | 57.7 | | | (37.8) |
| | | | | | | | | | | | | | | |
| | | | | | | | | | | | | | |
Net Cash from (used in) Investing Activities | | (118.1) | | | (293.2) | | | (132.9) | | | (173.9) | | | (37.8) |
| | | | | | | | | | | | | | | |
Financing Activities | | | | | | | | | | | | | | |
Cash Proceeds of Funded Debt Issued | | 648.0 | | | 663.2 | | | 1,122.6 | | | 617.7 | | | --- |
Received from Sinking Fund for Redemption of Debentures and Payment of Exchange | | 128.0 | | | 120.6 | | | 171.5 | | | 171.2 | | | --- |
Increase (Decrease) in Obligations under Capital Leases | | (0.7) | | | (28.1) | | | (1.4) | | | (7.8) | | | |
Sinking Fund Installments | | (112.7) | | | (118.4) | | | (112.7) | | | (121.8) | | | --- |
Serial Redemptions and Capital Loan Repayments | | 0.0 | | | 0.0 | | | 0.0 | | | 0.0 | | | --- |
Funded Debt Matured | | (502.0) | | | (335.6) | | | (568.3) | | | (407.5) | | | --- |
Net Cash from Financing Activities | | 160.6 | | | 301.7 | | | 611.7 | | | 251.8 | | | --- |
| | | | | | | | | | | | | | | |
Increase (Decrease) in Cash Position during Year | | (29.3) | | | 132.5 | | | 332.8 | | | 36.6 | | | --- |
Cash Position - Beginning of Year | | (462.8) | | | (492.1) | | | (359.6) | | | (26.8) | | | --- |
Cash Position - End of Year | $ | (492.1) | | $ | (359.6) | | $ | (26.8) | | | 9.8 | | | --- |
| | | | | | | | | | | | | | | |
Cash Represented by | | | | | | | | | | | | | | |
Bank Advances and Short Term Borrowing | $ | (492.1) | | $ | (359.6) | | $ | (26.8) | | | 9.8 | | | --- |
1The Budget Estimates do not include estimates of total borrowing requirements of the Province and New Brunswick Power Corporation. For information with respect to financial requirements of the Province and New Brunswick Power Corporation and with respect to maturing debt of the Province, see "Financing-Financial Requirements", "New Brunswick Power Corporation-Financial Requirements" and "Financing-Funded Debt Maturity Schedule", respectively.
2For further information see Table IV in "Tables and Supplementary Information of the Province."
(---)Denotes no estimate provided.
19
Exhibit "d" Current Province of New Brunswick Description
2004 Budget Estimates
The 2004 Budget projected an increase in net debt of $101.0 million. For the fiscal year ended March 31, 2004 the increase in net debt was $103.2 million. The change of $2.2 million from the Budget Estimates was the result of revenues being $30.7 million lower than budget at $5,479.8 million and expenditures being $28.5 million lower than budget at $5,583.0 million.
Major Sources of Ordinary Account Revenue
The major sources of ordinary account revenue for the Province are payments from the federal government, income taxes, consumption taxes, and property taxes. For the fiscal year ending March 31, 2005, the Province's revenue is estimated at $5,202.1 million, reflecting projected growth of 5.4% from the fiscal year ending March 31, 2004. Overall this represents a projected increase of $267.1 million in revenue. The principal factors that have increased are the following: Federal Payments ($149.8 million), Corporate Income Tax ($38.4 million), Personal Income Tax ($31.4 million), and Other Agencies ($24.4 million).
The following table shows the percentage sources of ordinary account revenue for the four fiscal years ended March 31, 2004 and the Budget Estimates for the fiscal year ending March 31, 2005.
ORDINARY ACCOUNT REVENUE SOURCES
| | Year ended March 31 % | Budget Estimates | Compound Annual Growth Rate |
| | 2001 | 2002 | 2003 | 2004 | 2005 | 2001-05 |
Taxes | | | | | | |
Personal Income | 20.2 | 18.7 | 19.3 | 19.3 | 18.9 | 2.0% | |
Corporate Income | 4.9 | 4.7 | 4.0 | 3.5 | 4.0 | (1.2%) | |
Consumption | 19.7 | 18.8 | 22.2 | 23.1 | 21.8 | 6.2% | |
Property | 6.2 | 6.0 | 6.3 | 6.2 | 6.4 | 4.4% | |
Miscellaneous | 0.6 | 0.6 | 0.7 | 0.9 | 0.7 | 6.3% | |
Total Taxes | 51.6 | 48.8 | 52.5 | 53.0 | 51.8 | 3.7% | |
| | | | | | | | |
Other Revenue | | | | | | | |
Licenses, Permits and Fees | 4.0 | 3.7 | 3.8 | 3.6 | 3.7 | 1.5% | |
Federal Government Payments | 39.2 | 41.1 | 38.7 | 36.9 | 37.8 | 2.8% | |
Other Agencies | 2.8 | 4.3 | 2.9 | 4.3 | 4.6 | 17.0% | |
Miscellaneous | 2.4 | 2.0 | 2.1 | 2.2 | 2.1 | 0.0% | |
Total Revenue | 100.0 | 100.0 | 100.0 | 100.0 | 100.0 | --- | |
Total Ordinary Account Revenue (millions) | $4,508.6 | $4,865.3 | $4,728.3 | $4,935.0 | $5,202.1 | 3.6% | |
Note:
Personal and Corporate Income Taxes. New Brunswick's provincial personal and corporate income taxes are collected and administered by the federal government under a federal-provincial tax collection agreement. For the taxation years up to and including 1999, personal income tax was calculated as a percentage of federal income tax. Effective January 1, 2000, the Province adopted a ‘tax on taxable income' method of calculating provincial personal income tax. This method gave New Brunswick personal income tax policy flexibility to help ensure the tax system addresses the government's social, economic and fiscal objectives.
Due to fiscal pressures, and in order for the government to continue to fund the priorities of the people of New Brunswick such as health care and education, the government made a decision not to index income tax brackets and non-refundable tax credits for the 2004 taxation year. Amounts for the 2004 taxation year remained at 2003 levels.
20
Exhibit "d" Current Province of New Brunswick Description
Provincial Personal Income Tax Rates and Brackets
2003 & 2004 Taxation Years
9.68% on first $32,183
14.82% on $32,183 to $64,368
16.52% on $64,368 to $104,648
17.84% over $104,648 |
In the 2001-02 Budget, the Province introduced a low-income tax reduction. Effective for the 2003 taxation year, New Brunswick's low-income tax reduction was enhanced so that all single tax filers with income up to $12,500 will no longer pay provincial personal income tax. As a result, New Brunswickers who earn income from a full-time job at the current minimum wage and families earning up to $20,000 no longer pay any provincial income tax. As in previous years, eligible low-income families with dependent children may also receive the New Brunswick Child Tax Benefit and the New Brunswick Working Income Supplement, depending upon their income level.
The corporate income tax is calculated as a percentage of corporate taxable income as defined for federal tax purposes. The 2002-2003 Budget reduced the general corporate income tax rate from 16% to 14.5%, effective July 1st, 2002. The 2003-2004 Budget further reduced the general corporate income tax rate from 14.5% to 13%, effective January 1st, 2003. Between 1999 and 2003, the small business corporate income tax rate, which applies to small Canadian controlled private corporations, was reduced from 6% to 3%. In addition, the small business threshold to which this rate applies was increased from the first $200,000 to the first $400,000 of active business income. The 2004-2005 Budget further reduced the small business corporate income tax rate from 3% to 2.5% effective July 1st, 2004. In addition, the 2004-2005 Budget further increased the smal l business threshold to which the rate applies from $400,000 to $425,000, effective July 1st, 2004.
Effective January 1, 2003, New Brunswick's Research and Development (R&D) tax credit was significantly increased and enhanced from a 10% non-refundable tax credit to a 15% refundable tax credit for expenditures that are eligible for the federal Scientific Research and Experimental Development Tax Credit. Also, New Brunswick offers a 40% refundable Film Tax Credit. The credit is applied to eligible wages and salaries paid to New Brunswick residents.
To encourage entrepreneurship and assist small businesses with obtaining equity capital, the government implemented the Small Business Investor Tax Credit effective August 1, 2003. This tax credit provides a 30% non-refundable personal income tax credit of up to $15,000 per year on eligible investments by New Brunswickers made after August 1, 2003. The credit is applied against provincial personal income tax otherwise payable.
Capital Taxes. Effective April 1, 1997, the Province introduced a large corporations capital tax, applied to taxable capital in excess of $5 million at a rate of 0.3%. The Large Corporations Capital Tax applies to the same definition of taxable capital as the federal Large Corporations Tax but does not apply to federally defined financial institutions. For banks, loan companies and trust companies, New Brunswick applies a capital tax on capital assets in excess of $10 million at a rate of 3%. The Province administers the capital tax on financial institutions. Both the Large Corporations Capital Tax and the Financial Corporations Capital Tax are deductible for federal and provincial corporate income tax purposes.
Harmonized Sales Tax. Effective April 1, 1997, New Brunswick eliminated its provincial retail sales tax and adopted a harmonized sales tax (HST) of 15%. The HST is a value-added tax and is composed of the federal 7% goods and services tax (GST) and a provincial component of 8%. The federal government administers the HST. The tax adopts the federal GST base and therefore applies to all goods and services subject to tax under the federal Excise Tax Act.
Under the HST, businesses receive full input tax credits for tax paid on business purchases. As with the federal GST, the HST provides the same tax-free status for certain goods offered under the GST (e.g. basic groceries). In addition, a number of rebates and credits are available. Books receive a point of sale rebate on the 8% provincial portion of the HST. Matching federal rebate programs, the Province provides partial rebates on the provincial portion of the HST for municipalities, charities and non-profit organizations in respect of tax payable that is not otherwise recoverable. New Brunswick also participates in the Foreign Visitor Rebate Program. As well, the Province offers HST rebates to universities for qualifying research and development projects.
21
Exhibit "d" Current Province of New Brunswick Description
Gasoline and Motive Fuel Tax and Tobacco Tax. The provincial gasoline and motive fuel tax rates increased effective December 10th, 2002 from 13.0 to 14.5 cents per litre for gasoline and from 15.4 to 16.9 cents per litre for diesel fuel. To discourage smoking and to help offset the costs that smoking imposes on the health care system, New Brunswick tobacco taxes have increased twice since the last reporting period. On June 18th, 2002, tobacco taxes increased from 7.25 to 9.75 cents per cigarette, from 4.95 to 7.45 cents per tobacco stick and from 3.99 to 6.49 cents per gram of fine cut tobacco. On December 10th, 2002, tobacco taxes were further increased from 9.75 to 11.75 cents per cigarette, from 7.45 to 9.45 cents per tobacco stick and from 6.49 to 8.49 cents per gram of fine cut tobacco.
Property Taxes. New Brunswick levies a provincial real property tax of $1.50 per $100 of assessment on residential property that is not occupied by the owner. A provincial property tax rate of 65 cents per $100 of assessment is applied to owner-occupied residential property in unincorporated areas. The Province also levies a property tax on non-residential property, at a rate of $2.25 per $100 of assessment. In addition to the residential and non-residential property tax rates, the Province applies a cost of assessment levy of 2 cents per $100 of assessment. Municipal/local taxes are imposed to defray the cost of providing local services that are not provided by the Province. In the case of incorporated municipalities, municipal taxes are collected by the Province and are remitted back to the municipality. In unincorporated areas, the local tax is collected and re tained by the Province, as the Province provides and pays for the provision of local services. The Province offers a low-income property tax allowance of up to $200 for families with taxable incomes of $20,000 or under. On behalf of the Office of the Rentalsman, there is also a fee of 5 cents per $100 of assessment imposed on residential property that is not owner-occupied and is not exempt under the Assessment Act.
Federal-Provincial Fiscal Arrangements
The Federal-Provincial Fiscal Arrangements Act was amended in June 2003 to implement the 2003 First Ministers Accord on Health Care Renewal, which provides for increased federal funding in support of health care through the introduction of a Health Reform Transfer (HRT), the one-time 2003 Diagnostic/Medical Equipment Trust (D/MET) and one-time 2003 Canada Health and Social Transfer Supplement.
Fiscal Equalization Payments. New Brunswick is one of eight provinces to receive fiscal equalization payments from the federal government. By addressing relative fiscal disparities, the Equalization Program assists provinces in providing a reasonably comparable level of public services at reasonably comparable levels of taxation. The program is intended to bring the per capita revenue-raising capacity of provinces up to the per capita revenue-raising capacity of the five provinces used as the standard (British Columbia, Manitoba, Ontario, Quebec and Saskatchewan). New Brunswick's equalization payment for the fiscal year ended March 31, 2003 was $1,146.9 million and for the fiscal year ending March 31, 2004 was $1,089.3 million. Fiscal equalization payments accounted for 24.3% of total ordinary revenue for the fiscal year ended March 31, 2003 and 22.1% of the total ordinary re venue for the fiscal year ending March 31, 2004.
Canada Health and Social Transfer. The federal government provides federal transfers in support of health care, post-secondary education, social assistance and services, early childhood development and early learning and child care to provinces and territories. The primary funding vehicles are the Canada Health and Social Transfer (CHST), and starting in 2003-04, the HRT, both of which provide for annual funding. Various one-time funds have been established over the past five years: the 1999, 2000, and 2003 CHST Supplement Trusts, the 2000 Medical Equipment Trust (MET), and the D/MET, under which Provinces can draw down their share as they see fit over the designated time period. The Province's CHST revenue for the fiscal year ended March 31, 2003 was $498.9 million, and includes funding from the 2000 CHST Supplement Trust. In addition, there was $12.3 million in revenue related to funding from the 2000 MET. Together, these revenues accounted for 10.8% of total ordinary revenue for the fiscal year ended March 31, 2003. CHST revenue was $521.5 million for the fiscal year ended March 31, 2004, including funding from the 2000 and 2003 CHST Supplement Trusts. The Province's HRT revenue for the fiscal year ended March 31, 2004 was $23.7 million. In addition, there was $12.2 million in revenue related to funding from the 2003 D/MET. Together, these revenues total $557.4 million and account for 11.3% of the total ordinary revenue for the fiscal year ending March 31, 2004.
Fiscal Stabilization Program. Under the Fiscal Stabilization Program, the federal government may make unconditional payments to a province when total revenues of that province, as per the federal definition, fall short of the previous years total due to a downturn in economic activity.
Revenue Guarantee Program. The Revenue Guarantee Program guarantees cash payments to a province if federal income tax changes result in a 1% or greater decline in that province's personal income tax base. This program is under review, given the move by provinces from "tax on tax" to "tax on income" method of calculating provincial personal income tax.
22
Exhibit "d" Current Province of New Brunswick Description
Major Ordinary Account Expenditure
For the fiscal year ending March 31, 2004 the Province's actual ordinary expenditure was $5,036.8 million, 2.86% higher than the actual ordinary expenditures for the fiscal year ended March 31, 2003. The net increase of $140.4 million is a result of various increases including funding for health care and wage settlements. These were offset by decreases in the cost of service of the public debt.
The following table shows the percentage distribution of ordinary account expenditure for the four fiscal years ended March 31, 2004 and the Budget Estimates for the fiscal year ending March 31, 2005.
ORDINARY ACCOUNT EXPENDITURE DISTRIBUTION |
| | | | | | | | | | | | | | | | | |
| | | | Fiscal Year Ended March 31, | | |
| | | | | | | | | | | | | | | Budget | |
| | | | | | | | | | | | | | | Estimates | |
| | | | 2001 | | | 2002 | | | 2003 | | | 2004 | | | 2005 | |
| | | | | | | | | | | | | | | | | |
Economic Development | | | 2.8 | % | | 3.0 | % | | 2.3 | % | | 2.6 | % | | 2.4 | % |
Education | | | 18.0 | | | 18.3 | | | 19.7 | | | 19.9 | | | 19.2 | |
Employment Development & Labour | | | 4.4 | | | 4.1 | | | 3.9 | | | 3.9 | | | 3.8 | |
Family and Community Services | | | 14.3 | | | 14.1 | | | 14.2 | | | 14.1 | | | 14.0 | |
Health | | | 28.1 | | | 28.8 | | | 30.0 | | | 31.1 | | | 31.6 | |
Protection Services | | | 2.7 | | | 2.6 | | | 2.7 | | | 2.7 | | | 2.6 | |
Resource Sector | | | 3.0 | | | 2.7 | | | 2.7 | | | 2.8 | | | 2.7 | |
Transportation | | | 3.2 | | | 3.1 | | | 3.3 | | | 3.0 | | | 2.8 | |
Central Government | | | 9.5 | | | 9.8 | | | 7.8 | | | 8.3 | | | 9.2 | |
Service of the Public Debt | | | 14.0 | | | 13.5 | | | 13.4 | | | 11.6 | | | 11.7 | |
Total | | | 100.0 | % | | 100.0 | % | | 100.0 | % | | 100.0 | % | | 100.0 | % |
Total Expenditure in Millions | | $ | 4,562.7 | | $ | 4,832.9 | | $ | 4,896.4 | | $ | 5,036.8 | | $ | 5,103.8 | |
Economic Development. The Economic Development expenditure of $122.3 million represents 2.4% of the total budgeted expenditure for the fiscal year ending March 31, 2005 and is made up of the Departments of: Business New Brunswick ($37.1 million), the Regional Development Corporation ($41.1 million), Tourism and Parks ($24.1 million); and a portion of General Government ($20.0 million).
Education. Operating expenses of elementary and secondary schools are paid by the Province. For the fiscal year ending March 31, 2005, expenditure on education for public schooling is estimated at $793.7 million, 15.5% of total budgeted expenditure. The Province also pays operating grants to universities estimated at $185.0 million, 3.6% of total budgeted expenditure, for the fiscal year ending March 31, 2005.
Employment Development & Labour. The Employment Development and Labour expenditure of $194.2 million represents 3.8% of the total budgeted expenditure for the fiscal year ending March 31, 2005 and is made up of the Departments of Training and Employment Development ($193.6 million) and a portion of General Government ($.6 million).
Family and Community Services. The Province provides an income security program which includes payments to social assistance clients, the disabled, and residents of special care homes. Funds are also budgeted for exit-related programs. In addition, the Province assists individuals and families in the acquisition and/or retention of suitable accommodations for reasonable and affordable cost. For the fiscal year ending March 31, 2005, the Province budgeted $712.1 million for Income Assistance, 13.9% of total budgeted expenditure.
Health. The Province pays the operating expenses of approved public hospitals to cover the cost of hospital services supplied by such hospitals. The Province also operates a comprehensive medical services payment plan (Medicare), which covers the costs of eligible medical services incurred by registered residents. For the fiscal year ending March 31, 2005, expenditure on health services is estimated at $1,612.2 million, 31.6% of total budgeted expenditure.
23
Exhibit "d" Current Province of New Brunswick Description
Protection Services. The Protection Services expenditure of $131.7 million represents 2.6% of total expenditure budgeted for the fiscal year ending March 31, 2005 and is made up of the Department of Justice ($42.0 million), the Department of Public Safety ($89.2 million) and a portion of General Government ($.5 million).
Resource Sector. The Resource Sector expenditure of $138.0 million represents 2.7% of the total budgeted expenditure for the fiscal year ending March 31, 2005 and is made up of the Department of Agriculture, Fisheries and Aquaculture ($28.5 million), a portion of Environment and Local Government ($16.7 million), Natural Resources ($90.6 million), Department of Energy ($1.9 million) and a portion of General Government ($.3 million).
Transportation. For the fiscal year ending March 31, 2005, the Province budgeted $141.3 million for the planning, design and maintenance of highways and the operation of ferry services. This represents 2.8% of the total budgeted expenditure.
Central Government. The Central Government expenditure of $469.3 million estimated for the fiscal year ending March 31, 2005 represents 9.2% of total budgeted expenditure and is made up of expenditures of the Department of Finance ($73.9 million), the Department of Supply and Services ($90.0 million), a portion of Environment and Local Government ($38.5 million), General Government ($231.2 million) and other central agencies ($35.7 million).
Service of the Public Debt. For the fiscal year ending March 31, 2005, the estimate of $604.0 million for servicing the debt of the Province, including interest, foreign exchange, amortization and other debt management expenses, represents 11.8% of the total budgeted expenditure.
Net Capital Expenditures
Expenditures for physical assets are financed primarily by borrowing, and are charged to operations as incurred. The following table shows the percentage distribution of gross capital expenditure for the four fiscal years ended March 31, 2004 and the Budget Estimates for the fiscal year ending March 31, 2005. The table also shows the total amounts of recoveries through cost-sharing agreements.
CAPITAL EXPENDITURE DISTRIBUTION |
| | | | | | | | | | | | | | | | |
| | Fiscal Year Ended March 31, | |
| | | | | | | | | | | | | | | Budget | |
| | | | | | | | | | | | | | | Estimates | |
| | | 2001 | | | 2002 | | | 2003 | | | 2004 | | | 2005 | |
| | | | | | | | | | | | | | | | |
| Highways | | 52.8 % | | | 52.9 % | | | 59.6 % | | | 63.4 % | | | 56.5 % | |
| Bridges | | 8.6 | | | 8.2 | | | 6.8 | | | 7.5 | | | 9.0 | |
| Schools | | 21.9 | | | 17.0 | | | 13.7 | | | 12.3 | | | 12.5 | |
| Hospitals | | 5.4 | | | 6.0 | | | 5.2 | | | 8.9 | | | 14.6 | |
| Land Purchase | | | | | | | | | | | | | | | |
| Other Public Buildings | | 5.2 | | | 6.6 | | | 7.5 | | | 2.8 | | | 2.4 | |
| Other | | 6.1 | | | 9.3 | | | 7.2 | | | 5.1 | | | 5.0 | |
| Total | | 100.0 % | | | 100.0 % | | | 100.0 % | | | 100.0 % | | | 100.0 % | |
| | | | | | | | | | | | | | | | |
| Total Expenditure (millions) | $ | 153.1 | | $ | 202.9 | | $ | 250.0 | | $ | 285.7 | | $ | 368.8 | |
| Total Recoveries (millions) | $ | 11.2 | | $ | 19.9 | | $ | 42.7 | | $ | 52.6 | | $ | 44.1 | |
| | | | | | | | | | | | | | | | |
| Net Capital Expenditure (millions) | $ | 141.9 | | $ | 183.0 | | $ | 207.3 | | $ | 233.1 | | $ | 324.7 | |
Capital recoveries for the fiscal year ending March 31, 2005 are estimated at $44.1 million, of which $43.2 million are recoveries from the Federal Government. As of March 31, 2004, the Province and the federal government had entered into 28 cost-sharing agreements for Economic Development. All of these agreements have expired as of March 31, 2004, involving expenditures in excess of $1,105.9 million of which the federal government will contribute a total of approximately 65.2%.
24
Exhibit "d" Current Province of New Brunswick Description
Included in this expenditure is the Regional Economic Development Agreement totaling $104.5 million which has a two-year pay-out period ending March 31,2005.
During the fiscal year ended March 31, 1999, an amendment was made to the Highway Improvement Program providing for expenditures of $300.0 million of which the federal government will contribute 50%. As of March 31, 2004 the Province had $297.6 million in shareable expenditures and recovered $148.8 million from the federal government.
During the fiscal year ended March 31,2003, an agreement was signed under the Strategic Highway Infrastructure Program for $29.2 million of which the federal government will contribute 50%. As of March 31, 2004, the Province had $11.4 million in shareable expenditures and recovered $5.7 million from the federal government.
During the fiscal year ended March 31,2004, an agreement was signed under the Strategic Infrastructure Fund for $400.0 million of which the federal government will contribute 50%. As of March 31, 2004, the Province had $15.4 million in shareable expenditures and recovered $7.7 million from the federal government.
Special Purpose Account
Special purpose account revenue is all revenue designated for special purpose by donor trust funds or by legislation. For the fiscal year ending March 31, 2005, such revenue is estimated to be $38.3 million and expenditures from the various accounts are estimated to be $37.9 million for a surplus of $0.4 million.
Special Operating Agencies
Revenue may be generated by the Special Operating Agencies or from transfers from other budgetary accounts. Expenditures are incurred by the agencies in delivering the programs they offer and may be of a capital or operating nature. For the fiscal year ending March 31, 2005, revenue is estimated at $203.1 million from the various agencies and expenditures at $192.4 million for a surplus of $10.7 million.
Loans and Advances
The Province has followed a policy of promoting economic development through the provision of financial assistance to industry. Such assistance has been channeled principally through the Department of Business New Brunswick, the Department of Family and Community Services and Provincial Holdings Ltd. and may take the form of repayable loans, guarantees of bank loans and bond issues and equity investments. Funds required for repayable loans and advances are appropriated annually by the Legislative Assembly and are included in the Province's annual borrowing requirements. Allowances for doubtful or uncollectable amounts are reviewed annually and the net balances of loans and advances less allowances are reflected in the Province's accounts. See "Tables and Supplementary Information of the Province--Table V" for information concerning loans and advances for the four fiscal years en ded March 31, 2004 and the Budget Estimates for the fiscal year ending March 31, 2005.
Business New Brunswick. The Minister of Business New Brunswick is responsible for assistance provided under the Economic Development Act, the Agricultural Development Board and the Fisheries Development Act:
The Economic Development Act authorizes the Minister to provide financial assistance to aid and encourage the establishment or development of industry on such terms and conditions as are specified by the Lieutenant-Governor in Council. At March 31, 2004 loans and guarantees under the Economic Development Act amounted to approximately $248.9 million. The allowance for doubtful accounts on these loans and guarantees amounted to $87.1 million.
The Agriculture Development Board provides aid to farmers and farm-related businesses by way of loans, grants and loan guarantees to increase income and employment in rural areas of the Province. At March 31, 2004 loans and guarantees outstanding were $23.3 million. The allowance for doubtful accounts totaled $16.3 million.
The Fisheries Development Act provides financial assistance mainly by way of direct loans of fishermen to purchase and operate fishing vessels and equipment. At March 31, 2004, loans and guarantees outstanding amounted to $55.3 million. The allowance for doubtful accounts totaled $44.0 million.
Family and Community Services. The Department of Family and Community Services carries out the Government's housing policies. Loans are issued pursuant to the New Brunswick Housing Act. At March 31, 2004 loans under the New
25
Exhibit "d" Current Province of New Brunswick Description
Brunswick Housing Act amounted to $32.7 million. The allowance for doubtful accounts on these loans totaled $2.5 million. In accordance with the recommendations of the Canadian Institute of Chartered Accountants, loans that will be repaid through future Provincial appropriations were expensed at the time of issue.
Provincial Holdings Ltd. Provincial Holdings Ltd. ("PHL") is a New Brunswick company, which the Province uses to invest in the equity of industrial enterprises that are based in the Province. "PHL" is wholly-owned by the Province, and at March 31, 2004, $6.7 million had been advanced to "PHL" by the Province. The allowance for doubtful accounts on the loans to "PHL" totaled approximately $2.3 million.
26
Exhibit "d" Current Province of New Brunswick Description
FINANCING
Borrowing Requirements
The following table provides information on the Province's ordinary account deficit or surplus, deficit or surplus from operations and increase or decrease in net debt for the four fiscal years ended March 31, 2004 and the Budget Estimates for the fiscal year ending March 31, 2005.
INCREASE (DECREASE) IN NET DEBT
| | | |
Year Ended March 31, (millions) |
| | | |
| | | | | | | | | | | | Budget Estimates |
| | | | 2001 | | 2002 | | 2003 | | 2004 | | 2005 |
| | | | | | | | | | | | |
Ordinary Account Revenue | | $ | 4,508.6 | $ | 4,865.3 | $ | 4,838.7 | $ | 5,039.2 | $ | 5,202.1 |
Ordinary Account Expenditure | | | 4,562.7 | | 4,832.9 | | 4,896.4 | | 5,036.8 | | 5,103.8 |
(Surplus) Deficit on Ordinary Account | | | 54.0 | | (32.4) | | 57.7 | | (2.4) | | (98.3) |
| | | | | | | | | | | | |
Capital Account Expenditure | | | 153.1 | | 202.9 | | 250.0 | | 285.7 | | 368.8 |
Capital Account Recoveries | | | 11.2 | | 19.9 | | 42.7 | | 52.6 | | 44.1 |
Net Capital Expenditure | | | 141.9 | | 183.0 | | 207.3 | | 233.1 | | 324.7 |
| | | | | | | | | | | | |
Special Purpose Account Revenues | | | 41.5 | | 38.3 | | 39.6 | | 40.7 | | 38.3 |
Special Purpose Account Expenditures | | | 34.8 | | 34.7 | | 31.6 | | 36.5 | | 37.9 |
(Surplus) Deficit on Special Purpose Account | | | (6.7) | | (3.6) | | (8.0) | | (4.2) | | (0.4) |
| | | | | | | | | | | | |
Special Operating Agency Revenues | | | 170.1 | | 187.9 | | 212.8 | | 207.4 | | 203.2 |
Special Operating Agency Expenditures | | | 164.1 | | 190.5 | | 204.3 | | 202.9 | | 199.5 |
(Surplus) Deficit on Special Operating Agency | | | (6.0) | | 2.6 | | (8.6) | | (4.5) | | (3.7) |
| | | | | | | | | | | | |
Sinking Fund Earnings | | | (220.0) | | (230.9) | | (243.0) | | (222.5) | | (228.0) |
| | | | | | | | | | | | |
Adjustments on Consolidation | | | (106.5) | | (96.2) | | 124.5 | | 103.6 | | 3.3 |
| | | | | | | | | | | | |
| | | | | | | | | | | | |
| | | | | | | | | | | | |
Increase (Decrease) in Net Debt | | $ | (143.3) | $ | (178.4) | $ | 109.4 | $ | 103.2 | $ | (2.4) |
| | | | | | | | | | | | |
Net loans and advances, sinking fund installments and the difference between the cash contributions made to the pension funds and the amounts expensed according to CICA recommendations as well as several other relatively small items are not included since they are non-budgetary items. Borrowing requirements associated with the budget and the aforementioned items for the fiscal year ended March 31, 2004 were $344.9 million and for the fiscal year ending March 31, 2005 are estimated at approximately $361.0 million.
27
Exhibit "d" Current Province of New Brunswick Description
Non-Public Borrowing
The Province has borrowed from one non-public source, the Canada Pension Plan ("CPP").
The CPP is a compulsory national pension plan in which all provinces other than Quebec participate. When the Plan generates surpluses, the excess funds are invested in capital markets. In the past, funds were invested in non-marketable securities issued by participating provinces, provincially guaranteed Crown Corporations and the federal government at a rate based on the federal government's long-term public market borrowing costs. Changes to CPP legislation in 1998 allowed for new funds flowing into the CPP to be invested in domestic and foreign equities and for provincial bonds previously issued to the CPP Investment Fund to be rolled over upon maturity on a one-time basis at a cost equal to the respective province's market rate. At March 31, 2004, New Brunswick had outstanding borrowings from the CPP Investment Fund of $834.3 million.
Public Borrowing
At March 31, 2004, the Province had outstanding borrowings for Provincial purposes from non-federal sources totaling $7,651.5 million through the issue and sale of debentures and notes, such securities being denominated in Canadian dollars, U.S. dollars, Japanese yen and Swiss francs. Not included in this amount is $3,098.0 million borrowed on behalf of New Brunswick Power Corporation.
Trend and Distribution of Borrowing
The trend and distribution of the amounts and sources of the Province's annual debt financing over the past five fiscal years is shown below:
SOURCES OF FUNDS 1
| | Year ended March 31, |
Public Borrowing | Non-Public Borrowing Canada Pension Plan |
Total Borrowing |
| | | | | | |
| | | | (millions) |
| | 2000 | | $550.0 | $46.9 | $596.92 |
| | 2001 | | 600.0 | 53.0 | 653.03 |
| | 2002 | | 600.0 | 74.8 | 674.84 |
| | 2003 | | 1,050.2 | 73.2 | 1,123.45 |
| | 2004 | | 551.9 | 71.2 | 623.16 |
| | | | | | |
| | | | $3,352.1 | $319.1 | $ 3,671.2 |
1Debt securities payable in foreign currencies are expressed as the Canadian dollar equivalent at the time of issue.
2 In addition, $50.0 million was borrowed on behalf of New Brunswick Power Corporation.
3 In addition, $300.0 million was borrowed on behalf of New Brunswick Power Corporation.
4 In addition, $300.0 million was borrowed on behalf of New Brunswick Power Corporation.
5 In addition, $741.8 million was borrowed on behalf of New Brunswick Power Corporation.
6 In addition, $296.7 million was borrowed on behalf of New Brunswick Power Corporation.
Between April 1, 2004 and December 15, 2004, the Province borrowed $615.2 million. Of this amount, $300.0 million was advanced to New Brunswick Power Corporation.
Growth of Funded Debt
The following tables illustrate the rate of change of the Province's outstanding Provincial purpose funded debt and present certain ratios relating that growth to economic indicators. The following tables do not include $50 million borrowed during the fiscal year 2000, $300.0 million borrowed during the fiscal year 2001, $300.0 million borrowed during the fiscal year 2002, $741.8 million borrowed during the fiscal year 2003, and $296.7 million borrowed during the fiscal year 2004 on behalf of New Brunswick Power Corporation.
28
Exhibit "d" Current Province of New Brunswick Description
The Province is required by legislation to pay annually into a sinking fund the Canadian currency equivalent of not less than 1% of all Provincial purpose funded debt. The Province's current policy is to pay 1.5% of Provincial purpose funded debt annually into the sinking fund. Sinking fund installments are invested in approved securities including direct and guaranteed obligations of the Province. Interest earned on such investments is added to the sinking fund and is reinvested in approved securities. At March 31, 2004 the value of the sinking fund applicable to debt issued for Provincial purposes amounted to $3,716.2 million. For the fiscal year ended March 31, 2004, earnings on investments amounted to $222.5 million.
OUTSTANDING NET PROVINCIAL PURPOSE FUNDED DEBT AND CAPITAL LOANS
Gross Provincial Purpose Funded Debt1 Denominated in millions |
At March 31, |
Cdn Dollars |
US Dollars |
Japanese Yen |
Swiss Francs | |
Total2 | Value of Sinking Funds | | Net Provincial Purpose Funded Debt | Change over previous year % |
2000 | $5,679.0 | $933.5 | ¥12,000.0 | Sfr230.0 | | $7,408.5 | $2,925.5 | | $4,483.0 | (0.4) |
2001 | 5,956.2 | 933.5 | 10,872.0 | 100.0 | | 7,656.2 | 3,130.2 | | 4,526.0 | 1.0 |
2002 | 6,305.4 | 933.5 | 9,744.0 | 100.0 | | 8,004.7 | 3,358.8 | | 4,645.9 | 2.6 |
2003 | 6,270.4 | 747.5 | 8,616.0 | 100.0 | | 8,418.7 | 3,543.0 | | 4,875.7 | 4.9 |
2004 | 7,396.9 | 747.5 | 0.0 | 100.0 | | 8,485.8 | 3,716.2 | | 4,769.6 | (2.2) |
1Debt securities issued in foreign currencies, which have been hedged are reported in the currency into which they have been hedged at the rates of exchange established by such hedges.
2
Debt securities payable in foreign currencies are expressed as the Canadian dollar equivalent at fiscal year-end rates of exchange or, where hedges are in place, at the rates of exchange established by such hedges.
COMPARATIVE DEBT STATISTICS1 |
| | | (millions) |
| | |
| | | | | | | |
| | | 2000 | 2001 | 2002 | 2003 | 2004 |
| | | | | | | |
Gross Domestic Product at market prices | | $19,041 | $20,085 | $20,689 | $21,168 | $22,425 |
Personal Income | | 16,635 | 17,434 | 17,786 | 18,251 | 18,802 |
Ordinary Revenue | | 4,416 | 4,509 | 4,865 | 4,839 | 5,039 |
Net Funded Debt | | 4,483 | 4,526 | 4,646 | 4,876 | 4,770 |
As % of Gross Domestic Product | | 23.5 | 22.5 | 22.5 | 23.0 | 21.3 |
As % of Personal Income | | 26.9 | 26.0 | 26.1 | 26.7 | 25.4 |
As % of Ordinary Revenue | | 101.5 | 100.4 | 95.5 | 100.8 | 94.7 |
1The figures for Ordinary Revenue and Net Funded Debt are for the fiscal year ended March 31. The figures for GDP and Personal Income are for the calendar year ended December 31 of the previous year.
29
Exhibit "d" Current Province of New Brunswick Description
PROVINCIAL PURPOSE FUNDED DEBT MATURITY SCHEDULE
For Securities Outstanding at March 31, 2004 (denominated in millions1) |
| | | Total |
| | Canadian | United States | | Swiss | Canadian |
Year ending March 31, | Dollars | Dollars | | Francs | Dollars2 |
2005 | $284.5 | US$ 247.5 | | Sfr --- | $613.7 |
2006 | 246.1 | 150.0 | | --- | 442.7 |
2007 | 760.5 | --- | | 100.0 | 764.9 |
2008 | 537.3 | --- | | --- | 537.3 |
2009 | 861.3 | --- | | --- | 861.3 |
| | | | | | |
2005-09 | 2,589.6 | 397.5 | | 100.0 | 3,219.8 |
2010-14 | 3,088.2 | 200.0 | | --- | 3,350.3 |
2015-19 | 600.0 | --- | | --- | 600.0 |
2020-24 | 319.1 | 150.0 | | --- | 515.7 |
2025-29 | 500.0 | --- | | --- | 500.0 |
2030-34 | 300.0 | --- | | --- | 300.0 |
| | | | | | |
| | $7,396.9 | US$747.5 | | Sfr100.0 | $8,485.8 |
1
Debt securities issued in foreign currencies, which have been hedged, are reported in the currency into which, they have been hedged at the rates of exchange established by such hedges.
2
Debt securities payable in foreign currencies are expressed as the Canadian dollar equivalent at the fiscal year-end rates of exchange or, where hedges are in place, at the rates of exchange established by such hedges.
Between April 1, 2004 and December 15, 2004, the Province borrowed $615.2 million. Of this amount, $300.0 million was advanced to New Brunswick Power Corporation. The preceding table does not include these amounts.
Unfunded Debt
Because the Province follows an accrual accounting system, expenditures are allocated to the year in which they were incurred regardless of the date of payment resulting in the establishment of accounts payable and accrued liabilities. Such unfunded debt is not secured by debt instruments.
At March 31, 2004, the Province's unfunded debt was as follows:
UNFUNDED DEBT
| | | At March 31, 2004 |
| | | (millions) |
Bank Advances and Short Term Borrowing | | $831.3 | |
Trust Deposits | | 45.8 | |
Accounts Payable | | 658.5 | |
Accrued Expenditures | | 780.4 | |
Deferred Revenue | | 294.5 | |
Total Unfunded Debt | | $2,610.7 | |
This unfunded debt is partially offset by assets of the Province in the amount of $1,820.0 million, represented by $841.1 million of cash and short term investments, $357.8 million of accounts and interest receivable, $466.6 million of taxes receivable, $43.3 million of inventories and $111.2 million of prepaid and deferred charges.
30
Exhibit "d" Current Province of New Brunswick Description
Contingent Liabilities
The following table summarizes outstanding contingent liabilities at March 31, 2004 with comparable numbers for March 31, 2003:
CONTINGENT LIABILITIES |
| | | | At March 31, |
| | | | 2003 | 2004 |
| | | | (millions) |
| | | | | |
Bank Loans | | | | |
| | Under Various Acts | | $246.7 | $339.3 |
| | | | | |
| | Less: Provision for Possible Losses | | 50.2 | 75.8 |
| | | | | |
Total Contingent Liabilities | | | $196.5 | $263.5 |
| | | | | |
Due to the adoption of the definition of the Reporting Entity recommended by the Public Sector Accounting and Auditing Board of the CICA, guarantees associated with the debt of New Brunswick Power Corporation and the New Brunswick Municipal Finance Corporation are not included in the previous table. These guarantees are as follows:
| | | | At March 31, |
| | | | 2003 | 2004 |
| | | | (millions) |
Bonds, Debentures and Notes | | | |
| | New Brunswick Power Corporation¹ | | $ 125.0 | $ 125.0 |
| | New Brunswick Municipal Finance Corporation | | 386.7 | 421.4 |
| | | | | |
Loans from Northern Canada Power Commission to New Brunswick Power Corporation | | 6.8 | 5.5 |
| | | | 518.5 | 551.9 |
| | Less: Sinking Funds | | 35.7 | 39.5 |
| | | | | |
| | | | 482.8 | 512.4 |
| | Accrued Interest¹ | | 12.1 | 12.3 |
| | | | | |
Total | | | $ 494.9 | $ 524.7 |
1Foreign denominated debt plus accrued interest are expressed as the Canadian dollar equivalent at fiscal year-end rates of exchange.
Debt Record
The Province has always paid promptly when due the full amount of the principal, redemption premium, if any, and interest on every direct obligation issued by it and every indirect obligation on which it has been required to implement its guarantee, all in the lawful currency of the country where payable at the time of payment thereof, subject during wartime to any applicable restrictions of laws and regulations forbidding trading with the enemy.
31
Exhibit "d" Current Province of New Brunswick Description
CONSOLIDATION OF NEW BRUNSWICK PUBLIC SECTOR DEBT
Other than the Province, New Brunswick Power Corporation, New Brunswick Municipal Finance Corporation and municipalities are the only public sector entities with outstanding debt. Municipalities, with the exception of the City of Saint John, are required to obtain approval from the Provincial Government before borrowing money for capital expenditures.
CONSOLIDATED FUNDED DEBT OF THE NEW BRUNSWICK PUBLIC SECTOR
(millions)
| | | | | |
Province of New Brunswick | | | | |
| | Funded Debt | | | $ 8,485.8 |
| | Less: Sinking Funds | | | 3,716.2 |
| | | | | 4,769.6 |
Municipalities | | | | |
| | Funded Debt | | | 421.4 |
| | | | | |
| | | | | |
Total Public Sector Debt | | | | $ 5,191.0 |
Information in the foregoing table relative to the Province is at March 31, 2004 and information relative to municipalities is the amount outstanding at December 31, 2003. The figures for the Province do not include contingent liabilities of the Province in respect of its guarantees of obligations of New Brunswick Power Corporation ($91.0 million net of sinking funds of $39.5 million). Also excluded is $2,734.3 million (net of sinking funds of $363.7 million) borrowed by the Province on behalf of New Brunswick Power Corporation. This debt is paid out of the operating revenues of New Brunswick Power Corporation rather than out of Provincial revenues. Between April 1, 2004 and December 15, 2004, the Province borrowed $615.2 million. Of this amount, $300.0 million was advanced to New Brunswick Power Corporation.
PUBLIC SECTOR PENSION LIABILITIES
The Public Service Superannuation Act establishes a plan under which pensions are paid to most government employees and to certain employees of boards or institutions affiliated with the Province or their surviving spouses and minor dependents. Employees contribute approximately 6.15% on average of their salaries into the Public Service Superannuation Fund (PSSF). Approximately 10,030 active Provincial employees are making contributions. The Province and other designated employers are required to contribute into the PSSF an amount that is necessary, in addition to employee contributions, to cover current service cost. If at any time the PSSF is unable to satisfy all pension liabilities, the deficiency will be met out of the ordinary revenue of the Province. The Province contributed $44.0 million as the employer portion of current service cost for the year ending March 31, 2004. &nb sp;The Province will contribute approximately $37.4 million for current service cost for the fiscal year ending March 31, 2005. The market value of the PSSF was 2,685.3 million as of March 31, 2004.
As the result of the PSSA's April 1, 2002 actuarial valuation for funding purposes, the Province of New Brunswick and three other designated employers will begin making special payments to reduce the $281.6 million unfunded liability. The Province's share of the special payments will be $39.3 million while the three designated employers will collectively contribute $10.7 million in the fiscal year ending March 31, 2005.
The Teachers' Pension Act establishes a plan for the payment of pensions to retired teachers or their surviving spouses and minor dependents. Teachers covered contribute approximately 7.35% on average of their salaries into the Teachers' Pension Fund (TPF). Approximately 7,880 active employees are making contributions. The Province is required to match employee contributions. If at any time the TPF is unable to satisfy all pension liabilities, the deficiency will be met out of the ordinary revenue of the Province. The Province contributed $31.4 million as the employer portion of current service cost for the year ended March 31, 2004. The Province will contribute approximately $31.5 million for the fiscal year ending March 31, 2005. The market value of the TPF was $3,099.6 million as of March 31, 2004.
As the result of the Teachers' April 1, 2003 actuarial valuation for funding purposes, the Province of New Brunswick will begin making special payments to reduce the $748.0 million unfunded liability. The special payments will be $72.6 million in the fiscal year ending March 31, 2005 ($69 million in the fiscal year ending March 31, 2004).
32
Exhibit "d" Current Province of New Brunswick Description
As of April 1, 2004, the actuarial pension liabilities using accounting assumptions were $39.2 million and $154.0 million for the Public Service Superannuation Plan and Teachers' Pension Plan, respectively.
Significant actuarial assumptions used for the purposes of financial statements were:
Short Term
Long Term
Salary escalation rate………………………………………..…….2.0% to 3.0%
4.0%
Real rate of return………………………………………………… 4.25%
4.25%
Inflation…………………………………………………………....2.0% to 3.0%
3.50%
The financial statements for the Province of New Brunswick report pension liabilities for the Public Service Superannuation Plan and the Teachers' Pension Plan of $20.8 million and $124.6 million, respectively as of March 31, 2004. The primary difference between the actuarial pension liabilities and the liabilities per the financial statements is that accounting standards require that experience gains be amortized over the estimated average remaining service life of the employees.
The Province sponsors three separate School District pension plans totaling $245.5 million in assets. The Plans have December 31 year-ends. The total surplus is approximately $35.1 million on an actuarial basis and $19.7 million on an accounting basis. If at any time these plans are found to be deficient, the Province is required to contribute an amount sufficient to fully fund the obligations.
The Province sponsors pension plans for Provincial court judges, Members of the Legislative Assembly and the Ombudsman. Collectively they have a total actuarial unfunded liability of $41.9 million and an accounting unfunded liability of $51.4 million as of March 31, 2004.
The Province also contributes to the Pension Plan of Certain Bargaining Employees of New Brunswick Hospitals, C.U.P.E. Employees of New Brunswick Hospitals and the Pension Plan for Part-time and Seasonal Employees. The Province contributes a fixed percentage of an employees' wages, and has no further financial obligation.
New Brunswick Investment Management Corporation
In 1996, legislation was proclaimed establishing the New Brunswick Investment Management Corporation. The corporation acts as trustee for the Public Service Superannuation Fund, the Teachers' Pension Fund and the Provincial Court Judges' Pension Fund.
33
Exhibit "d" Current Province of New Brunswick Description
NEW BRUNSWICK POWER CORPORATION
New Brunswick Power Corporation ("NB Power"), formerly The New Brunswick Electric Power Commission, was established in 1920 under the Electric Power Act, which provides that NB Power is an agent of the Crown in right of the Province of New Brunswick. The Electric Power Act states that the objective of NB Power shall be "to provide for the continuous supply of energy adequate for the needs and future development of the province and to promote economy and efficiency in the generation, distribution, supply, sale and use of power". At March 31, 2004, NB Power operated six hydro-electric plants with a combined net generating capacity of 884 megawatts, one CANDU nuclear plant at Point Lepreau with a net generating capacity of 635 megawatts, five thermal plants with a combined net generating capacity of 1,923 megawatts and three combustion turbine plants with a combined net generating capacity of 327 megawatts. NB Power has a total net generating capacity of 3,769 megawatts and its gross generation constitutes 90% of the gross generating capacity in the province.1 Gross investment in all plants at March 31, 2004, was $3,742 million.
At March 31, 2004, NB Power maintained 6,689 kilometers of transmission lines and 19,803 kilometers of distribution lines, representing a gross investment of $284 million and $709 million, respectively. NB Power also had an investment of $428 million in terminals and substations.
Interconnections
NB Power has developed extensive interconnection facilities to take advantage of its favorable geographic position between the two very large electric power systems in Quebec and New England and the other two Maritime Provinces. At March 31, 2004 interconnection capacity was as follows:
INTERCONNECTION CAPACITY | |
| Utility System | | Megawatts | |
| | | |
| Quebec | | 1,100 | |
| New England | | 810 | |
| Nova Scotia | | 500 | |
| Prince Edward Island | | 200 | |
| | | |
| Total | | 2,610 | |
NB Power exports energy to Northern Maine and to New England pursuant to export permits from the National Energy Board expiring in the 2006-2019 period.
Competition and Deregulation
In April 2003 the Government of New Brunswick passed a new Electricity Act to restructure the New Brunswick electricity sector from the current monopoly structure to a more competitive environment. Pursuant to this Act, effective October 1, 2004, NB Power was restructured into five successor corporations; New Brunswick Power Holding Corporation ("Holdco") and four subsidiary companies - New Brunswick Power Generation Corporation ("Genco"), New Brunswick Power Nuclear Corporation ("Nuclearco"), New Brunswick Power Transmission Corporation ("Transco"), and New Brunswick Power Distribution and Customer Service Corporation ("Disco"). Holdco will provide corporate services to the subsidiaries. The new subsidiary companies will operate on a commercial basis and over time will be required to:
earn a positive rate of return on equity
pay a cash dividend to the Province of New Brunswick
pay the equivalent of income and capital taxes
borrow funds without a provincial government guaranty2
1 Gross generating capacity for the Province is based on 2002 Statistics Canada figures.
2 New Brunswick Power Nuclear Corporation will remain an Agent of the Crown and its debt will continue to be guaranteed by the Province of New Brunswick.
34
Exhibit "d" Current Description of Province of New Brunswick
A corporation under the name New Brunswick Electric Finance Corporation ("NBEFC") was formed to facilitate, over time, the conversion of NB Power's debt to appropriate levels of debt and equity in the subsidiaries. On October 1, 2004, NBEFC re-capitalized NB Power, converting $187 million of debt to equity, to bring NB Power's equity to zero and further converted $140 million of debt to equity to re-capitalize Transco to 60% debt and 40% equity. All other subsidiaries were capitalized at 100% debt.
As part of the restructuring on October 1, 2004, the New Brunswick System Operator ("System Operator") was established as an independent not-for-profit corporation to:
ensure reliable operation of the electricity system
implement and operate an electricity market
design and administer a non-discriminatory transmission tariff
A Market Advisory Committee, comprised of many stakeholders, was implemented to advise the System Operator on market issues and recommend rule and tariff changes.
Wholesale and large industrial customers have the option to obtain electricity from competitive suppliers. Customers leaving the system may be assessed an exit fee or equivalent charge. For wholesale and large industrial customers that do not select an alternative supplier, Disco will have an obligation to provide a standard offer of service under terms and prices consistent with previous service. Market conditions will be reviewed periodically regarding the introduction of retail competition.
To facilitate provision of standard offer supply, the existing generation supply resources will be provided under contracts to Disco. If and when these contracted resources are insufficient to meet standard offer needs Disco would acquire new resources through a competitive request for proposal ("RFP") process (yet to be proclaimed).
The regulatory powers of the Board of Commissioners of Public Utilities of New Brunswick ("PUB") were increased to include:
the open-access transmission tariff in New Brunswick.
stranded costs and exit fees
RFP process for new resource requirements (yet to be proclaimed)
market monitoring
appeal of market rules
standard service rate increases that exceed the greater of 3.0% or the percentage change in the average consumer price index
Natural Gas Developments
NB Power has entered into an agreement to purchase all of the capacity and energy from a 90 MW natural gas cogeneration project ("Grandview") to be constructed and operated by TransCanada Corporation for Irving Oil Limited. Grandview be gan commercial operation in December 2004.
Business Development
Consistent with NB Power's business development plan objectives to ensure the reliability of supply, environmental acceptability, economic efficiency, and financial viability, four major development projects are in progress.
Coleson Cove Generating Station Refurbishment
The continued operation of the 998 MW oil-fired Coleson Cove Generating Station beyond 2005 required an upgrade to meet new environmental standards. The estimated $672 million station refurbishment includes installation of control technologies to reduce emission rates. Significantly lower fuel costs resulting from the conversion of the station to use Orimulsion(r) fuel was expected to finance the acquisition of new environmental protection equipment.
35
Exhibit "d" Current Description of Province of New Brunswick
The forecasted significantly lower fuel costs for the station have not materialized as a result of the unavailability of Orimulsion(r). In February 2004, NB Power initiated legal action in New Brunswick against the fuel supplier, Bitor America Corporation and Petroleos de Venezuela ("PDVSA"), for their failure to provide Orimulsion(r) under the terms and conditions negotiated by NB Power and Bitor. Discussions are being held between NB Power and PDVSA in an attempt to reach a solution to the dispute.
The station is projected to use heavy fuel oil in the near term with the potential of switching to Orimulsion(r) or another lower cost fuel in the medium term. Fuel switching may require development of a new fuel handling system and alternative delivery options are being considered.
Point Lepreau Nuclear Generating Station Refurbishment
NB Power is proposing to refurbish the Point Lepreau Generating Station during an 18-month outage scheduled to begin in April 2008. The $950 million capital project would replace all 380 fuel channel and calandria tube assemblies and feeders as well as complete other equipment replacements, inspections and upgrades to allow the station to operate an additional 25 years. Production from the station provides up to 30% of New Brunswick's electricity, and maintains significant environmental benefits. The project has received required approvals under the federal Canadian Environmental Assessment Act and provincial environmental impact assessment regulations.
In September 2002, the PUB recommended to the NB Power Board of Directors that the project, as presented, not proceed because of a lack of significant financial advantage over natural gas, a potential source of generation. The PUB's only review mandate is direct economics. Accordingly, the Government of New Brunswick solicited a third-party review of the project and in a report released in April 2004, Dr. Robin Jeffrey concluded that refurbishment offered no economic advantage over alternative supply options and the project contracts gave disproportionate financial risk to NB Power. However Dr. Jeffrey endorsed the project's condition assessment process, risk mitigation strategy, communication with the Canadian Nuclear Safety Commission on regulatory issues, early environmental approvals, integrated schedule, detailed implementation plan and progress reporting. Dr. Jeffrey's recommendations, endorsed by the shareholder, included renegotiating contracts with Atomic Energy of Canada Limited, investigating fossil fuel options and investigating private sector involvement.
Nuclearco is renegotiating the project contracts with Atomic Energy of Canada Limited and is in discussions with a third party, Bruce Power L.P. , for potential private sector involvement. Based on the results of these discussion s and investigations recommended by the Jeffrey Report, The Board of Directors of Nuclearco will make a recommendation to the Government of New Brunswick. The Government is expected to make a decision early in 2005.
International Power Line Project
The construction of a second 345 kV transmission line and interconnection to the New England electricity market will have the benefits of increased opportunities for imports and exports of electricity, reduced transmission losses and increased system reliability for the State of Maine and the Maritime Provinces. The estimated cost of the project is $50 million for the Canadian portion. The National Energy Board (NEB) has issued a conditional Certificate of Public Convenience and Necessity to construct, operate, and maintain the power line. The US portion is estimated to cost $90 million (USD) and is expected to be owned and operated by Bangor Hydro-Electric Company, a subsidiary of Emera Inc. Bangor Hydro-Electric Company is in the process of seeking the required approvals for the US portion of the project. ISO New England will operate the line and has agreed to roll the full cost of the US line, to $90 million (USD), into its regional tariff. The project is planned for completion in late 2006.
Renewable Energy Development
Following a public request for proposals, NB Power has signed a twenty-year power purchase agreement with Eastern Wind Inc. for a 20 MW wind farm on Grand Manan. The proposed wind farm will have 11 turbines and expects to be generating electricity in late 2005. Disco intends to purchase the output and environmental attributes from the project as part of a long-term goal to acquire 100 MW from renewable energy projects.
36
Exhibit "d" Current Description of Province of New Brunswick
Rates
Under the Electric Power Act, in effect prior to October 1, 2004, rates were charged by NB Power to cover all operating charges and expenses, overhead, interest and amortization charges, and to maintain "such reserve, depreciation and surplus accounts as are maintained by a properly managed corporation". Effective January 1, 1990, NB Power became subject to rate regulation by the PUB. The Lieutenant Governor in Council may reverse or vary any rate order of the PUB. If this occurs there is no appeal. The mandate of PUB does not extend to areas such as approval of borrowings or contracts for the sale or purchase of electricity outside the province.
The Public Utilities Act was amended on December 10, 1993 to provide "legislated permission" regulation. Since that date, NB Power and its successor company, Disco, may implement rate increases in any fiscal year without applying to the PUB, provided the rate increase does not exceed the greater of 3.0% or the percentage change in the average consumer price index. In addition, NB Power must, before making any direct capital expenditures for new generating facilities, apply to the PUB for its recommendations as to those proposed capital expenditures. The Public Utilities Act was also amended in November, 1997, to require NB Power to apply to the PUB for its recommendations before making any expenditure in excess of $75 million in relation to the decommissioning of a generating facility or a proposed maintenance program or a proposed upgrading program for a generating facility or a combination of such programs for a generating facility.
Under the new Electricity Act, effective October 1, 2004, Disco's ability to increase rates is governed by the same provision as set out in the 1993 Amendment to the Public Utilities Act. However, the 1997 amendments to the Public Utilities Act do not appear in the Electricity Act, therefore eliminating the requirement for Disco to make an application to the PUB for its recommendations before making any expenditures in excess of $75 million.
In addition, the newly incorporated Transco is governed under the Electricity Act and as such, Transco's rates are set out in an approved tariff. Genco and Nuclearco are not regulated as of October 1, 2004.
Rate increases in the past five fiscal years are shown in the following table:
AVERAGE RATE INCREASES |
| | | | | | | | | | | |
| | Year Ended March 31, | |
| | | | | | | | | | | |
| Customer | 2000 | | 2001 | | 2002 | | 2003 | | 2004 | |
| Classification | | | | | | | | | | |
| | | | | | | | | | | |
| Residential | 0.0% | | 3.0% | | 0.0% | | 3.0% | | 2.9% | |
| General service | 0.0 | | 0.0 | | 0.0 | | 1.5 | | 2.9 | |
| Industrial | 0.0 | | 0.0 | | 0.0 | | 1.5 | | 1.9 | |
| Wholesale | 0.0 | | 0.0 | | 0.0 | | 1.5 | | 2.9 | |
| Street lights | 0.0 | | 0.0 | | 0.0 | | 0.0 | | 2.9 | |
Operations and Financial Review
Highlights
The financial information which follows is on a consolidated basis for the fiscal year ended March 31, 2004 for NB Power and its wholly owned subsidiary, NB Coal Limited.
NB Power recorded a net loss of $18 million in 2003/04. A non-recurring charge against net income of $44 million for write-off of costs associated with a fuel handling system, intended for delivery of Orimulsion(r) to the Coleson Cove Generating Station, set back an otherwise significant turnaround in financial performance attributable to improved margins on in-province and
37
Exhibit "d" Current Description of Province of New Brunswick
out-of-province energy sales. The income from operations before the write-off was $26 million compared with a net loss from operations of $77 million the previous year.
The most significant factor contributing to the change in year-over-year operating income was a $96 million increase in the gross margin on in-province and out-of-province sales that increased from $692 million in 2002/03 to $788 million in 2003/04. Energy costs decreased significantly due to a 56 percent increase in hydro generation based on the long-term average and a 20 percent increase in year-over-year nuclear generation. Greater availability of these low-cost generation sources reduced reliance on more expensive generation sources. Other factors contributing to the year-over-year increase in income were:
continued improvement of the Canadian dollar lowered fuel costs
greater hydro and nuclear generation allowed for more surplus energy to be exported thereby increasing out-of-province revenue and out-of-province gross margin
higher in-province revenue due to the 2.6 percent average rate increase implemented April 1, 2003 and a slight growth in sales volume
unlike the previous fiscal year, there was no interruption in the supply of lower-cost Orimulsion(r) at the Dalhousie Generating Station
lower year-over-year financial charges primarily due to refinancing at reduced interest rates
There were other factors that offset the impact of these positive developments:
in-province and out-of-province gross margins were lower because of increases in thermal fuel prices
operations, maintenance and administration costs were higher as a result of increased pension costs due to a negative return in the prior year and a voluntary early retirement program offered in 2003/04
a $44 million write-off of costs associated with the Orimulsion(r) fuel handling system.
Operating cash flow in 2003/04 increased by $117 million to $256 million primarily due to a reduced net loss year-over-year.
NB Power's debt increased by $321 million in 2003/04 due to the capital spending on the Coleson Cove Generating Station Refurbishment Project and the one-time start-up funding of the used nuclear fuel management and nuclear decommissioning liabilities.
Operating Results
Total revenue was $1.311 billion in 2003/04 which is an increase of $38 million or 3 percent from 2002/03.
In-province revenue was $1,009 million in 2003/04 representing an increase of $16 million or 1.6 percent from 2002/03. The main contributors to the year-over-year variances were:
a 2.6 percent average rate increase implemented April 1, 2003 increased revenue by $24 million
higher sales volume increased revenue by $7 million
certain industrial sector contract price decreases, which are variable and linked to fuel costs, resulted in a year-over-year decrease in revenue of $15 million
Out-of-province revenue increased $19 million or 8.4 percent from 2002/03. The main contributors to the year-over-year variance were:
greater hydro and nuclear generation increased the availability of surplus energy for export resulting in a 28 percent increase in export sales volume and a $35 million increase in revenue
the introduction of locational marginal pricing in New England resulted in a lower year-over-year US market price. Exports to Canadian utilities increased as Canadian off-peak prices were higher than US off-peak prices. Lower overall market prices along with a stronger Canadian dollar resulted in a lower average price for export energy thereby offsetting the impact of the sales volume increase by $16 million.
38
Exhibit "d" Current Description of Province of New Brunswick
For the fiscal year ended March 31, 2004, energy was supplied as follows:
COMPOSITION OF ENERGY SUPPLY | | | | |
| | | Total | | In Province | |
| | | | | | |
| Hydro | | 15.5% | | 19.2% | |
| Heavy fuel oil & combustion turbine | 20.2 | | 14.6 | |
| Orimulsion(r) | 10.8 | | 9.0 | |
| Coal and petroleum coke | 21.9 | | 21.9 | |
| Nuclear | | 24.9 | | 27.9 | |
| Purchases | 6.7 | | 7.4 | |
| Total | | 100.0% | | 100.0% | |
The cost of fuel and purchased power was $467 million in 2003/04, a decrease of $61 million or 11.6 percent from 2002/03. Heavy fuel oil represented 42 percent of this spending while purchased power from utilities in Nova Scotia, Maine, Quebec and New Brunswick accounted for 20 percent. The year-over-year decrease in fuel and purchased power costs was attributable to the following factors:
hydro flows were 120 percent of the long-term average compared to 77 percent in 2002/03 resulting in a significant percent increase in total hydro generation over the previous year. The availability of this low-cost energy decreased generation costs by $55 million.
Point Lepreau's net capacity factor was 85.6 percent during 2003/04 representing an increase of 20 percent over 2002/03. Increased availability of this low-cost energy lowered generation costs by $37 million.
improvement in the performance of the Canadian dollar, offset by the impact of foreign exchange hedges, decreased costs by $22 million
generation costs were $16 million lower due to greater use of coal and Orimulsion(r) in place of heavy fuel oil (there was a period during 2002/03 when Orimulsion(r) was unavailable necessitating use of more expensive heavy fuel oil)
These decreases were offset by year-over-year increases in other costs, primarily a 28 percent increase in the export load which increased costs by $41 million and an overall increase in fuel prices, net of the hedging impact, which increased total fuel and purchased power costs by $28 million.
Operations, maintenance and administration costs were $388 million in 2003/04, an increase of $24 million or 6.6 percent from 2002/03. This was mainly due to the following increases:
pension costs were $19 million higher due to amortization of losses from a negative asset return in 2002/03
early retirement costs were $7 million higher due to a voluntary early retirement program
labor and benefits costs were $9 million higher from contract and merit increases
station outage and maintenance costs were $5 million higher because of work at Dalhousie, Coleson Cove, Courtenay Bay, and several hydro generating stations
tax costs were $2 million higher due to increased industrial property tax assessments
These increases were offset by a $15 million reduction in costs due to the Point Lepreau planned maintenance outage in 2003/04 being shorter and less costly than the outage in 2002/03.
Amortization and decommissioning costs were $213 million in 2003/04, a decrease of $3 million or 1.4 percent from 2002/03. In the previous year, an environmental liability of $11 million for treating acidic water drainage from an inactive mine was charged to decommissioning expense by NB Coal Limited. Amortization and decommissioning charges for other items increased by $8 million year-over-year due to the impact of capital additions.
At March 31, 2004, the net long-term debt of NB Power was $2,883 million (after deducting all sinking funds and using exchange rates prevailing on that date) compared to $2,744 as at March 31, 2003. All long-term debt is guaranteed or advanced by the Province of New Brunswick.
As part of the Coleson Cove Generating Station refurbishment, the station is being converted to burn Orimulsion(r). The project included development and construction of facilities capable of handling the new fuel. NB Power signed a memorandum of
39
Exhibit "d" Current Description of Province of New Brunswick
understanding for the development of these facilities and the site chosen required investment in a fixed jetty, storage tanks, pumping and piping to the existing pipelines used to transport heavy oil to the generating station.
Expenditures on the fuel delivery system to March 31, 2004 amounted to $47 million ($1 million - 2003). The means chosen to deliver the fuel will be determined in conjunction with the pending resolution of the fuel supply contracts. Of the $47 million, $44 million is not expected to provide future service value and has been expensed in 2003/04. Approximately $3 million remains as construction-in-progress pending resolution of the supply negotiations and evaluation of fuel delivery options.
Finance charges decreased $25 million or 10.3 percent to $217 million in 2003/04 due to the following factors:
Capital Expenditures
Capital expenditures, net of proceeds on disposal and customer contributions, were $497 million in 2003/04, an increase of $285 million or 134 percent from 2002/03.
The primary reason for the increase was spending on the Coleson Cove Generating Station Refurbishment Project , as spending in 2003/04 was $405 million versus $99 million the previous year. To March 31, 2004, $511 million has been spent, including expenditures for the fuel handling system. After the write-off on the fuel handling system costs noted above, the project cost incurred to date is $467 million. Management's forecasted total construction cost for the project is $672 million. In addition, $44 million has been written off.
Other capital expenditures include $12 million on pre-engineering analysis and work required in preparation for refurbishment of the Point Lepreau Generating Station. Total project expenditures to March 31, 2004 were $71 million, primarily for feasibility studies, engineering, analysis , and project planning. Transmission and distribution infrastructure upgrade projects were also completed during the year.
Free Cash Flow and Debt Increase
Free cash outflow was $376 million in 2003/04, a decrease of $290 million from 2002/03. The reasons for the decline were higher capital spending and funding of the used nuclear fuel management and nuclear decommissioning liabilities offset by a reduced net loss.
Net debt increased by $321 million in 2003/04 compared to an increase in 2002/03 of $149 million. This was mainly due to the financing of the capital spending on the Coleson Cove Generating Station Refurbishment Project and funding of the used nuclear fuel management and nuclear decommissioning liabilities.
Statistical Information
The following table sets forth certain information with respect to the peak demand and capacity for each of the fiscal years 2000 through 2004.
PEAK DEMAND AND CAPACITY |
| | | In Province | | Out-of- | | | | Total Net Generating | |
| | | Peak | | Province | | Total Peak | | Capacity and Firm | |
| Year Ended March 31, | | demand | | Firm Sales | | Demand | | Capacity Purchases3 | |
| | | | | | | (megawatts) | | | |
| | | | | | | | | | |
| 2000 | | 2,856 | | 427 | | 3,283 | | 4,468 | |
| 2001 | | 2,893 | | 464 | | 3,357 | | 4,121 | |
| 2002 | | 2,768 | | 863 | | 3,631 | | 4,268 | |
| 2003 | | 3,089 | | 590 | | 3,679 | | 4,275 | |
| 2004 | | 3,340 | | 366 | | 3,706 | | 4,276 | |
1 At the time of the in-province peak demand.
40
Exhibit "d" Current Description of Province of New Brunswick
The following table sets forth certain statistical information for the five fiscal years ended March 31, 2004.
SELECTED OUTPUT AND SALES DATA |
| | | | | | | | | | | | | | | | | | | | |
| | Year Ended March 31, | |
| | | | | | | | | | | | | | | | | | | | |
| | 2000 | | 2001 | | 2002 | | 2003 | | 2004 | |
| | | | | | | | | | | | | | | | | | | | |
| System Power Generated and Purchased (in millions of kilowatt-hours) | | | | | | | | | | | | | | | | | | | |
| Generated | 17,123 | | 18,818 | | 19,067 | | 17,908 | | 19,199 | |
| Purchased | | 4,712 | | | 2,092 | | | 1,945 | | | 1,752 | | | 1,371 | |
| | 21,835 | | 20,910 | | 21,012 | | 19,660 | | 20,570 | |
| | | | | | | | | | | | | | | | | | | | |
| Losses and internal use | 1,993 | | 2,021 | | 1,953 | | 2,051 | | 2,000 | |
| | | | | | | | | | | | | | | | | | | | |
| Total Energy Available | 19,842 | | 18,889 | | 19,059 | | 17,609 | | 18,570 | |
| | | | | | | | | | | | | | | | | | | | |
| Electric Sales (in millions of kilowatt-hours) | | | | | | | | | | | | | | | | | | | |
| | | | | | | | | | | | | | | | | | | | |
| In-province | 13,587 | | 14,011 | | 13,795 | | 14,540 | | 14,648 | |
| Out-of-province | | 6,255 | | | 4,878 | | | 5,264 | | | 3,069 | | | 3,922 | |
| | | | | | | | | | | | | | | | | | | | |
| Total Electric Sales | 19,842 | | 18,889 | | 19,059 | | 17,609 | | 18,570 | |
| | | | | | | | | | | | | | | | | | | | |
| Revenue from Sale of Power (in millions of dollars) | | | | | | | | | | | | | | | | | | | |
| In-province | | $ | 888 | | | $ | 931 | | | $ | 919 | | | $ | 993 | | $ | 1,009 | |
| Out-of-province | | | 329 | | | | 332 | | | | 359 | | | | 227 | | | 246 | |
| | | | | | | | | | | | | | | | | | | | |
| Total revenue from sale of power | | 1,217 | | | 1,263 | | | 1,278 | | | 1,220 | | | 1,255 | |
| Miscellaneous revenue | | | 31 | | | | 46 | | | | 41 | | | | 53 | | | 56 | |
| | | | | | | | | | | | | | | | | | | | |
| Total Revenue | $1,248 | | $1,309 | | $1,319 | | $1,273 | | $1,311 | |
| | | | | | | | | | | | | | | | | | | | |
| | | | | | | | | | | | | | | | | | | | |
| Number of Customers (at end of period)4 | 350,633 | | 353,724 | | 356,440 | | 360,237 | | 363,439 | |
| | | | | | | | | | | | | | | | | | | | |
| Average Revenue per kilowatt-hour | | | | | | | | | | | | | | | | | | | |
| In-province | | 6.54 | | | 6.64 | | | 6.66 | | | 6.83 | | | 6.89 | |
| Out-of-province | | 5.26 | | | 6.81 | | | 6.82 | | | 7.40 | | | 6.27 | |
4 Includes customers served indirectly through local distribution companies in the Cities of Saint John and Edmundston (41,656 at March 31, 2004).
41
Exhibit "d" Current Description of Province of New Brunswick
The following summary financial information was extracted from the audited Consolidated Financial Statements of NB Power.
NEW BRUNSWICK POWER CORPORATION |
| | | | | | | | | |
Summary Consolidated Balance Sheet |
| | | | | | | | | |
| | As At March 31, | |
| | (millions of dollars) | |
| | 2003 | | 2004 | |
| | | | | |
| | | | | | | | | |
| Assets | | | | | | | | |
| Current assets | | $ | 355 | | | $ | 287 | |
| Fixed assets | | 2,882 | | | 3,146 | |
| Long-term assets | | | 20 | | | | 176 | |
| Deferred charges | | | 130 | | | | 120 | |
| | | | | |
| | | | | | | | | |
| Total Assets | $3,387 | | $3,729 | |
| | | | | | | | | |
| | | | | | | | | |
| Liabilities and Deficit | | | | | | | | |
| Current liabilities | | $ | 682 | | | $ | 817 | |
| Long-term debt | | 2,612 | | | 2,814 | |
| Deferred liabilities | | | 270 | | | | 293 | |
| Deficit | | (177) | | | (195) | |
| | | | | |
| | | | | |
| Total Liabilities and Deficit | $3,387 | | $3,729 | |
42
Exhibit "d" Current Description of Province of New Brunswick
Summary Consolidated Statement of Income
| | | Year ended March 31, |
| | | | | millions of dollars | |
| | | 2000 | | 2002 | | 2001 | | 20031 | | 2004 |
| | | | | | | | | | | |
Revenues | | $1,248 | | $1,309 | | $1,319 | | $1,273 | | $1,311 |
Expenses | | | | | | | | | | |
Cost of energy | | 398 | | 504 | | 492 | | 528 | | 467 |
Operations | | 519 | | 530 | | 552 | | 580 | | 601 |
Interest and exchange | | 268 | | 355 | | 256 | | 242 | | 217 |
Write-off fuel handling system costs2 | | -- | | -- | | -- | | -- | | 44 |
| | | 1,185 | | 1,389 | | 1,300 | | 1,350 | | 1,329 |
| | | | | | | | | | | |
Net Income (Loss) for the Year | | $63 | | $(80) | | $19 | | $(77) | | $(18) |
1 Certain 2003 figures have been reclassified to conform to the 2004 financial statement presentation.
2 NB Power commenced a project in December 2002 to refurbish the 998-megawatt Coleson Cove Generating Station to extend its life and convert it
to burn Orimulsion(r) fuel. The project also included development and construction of facilities and pipeline capable of handling Orimulsion(r) fuel. Of the $47 million in expenses incurred on the fuel delivery system to March 31, 2004, $44 million is not expected to provide future service value and has been expensed in the year ended March 31, 2004, while $3 million remains in construction-in-progress, pending resolution of the supply contract negotiations for Orimulsion(r) fuel and evaluation of fuel delivery options.
43
Exhibit "d" Current Description of Province of New Brunswick
Summary Consolidated Statement of Cash Flow
| | | | | | | | | | | | | | | | |
| | | | | | | | | | | | | | | | |
| Summary Consolidated Statement of Cash Flow | | | | | | | | | | | | | | | |
| | | | | | | | | | | | | | | | |
| | Year Ended March 31, | |
| | (millions of dollars) | |
| | 2000 | | 2001 | | 2002 | | 20037 | | | 2004 | |
| Net Inflow (Outflow) of Cash Related to the | | | | | | | | | | | | | | | |
| Following Activities: | | | | | | | | | | | | | | | |
| Net income (loss) | $ | 63 | | $ | (80) | | $ | 19 | | $ | (77) | | $ | (18) | |
| Non-cash items | 166 | | 294 | | 215 | | | 216 | | | 274 | |
| Net change in non-cash working capital balances | | 22 | | | 16 | | | (35) | | | 14 | | | 29 | |
| Nuclear decommissioning and used fuel | | -- | | | -- | | | -- | | | (20) | | (156) | |
| management funds installments and earnings8 | | | | | | | | | | | | | | | |
| Other | | -- | | | -- | | | -- | | | (7) | | | (8) | |
| | | | | | | | | | | | | | | | |
| Cash from operating activities | 251 | | 230 | | 199 | | | 126 | | | 121 | |
| Cash from financing activities | (170) | | | (91) | | (104) | | | 131 | | | 321 | |
| Cash from investing activities | | (54) | | (116) | | (135) | | (212) | | (497) | |
| | | | | | | | | | | | | | | | |
| Net Cash Inflow (Outflow) | | 27 | | | 23 | | | (40) | | | 45 | | | (55) | |
| Cash and short-term investments | | | | | | | | | | | | | | | |
| Beginning of Year | | 7 | | | 34 | | | 57 | | | 17 | | | 62 | |
| | | | | | | | | | | | | | | | |
| End of Year | $ | 34 | | $ | 57 | | $ | 17 | | | $62 | | | $7 | |
1 Certain 2003 figures have been reclassified to conform to the 2004 financial statement presentation.
2 NB Power has established a used nuclear fuel segregated fund held in a custodial account to meet the license conditions of the Point Lepreau
Generating Station set by the CNSC. NB Power has also established a trust fund pursuant to the Federal Nuclear Fuel Waste Act ("NFWA"). In accordance with the NFWA, the Nuclear Waste Management Organization was formed to prepare and review alternatives, and provide recommendations for long-term management of nuclear waste. This submission is to occur within three years of the NFWA coming into force. The federal government will determine the strategy for dealing with the long-term management of used nuclear fuel based on submitted plans. The NFWA requires major owners of used nuclear fuel in Canada to establish trust funds to finance the long-term management of used nuclear fuel. The NFWA requires the Corporation to contribute $4 million annually for the next two years to its trust fund. Further funding requirements beyond this time will be based on the plan chosen. The funds contained in the established fund to meet the license conditions of the generating station described above will also be used to meet these requirements. NB Power has established a decommissioning segregated fund held in a custodial account to meet the license conditions for the Point Lepreau Generating Station set by the CNSC.
44
Exhibit "d" Current Province of New Brunswick Description
TABLES AND SUPPLEMENTARY INFORMATION OF THE PROVINCE
In the following tables, the revenue and expenditure for the four fiscal years ended March 31, 2004 have been extracted from the Public Accounts for such years (subject to certain adjustments for purposes of comparability). For the fiscal year ending March 31, 2005, the numbers have been extracted from the Budget and the forecast of revenue and expenditure published in the Budget Estimates. Revenue and expenditure are expressed on a net basis.
TABLE I - COMPARATIVE STATEMENT OF ORDINARY REVENUE
| | | | | | Fiscal Year Ended March 31, (millions) | | | Budget |
| | | | | | - | - | Estimates |
| | | 2001 | | | 2002 | | | 2003 | | | 2004 | | | 2005 |
| | | | | | | | | | | | | | | |
Own Source | | | | | | | | | | | | | | |
Taxes | $ | 2,325.5 | | $ | 2,376.3 | | $ | 2,481.6 | | $ | 2,612.3 | | $ | 2,692.5 |
Investment Income 1 | | 126.9 | | | 211.3 | | | 138.0 | | | 213.4 | | | 238.2 |
Licenses and Permits | | 99.8 | | | 95.3 | | | 95.8 | | | 95.3 | | | 95.4 |
Sale of Goods and Services | | 81.0 | | | 83.8 | | | 83.2 | | | 82.2 | | | 96.4 |
Royalties | | 63.6 | | | 58.2 | | | 57.5 | | | 67.2 | | | 65.4 |
Return on Investment | | 21.7 | | | 23.4 | | | 24.7 | | | 24.1 | | | 21.6 |
Fines and Penalties | | 1.6 | | | 1.3 | | | 1.5 | | | 1.2 | | | 7.8 |
Other | | 20.0 | | | 15.4 | | | 17.9 | | | 16.2 | | | 11.9 |
Transfer from Fiscal Stabilization Fund | | --- | | | --- | | | 110.4 | | | 104.2 | | | --- |
Total - Own Source | | 2,740.1 | | | 2,865.0 | | | 3,010.6 | | | 3,216.1 | | | 3,229.2 |
| | | | | | | | | | | | | | | |
Grants from Canada | | | | | | | | | | | | | | |
Unconditional Grants - Canada | | 1,590.4 | | | 1,818.0 | | | 1,647.6 | | | 1,636.4 | | | 1,774.1 |
Conditional Grants - Canada | | 178.1 | | | 182.3 | | | 180.5 | | | 186.7 | | | 198.8 |
Total - Grants from Canada | | 1,768.5 | | | 2,000.3 | | | 1,828.1 | | | 1,823.1 | | | 1,972.9 |
Total - Ordinary Revenue | $ | 4,508.6 | | $ | 4,865.3 | | $ | 4,838.7 | | $ | 5039.2 | | $ | 5202.1 |
1Includes Lottery Revenues, New Brunswick Municipal Finance Corporation, New Brunswick Liquor Corporation, New Brunswick Power Corporation and Algonquin Golf Limited.
TABLE II - COMPARATIVE STATEMENT OF ORDINARY EXPENDITURE
| | | Fiscal Year Ended March 31, (millions) | | | Budget |
| | | | | Estimates |
| | | 2001 | | | 2002 | | | 2003 | | | 2004 | | | 2005 |
| | | | | | | | | | | | | | | |
| | | | | | | | | | | | | | | |
Economic Development | $ | 126.4 | | $ | 144.6 | | $ | 114.1 | | $ | 132.8 | | $ | 122.3 |
Education | | 821.9 | | | 886.5 | | | 962.3 | | | 1,002.0 | | | 978.7 |
Employment Development & Labour | | 200.7 | | | 198.4 | | | 188.9 | | | 197.1 | | | 194.2 |
Family and Community Services | | 654.2 | | | 679.7 | | | 695.2 | | | 711.9 | | | 712.1 |
Health | | 1,280.0 | | | 1,393.4 | | | 1,468.4 | | | 1,565.6 | | | 1,612.2 |
Protection Services | | 123.5 | | | 126.2 | | | 131.4 | | | 134.3 | | | 131.7 |
Resource Sector | | 137.7 | | | 130.2 | | | 134.0 | | | 142.6 | | | 138.0 |
Transportation | | 145.3 | | | 150.7 | | | 159.5 | | | 151.4 | | | 141.3 |
Central Government | | 435.7 | | | 471.4 | | | 381.7 | | | 416.2 | | | 469.3 |
Service of the Public Debt | | 637.3 | | | 651.8 | | | 660.9 | | | 582.9 | | | 604.0 |
Total Ordinary Expenditure | $ | 4,562.7 | | $ | 4,832.9 | | $ | 4,896.4 | | $ | 5,036.8 | | $ | 5,103.8 |
45
TABLE III -- COMPARATIVE STATEMENT OF NET CAPITAL EXPENDITURE
| | | | | | |
| | | | | |
| | Fiscal Year Ended March 31, (millions) | | | | | | Budget Estimates |
| | | 2001 | | | 2002 | | | 2003 | | | 2004 | | | 2005 |
| | | | | | | | | | | | | | | |
Expenditure: | | | | | | | | | | | | | | |
Highways | $ | 80.8 | | $ | 107.4 | | $ | 148.9 | | $ | 181.3 | | $ | 208.4 |
Bridges | | 13.2 | | | 16.7 | | | 17.1 | | | 21.3 | | | 33.3 |
Schools | | 33.6 | | | 34.5 | | | 34.3 | | | 35.2 | | | 46.0 |
Hospitals | | 8.2 | | | 12.1 | | | 12.9 | | | 25.3 | | | 53.7 |
Other Public Buildings | | 7.9 | | | 13.4 | | | 18.7 | | | 8.1 | | | 8.7 |
Economic and Regional Development Projects | | 0.5 | | | 0.5 | | | 0.5 | | | 0.5 | | | 0.5 |
Water Pollution Control Grants | | 2.5 | | | 0.5 | | | 0.5 | | | 0.5 | | | 0.5 |
Other | | 6.4 | | | 17.8 | | | 17.1 | | | 13.5 | | | 17.7 |
Total Expenditure | | 153.1 | | | 202.9 | | | 250.0 | | | 285.7 | | | 368.8 |
Recoveries: | | | | | | | | | | | | | | |
Recoveries from Canada | | | | | | | | | | | | | | |
Highways | | 9.6 | | | 16.6 | | | 38.3 | | | 49.6 | | | 37.5 |
Economic and Regional Development Projects | | 0.5 | | | 0.8 | | | 3.1 | | | 0.2 | | | 0.2 |
Other | | --- | | | 0.7 | | | 0.4 | | | 1.6 | | | 5.5 |
| | | 10.1 | | | 18.1 | | | 41.8 | | | 51.4 | | | 43.2 |
Other Recoveries | | 1.1 | | | 1.8 | | | 0.9 | | | 1.2 | | | 0.9 |
Total Recoveries | | 11.2 | | | 19.9 | | | 42.7 | | | 52.6 | | | 44.1 |
Net Capital Expenditure | $ | 141.9 | | $ | 183.0 | | $ | 207.3 | | $ | 233.1 | | $ | 324.7 |
TABLE IV -- COMPARATIVE STATEMENT OF NET DEBT
| | | Fiscal Year Ended March 31, (millions) | | | Budget Estimates |
| | | 2001 | | | 2002 | | | 2003 | | | 2004 | | | 2005 |
Net Debt - Beginning of year | $ | 6,925.3 | | $ | 6,782.0 | | $ | 6,603.6 | | $ | 6,713.0 | | $ | 6,816.1 |
Ordinary Account (Surplus) Deficit | | 54.0 | | | (32.4) | | | 57.7 | | | (2.4) | | | (98.3) |
Net Capital Expenditure | | 141.9 | | | 183.0 | | | 207.3 | | | 233.1 | | | 324.7 |
Special Purpose (Surplus) Deficit | | (6.7) | | | (3.6) | | | (8.0) | | | (4.2) | | | (0.4) |
Special Operating Agency (Surplus) Deficit | | (6.0) | | | 2.6 | | | (8.6) | | | (4.5) | | | (3.7) |
Earnings from Sinking Funds | | (220.0) | | | (230.9) | | | (243.0) | | | (222.5) | | | (228.0) |
Adjustments on Consolidation | | (106.5) | | | (97.1) | | | 104.0 | | | 103.6 | | | 3.3 |
Increase (Decrease) in Net Debt for the year | | (143.3) | | | (178.4) | | | 109.4 | | | 103.1 | | | (2.4) |
Unusual Item | | --- | | | --- | | | --- | | | --- | | | --- |
Net Debt - End of year | $ | 6,782.0 | | $ | 6,603.6 | | $ | 6,713.0 | | $ | 6,816.1 | | $ | 6,813.7 |
46
Exhibit "d" Current Province of New Brunswick Description
TABLE V -- COMPARATIVE STATEMENT OF NET LOANS AND ADVANCES
| | | Fiscal Year Ended March 31, (millions) | | | Budget |
| | | | | Estimates |
| | | 2001 | | | 2002 | | | 2003 | | | 2004 | | | 2005 |
Disbursements: | | | | | | | | | | | | | | |
Agricultural Development Act | $ | 3.1 | | $ | 1.9 | | $ | 0.5 | | $ | 0.2 | | $ | 3.0 |
Economic Development Act | | 36.9 | | | 10.8 | | | 19.5 | | | 13.4 | | | 42.0 |
Fisheries Development Act | | 4.5 | | | 5.1 | | | 1.7 | | | 0.5 | | | 5.0 |
Housing | | 6.7 | | | 6.3 | | | 5.1 | | | 4.8 | | | 5.4 |
Nursing Home | | 2.9 | | | 1.7 | | | --- | | | --- | | | --- |
Provincial Holdings Ltd. | | 2.3 | | | --- | | | --- | | | --- | | | --- |
Veterans' Affairs | | 1.3 | | | 9.7 | | | 1.3 | | | 0.8 | | | --- |
Other | | --- | | | --- | | | 0.5 | | | --- | | | 2.6 |
| | | 57.7 | | | 35.5 | | | 28.6 | | | 19.7 | | | 58.0 |
Recoveries: | | | | | | | | | | | | | | |
Agricultural Development Act | | 1.9 | | | 1.6 | | | 0.6 | | | 0.5 | | | 1.1 |
Economic Development Act | | 15.9 | | | 7.6 | | | 12.6 | | | 25.8 | | | 9.5 |
Fisheries Development Act | | 4.4 | | | 3.6 | | | 3.8 | | | 2.9 | | | 2.8 |
Greater Moncton Area Transitional Policing | | 0.3 | | | 0.3 | | | 0.3 | | | 0.3 | | | 0.3 |
Housing | | 3.3 | | | 3.9 | | | 4.2 | | | 4.2 | | | 4.4 |
Nursing Home | | --- | | | 4.5 | | | --- | | | --- | | | --- |
Provincial Holdings Ltd. | | 2.9 | | | 1.1 | | | 0.4 | | | 0.3 | | | 0.3 |
Veterans' Affairs | | --- | | | --- | | | 0.3 | | | 1.3 | | | 1.5 |
Other | | 0.5 | | | 0.3 | | | 0.3 | | | 0.3 | | | 0.3 |
| | | 29.2 | | | 22.9 | | | 22.5 | | | 35.6 | | | 20.2 |
Net Loans and Advances | $ | 28.5 | | $ | 12.6 | | $ | 6.1 | | $ | (15.9) | | $ | 37.8 |
47
Exhibit "d" Current Province of New Brunswick Description
| | FUNDED DEBT OUTSTANDING AT MARCH 31, 2004 |
| | | | | | | | | |
| | Date of Maturity | | Interest Rate | Sinking Fund Installment Rate | Series | Currency Amount | Outstanding Amount (CAN $) | Date Issued | Reference |
| Repayable in United States Dollars: | % |
% | | Thousands | | | | | | | | | | | | | |
| | 29 June | 2004 | 7.625 | 1.5 | EY | 200,000.0 | 266,948.1 | June 1994 | 2 |
| | 5 July | 2004 | 7.556 | 1.5 | EX | 47,500.0 | 62,248.8 | July 1994 | 2,4 |
| | 20 June | 2005 | 6.5 | 1.5 | FH | 150,000.0 | 196,575.0 | June 1995 | 2 |
| | 15 Feb. | 2013 | 7.625 | 1 & 1.5 | EO | 200,000.0 | 262,100.0 | Feb. 1993 | 2 |
| | 15 Aug. | 2013 | 6.75 | 1 & 1.5 | ET | 200,000.0 | 262,100.0 | Sept. 1993 | 2 |
| | 15 May | 2020 | 9.75 | 1 & 1.5 | DU | 200,000.0 | 262,100.0 | May 1990 | 2 |
| | 1 May | 2022 | 8.75 | 1 & 1.5 | EI | 200,000.0 | 262,100.0 | May 1992 | 2 |
| | | | | | | US$1,197,500.0 | C$ 1,574,171.9 | | |
| | Repayable in Swiss Francs: | | | | | | |
| | 3 Nov. | 2006 | 5.625 | 1.5 | FQ | 100,000.0 | C$104,443.0 | March 1998 | 2,8 |
| | | | | | | Sfr 100,000.0 | C$104,443.0 | | |
| | Repayable in Canadian Dollars: | | | | | | |
| | 2 Apr. | 2004-10 Jan. 2005 | 12.08 - 14.06 | 1 | CP | | 67,087.0 | 1984 - 1985 | 1 |
| | 9 June | 2004 | 5.4 | 1.5 | FS | | 50,000.0 | June 1998 | 2 |
| | 30 July | 2004 | 2.739 | 1.5 | GE | | 36,000.0 | July 2003 | 2 |
| | 26 Aug. | 2004 | Floating | 1.5 | EZ | | 71,200.0 | Aug. 1994 | 2,5 |
| | 27 Sept. | 2004 | Floating | 1.5 | FB | | 41,101.5 | Sept. 1994 | 2,6 |
| | 1 Oct. | 2004 | Floating | 1.5 | FA | | 55,100.0 | Sept. 1994 | 2,7 |
| | 10 Apr. | 2005-10 Dec. 2005 | 10.8 - 12.57 | 1 | CP | | 46,125.0 | 1985 | 1 |
| | 19 Apr. | 2005 | 8.75 | 1 & 1.5 | FE | | 200,000.0 | April 1995 | 2 |
| | 29 July | 2005 | 2.96 | 1.5 | GF | | 36,000.0 | July 2003 | 2 |
| | 15 Dec. | 2005 | 7.50 | 1 & 1.5 | FK | | 200,000.0 | Dec. 1995 | 2 |
| | 3 Feb. | 2006 | 3.75 | 1 & 1.5 | GB | | 200,000.0 | Feb. 2003 | 2 |
| | 9 May | 2006-10 Mar. 2007 | 9.04 - 9.97 | 1 | CP | | 75,518.0 | 1986 - 1987 | 1 |
| | 19 June | 2006 | 7.75 | 1.5 | FL | | 200,000.0 | June 1996 | 2 |
| | 31 July | 2006 | 3.4 | 1.5 | GG | | 36,000.0 | July 2003 | 2 |
| | 16 Oct. | 2006 | 7.10 | 1.5 | FM | | 200,000.0 | Oct. 1996 | 2 |
| | 3 Nov. | 2006 | 5.625 | 1.5 | FQ | | 54,932.2 | March 1998 | 2,8 |
| | 26 Feb. | 2007 | 6.75 | 1 & 1.5 | FN | | 200,000.0 | Feb. 1997 | 2 |
| | 10 Apr. | 2007-10 Mar. 2008 | 9.12 - 11.07 | 1 | CP | | 62,396.0 | 1987 - 1988 | 1 |
| | 23 Oct. | 2007 | 4.78 & 4.7925 | 1 & 1.5 | GA | | 791,500.0 | Oct. 2002 | 2,17 |
| | 11 Apr. | 2008-1 Dec. 2008 | 9.62 - 10.39 | 1 | CP | | 59,314.0 | 1988 | 1 |
| | 2 June | 2008 | 5.70 | 1.5 | FR | | 550,000.0 | Mar., Oct. 1998 | 2,9 |
| | 7 July | 2008 | 4.35 | 1.5 | GD | | 101,958.4 | July 2003 | 2 |
| | 2 Dec. | 2008 | 4.25 | 1.5 | GI | | 300,000.0 | Sept. 2003 | 2 |
| | 3 Apr. | 2009-1 Mar. 2010 | 9.15 - 10.31 | 1 | CP | | 64,307.0 | 1989 - 1990 | 1 |
| | 2 June | 2009 | 5.25 | 1.5 | FU | | 550,000.0 | May, Sept. 1999 | 2,11 |
| | 22 June | 2009 | 10.25 | 1.5 | DR | | 88,019.0 | June 1989 | 2,3 |
| | 23 Nov. | 2009 | 10 | 1 & 1.5 | DT | | 120,359.0 | Nov. 1989 | 2,3 |
| | 2 Apr. | 2010-1 Mar. 2011 | 10.36 - 11.04 | 1.5 | CP | | 40,360.0 | 1990 - 1991 | 1 |
| | 15 June | 2010 | 6.375 | 1 & 1.5 | FW | | 600,000.0 | June, Dec. 2000 | 2,13 |
| | 10 Apr. | 2011-10 July 2011 | 9.81 - 10.04 | 1.5 | CP | | 58,458.0 | 1991 | 1 |
| | 12 July | 2011 | 5.8 | 1 & 1.5 | FX | | 600,000.0 | Feb., June 2001 | 2,14 |
| | 31 Oct. | 2011 | 10.125 | 1 & 1.5 | ED | | 200,000.0 | Oct. 1991 | 2 |
| | 1 Dec. | 2011 | 5.85 | 1 & 1.5 | FY | | 600,000.0 | Dec. 01, Feb. 02 | 2,15 |
48
Exhibit "d" Current Province of New Brunswick Description
| | 11 May | 2012-10 July 2012 | 9.17 - 9.45 | 1.5 | CP | | 41,673.0 | 1992 | 1 |
| | 6 Dec | 2012 | 5.875 | 1& 1.5 | FZ | | 600,000.0 | June, Aug. 2002 | 2,16 |
| | 18 Jan. | 2013 | 9.25 | 1 & 1.5 | EN | | 200,000.0 | Jan. 1993 | 2 |
| | 25 Feb | 2013 | 5.5 | 1 & 1.5 | GC | | 200,000.0 | Feb. 2003 | 2 |
| | 28 June | 2013 | 8.5 | 1 & 1.5 | ER | | 200,000.0 | June 1993 | 2 |
| | 13 Jan. | 2014 | 7.75 | 1.5 | EW | | 200,000.0 | Jan. 1994 | 2 |
| | 12 May | 2015 | 8.75 | 1 & 1.5 | FF | | 200,000.0 | May 1995 | 2 |
| | 27 June | 2017 | 6.75 | 1.5 | FO | | 250,000.0 | June 1997 | 2 |
| | 27 Dec. | 2017 | 6 | 1.5 | FP | | 250,000.0 | Nov. 1997 | 2 |
| | 2 Apr. | 2019 - 3 Mar. 2020 | 5.64-6.82 | 1.5 | CP | | 46,892.0 | 1999-2000 | 1 |
| | 1 Apr. | 2020 - 2 Mar. 2021 | 6.25-6.76 | 1.5 | CP | | 53,014.0 | 2000-2001 | 1 |
| | 1 Apr. | 2021 - 1 Mar. 2022 | 6.26-6.70 | 1.5 | CP | | 74,784.4 | 2001-2002 | 1 |
| | 1 Apr. | 2022 - 1 Mar. 2023 | 5.79 - 6.51 | 1.5 | CP | | 73,185.0 | 2002-2003 | 1 |
| | 5 Apr. | 2023 - 1 Mar. 2024 | 5.37 - 6.06 | 1.5 | CP | | 71,205.0 | 2003-2004 | 1 |
| | 27 Dec. | 2028 | 5.65 | 1.5 | FT | | 500,000.0 | July 98, Feb. 99 | 2,10 |
| | 15 Dec. | 2029 | 5.75 / 6.29 | 1 | FV | | 50,000.0 | Dec. 1999 | 12 |
| | 27 Jan. | 2034 | 5.5 | 1.5 | GJ | | 300,000.0 | Jan. 2004 | 2 |
| | | | | | | | | | |
| | | | | | | | C$ 9,905,192.5 | | |
| | | | | | | | C$ 11,583,807.4 | | |
| | | | | | | | | | |
| | | | | | | | | | |
| | | | | | | | | | |
| | | | | | | | | | |
| | | | | | | | | | |
| | | | | | | | | | |
Note:
Up to 31 March 1980, the sinking fund installment rate on the Series CP debentures was 3%.
Commencing 1 April 1980, the minimum rate was reduced to 1%.
49
Exhibit "d" Current Province of New Brunswick Description
References:
(1)
Issued to Canada Pension Plan Investment Fund, not negotiable, transferable or assignable. Twenty year bonds redeemable in whole, or in part, at 100% on not less than six months notice.
(2)
Non-callable.
( 3)
Pursuant to Section 24 of the Provincial Loans Act, the Minister of Finance authorized the cancellation of a portion of this issue held as an investment in the Sinking Fund effective 1 April 1991. The Sinking Fund instalment is the same as that made prior to the cancellation.
( 4)
US $47,500.0 represents the amount payable under an interest rate and currency swap agreement with a counter-party for the repayment at maturity of the Province's debt of Series EX 4.6% 5,000,000.0 Yen due 5 July 2004. Interest payments under the agreement are at a rate of 7.556% semi-annually in US dollars.
( 5)
Canadian $71,200.0 represents the amount payable under an interest rate and currency swap agreement with a counter-party for the repayment at maturity of the Province's debt of Series EZ 4.4% 5,000,000.0 Yen due 26 August 2004. Interest is payable semi-annually in Canadian dollars at a floating rate.
( 6)
Canadian $41,101.5 represents the amount payable under an interest rate and currency swap agreement with a counter-party for the repayment at maturity of the Province's debt of Series FB 4.7% 3,000,000.0 Yen due 27 September 2004. Interest is payable semi-annually in Canadian dollars at a floating rate.
(7)
Canadian $55,100.0 represents the amount payable under an interest rate and currency swap agreement with a counter-party for the repayment at maturity of the Province's debt of Series FA 4.76% 4,000,000.0 Yen due 1 October 2004. Interest is payable quarterly in Canadian dollars at a floating rate.
(8)
Swiss Franc 100,000.0 represents the amount payable under a swap transaction for the repayment at maturity of a portion of series FQ $150,000.0 due 3 November 2006. The remaining $54,932.2 of series FQ is repayable in Canadian dollars. Interest is payable semi-annually in Canadian dollars.
(9)
In October 1998, the Province issued an additional $250,000.0 of its Series FR debentures.
(10)
In February 1999, the Province issued an additional $250,000.0 of its Series FT debentures.
(11)
In September 1999, the Province issued an additional $250,000.0 of its Series FU debentures.
(12)
Puttable at par on 15 December 2007 at the option of the note holder with 10 calendar days notice. The interest rate is 5.75% to 15 December 2007. After this date, until maturity, the interest rate is 6.29%.
(13)
In December 2000, the Province issued an additional $300,000.0 of its Series FW debentures.
(14)
In June 2001, the Province issued an additional $300,000.0 of its Series FX debentures.
(15)
In February 2002, the Province issued an additional $300,000.0 of its Series FY debentures.
(16)
In August 2002, the Province issued an additional $300,000.0 of its Series FZ debentures.
(17)
Canadian $791,500.0 represents the amount payable under an interest rate and currency swap agreement with a counter-party for the repayment at maturity of the Province's debt of Series GA 3.50% $500,000.0 US due 23 October 2007. Interest is payable semi-annually in Canadian dollars at a fixed rate.
50
Exhibit "d" Current Province of New Brunswick Description
FOREIGN EXCHANGE
Canada maintains a floating exchange rate for the Canadian dollar to permit the rate to be determined by fundamental market forces without intervention except as required to maintain orderly conditions.
Spot exchange rates for the U.S. dollar, Japanese yen and Swiss franc in Canada, expressed in Canadian dollars, are shown in the table below for 1999 through 2003.
Average of Noon Spot Rates | | 1999 | | 2000 | | 2001 | | 2002 | | 2003 |
| | | | | | | | | | | |
U.S. Dollar | $ | 1.4859 | $ | 1.4852 | $ | 1.5489 | $ | 1.5704 | $ | 1.4014 |
Japanese Yen (100 yen) | | 1.3110 | | 1.3780 | | 1.2755 | | 1.2554 | | 1.2088 |
Swiss Franc | | 0.9901 | | 0.8796 | | 0.9189 | | 1.0112 | | 1.0418 |
Source: Bank of Canada
SOURCES OF INFORMATION
Information included herein which is designated as being taken from a publication of the Province or Canada, or any agency or instrumentality of either, is included herein upon the authority of such publication as a public official document.
The financial statements of the Province included herein under the heading "Tables and Supplementary Information of the Province" have been taken from the Public Accounts of the Province (subject to certain adjustments for purposes of comparability) and the forecast of revenue and expenditure published in the Budget Estimates. All financial information of the Province contained herein was obtained from the annual Budget and Main Estimates, the financial reviews pertaining thereto and the Public Accounts, or was prepared by representatives of the Department of Finance in their official capacities. The information set forth under "Province of New Brunswick", and other than as described in the preceding paragraph, was prepared by representatives of the Department of Finance in their official capacities.
51
Exhibit "e" Audited Financial Statements of the Province of New Brunswick
Audited Financial Statements
Province of New Brunswick
For fiscal year ended March 31, 2004


ii | PROVINCE OF NEW BRUNSWICK | 2004 |
To His Honour,
The Honourable Hermenegilde Chiasson
Lieutenant-Governor of the Province of New Brunswick
The undersigned has the honour to submit the Public Accounts of the Province of New Brunswick for the fiscal year ended 31 March 2004.
I am, Your Honour,
JEANNOT VOLPE
Minister of Finance
Fredericton, New Brunswick
29 October 2004
The Honourable Jeannot Volpe
Minister of Finance
Sir:
The undersigned has the honour to present to you the Public Accounts of the Province of New Brunswick for the fiscal year ended 31 March 2004.
Respectfully submitted,
Mike Ferguson, C.A.
Comptroller
Fredericton, New Brunswick
29 October 2004
2004 | PROVINCE OF NEW BRUNSWICK | iii |
| | | | |
| | | | |
| | | | |
| | | | |
| | | | |
| TABLE OF CONTENTS |
| | | | |
| Audited Financial Statements |
| | | | |
| Introduction to Volume I | | 1 | |
| | | | |
| Statement of Responsibility | | 2 | |
| | | | |
| Results for the Year | | 3 | |
| | | | |
| Major Variance Analysis | | 5 | |
| | | | |
| Auditor's Report | | 9 | |
| | | | |
| Statement of Financial Position | 10 | |
| | | | |
| Statement of Revenue and Expenditure | 11 | |
| | | | |
| Statement of Cash Flow | | 12 | |
| | | | |
| Statement of Net Debt | | 13 | |
| | | | |
| Notes to the Financial Statements | 14 | |
| | | | |
| Schedules to the Financial Statements | 43 | |
2004 | PROVINCE OF NEW BRUNSWICK | 1 |
INTRODUCTION
VOLUME I
The Public Accounts of the Province of New Brunswick are presented in five volumes.
This volume contains the audited financial statements of the Provincial Reporting Entity as described in note 1 to the financial statements. They include a Statement of Financial Position, a Statement of Revenue and Expenditure, a Statement of Cash Flow and a Statement of Net Debt. This volume also contains the Auditor's Report, Statement of Responsibility and a variance analysis.
Volume II contains unaudited supplementary information to the Financial Statements presented in Volume I. It presents summary statements for revenue and expenditure as well as five-year comparative statements. This volume also contains detailed information on Supplementary Appropriations, Funded Debt, statements of the General Sinking Fund, Securities Held, and revenue and expenditure by government department (this includes salary, travel, supplier, grant and contribution, and loan disbursement listings).
Volume III contains the financial statements of those corporations, boards and commissions which are accountable for the administration of their financial affairs and resources to the Government or the Legislature of the Province. The Government or Legislature also has the power to control these organizations either through ownership or through legislative provisions.
Volume IV contains the financial statements of various trust funds which the Province administers as Trustee.
Volume V contains salary listings of certain government organizations, including Regional Health Authorities, New Brunswick Power Corporation, and New Brunswick Liquor Corporation. The salary listings are for employees who received earnings during the year ended 31 December 2003 in excess of $40,000.
2 | PROVINCE OF NEW BRUNSWICK | 2004 |

STATEMENT OF RESPONSIBILITY
The financial statements of the Province of New Brunswick are prepared each year by the Comptroller as required under section 12 of the Financial Administration Act. The financial statements include a Statement of Financial Position, a Statement of Revenue and Expenditure, a Statement of Cash Flow and a Statement of Net Debt.
Financial statement integrity and objectivity are the responsibility of the Government. To help fulfil this responsibility, systems of internal control have been established to provide reasonable assurance that transactions are properly authorized, executed and reported. The statements are prepared in accordance with the accounting policies described in Note 1 to the Financial Statements.
On behalf of the Government:
Honourable Jeannot Volpe
Minister of Finance
13 October 2004
2004 | PROVINCE OF NEW BRUNSWICK | 3 |
RESULTS FOR THE YEAR
The Government uses multiple measures to guide its fiscal management, a number of which are described below.
Net Debt and Net Debt as a Percentage of Gross Domestic Product
The most important indicators are the trend in the change in Net Debt and the trend in the ratio that compares the Province's Net Debt to its Gross Domestic Product (GDP).
Net Debt
31 March 2004 was the end of the four year Balanced Budget Period that began 1 April 2000. The Province's Financial Statements for the year ended 31 March 2000 reported Net Debt of $ 6,807.7 million. Since then, required accounting changes related to NB Power and Workplace Health Safety and Compensation Commission have resulted in restating Net Debt. The Auditor General reported in his 2003 Annual Report, Volume II that the restated Net Debt at 31 March 2000 was $6,925.3 million. The Province's audited Net Debt at 31 March 2004 is $6,816.1 million, a reduction of $109.2 million. In other terms, the Province has generated a four year surplus of $109.2 million.
(millions)
| Year | 2000 | 2001 | 2002 | 2003 | 2004 | |
| Net Debt | $ 6,925.3 | $ 6,782.0 | $ 6,603.6 | $ 6,712.9 | $ 6,816.1 | |
Net Debt increased during the year ended 31 March 2004 by $103.2 million, the amount of the deficit for the year. This was $2.2 million higher than originally budgeted, however, it is important to judge that increase against the decreases in Net Debt achieved since 2000.
Net Debt as a Percentage of Gross Domestic Product
At 31 December 1999, the Province's Gross Domestic Product was $19,041 million. Therefore the restated Net Debt as at 31 March 2000 was 36.4% of GDP at the time. This was also reported by the Auditor General in his 2003 Annual Report, Volume II. The Province's GDP at 31 December 2003 was $22,358 million, so the Net Debt to GDP ratio stands at 30.5% for the year ended 31 March 2004.
(millions) | |
| Year | | 2000 | | | 2001 | | | 2002 | | | 2003 | | | 2004 | |
| GDP | $ | 19,041.0 | | $ | 20,178.0 | | $ | 20,772.0 | | $ | 21,163.0 | | $ | 22,358.0 | |
| Net Debt | | 6,925.3 | | | 6,782.0 | | | 6,603.6 | | | 6,712.9 | | | 6,816.1 | |
| Ratio | | 36.4% | | | 33.6% | | | 31.8% | | | 31.7% | | | 30.5% | |
The four year reduction in net debt of $109.2 million and the four year improvement in the Net Debt to GDP ratio (a reduction of 5.9% compared to the starting point of 36.4%) have both been calculated using numbers accepted by the Auditor General without further adjustment.
Even with an increase in Net Debt during the year ended 31 March 2004, the Net Debt to GDP ratio improved significantly from 31.7% to 30.5%.
4 | PROVINCE OF NEW BRUNSWICK | 2004 |
Debt Charges
The Province's Debt Charges for the year ended 31 March 2004, calculated as the amount spent on servicing the public debt less sinking fund earnings, totaled $360.4 million, $46.6 million less than what the Province spent in 2000.
Other Measures
In addition to these measures, the Province tracks other performance measures using adjusted numbers.
Balanced Budget Results
31 March 2004 was the end of the four year Balanced Budget Period that began 1 April 2000. During that period, the Government generated a $247.2 million surplus for Balanced Budget purposes.
The Surplus for Balanced Budget purposes for the year ended 31 March 2004 was $ 0.1 million.
The calculation of surplus under balanced budget legislation requires certain adjustments to revenue from Provincial Entitlements. It also says that changes to accounting policies are not to be applied retroactively. For these two reasons, the calculation of surplus under balanced budget legislation results in a different number than shown on the Province's Statement of Revenue and Expenditure.
Results for Fiscal Policy Purposes
During the year ended 31 March 2001, the Province established a Fiscal Stabilization Fund as another fiscal management tool. During the year ended 31 March 2004, the Province removed the balance of this fund resulting in a deficit for fiscal policy purposes for the year of $13.6 million. This represented a $7.7 million improvement on the deficit for fiscal policy purposes which was expected when the 2004-2005 budget was tabled.
Over the four year period beginning 1 April 2000 and ending 31 March 2004, a cumulative surplus for fiscal policy purposes of $109.2 million has been achieved.
| Year | 2001 | 2002 | 2003 | 2004 | Total | |
| Year Fiscal Policy Surplus | $ 43.3 | $ 78.5 | $ 1.0 | $ (13.6) | $ 109.2 | |
The Government has changed how it reports the results for fiscal policy purposes in its Financial Statements consistent with the Public Sector Accounting Board's new guidelines. These results are now disclosed in the Notes to the Financial Statements.
2004 | PROVINCE OF NEW BRUNSWICK | 5 |
2003-2004
MAJOR VARIANCE ANALYSIS
Explanations of major variances are described below, first for revenue, followed by expenditure. In this analysis, comparisons are made between the actual results for 2003-2004 and either the 2003-2004 budget or actual results for 2002-2003.
REVENUE
Provincial Sources
Taxes on Consumption
Taxes on consumption are $72.1 million higher than budgeted. This is mainly due to an increase in harmonized sales tax (HST) revenue of $68.4 million that reflects large prior-year adjustments for the 1999 to 2002 taxation years and a higher federal estimate of New Brunswick's portion of the harmonized sales tax.
Taxes on consumption are $89.3 million higher than the previous year. This is largely due to an increase in harmonized sales tax revenue of $67.1 million reflecting an increase in federal estimates of New Brunswick's portion of the harmonized sales tax as well as positive prior-year adjustments. In addition, gasoline and motive fuel tax revenue is up $12.8 million, reflecting the annualized impact of the December 2002 tax increase. Tobacco tax revenue increased $9.4 million over the previous year, reflecting the full impact of the tax increases in June 2002 and December 2002.
Taxes on Income
Taxes on income are down $5.8 million from budget. This is primarily due to a $31.2 million decrease in corporate income tax revenue largely due to a negative prior-year adjustment with respect to the 2002 taxation year. This is offset by an increase of $28.2 million for personal income tax revenue that reflects a higher than anticipated yield from the personal income tax system along with a positive prior-year adjustment with respect to the 2002 taxation year.
Taxes on income are $14.1 million higher than the previous year. This is attributable to a $41.4 million increase in personal income tax revenue resulting from growth in the personal income tax base. This is offset by a $23.8 million decrease in corporate income tax revenue reflecting tax reductions and a significant negative prior-year adjustment in 2003-2004.
Other Taxes
Other taxes are $13.0 million higher than budgeted, mainly due to an increase of $11.0 million in large corporation capital tax revenue that is the result of a positive prior-year adjustment with respect to the 2002 taxation year.
Other taxes are $18.5 million higher than the previous year due to higher revenue from insurance premium taxes and large corporation capital tax. Insurance premium tax revenue is up $7.9 million due to increased value and volume of policies issued and in-year accounting adjustments. Large corporation capital tax revenue is up $8.7 million due to a positive prior-year adjustment affecting 2003-2004 revenues.
6 | PROVINCE OF NEW BRUNSWICK | 2004 |
Investment Income
Investment income is down $54.4 million from budget. This decrease is primarily due to NB Power Corp. reporting a net loss of $18.0 million. This was a decrease of $58.0 million from budget largely due to the one-time write-off for costs associated with a fuel handling system for Coleson Cove.
Investment income is $76.0 million higher than the previous year. This increase is primarily due to a year-over-year improvement in NB Power Corp.'s net results of $59.4 million. This improvement is largely attributable to improved performance from hydro generation and an improved capacity factor at Point Lepreau.
Sinking Fund Earnings
Sinking fund earnings are down $22.5 million from budget mainly due to lower than forecasted interest rates and a stronger than forecasted Canadian dollar.
Sinking fund earnings are down $20.5 million year-over-year due to lower net gains on the disposal of debentures relative to the previous year.
FEDERAL SOURCES
Health and Social Transfers
Health and Social Transfers are $34.1 million higher than budgeted due to additional federal funding resulting from the 2003 First Ministers' Accord on Health Care Renewal.
Health and Social Transfers are up $46.3 million over the previous year due to increased federal funding levels.
Fiscal Equalization Payments
Fiscal equalization payments are down $112.7 million from budget due to changes in population and lower-than-anticipated fiscal disparities among provinces. The weakened Ontario economy was the main contributor.
Fiscal equalization payments are down $57.6 million from the previous year due to negative prior-year adjustments and lower payments with respect to 2003-2004. The latter is attributable to narrowing fiscal disparities among provinces.
Conditional Grants - Canada
Conditional grants are up $42.4 million from budget. This increase is attributable to new federal funding from the Diagnostic and Medical Equipment Trust of $12.2 million, as well as an increase in funding of $13.4 million for Regional Health Authorities from external sources. Other contributing factors are a reallocation of revenues within the Department of Education for $7.0 million and smaller increases within other departments.
2004 | PROVINCE OF NEW BRUNSWICK | 7 |
Conditional grants are up $27.6 million over the previous year. This is largely attributable to an increase in capital recoveries from the federal government of $9.7 million, primarily for highway improvement and infrastructure. Also, Regional Health Authorities received additional funding of $10.6 million from external sources.
EXPENDITURE
Education
Education expenditures were $7.6 million below budget primarily because Teachers' Pension Plan expense was less than anticipated, and because of the introduction of a property tax exemption for university properties. These were partially offset by an increase in the provision for loss in the Student Financial Assistance program.
Education expenditures were $43.4 million higher than in 2002-03 mainly due to Teachers' Pension Plan expense, negotiated wage increases including the teachers' collective agreement, and enhanced access to post-secondary education.
Health
Health expenditures were $68.7 million higher than budget mainly due to increased expenditures in Hospital Services and Medicare.
Health expenditures were $123.7 million higher than 2002-03 mainly due to increased expenditures in Hospital Services, Medicare, Prescription Drug Program and Capital Account expenditures.
Family and Community Services
Family and Community Services expenditures were $1.1 million higher than budget because of higher than projected provision for loss for Social Assistance payments.
Family and Community Services expenditures were $17.5 million higher than 2002-03 primarily due to general increases in the Family and Community Social Services Program.
Protection Services
Protection Services expenditures were $1.5 million lower than in 2002-03 primarily due to a lower level of capital expenditures relating to courthouses within this sector.
Economic Development
Economic Development expenditures were $26.4 million higher than budget mainly due to increased expenditures in Business New Brunswick's provision for loss and Strategic Assistance programs.
Economic Development expenditures were $15.5 million higher than in 2002-03 mainly due to increased expenditures in Business New Brunswick's provision for loss.
8 | PROVINCE OF NEW BRUNSWICK | 2004 |
Employment Development and Labour
Employment Development and Labour expenditures were $5.9 million lower than budget because of lower than anticipated demand for services.
Employment Development and Labour expenditures were $8.4 million higher than 2002-2003 mainly due to an increase in services to clients in the areas of job creation and training.
Resource Sector
Resource Sector expenditures were $11.7 million higher than budget and $19.9 million higher than 2002-03 mainly due to increased spending in silviculture and mineral exploration, increased provision for loss associated with Agriculture, Fisheries & Aquaculture and the inclusion of the NB Tire Stewardship Board expenditures within this sector.
Transportation
Transportation expenditures were $11.0 million higher than budget due to increased spending on highway construction and winter maintenance. These increases were partially offset by reductions achieved in other program areas.
Transportation expenditures were $33.2 million higher than in 2002-03 mainly due to an increased capital budget.
Central Government
Central Government expenditures were $20.1 million lower than budget mainly due to savings in General Government's Supplementary Funding Provision and lower than anticipated pension expense.
Central Government expenditures were $30.3 million higher than 2002-03 mainly due to increased pension expense, costs associated with the 2003 Provincial Election and higher than anticipated provision for loss expense.
Service of the Public Debt
Service of the Public Debt expenditures were $113.9 million lower than budget due to the significantly stronger than forecast Canadian dollar and lower than forecast short-term interest expense.
Service of the Public Debt expenditures were $78.0 million lower than 2002-03 due mainly to the significant strengthening of the Canadian dollar.
2004 | PROVINCE OF NEW BRUNSWICK | 9 |

AUDITOR'S REPORT
To the Legislative Assembly
Province of New Brunswick
I have audited the statement of financial position of the Province of New Brunswick as at 31 March 2004 and the statements of revenue and expenditure, cash flow and net debt for the year then ended. These financial statements are the responsibility of government. My responsibility is to express an opinion on these financial statements based on my audit.
I conducted my audit in accordance with Canadian generally accepted auditing standards. Those standards require that I plan and perform an audit to obtain reasonable assurance whether the financial statements are free of material misstatement. An audit includes examining, on a test basis, evidence supporting the amounts and disclosures in the financial statements. An audit also includes assessing the accounting principles used and significant estimates made by government, as well as evaluating the overall financial statement presentation.
In my opinion, these financial statements present fairly, in all material respects, the financial position of the Province as at 31 March 2004 and the results of its operations and its cash flows for the year then ended in accordance with the accounting policies set out in Note 1 to the financial statements. As required by the Auditor General Act, I report that, in my opinion, these policies have been applied on a basis consistent with that of the preceding year.
Daryl C. Wilson, FCA
Auditor General
1 September 2004
Office of the Auditor General
P.O. Box 758
Fredericton, New Brunswick E3B 5B4
10 | PROVINCE OF NEW BRUNSWICK | 2004 |
| | | | | | | | | | |
STATEMENT OF FINANCIAL POSITION |
as at 31 March 2004 | |
| | | | | | | | | | |
| | | | | (millions) | |
| Schedule | | | 2004 | | | 2003 | |
| | | | | | | | | | |
| | ASSETS | | | | | | | | |
| | | | | | | | | | |
| 7 | Cash Net of Short Term Borrowing | $ | | 9.8 | | $ | --- | |
| 1 | Accounts and Interest Receivable | | 357.8 | | | 326.0 | |
| 2 | Taxes Receivable | | | 466.6 | | | 417.5 | |
| 3 | Inventories | | | 43.3 | | | 43.2 | |
| 4 | Prepaid and Deferred Charges | | 111.2 | | | 125.6 | |
| | Unrealized Foreign Exchange Losses | | --- | | | 59.7 | |
| 5 | Loans and Advances | | | 126.3 | | | 148.4 | |
| 6 | Investments | | | (146.4) | | | (99.6) | |
| | Total Assets | | $ | 968.6 | | $ | 1,020.8 | |
| | | | | | | | | | |
| | | | | | | | | | |
| | LIABILITIES | | | | | | | | |
| | | | | | | | | | |
| 7 | Bank Advances and Short Term Borrowing | $ | | --- | | $ | 26.8 | |
| 8 | Accounts Payable | | | 658.5 | | | 509.4 | |
| 9 | Accrued Expenditures | | | 780.4 | | | 710.1 | |
| | Unrealized Foreign Exchange Gains | | 22.8 | | | | |
| 10 | Allowance for Losses | | | 75.8 | | | 50.2 | |
| 11 | Deferred Revenue | | | 294.5 | | | 287.9 | |
| 12 | Deposits Held in Trust | | | 45.8 | | | 37.8 | |
| 13 | Obligations under Capital Leases (Note 8) | | 865.8 | | | 873.7 | |
| | Pension Liability (Note 13) | | 271.5 | | | 362.1 | |
| | | | | 3,015.1 | | | 2,858.0 | |
| | | | | | | | | | |
| | | | | | | | | | |
| | | | | | | | | | |
| | Funded Debt (Note 11) | | | 11,583.8 | | | 11,391.5 | |
| | Borrowing for NB Power Corporation | | (3,098.0) | | | (2,972.8) | |
| | Funded Debt for Provincial Purposes | | 8,485.8 | | | 8,418.7 | |
| | | | | | | | | | |
| | Sinking Fund Investments | | (3,716.2) | | | (3,543.0) | |
| | | | | 4,769.6 | | | 4,875.7 | |
| | Total Liabilities | | | 7,784.7 | | | 7,733.7 | |
| | | | | | | | | | |
| | NET DEBT | | | (6,816.1) | | | (6,712.9) | |
| | | | $ | 968.6 | | $ | 1,020.8 | |
| | | | | | | | | | |
| | Contingent Liabilities - See Note 14 | | | | | | | |
| | Commitments - See Note 15 | | | | | | | |
| | |
| The accompanying notes are an integral part of these Financial Statements. | |
| | |
| Mike Ferguson, C.A. Comptroller | |
2004 | PROVINCE OF NEW BRUNSWICK | 11 |
| | | | | | | | | | | |
STATEMENT OF REVENUE AND EXPENDITURE |
for the fiscal year ended 31 March 2004 |
| | | | | | | | | | | |
| | | (millions) | |
| Schedule | 2004 | | | 2004 | | | 2003 | |
| | | Budget | | | Actual | | | Actual | |
| | REVENUE | | | | | | | | | |
| | Provincial Sources | | | | | | | | | |
| 14 | Taxes on Consumption | $ | 1,067.3 | | $ | 1,139.4 | | $ | 1,050.1 | |
| | Taxes on Property | | 314.8 | | | 303.9 | | | 295.0 | |
| 15 | Taxes on Income | | 1,071.4 | | | 1,065.6 | | | 1,051.5 | |
| 16 | Other Taxes | | 90.5 | | | 103.5 | | | 85.0 | |
| 17 | Licenses and Permits | | 104.5 | | | 104.1 | | | 103.0 | |
| 18 | Royalties | | 63.4 | | | 70.4 | | | 60.0 | |
| 19 | Investment Income | | 307.1 | | | 252.7 | | | 176.7 | |
| 20 | Other Provincial Revenue | | 264.2 | | | 271.6 | | | 267.1 | |
| | Sinking Fund Earnings | | 245.0 | | | 222.5 | | | 243.0 | |
| | | | 3,528.2 | | | 3,533.7 | | | 3,331.4 | |
| | | | | | | | | | | |
| | Federal Sources | | | | | | | | | |
| | Health and Social Transfers | | 511.1 | | | 545.2 | | | 498.9 | |
| | Fiscal Equalization Payments | | 1,202.0 | | | 1,089.3 | | | 1,146.9 | |
| | Other Unconditional Grants - Canada | | 1.9 | | | 1.9 | | | 1.9 | |
| 21 | Conditional Grants - Canada | | 267.3 | | | 309.7 | | | 282.1 | |
| | | | 1,982.3 | | | 1,946.1 | | | 1,929.8 | |
| | | | 5,510.5 | | | 5,479.8 | | | 5,261.2 | |
| | | | | | | | | | | |
| | EXPENDITURE | | | | | | | | | |
| 22 | Education | | 1,071.2 | | | 1,063.6 | | | 1,020.2 | |
| 23 | Health | | 1,632.4 | | | 1,701.1 | | | 1,577.4 | |
| 24 | Family and Community Services | | 714.4 | | | 715.5 | | | 698.0 | |
| 25 | Protection Services | | 145.6 | | | 145.7 | | | 147.2 | |
| 26 | Economic Development | | 139.2 | | | 165.6 | | | 150.1 | |
| 27 | Employment Development and Labour | | 234.3 | | | 228.4 | | | 220.0 | |
| 28 | Resource Sector | | 153.8 | | | 165.5 | | | 145.6 | |
| 29 | Transportation | | 337.5 | | | 348.5 | | | 315.3 | |
| 30 | Central Government | | 486.3 | | | 466.2 | | | 435.9 | |
| | Service of the Public Debt (Note 12) | | 696.8 | | | 582.9 | | | 660.9 | |
| | | | 5,611.5 | | | 5,583.0 | | | 5,370.6 | |
| | | | | | | | | | | |
| | SURPLUS (DEFICIT) RESULTING IN DECREASE | | | | | | | | | |
| | (INCREASE) IN NET DEBT FOR THE YEAR | $ | (101.0) | | $ | (103.2) | | $ | (109.4) | |
| | | | | | | | | | |
| The accompanying notes are an integral part of these Financial Statements. | | | | |
12 | PROVINCE OF NEW BRUNSWICK | 2004 |
| | | | | | | | |
STATEMENT OF CASH FLOW |
| for the fiscal year ended 31 March 2004 |
| | | | | | | | |
| | | (millions) | |
| | | 2004 | | | 2003 | |
| | | | | | | | |
| OPERATING ACTIVITIES | | | | | | | |
| | | | | | | | |
| Decrease (Increase) in Net Debt for the Year | $ | (103.2) | | $ | (109.4) | |
| Non Cash Items | | | | | | | |
| Amortization of Premiums, Discounts and Issue Expenses | | | 7.4 | | | 7.9 | |
| Foreign Exchange Expense | | (40.3) | | | 35.4 | |
| Increase in Allowance for Doubtful Accounts | | 71.2 | | | 33.1 | |
| Sinking Fund Earnings | | (222.5) | | | (243.0) | |
| Actual Losses Due to Foreign Exchange | | (25.8) | | | (76.7) | |
| Decrease in Pension Liability (Note 13) | | (90.6) | | | (10.5) | |
| Increase (Decrease) in Deferred Revenue | | | 6.6 | | | 1.7 | |
| Capital Asset Acquisitions Charged to Operations | | 233.6 | | | 201.0 | |
| Proceeds from Disposal of Capital Assets | | | (2.0) | | | (3.6) | |
| Decrease in Working Capital | | 124.3 | | | 18.1 | |
| Net Cash From (Used in) Operating Activities | | (41.3) | | | (146.0) | |
| | | | | | | | |
| | | | | | | | |
| INVESTING ACTIVITIES | | | | | | | |
| | | | | | | | |
| Purchase of Capital Assets | | (233.6) | | | (201.0) | |
| Proceeds from Disposal of Capital Assets | | | 2.0 | | | 3.6 | |
| (Increase) Decrease in Investments, Loans and Advances | | 57.7 | | | 64.5 | |
| Net Cash Used in Investing Activities | | (173.9) | | | (132.9) | |
| | | | | | | | |
| | | | | | | | |
| FINANCING ACTIVITIES | | | | | | | |
| | | | | | | | |
| Proceeds from Issuance of Funded Debt | | 617.7 | | | 1,122.6 | |
| Received from Sinking Fund for Redemption of Debentures and | | | | | | | |
| Payment of Exchange | | 171.2 | | | 171.5 | |
| Decrease in Obligations under Capital Leases | | | (7.9) | | | (1.4) | |
| Sinking Fund Instalments | | (121.8) | | | (112.7) | |
| Funded Debt Matured | | (407.4) | | | (568.3) | |
| Net Cash From Financing Activities | | 251.8 | | | 611.7 | |
| | | | | | | | |
| INCREASE IN CASH POSITION DURING YEAR | | 36.6 | | | 332.8 | |
| CASH POSITION - BEGINNING OF YEAR | | (26.8) | | | (359.6) | |
| CASH POSITION - END OF YEAR | $ | | 9.8 | | $ | (26.8) | |
| | | | | | | | |
| | | | | | | | |
| CASH REPRESENTED BY | | | | | | | |
| | | | | | | | |
| Cash (Bank Advances) net of Short Term Borrowing | $ | | 9.8 | | $ | (26.8) | |
| | | | | | | | |
| The accompanying notes are an integral part of these Financial Statements. | | | | | | | |
2004 | PROVINCE OF NEW BRUNSWICK | 13 |
| | | | | | | | | |
| STATEMENT OF NET DEBT |
| for the fiscal year ended 31 March 2004 |
| | | | | | | | | |
| | | | (millions) | |
| | | | 2004 | | | 2003 | |
| | | | | | | | | |
| | | | | | | | | |
| NET DEBT - BEGINNING OF YEAR | | | | | | | |
| | | | | | | | | |
| As Previously Published | | $ | (6,712.9) | | $ | (6,654.1) | |
| Prior Years' Adjustments | | | | | | | | |
| NB Power Accounting Change for Asset Retirement | | --- | | | 44.0 | |
| Workplace Health, Safety and Compensation Commission | | | | | | | |
| Accounting Change for Reporting Entity | | --- | | | | 6.6 | |
| As Restated | | | (6,712.9) | | | (6,603.5) | |
| | | | | | | | | |
| SURPLUS (DEFICIT) RESULTING IN DECREASE | | | | | | | |
| (INCREASE) IN NET DEBT FOR THE YEAR | | (103.2) | | | (109.4) | |
| | | | | | | | | |
| NET DEBT - END OF YEAR | $ | (6,816.1) | | $ | (6,712.9) | |
| | | | | | | | | |
| | | | | | | | | |
The accompanying notes are an integral part of these Financial Statements.
14 | PROVINCE OF NEW BRUNSWICK | 2004 |
NOTES TO THE FINANCIAL STATEMENTS
31 March 2004
NOTE 1
SUMMARY OF SIGNIFICANT ACCOUNTING POLICIES
a) Provincial Reporting Entity
In these financial statements, the Province is defined as the Provincial Reporting Entity. The Provincial Reporting Entity is comprised of certain organizations that are controlled by the government. These organizations are the Consolidated Fund, the General Sinking Fund, the Fiscal Stabilization Fund and certain agencies, commissions and corporations. The agencies, commissions and corporations included in this definition are identified below.
Transactions and balances of organizations are included in these financial statements through one of the following accounting methods:
Consolidation method - This method combines the accounts of distinct organizations. It requires uniform accounting policies for the organizations. Inter-organizational balances and transactions are eliminated under this method. This method reports the organizations as if they were one organization.
Modified equity method - This method is used for government enterprises. Government enterprises are defined in note 9 to these financial statements. The modified equity method reports a government enterprise's net assets as an investment in the Province's Statement of Financial Position. The net income of the government enterprise is reported as investment income in the Province's Statement of Revenue and Expenditure. Inter-organizational transactions and balances are not eliminated. All gains or losses arising from inter-organizational transactions between government enterprises and other government organizations are eliminated. The accounting policies of government enterprises are not adjusted to conform with those of other government organizations.
Transaction method - This method records only transactions between the Province and the other organizations.
Organizations that have been included in the Provincial Reporting Entity through consolidation are:
Algonquin Properties Limited;
Arts Development Trust Fund;
Environmental Trust Fund;
Fiscal Stabilization Fund;
Forest Protection Limited;
Group Insurance Trust Fund;
N.B. Agriexport Inc.;
New Brunswick Credit Union Deposit Insurance Corporation;
New Brunswick Distance Education Network Inc.;
New Brunswick Highway Corporation;
New Brunswick Housing Corporation;
New Brunswick Investment Management Corporation;
New Brunswick Tire Stewardship Board;
Regional Development Corporation;
Regional Health Authorities;
Service New Brunswick;
Sport Development Trust Fund.
2004 | PROVINCE OF NEW BRUNSWICK | 15 |
NOTES TO THE FINANCIAL STATEMENTS
31 March 2004
Government enterprises that have been included in these financial statements through modified equity accounting are:
Algonquin Golf Limited;
Lotteries Commission of New Brunswick;
New Brunswick Liquor Corporation;
New Brunswick Municipal Finance Corporation;
New Brunswick Power Corporation.
Certain organizations that are accountable to the Legislature have been included through the transaction method. The transaction method was used because the appropriate methods would not produce a materially different result. The determination of which entities to exclude because of materiality was made by Board of Management. The organizations included through the transaction method are:
Advisory Council on the Status of Women;
Board of Commissioners of Public Utilities of New Brunswick;
Fundy Linen Services Inc.;
Kings Landing Corporation;
New Brunswick Advisory Council on Youth;
New Brunswick Arts Board;
New Brunswick Crop Insurance Commission;
New Brunswick Museum;
New Brunswick Public Libraries Foundation;
New Brunswick Research and Productivity Council;
Premier's Council on the Status of Disabled Persons;
Provincial Holdings Ltd.;
Strait Crossing Finance Inc.
b) Significant Accounting Policies
Accrual Accounting
Expenditures are recorded for all goods and services received during the fiscal year.
Revenue from Canada under the Federal-Provincial Fiscal Arrangements and Federal Post-Secondary Education and Health Contributions Act, 1977, and the Canada-New Brunswick Tax Collection Agreement is accrued based on information provided by Canada and is subject to adjustment in future years.
All other revenues and recoveries are recorded on an accrual basis.
16 | PROVINCE OF NEW BRUNSWICK | 2004 |
NOTES TO THE FINANCIAL STATEMENTS
31 March 2004
Debt Charges
Interest and other debt service charges are reported in the Statement of Revenue and Expenditure as Service of the Public Debt except as described below:
Because government enterprises are included in the Provincial Reporting Entity through modified equity accounting, the cost of servicing their debt is not included in the Service of the Public Debt expenditure. The cost of servicing the debt of government enterprises is an expenditure included in the calculation of their net profit or loss for the year.
Interest costs imputed on the Province's Accrued Pension Liability are recorded as part of pension expense, which is included in various expenditure functions.
Interest earned on the assets of the General Sinking Fund and on other provincial assets is reported as revenue.
Note 12 to these financial statements reports the components of the Service of the Public Debt Expenditure function and total debt charges.
Government Transfers
Government transfers are transfers of money, such as grants, from a government to an individual, an organization or another government for which the government making the transfer does not receive any goods or services directly in return.
Government transfers are recognized in the Province's financial statements as expenditures or revenues in the period that the events underlying the transfer occurred. Liabilities have been established for any transfers due at 31 March 2004 for which the intended recipients have met the eligibility criteria. Receivables have been established for transfers to which the Province is entitled under governing legislation, regulation or agreement.
During the year ended 31 March 2001, a supplement to the Canada Health and Social Transfer of $60.4 million was received from Canada. This is being recognized as revenue on a straight-line basis over four years.
Physical Assets
The cost of acquiring physical assets is expensed in the year of acquisition. The Statement of Financial Position does not report an amount for these assets. See note 18 regarding Tangible Capital Assets.
Short Term Investments
Short term investments are recorded at cost.
Allowances
Allowances have been established for accounts receivable, loan guarantees and other possible losses. These allowances are disclosed in the schedules to the financial statements.
2004 | PROVINCE OF NEW BRUNSWICK | 17 |
NOTES TO THE FINANCIAL STATEMENTS
31 March 2004
Concessionary Loans
There are two situations where the Province charges loan disbursements entirely as expenditures. These are:
Loan agreements which commit the Province to provide future grants to the debtor to be used to repay the loan.
Loan agreements which include forgiveness provisions if the forgiveness is considered likely.
In both these situations, the loan is charged to expenditure when it is disbursed.
Loans that are significantly concessionary because they earn a low rate of return are originally recorded as assets at the net present value of the expected future cash flows. The net present value is calculated using the Province's borrowing rate at the time the loan was issued. The difference between the nominal value of the loan and its net present value is recorded as an expenditure.
Inventories
Inventories are recorded at the lower of cost or net realizable value. Inventories include supplies for use, and goods and properties held for resale. Properties held for resale include land and fixtures acquired or constructed for the purpose of sale. Properties held for resale also include properties acquired through foreclosure. Properties acquired through foreclosure which have not been disposed of within two fiscal year ends of repossession are removed from inventory and are recorded as expenditure.
Deferred Revenue
Amounts received or recorded as receivable but not earned by the end of the fiscal year are recorded as deferred revenue.
Deposits Held in Trust
Any funds remitted to the Province and held in trust for specified persons are included in both the financial assets and liabilities of the Province. Legally established trust funds which the Province administers but does not control are not included as Provincial assets or liabilities. Note 17 to these financial statements discloses the equity balances of the trust funds administered by the Province.
Borrowing on Behalf of New Brunswick Power Corporation
The Province, as represented by the Consolidated Fund, has issued long term debt securities on behalf of New Brunswick Power Corporation in exchange for debentures with like terms and conditions.
The New Brunswick Power Corporation debentures received by the Province are reported in the Statement of Financial Position as a reduction of Funded Debt. This financing arrangement was used to obtain more favourable debt servicing costs. The transactions involving these securities, including the debt servicing costs, are not part of the budget plan of the Province's Consolidated Fund.
18 | PROVINCE OF NEW BRUNSWICK | 2004 |
NOTES TO THE FINANCIAL STATEMENTS
31 March 2004
Foreign Currency Translation
The Province's assets, liabilities and contingent liabilities denominated in foreign currencies are translated to Canadian dollars at the year end rates of exchange, except where such items have been hedged or are subject to interest rate and currency swap agreements. In such cases, the rates established by the hedge or the agreements are used in the translation. Revenue and expenditure items are translated at the rates of exchange in effect at the respective transaction dates.
Exchange gains and losses are included in the Statement of Revenue and Expenditure except for the unrealized exchange gains and losses arising on the translation of long term items, which are deferred and amortized on a straight line basis over the remaining life of the related assets or liabilities.
Leases
Long term leases, under which the Province, as lessee, assumes substantially all the benefits and risks of ownership of leased property, are classified as capital leases although certain minimum dollar thresholds are in place for practical reasons. The present value of a capital lease is accounted for as an expenditure and an obligation at the inception of the lease.
All leases under which the Province does not assume substantially all the benefits and risks of ownership related to the leased property are classified as operating leases. Each rental payment required by an operating lease is recorded as an expenditure when it is due.
Measurement Uncertainty
Measurement uncertainty is uncertainty in the determination of the amount at which an item is recognized in financial statements. This uncertainty exists when there is a variance between the recognized amount and another reasonably possible amount. Many items in these financial statements have been measured using estimates. Those estimates have been based on assumptions that reflect economic conditions.
Some examples of where measurement uncertainty exists are the establishment of allowances for doubtful accounts and the determination of pension expense.
NOTE 2
BUDGET
The budget amounts included in these financial statements are the amounts published in the Main Estimates, adjusted for transfers from the Supplementary Funding Provision Program and elimination of inter-account transactions.
The Supplementary Funding Provision Program is an appropriation which provides funding to other programs for costs associated with contract settlements and other requirements not budgeted in a specific program.
Budget figures for the year ending 31 March 2004 have also been adjusted to include estimated revenue and expenditures, as approved by Board of Management, for those entities which are included in the reporting entity through consolidation.
2004 | PROVINCE OF NEW BRUNSWICK | 19 |
NOTES TO THE FINANCIAL STATEMENTS
31 March 2004
NOTE 3
BALANCING OF EXPENDITURE AND REVENUE
The Province's Balanced Budget Act requires that total expenditures not exceed total revenues for the period commencing 1 April 2000 and ending 31 March 2004.
That Act stipulates that any change made within the last fifteen months of the period from 1 April 2000 to 31 March 2004, or after completion of that period, in relation to the official estimates by the Government of Canada for provincial entitlements under the Federal-Provincial Fiscal Arrangements and Federal Post-Secondary Education and Health Contributions Act or the Canada-New Brunswick Tax Collection Agreement, shall not be taken into account.
The difference for the period ending 31 March 2004 between revenue and expenditure is as follows:
| | (millions) |
| | 2001 | 2002 | | 2003 | 2004 |
| | Actual | Actual | | Actual | Actual |
| | | | | | |
Revenue | $ 4,901.0 | $ 5,216.7 | |
$ 5,261.2 | $ 5,479.8 | Add: Changes in Provincial Entitlements from | | | | | |
Canada | | | | | |
(Section 6(1)) after December 2002 | --- | --- | | 30.9 | 41.2 |
(Section 6(2)) for 2003-2004 | --- | --- | | --- | 62.1 |
Adjusted Revenue | 4,901.0 | 5,216.7 | | 5,292.1 | 5,583.1 |
| | | | | | |
Expenditure | 4,719.2 | 5,072.9 | | 5,370.6 | 5,583.0 |
Adjusted Surplus (Deficit) for the year | 181.8 | 143.8 | | (78.5) | 0.1 |
Cumulative Difference - Beginning of Year | ---
| 181.8 | | 325.6 | 247.1 |
Cumulative Difference - End of Year | $ 181.8 | $ 325.6 | | $ 247.1 | $ 247.2 |
NOTE 4 FISCAL STABILIZATION FUND
The Province's Fiscal Stabilization Fund Act establishes a fund separate from the Consolidated Fund, for the purpose of assisting in stabilizing the fiscal position of the Province of New Brunswick from year to year and to improve long term fiscal planning.
Any transfers into the Fiscal Stabilization Fund are authorized by an appropriation in accordance with the Financial Administration Act. All transfers out of the Fund are made with the approval of the Lieutenant-Governor-in-Council. The Fund has been included in these financial statements on a consolidated basis.
For the year ending 31 March 2004, the remaining balance of $104.2 million was transferred from the Fiscal Stabilization Fund to the Consolidated Fund. Of this amount $14.6 million is interest that has been reported as revenue and $89.6 million is the remaining principal of the fund.
The Province's Surplus (Deficit) for fiscal policy purposes is as follows:
| | (millions) |
| | 2004 Budget | 2004 Actual | 2003 Actual |
| | | | |
Surplus (Deficit) resulting in Decrease (Increase) in Net Debt for the year |
$ (101.0) |
$ (103.2) |
$ (109.4) |
Transfer from Fiscal Stabilization Fund | 108.5 | 89.6 | 110.4 |
| | | | |
Surplus (Deficit) for fiscal policy purposes | $ 7.5 | $ (13.6) | $ 1.0 |
20 | PROVINCE OF NEW BRUNSWICK | 2004 |
NOTES TO THE FINANCIAL STATEMENTS
31 March 2004
NOTE 5 LOANS AND ADVANCES
In addition to establishing budgets for various revenue and expenditure classifications, the Province budgets disbursements and recoveries for loans and advances. The budgeted amounts and actual results for the year ended 31 March 2004, and the actual results for the year ended 31 March 2003 are as follows:
| | (millions) |
| | 2004 Budget | 2004 Actual | 2003 Actual |
| | | | |
Disbursements | | | |
Agricultural Development Act | $ 3.0 | $ 0.2 | $ 0.5 |
Economic Development Act | 42.0 | 13.3 | 19.5 |
Fisheries Development Act | 5.0 | 0.5 | 1.7 |
Housing | 7.1 | 4.8 | 5.1 |
Loan to Municipality | --- | --- | 0.5 |
Veterans' Affairs | --- | 0.9 | 1.3 |
Other | 1.6 | ---
| ---
|
Total Disbursements | 58.7 | 19.7 | 28.6 |
| | | | |
Recoveries | | | |
Agricultural Development Act | 0.3 | 0.5 | 0.6 |
Economic Development Act | 9.0 | 25.8 | 12.6 |
Finance | 0.3 | 0.3 | 0.2 |
Fisheries Development Act | 3.0 | 2.9 | 3.8 |
Housing | 3.6 | 4.2 | 4.3 |
Provincial Holdings Ltd. | 0.3 | 0.3 | 0.4 |
Veterans' Affairs | 1.4 | 1.3 | 0.3 |
Other | 0.3 | 0.3 | 0.4 |
Total Recoveries |
18.2 |
35.6 |
22.6 |
Net Loans and Advances | $ 40.5 | $ (15.9) | $ 6.0 |
2004 | PROVINCE OF NEW BRUNSWICK | 21 |
NOTES TO THE FINANCIAL STATEMENTS
31 March 2004
NOTE 6
SPECIAL PURPOSE ACCOUNTS
Special Purpose Account revenue earned but not spent accumulates as a surplus in that account and may be spent in future years for the purposes specified. At 31 March 2004, the accumulated surplus in all Special Purpose Accounts totaled $72.2 million ($68.0 million 2003). This total is recorded as a reduction in net debt. The following table summarizes the change in the accumulated Special Purpose Account surplus.
| | | (millions) |
| | 2003 | 2004 |
| | Accumulated Surplus |
Revenue |
Expenditure | Accumulated Surplus |
| | | | | |
Education | | | | |
Canada Student Loans | $ 0.4 | $ 9.4 | $ 9.4 | $ 0.4 |
Fred Magee Account | 0.3 | --- | --- | 0.3 |
Library Account | 0.4 | 0.1 | 0.2 | 0.3 |
Scholarship and Trusts | --- | 0.2 | 0.2 | --- |
Self Sustaining Accounts | 5.2 | 9.3 | 8.9 | 5.6 |
Environment and Local Government | | | | |
Environmental Trust Fund | 3.1 | 5.5 | 5.1 | 3.5 |
Family and Community Services | | | | |
CMHC Funding | 41.2 | 6.0 | 1.8 | 45.4 |
Finance | | | | |
Strait Crossing Finance Inc. | --- | 0.1 | 0.1 | --- |
General Government | | | | |
Active Community School Sport Project | --- | 0.2 | --- | 0.2 |
Arts Development Trust Fund | 0.1 | 0.7 | 0.8 | --- |
Historic Places | --- | 0.4 | 0.4 | --- |
Sport Development Trust Fund | 0.1 | 0.5 | 0.5 | 0.1 |
Health and Wellness | | | | |
Hospital Liability Protection Account | 0.3 | 1.2 | 1.0 | 0.5 |
Medical Research Assistance Account | 3.1 | 0.1 | 0.1 | 3.1 |
Justice | | | | |
Child Centered Family Justice Fund | 0.4 | 0.4 | 0.5 | 0.3 |
Natural Resources | | | | |
Grand Lake Meadows | --- | 0.3 | --- | 0.3 |
Wildlife Trust Fund | 1.3 | 1.1 | 1.1 | 1.3 |
Trail Management Trust Fund | 0.5 | 1.0 | 0.8 | 0.7 |
Recoverable Projects | --- | 0.1 | 0.1 | --- |
Public Safety | | | | |
Municipal Police Assistance Account | 0.2 | 0.7 | 0.5 | 0.4 |
National Safety Code Agreement | 0.1 | 0.3 | 0.3 | 0.1 |
Suspended Driver - Alcohol Re-education Program |
0.1 |
0.3 |
0.4 |
--- |
Victim Services Account | 0.4 | 1.2 | 1.5 | 0.1 |
Supply and Services | | | | |
Land Management Account | 7.7 | 1.1 | 2.6 | 6.2 |
Public/Private Partnership Projects | 0.2 | --- | --- | 0.2 |
Renovation of Old Government House | 0.3 | --- | --- | 0.3 |
Training and Employment Development | | | | |
Johann Wordel Account | 0.1 | --- | --- | 0.1 |
New Brunswick Community College Scholarship Account
|
0.2 |
0.4 |
0.1 |
0.5 |
Recoverable Projects | 2.3 | 0.1 | 0.1 | 2.3 |
| | | | | |
| | $ 68.0 | $ 40.7 | $ 36.5 | $ 72.2 |
22 | PROVINCE OF NEW BRUNSWICK | 2004 |
NOTES TO THE FINANCIAL STATEMENTS
31 March 2004
NOTE 7
SPECIAL OPERATING AGENCIES
Revenue may be generated by the Special Operating Agencies or from transfers from other budgetary accounts. Expenditures are incurred by the agencies in delivering the programs they offer and may be of a capital or operating nature.
Special Operating Agency account revenue earned but not spent in any year, accumulates as a surplus in that account and may with permission from Board of Management be spent in future years. At 31 March 2004, the accumulated surplus in all Special Operating Agency accounts totaled $22.9 million ($18.4 million 2003). This total is recorded as a reduction in net debt. The following table summarizes the change in the accumulated Special Operating Agency surplus during the 2004 fiscal year.
| | | | (millions) |
| | | 2003 | 2004 |
| | | Accumulated Surplus |
Revenue |
Expenditure | Accumulated Surplus |
| | | | | | |
Public Safety | | | | |
| | New Brunswick Safety Code Services | $ 0.4 | $ 4.5 | $ 4.0 | $ 0.9 |
Regional Development Corporation | | | | |
| | Regional Development Corporation | 6.7 | 25.7 | 28.6 | 3.8 |
Tourism and Parks | | | | |
| | Mactaquac Golf Course | 0.7 | 0.8 | 0.7 | 0.8 |
Training and Employment Development | |
| | |
| | New Brunswick Community College | 5.9 | 106.8 | 106.4 | 6.3 |
Transportation | | | | |
| | Vehicle Management | 4.7 | 69.5 | 63.1 | 11.1 |
| | | | | | |
| | | $ 18.4 | $ 207.3 | $ 202.8 | $ 22.9 |
NOTE 8
OBLIGATIONS UNDER CAPITAL LEASES
The total future principal and interest payments for capital leases amount to $1,847.5 million ($1,892.7 million 2003). That amount includes $865.8 million ($873.7 million 2003) in principal and $981.7 million ($1,019.0 million 2003) in interest.
Minimum annual principal and interest payments in each of the next five years are as follows:
Fiscal Year | (millions) |
2004-2005 | $ 77.2 |
2005-2006 | 76.7 |
2006-2007 | 76.7 |
2007-2008 | 76.3 |
2008-2009 | 76.3 |
2004 | PROVINCE OF NEW BRUNSWICK | 23 |
NOTES TO THE FINANCIAL STATEMENTS
31 March 2004
NOTE 9
GOVERNMENT ENTERPRISES
A Government Enterprise is an organization accountable to the Legislative Assembly that has the power to contract in its own name, has the financial and operating authority to carry on a business, sells goods and services to customers outside the Provincial Reporting Entity as its principal activity, and that can, in the normal course of its operations, maintain its operations and meet its liabilities from revenues received from sources outside the Provincial Reporting Entity.
The following is a list of Government Enterprises, and their fiscal year ends, which are included in the Provincial Reporting Entity as described in note 1 a) to these financial statements.
Algonquin Golf Limited | 31-12-03 |
Lotteries Commission of New Brunswick (Lotteries) | 31-03-04 |
New Brunswick Liquor Corporation (Liquor) | 31-03-04 |
New Brunswick Municipal Finance Corporation (Municipal Finance) | 31-12-03 |
New Brunswick Power Corporation (Power) | 31-03-04 |
| | |
The following table presents condensed financial information of these Government Enterprises.
24 | PROVINCE OF NEW BRUNSWICK | 2004 |
NOTES TO THE FINANCIAL STATEMENTS
31 March 2004
| | (millions) |
| | | Algonquin Golf Limited |
Lotteries
|
Liquor
| Municipal Finance |
Power
|
Total
|
Assets | | | | | | | |
Cash and Equivalents | | $ --- | $ --- | $ 0.3 | $ 0.4 | $ 7.0 | $ 7.7 |
Receivables | | --- | 0.8 | 1.7 | 5.2 | 181.0 | 188.7 |
Prepaids | | --- | --- | 0.7 | --- | 3.0 | 3.7 |
Inventories | | 0.1 | --- | 17.3 | --- | 96.0 | 113.4 |
Deferred Charges | | --- | --- | 1.9 | --- | 120.0 | 121.9 |
Fixed Assets | | 6.0 | --- | 10.4 | --- | 3,146.0 | 3,162.4 |
Other Assets | | --- | --- | --- | 421.9 | 176.0 | 597.9 |
Total Assets | | $ 6.1 | $ 0.8 | $ 32.3 | $ 427.5 | $ 3,729.0 | $ 4,195.7 |
| |
|
|
| |
|
|
|
| |
|
|
| |
|
|
|
Liabilities | | | | | | | |
Short Term Indebtedness | | $ --- | $ --- | $ --- | $ --- | $ 477.0 | $ 477.0 |
Payables | | 2.4 | --- | 16.4 | 5.1 | 271.0 | 294.9 |
Reserves | | 1.8 | --- | --- | --- | 293.0 | 294.8 |
Long Term Debt | | 4.3 | --- | 3.3 | 421.4 | 148.7 | 577.7 |
Debt Funded by the Province | | -- | --- | --- |
--- | 2,734.3 | 2,734.3 | Total Liabilities | | 8.5 | --- | 19.7 | 426.5 | 3,924.0 | 4,378.7 |
| |
|
|
| |
|
|
|
| |
|
|
| |
|
|
|
Equity |
|
|
| |
|
|
|
Retained Earnings | | (2.4) | 0.8 | 12.6 | 1.0 | (195.0) | (183.0) |
Total Equity | | (2.4) | 0.8 | 12.6 | 1.0 | (195.0) | (183.0) |
Total Liabilities and Equity | | $ 6.1 | $ 0.8 | $ 32.3 | $ 427.5 | $ 3,729.0 | $ 4,195.7 |
| |
|
|
| |
|
|
|
| |
|
|
| |
|
|
|
Net Income | | | | | | | |
Revenue | | $ 1.6 | $ 119.3 | $ 318.6 | $ 23.2 | $ 1,311.0 | $ 1,773.7 |
Expenses | | (2.1) | (2.6) | (200.0) | (0.1) | (1,112.0) | (1,316.8) |
Interest Expense | | (0.3) | --- | --- | (23.0) | (217.0) | (240.3) |
Net Income | | $ (0.8) | $ 116.7 | $ 118.6 | $ 0.1 | $ (18.0) | $ 216.6 |
| |
|
|
| |
|
|
|
The financial information of Government Enterprises is prepared according to generally accepted accounting principles, using accounting policies that are appropriate for the industry segment in which they operate. These accounting policies may not be consistent with accounting policies used by other member organizations of the Provincial Reporting Entity.
Because minor adjustments are required for timing differences, the net income amounts reported in the financial statements of government enterprises may vary slightly from the investment income reported in the Province's Statement of Revenue and Expenditure.
2004 | PROVINCE OF NEW BRUNSWICK | 25 |
NOTES TO THE FINANCIAL STATEMENTS
31 March 2004
Algonquin Golf Limited
Algonquin Golf Limited was incorporated on 29 May 1998 under the New Brunswick Business Corporation Act. Its purpose is to re-develop and operate the golf course formerly owned by Algonquin Properties Limited. The first year of operations was 2000, the course opened on 1 July 2000.
Lotteries Commission of New Brunswick
The Lotteries Commission of New Brunswick is a shareholder in Atlantic Lottery Corporation Inc. and in the Interprovincial Lottery Corporation. Atlantic Lottery Corporation Inc. is jointly owned by the four Atlantic Provinces and is responsible to develop, organize, undertake, conduct and manage lotteries in Atlantic Canada. Atlantic Lottery Corporation Inc. also markets and handles the products of the Interprovincial Lottery Corporation. The Interprovincial Lottery Corporation is a corporation jointly owned by the ten Canadian provinces.
New Brunswick Liquor Corporation
The New Brunswick Liquor Corporation was established under the New Brunswick Liquor Corporation Act. Its business activity is the purchase, distribution and sale of alcoholic beverages throughout the Province of New Brunswick.
New Brunswick Municipal Finance Corporation
The Municipal Finance Corporation was established under the New Brunswick Municipal Finance Corporation Act. Its purpose is to provide financing for municipalities and municipal enterprises through a central borrowing authority.
New Brunswick Power Corporation
The New Brunswick Power Corporation was established in 1920 under the Electric Power Act and is an agent of the Crown in right of the Province. The Corporation provides for the continuous supply of energy adequate for the needs and future development of the Province and promotes economy and efficiency in the distribution, supply, sale and use of power.
26 | PROVINCE OF NEW BRUNSWICK | 2004 |
NOTES TO THE FINANCIAL STATEMENTS
31 March 2004
NOTE 10
BORROWING AUTHORITY
a) Balance of Borrowing Authority under the Provincial Loans Act
The balance of borrowing authority granted under the Provincial Loans Act is as follows:
| | (millions) |
| | Balance 2003 | Authority Granted During the Year | Borrowing During the Year |
Balance 2004 |
| | | | | |
Loan Act 2001 | $ 380.8 | $ --- | $ 286.8 | $ 94.0 |
Loan Act 2003 | --- | 400.0 | --- | 400.0 |
| | | | | |
| | $ 380.8 | $ 400.0 | $ 286.8 | $ 494.0 |
Under the authority of section 2 of the Provincial Loans Act, the maximum temporary indebtedness of the Province is $1,400.0 million. At 31 March 2004, the cash position of the Province net of bank advances and short term borrowing was $9.8 million.
Under the authority of subsection 3(1) of the Provincial Loans Act, the Province may borrow sums required for the repayment, refinancing or renewal of securities issued or for the payment of any loan or liability, repayment of which is guaranteed by the Province. This authority is in addition to the authorities listed above.
b) Borrowing by the Municipal Finance Corporation
The New Brunswick Municipal Finance Corporation has authority under the New Brunswick Municipal Finance Corporation Act to provide financing for municipalities and municipal enterprises. As at 31 December 2003, long term debt owed by the corporation was $421.4 million.
2004 | PROVINCE OF NEW BRUNSWICK | 27 |
NOTES TO THE FINANCIAL STATEMENTS
31 March 2004
NOTE 11
FUNDED DEBT OUTSTANDING
The following is a maturity schedule for the total amount of the Province's Funded Debt.
| | | |
| | (millions) |
| | | | | | |
Fiscal Year of Maturity | Interest Rate (%) Range |
Currency Amount | Total Funded Debt | Borrowing for NB Power Corporation | Funded Debt for Provincial Purposes |
| | | | | | |
2004-2005 | 7.5-7.6 2.7-14.1 | US $247.5 CAN $320.5 | $ 329.2 320.5
649.7 | $ --- (36.0)
(36.0) | $ 613.7 |
| | | | | | |
2005-2006 | 6.5 3.0-12.6 | US $150.0 CAN $682.1 | 196.6 682.1
878.7 | --- (436.0)
(436.0) | 442.7 |
| | | | | | |
2006-2007 | 5.6 3.4-10.0 | Sfr 100.0 CAN $766.5 | 104.4 766.5
870.9 | --- (106.0)
(106.0) | 764.9 |
| | | | | | |
2007-2008 | 3.8-11.1 | CAN $892.6 | 892.6 | (355.3) | 537.3 |
| | | | | | |
2008-2009 | 4.3-10.4 | CAN $1,011.3 | 1,011.3 | (150.0) | 861.3 |
| | | | | | |
2009-2010 & After | 6.8-9.8 5.2-11.1 | US $800.0 CAN $6,232.2 | 1,048.4 6,232.2
7,280.6 | (589.7) (1,425.0)
(2,014.7) | 5,265.9 |
| | | | |
Funded Debt before Sinking Fund Investments | 11,583.8 | (3,098.0) | 8,485.8 |
Less: Sinking Fund Investments
| 4,079.9 | (363.7) | 3,716.2 |
Funded Debt Outstanding | $ 7,503.9 | $ (2,734.3) | $ 4,769.6 |
2004 | PROVINCE OF NEW BRUNSWICK | 28 |
NOTES TO THE FINANCIAL STATEMENTS
31 March 2004
Pursuant to section 12 of the Provincial Loans Act, the Minister of Finance maintains a General Sinking Fund for the repayment of funded debt either at maturity or upon redemption in advance of maturity. At 31 March 2004, the equity of the General Sinking Fund accumulated for the repayment of Provincial Debt was $3,716.2 million ($3,543.0 million 2003). Some of the assets of this Fund are bonds and debentures issued or guaranteed by the Province of New Brunswick. The provincial net book value of these investments at 31 March 2004 was $1,565.6 million ($1,376.3 million 2003).
Because government enterprises are included in the reporting entity through modified equity accounting, long term debt issued directly by those enterprises is not included in the amount of Funded Debt Outstanding. Note 9 to these financial statements discloses the long term debt obligations of government enterprises.
The following amounts, which are payable swap agreements, have been included in the preceding funded debt maturity schedule. They have been reflected in that schedule in the currency payable per each financial swap agreement.
| | | (millions) 2004 |
Fiscal Year of Maturity | | Amount Payable in Original Currency | | Amount Payable Per Financial Swap Agreement | - | Canadian Dollar Equivalent |
| | | | | | | |
2004-2005 | | Yen 5,000.0 | | US $ 47.5 | | $ 62.2 |
2004-2005 | | Yen 5,000.0 | | CAN $ 71.2 | | 71.2 |
2004-2005 | | Yen 4,000.0 | | CAN $ 55.1 | | 55.1 |
2004-2005 | | Yen 3,000.0 | | CAN $ 41.1 | | 41.1 |
2006-2007 | | CAN $ 95.1 | | Sfr 100.0 | | 104.4 |
2007-2008 | | US $ 500.0 | | CAN $ 791.5 | | 791.5 |
| | | | | | | |
| | | | | | | $ 1,125.5 |
All of the swap agreements are interest rate and currency swap agreements except the Sfr 100.0 issue due 2006-2007 which is a currency swap agreement only.
The following estimated payments are required in each of the next five years to meet the sinking fund provisions of existing debt.
Fiscal Year | (millions) |
| | |
2004-2005 | $ 124.5 |
2005-2006 | 115.9 |
2006-2007 | 107.3 |
2007-2008 | 98.6 |
2008-2009 | 83.9 |
| | |
2004 | PROVINCE OF NEW BRUNSWICK | 29 |
NOTES TO THE FINANCIAL STATEMENTS
31 March 2004
NOTE 12
DEBT CHARGES
The total cost of interest, exchange, amortization and related expenses is $445.8 million ($445.8 million 2003), which consists of:
| | (millions) |
| | 2004 | 2003 |
| | | |
Interest | $ 766.2 | $ 799.1 |
Interest on Fredericton - Moncton Highway Capital Lease | 58.1 | 55.8 |
Interest on Other Capital Leases | 2.3 | 2.4 |
Foreign Exchange Expense | (40.3) | 35.4 |
Other Expenses | 2.1 | 3.3 |
| | 788.4 | 896.0 |
| | | |
Interest Recovery for Debt Incurred for the New Brunswick Power Corporation | (205.5) | (235.1) |
Service of the Public Debt | 582.9 | 660.9 |
Sinking Fund Earnings | (222.5) | (243.0) |
Debt Charges before Pension Interest | 360.4 | 417.9 |
Pension Interest Charged | 85.4 | 27.9 |
| | $ 445.8 | $445.8 |
NOTE 13
PENSION PLANS
a) Description
Employees of the Province and certain other entities, as well as members of the Legislative Assembly, are entitled to receive pension benefits. The Pension plans under which these benefits are received are as follows:
Plan Name | | Date of Latest Actuarial Valuation for Accounting Purposes |
| | | |
Public Service Superannuation Plan (PSSA) | | 01 April 2003 |
Teachers' Pension Plan (TPA) | | 01 April 2003 |
Provincial Court Act and Provincial Court Judges' Pension Act (Judges') | | 01 April 2003 |
Members' Superannuation Plan and Members' Pension Plan (Members') | | 01 April 1996 |
Pension Plan for Canadian Union of Public Employees of New Brunswick Hospitals (H-CUPE) | | --- |
Pension Plan for Management Employees of New Brunswick School Districts (Sch-Mgt) | | 01 January 2002 |
Pension Plan for General Labour, Trades and Services Employees of New Brunswick School Districts (GLTS) | | 01 January 2000 |
Pension Plan for Full-Time CUPE 2745 Employees of New Brunswick School Districts (CUPE 2745) | | 01 January 2000 |
Ombudsman Plan (Ombud) | | --- |
Pension Plan for Certain Bargaining Employees of New Brunswick Hospitals (H - CBE) | | --- |
Pension Plan for Part-time and Seasonal Employees (Part-time) | | --- |
Early Retirement / Workforce Adjustment Program (Early Ret) | | 01 April 1999 |
30 | PROVINCE OF NEW BRUNSWICK | 2004 |
NOTES TO THE FINANCIAL STATEMENTS
31 March 2004
Pension funds distinct from the Consolidated Fund exist for each of these pension plans, except the Members' Superannuation Plan, Members' Pension Plan and the Ombudsman Plan.
The pension expense and liability relating to NB Power employees belonging to the Public Service Superannuation Plan are fully accounted for in the financial statements of NB Power. The schedules in this note have been adjusted to reflect this.
The following is a summary of the contribution levels and basic member benefits for each pension plan. Complete plan descriptions are contained in the specific plan documentation.
| | Contributions | | | | | |
| | Employee | | | Benefits |
Plan | Earnings Up to YMPE | Earnings Above YMPE |
Employer | | Unreduced Benefits | Reduced Benefits |
Basic Benefit | Annual Benefit Indexing |
| | | | | | | | | |
PSSA | 5.80% | 7.50% | Determined by an actuary required to fund current service costs. | | Age 60 with 5 years service. | Age 55 with 5 years service. | 2.0% of salary times years service. Integrated with CPP. | Up to 5.00% |
TPA | 7.30% | 9.00% | Equal to Employee. | | Sum of age and years of service 87; 35 years service; or age 65 with 5 years service; or age 60 with 20 years service. | Sum of age and service total 80 or age 60 with 5 years service. | 2.0% of salary times years service. Integrated with CPP. | Up to 4.75% |
Sch -Mgt | This plan is being curtailed. There are no current contributors to the plan | N/A | | Age 60 with 5 continuous years service. | At age 55 with 5 continuous years service. | 2.0% of salary times years service. Integrated with CPP. | Up to 3.00% |
CUPE 2745 | 4.50% | 6.00% | No more than 95% of employee contributions. | | Age 60 with 5 years continuous employment. | Age 55 with 5 years continuous employment. | 1.3% to 2.0% of salary times years service. Integrated with CPP. | Up to 2.00% |
GLTS | 4.50% | 6.00% | Not less than 95% of employee contributions. | | Age 60 with 5 years continuous service. | Age 55 with 5 years continuous employment. | 1.4% to 2.0% of salary times years service. Integrated with CPP. | Up to 2.00% |
Judges' a)Provincial Court Act
b)Provincial Court Judges' Pension Act | 7.00%
7.00% | N/A
N/A | Determined by an actuary.
Determined by an actuary. | | Age 60 with 25 years service or at age 65 with 10 years service.
Age 60 with 2 years service. | N/A
2 years service. | 60% of salary Integrated with CPP.
2.75% per year of service up to 65% of salary. Not integrated with CPP. | Up to 6.00%
Up to 5.00% |
2004 | PROVINCE OF NEW BRUNSWICK | 31 |
NOTES TO THE FINANCIAL STATEMENTS
31 March 2004
| | Contributions | | | | |
| | Employee | | Benefits |
Plan | Earnings Up to YMPE | Earnings Above YMPE | Employer | Unreduced Benefits | Reduced Benefits |
Basic Benefit
| Annual Benefit Indexing |
| | | | | | | | |
H - CUPE | 5.15% | 6.00% | Currently on a contribution holiday. | Age 60 with 5 years continuous service. | Age 55 with 5 years continuous employment. | 1.4% to 1.75% of salary times years service. Integrated with CPP. | Up to 2.00%. |
H - CBE | 5.185% | 6.61% | Equal to employee contributions. | Age 60 with 5 years continuous service. Normal retirement at age 65. | Age 55 with 5 years continuous employment. | 2.0% of salary times years service. Integrated with CPP. | Up to 4.00%. |
Part-Time | 2.00%, 3.25% or 4.50% | N/A | Equal to employee contributions. | Normal retirement age 65. | N/A | Defined contribution plan. | N/A |
Ombud | This plan has no active members and exists solely to pay benefits to past Ombudsmen or their beneficiaries. The current and future Ombudsmen are members of either the Judges' or PSSA Plan. |
Early Ret | The Province has obligations under various early retirement initiatives. |
Members' | a) Members' Superannuation Plan Applies to Members of the Legislative Assembly who were MLA's prior to enactment of the Members' Pension Act. Members contribute 9% of MLA's indemnity plus 6% of Minister's salary. Province contributes amount equal to excess of pension payments over member contributions plus interest. Eligible for benefits upon ceasing to be an MLA with at least 10 sessions service. Basic MLA benefits equal 4.5% of average indemnity times number sessions up to final year's indemnity. Basic Minister's benefits equal 3% of Ministers' average salary times years service as a Minister. b) Members' Pension Plan Members contribute lesser of amount under MSP and maximum deductible RPP contributions per Income Tax Act. Province contributes amount equal to excess of pension payments over member contributions plus interest. Eligible for benefits at age 60 upon ceasing to be an MLA with minimum 8 sessions service. Supplementary allowance at age 55 with minimum 8 sessions service. Basic MLA benefits equal 2% of average indemnity times sessions served. Additional supplementary allowance of 125% of basic MLA's pension. Basic Ministers' benefits equal 2% of Ministers' average salary times years service as Minister. Additional supplementary allowance of 50% of basic Ministers' pension amount. |
32 | PROVINCE OF NEW BRUNSWICK | 2004 |
NOTES TO THE FINANCIAL STATEMENTS
31 March 2004
b) Pension Liability
With the exception of the H - CBE plan and the H - CUPE plan which are defined benefit plans with fixed employer contributions, and the Part-Time plan, which is a defined contribution plan, the Province is liable for any excess of accrued pension benefits over pension fund assets. The Provincial share of the estimated pension liability for all pension plans is $271.5 million ($362.1 million 2003). This estimate is based on actuarial valuations for accounting purposes using the projected unit credit method, calculated as at the dates listed above. This method estimates the present value of retirement benefits associated with the period of employee service to the valuation date. These actuarial valuations were based on a number of assumptions about future events, such as rates of return on assets, wage and salary increases and employee turnover and mortality. Section g) of this note lists some of the actuarial assumptions used. Section h) lists selected information about plan members.
Details of the pension liability are outlined in the following table. The estimated accrued benefits and the value of plan assets reported have been updated to the most recent year end of the applicable pension plan. This was based on a projection of the actuarial assumptions and on actual contribution levels. The plans for hospital and school district employees have 31 December year ends. All other plans have 31 March year ends.
Details of the unamortized adjustments and valuation allowances are disclosed in sections d), e) and f) of this note.
2004 | 2003 |
Plan | Estimated Accrued Benefits |
Value of
Assets | Actuarial Pension Liability (Surplus) | Unamortized Pension Adjustments and Valuation Allowance | Pension Liability (Surplus) | Pension Liability (Surplus) |
| |
|
|
|
|
|
|
PSSA | $ 2,724.5 | $ 2,685.3 | $ 39.2 | $ 18.4 | $ 20.8 | $ 49.1 |
TPA | 3,253.6 | 3,099.6 | 154.0 | 29.4 | 124.6 | 187.4 |
Judges' | 28.2 | 22.6 | 5.6 | (9.5) | 15.1 | 15.3 |
Members' | 36.3 | --- | 36.3 | --- | 36.3 | 35.3 |
H - CUPE | --- | 33.5 | (33.5) | --- | (33.5) | (35.5) |
Sch -Mgt | 14.1 | 12.8 | 1.3 | --- | 1.3 | 1.5 |
GLTS | 164.9 | 194.3 | (29.4) | (16.5) | (12.9) | (12.0) |
CUPE 2745 | 31.4 | 38.4 | (7.0) | 1.1 | (8.1) | (6.4) |
Early Ret | 127.9 | --- | 127.9 | --- | 127.9 | 127.4 |
| | $ 6,380.9 | $ 6,086.5 | $ 294.4 | $ 124.2 | $ 271.5 | $ 362.1 |
The value of accrued benefits in all plans exceeds the value of assets by $294.4 million at 31 March 2004. However, because the calculation of this excess includes estimates of future events and market values of assets, the Statement of Financial Position reports a liability of $271.5 million for accounting purposes. The difference of $22.9 million is being amortized over future years.
2004 | PROVINCE OF NEW BRUNSWICK | 33 |
NOTES TO THE FINANCIAL STATEMENTS
31 March 2004
c) Change in Pension Liability
The components of the change in pension liability are disclosed in the following table:
| | (millions) |
Plan | Employers' Share of Pension Benefits Earned | Pension Interest | Amortization of Adjustments | Valuation Adjustment | Total Pension Expense | Employer Pension Contribution | Increase (Decrease) in Pension Liability |
| |
|
|
|
|
|
|
|
PSSA | $ 35.0 | $ 32.5 | $ (14.5) | $ --- | $ 53.0 | $ 81.3 | $ (28.3) |
TPA | 32.1 | 44.5 | (39.0) | --- | 37.6 | 100.4 | (62.8) |
Judges' | 0.8 | 0.6 | (1.4) | --- | --- | 0.2 | (0.2) |
Members' | 0.7 | 2.9 | --- | --- | 3.6 | 2.6 | 1.0 |
H - CUPE | 6.3 | (4.3) | --- | --- | 2.0 | --- | 2.0 |
Sch -Mgt | --- | 0.3 | (0.5) | --- | (0.2) | --- | (0.2) |
GLTS | 3.3 | (1.3) | (0.1) | (0.5) | 1.4 | 2.3 | (0.9) |
CUPE 2745 | 0.6 | (0.5) | 0.2 | (1.5) | (1.2) | 0.5 | (1.7) |
Ombud | 0.2 | --- | --- | --- | 0.2 | 0.2 | --- |
H - CBE | 12.3 | --- | --- | --- | 12.3 | 12.3 | --- |
Part-time | 4.8 | --- | --- | --- | 4.8 | 4.8 | --- |
Early Ret | --- | 10.7 | --- | --- | 10.7 | 10.2 | 0.5 |
| | $ 96.1 | $ 85.4 | $ (55.3) | $ (2.0) | $ 124.2 | $ 214.8 | $ (90.6) |
Total pension benefits of $180.6 million were earned by employees during the fiscal year. Employees contributed $75.2 million toward these benefits. The value of pension benefits charged to agencies was $9.3 million. The employers' share of pension benefits earned was $96.1 million.
d) Experience Adjustments
Experience gains or losses are generally amortized to pension expense over the estimated average remaining service life of active contributors. The balance of experience gains on assets that arose prior to 1994 in the Public Service and Teachers' plans are being amortized over 5 years commencing in 1999. The following table summarizes the experience gains or losses for each plan:
34 | PROVINCE OF NEW BRUNSWICK | 2004 |
NOTES TO THE FINANCIAL STATEMENTS
31 March 2004
| | | (millions) |
Plan | Estimated Average Remaining Service Life of Active Contributors (years) | 31 March 2003 Unamortized Experience Adjustments | New Experience (Gains) Losses |
Amortization of Experience Adjustments |
31 March 2004 Unamortized Experience Adjustments |
| | | | | | |
PSSA | 16.0 | $ 380.7 | $ (349.2) | $ 5.4 | $ 36.9 |
TPA | 16.0 | 510.2 | (391.1) | 19.7 | 138.8 |
Judges' | 9.5 | (7.6) | (3.3) | 1.4 | (9.5) |
Sch - Mgt | --- | --- | (0.5) | 0.5 | --- |
GLTS | 12.0 | 14.3 | (12.6) | 0.1 | 1.8 |
CUPE 2745 | 15.0 | 3.5 | (1.9) | (0.2) | 1.4 |
| | | $ 901.1 | $ (758.6) | $ 26.9 | $ 169.4 |
e) Changes to Actuarial Assumptions
Changes to actuarial assumptions are amortized to pension expense over the estimated average remaining service life of active contributors. The following table summarizes the value of estimation adjustments arising from changes to actuarial assumptions for each plan:
| | | (millions) |
Plan | Estimated Average Remaining Service Life of Active Contributors (years) |
31 March 2003 Unamortized Value of Changes to Assumptions | New Changes to Assumptions | Amortization of Changes to Assumptions | 31 March 2004 Unamortized Value of Changes to Assumptions |
| |
| | |
|
|
PSSA | 16.0 | $ (27.6) | $ --- | $ 9.1 | $ (18.5) |
TPA | 16.0 | (157.5) | 28.8 | 19.3 | (109.4) |
| | | $ (185.1) | $ 28.8 | $ 28.4 | $ (127.9) |
| |
|
| |
|
|
2004 | PROVINCE OF NEW BRUNSWICK | 35 |
NOTES TO THE FINANCIAL STATEMENTS
31 March 2004
f) Valuation Allowance
Pension surpluses for individual plans that exceed certain limits have been reduced by valuation allowances. Details of the allowances are provided in the following table:
Plan | (millions) 31 March 2004 Valuation Allowance |
| | |
GLTS | $ (18.3) |
CUPE 2745 | (0.3) |
| | |
| | $ (18.6) |
g) Actuarial Assumptions
Calculation of the Province's employee pension obligations and related pension expenditure is based on long and short term actuarial assumptions except the Judges' Plan where only long term assumptions are used.
The tables below disclose the long term assumptions and the range of short term assumptions used in the actuarial valuations.
Long Term Assumptions |
Plan | Rate of Return on Assets (%) | Annual Wage and Salary Increase (%) |
Inflation (%) | Rate of Pension Escalation after Retirement (%) |
| | | | | |
PSSA | 7.90 | 4.00 plus promotional increase between 0.20 and 1.00 | 3.50 | 3.30 to 3.40 |
TPA | 7.90 | 4.00 plus promotional increase between 0.25 and 1.50 | 3.50 | 3.20 to 3.40 |
Judges' | 7.90 | 4.50 | 3.50 | 3.30 to 3.40 |
Sch - Mgt | 8.16 | 4.75 | 4.00 | 2.00 |
GLTS | 7.90 | 4.00 | 3.50 | 2.00 |
CUPE 2745 | 7.90 | 4.00 | 3.50 | 2.00 |
Members' | 8.16 | 4.75 | 4.00 | 4.00 |
36 | PROVINCE OF NEW BRUNSWICK | 2004 |
NOTES TO THE FINANCIAL STATEMENTS
31 March 2004
| |
Short Term Assumptions |
Plan | Rate of Return on Assets (%) | Annual Wage and Salary Increase (%) |
Inflation (%) | Rate of Pension Escalation after Retirement (%) |
| | | | | |
PSSA | 7.90 | 2.00 to 3.00 | 2.00 to 3.00 | 1.70 to 2.70 |
TPA | 7.90 | 2.00 to 3.00 | 2.00 to 3.00 | 1.70 to 2.75 |
Sch - Mgt | 7.90 | 1.50 to 4.00 | 2.00 to 3.50 | 2.00 |
GLTS | 7.90 | 2.00 to 3.00 | 2.00 to 3.00 | 2.00 |
CUPE 2745 | 7.90 | 2.00 to 3.00 | 2.00 to 3.00 | 2.00 |
Members' | N/A | 0.00 to 4.00 | 2.00 to 3.50 | 2.00 to 3.50 |
These assumptions have been used to determine the amount of the Province's obligation for pension benefits outstanding and the value of benefits earned by employees during the fiscal year and are based on management's best estimates. Different assumptions have been used to determine the appropriate level of employee and employer contributions needed to fund the estimated cost of the pension plans.
h) Member Data
The following table lists data about the members of each plan.
Plan | Number of Active Contributors |
Number of Pensioners | Average Annual Salary of Contributors | Average Annual Pension |
| | | | | |
PSSA | 19,458 | 9,860 | $ 49,252 | $ 15,599 |
TPA | 9,319 | 6,740 | 52,465 | 26,607 |
Judges' | 29 | 27 | 151,561 | 46,735 |
Sch - Mgt | --- | 75 | --- | 11,278 |
GLTS | 2,067 | 1,067 | 26,192 | 7,024 |
CUPE 2745 | 636 | 138 | 24,014 | 4,427 |
Members' | 55 | 90 | 40,844 | 29,017 |
Ministers earn an additional average salary of $37,127.
2004 | PROVINCE OF NEW BRUNSWICK | 37 |
NOTES TO THE FINANCIAL STATEMENTS
31 March 2004
NOTE 14
CONTINGENT LIABILITIES
a) Guaranteed Loans
The Province has guaranteed certain debt of entities external to the Provincial Reporting Entity under the authority of various statutes. At 31 March 2004, the total contingent liability in respect of these guarantees was $339.3 million ($246.7 million 2003), of which the Province has recognized $75.8 million as a liability in the Statement of Financial Position ($50.2 million 2003).
| | (millions) |
| | Authorized | Contingent |
| | Limit | Liability |
| | | |
Adult Education and Training Act | $ 0.3 | $ 0.3 |
Agricultural Development Act | 0.1 | 0.1 |
Economic Development Act | 131.9 | 124.8 |
Employment Development Act | 5.3 | 5.3 |
Fisheries Development Act | 13.1 | 6.5 |
Livestock Incentives Act | 2.2 | 1.5 |
Nursing Homes Act | 10.6 | 10.6 |
Regional Development Corporation Act | 4.0 | 3.4 |
Youth Assistance Act | 186.8 | 186.8 |
| | | 339.3 |
Less: Allowance for Losses (Schedule 10) | | 75.8 |
| | | $ 263.5 |
b) Environmental Responsibility
The Province of New Brunswick has an agreement with a mining company to limit the liability of the company to $3.0 million for environmental damages that occurred prior to the company commencing mining at a specified site. The cost to clean up the major problem area of this site has been estimated at $3.0 million. The Province currently holds a performance bond for $1.3 million from this company relating to this clean up.
c) Insurance
The Province does not carry general liability insurance or property insurance on its assets except in a few limited instances. Any successful liability claims against the Province and any replacement of lost or damaged property are charged to expenditure in the year of settlement or replacement.
38 | PROVINCE OF NEW BRUNSWICK | 2004 |
NOTES TO THE FINANCIAL STATEMENTS
31 March 2004
NOTE 15
COMMITMENTS
a) Operating Leases
The total future minimum payments under various operating lease agreements, including those of government enterprises, for the rental of space and equipment amounts to $392.0 million ($398.5 million 2003). Minimum annual lease payments in each of the next five years are as follows:
Fiscal Year | (millions) |
2004-2005 | $ 47.5 |
2005-2006 | 41.6 |
2006-2007 | 39.1 |
2007-2008 | 35.9 |
2008-2009 | 32.1 |
b) Nursing Homes
The Department of Health and Wellness includes in its annual operating budget funding for the repayment of approved long term debt of certain nursing homes. The Department funds the nursing homes through grants which pay the difference between operating expenses and revenue from other sources. On average, revenue from other sources covers approximately 35% of operating costs.
Total long term debt of these nursing homes at 31 March 2004 amounted to approximately $95.4 million ($96.9 million 2003). Of the $95.4 million nursing home debt, the Province has issued guarantees totalling approximately $10.6 million ($10.6 million 2003) which is included as a contingent liability.
c) Authorized Capital Projects
The 31 March 2004 estimated amount required to complete authorized major construction projects of schools, hospitals, other buildings, roads and bridges, and to meet capital grant obligations is $180.7 million ($751.1 million 2003). This includes projects that will be cost shared with the Government of Canada.
2004 | PROVINCE OF NEW BRUNSWICK | 39 |
NOTES TO THE FINANCIAL STATEMENTS
31 March 2004
NOTE 16
EXPENDITURE BY PRIMARY CLASSIFICATION
The expenditures by primary classification are as follows:
| | | (millions) |
| | | 2004 | 2003 |
| | | |
| | | | |
| | Personal Services | $ 1,919.4 | $ 1,743.0 |
| | Other Services | 997.3 | 1,002.5 |
| | Materials and Supplies | 117.9 | 117.2 |
| | Property and Equipment | 285.2 | 247.9 |
| | Contributions, Grants and Subsidies to or on behalf of: | | |
| | Municipalities and Local Service Districts | 145.1 | 137.7 |
| | Individuals | 894.0 | 858.8 |
| | Nursing Homes | 125.1 | 122.4 |
| | Other | 435.2 | 426.8 |
| | Debt and Other Charges | 663.8 | 714.3 |
| | | | |
| | | $ 5,583.0 | $ 5,370.6 |
| | | | |
Personal Services includes salaries and benefits of employees, and allowances paid to the members of the Legislative Assembly. Personal Services does not include salaries and benefits of employees of hospitals and other agencies, which are paid by those organizations. Funding provided to those organizations is recorded as Contributions, Grants and Subsidies.
Other Services includes the purchase of various services including rental of space, postage, advertising, professional services, Royal Canadian Mounted Police services and travel expenses.
Materials and Supplies includes the purchase of textbooks, office supplies, heating fuel, vehicle and equipment supplies and parts, and structural materials and supplies.
Property and Equipment includes the purchase and construction of buildings, roads, bridges, equipment, and office furniture.
Contributions, Grants and Subsidies includes payments to government corporations, agencies and boards, and to business entities and non-profit organizations. Contributions, Grants and Subsidies to or on behalf of individuals includes income assistance payments and medical service payments on behalf of individuals.
Debt and Other Charges includes the cost of servicing the public debt and bad debt expenses.
40 | PROVINCE OF NEW BRUNSWICK | 2004 |
NOTES TO THE FINANCIAL STATEMENTS
31 March 2004
NOTE 17
TRUST FUNDS
The Province is trustee for various trust funds outside the Provincial Reporting Entity.
The following is a summary of the trust fund equities calculated using the method indicated below to value investment assets:
| | (millions) |
| | 2004 | 2003 |
Cost Method: | | |
| | | |
Margaret R. Lynds Bequest | $ 0.1 | $ 0.1 |
Mental Health Trust Fund | 0.8 | 0.8 |
New Brunswick Power Corporation Sinking Fund | 39.5 | 35.7 |
Viscount Bennett Bequest | 0.2 | 0.2 |
| | | |
| | $ 40.6 | $ 36.8 |
| | | |
Market Value Method: | | |
| | | |
Judges' Superannuation Fund | $ 22.6 | $ 18.5 |
Pension Plan for the Management Employees of New Brunswick School Districts | 12.8 | 12.4 |
Pension Plan for General Labour, Trades and Services Employees of New Brunswick School Districts | 194.3 | 172.8 |
Pension Plan for Full-Time CUPE 2745 Employees of New Brunswick School Districts | 38.4 | 33.6 |
Public Service Superannuation Fund | 2,685.3 | 2,131.1 |
Teachers' Pension Trust Fund | 3,099.6 | 2,522.4 |
| | | |
| | $ 6,053.0 | $ 4,890.8 |
The Margaret R. Lynds Bequest is used to award three annual scholarships of equal value to students pursuing the study of communications at specified universities. The Mental Health Trust Fund is used to pay for psychoanalysis treatment of deserving New Brunswick residents. The income from the Viscount Bennett Bequest is used to develop the Province's historic resources.
The New Brunswick Power Corporation Sinking Fund is held in trust under the authority of the Electric Power Act. New Brunswick Power Corporation makes payments to this sinking fund as required by the terms of any bond or debenture issues. These are retained and invested. The purpose of the fund is to repay the bonds or debentures when they mature.
2004 | PROVINCE OF NEW BRUNSWICK | 41 |
NOTES TO THE FINANCIAL STATEMENTS
31 March 2004
NOTE 18
TANGIBLE CAPITAL ASSETS
The Province has a significant investment in tangible capital assets that have a useful life of greater than one year. Tangible capital assets are recorded as an expenditure in the period acquired and are not included as assets in the Statement of Financial Position. These assets are a key component in the delivery of programs and provide on-going value to the public.
The Province's net investment in Tangible Capital Assets over the past five years has been:
| | (millions) |
| | 2004 | 2003 | 2002 | 2001 | 2000 |
| | | | | | |
Purchase of Capital Assets | $ 233.6 | $ 201.0 | $ 198.8 | $ 154.7 | $ 1,160.3 |
Proceeds from Disposal of Capital Assets | (2.0) | (3.6) | (2.4) | (2.1) | (3.0) |
| |
|
|
|
|
|
| | $ 231.6 | $ 197.4 | $ 196.4 | $ 152.6 | $ 1,157.3 |
Details of certain tangible capital assets are as follows:
a)
Vehicles and Equipment
| | (millions) |
| | 2004 | 2003 |
| | Cost | Accumulated Depreciation | Net Book Value | Net Book Value |
| | | | | |
Vehicles and Equipment | $ 186.5 | $ 115.1 | $ 71.4 | $ 76.8 |
b)
Capital Leases
| | (millions) | |
| | Cost | |
| | | |
Fredericton to Moncton Highway | $ 903.8 |
|
Moncton North School | 8.2 |
|
Miramichi Youth Facility | 13.6 |
|
| | |
|
| | |
|
b)
Land and Buildings
| | Estimated Number | |
| | | |
Number of Provincially Owned Properties | 11,451 |
|
| |
|
|
| |
|
|
42 | PROVINCE OF NEW BRUNSWICK | 2004 |
NOTES TO THE FINANCIAL STATEMENTS
31 March 2004
NOTE 19
COMPARATIVE FIGURES
Certain figures for the prior year have been restated to conform with the 2004 presentation of the financial statements.
2004 | PROVINCE OF NEW BRUNSWICK | 43 |
| | | | |
SCHEDULES TO THE FINANCIAL STATEMENTS |
31 March 2004 |
| | (millions) |
| | 2004 | | 2003 |
SCHEDULE 1 |
ACCOUNTS AND INTEREST RECEIVABLE |
| | | | |
Accounts Receivable |
General Receivables | $231.2 | | $200.1 |
Canada - Conditional Grants |
Canada Mortgage and Housing Corporation | 26.9 | | 27.5 |
Canada/New Brunswick Highway Improvement Program | 11.5 | | 9.6 |
Disaster Financial Assistance Program | 33.3 | | 31.8 |
Infrastructure Program | 4.9 | | 2.9 |
Official Languages | 36.1 | | 23.2 |
Refund of Harmonized Sales Tax Paid | 8.0 | | 10.9 |
Regional Economic Development Agreement | 4.5 | | 0.6 |
Other Agreements | 5.2 | | 4.2 |
Canada - Unconditional Grants |
Canada Health and Social Transfer | 1.9 | | 10.8 |
Guarantee Payouts | 32.0 | | 32.7 |
Working Capital Advances | 5.3 | | 5.1 |
Other | 1.9 | | 2.2 |
Interest Receivable |
Agricultural Development Act | 0.7 | | 1.5 |
Economic Development Act | 9.1 | | 8.8 |
Fisheries Development Act | 12.5 | | 13.2 |
Other | 8.5 | | 6.8 |
Consolidated Entities | 42.8 | | 47.4 |
| | 476.3 | | 439.3 |
Less: Allowance for Doubtful Accounts | 118.5 | | 113.3 |
| | $357.8 | | $326.0 |
44 | PROVINCE OF NEW BRUNSWICK | 2004 |
| | | | | |
SCHEDULES TO THE FINANCIAL STATEMENTS |
31 March 2004 |
| | | | | |
| | | (millions) |
| | | 2004 | | 2003 |
| | | | | |
SCHEDULE 2 |
TAXES RECEIVABLE |
| | | | | |
Gasoline and Motive Fuels Tax | | $21.9 | | $20.0 |
Real Property Tax | | 384.0 | | 374.3 |
Royalties and Stumpage on Timber | | 28.0 | | 18.2 |
Sales Tax | | 107.7 | | 85.4 |
Tobacco Tax | | 11.3 | | 9.0 |
Other | | 0.3 | | 0.1 |
| | | 553.2 | | 507.0 |
Less: Allowance for Doubtful Accounts | | 86.6 | | 89.5 |
| | | $466.6 | | $417.5 |
| | | | | |
SCHEDULE 3 | | | | |
INVENTORIES | | | | |
| | | | | |
Construction and Maintenance Materials | | $9.5 | | $8.2 |
Educational Textbooks | | 1.6 | | 2.3 |
Machine Repair Parts | | 6.1 | | 6.1 |
Properties Held for Sale | | 3.1 | | 2.4 |
Stationery and Supplies | | 1.7 | | 1.6 |
Veterinary Supplies | | 0.8 | | 0.8 |
Other Supplies | | 6.6 | | 8.5 |
Consolidated Entities | | 13.9 | | 13.3 |
| | | $43.3 | | $43.2 |
| | | | | |
SCHEDULE 4 | | | | |
PREPAID AND DEFERRED CHARGES | | | | |
| | | | | |
Unamortized Premiums, Discounts, and Issue Expenses | | | | |
on Debentures | $55.9 | | $57.9 |
Other | | 63.3 | | 64.0 |
Consolidated Entities | | (8.0) | | 3.7 |
| | | $111.2 | | $125.6 |
2004 | PROVINCE OF NEW BRUNSWICK | 45 |
| | | | | | | | | | | | | |
SCHEDULES TO THE FINANCIAL STATEMENTS |
31 March 2004 |
| | | | | (millions) | | |
| | | | | 2004 | | | | | | 2003 | | |
| | | | | Allowance | | | | | | Allowance | | |
| | | | | for Doubtful | | | | | | for Doubtful | | |
| | | Amount | | Accounts | | Net | | Amount | | Accounts | | Net |
SCHEDULE 5 |
LOANS AND ADVANCES |
| | | | | | | | | | | | | |
Business New Brunswick | | | | | | | | | | | | |
Agricultural Development Act | | $21.7 | | $15.4 | | $6.3 | | $20.3 | | $14.0 | | $6.3 |
Economic Development Act | | 124.1 | | 57.1 | | 67.0 | | 155.7 | | 70.0 | | 85.7 |
Fisheries Development Act | | 48.8 | | 37.5 | | 11.3 | | 54.4 | | 40.4 | | 14.0 |
N. B. Agriexport Inc. | | 0.5 | | --- | | 0.5 | | 0.5 | | --- | | 0.5 |
Provincial Holdings Ltd. | | 6.7 | | 2.3 | | 4.4 | | 8.1 | | 2.5 | | 5.6 |
| | | | | | | | | | | | | |
Education | | | | | | | | | | | | |
Loans to Students | | 0.2 | | 0.2 | | --- | | 0.2 | | 0.2 | | --- |
| | | | | | | | | | | | | |
Environment and Local Government |
Water and Sewerage Systems | | 0.4 | | --- | | 0.4 | | 0.4 | | --- | | 0.4 |
Other Loans | | 0.2 | | 0.2 | | --- | | 0.2 | | 0.2 | | --- |
| | | | | | | | | | | | | |
Executive Council | | | | | | | | | | | | |
La Fondation du quotidien francophone | | 4.0 | | 4.0 | | --- | | 4.0 | | 4.0 | | --- |
| | | | | | | | | | | | | |
Family and Community Services | | | | | | | | |
New Brunswick Housing Act | | 32.7 | | 2.5 | | 30.2 | | 31.8 | | 2.5 | | 29.3 |
| | | | | | | | | | | | | |
Finance | | | | | | | | | | | | |
Loans to Municipalities | | 0.5 | | --- | | 0.5 | | 0.5 | | --- | | 0.5 |
Municipalities - Department of | | | | | | | | | | | | |
Regional Industrial Expansion |
Agreements | 1.1 | | 0.6 | | 0.5 | | 1.4 | | 0.6 | | 0.8 |
| | | | | | | | |
Health and Wellness | | | | | | | | |
Veterans' Affairs Units | | 11.5 | | --- | | 11.5 | | 12.0 | | --- | | 12.0 |
| | | | | | | | | | | | | |
Public Safety |
City of Moncton | | 1.4 | | --- | | 1.4 | | 1.7 | | --- | | 1.7 |
Unsatisfied Judgements | | 9.5 | | 9.5 | | --- | | 9.5 | | 9.5 | | --- |
| | | | | | | | | | | | | |
Regional Development Corporation |
Fundy Trail Endowment Fund | | 3.8 | | --- | | 3.8 | | 3.6 | | --- | | 3.6 |
| | | | | | | | | | | | | |
Adjustments on Consolidation | (11.5) | | --- | | (11.5) | | (12.0) | | --- | | (12.0) |
| | | $255.6 | | $129.3 | | $126.3 | | $292.3 | | $143.9 | | $148.4 |
46 | PROVINCE OF NEW BRUNSWICK | 2004 |
| | | | | |
SCHEDULES TO THE FINANCIAL STATEMENTS |
31 March 2004 |
| | | | | |
| | | (millions) |
| | | 2004 | | 2003 |
| | | | | |
SCHEDULE 6 |
INVESTMENTS |
| | | | | |
Investment in Government Enterprises |
Algonquin Golf Limited | | $(2.5) | | $(1.6) |
Lotteries Commission of New Brunswick | | 0.8 | | 1.3 |
New Brunswick Liquor Corporation | | 11.8 | | 13.6 |
New Brunswick Municipal Finance Corporation | | 1.0 | | 0.9 |
New Brunswick Power Corporation | | (196.1) | | (178.1) |
| | | (185.0) | | (163.9) |
Other Long Term Investments | | 3.6 | | 3.3 |
Consolidated Entities | 35.0 | | 61.0 |
| | | $(146.4) | | $(99.6) |
| | | | | |
SCHEDULE 7 |
CASH NET OF SHORT TERM BORROWING / BANK |
ADVANCES AND SHORT TERM BORROWING |
| | | | | |
Cash | $17.8 | | $28.4 |
Short Term Investments | 724.0 | | 327.2 |
Consolidated Entities | 99.3 | | 169.1 |
| | | 841.1 | | 524.7 |
| | | | | |
Less: |
| | | | | |
Bank Overdrafts | | 47.0 | | 78.2 |
Treasury Bills 0% Maturing 21 June 2004 | 24.0 | | 20.0 |
Treasury Bills 2.02% - 2.69% Maturing 5 April 2004 - |
15 September 2004 | 760.3 | | 453.3 |
| | | 831.3 | | 551.5 |
| $9.8 | | $(26.8) |
2004 | PROVINCE OF NEW BRUNSWICK | 47 |
| | | | | |
SCHEDULES TO THE FINANCIAL STATEMENTS |
31 March 2004 |
| | | | | |
| | | (millions) |
| | | 2004 | | 2003 |
| | | | | |
SCHEDULE 8 |
ACCOUNTS PAYABLE |
| | | | | |
Accounts Payable for Goods and Services by | | | | |
Government Departments | $307.0 | | $300.5 |
Due to Canada |
Department of Regional Industrial Expansion | | 0.6 | | 0.8 |
Equalization and Canada Health and Social Transfer | | 185.4 | | 33.8 |
Other Agreements | | 0.2 | | 0.2 |
New Brunswick Housing Corporation - Third Parties | | 43.5 | | 44.5 |
Other | | 0.6 | | 1.0 |
Consolidated Entities | | 121.2 | | 128.6 |
| | | $658.5 | | $509.4 |
| | | | | |
SCHEDULE 9 |
ACCRUED EXPENDITURES |
| | | | | |
Accrued Interest |
Funded Debt | | $155.8 | | $162.8 |
Outstanding Treasury Bills | 2.4 | | 1.2 |
Other | | 72.8 | | 65.5 |
| | | 231.0 | | 229.5 |
| | | | | |
Accrued Salaries Payable | | 108.3 | | 88.7 |
Health | | 29.5 | | 20.2 |
Holdbacks on Contracts | | 7.5 | | 7.5 |
Liability for Injured Workers | 89.6 | | 83.2 |
Retirement Allowances | 222.6 | | 214.7 |
Other | | 67.4 | | 57.0 |
Consolidated Entities | | 24.5 | | 9.3 |
| | | $780.4 | | $710.1 |
48 | PROVINCE OF NEW BRUNSWICK | 2004 |
| | | | | |
SCHEDULES TO THE FINANCIAL STATEMENTS |
31 March 2004 |
| | | | | |
| | | | | |
| | | (millions) |
| | | 2004 | | 2003 |
| | | | | |
SCHEDULE 10 |
ALLOWANCE FOR LOSSES |
| | | | | |
Business New Brunswick | $40.0 | | $19.9 |
Education | 35.1 | | 30.1 |
Training and Employment Development | 0.2 | | 0.2 |
Consolidated Entities | | 0.5 | | --- |
| | | $75.8 | | $50.2 |
| | | | | |
SCHEDULE 11 | | | | |
DEFERRED REVENUE | | | | |
| | | | | |
Canada Health and Social Transfer | | $0.2 | | $15.3 |
Motor Vehicle and Operators' Licenses | | 34.0 | | 33.7 |
Real Property Taxes | | 242.9 | | 226.1 |
Other | | 12.9 | | 11.9 |
Consolidated Entities | | 4.5 | | 0.9 |
| | | $294.5 | | $287.9 |
| | | | | |
SCHEDULE 12 |
DEPOSITS HELD IN TRUST |
| | | | | |
Administrator of Estates of Patients in Psychiatric Facilities | | $0.3 | | $0.3 |
Contractors' Deposits | | 1.2 | | 1.7 |
Court of Queen's Bench | | 5.5 | | 5.1 |
Employee Contributions for Early Retirement Benefits | 1.2 | | 2.3 |
Family Support Order Services | | 0.6 | | 0.4 |
Mining Licenses - Non-Performance Renewal Fees | | 1.3 | | 1.3 |
New Brunswick Crop Reinsurance Fund | | 2.2 | | 2.2 |
Sale of Property for Taxes | | 1.0 | | 0.8 |
Scholarship Trusts | 2.5 | | 2.2 |
Tenants' Security Deposits | | 12.1 | | 11.4 |
Metallic Minerals Tax Act | | 7.9 | | --- |
Other | | 10.0 | | 10.1 |
| | | $45.8 | | $37.8 |
| | | | | |
SCHEDULE 13 |
OBLIGATIONS UNDER CAPITAL LEASES |
| | | | | |
Moncton North School | | $8.0 | | $8.4 |
Miramichi Youth Facility | 18.2 | | 18.4 |
New Brunswick Highway Corporation | 837.0 | | 843.8 |
Consolidated Entities | | 2.6 | | 3.1 |
| | | $865.8 | | $873.7 |
2004 | PROVINCE OF NEW BRUNSWICK | 49 |
| | | | | | | |
SCHEDULES TO THE FINANCIAL STATEMENTS |
31 March 2004 |
| | | | | | | |
| | | | | | | |
| | | | | (millions) | | |
| | | 2004 | | 2004 | | 2003 |
| | | Budget | | Actual | | Actual |
| | | | | | | |
SCHEDULE 14 |
TAXES ON CONSUMPTION |
| | | | | | | |
Gasoline and Motive Fuels Tax | | $237.3 | | $234.9 | | $222.1 |
Harmonized Sales Tax | 734.7 | | 803.1 | | 736.0 |
Tobacco Tax | | 95.2 | | 101.3 | | 91.9 |
Other | | 0.1 | | 0.1 | | 0.1 |
| | | $1,067.3 | | $1,139.4 | | $1,050.1 |
| | | | | | | |
SCHEDULE 15 |
TAXES ON INCOME |
| | | | | | | |
Corporate Income Tax | | $142.3 | | $111.1 | | $134.9 |
Mining Tax | | 5.0 | | 2.2 | | 5.7 |
Personal Income Tax | | 924.1 | | 952.3 | | 910.9 |
| | | $1,071.4 | | $1,065.6 | | $1,051.5 |
| | | | | | | |
SCHEDULE 16 |
OTHER TAXES |
| | | | | | | |
Financial Corporation Capital Tax | | $8.8 | | $9.8 | | $8.3 |
Insurance Premium Tax | | 41.3 | | 42.2 | | 34.3 |
Large Corporation Capital Tax | 36.4 | | 47.4 | | 38.7 |
Other | | 4.0 | | 4.1 | | 3.7 |
| | | $90.5 | | $103.5 | | $85.0 |
| | | | | | | |
SCHEDULE 17 |
LICENSES AND PERMITS |
| | | | | | | |
Angling Licenses | | $1.4 | | $1.5 | | $1.5 |
Credit Unions - Assessment | | 0.2 | | 0.2 | | 0.2 |
Hunting Licenses | | 2.1 | | 1.9 | | 2.0 |
Liquor Licenses | | 3.4 | | 3.1 | | 3.4 |
Mines | | 0.9 | | 0.8 | | 0.7 |
Motor Vehicle | | 80.6 | | 78.0 | | 78.8 |
Public Health Inspection | | 0.7 | | 0.8 | | 0.7 |
Security Frauds Prevention Act | | 5.5 | | 6.1 | | 5.8 |
Trusts - Annual Filing Fees | | 0.2 | | 0.1 | | 0.2 |
Water, Air Quality and Industrial Waste Control | | 1.6 | | 1.7 | | 1.6 |
Other | | 7.9 | | 9.9 | | 8.1 |
| | | $104.5 | | $104.1 | | $103.0 |
50 | PROVINCE OF NEW BRUNSWICK | 2004 |
| | | | | | | |
SCHEDULES TO THE FINANCIAL STATEMENTS |
31 March 2004 |
| | | | | | | |
| | | | | | | |
| | | | | (millions) | | |
| | | 2004 | | 2004 | | 2003 |
| | | Budget | | Actual | | Actual |
| | | | | | | |
SCHEDULE 18 |
ROYALTIES |
| | | | | | | |
Forest | | $55.4 | | $62.9 | | $53.1 |
Mines | | 8.0 | | 7.5 | | 6.9 |
| | | $63.4 | | $70.4 | | $60.0 |
| | | | | | | |
SCHEDULE 19 |
INVESTMENT INCOME |
| | | | | | | |
Algonquin Golf Limited | | $--- | | $(0.8) | | $(0.7) |
Fiscal Stabilization Fund | | --- | | 5.2 | | 5.6 |
Lottery Revenues | | 116.7 | | 116.7 | | 109.1 |
New Brunswick Liquor Corporation | | 117.0 | | 118.6 | | 110.1 |
New Brunswick Power Corporation | | 40.0 | | (18.0) | | (77.4) |
Workplace Health, Safety and Compensation |
Commission (WHSCC) | | 8.5 | | --- | | --- |
Other Investment Income | | 24.9 | | 31.0 | | 30.0 |
| | | $307.1 | | $252.7 | $--- | $176.7 |
| | | | | | | |
SCHEDULE 20 |
OTHER PROVINCIAL REVENUE |
| | | | | | | |
Sales of Goods and Services | | | | | | |
Institutional | $89.4 | | $99.6 | | $96.2 |
Intergovernmental | 7.2 | | 8.1 | | 7.0 |
Leases and Rentals | 18.2 | | 18.5 | | 18.1 |
Provincial Parks | 2.1 | | 2.3 | | 2.3 |
General | 107.2 | | 110.0 | | 109.6 |
Fines and Penalties | 4.0 | | 2.9 | | 3.2 |
Other Revenue | | 36.1 | | 30.2 | | 30.7 |
| | | $264.2 | | $271.6 | | $267.1 |
| | | | | | | |
SCHEDULE 21 |
CONDITIONAL GRANTS - CANADA |
| | | | | | | |
Economic Development | | $24.6 | | $22.7 | | $21.7 |
Education | | 21.0 | | 32.4 | | 30.8 |
Employment Development | | 102.1 | | 108.3 | | 106.6 |
Family and Community Services | | 34.2 | | 34.3 | | 35.2 |
General Government Services | | --- | | 12.2 | | 12.4 |
Health | | 31.4 | | 41.2 | | 28.7 |
Protection Services | | 8.4 | | 7.9 | | 7.9 |
Resources | | 1.2 | | 0.9 | | 0.4 |
Transportation | 44.4 | | 49.8 | | 38.4 |
| | | $267.3 | | $309.7 | | $282.1 |
2004 | PROVINCE OF NEW BRUNSWICK | 51 |
| | | | | | | |
SCHEDULES TO THE FINANCIAL STATEMENTS |
31 March 2004 |
| | | | | | | |
| | | | | (millions) | | |
| | | 2004 | | 2004 | | 2003 |
| | | Budget | | Actual | | Actual |
| | | | | | | |
SCHEDULE 22 |
EDUCATION |
| | | | | | | |
Education | | $801.0 | | $807.6 | | $783.4 |
General Government | | 49.8 | | 41.2 | | 21.3 |
Maritime Provinces Higher Education Commission | | 187.0 | | 179.7 | | 181.8 |
New Brunswick Distance Education Network | | 0.4 | | 0.9 | | 0.4 |
Supply and Services | | 33.0 | | 34.2 | | 33.3 |
| | | $1,071.2 | | $1,063.6 | | $1,020.2 |
| | | | | | | |
SCHEDULE 23 |
HEALTH |
| | | | | | | |
General Government | | $3.0 | | $2.0 | | $7.5 |
Health and Wellness | | 537.7 | | 550.4 | | 508.2 |
Regional Health Authorities | | 1,091.7 | | 1,148.7 | | 1,061.7 |
| | | $1,632.4 | | $1,701.1 | | $1,577.4 |
| | | | | | | |
SCHEDULE 24 |
FAMILY AND COMMUNITY SERVICES |
| | | | | | | |
Family and Community Services | $711.0 | | $710.4 | | $694.4 |
General Government | 3.4 | | 5.1 | | 3.6 |
| | | $714.4 | | $715.5 | | $698.0 |
| | | | | | | |
SCHEDULE 25 |
PROTECTION SERVICES |
| | | | | | | |
General Government | $0.7 | | $0.2 | | $0.2 |
Justice | 41.8 | | 45.2 | | 42.8 |
Public Safety | 102.1 | | 99.8 | | 98.0 |
Supply and Services | 1.0 | | 0.5 | | 6.2 |
| | | $145.6 | | $145.7 | | $147.2 |
52 | PROVINCE OF NEW BRUNSWICK | 2004 |
| | | | | | | |
SCHEDULES TO THE FINANCIAL STATEMENTS |
31 March 2004 |
| | | | | | | |
| | | | | (millions) | | |
| | | 2004 | | 2004 | | 2003 |
| | | Budget | | Actual | | Actual |
| | | | | | | |
SCHEDULE 26 |
ECONOMIC DEVELOPMENT |
| | | | | | | |
Business New Brunswick | $26.8 | | $32.2 | | $32.3 |
General Government | 14.9 | | 34.7 | | 18.8 |
Regional Development Corporation | 47.2 | | 42.0 | | 36.1 |
Regional Development Corporation - Special |
Operating Agency | 23.1 | | 28.6 | --- | 35.0 |
Tourism and Parks | 27.2 | | 28.1 | | 27.9 |
| | | $139.2 | | $165.6 | | $150.1 |
| | | | | | | |
SCHEDULE 27 |
EMPLOYMENT DEVELOPMENT AND LABOUR |
| | | | | | | |
General Government | $0.6 | | $0.6 | | $0.6 |
Supply and Services | 2.0 | | 2.0 | | 2.0 |
Training and Employment Development | 231.7 | | 225.8 | | 217.4 |
| | | $234.3 | | $228.4 | | $220.0 |
| | | | | | | |
SCHEDULE 28 |
RESOURCE SECTOR |
| | | | | | | |
Agriculture, Fisheries and Aquaculture | $29.0 | | $28.9 | | $30.2 |
Energy | 2.6 | | 2.1 | | 2.6 |
Environment | 20.9 | | 20.5 | | 19.7 |
Forest Protection Limited | 9.6 | | 10.0 | | 4.3 |
General Government | 0.3 | | 3.3 | | 0.3 |
Natural Resources | 91.4 | | 98.0 | | 88.3 |
New Brunswick Tire Stewardship Board | --- | | 2.6 | | --- |
Supply and Services | --- | | 0.1 | | 0.2 |
| | | $153.8 | | $165.5 | | $145.6 |
| | | | | | | |
SCHEDULE 29 |
TRANSPORTATION |
| | | | | | | |
General Government | $0.3 | | $1.6 | | $1.2 |
Supply and Services | --- | | 0.4 | | 0.3 |
Transportation | 337.2 | | 346.5 | | 313.8 |
| | | $337.5 | | $348.5 | | $315.3 |
2004 | PROVINCE OF NEW BRUNSWICK | 53 |
| | | | | | | |
SCHEDULES TO THE FINANCIAL STATEMENTS |
31 March 2004 |
| | | | | | | |
| | | | | (millions) | | |
| | | 2004 | | 2004 | | 2003 |
| | | Budget | | Actual | | Actual |
| | | | | | | |
SCHEDULE 30 |
CENTRAL GOVERNMENT |
| | | | | | | |
Algonquin Properties Ltd | $10.6 | | $8.1 | | $8.4 |
Executive Council | 4.9 | | 4.7 | | 4.5 |
Finance | 81.1 | | 78.4 | | 81.0 |
General Government | 163.2 | | 146.4 | | 120.2 |
Intergovernmental Affairs | 2.2 | | 2.1 | | 2.0 |
Legislative Assembly | 14.4 | | 21.0 | | 14.3 |
Local Government | 41.0 | | 38.2 | | 37.0 |
New Brunswick Investment Management Corporation | 6.6 | | 8.5 | | 7.0 |
Office of the Comptroller | 5.1 | | 4.6 | | 4.9 |
Office of Human Resources | 6.0 | | 5.6 | | 5.4 |
Office of the Premier | 1.2 | | 1.1 | | 1.2 |
Service New Brunswick | 53.1 | | 48.4 | | 49.6 |
Supply and Services | 96.9 | | 99.1 | | 100.4 |
| | | $486.3 | | $466.2 | | $435.9 |
Exhibit "f" Consent of Auditor General for New Brunswick
Office of the | Bureau du |
Auditor General | verificateur general |
![[auditor002.gif]](https://capedge.com/proxy/18-K/0001137171-04-001643/auditor002.gif)
Exhibit (f)
CONSENT OF AUDITOR GENERAL
I hereby consent to the inclusion of the report of the Auditor General on the financial statements of the Province of New Brunswick for the fiscal year ended 31 March 2004 as exhibit (f) to the Annual Report on Form 18-K of the Province of New Brunswick for the fiscal year ended 31 March 2004, and to the incorporation by reference of such report in the Registration Statement No. 33-89790 of the Province of New Brunswick.
Fredericton, New Brunswick
Daryl C. Wilson, FCA
December 17 2004
Auditor General
Tel./Telephone:
P.O. Box 758
Case postale 758
(506) 453-2243
Fredericton
Fredericton
Fax/Telecopieur:
New Brunswick
Nouveau-Brunswick
(506) 453-3067
Canada E3B 5B4
Canada E3B 5B4
1
Exhibit "g" Financial Statements NB Power
NEW BRUNSWICK POWER CORPORATION AUDITORS' REPORT
AND CONSOLIDATED FINANCIAL STATEMENTS
March 31, 2004

NEW BRUNSWICK POWER CORPORATION |
CONSOLIDATED STATEMENT OF LOSS AND DEFICIT |
For the year ended March 31, 2004 |
(in millions) |
| | | | | | | 2004 | | 2003 |
| | | | | | | | | | | |
REVENUES | | | | | | | | | |
| | | | | | | | | | | |
| | Sales of power (Note 2) | | | | | | | |
| | In-province | | | | $ 1,009 | | | $ 993 | |
| | Out-of-province | | | 246 | | | 227 | |
| | Miscellaneous | | | | 56 | | | 53 | |
| | | | | | | | 1,311 | | | 1,273 |
| | | | | | | | | | | |
EXPENSES | | | | | | | | | |
| | | | | | | | | | | |
| | Fuel and purchased power | | 467 | | | 528 | |
| | Operation, maintenance and administration | 388 | | | 364 | |
| | Amortization and decommissioning (Note 3) | 213 | | | 216 | |
| | Write-off of fuel handling system costs (Note 4) | 44 | | | - | |
| | | | | | | | 1,112 | | | 1,108 |
| | | | | | | | | | | |
Income before finance charges | | | 199 | | | 165 |
| | | | | | | | | | | |
Finance charges (Note 5) | | | | 217 | | | 242 |
| | | | | | | | | | | |
NET LOSS FOR THE YEAR | | | (18) | | | (77) |
| | | | | | | | | | | |
DEFICIT | | | | | | | | | |
| | | | | | | | | | | |
BEGINNING OF YEAR | | | | (177) | | | (100) |
| | | | | | | | | | | |
END OF YEAR | | | | | $ (195) | | | $ (177) |
1
NEW BRUNSWICK POWER CORPORATION |
CONSOLIDATED BALANCE SHEET |
as at March 31, 2004 |
(in millions) |
| | | | | | | | 2004 | | | 2003 |
| | | | | | | | | | | |
| | CURRENT ASSETS | | | | | | |
| | | | | | | | | | | |
| | Cash and short-term investments (Note 6) | $ 7 | | | $ 62 |
| | Accounts receivable | | | 181 | | | 188 |
| | Materials, supplies and fuel | | 96 | | | 98 |
| | Prepaid expenses | | | 3 | | | 7 |
| | | | | | | | | | | |
| | | | | | | | 287 | | | 355 |
| | | | | | | | | | | |
| | PROPERTY, PLANT AND EQUIPMENT (Note 7) | | | | |
| | | | | | | | | | | |
| | Land, buildings, plant and equipment, at cost | 6,016 | | | 5,607 |
| | Less: accumulated amortization | | 2,870 | | | 2,725 |
| | | | | | | | | | | |
| | | | | | | | 3,146 | | | 2,882 |
| | | | | | | | | | | |
| | LONG-TERM ASSETS | | | | | | |
| | | | | | | | | | | |
| | Nuclear decommissioning and used fuel management | | | | |
| | funds (Note 8) | | | | 176 | | | 20 |
| | | | | | | | | | | |
| | DEFERRED CHARGES | | | | | | |
| | | | | | | | | | | |
| | Deferred debt costs, less amounts amortized | 50 | | | 56 |
| | Deferred pension benefit (Note 9) | | 67 | | | 68 |
| | Other deferred charges | | | 3 | | | 6 |
| | | | | | | | 120 | | | 130 |
| | | | | | | | | | | |
| | | | | | | | $ 3,729 | | | $ 3,387 |
| | | | | | | | | | | |
| | | | | | | | | | | |
| | ON BEHALF OF NEW BRUNSWICK POWER CORPORATION | | | | |
| | | | | | | | | | | |
| | | /s/ Leon Furlong | | | Chairman | | | | |
| | | | | | | | | | | |
| | | | | | | | | | | |
| | | /s/ David Hay | | | President and Chief Executive Officer | |
2
NEW BRUNSWICK POWER CORPORATION |
CONSOLIDATED BALANCE SHEET |
as at March 31, 2004 |
(in millions) |
| | | | | | | 2004 | | | 2003 |
| | | | | | | | | | |
CURRENT LIABILITIES | | | | | | |
| | | | | | | | | | |
Short-term indebtedness (Note 11) | | $ 477 | | | $ 295 |
Accounts payable and accruals | | 201 | | | 184 |
Accrued interest | | | | 70 | | | 71 |
Current portion of long-term debt (Note 10) | | 69 | | | 132 |
| | | | | | | | | | |
| | | | | | | 817 | | | 682 |
| | | | | | | | | | |
LONG-TERM DEBT (Note 10) | | | | | | |
| | | | | | | | | | |
Debentures and other loans | | | 3,217 | | | 2,999 |
Less: sinking funds | | | | 403 | | | 387 |
| | | | | | | | | | |
| | | | | | | 2,814 | | | 2,612 |
| | | | | | | | | | |
DEFERRED LIABILITIES | | | | | | |
| | | | | | | | | | |
Plant decommissioning and | | | | | | |
| | used nuclear fuel management (Note 12) | 240 | | | 225 |
Other (Note 13) | | | | 53 | | | 45 |
| | | | | | | | | | |
| | | | | | | 293 | | | 270 |
| | | | | | | | | | |
DEFICIT | | | | | | | | |
| | | | | | | | | | |
Deficit | | | | | (195) | | | (177) |
| | | | | | | | | | |
| | | | | | | $ 3,729 | | | $ 3,387 |
3
NEW BRUNSWICK POWER CORPORATION |
CONSOLIDATED STATEMENT OF CASH FLOW |
For the year ended March 31, 2004 |
(in millions) |
| | | | | | | 2004 | | | 2003 |
| | | | | | | | | | |
NET INFLOW (OUTFLOW) OF CASH RELATED | | | | |
TO THE FOLLOWING ACTIVITIES : | | | | | |
| | | | | | | | | | |
OPERATING | | | | | | | |
| | | | | | | | | | |
| | Net loss for the year | | | $ (18) | | | $ (77) |
| | Amounts charged or credited to operations not | | | | |
| | requiring a current cash payment (Note 14) | 274 | | | 216 |
| | | | | | | | | | |
| | | | | | | 256 | | | 139 |
| | | | | | | | | | |
| | Nuclear decommissioning and used fuel management | | | | |
| | funds installments and earnings | | (156) | | | (20) |
| | Decommissioning liability expenditures | | (3) | | | (1) |
| | Additions to deferred charges | | (5) | | | (6) |
| | Net change in non-cash working capital balances | 29 | | | 14 |
| | | | | | | | | | |
| | | | | | | 121 | | | 126 |
| | | | | | | | | | |
INVESTING | | | | | | | | |
| | | | | | | | | | |
| | Expenditure on property, plant and equipment | (504) | | | (217) |
| | Proceeds on disposal and customer contributions | 7 | | | 5 |
| | | | | | | | | | |
| | | | | | | (497) | | | (212) |
| | | | | | | | | | |
FINANCING | | | | | | | |
| | | | | | | | | | |
| | Debt retirements net of sinking fund proceeds | (102) | | | (829) |
| | Sinking fund installments and earnings | | (55) | | | (56) |
| | Proceeds from long-term debt obligations | 296 | | | 721 |
| | Increase in short-term indebtedness | | 182 | | | 295 |
| | | | | | | | | | |
| | | | | | | 321 | | | 131 |
| | | | | | | | | | |
NET CASH INFLOW (OUTFLOW) | | (55) | | | 45 |
| | | | | | | | | | |
CASH AND SHORT-TERM INVESTMENTS | | | | |
| | | | | | | | | | |
BEGINNING OF YEAR | | | 62 | | | 17 |
| | | | | | | | | | |
END OF YEAR | | | $ 7 | | | $ 62 |
4
NEW BRUNSWICK POWER CORPORATION
NOTES TO THE CONSOLIDATED FINANCIAL STATEMENTS
Year ended March 31, 2004
(in millions)
1.
SIGNIFICANT ACCOUNTING POLICIES
The New Brunswick Power Corporation ("the Corporation"), established in 1920 as a Crown Corporation of the Province of New Brunswick by enactment of the New Brunswick Electric Power Act, has a corporate mission to provide for the continuous supply of energy adequate for the needs and future development of the Province and to promote economy and efficiency in the generation, distribution, supply, sale and use of power.
The accompanying consolidated financial statements have been prepared in accordance with Canadian generally accepted accounting principles, applied on a basis consistent with that of the preceding year. The financial statements include the accounts of the Corporation and those of its wholly owned subsidiary, NB Coal Limited (NB Coal).
a.
Regulation
The Corporation is regulated under a system whereby annual average rate increases greater than three percent, or the Consumer Price Index, whichever is higher, require regulatory review by the Board of Commissioners of Public Utilities of the Province of New Brunswick (Public Utilities Board). The Corporation must also apply to the Public Utilities Board before making any expenditure greater that $75 million in relation to upgrading, maintaining or decommissioning a generating facility.
b.
Property, plant and equipment
The cost of additions to property, plant and equipment is the original cost of contracted services, direct labour and material, interest on funds used during construction and indirect charges for administration and other expenses, less credits for the value of power generated during commissioning. Property, plant and equipment also includes the present value of asset retirement obligations related to the disposal of used nuclear fuel and decommissioning of the nuclear and thermal generating stations.
Interest during construction is capitalized monthly based on the cost of long-term borrowings. When significant assets are removed from service for extended periods of time for refurbishment, interest during construction is charged based on the net book value of the asset concerned.
Contributions in aid of construction , which include amounts received from customers as well as research and development grants in respect of new facilities, are netted against the cost of related assets. Amounts received from customers are being amortized over the estimated service lives of the related assets.
The cost of distribution assets retired, net of dismantlement and salvage, is charged to accumulated amortization. For all other property, plant and equipment dispositions, the cost and accumulated amortization is removed from the accounts , with the gain or loss on disposal being reflected in income.
| 5 | ![[fsnotes04final002.jpg]](https://capedge.com/proxy/18-K/0001137171-04-001643/fsnotes04final002.jpg) |
NEW BRUNSWICK POWER CORPORATION
NOTES TO THE CONSOLIDATED FINANCIAL STATEMENTS
Year ended March 31, 2004
(in millions)
1.
SIGNIFICANT ACCOUNTING POLICIES (continued)
b.
Property, plant and equipment (continued)
Amortization is provided for all assets sufficient to amortize the cost of such assets, less estimated salvage value, over their estimated service lives. The estimated service lives of fixed assets are periodically reviewed and any changes are applied prospectively. Amortization is suspended when significant assets are removed from service for extended periods for refurbishment. Amortization is provided on certain mining equipment on an increasing charge basis, the amortization amount being based on the amount of related debt retirement required during the year. All other assets are amortized on a straight-line basis. Amortization is provided on the net cost of property, plant and equipment in respect of which grants have been provided and on amounts contributed by customers.
The main categories of property, plant and equipment are being amortized based on the following average estimated service lives:
Assets | Years |
Hydro Generating Facilities | 70 * |
Thermal Generating Stations | 35 |
Nuclear Generating Station | 27 |
Combustion Turbine Generating Stations | 25 |
Terminals and Substations | 40 |
Transmission System | 35 - 55 |
Distribution System | 10 - 35 |
Buildings | |
- General | 40 |
- Head Office | 50 |
Communications and Computer Systems Mining Equipment Motor Vehicles | 3 - 15 20 - 35 4 - 10 |
*Components of the hydro generating facilities have service lives between 35 - 100 years
c. Cash and short-term investments
Cash and short-term investments, which are stated at cost, consist of balances with banks and investments in money market instruments.
d.
Inventories
Inventories of materials and supplies, and fuel, other than nuclear fuel, are valued at average cost. Nuclear fuel is valued at cost using the first-in, first-out method.
| 6 | |
NEW BRUNSWICK POWER CORPORATION
NOTES TO THE CONSOLIDATED FINANCIAL STATEMENTS
Year ended March 31, 2004
(in millions)
1.
SIGNIFICANT ACCOUNTING POLICIES (continued)
e.
Deferred debt costs
The Corporation amortizes debenture discounts and premiums, the expenses of issues, and the deferred interest related to debt refinancing, over the lives of the issues to which they pertain.
f.
Foreign exchange transactions
Monetary assets and liabilities denominated in foreign currencies are translated to Canadian (CDN ) dollars at rates of exchange prevailing at the balance sheet date except where such items have been hedged by the acquisition of a forward exchange contract, in which case the rate established by the terms of the contract is used in the translation. Exchange gains and losses resulting from foreign currency translation are reflected in income.
g.
Long-term debt
Long-term debt is recorded on the balance sheet at cost. The estimated fair value of long-term debt is disclosed in the notes to the financial statements using market values or estimates of market values based on debt with similar terms and maturities. The estimated fair value does not include costs that would be incurred to exchange or settle the debt.
h.
Sinking funds
The Minister of Finance of the Province of New Brunswick, as Trustee for the Corporation, maintains sinking funds for all debenture issues. Sinking fund earnings are reflected in the Corporation's income and sinking fund investments are deducted from long-term debt as a legally enforceable right to offset exists.
i .. Asset Retirement Obligations
Nuclear and Thermal Generating Stations
In order to provide for the estimated future costs of permanently disposing of used nuclear fuel and decommissioning the nuclear and thermal generating stations to return the sites to a state of unrestricted use, the Corporation recognizes these liabilities taking into account the time value of money.
The following costs have been recognized as a liability as at March 31, 2004:
The estimated present value of the costs of decommissioning the nuclear and thermal generating stations at the end of their useful lives
The estimated present value of the fixed cost portion of used nuclear fuel management activities that are required regardless of the volume of fuel consumed
The estimated present value of the variable cost portion of used nuclear fuel management activities to take into account actual fuel volumes incurred up to March 31, 2004
The liability for used nuclear fuel management is increased for nuclear fuel bundles used each year with the corresponding amounts charged to operations through fuel expense.
| 7 | |
NEW BRUNSWICK POWER CORPORATION
NOTES TO THE CONSOLIDATED FINANCIAL STATEMENTS
Year ended March 31, 2004
(in millions)
1.
SIGNIFICANT ACCOUNTING POLICIES (continued)
i. Asset Retirement Obligations (continued)
The liabilities for nuclear and thermal plant decommissioning and used nuclear fuel management are increased for the passage of time by calculating accretion (interest) on the liabilities. The accretion expense is calculated using the Corporation's credit adjusted risk free rate and is included with amortization expense.
The calculations of the anticipated future costs are based on detailed studies which take into account various assumptions regarding the method and timing of dismantlement of the nuclear and thermal generating stations, the cost of transportation of nuclear material to permanent disposal facilities, and estimates of inflation rates in the future.
Expenditures incurred on a current basis relating to used nuclear fuel management and plant decommissioning are charged against the deferred liability accounts.
In view of potential developments in the technology of decommissioning and used nuclear fuel management, and because of the various assumptions and estimates inherent in the calculations, the Corporation reviews such calculations periodically.
Hydro Generating Stations
The Corporation currently has no intention of decommissioning its hydro generating stations. With either maintenance efforts or rebuilding, the assets are expected to be used for the foreseeable future. Therefore, no removal date can be determined and consequently a reasonable estimate of the fair value of any related asset retirement obligations cannot be made at this time. If, at some future date, it becomes possible to estimate the fair value cost of removing assets that the Corporation is legally required to remove, an asset retirement obligation will be recognized at that time.
Transmission and Distribution Assets
Although some of the Corporation's transmission and distribution assets may have asset retirement obligations, the Corporation expects to use the majority of its transmission and distribution assets for an indefinite period of time. Therefore, no removal date can be determined and consequently a reasonable estimate of the fair value of any related asset retirement obligation cannot be made at this time. If, at some future date, it becomes possible to estimate the fair value cost of removing assets that the Corporation is legally required to remove, an asset retirement obligation will be recognized at that time.
j ..
Pension plans
Corporation employees are members of the Province of New Brunswick Public Service Superannuation Plan. This multi-employer, defined benefit plan provides pensions based on length of service and the average of the highest five consecutive years of earnings. Pension benefits paid are escalated each year based on the Consumer Price Index to a maximum of 5 or 6% depending on retirement date. The Corporation and its employees make contributions to the plan as prescribed in the Public Service Superannuation Act and its regulations. NB Coal maintains a private defined benefit pension plan for its employees.
| 8 | |
NEW BRUNSWICK POWER CORPORATION
NOTES TO THE CONSOLIDATED FINANCIAL STATEMENTS
Year ended March 31, 2004
(in millions)
1.
SIGNIFICANT ACCOUNTING POLICIES (continued)
j ..
Pension plans (continued)
Under both plans, future salary levels affect the amount of employee future benefits, and therefore the projected benefit method pro-rated on services has been used to determine the accrued benefit obligation. The expected return on plan assets is based on the fair value of plan assets. Actuarial gains or losses in excess of 10% of the greater of the accrued benefit obligation and the fair value of the plan assets at the beginning of the year are amortized over the expected average remaining service life of the employee group. The transitional asset (fair market value of the plan assets less the accrued benefit obligation as determined at April 1, 2000), is also amortized over the average remaining service life of the employee group.
k ..
Retirement allowance
The Corporation has a retirement allowance program for employees that provides a lump-sum payment equal to one week of pay for each full year of employment to a maximum of 26 weeks of pay. Actuarial calculations are prepared to determine the amount of the Corporation's obligations for retirement allowances. The actuarial method used incorporates management's best estimate assumptions to determine the present value of the accrued retirement allowance obligation based on projections of salaries and wages to normal retirement dates. The actuarial present value of accrued retirement allowance obligations for past service is amortized on a straight-line basis over the expected average remaining service life of the employee group.
l ..
Early retirement programs
The total cost of such programs is charged to income in the year the program is initiated, irrespective of when payments are actually made.
m ..
Revenue
Billings to residential and general service customers are rendered monthly on a cyclical basis. All other customers are billed at the end of each month. Revenue in respect of items not billed at the end of a fiscal period is estimated and accrued.
n ..
Derivative financial instruments
In accordance with its hedging policies and objectives, the Corporation only enters into derivative financial instruments to manage underlying exposures. The Corporation formally documents all relationships between hedging instruments and hedged items, as well as its hedging objectives and strategy underlying various hedge transactions. This process includes linking all derivatives to specific assets and liabilities on the balance sheet or to specific forecasted transactions.
Hedge accounting , which allows deferral of gains and losses until settlement, is applied when the derivative instrument is designated as a hedge and the derivative is expected to be effective throughout the life of the hedged item. Effectiveness is achieved when changes in the cash flows or fair value of the derivative instrument substantially offset changes in the cash flows or fair value of the hedged item. The Corporation assesses both at inception and on an ongoing basis whether the derivatives used in hedging transactions are effective.
| 9 | |
NEW BRUNSWICK POWER CORPORATION
NOTES TO THE CONSOLIDATED FINANCIAL STATEMENTS
Year ended March 31, 2004
(in millions)
1.
SIGNIFICANT ACCOUNTING POLICIES (continued)
n ..
Derivative financial instruments (continued)
Effective derivatives that meet hedge criteria are not recorded on the balance sheet and any gain or losses on these instruments are deferred and only recognized at the settlement date. Derivative instruments not meeting hedge criteria are accounted for on the balance sheet at fair value and subsequent changes in fair value are recorded in earnings.
If a derivative instrument ceases to exist and is not replaced as part of the Corporation's hedging strategy, the termination gain or loss is deferred and recognized when the gain or loss of the hedged item is recognized. If a hedged item ceases to exist or is no longer probable of occurring, any previously deferred gains or losses associated with a derivative instrument are recognized in earnings. If a hedging relationship is terminated or ceases to be effective, any previously deferred gains or losses are carried forward and recognized in earnings in the same period as the hedged item and any subsequent gains or losses on the fair value of the instrument are recognized in earnings.
The Corporation periodically uses derivative financial instruments to manage the following risks:
Interest Rates and Foreign Currency Exchange Rates
The Corporation enters into interest rate swaps to hedge against the interest rate exposure associated with the future issuance of debt . The gains or losses on these interest rate swaps that meet the hedge criteria are accounted for on a settlement basis and are recognized only when the debt is refinanced. The resulting gains or losses are deferred and amortized to interest expense over the new debt term.
The Corporation enters into Canadian dollar - US dollar forward contracts or Canadian dollar - US dollar cross currency interest rate swaps to hedge exchange risk related to forecasted US dollar purchases, and interest and principal obligations on US dollar denominated long-term debt.
Gains or losses on forward contracts hedging forecasted US dollar purchases are deferred and recognized at the settlement date as part of the underlying item. In the event that a forward contract is terminated the realized gain or loss would be recognized under deferred assets or liabilities and recognized in income at the settlement date of the related underlying item.
Gains or losses on forward contracts and cross currency interest rate swaps hedging US dollar interest and principal obligations are recognized through income at the settlement date. Interest is accrued at the hedged rate and outstanding US dollar denominated debt is translated to Canadian dollars at the hedged rate. In the event that a cross currency interest rate swap is terminated, the realized gain or loss would be recognized under deferred assets or liabilities and amortized over the debt term.
| 10 | |
NEW BRUNSWICK POWER CORPORATION
NOTES TO THE CONSOLIDATED FINANCIAL STATEMENTS
Year ended March 31, 2004
(in millions)
1.
SIGNIFICANT ACCOUNTING POLICIES (continued)
n ..
Derivative financial instruments (continued)
The Corporation has also assigned certain US dollar denominated sinking fund assets to provide a hedge against outstanding US dollar debentures. The sinking fund assets and outstanding debentures are translated to Canadian dollars at the current exchange rate with the resulting gains or losses recorded in income in the current period.
Oil and Natural Gas Prices
The Corporation enters into oil and natural gas swaps to hedge the anticipated exposure related to changes in the cost of heavy fuel oil in the operations of its generating stations and on a purchase contract largely based on natural gas prices.
Gains or losses on these swaps are recognized at the settlement dates as an adjustment to the fuel or purchased power expense.
o ..
Use of estimates
The preparation of financial statements in conformity with generally accepted accounting principles requires management to make estimates and assumptions that affect the reported amounts of assets and liabilities at the date of the financial statements and the reported amounts of revenue and expense during the reporting period. Actual results could differ from the estimates.
2.
REVENUES
a)
Power sales to the Province of New Brunswick and other government owned organizations are recorded and paid at normal commercial rates.
b)
Total revenue includes $84 million (2003 - $135 million) of sales to customers in the United States.
3.
AMORTIZATION AND DECOMMISSIONING
| | 2004 | | 2003 |
| | | | |
Amortization | $ 196 | | $ 190 |
Decommissioning | 17 | | 26 |
| | $ 213 | | $ 216 |
During 2003, an environmental liability for $11 million related to NB Coal was setup and charged to decommissioning expense.
| 11 | |
NEW BRUNSWICK POWER CORPORATION
NOTES TO THE CONSOLIDATED FINANCIAL STATEMENTS
Year ended March 31, 2004
(in millions)
4. WRITE-OFF OF FUEL HANDLING SYSTEM COSTS
The Corporation received environmental approvals and commenced a project in December 2002 to refurbish the 998 megawatt Coleson Cove Generating Station to extend it s life and convert it to burn Orimulsion(R) fuel.
The project also included development and construction of facilities and pipeline capable of handling Orimulsion(R) fuel .. The Corporation had signed a memorandum of understanding for the development of these facilities. The site chosen required investment in a fixed jetty, storage tanks, pumping , and piping to the existing pipelines used to transport heavy oil to the generating station.
Expenses incurred to March 31, 2004 on the fuel delivery system amounted to $47 million ($1 million - 2003). The availability of Orimulsion(R) fuel is currently uncertain . The method chosen to deliver the Orimulsion(R) fuel will be determined in conjunction with the pending resolution of the supply contract negotiations for Orimulsion(R) fuel .. Of the $47 million, $44 million is not expected to provide future service value and has been expensed in the year ended March 31, 2004, while $3 million remains in construction-in-progress, pending resolution of the supply contract negotiations for Orimulsion(R) fuel and evaluation of fuel delivery options (See Note 16).
5.
FINANCE CHARGES
| | 2004 | | 2003 |
| | | | |
Interest expense | $ 240 | | $ 256 |
Less: Income from sinking funds, trust funds, and other i nvestments | (31) | | (27) |
| | 209 | | 229 |
| | | | |
Provincial government guarantee fee | 20 | | 19 |
Amortization of deferred debt costs | 7 | | 6 |
Unrealized foreign exchange gains | (1) | | (3) |
Realized foreign exchange (gains) losses | (2) | | 1 |
| | 233 | | 252 |
Less: Interest capitalized | (16) | | (10) |
| $ 217 | | $ 242 |
Interest paid on debt during the year was $238 million (2003 - $255 million). Interest received on investments during the year was $27 million (2003 - $23 million).
6.
CASH AND SHORT-TERM INVESTMENTS
| | 2004 | | 2003 |
| | | | |
Cash | $ 4 | | $ 60 |
Short-term investments | 3 | | 2 |
| | $ 7 | | $ 62 |
| 12 | |
NEW BRUNSWICK POWER CORPORATION
NOTES TO THE CONSOLIDATED FINANCIAL STATEMENTS
Year ended March 31, 2004
(in millions)
7.
PROPERTY, PLANT AND EQUIPMENT
| | | 2004 | | | | 2003 | |
| | Cost | | Accumulated amortization | | Cost | | Accumulated amortization |
Power generating stations |
$ 3,742 | |
$ 2,052 | |
$ 3,731 | |
$ 1,926 |
Transmission system | 284 | | 132 | | 278 | | 126 |
Terminals and substations | 428 | | 220 | | 417 | | 213 |
Distribution system | 709 | | 296 | | 719 | | 306 |
Buildings and properties | 59 | | 30 | | 58 | | 29 |
Communications and computer systems | 86 | | 42 | | 79 | |
34
|
Mining equipment and related assets | 53 | | 52 | | 53 | | 49 |
Motor vehicles | 50 | | 32 | | 50 | | 30 |
Miscellaneous assets | 18 | | 14 | | 17 | | 12 |
Construction-in-progress* | 587 | | - | | 205 | | - |
| | $ 6,016 | | $ 2,870 | | $ 5,607 | | $ 2,725 |
*Construction-in-progress at March 31, 2004 includes $71 million (2003 - $59 million) of expenditures on the Point Lepreau Generating Station Refurbishment Project. Management's forecasted total construction cost for the project is $9 40 million . The project has not received final approval.
Construction-in-progress at March 31, 2004 also includes $467 million (2003 - $106 million) of expenditures on the Coleson Cove Generating Station Refurbishment Project. Management's forecasted total construction cost for the project is $672 million, which may increase pending resolution of the supply contract negotiations for Orimulsion(R) fuel and evaluation of fuel delivery options. In addition, $44 million has been written off (See Note 4).
| 13 | |
NEW BRUNSWICK POWER CORPORATION
NOTES TO THE CONSOLIDATED FINANCIAL STATEMENTS
Year ended March 31, 2004
(in millions)
8.
NUCLEAR DECOMMISSIONING AND USED FUEL MANAGEMENT FUNDS
Used Nuclear Fuel Management Funds The used nuclear fuel management trust funds are comprised of: | 2004 | 2003 |
1. The Corporation has established a used nuclear fuel segregated fund held in a custodial account to meet the license conditions of the Point Lepreau Generating Station set by the Canadian Nuclear Safety Commission (CNSC). |
$ 76 |
$ - |
2. The Corporation has also established a trust fund pursuant to the Federal Nuclear Fuel Waste Act (NFWA) . I n accordance with the NFWA, the Nuclear Waste Management Organization was formed to prepare and review alternatives, and provide recommendations for long-term management of nuclear waste. This submission is to occur within three years of the NFWA coming into force. The federal government will determine the strategy for dealing with the long-term management of used nuclear fuel based on submitted plans. The NFWA requires major owners of used nuclear fuel in Canada to establish trust funds to finance the long-term management of used nuclear fuel. The NFWA requires the Corporation to contribute $4 million annually for the next two years to its trust fund. Further funding requirements beyond this time will be based on the plan chosen. The funds contained in the established fund to meet the license conditions of the generating station described above will also be used to meet these requirements. |
24 |
20 |
| | 100 | 20 |
Nuclear Decomissioning Fund | | |
The Corporation has established a decommissioning segregated fund held in a custodial account to meet the license conditions for the Point Lepreau Generating Station set by the CNSC. |
76 |
- |
| | $ 176 | $ 20 |
| 14 | |
NEW BRUNSWICK POWER CORPORATION
NOTES TO THE CONSOLIDATED FINANCIAL STATEMENTS
Year ended March 31, 2004
(in millions)
9.
DEFERRED PENSION BENEFIT
Corporation employees are members of the Province of New Brunswick Public Service Superannuation Plan (Public Service Plan) as described in Note 1 j . Pension assets and liabilities for the Public Service Plan are measured as at March 31, 2004 while the assets and liabilities for the NB Coal plan are measured as at December, 31, 2003. The most recent actuarial valuation done for funding purposes for the Public Service Plan was April 1, 2002. The next valuation for funding purposes is required to be completed as at April 1, 2005.
The significant assumptions of management include the following:
Discount rate used at March 31, 2004 to determine the accrued benefit obligation - 6.5% (March 2003 - 6.5%)
Expected long-term rate of return on plan assets - 7.5%
Salary increases - 2.5%
The costs recognized for the year are:
| | 2004 | | 2003 |
Current service cost | $ 13 | | $ 12 |
Interest on accrued benefit obligation | 50 | | 45 |
Actual (gain) or loss on plan assets | (153) | | 52 |
Difference between actual and expected return on plan assets | 106 | | (103) |
Amortization of gain/losses and transitional surplus | 8 | | (1) |
Costs recognized | $ 24 | | $ 5 |
The status of the assets and obligations of the Corporation's share of the Public Service Plan and NB Coal's private plan as at March 31, 2004 was as follows:
| | 2004 | | 2003 |
Pension fund assets at fair value | $ 778 | | $ 621 |
Accrued benefit obligation | 810 | |
756
|
Pension deficit
| (32) | | (135) |
Unamortized transitional obligation | (40) | | (44) |
Unamortized losses | 139 | | 247 |
Pension asset | $ 67 | | $ 68 |
In accordance with prescribed regulations, employees contributed $10 million (2003 - - $10 million) and the Corporation contributed $ 2 3 million to the plan (2003 - $12 million) during the year. Total contributions to date in excess of pension expense , in the amount of $67 million (2003 - $68 million) , have been recorded as an asset under deferred charges.
| 15 | |
NEW BRUNSWICK POWER CORPORATION
NOTES TO THE CONSOLIDATED FINANCIAL STATEMENTS
Year ended March 31, 2004
(in millions)
10.
LONG-TERM DEBT
| | 2004 | | 2003 |
| | | | |
Debenture guaranteed by the Province of New Brunswick | $ 125 | | $ 125 |
Debentures held by the Province of New Brunswick | 3,155 | | 2,998 |
Other loans | 6 | | 8 |
| | | | |
| | 3,286 | | 3,131 |
Less: payments due within one year | 69 | | 132 |
| | | | |
Long-term debt | 3,217 | | 2,999 |
| | | | |
Less: s inking funds | 403 | | 387 |
| | | | |
| | $ 2,814 | | $ 2,612 |
Debentures
Date of maturity | Average Coupon Rate |
Canadian |
US |
2004 | |
2003 |
Years ending: | | | | | | |
March 31, 2004 | 7.5% | | | | | 100 |
March 31, 2005 | 2.7% | 36 | - | 36 | | - |
March 31, 2006 | 5.7% | 436 | - | 436 | | 400 |
March 31, 2007 | 5.6% | 106 | - | 106 | | 70 |
March 31, 2008 | 4.7% | 39 | 317 | 356 | | 317 |
March 31, 2009 | 7.3% | 275 | - | 275 | | - |
1-5 years | 5.7% | 892 | 317 | 1,209 | | 887 |
6-10 years | 7.2% | 1,275 | 319 | 1,594 | | 1,459 |
11-30 years | 8.8% | 150 | 327 | 477 | | 777 |
| | | | | | | |
Debentures | | $ 2,317 | $ 963 | $ 3,280 | | $ 3,123 |
| | | | | | | |
Loans payable in annual installments of principal and interest at rates varying from 4.5% to 8.26% per annum to the year 2011. | 6 | |
8 |
Total long-term debt | $ 3,286 | | $ 3,131 |
The weighted average coupon interest rate on all debentures outstanding at March 31, 2004 is 6.89% (2003 - 7.24%).
The US dollar debenture balance outstanding at March 31, 2004 is US $650 million (2003 - $650 million).
| 16 | |
NEW BRUNSWICK POWER CORPORATION
NOTES TO THE CONSOLIDATED FINANCIAL STATEMENTS
Year ended March 31, 2004
(in millions)
10.
LONG-TERM DEBT (continued)
Long-term debt and sinking fund obligations
Long-term debt principal and sinking fund obligations with respect to debt outstanding at March 31, 2004 are as follows for the five years ending March 31, 2009:
| | |
|
Year ending March 31, 2005 | | $ 69 |
Year ending March 31, 2006 | | 469 |
Year ending March 31, 2007 | | 134 |
Year ending March 31, 2008 | | 380 |
Year ending March 31, 2009 | | 297 |
| | | |
Cross-currency interest rate swaps
a)
7.625% Debentures, due February 2013 - US $100 million
With respect to this debt, the Corporation has entered into a cross-currency interest rate swap transaction with Canadian banks that results in an effective fixed interest rate of 7.75125% on CDN $159 million.
b)
6.75% Debentures, due August 2013 - US $100 million
With respect to this debt, the Corporation has entered into a cross-currency interest rate swap transaction with Canadian banks that results in an effective fixed interest rate of 6.80025% on CDN $159 million.
c)
3.50% Debentures, due October 2007 - US $200 million
With respect to this debt, the Corporation has entered into a cross-currency interest rate swap transaction with the Province of New Brunswick that results in an effective fixed interest rate of 4.7925% on CDN $317 million.
Guarantee fee
The Corporation pays an annual guarantee fee to the Province of New Brunswick, amounting to 0.6489% of the total of long-term debt guaranteed by the Province, debentures held by the Province and short-term indebtedness to the Province, less the balance held in sinking funds, measured as at the previous year end.
11.
SHORT-TERM INDEBTEDNESS
The Corporation borrows funds for temporary purposes from the Province of New Brunswick. The short-term borrowings from the Province of New Brunswick are $477 million at March 31, 2004 (2003 - $295 million).
The Corporation may also borrow from banks from time to time. Such borrowings are payable on demand. The Corporation has $89 million in bank lines of credit available for short-term borrowings, guaranteed by the Province of New Brunswick .
NB Coal has bank lines of credit totaling $4 million, which are secured by a general assignment of book debts.
| 17 | |
NEW BRUNSWICK POWER CORPORATION
NOTES TO THE CONSOLIDATED FINANCIAL STATEMENTS
Year ended March 31, 2004
(in millions)
12.
PLANT DECOMMISSIONING AND USED NUCLEAR FUEL MANAGEMENT
The Corporation's nuclear generating station produces used nuclear fuel in the form of radioactive fuel bundles. The used nuclear fuel will need to be disposed of and the nuclear station will need to be dismantled and decommissioned at the end of its service life.
The Corporation also provides for decommissioning its thermal generating stations at the end of their useful lives.
The liability for plant decommissioning and used nuclear fuel management consists of the following:
| | 2004 | | 2003 |
Used Nuclear Fuel Management | | | |
Balance, beginning of year | $ 61 | | $ 56 |
Add: Liabilities incurred | 1 | | 1 |
Add: Accretion expense | 4 | | 4 |
Balance, end of year | 66 | | 61 |
| | | | |
Nuclear Decommissioning | | | |
Balance, beginning of year | 129 | | 120 |
Add: Accretion expense | 9 | | 9 |
Balance, end of year | 138 | | 129 |
| | | | |
Thermal Decommissioning | | | |
Balance, beginning of year | 35 | | 33 |
Add: Accretion expense | 2 | | 2 |
Less: Expenditures | 1 | | - |
Balance, end of year | 36 | | 35 |
| | | | |
Total plant decommissioning and used nuclear fuel management liability at end of year | $ 240 | | $ 225 |
Liability for Used Nuclear Fuel Management
The liability for used nuclear fuel management costs represents the cost of managing the radioactive used nuclear fuel bundles generated by the nuclear station. The liability is partially funded (See Note 8). Th e key assumptions on which the liability is based are:
The total undiscounted amount of the estimated cash flows required to settle the liability is $454 million
The management of the used nuclear fuel will require cash expenditures until 2047 to settle the liability
The credit adjusted risk free rate at which the estimated cash flows have been discounted is 7.1%
The end of the service life of the station is 2010
| 18 | |
NEW BRUNSWICK POWER CORPORATION
NOTES TO THE CONSOLIDATED FINANCIAL STATEMENTS
Year ended March 31, 2004
(in millions)
12.
PLANT DECOMMISSIONING AND USED NUCLEAR FUEL MANAGEMENT (continued)
Liability for Nuclear Decommissioning
The liability for nuclear decommissioning represents the costs of decommissioning the nuclear generating station after the end of its service life. The liability is partially funded (See Note 8). The key assumptions on which the liability is based are:
The total undiscounted amount of the estimated cash flows required to settle the liability is $478 million
The decommissioning of the nuclear generating station will require cash expenditures until 2052 to settle the liability
The credit adjusted risk free rate at which the estimated cash flows have been discounted is 7.1%
The end of the service life of the station is 2010
Liability for Thermal Decommissioning
The liability for thermal decommissioning represents the costs of decommissioning the thermal generating stations after the end of their service lives. The liability is not funded. The key assumptions on which the liability is based are:
The total undiscounted amount of the estimated cash flows required to settle the liability is $94 million
The decommissioning of the thermal generating stations will require cash expenditures until 2033 to settle the liability
The credit adjusted risk free rate at which the estimated cash flows have been discounted is 7.1%
13.
DEFERRED LIABILITIES - OTHER
| | 2004 | | 2003 |
| | | | |
Early retirement programs | $ 30 | | $ 24 |
Retirement allowance program | 15 | | 13 |
Other future employee benefits payable | 1 | | 1 |
NB Coal environmental liability | 10 | | 11 |
| | | | |
| | 56 | | 49 |
Less: a mounts due within one year | 3 | | 4 |
| | $ 53 | | $ 45 |
| 19 | |
NEW BRUNSWICK POWER CORPORATION
NOTES TO THE CONSOLIDATED FINANCIAL STATEMENTS
Year ended March 31, 2004
(in millions)
13.
DEFERRED LIABILITIES - OTHER (continued)
Retirement Allowance Liability
The interest rate used in the calculation of this obligation was 6.5% and the assumed rate of salary escalation was 2.5%. The latest actuarial calculation was completed as at April 1, 2003.
The retirement allowance obligation as at March 31, 2004 is $28 million (2003 - - $27 million). The retirement allowance expense for the year ended March 31, 2004 was $4 million (2003 - $4 million). The cumulative amount expensed in excess of amounts paid out under the retirement allowance program has been set up as a deferred liability.
NB Coal Environmental Liability
During the prior year, the Corporation and its subsidiary, NB Coal, developed a long-term plan to treat acidic water drainage from an inactive mine. The plan involves building a permanent water treatment facility which will be used to treat the site for as long as required. In 2003, NB Coal recognized an environmental liability equal to the net present value of the expected future costs.
| | 2004 | | 2003 |
| | | |
Balance, beginning of year | $ 11 | | $ - |
Add: Liabilities incurred | - | | 11 |
Add: Accretion expense | 1 | | 1 |
Less: Expenditures | 2 | | 1 |
Balance, end of year | $ 10 | | $ 11 |
| | | | |
14.
AMOUNTS CHARGED OR CREDITED TO OPERATIONS NOT REQUIRING A CURRENT CASH PAYMENT
| | 2004 | | 2003 |
| | | | |
Amortization and decommissioning | $ 213 | | $ 216 |
Amortization of deferred debt costs | 7 | | 6 |
Unrealized foreign exchange gains | (1) | | (3) |
Used nuclear fuel liabilities incurred | 1 | | 1 |
Retirement expenses less related funding | 7 | | 3 |
Pension expenses less related funding | 1 | | (7) |
Write-off of fuel handling system costs | 44 | | - |
Other | 2 | | - |
| | $ 274 | | $ 216 |
| 20 | |
NEW BRUNSWICK POWER CORPORATION
NOTES TO THE CONSOLIDATED FINANCIAL STATEMENTS
Year ended March 31, 2004
(in millions)
15.
FINANCIAL INSTRUMENTS
Fair value of financial instruments
The fair value of financial instruments have been estimated by reference to quoted market prices or from valuations supplied by counter-parties for actual or similar instruments at the fiscal year-end, unless otherwise noted.
Interest rate and foreign exchange risk management
At March 31, 2004, the Corporation had outstanding forward cross-currency interest rate swaps effectively hedging principal and interest payments as follows:
| | 2004 | | 2003 |
Cross-Currency Interest Rate Swaps | | | |
| | | | |
US debt amount (in millions) | $ 400 | | $ 400 |
Weighted average interest rate | 6.04% | | 6.04% |
Weighted average exchange rate | 1.5883 | | 1.5883 |
Fair value liability (in millions) | $ (122) | | $ (21) |
At March 31, 2004, the Corporation had outstanding foreign exchange contracts maturing over the next eighteen months as follows:
| | 2004 | | 2003 |
Foreign Exchange Contracts | | | |
| | | | |
Net commitment to purchase USD (in millions) | $ 106 | | $ 263 |
Weighted average exchange rate | 1.4879 | | 1.5554 |
Fair value liability (in millions) | $ (18) | | $ (17) |
Fuel price risk management
At March 31, 2004, the Corporation had outstanding heavy fuel oil swap contracts maturing over the next twelve months as follows:
| | 2004 | | 2003 |
Heavy Fuel Oil Swaps | | | |
| | | | |
Notional amount (in barrels) | 3.3 million | | 3.2 million |
Weighted average fixed price/barrel (in USD) | $ 21.92 | | $ 17.89 |
Fair value asset (in millions) | $ 9 | | $ 8 |
| 21 | |
NEW BRUNSWICK POWER CORPORATION
NOTES TO THE CONSOLIDATED FINANCIAL STATEMENTS
Year ended March 31, 2004
(in millions)
15.
FINANCIAL INSTRUMENTS (continued)
At March 31, 2004, the Corporation had outstanding natural gas swap contracts maturing over the next eighteen months as follows:
| | 2004 | | 2003 |
Natural Gas Swaps | | | |
| | | | |
Notional amount (in btu's) | 10.1 million | | 1.3 million |
Weighted average fixed price/btu (in USD) | $ 5.95 | | $ 3.92 |
Fair value asset (in millions) | $ 14 | | $ 4 |
Under these agreements, the Corporation exchanges monthly payments based on the differential between a fixed price and a monthly cumulative floating price for the associated fuel. The differential to be paid or received is reflected in the cost of purchased power or fuel expense.
Fair value of debt and sinking funds
| | 2004 | | 2003 |
Long - Term Debt | | | |
| | | | |
Book value (in millions) | $ 3,286 | | $ 3,131 |
Fair value (in millions) | $ 3,879 | | $ 3,639 |
| | | | |
Sinking Funds | | | |
| | | | |
Book value (in millions) | $ 403 | | $ 387 |
Fair value (in millions) | $ 452 | | $ 420 |
Fair value of nuclear decommissioning and used fuel management funds
| | 2004 | | 2003 |
Nuclear Decommissioning & Used Fuel Management Funds | | | |
| | | | |
Book value (in millions) | $ 176 | | $ 20 |
Fair value (in millions) | $ 183 | | $ 20 |
| | | | |
Fair value of other financial assets and liabilities
The fair values of all other financial assets and liabilities are not materially different
from their carrying values
Credit risk
Credit risk arises from the potential that a counter party will fail to perform its obligations. The Corporation conducts a thorough assessment of debtors prior to granting credit and actively monitors the financial health of its debtors on an on-going basis. The maximum credit risk exposure is deemed to be the sum of accounts receivable, net of applicable reserves, and the total unrealized gains on other financial instruments exposed to credit risk . Accounts receivable, net of applicable reserves is $1 8 1 million (2003 - $188 million). The total unrealized gains on other financial instruments exposed to credit risk is $23 million (2003 - $12 million).
| 22 | |
NEW BRUNSWICK POWER CORPORATION
NOTES TO THE CONSOLIDATED FINANCIAL STATEMENTS
Year ended March 31, 2004
(in millions)
16.
COMMITMENTS AND CONTINGENCIES
Coleson Cove Generating Station Refurbishment
Expenditures to March 31, 2004 to refurbish, extend its service life and install emission control equipment amounted to $ 467 million (2003 - $106 million). The refurbishment project is expected to be completed by January 2005 (See Note 7) .
Belledune Wharf
The Corporation has entered into an operating lease expiring in 2013, with a twenty year renewal option, for the port facility at Belledune. This lease provides for annual charges of approximately $5 million.
Courtenay Bay Generating Station
The Corporation has entered into a lease agreement for site facilities, expiring in 2021, with a five-year option to extend. The tenant has repowered an existing 100 MW unit to a 280 MW combined cycle natural gas unit , which began commercial operation effective September 2001.
The Corporation has also entered into a related power purchase and transmission access agreement expiring in 2021, with a five year option to extend, with the same third party. The Corporation will purchase all the electrical energy produced by the re-powered 280 MW combined cycle natural gas unit during the winter period, November 1 to March 31, and from time to time, some or all of the electrical energy produced during the summer period.
Power Purchase Agreements
The Corporation has entered into a 20 year power purchase agreement to purchase all the capacity and electrical energy produced by a 90 MW co-generation facility that is expected to begin production in December 2004.
The Corporation also has an outstanding power purchase agreement for 38.5 MW of capacity and energy from a co-generation facility which expires in 2027.
Gas Transportation Agreement
The Corporation has entered into an agreement expiring in 2015, for firm natural gas transportation service to the re-powered Courtenay Bay Generating Station. The cost of transportation will be recovered from the tenant referred to in the lease of the generating station.
Orimulsion(R) Fuel Supply
The Corporation has a n agreement with Bitor America Corporation to purchase Orimulsion(R) fuel for the Dalhousie Generating Station to 2010. Also, the Corporation signed a term sheet and negotiated a contract with Bitor America Corporation for the purchase of Orimulsion(R) fuel for the Coleson Cove Generating Station for a twenty year term, beginning in 2004. In February 2004, the Corporation filed a lawsuit against Bitor America Corporation and Petroleos de Venezuela ("P DVSA ") for breach of contract. The legal action was taken against the Orimulsion(R) fuel supplier to protect the benefits in the contract for the Coleson Cove Generating Station Refurbishment .
| 23 | |
NEW BRUNSWICK POWER CORPORATION
NOTES TO THE CONSOLIDATED FINANCIAL STATEMENTS
Year ended March 31, 2004
(in millions)
16.
COMMITMENTS AND CONTINGENCIES (continued)
Computer Equipment
The Corporation has entered into operating leases relating to computer equipment. The future minimum lease payments under these leases are as follows:
| | 2004 | | 2003 |
2005 2006 2007 |
$ 4 2 1 | |
$ 3 1 - |
| | $ 7 | | $ 4 |
1 7 . RESTRUCTURING
In April 2003 the Province of New Brunswick enacted the "Electricity Act". This Act provides for:
| New Brunswick Power Holding Corporation New Brunswick Power Nuclear Corporation New Brunswick Power Generation Corporation New Brunswick Power Transmission Corporation New Brunswick Power Distribution and Customer Service Corporation
|
The establishment of a New Brunswick System Operator , a not for profit organization whose primary objective is to independently direct the operation of the electricity market and maintain the adequacy and reliability of the transmission grid.
The establishment of the New Brunswick Electric Finance Corporation. The New Brunswick Electric Finance Corporation will provide financing and financial backing as required by the new operating companies until such time as they can borrow on their own
The Act also allows for the Province of New Brunswick to:
Cause the Generation Corporation to sell all or part of its assets comprising the Coleson Cove Generating Station, or enter into an agreement including a trust, lease, partnership, joint venture or operating agreement, with respect to the Coleson Cove Generating Station.
Cause the Nuclear Corporation to enter into an arrangement including a trust, lease, partnership, joint venture or operating agreement with respect to the Point Lepreau Nuclear generating Station .
Effect the transferring of officers, employees, assets, liabilities, rights and obligations of New Brunswick Power Corporation to the New Brunswick Power Holding Corporation, the four operating companies, the System Operator and the Electric Finance Corporation. The transfers of assets, liabilities, rights and obligations will be done at their book values.
The Act received royal assent on April 11, 2003 and is expected to be proclaimed during 2004-05.
| 24 | |
NEW BRUNSWICK POWER CORPORATION
NOTES TO THE CONSOLIDATED FINANCIAL STATEMENTS
Year ended March 31, 2004
(in millions)
18.
COMPARATIVE FIGURES
Certain 2003 figures have been reclassified to conform to the 2004 financial statement presentation.
| 25 | |
Exhibit"h" Consent of the Auditor for NB Power

1