FORM 18-K
For Foreign Governments and Political Subdivisions Thereof
SECURITIES AND EXCHANGE COMMISSION
Washington, D.C. 20549
ANNUAL REPORT
of
PROVINCE OF NEW BRUNSWICK
CANADA
(Name of Registrant)
Date of end of last fiscal year: March 31, 2006
SECURITIES REGISTERED *
(As of close of fiscal year)
Amounts as to
Names of
Title of issue
which registration
exchanges on
is effective
which registered
________________________ ê ____________________________ ê ________________________
N/A
N/A
N/A
Names and addresses of persons authorized to receive notices
and communications from the Securities and Exchange Commission:
JOHN MCNAB
Canadian Consulate General
1251 Avenue of the Americas
New York, NY 10020
Copies to:
CHRISTOPHER J. CUMMINGS
JOHN DICAIRE
Shearman & Sterling LLP
Assistant Deputy Minister
Commerce Court West
Treasury Division
199 Bay Street, Suite 4405
Province of New Brunswick
Toronto, ON Canada M5L1E8 P.O. Box 6000
Fredericton, NB, Canada E3B5H1
* The Registrant is filing this annual report on a voluntary basis.
The information set forth below is to be furnished:
1.
In respect of each issue of securities of the registrant registered, a brief statement as to:
(a)
The general effect of any material modifications, not previously reported, on the rights of the holders of such securities.
None.
(b)
The title and the material provisions of any law, decree or administrative action, not previously reported, by reason of which the security is not being serviced in accordance with the terms thereof.
None.
(c)
The circumstances of any other failure, not previously reported, to pay principal, interest, or any sinking fund or amortization installment.
None.
2.
A statement as of the close of the last fiscal year of the registrant giving the total outstanding of:
(a)
Internal funded debt of the registrant. (Total to be stated in the currency of the registrant. If any internal funded debt is payable in a foreign currency, it should not be included under this paragraph (a), but under paragraph (b) of this item).
Reference is made to page 31 of Exhibit (d) hereto.
(b)
External funded debt of the registrant. (Totals to be stated in the respective currencies in which payable. No statement needs to be furnished as to intergovernmental debt.)
Reference is made to page 31 of Exhibit (d) hereto.
3.
A statement giving the title, date of issue, date of maturity, interest rate and amount outstanding, together with the currency or currencies in which payable, of each issue of funded debt of the registrant outstanding as of the close of the last fiscal year of the registrant.
Reference is made to pages 40, 41and 42 of Exhibit (d) hereto.
4.
(a)
As to each issue of securities of the registrant which is registered, there should be furnished a break-down of the total amount outstanding, as shown in Item 3, into the following:
(1)
Total amount held by or for the account of the registrant.
As at March 31, 2006, the total amount held by or for the account of the registrant was as follows:
| | | | | | | |
Date of Maturity | Interest Rate (%) | Series | | Amount Outstanding | | Amount held in Sinking Fund | Date Issued |
| | | | | | | |
| | | | | | | |
23 Oct. 2007 | 3 1/2 | GA | $ | 500,000,000 | | -- | Oct. 2002 |
15 Feb. 2013 | 7 5/8 | EO | $ | 200,000,000 | $ | 26,447,000 | Feb. 1993 |
15 Aug. 2013 | 6 3/4 | ET | $ | 200,000,000 | $ | 119,805,000 | Sept. 1993 |
15 May 2020 | 9 3/4 | DU | $ | 200,000,000 | $ | 13,310,000 | May 1990 |
1 May 2022 | 8 3/4 | EI | $ | 200,000,000 | | -- | May 1992 |
| | | | | | | |
2
(2)
Total estimated amount held by nationals of the registrant (or if registrant is other than a national government by the nationals of its national government); this estimate need be furnished only if it is practicable to do so.
Not practicable to furnish.
(3)
Total amount otherwise outstanding.
| | | | | |
Date of Maturity |
Interest Rate (%) |
Series | | Amount Otherwise Outstanding |
Date Issued |
| | | | | |
| | | | | |
23 Oct 2007 | 3 ½ | GA | $ | 500,000,000 | Oct. 2002 |
15 Feb 2013 | 7 5/8 | EO | $ | 177,203,000 | Feb. 1993 |
15 Aug 2013 | 6 ¾ | ET | $ | 122,235,000 | Sept. 1993 |
15 May 2020 | 9 ¾ | DU | $ | 186,690,000 | May 1990 |
1 May 2022 | 8 ¾ | EI | $ | 200,000,000 | May 1992 |
| | | | | |
(b)
If a substantial amount is set forth in answer to paragraph (a)(1) above, describe briefly the method employed by the registrant to reacquire such securities.
The Province of New Brunswick sinking fund is a general investment type fund. The Provincial Loans Act and in some cases the terms and conditions of the debenture issue specify the minimum rate at which sinking fund installments will be made. Purchases of bonds into the fund are generally discretionary. Many of the bonds purchased into the fund are New Brunswick or New Brunswick guaranteed bonds. The Province is also permitted to buy debt instruments issued or guaranteed by the Government of Canada or any Province of Canada and other debt instruments defined by the Provincial Loans Act.
5.
A statement as of the close of the last fiscal year of the registrant giving the estimated total of:
(a)
Internal floating indebtedness of the registrant. (Total to be stated in the currency of the registrant.)
Reference is made to pages 31, 40, 41 and 42 of Exhibit (d) hereto.
(b)
External floating indebtedness of the registrant. (Total to be stated in the respective currencies in which payable.)
Reference is made to page 40 of Exhibit (d) hereto.
6.
Statements of the receipts, classified by source, and of the expenditures, classified by purpose, of the registrant for each fiscal year of the registrant ended since the close of the latest fiscal year for which such information was previously reported. These statements should be so itemized as to be reasonably informative and should cover both ordinary and extraordinary receipts and expenditures; there should be indicated separately, if practicable, the amount of receipts pledged or otherwise specifically allocated to any issue registered, indicating the issue.
Reference is made to pages 19 to 29 and 37 to 39 of Exhibit (d) hereto.
3
7.
(a)
If any foreign exchange control, not previously reported, has been established by the registrant (or if the registrant is other than a national government, by its national government), briefly describe such foreign exchange control.
None.
(b)
If any foreign exchange control previously reported has been discontinued or materially modified, briefly describe the effect of any such action, not previously reported.
Not applicable.
This annual report comprises:
(a)
Pages numbered 1 to 5 consecutively.
(b)
The following exhibit:
(d)
Current Province of New Brunswick Description.
This annual report is filed subject to the Instructions for Form 18-K for Foreign Governments and Political Subdivisions Thereof.
4
SIGNATURE
Pursuant to the requirements of the Securities Exchange Act of 1934, the registrant has duly caused this annual report to be signed on its behalf by the undersigned, thereunto duly authorized, at Fredericton, Canada on the 14th day of December 2006.
Province of New Brunswick
By: /s/ Leonard Lee-White
Leonard Lee-White
Managing Director Debt Management
Treasury Division
Department of Finance
5
EXHIBIT INDEX
(a)
None
(b)
None
(c)
The Province of New Brunswick 2006 – 2007 budget (incorporated by reference to Amendment No.1 on form 18-K/A dated April 7, 2006 to the Annual Report of the Province of New Brunswick).
(d)
Current Province of New Brunswick Description.
6
Exhibit “d” Current Province of New Brunswick Description
![[newbrunswick18k121406001.gif]](https://capedge.com/proxy/18-K/0001137171-06-002227/logo.jpg)
December 2006
1
Exhibit “d” Current Province of New Brunswick Description
TABLE OF CONTENTS
Page
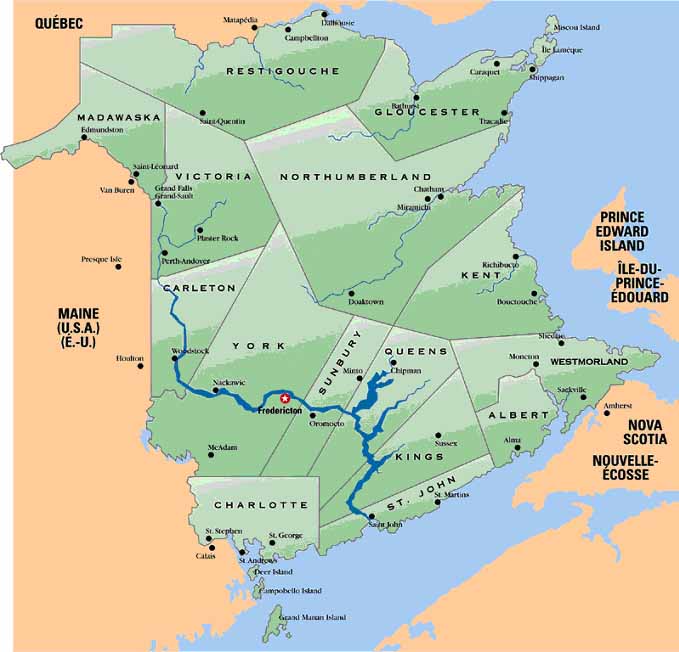
Map of the Province
3
Province of New Brunswick
4
General Information
5
The Economy
6
Revenue and Expenditure of the Province
19
Financing
29
Consolidation of New Brunswick Public Sector Debt
34
Public Sector Pension Liabilities
34
New Brunswick Electric Finance Corporation
35
Tables and Supplementary Information of the Province
37
Funded Debt Outstanding at March 31, 2006
40
Foreign Exchange
43
Sources of Information
43
All dollar amounts herein are in Canadian dollars unless otherwise specified. On December 14, 2006 the noon buying rate in the City of New York for cable transfers payable in Canadian dollars, as reported by The Federal Reserve Bank of New York, was $1.1565 per U.S. dollar.
Financial data for the Province of New Brunswick ("New Brunswick" or the "Province") have been rounded. Certain information presented in tabular form may not add to the total presented due to such rounding.
The Province made a major change in its accounting policies during the year ended March 31, 2005 by implementing the new government reporting model recommendations of the Public Sector Accounting Board (“PSAB”) of the Canadian Institute of Chartered Accountants (“CICA”). The Province now distinguishes between financial and non-financial assets and is now accounting for tangible capital assets as prescribed by PSAB. The new reporting model has resulted in a number of financial statement changes. In some cases historical data cannot be reproduced in the new format.
Compound annual rates of growth are computed by using the "geometric average method", which is based on first and last year observations of the variables rather than all observations over the period concerned.
2
Exhibit “d” Current Province of New Brunswick Description
MAP OF NEW BRUNSWICK
3
Exhibit “d” Current Province of New Brunswick Description
PROVINCE OF NEW BRUNSWICK
The following summary information is qualified in its entirety by the information contained herein.
| | | | | | | |
| | | | | | |
| | | | | | | |
| | Year ended December 31, (Canadian dollars in millions where applicable) | | Compound Annual Growth Rate % |
| | |
| | 2001 | 2002 | 2003 | 2004 | 2005 | 2001-2005 |
Economy1 | | | | | | | |
Gross Domestic Product at market prices | | 20,684 | 21,169 | 22,346 | 23,487 | 24,162 | 4.0 |
Personal Income | | 17,852 | 18,302 | 18,961 | 19,751 | 20,398 | 3.4 |
Retail Trade | | 7,498 | 7,787 | 7,827 | 7,963 | 8,391 | 2.8 |
Manufacturing Shipments | | 11,830 | 12,447 | 12,549 | 13,636 | 14,959 | 6.0 |
Foreign Commodity Exports | | 8,271 | 8,166 | 8,517 | 9,438 | 10,675 | 6.6 |
Population at July 1 (in thousands) | | 750 | 750 | 751 | 752 | 751 | 0.1 |
Unemployment Rate | | 11.1% | 10.2% | 10.3% | 9.8% | 9.7% | --- |
Change in Consumer Price Index | | 1.7% | 3.4% | 3.4% | 1.5% | 2.4% | --- |
| | | | | | | | |
| Year ended March 31, (Canadian dollars in millions) | | Budget Estimat Estimates |
| |
| | | 2004 | 2005 | 2006 | 2007 |
| | | | | | |
Government Finance* | | | | | | |
Ordinary Account (Surplus) Deficit |
| | 101.2 | (248.5) | (239.3) | (84.2) |
Net Capital Expenditure |
| | 240.7 | 344.0 | 375.2 | 408.4 |
(Surplus) Deficit on Special Purpose Account |
| | (4.2) | (6.3) | (6.8) | 3.2 |
(Surplus) Deficit on Special Operating Agency |
| | (12.1) | (12.7) | (33.9) | (10.7) |
Earnings from Sinking Fund |
| | (222.5) | (221.6) | (226.4) | (229.7) |
Increase (Decrease) in Net Debt |
| | 91.2 | (145.4) | (122.6) | 87.0 |
|
| | | | | |
*Comparable historic figures are not available due to move to Tangible Capital Asset Accounting | | |
| | | | | | |
| | Year ended March 31, (Canadian dollars in millions) |
| |
| | 2002 | 2003 | 2004 | 2005 | 2006 |
| | | | | | |
Provincial Purpose Funded Debt and Capital Loans 2 | | | | | | |
Gross Provincial Purpose Funded Debt and Capital Loans | | 8,004.7 | 8,418.7 | 8,485.8 | 8,397.0 | 8,942.4 |
Less Sinking Funds | | 3,358.8 | 3,543.0 | 3,716.2 | 3,773.8 | 3,984.0 |
Net Provincial Purpose Funded Debt and Capital Loans | | 4,645.9 | 4,875.7 | 4,769.6 | 4,623.2 | 4,958.4 |
| | | | | | |
| | Year ended March 31, (Canadian dollars in millions) |
| | 2002 | 2003 | 2004 | 2005 | 2006 |
Advances to NB Power /NBEFC 3 | | | | | | |
Gross Advances | | 3,121.7 | 2,972.8 | 3,098.0 | 3,316.6 | 3,261.5 |
Less Sinking Funds | | 327.4 | 351.3 | 363.7 | 391.6 | 336.4 |
Net Advances | | 2,794.3 | 2,621.5 | 2,734.3 | 2,925.0 | 2,925.1 |
| | | | | |
| Year ended March 31, (Canadian dollars in millions) |
| 2002 | 2003 | 2004 | 2005 | 2006 |
Contingent Liabilities | 151.4 | 196.5 | 263.5 | 269.4 | 102.6 |
| | | | | |
1Source: Statistics Canada – Numbers are subject to adjustment.
2Foreign currency issues are expressed as the Canadian dollar equivalent at fiscal year end rates of exchange or, where hedges are in place, at the rates of exchange established by such hedges.
3Foreign currency issues are expressed as the Canadian dollar equivalent at fiscal year end rates of exchange. See section on New Brunswick Electric Finance Corporation.
4
Exhibit “d” Current Province of New Brunswick Description
PROVINCE OF NEW BRUNSWICK
GENERAL INFORMATION
Introduction
The Province of New Brunswick is located on the eastern seaboard of Canada and has a total area of 28,355 square miles of which about 12,877 square miles is Crown land owned by the Province. The St. John River flows for a distance of over 300 miles through the Province to its mouth on the Bay of Fundy. The Province's population is concentrated principally in the valleys of the St. John and other rivers.
A large part of New Brunswick is covered by forests, which constitute a major natural resource. Other natural resources include fish and shellfish, farmland and base metals, coal, potash, limestone and other minerals. The location of the Province provides the advantage of cost effective water transportation for its products to export markets in the eastern U.S., Great Britain and Western Europe. Saint John, New Brunswick’s largest city, located at the mouth of the St. John River on the Bay of Fundy, is home to one of North America’s largest oil refineries and is one of the two principal seaports in eastern Canada that remain open throughout the year. Consequently, some Canadian shipping, which would otherwise pass through the St. Lawrence River, is diverted to the Saint John port during the winter months.
According to Statistics Canada, the population of the Province on July 1, 2006 was estimated at 749,168. The three largest urban areas of New Brunswick and their respective populations based on 2001 census figures are Saint John (122,678), Moncton (117,727) and Fredericton (81,346), the capital of the Province.
Government
Canada consists of a federation of provinces and Federal territories with a constitutional division of powers between the Federal and provincial governments established by the Constitution Act, 1867 and the Constitution Act, 1982. Under these Acts the provinces are assigned jurisdiction over health, social services, education, municipal institutions, property and civil rights, natural resources and other matters of purely private or local concern. The Parliament of Canada has jurisdiction over all areas not assigned exclusively to the provincial legislatures, including such matters as the Federal public debt and property, the regulation of trade and commerce, currency and coinage, banks and banking, national defense, the postal services, railways and navigation and employment insurance.
The Constitution Act, 1982 provides for enlarged provincial jurisdiction over and taxation of certain natural resources and electrical energy, a Charter of Rights and Freedoms, including language rights, the principles of the reduction of regional economic disparities and the making of fiscal equalization payments to certain provinces by the Government of Canada, and for the amendment of the constitution in Canada. Each Province owns mineral and other resources on its provincial Crown Lands and may own sub-surface resources on its other lands.
The executive power in New Brunswick is vested in the Lieutenant-Governor acting on the advice of the Executive Council. The Executive Council is responsible to the Legislative Assembly. The Lieutenant-Governor, who is the representative of the Queen, is appointed by the Governor-General of Canada in Council on the recommendation of the Prime Minister of Canada. The current Lieutenant-Governor is His Honour Herménégilde Chiasson. Members of the Executive Council are appointed by the Lieutenant-Governor on the nomination of the Premier from members of the Legislative Assembly. There are presently 19 members of the Executive Council, including the Premier, the Honourable Shawn Graham.
Legislative power is exercised by the Legislative Assembly and legislation becomes effective upon the assent of the Lieutenant-Governor unless otherwise specified in the legislation. The Legislative Assembly is elected for a term of five years and may be dissolved at any time by the Lieutenant-Governor on the advice of the Premier. Of a total of 55 seats in the Legislative Assembly, 29 are held by the Liberal Party and 26 are held by the Progressive Conservative Party. The last provincial general election was held on September 18, 2006 in which the Liberal Party defeated the incumbent Progressive Conservative Party.
5
Exhibit “d” Current Province of New Brunswick Description
International Trade Agreements
The Government of New Brunswick believes that Canada’s participation in the Canada-U.S. Free Trade Agreement (“FTA”) and North American Free Trade Agreement (“NAFTA”) improves the Province’s international trade opportunities, particularly with neighbouring U.S. states. The FTA/NAFTA have provided the Province with an extraordinary advantage with the US market over the past 20 years. However, as the US implements more regional/bilateral free trade agreements, the Province’s exclusive position is being eroded. The formation of the World Trade Organization (“WTO”) is beneficial for the export-oriented economies of both Canada and New Brunswick. In November 2001, the fourth WTO Ministerial Conference in Doha, Qatar launched a new round of multilateral trade negotiations. Although negotiations faltered after the 2002 Cancun Ministerial, the sixth WTO Ministerial Conferenc e in Hong Kong in December 2005 was seen as a moderate success. The WTO is the cornerstone of Canadian trade policy and New Brunswick has indicated its support for Canada’s position on the July 2005 negotiating framework. The Province participates actively on Federal/Provincial consultative committees concerned with implementation, dispute settlement and future negotiation issues related to international trade and investment agreements.
On March 22, 2002, the U.S. Department of Commerce (“DOC”) found that Canadian softwood lumber producers, other than those from Atlantic Canada, had benefited from countervailable subsidies and that all Canadian producers of softwood lumber had sold their product below fair market value. As a result, the DOC imposed a Countervailing Duty (“CVD”) of 18.79% and an Anti-Dumping (“AD”) duty of 8.43% on Canadian softwood lumber. On August 10, 2005, a NAFTA Extraordinary Challenge Committee (“ECC”) ruled that no duties could apply to Canadian lumber imports into the US. In response, the US Trade Representative indicated that the ECC decision would have no impact on the antidumping and countervailing duty orders. Canada countered by cancelling scheduled negotiations. The DOC again lowered the CVD and AD rates in December 2005 as a result of the second Administrative review. The Maritimes’ AD r ate is set at 2.25%, while the rest of Canada is paying 11.35% (the “all others” AD rate of 2.65%, plus the CVD rate of 8.7%).
The US maintained its position that a negotiated solution was the only way to settle this dispute and on April 27, 2006 Canada and the US arrived at a mutually agreed upon framework for an agreement. On Sept 12, 2006, Canada and the US signed the final Softwood Lumber Agreement ("SLA") to end the softwood lumber dispute. Ottawa delivered on a promised "exclusion" for Atlantic Canada. Since the SLA came into force on Thursday, October 12, 2006, all softwood lumber of Atlantic origin enters the US duty free, export tax free and with no quota restrictions. Atlantic exporters are currently enjoying a 15% advantage over the rest of Canada. At the current very low price for lumber (US$273 per thousand board feet), exporters in affected provinces are being charged an export tax of 15% and they could potentially pay an additional 7.5% "surge" tax if their shipments exceed their market share.
THE ECONOMY
Recent Developments
The Canadian economy continued to adjust to the significant structural change brought about by soaring raw material prices and the ensuing appreciation of the Canadian dollar. Real Gross Domestic Product (“GDP”) advanced 2.9% in 2005, slower than the pace set in 2004. With sizable gains in the last quarter of the year, overall employment pushed ahead 1.4%. However, economic growth in New Brunswick decelerated in 2005 from the previous year, up only 0.3%. Growth in the Province was largely on the strength of business investment and personal consumption, but was weakened by the high dollar impacting exports and increases in imports. For Canada, the higher exchange rate, combined with high energy and other commodity prices, caused economic momentum to shift from central to western Canada, with Alberta and British Columbia posting the strongest performances. For New Brunswick, growth was recorded in most sectors, while manufacturing and accommodatio n and food services posted the most significant decreases. Output from the goods producing sector declined 2.9%, while output from the service sector increased 1.7%.
In 2005, retail sales in New Brunswick increased 5.4% over the 2004 level, compared to a 6.1% national increase. New motor vehicle sales contracted for the third consecutive year, down 0.8% from 2004. New Brunswick's Consumer Price Index increased 2.4%, compared to a 2.2% increase for Canada. Despite the strong Canadian dollar, New Brunswick manufacturing shipments in 2005 increased 9.7% over 2004, above the national rate of 0.8%. Labour income in New Brunswick rose 3.5% to $12.6 billion in 2005, below the national rate of growth of 5.6%. New Brunswick's housing starts in 2005 totaled 3,959, a 0.3% increase over 2004. Capital investment in the Province increased by 5.5% from 2004, with construction investment marginally outpacing that of machinery and equipment. Capital investment in Canada increased by 7.1% in 2005. In the agriculture sector, farm cash receipts increased 2.4% in 2005 despite a 7.6% decline in potato receipts. The value of mineral production in New Brunswick increased 12.4% over 2004, largely due to an 11.2% increase in the value of metallic minerals.
Foreign exports of commodities increased 13.1% in 2005 to $10.7 billion. The value of energy products exports rose 38.3% over the 2004 level while forestry products plunged 19.9%, industrial goods rose 15.8% and machinery and equipment declined 18.8%.
6
Exhibit “d” Current Province of New Brunswick Description
New Brunswick’s employment level in 2005 increased 0.1% from its 2004 level. With the labour force increasing 0.1% as well, the unemployment rate dropped to 9.7% from 9.8% in 2004.
Economic Activity
In 2005, the nominal value of New Brunswick’s GDP was estimated at $24,162 million or $32,173 per capita. Over the 2001 to 2005 period, GDP at market prices grew at a compound annual growth rate of 4.0% compared to a national rate of growth of 5.5%.
Between 2001 and 2005, the real GDP from goods producing industries increased at a compound annual growth rate of 2.0% to $5,806.6 million (1997 dollars). The real GDP of service producing industries recorded a compound annual growth rate of 2.3% during that same period, reaching a level of $13,390.3 million (1997 dollars).
The gross value of manufacturing shipments increased at a compound annual growth rate of 6.0% (in current prices) over the 2001 to 2005 period, while foreign exports of commodities rose at a compound annual growth rate of 6.6% (in current prices).
Personal income has increased from $17,852 million in 2001 to $20,398 million in 2005 (in current prices), a compound annual growth rate of 3.4%. On a per capita basis, personal income increased from $23,803 to $27,161 (in current prices) over the same period, growing at a compound annual growth rate of 3.4% as well, higher than the national compound annual growth rate of 3.0%. Retail trade for New Brunswick increased at a compound annual growth rate of 2.8% (in current prices) over the same period.
The following table sets forth selected indices of economic activity for New Brunswick and for Canada as a whole for the years 2001 through 2005.
| | | | | | | |
SELECTED ECONOMIC INDICATORS |
| Year Ended December 31, (millions unless otherwise stated) | GR1 (%) |
| 2001 | 2002 | 2003 | 2004 | 2005 | 2001-2005 |
Gross Domestic Product at market prices | $20,684 | $21,169 | $22,346 | $23,487 | $24,162 |
4.0 | |
Gross Domestic Product
(Canada) at market prices | 1,108,048 | 1,152,905 | 1,213,408 | 1,290,788 | 1,371,425 |
5.5 | |
Per Capita Gross Domestic
Product (in dollars) | 27,579 | 28,225 | 29,755 | 31,233 | 32,173 |
3.9 | |
Per Capita Gross Domestic Product (Canada) (in dollars) | 35,719 | 36,748 | 38,307 | 40,351 | 42,460 |
4.4 | |
Personal Income | 17,852 | 18,302 | 18,961 | 19,751 | 20,398 | 3.4 | |
Per Capita Personal Income (in dollars) | 23,803 | 24,403 | 25,248 | 26,265 | 27,161 |
3.4 | |
Per Capita Personal Income (Canada) (in dollars) | 28,254 | 28,650 | 29,438 | 30,605 | 31,819 |
3.0 | |
Private and Public Investment (new) | 3,493 | 3,549 | 3,980 | 4,405 | 4,648 | 7.4 | |
Retail Trade | 7,498 | 7,787 | 7,827 | 7,963 | 8,391 | 2.8 | |
Manufacturing Shipments | 11,830 | 12,447 | 12,549 | 13,636 | 14,959 | 6.0 | |
Foreign Commodity Exports | 8,271 | 8,166 | 8,517 | 9,438 | 10,675 | 6.6 | |
Real Gross Domestic Product
(chained 1997 dollars) | 19,257 | 20,133 | 20,605 | 21,147 | 21,219 |
2.5 | |
Real Gross Domestic Product
(Canada) at market prices
(chained 1997 dollars) | 1,038,702 | 1,069,282 | 1,088,773 | 1,124,688 | 1,157,705 |
2.5 | |
Change in Consumer Price Index | 1.7% | 3.4% | 3.4% | 1.5% | 2.4% | | |
Change in Consumer Price Index (Canada) | 2.6% | 2.2% | 2.8% | 1.9% | 2.2% | | |
1Compound annual growth rate Source: Statistics Canada
7
Exhibit “d” Current Province of New Brunswick Description
New Investment
The following table sets forth statistics regarding new investment in New Brunswick, by sector, and compares total new investment with Canada as a whole.
| | | | | |
NEW INVESTMENT |
| Year Ended December 31, |
| 2001 | 2002 | 2003 | 20041 | 20051 |
| (millions) |
Construction Investment2 | 1,985.3 | 2,089.7 | 2,526.1 | 2,571.5 | 2,715.4 |
Housing | 883.8 | 1,026.8 | 1,150.6 | 1,291.0 | 1,320.1 |
Transportation and Warehousing | 56.5 | 48.4 | 30.5 | 21.6 | 163.8 |
Manufacturing | 89.2 | 56.3 | 78.6 | 93.3 | 70.8 |
Public Administration | 380.3 | 372.0 | 365.0 | 402.8 | 455.5 |
Utilities | 141.3 | 192.4 | 449.9 | nd | nd |
Finance and Insurance | 10.1 | 16.2 | 6.1 | 5.2 | 5.2 |
Mining and Oil and Gas Extraction | nd | 65.0 | nd | nd | nd |
Agriculture, Forestry, Fishing and Hunting | 32.4 | 37.0 | 32.8 | 26.2 | 26.6 |
Educational Services | 50.9 | 49.2 | 56.5 | 70.6 | 64.4 |
Retail Trade | 53.0 | 42.3 | 100.2 | 159.3 | 143.1 |
Information and Cultural Industries | nd | 62.8 | nd | 38.4 | nd |
Health Care and Social Assistance | 38.7 | 25.1 | 23.6 | 48.4 | 49.4 |
Construction | 7.6 | 7.8 | 9.8 | 10.4 | 10.6 |
Real Estate and Rental and Leasing | 40.7 | 53.6 | 74.4 | 24.1 | 30.3 |
Professional, Scientific & Technical Services | 2.2 | 3.8 | 2.1 | 2.5 | 2.3 |
Administrative & Support, Waste Management & Remediation Services | 11.0 | 1.4 | 5.8 | 3.5 | 7.4 |
Accommodation and Food Services | 5.2 | 13.1 | 10.6 | 21.8 | 27.9 |
Wholesale Trade | 10.8 | 6.4 | 13.5 | 17.7 | 12.0 |
Other Services | 6.5 | 8.1 | 13.6 | 4.5 | 6.7 |
Management of Companies & Enterprises | 0.4 | 1.0 | nd | nd | nd |
Arts, Entertainment and Recreation | 1.3 | 1.2 | 6.8 | 4.0 | 1.7 |
Machinery Equipment Investment2 | 1,507.6 | 1,458.8 | 1,454.0 | 1,833.1 | 1,932.7 |
Manufacturing | 327.0 | 291.2 | 370.7 | 379.1 | 537.6 |
Finance and Insurance | 182.4 | 194.1 | 179.8 | 218.6 | 217.6 |
Information and Cultural Industries | nd | 203.3 | nd | 151.7 | nd |
Transportation and Warehousing | 82.4 | 91.2 | 86.5 | 78.8 | 98.7 |
Construction | 58.3 | 60.9 | 74.9 | 76.9 | 78.2 |
Agriculture, Forestry, Fishing and Hunting | 56.8 | 67.7 | 72.3 | 75.9 | 60.9 |
Utilities | 55.4 | 38.8 | 43.5 | nd | nd |
Retail Trade | 83.5 | 84.1 | 100.9 | 120.7 | 91.9 |
Professional, Scientific & Technical Services | 34.1 | 33.7 | 31.7 | 42.0 | 39.7 |
Public Administration | 128.4 | 100.9 | 93.2 | 126.6 | 115.6 |
Real Estate and Rental and Leasing | 92.5 | 127.8 | 82.3 | 113.5 | 120.8 |
Wholesale Trade | 49.8 | 38.1 | 35.2 | 45.8 | 39.6 |
Mining and Oil and Gas Extraction | nd | 18.3 | nd | nd | nd |
Health Care and Social Assistance | 44.2 | 37.2 | 43.8 | 51.4 | 53.4 |
Educational Services | 23.6 | 22.3 | 25.2 | 28.9 | 24.4 |
Administrative & Support, Waste Management & Remediation Services | 23.6 | 14.0 | 22.6 | 20.1 | 23.6 |
Accommodation and Food Services | 12.3 | 9.5 | 12.9 | 11.9 | 14.6 |
Other Services | 15.8 | 13.7 | 16.0 | 10.8 | 13.5 |
Management of Companies & Enterprises | 1.3 | 7.6 | nd | nd | nd |
Arts, Entertainment and Recreation | 3.4 | 4.4 | 4.2 | 12.2 | 7.4 |
Total New Investment | $3,492.9 | $3,548.5 | $3,980.2 | $4,404.7 | $4,648.1 |
| | | | | |
Total New Investment (Canada) | $206,870.6 | $213,978.7 | $224,849.7 | $247,881.7 | $265,511.7 |
1Preliminary actual.
2Total investments include amounts which are not separately disclosed by Statistics Canada.
nd: not disclosed Source: Statistics Canada.
8
Exhibit “d” Current Province of New Brunswick Description
Capital investment increased 5.5% in 2005 from the 2004 level to $4,648.1 million. Investment in 2005 represents the highest annual investment total in provincial history. Major investments since the mid-1990s included projects in the refined petroleum products, power generation, real estate, retailing, food processing, electronic products, communications, transportation, health, recreation, education and forestry-related industries.
In 2005, Enbridge Gas New Brunswick continued developing the natural gas distribution system in the Province. Natural gas was available in Fredericton, Moncton, Saint John, St. George, Oromocto, St. Stephen, Dieppe, and Riverview at the end of the year. By late 2005, Enbridge had more than 4,500 customers in New Brunswick compared to around 3,000 in 2004. The company plans to continue expanding its customer base.
In recent years, Aliant (owner of NBTel) and Rogers Communications Inc. have made significant investments in the Province’s telecommunications system, increasing access to high-speed Internet and wireless communications. Rogers Cable Inc. (“Rogers”) has invested more than $90 million over the 2001-2006 period to improve service and introduce new products in New Brunswick; another $48 million to improve its wireless infrastructure; and $2 million to renovate its studios. Rogers began to provide local telephone service in the Province and rolled out Voice Over Internet Protocol (“VoIP”) service in 2006. Aliant announced it would spend $16.4 million in 2005 to expand broad Internet access in New Brunswick. Areas in Bathurst, Fredericton, Grand Bay, Moncton, Oromocto, Riverview, Saint John and Woodstock would benefit from the new service. By the end of 2005, 79% of homes and 84% of businesses in Atlantic Canada had access to Aliant� 46;s broadband services. The $44.6 million arrangement to have access to high-speed Internet service for 90% of New Brunswickers was officially signed by the three partners (Aliant - $15.6 million, the Province - $12.5 million and the Federal government - $16.5 million) in 2005. Aliant unveiled a new $2 million innovation centre in Saint John to test new products for small and medium-sized business customers with a focus in Internet Protocol driven technology. The company also announced it would invest $500,000 over 2005-2008 to support wireless research and development at the University of New Brunswick.
In August 2003, the Federal and New Brunswick governments announced a cost-sharing agreement to complete the twinning of a 130-kilometer stretch of the Trans-Canada Highway (“TCH”) between Fredericton and the Quebec border by 2007. Once completed, the four-lane TCH will extend from the Quebec border in the northwest to the Nova Scotia border in the southeast. In early 2005, Brun-Way Group (“Brun-Way”) signed a $543-million agreement with the Province regarding the twinning of the TCH. Under the agreement, Brun-Way will be responsible for the design, construction and financing of the 98-kilometre stretch between Grand Falls and Woodstock, and the selected upgrade of 128-km of the current four-lane highway between the Quebec border and Longs Creek. Construction of the highway will be completed in 2007.
In 2005, investment in the Liquified Natural Gas (“LNG”) Terminal in Saint John by Irving Oil Limited broke ground. The $750 million terminal, to be operational in 2008, will be constructed, owned and operated by Canaport LNG, a new company created under agreements between Irving Oil and Spanish energy giant Repsol. The $220 million investment in Saint John by Irving Paper was still underway in 2005.
Foreign Exports of Commodities
Foreign exports of commodities have become increasingly important to both the New Brunswick and Canadian economies. In 2005, foreign exports were equivalent to 50.3% of real GDP for the Province, compared to 35.3% for Canada. New Brunswick's foreign exports of commodities, estimated at $10,675.4 million in 2005 (in current dollars), increased at a compound annual growth rate of 6.6% over the 2001 to 2005 period.
Due to the significance of commodity exports, the economic performance of the Province is highly dependent on international economic conditions, particularly in the U.S. In 2005, the U.S. purchased an aggregate of 90.6% of the Province's foreign commodity exports. Energy products (mostly refined petroleum products and some electricity) accounted for 57.9% of all commodity exports that year, followed by forest products (lumber, pulp and paper) at 16.4%, and agricultural and fishing products at 12.0%. Other important commodity exports are fertilizers, plastic products, machinery and mechanical appliances, potash and metallic ores (mostly zinc).
The table below shows foreign exports of commodities from New Brunswick for the years 2001 to 2005. The largest component, energy products, increased at a compound annual growth rate of 16.3% during that time, due to particularly strong increases in energy prices in the past few years. Exports of forest products decreased at a compound annual growth rate of 6.7% due to price declines and weak markets. Declining at a compound annual growth rate of 1.4% over the past five years, exports of agricultural and fishing products reported strong numbers from 2001 to 2002, but experienced a steady downturn since 2003.
9
Exhibit “d” Current Province of New Brunswick Description
| | | | | | | | |
FOREIGN EXPORTS OF COMMODITIES |
|
| Year Ended December 31, | CAGR1 (%) |
| 2001 | 2002 | 2003 | 2004 | 2005 | 2001-2005 |
| (millions) | |
| | | | | | |
Forest Products | $2,319.8 | $2,088.5 | $2,027.2 | $2,191.5 | $1,756.0 | -6.7 |
Energy Products | 3,379.8 | 3,312.2 | 3,871.1 | 4,470.9 | 6,181.4 | 16.3 |
Agriculture and Fishing Products | 1,352.2 | 1,402.9 | 1,340.6 | 1,282.3 | 1,277.8 | -1.4 |
Industrial Goods | 584.1 | 595.0 | 587.1 | 692.3 | 801.8 | 8.2 |
Machinery and Equipment | 465.7 | 576.0 | 514.8 | 565.3 | 459.1 | -0.4 |
Other | 169.1 | 191.4 | 177.0 | 235.8 | 199.4 | 4.2 |
| | | | | | |
Total | $8,271.0 | $8,165.8 | $8,517.0 | $9,438.0 | 10,675.4 | 6.6 |
1Compound annual growth rate
Source: Statistics Canada.
10
Exhibit “d” Current Province of New Brunswick Description
Structure of the Economy
The New Brunswick economy receives a large contribution from natural resources, especially forestry and forestry-related industries. The provincial economy shows a larger concentration of service industries than goods producing industries compared to Canada as a whole. During the 2001 to 2005 period, real GDP in the service industries accounted for 69.1% of total real GDP compared to 68.5% for Canada. The following table shows Real GDP by industry in New Brunswick for the years 2001 to 2005, valued in chained 1997 dollars.
| | | | | | |
GROSS DOMESTIC PRODUCT BY INDUSTRY1 |
| Year Ended December 31, |
|
2001 |
2002 |
2003 |
2004 |
2005 | CAGR2 % 2001-2005 |
| (millions of 1997 dollars) |
Goods Producing Industries | | | | | | |
Manufacturing3 | $2,686.2 | $2,979.5 | $3,039.2 | $3,168.0 | $2,962.2 | 2.5 |
Construction | 1,008.9 | 1,014.1 | 1,150.4 | 1,125.5 | 1,152.3 | 3.4 |
Utilities | 593.0 | 598.0 | 624.8 | 622.7 | 617.60 | 1.0 |
Agriculture, Forestry, Fishing and Hunting | 854.8 | 930.0 | 862.8 | 918.6 | 918.9 |
1.8 |
Mining and Oil and Gas Extraction | 259.8 | 209.4 | 187.5 | 171.9 | 178.3 | -9.0 |
| | | | | | |
Total Goods Producing Industries | 5,361.5 | 5,686.9 | 5,854.5 | 5,982.8 | 5,806.6 | 2.0 |
| | | | | | |
Service Producing Industries | | | | | | |
Transportation and Warehousing | 1,001.8 | 1,015.8 | 1,020.4 | 1,044.5 | 1,042.1 | 1.0 |
Information and Cultural Industries | 716.5 | 763.1 | 765.5 | 779.1 | 796.6 | 2.7 |
Retail Trade | 1,105.0 | 1,126.5 | 1,154.5 | 1,189.7 | 1,234.4 | 2.8 |
Wholesale Trade | 811.1 | 852.1 | 920.2 | 946.2 | 962.0 | 4.4 |
Finance and Insurance, Real Estate, Renting, Leasing, Company Management | 3,010.4 | 3,060.1 | 3,168.1 | 3,295.3 | 3,392.9 |
3.0 |
Public Administration | 1,707.4 | 1,753.1 | 1,780.2 | 1,798.5 | 1,818.1 | 1.6 |
Educational Services | 881.1 | 892.3 | 887.1 | 895.9 | 891.5 | 0.3 |
Health Care and Social Assistance | 1,255.6 | 1,273.5 | 1,285.6 | 1,293.0 | 1,313.6 | 1.1 |
Professional, Scientific and Technical Services | | | | | | |
458.4 | 503.5 | 516.3 | 531.7 | 542.6 | 4.3 |
Administrative and support, Waste Management and Remediation Services | | | | | | |
304.1 | 373.4 | 371.2 | 386.5 | 398.7 | 7.0 |
Accommodation and Food Services | 418.3 | 424.2 | 432.8 | 430.3 | 418.8 | 0.03 |
Arts, Entertainment and Recreation | 102.5 | 107.3 | 102.2 | 104.0 | 104.0 | 0.4 |
Other Services (except Public Administration) | | | | | | |
463.6 | 488.1 | 491.8 | 496.7 | 508.4 | 2.3 |
| | | | | | |
Total Service Producing Industries | 12,221.9 | 12,621.9 | 12,874.6 | 13,162.4 | 13,390.3 | 2.3 |
| | | | | | |
Total Real Domestic Product (at basic prices) | $17,607.0 | $18,315.1 | $18,717.9 | $19,133.9 | $19,197.1 |
2.2 |
1Totals may not add up due to the adoption of the chain Fisher deflation methodology.
2Compound annual growth rate
3Includes natural resources processing: output of forestry-related products accounted for approximately 44.6% of manufacturing GDP at basic prices during the years 2001 through 2005.
Source: Statistics Canada.
11
Exhibit “d” Current Province of New Brunswick Description
Primary Industries
Mining. The New Brunswick mining sector has benefited from the development of base metal deposits (zinc, lead, copper and silver ores), potash and peat. This has resulted in increased direct employment and the development and operation of related smelting, land and water transportation facilities. The New Brunswick mining industry employs approximately 3,060 people.
An increase in the prices of both base metals and potash in 2005 from 2004 levels was partly offset by a rise in the value of the Canadian dollar. The net effect was an increase in the total value of mineral production in New Brunswick (increased by 12.4% to $875 million from a final value of $779 million in 2004). Metals, which accounted for 65% of the total value of the Province’s mineral production, increased by 11% from 2004 levels, while non-metallics (34% of total production) increased by 13%, chiefly on the strength of higher potash values. Among the metals, zinc continued to be the dominant commodity (over 65% of total value of metals). However the Province’s only zinc producer, Falconbridge Limited - Brunswick mine, is expected to exhaust its mineable reserves by the first quarter of 2010.
The main non-metal commodities are potash, peat, salt and sulphur in smelter gas. Potash Corporation of Saskatchewan (“PCS”) operated normally in 2005, despite having to deal with a brine inflow to the underground workings. Following the expansion of the Rocanville plant in Saskatchewan, PCS’s Cassidy Lake (formerly Potacan) facility has ceased to upgrade standard grade material for export. However, a major exploration program has delineated a significant new potash zone south of the existing mine site. The workforce in the potash sector was 427 in 2005.
Structural materials such as lime, stone, sand and gravel contributed about 6% to the value of production in 2005. Several limestone quarries were active as were areas producing marl and silica.
A plan by Corridor Resources Inc. to develop the McCully natural gas field has been approved. The plan includes eight wells to be completed for production, while two existing wells will continue to provide gas to the PCS potash mill. The eight wells’ production is expected to be in the range of 20 million standard cubic feet per day. Gas will be delivered to the Maritime & Northeast Pipeline via a 45-kilometre pipeline. Approximately $70 million has been spent to date at McCully, with an additional capital expenditure of about $45 million planned for 2006.
The Province has established a number of initiatives to improve and expand the viability of the mining industry as recommended in a major study presented in 2000. In addition to the Prospector Development Program and the Junior Mining Assistance Program, there are two new initiatives to assist the exploration and mining industries: an 18% tax credit to companies that undertake advanced exploration and a new mine reclamation fund. In 2005, investment in mining exploration in the metallic and industrial minerals sector totaled around $12 million. In October 2003, an annual grant program was announced by the Province for the Bathurst Mining Camp. Fifteen million dollars will be invested in advanced exploration over the first three years. The terms of the program may be extended for two additional years with a further $10 million contribution.
The following table sets forth the total selling value of mineral production in New Brunswick (including the value of concentrating and smelting) for the years 2001 through 2005.
| | | | | | | |
MINERAL PRODUCTION |
| Year Ended December 31, |
| 2001 | 2002 | 2003 | 2004 | 2005 |
| (millions) |
Base Metals | $580.2 | $440.3 | $447.7 | $507.8 | 564.8 |
Fuels, including Coal | 19.9 | 19.9 | 17.1 | n/d | n/d |
Non-Metallic Minerals | 207.1 | 193.2 | 237.8 | n/d | n/d |
Total | $807.2 | $653.5 | $702.5 | $778.6 | $874.9 |
n/d not disclosed
Source: Statistics Canada.
12
Exhibit “d” Current Province of New Brunswick Description
Forestry. Approximately 83.5% of the land area of New Brunswick is forested and roughly one half of the forested land is owned by the Province as Crown land. Nearly all Crown land is subject to timber licenses or harvest agreements. Harvest activities on Crown land generated $60 million in Crown land royalties for the fiscal year ended March 31, 2006. The Province received $57 million of these royalties from Licensee and Sub-licensee harvest activities and $3 million was forwarded to New Brunswick First Nation Communities in accordance with harvesting agreements and in association with First Nation harvesting activities.
The following table sets forth the most recently published estimates of forest production in New Brunswick for the years 2000 through 2004.
| | | | | |
FOREST PRODUCTION |
| Year Ended December 31, |
| 2000 | 2001 | 2002 | 2003 | 2004 |
| (thousands of cubic metres) |
Pulpwood | 3,573 | 2,799 | 3,0691 | 3,643 | 3,6431 |
Logs and Bolts | 8,231 | 7,308 | 7,3191 | 7,637 | 7,6371 |
Fuelwood | 33 | 44 | 36 | 36 | 361 |
Other | 36 | 35 | 33 | 30 | 35 |
Total | 11,872 | 10,186 | 10,4571 | 11,347 | 11 3511 |
1National Forestry database estimate.
Source: National Forestry Database
Information regarding New Brunswick's pulp and paper and wood manufacturing industries is set forth below under "Manufacturing". Pulpwood production from year to year is affected by, among other things, weather conditions for harvesting and bears a fluctuating relationship to shipments by the pulp and paper industry.
Harvesting of the Province’s wood resources on Crown lands and industrial freehold lands is in balance with current growth on a sustainable-yield basis. The Province’s yearly harvest level is estimated at 10.5 million cubic metres, comprised of 65% softwood and 35% hardwood fibre.
Agriculture. The 2001 Census of Agriculture indicated that New Brunswick had 3,034 farms and 388,061 hectares of farmland. The comparable figures from the 1996 census were 3,405 farms and 386,027 hectares. Cattle farms accounted for 26% of all farms in New Brunswick in 2001, followed by fruit operations (13%) and dairy farms (11%). Total farm cash receipts in the Province were $426.9 million in 2005, up 2.4% from the previous year. Receipts for potatoes, the largest crop, decreased 7.6% to $77.2 million.
Fishing. Lobster, crab, herring, shrimp, scallops and sea urchin have been the species most important to the primary fishing industry, accounting for nearly 96.5% of the value of landings estimated at $197.2 million in 2005, a 1.9% increase from 2004. The average annual value of fish landings during the 2001-2005 period was $189.6 million. New methods of processing and marketing frozen and pre-cooked fish and shellfish have expanded market opportunities and increased the competitiveness of the industry. Shipments of processed fish products for 2005 decreased 9.4% from 2004 to $765.2 million, well below the 2001-2005 average of $895.2 million. Exports of fish products reached $819.2 million in 2005, a 1.4% increase from 2004.
Sales of New Brunswick aquaculture products and services increased 7.4% to $265.5 million in 2005. New Brunswick sales accounted for 36% of the Canadian total in 2005, behind first-ranked British Columbia (48%).
13
Exhibit “d” Current Province of New Brunswick Description
Secondary Industries
Manufacturing. Manufacturing activity in New Brunswick employed approximately 35,900 people in 2005, providing $1,307.1 million in wages and salaries compared to $1,378.7 million in 2004.
In 2005, the value of manufacturing shipments increased by 9.7% to $14,958.9 million from $13,636.2 million in 2004. The miscellaneous group of manufacturing industries (which includes diverse groups of small plants as well as large producers such as the Irving Oil refinery and Brunswick Mining and Smelting) accounted for 66.9% of total shipments in 2005 and reported a 30.6% increase in the value of shipments over 2004. However, shipments from the paper products, wood products and food industries all declined from the previous year.
The table below sets forth the leading industrial groups in New Brunswick’s manufacturing sector, according to gross selling value of factory shipments, for the years 2001 through 2005.
| | | | | | | |
GROSS SELLING VALUE OF FACTORY SHIPMENTS |
| Year Ended December 31, |
| | | | | | CAGR1 % |
| 2001 | 2002 | 2003 | 2004 | 2005 | 2001-2005 |
Industry | (millions) | |
Paper Manufacturing | $2,191.7 | $2,324.3 | $2,128.7 | $2,541.9 | $1,890.7 | -3.6 | |
Food Manufacturing | 1,921.6 | 1,996.5 | 2,014.9 | 1,827.6 | 1,610.2 | -4.3 | |
Wood Product Manufacturing | 1,427.5 | 1,560.5 | 1,686.7 | 1,604.0 | 1,449.3 | 0.4 | |
Miscellaneous Manufacturing2 | 6,288.7 | 6,565.4 | 6,718.9 | 7,662.8 | 10,008.7 | 12.3 | |
Total | $11,829.5 | $12,446.7 | $12,549.3 | $13,636.2 | $14,958.9 | 6.0 | |
1Compound annual growth rate
2The principal components of "Miscellaneous" are petroleum products, lead smelting and electrical and electronics commodities.
Source: Statistics Canada.
Construction. The construction industry is the second largest of the goods-producing industries in terms of contribution to real GDP. Spending on construction activity in 2005 increased 5.6% from the 2004 level to $2,715.4 million. The main contributors to the increase were continued work on the twinning of the Trans-Canada Highway, the Point Lepreau refurbishment project and the initial phase of construction on the $750 million LNG terminal. Capital investment in Canada reported an increase of 7.1% in 2005. Residential construction, the largest component of investment, accounted for 28.1% of capital investment in 2005. Housing starts in the Province reached 3,959 in 2005, a 0.3% gain from the 2004 level. At the same time, construction investment in the utilities industry fell 25.0% to $393.7 million in 2005. According to preliminary estimates, construction investment in New Brunswick in 2006 is expected to reach $2,935.0 million, up 8.1% fro m 2005.
Service Industries
Trade. Retail trade amounted to $8,391.2 million in 2005, an increase of 5.4% from 2004, compared to the national increase of 6.1%. Between 2001 and 2005, New Brunswick’s compound annual growth rate for retail trade was 2.8%. On a per capita basis, the value of retail sales was $11,166 for New Brunswick and $11,388 for Canada as a whole.
Transportation. New Brunswick has an extensive infrastructure of road, rail, water and air transportation services. In addition, the Province has an area air traffic control centre that controls aircraft within the Maritime provinces, as well as parts of Quebec and Newfoundland and Labrador. Aircraft movements increased at New Brunswick’s three main airports in 2005 with Fredericton leading at 12.2%, followed by Moncton at 4.2% and Saint John at 0.5%.
A major ice-free port in Saint John handled a record 27.5 million metric tonnes of cargo in 2005, an increase of 4.8% from 2004; there were gains in both incoming (+2.2%) and outgoing (+7.8%) traffic. The petroleum sector rose 7.5% and container
14
Exhibit “d” Current Province of New Brunswick Description
traffic increased 2.9%. Forest products declined 62.8% due to the closure of the St. Anne-Nackawic mill the year before. The mill reopened in 2006 under a new owner. The port had 37 cruise ship calls with over 90,000 passengers. A $2 million state-of-the-art gangway was installed for the cruise ships in 2005.
The port of Belledune handled 2.2 million metric tonnes of goods in 2005, an increase of 2.3% from the previous year. Capital investment worth $537,000 was carried out at the port.
Communications and Technology. Employment in communications and technology averaged 48,600 persons in 2005, a slight increase of 200 from the previous year.
Several customer contact centres announced new jobs or expansion plans including: Asurion, Cendant Canada Inc., ClientLogic, Connect North America, Minacs, Nucomm International, SalesBridge Canada, SNC-Lavalin ProFac, Stream, Teletech and Virtual Agent Services. The industry has more than 100 companies and employs over 20,000 contact centre workers.
In March 2005, an agreement was signed by the Province, the Federal government and Aliant to invest $44.6 million to increase high-speed Internet connections. Access is currently available to most New Brunswick residences and businesses, and all regional health centres, business parks and First Nations communities. Aliant also opened a new $2 million innovation centre in Saint John to test new products for small and medium-sized businesses.
Rogers Cable continued to improve its service and to introduce new products in New Brunswick. In 2005, Rogers had over 1,000 employees in the Province.
Tourism. In recent years, tourism has made a significant contribution to the economy of New Brunswick. Revenues in 2005 were similar to the previous year’s result of $1.2 billion, although visitation declined 1% to 1.74 million visitors. The season was highlighted by a special campaign encouraging New Brunswickers to enjoy their “own backyard” by taking advantage of special two-for-one promotions. Various indicators suggest that many tourism operations enjoyed increased visitation by New Brunswick residents.
In other developments, Moncton welcomed an estimated 85,000 people to a Rolling Stones concert and Saint John became the home to a new Quebec Major Junior Hockey League team. In 2005, new tourism investments totaling $3.8 million were undertaken in Caraquet, Miscou Island and Saint Andrews. The accommodation sector benefited from new projects and upgrades in several communities, worth more than $16.5 million in total.
15
Exhibit “d” Current Province of New Brunswick Description
Labour Force
The number of employed in New Brunswick edged up modestly in 2005 to reach a record high of 350,500. Annual employment finished the year 400 above the 2004 level, an increase of 0.1%. Nationally, employment growth slowed to 1.4%. The provincial unemployment rate fell below 10% for the second year in a row, to 9.7%, the lowest level in 30 years. Canada’s jobless rate averaged 6.8%. Unemployment in New Brunswick stood at 37,700, the fewest number of unemployed since 2000. Nationally, the unemployment level decreased 5.1%.
The following table sets forth certain information concerning New Brunswick's labour market.
| | | | | |
LABOUR FORCE |
| |
| Average for Year Ended December 31, |
| 2001 | 2002 | 2003 | 2004 | 2005 |
| (thousands) |
Population 15 years and over | 600.0 | 602.4 | 605.0 | 607.6 | 610.4 |
Labour Force | 371.5 | 382.0 | 382.4 | 388.0 | 388.2 |
Labour Force Employed | 330.1 | 343.1 | 343.1 | 350.1 | 350.5 |
Labour Force Unemployed | 41.4 | 38.9 | 39.4 | 38.0 | 37.7 |
Unemployment Rate | | | | | |
New Brunswick | 11.1% | 10.2% | 10.3% | 9.8% | 9.7% |
Canada | 7.2% | 7.7% | 7.6% | 7.2% | 6.8% |
Participation Rate | | | | | |
New Brunswick | 61.9% | 63.4% | 63.2% | 63.9% | 63.6% |
Canada | 65.9% | 66.9% | 67.5% | 67.5% | 67.2% |
Source: Statistics Canada.
16
Exhibit “d” Current Province of New Brunswick Description
From 2001 to 2005, the number of persons employed in New Brunswick increased 6.2%. Job growth in the Province in 2005 was concentrated in the service sector, with employment increasing by 7,500, nearly double the gains registered in 2004. Six of the 11 service industries posted increases, with trade and public administration spearheading growth; they added 4,100 and 2,500 jobs respectively to the economy.
The following table indicates employment by industry in New Brunswick for the years 2001 through 2005.
| | | | | |
EMPLOYMENT BY INDUSTRY |
| Average for Year Ended December 31, |
|
| 2001 | 2002 | 2003 | 2004 | 2005 |
Goods Producing Sector | (thousands) |
Agriculture | 5.8 | 5.3 | 5.8 | 6.7 | 6.8 |
Forestry, Fishing, Mining, Oil and Gas | 11.7 | 10.7 | 11.2 | 11.7 | 11.6 |
Manufacturing | 37.9 | 37.7 | 39.7 | 41.9 | 35.9 |
Utilities | 4.5 | 4.7 | 4.2 | 3.6 | 3.3 |
Construction | 18.7 | 19.7 | 19.2 | 19.4 | 18.6 |
Service Producing Sector | | | | | |
Trade | 55.5 | 55.1 | 53.4 | 54.1 | 58.2 |
Transportation and Warehousing | 19.4 | 20.0 | 19.2 | 20.1 | 21.2 |
Professional, Scientific and Technical Services | 12.7 | 14.4 | 15.5 | 16.1 | 15.1 |
Business, Building and Other Support Services | 15.4 | 19.1 | 21.4 | 21.2 | 21.0 |
Educational Services | 22.5 | 21.9 | 21.9 | 24.8 | 26.4 |
Health Care and Social Assistance | 40.5 | 42.7 | 45.2 | 48.1 | 46.8 |
Information, Culture and Recreation | 12.0 | 12.9 | 12.1 | 11.1 | 12.5 |
Accommodation and Food Services | 23.3 | 25.3 | 22.5 | 21.6 | 22.2 |
Other Services | 15.1 | 17.3 | 17.0 | 17.3 | 16.4 |
Finance, Insurance, Real Estate and Leasing | 13.4 | 15.2 | 14.9 | 14.0 | 13.5 |
Public Administration | 21.6 | 21.1 | 19.9 | 18.5 | 21.0 |
Total | 330.1 | 343.1 | 343.1 | 350.1 | 350.5 |
Source: Statistics Canada.
17
Exhibit “d” Current Province of New Brunswick Description
Economic Development
Economic growth is assisted by the Federal government’s Atlantic Canada Opportunities Agency (“ACOA”), which was launched in June 1987 with a mandate to stimulate economic development in the Atlantic provinces.
The Canada-New Brunswick Infrastructure Program Agreement was established in 2000 to improve urban and rural municipal infrastructure in New Brunswick. Canada and New Brunswick are each contributing $54.4 million to be matched by municipalities for a total fund of $163.2 million. As at March 31, 2006, $103.9 million of Federal/provincial funding has been expended under this Agreement. This initiative will continue until March 31, 2009.
In 2004, the Canada-New Brunswick Municipal Rural Infrastructure Fund Agreement was established to improve local infrastructure projects in New Brunswick. Canada and New Brunswick are each contributing $33.0 million to be matched by municipalities for a total of $99.0 million. As at March 31, 2006, $2.0 million of Federal/provincial funding has been expended under this Agreement. This initiative will continue until March 31, 2011.
In 1999 the Government of New Brunswick established the $25 million Acadian Peninsula Economic Development Fund to provide additional economic stimulation to the northeast region of the Province. In 2005, the funding for this initiative was increased to $40.0 million. As at March 31, 2006, $31.5 million has been expended under this initiative. In 2002, a similar $25 million fund was established to support the Restigouche-Chaleur Economic Development Initiative in the northern part of the Province. As at March 31, 2006, $9.5 million has been expended under this initiative. In 2004, another $25 million Miramichi Regional Economic Development Fund was established to provide economic development to the Miramichi region. As at March 31, 2006, $3.8 million has been expended under this initiative.
In 2001, the $30 million Total Development Fund was established by the Government of New Brunswick to provide financial support for the implementation of Total Development Strategies in the forestry, mining, energy, aquaculture, agriculture, new technology and tourism sectors. As at March 31, 2006, $21.5 million has been expended under this program.
The Canada-New Brunswick Agreement on the Transfer of Federal Gas Tax Revenues under the New Deal for Cities and Communities was established in 2006 for investment in environmentally sustainable municipal infrastructure. Canada and New Brunswick are contributing $116.1 million and $30.0 million, respectively, for a total of $146.1 million. As at March 31, 2006, nothing had been expended under this initiative.
18
Exhibit “d” Current Province of New Brunswick Description
REVENUE AND EXPENDITURE OF THE PROVINCE
General Information
Under the Constitution Act, 1867 and the Constitution Act, 1982 provincial legislatures are given certain exclusive powers, including the power to impose direct taxation within the provinces to raise revenue for provincial purposes and the power to borrow money on the sole credit of the provinces.
The Financial Administration Act governs the receipt of public money, the disbursement of public funds, the control of expenditures, and the keeping and auditing of public accounts of the Province. All public monies are to be deposited to the credit of the Province and constitute the Consolidated Fund of the Province. Monies necessary for the carrying out of the operations of the provincial government for each fiscal year are voted by the Legislative Assembly, with the exception of those expenditures for which provision has already been made through existing legislative authority. In addition, under the authority of the Financial Administration Act, should the occasion arise when the Legislative Assembly is not in session, the Lieutenant-Governor in Council may order the issue of a special warrant authorizing payment out of the Consolidated Fund for an expenditure required urgently for the public good which was not provided for by the Legislative Assembly. Amounts appropriated under special warrant must be approved at the next session of the Legislative Assembly.
In accordance with the Financial Administration Act and certain other Acts, funds received for a special purpose are to be disbursed for that purpose. Unlike regular appropriations, any unspent balance of these funds may be carried forward to subsequent fiscal years. At March 31, 2006, the balance of unspent special purpose funds was $85.7 million.
Funds may also be considered as Special Operating Agency Funds. Revenue may be generated by the Agencies or from transfers from other budgetary accounts. Any unspent balance of these funds may, with permission from the Board of Management as per the Financial Administration Act, be carried forward to subsequent fiscal years. At March 31, 2006, the balance of unspent special operating funds was $35.5 million. All transactions between the Special Operating Agencies and provincial departments are eliminated from the Province's combined statement of revenue and expenditure.
The Fiscal Stabilization Fund Act was enacted in the 2001 fiscal year. The Act established a fund separate from the Consolidated Fund for the purpose of assisting in stabilizing the fiscal position of the Province from year to year and to improve long-term planning. There have been no transactions in this Fund since the remaining amount was transferred out of this fund to the Consolidated Fund in the fiscal year ended March 31, 2005.
Volume 1 of the public accounts are subject to review by the Auditor General, an official responsible under the provisions of the Auditor General Act for the examination of the accounts of the Province and for reporting thereon annually to the Legislative Assembly.
For each fiscal year, the Minister of Finance delivers a budget and the Estimates of Revenue and Expenditure (the "Budget Estimates") to the Legislative Assembly. The Minister of Finance reports on the status of the budget plan during the year. The Budget Estimates include the revenue and expenses of some provincially-created Boards, Commissions and Crown corporations, or the net profits of such entities, or the provincial contribution towards the operations of such entities, as well as funds advanced through such entities to various individuals and enterprises in the form of repayable loans and investments.
The Provincial Reporting Entity is comprised of certain organizations that are accountable to the provincial Legislature. Transactions and balances of these organizations are included in the Province's financial statements through different accounting methods as outlined in Note 1(a) of Volume 1 of the Public Accounts.
The Province adopted the Fiscal Responsibility and Balanced Budget Act and repealed the Balanced Budget Act during the 2006 fiscal year. The Fiscal Responsibility and Balanced Budget Act stipulates that “It is the objective of the Government of New Brunswick that, in respect of each fiscal period, the total amount of expenses for that fiscal period not exceed the total amount of revenue for that fiscal period.” The Act also stipulates that "It is the objective of the Government of New Brunswick that at the end of each fiscal period the ratio of net debt to GDP be less than at the end of the previous fiscal period."
The current fiscal period commenced April 1, 2004, and to date the Government has met its objective with a cumulative surplus of $482.4 million. This fiscal period ends March 31, 2007.
The Province implemented Tangible Capital Asset Accounting and introduced major changes in accounting policies during the year ended March 31, 2005. It implemented the new government reporting model recommendations of PSAB of the CICA. In addition to restating net debt, the new accounting model introduces an additional financial measure for governments that
19
Exhibit “d” Current Province of New Brunswick Description
is referred to as the accumulated deficit. It is the net debt minus non-financial assets. With this model, net debt is divided into two components: the portion that relates to investment in capital infrastructure and other non-financial assets and the portion that relates to past operating deficits or the accumulated deficit. The new reporting model has resulted in a number of financial statement changes. In some cases, historical data cannot be reproduced in the new format
Changes in Cash Flow
The following table sets forth the changes in cash flow of the Province for the three fiscal years ended March 31, 2006 and the Budget Estimates for the fiscal year ending March 31, 2007.
20
Exhibit “d” Current Province of New Brunswick Description
| | | | | | | | |
| | | | | | | | Budget Estimates |
| | 2004 | | 2005 | | 2006 | | 2007 |
Operating Transactions | | | | | | | | |
Surplus (Deficit) | $ | (173.4) | $ | 242.3 | $ | 243.6 | $ | 22.2 |
Non-Cash Items | | | | | | | | |
Amortization of Premiums, Discounts and Issue Expenses | | 7.4 | | 7.0 | | 7.4 | | 7.0 |
Foreign Exchange Expense | | (40.3) | | (21.7) | | (7.8) | | --- |
Increase in Allowance for Doubtful Accounts | | 71.2 | | 77.4 | | 59.7 | | --- |
Sinking Fund Earnings | | (222.5) | | (221.6) | | (226.4) | | (229.7) |
Amortization of Tangible Capital Assets | | 269.1 | | 193.4 | | 204.5 | | 209.1 |
Loss on Disposals of Tangible Capital Assets | | --- | | 2.3 | | 0.4 | | |
Actual Losses (Gains) Due to Foreign Exchange | | (25.8) | | 10.5 | | 19.1 | | |
Decrease in Pension Liability | | (90.6) | | (114.8) | | (126.5) | | --- |
Increase (Decrease) in Deferred Revenue | | 6.7 | | 23.1 | | 5.4 | | |
Proceeds from Disposal of Tangible Capital Assets | | (2.0) | | (27.2) | | (3.0) | | --- |
Decrease (Increase) in Working Capital | | 124.1 | | 147.3 | | (88.6) | | --- |
Net Cash from (Used In) Operating Activities | | (76.1) | | 318.0 | | (87.8) | | --- |
| | | | | | | | |
Investing Transactions | | | | | | | | |
(Increase) Decrease in Investments, Loans and Advances | | 57.7 | | (1.4) | | (401.5) | | (36.6) |
Net Cash From (Used in) Investing Activities | | 57.7 | | (1.4) | | (401.5) | | (36.6) |
| | | | | | | | |
Capital Transactions | | | | | | | | |
Purchase of Capital Assets | | (248.6) | | (326.7) | | (342.2) | | (345.9) |
Cash Received to Acquire Tangible Capital Assets | | 49.8 | | 34.3 | | 24.9 | | 27.6 |
Proceeds from Disposal of Capital Assets | | 2.0 | | 27.2 | | 3.1 | | |
Cash used in Capital Transactions | | (196.8) | | (265.2) | | (314.2) | | (318.3) |
| | | | | | | | |
Financing Transactions | | | | | | | | |
Proceeds from Issuance of Funded Debt | | 617.7 | | 567.1 | | 987.9 | | --- |
Received from Sinking Fund for Redemption of Debentures and Payment of Exchange | | 171.2 | | 292.2 | | 144.1 | | --- |
Decrease in Obligations under Capital Leases | | (7.8) | | (16.4) | | (15.3) | | |
Sinking Fund Installments | | (121.8) | | (128.3) | | (127.9) | | --- |
Funded Debt Matured | | (407.5) | | (627.5) | | (453.2) | | --- |
Net Cash from Financing Activities | | 251.8 | | 87.1 | | 535.6 | | --- |
Increase (Decrease) in Cash Position during Year | | 36.6 | | 138.5 | | (92.3) | | --- |
Cash Position - Beginning of Year | | (26.8) | | 9.8 | | 148.3 | | --- |
Cash Position - End of Year | $ | 9.8 | $ | 148.3 | $ | 56.0 | | --- |
| | | | | | | | |
Cash Represented by | | | | | | | | |
Cash net of Bank Advances and Short Term Borrowing. | $ | 9.8 | $ | 148.3 | $ | 56.0 | | --- |
1The Budget Estimates do not include estimates of total borrowing requirements of the Province and NB Power. For information with respect to financial requirements of the Province and NB Power and with respect to maturing debt of the Province, see "Financing-Financial Requirements", "NB Power -Financial Requirements" and "Financing-Funded Debt Maturity Schedule", respectively.
2For further information see Table IV in "Tables and Supplementary Information of the Province."
(---)Denotes no estimate provided.
21
Exhibit “d” Current Province of New Brunswick Description
2006-2007 Budget Estimates
The 2006-2007 Budget projected a decrease in net debt of $4.0 million. For the fiscal year ended March 31, 2006 the decrease in net debt was $122.6 million. The change of $118.6 million from the Budget Estimates was in part the result of revenues being $240.4 million higher than budget at $6,300.7 million and expenses being $95.7 million higher than budget at $6,057.1 million. The change in net debt also reflects adjustments due to Tangible Capital Asset accounting.
Major Sources of Ordinary Account Revenue
The major sources of ordinary account revenue for the Province are payments from the Federal government, consumption taxes and income taxes. For the fiscal year ending March 31, 2007, the Province’s revenue is estimated at $5,852.2 million, reflecting a projected decrease of 1.1% from the fiscal year ended March 31, 2006. Overall this represents a projected decrease of $65.6 million in revenue. The principal factors that have decreased are consumption taxes due to the implementation of tax measures for the new fiscal year and revenue from other agencies due to an exceptional year for NB Power in the previous fiscal year.
The following table shows the percentage sources of ordinary account revenue for the four fiscal years ended March 31, 2006 and the Budget Estimates for the fiscal year ending March 31, 2007.
ORDINARY ACCOUNT REVENUE SOURCES
| | | | | | | |
|
Year ended March 31 % |
Budget Estimates | Compound Annual Growth Rate |
| 2003 | 2004 | 2005 | 2006 | 2007 | 2003-07 |
Taxes | | | | | | |
Personal Income | 19.3 | 18.7 | 17.9 | 18.0 | 18.9 | | 4.9 |
Corporate Income | 4.0 | 3.3 | 4.0 | 3.5 | 3.9 | | 5.3 |
Consumption | 22.2 | 22.4 | 18.9 | 19.6 | 19.5 | | 2.2 |
Property | 6.3 | 6.0 | 6.1 | 5.9 | 6.1 | | 4.7 |
Miscellaneous | 0.7 | 0.8 | 0.7 | 0.7 | 0.7 | | 4.7 |
Total Taxes | 52.5 | 51.3 | 47.6 | 47.6 | 49.2 | | 3.8 |
| | | | | | | |
Other Revenue | | | | | | | |
Licenses, Permits and Fees | 3.8 | 5.8 | 5.3 | 5.3 | 5.2 | | 14.4 |
Federal Government Payments | 38.7 | 36.5 | 40.7 | 39.0 | 40.6 | | 6.8 |
Other Agencies | 2.9 | 4.2 | 4.5 | 6.3 | 3.3 | | 8.9 |
Miscellaneous | 2.1 | 2.2 | 1.9 | 1.8 | 1.7 | | -1.1 |
Total Revenue | 100.0 | 100.0 | 100.0 | 100.0 | 100.0 | | |
Total Ordinary Account Revenue (millions) | $4,728.3 | $5,094.3 | $5,601.6 | $5,917.8 | $5,852.2 | | 5.5 |
Note:
·
Total Ordinary Account Revenue reported as per the Public Accounts of the Province, except for 2003 where the revenue from the Fiscal Stabilization Fund has been excluded.
Personal and Corporate Income Taxes. New Brunswick’s provincial personal and corporate income taxes are collected and administered by the Federal government under a Federal-provincial tax collection agreement. For the taxation years up to and including 1999, personal income tax was calculated as a percentage of Federal income tax. Effective January 1, 2000, the Province adopted a ‘tax on taxable income’ method of calculating provincial personal income tax. This method gave New Brunswick personal income tax policy flexibility to help ensure the tax system addresses the government’s social, economic and fiscal objectives.
The 2005-2006 Budget announced that provincial income tax credit amounts and tax brackets would be indexed to protect against inflation effective January 1, 2005.
22
Exhibit “d” Current Province of New Brunswick Description
Provincial Personal Income Tax Rates and Brackets
2005 Taxation Year
2006 Taxation Year
| |
9.68% on first $32,730
14.82% on $32,730 to $65,462
16.52% on $65,462 to $106,427
17.84% over $106,427 | 9.68% on first $33,450
14.82% on $33,450 to $66,902
16.52% on $66,902 to $108,768
17.84% over $108,768 |
In the 2001-2002 Budget, the Province introduced a low-income tax reduction. The 2005-06 Budget announced that effective for the 2005 taxation year, indexation was extended to include the Low-Income Tax Reduction. In the 2006 taxation year, indexation will continue to be extended to the Low-Income Tax Reduction. As a result, all single tax-filers with incomes up to $12,992 and families earning up to $20,766 will not have to pay provincial personal income tax. In addition, the 2006-2007 Budget announced that effective January 1, 2007, the Low-Income Tax Reduction would be further enhanced such that all single tax-filers with incomes up to $13,750 and families with incomes up to $22,000 will pay no provincial personal income tax. As in previous years, eligible low-income families with dependent children may also receive the New Brunswick Child Tax Benefit and the New Brunswick Working Income Supplement, depending upon their income level.
In June 2006, the New Brunswick Legislature adopted the Tuition Tax Cash Back Credit Act, Under this program, New Brunswickers and others who attended post-secondary institutions anywhere, paid tuition after January 1, 2005 and decide to live and work in New Brunswick, will be eligible for a rebate of 50% of their tuition costs to a maximum of $10,000. Individuals can apply for up to $2,000 per year.
As part of the new government's efforts to encourage post-secondary education, on October 3, 2006, cabinet members approved the creation of $2,000 grants to first-year university students.
The corporate income tax is calculated as a percentage of corporate taxable income as defined for Federal tax purposes. The 2002-2003 Budget reduced the general corporate income tax rate from 16% to 14.5% effective July 1st, 2002. The 2003-2004 Budget further reduced the general corporate income tax rate from 14.5% to 13% effective January 1st, 2003. The 2006-2007 Budget announced that effective January 1, 2007, the general corporate income tax rate would be further reduced from 13% to 12%. Between 1999 and 2003, the small business corporate income tax rate, which applies to small Canadian controlled private corporations, was reduced from 6% to 3%. In addition, the small business threshold to which this rate applies was increased from the first $200,000 to the first $400,000 of active business income. The 2004-2005 Budget further reduced the small business corporate income tax rate from 3% to 2.5 % effective July 1st, 2004. In addition, the 2004-2005 Budget further increased the small business threshold to which the rate applies from $400,000 to $425,000 effective July 1st, 2004. The 2005-2006 Budget announced a three-year plan to bring the small business rate to one percent and to increase the income threshold eligible for the small business corporate income tax rate up to $500,000. The following table provides the details of the three-year plan.
| | |
Effective Date | Rate | Threshold |
July 1, 2005 | 2% | $450,000 |
July 1, 2006 | 1.5% | $475,000 |
July 1, 2007 | 1% | $500,000 |
Effective January 1, 2003, New Brunswick’s Research and Development tax credit was significantly increased and enhanced from a 10% non-refundable tax credit to a 15% refundable tax credit for expenditures that are eligible for the Federal Scientific Research and Experimental Development Tax Credit. Also, New Brunswick offers a 40% refundable Film Tax Credit. The credit is applied to eligible wages and salaries paid to New Brunswick residents.
To encourage entrepreneurship and assist small businesses with obtaining equity capital, the government implemented the Small Business Investor Tax Credit effective August 1, 2003. This tax credit provides a 30% non-refundable personal income tax credit of up to $15,000 per year on eligible investments by New Brunswickers made after August 1, 2003. The credit is applied against provincial personal income tax otherwise payable.
Capital Taxes. Effective April 1, 1997, the Province introduced a large corporations capital tax applied to taxable capital in excess of $5 million at a rate of 0.3%. The Large Corporations Capital Tax applies to the same definition of taxable capital as the Federal Large Corporations Tax but does not apply to federally defined financial institutions. In December 2005, the government announced a $250-million, five-year plan to help the forestry industry respond to current challenges in world market conditions. Part of this
23
Exhibit “d” Current Province of New Brunswick Description
initiative was the commitment to eliminate the Large Corporations Capital Tax by the end of 2008. This tax was reduced to 0.25% in 2006, 0.2% in 2007, 0.1% in 2008, and eliminated for 2009.
For banks, loan companies and trust companies, New Brunswick applies a capital tax on capital assets in excess of $10 million at a rate of 3%. The Province administers the capital tax on financial institutions. Both the Large Corporations Capital Tax and the Financial Corporations Capital Tax are deductible for Federal and provincial corporate income tax purposes.
Harmonized Sales Tax. Effective April 1, 1997, New Brunswick eliminated its provincial retail sales tax and adopted a harmonized sales tax (“HST”) of 15%. The HST is a value-added tax and was composed of the Federal 7% goods and services tax (“GST”) and a provincial component of 8%. The Federal government administers the HST. The tax adopts the Federal GST base and therefore applies to all goods and services subject to tax under the Federal Excise Tax Act. On July 1, 2006, the Federal government reduced the GST to 6%. As a result, the amount of the HST in New Brunswick was reduced to 14%.
Under the HST, businesses receive full input tax credits for tax paid on business purchases. As with the Federal GST, the HST provides the same tax-free status for certain goods offered under the GST (e.g. basic groceries). In addition, a number of rebates and credits are available. Books receive a point of sale rebate on the 8% provincial portion of the HST. Matching Federal rebate programs, the Province provides partial rebates on the provincial portion of the HST for municipalities, charities and non-profit organizations in respect of tax payable that is not otherwise recoverable. New Brunswick also participates in the Foreign Visitor Rebate Program which allows non-residents to claim the 8% provincial portion of the HST on goods and services purchased in New Brunswick. As well, the Province offers HST rebates to universities for qualifying research and development projects.
Gasoline and Motive Fuel Tax and Tobacco Tax. The provincial gasoline and motive fuel tax rates are 10.7 cents per litre for gasoline and 16.9 cents per litre for diesel fuel. To provide relief to New Brunswick drivers at the pumps, the provincial gasoline tax was reduced by 3.8 cents per litre, effective at midnight October 3, 2006. The new Liberal government announced in their platform that they would also provide equivalent relief to owners of non-commercial diesel vehicles through a reduction in annual vehicle registration fees. More details on this measure will be released in the coming months. To discourage smoking and to help offset the costs that smoking imposes on the health care system, New Brunswick tobacco taxes have increased twice. On June 18th, 2002, tobacco taxes increased from 7.25 to 9.75 cents per cigarette, from 4.95 to 7.45 cents per tobacco stick and from 3.99 to 6.49 cents per gram of fine cut tobacco. On December 10, 2002, tobacco taxes were further increased from 9.75 to 11.75 cents per cigarette, from 7.45 to 9.45 cents per tobacco stick and from 6.49 to 8.49 cents per gram of fine cut tobacco.
Property Taxes. New Brunswick levies a provincial real property tax of $1.50 per $100 of assessment on residential property that is not occupied by the owner. A provincial property tax rate of 65 cents per $100 of assessment is applied to owner-occupied residential property in unincorporated areas. The Province also levies a property tax on non-residential property at a rate of $2.25 per $100 of assessment. In addition to the residential and non-residential property tax rates, the Province applies a cost of assessment levy of two cents per $100 of assessment. Municipal/local taxes are imposed to defray the cost of providing local services that are not provided by the Province. In the case of incorporated municipalities, municipal taxes are collected by the Province and are remitted back to the municipality. In unincorporated areas, the local tax is collected and retained by the Province, as the Province provides and pays for the provision of local services. The Province offers a low-income property tax allowance of up to $200 for families with taxable incomes of $20,000 or under. There is also a fee of 5 cents per $100 of assessment imposed on residential property that is not owner-occupied and is not exempt under the Assessment Act. This levy finances the Office of the Rentalsman.
The 2004-2005 Budget announced that, effective January 1, 2005, qualifying not-for-profit housing corporations and not-for-profit co-operative housing associations are eligible to receive relief from the provincial property tax applied to their low-income rental housing property.
In the 2005-2006 Budget, government introduced legislation to amend the Assessment Act to encourage private sector businesses to develop and utilize heritage properties. This program provides a property tax incentive for owners of designated heritage properties who undertake an approved restoration. The owner of the designated heritage property is forgiven a portion of the net increase in provincial and municipal taxes resulting from the increase in assessed value of this property for a four-year period.
The 2006-2007 Budget announced the Forestry Investment Tax Credit. Effective for investments made after March 31, 2006, forestry companies will qualify for a rebate of 50% of investments in manufacturing and processing equipment up to a maximum of 50% of the provincial property tax paid for that year. This credit will be in effect for the 2006 and 2007 taxation years.
24
Exhibit “d” Current Province of New Brunswick Description
Federal-Provincial Fiscal Arrangements
Fiscal Equalization Payments. New Brunswick is one of eight provinces to receive fiscal equalization payments from the Federal government. The Equalization Program assists provinces in providing reasonably comparable levels of public services at reasonably comparable levels of taxation. New Brunswick's equalization payment for the fiscal year ended March 31, 2005 was $1,395.5 million and for the fiscal year ended March 31, 2006 was $1,348 million. Fiscal equalization payments accounted for 24.9% of total ordinary revenue for the fiscal year ended March 31, 2005 and 22.8% of the total ordinary revenue for the fiscal year ended March 31, 2006.
The Federal-Provincial Fiscal Arrangements Act was amended in June 2006 to set out the amount of the fiscal equalization payments to the provinces for the fiscal year beginning on April 1st, 2006 and applies a 3.5% escalator for each subsequent year. The Act was also amended to provide for the one-time payment to provinces and territories for the fiscal year 2006-2007 in support of early learning and child care.
Canada Health Transfer(“CHT”) and Canada Social Transfer (“CST”). In 2005-2006 the Federal government provided annual funding through the CHT, CST and various one-time funds in support of health care, post-secondary education, social assistance and services, early childhood development, and early learning and child care to provinces and territories. For the fiscal year ended March 31, 2005, major health and social transfers totalled $676.4 million which accounted for 12.1% of total ordinary revenue. For the fiscal year ended March 31, 2006, major health and social transfers totalled $751.9 million which accounted for 12.7% of total ordinary revenue.
Fiscal Stabilization Program. Under the Fiscal Stabilization Program, the Federal government may make unconditional payments to a Province when total revenues of that Province, as per the Federal definition, fall short of the previous years total due to a downturn in economic activity.
Revenue Guarantee Program. This program expired in the fiscal year 2003-2004 and was not renewed.
Major Ordinary Account Expenditure
For the fiscal year ending March 31, 2006 the Province's actual ordinary expenditure was $5,678.5 million, 6.1% higher than the actual ordinary expenditures for the fiscal year ended March 31, 2005. The net increase of $325.4 million is a result of various increases including funding for health care and education and a one-time grant to universities.
The following table shows the percentage distribution of ordinary account expenditure for the four fiscal years ended March 31, 2006 and the Budget Estimates for the fiscal year ending March 31, 2007:
| | | | | | | | | | | | | | | | | |
ORDINARY ACCOUNT EXPENDITURE DISTRIBUTION |
| | | | | Fiscal Year Ended March 31, | | | | | | Budget | |
| | | | | | | | | | | | | | | | Estimate | |
| | | | 2003 | | | 2004 | | | 2005 | | | 2006 | | | 2007 | |
Economic Development. | | | | 2.3 | % | 2.6 | % | 2.6 | % | 2.7 | % | | 2.1 | % |
Education | | | | 19.8 | | | 19.3 | | | 18.6 | | | 20.0 | | | 17.5 | |
Employment Development & Labour | | | | 3.9 | | | 3.8 | | | 3.7 | | | 3.4 | | | 4.1 | |
Family and Community Services | | | | 14.2 | | | 13.7 | | | 13.5 | | | 13.5 | | | 13.7 | |
Health | | | | 30.0 | | | 30.1 | | | 31.5 | | | 31.7 | | | 33.3 | |
Protection Services | | | | 2.7 | | | 2.6 | | | 2.6 | | | 2.6 | | | 2.6 | |
Resource Sector | | | | 2.7 | | | 2.7 | | | 2.8 | | | 2.6 | | | 2.6 | |
Transportation. | | | | 3.3 | | | 2.9 | | | 2.8 | | | 2.9 | | | 2.8 | |
Central Government | | | | 7.7 | | | 11.1 | | | 11.0 | | | 10.2 | | | 11.3 | |
Service of the Public Debt | | | | 13.4 | | | 11.2 | | | 10.9 | | | 10.4 | | | 10.0 | |
| | | | 100.0 | % | | 100.0 | % | | 100.0 | % | | 100.0 | % | | 100.0 | % |
Total Ordinary Account Expenditures (in millions) | | | $ | 4,896.4 | | $ | 5,195.5 | | $ | 5,353.1 | | $ | 5,678.5 | | $ | 5,768.0 | |
25
Exhibit “d” Current Province of New Brunswick Description
Economic Development. The Economic Development expenditure of $120.2 million represents 2.1% of the total budgeted expenditure for the fiscal year ending March 31, 2007 and is made up of the Departments of: Business New Brunswick ($36.4 million), the Regional Development Corporation ($38.5 million), Tourism and Parks ($25.3 million) and a portion of General Government ($20.0 million).
Education. Operating expenses of elementary and secondary schools are paid by the Province. For the fiscal year ending March 31, 2007, expenditure on education for public schooling is estimated at $861.6 million, 14.8% of total budgeted expenditure. The Province also pays operating grants to universities estimated at $147.5 million, 2.6% of total budgeted expenditure, for the fiscal year ending March 31, 2007.
Employment Development and Labour. The Employment Development and Labour expenditure of $239.3 million represents 4.1% of the total budgeted expenditure for the fiscal year ending March 31, 2007 and is made up of the Departments of Training and Employment Development ($238.7 million) and a portion of General Government ($0.6 million).
Family and Community Services. The Province provides an income security program that includes payments to social assistance clients, the disabled, and residents of special care homes. Funds are also budgeted for exit-related programs. In addition, the Province assists individuals and families in the acquisition and/or retention of suitable accommodations for reasonable and affordable cost. For the fiscal year ending March 31, 2007, the Province budgeted $792.2 million for Income Assistance, 13.7% of total budgeted expenditure.
Health. The Province pays the operating expenses of approved public hospitals to cover the cost of hospital services supplied by such hospitals. The Province also operates a comprehensive medical services payment plan (Medicare), which covers the costs of eligible medical services incurred by registered residents. For the fiscal year ending March 31, 2007, expenditure on health services is estimated at $1,919.2 million, 33.3% of total budgeted expenditure.
Protection Services. The Protection Services expenditure of $151.2 million represents 2.6% of total expenditure budgeted for the fiscal year ending March 31, 2007 and is made up of the Department of Justice ($34.4 million), the Office of the Attorney General ($13.6 million), the Department of Public Safety ($102.6 million), and a portion of General Government ($0.6 million).
Resource Sector. The Resource Sector expenditure of $149.7 million represents 2.6% of the total budgeted expenditure for the fiscal year ending March 31, 2007 and is made up of the Department of Agriculture, Fisheries and Aquaculture ($32.1 million), the Department of the Environment ($13.7 million), Department of Natural Resources ($93.6 million), Department of Energy ($2.0 million), Energy Efficiency and Conservation Agency of New Brunswick ($8.0 million), and a portion of General Government ($0.3 million).
Transportation. For the fiscal year ending March 31, 2007, the Province budgeted $158.9 million for the planning, design and maintenance of highways and the operation of ferry services. This represents 2.8% of the total budgeted expenditure.
Central Government. The Central Government expenditure of $653.1 million estimated for the fiscal year ending March 31, 2007 represents 11.3% of total budgeted expenditure and is made up of expenditures of the Department of Finance ($12.3 million), the Department of Supply and Services ($97.5 million), Department of Local Government ($110.4 million), General Government ($242.8 million), other central agencies ($39.9 million), and Consolidated Entities (150.2 million).
Service of the Public Debt. For the fiscal year ending March 31, 2007 the estimate of $575.1 million for servicing the debt of the Province including interest, foreign exchange, amortization, and other debt management expenses, represents 10.0% of the total budgeted expenditure.
Net Capital Expenditures
Expenditures for physical assets are financed primarily by borrowing and are charged to operations as incurred. The following table shows the percentage distribution of gross capital expenditure for the four fiscal years ended March 31, 2006 and the Budget Estimates for the fiscal year ending March 31, 2007. The table also shows the total amounts of recoveries through cost-sharing agreements with the Federal government.
26
Exhibit “d” Current Province of New Brunswick Description
| | | | | | | | | | | | | | | | | | | | | |
CAPITAL EXPENDITURE DISTRIBUTION |
| | | | | | | | | | | | | | | |
| | | | | Fiscal Year Ended March 31, | | | | |
| | | | | | | | | | | | | | Budget | |
| | | | | | | | | | | | | | Estimate | |
| | 2003 | | | 2004 | | | 2005 | | | 2006 | | | 2007 | |
Expenditures | | | | | | | | | | | | | | | |
Highways | | 58.7 | % | | 61.7 | % | 53.0 | % | | 46.7 | % | | 46.7 | % |
Bridges | | 6.7 | | | 7.3 | | | 7.9 | | | 8.7 | | | 7.3 | |
Schools | | 13.5 | | | 12.0 | | | 12.1 | | | 11.3 | | | 13.3 | |
Hospitals | | 5.1 | | | 8.6 | | | 14.8 | | | 21.8 | | | 20.8 | |
Other Public Buildings | | 7.4 | | | 2.8 | | | 2.4 | | | 3.1 | | | 5.4 | |
Vehicles | | 1.5 | | | 2.6 | | | 5.0 | | | 3.6 | | | 1.6 | |
Other | | 7.1 | | | 5.0 | | | 4.8 | | | 4.8 | | | 4.9 | |
Total | | 100.0 | % | | 100.0 | % | | 100.0 | % | | 100.0 | % | | 100.0 | % |
| | | | | | | | | | | | | | | |
Total Expenditure (in millions) | $ | 253.9 | | $ | 293.3 | | $ | 385.6 | | $ | 405.3 | | $ | 436.7 | |
| | | | | | | | | | | | | | | |
Recoveries | | | | | | | | | | | | | | | |
Recoveries from Canada | | | | | | | | | | | | | | | |
Highways | | 89.7 | % | | 94.3 | % | | 76.7 | % | | 84.7 | % | | 96.5 | % |
Economic and Regional Development Projects | |
7.3 | | | 0.4 | | | 4.1 | | | --- | | | --- | |
Health | | 0.9 | | | 3.0 | | | 8.9 | | | 4.0 | | | 2.5 | |
| | 97.9 | | | 97.7 | | | 89.7 | | | 88.7 | | | 98.9 | |
Other Recoveries | | 2.1 | | | 2.3 | | | 10.3 | | | 11.3 | | | 1.1 | |
Total | | 100.0 | % | | 100.0 | % | | 100.0 | % | | 100.0 | % | | 100.0 | % |
| | | | | | | | | | | | | | | |
Total Recoveries (in millions) | $ | 42.7 | | $ | 52.6 | | $ | 41.6 | | $ | 30.1 | | $ | 28.3 | |
| | | | | | | | | | | | | | | |
Net Capital Exp. (in millions) | $ | 211.2 | | $ | 240.7 | | $ | 344.0 | | $ | 375.2 | | $ | 408.4 | |
Special Operating Agencies
Revenue may be generated by the Special Operating Agencies or from transfers from other budgetary accounts. Expenditures are incurred by the agencies in delivering the programs they offer and may be of a capital or operating nature. For the fiscal year ending March 31, 2007, gross revenue is estimated at $234.9 million from the various agencies and expenditures are estimated at $224.2 million for a surplus of $10.7 million.
Loans and Advances
The Province has followed a policy of promoting economic development through the provision of financial assistance to industry. Such assistance has been channeled principally through the Department of Business New Brunswick, the Department of Family and Community Services and Provincial Holdings Ltd. and may take the form of repayable loans, guarantees of bank loans and bond issues and equity investments. Funds required for repayable loans and advances are appropriated annually by the Legislative Assembly and are included in the Province's annual borrowing requirements. Allowances for doubtful or uncollectable amounts are reviewed annually and the net balances of loans and advances less allowances are reflected in the Province's accounts. See "Tables and Supplementary Information of the Province--Table V" for information concerning loans and advances for the four fiscal years ended March 31, 2006 and the Budget Estimates for the fiscal year ending March 31, 2007.
27
Exhibit “d” Current Province of New Brunswick Description
Business New Brunswick. The Minister of Business New Brunswick is responsible for assistance provided under the Economic Development Act, the Agricultural Development Board and the Fisheries Development Act:
The Economic Development Act authorizes the Minister to provide financial assistance to aid and encourage the establishment or development of industry on such terms and conditions as are specified by the Lieutenant-Governor in Council. At March 31, 2006, loans and guarantees under the Economic Development Act amounted to approximately $259.0 million. The allowance for doubtful accounts on these loans and guarantees amounted to $127.3 million.
The Agriculture Development Board provides aid to farmers and farm-related businesses by way of loans, grants and loan guarantees to increase income and employment in rural areas of the Province. At March 31, 2006 loans and guarantees outstanding were $19.4 million. The allowance for doubtful accounts totaled $13.4 million.
The Fisheries Development Act provides financial assistance mainly by way of direct loans to fishermen to purchase and operate fishing vessels and equipment. At March 31, 2006, loans and guarantees outstanding amounted to $60.9 million. The allowance for doubtful accounts totaled $49.3 million.
Family and Community Services. The Department of Family and Community Services carries out the Government's housing policies. Loans are issued pursuant to the New Brunswick Housing Act. At March 31, 2006, loans under the New Brunswick Housing Act totaled $34.5 million. The allowance for doubtful accounts on these loans totaled $2.4 million. In accordance with the recommendations of the CICA, loans that will be repaid through future Provincial appropriations are expensed at the time of issue.
Provincial Holdings Ltd. Provincial Holdings Ltd. (“PHL”) is a New Brunswick company that the Province uses to invest in the equity of industrial enterprises that are based in the Province. PHL is wholly owned by the Province. As at March 31, 2006, $6.0 million had been advanced to PHL by the Province. The allowance for doubtful accounts on loans to PHL totaled approximately $4.4 million.
Post-Secondary Education and Training. The Department of Post-Secondary Education and Training administers the Student Loan Program which provides financial assistance to New Brunswick residents attending post-secondary institutions. As of March 31, 2006, the total of Student Loans outstanding was $258.3 million. The allowance for doubtful accounts on these loans totaled $41.0 million.
28
Exhibit “d” Current Province of New Brunswick Description
FINANCING
Borrowing Requirements
The following table provides information on the Province's ordinary account deficit or surplus, deficit or surplus from operations and increase or decrease in net debt for the three fiscal years ended March 31, 2006 and the Budget Estimates for the fiscal year ending March 31, 2007.
INCREASE (DECREASE) IN NET DEBT
| | | | | | Year Ended March 31, | | | | |
| | | | | | (millions) | | | | | |
| Historical data not available due to move to Tangible Capital | | | | | | | | | | | Budget | |
| Asset Accounting | | | | | | | | | | | Estimates | |
| | | 2004 | | | 2005 | | | 2006 | | | 2007 | |
| Ordinary Account Revenue | $ | 5,094.3 | | $ | 5,601.6 | | $ | 5,917.8 | | $ | 5,882.6 | |
| Ordinary Account Expenditure | | 5,195.5 | | | 5,353.1 | | | 5,678.5 | | | 5,798.4 | |
| (Surplus) Deficit on Ordinary Account | | 101.2 | | | (248.5 | ) | | (239.3 | ) | | (84.2 | ) |
| Capital Account Expenditure | | 293.3 | | | 385.6 | | | 405.3 | | | 436.7 | |
| Capital Account Recoveries | | 52.6 | | | 41.6 | | | 30.1 | | | 28.3 | |
| Net Capital Expenditure | | 240.7 | | | 344.0 | | | 375.2 | | | 408.4 | |
| Special Purpose Account Revenues | | 40.7 | | | 48.9 | | | 53.3 | | | 52.3 | |
| Special Purpose Account Expenditures | | 36.5 | | | 42.6 | | | 46.5 | | | 55.5 | |
| (Surplus) Deficit on Special Purpose Account | | (4.2 | ) | | (6.3 | ) | | (6.8 | ) | | 3.2 | |
| Special Operating Agency Revenues | | 207.4 | | | 216.9 | | | 235.2 | | | 65.4 | |
| Special Operating Agency Expenditures | | 195.3 | | | 204.2 | | | 201.3 | | | 54.7 | |
| (Surplus) Deficit on Special Operating Agency | | (12.1 | ) | | (12.7 | ) | | (33.9 | ) | | (10.7 | ) |
| Sinking Fund Earnings | | (222.5 | ) | | (221.6 | ) | | (226.4 | ) | | (229.7 | ) |
| Eliminations of Inter-Account Transactions | | (0.0 | ) | | (0.4 | ) | | (0.1 | ) | | -- | |
| Change in Other Non-Financial Assets | | (11.9 | ) | | 0.1 | | | 8.6 | | | -- | |
| Increase (Decrease) in Net Debt | $ | 91.2 | | $ | (145.4 | ) | $ | (122.6 | ) | $ | 87.0 | |
Net loans and advances, sinking fund installments and the difference between the cash contributions made to the pension funds and the amounts expensed according to CICA recommendations as well as several other relatively small items are not included since they are non-budgetary items. Borrowing requirements associated with the budget and the aforementioned items for the fiscal year ended March 31, 2006 were $771.0 million and for the fiscal year ending March 31, 2007 are estimated at approximately $524.8 million and $100.0 million for the student loan program.
29
Exhibit “d” Current Province of New Brunswick Description
Non-Public Borrowing
In recent years, the Province has borrowed from one non-public source, the Canada Pension Plan (“CPP”).
The CPP is a compulsory national pension plan in which all provinces other than Quebec participate. When the Plan generates surpluses, the excess funds are invested in capital markets. In the past, funds were invested in non-marketable securities issued by participating provinces, provincially guaranteed Crown Corporations and the Federal government at a rate based on the Federal government's long-term public market borrowing costs. Changes to CPP legislation in 1998 allowed for new funds flowing into the CPP to be invested in domestic and foreign equities and for provincial bonds previously issued to the CPP Investment Fund to be rolled over upon maturity on a one-time basis at a cost equal to the respective Province’s market rate. At March 31, 2006, New Brunswick had outstanding borrowings from the CPP Investment Fund of $834.3 million.
Public Borrowing
At March 31, 2006, the Province had outstanding borrowings for Provincial purposes from non-CPP sources totaling $8,108.1 million through the issue and sale of debentures and notes, such securities being denominated in Canadian dollars, U.S. dollars and Swiss francs. Not included in this amount is $3,261.5 million borrowed on behalf of New Brunswick Electric Finance Corporation (“NBEFC”).
Trend and Distribution of Borrowing
The trend and distribution of the amounts and sources of the Province's annual debt financing over the past five fiscal years is shown below:
SOURCES OF FUNDS 1
| | | | | | | | |
| Year ended March 31, |
Public Borrowing | Non-Public Borrowing Canada Pension Plan |
Total Borrowing |
| | | | | |
| | | (millions) |
| 2002 | | $ | 600.0 | $ | 74.8 | $ | 674.82 |
| 2003 | | | 1,050.2 | | 73.2 | | 1,123.43 |
| 2004 | | | 551.9 | | 71.2 | | 623.14 |
| 2005 | | | 500.0 | | 67.1 | | 567.15 |
| 2006 | | | 950.0 | | 46.1 | | 996.16 |
| | | | | | | | |
| | | $ | 3,652.1 | $ | 332.4 | $ | 3,984.5 |
1Debt securities payable in foreign currencies are expressed as the Canadian dollar equivalent at the time of issue.
2 In addition, $300.0 million was borrowed on behalf of New Brunswick Power Corporation.
3 In addition, $741.8 million was borrowed on behalf of New Brunswick Power Corporation.
4 In addition, $296.7 million was borrowed on behalf of New Brunswick Power Corporation.
5 In addition, $300.0 million was borrowed on behalf of New Brunswick Power Corporation.
6 In addition, $400.0 million was borrowed on behalf of NBEFC.
(See section entitled “New Brunswick Electric Finance Corporation”)
Between April 1, 2006 and December 15, 2006, the Province borrowed $357.3 million.
30
Exhibit “d” Current Province of New Brunswick Description
Growth of Funded Debt
The following tables illustrate the rate of change of the Province's outstanding Provincial purpose funded debt and present certain ratios relating that growth to economic indicators. The following tables do not include $300.0 million borrowed during the fiscal year 2002, $741.8 million borrowed during the fiscal year 2003, $296.7 million borrowed during the fiscal year 2004, and $300.0 borrowed during fiscal year 2005 for New Brunswick Power Corporation (“NB Power”) and $400.0 million borrowed during fiscal year 2006 on behalf of NBEFC.
The Province is required by legislation to pay annually into a sinking fund the Canadian currency equivalent of not less than 1% of all Provincial purpose funded debt. The Province’s current policy is to pay 1.5% of Provincial purpose funded debt annually into the sinking fund. Sinking fund installments are invested in approved securities including direct and guaranteed obligations of the Province. Interest earned on such investments is added to the sinking fund and is reinvested in approved securities. At March 31, 2006 the value of the sinking fund applicable to debt issued for Provincial purposes amounted to $3,984.0 million. For the fiscal year ended March 31, 2006, earnings on investments amounted to $226.4 million.
OUTSTANDING NET PROVINCIAL PURPOSE FUNDED DEBT AND CAPITAL LOANS
(millions)
| | | | | | | | | |
At March
31, |
Cdn Dollars |
US
Dollars |
Japanese
Yen |
Swiss Francs | |
Total2 |
Value of Sinking Funds |
Net Provincial Purpose Funded Debt | Change over previous
year % |
2002 | 6,305.4 | 933.5 | 9,744.0 | 100.0 | | 8,004.7 | 3,358.8 | 4,645.9 | 2.6 |
2003 | 6,270.4 | 747.5 | 8,616.0 | 100.0 | | 8,418.7 | 3,543.0 | 4,875.7 | 4.9 |
2004 | 7,396.9 | 747.5 | 0.0 | 100.0 | | 8,485.8 | 3,716.2 | 4,769.6 | (2.2) |
2005 | 7,679.5 | 500.0 | 0.0 | 100.0 | | 8,397.0 | 3,773.8 | 4,623.2 | (3.1) |
2006 | 8,429.5 | 350.0 | 0.0 | 100.0 | | 8,942.4 | 3,984.0 | 4,958.4 | 7.3 |
1Debt securities issued in foreign currencies, which have been hedged are reported in the currency into which they have been hedged at the rates of exchange established by such hedges.
2
Debt securities payable in foreign currencies are expressed as the Canadian dollar equivalent at fiscal year-end rates of exchange or, where hedges are in place, at the rates of exchange established by such hedges.
| | | | | | |
COMPARATIVE DEBT STATISTICS1 |
| | (millions) |
| |
| | | | | | |
| | 2002 | 2003 | 2004 | 2005 | 2006 |
| | | | | | |
Gross Domestic Product at market prices | | $20,684 | $21,169 | $22,346 | $23,487 | $24,162 |
Personal Income | | 17,852 | 18,302 | 18,961 | 19,751 | 20,398 |
Ordinary Revenue | | 4,865 | 4,728 | 5,094 | 5,602 | 5,918 |
Net Funded Debt | | 4,646 | 4,876 | 4,770 | 4,623 | 4,958 |
As % of Gross Domestic Product | | 22.5 | 23.0 | 21.3 | 19.7 | 20.5 |
As % of Personal Income | | 26.0 | 26.6 | 25.2 | 23.4 | 24.3 |
As % of Ordinary Revenue | | 95.5 | 103.1 | 93.6 | 82.5 | 83.8 |
| | | | | | |
1The figures for Ordinary Revenue and Net Funded Debt are for the fiscal year ended March 31. The figures for GDP and Personal Income are for the calendar year ended December 31 of the previous year.
31
Exhibit “d” Current Province of New Brunswick Description
PROVINCIAL PURPOSE FUNDED DEBT MATURITY SCHEDULE
| | | | | |
For Securities Outstanding at March 31, 2006 (denominated in millions1) |
| | Total |
| Canadian | United States | | Swiss | Canadian |
Year ending March 31, | Dollars | Dollars | | Francs | Dollars2 |
2007 | $ 600.4 | US$ --- | | Sfr100.0 | $764.8 |
2008 | 537.3 | --- | | --- | 537.3 |
2009 | 861.3 | --- | | --- | 861.3 |
2010 | 922.7 | --- | | --- | 922.7 |
2011 | 440.4 | --- | | --- | 440.4 |
| | | | | |
2007-11 | 3,422.1 | --- | | 100.0 | 3,526.5 |
2012-16 | 2,775.1 | 200.0 | | --- | 3,008.5 |
2017-21 | 599.9 | 50.0 | | --- | 658.3 |
2022-26 | 305.5 | 100.0 | | --- | 422.2 |
2027-31 | 500.0 | --- | | --- | 500.0 |
2032-36 | 826.9 | --- | | --- | 826.9 |
| | | | | |
| $ 8,429.5 | US$ 350.0 | | Sfr100.0 | $ 8,942.4 |
1
Debt securities issued in foreign currencies, which have been hedged, are reported in the currency into which, they have been hedged at the rates of exchange established by such hedges.
2
Debt securities payable in foreign currencies are expressed as the Canadian dollar equivalent at the fiscal year-end rates of exchange or, where hedges are in place, at the rates of exchange established by such hedges.
Between April 1, 2006 and December 15, 2006, the Province borrowed $357.3 million.
Unfunded Debt
Because the Province follows an accrual accounting system, expenditures are allocated to the year in which they were incurred regardless of the date of payment resulting in the establishment of accounts payable and accrued liabilities. Such unfunded debt is not secured by debt instruments.
At March 31, 2006, the Province's unfunded debt was as follows:
UNFUNDED DEBT
| | | |
| | At March 31, 2006 |
| | (millions) |
Bank Advances and Short Term Borrowing | | $ | 577.8 |
Trust Deposits | | | 57.1 |
Accounts Payable | | | 667.4 |
Accrued Expenditures | | | 920.1 |
Deferred Revenue | | | 323.1 |
Total Unfunded Debt | | $ | 2,545.5 |
This unfunded debt is partially offset by assets of the Province in the amount of $1,652.8 million, represented by $633.8 million of cash and short term investments, $449.8 million of receivables and advances, $446.2 million of taxes receivable, $46.8 million of inventories and $76.2 million of prepaid and deferred charges.
32
Exhibit “d” Current Province of New Brunswick Description
Contingent Liabilities
The following table summarizes outstanding contingent liabilities at March 31, 2006 with comparable numbers as at March 31, 2005
| | | | | | | | |
CONTINGENT LIABILITIES |
| | | | At March 31, |
| | | | 2005 | 2006 |
| | | | (millions) |
| | | | | | | |
Bank Loans | | | | | | | |
| Under Various Acts | | $ | 337.0 | | $ | 163.3 |
| | | | | | | |
| Less: Provision for Possible Losses | | | 67.6 | | | 60.7 |
| | | | | | | |
Total Contingent Liabilities | | | $ | 269.4 | | $ | 102.6 |
| | | | | | | |
Due to the adoption of the definition of the Reporting Entity recommended by the Public Sector Accounting and Auditing Board of the CICA, guarantees associated with the debt of NB Power and the New Brunswick Municipal Finance Corporation are not included in the previous table. These guarantees are as follows:
| | | | | | | | | | |
| | | At March 31, |
| | | 2005 | 2006 |
| | | (millions) |
Bonds, Debentures and Notes | | | |
| | NB Power ¹ | | $ | 125.0 | | $ | 125.0 |
| | New Brunswick Municipal Finance Corporation | | | 466.6 | | | 496.1 |
| | | | | | | | |
| Loans from Northern Canada Power Commission to NB Power | | | 4.4 | | | 3.0 |
| | | | | 596.0 | | | 624.1 |
| | Less: Sinking Funds | | | 43.3 | | | 47.4 |
| | | | | | | | |
| | | | | 552.7 | | | 576.7 |
| | Accrued Interest¹ | | | 12.6 | | | 12.8 |
| | | | | | | | |
| Total | | | $ | 565.3 | | $ | 589.5 |
1Foreign denominated debt plus accrued interest are expressed as the Canadian dollar equivalent at fiscal year-end rates of exchange.
Debt Record
The Province has always paid promptly when due the full amount of the principal, redemption premium, if any, and interest on every direct obligation issued by it and every indirect obligation on which it has been required to implement its guarantee, all in the lawful currency of the country where payable at the time of payment thereof, subject during wartime to any applicable restrictions of laws and regulations forbidding trading with the enemy.
33
Exhibit “d” Current Province of New Brunswick Description
CONSOLIDATION OF NEW BRUNSWICK PUBLIC SECTOR DEBT
Other than the Province, NBEFC, New Brunswick Municipal Finance Corporation and municipalities are the only public sector entities with outstanding debt. Municipalities, with the exception of the City of Saint John, are required to obtain approval from the Provincial government before borrowing money for capital expenditures.
CONSOLIDATED FUNDED DEBT OF THE NEW BRUNSWICK PUBLIC SECTOR
(millions)
| | | | |
| | | | |
Province of New Brunswick | | | | |
| Funded Debt | $ | | 8,942.4 |
| Less: Sinking Funds | | | 3,984.0 |
| | | | 4,958.4 |
Municipalities | | | | |
| Funded Debt | | | 496.1 |
| | | | |
| | | | |
Total Public Sector Debt | | $ | | 5,454.5 |
Information in the foregoing table relative to the Province is at March 31, 2006 and information relative to municipalities is the amount outstanding at December 31, 2005. The figures for the Province do not include contingent liabilities of the Province in respect of its guarantees of obligations of NB Power (and assumed by the NBEFC) ($80.6 million net of sinking funds of $47.4 million). Also excluded is $2,925.1 million (net of sinking funds of $336.4 million) borrowed by the Province on behalf of NB Power (and assumed by NBEFC). This debt is paid out of the operating revenues of the NBEFC rather than out of Provincial revenues. Between April 1, 2006 and December 15, 2006, the Province borrowed $357.3 million.
PUBLIC SECTOR PENSION LIABILITIES
The Public Service Superannuation Act establishes a plan under which pensions are paid to most government employees and to certain employees of boards or institutions affiliated with the Province or their surviving spouses and minor dependents. Employees contribute approximately 6.0% on average of their salaries into the Public Service Superannuation Fund (“PSSF”). Approximately 9,823 active Provincial employees are making contributions. The Province and other designated employers are required to contribute into the PSSF an amount that is necessary, in addition to employee contributions, to cover current service cost. If at any time the PSSF is unable to satisfy all pension liabilities, the deficiency will be met out of the ordinary revenue of the Province. The Province contributed $45.5 million as the employer portion of current service cost for the year ended March 31, 2006. The Province will contribute app roximately $48.17 million for current service cost for the fiscal year ending March 31, 2007. The market value of the PSSF was $3,379.7 million as of March 31, 2006.
As the result of the PSSF’s April 1, 2002 actuarial valuation for funding purposes, the Province and three other designated employers began making special payments to reduce the $281.6 million unfunded liability. The Province’s share of the special payments will be $42.4 million while the three designated employers will collectively contribute $11.5 million in the fiscal year ending March 31, 2007. ($40.8 million for the Province and $11.1 million collectively for the three designated employers in the fiscal year ended March 31, 2006.)
The Teachers’ Pension Act establishes a plan for the payment of pensions to retired teachers or their surviving spouses and minor dependents. Teachers covered contribute approximately 7.7% on average of their salaries into the Teachers’ Pension Fund (“TPF”). Approximately 6,944 active employees are making contributions. The Province is required to match employee contributions. If at any time the TPF is unable to satisfy all pension liabilities, the deficiency will be met out of the ordinary revenue of the Province. The Province contributed $34.6 million as the employer portion of current service cost for the year ended March 31, 2006. The Province will contribute approximately $ 34.4 million for the fiscal year ending March 31, 2007. The market value of the TPF was $3,730.2 million as of March 31, 2006.
34
Exhibit “d” Current Province of New Brunswick Description
As the result of the TPF’s April 1, 2003 actuarial valuation for funding purposes, the Province began making special payments to reduce the $748.0 million unfunded liability. The special payments will be $78.4 million in the fiscal year ending March 31, 2007 ($75.3 million in the fiscal year ended March 31, 2006).
As of April 1, 2006, the Public Service Superannuation Plan had an actuarial pension surplus of $118.9 million using accounting assumptions while the Teachers’ Pension Plan had an actuarial pension surplus of $128.5 million.
Significant actuarial assumptions used for the purposes of financial statements were:
Short Term
Long Term
Salary escalation rate………………………………………………… 3.25%
3.45 to 4.25%
Real rate of return…………………………………………………….. 4.25%
4.25%
Inflation…………………………………………………………..…… 2.75%
2.75%
As of March 31, 2006, the financial statements for the Province report a pension surplus of $69.2 million and $54.7 million for the Public Service Superannuation Plan and the Teachers’ Pension Plan, respectively. The primary difference between the actuarial pension liabilities and the liabilities per the financial statements is that accounting standards require that experience gains be amortized over the estimated average remaining service life of the employees.
The Province sponsors three separate School District pension plans totaling $285.6 million in assets. The Plans have December 31 year-ends. The total surplus is approximately $43.3 million on an actuarial basis and $21.1 million on an accounting basis. If at any time these plans are found to be deficient, the Province is required to contribute an amount sufficient to fully fund the obligations.
The Province sponsors pension plans for provincial court judges, Members of the Legislative Assembly and the Ombudsman. Collectively, they have a total actuarial unfunded liability of $44.1 million and an accounting unfunded liability of $53.4 million as of March 31, 2006.
The Province also contributes to the Pension Plan of Certain Bargaining Employees of New Brunswick Hospitals, C.U.P.E. Employees of New Brunswick Hospitals and the Pension Plan for Part-time and Seasonal Employees. The Province contributes a fixed percentage of an employee’s wages and has no further financial obligation.
New Brunswick Investment Management Corporation
In 1996, legislation was proclaimed establishing the New Brunswick Investment Management Corporation. The corporation acts as trustee for the PSSF, the TPF and the Provincial Court Judges’ Pension Fund.
New Brunswick Electric Finance Corporation
NBEFC was established under the Electricity Act (the “Act”) that came into force on October 1, 2004.
NBEFC has as its mandate to manage the assets, liabilities, rights and obligations that NBEFC received as part of the restructuring of New Brunswick Power Holding Corporation (“Holding Corporation”), and to dispose or otherwise deal with them as it sees fit.
Upon the proclamation of the Act, NB Power was restructured into the Holding Corporation with four subsidiary companies:
New Brunswick Power Generation Corporation;
New Brunswick Power Nuclear Corporation;
New Brunswick Power Transmission Corporation; and
New Brunswick Power Distribution and Customer Service Corporation.
35
Exhibit “d” Current Province of New Brunswick Description
As a result of the restructuring, the former NB Power’s debt, accrued interest and Sinking Funds were transferred to NBEFC. A net total of $3.5 billion was transferred to NBEFC that consisted of the following:
| | | | |
| | | Millions |
| Long-term debt | $ | 3,537 |
| Short-term debt | | 378 |
| Accrued interest | | 83 |
| Sinking funds | | (418) |
| | $ | 3,580 |
In exchange, NBEFC received promissory notes from each Holding Corporation subsidiary, including accrued interest, and a $140-million equity share in New Brunswick Transmission Corporation. In addition, NBEFC assumed the deferred debt charges of $50 million and relieved the newly formed Holding Corporation and its subsidiaries (“NB Power Group”) of NB Power’s $187 million deficit.
NBEFC holds Class “B” non-voting share of nominal value in the Holding Corporation as well as in its subsidiaries. NBEFC holds an additional thousand Class “B” non-voting common shares in New Brunswick Transmission Corporation assigned a value of $140 million.
NBEFC receives debt service payments, dividends and payments in lieu of taxes from the newly formed companies.
36
Exhibit “d” Current Province of New Brunswick Description
TABLES AND SUPPLEMENTARY INFORMATION OF THE PROVINCE
In the following tables, the revenue and expenditure for the four fiscal years ended March 31, 2006 have been extracted from the Public Accounts for such years (subject to certain adjustments for purposes of comparability). For the fiscal year ending March 31, 2007, the numbers have been extracted from the Budget and the forecast of revenue and expenditure published in the Budget Estimates. Revenue and expenditure are expressed on a net basis.
| | | | | | | | | | | | | | | | | | | | | | | | |
TABLE I - COMPARATIVE STATEMENT OF ORDINARY REVENUE |
| | | | | | Fiscal Year Ended March 31, (in millions) | | | | | |
| | | | | | | | | | | | | | | Budget | | |
| | | | | | | | | | | | | | | Estimate | | |
| | | 2003 | | | 2004 | | | 2005 | | | 2006 | | | 2007 | | |
Own Source | | | | | | | | | | | | | | | | | |
Taxes | | $ | 2,481.6 | | $ | 2,612.4 | | $ | 2,664.2 | | $ | 2,817.5 | | $ | 2,879.0 | | |
Investment Income | | | 138.0 | | | 213.3 | | | 249.8 | | | 372.0 | | | 194.1 | | |
Licences and Permits | | | 95.8 | | | 95.3 | | | 93.2 | | | 103.4 | | | 101.4 | | |
Sale of Goods and Services | | | 83.2 | | | 201.3 | | | 203.9 | | | 212.8 | | | 205.1 | | |
Royalties | | | 57.5 | | | 67.2 | | | 67.8 | | | 65.0 | | | 64.6 | | |
Return on Investment | | | 24.7 | | | 30.0 | | | 22.2 | | | 21.1 | | | 18.8 | | |
Fines and Penalties | | | 1.5 | | | 1.2 | | | 1.6 | | | 1.8 | | | 1.5 | | |
Other | | | 17.9 | | | 16.2 | | | 16.9 | | | 18.6 | | | 12.4 | | |
Transfer from Fiscal Stabilization Fund | | | 110.4 | | | --- | | | --- | | | --- | | | --- | | |
Total - Own Source | | | 3,010.6 | | | 3,236.9 | | | 3,319.6 | | | 3,612.2 | | | 3,476.9 | | |
| | | | | | | | | | | | | | | | | |
Grants from Canada | | | | | | | | | | | | | | | | | |
Unconditional Grants - Canada | | | 1,647.6 | | | 1,636.4 | | | 2,039.8 | | | 2,046.2 | | | 2,135.9 | | |
Conditional Grants - Canada | | | 180.5 | | | 221.0 | | | 242.2 | | | 259.4 | | | 239.4 | | |
Total - Grants from Canada | | | 1,828.1 | | | 1,857.4 | | | 2,282.0 | | | 2,305.6 | | | 2,375.3 | | |
Total - Ordinary Revenue | | $ | 4,838.7 | | $ | 5,094.3 | | $ | 5,601.6 | | $ | 5,917.8 | | $ | 5,852.2 | | |
| | | | | | | | | | | | | | | | | |
TABLE II - COMPARATIVE STATEMENT OF ORDINARY EXPENDITURE |
| | | | | Fiscal Year Ended March 31, (in millions) | | | | | |
| | | | | | | | | | | | | | | | Budget |
| | | | | | | | | | | | | | | | Estimate |
| | | | 2003 | | | 2004 | | | 2005 | | | 2006 | | | 2007 |
| | | | | | | | | | | | | | | | |
Economic Development | | | $ | 114.1 | | $ | 132.8 | | $ | 137.3 | | $ | 152.1 | | $ | 120.2 |
Education | | | | 968.0 | | | 1,002.0 | | | 999.3 | | | 1,134.0 | | | 1,009.1 |
Employment Development & Labour | | | | 188.9 | | | 197.1 | | | 196.0 | | | 195.5 | | | 239.3 |
Family and Community Services | | | | 695.2 | | | 711.9 | | | 723.5 | | | 765.8 | | | 792.2 |
Health | | | | 1,468.4 | | | 1,565.6 | | | 1,689.5 | | | 1,802.8 | | | 1.919.2 |
Protection Services | | | | 131.4 | | | 134.3 | | | 139.5 | | | 148.1 | | | 151.2 |
Resource Sector | | | | 134.0 | | | 142.6 | | | 148.8 | | | 146.6 | | | 149.7 |
Transportation | | | | 159.5 | | | 151.4 | | | 150.3 | | | 164.7 | | | 158.9 |
Central Government | | | | 376.0 | | | 574.9 | | | 588.0 | | | 577.5 | | | 653.1 |
Service of the Public Debt | | | | 660.9 | | | 582.9 | | | 580.9 | | | 591.4 | | | 575.1 |
| | | | | | | | | | | | | | | | |
Total Ordinary Expenditure | | | $ | 4,896.4 | | $ | 5,195.5 | | $ | 5,353.1 | | $ | 5,678.5 | | $ | 5,768.0 |
37
Exhibit “d” Current Province of New Brunswick Description
| | | | | | | | | | | | | | | | | | | | | |
Table III - Comparative Statement of Net Capital Expenditure |
| | | | | | | | | | | | | | | |
(in millions) | | | Fiscal Year Ended March 31, | | | | | | |
| | | | | | | | | | | | | | | Budget |
| | | | | | | | | | | | | | | Estimate |
| | | 2003 | | | 2004 | | | 2005 | | | 2006 | | | 2007 |
Expenditure: | | | | | | | | | | | | | | | |
| | | | | | | | | | | | | | | |
Highways | | $ | 148.9 | | $ | 181.3 | | $ | 204.3 | | $ | 189.0 | | $ | 203.8 |
Bridges | | | 17.1 | | | 21.3 | | | 30.4 | | | 35.4 | | | 32.0 |
Schools | | | 34.3 | | | 35.2 | | | 46.7 | | | 45.9 | | | 58.0 |
Hospitals | | | 12.9 | | | 25.3 | | | 56.9 | | | 88.5 | | | 90.9 |
Other Public Buildings | | | 18.7 | | | 8.1 | | | 9.3 | | | 12.5 | | | 23.5 |
Economic and Regional Development | | | 16.3 | | | 12.3 | | | 15.3 | | | 15.6 | | | 18.1 |
Vehicles | | | 3.9 | | | 7.5 | | | 19.3 | | | 14.7 | | | 7.0 |
Water Pollution Control Grants. | | | 0.5 | | | 0.5 | | | 0.4 | | | 0.7 | | | 0.4 |
Other | | | 1.3 | | | 1.8 | | | 3.0 | | | 3.0 | | | 3.0 |
Total Expenditure | | | 253.9 | | | 293.3 | | | 385.6 | | | 405.3 | | | 436.7 |
| | | | | | | | | | | | | | | |
Recoveries: | | | | | | | | | | | | | | | |
Recoveries from Canada | | | | | | | | | | | | | | | |
Highways | | | 38.3 | | | 49.6 | | | 31.9 | | | 25.5 | | | 27.3 |
Economic and Regional Development Projects | | | 3.1 | | | 0.2 | | | 1.7 | | | --- | | | --- |
Health | | | 0.4 | | | 1.6 | | | 3.7 | | | 1.2 | | | 0.7 |
| | | 41.8 | | | 51.4 | | | 37.3 | | | 26.7 | | | 28.0 |
Other Recoveries | | | 0.9 | | | 1.2 | | | 4.3 | | | 3.4 | | | 0.3 |
Total Recoveries | | | 42.7 | | | 52.6 | | | 41.6 | | | 30.1 | | | 28.3 |
Net Capital Expenditure. | | $ | 211.2 | | $ | 240.7 | | $ | 344.0 | | $ | 375.2 | | $ | 408.4 |
| | | | | | | | | | | | | | | | | | | | | |
Table IV - Comparative Statement of Net Debt |
| | | | | | | | | | | | | | | |
| | | | | Fiscal Year Ended March 31, | | | | |
| | | | | | | | | | | | | | Budget | |
| | | | | | | | | | | | | | Estimate | |
| | | | | 2004 | | | 2005 | | | 2006 | | | 2007 | |
| | | | | | | | | | | | | | | |
Net Debt – Beginning of Year | | | | $ | 6,832.5 | | $ | 6,923.7 | | $ | 6,778.2 | | $ | 6,655.6 | |
| | | | | | | | | | | | | | | |
Ordinary Account (Surplus) Deficit | | | | | 101.2 | | | (248.5) | | | (239.3) | | | (84.2) | |
Net Capital Expenditure | | | | | 240.7 | | | 344.0 | | | 375.2 | | | 408.4 | |
Special Purpose (Surplus) Deficit | | | | | (4.2) | | | (6.3) | | | (6.8) | | | 3.2 | |
Special Operating Agency (Surplus) Deficit | | | | | (12.1) | | | (12.7) | | | (34.0) | | | (10.7) | |
Earnings from Sinking Funds | | | | | (222.5) | | | (221.6) | | | (226.4) | | | (229.7) | |
Change in Other Non-Financial Assets | | | | | (11.9) | | | 0.1 | | | 8.6 | | | --- | |
Eliminations of Inter-Account Transactions | | | | 0 | | | (0.5) | | | 0.1 | | | --- | |
| | | | | | | | | | | | | | | |
Increase (Decrease) in Net Debt for the Year | | | | | 91.2 | | | (145.5) | | | (122.6) | | | 87.0 | |
| | | | | | | | | | | | | | | |
Net Debt – End of Year | | | | $ | 6,923.7 | | $ | 6,778.2 | | $ | 6,655.6 | | $ | 6,742.6 | |
| | | | | | | | | | | | | | | |
38
Exhibit “d” Current Province of New Brunswick Description
| | | | | | | | | | | | | | | | | | | | | | | | | | |
TABLE V - COMPARATIVE STATEMENT OF NET LOANS AND ADVANCES |
| | | | | | | | | | | | | | | | |
| | | | | | Fiscal Year Ended March 31, | | | | |
(in millions) | | | | | | | | | | | | | | | Budget | |
| | | | | | | | | | | | | | | Estimate | |
| | | 2003 | | | 2004 | | | 2005 | | | 2006 | | | 2007 | |
| | | | | | | | | | | | | | | | |
| | | | | | | | | | | | | | | | |
Disbursements: | | | | | | | | | | | | | | | | |
| | | | | | | | | | | | | | | | |
Agricultural Development Act | | $ | 0.5 | | $ | 0.2 | | $ | 0.1 | | $ | 0.3 | | $ | 2.0 | |
Economic Development Act | | | 19.5 | | | 13.4 | | | 18.2 | | | 30.0 | | | 45.0 | |
Energy Efficiency Upgrade Loans | | | --- | | | --- | | | --- | | | 0.2 | | | 3.4 | |
Fisheries Development Act | | | 1.7 | | | 0.5 | | | 1.2 | | | 0.5 | | | 3.0 | |
Housing | | | 5.1 | | | 4.8 | | | 4.9 | | | 4.9 | | | 5.9 | |
Student Loans | | --- | | | --- | | | --- | | | 267.6 | | | 58.7 | * |
Veterans' Affairs | | | 1.3 | | | 0.8 | | | --- | | | --- | | | --- | |
Other | | | 0.5 | | | 0.0 | | | 0.9 | | | 0.5 | | | 1.6 | |
| | | 28.6 | | | 19.7 | | | 25.3 | | | 304.0 | | | 119.6 | |
| | | | | | | | | | | | | | | | |
Recoveries: | | | | | | | | | | | | | | | | |
| | | | | | | | | | | | | | | | |
Agricultural Development Act | | | 0.6 | | | 0.5 | | | 1.5 | | | 2.4 | | | 1.5 | |
Economic Development Act | | | 12.6 | | | 25.8 | | | 11.1 | | | 25.4 | | | 9.5 | |
Fisheries Development Act | | | 3.8 | | | 2.9 | | | 3.7 | | | 2.9 | | | 2.8 | |
Greater Moncton Area Transitional Policing | | | 0.3 | | | 0.3 | | | 0.3 | | | 0.3 | | | 0.3 | |
Housing | | | 4.2 | | | 4.2 | | | 5.0 | | | 4.8 | | | 5.7 | |
Student Loans | | | --- | | | --- | | | --- | | | 10.9 | | | 14.7 | |
Provincial Holdings Ltd | | | 0.4 | | | 0.3 | | | 0.3 | | | 0.1 | | | 0.3 | |
Veterans' Affairs | | | 0.3 | | | 1.3 | | | 1.4 | | | 1.5 | | | 1.6 | |
Other | | | 0.3 | | | 0.3 | | | 0.3 | | | 0.6 | | | 0.6 | |
| | | 22.5 | | | 35.6 | | | 23.6 | | | 48.9 | | | 37.0 | |
Net Loans and Advances. | | $ | 6.1 | | $ | (15.9) | | $ | 1.7 | | $ | 255.1 | | $ | 82.6 | |
| | | | | | | | | | | | | | | | |
| | | | | | | | | | | | | | | | |
* In 05/06, the Dept of Education took over the financing of the NB Student Loan Program | | | | | | |
| | | | | | | | | | | | | | | | |
39
Exhibit “d” Current Province of New Brunswick Description
| | | | | | | | | | | | | | | |
| FUNDED DEBT OUTSTANDING AT MARCH 31, 2006 |
| | | | | | | | |
| Date of Maturity | | Interest Rate | Sinking Fund Installment Rate | Series | Currency Amount | Outstanding Amount (CAN $) | Date Issued | Note |
| | | % | % | | Thousands | | |
| Repayable in United States Dollars: | | | | | | |
| 15 Feb. | 2013 | 7.625 | 1 & 1.5 | EO | 200,000.0 | 233,420.0 | Feb. 1993 | 2 |
| 15 Aug. | 2013 | 6.75 | 1 & 1.5 | ET | 200,000.0 | 233,420.0 | Sept. 1993 | 2 |
| 15 May | 2020 | 9.75 | 1 & 1.5 | DU | 200,000.0 | 233,420.0 | May 1990 | 2 |
| 1 May | 2022 | 8.75 | 1 & 1.5 | EI | 200,000.0 | 233,420.0 | May 1992 | 2 |
| | | | | | US$ 800,000.0 | C$ 933,680.0 | | |
| | | | | | | | | |
| Repayable in Swiss Francs: | | | | | | |
| 3 Nov. | 2006 | 5.625 | 1.5 | FQ | 100,000.0 | C$104,443.0 | March 1998 | 2,4 |
| | | | | | Sfr 100,000.0 | C$104,443.0 | | |
| | | | | | | |
| Repayable in Canadian Dollars: | | | | | | |
| 9 May | 2006-10 Mar. 2007 | 9.04 – 9.97 | 1 | CP | | 75,518.0 | 1986 – 1987 | 1 |
| 19 June | 2006 | 7.75 | 1.5 | FL | | 200,000.0 | June 1996 | 2 |
| 31 July | 2006 | 3.4 | 1.5 | GG | | 36,000.0 | July 2003 | 2 |
| 16 Oct. | 2006 | 7.10 | 1.5 | FM | | 200,000.0 | Oct. 1996 | 2 |
| 3 Nov. | 2006 | 5.625 | 1.5 | FQ | | 54,932.2 | March 1998 | 2,4 |
| 26 Feb. | 2007 | 6.75 | 1 & 1.5 | FN | | 200,000.0 | Feb. 1997 | 2 |
| 10 Apr. | 2007-10 Mar 2008 | 9.12 – 11.07 | 1 | CP | | 62,396.0 | 1987 – 1988 | 1 |
| 30 July | 2007 | 3.816 | 1.5 | GH | | 38,704.0 | July 2003 | 2 |
| 23 Oct. | 2007 | 4.78 & 4.7925 | 1 & 1.5 | GA | | 791,500.0 | Oct. 2002 | 2,13 |
| 11 Apr. | 2008-1 Dec. 2008 | 9.62 – 10.39 | 1 | CP | | 59,314.0 | 1988 | 1 |
| 2 June | 2008 | 5.70 | 1.5 | FR | | 550,000.0 | Mar., Oct. 1998 | 2,5 |
| 7 July | 2008 | 4.35 | 1.5 | GD | | 101,958.4 | July 2003 | 2 |
| 2 Dec. | 2008 | 4.25 | 1.5 | GI | | 300,000.0 | Sept. 2003 | 2 |
| 3 Apr. | 2009-1 Mar. 2010 | 9.15 – 10.31 | 1 | CP | | 64,307.0 | 1989 – 1990 | 1 |
| 1 May | 2009 | Floating | 1.5 | GM | | 200,000.0 | April 2005 | 2,15 |
| 2 June | 2009 | 5.25 | 1.5 | FU | | 550,000.0 | May, Sept 1999 | 2,7 |
| 22 June | 2009 | 10.25 | 1.5 | DR | | 88,019.0 | June 1989 | 2,3 |
| 23 Nov. | 2009 | 10 | 1 & 1.5 | DT | | 120,359.0 | Nov. 1989 | 2,3 |
| 2 Dec | 2009 | 4.5 | 1 & 1.5 | GK | | 300,000.0 | June 2004 | 2 |
| 2 Apr. | 2010-1 Mar. 2011 | 10.36 – 11.04 | 1.5 | CP | | 40,360.0 | 1990 – 1991 | 1 |
| 15 June | 2010 | 6.375 | 1 & 1.5 | FW | | 600,000.0 | June, Dec. 2000 | 2,9 |
| 10 Apr. | 2011-10 July 2011 | 9.81 – 10.04 | 1.5 | CP | | 58,458.0 | 1991 | 1 |
| 12 July | 2011 | 5.8 | 1 & 1.5 | FX | | 600,000.0 | Feb., June 2001 | 2,10 |
| 31 Oct. | 2011 | 10.125 | 1 & 1.5 | ED | | 200,000.0 | Oct. 1991 | 2 |
| 1 Dec. | 2011 | 5.85 | 1 & 1.5 | FY | | 600,000.0 | Dec 01, Feb 02 | 2,11 |
| 11 May | 2012-10 July 2012 | 9.17 – 9.45 | 1.5 | CP | | 41,673.0 | 1992 | 1 |
| 6 Dec | 2012 | 5.875 | 1& 1.5 | FZ | | 600,000.0 | June, Aug. 2002 | 2,12 |
| 18 Jan. | 2013 | 9.25 | 1 & 1.5 | EN | | 200,000.0 | Jan. 1993 | 2 |
| 25 Feb | 2013 | 5.5 | 1 & 1.5 | GC | | 200,000.0 | Feb. 2003 | 2 |
| 28 June | 2013 | 8.5 | 1 & 1.5 | ER | | 200,000.0 | June 1993 | 2 |
| 13 Jan. | 2014 | 7.75 | 1.5 | EW | | 200,000.0 | Jan. 1994 | 2 |
| 4 Feb. | 2015 | 4.5 | 1 & 1.5 | GL | | 550,000.0 | Feb., Apr 2005 | 2,16 |
40
Exhibit “d” Current Province of New Brunswick Description
| | | | | | | | | | | | | | | |
| 12 May | 2015 | 8.75 | 1 & 1.5 | FF | | 200,000.0 | May 1995 | 2 |
| 3 Dec. | 2015 | 4.3 | 1.5 | GN | | 500,000.0 | June 05, Jan 06 | 2,17 |
| 27 June | 2017 | 6.75 | 1.5 | FO | | 250,000.0 | June 1997 | 2 |
| 27 Dec. | 2017 | 6 | 1.5 | FP | | 250,000.0 | Nov. 1997 | 2 |
| 2 Apr. | 2019 - 3 Mar. 2020 | 5.64 – 6.82 | 1.5 | CP | | 46,892.0 | 1999-2000 | 1 |
| 1 Apr. | 2020 - 2 Mar. 2021 | 6.25 – 6.76 | 1.5 | CP | | 53,014.0 | 2000-2001 | 1 |
| 1 Apr. | 2021 - 1 Mar. 2022 | 6.26 – 6.70 | 1.5 | CP | | 74,784.4 | 2001-2002 | 1 |
| 1 Apr. | 2022 – 1 Mar. 2023 | 5.79 – 6.51 | 1.5 | CP | | 73,185.0 | 2002-2003 | 1 |
| 5 Apr. | 2023 – 1 Mar. 2024 | 5.37 – 6.06 | 1.5 | CP | | 71,205.0 | 2003-2004 | 1 |
| 31 Mar | 2024 | 4.67 | 1.5 | GP | | 100,000.0 | Mar. 2006 | 2 |
| 10 Apr. | 2025 – May 2025 | 4.97 – 5.10 | 1.5 | CP | | 19,188.0 | 2005 | 1 |
| 2 Apr. | 2024 – 10 Jan. 2025 | 5.16 – 5.83 | 1.5 | CP | | 67,087.0 | 2004-2005 | 1 |
| 27 Dec. | 2028 | 5.65 | 1.5 | FT | | 500,000.0 | July 98, Feb. 99 | 2,6 |
| 15 Dec. | 2029 | 5.75 – 6.29 | 1 | FV | | 50,000.0 | Dec. 1999 | 8 |
| 27 Jan. | 2034 | 5.5 | 1.5 | GJ | | 550,000.0 | Jan., Nov. 2004 | 2,14 |
| 10 July | 2035 | 4.73 | 1.5 | CPP-A | | 26,937.0 | 2005 | 18 |
| 26 Sept | 2035 | 4.65 | 1.5 | GO | | 250,000.0 | Sept 2005 | 2 |
| | | | | | | | | |
| | | | | | | $ 11,165,791.0 | | |
| | | | | | | C$ 12,203,914.0 | | |
Note: | | | | | | | | |
Up to 31 March 1980, the sinking fund installment rate on the Series CP debentures was 3%. Commencing 1 April 1980, the minimum rate was reduced to 1%. |
Note:
(1)
Issued to Canada Pension Plan Investment Fund, not negotiable, transferable or assignable. Twenty year bonds redeemable in whole, or in part, at 100% on not less than thirty days notice.
(2)
Non-callable.
(3)
Pursuant to Section 24 of the Provincial Loans Act, the Minister of Finance authorized the cancellation of a portion of this issue held as an investment in the Sinking Fund effective 1 April 1991. The Sinking Fund instalment is the same as that made prior to the cancellation.
(4)
Swiss Franc 100,000.0 represents the amount payable under a swap transaction for the repayment at maturity of a portion of series FQ $150,000.0 due 3 November 2006. The remaining $54,932.2 of series FQ is repayable in Canadian dollars. Interest is payable semi-annually in Canadian dollars.
(5)
In October 1998, the Province issued an additional $250,000.0 of its Series FR debentures.
(6)
In February 1999, the Province issued an additional $250,000.0 of its Series FT debentures.
(7)
In September 1999, the Province issued an additional $250,000.0 of its Series FU debentures.
(8)
Puttable at par on 15 December 2007 at the option of the note holder with 10 calendar days notice. The interest rate is 5.75% to 15 December 2007. After this date, until maturity, the interest rate is 6.29%.
(9)
In December 2000, the Province issued an additional $300,000.0 of its Series FW debentures.
(10)
In June 2001, the Province issued an additional $300,000.0 of its Series FX debentures.
(11)
In February 2002, the Province issued an additional $300,000.0 of its Series FY debentures.
(12)
In August 2002, the Province issued an additional $300,000.0 of its Series FZ debentures.
41
Exhibit “d” Current Province of New Brunswick Description
(13)
Canadian $791,500.0 represents the amount payable under an interest rate and currency swap agreement with a counter-party for the repayment at maturity of the Province’s debt of Series GA 3.50% $500,000.0 US due 23 October 2007. Interest is payable semi-annually in Canadian dollars at a fixed rate.
(14)
In November 2004, the Province issued an additional $250,000.0 of its Series GJ debentures.
(15)
Canadian $200,000.0 represents the amount payable under an interest swap agreement with a counterparty. Interest is payable in monthly Canadian dollars at a floating rate.
(16)
In April 2005, the Province issued an additional $300,000 of its Series GL debentures.
(17)
In January 2006, the Province issued an additional $300,000 of its Series GN debentures.
(18)
Issued to the Canada Pension Plan Investment Board, non negotiable or transferable. Assignable only to a wholly-owned subsidiary of the CPP Investment Board. Thirty year bonds redeemable in whole or in part prior to maturity on not less that six days notice.
42
Exhibit “d” Current Province of New Brunswick Description
FOREIGN EXCHANGE
Canada maintains a floating exchange rate for the Canadian dollar to permit the rate to be determined by fundamental market forces without intervention except as required to maintain orderly conditions.
Spot exchange rates for the U.S. dollar, Japanese yen and Swiss franc in Canada, expressed in Canadian dollars, are shown in the table below for 2001 through 2005.
| | | | | | | | | | |
Average of Noon Spot Rates | | 2001 | | 2002 | | 2003 | | 2004 | | 2005 |
| | | | | | | | | | |
U.S. Dollar | $ | 1.5489 | $ | 1.5704 | $ | 1.4014 | $ | 1.3015 | $ | 1.2116 |
Japanese Yen (100 yen) | | 1.2755 | | 1.2554 | | 1.2088 | | 1.2035 | | 1.1037 |
Swiss Franc | | 0.9189 | | 1.0112 | | 1.0418 | | 1.0473 | | 0.9749 |
Source: Bank of Canada
SOURCES OF INFORMATION
Information included herein which is designated as being taken from a publication of the Province or Canada, or any agency or instrumentality of either, is included herein upon the authority of such publication as a public official document.
The financial statements of the Province included herein under the heading "Tables and Supplementary Information of the Province" have been taken from the Public Accounts of the Province (subject to certain adjustments for purposes of comparability) and the forecast of revenue and expenditure published in the Budget Estimates. All financial information of the Province contained herein was obtained from the annual Budget and Main Estimates, the financial reviews pertaining thereto and the Public Accounts, or was prepared by representatives of the Department of Finance in their official capacities. The information set forth under "Province of New Brunswick", and other than as described in the preceding paragraph, was prepared by representatives of the Department of Finance in their official capacities.
43