PUBLIC
ACCOUNTS
for the fiscal year ended
31 March 2011
Printed by Authority
of the Legislature
Fredericton, N.B.

Volume 1
Financial Statements
PUBLIC
ACCOUNTS
for the fiscal year ended
31 March 2011
Printed by Authority
of the Legislature
Fredericton, N.B.
2011
PROVINCE OF NEW BRUNSWICK
iii
TABLE OF CONTENTS
Audited Financial Statements
| |
| Introduction to Volume I | 1 |
| Statement of Responsibility | 2 |
| Results for the Year | 3 |
| Major Variance Analysis | 7 |
| Indicators of Financial Health | 14 |
| Auditor's Report | 21 |
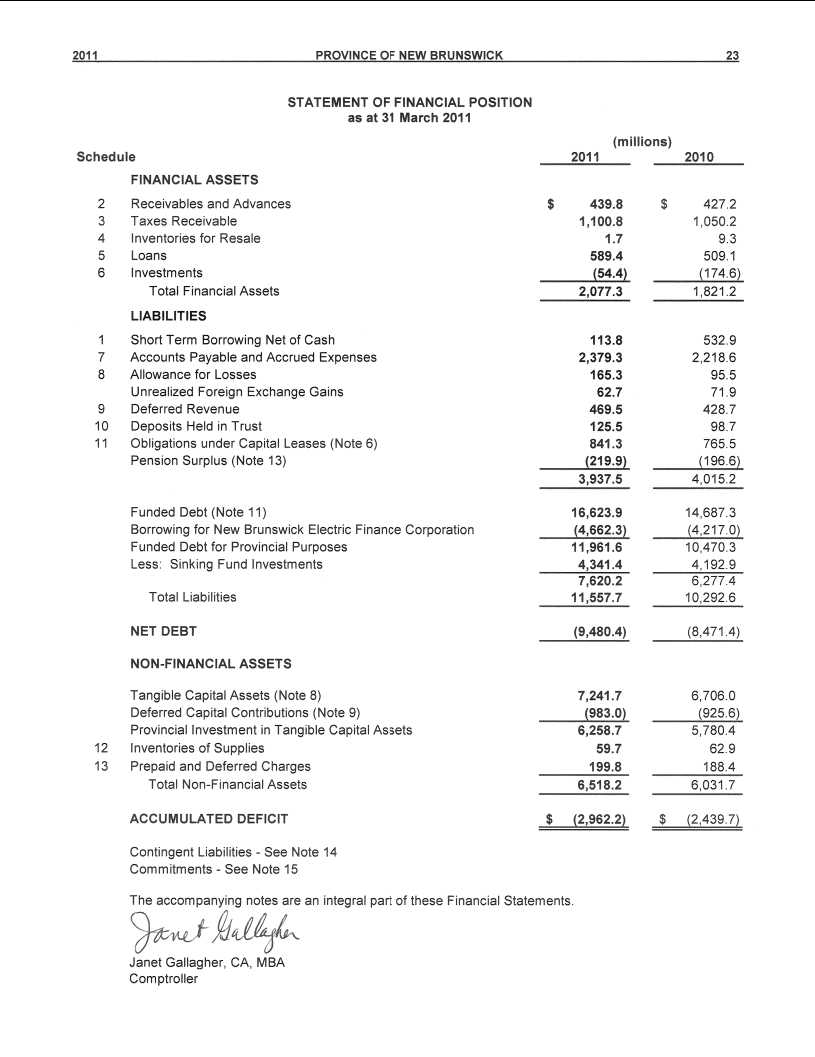
| Statement of Financial Position | 23 |
| Statement of Operations | 24 |
| Statement of Cash Flow | 25 |
| Statement of Change in Net Debt | 26 |
| Statement of Change in Accumulated Deficit | 26 |
| Notes to the Financial Statements | 27 |
| Schedules to the Financial Statements | 63 |
| 2011 | PROVINCE OF NEW BRUNSWICK |
1 |
INTRODUCTION
VOLUME I
The Public Accounts of the Province of New Brunswick are presented in two volumes.
This volume contains the audited financial statements of the Provincial Reporting Entity
as described in note 1 to the financial statements.
They include a Statement of
Financial Position, a Statement of Operations, a Statement of Cash Flow, a Statement of Change in Net Debt and a Statement of Change in Accumulated Deficit. This volume also contains the Auditor’s Report, Statement of Responsibility, management’s comments on the results of the year, major variance analysis and a discussion of the Indicators of Financial Health of the Province.
Volume II contains unaudited supplementary information to the Financial Statements presented in Volume I. It presents summary statements for revenue and expenditure as well as five-year comparative statements. This volume also contains detailed information on Supplementary Appropriations, Funded Debt, statements of the General Sinking Fund and revenue and expenditure by government department.
In addition, the Government includes the following lists on the Office of the Comptroller web site at http://www.gnb.ca/0087 :
- Salary information of government employees and employees of certain government organizations in excess of $60,000. Salary information is for the calendar year and is reported under the department where the employee worked at 31 December;
- Travel and other employee expenses in excess of $12,000 paid during the year to government employees, separated by department;
- Payments made to suppliers during the year in excess of $25,000 separated by department as well as a global listing including payments made by all departments;
- Loans disbursed to recipients during the year in excess of $25,000 separated by department.
| 2011 | PROVINCE OF NEW BRUNSWICK |
3 | RESULTS FOR THE YEAR
General Comments
The Province's summary financial statements, contained in this volume of Public Accounts, report a deficit for the fiscal year ended 31 March 2011 of $633.0 million. This represents a decrease of $115.8 million from the budgeted deficit of $748.8 million. The difference is the result of higher than budgeted revenues of $178.8 million, offset by higher than budgeted expenses of $63.0 million.
Revenues were higher than budget primarily due to an increase of $212.6 million reflecting a broad-based improvement in the province’s taxation revenue during the year. A strengthened economy, positive prior-year adjustments from the federal government and increased consumption tax revenue and resource-based revenue contributed to the improvement.
Expenses were higher than budget due in part to costs associated with the December 2010 flood and storm surges, as well as higher than budgeted costs in delivering health and social programs. These increases were partially offset by lower costs due in part to the in-year spending restraint initiative by government, as well as lower costs under Economic Development due to various projects not proceeding as planned.
There are several other variances discussed in more detail in the major variance section that follows.
Summary Financial Information
| (millions) | | | | |
| Statement of Financial Position | | | | |
| | | | | 2011 | | | 2010 | |
| Financial Assets | | $ | | 2,077.3 | | $ | 1,821.2 | |
| Liabilities | | | | (11,557.7) | | | (10,292.6) | |
| Net Debt | | | | (9,480.4) | | | (8,471.4) | |
| Tangible Capital Assets net of | | | | | | | | |
| Deferred Contributions | | | | 6,258.7 | | | 5,780.4 | |
| Other Non Financial Assets | | | | 259.5 | | | 251.3 | |
| Total Non Financial Assets | | | | 6,518.2 | | | 6,031.7 | |
| Accumulated Deficit | $ | (2,962.2) | | $ | (2,439.7) | |
| |
| Statement of Operations | | | | |
| | | | | 2011 | | | 2010 | |
| Revenue – Provincial Own | | $ | | 4,577.4 | | $ | 4,146.9 | |
| Revenue – Federal Sources | | | | 2,919.3 | | | 2,901.0 | |
| Total Revenue | | | | 7,496.7 | | | 7,047.9 | |
| Expenses | | | | 8,129.7 | | | 7,770.2 | |
| Surplus / (Deficit) | | $ | | (633.0) | | $ | (722.3) | |
| |
| Statement of Change in Net Debt | | | | |
| | | | | 2011 | | | 2010 | |
| Opening Net Debt | $ | (8,471.4) | | $ | (7,387.8) | |
| (Increase) Decrease in Net Debt | | | | | | | | |
| From Operations | | | | (1,009.0) | | | (970.0) | |
| Accounting change | | | - | -- | | | (113.6) | |
| Total Change in Net Debt | | | | (1,009.0) | | | (1,083.6) | |
| Ending Net Debt | $ | (9,480.4) | | $ | (8,471.4) | |
| 4 | PROVINCE OF NEW BRUNSWICK |
2011 | Revenue
Revenues of the Province for the past eight years, as restated, are shown in the table below.
| | | | | | | | | | | | | | | | |
(millions) |
| | | 2004 | | 2005 | | 2006 | | 2007 | | 2008 | | 2009 | | 2010 | | 2011 |
| Provincial | $ | 3,569.1 | $ | 3,664.2 | $ | 3,970.0 | $ | 4,201.7 | $ | 4,444.1 | $ | 4,439.4 | $ | 4,146.9 | $ | 4,577.4 |
| Federal Sources | $ | 1,917.9 | $ | 2,354.8 | $ | 2,392.9 | $ | 2,487.4 | $ | 2,577.7 | $ | 2,726.7 | $ | 2,901.0 | $ | 2,919.3 |
| Total Revenue | $ | 5,487.0 | $ | 6,019.0 | $ | 6,362.9 | $ | 6,689.1 | $ | 7,021.8 | $ | 7,166.1 | $ | 7,047.9 | $ | 7,496.7 |
Average annual revenue growth over the eight-year period is 4.6%. This exceeds the historical average revenue growth rate of 3.5% over the past 20 years. In 2010 revenues contracted due to the slowdown of the economy, tax reductions and a significant net loss for the New Brunswick Electric Finance Corporation (NBEFC). In 2011, revenue grew by 6.4% as NBEFC returned to a net profit and revenue from taxation rebounded.
Expense
Expenses of the Province for the past eight years, as restated, are shown in the table below.
| | | | | | | | | | | | | | | | |
(millions) |
| | | 2004 | | 2005 | | 2006 | | 2007 | | 2008 | | 2009 | | 2010 | | 2011 |
| Total Expense | $ | 5,669.0 | $ | 5,783.7 | $ | 6,121.8 | $ | 6,442.6 | $ | 6,909.7 | $ | 7,342.0 | $ | 7,770.2 | $ | 8,129.7 |
Average annual expense growth over the eight-year period is 5.3%. An increase in the demand for services contributed to expense growth during the period. The Province also experienced cost increases for various goods and services, including wages, prescription drugs, materials and supplies. During this period additional federal funding, including a number of one-time funds and trusts, enabled the Province to make additional investments in affordable housing, municipal infrastructure and various other initiatives.
In 2011, expenses increased by $359.5 million year-over-year, a 4.6% increase. The increase in expenses over 2010 includes additional investments made in health and social programs, costs associated with the December 2010 flood and storm surges, and increased debt servicing costs. These increased costs were partially offset by decreased spending in other areas, particularly Economic Development.
Surplus / (Deficit)
Surpluses (or Deficits) of the Province for the past eight years, as restated, are shown in the table below.
| | | | | | | | | | | | | | | | | | | |
(millions) |
| | | 2004 | | | 2005 | | 2006 | | 2007 | | 2008 | | 2009 | | | 2010 | | | 2011 |
| Surplus/(Deficit) | $ | (182.0 | ) | $ | 235.3 | $ | 241.1 | $ | 246.5 | $ | 112.1 | $ | (175.9) | | $ | (722.3) | | $ | (633.0) |
The deficit for the year ended 31 March 2011 was $633.0 million. The deficit in 2011 was lower than the budgeted deficit of $748.8 million. Improved revenues related to a strengthened economy, positive prior-year adjustments from the federal government and increased consumption tax revenue and resource-based revenue offset spending increases from budget.
| 2011 | PROVINCE OF NEW BRUNSWICK |
5 | Net Debt
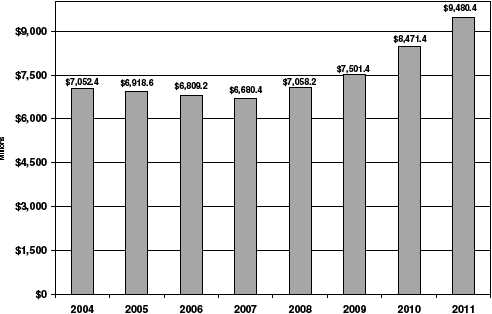
Net debt increased by $1.0 billion during the year ended 31 March 2011. Higher-than-normal investment in capital, tax reductions and continued cost pressures on health and social programs combined with the lingering effects of the economic slowdown contributed to the increase in net debt. The following graph illustrates the net debt position as restated at the end of each of the past eight years.
Net Debt
| | | | | | | | | | | | | | | | |
(millions) |
| | | 2004 | | 2005 | | 2006 | | 2007 | | 2008 | | 2009 | | 2010 | | 2011 |
| Net Debt | $ | 7,052.4 | $ | 6,918.6 | $ | 6,809.2 | $ | 6,680.4 | $ | 7,058.2 | $ | 7,501.4 | $ | 8,471.4 | $ | 9,480.4 |
The increase in net debt over this eight year period has been $2,428.0 million.
Cost of Servicing the Public Debt
The Province’s cost of servicing the Public Debt totaled $642.6 million for the year ended 31 March 2011. This marks an increase of $26.0 million from the 2010 cost. The higher cost results from increased borrowing, which was partially offset by the appreciation of the Canadian dollar.
| 6 | PROVINCE OF NEW BRUNSWICK |
2011 | 
(millions) |
| | | 2004 | | 2005 | | 2006 | | 2007 | | 2008 | | 2009 | | 2010 | | 2011 |
| Cost of Servicing the Public Debt | $ | 582.9 | $ | 580.9 | $ | 591.4 | $ | 559.4 | $ | 576.9 | $ | 602.5 | $ | 616.6 | $ | 642.6 |
| | | | | | | | | | | | | | | | |
Results According to the Fiscal Responsibility and Balanced Budget Act
The Act’s stated objective is for balanced budgets over designated fiscal periods. The current fiscal period commenced 1 April 2007 and ended 31 March 2011. During the year, the government incurred a $770.6 million deficit for Balanced Budget purposes for a cumulative deficit for the fiscal period of $1,693.4 million. In the 2010 and 2011 Budgets, government indicated that given the global economic and financial climate, the objectives of the Act would not be met. The current government will introduce new legislation for balanced budgets during its mandate.
Surplus / (Deficit) According to Fiscal Responsibility and Balanced Budget Act
| | | | | | | | | | | | | | |
| | | | | (millions) | | | | | | | | | | |
| | | 2008 | | 2009 | | | 2010 | | | 2011 | | | Cumulative | |
| Surplus/(Deficit)- FRBBA | $ | 86.7 | $ | (192.3 | ) | $ | (817.2 | ) | $ | (770.6 | ) | $ | (1,693.4 | ) |
| 2011 | PROVINCE OF NEW BRUNSWICK |
7 | MAJOR VARIANCE ANALYSIS
Explanations of major variances are described below, first for revenue, followed by expenses. In this analysis, comparisons are made between the actual results for 2011 and either the 2011 budget or actual results for 2010.
REVENUE
Budget 2011 to Actual 2011 Comparison
| 2011 Budget to Actual |
| ($ millions) |
| Item | Budget | Actual | Variance | % Variance |
| Provincial Sources | | | | |
| Taxes | 3,192.3 | 3,404.9 | 212.6 | 6.7 |
| Licenses and Permits | 127.6 | 134.4 | 6.8 | 5.4 |
| Royalties | 83.6 | 87.5 | 3.9 | 4.6 |
| Investment Income | 214.1 | 218.5 | 4.4 | 2.1 |
| Other Provincial Revenue | 501.7 | 508.6 | 6.9 | 1.4 |
| Sinking Fund Earnings | 229.3 | 223.5 | (5.8) | (2.5) |
| Total Provincial Revenues | 4,348.6 | 4,577.4 | 228.8 | 5.3 |
| Federal Sources | | | | |
| Fiscal Equalization | 1,661.0 | 1,661.8 | 0.8 | 0.0 |
| Unconditional Grants | 843.9 | 833.5 | (10.4) | (1.2) |
| Conditional Grants | 464.4 | 424.0 | (40.4) | (8.7) |
| Total Federal Revenues | 2,969.3 | 2,919.3 | (50.0) | (1.7) |
| Total Revenues | 7,317.9 | 7,496.7 | 178.8 | 2.4 |
Taxes
Taxes are up $212.6 million over budget, primarily due to:
- Corporate Income Tax is up $70.3 million primarily due to an underpayment in respect of the 2009 taxation year and the strengthened economy;
- Harmonized Sales Tax is up $42.9 million mainly as a result of higher-than-anticipated in-year payments due to the strengthened economy and positive prior-year adjustments;
- The Tobacco Tax increased by $25.0 million due to a one-time tax settlement and higher sales;
- Personal Income Tax is up $22.0 million largely due to an underpayment for the 2009 taxation year;
- Metallic Minerals Tax is up $18.2 million due to higher world zinc prices and delayed mine closure;
- Financial Corporation Capital Tax is up $9.9 million due to increased capital for major banks;
- Gasoline and Motive Fuels Tax is up $8.0 million due to higher gasoline sales;
- Large Corporation Capital Tax is up $7.2 million due to revenue received for prior year adjustments.
Unconditional Grants
Unconditional Grants are down $10.4 million from budget due to revised federal estimates for the Canada Health Transfer.
Conditional Grants
Conditional Grants are down $40.4 million from budget mainly due to less than anticipated economic projects submitted for federal funding. This was partially offset by unplanned federal funding for disaster assistance for provincial flooding.
| 8 | PROVINCE OF NEW BRUNSWICK |
2011 |
Actual 2010 to Actual 2011 Comparison
| 2010 Actual to 2011 Actual |
| ($ millions) |
| Item | 2010 | 2011 | | % |
| | Actual | Actual | Change | Change |
| Provincial Sources |
| Taxes | 3,263.7 | 3,404.9 | 141.2 | 4.3 |
| Licenses and Permits | 129.0 | 134.4 | 5.4 | 4.2 |
| Royalties | 62.3 | 87.5 | 25.2 | 40.5 |
| Investment Income | (9.2) | 218.5 | 227.7 | 2,483.5 |
| Other Provincial Revenue | 484.7 | 508.6 | 23.9 | 4.9 |
| Sinking Fund Earnings | 216.4 | 223.5 | 7.1 | 3.3 |
| Total Provincial Revenues | 4,146.9 | 4,577.4 | 430.5 | 10.4 |
| Federal Sources |
| Fiscal Equalization Payments | 1,689.4 | 1,661.8 | (27.6) | (1.6) |
| Unconditional Grants | 803.4 | 833.5 | 30.1 | 3.7 |
| Conditional Grants | 408.2 | 424.0 | 15.8 | 3.9 |
| Total Federal Revenues | 2,901.0 | 2,919.3 | 18.3 | 0.6 |
| Total Revenues | 7,047.9 | 7,496.7 | 448.8 | 6.4 |
| |
Taxes:
Taxes are up $141.2 million over the previous year, mainly due to:
- Harmonized Sales Tax is up $120.8 million mainly due to the strengthened economy;
- Corporate Income Tax is up $57.3 million due to the strengthened economy and prior-year adjustments;
- Tobacco Tax is up $19.1 million due to a one-time tax settlement and higher sales;
- Provincial Real Property Tax is up $14.9 million due to growth in assessment base and the end of the High Energy Tax Rebate and Forestry Industry Investment Tax Credit in 2010;
- Gasoline and Motive Fuels Tax is up $10.9 million due to higher gasoline sales;
- Personal Income Tax is down $81.4 million mostly due to tax changes and prior-year adjustments.
Royalties
Revenue for royalties is up $25.2 million from the previous fiscal year. This is mainly due to forest royalties up $17.6 million due to higher harvest levels and royalties from mines up $7.6 million due to an increase in potash production.
Investment Income
Investment Income is up $227.7 million from 2010 which is mainly attributable to the NBEFC. NBEFC recorded a loss in 2010 of $212.2 million due primarily to NB Power’s write-down of the Dalhousie Generating Station. NBEFC reported a positive net income of $10.8 million in 2011.
Other Provincial Revenue
Other provincial revenue is up $23.9 million from 2010. This revenue source reflects a significant number of revenue accounts across government departments and agencies. Major revenue increases include lottery and gaming revenue up $6.5 million, recovery levy up $2.3 million in the Department of Health and revenue for school district projects up $2.5 million in the Department of Education.
Fiscal Equalization Payments
Fiscal Equalization Payments are down $27.6 million due to a narrowing of fiscal disparities between New Brunswick and the national average.
2011 | PROVINCE OF NEW BRUNSWICK |
9 |
Unconditional Grants
Unconditional grants are up $30.1 million mainly due to the legislated growth in the federal cash funding for the Canada Health Transfer and the Canadian Social Transfer.
Conditional Grants
Conditional Grants are up $15.8 million from the previous year mainly due to federal funding of $22.7 million received for disaster assistance for provincial flooding.
EXPENSES
Budget 2011 to Actual 2011 Comparison
| 2011 Budget to Actual |
| ($ millions) |
| Item | Budget | Actual | Variance | % Variance |
| Education and Training | 1,656.8 | 1,655.1 | (1.7) | (0.1) |
| Health | 2,661.1 | 2,687.2 | 26.1 | 1.0 |
| Social Development | 1,048.3 | 1,080.8 | 32.5 | 3.1 |
| Protection Services | 204.2 | 250.6 | 46.4 | 22.7 |
| Economic Development | 387.7 | 328.4 | (59.3) | (15.3) |
| Labour and Employment | 148.7 | 141.7 | (7.0) | (4.7) |
| Resources | 212.2 | 215.1 | 2.9 | 1.4 |
| Transportation | 397.2 | 402.7 | 5.5 | 1.4 |
| Central Government | 716.1 | 725.5 | 9.4 | 1.3 |
| Service of the Public Debt | 634.4 | 642.6 | 8.2 | 1.3 |
| Total Expenses | 8,066.7 | 8,129.7 | 63.0 | 0.8 |
Items in the table are reported by functional area. See the related schedule in the financial statements for additional details.
Education and Training
Education and Training expenses were $1.7 million lower than budget mainly due to the following:
- A decrease in expenses by and on behalf of the school districts as a result of in-year spending restraint;
- A decrease in expenses under the Student Financial Assistance Program of the Department of Post-Secondary Education, Training and Labour due to lower than budgeted interest costs and lower take-up in student debt reduction programs.
These decreases were partially offset by increases related to pension expense and capital spending.
Health
Health expenses were $26.1 million higher than budget mainly due to the following:
- Additional expenditures under the Medicare program due to the recruitment of additional physicians, growth, and unfunded prior year pressures;
- Higher than expected growth within the Prescription Drug Program.
Social Development
Social Development expenses were $32.5 million higher than budget mainly due to the following:
- Increased expenses in the Income Security Program as a result of an increase in the social assistance caseload and the re-introduction of theHome Energy Assistance Program;
- Increased expenses in the Long Term Care Program as a result of increased costs for in-home, residential and nursing home services.
| 10 | PROVINCE OF NEW BRUNSWICK |
2011 |
Protection Services
Protection Services expenses were $46.4 million higher than budget mainly due to the following:
- Increased expenses under the Department of Public Safety’s Disaster Financial Assistance program as a result of costs associated with the December 2010 flood and storm surges;
- Increased expenses in the Court Services Program of the Department of Justice and Consumer Affairs mainly due to enhanced access to family justice programming;
- An increase in provision for losses expense.
Economic Development
Economic Development expenses were $59.3 million lower than budget mainly due to the following:
- Decreased expenses under Business New Brunswick’s Strategic Assistance Program due to a number of projects not proceeding in the 2011 fiscal year as planned;
- Decreased expenses in the Regional Development Corporation due to the deferral of a number of projects under the federal government’s Building Canada Fund. These decreases were partially offset by increased expenses in the Development Projects and Operations Program related to a number of additional projects.
Labour and Employment
Labour and Employment expenses were $7.0 million lower than budget mainly due to a decrease in expenses under the Labour Market Development Agreement and the Labour Market Agreement to offset a decrease in anticipated federal funding and less than anticipated expenses in various Employment Development programs.
Resources
Resources expenses were $2.9 million higher than budget mainly due to the following:
- Increased expenses in the Energy Efficiency and Conservation Agency of New Brunswick due to increased participation in the Agency’s program offerings, with the majority of the increase being in the Residential energy efficiency upgrades program;
- Increased expenses in the Department of Agriculture and Aquaculture primarily due to additional federal funding received under federal-provincial-territorial agriculture programs.
These increases were partially offset by the following:
- A decrease in the Department of Fisheries’ Strategic Assistance Program due to no concessionary loans being approved;
- A decrease in provision for losses expense.
Transportation
Transportation expenses were $5.5 million higher than budget mainly due to the following:
- An increase in the Winter Maintenance Program costs as a result of the length and severity of the winter;
- Costs associated with the acquisition of the Saint John Harbour Bridge;
- An increase in amortization expense.
These increases were partially offset by a decrease in expenses under the New Brunswick Highway Corporation due to the recognition of rehabilitation payments under public-private partnerships as investments in tangible capital assets.
Central Government
Central Government expenses were $9.4 million higher than budget mainly due to an increase in the provision for losses expense. This increase was partially offset by decreased expenses in a number of other areas.
2011 | PROVINCE OF NEW BRUNSWICK |
11 |
Service of the Public Debt
Service of the Public Debt expenses were $8.2 million higher than budget due to higher interest expense resulting from the timing of borrowing. This was partially offset by a strengthening Canadian dollar and other factors.
Actual 2010 to Actual 2011 Comparison
| | | | |
2010 Actual to 2011 Actual |
| ($ millions) |
| Item | 2010 Actual | 2011 Actual | Change | % Change |
| Education and Training | 1,621.7 | 1,655.1 | 33.4 | 2.1 |
| Health | 2,587.9 | 2,687.2 | 99.3 | 3.8 |
| Social Development | 984.4 | 1,080.8 | 96.4 | 9.8 |
| Protection Services | 209.5 | 250.6 | 41.1 | 19.6 |
| Economic Development | 343.7 | 328.4 | (15.3) | (4.4) |
| Labour and Employment | 141.5 | 141.7 | 0.2 | 0.1 |
| Resources | 205.8 | 215.1 | 9.3 | 4.5 |
| Transportation | 381.4 | 402.7 | 21.3 | 5.6 |
| Central Government | 677.7 | 725.5 | 47.8 | 7.1 |
| Service of the Public Debt | 616.6 | 642.6 | 26.0 | 4.2 |
| Total Expenses | 7,770.2 | 8,129.7 | 359.5 | 4.6 |
Items in the table are reported by functional area.
statements for additional details.
See the related schedule in the financial
Education and Training
Education and Training expenses were $33.4 million higher than the previous year mainly due to the following:
- Increased expenses due to additional investments and salaries in K-12 education;
- Increased expenses under the Department of Post-Secondary Education, Training and Labour’s Post-Secondary Affairs Program due to a provincial contribution to the Official Languages in Education agreement as it related to postsecondary education;
- Increased expenses under the Student Financial Assistance Program of the Department of Post- Secondary Education, Training and Labour due to higher interest costs.
These increases were partially offset by the following:
- A decrease in the provision for losses expense;
- A decrease in pension expense due to improved investment returns;
- A decrease in the University Deferred Maintenance Program under the Maritime Provinces Higher Education Commission.
Health
Health expenses were $99.3 million higher than the previous year mainly due to the following:
- Increased expenses under the Medicare program due to the recruitment of additional physicians, growth and increased wages;
- Increased expenses under the Prescription Drug Program due to an increase in the number of prescriptions by beneficiaries;
- Increased expenses in the Regional Health Authorities associated with wages, energy costs, medical supplies and drugs
12 | PROVINCE OF NEW BRUNSWICK |
2011 |
Social Development
Social Development expenses were $96.4 million higher than the previous year mainly due to the following:
- Increased expenses under Nursing Home Services mainly due to increased per diems related to collective agreement settlements reached with a number of bargaining groups;
- Increased expenses under Long Term Care due to additional funding provided to home support workers, disability support recipients and adult residential facilities;
- Increased expenses in the Income Security Program mainly due to an increase in the social assistance caseload and additional costs associated with the elimination of the Interim Assistance Rate in January 2010;
- Increased expenses under Housing Services due to the delivery of the Economic Stimulus and Affordable Housing Initiative Extension.
Protection Services
Protection Services expenses were $41.1 million higher than the previous year mainly due to the following:
- Increased expenses under the Department of Public Safety’s Disaster Financial Assistance program as a result of costs associated with the December 2010 flood and storm surges;
- An increase in provision for losses expense.
These increases were partially offset by a decrease in expenses in the Department of Justice and Consumer Affairs primarily due to additional salary payments made to Provincial Court judges in 2010 following a Court of Appeal decision.
Economic Development
Economic Development expenses were $15.3 million lower than the previous year mainly due to a decrease in provision for losses expense. This decrease was partially offset by an increase in expenses in the Regional Development Corporation’s Development Projects and Operations Program related to a number of additional projects in 2011.
Resources
Resources expenses were $9.3 million higher than the previous year mainly due to the following:
- Increased expenses in the Energy Efficiency and Conservation Agency of New Brunswick due to increased participation in the Agency’s program offerings with the majority of the increase being in the Residential energy efficiency upgrades program;
- Increased expenses in the Department of Agriculture and Aquaculture primarily due to additional federal funding received under federal-provincial-territorial agriculture programs.
These increases were partially offset by a decrease in provision for losses expense.
Transportation
Transportation expenses were $21.3 million higher than the previous year mainly due to the following:
- Increased expenses under the Winter Maintenance Program as a result of the length and severity of the winter;
- Costs associated with the acquisition of the Saint John Harbour Bridge;
- An increase in amortization expense.
Central Government
Central Government expenses were $47.8 million higher than the previous year mainly due to the following:
- Costs associated with the establishment of the New Brunswick Internal Services Agency; most of these costs represent salaries for employees who were transferred from other departments;
- An increase in the provision for losses expense;
- Increased expenses by the Legislative Assembly mainly due to the 2010 Provincial Election.
These expenses were partially offset by a decrease in pension expense due to improved investment returns.
2011 | PROVINCE OF NEW BRUNSWICK |
13 |
Service of the Public Debt
Service of the Public Debt expenses were $26.0 million higher than the previous fiscal year due to higher interest expense resulting from increased borrowings which were partially offset by the strengthening Canadian dollar.
14 | PROVINCE OF NEW BRUNSWICK |
2011 |
INDICATORS OF FINANCIAL HEALTH
This section provides indicators of progress in the province’s financial condition and follows Canadian Institute of Chartered Accountants (CICA) guidelines, using information provided in the province’s financial statements as well as other standard socio-economic indicators such as nominal Gross Domestic Product (GDP) data from Statistics Canada.
The analysis provides results in a manner that improves transparency and provides a clearer understanding of recent trends in the province’s financial health. Trends over the last eight years (2004 to 2011) are evaluated using sustainability, flexibility and vulnerability criteria established by the CICA and used by the Auditor General of New Brunswick. Though many potential indicators are available, those found to be the most relevant, measurable and transparent to users of government financial information are included. Similar data series are also widely used by banks and other financial institutions, investors and credit-rating agencies.
The Fiscal Responsibility and Balanced Budget Act also contains measures to enhance fiscal transparency and accountability. The Act’s stated objective is for balanced budgets over designated fiscal periods and a decrease in the net debt-to-GDP ratio over successive fiscal periods. In the 2010 and 2011 Budgets, the government indicated that given the global economic and financial climate, objectives of the Act for the four-year period (2008 to 2011) would not be met. The 2012 budget reiterated this by stating that returning the province to balanced budgets will be a multi-year process. A number of provinces suspended or amended their balanced budget and debt reduction legislation as a result of the global economic slowdown. The current government will introduce new legislation for balanced budgets during its mandate.
In evaluating a government’s financial health, it should be acknowledged that governments have exposure to a number of variables that are beyond their direct scope of control, but still can exert major influences on financial results and indicators. These include but are not limited to:
- Changing global economic conditions such as energy prices, commodity prices, investment valuation and inflation;
- Changes to international financial conditions that impact interest rates, currency fluctuations or availability of credit;
- Changes to federal transfers or programs;
- Emergencies such as floods, forest fires and pandemics;
- Developments affecting agencies such as NB Power that are reflected on the province’s books and;
- Changes in generally accepted accounting principles.
Sustainability
Sustainability is defined by CICA as the degree to which a government can maintain its existing financial obligations both in respect of its service commitments to the public and financial commitments to creditors, employees and others without increasing the debt or tax burden relative to the economy within which it operates. It is measured in this analysis by:
- Net debt as a proportion of GDP;
- Net debt per capita.
Net Debt as a Proportion of GDP:
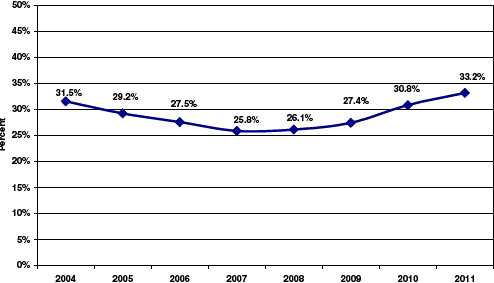
Net debt is an indication of the extent to which provincial government liabilities exceed financial assets. The net debt-to-GDP ratio shows the relationship between net debt and the economy. If the ratio is declining, growth in the economy is exceeding growth in net debt, resulting in improved sustainability. Conversely, an increasing net debt-to-GDP ratio indicates net debt is increasing faster than growth in the economy and serving to reduce the provincial government’s financial sustainability.
Over the last eight years the province’s ratio of net debt-to-GDP increased from 31.5% to 33.2%. The following graph reports a steady improvement (reduction) in the net debt-to-GDP ratio from 2004 to 2007, with modest increases in the ratio in 2008 and 2009 related to the costs for the completion of the Trans-Canada Highway and the onset of the economic slowdown. In 2010 and 2011, the ratio increased due to higher-than-normal investment in capital, tax reductions and continued cost pressures for health and social programs combined with the effects of the economic slowdown.
2011 | PROVINCE OF NEW BRUNSWICK |
15 |
For purposes of the Fiscal Responsibility and Balanced Budget Act, an improvement in the net debt-to-GDP ratio over successive fiscal periods is targeted. This means the net debt-to-GDP ratio for the year ended 31 March 2011 must be lower than the year ended 31 March 2007. This objective of the act was not met. In the 2010 and 2011 Budgets, the government indicated that given the global economic and financial climate, the objectives of the Act would not be met. A number of provinces suspended or amended their balanced budget and debt reduction legislation as a result of the global economic slowdown.
Net Debt-to-GDP Ratio
| | | |
Net Debt-to-GDP Ratio |
| Fiscal Year Ending | Net Debt | GDP | Net Debt/GDP |
| | ($ millions) | ($ millions) | (%) |
| 2004 | 7,052.4 | 22,366 | 31.5% |
| 2005 | 6,918.6 | 23,672 | 29.2% |
| 2006 | 6,809.2 | 24,716 | 27.5% |
| 2007 | 6,680.4 | 25,847 | 25.8% |
| 2008 | 7,058.2 | 27,044 | 26.1% |
| 2009 | 7,501.4 | 27,376 | 27.4% |
| 2010 | 8,471.4 | 27,497 | 30.8% |
| 2011 | 9,480.4 | 28,597 | 33.2% |
Net Debt per Capita:
Net debt per capita is a statement of the net debt attributable to each New Brunswick resident. The level of net debt per capita had been trending upwards in recent years due to the completion of the Trans-Canada Highway and the impact of the economic slowdown. For 2010 and 2011, the ratio increased due to higher-than-normal investment in capital, tax reductions and continued cost pressures for social programs combined with the effects of the economic slowdown.
16 | PROVINCE OF NEW BRUNSWICK |
2011 | Net Debt per Capita

| | | |
| Net Debt per Capita |
| Fiscal Year Ending | Net Debt | Population | Net Debt per Capita |
| | ($ millions) | (July 1) | ($) |
| 2004 | 7,052.4 | 749,369 | 9,411.2 |
| 2005 | 6,918.6 | 747,960 | 9,250.1 |
| 2006 | 6,809.2 | 745,674 | 9,131.6 |
| 2007 | 6,680.4 | 745,515 | 8,960.9 |
| 2008 | 7,058.2 | 746,902 | 9,450.0 |
| 2009 | 7,501.4 | 749,324 | 10,010.9 |
| 2010 | 8,471.4 | 751,755 | 11,268.9 |
| 2011 | 9,480.4 | 753,998 | 12,573.5 |
Flexibility
Flexibility is defined by CICA as the degree to which a government can change its debt or tax burden on the economy within which it operates to meet its existing financial obligations both in respect of its service commitments to the public and financial commitments to creditors, employees and others. It is measured in this analysis by:
- Own-source revenue as a proportion of GDP;
- Cost of servicing the public debt as a proportion of total revenue.
Own-source Revenue as a Proportion of GDP:
This ratio measures own-source revenues of the provincial government as a percentage of the economy, as measured by nominal GDP. An increase in this ratio indicates that government own-source revenues are growing faster than the economy as a whole, reducing government’s flexibility to increase revenues without slowing growth in the economy. A decrease in the ratio is indicative of the government taking less revenue out of the economy on a relative basis, which increases its flexibility.
2011 | PROVINCE OF NEW BRUNSWICK |
17 |
Own-source revenue includes revenues from taxation, natural resources, fees, return on investment, lotteries, fines and penalties, etc., and is essentially all revenue minus federal transfers. While more controllable than federal transfers, as the province can influence revenues through its own tax rates and fiscal policy, own-source revenue is vulnerable to, among other factors:
- Net income or revenue of outside agencies that affect the province’s books (e.g. NB Power);
- Variability in provincial revenues that are collected or estimated by the federal government such as personal and corporate income taxes and the Harmonized Sales Tax;
- Commodity tax revenues such as Metallic Minerals Tax that are vulnerable to world prices.
Own-source revenue as a proportion of GDP was relatively stable over the eight year period 2004 to 2011 with the exception of a decrease in 2010 to 15.1%. This decrease was attributable to the economic slowdown, lowered taxes and the significant net loss for the New Brunswick Electric Finance Corporation (NBEFC). In 2011, with strengthened tax revenues and a return to positive net income for NBEFC, the ratio returned to its normal level.
Own-source Revenue as a Proportion of GDP

18 | PROVINCE OF NEW BRUNSWICK |
2011 |
Own-source Revenue as a Proportion of GDP |
| Fiscal Year Ending | Own-source
Revenue | GDP | Own-source Revenue |
| | | | as a Proportion of GDP |
| | ($ millions) | ($ millions) | (%) |
| 2004 | 3,569.1 | 22,366 | 16.0% |
| 2005 | 3,664.2 | 23,672 | 15.5% |
| 2006 | 3,970.0 | 24,716 | 16.1% |
| 2007 | 4,201.7 | 25,847 | 16.3% |
| 2008 | 4,444.1 | 27,044 | 16.4% |
| 2009 | 4,439.4 | 27,376 | 16.2% |
| 2010 | 4,146.9 | 27,497 | 15.1% |
| 2011 | 4,577.4 | 28,597 | 16.0% |
Cost of Servicing the Public Debt as a Proportion of Total Revenue:
Debt service costs as a proportion of total revenue is an indicator of the province’s ability to satisfy existing credit requirements in the context of the government’s overall revenue. Debt service costs can be impacted by variables outside the direct control of government, such as credit ratings, interest rates, financial markets and currency fluctuations. Investment in public infrastructure resulting in a change in the stock of debt can also influence borrowing requirements.
The province’s proportion of debt service costs to revenue declined steadily over the 2004 to 2008 period, lowering the overall financial burden on the provincial budget. A decrease in this ratio indicates that debt service costs are a smaller proportion of provincial revenues overall, allowing the province more financial resources to provide essential programs and services or reduce taxes. In the last three years the ratio has increased modestly, reflecting in part, increased borrowing related to the higher-than-normal investment in capital, tax reductions, and continued cost pressures for health and social programs combined with the effects of the economic slowdown. This is still well below the 10.6% ratio for 2004.
Cost of Servicing the Public Debt as a Proportion of Total Revenue

2011 | PROVINCE OF NEW BRUNSWICK |
19 |
Cost of Servicing the Public Debt as a Proportion of Total Revenue |
| Fiscal Year Ending | Cost of Servicing the
Public Debt | Total
Revenue | Cost of Servicing the
Public Debt as a
Proportion of Total
Revenue |
| | ($ millions) | ($ millions) | (%) |
| 2004 | 582.9 | 5,487.0 | 10.6% |
| 2005 | 580.9 | 6,019.0 | 9.7% |
| 2006 | 591.4 | 6,362.9 | 9.3% |
| 2007 | 559.4 | 6,689.1 | 8.4% |
| 2008 | 576.9 | 7,021.8 | 8.2% |
| 2009 | 602.5 | 7,166.1 | 8.4% |
| 2010 | 616.6 | 7,047.9 | 8.7% |
| 2011 | 642.6 | 7,496.7 | 8.6% |
Vulnerability
Vulnerability as defined by CICA is the degree to which a government is dependent on sources of funding outside its control or influence or is exposed to risks that could impair its ability to meet its existing financial obligations both in respect of its service commitments to the public and financial commitments to creditors, employees and others. A common measurement of vulnerability is federal government transfers as a proportion of revenue.
Federal Government Transfers as a Proportion of Total Revenue:
Revenue from federal sources is comprised of conditional and unconditional grants from the federal government, including:
- Fiscal Equalization Program payments;
- The Canada Health Transfer and the Canada Social Transfer;
- Conditional grants or capital revenue in support of economic development, infrastructure, education and labour training and other areas.
Federal transfer payments can be affected by both federal fiscal policy decisions, as well as the normal annual estimate process that guides federal payments under the Equalization Program and Canada Health and Social Transfers. Both of these factors can contribute to year-to-year changes in the level of transfers. In the past, adjustments related to prior-year estimates of Equalization and social program transfers have had a pronounced impact on this measurement year-to-year.
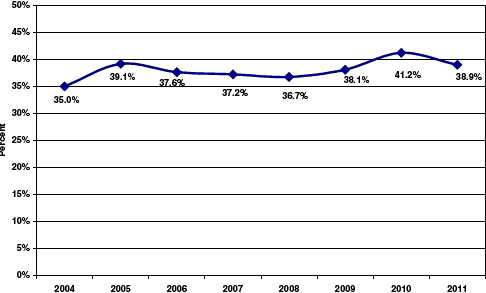
Comparing the level of federal transfers to total revenue provides an indication of the vulnerability of the province. Generally, if the ratio is increasing, the province is increasingly reliant on federal transfers, resulting in increased vulnerability. If the ratio is declining, vulnerability is diminished.
Federal government transfers as a proportion of total revenue declined annually over the period 2005 to 2008, increased in 2009 and 2010 and have declined again in 2011. In 2010, provincial-source revenues contracted as the effects of the economic slowdown hampered revenues and the NBEFC experienced a significant net loss. At the same time, federal stimulus funding supported federal-source revenue growth. In 2011, provincial-source revenue rebounded while federal-source revenue remained constant.
20 | PROVINCE OF NEW BRUNSWICK |
2011 |
Federal Government Transfers as a Proportion of Total Revenue
Federal Government Transfers as a Proportion of Total Revenue |
| Fiscal Year Ending | Federal
Government Transfers | Total
Revenue | Federal Government
Transfers as a
Proportion of Total
Revenue |
| | ($ millions) | ($ millions) | (%) |
| 2004 | 1,917.9 | 5,487.0 | 35.0% |
| 2005 | 2,354.8 | 6,019.0 | 39.1% |
| 2006 | 2,392.9 | 6,362.9 | 37.6% |
| 2007 | 2,487.4 | 6,689.1 | 37.2% |
| 2008 | 2,577.7 | 7,021.8 | 36.7% |
| 2009 | 2,726.7 | 7,166.1 | 38.1% |
| 2010 | 2,901.0 | 7,047.9 | 41.2% |
| 2011 | 2,919.3 | 7,496.7 | 38.9% |
24 | PROVINCE OF NEW BRUNSWICK |
2011 | STATEMENT OF OPERATIONS
for the fiscal year ended 31 March 2011
| | | | | | | | | | |
| | | | | | | (millions) | | | | |
| Schedule | | 2011 | | | 2011 | | | 2010 | |
| | | | Budget | | | Actual | | | Actual | |
| | REVENUE | | | | | | | | | |
| |
| | Provincial Sources | | | | | | | | | |
| 14 | Taxes | $ | 3,192.3 | | $ | 3,404.9 | | $ | 3,263.7 | |
| 15 | Licenses and Permits | | 127.6 | | | 134.4 | | | 129.0 | |
| 16 | Royalties | | 83.6 | | | 87.5 | | | 62.3 | |
| 17 | Investment Income | | 214.1 | | | 218.5 | | | (9.2 | ) |
| 18 | Other Provincial Revenue | | 501.7 | | | 508.6 | | | 484.7 | |
| | Sinking Fund Earnings | | 229.3 | | | 223.5 | | | 216.4 | |
| | | | 4,348.6 | | | 4,577.4 | | | 4,146.9 | |
| |
| | Federal Sources | | | | | | | | | |
| | Fiscal Equalization Payments | | 1,661.0 | | | 1,661.8 | | | 1,689.4 | |
| 19 | Unconditional Grants | | 843.9 | | | 833.5 | | | 803.4 | |
| 20 | Conditional Grants | | 464.4 | | | 424.0 | | | 408.2 | |
| | | | 2,969.3 | | | 2,919.3 | | | 2,901.0 | |
| | | | 7,317.9 | | | 7,496.7 | | | 7,047.9 | |
| |
| | EXPENSE | | | | | | | | | |
| |
| 21 | Education and Training | | 1,656.8 | | | 1,655.1 | | | 1,621.7 | |
| 22 | Health | | 2,661.1 | | | 2,687.2 | | | 2,587.9 | |
| 23 | Social Development | | 1,048.3 | | | 1,080.8 | | | 984.4 | |
| 24 | Protection Services | | 204.2 | | | 250.6 | | | 209.5 | |
| 25 | Economic Development | | 387.7 | | | 328.4 | | | 343.7 | |
| 26 | Labour and Employment | | 148.7 | | | 141.7 | | | 141.5 | |
| 27 | Resources | | 212.2 | | | 215.1 | | | 205.8 | |
| 28 | Transportation | | 397.2 | | | 402.7 | | | 381.4 | |
| 29 | Central Government | | 716.1 | | | 725.5 | | | 677.7 | |
| | Service of the Public Debt (Note 12) | | 634.4 | | | 642.6 | | | 616.6 | |
| | | | 8,066.7 | | | 8,129.7 | | | 7,770.2 | |
| |
| |
| | ANNUAL DEFICIT | $ | (748.8 | ) | $ | (633.0 | ) | $ | (722.3 | ) |
The accompanying notes are an integral part of these Financial Statements.
2011 | PROVINCE OF NEW BRUNSWICK |
25 | STATEMENT OF OPERATIONS
for the fiscal year ended 31 March 2011
| | | | (millions) |
| | | | 2011 | | | | 2010 |
| OPERATING ACTIVITIES | | | | | | | |
| | | | | | | |
| Deficit | | $ | (633.0) | | $ | | (722.3) |
| Non Cash Items | | | | | | | |
| Amortization of Premiums, Discounts and Issue Expenses | | 5.5 | | | | 5.7 |
| Foreign Exchange Expense | | | (25.1) | | | | (20.0) |
| Increase in Provision for Losses | | | 106.9 | | | | 92.7 |
| Amortization of Tangible Capital Assets | | 306.0 | | | | 293.7 |
| Loss on Disposal of Tangible Capital Assets | | 4.7 | | | | 0.5 |
| Asset Impairment | | | 3.7 | | | | -- |
| Amortization of Deferred Contributions | | (37.1) | | | | (35.0) |
| Sinking Fund Earnings | | | (223.5) | | | | (216.4) |
| Losses on Foreign Exchange Settlements | | 7.0 | | | | 4.9 |
| (Increase) Decrease in Pension Surplus (Note 13) | | (23.3) | | | | 13.6 |
| Increase in Deferred Revenue | | | 40.8 | | | | 31.1 |
| (Increase) Decrease in Working Capital | | 97.2 | | | | (100.5) |
| Net Cash From Operating Activities | | | (370.2) | | | | (652.0) |
| | | | | | | |
| INVESTING ACTIVITIES | | | | | | | |
| (Increase) Decrease in Investments, Loans and Advances | | (217.4) | | | | 117.8 |
| Non-Cash Adjustment - Other Comprehensive Income of | | | | | | |
| Government Business Enterprises | | | 110.5 | | | | 4.9 |
| Net Cash Used in Investing Activities | | (106.9) | | | | 122.7 |
| | | | | | | |
| CAPITAL TRANSACTIONS | | | | | | | |
| Acquisition of Capital Assets | | | (850.0) | | | | (570.7) |
| Revenue Received to Acquire Tangible Capital Assets | | 94.5 | | | | 103.1 |
| Net Cash Used in Capital Transactions | | (755.5) | | | | (467.6) |
| | | | | | | |
| | | | | | | |
| FINANCING ACTIVITIES | | | | | | | |
| Proceeds from Issuance of Funded Debt | | 2,660.2 | | | | 1,841.7 |
| Purchase of NBEFC Debentures | | | (694.1) | | | | (548.8) |
| Elimination of Debentures held by NB Immigrant Investor Fund | | (24.8) | | | | -- |
| Received from Sinking Fund for Redemption of Debentures and | | | | | | |
| Payment of Exchange | | | 231.0 | | | | 343.7 |
| Decrease in Obligations under Capital Leases | | 75.8 | | | | (20.4) |
| Sinking Fund Instalments | | | (156.0) | | | | (160.3) |
| Funded Debt Matured | | | (440.4) | | | | (922.7) |
| Net Cash From Financing Activities | | | 1,651.7 | | | | 533.2 |
| | | | | | | |
| INCREASE (DECREASE) IN CASH DURING YEAR | | 419.1 | | | | (463.7) |
| CASH POSITION - BEGINNING OF YEAR | | (532.9) | | | | (69.2) |
| CASH POSITION - END OF YEAR | | $ | (113.8) | | $ | | (532.9) |
| | | | | | | |
| CASH REPRESENTED BY | | | | | | | |
| Short Term Borrowing Net of Cash | | $ | (113.8) | | $ | | (532.9) |
| | | | | | | |
| | | | | | |
The accompanying notes are an integral part of these Financial Statements.
26 | PROVINCE OF NEW BRUNSWICK |
2011 |
| STATEMENT OF CHANGE IN NET DEBT |
| for the fiscal year ended 31 March 2011 |
| | | | | | | | (millions) | | | | |
| | | | 2011 | | | 2011 | | | 2010 | |
| | | | Budget | | | Actual | | | Actual | �� |
|
| RESTATED NET DEBT - BEGINNING OF YEAR (NOTE 18) | $ | | (8,353.1 | ) | $ | (8,471.4 | ) | $ | (7,501.4 | ) |
| |
| CHANGES IN YEAR | | | | | | | | | | | |
| |
| Annual Deficit | | | | (748.8 | ) | | (633.0 | ) | | (722.3 | ) |
| Other Comprehensive Income of Government Business Enterprises | | | -- | | | 110.5 | | | 4.9 | |
| Acquisition of Tangible Capital Assets | | | (800.4 | ) | | (850.0 | ) | | (570.7 | ) |
| Amortization of Tangible Capital Assets | | | 306.7 | | | 306.0 | | | 293.7 | |
| Amortization of Deferred Contributions | | | (34.2 | ) | | (37.1 | ) | | (35.0 | ) |
| Loss on Disposal of Tangible Capital Assets | | | -- | | | 4.7 | | | 0.5 | |
| Asset Impairment | | | | -- | | | 3.7 | | | | |
| Revenue Received to Acquire Tangible Capital Assets | | | 66.7 | | | 94.5 | | | 103.1 | |
| Net Change in Supplies Inventories | | | -- | | | 3.2 | | | (11.1 | ) |
| Net Change in Prepaid Expenses | | | | -- | | | (11.5 | ) | | (33.1 | ) |
| INCREASE IN NET DEBT | | | | (1,210.0 | ) | | (1,009.0 | ) | | (970.0 | ) |
| NET DEBT - END OF YEAR | | $ | | (9,563.1 | ) | $ | (9,480.4 | ) | $ | (8,471.4 | ) |
| | | | | | | | | | |
| STATEMENT OF CHANGE IN ACCUMULATED DEFICIT |
| for the fiscal year ended 31 March 2011 |
| | | | | | (millions) | | | | |
| | | | 2011 | | | 2011 | | | 2010 | |
| | | | Budget | | | Actual | | | Actual | |
| |
| RESTATED ACCUMULATED DEFICIT - | $ | | (2,441.9 | ) | $ | (2,439.7 | ) | $ | (1,722.3 | ) |
| BEGINNING OF YEAR (NOTE 18) | | | | | | | | | | |
| |
| Annual Deficit | | | (748.8 | ) | | (633.0 | ) | | (722.3 | ) |
| Other Comprehensive Income | | | -- | | | 110.5 | | | 4.9 | |
| |
| ACCUMULATED DEFICIT - END OF YEAR | $ | | (3,190.7 | ) | $ | (2,962.2 | ) | $ | (2,439.7 | ) |
| |
| |
| The accompanying notes are an integral part of these Financial Statements. | | | | | | | |
2011 | PROVINCE OF NEW BRUNSWICK |
27 | NOTES TO THE FINANCIAL STATEMENTS
31 March 2011
|
| NOTE 1 SUMMARY OF SIGNIFICANT ACCOUNTING POLICIES |
| a) Basis of Accounting |
These financial statements are prepared in accordance with Canadian public sector accounting standards.
b) Specific Accounting Policies
Accrual Accounting
Expenses are recorded for all goods and services received or consumed during the fiscal year.
Revenues and recoveries are recorded on an accrual basis with the exception of revenue from Canada under the
Federal-Provincial Fiscal Arrangements and Federal Post-Secondary Education and Health Contributions Act, 1977, and the Canada-New Brunswick Tax Collection Agreement which is accrued based on information provided by Canada and is adjusted in subsequent years.
Interest revenue is recorded on outstanding loan amounts due to the Province as the interest is earned. The major categories of loans receivable are Student Assistance, Economic Development, Agriculture Development and Fisheries.
Amounts received or recorded as receivable but not earned by the end of the fiscal year are recorded as deferred revenue.
Debt Charges
Interest and other debt service charges are reported in the Statement of Operations as Service of the Public Debt except as described below:
Because government business enterprises are included in the Provincial Reporting Entity through modified equity accounting, the cost of servicing their debt is not included in the Service of the Public Debt expense. The cost of servicing the debt of government business enterprises is an expense included in the calculation of their net profit or loss for the year.
Interest costs imputed on the Province’s Accrued Pension Liability are recorded as part of pension expense, which is included in various expense functions.
Interest on debt to finance the Student Loan Portfolio is recorded as part of the Education and Training expense function.
Interest earned on the assets of the General Sinking Fund and on other provincial assets is reported as revenue.
Note 12 to these financial statements reports the components of the Service of the Public Debt Expense function and total debt charges.
Government Transfers
Government transfers are transfers of money, such as grants, from a government to an individual, an organization or another government for which the government making the transfer does not receive any goods or services directly in return.
Government transfers are recognized in the Province's financial statements as expenses or revenues in the period that the events underlying the transfer occurred as long as the transfer is authorized and eligibility criteria have been met. Liabilities have been established for any transfers due at 31 March 2011 for which the intended recipients have met the eligibility criteria. Receivables have been established for transfers to which the Province is entitled under governing legislation, regulation or agreement.
28 | PROVINCE OF NEW BRUNSWICK |
2011 | NOTES TO THE FINANCIAL STATEMENTS
31 March 2011
Federal Trust Fund Available but not Recognized
On occasion, the federal government has established time-limited trust funds for each province to hold funds designated for each province to be spent on shared national priorities. The funding was intended to be used over multiple periods as each jurisdiction determined best fit their strategic plans. In New Brunswick, the following trust fund exists at 31 March with the balance available and the schedule for funding draw down as approved by the Board of Management.
| | | | | | |
| | | Amount
Available
at 31 March
2011 | | (millions)
Amount to be Recognized as
Revenue Each Year |
| | | |
| | | |
| Trust Fund | | | 2012 | | 2013 |
| |
| Police Officer Recruitment Fund | $ | 4.6 | $ | 2.3 | $ | 2.3 |
Asset Classification
Assets are classified as either financial or non-financial. Financial assets are assets that could be used to discharge existing liabilities or finance future operations and are not to be consumed in the normal course of operations. Non-financial assets are acquired, constructed or developed assets that do not provide resources to discharge existing liabilities but are employed to deliver government services, may be consumed in normal operations and are not for resale. Non-financial assets include tangible capital assets, prepaid expenses and inventories of supplies.
Short Term Investments
Short term investments are recorded at cost with supplemental information related to market values of short term investments reported in Note 5 to these financial statements.
Concessionary Loans
There are two situations where the Province charges loan disbursements entirely as expenses. These are:
- Loan agreements which commit the Province to provide future grants to the debtor to be used to repay the loan.
- Loan agreements which include forgiveness provisions if the forgiveness is considered likely.
In both these situations, the loan is charged to expense when it is disbursed.
Loans that are significantly concessionary because they earn a low rate of return are originally recorded as assets at the net present value of the expected future cash flows. The net present value is calculated using the Province’s borrowing rate at the time the loan was issued. The difference between the nominal value of the loan and its net present value is recorded as an expense.
2011 | PROVINCE OF NEW BRUNSWICK |
29 | NOTES TO THE FINANCIAL STATEMENTS
31 March 2011
Inventories
Inventories are recorded at the lower of cost or net realizable value. Inventories include supplies for use, and goods and properties held for resale. Properties held for resale are reported as a financial asset and include land and fixtures acquired or constructed for the purpose of sale. Properties held for resale also include properties acquired through foreclosure. Inventories of supplies for use are reported as a non-financial asset.
Allowances
Allowances have been established for loans and accounts receivable, loan guarantees and other possible losses. These allowances are disclosed in the schedules to the financial statements.
Obligations resulting from guaranteed loans are recorded as liabilities when a loss is probable with changes in this allowance recorded annually. As with all provisions for loss, this is an estimate and reflects management’s best estimate of probable losses.
Each outstanding loan guarantee under the Economic Development Act is reviewed on a quarterly basis. An allowance for loss on loan guarantees is established when it is determined that a loss is probable. A loss is considered probable when one or more of the following factors is present:
- a decline in the financial position of the borrower;
- economic conditions in which the borrower operates indicate the borrower’s inability to repay the loan;
- collection experience for the loan.
Losses on guaranteed loans under the Agriculture Development Act and the Fisheries Development Act for classes that have similar standards are calculated using an average rate based on past experience and trends.
Amounts due to the province but deemed uncollectible are written off from the accounts of the Province once the write-off has been approved by either the Board of Management or Secretary to the Board of Management depending on the dollar value involved.
Tangible Capital Assets
Tangible capital assets are assets owned by the Province which have useful lives greater than one year. Certain dollar thresholds have been established for practical purposes. Computer hardware and software have not been capitalized in the Province’s financial statements.
Tangible capital assets are reported at gross cost. Contributions received to assist in the acquisition of tangible capital assets are reported as Deferred Capital Contributions and amortized to income at the same rate as the related asset.
Tangible capital asset policies of government entities which are consolidated in these financial statements are not adjusted to conform to Provincial policies. The types of items which could differ include amortization rates, estimates of useful lives and dollar thresholds for capitalization.
Public Private Partnership Road Contracts
The Province, through the New Brunswick Highway Corporation (NBHC), contracts with independent organizations to provide rehabilitation and maintenance work on designated portions of the Provincial highway network. The contracts provide for annual payment amounts determined at the inception of the contracts for maintenance and rehabilitation (capital improvement) of the roads.
The terms of the agreements provide for scheduled annual payments which reflect the expected timing of capital improvement work. The payments to the contractors are being accounted for as follows:
- as prepaid expenses when the rehabilitation work is expected to be completed after the payment has been made;
- as accrued expenditures when the rehabilitation work is expected to occur prior to the payment being made; and
- as the acquisition of tangible capital assets in the year the rehabilitation work is expected to be completed.
30 | PROVINCE OF NEW BRUNSWICK |
2011 | NOTES TO THE FINANCIAL STATEMENTS
31 March 2011
Amortization of the capital improvement work commences in the year the rehabilitation work is expected to be performed. This may not reflect when the work is actually completed by the contractors. Accordingly, some measurement uncertainty exists relative to the timing of the amortization expense and the allocation of the payment amounts as prepaid expenses, tangible capital assets or accrued expenditures.
Injured Worker Liability
The Province provides workers’ compensation benefits on a self-insured basis. WorkSafe New Brunswick administers the claims on the Province’s behalf and charges a fee for this service. The liability for workers’ compensation of $132.7 million as at 31 March 2011 ($133.9 million at 31 March 2010) is determined by an actuary and is included in the Employee Benefits Liability. Annual claim payments are expensed by each department and are included in the functional expense area related to the program the employee worked in. The net change in the liability excluding the actual claims costs is a reduction of $1.2 million in the 2011 fiscal year ($1.7 million increase in 2010) and is credited in General Government.
Trusts Under Provincial Administration
Legally established trust funds which the Province administers but does not control are not included as Provincial assets or liabilities. These financial statements disclose the equity balances of the trust funds administered by the Province in Note 17.
Borrowing on Behalf of New Brunswick Electric Finance Corporation
The Province, as represented by the Consolidated Fund, has issued long term debt securities on behalf of New Brunswick Electric Finance Corporation in exchange for debentures with like terms and conditions.
The New Brunswick Electric Finance Corporation debentures received by the Province are reported in Note 11 of these financial statements as a reduction of Funded Debt. This financing arrangement was used to obtain more favourable debt servicing costs. The transactions involving these securities, including the debt servicing costs, are not part of the budget plan of the Province’s Consolidated Fund.
Foreign Currency Translation and Risk Management
The Province's assets, liabilities and contingent liabilities denominated in foreign currencies are translated to Canadian dollars at the year end rates of exchange, except where such items have been hedged or are subject to interest rate and currency swap agreements. In such cases, the rates established by the hedge or the agreements are used in the translation. Exchange gains and losses are included in the Statement of Operations except for the unrealized exchange gains and losses arising on the translation of long term items, which are deferred and amortized on a straight line basis over the remaining life of the related assets or liabilities. Revenue and expense items are translated at the rates of exchange in effect at the respective transaction dates.
The Province borrows funds in both domestic and foreign capital markets and manages its existing debt portfolio to achieve the lowest debt costs within specified risk parameters. As a result, the Province may be exposed to foreign exchange risk. Foreign exchange or currency risk is the risk that the principal and interest payments on foreign debt will fluctuate in Canadian dollar terms due to fluctuations in foreign exchange rates.
2011 | PROVINCE OF NEW BRUNSWICK |
31 | NOTES TO THE FINANCIAL STATEMENTS
31 March 2011
In accordance with risk management policy guidelines, the Province uses various financial instruments and techniques to manage exposure to foreign currency risk. These financial instruments include currency forwards, cross-currency swaps and purchases of foreign denominated assets into the Province’s sinking fund.
As at March 31, 2011, the Province had outstanding $850.0 million US$ and 300.0 million Swiss Francs denominated debt. Of this total, $650.0 million US$ and 300.0 million Swiss Francs were hedged by entering into cross-currency swaps, which convert the interest and principal payable from the original currency to Canadian dollars.
The Province’s currency exposure was 1.6% of the total debt portfolio prior to netting out the US dollar denominated assets in the sinking fund. A one-cent change in the US/CDN$ foreign exchange rate as of March 31, 2011 would result in a $1.2 million change in the principal amount of Provincial-purpose long term debt. The hypothetical change, a gain or loss, would be amortized over the remaining life of the related debt issue. A one-cent change would also result in a change of $0.1 million on interest payments in Service of the Public Debt.
The net currency exposure is 0.5% when the US dollar denominated assets held in the sinking fund are netted from the total Provincial-purpose debt portfolio.
Sinking Funds
The General Sinking Fund is maintained by the Minister of Finance under the authority of section 12 of the Provincial Loans Act (“Act”). This Act provides that the Minister shall maintain one or more sinking funds for the payment of funded debt either at maturity or upon redemption in advance of maturity. Typically, redemptions are only made after the related Provincial purpose portion of the debt has been outstanding a minimum of twenty years.
Sinking fund investments in bonds and debentures are reported at par value less unamortized discounts less premiums and the unamortized balance of unrealized foreign exchange gains or losses. Short-term deposits are reported at cost. The Province’s sinking fund may be invested in eligible securities as defined in the Act.
Sinking fund installments are paid into the General Sinking Fund on or before the anniversary date of each issue of funded debt, at the prescribed rate of a minimum of 1% of the outstanding principal.
New Brunswick Electric Finance Corporation (NBEFC) is contractually obligated to pay to the Province the amount of the sinking fund installment required each year in respect of the debentures issued by the Province on behalf of New Brunswick Power Corporation prior to 1 October 2004 and on behalf of NBEFC after 30 September 2004.
The following table shows the allocation of various components of the Sinking Fund between the Consolidated Fund of the Province and NBEFC.
| | | Consolidated
Fund | | NBEFC | | Total |
| |
| Fund Equity, beginning of year | $ | 4,192.9 | $ | 364.1 | $ | 4,557.0 |
| Sinking Fund Earnings | | 223.5 | | 8.4 | | 231.9 |
| Installments | | 156.0 | | 42.2 | | 198.2 |
| Paid for Debt Retirement | | (231.0) | | (21.6) | | (252.6) |
| |
| Fund Equity, end of year | $ | 4,341.4 | $ | 393.1 | $ | 4,734.5 |
32 | PROVINCE OF NEW BRUNSWICK |
2011 | NOTES TO THE FINANCIAL STATEMENTS
31 March 2011
Leases
Long term leases, under which the Province, as lessee, assumes substantially all the benefits and risks of ownership of leased property, are classified as capital leases although certain minimum dollar thresholds are in place for practical reasons. The present value of a capital lease is accounted for as a tangible capital asset and an obligation at the inception of the lease.
All leases under which the Province does not assume substantially all the benefits and risks of ownership related to the leased property are classified as operating leases. Each rental payment required by an operating lease is recorded as an expense when it is due.
Measurement Uncertainty
Measurement uncertainty is uncertainty in the determination of the amount at which an item is recognized in financial statements. This uncertainty exists when there is a variance between the recognized amount and another reasonably possible amount. Many items in these financial statements have been measured using estimates. Those estimates have been based on assumptions that reflect economic conditions.
Some examples of where measurement uncertainty exists are:
- determination of valuation allowances on investments;
- the establishment of allowances for doubtful accounts and allowances for losses;
- the determination of employee future benefits;
- determination of injured worker liability and related expense;
- allocation of payments under Public Private Partnership agreements for highway maintenance between prepaid expense and tangible capital assets; and
- calculation of transition balances for tangible capital assets, and;
- determination of depreciation rates and residual values of tangible capital assets.
c) Provincial Reporting Entity
These financial statements include those entities which make up the Provincial Reporting Entity. The Provincial Reporting Entity is comprised of certain organizations that are controlled by the government. These organizations are the Consolidated Fund, the General Sinking Fund and the agencies, commissions and corporations listed below.
d) Basis of Consolidation
Transactions and balances of organizations are included in these financial statements through one of the following accounting methods:
Consolidation Method
This method combines the accounts of distinct organizations. It requires uniform accounting policies for the organizations except that tangible capital asset policies of these organizations are not conformed to provincial policies. Inter-organizational balances and transactions are eliminated under this method. This method reports the organizations as if they were one organization. The organizations included through the consolidation method are:
2011 | PROVINCE OF NEW BRUNSWICK |
33 | NOTES TO THE FINANCIAL STATEMENTS
31 March 2011
Algonquin Golf Limited
Algonquin Properties Limited
Ambulance New Brunswick Inc.
Arts Development Trust Fund
Atlantic Education International Inc.
Collège communautaire du Nouveau-Brunswick
Economic and Social Inclusion Corporation
Energy Efficiency and Conservation Agency
of New Brunswick
Environmental Trust Fund
FacilicorpNB Ltd.
Forest Protection Limited
Horizon Health Network
Kings Landing Corporation
New Brunswick Community College | New Brunswick Credit Union Deposit
Insurance Corporation
New Brunswick Health Council
New Brunswick Highway Corporation
New Brunswick Housing Corporation
New Brunswick Immigrant Investor Fund (2009) Ltd.
New Brunswick Internal Services Agency
New Brunswick Investment Management Corporation
New Brunswick Legal Aid Services Commission
New Brunswick Lotteries and Gaming Corporation
Recycle New Brunswick
Regional Development Corporation
Service New Brunswick
Sport Development Trust Fund
Vitalité Health Network |
Modified Equity Method
This method is used for government business enterprises (GBE’s). GBE’s are defined in Note 7 to these financial statements. The modified equity method reports a GBE’s net assets as an investment on the Province’s Statement of Financial Position. The net income of the GBE is reported as investment income on the Province’s Statement of Operations. Inter-organizational transactions and balances are not eliminated. All gains or losses arising from inter-organizational transactions between GBE’s and other government organizations are eliminated. The accounting policies of GBE’s are not adjusted to conform with those of other government organizations. The organizations that have been included through modified equity accounting are:
| |
| New Brunswick Electric Finance Corporation | New Brunswick Power Group |
| New Brunswick Liquor Corporation | New Brunswick Securities Commission |
| New Brunswick Municipal Finance Corporation | |
| |
| |
Transaction Method
This method records only transactions between the Province and the other organizations. The transaction method was used because the appropriate methods would not produce a materially different result. The organizations included through the transaction method are:
New Brunswick Advisory Council on the
Status of Women
New Brunswick Agricultural Insurance
Commission
New Brunswick Arts Board
New Brunswick Energy and Utilities Board | New Brunswick Insurance Board
New Brunswick Museum
New Brunswick Public Libraries Foundation
Premier's Council on the Status of Disabled Persons
Provincial Holdings Ltd.
Strait Crossing Finance Inc. |
NOTE 2 BUDGET
The budget amounts included in these financial statements are the amounts published in the Main Estimates, adjusted for transfers from the Supplementary Funding Provision Program and elimination of inter-account transactions. In addition, the following budget amounts were restated for the accounting changes with respect to tax transfers, crown licensee management fees and to reflect the New Brunswick Lotteries and Gaming Corporation as an other government organization. Revenue increased by $70.5 million (timber royalties $28.7 million, taxes $27.8 million, lotteries and gaming revenue $14.0 million). Expenses increased by $70.5 million (resources $28.7 million, central government $26.2 million, social development $15.6 million). These changes are described in note 18 to these financial statements.
34 | PROVINCE OF NEW BRUNSWICK |
2011 | NOTES TO THE FINANCIAL STATEMENTS
31 March 2011
The Supplementary Funding Provision Program is an appropriation which provides funding to other programs for costs associated with contract settlements and other requirements not budgeted in a specific program.
Budget figures for the year ending 31 March 2011 reflect the acquisition of tangible capital assets and amortization expense. These amounts are disclosed in the Main Estimates as a separate schedule.
NOTE 3 FISCAL RESPONSIBILITY AND BALANCED BUDGET ACT
The Province is required under the Fiscal Responsibility and Balanced Budget Act to report annually on the difference between the revenue and expenses, subject to the provisions of sections 3 and 4 of the Act, for the fiscal year to which the Public Accounts relate and the cumulative difference between revenues and expenses for the current fiscal period. 31 March 2011 marks the end of the current four year fiscal period. The previous fiscal period spanned three years and ended 31 March 2007.
Section 3 of the Act stipulates that for Balanced Budget purposes, the changes to accounting policies apply prospectively as of the first day of the fiscal year in which the change is implemented and do not affect any previous year.
Section 4(1) of the Act stipulates that any change made within the last fifteen months of the fiscal period or after completion of that period in relation to the official estimates by the Government of Canada for provincial entitlements under the Federal-Provincial Fiscal Arrangements Act (Canada), the Canada-New Brunswick Tax Collection Agreement or the Comprehensive Integrated Tax Coordination Agreement, shall not be taken into account.
Section 4(2) of the Act stipulates that any change made in relation to the first official estimates by the Government of Canada respecting provincial entitlements under the Federal-Provincial Fiscal Arrangements Act (Canada), the Canada-New Brunswick Tax Collection Agreement or the Comprehensive Integrated Tax Coordination Agreement for the last fiscal year of a fiscal period shall not be taken into account.
The surplus (deficit) according to the Fiscal Responsibility and Balanced Budget Act for each of the years in the fiscal period ending 31 March 2011 is as follows:
| | | | |
| | (millions) |
| | 2008 | 2009 | 2010 | 2011 |
| | Actual | Actual | Actual | Actual |
| |
| Revenue | $ 6,962.3 | $ 7,112.8 | $ 6,989.9 | $ 7,496.7 |
| Adjustments as per section 4(1) of the Act | -- | -- | (79.3) | (93.0) |
| Adjustments as per section 4(2) of the Act | -- | -- | -- | (44.6) |
| Revenue as per Fiscal Responsibility and | | | | |
| Balanced Budget Act | 6,962.3 | 7,112.8 | 6,910.6 | 7,359.1 |
| Expense | 6,875.6 | 7,305.1 | 7,727.8 | 8,129.7 |
| |
| |
| Surplus (Deficit) for the year | 86.7 | (192.3) | (817.2) | (770.6) |
| Cumulative Surplus (Deficit) at beginning of year | -- | 86.7 | (105.6) | (922.8) |
| |
| Cumulative Surplus (Deficit) at end of year | $ 86.7 | $ (105.6) | $ (922.8) | $ (1,693.4) |
The Province is required under the Act to report annually on the ratio of Net Debt to Gross Domestic Product (GDP) for the fiscal year to which the Public Accounts relate and the difference between that ratio and the ratio of Net Debt to GDP at the end of the previous fiscal period.
2011 | PROVINCE OF NEW BRUNSWICK |
35 | NOTES TO THE FINANCIAL STATEMENTS
31 March 2011
The following table presents the difference between the ratio for the fiscal period ending March 31, 2007 and for the year ended March 31, 2011.
| | | |
| | | (millions) | |
| | 2007 | 2011 | Difference |
| Net Debt | $ 6,680.4 | $ 9,480.4 | |
| GDP (31 December) | $ 25,847.0 | $ 28,597.0 | |
| Ratio of Net Debt to GDP | 25.8% | 33.2% | 7.4% increase |
NOTE 4 SPECIAL PURPOSE ACCOUNTS
Special Purpose Account revenue earned but not spent accumulates as a surplus in that account and may be spent in future years for the purposes specified. At 31 March 2011, the accumulated surplus in all Special Purpose Accounts totaled $115.3 million ($115.9 million in 2010). This total is a component of net debt and accumulated deficit.
Descriptions of Major Special Purpose Accounts
CMHC Funding
CMHC funding is used to provide funding for the operation of the programs that fall under the administration of the Social Housing Agreement. Fund revenues include interest earned on the fund, interest earned from second mortgages, and the cumulative excess of funding for social housing not spent to date. Expenditures from the fund are for approved CMHC program funding, any annual excess of which may be carried over for future program expenditures until the agreement expiration date in 2034.
School District Self Sustaining Accounts
Self Sustaining Accounts record school district revenue and expenses for non-educational services such as the rental of school facilities, cafeteria operations and foreign student tuition fees. These special purpose accounts also record partnership activities with third parties to provide resources, services or grants to students.
The table below summarizes the change in the accumulated Special Purpose Account surplus.
36 | PROVINCE OF NEW BRUNSWICK |
2011 | NOTES TO THE FINANCIAL STATEMENTS
31 March 2011
| | | | |
| | (millions) |
| | 2010 | 2011 |
| | Accumulated | | | Accumulated |
| | Surplus | Revenue | Expense | Surplus |
| |
| Active Community School Sport Project | $ 0.1 | $ 0.4 | $ 0.5 | $ -- |
| Archives Trust Account | 0.1 | -- | -- | 0.1 |
| Arts Development Trust Fund | -- | 0.7 | 0.7 | -- |
| Child Centered Family Justice Fund | -- | 0.5 | 0.5 | -- |
| CMHC Funding | 53.7 | 11.7 | 13.6 | 51.8 |
| Environmental Trust Fund | 8.4 | 9.0 | 8.3 | 9.1 |
| Fish Stocking Fund | 0.9 | 0.3 | 0.3 | 0.9 |
| Fred Magee Account | 0.4 | -- | -- | 0.4 |
| Grand Lake Meadows | 0.1 | -- | -- | 0.1 |
| Historic Places | 0.1 | -- | -- | 0.1 |
| Hospital Liability Protection Account | 0.5 | 2.8 | 3.3 | -- |
| International Projects | 0.1 | 1.5 | 1.5 | 0.1 |
| Johann Wordel Account | 0.1 | -- | -- | 0.1 |
| Land Management Account | 11.0 | 1.7 | 2.7 | 10.0 |
| Library Account | 0.3 | 0.4 | 0.2 | 0.5 |
| Medical Research Assistance Account | 3.0 | 0.1 | 0.7 | 2.4 |
| Municipal Police Assistance | 2.8 | 1.7 | 1.2 | 3.3 |
| National Safety Code Agreement | -- | 0.2 | 0.2 | -- |
| Natural Resources Recoverable Projects | -- | 0.1 | 0.1 | -- |
| NB 911 Service Fund | 8.5 | 5.8 | 4.3 | 10.0 |
| NB Community College Scholarship Account | 1.1 | -- | -- | 1.1 |
| Provincial Parks | -- | 0.1 | -- | 0.1 |
| Provincial Proceeds of Crime | 1.1 | 0.1 | 0.8 | 0.4 |
| Public/Private Partnership Projects | 0.2 | -- | -- | 0.2 |
| Renovation of Old Government House | 0.2 | -- | -- | 0.2 |
| School District Scholarship and Trusts | -- | 0.3 | 0.3 | -- |
| School District Self Sustaining Accounts | 16.3 | 23.9 | 22.7 | 17.5 |
| Sport Development Trust Fund | -- | 0.5 | 0.5 | -- |
| Strait Crossing Finance Inc. | -- | 0.1 | 0.1 | -- |
| Suspended Driver - Alcohol Re-Education | -- | 0.4 | 0.3 | 0.1 |
| Trail Management Trust Fund | 1.2 | 1.3 | 1.2 | 1.3 |
| Training Recoverable Projects | 2.4 | 2.2 | 1.6 | 3.0 |
| Victim Services Account | 2.1 | 1.7 | 2.4 | 1.4 |
| Wildlife Trust Fund | 1.2 | 1.1 | 1.2 | 1.1 |
| | $ 115.9 | $ 68.6 | $ 69.2 | $ 115.3 |
NOTE 5 SHORT TERM INVESTMENTS
The fair value of short-term investments at March 31, 2011 is not materially different from the carrying value. Short- term investments primarily consist of investments in banker’s acceptances and term deposits.
2011 | PROVINCE OF NEW BRUNSWICK |
37 | NOTES TO THE FINANCIAL STATEMENTS
31 March 2011
NOTE 6 OBLIGATIONS UNDER CAPITAL LEASES
The total future principal and interest payments for capital leases amount to $1,557.4 million ($1,394.2 million 2010). That amount includes $841.3 million ($765.5 million 2010) in principal and $716.1 million ($628.7 million 2010) in interest.
Minimum annual principal and interest payments in each of the next five years are as follows:
| | |
| Fiscal Year | | (millions) |
| |
| 2011-2012 | $ | 88.6 |
| 2012-2013 | | 87.7 |
| 2013-2014 | | 87.0 |
| 2014-2015 | | 86.5 |
| 2015-2016 | | 86.5 |
NOTE 7 GOVERNMENT BUSINESS ENTERPRISES
A Government Business Enterprise is an organization accountable to the Legislative Assembly that has the power to contract in its own name, has the financial and operating authority to carry on a business, sells goods and services to customers outside the Provincial Reporting Entity as its principal activity, and that can, in the normal course of its operations, maintain its operations and meet its liabilities from revenues received from sources outside the Provincial Reporting Entity.
The following is a list of Government Business Enterprises, and their fiscal year ends, which are included in the Provincial Reporting Entity as described in Note 1 to these financial statements. In addition we have included summary information for the NB Power Group in the narrative section following the table below. The financial results of the NB Power Group are included in New Brunswick Electric Finance Corporation’s financial statements using the modified equity method.
| |
| New Brunswick Liquor Corporation (Liquor) | 31-03-11 |
| New Brunswick Municipal Finance Corporation (Municipal Finance) | 31-12-10 |
| New Brunswick Electric Finance Corporation (NB Electric Finance) | 31-03-11 |
| New Brunswick Power Group (NB Power Group) | 31-03-11 |
| New Brunswick Securities Commission (Securities) | 31-03-11 |
The following table presents condensed financial information of these Government Business Enterprises.
38 | PROVINCE OF NEW BRUNSWICK |
2011 | NOTES TO THE FINANCIAL STATEMENTS
31 March 2011
| | | | | |
| | | Municipal | NB Electric | | |
| | Liquor | Finance | Finance | Securities | Total |
| Assets | | | | | |
| Cash and | | | | | |
| Equivalents | $ 1.5 | $ 1.0 | $ 0.3 | $ 2.3 | $ 5.1 |
| Receivables | 3.4 | 3.9 | 526.1 | -- | 533.4 |
| Prepaids | 0.4 | -- | -- | -- | 0.4 |
| Inventories | 22.5 | -- | -- | -- | 22.5 |
| Investments | -- | 0.8 | 246.5 | 1.6 | 248.9 |
| Deferred Charges | 0.3 | -- | -- | -- | 0.3 |
| Fixed Assets | 9.3 | -- | -- | 0.3 | 9.6 |
| Long Term Notes | | | | | |
| Receivable | -- | 725.5 | 4,015.3 | -- | 4,740.8 |
| Total Assets | $ 37.4 | $ 731.2 | $ 4,788.2 | $ 4.2 | $ 5,561.0 |
| |
| |
| Liabilities | | | | | |
| Payables | $ 15.5 | $ 3.9 | $ 484.2 | $ 0.8 | $ 504.4 |
| Other Long Term | | | | | |
| Liabilities | -- | -- | 135.0 | -- | 135.0 |
| Long Term Debt | -- | 726.3 | 4,667.3 | -- | 5,393.6 |
| Sinking Funds | -- | -- | (393.1) | -- | (393.1) |
| Total Liabilities | 15.5 | 730.2 | 4,893.4 | 0.8 | 5,639.9 |
| |
| Equity | | | | | |
| Retained Earnings | 21.9 | 1.0 | (117.9) | 3.4 | (91.6 |
| Accumulated Other | | | | | |
| Comprehensive Income | -- | -- | 12.7 | -- | 12.7 |
| Total Equity | 21.9 | 1.0 | (105.2) | 3.4 | (78.9) |
| Total Liabilities and | | | | | |
| Equity | $ 37.4 | $ 731.2 | $ 4,788.2 | $ 4.2 | $ 5,561.0 |
| |
| |
| Net Income | | | | | |
| Revenue | $ 414.8 | $ 32.2 | $ 343.9 | $ 12.3 | $ 803.2 |
| Expenses | (255.4) | (0.9) | (333.1) | (5.2) | (594.6 |
| Interest and Related | | | | | |
| Expense | -- | (31.3) | -- | -- | (31.3) |
| Net Income | $ 159.4 | $ -- | $ 10.8 | $ 7.1 | $ 177.3 |
The financial information of Government Business Enterprises is prepared according to Generally Accepted Accounting Principles, using accounting policies that are appropriate for the industry segment in which they operate. These accounting policies may not be consistent with accounting policies used by other member organizations of the Provincial Reporting Entity.
2011 | PROVINCE OF NEW BRUNSWICK |
39 | NOTES TO THE FINANCIAL STATEMENTS
31 March 2011
New Brunswick Liquor Corporation
The New Brunswick Liquor Corporation was established under the New Brunswick Liquor Corporation Act. Its business activity is the purchase, distribution and sale of alcoholic beverages throughout the Province of New Brunswick.
New Brunswick Municipal Finance Corporation
The Municipal Finance Corporation was established under the New Brunswick Municipal Finance Corporation Act. Its purpose is to provide financing for municipalities and municipal enterprises through a central borrowing authority. The Province is guarantor of all debt issued by the Corporation.
New Brunswick Electric Finance Corporation
New Brunswick Electric Finance Corporation (NBEFC) is a Crown Corporation formed to assume New Brunswick Power's existing debt, to capitalize the new companies with debt and equity to enable them to become financially independent of Government, and to receive interest, dividend and special payments (in lieu of taxes) to enable it to service and repay the debt it has assumed.
NBEFC records the financial results of the NB Power Group using the equity method. The $246.5 million shown by NBEFC as an investment on its balance sheet is equal to the amount of capital stock of the NB Power Group plus all earnings of the NB Power Group subsequent to 30 September 2004. The NB Power Group’s net income is reported as income on NBEFC’s “Statement of Income and Surplus (Deficit)”. Unrealized intercompany gains or losses are eliminated.
NBEFC’s net income was reduced by $31.7 million of unrealized intercompany gains related to expenses deferred under the rate regulatory accounting used by the NB Power Group. In addition, NBEFC’s “Other Comprehensive Income” was increased by $32.6 million to adjust for the change in unrealized gain resulting from NB Power Group’s recognition of a “Future special payments in lieu of income taxes – other comprehensive income” asset. The specific treatment of costs by the NB Power Group is outlined in the Electricity Act.
The amount of $4,015.3 million reported by NBEFC as Long Term Notes Receivable is included by the NB Power Group as Long Term Debt. In addition, $4,662.3 million of the amount shown as Long Term Debt of NBEFC has been borrowed by the Province and is shown on the Statement of Financial Position as a reduction of Funded Debt.
New Brunswick Power Group
The New Brunswick Power Corporation was established as a Crown Corporation of the Province of New Brunswick in 1920 by enactment of the New Brunswick Electric Power Act. On October 1, 2004 the Province of New Brunswick proclaimed the Electricity Act which resulted in the reorganization of NB Power and the restructuring of the electricity industry in New Brunswick. NB Power was continued as New Brunswick Power Holding Corporation with four new subsidiary operating companies (NB Power Group) which commenced operations on that date.
The NB Power Group provides for the continuous supply of energy adequate for the needs and future development of the Province, and promotes economy and efficiency in the distribution, supply, sale and use of power.
The 31 March 2011 combined statements of the NB Power Group report a net earnings of $67 million on total revenue of $1,616 million. Total assets reported were $5,632 million. Of this amount, $3,773 million is related to the net book value of tangible capital assets. The statements also report total liabilities of $5,326 million of which $3,967 million is long term debt and $550 million matures in the 2011-2012 fiscal year.
40 | PROVINCE OF NEW BRUNSWICK |
2011 | NOTES TO THE FINANCIAL STATEMENTS
31 March 2011
New Brunswick Securities Commission
The New Brunswick Securities Commission is a Provincial Corporation under the Securities Act (New Brunswick) established on July 1, 2004. The business of the Commission is the regulation of the New Brunswick capital markets, including administration of the Act, the General Regulation and the New Brunswick Securities Commission rules.
NOTE 8 TANGIBLE CAPITAL ASSETS
Tangible capital assets include acquired, built, developed and improved tangible assets, whose useful life extends beyond the fiscal year and which are intended to be used on an ongoing basis for producing goods or delivering services. The Province does not capitalize computer hardware and software.
Certain assets which have historical or cultural value, including works of art, historical documents and historical and cultural artifacts are not recognized as tangible capital assets. Intangibles and items inherited by right of the Crown, such as Crown lands, forests and mineral resources, are not recognized in the financial statements. Assets under construction are not amortized until the asset is available to be put into service.
Calculation of opening balances included, where available, acquisition totals reported in Public Accounts from 1973 to 2004. Surfacing costs have been segregated starting in 2005. Prior to 2005, these costs were included in roads and highways and bridges.
Tangible capital assets are amortized on a straight-line basis over their estimated useful lives as noted in the table that follows. One-half of the annual amortization is charged in the year of acquisition and in the year of disposal.
Included in the closing costs of the various classes as of March 31, 2011 are costs for assets under construction, which are not amortized. These costs are for buildings ($293.0 million); bridges, roads and highways ($203.4 million); ferries ($66.1 million); and water management systems ($33.1 million).
2011 | PROVINCE OF NEW BRUNSWICK |
41 |
NOTES TO THE FINANCIAL STATEMENTS
31 March 2011
| | (millions) |
| | 2011 | 2010 |
| |
| | | | | | Vehicles | Roads, | Dams and | | |
| | | Buildings and | Machinery | | and Mobile | Bridges | Water | | |
| | | Land | and | | Heavy | and | Management | | |
| | Land | Improvements Equipment | Ferries | Equipment | Highways | Systems | Total | Total |
| Estimated Useful | | | | | | | | | |
| Life (Years) | Indefinite | 20-40 | 5-15 | 40-50 | 5-20 | 20-50 | 20-50 | | |
| |
| Cost | | | | | | | | | |
| Opening Costs | $ 329.8 | $ 2,894.1 | $ 659.9 | $ 51.1 | $ 288.8 | $ 6,701.2 | $ 34.4 | $ 10,959.3 | $ 10,405.3 |
| Additions | 12.0 | 368.8 | 38.2 | 45.5 | 18.0 | 342.7 | 24.8 | 850.0 | 570.7 |
| Disposals | (1.2) | (3.2) | (6.3) | -- | (61.7) | -- | -- | (72.4) | (16.7) |
| Impairments | -- | (3.7) | -- | -- | -- | -- | -- | (3.7) | -- |
| Closing Costs | 340.6 | 3,256.0 | 691.8 | 96.6 | 245.1 | 7,043.9 | 59.2 | 11,733.2 | 10,959.3 |
| |
| |
| Accumulated | | | | | | | | | |
| Amortization | | | | | | | | | |
| Opening | | | | | | | | | |
| Accumulated | | | | | | | | | |
| Amortization | -- | 1,336.8 | 497.7 | 6.5 | 196.4 | 2,214.1 | 1.8 | 4,253.3 | 3,975.8 |
| Amortization Expense | -- | 76.2 | 37.7 | 0.8 | 17.5 | 173.2 | 0.6 | 306.0 | 293.7 |
| Disposals | -- | -- | (6.3) | -- | (61.5) | -- | -- | (67.8) | (16.2) |
| Closing Accumulated | | | | | | | | | |
| Amortization | -- | 1,413.0 | 529.1 | 7.3 | 152.4 | 2,387.3 | 2.4 | 4,491.5 | 4,253.3 |
| |
| |
| |
| Net Book Value | $ 340.6 | $ 1,843.0 | $ 162.7 | $ 89.3 | $ 92.7 | $ 4,656.6 | $ 56.8 | $ 7,241.7 | $ 6,706.0 |
42 | PROVINCE OF NEW BRUNSWICK |
2011 | NOTES TO THE FINANCIAL STATEMENTS
31 March 2011
NOTE 9 DEFERRED CAPITAL CONTRIBUTIONS
Capital contributions related to the acquisition of tangible capital assets are deferred and amortized over the useful life of the related asset. The amortization of capital contributions is reported as revenue in the Statement of Operations. Deferred capital contributions represent the unamortized portion of these contributed amounts. The changes in the balance of deferred capital contributions during the year are as follows:
| | | | | | | | | | | | |
| | | | | | | (millions) |
| | | | | | | 2011 | | 2010 |
| |
| Balance, beginning of year | | | | | | $ | 925.6 | | $ | | 857.5 | |
| Contributions received | | | | | | | 94.5 | | | | 103.1 | |
| Amortized to revenue during the year | | | | | | | (37.1 | ) | | | (35.0 | ) |
| |
| Balance, end of year | | | | | | $ | 983.0 | | $ | | 925.6 | |
| |
| |
| NOTE 10 BORROWING AUTHORITY | | | | | | | | | | | | |
| |
| a) Balance of Borrowing Authority under the Provincial Loans Act | | | | | | | |
| |
| The balance of borrowing authority granted under the Provincial Loans Act is as follows: | | | | | |
| |
| | (millions) |
| | | | | | Authority | | | | | | | |
| | | | | | Granted | | Borrowing | | | | | |
| | | | Balance | | During the | | During the | | Balance | |
| | | | 2010 | | Year | | Year | | | | 2011 | |
| |
| Loan Act 2009 | $ | | 878.6 | $ | --- | $ | 878.6 | | $ | - | -- | |
| Loan Act 2010 | | | -- | | 1,600.0 | | 877.2 | | | | 722.8 | |
| | $ | | 878.6 | $ | 1,600.0 | $ | 1,755.8 | | $ | | 722.8 | |
Under the authority of section 2 of the Provincial Loans Act, the maximum temporary indebtedness of the Province is $2,200.0 million. At 31 March 2011, the short term borrowing of the Province net of cash was $113.8 million.
Under the authority of subsection 3(1) of the Provincial Loans Act, the Province may borrow sums required for the repayment, refinancing or renewal of securities issued or for the payment of any loan or liability, repayment of which is guaranteed by the Province. This authority is in addition to the authorities listed above.
b) Borrowing by the Municipal Finance Corporation
The New Brunswick Municipal Finance Corporation has authority under the New Brunswick Municipal Finance Corporation Act to provide financing for municipalities and municipal enterprises. As at 31 December 2010, long term debt owed by the corporation was $730.1 million. The Province guarantees this debt.
NOTE 11 FUNDED DEBT OUTSTANDING
The following is a maturity schedule for the total amount of the Province’s Funded Debt.
2011 | PROVINCE OF NEW BRUNSWICK |
43 | NOTES TO THE FINANCIAL STATEMENTS
31 March 2011
| | | | | | | |
| | | (millions) |
| | | | | | Funded |
| | Interest | | Total | NB Electric | Debt for |
| Fiscal Year of | Rate (%) | Currency | Funded | Finance | Provincial |
| Maturity | Range | Amount | Debt | Corporation | Purposes |
| 2011-2012 | 5.8-10.1 | CAN $1,458.5 | $ 1,458.5 | $ (550.0) | $ 908.5 |
| 2012-2013 | 7.6 | US $200.0 | 194.4 | (97.2) | 97.2 |
| | 4.5-9.5 | CAN $1,128.3 | 1,128.3 | (325.0) | 803.3 |
| | | | 1,322.7 | (422.2) | 900.5 |
| 2013-2014 | 6.8 | US $200.0 | 194.4 | (97.2) | 97.2 |
| | 3.4-8.5 | CAN $1,099.4 | 1,099.4 | (220.0) | 879.4 |
| | | | 1,293.8 | (317.2) | 976.6 |
| 2014-2015 | 4.5 | CAN $550.0 | 550.0 | -- | 550.0 |
| 2015-2016 | 0.0-8.8 | CAN $724.8 | 724.8 | (400.0) | 324.8 |
| 2016-2017 | 2.9 | CHF 300.0 | 321.4 | -- | 321.4 |
| & After | 5.2-9.8 | US $900.0 | 974.4 | (242.9) | 731.5 |
| | 4.4-6.8 | CAN $10,003.1 | 10,003.1 | (2,730.0) | 7,273.1 |
| | | | 11,298.9 | (2,972.9) | 8,326.0 |
| Total Funded Debt | | | 16,648.7 | (4,662.3) | 11,986.4 |
| Less: Debt Issued to the New Brunswick | | | |
| Immigrant Investor Fund (2009) Ltd. | 24.8 | -- | 24.8 |
| Funded Debt Before Sinking Fund Investments | 16,623.9 | (4,662.3) | 11,961.6 |
| Less: Sinking Fund Investments | | 4,734.5 | (393.1) | 4,341.4 |
| Funded Debt Outstanding | | $ 11,889.4 | $ (4,269.2) | $ 7,620.2 |
Pursuant to section 12 of the Provincial Loans Act, the Minister of Finance maintains a General Sinking Fund for the repayment of funded debt either at maturity or upon redemption in advance of maturity. At 31 March 2011, the equity of the General Sinking Fund accumulated for the repayment of Provincial Debt was $4,341.4 million ($4,192.9 million 2010). Some of the assets of this Fund are bonds and debentures issued or guaranteed by the Province of New Brunswick. The provincial net book value of these investments at 31 March 2011 was $2,417.6 million ($2,387.8 million 2010).
Because government business enterprises are included in the reporting entity through modified equity accounting, long term debt issued directly by those enterprises is not included in the amount of Funded Debt Outstanding. Note 7 to these financial statements discloses the long term debt obligations of government business enterprises.
The following amounts, which are payable swap agreements, have been included in the preceding funded debt maturity schedule. They have been reflected in that schedule in the currency payable per each financial swap agreement.
44 | PROVINCE OF NEW BRUNSWICK |
2011 | NOTES TO THE FINANCIAL STATEMENTS
31 March 2011
| | | | | |
| | (millions) |
| | 2011 |
| | Amount Payable | Amount Payable | Canadian |
| Fiscal Year | in Original | Per Financial | Dollar |
| of Maturity | Currency | Swap Agreement | Equivalent |
| |
| 2015-2016 | CHF 300.0 | CAN $ 321.4 | $ 321.4 |
| 2016-2017 | US $ 500.0 | CAN $ 584.7 | 584.7 |
| 2020-2021 | US $ 50.0 | CAN $ 48.9 | 48.9 |
| 2022-2023 | US $ 100.0 | CAN $ 97.8 | 97.8 |
|
| | | | | $ 1,052.8 |
The swap agreements are interest rate and currency swap agreements.
The following estimated payments are required in each of the next five years to meet the sinking fund provisions of existing debt.
| | | | |
| | | Fiscal Year | | (millions) |
| |
| | | 2011-2012 | $ | 172.9 |
| | | 2012-2013 | | 163.1 |
| | | 2013-2014 | | 143.1 |
| | | 2014-2015 | | 137.5 |
| | | 2015-2016 | | 127.9 |
| |
| NOTE 12 | DEBT CHARGES | | | |
The total cost of interest, exchange, amortization and related expenses is $476.3 million ($520.7 million 2010), which consists of:
| | |
| | (millions) |
| | 2011 | 2010 |
| |
| Interest | $ 856.1 | $ 813.3 |
| Interest on Fredericton – Moncton Highway Capital Lease | 50.2 | 51.7 |
| Interest on Other Capital Leases | 4.6 | 2.0 |
| Foreign Exchange Expense | (25.1) | (20.0) |
| Amortization of Discounts and Premiums | 5.5 | 5.7 |
| Other Expenses | 1.9 | 9.4 |
| | 893.2 | 862.1 |
Interest Recovery for Debt Incurred for the New Brunswick Electric Finance Corporation | (250.6) | (245.5) |
| Service of the Public Debt | 642.6 | 616.6 |
| Sinking Fund Earnings | (223.5) | (216.4) |
| | 419.1 | 400.2 |
| Pension Interest Charged | 52.9 | 118.2 |
| Interest on Debt to finance Student Loan Portfolio | 4.3 | 2.3 |
| | $ 476.3 | $ 520.7 |
2011 | PROVINCE OF NEW BRUNSWICK |
45 | NOTES TO THE FINANCIAL STATEMENTS
31 March 2011
NOTE 13
PENSION PLANS
a) Description
Employees of the Province and certain other entities, as well as members of the Legislative Assembly, are entitled to receive pension benefits. The Pension plans under which these benefits are received are as follows:
| |
| | Date of Latest |
| | Actuarial Valuation |
| for Accounting |
Plan Name | Purposes |
| |
| Public Service Superannuation Act (PSSA) | 01 April 2010 |
| Teachers’ Pension Act (TPA) | 01 April 2010 |
| Provincial Court Act and Provincial Court Judges’ Pension Act | |
| (Judge) | 01 April 2010 |
| Members’ Superannuation Act and Members’ Pension Act | |
| (Member) | 01 April 2008 |
| Pension Plan for Canadian Union of Public Employees of | |
| New Brunswick Hospitals (H-CUPE) | --- |
| Pension Plan for Management Employees of New Brunswick | |
| School Districts (Sch-Mgt) | 31 December 2010 |
| Pension Plan for General Labour, Trades and Services Employees | |
| of New Brunswick School Districts (GLTS) | 31 December 2010 |
| Pension Plan for Full-Time CUPE 2745 Employees of New | |
| Brunswick School Districts (CUPE 2745) | 31 December 2010 |
| Ombudsman Act (Ombud) | --- |
| Pension Plan for Certain Bargaining Employees of | |
| New Brunswick Hospitals (H – CBE) | --- |
| Pension Plan for Part-time and Seasonal Employees (Part-time) | --- |
| Early Retirement Programs (Early Ret) | 01 April 2009 |
Pension trust funds distinct from the Consolidated Fund exist for each of these pension plans, except the
Members’ Superannuation Act, Members’ Pension Act and the Ombudsman Act and Early Retirement Programs.
The pension expense and liability relating to NB Power employees belonging to the Public Service Superannuation Act are fully accounted for in the financial statements of NB Power. The schedules in this note have been adjusted to reflect this.
46 | PROVINCE OF NEW BRUNSWICK |
2011 | NOTES TO THE FINANCIAL STATEMENTS
31 March 2011
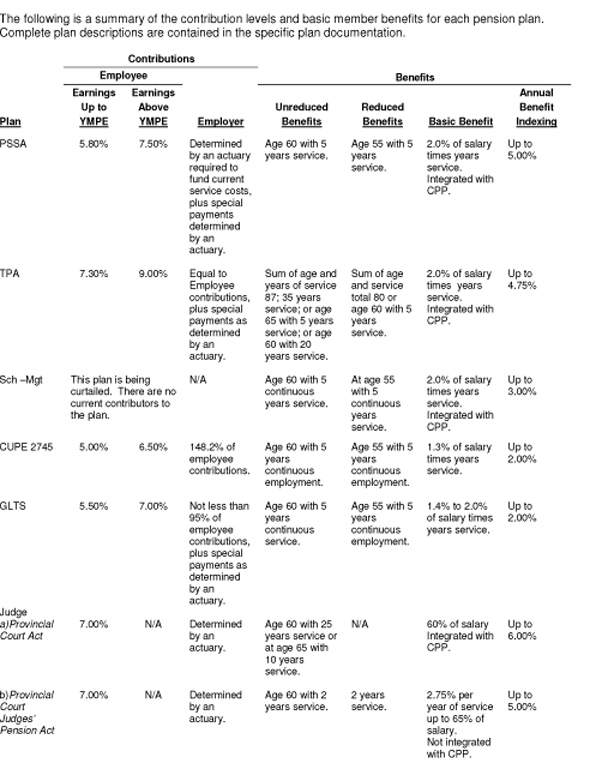
2011 | PROVINCE OF NEW BRUNSWICK |
47 | NOTES TO THE FINANCIAL STATEMENTS
31 March 2011

48 | PROVINCE OF NEW BRUNSWICK |
2011 | NOTES TO THE FINANCIAL STATEMENTS
31 March 2011
b) Pension Liability
With the exception of the H - CBE plan and the H - CUPE plan and the Part-Time plan, the Province is liable for any excess of accrued pension benefits over pension fund assets. The H – CBE and H – CUPE plans are defined benefit plans with fixed employer contributions and the Part-Time plan is a defined contribution plan. The Province’s liability related to these plans is limited to its annual contributions to the plans.
The Provincial share of the estimated pension surplus for all defined benefit pension plans is $219.9 million ($196.6 million 2010). This estimate is based on actuarial valuations for accounting purposes using the projected unit credit method, calculated as at the dates listed above. This method estimates the present value of retirement benefits associated with the period of employee service to the valuation date. These actuarial valuations were based on a number of assumptions about future events, such as rates of return on assets, wage and salary increases and employee turnover and mortality. Section d) of this note lists some of the actuarial assumptions used. Section e) lists selected information about plan members.
The value of accrued benefits in all defined benefit plans exceeds the value of assets resulting in an actuarial pension liability of $508.7 million. However, the calculation of this liability includes estimates of future events and market values of assets which can be volatile. The effects of experience gains and losses on market values and the actuarial liability, as well as effects of assumption changes are amortized over future years. Unamortized experience gains and losses of $728.6 million reduce the actuarial liability.
c) Summary Pension Information
Details of the pension liability, unamortized adjustments, pension expense and change in pension liability are outlined in the following table. The estimated accrued benefits and the value of plan assets reported have been updated to the most recent year end of the applicable pension plan. This was based on a projection of the actuarial assumptions and on actual contribution levels. The plans for hospital and school district employees have 31 December year ends. All other plans have 31 March year ends.
2011 | PROVINCE OF NEW BRUNSWICK |
49 | NOTES TO THE FINANCIAL STATEMENTS
31 March 2011

50 | PROVINCE OF NEW BRUNSWICK |
2011 | NOTES TO THE FINANCIAL STATEMENTS
31 March 2011
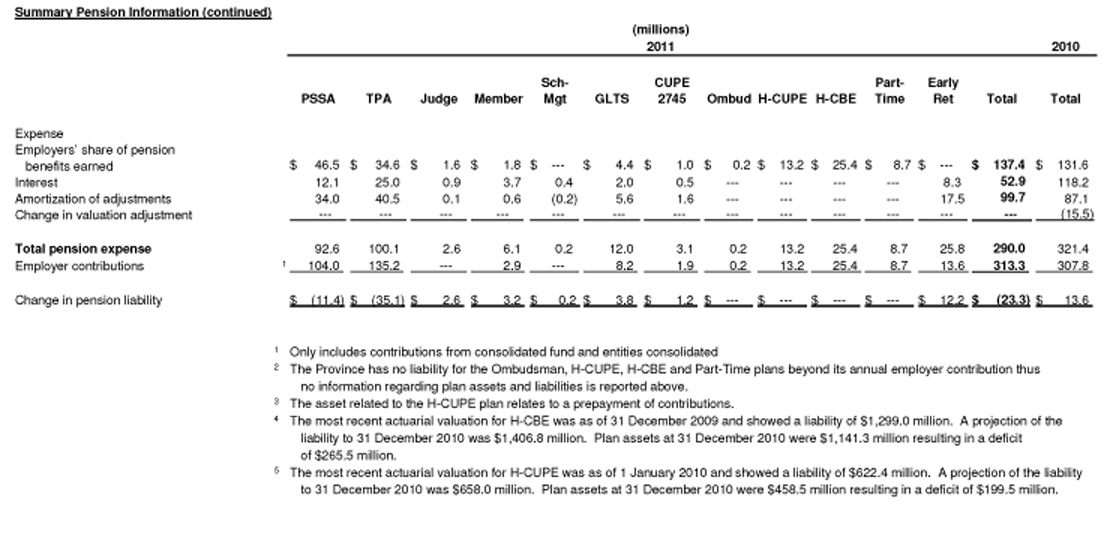
2011 | PROVINCE OF NEW BRUNSWICK |
51 | NOTES TO THE FINANCIAL STATEMENTS
31 March 2011
d) Actuarial Assumptions
Calculation of the Province’s employee pension obligations and related pension expenditure is based on long term actuarial assumptions except the Members’ Plan where both short and long term assumptions are used. In addition, salary increase assumptions have been refined given wage freeze measures implemented in the short term.
The table below discloses the assumptions used in the actuarial valuations.
| | | |
| | | | Rate of Pension |
| | Rate of Return | | Escalation after |
| Plan | on Assets (%) | Inflation (%) | Retirement (%) |
| |
| PSSA | 7.12 | 2.50 | 2.30 to 2.40 |
| TPA | 7.12 | 2.50 | 2.20 to 2.40 |
| Judge | 7.12 | 2.50 | 2.30 to 2.40 |
| Sch – Mgt | 7.12 | 2.50 | 2.10 |
| GLTS | 6.96 | 2.50 | 2.00 |
| CUPE 2745 | 6.96 | 2.50 | 2.00 |
| Member | 6.86 | 2.50 | 2.40 |
Annual Wage and Salary Increase Assumptions (%) (excludes promotional scale)
| | | | | | | | | | | | |
| | 2011 | | 2012 | | 2013 | | 2014 | | 2015 | | 2016 | + |
| |
| PSSA | 0.0 | % | 0.0 | % | 2.0 | % | 2.0 | % | 2.5 | % | 3.0 | % |
| TPA | 4.0 | % | 1.0 | % | 0.0 | % | 0.0 | % | 2.5 | % | 3.0 | % |
| Judge | 0.0 | % | 0.0 | % | 4.0 | % | 4.0 | % | 4.0 | % | 4.0 | % |
| Sch – Mgt | 0.0 | % | 0.0 | % | 3.0 | % | 3.0 | % | 3.0 | % | 3.0 | % |
| GLTS | 0.0 | % | 2.0 | % | 2.0 | % | 2.0 | % | 2.0 | % | 2.0 | % |
| CUPE 2745 | 0.0 | % | 2.0 | % | 2.0 | % | 2.0 | % | 2.0 | % | 2.0 | % |
| Member | 3.0 | % | 3.0 | % | 3.0 | % | 3.0 | % | 3.0 | % | 3.0 | % |
These assumptions have been used to determine the amount of the Province’s obligation for pension benefits outstanding and the value of benefits earned by employees during the fiscal year and are based on management’s best estimates. Different assumptions have been used to determine the appropriate level of employee and employer contributions needed to fund the estimated cost of the pension plans.
52 | PROVINCE OF NEW BRUNSWICK |
2011 | NOTES TO THE FINANCIAL STATEMENTS
31 March 2011
e) Member Data
| The following table lists data about the members of each plan. | | | | | |
| |
| | | | | | | Average | | |
| | | Estimated Average | Number of | | | Annual Salary | | Average |
| | | Remaining Service | Active | Number of | | of | | Annual |
| Plan | | Life (Years) | Contributors | Pensioners | | Contributors | | Pension |
| |
| PSSA | | 14 | 19,892 | 12,847 | $ | 59,296 | $ | 19,747 |
| TPA | | 16 | 10,103 | 8,290 | | 70,327 | | 29,724 |
| Judge | | 6 | 32 | 24 | | 204,951 | | 53,357 |
| Sch – Mgt | - | -- | N/A | 95 | | N/A | | 11,931 |
| GLTS | | 9 | 2,163 | 1,379 | | 31,622 | | 9,499 |
| CUPE 2745 | | 8 | 844 | 294 | | 28,173 | | 6,702 |
| Member | | 8 | | | | | | |
| Member | | | 55 | 91 | | 85,000 | | 30,961 |
| Minister | | | 20 | 37 | | 51,755 | | 5,945 |
The Members’ Pension Plan provides for a benefit based on years of service and salary as a Member and a benefit based on years of service and salary as a Minister. All Ministers are also included as a Member.
NOTE 14 CONTINGENT LIABILITIES
a) Guaranteed Loans
The Province has guaranteed certain debt of entities external to the Provincial Reporting Entity under the authority of various statutes. At 31 March 2011, the total contingent liability in respect of these guarantees was $141.2 million ($130.0 million 2010), of which the Province has recognized $49.1 million as a liability in the Statement of Financial Position ($39.9 million 2010).
| | | | |
| | | (millions) |
| | | Authorized | Contingent |
| | | Limit | | Liability |
| Agricultural Development Act | $ | 7.2 | $ | 7.2 |
| Economic Development Act | | 167.7 | | 117.4 |
| Employment Development Act | | 0.8 | | 0.8 |
| Fisheries Development Act | | 6.2 | | 6.2 |
| Livestock Incentives Act | | 0.7 | | 0.6 |
| Nursing Homes Act | | 6.4 | | 6.4 |
| Regional Development Corporation Act | | 2.6 | | 2.6 |
| | | | | 141.2 |
| Less: Included in Allowance for Losses (Schedule 8) | | | | 49.1 |
| | | | $ | 92.1 |
| |
| |
| | | | |
b) New Brunswick Municipal Finance Corporation
The New Brunswick Municipal Finance Corporation (NBMFC) is included in the Province’s reporting entity under Note
1. The Province guarantees the payment of principal and interest of any borrowing by NBMFC. In the event of a defaulted payment, the Province shall recover such amounts from the defaulting municipality or from the defaulting municipality that has guaranteed the payment due to the Corporation from the defaulting municipal enterprise. As of December 31, 2010, total debenture debt outstanding was $730.1 million ($687.1 million in 2009).
2011 | PROVINCE OF NEW BRUNSWICK |
53 | NOTES TO THE FINANCIAL STATEMENTS
31 March 2011
c) New Brunswick Credit Union Deposit Insurance Corporation
The New Brunswick Credit Union Deposit Insurance Corporation (NBCUDIC) guarantees the repayment of deposits with the New Brunswick credit unions and caisse populaires. NBCUDIC is included in the Province’s reporting entity as described in Note 1. As of December 31, 2010, deposits of the credit unions and caisse populaires totalled $3,247.9 million ($3,148.0 million in 2009). In addition, NBCUDIC has guaranteed specific losses up to $18.5 million until 2012.
d) Provincial Holdings Ltd.
Provincial Holdings Ltd. (PHL) is wholly owned by the Province and is responsible for administering industrial development project investments. Any resulting losses on loans guaranteed by PHL will be borne by the Province. At 31 March 2011, the total loan guarantees authorized totalled $50.0 million with a contingent liability of $47.0 million. A provision related to these guarantees has been included in the Allowance for Losses schedule in these financial statements.
e) Environmental Responsibility
The Province of New Brunswick has assumed responsibility for a mining site. There is no imminent environmental or health threat from the property as it is being continually monitored and managed. The Province currently holds a cash security in the amount of $3.2 million for remediation. The estimated cost to complete a full reclamation at this site is $9.0 million. There has been no decision at this time to proceed with full reclamation of the site.
f) Insurance
The Province does not carry general liability insurance or property insurance on its assets except in a few limited instances. Any successful liability claims against the Province and any replacement of lost or damaged property are charged to expense in the year of settlement or replacement.
g) Legal Actions
The Province of New Brunswick is involved in various legal proceedings arising from government activities. Amounts totalling $24.0 million have been accrued in these financial statements which represents management’s best estimate of the likely losses due to legal actions.
54 | PROVINCE OF NEW BRUNSWICK |
2011 |
NOTES TO THE FINANCIAL STATEMENTS
31 March 2011
NOTE 15
COMMITMENTS
a) Operating Leases
The total future minimum payments under various operating lease agreements, including those of government business enterprises, for the rental of space and equipment amounts to $483.9 million ($485.8 million 2010). Minimum annual lease payments in each of the next five years are as follows:
| | |
| Fiscal Year | | (millions) |
| |
| 2011-2012 | $ | 96.3 |
| 2012-2013 | | 80.3 |
| 2013-2014 | | 63.3 |
| 2014-2015 | | 47.3 |
| 2015-2016 | | 41.7 |
b) Nursing Homes
The Department of Social Development includes in its annual operating budget funding for the repayment of approved long term debt of certain nursing homes. The Department funds the nursing homes through grants which pay the difference between operating expenses and revenue from other sources.
Total long term debt of these nursing homes at 31 March 2011 amounted to approximately $263.1 million ($206.9 million 2010). Of the $263.1 million nursing home debt, the Province has issued guarantees totalling approximately $6.4 million ($6.9 million 2010) which is included as a contingent liability.
c) Contractual Obligations
The nature of the government’s activities results in significant multi-year contracts and obligations. The Province currently has outstanding contractual commitments of $2,467.9 million.
| | (millions) |
| Consolidated Fund Entities | $ | 250.8 |
| Other Government Entities | | 1,916.1 |
| Government Enterprises | | 301.0 |
| |
| |
| Significant commitments and agreements include: | | |
2011 | PROVINCE OF NEW BRUNSWICK |
55 | NOTES TO THE FINANCIAL STATEMENTS
31 March 2011
| | | | | | |
| Consolidated Fund Entities | | | | | | |
| |
| | 2012 | 2013 | 2014 | 2015 | 2016+ | Totals |
| |
| Finance | | | | | | |
| Management of Assets for Various Pension, | | | | | | |
| Trust Funds and Tax Issues | $ 2.3 | $ -- | $-- | $-- | $ -- | $ 2.3 |
| Project Management, Marketing, Web and | | | | | | |
| Staffing Services | 0.7 | 0.5 | 0.3 | -- | -- | 1.5 |
| Natural Resources | | | | | | |
| Various Agreements Under Natural Resources | | | | | | |
| Management | 4.7 | 2.8 | 0.3 | 0.3 | 2.0 | 10.1 |
| Office of Human Resources | | | | | | |
| Training Services Contract | 0.1 | -- | -- | -- | -- | 0.1 |
| Maritime Provinces Higher Education Commission | | | | | | |
| Construction, Renovation and Repair of Universities | 0.6 | -- | -- | -- | -- | 0.6 |
| Public Safety | | | | | | |
| Motor Vehicle Modernization Project | 3.0 | -- | -- | -- | -- | 3.0 |
| Social Development | | | | | | |
| Construction and Repair of Social Housing Units | 3.9 | -- | -- | -- | -- | 3.9 |
| Supply and Services | | | | | | |
| Provincial Building Acquisition and Maintenance | 114.2 | 3.9 | -- | -- | -- | 118.1 |
| Tourism and Parks | | | | | | |
| Advertising, Publication, Software and Web | | | | | | |
| Service Contracts | 5.9 | 4.4 | 1.1 | -- | -- | 11.4 |
| Transportation | | | | | | |
| National Highways System | 54.2 | 4.5 | -- | -- | -- | 58.7 |
| Permanent Bridges and Highways | 48.1 | 12.5 | -- | -- | -- | 60.6 |
| Replacement of the Grand Manan and White | | | | | | |
| Head Ferries | 18.2 | -- | -- | -- | -- | 18.2 |
| Rural Road Initiative | 1.5 | 0.1 | -- | -- | -- | 1.6 |
| Subtotal | 257.4 | 28.7 | 1.7 | 0.3 | 2.0 | 290.1 |
| Capital Contributions from Outside Souces | 39.3 | -- | -- | -- | -- | 39.3 |
| Total | $218.1 | $28.7 | $1.7 | $0.3 | $2.0 | $250.8 |
56 | PROVINCE OF NEW BRUNSWICK |
2011 | NOTES TO THE FINANCIAL STATEMENTS
31 March 2011
| Other Government Entities | | | | | | | |
| |
| | | 2012 | 2013 | 2014 | 2015 | 2016+ | Totals |
| |
| Ambulance NB | | | | | | | |
| Management of Ambulance Services | | | | | | | |
| through NB EMS | | $ 26.9 | $ 26.9 | $ 26.9 | $ 26.9 | $ 53.7 | $ 161.3 |
| New Brunswick Highway Corporation | | | | | | | |
| Maintenance and Rehabilitation of the | | | | | | | |
| Fredericton to Moncton Highway | | 12.7 | 17.3 | 21.1 | 15.8 | 48.6 | 115.5 |
| Maintenance and Rehabilitation of the Trans | | | | | | | |
| Canada Highway from the Quebec border | | | | | | | |
| to Longs Creek | | 20.8 | 21.3 | 21.8 | 22.2 | 286.3 | 372.4 |
| Maintenance and Rehabilitation of the | | | | | | | |
| Route 1 Gateway | | 13.5 | 18.4 | 21.1 | 21.6 | 733.4 | 808.0 |
| P3 - Route 1 Gateway GMP Construction | | 11.6 | 554.2 | 14.5 | -- | -- | 580.3 |
| Regional Development Corporation | | | | | | | |
| Canada - New Brunswick Agreements | | 25.9 | 6.3 | 1.7 | 0.2 | -- | 34.1 |
| Regional and Community Development | | | | | | | |
| Initiative | | 42.2 | 7.2 | 3.4 | -- | -- | 52.8 |
| Horizon Health Network | | | | | | | |
| Diagnostic Imaging Equipment | | 1.7 | -- | -- | -- | -- | 1.7 |
| | Subtotal | 155.3 | 651.6 | 110.5 | 86.7 | 1,122.0 | 2,126.1 |
| Capital Contributions from Outside Sources | | 5.8 | 204.2 | -- | -- | -- | 210.0 |
| | Total | $ 149.5 | $ 447.4 | $ 110.5 | $ 86.7 | $ 1,122.0 | $ 1,916.1 |
| |
| |
| Government Enterprises | | | | | | | |
| |
| NB Power | | | | | | | |
| Point Lepreau Generating Station | | | | | | | |
| Refurbishment | | $ 300.0 | $ -- | $ -- | $ -- | $ -- | $ 300.0 |
| Point Lepreau Generating Station | | | | | | | |
| Turbine Upgrade Project | | 1.0 | -- | -- | -- | -- | 1.0 |
| | Total | $ 301.0 | $ -- | $ -- | $ -- | $ -- | $ 301.0 |
2011 | PROVINCE OF NEW BRUNSWICK |
57 | NOTES TO THE FINANCIAL STATEMENTS
31 March 2011
NOTE 16 SEGMENT REPORTING
Note 16 is intended to provide supplementary information on the province’s revenue and expenses by segment. The segments have been defined based on the accountability and control relationships between the Government and the various organizations within the reporting entity. Although the government controls all the entities included, there are varying levels of accountability. The segments are defined as: Government Departments and Some Agencies; Regional Health Authorities; and Other Crowns and Agencies. An Interaccount Eliminations column is added to eliminate double counting between columns and to reconcile to the Statement of Operations. Eliminations between the Province and entities impact asset and liability accounts with respect to tangible capital assets and deferred contributions from the Province. The extent of these items was $8.7 million in the 2011 fiscal year ($15.0 million in 2010).
The Government Departments and Some Agencies segment represents the group most directly accountable to the Board of Management and Cabinet. The segment includes all line departments such as Health, Education and Transportation as well as the following agencies: Energy Efficiency and Conservation Agency of New Brunswick, Regional Development Corporation, New Brunswick Highway Corporation, New Brunswick Housing Corporation, Sport Development Trust Fund, Arts Development Trust Fund, New Brunswick Internal Services Agency, Economic and Social Inclusion Corporation, New Brunswick Lotteries and Gaming Corporation, and Environmental Trust Fund.
The Regional Health Authorities (RHA’s) are disclosed separately due to the magnitude of their operations and the fact they are somewhat removed from day to day control of the Board of Management and Cabinet.
Other Crowns and Agencies are also somewhat removed and independent with respect to day to day operations yet still controlled by government under the Public Sector Accounting Board’s criteria for control. The organizations included in this segment include: New Brunswick Electric Finance Corporation, New Brunswick Liquor Corporation, New Brunswick Municipal Finance Corporation, New Brunswick Power Group and New Brunswick Securities Commission. Also included with other agencies are the following entities which are consolidated in the Province’s financial statements: Algonquin Golf Limited, Algonquin Properties Limited, Ambulance New Brunswick Inc., Collège communautaire du Nouveau-Brunswick; FacilicorpNB Ltd., Forest Protection Limited, New Brunswick Community College, New Brunswick Health Council, New Brunswick Immigrant Investor Fund (2009) Ltd., Kings Landing Corporation, New Brunswick Legal Aid Services Commission, New Brunswick Investment Management Corporation, New Brunswick Credit Union Deposit Insurance Corporation, Recycle New Brunswick and Service New Brunswick.
58 | PROVINCE OF NEW BRUNSWICK |
2011 |
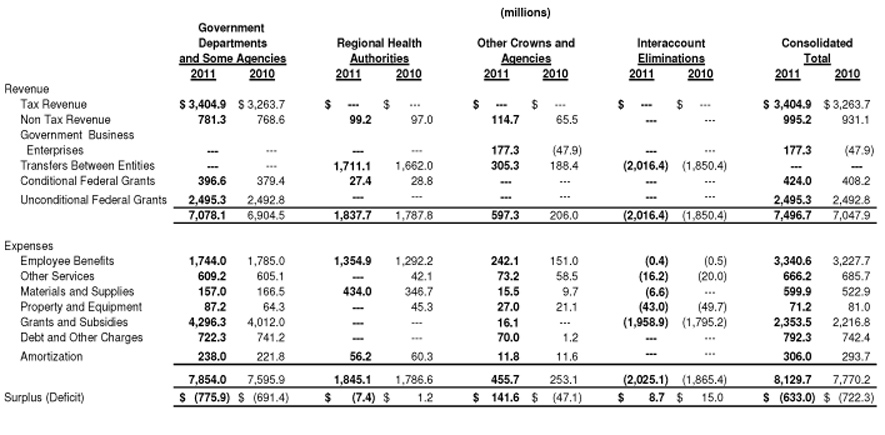
2011 | PROVINCE OF NEW BRUNSWICK |
59 | NOTES TO THE FINANCIAL STATEMENTS
31 March 2011
NOTE 17
TRUST FUNDS
The Province is trustee for various trust funds outside the Provincial Reporting Entity.
The following is a summary of the trust fund equities calculated using the method indicated below to value investment assets:
| | | |
| | | (millions) |
| | | 2011 | 2010 |
| Cost Method: | | | |
| |
| Margaret R. Lynds Bequest | | $ 0.1 | $ 0.1 |
| Mental Health Trust Fund | | 1.2 | 1.1 |
| Viscount Bennett Bequest | | 0.2 | 0.2 |
| |
| | | $ 1.5 | $ 1.4 |
| |
| Market Value Method: | | | |
| |
| Judges' Superannuation Fund | | $ 29.4 | $ 27.3 |
| Office of the Public Trustee Trust Fund | | 7.6 | 4.3 |
| Pension Plan for the Management Employees | | | |
| of New Brunswick School Districts | | 10.6 | 10.8 |
| Pension Plan for General Labour, Trades and Services | | | |
| Employees of New Brunswick School Districts | | 252.8 | 235.6 |
| Pension Plan for Full-Time CUPE 2745 Employees of | | | |
| New Brunswick School Districts | | 56.0 | 51.5 |
| Public Service Superannuation Fund | | 5,044.4 | 4,604.6 |
| Teachers' Pension Trust Fund | | 4,026.8 | 3,713.8 |
| |
| | | $ 9,427.6 | $ 8,647.9 |
The Margaret R. Lynds Bequest awards three annual scholarships of equal value to students pursuing the study of communications at specified universities. The Mental Health Trust Fund is used to pay for psychoanalysis treatment of deserving New Brunswick residents. The income from the Viscount Bennett Bequest is used to develop the Province's historic resources. The Public Trustee of New Brunswick protects the financial and personal interests of the elderly, the mentally challenged, children, missing or deceased persons, when there is no one else able and willing to do so.
NOTE 18 PRIOR PERIOD ADJUSTMENTS
Crown Licensee Management Fees
The Province has retroactively restated timber royalty revenue and resources expenses to reflect the licensee management fees that were previously netted against revenue. The result is that both revenue and expense increased by $22.7 million in the year ended 31 March 2010. There was no impact on net debt.
60 | PROVINCE OF NEW BRUNSWICK |
2011 | NOTES TO THE FINANCIAL STATEMENTS
31 March 2011
Tax Transfers
The Province elected early adoption of the new tax revenue accounting standard for certain tax transfers. Tax transfers are defined as financial benefits made through the tax system for a purpose other than the relieving of taxes previously paid or currently owing. Four tax transfer items were identified requiring restatement. Pari-mutuel commission, tax revenue sharing with First Nations, energy assistance rebates and the low income seniors’ benefit were identified as tax transfers and as such tax revenue increased and expenses were increased by equal amounts ($19.8 million for the year ended 31 March 2010). There was no impact on net debt.
New Brunswick Lotteries and Gaming Corporation
The New Brunswick Lotteries and Gaming Corporation was accounted for previously as a government business enterprise, therefore consolidated using the modified equity method. A review of the entity this year resulted in its reclassification as an other government organization, which requires its results be fully consolidated in these financial statements. There is no impact on the deficit, net debt or accumulated deficit, however, revenues and expenses in the year ended 31 March 2010 each increased by $14.9 million and the amount of $0.2 million previously reported as an investment has now been reflected as accounts receivable.
Restatements to Net Debt and Accumulated Deficit
The tables below summarize the impact of the prior period adjustments on the opening net debt and accumulated deficit figures. The paragraphs following the tables provide additional information on these adjustments.
| | | | | | | | | |
| RESTATED NET DEBT - BEGINNING OF YEAR |
| |
| | | | | | | (millions) | | | |
| | | | 2011 | | | 2011 | | | 2010 |
| | | | Budget | | | Actual | | | Actual |
| NET DEBT - BEGINNING OF YEAR | | | | | | | | | |
| |
| As Previously Published | $ | | (8,353.1) | | $ | (8,353.1) | | $ | (7,387.8) |
| Prior Years' Adjustments | | | | | | | | | |
| Sick Leave Liability | | | -- | | | (84.4) | | | (81.5) |
| Retirement Allowance Liability | | | -- | | | (33.9) | | | (32.1) |
| RESTATED NET DEBT - BEGINNING OF YEAR | $ | | (8,353.1) | | $ | (8,471.4) | | $ | (7,501.4) |
2011 | PROVINCE OF NEW BRUNSWICK |
61 | NOTES TO THE FINANCIAL STATEMENTS
31 March 2011
| | | | | | | | | |
| RESTATED ACCUMULATED DEFICIT - BEGINNING OF YEAR |
| |
| | | | | | (millions) | | | | |
| | | 2011 | | | 2011 | | | 2010 | |
| | | Budget | | | Actual | | | Actual | |
| |
| ACCUMULATED DEFICIT - BEGINNING OF YEAR | | | | | | | | | |
| |
| As Previously Published | $ | (2,441.9) | | $ | (2,441.9) | | $ | (1,708.9) | |
| Prior Years' Adjustments | | | | | | | | | |
| Sick Leave Liability | | -- | | | (84.4) | | | (81.5) | |
| Retirement Allowance Liability | | -- | | | (33.9) | | | (32.1) | |
| Fundy Trail Parkway | | -- | | | 16.5 | | | 15.2 | |
| Deferred Maintenance on Highways | | -- | | | 104.0 | | | 85.0 | |
| | | | | | | | | |
RESTATED ACCUMULATED DEFICIT -
BEGINNING OF YEAR | | $ (2,441.9) | | | $ (2,439.7) | | | $ (1,722.3) | |
Sick Leave
The Regional Health Authorities adopted Public Sector Accounting standards during the year resulting in the need to record sick leave liability in their financial statements. The authorities had actuarial valuations completed and estimated the liability at 31 March 2010 at $84.4 million. The increase to the liability and expenses in the year ended 31 March 2010 was $2.9 million.
Retirement Allowance
The Province had a new valuation done during the year related to its retirement allowance liability. During the course of the valuation, it was determined that temporary employees had not been included in prior valuations due to the manner in which the employee data was obtained. The inclusion of this group of employees in the liability calculation resulted in a restatement of the liability and related expense retroactively, increasing the retirement allowance liability at 31 March 2010 by $33.9 million and net debt at 31 March 2010 by $32.1 million. This also resulted in increased expenses by $1.8 million for the year ended 31 March 2010.
Fundy Trail Parkway
The Fundy Trail Development Authority Inc. is an independent organization that receives grants from the Provincial and Federal governments to manage, operate and maintain the Fundy Trail Parkway. The title to the Parkway remains with the Province but the asset had not been reflected in the Province’s financial statements. The Province has retroactively reported the asset in its financial statements. For the year ended 31 March 2010, this resulted in an increase in the net book value of the tangible capital assets of $25.4 million and an increase in deferred capital contributions of $8.8 million, an increase in revenue in the year ended 31 March 2010 of $0.5 million and a decrease of expenses in that year of $0.8 million resulting in a decrease in the annual deficit of $1.3 million.
Deferred Maintenance on Highways
The New Brunswick Highway Corporation (NBHC) retroactively changed its accounting treatment of the operation, maintenance and rehabilitation (OMR) payments it pays to the contractors maintaining two portions of the highway in New Brunswick during the year ended 31 March 2011. The change in accounting treatment was made to provide better information on the capital work done on the highways. NBHC makes annual payments to the contractors to pay for capital improvements and maintenance on the highways so when the roads revert to the Province at the end of the contract, they will have been maintained to an agreed upon standard.
62 | PROVINCE OF NEW BRUNSWICK |
2011 | NOTES TO THE FINANCIAL STATEMENTS
31 March 2011
In 2011 NBHC began separating capital and maintenance amounts based on pre-established estimates identifying the amount of capital and maintenance required each year to maintain the road to a specified standard. As the pre-established estimate is subject to measurement uncertainty the timing of the annual cash payments may differ from the timing of expenditures in the pre-established estimates and both may differ from the timing of the actual construction undertaken by the contractor.
Amounts paid in advance of the anticipated dates of capital maintenance are recorded as prepaid expenses in these financial statements and capitalized as highways according to the pre-established estimate. The impact of the accounting change on these financial statements at 31 March 2010 is an increase in prepaid expenses of $85.2 million, an increase in net book value of tangible capital assets of $18.9 million resulting in a decrease in the accumulated deficit at 31 March 2010 of $104.0 million as well as a decrease in expense during the 2010 fiscal year of $19.0 million,. There is no impact on net debt.
NOTE 19 COMPARATIVE FIGURES
Certain 2010 figures have been restated to conform to 2011 presentation.
2011 | PROVINCE OF NEW BRUNSWICK |
63 | SCHEDULES TO THE FINANCIAL STATEMENTS
31 March 2011
| | (millions) |
| | 2011 | | | 2010 |
| |
| SCHEDULE 1 | | | | |
| SHORT TERM BORROWING NET OF CASH | | | | |
| |
| Short Term Investments | $ 671.3 | | $ | 744.7 |
| Cash | 41.9 | | | 35.5 |
| | 713.2 | | | 780.2 |
| Less: | | | | |
| |
| Treasury Bills 1.03% - 1.26% Maturing 28 April 2011 - 28 July 2011 | 827.0 | | | 1,313.1 |
| | $ (113.8 | ) | $ | (532.9) |
SCHEDULE 2
RECEIVABLES AND ADVANCES
| | | | |
| Accounts Receivable | | | | |
| General Receivables of Government Departments | $ | 242.3 | $ | 247.1 |
| General Receivables of Government Entities | | 37.4 | | 11.8 |
| | | 279.7 | | 258.9 |
| |
| Due from Federal Government | | | | |
| Central Government Services | | 76.4 | | 50.4 |
| Economic Development | | 69.8 | | 45.1 |
| Education | | 24.6 | | 28.7 |
| Harmonized Sales Tax Rebate | | 22.7 | | 24.4 |
| Transportation | | 13.5 | | 46.0 |
| Health | | 0.5 | | 0.7 |
| Other | | 9.2 | | 9.2 |
| | | 216.7 | | 204.5 |
| |
| Guarantee Payouts | | 100.2 | | 149.0 |
| |
| Advances | | | | |
| Advances of Grants | | 10.7 | | 37.6 |
| Working Capital Advances | | 6.2 | | 6.1 |
| Other | | 12.4 | | 16.1 |
| | | 29.3 | | 59.8 |
| Interest Receivable | | | | |
| Student Loans | | 12.8 | | 10.8 |
| Economic Development Act | | 7.3 | | 12.2 |
| Fisheries Development Act | | 6.9 | | 7.9 |
| Agricultural Development Act | | 0.1 | | 0.1 |
| Other | | 37.0 | | 30.0 |
| | | 64.1 | | 61.0 |
| |
| | | 690.0 | | 733.2 |
| Less: Allowance for Doubtful Accounts | | 250.2 | | 306.0 |
| | $ | 439.8 | $ | 427.2 |
64 | PROVINCE OF NEW BRUNSWICK |
2011 | SCHEDULES TO THE FINANCIAL STATEMENTS
31 March 2011
| | | | | |
| | | (millions) |
| | | 2011 | | | 2010 |
| |
| SCHEDULE 3 | | | | | |
| TAXES RECEIVABLE | | | | | |
| |
| Real Property Tax | $ | 984.0 | $ | | 961.0 |
| Sales Tax | | 98.2 | | | 97.4 |
| Tobacco Tax | | 24.3 | | | 23.8 |
| Gasoline and Motive Fuels Tax | | 19.3 | | | 17.2 |
| Royalties and Stumpage on Timber | | 10.1 | | | 8.5 |
| Metallic Minerals Tax | | 1.0 | | | -- |
| Other | | 7.7 | | | 4.1 |
| | | 1,144.6 | | | 1,112.0 |
| Less: Allowance for Doubtful Accounts | | 43.8 | | | 61.8 |
| | $ | 1,100.8 | $ | | 1,050.2 |
| |
| SCHEDULE 4 | | | | | |
| INVENTORIES FOR RESALE | | | | | |
| |
| Inventories for Resale | | | | | |
| Properties Held for Sale | $ | 1.7 | $ | | 9.3 |
2011 | PROVINCE OF NEW BRUNSWICK |
65 | SCHEDULES TO THE FINANCIAL STATEMENTS
31 March 2011
| | | | | | | | | | | | | | |
| | (millions) |
| | 2011 | | 2010 |
| | | | | Allowance | | | | | | | Allowance | | | |
| | | | | for Doubtful | | | | | | | for Doubtful | | | |
| | | Amount | | Accounts | | | Net | | Amount | | Accounts | | | Net |
| SCHEDULE 5 | | | | | | | | | | | | | | |
| LOANS | | | | | | | | | | | | | | |
| |
| Loans to Students | $ | 415.1 | $ | 89.5 | $ | | 325.6 | $ | 391.0 | $ | 80.7 | $ | | 310.3 |
| Economic Development Act | | 314.3 | | 132.0 | | | 182.3 | | 303.6 | | 175.3 | | | 128.3 |
| New Brunswick Housing Act | | 33.8 | | 2.7 | | | 31.1 | | 35.9 | | 3.8 | | | 32.1 |
| Energy Efficiency Upgrade Loans | | 14.3 | | 0.3 | | | 14.0 | | 11.1 | | 0.5 | | | 10.6 |
| Fisheries Development Act | | 29.4 | | 19.7 | | | 9.7 | | 35.2 | | 26.1 | | | 9.1 |
| Agricultural Development Act | | 9.8 | | 1.7 | | | 8.1 | | 11.2 | | 3.3 | | | 7.9 |
| Provincial Holdings Ltd. | | 7.6 | | 2.6 | | | 5.0 | | 2.6 | | 2.6 | | | -- |
| L'Office de Stabilisation | | 4.0 | | -- | | | 4.0 | | 4.1 | | -- | | | 4.1 |
| Fundy Trail Endowment Fund | | 3.5 | | -- | | | 3.5 | | 3.3 | | -- | | | 3.3 |
| Loans to Municipalities | | 1.6 | | -- | | | 1.6 | | 3.4 | | -- | | | 3.4 |
| Beaverbrook Art Gallery | | 7.6 | | 6.1 | | | 1.5 | | 6.6 | | 6.6 | | | -- |
| La Fondation du quotidien | | | | | | | | | | | | | | |
| francophone | | 4.0 | | 4.0 | | | -- | | 4.0 | | 4.0 | | | -- |
| Unsatisfied Judgements | | 9.4 | | 9.4 | | | -- | | 9.5 | | 9.5 | | | -- |
| Other Loans | | 4.1 | | 1.1 | | | 3.0 | | 0.9 | | 0.9 | | | -- |
| |
| | $ | 858.5 | $ | 269.1 | $ | | 589.4 | $ | 822.4 | $ | 313.3 | $ | | 509.1 |
66 | PROVINCE OF NEW BRUNSWICK |
2011 | SCHEDULES TO THE FINANCIAL STATEMENTS
31 March 2011
| | (millions) |
| SCHEDULE 6 | | 2011 | | | 2010 |
| INVESTMENTS | | | | | |
| |
| Investment in Government Enterprises | | | | | |
| New Brunswick Liquor Corporation | $ | 21.9 | | $ | 22.1 |
| New Brunswick Securities Commission | | 3.4 | | | 4.2 |
| New Brunswick Municipal Finance Corporation | | 1.0 | | | 1.0 |
| New Brunswick Electric Finance Corporation | | (105.2) | | | (226.5) |
| | | (78.9) | | | (199.2) |
| Other Long Term Investments | | 24.5 | | | 24.6 |
| | $ | (54.4) | | $ | (174.6) |
| |
| |
| SCHEDULE 7 | | | | | |
| ACCOUNTS PAYABLE AND ACCRUED EXPENSES | | | | | |
| |
| Accounts Payable | $ | 603.7 | | $ | 465.2 |
| Due to Canada | | | | | |
| Equalization and Canada Health and Social Transfer | | 104.2 | | | 125.0 |
| Canada Mortgage and Housing Corporation | | 35.1 | | | 36.5 |
| Other Agreements | | 1.2 | | | 1.5 |
| | | 140.5 | | | 163.0 |
| |
| Accrued Interest | | | | | |
| Funded Debt | | 132.2 | | | 112.0 |
| Other | | 77.9 | | | 79.0 |
| | | 210.1 | | | 191.0 |
| |
| Employee Benefits | | | | | |
| Retirement Allowances | | 357.1 | | | 349.0 |
| Accrued Salaries Payable | | 333.3 | | | 341.8 |
| Liability for Injured Workers | | 132.7 | | | 133.9 |
| | | 823.1 | | | 824.7 |
| |
| Municipal Property Taxes Due to Municipalities | | 401.5 | | | 385.8 |
| Holdbacks on Contracts | | 26.6 | | | 17.7 |
| Medicare and Out of Province Payments | | 26.5 | | | 28.9 |
| Hospital Liability Protection Plan | | 15.2 | | | 14.0 |
| Strategic Assistance | | 13.7 | | | 21.4 |
| Other | | 118.4 | | | 106.9 |
| | | 601.9 | | | 574.7 |
| | $ | 2,379.3 | | $ | 2,218.6 |
2011 | PROVINCE OF NEW BRUNSWICK |
67 | SCHEDULES TO THE FINANCIAL STATEMENTS
31 March 2011
| (millions) |
| SCHEDULE 8 | | | | |
| ALLOWANCE FOR LOSSES | | 2011 | | 2010 |
| |
| Business New Brunswick | $ | 40.3 | $ | 30.3 |
| Property Tax Appeals | | 14.5 | | 20.8 |
| Post-Secondary Education, Training and Labour | | 0.1 | | 0.1 |
| Other | | 110.4 | | 44.3 |
| | $ | 165.3 | $ | 95.5 |
| |
| |
| SCHEDULE 9 | | | | |
| DEFERRED REVENUE | | | | |
| |
| Real Property Taxes | $ | 338.7 | $ | 323.1 |
| Motor Vehicle and Operators' Licenses | | 52.0 | | 50.2 |
| Deferred Federal Revenue | | 4.4 | | 10.8 |
| Other | | 74.4 | | 44.6 |
| | $ | 469.5 | $ | 428.7 |
| |
| |
| SCHEDULE 10 | | | | |
| DEPOSITS HELD IN TRUST | | | | |
| |
| Retention Fund for Fee for Service Physicians | $ | 28.2 | $ | 23.8 |
| New Brunswick Immigrant Investor Fund (2009) Ltd. | | 27.0 | | -- |
| Tenants' Security Deposits | | 18.7 | | 17.6 |
| Court of Queen's Bench | | 10.3 | | 11.0 |
| Contractors' Deposits | | 6.8 | | 6.5 |
| Mining Licenses - Non-Performance Renewal Fees | | 5.8 | | 7.3 |
| Scholarship Trusts | | 3.6 | | 3.7 |
| Family Support Order Services | | 1.4 | | 1.3 |
| Sale of Property for Taxes | | 1.3 | | 1.3 |
| Other | | 22.4 | | 26.2 |
| | $ | 125.5 | $ | 98.7 |
68 | PROVINCE OF NEW BRUNSWICK |
2011 | SCHEDULES TO THE FINANCIAL STATEMENTS
31 March 2011
| | | | | |
| SCHEDULE 11 | | | | | |
| OBLIGATIONS UNDER CAPITAL LEASES | | 2011 | | | 2010 |
| |
| Highways | $ | 714.7 | $ | | 736.4 |
| Protection | | 71.0 | | | 16.1 |
| Education | | 49.6 | | | 5.9 |
| Other | | 6.0 | | | 7.1 |
| | $ | 841.3 | $ | | 765.5 |
| |
| SCHEDULE 12 | | | | | |
| INVENTORIES OF SUPPLIES | | | | | |
| |
| Health Supplies and Vaccines | $ | 28.2 | $ | | 30.6 |
| Construction and Maintenance Materials | | 13.0 | | | 14.6 |
| Machine Repair Parts | | 6.3 | | | 6.9 |
| Stationery and Supplies | | 2.1 | | | 2.2 |
| Veterinary Supplies | | 1.1 | | | 1.0 |
| Educational Textbooks | | 1.0 | | | 1.3 |
| Other Supplies | | 8.0 | | | 6.3 |
| | $ | 59.7 | $ | | 62.9 |
| |
| |
| SCHEDULE 13 | | | | | |
| PREPAID AND DEFERRED CHARGES | | | | | |
| |
| Public Private Partnership Contracts | $ | 95.8 | $ | | 85.2 |
| Unamortized Premiums, Discounts, and Issue Expenses on Debentures | | 77.9 | | | 84.4 |
| Deferred Financing Charges | | 1.7 | | | -- |
| Other | | 24.4 | | | 18.8 |
| | $ | 199.8 | $ | | 188.4 |
2011 | PROVINCE OF NEW BRUNSWICK |
69 | SCHEDULES TO THE FINANCIAL STATEMENTS
31 March 2011
| | | | | | | |
| | (millions) |
| | | | 2011 | | 2011 | | 2010 |
| | | | Budget | | Actual | | Actual |
| |
| SCHEDULE 14 | | | | | | | |
| TAXES | | | | | | | |
| |
| Personal Income Tax | $ | | 1,202.6 | $ | 1,224.6 | $ | 1,306.0 |
| Corporate Income Tax | | | 187.3 | | 257.6 | | 200.3 |
| Metallic Minerals Tax | | | 8.0 | | 26.2 | | 32.5 |
| | | | 1,397.9 | | 1,508.4 | | 1,538.8 |
| |
| Provincial Real Property Tax | | | 420.0 | | 426.8 | | 411.9 |
| |
| Harmonized Sales Tax | | | 1,012.3 | | 1,055.2 | | 934.4 |
| Gasoline and Motive Fuels Tax | | | 202.8 | | 210.8 | | 199.9 |
| Tobacco Tax | | | 101.8 | | 126.8 | | 107.7 |
| Pari-mutuel Tax | | | 0.6 | | 0.6 | | 0.6 |
| | | | 1,317.5 | | 1,393.4 | | 1,242.6 |
| |
| Insurance Premium Tax | | | 41.9 | | 44.9 | | 42.5 |
| Financial Corporation Capital Tax | | | 8.0 | | 17.9 | | 12.7 |
| Large Corporation Capital Tax | | | -- | | 7.2 | | 9.2 |
| Other | | | 7.0 | | 6.3 | | 6.0 |
| | | | 56.9 | | 76.3 | | 70.4 |
| | $ | | 3,192.3 | $ | 3,404.9 | $ | 3,263.7 |
| |
| SCHEDULE 15 | | | | | | | |
| LICENSES AND PERMITS | | | | | | | |
| |
| Motor Vehicle | $ | | 104.7 | $ | 111.8 | $ | 104.2 |
| Fish and Wildlife | | | 6.1 | | 6.3 | | 5.9 |
| Mines | | | 2.0 | | 2.0 | | 4.3 |
| Liquor Licenses | | | 1.2 | | 1.0 | | 0.9 |
| Other | | | 13.6 | | 13.3 | | 13.7 |
| | $ | | 127.6 | $ | 134.4 | $ | 129.0 |
| |
| SCHEDULE 16 | | | | | | | |
| ROYALTIES | | | | | | | |
| |
| Forest | $ | | 64.8 | $ | 69.1 | $ | 51.5 |
| Mines | | | 18.8 | | 18.4 | | 10.8 |
| | $ | | 83.6 | $ | 87.5 | $ | 62.3 |
70 | PROVINCE OF NEW BRUNSWICK |
2011 | SCHEDULES TO THE FINANCIAL STATEMENTS
31 March 2011
| | | | | | | | | |
| | (millions) |
| | | | 2011 | | | 2011 | | 2010 | |
| | | | Budget | | | Actual | | Actual | |
| |
| SCHEDULE 17 | | | | | | | | | |
| INVESTMENT INCOME | | | | | | | | | |
| |
| Net Income of Government Enterprises | | | | | | | | | |
| New Brunswick Liquor Corporation | $ | | 167.3 | $ | | 159.4 | $ | 157.9 | |
| New Brunswick Securities Commission | | | 5.7 | | | 7.1 | | 6.4 | |
| New Brunswick Municipal Finance Corporation | | | -- | | | -- | | 0.1 | |
| New Brunswick Electric Finance Corporation | | | -- | | | 10.8 | | (212.2 | ) |
| | | | 173.0 | | | 177.3 | | (47.8 | ) |
| Other Investment Income | | | 41.1 | | | 41.2 | | 38.6 | |
| | $ | | 214.1 | $ | | 218.5 | $ | (9.2 | ) |
| |
| SCHEDULE 18 | | | | | | | | | |
| OTHER PROVINCIAL REVENUE | | | | | | | | | |
| |
| Sales of Goods and Services | | | | | | | | | |
| General | $ | | 226.8 | $ | | 229.0 | $ | 221.5 | |
| Institutional | | | 27.7 | | | 26.9 | | 27.2 | |
| Leases and Rentals | | | 22.5 | | | 22.8 | | 22.3 | |
| Intergovernmental | | | 8.6 | | | 9.1 | | 8.8 | |
| Provincial Parks | | | 5.5 | | | 5.6 | | 5.0 | |
| Lotteries and Gaming | | | 149.6 | | | 137.3 | | 130.8 | |
| Fines and Penalties | | | 11.7 | | | 13.8 | | 13.9 | |
| Other Revenue | | | 49.3 | | | 64.1 | | 55.2 | |
| | $ | | 501.7 | $ | | 508.6 | $ | 484.7 | |
| |
| SCHEDULE 19 | | | | | | | | | |
| UNCONDITIONAL GRANTS | | | | | | | | | |
| |
| Canada Health Transfer | $ | | 589.6 | $ | | 579.4 | $ | 554.8 | |
| Canada Social Transfer | | | 246.8 | | | 246.7 | | 241.1 | |
| Wait Times Reduction Transfer | | | 5.6 | | | 5.5 | | 5.6 | |
| Statutory Subsidies | | | 1.9 | | | 1.9 | | 1.9 | |
| | $ | | 843.9 | $ | | 833.5 | $ | 803.4 | |
2011 | PROVINCE OF NEW BRUNSWICK |
71 | SCHEDULES TO THE FINANCIAL STATEMENTS
31 March 2011
| | (millions) |
| | | | 2011 | | | 2011 | | 2010 | |
| | | | Budget | | | Actual | | Actual | |
| |
| SCHEDULE 20 | | | | | | | | | |
| CONDITIONAL GRANTS | | | | | | | | | |
| |
| Education | $ | | 172.4 | $ | | 165.6 | $ | 172.4 | |
| Economic Development | | | 155.3 | | | 81.8 | | 94.3 | |
| Central Government Services | | | 54.4 | | | 61.5 | | 45.4 | |
| Amortization of Deferred Capital Contributions | | 34.2 | | | 37.1 | | 34.9 | |
| Health | | | 29.6 | | | 32.9 | | 39.9 | |
| Social Services | | | 4.8 | | | 4.7 | | 4.8 | |
| Transportation | | | 0.3 | | | 0.3 | | 1.0 | |
| Other | | | 13.4 | | | 40.1 | | 15.5 | |
| | $ | | 464.4 | $ | | 424.0 | $ | 408.2 | |
| |
| SCHEDULE 21 | | | | | | | | | |
| EDUCATION AND TRAINING | | | | | | | | | |
| |
| Education | $ | | 1,019.7 | $ | | 1,009.7 | $ | 981.4 | |
| Post-Secondary Education Services | | 472.0 | | | 467.4 | | 459.3 | |
| Pension Expense | | | 112.7 | | | 115.5 | | 130.5 | |
| Amortization Expense | | | 32.8 | | | 33.7 | | 30.8 | |
| Provision Expense | | | 12.5 | | | 14.6 | | 19.9 | |
| Supply and Services | | | 6.3 | | | 10.5 | | 4.9 | |
| General Government | | | 0.8 | | | 3.7 | | (5.1 | ) |
| | $ | | 1,656.8 | $ | | 1,655.1 | $ | 1,621.7 | |
| |
| SCHEDULE 22 | | | | | | | | | |
| HEALTH | | | | | | | | | |
| |
| Health Services | | | 2,575.4 | | | 2,611.7 | | 2,484.4 | |
| Amortization Expense | | | 72.5 | | | 62.3 | | 66.0 | |
| Pension Expense | | | 13.2 | | | 13.2 | | 36.6 | |
| Supply and Services | | | -- | | | -- | | 0.9 | |
| | $ | | 2,661.1 | $ | | 2,687.2 | $ | 2,587.9 | |
72 | PROVINCE OF NEW BRUNSWICK |
2011 | SCHEDULES TO THE FINANCIAL STATEMENTS
31 March 2011
| | | | | | (millions) | | | |
| | | | 2011 | | 2011 | | | 2010 |
| | | | Budget | | Actual | | | Actual |
| |
| SCHEDULE 23 | | | | | | | | |
| SOCIAL DEVELOPMENT | | | | | | | | |
| |
| Social Development | $ | | 1,041.7 | $ | 1,075.1 | $ | | 978.3 |
| Provision Expense | | | 4.0 | | 3.4 | | | 3.8 |
| Amortization Expense | | | 1.5 | | 1.3 | | | 1.2 |
| General Government | | | 1.1 | | 1.0 | | | 1.1 |
| | $ | | 1,048.3 | $ | 1,080.8 | $ | | 984.4 |
| |
| SCHEDULE 24 | | | | | | | | |
| PROTECTION SERVICES | | | | | | | | |
| |
| Public Safety | $ | | 144.9 | $ | 181.6 | $ | | 143.2 |
| Justice and Consumer Affairs | | | 32.1 | | 36.3 | | | 38.5 |
| Attorney General | | | 17.0 | | 16.1 | | | 16.1 |
| New Brunswick Legal Aid Services Commission | | 6.9 | | 7.2 | | | 7.6 |
| Provision Expense | | | 0.3 | | 3.4 | | | 1.0 |
| Supply and Services | | | -- | | 2.8 | | | -- |
| Pension Expense | | | 1.4 | | 2.6 | | | 2.5 |
| General Government | | | 0.4 | | 0.3 | | | 0.3 |
| New Brunswick Credit Union Deposit Insurance Corporation | | 1.2 | | 0.2 | | | 0.2 |
| Amortization Expense | | | -- | | 0.1 | | | 0.1 |
| | $ | | 204.2 | $ | 250.6 | $ | | 209.5 |
| |
| SCHEDULE 25 | | | | | | | | |
| ECONOMIC DEVELOPMENT | | | | | | | | |
| |
| Regional Development Corporation | $ | | 292.4 | $ | 237.2 | $ | | 203.9 |
| Tourism and Parks | | | 31.3 | | 32.3 | | | 33.5 |
| Business New Brunswick | | | 38.2 | | 29.5 | | | 28.5 |
| Provision Expense | | | 17.0 | | 18.3 | | | 67.0 |
| Post-Secondary Education, Training and Labour | | 4.4 | | 4.1 | | | 4.5 |
| Kings Landing Corporation | | | 3.3 | | 3.8 | | | 3.3 |
| Amortization Expense | | | 1.1 | | 3.1 | | | 3.0 |
| New Brunswick Immigrant Investor Fund (2009) Ltd. | | -- | | 0.1 | | | -- |
| | $ | | 387.7 | $ | 328.4 | $ | | 343.7 |
2011 | PROVINCE OF NEW BRUNSWICK |
73 |
SCHEDULES TO THE FINANCIAL STATEMENTS
31 March 2011
| | | | | | | (millions) | | | | |
| | | | | 2011 | | 2011 | | | 2010 | |
| | | | | Budget | | Actual | | | Actual | |
| |
| SCHEDULE 26 | | | | | | | | | | |
| LABOUR AND EMPLOYMENT | | | | | | | | | |
| |
| Post-Secondary Education, Training and Labour | | | 148.1 | $ | 141.1 | | $ | 140.9 | |
| General Government | | | | 0.6 | | 0.6 | | | 0.6 | |
| | | | | 148.7 | $ | 141.7 | | $ | 141.5 | |
| |
| SCHEDULE 27 | | | | | | | | | | |
| RESOURCES | | | | | | | | | | |
| |
| Natural Resources | | | | 115.4 | $ | 114.6 | | $ | 113.0 | |
| Agriculture and Aquaculture | | | | 36.2 | | 38.4 | | | 34.9 | |
| Energy Efficiency and Conservation Agency of | | | | | | | | | |
| New Brunswick | | | | 17.7 | | 23.0 | | | 14.1 | |
| Environment | | | | 21.4 | | 21.1 | | | 21.1 | |
| Forest Protection Limited | | | | 5.3 | | 5.4 | | | 5.8 | |
| Recycle New Brunswick | | | | 4.3 | | 4.8 | | | 4.0 | |
| Energy | | | | 3.5 | | 3.4 | | | 3.5 | |
| Fisheries | | | | 4.7 | | 3.4 | | | 4.0 | |
| Amortization Expense | | | | 0.4 | | 1.3 | | | 1.2 | |
| Supply and Services | | | | -- | | 1.1 | | | 0.7 | |
| Provision Expense | | | | 3.3 | | (1.4 | ) | | 3.5 | |
| | | | | 212.2 | $ | 215.1 | | $ | 205.8 | |
| |
| SCHEDULE 28 | | | | | | | | | | |
| TRANSPORTATION | | | | | | | | | | |
| |
| Transportation | | | | 211.6 | $ | 212.7 | | $ | 204.7 | |
| Amortization Expense | | | | 185.3 | | 188.2 | | | 176.5 | |
| Supply and Services | | | | -- | | 0.3 | | | 0.4 | |
| Provision Expense | | | | 0.3 | | 1.5 | | | (0.2 | ) |
| | | | | 397.2 | $ | 402.7 | | $ | 381.4 | |
74 | PROVINCE OF NEW BRUNSWICK |
2011 | SCHEDULES TO THE FINANCIAL STATEMENTS
31 March 2011
| | | (millions) |
| | | 2011 | | 2011 | | | 2010 |
| | | Budget | | Actual | | | Actual |
| |
| SCHEDULE 29 | | | | | | | |
| CENTRAL GOVERNMENT | | | | | | | |
| |
| Pension Expense | $ | 142.1 | $ | 133.3 | $ | | 151.6 |
| Supply and Services | | 120.9 | | 126.7 | | | 129.0 |
| Local Government | | 119.4 | | 116.0 | | | 114.9 |
| General Government | | 115.9 | | 87.8 | | | 76.7 |
| Service New Brunswick | | 61.8 | | 55.9 | | | 56.9 |
| Provision Expense | | 6.0 | | 54.7 | | | 22.7 |
| Legislative Assembly | | 30.4 | | 30.3 | | | 21.7 |
| Wellness, Culture and Sport | | 20.1 | | 20.0 | | | 20.9 |
| New Brunswick Internal Services Agency | 20.0 | | 18.4 | | | -- |
| New Brunswick Lotteries and Gaming Corporation | 14.0 | | 16.2 | | | 14.9 |
| Amortization Expense | | 13.1 | | 16.0 | | | 14.8 |
| Algonquin Golf and Algonquin Properties Ltd. | 9.6 | | 13.2 | | | 9.5 |
| Finance | | 13.0 | | 11.9 | | | 12.6 |
| New Brunswick Investment Management Corporation | 11.6 | | 7.9 | | | 11.3 |
| Executive Council | | 5.7 | | 5.5 | | | 5.4 |
| Office of the Comptroller | | 4.1 | | 3.8 | | | 4.3 |
| Office of Human Resources | | 3.4 | | 3.0 | | | 5.3 |
| Intergovernmental Affairs | | 2.8 | | 2.7 | | | 3.5 |
| Office of the Premier | | 2.2 | | 2.2 | | | 1.7 |
| | $ | 716.1 | $ | 725.5 | $ | | 677.7 |