2012-2013 Economic Outlook
Published by:
Department of Finance
Province of New Brunswick
P.O. Box 6000
Fredericton, New Brunswick E3B 5H1 Canada
Internet: www.gnb.ca/0024/index-e.asp
March 27, 2012
Cover:
Government Services (GS 8611)
Translation:
Translation Bureau, Government Services
Printing and Binding:
Printing Services, Government Services
ISBN 978-1-55396-351-6
Printed in New Brunswick
 | Think Recycling! |
| 2012-2013 Economic Outlook |
Global Economy
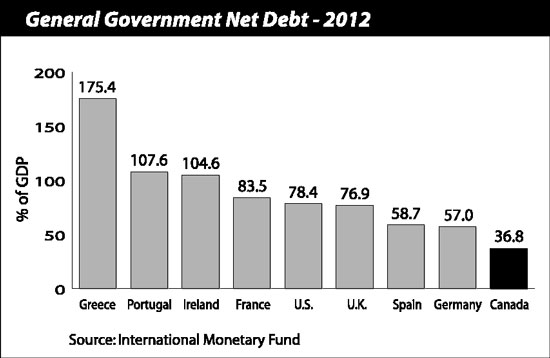
| ● | According to the International Monetary Fund (IMF), global output expanded by 3.8% in 2011. Real Gross Domestic Product (GDP) growth was led by emerging and developing economies, which grew by an estimated 6.2%. Advanced economies grew by a modest 1.6%. |
| | |
| ● | The global outlook deteriorated in the final quarter of 2011 largely a result of the level of sovereign debt and its impact on international trade and financial conditions setting the tone for weaker growth in 2012. |
| ● | The IMF anticipates global growth of 3.3% in 2012. Advanced economies are expected to expand by only 1.2% in 2012. Growth prospects are strongest for the U.S., Canada and Japan, with expansion in the neighbourhood of 1.8%. |
| 2012-2013 Economic Outlook |
| ● | The euro area economy is expected to slip back into recession. Economic output is expected to decline by half of a percentage point due to weakness in the banking sector, ongoing fiscal restraint, high unemployment rates, limited access to credit and rising government bond yields. Italy and Spain are expected to report the weakest performances among the advanced economies. |
| | |
| ● | Emerging and developing economies are projected to grow by 5.4% and will once again be the drivers of growth in 2012. China and India will lead the way, albeit at a slower pace, due to weaker global trade and previous measures to contain inflationary pressures within their respective economies. The IMF is projecting growth of 8.2% in China and 7.0% in India. |
| | |
| ● | The U.S. economy posted stronger-than-anticipated growth in the second half of 2011, as healthy gains in full-time employment and pent-up demand fueled consumer expenditures. Despite these positive developments, spillover effects from the European crisis and fiscal consolidation among governments will lead to more modest U.S. growth in 2012. |
| | |
| ● | Consumer expenditure growth in the U.S. will be limited in 2012 by tightened lending standards among banks, soft employment growth and households reducing their debt loads. Growth will rely mainly on exports and business investment, which, for the latter, will be moderate despite strong corporate balance sheets. |
| | | 2012-2013 Economic Outlook |
Canadian Economy
| ● | Supported largely by growth in domestic demand, the Canadian economy is estimated to have grown by 2.5% in 2011, a marked slowing from the 3.2% pace set in 2010. Economic activity was led by business investment, consumer spending and housing, while government expenditures were flat. Net exports acted as a drag on the Canadian economy. |
| | |
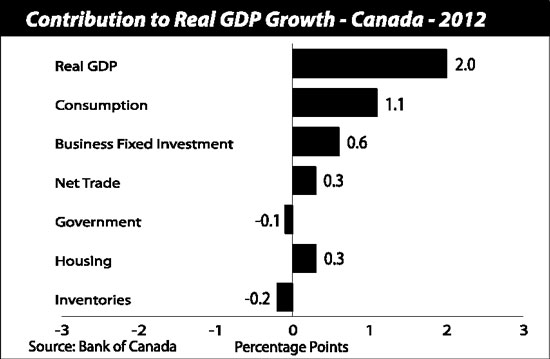
| ● | Growth in 2012 is expected to slow to 2.0%, as favourable credit conditions and healthy confidence levels support gains in personal expenditure and business investment. |
| ● | Net trade, on the other hand, is expected to contribute little to overall growth due to weak external demand for commodities. |
| | |
| ● | Low mortgage rates will keep housing activity near current levels, although there is concern that rapid price growth seen in recent years in some of the larger markets across the country could lead to a housing slowdown. |
| 2012-2013 Economic Outlook |
| ● | Roughly 265,000 jobs were added to the economy in 2011, with Ontario, Alberta and Quebec registering the strongest gains. However, the labour market situation deteriorated somewhat as the year came to a close. More modest job growth is expected for 2012. |
| | |
| ● | Inflationary pressures are expected to moderate in 2012 as the domestic economy continues to operate below capacity and energy prices remain stable. |
| | |
| ● | Interest rates are not expected to increase in the foreseeable future due to moderating inflationary pressures and weaker global growth prospects. Rate cuts are unlikely unless world developments cause domestic growth to slow considerably. The Canadian dollar will remain near parity for much of 2012. |
| | |
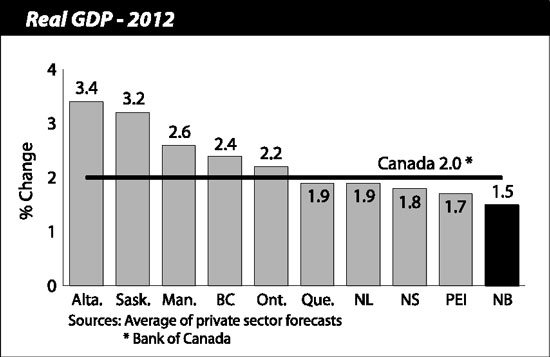
| ● | According to consensus among private sector forecasters, economic growth is expected to be strongest in the western provinces such as Alberta and Saskatchewan, while the Maritime provinces should remain at or slightly below historical averages. |
| 2012-2013 Economic Outlook |
Statistical Summary - Growth Rates1 |
| | 2010 to 2011 |
| | N.B. | Canada |
| Population and Labour | | |
| Total Population (July 1) | 0.3 | 1.0 |
| Labour Force | -0.8 | 0.9 |
| Employment | -1.2 | 1.6 |
| Unemployment Rate (%) | 9.5 | 7.4 |
| Participation Rate (%) | 62.8 | 66.8 |
| Wages and Salaries | 3.9 | 4.7 |
| Consumers and Housing | | |
| Retail Sales | 4.9 | 3.6 |
| Consumer Price Index | 3.5 | 2.9 |
| Housing Starts | -15.8 | 2.1 |
| Business | | |
| Manufacturing Sales | 14.8 | 7.8 |
| Foreign Exports | 17.0 | 12.0 |
| Building Permits | -14.8 | 2.1 |
1 Per cent change unless otherwise indicated. |
| Source: Statistics Canada. | | |
New Brunswick Economy
| ● | The Department of Finance is projecting real GDP growth of 1.2% in 2011 down from 1.5% at budget last year due to growing uncertainty in the rest of the world. This is consistent with projections from the private sector financial community. |
| | |
| ● | Moderate growth in wages, in spite of the weak performance in employment, supported robust consumer expenditures in the province. |
| | |
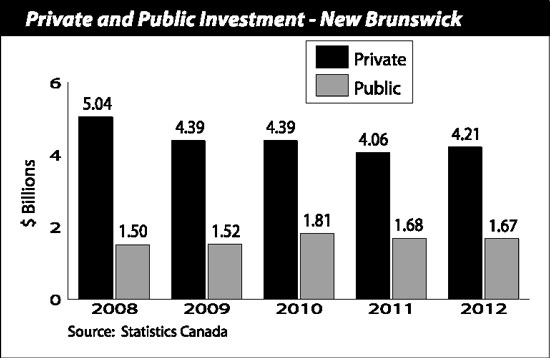
| ● | Rising commodity prices resulted in a 17.0% increase in exports in 2011. However, when adjusted for price growth, exports remained stable following a strong year in 2010. A slowdown in mineral production in the fourth quarter of 2011 offset an otherwise healthy performance in the mining sector. Private and public investment levels were down from the previous year acting as a drag on economic activity in the province. |
| 2012-2013 Economic Outlook |
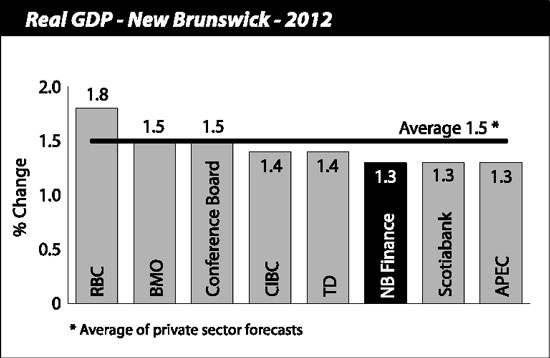
| ● | The Department of Finance anticipates growth of 1.3% in 2012, consistent with growth anticipated by private sector forecasters. Continued strength from consumer expenditures along with an improvement in the province’s labour force should yield modest growth in 2012. |
| ● | Growth in capital formation is expected to be driven by investment in the mining, utilities and manufacturing sectors in 2012. Cutbacks in public sector capital spending, along with the absence of any major projects, will prevent overall investment from contributing any substantial amount to economic growth. |
| 2012-2013 Economic Outlook |
New Brunswick Economic Indicators
Growth Rates1, 2009 to 2016
| | | | | | | | | | | | | | | | | | | | |
| | | | | | | | | | | | | | | | | | | 2014 | |
| | | | 2009 | | | 2010 | | | 2011 | | | 2012 | | | 2013 | | | 2016 | |
| Economic Accounts * | | | | | | | | | | | | | | | | | | | |
| Gross Domestic Product (GDP) | | | 1.5 | | | 5.5 | | | 4.5 | | | 3.2 | | | 4.5 | | | 3.9 | |
| Personal Expenditures | | | 2.0 | | | 3.9 | | | 5.1 | | | 4.3 | | | 4.6 | | | 4.0 | |
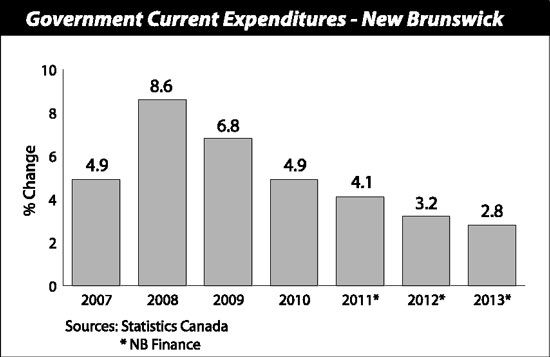
| Government Current Expenditures | | | 6.8 | | | 4.9 | | | 4.1 | | | 3.2 | | | 2.8 | | | 3.0 | |
| Gross Fixed Capital Formation | | | -8.8 | | | -1.0 | | | -5.7 | | | 3.1 | | | 3.7 | | | 2.5 | |
| GDP (real) | | | -0.4 | | | 3.1 | | | 1.2 | | | 1.3 | | | 2.1 | | | 1.8 | |
| Income * | | | | | | | | | | | | | | | | | | | |
| Personal Income | | | 2.7 | | | 3.4 | | | 4.1 | | | 3.6 | | | 3.8 | | | 3.7 | |
| Labour Income | | | 2.6 | | | 4.0 | | | 3.9 | | | 4.0 | | | 3.8 | | | 3.4 | |
| Corporate Profits Before Taxes | | | -7.4 | | | 18.5 | | | 4.0 | | | 3.7 | | | 18.1 | | | 4.3 | |
| Population and Labour | | | | | | | | | | | | | | | | | | | |
| Total Population (July 1) | | | 0.4 | | | 0.4 | | | 0.3 | | | 0.3 | | | 0.2 | | | 0.2 | |
| Labour Force | | | 0.4 | | | -0.4 | | | -0.8 | | | 0.5 | | | 0.6 | | | 0.3 | |
| Employment | | | 0.1 | | | -0.9 | | | -1.2 | | | 0.6 | | | 0.8 | | | 0.4 | |
| Unemployment Rate (%) | | | 8.8 | | | 9.3 | | | 9.5 | | | 9.5 | | | 9.3 | | | 9.1 | |
| Participation Rate (%) | | | 64.2 | | | 63.6 | | | 62.8 | | | 62.7 | | | 62.9 | | | 62.9 | |
| Other | | | | | | | | | | | | | | | | | | | |
| Consumer Price Index | | | 0.3 | | | 2.1 | | | 3.5 | | | 1.7 | | | 1.6 | | | 2.0 | |
| Housing Starts | | | -17.6 | | | 16.5 | | | -15.8 | | | -7.3 | | | -3.1 | | | -3.4 | |
1 Per cent change unless otherwise indicated. |
| Sources: Statistics Canada. |
| * 2011-2016 NB Finance. |
| ● | High gasoline prices in 2011, largely brought about by global demand pressures, pushed the consumer price index (CPI) to 3.5% in 2011. Stable fuel prices should result in inflation returning to growth below 2.0% in 2012. |
| | |
| ● | Residential construction is expected to remain weak in 2012 due to limited job growth restraining consumer demand for new homes. |
| 2012-2013 Economic Outlook |
| ● | The contribution of government expenditures to economic growth will continue to be minimal in 2012 due to fiscal restraint by all levels of government. |
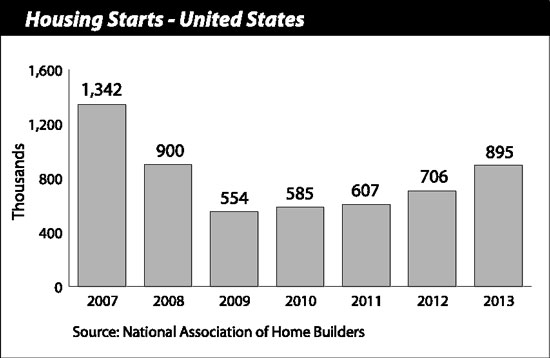
| ● | A modest increase in U.S. housing activity should bode well for exporters of forest products, while reduced refinery capacity in the eastern U.S. should support energy exports from the province. |
| 2012-2013 Economic Outlook |
| ● | The province’s labour market experienced another difficult year in 2011. Employment was down 1.2% (-4,100 jobs) as gains in part-time jobs were not enough to offset full-time losses. The employment picture brightened with slight gains in the final quarter of the year. Modest job growth is expected in 2012. |
| | |
| ● | Further net trade gains are expected from the utilities sector as the Point Lepreau nuclear power plant is scheduled to resume production late in 2012, thereby reducing the province’s need to import replacement power. |
| | |
| ● | Looking ahead to 2013, New Brunswick’s forestry sector should benefit from continued improvement in the U.S. housing market. Increased potash production, resulting from the completion of the expansion at the existing mine site, should partially offset the closure of Brunswick Mine. Production and exploration from other smaller mines around the province should also help mitigate the closure. |
| 2012-2013 Economic Outlook |
New Brunswick Annual Indicators
New Brunswick Annual Indicators (as of March 12, 2012)
| | | | | | | | | | | | | | | | % Change | |
| Indicators | | | 2008 | | | 2009 | | | 2010 | | | 2011 | | | 2008-09 | | | 2009-10 | | | 2010-11 | |
| Labour | | | | | | | | | | | | | | | | | | | | | | |
| Population 15 Years and Over ('000) | | | 610.7 | | | 613.9 | | | 616.8 | | | 619.4 | | | 0.5 | | | 0.5 | | | 0.4 | |
| Labour Force ('000) | | | 392.6 | | | 394.2 | | | 392.5 | | | 389.2 | | | 0.4 | | | -0.4 | | | -0.8 | |
| Employment ('000) | | | 359.1 | | | 359.5 | | | 356.1 | | | 352.0 | | | 0.1 | | | -0.9 | | | -1.2 | |
| Full-time ('000) | | | 302.5 | | | 302.3 | | | 301.7 | | | 294.7 | | | -0.1 | | | -0.2 | | | -2.3 | |
| Part-time ('000) | | | 56.6 | | | 57.3 | | | 54.4 | | | 57.4 | | | 1.2 | | | -5.1 | | | 5.5 | |
| Goods-producing Industries ('000) | | | 79.7 | | | 80.6 | | | 79.8 | | | 79.8 | | | 1.1 | | | -1.0 | | | 0.0 | |
| Service-producing Industries ('000) | | | 279.4 | | | 278.9 | | | 276.3 | | | 272.3 | | | -0.2 | | | -0.9 | | | -1.4 | |
| Unemployment ('000) | | | 33.5 | | | 34.6 | | | 36.4 | | | 37.1 | | | 3.3 | | | 5.2 | | | 1.9 | |
| Participation Rate (%) | | | 64.3 | | | 64.2 | | | 63.6 | | | 62.8 | | | … | | | … | | | … | |
| Employment Rate (%) | | | 58.8 | | | 58.6 | | | 57.7 | | | 56.8 | | | … | | | … | | | … | |
| Unemployment Rate (%) | | | 8.5 | | | 8.8 | | | 9.3 | | | 9.5 | | | … | | | … | | | … | |
| Average Weekly Earnings ($) | | | 730.67 | | | 750.91 | | | 761.76 | | | 789.60 | | | 2.8 | | | 1.4 | | | 3.7 | |
| Wages and Salaries ($M) | | | 12,879.6 | | | 13,216.1 | | | 13,746.5 | | | 14,278.1 | | | 2.6 | | | 4.0 | | | 3.9 | |
| Employment Insurance Beneficiaries (#) | | | 40,930 | | | 47,007 | | | 46,571 | | | 45,617 | | | 14.8 | | | -0.9 | | | -2.0 | |
| Consumers | | | | | | | | | | | | | | | | | | | | | | |
| Retail Trade ($M) | | | 10,017.9 | | | 10,092.7 | | | 10,591.6 | | | 11,105.6 | | | 0.7 | | | 4.9 | | | 4.9 | |
| New Motor Vehicle Sales (units) | | | 39,522 | | | 35,274 | | | 38,777 | | | 39,503 | | | -10.7 | | | 9.9 | | | 1.9 | |
| New Motor Vehicle Sales ($M) | | | 1,076.9 | | | 1,061.9 | | | 1,207.7 | | | 1,222.1 | | | -1.4 | | | 13.7 | | | 1.2 | |
| Food Services and Drinking Places ($M) | | | 891.3 | | | 938.7 | | | 968.8 | | | 973.0 | | | 5.3 | | | 3.2 | | | 0.4 | |
| Consumer Price Index (2002=100) | | | 113.2 | | | 113.5 | | | 115.9 | | | 120.0 | | | 0.3 | | | 2.1 | | | 3.5 | |
| Housing | | | | | | | | | | | | | | | | | | | | | | |
| Housing Starts (units) | | | 4,274 | | | 3,521 | | | 4,101 | | | 3,452 | | | -17.6 | | | 16.5 | | | -15.8 | |
| Residential Building Permits ($M) | | | 590.0 | | | 575.1 | | | 570.8 | | | 543.5 | | | -2.5 | | | -0.7 | | | -4.8 | |
| MLS® Residential Sales (units) | | | 7,555 | | | 7,003 | | | 6,703 | | | 6,597 | | | -7.3 | | | -4.3 | | | -1.6 | |
| Business | | | | | | | | | | | | | | | | | | | | | | |
| Manufacturing Sales ($M) | | | 17,814.5 | | | 14,240.4 | | | 17,256.9 | | | 19,804.0 | | | -20.1 | | | 21.2 | | | 14.8 | |
| Foreign Exports ($M) | | | 12,808.2 | | | 9,825.2 | | | 12,688.1 | | | 14,847.3 | | | -23.3 | | | 29.1 | | | 17.0 | |
| Non-residential Building Permits ($M) | | | 523.8 | | | 573.2 | | | 562.5 | | | 422.4 | | | 9.4 | | | -1.9 | | | -24.9 | |
| Industrial and Commercial ($M) | | | 382.1 | | | 272.0 | | | 292.3 | | | 273.9 | | | -28.8 | | | 7.5 | | | -6.3 | |
| Institutional and Government ($M) | | | 141.7 | | | 301.1 | | | 270.2 | | | 148.5 | | | 112.5 | | | -10.3 | | | -45.1 | |
| Wholesale Trade ($M) | | | 5,293.1 | | | 5,486.1 | | | 5,843.9 | | | 5,943.2 | | | 3.6 | | | 6.5 | | | 1.7 | |
| Mining Production ($M) | | | 1,537.0 | | | 1,100.4 | | | 1,210.5 | | | 1,308.2 | | | -28.4 | | | 10.0 | | | 8.1 | |
| Farm Cash Receipts ($M) | | | 472.7 | | | 498.4 | | | 478.5 | | | 538.2 | | | 5.4 | | | -4.0 | | | 12.5 | |
Sawn Lumber Production ('000 m3) | | | 2 408.2 | | | 1 933.5 | | | 2 383.1 | | | 2 372.1 | | | -19.7 | | | 23.3 | | | -0.5 | |
| Demographics | | | | | | | | | | | | | | | | | | | | | | |
| Population (July 1) (#) | | | 747,023 | | | 749,983 | | | 752,838 | | | 755,455 | | | 0.4 | | | 0.4 | | | 0.3 | |
| Natural Increase (July 1-June 30) (#) | | | 851 | | | 686 | | | 525 | | | | | | … | | | … | | | … | |
| Net Migration (July 1-June 30) (#) | | | 2,109 | | | 2,169 | | | 2,092 | | | | | | … | | | … | | | … | |
| … not applicable |
| MLS® is a registered trademark of the Canadian Real Estate Association. |
| Sources: Statistics Canada, Natural Resources Canada and New Brunswick Real Estate Association. |