2012-2013 Third Quarter Report
Published by:
Department of Finance
Government of New Brunswick
P.O. Box 6000
Fredericton, New Brunswick
E3B 5H1
Canada
Internet: www.gnb.ca/finance
February 2013
Translation:
Translation Bureau, Government Services
ISBN 978-1-55396-364-6
 Think Recycling!
2012 Economic Update
 | | The World Bank estimates global GDP grew 2.3 per cent in 2012 reporting that the global economy remains fragile. High-income countries continue to suffer from volatility and slow growth, while developing countries recorded among their slowest growth rates of the past decade. |
| Real GDP in the U.S. increased 2.2 per cent in 2012 as gains in personal consumption expenditures, investment and exports offset declines in government spending. U.S. housing starts grew by 28% for the year and reached a level of construction not seen since 2008. |
| The Bank of Canada is now projecting real GDP growth of 1.9% in 2012 as weakness in exports and business investment resulted in a slowdown in the Canadian economy in the second half of the year. |
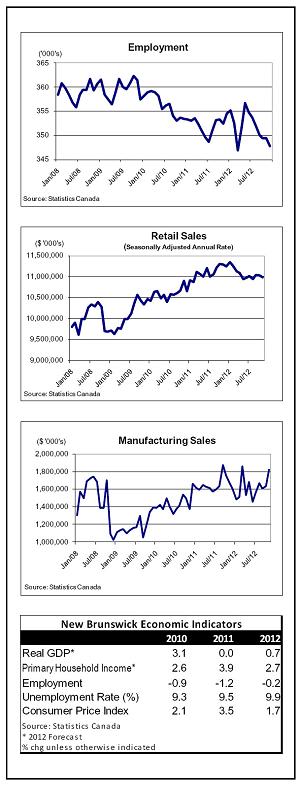
| The Department of Finance expects real GDP growth of 0.7% for New Brunswick in 2012, a level consistent with expectations among private sector forecasters. |
| Employment for the year declined by 600 as full-time job gains (+1,500) were not enough to offset part-time job losses (-2,100). |
| Wages and salaries grew by less than 2.0% and trailed the national growth rate. |
| Consumer spending continued to soften in the third quarter. Through the first ten months of the year, retail sales were unchanged when compared to year-earlier levels. |
| After a slow start to the year, manufacturing sales have posted gains in four of the last five months. |
| Housing starts in the province’s urban centres are up 3.4% over year-earlier levels. Multi-unit construction in Moncton and modest gains in the smaller urban centres contributed to an improved residential construction sector. |
| Consumer inflation in the province has averaged 1.7 per cent, slightly higher than the national growth rate of 1.5 per cent. |
2012-2013 Fiscal Update
Based on third quarter information, a revised deficit of $411.1 million is projected for 2012-2013. This is an increase of $228.2 million compared to the budget deficit of $182.9 million and a $54.4 million increase from the second quarter report.
Net debt is projected to increase by $955.9 million year-over-year, an increase of $216.9 million from the budget estimate of $738.9 million and a $44.4 million increase from the second quarter.
Revenues are projected to be $195.8 million lower than budget mainly due to a weakened economy. The major variances include:
| | Personal Income Tax is down $126.1 million because of a reduced yield from the tax system, resulting in a significant negative prior year adjustment and a lower forecast base; as well as weaker income growth. |
| | Royalties are down $32.0 million because of weakened demand and lower prices for potash and a weakening demand for pulp wood. |
| | Return on Investment is down $19.0 million mainly due to lower projected net income for the New Brunswick Electric Finance Corporation as a result of the latest estimates provided by NB Power, and lower projected net income for the New Brunswick Liquor Corporation because of lower-than-anticipated sales. |
| | Sale of Goods and Services is down $17.7 million due to less revenue for the Consolidated Entities. |
| | Corporate Income Tax is down $17.4 million largely due to a negative prior year adjustment. |
| | Tobacco Tax is down an estimated $15.0 million due to lower sales. |
| | Capital Revenue is down $8.4 million mainly due to lower-than-anticipated land sales. |
| | Canada Health Transfer is down $7.5 million due to revised federal estimates. |
| | Harmonized Sales Tax is projected to increase $30.2 million due to positive prior-year adjustments for the 2008-2012 taxation years. |
| | Miscellaneous Revenue is up $14.8 million mainly due to higher-than-anticipated revenue from the Consolidated Entities. |
| | Special Operating Agency Revenue is up $6.3 million primarily due to projected increased federal funding for agreements with the Regional Development Corporation. |
2012-2013 Fiscal Update
Total expenses are projected to be $32.3 million higher than budget. This is mainly due to the following:
| $5.0 million decrease in the Department of Economic Development due to a projected under-expenditure in the Strategic Assistance Program. |
| | $77.4 million increase in General Government mainly the result of an increase in pension expense due to the adoption of new actuarial mortality tables, which were updated for the first time in nearly a decade. |
| | $15.6 million decrease in the Department of Health due to a number of savings and cost containment initiatives in the health care system. |
| | $21.8 million decrease in the Department of Post-Secondary Education, Training and Labour mainly due to decreased uptake in employment development programs (offset by lower revenue). |
| | $5.9 million increase in the Department of Public Safety due to higher than budgeted expenses in the Police, Fire and Emergency Services program. |
| | $5.6 million decrease in Service of the Public Debt due to mainly due to borrowing later in the fiscal year than anticipated. |
| | $12.1 million decrease in the Department of Social Development mainly due to projected under-expenditures in the Long Term Care and Housing Services programs. |
| | $15.8 million increase in the Department of Transportation and Infrastructure primarily due to delays in achieving some government renewal savings initiatives and cost pressures related to increased commodity prices. |
| | $13.3 million in projected under-expenditures across a number of other departments, partially offset by projected over-expenditures in others. |
COMPARATIVE STATEMENT OF SURPLUS OR DEFICIT Thousands $ | | | | |
| | | | |
| | | | |
| | Year Ending March 31 | | Variance | |
| | | | | | | | | |
| | 2013 | 2013 | | | 2013 | | from | |
| | Estimate | | 2nd Quarter | 3rd Quarter | | Estimate | |
| Revenue | | | | | | | | | |
| Ordinary Account........................................................ | 7,422,001 | 7,286,669 | | | 7,226,258 | (195,743) | |
| Capital Account.......................................................... | 232,822 | 231,707 | | | 224,383 | (8,439) | |
| Special Purpose Account............................................ | 63,512 | 67,701 | | | 65,501 | 1,989 | |
| Special Operating Agency Account (net)...................... | 73,726 | 83,230 | | | 80,075 | 6,349 | |
| Sinking Fund Earnings............................................... | 221,000 | | 221,000 | | | 221,000 | | 0 | |
| Total Revenue......................................................... | 8,013,061 | 7,890,307 | | | 7,817,217 | (195,844) | |
| Expense | | | | | | | | | |
| Ordinary Account...................................................... | 7,662,367 | 7,709,118 | | | 7,692,505 | 30,138 | |
| Capital Account........................................................ | 52,799 | 52,722 | | | 56,842 | 4,043 | |
| Special Purpose Account.......................................... | 70,794 | 74,164 | | | 71,303 | 509 | |
| Special Operating Agency Account (net)..................... | 71,086 | 72,034 | | | 68,808 | (2,278) | |
| Amortization of Tangible Capital Assets...................... | 338,921 | | 338,919 | | | 338,835 | | (86) | |
| Total Expense........................................................ | 8,195,967 | 8,246,957 | | | 8,228,293 | 32,326 | |
| Surplus (Deficit)...................................................... | (182,906) | | (356,650) | | | (411,076) | | (228,170) | |
COMPARATIVE STATEMENT OF ORDINARY ACCOUNT REVENUE BY SOURCE Thousands $ | | | |
| | | |
| | | |
| | Year Ending March 31 | | Variance | |
| | | | | | | | |
| | 2013 | 2013 | 2013 | | from | |
| | Estimate | | 2nd Quarter | | 3rd Quarter | | Estimate | |
| | | | | | |
Taxes | | |
| Personal Income Tax................................................ | 1,317,400 | 1,231,000 | 1,191,300 | (126,100) | |
| Corporate Income Tax............................................... | 223,600 | 215,200 | 206,200 | (17,400) | |
| Metallic Mineral Tax.................................................. | 40,000 | 40,000 | 35,000 | (5,000) | |
| Provincial Real Property Tax...................................... | 469,400 | 469,400 | 469,400 | 0 | |
| Harmonized Sales Tax.............................................. | 1,135,400 | 1,120,400 | 1,165,600 | 30,200 | |
| Gasoline and Motive Fuels Tax.................................. | 247,300 | 247,300 | 243,000 | (4,300) | |
| Tobacco Tax............................................................ | 150,000 | 145,000 | 135,000 | (15,000) | |
| Pari-Mutuel Tax........................................................ | 600 | 600 | 600 | 0 | |
| Insurance Premium Tax............................................ | 43,746 | 45,400 | 45,900 | 2,154 | |
| Real Property Transfer Tax........................................ | 13,600 | 12,600 | 11,000 | (2,600) | |
| Large Corporation Capital Tax.................................... | 0 | 0 | (49) | (49) | |
| Financial Corporation Capital Tax............................... | 23,125 | 28,000 | 28,000 | 4,875 | |
| Sub-total: Taxes.................................................. | 3,664,171 | | 3,554,900 | | 3,530,951 | | (133,220) | |
| | | | | |
| Return on Investment............................................... | 300,581 | 292,887 | 281,558 | (19,023) | |
| Licences and Permits............................................... | 135,124 | 133,998 | 133,853 | (1,271) | |
| Sale of Goods and Services..................................... | 296,173 | 277,774 | 278,439 | (17,734) | |
| Lottery and Gaming Revenues................................ | 142,938 | 145,938 | 145,938 | 3,000 | |
| Royalties................................................... | 121,670 | 112,605 | 89,660 | (32,010) | |
| Fines and Penalties................................................. | 8,233 | 8,178 | 8,507 | 274 | |
| Miscellaneous.......................................... | 24,690 | | 32,833 | | 39,449 | | 14,759 | |
| | | | | | |
| TOTAL: OWN SOURCE REVENUE…………………. | 4,693,580 | | 4,559,113 | | 4,508,355 | | (185,225) | |
| | | | | | | |
| Unconditional Grants – Canada | | | | | | | |
| Fiscal Equalization Payments................................... | 1,597,700 | 1,597,700 | 1,597,700 | 0 | |
| Canada Health Transfer............................................ | 637,200 | 629,700 | 629,712 | (7,488) | |
| Canada Social Transfer............................................. | 257,400 | 257,400 | 257,197 | (203) | |
| Wait Times Reduction Transfer.................................. | 5,422 | 5,422 | 5,423 | 1 | |
| Other........................................................ | 1,866 | 1,866 | 1,866 | 0 | |
| Sub-total: Unconditional Grants – Canada... | 2,499,588 | | 2,492,088 | | 2,491,898 | | (7,690) | |
| | | | | |
| Conditional Grants – Canada.................................... | 228,833 | 235,468 | 226,005 | (2,828) | |
| | | | | |
| TOTAL: GRANTS FROM CANADA........................ | 2,728,421 | | 2,727,55 | | 2,717,903 | | (10,518) | |
| | | | | | | | |
| TOTAL: GROSS ORDINARY REVENUE................. | 7,422,001 | | 7,286,669 | | 7,226,258 | | (195,743) | |
| | COMPARATIVE STATEMENT OF ORDINARY ACCOUNT EXPENSE Thousands $ | | | | |
| | | | | |
| | | | | |
| | | Year Ending March 31 | | | | | | |
| | | 2013 | 2013 | 2013 | | Variance | | |
| DEPARTMENT | Estimate | | 2nd Quarter | | 3rd Quarter | | from Estimate | | |
| | | | | | | | $ | % | | |
| Agriculture, Aquaculture and Fisheries........... | 39,983 | 43,255 | 40,755 | 772 | 1.9% | ! | |
| Economic Development................................ | 105,401 | 105,401 | 100,401 | (5,000) | -4.7% | ü | |
| |
| Education and Early Childhood | 1,071,133 | 1,081,733 | 1,073,062 | | | | | | |
| Development.......................................... | 1,929 | 0.2% | ! | |
| Efficiency New Brunswick............................ | 11,819 | 11,819 | 11,819 | 0 | 0.0% | | |
| Energy and Mines....................................... | 7,392 | 7,392 | 7,133 | (259) | -3.5% | ü | |
| |
| Environment and Local Government.............. | 138,768 | 138,512 | 140,151 | 1,383 | 1.0% | ! | |
| Executive Council Office.............................. | 18,441 | 18,111 | 17,941 | (500) | -2.7% | ü | |
| |
| Finance.............................................… | 20,206 | 19,106 | 18,706 | (1,500) | -7.4% | ü | |
| |
| General Government................................... | 608,764 | 645,515 | 686,165 | 77,401 | 12.7% | ! | |
| Government Services.................................. | 59,457 | 60,157 | 59,457 | 0 | 0.0% | | |
| Health................................................... | 2,583,815 | 2,583,815 | 2,568,258 | (15,557) | -0.6% | ü | |
| |
| Healthy and Inclusive Communities.............. | 10,095 | 10,095 | 10,192 | 97 | 1.0% | ! | |
| Human Resources...................................… | 4,123 | 4,073 | 4,048 | (75) | -1.8% | ü | |
| |
| Invest NB................................................… | 14,637 | 14,437 | 10,607 | (4,030) | -27.5% | ü | |
| |
| Justice and Attorney General....................... | 63,286 | 62,181 | 61,786 | (1,500) | -2.4% | ü | |
| |
| Legislative Assembly...............................… | 26,173 | 26,133 | 26,451 | 278 | 1.1% | ! | |
| Natural Resources...................................… | 108,252 | 105,865 | 103,845 | (4,407) | -4.1% | ü | |
| |
| Office of the Premier................................… | 1,655 | 1,645 | 1,625 | (30) | -1.8% | ü | |
| |
| Post-Secondary Education, Training and | 588,302 | 570,310 | 566,488 | (21,814) | -3.7% | ü | |
| Labour.................................................. | |
| Public Safety......................................… | 142,290 | 148,290 | 148,190 | 5,900 | 4.1% | ! | |
| Service of the Public Debt....................… | 672,000 | 672,000 | 666,400 | (5,600) | -0.8% | ü | |
| |
| Social Development.............................… | 1,051,925 | 1,051,925 | 1,039,825 | (12,100) | -1.2% | ü | |
| |
| Tourism, Heritage and Culture..............… | 41,177 | 40,527 | 40,177 | (1,000) | -2.4% | ü | |
| |
| Transportation and Infrastructure...........… | 273,273 | | 286,821 | | 289,023 | | 15,750 | | 5.8% | ! | |
| TOTAL..............................................… | 7,662,367 | | 7,709,118 | | 7,692,505 | | 30,138 | | 0.4% | | |
| | | | | | | | | | | | |
| ü | Projected under-expenditure | | | | | | | | | | | |
| ! | Projected over-expenditure | | | | | | | | | | | |
The 2013 Estimates were restated to include departmental transfers and reorganization.
The increase in General Government is mainly the result of an estimated $53 million increase in pension expense due to the adoption of new actuarial mortality tables.
| COMPARATIVE STATEMENT OF CHANGE IN NET DEBT | | | | |
| Thousands | | | | | | | | |
| | $ | | | | | | | | |
| | Year Ending March 31 | | Variance | |
| | | | | | | | | |
| | 2013 | 2013 | | | 2013 | | from | |
| | Estimate | | 2nd Quarter | 3rd Quarter | | Estimate | |
| Surplus (Deficit)................... | (182,906) | (356,650) | | | (411,076) | (228,170) | |
| Acquisition of Tangible Capital Assets........ | (894,961) | (893,728) | | | (883,629) | 11,332 | |
| Amortization of Tangible Capital Assets........ | 338,921 | 338,919 | | | 338,835 | (86) | |
| (Increase) Decrease in Net Debt.......... | (738,946) | | (911,459) | | | (955,870) | | (216,924) | |