
2013-2014 Economic Outlook
Published by:
Department of Finance
Province of New Brunswick
P.O. Box 6000
Fredericton, New Brunswick
E3B 5H1
Canada
Internet: www.gnb.ca/0024/index-e.asp
March 26, 2013
Cover:
Government Services (GS 9130)
Translation:
Translation Bureau, Government Services
Printing and Binding:
Printing Services, New Brunswick Internal Services Agency
ISBN 978-1-55396-363-9
Printed in New Brunswick

Think Recycling!
2013-2014 Economic Outlook
Global Economy
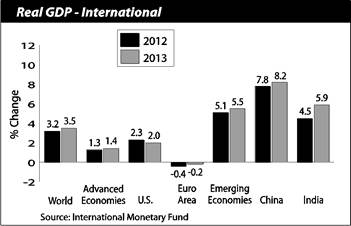
Global economic growth slowed to 3.2% in 2012, with both industrialized and developing economies reporting weaker performances from the previous year. World growth was driven by emerging market and developing economies, which grew by 5.1% according to the International Monetary Fund (IMF). Advanced economies (led by Canada, the U.S. and Japan) grew by 1.3%, down from 1.6% the previous year due to government restraint and a recession in the euro area.

2013-2014 Economic Outlook
China and India will be the main drivers of growth among emerging and developing economies in 2013. However, the pace of economic activity in these countries will be below recent expectations due to sluggish growth in many of their trading partners’ economies. In particular, the euro area is expected to experience a modest decline in real Gross Domestic Product (GDP) for the second consecutive year.
The U.S. economy is expected to grow by 2.0% in 2013, slightly below the 2012 level. Thanks to improved confidence levels and healthier household balance sheets resulting from a stronger housing market, consumer expenditures will contribute moderately to growth in 2013.
The implementation of the American Taxpayer Relief Act of 2012 helped the U.S. avoid the so-called “fiscal cliff”, which was a series of automatic spending cuts and tax increases that were set to take effect on January 1, 2013. However, fiscal restraint in the U.S. is still expected to have a slowing impact on growth.
2013-2014 Economic Outlook
Canadian Economy
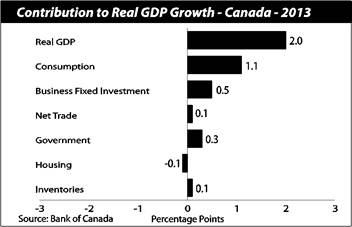
Supported largely by growth in domestic demand, initial indicators suggest the Canadian economy expanded by 1.8% in 2012, down from the 2.6% reported in 2011. Economic activity was led by consumer spending, housing and business investment; net trade and government expenditures acted as a drag on growth.
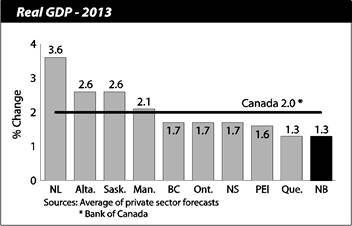
According to the Bank of Canada, the Canadian economy is set to grow by 2.0% in 2013. Following a slowdown during the second half of 2012, the Bank anticipates the economy will pick up momentum through the first half of 2013 due to a rise in foreign demand and increased activity in the energy sector.
2013-2014 Economic Outlook
2013-2014 Economic Outlook
| | Statistical Summary - Growth Rates1 |
| | | 2011 to 2012 |
| | | N.B. | Canada |
| | Population and Labour | | |
| | Total Population (July 1) | 0.1 | 1.1 |
| | Labour Force | 0.6 | 0.9 |
| | Employment | -0.2 | 1.2 |
| | Unemployment Rate (%) | 10.2 | 7.2 |
| | Participation Rate (%) | 63.1 | 66.7 |
| | Wages and Salaries | 1.6 | 4.2 |
| | Consumers and Housing | | |
| | Retail Sales | -0.5 | 2.5 |
| | Consumer Price Index | 1.7 | 1.5 |
| | Housing Starts | -4.4 | 10.8 |
| | Business | | |
| | Manufacturing Sales | -1.4 | 3.4 |
| | Foreign Exports | 0.1 | 1.9 |
| | Building Permits | -3.7 | 9.1 |
| | 1 Per cent change unless otherwise indicated. |
| | Source: Statistics Canada. | | |
New Brunswick Economy
Economic growth in 2012 was constrained by weak income growth, slowing consumer expenditures and government restraint. Employment for the year declined by 600 although the drop was not as pronounced as the previous two years. On the positive side, the number of full-time jobs in 2012 increased by 1,500.
2013-2014 Economic Outlook
2013-2014 Economic Outlook
With the completion of the Point Lepreau refurbishment and the potash mine expansion, major projects that contributed to economic growth in recent years have concluded. This, in combination with more sustainable levels of government capital spending, will limit growth prospects in 2013.
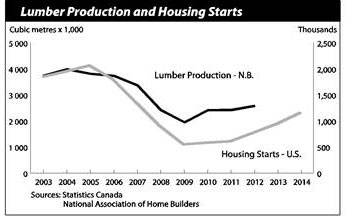
A gradual rebound in the U.S. housing market should bode well for New Brunswick’s forestry sector and benefit trade, the driver of economic growth in 2013. Electricity generation from the refurbished Point Lepreau facility should also improve the province’s net trade and increase output in the utilities sector.
2013-2014 Economic Outlook
New Brunswick Economic Indicators Growth Rates1, 2010 to 2017, 2010 to 2017 |
| | | | | | 2015- |
| 2010 | 2011 | 2012 | 2013 | 2014 | 2017 |
Economic Accounts * |
Gross Domestic Product (GDP) | 6.6 | 4.0 | 2.6 | 2.7 | 3.7 | 3.9 |
Household Final Consumption Expenditures | 4.4 | 4.4 | 2.2 | 2.4 | 3.4 | 4.5 |
Gross Fixed Capital Formation | 3.2 | -5.7 | -2.0 | -3.0 | 3.5 | 4.1 |
GDP (real) | 3.1 | 0.0 | 0.7 | 0.5 | 1.4 | 1.7 |
Income * |
Primary Household Income | 2.6 | 3.9 | 2.0 | 2.8 | 3.3 | 3.8 |
Net Operating Surplus: Corporations | 36.5 | 5.3 | -0.6 | 8.4 | 6.6 | 2.0 |
Population and Labour |
Total Population (July 1) | 0.4 | 0.3 | 0.1 | 0.0 | 0.0 | 0.0 |
Labour Force | -0.4 | -0.8 | 0.6 | 0.4 | 0.6 | 0.3 |
Employment | -0.9 | -1.2 | -0.2 | 0.5 | 0.8 | 0.6 |
Unemployment Rate (%) | 9.3 | 9.5 | 10.2 | 10.1 | 10.0 | 9.7 |
Participation Rate (%) | 63.6 | 62.8 | 63.1 | 63.5 | 63.9 | 64.1 |
Other |
Consumer Price Index | 2.1 | 3.5 | 1.7 | 1.8 | 1.9 | 1.9 |
Housing Starts | 16.5 | -15.8 | -4.4 | -10.5 | -8.2 | -0.1 |
1 Per cent change unless otherwise indicated. Sources: Statistics Canada. *2012-2017 NB Finance. |
The need for sustainable budget balances will limit governments’ contribution to economic growth in the near-term in exchange for a more favourable growth environment in the future.
Looking ahead to 2014, improved economic activity in the U.S. and Canada should enhance the province’s trade sector. The mining sector should benefit from the ramping up towards full production of the newly expanded potash mine. Upward potential in the mining sector also exists for the Sisson Brook tungsten mine, should development begin in 2014.
2013-2014 Economic Outlook
Current expectations are for improved economic conditions and a pickup in growth in 2014, with real GDP growth projected to strengthen to 1.4%.
The proposed west-east petroleum product pipeline could notably impact economic performance through investment and construction activity. Any additional economic benefits are likely to occur over the medium-term.
Natural resource developments in the energy sector over the long-term horizon could provide a major boost to the province through increased investment spending, job creation and government revenues.
2013-2014 Economic Outlook
New Brunswick Annual Indicators
| New Brunswick Annual Indicators (as of March 1, 2013)
| | | | | %Change | | |
Indicators | 2009 | 2010 | 2011 | 2012 | 2009-10 | 2010-11 | 2011-12 |
Labour | | | | | | | |
Population 15 Years and Over ('000) | 613.9 | 616.8 | 619.4 | 620.4 | 0.5 | 0.4 | 0.2 |
Labour Force ('000) | 394.2 | 392.5 | 389.2 | 391.4 | -0.4 | -0.8 | 0.6 |
Employment ('000) | 359.5 | 356.1 | 352.0 | 351.4 | -0.9 | -1.2 | -0.2 |
Full-time ('000) | 302.3 | 301.7 | 294.7 | 296.2 | -0.2 | -2.3 | 0.5 |
Part-time ('000) | 57.3 | 54.4 | 57.4 | 55.3 | -5.1 | 5.5 | -3.7 |
Goods-producing Industries ('000) | 80.6 | 79.8 | 79.8 | 74.7 | -1.0 | 0.0 | -6.4 |
Service-producing Industries ('000) | 278.9 | 276.3 | 272.3 | 276.8 | -0.9 | -1.4 | 1.7 |
Unemployment ('000) | 34.6 | 36.4 | 37.1 | 40.0 | 5.2 | 1.9 | 7.8 |
Participation Rate (%) | 64.2 | 63.6 | 62.8 | 63.1 | … | … | … |
Employment Rate (%) | 58.6 | 57.7 | 56.8 | 56.6 | … | … | … |
Unemployment Rate (%) | 8.8 | 9.3 | 9.5 | 10.2 | … | … | … |
Average Weekly Earnings ($) | 749.97 | 761.72 | 788.79 | 809.77 | 1.6 | 3.6 | 2.7 |
Wages and Salaries ($M) | 13,109.0 | 13,409.5 | 13,937.0 | 14,162.2 | 2.3 | 3.9 | 1.6 |
Employment Insurance Beneficiaries | 47,007 | 46,571 | 45,665 | 44,675 | -0.9 | -1.9 | -2.2 |
Consumers | | | | | | | |
Retail Trade ($M) | 10,092.7 | 10,592.5 | 11,102.4 | 11,041.5 | 5.0 | 4.8 | -0.5 |
New Motor Vehicle Sales (units) | 35,274 | 38,777 | 39,503 | 39,895 | 9.9 | 1.9 | 1.0 |
New Motor Vehicle Sales ($M) | 1,061.9 | 1,207.7 | 1,222.1 | 1,212.7 | 13.7 | 1.2 | -0.8 |
Food Services and Drinking Places ($M) | 938.7 | 968.8 | 962.2 | 980.1 | 3.2 | -0.7 | 1.9 |
Consumer Price Index (2002=100) | 113.5 | 115.9 | 120.0 | 122.0 | 2.1 | 3.5 | 1.7 |
Housing | | | | | | | |
Housing Starts (units) | 3,521 | 4,101 | 3,452 | 3,299 | 16.5 | -15.8 | -4.4 |
Residential Building Permits ($M) | 575.1 | 570.8 | 543.5 | 530.0 | -0.7 | -4.8 | -2.5 |
MLS® Residential Sales (units) | 7,003 | 6,702 | 6,599 | 6,403 | -4.3 | -1.5 | -3.0 |
Business | | | | | | | |
Manufacturing Sales ($M) | 14,240.4 | 17,256.9 | 19,809.0 | 19,522.6 | 21.2 | 14.8 | -1.4 |
Foreign Exports ($M) | 9,825.2 | 12,665.8 | 14,789.7 | 14,800.8 | 28.9 | 16.8 | 0.1 |
Non-residential Building Permits ($M) | 573.2 | 562.5 | 422.4 | 400.4 | -1.9 | -24.9 | -5.2 |
Industrial and Commercial ($M) | 272.0 | 292.3 | 273.9 | 239.4 | 7.5 | -6.3 | -12.6 |
Institutional and Government ($M) | 301.1 | 270.2 | 148.5 | 161.0 | -10.3 | -45.1 | 8.5 |
Wholesale Trade ($M) | 5,486.1 | 5,832.5 | 5,926.7 | 5,967.6 | 6.3 | 1.6 | 0.7 |
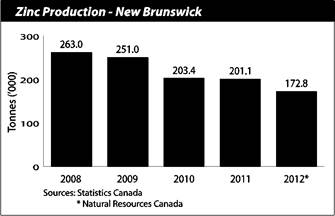
Mining Production ($M) | 1,100.4 | 1,210.5 | 1,334.9 | 1,146.4 | 10.0 | 10.3 | -14.1 |
Farm Cash Receipts ($M) | 498.4 | 478.8 | 533.3 | 527.1 | -3.9 | 11.4 | -1.2 |
Sawn Lumber Production ('000 m3) | 1 958.3 | 2 423.4 | 2 429.6 | 2 594.0 | 23.8 | 0.3 | 6.8 |
Demographics |
Population (July 1) | 749,945 | 752,892 | 755,335 | 755,950 | 0.4 | 0.3 | 0.1 |
Natural Increase (July 1-June 30) | 948 | 756 | 570 | | … | … | … |
Net Migration (July 1-June 30) | 1,999 | 1,687 | 45 | | … | … | … |
… not applicable
MLS® is a registered trademark of the Canadian Real Estate Association.
Sources: Statistics Canada, Natural Resources Canada, Agriculture and Agri-Food Canada, and New Brunswick Real Estate Association. |