EXHIBIT 99.9
2013-2014 First Quarter Report
Published by:
Department of Finance
Government of New Brunswick
P.O. Box 6000
Fredericton, New Brunswick
E3B 5H1
Canada
Internet: www.gnb.ca/finance
September 2013
Translation:
Translation Bureau, Government Services
ISBN 978-1-55396-368-4
| | 2013 Economic Update | | | |
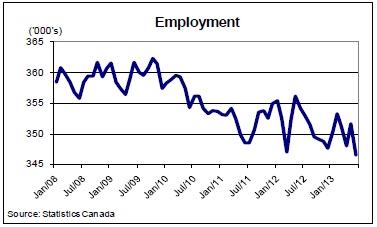
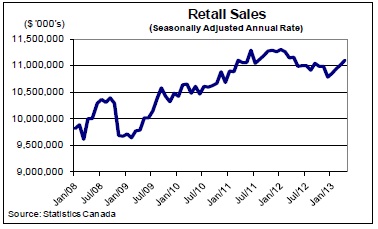
| | | | | ● The IMF revised their forecast downward from their April outlook of 3.3 per cent, with global growth in 2013 expected to remain at the 2012 level of 3.1 per cent. ● Factors influencing global growth include weaker domestic demand and slower growth in several key emerging market economies, as well as a more protracted recession in the euro area. ● Real GDP in the U.S. increased by an annual rate of 1.7 per cent in the second quarter, following a 1.1 per cent growth rate in the first quarter. ● The Bank of Canada is now projecting real GDP growth of 1.8 per cent in 2013, up from earlier expectations, as external demand increases and business confidence strengthens. ● Many private sector forecasters have lowered their growth expectations for New Brunswick and are now modestly above the Department of Finance forecast of 0.5 per cent real GDP growth for 2013. ● Employment declined by 2,500 in the first six months of the year, with gains in the goods-producing sector limiting a decline in the service sector. ● Wages and salaries grew by less than 1.0 per cent year-to-date and trailed the national growth rate. Consumer spending is beginning to show signs of recovery with five consecutive monthly increases in retail sales; moreover sales in May were at their highest level in sixteen months. ● Led by a healthy start to the year – particularly in wood products – manufacturing sales have shown a modest improvement (+1.4%) over 2012 levels. ● Housing starts in the provinces urban centres are down 13.0 per cent over year-earlier levels. Single family construction slowed during the first half of the year in the provinces large urban centres, while multi-unit construction showed a modest improvement. ● Consumer price inflation in the province has averaged 0.5 per cent, slightly lower than the national growth rate of 0.8 per cent. |
| | | | | | | | |
| | New Brunswick Economic Indicators | | | |
| | | | 2011 | | | 2012 | | | | 2013F | | | |
| | Real GDP | | | 0.0 | | | | -0.6 | | | | 0.5 | | | |
| | Wages and Salaries | | | 3.9 | | | | 1.6 | | | | 2.0 | | | |
| | Employment | | | -1.2 | | | | -0.2 | | | | 0.0 | | | |
| | Unemployment Rate (%) | | | 9.5 | | | | 10.2 | | | | 10.5 | | | |
| | Consumer Price Index | | | 3.5 | | | | 1.7 | | | | 1.2 | | | |
| | Source: Statistics Canada | | | | | | | | | | | | | | |
| | % chg unless otherwise indicated | | | | | | | | | | | |
| | | | | | | | | | | | | | |
| | | | | | | | | | | | | | |
| | | | | | | | | | | | | | |
2013-2014 Fiscal Update
Based on first quarter information, there is a deficit of $499.9 million for 2013-2014. This is an increase of $21.2 million compared to the budget deficit of $478.7 million.
Net debt is projected to increase $619.2 million year-over-year, an increase of $24.7 million from the budget estimate of $594.4 million.
Revenues are $41.4 million lower than budget mainly due to weaker-than-anticipated results for NB Power and reduced Special Operating Agency Account Revenue. The major variances include:
| Return on Investment is down $32.4 million mainly due to lower net income of $30.0 million for the New Brunswick Electric Finance Corporation due to weaker- than-anticipated results for NB Power. This is due to increased costs for fuel, pensions and purchased power. |
| Sale of Goods and Services is down $16.0 million from budget which is mainly offset by an increase of $13.6 million in Miscellaneous Revenue. This is due to a realignment of revenue for the Regional Health Authorities. |
● | Special Operating Agency Account Revenue (net) is down $4.4 million mainly due to lower expenses related to federal agreements. |
2013-2014 Fiscal Update
Total expenses are projected to be $20.2 million lower than budget. The major variances include the following:
| General Government ($7.7 million under): Various miscellaneous under- expenditures, including lower than budgeted centrally managed funds and Consolidated Entity expenses. |
| Justice and Attorney General ($3 million under): Mainly due to the transfer of certain functions to the new Financial and Consumer Services Commission. |
| Post-Secondary Education, Training and Labour ($9.9 million under): Primarily due to projected under-expenditures in the Student Financial Assistance program due to lower interest rates and provision for loss savings, as well as the Labour Market Development program due to lower than expected uptake for employment programs. |
| Transportation and Infrastructure ($2.3 million over): Mainly due to higher than budgeted expenses for Ferry Operations. |
| Other accounts ($2.0 million under): Lower than budgeted expenses in the Regional Development Corporation Special Operating Agency due to some projects that were budgeted in 2013-14 occurring in the previous fiscal year. This was partially offset by higher than budgeted capital account expenses in the Department of Transportation and Infrastructure. |
COMPARATIVE STATEMENT OF SURPLUS OR DEFICIT
Thousands
$
| | | Year Ending March 31 | | | | |
| | | 2014 | | | 2014 | | | | |
| | | Estimate | | | 1st Quarter | | | Estimate | |
| Revenue | | | | | | | | | |
| Ordinary Account | | | 7,565,600 | | | | 7,528,118 | | | | (37,482 | ) |
| Capital Account | | | 81,044 | | | | 82,068 | | | | 1,024 | |
| Special Purpose Account | | | 61,658 | | | | 61,094 | | | | (564 | ) |
| Special Operating Agency Account (net) | | | 79,133 | | | | 74,722 | | | | (4,411 | ) |
| Sinking Fund Earnings | | | 206,500 | | | | 206,500 | | | | 0 | |
| Total Revenue | | | 7,993,935 | | | | 7,952,502 | | | | (41,433 | ) |
| | | | | | | | | | | | | |
| Expense | | | | | | | | | | | | |
| Ordinary Account | | | 7,930,758 | | | | 7,913,062 | | | | (17,696 | ) |
| Capital Account | | | 44,689 | | | | 47,895 | | | | 3,206 | |
| Special Purpose Account | | | 72,462 | | | | 72,522 | | | | 60 | |
| Special Operating Agency Account (net) | | | 69,199 | | | | 63,146 | | | | (6,053 | ) |
| Amortization of Tangible Capital Assets | | | 355,520 | | | | 355,760 | | | | 240 | |
| Total Expense | | | 8,472,628 | | | | 8,452,385 | | | | (20,243 | ) |
| | | | | | | | | | | | | |
| Surplus (Deficit) | | | (478,693 | ) | | | (499,883 | ) | | | (21,190 | ) |
COMPARATIVE STATEMENT OF ORDINARY ACCOUNT REVENUE BY SOURCE
Thousands
$
| | | Year Ending March 31 | | | | |
| | | 2014 | | | 2014 | | | Variance from | |
| | | Estimate | | | 1st Quarter | | | Estimate | |
| Taxes | | | | | | | | | | | | |
| Personal Income Tax | | | 1,416,000 | | | | 1,416,000 | | | | 0 | |
| Corporate Income Tax | | | 236,400 | | | | 236,400 | | | | 0 | |
| Metallic Minerals Tax | | | 2,000 | | | | 0 | | | | (2,000 | ) |
| Provincial Real Property Tax | | | 481,500 | | | | 481,500 | | | | 0 | |
| Harmonized Sales Tax | | | 1,159,800 | | | | 1,159,800 | | | | 0 | |
| Gasoline and Motive Fuels Tax | | | 243,000 | | | | 243,000 | | | | 0 | |
| Tobacco Tax | | | 157,000 | | | | 157,000 | | | | 0 | |
| Pari-Mutuel Tax | | | 600 | | | | 600 | | | | 0 | |
| Insurance Premium Tax | | | 47,205 | | | | 47,205 | | | | 0 | |
| Real Property Transfer Tax | | | 11,500 | | | | 11,500 | | | | 0 | |
| Large Corporation Capital Tax | | | 0 | | | | 0 | | | | 0 | |
| Financial Corporation Capital Tax | | | 28,000 | | | | 30,000 | | | | 2,000 | |
| Sub-total: Taxes | | | 3,783,005 | | | | 3,783,005 | | | | 0 | |
| | | | | | | | | | | | | |
| Return on Investment | | | 326,840 | | | | 294,483 | | | | (32,357 | ) |
| Licences and Permits | | | 138,267 | | | | 137,756 | | | | (511 | ) |
| Sale of Goods and Services | | | 293,867 | | | | 277,854 | | | | (16,013 | ) |
| Lottery and Gaming Revenues | | | 153,347 | | | | 153,347 | | | | 0 | |
| Royalties | | | 110,855 | | | | 110,855 | | | | 0 | |
| Fines and Penalties | | | 8,294 | | | | 8,294 | | | | 0 | |
| Miscellaneous | | | 36,959 | | | | 50,558 | | | | 13,599 | |
| | | | | | | | | | | | | |
| TOTAL: OWN SOURCE REVENUE | | | 4,851,434 | | | | 4,816,152 | | | | (35,282 | ) |
| | | | | | | | | | | | | |
| Unconditional Grants – Canada | | | 1,562,000 | | | | 1,562,000 | | | | 0 | |
| Fiscal Equalization Payments | | | | | | | | | | | | |
| Canada Health Transfer | | | 664,000 | | | | 664,000 | | | | 0 | |
| Canada Social Transfer | | | 262,300 | | | | 262,300 | | | | 0 | |
| Wait Times Reduction Transfer | | | 5,368 | | | | 5,368 | | | | 0 | |
| Other | | | 1,866 | | | | 1,866 | | | | 0 | |
| Sub-total: Unconditional Grants – Canada | | | 2,495,534 | | | | 2,495,534 | | | | 0 | |
| | | | | | | | | | | | | |
| Conditional Grants – Canada | | | 218,632 | | | | 216,432 | | | | (2,200 | ) |
| | | | | | | | | | | | | |
| TOTAL: GRANTS FROM CANADA | | | 2,714,166 | | | | 2,711,966 | | | | (2,200 | ) |
| | | | | | | | | | | | | |
| TOTAL: GROSS ORDINARY REVENUE | | | 7,565,600 | | | | 7,528,118 | | | | (37,482 | ) |
COMPARATIVE STATEMENT OF ORDINARY ACCOUNT EXPENSE
Thousands
$
| | | Year Ending March 31 | | | | | | | | |
| | | | | | | | | | | |
| | | 2014 | | | 2014 | | | Variance | | |
| DEPARTMENT | | Estimate | | | 1st Quarter | | | from Estimate | | |
| | | | | | | | | $ | | | % | | |
| Agriculture, Aquaculture and Fisheries | | | 39,882 | | | | 39,882 | | | | 0 | | | | 0.0 | % | |
| Economic Development | | | 101,373 | | | | 101,373 | | | | 0 | | | | 0.0 | % | |
| Education and Early Childhood Development | | | 1,074,592 | | | | 1,074,592 | | | | 0 | | | | 0.0 | % | |
| Efficiency New Brunswick | | | 11,649 | | | | 11,649 | | | | 0 | | | | 0.0 | % | |
| Energy and Mines | | | 8,061 | | | | 8,061 | | | | 0 | | | | 0.0 | % | |
| Environment and Local Government | | | 139,497 | | | | 139,497 | | | | 0 | | | | 0.0 | % | |
| Executive Council Office | | | 18,370 | | | | 18,260 | | | | (110 | ) | | | -0.6 | % | ü |
| Finance | | | 18,949 | | | | 18,949 | | | | 0 | | | | 0.0 | % | |
| General Government | | | 862,873 | | | | 855,175 | | | | (7,698 | ) | | | -0.9 | % | ü |
| Government Services | | | 59,597 | | | | 59,597 | | | | 0 | | | | 0.0 | % | |
| Health | | | 2,583,815 | | | | 2,583,815 | | | | 0 | | | | 0.0 | % | |
| Healthy and Inclusive Communities | | | 17,301 | | | | 17,251 | | | | (50 | ) | | | -0.3 | % | ü |
| Human Resources | | | 3,973 | | | | 3,973 | | | | 0 | | | | 0.0 | % | |
| Invest NB | | | 14,638 | | | | 14,638 | | | | 0 | | | | 0.0 | % | |
| Justice and Attorney General | | | 62,700 | | | | 59,718 | | | | (2,982 | ) | | | -4.8 | % | ü |
| Legislative Assembly | | | 21,659 | | | | 21,659 | | | | 0 | | | | 0.0 | % | |
| Natural Resources | | | 101,593 | | | | 101,993 | | | | 400 | | | | 0.4 | % | ! |
| Office of the Premier | | | 1,652 | | | | 1,652 | | | | 0 | | | | 0.0 | % | |
| Post-Secondary Education, Training and Labour | | | 604,341 | | | | 594,488 | | | | (9,853 | ) | | | -1.6 | % | ü |
| Public Safety | | | 147,581 | | | | 147,581 | | | | 0 | | | | 0.0 | % | |
| Service of the Public Debt | | | 664,000 | | | | 664,000 | | | | 0 | | | | 0.0 | % | |
| Social Development | | | 1,062,734 | | | | 1,062,734 | | | | 0 | | | | 0.0 | % | |
| Tourism, Heritage and Culture | | | 37,632 | | | | 37,924 | | | | 292 | | | | 0.8 | % | ! |
| Transportation and Infrastructure | | | 272,296 | | | | 274,601 | | | | 2,305 | | | | 0.8 | % | ! |
| | | | | | | | | | | | | | | | | | |
| TOTAL | | | 7,930,758 | | | | 7,913,062 | | | | (17,696 | ) | | | -0.2 | % | |
ü Projected under-expenditure
! Projected over-expenditure
COMPARATIVE STATEMENT OF CHANGE IN NET DEBT
Thousands
$
| | | Year Ending March 31 | | | | |
| | | | | | | | | Variance | |
| | | 2014 | | | 2014 | | | from | |
| | | Estimate | | | 1st Quarter | | | Estimate | |
| | | | | | | | | | |
| Surplus (Deficit) | | | (478,693 | ) | | | (499,883 | ) | | | (21,190 | ) |
| | | | | | | | | | | | | |
| Acquisition of Tangible Capital Assets | | | (421,374 | ) | | | (421,930 | ) | | | (556 | ) |
| | | | | | | | | | | | | |
| Amortization of Tangible Capital Assets | | | 355,520 | | | | 355,760 | | | | 240 | |
| | | | | | | | | | | | | |
| Deferred Revenue Related to Tangible Capital Assets | | | (49,894 | ) | | | (53,110 | ) | | | (3,216 | ) |
| | | | | | | | | | | | | |
| (Increase) Decrease in Net Debt | | | (594,441 | ) | | | (619,163 | ) | | | (24,722 | ) |
9