| 2014 | PROVINCE OF NEW BRUNSWICK | ii |
| | | |
| 2014 | PROVINCE OF NEW BRUNSWICK | iii |
| | | |
| 2014 | PROVINCE OF NEW BRUNSWICK | 1 |
| | | |
INTRODUCTION
VOLUME I
The Public Accounts of the Province of New Brunswick are presented in two volumes.
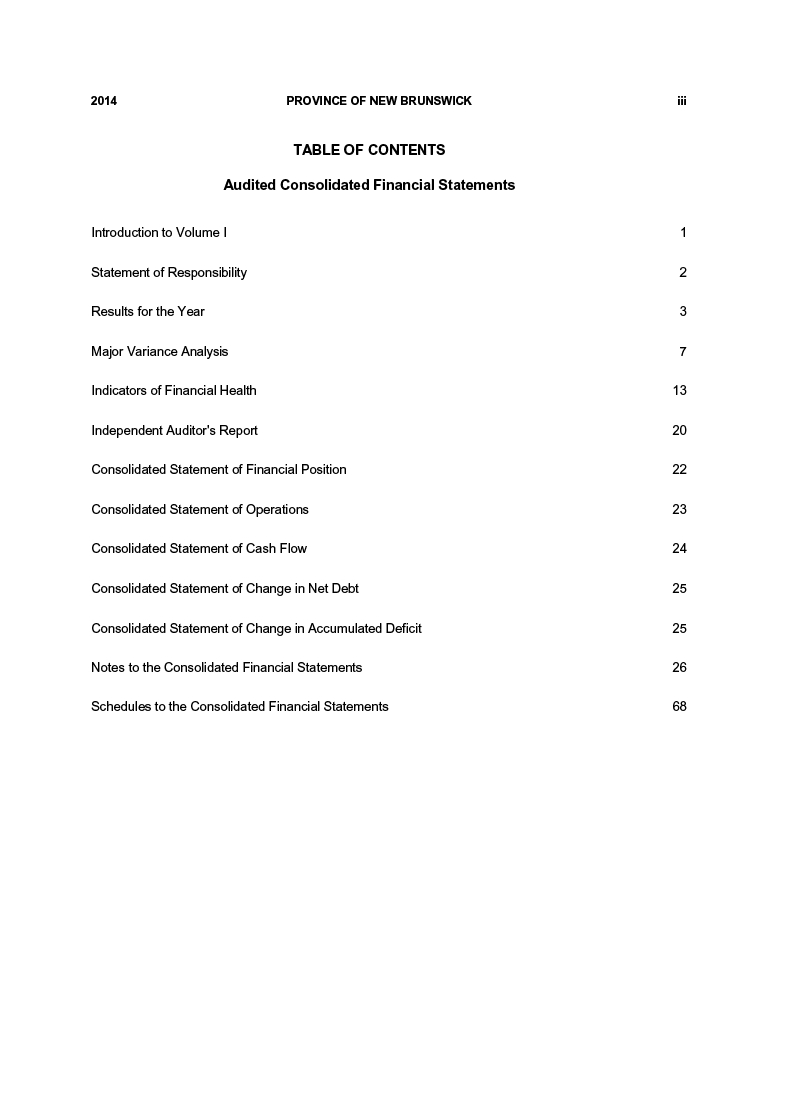
This volume contains the audited consolidated financial statements of the Provincial Reporting Entity as described in Note 1 to the consolidated financial statements. They include a Consolidated Statement of Financial Position, a Consolidated Statement of Operations, a Consolidated Statement of Cash Flow, a Consolidated Statement of Change in Net Debt and a Consolidated Statement of Change in Accumulated Deficit. This volume also contains the Independent Auditor’s Report, Statement of Responsibility, management’s comments on the Results for the Year, Major Variance Analysis and a discussion of the Indicators of Financial Health of the Province.
Volume II contains unaudited supplementary information to the consolidated financial statements presented in Volume I. It presents summary statements for revenue and expenditure as well as five-year comparative statements. This volume also contains detailed information on Supplementary Appropriations, Funded Debt, statements of the General Sinking Fund and revenue and expenditure by government department.
In addition, the Government includes the following lists on the Office of the Comptroller web site at http://www.gnb.ca/0087 :
- Salary information of government employees and employees of certain government organizations in excess of $60,000. Salary information is for the calendar year and is reported under the department where the employee worked at 31 December;
- Travel and other employee expenses in excess of $12,000 paid during the year to government employees, separated by department;
- Payments made to suppliers during the year in excess of $25,000 separated by department as well as a global listing including payments made by all departments;
- Loans disbursed to recipients during the year in excess of $25,000 separated by department.
| 2014 | PROVINCE OF NEW BRUNSWICK | 2 |
| | | |

STATEMENT OF RESPONSIBILITY
The consolidated financial statements of the Province of New Brunswick are prepared each year by the Comptroller as required under section 12 of the Financial Administration Act. The Results for the Year , Major Variance Analysis and Indicators of Financial Health commentaries are prepared jointly by the Department of Finance and the Office of the Comptroller. The consolidated financial statements include a Consolidated Statement of Financial Position, a Consolidated Statement of Operations , a Consolidated Statement of Cash Flow, a Consolidated Statement of Change in Net Debt and aConsolidated Statement of Change inAccumulated Deficit.
Financial statement integrity and objectivity are the responsibility of the Government. To help fulfil this responsibility, systems of internal control have been established to provide reasonable assurance that transactions are properly authorized, executed and reported. The statements are prepared in accordance with the accounting policies described inNote 1 to the Consolidated FinancialStatements .
On behalf ofthe Government:
| 2014 | PROVINCE OF NEW BRUNSWICK | 3 |
| | | |
RESULTS FOR THE YEAR
General Comments
The Province's summary financial statements, contained in this volume of Public Accounts, report a deficit for the fiscal year ended 31 March 2014 of $498.7 million. This represents an increase of $20.0 million from the budgeted deficit of $478.7 million. The difference is the result of lower than budgeted revenues of $230.4 million, offset by lower than budgeted expenses of $210.4 million.
Revenues were lower due to a $187.7 million shortfall in tax revenues attributable to a weakened economy including adjustments to prior year revenue estimates, and a reduction of $59.0 million in income from Government Business Enterprises primarily related to weaker than projected results for the New Brunswick Power Corporation.
Expenses were $210.4 million lower than budget. Most of the under-expenditure occurred in Central Government due to lower than budgeted pension expense, general government expenses, and provision for losses. A decrease in departmental spending throughout government contributed to lower than budgeted expenses in a number of areas, including Health, Social Development, and Economic Development. These decreases were offset by higher than budgeted expenses in other areas such as Education and Training and Transportation and Infrastructure.
There are several other variances discussed in more detail in the major variance section that follows.
Summary Financial Information
| (millions) |
| Consolidated Statement of Financial Position |
| | 2014 | 2013 |
| Financial Assets | $ 7,766.1 | $ 7,653.8 |
| Liabilities | (19,407.3) | (18,738.4) |
| Net Debt | (11,641.2) | (11,084.6) |
| Tangible Capital Assets | 8,018.5 | 7,977.6 |
| Other Non Financial Assets | 349.6 | 302.3 |
| Total Non Financial Assets | 8,368.1 | 8,279.9 |
| Accumulated Deficit | $ (3,273.1) | $ (2,804.7) |
| |
Consolidated Statement of Operations |
| | | 2014 | | | 2013 | |
| Revenue – Provincial Sources | | $ 4,888.8 | | | $ 4,787.4 | |
| Revenue – Federal Sources | | 2,874.7 | | | 3,000.5 | |
| Total Revenue | | 7,763.5 | | | 7,787.9 | |
| Expenses | | 8,262.2 | | | 8,295.4 | |
| Surplus / (Deficit) | | $ (498.7) | | | $ (507.5) | |
Consolidated Statement of Change in Net Debt
| | | | | | |
| | | 2014 | | | 2013 | |
| Opening Net Debt | | $ (11,130.6) | | | $ (10,125.8) | |
| Increase in Net Debt From | | | | | | |
| Operations | | (510.6) | | | (958.8) | |
| Ending Net Debt | | $ (11,641.2) | | | $ (11,084.6) | |
| 2014 | PROVINCE OF NEW BRUNSWICK | 4 |
| | | |
Revenue
Revenues of the Province for the past ten years, as restated, are shown in the table below.
| | | | | | | | | | | | | | | | | | | | |
| | (millions) |
| | | 2005 | | 2006 | | 2007 | | 2008 | | 2009 | | 2010 | | 2011 | | 2012 | | 2013 | | 2014 |
| ProvincialSources | $ | 3,688.6 | $ | 3,994.2 | $ | 4,225.4 | $ | 4,469.7 | $ | 4,467.3 | $ | 4,179.7 | $ | 4,612.5 | $ | 4,931.7 | $ | 4,787.4 | $ | 4,888.8 |
| Federal Sources | $ | 2,354.8 | $ | 2,392.9 | $ | 2,530.9 | $ | 2,720.6 | $ | 2,763.6 | $ | 2,940.8 | $ | 2,930.3 | $ | 2,874.2 | $ | 3,000.5 | $ | 2,874.7 |
| Total Revenue | $ | 6,043.4 | $ | 6,387.1 | $ | 6,756.3 | $ | 7,190.3 | $ | 7,230.9 | $ | 7,120.5 | $ | 7,542.8 | $ | 7,805.9 | $ | 7,787.9 | $ | 7,763.5 |
Average annual revenue growth over the ten-year period is 3.5%. Since 2009, revenue growth has only averaged 1.3% reflecting the slowdown in the economy and other factors. In 2014, year-over-year revenue declined by 0.3% due to a reduction in federal sources mainly attributable to one-time funding in 2013 for the Route One Gateway Project.
| | | | | | | | | | | | | | | | | | | | |
| Expense | | | | | | | | | | | | | | | | | | | | |
| |
| Expenses of the Province for the past ten years, as restated, are shown in the table below. | | |
| |
| | | (millions) |
| | | 2005 | | 2006 | | 2007 | | 2008 | | 2009 | | 2010 | | 2011 | | 2012 | | 2013 | | 2014 |
| TotalExpense | $ | 5,820.2 | $ | 6,161.8 | $ | 6,479.0 | $ | 6,949.2 | $ | 7,382.9 | $ | 7,816.4 | $ | 8,160.0 | $ | 8,050.7 | $ | 8,295.4 | $ | 8,262.2 |
Average annual expense growth over the ten-year period is 3.8%. In 2014, expenses decreased by $33.2 million year-over-year, a 0.4% decrease. This was mainly due to decreased pension expense and economic development expenses. These decreases were partially offset by increased spending in other areas, including Education and Training, Social Development, and amortization.
Surplus / (Deficit)
Surpluses (or Deficits) of the Province for the past ten years, as restated, are shown in the table below.
| | | | | | | | | | | | | | | | | | | | | | | | | | |
| | | (millions) |
| | | 2005 | | 2006 | | 2007 | | 2008 | | 2009 | | | 2010 | | | 2011 | | | 2012 | | | 2013 | | | 2014 | |
| Surplus/(Deficit) | $ | 223.2 | $ | 225.3 | $ | 277.3 | $ | 241.1 | $ | (152.0 | ) | $ | (695.9 | ) | $ | (617.2 | ) | $ | (244.8 | ) | $ | (507.5 | ) | $ | (498.7 | ) |
The deficit for the year ended 31 March 2014 was $498.7 million. The deficit was higher than the budgeted deficit of $478.7 million. The increase in the deficit was the result of a revenue shortfall from budget of $230.4 million due to weakened tax revenue and lower results for the New Brunswick Power Corporation, offset by lower than budgeted expenses of $210.4 million.
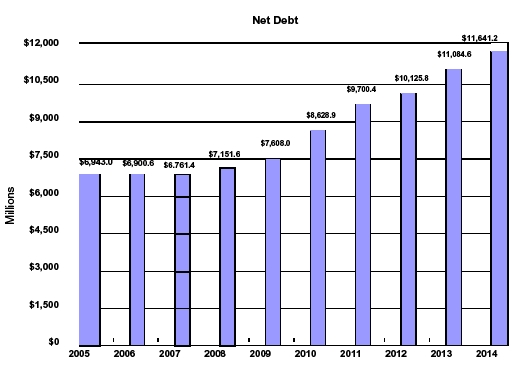
Net Debt
Net debt increased by $510.6 million during the year ended 31 March 2014, a decrease of $34.0 million from the budgeted projection of $544.6 million. The increase in net debt is related to the operating deficit and net capital asset transactions of highways, hospitals, schools and other buildings.
| 2014 | PROVINCE OF NEW BRUNSWICK | 5 |
| | | |
| | | | | | | | | | | | | | | | | | | | |
| | | (millions) |
| | | 2005 | | 2006 | | 2007 | | 2008 | | 2009 | | 2010 | | 2011 | | 2012 | | 2013 | | 2014 |
| NetDebt | $ | 6,943.0 | $ | 6,900.6 | $ | 6,761.4 | $ | 7,151.6 | $ | 7,608.0 | $ | 8,628.9 | $ | 9,700.4 | $ | 10,125.8 | $ | 11,084.6 | $ | 11,641.2 |
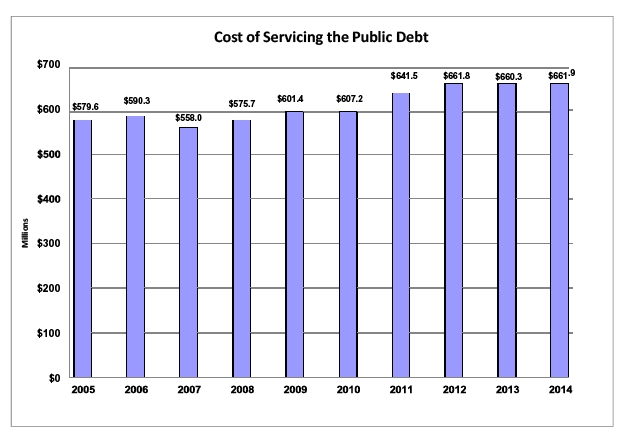
Cost of Servicing the Public Debt
The Province’s cost of servicing the Public Debt totaled $661.9 million for the year ended 31 March 2014. This represents a slight increase of $1.6 million from 2013 due to higher levels of debt which was partially offset by refinancing maturing debt at lower levels.
| 2014 | PROVINCE OF NEW BRUNSWICK | 6 |
| | | |
| | | | | | | | | | | | | | | | | | | | |
| | (millions) |
| | | 2005 | | 2006 | | 2007 | | 2008 | | 2009 | | 2010 | | 2011 | | 2012 | | 2013 | | 2014 |
| |
| CostofServicing | $ | 579.6 | $ | 590.3 | $ | 558.0 | $ | 575.7 | $ | 601.4 | $ | 607.2 | $ | 641.5 | $ | 661.8 | $ | 660.3 | $ | 661.9 |
| thePublicDebt | | | | | | | | | | | | | | | | | | | | |
Results According to the Fiscal Responsibility and Balanced Budget Act
In June 2014, new fiscal accountability legislation was proclaimed with the Fiscal Responsibility and Balanced Budget Act repealed. Under the Fiscal Responsibility and Balanced Budget Act, the Act’s stated objective was for balanced budgets over designated fiscal periods. The Government had previously indicated the balanced budget provisions of the Act would not be met for the current four-year period. The current fiscal period is 1 April 2011 through 31 March 2015. For 2014, the government incurred a $559.8 million deficit under the Act for a cumulative deficit of $1,328.1 million for balanced budget purposes.
Surplus / (Deficit) According to Fiscal Responsibility and Balanced Budget Act
2011-12 to 2014-15
| | | | | | | | | | | |
| (millions) |
|
| | | 2012 | | 2013 | | | 2014 | | | Cumulative | |
| Surplus/(Deficit) - FRBBA | | $ (260.6) | | $ (507.7) | | | $ (559.8) | | | $ (1,328.1) | |
| 2014 | PROVINCE OF NEW BRUNSWICK | 7 |
| | | |
MAJOR VARIANCE ANALYSIS
Explanations of major variances are described below, first for revenue, followed by expenses. In this analysis, comparisons are made between the actual results for 2014 and either the 2014 budget or actual results for 2013.
REVENUE
Budget 2014 to Actual 2014 Comparison
| | | | | | |
| 2014 Budget to Actual |
| ($ millions) |
|
| Item | Budget | Actual | Variance | | % Variance | |
| Provincial Sources | | | | | | |
| Taxes | 3,783.0 | 3,595.3 | (187.7) | | (5.0) | |
| Licenses and Permits | 147.7 | 148.7 | 1.0 | | 0.7 | |
| Royalties | 110.9 | 90.9 | (20.0) | | (18.0) | |
| Income from Government Business Enterprises | 280.9 | 221.9 | (59.0) | | (21.0) | |
| Other Provincial Revenue | 607.1 | 627.5 | 20.4 | | 3.4 | |
| Sinking Fund Earnings | 206.5 | 204.5 | (2.0) | | (1.0) | |
| Revenue from Provincial Sources | 5,136.1 | 4,888.8 | (247.3) | | (4.8) | |
| Federal Sources | | | | | | |
| Fiscal Equalization | 1,562.0 | 1,562.0 | - | | - | |
| Unconditional Grants | 933.5 | 948.9 | 15.4 | | 1.6 | |
| Conditional Grants | 362.3 | 363.8 | 1.5 | | 0.4 | |
| Revenue from Federal Sources | 2,857.8 | 2,874.7 | 16.9 | | 0.6 | |
| Total Revenues | 7,993.9 | 7,763.5 | (230.4) | | (2.9) | |
Taxes
Taxes are down $187.7 million from budget, primarily due to:
- Harmonized Sales Tax is down $98.0 million, mainly due to a weakened economy including negative adjustments to prior year revenue estimates of $64.8 million.
- Personal Income Tax is down $45.7 million due to a weakened tax base including negative adjustments to prior year revenue estimates.
- Provincial Real Property Tax is down $30.6 million due to the reassessment of large industrial, commercial, and residential properties and other adjustments.
Royalties
Royalties fell $20.0 million from budget primarily due to lower price and volume for potash.
Income from Government Business Enterprises
Income from Government Business Enterprises is down $59.0 million from budget largely due to lower investment income from the New Brunswick Power Corporation due to performance issues at the Point Lepreau Generating Station (PLGS) in the first quarter, increased purchased power and natural gas costs due to the exceptionally cold winter temperatures and supply issues in the Northeast, and a winter storm that cost the utility $12 million in late December. In addition, the Financial and Consumer Services Commission (formerly the New Brunswick Securities Commission) is now being accounted for using the consolidation method instead of the modified equity method, as budgeted.
| 2014 | PROVINCE OF NEW BRUNSWICK | 8 |
| | | |
Other Provincial Revenue
Other provincial revenue is up $20.4 million mainly due to changes that occurred when the Financial and Consumer Services Commission (formerly the New Brunswick Securities Commission) was created, which resulted in the entity being accounted for using the consolidation method instead of the modified equity method, as budgeted.
Unconditional Grants
Unconditional Grants are up $15.4 million from budget largely related to an increase for the Canada Health Transfer related to new population data.
| | | | |
| Actual 2013 to Actual 2014 Comparison | | | | |
| |
| 2013 Actual to 2014 Actual |
| ($ millions) |
|
| Item | 2013 | 2014 | | % |
| | Actual | Actual | Change | Change |
| Provincial Sources | | | | |
| Taxes | 3,542.1 | 3,595.3 | 53.2 | 1.5 |
| Licenses and Permits | 144.6 | 148.7 | 4.1 | 2.8 |
| Royalties | 86.1 | 90.9 | 4.8 | 5.6 |
| Income from Government Business Enterprises | 189.7 | 221.9 | 32.2 | 17.1 |
| Other Provincial Revenue | 604.2 | 627.5 | 23.3 | 3.9 |
| Sinking Fund Earnings | 220.7 | 204.5 | (16.2) | (7.3) |
| Revenue from Provincial Sources | 4,787.4 | 4,888.8 | 101.4 | 2.1 |
| Federal Sources | | | | |
| Fiscal Equalization Payments | 1,597.7 | 1,562.0 | (35.7) | (2.2) |
| Unconditional Grants | 894.2 | 948.9 | 54.7 | 6.1 |
| Conditional Grants | 508.6 | 363.8 | (144.8) | (28.5) |
| Revenue from Federal Sources | 3,000.5 | 2,874.7 | (125.8) | (4.2) |
| Total Revenues | 7,787.9 | 7,763.5 | (24.4) | (0.3) |
Taxes
Taxes are up $53.2 million over the previous fiscal year, mainly due to:
- Personal Income Tax is up $146.5 million primarily due to personal income tax increases announced in the 2013-2014 Budget.
- Corporate Income Tax is up $13.5 million reflecting an increase in the New Brunswick general corporate income tax rate announced in the 2013-2014 Budget.
- Harmonized Sales Tax is down by $107.8 million due to prior year adjustments for the 2008 to 2013 taxation years.
Income From Government Business Enterprises
Income from Government Business Enterprises is up $32.2 million from the previous fiscal year mainly attributable to increased investment income for the New Brunswick Power Corporation and a change in the consolidation method for the Financial and Consumer Services Commission (formerly the New Brunswick Securities Commission).
| 2014 | PROVINCE OF NEW BRUNSWICK | 9 |
| | | |
Other Provincial Revenue
Other provincial revenue is up $23.3 million mainly due to changes in the method of consolidation for the Financial and Consumer Services Commission (formerly the New Brunswick Securities Commission) and the New Brunswick Agricultural Insurance Commission.
Sinking Fund Earnings
Sinking Fund Earnings are down $16.2 million from the previous fiscal year due to a continued reduction in the asset base from redemptions exceeding installments and earnings, as well as lower interest rates.
Fiscal Equalization Payments
Fiscal Equalization Payments are down $35.7 million reflecting a narrowing of fiscal disparities between New Brunswick and the national average.
Unconditional Grants
Unconditional Grants are up $54.7 million due to legislated growth for Canada Health Transfer and Canada Social Transfer as well as positive adjustments related to population data.
Conditional Grants
Conditional Grants are down $144.8 million mainly due to one-time capital revenue received in 2013 related to the Route One Gateway Project.
| | | | |
| EXPENSES | | | | |
| |
| Budget 2014 to Actual 2014 Comparison | | | |
| |
| 2014 Budget to Actual |
| ($ millions) |
|
| Item | Budget | Actual | Variance | % Variance |
| Education and Training | 1,794.9 | 1,821.8 | 26.9 | 1.5 |
| Health | 2,806.2 | 2,789.9 | (16.3) | (0.6) |
| Social Development | 1,096.6 | 1,076.6 | (20.0 | (1.8) |
| Protection Services | 236.6 | 235.2 | (1.4) | (0.6) |
| Economic Development | 252.1 | 231.4 | (20.7) | (8.2) |
| Labour and Employment | 126.2 | 118.3 | (7.9) | (6.3) |
| Resources | 206.4 | 212.7 | 6.3 | 3.0 |
| Transportation and Infrastructure | 561.4 | 577.9 | 16.5 | 2.9 |
| Central Government | 728.2 | 536.5 | (191.7) | (26.3) |
| Service of the Public Debt | 664.0 | 661.9 | (2.1) | (0.3) |
| Total Expenses | 8,472.6 | 8,262.2 | (210.4) | (2.5) |
Items in the table are reported by functional area. See the related schedule in the consolidated financial statements for additional details.
Education and Training
Education and Training expenses were $26.9 million higher than budget. This was mainly due to higher than budgeted pension expense.
Health
Health expenses were $16.3 million lower than budget mainly due to a number of savings and cost containment initiatives in the health care system, including lower than budgeted costs in the prescription drug program, benchmarking initiatives in the Regional Health Authorities, lower than expected costs for blood products, and IT-related expenditure reductions.
| 2014 | PROVINCE OF NEW BRUNSWICK | 10 |
| | | |
Social Development
Social Development expenses were $20.0 million less than budget mainly due to the elimination of property tax payments made on public housing units, the capitalization of investments in tangible capital assets for a new housing system that is in progress, and lower than budgeted expenses in the Long Term Care program.
Economic Development
Economic Development expenses were $20.7 million lower than budget mainly due to lower than budgeted expenses in the Regional Development Corporation Special Operating Agency due to project timing changes from budget and less than budgeted expenses in the Strategic Assistance program of Invest NB.
Labour and Employment
Labour and Employment expenses were $7.9 million lower than budget primarily due to lower than expected uptake in the Employment Services, Workability, and Training and Skills Development programs.
Resources
Resources expenses were $6.3 million higher than budget. This was mainly due to a change in the consolidation method for the New Brunswick Agricultural Insurance Commission.
Transportation and Infrastructure
Transportation expenses were $16.5 million higher than budget mainly due to higher than budgeted expenses in the Department of Transportation and Infrastructure as a result of delays in achieving some productivity and process improvement savings initiatives, increased expenses in the Winter Maintenance program due to the length and severity of the winter and various cost pressures.
Central Government
Central Government expenses were $191.7 million lower than budget. This was due to a number of factors, including:
- Lower than budgeted pension expense due in part to a change from budget in the accounting method for the conversion of the Public Service Superannuation Act plan to the Public Service Shared Risk Plan;
- Lower than budgeted expenses in General Government due to lower than expected centrally managed funds;
- Lower than budgeted provision for losses expense.
These decreases were offset by increased expenses in other areas, including a change in the consolidation method of the Financial and Consumer Services Commission.
| 2014 | PROVINCE OF NEW BRUNSWICK | 11 |
| | | |
|
Actual 2013 to Actual 2014 Comparison | | | |
| |
| 2013 Actual to 2014 Actual |
| ($ millions) |
|
| Item | 2013 Actual | 2014 Actual | Change | % Change |
| Educationand Training | 1,787.6 | 1,821.8 | 34.2 | 1.9 |
| Health | 2,786.1 | 2,789.9 | 3.8 | 0.1 |
| Social Development | 1,052.8 | 1,076.6 | 23.8 | 2.3 |
| Protection Services | 237.3 | 235.2 | (2.1) | (0.9) |
| Economic Development | 269.1 | 231.4 | (37.7) | (14.0) |
| Labourand Employment | 100.5 | 118.3 | 17.8 | 17.7 |
| Resources | 217.4 | 212.7 | (4.7) | (2.2) |
| Transportation and Infrastructure | 547.7 | 577.9 | 30.2 | 5.5 |
| Central Government | 636.6 | 536.5 | (100.1) | (15.7) |
| Service of the Public Debt | 660.3 | 661.9 | 1.6 | 0.2 |
| Total Expenses | 8,295.4 | 8,262.2 | (33.2) | (0.4) |
Items in the table are reported by functional area. See the related schedule in the consolidated financial statements for additional details.
Education and Training
Education and Training expenses were $34.2 million higher than the previous fiscal year. This was mainly due to additional investments and salaries in K-12 education.
Social Development
Social Development expenses were $23.8 million higher than the previous fiscal year mainly due to wages and increased costs for long term care clients.
Economic Development
Economic Development expenses were $37.7 million less than the previous fiscal year primarily due to a decrease in expenses under the Regional Development Corporation Special Operating Agency primarily relating to various federal-provincial agreements.
Labour and Employment
Labour and Employment expenses were $17.8 million higher than the previous fiscal year primarily due to greater uptake in the Workforce Expansion and Training and Skills Development programs.
Resources
Resources expenses were $4.7 million lower than the previous fiscal year mainly due to expenditures under the Agri-Recovery program in the previous fiscal year.
Transportation and Infrastructure
Transportation and Infrastructure expenses were $30.2 million higher than the previous year mainly due to increased amortization expense and increased expenses in the Buildings Group, New Brunswick Highway Corporation, and Winter Maintenance programs of the Department of Transportation and Infrastructure.
Central Government
Central Government expenses were $100.1 million lower than the previous year. This was due to a number of factors, including:
- Decreased pension expense due to a one-time negative adjustment to recognize the net pension asset of the New Brunswick Power Corporation at conversion to the Public Service Shared Risk Plan, compounded by the recognition of an actuarial loss in the prior year related to Supplementary Early Retirement Programs (SERP);
| 2014 | PROVINCE OF NEW BRUNSWICK | 12 |
| | | |
- Lower than budgeted expenses in General Government mainly due to decreased retirement allowance expense;
These decreases were offset by increased expenses in other areas including a change in the consolidation method of the Financial and Consumer Services Commission.
| 2014 | PROVINCE OF NEW BRUNSWICK | 13 |
| | | |
INDICATORS OF FINANCIAL HEALTH
This section provides indicators of progress in the Province’s financial condition using information provided in the Province’s consolidated financial statements as well as other standard socio-economic indicators such as nominal Gross Domestic Product (GDP) data from Statistics Canada.
The analysis of financial indicators is a reporting practice recommended by the Public Sector Accounting Board, and provides results in a manner that improves transparency and provides a clearer understanding of recent trends in the Province’s financial health. Trends over the last ten years (2005 to 2014) are evaluated using the criteria of sustainability, flexibility and vulnerability. Though many potential indicators are available, those found to be the most relevant, measurable and transparent to users of government financial information are included. Similar data series are also widely used by banks and other financial institutions, investors and credit-rating agencies.
In evaluating a government’s financial health, it should be acknowledged that governments have exposure to a number of variables that are beyond their direct scope of control, but still can exert major influences on financial results and indicators. These include but are not limited to:
- Changing global economic conditions such as energy prices, commodity prices, investment valuation and inflation;
- Changes to international financial conditions that impact interest rates, currency fluctuations or availability of credit;
- Changes to federal transfers or programs;
- Emergencies such as floods, forest fires and pandemics;
- Developments affecting agencies such as the New Brunswick Power Corporation that are reflected on the Province’s books and;
- Changes in generally accepted accounting principles.
Sustainability
Sustainability is the degree to which a government can maintain its existing financial obligations both in respect of its service commitments to the public and financial commitments to creditors, employees and others without increasing the debt or tax burden relative to the economy within which it operates. It is measured in this analysis by:
- Net debt as a proportion of GDP;
- Net debt per capita.
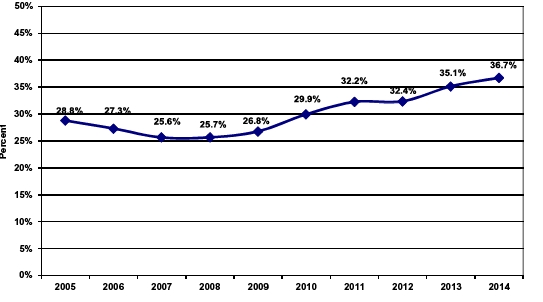
Net Debt as a Proportion of GDP:
Net debt is an indication of the extent to which Provincial government liabilities exceed financial assets. The net debt-to-GDP ratio shows the relationship between net debt and the economy. If the ratio is declining, growth in the economy is exceeding growth in net debt, resulting in improved sustainability. Conversely, an increasing net debt-to-GDP ratio indicates net debt is increasing faster than growth in the economy and serving to reduce the provincial government’s financial sustainability.
Over the last ten years the Province’s ratio of net debt-to-GDP increased from 28.8% to 36.7%. Beginning 2008, the ratio has trended upwards related to weakened economic circumstances, capital spending, and other factors. In 2012, the ratio stabilized but increased in 2013 in part related to the Route One Gateway project coming onto the Province’s books. In 2014, the ratio rose as growth in net debt outpaced that of the economy.
| 2014 | PROVINCE OF NEW BRUNSWICK | 14 |
| | | |
Net Debt-to-GDP Ratio
| | | |
Net Debt-to-GDP Ratio |
| Fiscal Year Ending | Net Debt | GDP | Net Debt/GDP |
| | ($ millions) | ($ millions) | (%) |
| 2005 | 6,943.0 | 24,116 | 28.8 |
| 2006 | 6,900.6 | 25,272 | 27.3 |
| 2007 | 6,761.4 | 26,378 | 25.6 |
| 2008 | 7,151.6 | 27,869 | 25.7 |
| 2009 | 7,608.0 | 28,422 | 26.8 |
| 2010 | 8,628.9 | 28,825 | 29.9 |
| 2011 | 9,700.4 | 30,082 | 32.2 |
| 2012 | 10,125.8 | 31,291 | 32.4 |
| 2013 | 11,084.6 | 31,543 | 35.1 |
| 2014 | 11,641.2 | 31,701 | 36.7 |
| |
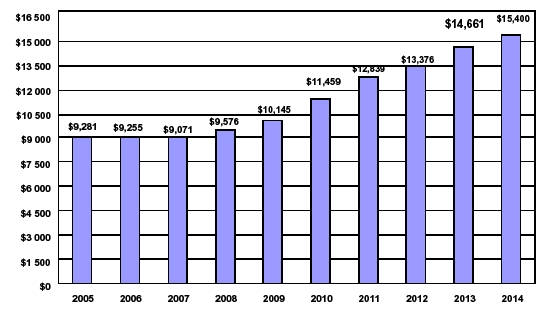
| Net Debt per Capita: | | | |
Net debt per capita is a statement of the net debt attributable to each New Brunswick resident. A decrease in net debt per capita suggests the debt burden has improved while an increase implies the debt burden has increased. Since 2008, the net debt per capita has trended upwards reflecting weakened economic circumstances, capital spending and other factors.
| 2014 | PROVINCE OF NEW BRUNSWICK | 15 |
| | | |
Net Debt per Capita
| | | |
| Net Debt per Capita |
|
| Fiscal Year Ending | Net Debt | Population | Net Debt per Capita |
| | ($ millions) | (July 1) | ($) |
| 2005 | 6,943.0 | 748,044 | 9,281 |
| 2006 | 6,900.6 | 745,609 | 9,255 |
| 2007 | 6,761.4 | 745,407 | 9,071 |
| 2008 | 7,151.6 | 746,855 | 9,576 |
| 2009 | 7,608.0 | 749,954 | 10,145 |
| 2010 | 8,628.9 | 753,044 | 11,459 |
| 2011 | 9,700.4 | 755,530 | 12,839 |
| 2012 | 10,125.8 | 756,997 | 13,376 |
| 2013 | 11,084.6 | 756,050 | 14,661 |
| 2014 | 11,641.2 | 755,898 | 15,400 |
Flexibility
Flexibility is the degree to which a government can change its debt or tax burden on the economy within which it operates to meet its existing financial obligations both in respect of its service commitments to the public and financial commitments to creditors, employees and others. It is measured in this analysis by:
- Own-source revenue as a proportion of GDP;
- Cost of servicing the public debt as a proportion of total revenue.
| 2014 | PROVINCE OF NEW BRUNSWICK | 16 |
| | | |
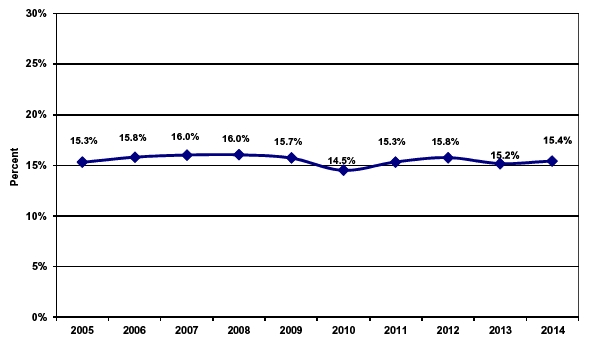
Own-source Revenue as a Proportion of GDP:
This ratio measures own-source revenues of the Provincial government as a percentage of the economy, as measured by nominal GDP. An increase in this ratio indicates that government own-source revenues are growing faster than the economy as a whole, reducing government’s flexibility to increase revenues without slowing growth in the economy. A decrease in the ratio is indicative of the government taking less revenue out of the economy on a relative basis, which increases its flexibility.
Own-source revenue includes revenues from taxation, natural resources, fees, return on investment, lotteries, fines and penalties, etc., and is essentially all revenue minus federal transfers. While more controllable than federal transfers, as the Province can influence revenues through its own tax rates and fiscal policy, own-source revenue is vulnerable to, among other factors:
- Net income or revenue of outside agencies whose revenue can fluctuate significantly due to price, volume, accounting changes, weather, etc (e.g. the New Brunswick Power Corporation)
- Variability in provincial revenues that are collected or estimated by the federal government such as personal and corporate income taxes and the Harmonized Sales Tax;
- Commodity tax revenues such as Metallic Minerals Tax that are vulnerable to world prices.
Own-source revenue as a proportion of GDP has been relatively stable over the past ten years.
Own-source Revenue as a Proportion of GDP
| 2014 | PROVINCE OF NEW BRUNSWICK | 17 |
| | | |
| | | |
Own-source Revenue as a Proportion of GDP |
|
| |
| Fiscal Year Ending | Own-source Revenue | GDP | Own-source Revenue |
| | | | as a Proportion of |
| | | | GDP |
| | ($ millions) | ($ millions) | (%) |
| 2005 | 3,688.6 | 24,116 | 15.3 |
| 2006 | 3,994.2 | 25,272 | 15.8 |
| 2007 | 4,225.4 | 26,378 | 16.0 |
| 2008 | 4,469.7 | 27,869 | 16.0 |
| 2009 | 4,467.3 | 28,422 | 15.7 |
| 2010 | 4,179.7 | 28,825 | 14.5 |
| 2011 | 4,612.5 | 30,082 | 15.3 |
| 2012 | 4,931.7 | 31,291 | 15.8 |
| 2013 | 4,787.4 | 31,543 | 15.2 |
| 2014 | 4,888.8 | 31,701 | 15.4 |
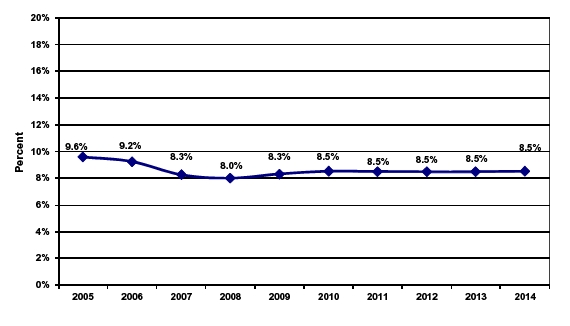
Cost of Servicing the Public Debt as a Proportion of Total Revenue:
Debt service costs as a proportion of total revenue is an indicator of the Province’s ability to satisfy existing credit requirements in the context of the government’s overall revenue. Debt service costs can be impacted by variables outside the direct control of government, such as credit ratings, interest rates, financial markets and currency fluctuations. Investment in public infrastructure resulting in a change in the stock of debt can also influence borrowing requirements.
The Province’s proportion of debt service costs to revenue declined steadily over the 2005 to 2008 period, lowering the overall financial burden on the Provincial budget. A decrease in this ratio indicates that debt service costs are a smaller proportion of Provincial revenues overall, allowing the Province more financial resources to provide essential programs and services. Since then, the ratio has been relatively stable.
Cost of Servicing the Public Debt as a Proportion of Total Revenue
| 2014 | PROVINCE OF NEW BRUNSWICK | 18 |
| | | |
| | | |
| Cost of Servicing the Public Debt as a Proportion of Total Revenue |
|
Fiscal Year Ending | Cost of Servicing the PublicDebt | Total Revenue | Cost of Servicing the Public Debt as a Proportion of Total |
| | | | Revenue |
| | ($ millions) | ($millions) | (%) |
| 2005 | 579.6 | 6,043.4 | 9.6 |
| 2006 | 590.3 | 6,387.1 | 9.2 |
| 2007 | 558.0 | 6,756.3 | 8.3 |
| 2008 | 575.7 | 7,190.3 | 8.0 |
| 2009 | 601.4 | 7,230.9 | 8.3 |
| 2010 | 607.2 | 7,120.5 | 8.5 |
| 2011 | 641.5 | 7,542.8 | 8.5 |
| 2012 | 661.8 | 7,805.9 | 8.5 |
| 2013 | 660.3 | 7,787.9 | 8.5 |
| 2014 | 661.9 | 7,763.5 | 8.5 |
Vulnerability
Vulnerability is the degree to which a government is dependent on sources of funding outside its control or influence or is exposed to risks that could impair its ability to meet its existing financial obligations both in respect of its service commitments to the public and financial commitments to creditors, employees and others. A common measurement of vulnerability is federal government transfers as a proportion of revenue.
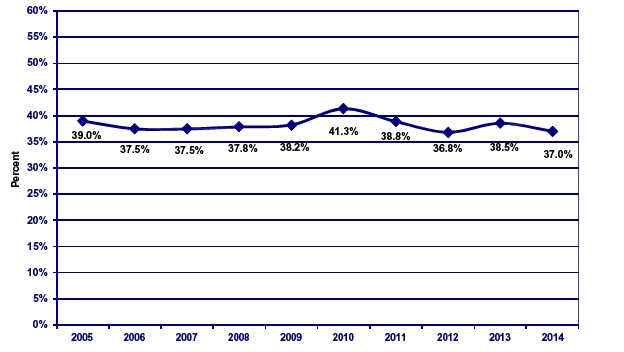
Federal Government Transfers as a Proportion of Total Revenue:
Revenue from federal sources is comprised of conditional and unconditional grants from the federal government, including:
- Fiscal Equalization Program payments;
- The Canada Health Transfer and the Canada Social Transfer;
- Conditional grants or capital revenue in support of economic development, infrastructure, education and labour training and other areas.
Federal transfer payments can be affected by federal fiscal policy decisions, the normal annual estimate process that guides federal payments under the Equalization Program and Canada Health and Social Transfers, as well as timing and conditions related to conditional grants.
Comparing the level of federal transfers to total revenue provides an indication of the vulnerability of the Province. Generally, if the ratio is increasing, the Province is increasingly reliant on federal transfers, resulting in increased vulnerability. If the ratio is declining, vulnerability is diminished.
Federal government transfers as a proportion of total revenue hovered in the 37-39 percent range from 2005 to 2009, before spiking in 2010. In that year, provincial-source revenues contracted as the effects of the economic slowdown hampered revenues and the NBEFC experienced a significant net loss. At the same time, federal stimulus funding supported federal-source revenue growth. The ratio has since declined back to the 37% range.
| 2014 | PROVINCE OF NEW BRUNSWICK | 19 |
| | | |
Federal Government Transfers as a Proportion of Total Revenue
| | | |
| Federal Government Transfers as a Proportion of Total Revenue |
|
Fiscal Year Ending | FederalGovernment Transfers | Total Revenue | Federal Government Transfersasa Proportion of Total |
| | | | Revenue |
| | ($ millions) | ($ millions) | (%) |
| 2005 | 2,354.8 | 6,043.4 | 39.0 |
| 2006 | 2,392.9 | 6,387.1 | 37.5 |
| 2007 | 2,530.9 | 6,756.3 | 37.5 |
| 2008 | 2,720.6 | 7,190.3 | 37.8 |
| 2009 | 2,763.6 | 7,230.9 | 38.2 |
| 2010 | 2,940.8 | 7,120.5 | 41.3 |
| 2011 | 2,930.3 | 7,542.8 | 38.8 |
| 2012 | 2,874.2 | 7,805.9 | 36.8 |
| 2013 | 3,000.5 | 7,787.9 | 38.5 |
| 2014 | 2,874.7 | 7,763.5 | 37.0 |
| 2014 | PROVINCE OF NEW BRUNSWICK | 20 |
| | | |
| 2014 | PROVINCE OF NEW BRUNSWICK | 21 |
| | | |
| 2014 | PROVINCE OF NEW BRUNSWICK | 22 |
| | | |
| | | | | |
| CONSOLIDATED STATEMENT OF FINANCIAL POSITION |
| as at 31 March |
| | | | (millions) | |
| Schedule | | 2014 | 2013 | |
| | FINANCIAL ASSETS | | | | |
| 1 | Cash and Short Term Investments | | $ 1,538.0 | $ 1,296.6 | |
| 2 | Receivables and Advances | | 358.7 | 442.4 | |
| 3 | Taxes Receivable | | 1,115.4 | 1,140.2 | |
| 4 | Inventories for Resale | | 3.4 | 3.4 | |
| 5 | Loans | | 577.6 | 592.0 | |
| 6 | Equity inGovernment Business Enterprises (Note 7) | | 272.7 | 201.1 | |
| | Sinking Fund Equity (Note 10) | | 3,883.9 | 3,955.8 | |
| 6 | Other Investments | | 16.4 | 22.3 | |
| | Total Financial Assets | | 7,766.1 | 7,653.8 | |
| | LIABILITIES | | | | |
| | Short Term Borrowing (Note 5) | | 1,371.8 | 1,371.5 | |
| 7 | Accounts Payable and Accrued Expenses | | 2,482.1 | 2,518.3 | |
| 8 | Allowance for Losses | | 41.6 | 52.3 | |
| | Unrealized Foreign Exchange Gains | | 22.7 | 27.3 | |
| 9 | Deferred Revenue | | 507.2 | 545.5 | |
| 10 | Deposits HeldinTrust | | 330.1 | 240.5 | |
| 11 | Obligations under Capital Leases (Note 6) | | 716.2 | 794.7 | |
| | Net Pension Liability (Note 12) | | (0.6) | (149.5) | |
| | | | 5,471.1 | 5,400.6 | |
| |
| | Funded Debt (Note 10) | | 18,502.5 | 18,023.2 | |
| | Borrowing for New Brunswick Power Corporation | | (4,566.3) | (4,685.4) | |
| | Funded Debt for Provincial Purposes | | 13,936.2 | 13,337.8 | |
| | Total Liabilities | | 19,407.3 | 18,738.4 | |
| |
| | NET DEBT | | (11,641.2) | (11,084.6) | |
| |
| | NON-FINANCIAL ASSETS | | | | |
| | Tangible Capital Assets (Note 8) | | 8,018.5 | 7,977.6 | |
| 12 | Inventories of Supplies | | 48.0 | 52.3 | |
| 13 | Prepaid and Deferred Charges | | 301.6 | 250.0 | |
| | Total Non-Financial Assets | | 8,368.1 | 8,279.9 | |
| |
| | ACCUMULATED DEFICIT | | $ (3,273.1) | $ (2,804.7) | |
| | Contingent Liabilities - Note 14 | | | | |
| | Commitments - Note 15 | | | | |
| |
| | The accompanying notes are an integral part of these consolidated financial statements. | | |

| 2014 | PROVINCE OF NEW BRUNSWICK | 23 |
| | | |
CONSOLIDATED STATEMENT OF OPERATIONS
for the fiscal year ended 31 March
| | | | |
| | | (millions) |
| Schedule | 2014 | 2014 | 2013 |
| | | Budget | Actual | Actual |
| |
| | REVENUE | | | |
| |
| | Provincial Sources | | | |
| 14 | Taxes | $ 3,783.0 | $ 3,595.3 | $ 3,542.1 |
| 15 | Licenses and Permits | 147.7 | 148.7 | 144.6 |
| 16 | Royalties | 110.9 | 90.9 | 86.1 |
| 17 | Income from Government Business Enterprises | 280.9 | 221.9 | 189.7 |
| 18 | Other Provincial Revenue | 607.1 | 627.5 | 604.2 |
| | Sinking Fund Earnings | 206.5 | 204.5 | 220.7 |
| | | 5,136.1 | 4,888.8 | 4,787.4 |
| |
| | Federal Sources | | | |
| | Fiscal Equalization Payments | 1,562.0 | 1,562.0 | 1,597.7 |
| 19 | Unconditional Grants | 933.5 | 948.9 | 894.2 |
| 20 | Conditional Grants | 362.3 | 363.8 | 508.6 |
| | | 2,857.8 | 2,874.7 | 3,000.5 |
| | | 7,993.9 | 7,763.5 | 7,787.9 |
| |
| | EXPENSE | | | |
| |
| 21 | Education and Training | 1,794.9 | 1,821.8 | 1,787.6 |
| 22 | Health | 2,806.2 | 2,789.9 | 2,786.1 |
| 23 | Social Development | 1,096.6 | 1,076.6 | 1,052.8 |
| 24 | Protection Services | 236.6 | 235.2 | 237.3 |
| 25 | Economic Development | 252.1 | 231.4 | 269.1 |
| 26 | Labour and Employment | 126.2 | 118.3 | 100.5 |
| 27 | Resources | 206.4 | 212.7 | 217.4 |
| 28 | Transportation and Infrastructure | 561.4 | 577.9 | 547.7 |
| 29 | Central Government | 728.2 | 536.5 | 636.6 |
| | Service of the Public Debt (Note 11) | 664.0 | 661.9 | 660.3 |
| | | 8,472.6 | 8,262.2 | 8,295.4 |
| |
| | ANNUAL DEFICIT | $ (478.7) | $ (498.7) | $ (507.5) |
The accompanying notes are an integral part of these consolidated financial statements.
| 2014 | PROVINCE OF NEW BRUNSWICK | 24 |
| | | |
| | | | |
| CONSOLIDATED STATEMENT OF CASH FLOW |
| for the fiscal year ended 31 March |
| | | (millions) | |
| OPERATING ACTIVITIES | | 2014 | 2013 | |
| |
| |
| Deficit | | $ (498.7) | $ (507.5) | |
| Non Cash Items | | | | |
| Amortization of Premiums, Discounts and Issue Expenses | | 8.0 | 4.2 | |
| Foreign Exchange Expense | | (6.2) | (19.3) | |
| Increase (decrease) in Provision for Losses | | 28.7 | (77.5) | |
| Amortization of Tangible Capital Assets | | 373.2 | 349.9 | |
| Loss on Disposal or Impairment of Tangible Capital Assets | | 4.2 | 24.7 | |
| Sinking Fund Earnings | | (204.5) | (220.7) | |
| Losses on Foreign Exchange Settlements | | 3.3 | 6.5 | |
| Increase in Net Pension Liability (Note 12) | | 148.9 | 110.0 | |
| Decrease in Deferred Revenue | | (38.3) | (49.9) | |
| Changes in Working Capital: | | | | |
| Decrease (increase) in Accounts Receivable | | 61.3 | (79.7) | |
| Decrease (increase) in Taxes Receivable | | 15.5 | (60.8) | |
| Increase in Inventories | | 4.3 | 2.8 | |
| Increase (Decrease) in Prepaid and Deferred Charges - Other | | 24.5 | (35.1) | |
| (Decrease) increase in Accounts Payable and Accrued Expenses | | (36.2) | 142.9 | |
| Increase in Deposits Held in Trust | | 89.6 | 53.0 | |
| Net Cash Used in Operating Activities | | (22.4) | (356.5) | |
| |
| INVESTING ACTIVITIES | | | | |
| |
| Increase in Investments, Loans and Advances | | (104.9) | (141.5) | |
| Other Comprehensive Income | | 76.3 | 119.4 | |
| Net Cash Used in Investing Activities | | (28.6) | (22.1) | |
| |
| CAPITAL TRANSACTIONS | | | | |
| |
| Acquisition of Capital Assets (Note 8) | | (418.3) | (899.7) | |
| |
| FINANCING ACTIVITIES | | | | |
| |
| Proceeds from Issuance of Funded Debt | | 1,732.2 | 1,920.6 | |
| Purchase of NB Power Debentures | | (180.0) | (451.6) | |
| Elimination of Debentures held by NB Immigrant Investor Fund | | (57.0) | (34.1) | |
| Received from Sinking Fund for Redemption of Debentures and | | | | |
| Payment of Exchange | | 403.2 | 628.5 | |
| Decrease in Obligations under Capital Leases | | (78.5) | (27.1) | |
| Sinking Fund Installments | | (126.9) | (126.6) | |
| Short Term Borrowing | | 0.3 | 697.0 | |
| Funded Debt Matured | | (982.6) | (903.3) | |
| Net Cash From Financing Activities | | 710.7 | 1,703.4 | |
| |
| INCREASE IN CASH DURING YEAR | | 241.4 | 425.1 | |
| CASH AND SHORT TERM INVESTMENTS - BEGINNING OF YEAR | | 1,296.6 | 871.5 | |
| CASH AND SHORT TERM INVESTMENTS - END OF YEAR | | $ 1,538.0 | $1,296.6 | |
| The accompanying notes are an integral part of these consolidated statements | | | | |
| 2014 | PROVINCE OF NEW BRUNSWICK | 25 |
| | | |
| | | | | | | | | | |
| CONSOLIDATED STATEMENT OF CHANGE IN NET DEBT |
| for the fiscal year ended 31 March |
| | | | | | | (millions) | | | | |
| | | | 2014 | | | 2014 | | | 2013 | |
| | | | Budget | | | Actual | | | Actual | |
| |
| RESTATED NET DEBT - BEGINNING OF YEAR | | | | | | | | | | |
| (NOTE 18) | | | $(11,054.0) | | | $ (11,130.6) | | | $(10,125.8) | |
| |
| CHANGES IN YEAR | | | | | | | | | | |
| |
| Annual Deficit | | | (478.7) | | | (498.7) | | | (507.5) | |
| Other Comprehensive Income | | | -- | | | 76.3 | | | 119.4 | |
| Acquisition of Tangible Capital Assets (Note 8) | | | (421.4) | | | (418.3) | | | (899.7) | |
| Amortization of Tangible Capital Assets (Note 8) | | | 355.5 | | | 373.2 | | | 349.9 | |
| Loss on Disposal or Impairment of Tangible Capital Assets | | | -- | | | 4.2 | | | 24.7 | |
| Net Change in Supplies Inventories | | | -- | | | 4.3 | | | 3.7 | |
| Net Change in Prepaid Expenses | | | -- | | | (51.6) | | | (49.3) | |
| INCREASE IN NET DEBT | | | (544.6) | | | (510.6) | | | (958.8) | |
| NET DEBT - END OF YEAR | | | $(11,598.6) | | | $ (11,641.2) | | | $(11,084.6) | |
| | | | | | | | | | |
| CONSOLIDATED STATEMENT OF CHANGE IN ACCUMULATED DEFICIT |
| for the fiscal year ended 31 March |
| | | | | | (millions) | | | | |
| | | | 2014 | | | 2014 | | | 2013 | |
| | | | Budget | | | Actual | | | Actual | |
| |
| RESTATED ACCUMULATED DEFICIT - | | | | | | | | | | |
| BEGINNING OF YEAR (NOTE 18) | | | $ (2,795.9) | | | $ (2,850.7) | | | $(2,416.6) | |
| |
| Annual Deficit | | | (478.7) | | | (498.7) | | | (507.5) | |
| Other Comprehensive Income | | | -- | | | 76.3 | | | 119.4 | |
| |
| ACCUMULATED DEFICIT – END OF YEAR | | | $ (3,274.6) | | | $ (3,273.1) | | | $(2,804.7) | |
| |
| |
| The accompanying notes are an integral part of these consolidated financial statements. | | | | | |
| 2014 | PROVINCE OF NEW BRUNSWICK | 26 |
| | | |
NOTES TO THE CONSOLIDATED FINANCIAL STATEMENTS
31 March 2014
|
| NOTE 1 SUMMARY OF SIGNIFICANT ACCOUNTING POLICIES |
|
| a) Basis of Accounting |
These consolidated financial statements are prepared in accordance with Canadian public sector accounting standards.
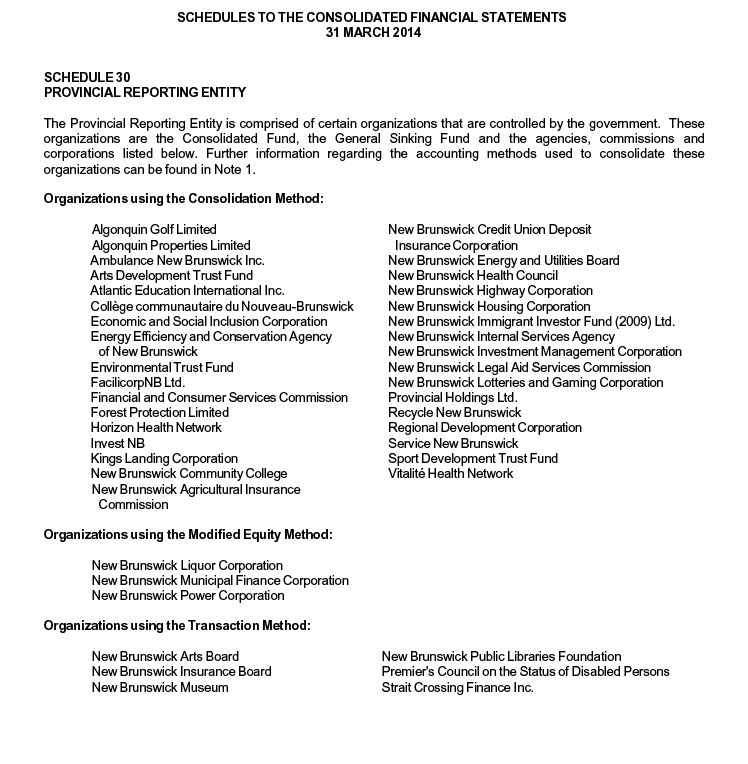
b) Provincial Reporting Entity
These consolidated financial statements include the accounts of organizations that are controlled by the Province. A complete listing of the organizations within the Province’s government reporting entity is provided in Schedule 30.
Legally established trust funds which the Province administers but does not control are not included as Provincial assets or liabilities. These consolidated financial statements disclose the equity balances of the trust funds administered by the Province in Note 17.
c) Principles of Consolidation
Transactions and balances of organizations are included in these consolidated financial statements through one of the following accounting methods:
Consolidation Method
This method combines the accounts of distinct organizations. It requires uniform accounting policies for the organizations. The Province does not adjust the tangible capital asset policies of organizations that are consolidated using this method to those of the Province, as it would not result in a material adjustment. Inter-organizational balances and transactions are eliminated under this method. This method reports the organizations as if they were one organization.
Modified Equity Method
This method is used for government business enterprises (GBE’s). GBE’s are defined in Note 7 to these consolidated financial statements. The modified equity method reports a GBE’s net assets as an investment on the Province’s Consolidated Statement of Financial Position. The net income of the GBE is reported as income from government business enterprises on the Province’s Consolidated Statement of Operations. Inter-organizational transactions and balances are not eliminated. All gains or losses arising from inter-organizational transactions between GBE’s and other government organizations are eliminated. The accounting policies of GBE’s are not adjusted to conform with those of other government organizations.
Transaction Method
This method records only transactions between the Province and the other organizations. The transaction method is used when the appropriate methods would not produce a materially different result.
d) Future Changes in Accounting Policy
PS - 3260 Liability for Contaminated Sites
The Public Sector Accounting Board issued this accounting standard effective for fiscal years starting on or after April 1, 2014. As defined in the standard, contaminated sites are a result of contamination being introduced into air, soil, water, or sediment of a chemical, organic, or radioactive material, or live organism that exceeds an environmental standard. The Province will recognize a liability related to the remediation of such contaminated sites subject to certain recognition criteria. The Province is currently analyzing the impact of this standard on its financial statements.
| 2014 | PROVINCE OF NEW BRUNSWICK | 27 |
| | | |
NOTES TO THE CONSOLIDATED FINANCIAL STATEMENTS
31 March 2014
PS 3450 - Financial Instruments and PS 2601 – Foreign Currency Translation
The Public Sector Accounting Board issued section PS 3450 - Financial Instruments effective for fiscal years beginning on or after April 1, 2016. Under this new standard, financial instruments will be assigned a measurement category of either fair value, cost or amortized cost. Until a financial instrument is derecognized, any gains or losses that arise due to fair value remeasurement will be reported on the Statement of Remeasurement Gains and Losses. Adoption of this standard requires the adoption of PS 2601 Foreign Currency Translation, PS 1201 Financial Statement Presentation and PS 3041 Portfolio Investments in the same fiscal year.
e) Specific Accounting Policies
Asset Classification
Assets are classified as either financial or non-financial. Financial assets are assets that could be used to discharge existing liabilities or finance future operations and are not to be consumed in the normal course of operations. Non-financial assets are acquired, constructed or developed assets that do not provide resources to discharge existing liabilities but are employed to deliver government services, may be consumed in normal operations and are not for resale. Non-financial assets include tangible capital assets, prepaid and deferred charges and inventories of supplies.
Financial Assets
Cash and Short Term Investments
Cash and short term investments are recorded at cost, which approximates market value. Short term investments include highly liquid investments that are readily convertible to known amounts of cash, with maturity dates of three months or less. Short term investments include $857.9 million due from the New Brunswick Power Corporation.
Inventories for resale
Inventories for resale are recorded at the lower of cost or net realizable value. Properties held for resale are reported as a financial asset and include land and fixtures acquired or constructed for the purpose of sale. Properties held for resale also include properties acquired through foreclosure.
Loans
Loans are initially recorded at cost, and reported at the lower of cost and net recoverable value through a valuation allowance. Changes in the valuation allowance are recognized in expense. Interest revenue is recognized on a loan when earned, and ceases to be accrued when the collectability of either the principal or interest is not reasonably assured.
Loans issued under the Economic Development Act, Agricultural Development Act, and Fisheries and Aquaculture Development Act facilitate the establishment, development, or maintenance of industry in a variety of areas. As such, the nature and terms of the loans under these Acts vary. Energy Efficiency Upgrade Loans issued to clients are repayable over a maximum six year term, and are interest free. Loans to students are interest free while the student is in full-time studies and becomes repayable with interest six months after the student leaves post-secondary studies. The maximum repayment term is fifteen years. Loans issued under the New Brunswick Housing Act may offer concessionary interest rates, and are repayable over a period not to exceed twenty-five years.
Other Investments
Investments are recorded at cost. Where there has been a loss in the value of an investment that is other than a temporary decline, the investment is written down to recognize this loss.
| 2014 | PROVINCE OF NEW BRUNSWICK | 28 |
| | | |
NOTES TO THE CONSOLIDATED FINANCIAL STATEMENTS
31 March 2014
Sinking Funds
The General Sinking Fund is maintained by the Minister of Finance under the authority of section 12 of the Provincial Loans Act (“Act”). This Act provides that the Minister shall maintain one or more sinking funds for the payment of funded debt either at maturity or upon redemption in advance of maturity. Typically, redemptions are only made after the related Provincial purpose portion of the debt has been outstanding a minimum of twenty years.
Sinking fund installments are paid into the General Sinking Fund on or before the anniversary date of each issue of funded debt, at the prescribed rate of a minimum of 1% of the outstanding principal.
Sinking fund investments in bonds and debentures are reported at par value less unamortized discounts less premiums and the unamortized balance of unrealized foreign exchange gains or losses. Short-term deposits are reported at cost. The Province’s sinking fund may be invested in eligible securities as defined in the Act.
New Brunswick Power Corporation is contractually obligated to pay to the Province the amount of the sinking fund installment required each year in respect of the debentures issued by the Province on behalf of the New Brunswick Power Corporation.
| | | | | | | | | |
| The following table shows the components of the Sinking Fund: | | | | | | | |
| |
| | (millions) |
| |
| | | Consolidated | | | | | | | |
| | | Fund | | | NB Power | | | Total | |
| |
| Fund Equity, beginning of year | | $ 3,955.8 | | | $ 376.4 | | | $ 4,332.2 | |
| Sinking Fund Earnings | | 204.4 | | | 38.4 | | | 242.8 | |
| Installments | | 126.9 | | | 45.5 | | | 172.4 | |
| Paid for Debt Retirement | | (403.2) | | | (56.3) | | | (459.5) | |
| |
| Fund Equity, end of year | | $ 3,883.9 | | | $ 404.0 | | | $ 4,387.9 | |
Allowances
Allowances have been established for loans and accounts receivable, loan guarantees and other possible losses. These allowances are disclosed in the schedules to the consolidated financial statements.
Obligations resulting from guaranteed loans are recorded as liabilities when management determines that a loss is probable with changes in this allowance recorded annually.
Each outstanding loan guarantee under the Economic Development Act is reviewed on a quarterly basis. An allowance for loss on loan guarantees is established when management determines that a loss is probable. A loss is considered probable when one or more of the following factors is present:
- a decline in the financial position of the borrower;
- economic conditions in which the borrower operates indicate the borrower’s inability to repay the loan;
- collection experience for the loan.
Losses on guaranteed loans under the Agriculture Development Act and the Fisheries and Aquaculture Development Act for classes that have similar standards are calculated using an average rate based on past experience and trends.
| 2014 | PROVINCE OF NEW BRUNSWICK | 29 |
| | | |
NOTES TO THE CONSOLIDATED FINANCIAL STATEMENTS
31 March 2014
Amounts due to the Province but deemed uncollectible are written off from the accounts of the Province once the write-off has been approved by either the Board of Management or Secretary to the Board of Management depending on the dollar value involved.
Sick Leave
The cost of accumulating, non-vesting sick leave benefits are determined by an actuarial valuation, using management’s best estimate of salary escalation, accumulated sick days at retirement, long term inflation rates and discount rates. In accordance with Canadian public sector accounting standards for post-employment benefits and compensated absences, the Province recognizes the liability.
InjuredWorker Liability
The Province provides workers’ compensation benefits on a self-insured basis. WorkSafe New Brunswick administers the claims on the Province’s behalf and charges a fee for this service. The liability for workers’ compensation of $131.4 million as at 31 December 2013 ($131.9 million at 31 December 2012) is determined by an actuary and is included in the Employee Benefits Liability in Schedule 7. Management estimates the amount of the liability as at 31 March is not materially different. Annual claim payments are expensed by each department and are included in the functional expense area related to the program in which the employee worked. The net change in the liability excluding the actual claims costs is a decrease of $0.5 million in the 2014 fiscal year ($0.5 million decrease in 2013) and is expensed in General Government.
Borrowing on Behalf of New Brunswick Power Corporation
The Province, as represented by the Consolidated Fund, has issued long term debt securities on behalf of the New Brunswick Power Corporation in exchange for debentures with like terms and conditions. This financing arrangement was used to obtain more favourable debt servicing costs.
The New Brunswick Power Corporation debentures received by the Province are reported in the Statement of Financial Position of these consolidated financial statements as a reduction of Funded Debt. The transactions involving these securities, including the debt servicing costs, are not part of the budget plan of the Province’s Consolidated Fund.
Non-Financial Assets
Tangible Capital Assets
Tangible capital assets are assets owned by the Province which have useful lives greater than one year. Certain dollar thresholds have been established for practical purposes.
Tangible capital asset policies of government entities which are consolidated in these consolidated financial statements are not adjusted to conform to Provincial policies. The types of items which could differ include amortization rates, estimates of useful lives and dollar thresholds for capitalization.
Capital Leases
Long term leases, under which the Province, as lessee, assumes substantially all the benefits and risks of ownership of leased property, are classified as capital leases although certain minimum dollar thresholds are in place for practical reasons. The present value of a capital lease is accounted for as a tangible capital asset and an obligation at the inception of the lease.
| 2014 | PROVINCE OF NEW BRUNSWICK | 30 |
| | | |
NOTES TO THE CONSOLIDATED FINANCIAL STATEMENTS
31 March 2014
Inventories of Supplies
Inventories of supplies for use are recorded at the lower of cost or net realizable value. Inventories of supplies are reported as a non-financial asset.
Revenues
Tax Revenue
Official estimates received from the federal government are used as the basis for determining federal tax revenue. Federal tax revenue amounts for the current year reflect prior year adjustments based on returns or more recent economic data.
Provincial real property tax is recognized based on the calculation of applying the relevant provincial and local service district tax rates to the assessed property value. Adjustments are made to current year revenue for future assessments and allowance for doubtful accounts.
Other provincial tax revenue is recognized based on the self-assessed returns of tax payers and tax collectors. This revenue is subsequently adjusted for future tax assessments and allowance for doubtful accounts. Other provincial tax revenue is also recognized from direct payments made by tax payers in completing certain types of transactions.
Grant Revenue
Government transfers are recognized as revenue in the period during which the transfer is authorized and all eligibility criteria have been met, except when and to the extent that the transfer gives rise to an obligation that meets the definition of a liability. Transfers meeting the definition of a liability are recorded as deferred revenue and are recognized as revenue when transfer stipulations are met. Transfer amounts related to capital projects that have not been finalized at year end have been recorded as deferred capital contributions in Schedule 9. Details regarding major transfers recognized during the period are included in Schedule 19.
Expenses
Grant Expense
Grants, entitlements and other government transfers are recognized as expense in the period during which the event giving rise to the transfer has occurred, provided that the transfer has been authorized and all eligibility criteria have been met by the recipient.
Debt Charges
Interest and other debt service charges are reported in the Consolidated Statement of Operations as Service of the Public Debt except as described below:
Because government business enterprises are included in the Provincial Reporting Entity through modified equity accounting, the cost of servicing their debt is not included in the Service of the Public Debt expense. The cost of servicing the debt of government business enterprises is an expense included in the calculation of their net profit or loss for the year.
Interest costs imputed on the Province’s Net Pension Liability are recorded as part of pension expense, which is included in various expense functions.
Interest on debt to finance the Student Loan Portfolio is recorded as part of the Education and Training expensefunction.
| 2014 | PROVINCE OF NEW BRUNSWICK | 31 |
| | | |
NOTES TO THE CONSOLIDATED FINANCIAL STATEMENTS
31 March 2014
Interest earned on the assets of the General Sinking Fund and on other provincial assets is reported as revenue.
Note 11 to these consolidated financial statements reports the components of the Service of the Public Debt Expense function and total debt charges.
Operating Leases
All leases under which the Province does not assume substantially all the benefits and risks of ownership related to the leased property are classified as operating leases. Each rental payment required by an operating lease is recorded as an expense when it is due.
ConcessionaryLoans
There are two situations where the Province charges loan disbursements entirely as expenses. These are:
- Loan agreements which commit the Province to provide future grants to the debtor to be used to repay the loan.
- Loan agreements which include forgiveness provisions if the forgiveness is considered likely.
In both these situations, the loan is charged to expense when it is disbursed.
Loans that are significantly concessionary because they earn a low rate of return are originally recorded as assets at the net present value of the expected future cash flows. The net present value is calculated using the Province’s borrowing rate at the time the loan was issued. The difference between the nominal value of the loan and its net present value is recorded as an expense.
f) Foreign CurrencyTranslation and Risk Management
The Province's assets, liabilities and contingent liabilities denominated in foreign currencies are translated to Canadian dollars at the year-end rates of exchange, except where such items have been hedged or are subject to interest rate and currency swap agreements. In such cases, the rates established by the hedge or the agreements are used in the translation. Exchange gains and losses are included in the Consolidated Statement of Operations except for the unrealized exchange gains and losses arising on the translation of long term items, which are deferred and amortized on a straight line basis over the remaining life of the related assets or liabilities. Revenue and expense items are translated at the rates of exchange in effect at the respective transaction dates.
The Province borrows funds in both domestic and foreign capital markets and manages its existing debt portfolio to achieve the lowest debt costs within specified risk parameters. As a result, the Province may be exposed to foreign exchange risk. Foreign exchange or currency risk is the risk that the principal and interest payments on foreign debt will fluctuate in Canadian dollar terms due to fluctuations in foreign exchange rates.
In accordance with risk management policy guidelines, the Province uses various financial instruments and techniques to manage exposure to foreign currency risk. These financial instruments include currency forwards, cross-currency swaps and purchases of foreign denominated assets into the Province’s sinking fund.
As at March 31, 2014, the Province had outstanding $1,400 million US$ and 300 million Swiss Francs denominated debt. Of this total, $1,400 million US$ and 300 million Swiss Francs were hedged by entering into cross-currency swaps, which convert the interest and principal payable from the original currency to Canadian dollars. Since the entire foreign denominated debt portfolio has been hedged, the province has no foreign currency exposure.
There is no net currency exposure when the US dollar denominated assets held in the sinking fund are netted from the total Provincial-purpose debt portfolio.
| 2014 | PROVINCE OF NEW BRUNSWICK | 32 |
| | | |
NOTES TO THE CONSOLIDATED FINANCIAL STATEMENTS
31 March 2014
g) Measurement Uncertainty
Measurement uncertainty exists when there is uncertainty in the determination of the amount at which an item is recorded in the financial statements. Such uncertainty exists when there is a variance between the recognized or disclosed amount and another reasonably possible amount. Many items are measured using management’s best estimate, based on assumptions that reflect the most probable set of economic conditions and planned courses of action at the time of financial statement preparation. Estimates are updated to reflect new information as it becomes available. Actual results could differ from these estimates.
Significant estimates used in these financial statements include:
- Uncertainty relating to the determination of federal and provincial source tax revenues arising due to possible revisions of tax revenue amounts as a result of reassessments of prior tax periods and the timing of instalment payments.
- Uncertainty in the estimation of the amount of Canada Health Transfers and Canada Social Transfers arising from variances between the estimated and actual national and provincial tax points, and the provincial share of national population figures.
- Uncertainty related to the determination of the obligation for pensions and other employee future benefits arising because actual results may differ from the Province’s assumptions used to estimate the amount of benefits that employees will receive and the investment return on plan assets.
- Uncertainty relating to the allocation of payments for public private partnership road contracts arising because amortization of the capital improvement work commences in the year the rehabilitation work is expected to be performed, which may not reflect when the work is actually completed by the contractors.
This may impact the timing of amortization expense and the classification of payments as a prepaid expense, accrued expenditures, or tangible capital asset. - Uncertainty relating to the determination of the amount of accruals for environmental obligations, future payments related to contingent liabilities, valuation allowances for loans, investments and accounts receivable, and the estimated useful lives of tangible capital assets arising because these amounts are based on probable outcomes and the use of estimates.
NOTE 2
BUDGET
The budget figures included in these consolidated financial statements are the amounts published in the Main Estimates, adjusted for transfers from the Supplementary Funding Provision Program and elimination of inter-account transactions.
The Supplementary Funding Provision Program is an appropriation which provides funding to other programs for costs associated with contract settlements and other requirements not budgeted in a specific program.
Budget figures for the year ending 31 March 2014 reflect the acquisition of tangible capital assets and amortization expense. These amounts are disclosed in the Main Estimates as a separate schedule.
As a result of the adoption of PS 3410 in 2013, the classification of deferred capital contributions on the Province’s consolidated statement of financial position was changed. The 2014 budgeted net debt amount did not reflect this change and therefore has been reduced by the budgeted amount of deferred capital contributions for 2014 of $49.9 million.
NOTE 3 FISCAL RESPONSIBILITY AND BALANCED BUDGET ACT
The Province is required under the Fiscal Responsibility and Balanced Budget Act to report annually on the difference between the revenue and expenses, subject to the provisions of sections 4 and 5 of the Act, for the fiscal year to which the Public Accounts relate and the cumulative difference between revenues and expenses for the current fiscal period. 1 April 2011 marked the beginning of a new four year fiscal period.
| 2014 | PROVINCE OF NEW BRUNSWICK | 33 |
| | | |
NOTES TO THE CONSOLIDATED FINANCIAL STATEMENTS
31 March 2014
Section 4 of the Act stipulates that for Balanced Budget purposes, the changes to accounting policies apply prospectively as of the first day of the fiscal year in which the change is implemented and do not affect any previous year.
Section 5(1) of the Act stipulates that any change made within the last fifteen months of the fiscal period or after completion of that period in relation to the official estimates by the Government of Canada for provincial entitlements under the Federal-Provincial Fiscal Arrangements Act (Canada), the Canada-New Brunswick Tax Collection Agreement or the Comprehensive Integrated Tax Coordination Agreement shall not be taken into account.
Section 5(2) of the Act stipulates that any change made in relation to the first official estimates by the Government of Canada respecting provincial entitlements under the Federal-Provincial Fiscal Arrangements Act (Canada), the Canada-New Brunswick Tax Collection Agreement or the Comprehensive Integrated Tax Coordination Agreement for the last fiscal year of a fiscal period shall not be taken into account.
The deficit according to the Fiscal Responsibility and Balanced Budget Act for the fiscal period ending 31 March 2014 is as follows:
| | | | | | | | | | |
| | (millions) |
| |
| | | 2014 | | | | 2013 | | | 2012 | |
| | | Actual | | | | Actual | | | Actual | |
| |
| Revenue | | $ 7,763.5 | | | | $ 7,781.7 | | | $ 7,789.0 | |
| Adjustments per section 5(1) of the Act | | (61.1) | | | | - | | | - | |
| Revenue as per Fiscal Responsibility and | | | | | | | | | | |
| Balanced Budget Act | | 7,702.4 | | | | 7,781.7 | | | 7,789.0 | |
| Expense | | 8,262.2 | | | | 8,289.4 | | | 8,049.6 | |
| |
| Deficit for the year | | (559.8) | | | | (507.7) | | | (260.6) | |
| Cumulative Deficit at beginning of year | | (768.3) | | | | (260.6) | | | - | |
| |
| Cumulative Deficit at end of year | | $ (1,328.1) | | | | $ (768.3) | | | $ (260.6) | |
The Government had previously indicated that balanced budget provisions of the Act would not be met for the current four-year period.
The Province is required under the Act to report annually on the ratio of Net Debt to Gross Domestic Product (GDP) for the fiscal year to which the Public Accounts relate and the difference between that ratio and the ratio of Net Debt to GDP at the end of the previous fiscal period.
The following table presents the difference between the ratio for the fiscal period ending 31 March 2013 and for the year ended 31 March 2014.
| 2014 | PROVINCE OF NEW BRUNSWICK | 34 |
| | | |
NOTES TO THE CONSOLIDATED FINANCIAL STATEMENTS
31 March 2014
| | | | | | |
| | (millions) |
| | 2014 | | | 2013 | | Difference |
| Net Debt | $ 11,641.2 | | | $ 11,084.6 | | |
| GDP (31 December) | $ 31,701.0 | | | $ 31,543.0 | | |
| Ratio of Net Debt to GDP | 36.7% | | | 35.1% | | 1.6% Increase |
In June 2014, new fiscal accountability legislation was proclaimed with the Fiscal Responsibility and Balanced Budget Act repealed.
NOTE 4
SPECIAL PURPOSE ACCOUNTS
Special Purpose Account revenue earned but not spent accumulates as a surplus in that account and may be spent in future years for the purposes specified. At 31 March 2014, the accumulated surplus in all Special Purpose Accounts totaled $114.5 million ($121.0 million in 2013). This total is a component of net debt and accumulated deficit.
Descriptions of Major Special Purpose Accounts
CMHC
CMHC funding is used to provide funding for the operation of the programs that fall under the administration of the Social Housing Agreement. Fund revenues include interest earned on the fund, interest earned from second mortgages, and the cumulative excess of funding for social housing not spent to date. Expenditures from the fund are for approved CMHC program funding, any annual excess of which may be carried over for future program expenditures until the agreement expiration date in 2034. The accumulated surplus in CMHC funding at March 31, 2014 was $41.1 million ($46.1 million in 2013).
School District Self-Sustaining Accounts
Self-Sustaining Accounts record school district revenue and expenses for non-educational services such as the rental of school facilities, cafeteria operations and foreign student tuition fees. These special purpose accounts also record partnership activities with third parties to provide resources, services or grants to students. The accumulated surplus in school district self-sustaining accounts at March 31, 2014 was $20.8 million ($20.6 million in 2013).
The following table summarizes the change in the accumulated Special Purpose Account surplus:
| 2014 | PROVINCE OF NEW BRUNSWICK | 35 |
| | | |
NOTES TO THE CONSOLIDATED FINANCIAL STATEMENTS
31 March 2014
| | | | | | | | | | |
| |
| | 2013 | | | | | | 2014 | | | |
| | Accumulated | | | | | | | | | Accumulated |
| | Surplus | | | Revenue | | | Expense | | | Surplus |
| |
| Active Community School Sport Project | $ 0.1 | | | $ 0.3 | | | $ 0.3 | | | $ 0.1 |
| Archives Trust Account | 0.1 | | | - | | | - | | | 0.1 |
| Arts Development Trust Fund | - | | | 0.7 | | | 0.7 | | | - |
| Child Centered Family Justice Fund | - | | | 0.4 | | | 0.4 | | | - |
| CMHC | 46.1 | | | 11.2 | | | 16.2 | | | 41.1 |
| Environmental Trust Fund | 17.2 | | | 9.0 | | | 8.5 | | | 17.7 |
| Fish Stocking Fund | 1.0 | | | 0.4 | | | 0.4 | | | 1.0 |
| Fred Magee Account | 0.4 | | | - | | | - | | | 0.4 |
| Grand Lake Meadows | 0.1 | | | - | | | - | | | 0.1 |
| Historic Places | 0.1 | | | - | | | - | | | 0.1 |
| Health Services Liability Protection Plan | 0.1 | | | 4.0 | | | 4.0 | | | 0.1 |
| International Projects | - | | | 0.3 | | | 0.3 | | | - |
| Johann Wordel Account | 0.1 | | | - | | | - | | | 0.1 |
| Land Management Account | 9.6 | | | 1.0 | | | 1.9 | | | 8.7 |
| Library Account | 0.7 | | | 0.5 | | | 0.6 | | | 0.6 |
| Medical Research Assistance Account | 2.3 | | | - | | | 0.5 | | | 1.8 |
| Municipal Police Assistance | 3.4 | | | 1.3 | | | 1.4 | | | 3.3 |
| National Safety Code Agreement | - | | | 0.2 | | | 0.2 | | | - |
| NB 911 Service Fund | 10.8 | | | 5.2 | | | 5.7 | | | 10.3 |
| NB Community College Scholarship Account | 1.1 | | | - | | | - | | | 1.1 |
| Province Parks | 0.2 | | | 0.1 | | | - | | | 0.3 |
| Provincial Proceeds of Crime | 0.2 | | | 0.3 | | | 0.1 | | | 0.4 |
| Public/Private Partnership Projects | 0.2 | | | - | | | - | | | 0.2 |
| Renovation of Old Government House | 0.2 | | | - | | | - | | | 0.2 |
| School District Scholarship Trusts | - | | | 0.3 | | | 0.3 | | | - |
| School District Self Sustaining Accounts | 20.6 | | | 24.2 | | | 24.0 | | | 20.8 |
| Sport Development Trust Fund | - | | | 0.5 | | | 0.5 | | | - |
| Strait Crossing Finance Inc. | - | | | 0.1 | | | 0.1 | | | - |
| Suspended Drive – Alcohol Re-Education | 0.2 | | | 0.3 | | | 0.3 | | | 0.2 |
| Trail Management Trust Fund | 1.5 | | | 1.4 | | | 1.5 | | | 1.4 |
| Training Recoverable Projects | 2.5 | | | 1.8 | | | 1.7 | | | 2.6 |
| Victim Services Account | 1.0 | | | 2.2 | | | 2.6 | | | 0.6 |
| Wildlife Trust Fund | 1.2 | | | 1.3 | | | 1.3 | | | 1.2 |
| |
| | $ 121.0 | | | $ 67.0 | | | $ 73.5 | | | $ 114.5 |
| 2014 | PROVINCE OF NEW BRUNSWICK | 36 |
| | | |
NOTES TO THE CONSOLIDATED FINANCIAL STATEMENTS
31 March 2014
NOTE 5 SHORT TERM BORROWING
Short term borrowing is recorded at cost, which approximates market value. Short term borrowing consists of treasury bills with interest rates ranging from 0.95% - 1.10%, maturing between 10 April and 5 December 2014.
NOTE 6 OBLIGATIONS UNDER CAPITAL LEASES
The total future principal and interest payments for capital leases amount to $1,209.5 million ($1,394.8 million 2013). That amount includes $716.2 million ($794.7 million 2013) in principal and $493.3 million ($600.1 million 2013) in interest.
Minimum annual principal and interest payments in each of the next five years are as follows:
| | |
| Fiscal Year | | (millions) |
| |
| 2014-2015 | | $ 86.3 |
| 2015-2016 | | 85.7 |
| 2016-2017 | | 85.1 |
| 2017-2018 | | 84.0 |
| 2018-2019 | | 84.0 |
NOTE 7 GOVERNMENT BUSINESS ENTERPRISES
A Government Business Enterprise is an organization accountable to the Legislative Assembly that has the power to contract in its own name, has the financial and operating authority to carry on a business, sells goods and services to customers outside the Provincial Reporting Entity as its principal activity, and that can, in the normal course of its operations, maintain its operations and meet its liabilities from revenues received from sources outside the Provincial Reporting Entity.
The following is a list of Government Business Enterprises, and their fiscal year ends, which are included in the Provincial Reporting Entity as listed in Schedule 30 to these consolidated financial statements.
| |
| New Brunswick Liquor Corporation (Liquor) | 30-03-14 |
| New Brunswick Municipal Finance Corporation (Municipal Finance) | 31-12-13 |
| New Brunswick Power Corporation (Power) | 31-03-14 |
Effective July 1, 2013, the New Brunswick Securities Commission was continued under the name Financial and Consumer Services Commission. The new organization is included in the Province’s government reporting entity as another government organization, and is being accounted for using the consolidation method.
On October 1, 2013, the NB Power Group of Companies, New Brunswick Electric Finance Corporation (NBEFC) and the New Brunswick System Operator (NBSO) were amalgamated into the New Brunswick Power Corporation. As a result of the amalgamation, the Province’s investment in the New Brunswick Power Corporation, previously recognized indirectly through its investment in NBEFC, is now recognized directly as an investment in the New Brunswick Power Corporation. The amalgamation was accounted for in the current year. Comparative financial statement amounts have not been restated.
The following table presents condensed financial information of these Government Business Enterprises.
| 2014 | PROVINCE OF NEW BRUNSWICK | 37 |
| | | |
NOTES TO THE CONSOLIDATED FINANCIAL STATEMENTS
31 March 2014
| | | | | | | | | | |
| | | (millions) |
| | | | | | Municipal | | | | | |
| Assets | | Liquor | | | Finance | | | Power | | Total |
| |
| Cash and Equivalents | | $ 2.5 | | | $ 1.1 | | | $ 3.0 | | $ 6.6 |
| Receivables | | 4.2 | | | 3.1 | | | 306.0 | | 313.3 |
| Prepaids | | 0.5 | | | -- | | | 8.0 | | 8.5 |
| Inventories | | 24.2 | | | -- | | | 211.0 | | 235.2 |
| Current portion of Derivative Assets | | -- | | | -- | | | 132.0 | | 132.0 |
| Current portion of Regulatory Assets | | -- | | | -- | | | 21.0 | | 21.0 |
| Fixed Assets | | 7.8 | | | -- | | | 4,072.0 | | 4,079.8 |
| Long Term Assets | | -- | | | -- | | | 1,669.0 | | 1,669.0 |
| Long Term Notes Receivable | | -- | | | 863.6 | | | 16.0 | | 879.6 |
| Sinking Fund Receivable | | -- | | | -- | | | 404.0 | | 404.0 |
| Intangible Assets | | 1.5 | | | -- | | | 21.0 | | 22.5 |
| Total Assets | | $ 40.7 | | | $ 867.8 | | | $ 6,863.0 | | $ 7,771.5 |
| |
| Liabilities | | | | | | | | | | |
| Payables | | $ -- | | | $ 3.1 | | | $ 282.0 | | $ 285.1 |
| Current Liabilities | | 16.8 | | | -- | | | 871.0 | | 887.8 |
| Deferred Liabilities | | -- | | | -- | | | 744.0 | | 744.0 |
| Other Long Term Liabilities | | 2.9 | | | -- | | | -- | | 2.9 |
| Long Term Debt | | -- | | | 863.6 | | | 4,567.0 | | 5,430.6 |
| Total Liabilities | | 19.7 | | | 866.7 | | | 6,464.0 | | 7,350.4 |
| |
| Equity | | | | | | | | | | |
| Retained Earnings | | 21.0 | | | 1.1 | | | 252.0 | | 274.1 |
| Accumulated Other | | | | | | | | | | |
| Comprehensive Income | | -- | | | -- | | | 147.0 | | 147.0 |
| Total Equity | | 21.0 | | | 1.1 | | | 399.0 | | 421.1 |
| Total Liabilities and Equity | | $ 40.7 | | | $ 867.8 | | | $ 6,863.0 | | $ 7,771.5 |
| |
| Net Income | | | | | | | | | | |
| Revenue | | $ 387.0 | | | $ 34.5 | | | $ 1,797.0 | | $ 2,218.5 |
| Expenses | | (225.8) | | | (0.3) | | | (1,537.0) | | (1,763.1) |
| Interest and Related Expense | | -- | | | (34.3) | | | (205.0) | | (239.3) |
| Net Income | | $ 161.2 | | | $ (0.1) | | | $ 55.0 | | $ 216.1 |
| |
| Accumulated Other | | | | | | | | | | |
| Comprehensive Income | | | | | | | | | | |
| Accumulated Other Comprehensive | | | | | | | | | | |
| Income, Beginning of Year | | $ -- | | | $ -- | | | $ 80.0 | | $ 80.0 |
| Other Comprehensive | | | | | | | | | | |
| Income, For the Year | | -- | | | -- | | | 67.0 | | 67.0 |
| Accumulated Other Comprehensive | | | | | | | | | | |
| Income, End of Year | | $ -- | | | $ -- | | | $ 147.0 | | $ 147.0 |
The financial information of Government Business Enterprises is prepared according to the accounting standards applicable to each reporting entity, using accounting policies that are appropriate for the industry
| 2014 | PROVINCE OF NEW BRUNSWICK | 38 |
| | | |
NOTES TO THE CONSOLIDATED FINANCIAL STATEMENTS
31 March 2014
segment in which they operate. These accounting policies may not be consistent with accounting policies used by other member organizations of the Provincial Reporting Entity.
New Brunswick Liquor Corporation
The New Brunswick Liquor Corporation was established under the New Brunswick Liquor Corporation Act. Its business activity is the purchase, distribution and sale of alcoholic beverages throughout the Province of New Brunswick. The Corporation’s financial statements are prepared in accordance with International Financial Reporting Standards.
Subsequent to the New Brunswick Liquor Corporation’s March 30, 2014 year end, a payment was made to the Province in the amount of $2.8 million on March 31, 2014. As such, this revenue has been reflected in the results of the Province.
New Brunswick Municipal Finance Corporation
The Municipal Finance Corporation was established under the New Brunswick Municipal Finance Corporation Act. Its purpose is to provide financing for municipalities and municipal enterprises through a central borrowing authority. The Province is guarantor of all debt issued by the Corporation. The Corporation’s financial statements are prepared in accordance with International Financial Reporting Standards.
In March of 2014, NBMFC issued an additional $10.0 million in long-term debt. This additional issuance had no impact on the results of the Province.
New Brunswick Power Corporation
The New Brunswick Power Corporation was established as a Crown Corporation of the Province of New Brunswick in 1920 by enactment of the New Brunswick Electric Power Act. In 2004, NB Power continued as New Brunswick Power Holding Corporation with new subsidiary operating companies (collectively the NB Power Group of Companies). On October 1, 2013, by enactment of the New Brunswick Electricity Act, NB Power became a single, integrated Crown Corporation. The Corporation’s financial statements were prepared in accordance with Canadian generally accepted accounting principles applied on a consistent basis with the preceding year.
Prior to the above noted amalgamation on October 1, 2013, the financial results of the NB Power Group of Companies were recorded in the New Brunswick Electric Finance Corporation (NBEFC) using the modified equity method, with any unrealized intercompany gains or losses being eliminated upon consolidation. NBEFC’s financial results were then consolidated with those of the Province, also using the modified equity method.
Over the period 2009 – 2013, NBEFC’s net income was reduced by $153.1 million of unrealized intercompany gains related to expenses deferred under the rate regulatory accounting practice used by the NB Power Group. As of November 23, 2012, the NB Power Group is no longer deferring new expenses related to Point Lepreau, with the exception of interest, as the refurbishment is complete. Due to the subsequent amalgamation of the NB Power Group and NBEFC, the Province will now recognize the total amount of $153.1 million in net income over the 27 year estimated useful life of Point Lepreau. The adjustment was previously recognized in NBEFC. For the fiscal year ended March 31, 2014, $5.7 million was amortized into the Province’s income. On the consolidated statement of financial position, the Province’s investment in the New Brunswick Power Corporation has been reduced by the remaining amount of the regulatory deferral ($145.6 million).
The amount of $4,567.0 million shown as long-term debt of the New Brunswick Power Corporation has been borrowed by the Province and is shown on the consolidated statement of financial position as a reduction of funded debt.
The New Brunswick Power Corporation’s long-term debt principal repayment schedule is as follows:
| 2014 | PROVINCE OF NEW BRUNSWICK | 39 |
| | | |
NOTES TO THE CONSOLIDATED FINANCIAL STATEMENTS
31 March 2014
| | |
| | | (millions) |
| | | Principal |
| Year Ending | | Repayment |
| |
| March 31, 2016 | | $ 580.0 |
| March 31, 2017 | | 400.0 |
| March 31, 2018 | | 420.0 |
| March 31, 2019 | | 230.0 |
| March 31, 2020 and thereafter | | 2,937.0 |
| |
| Total Long-term portion | | $ 4,567.0 |
NOTE 8
TANGIBLE CAPITAL ASSETS
Tangible capital assets include acquired, built, developed and improved tangible assets, whose useful life extends beyond the fiscal year and which are intended to be used on an ongoing basis for producing goods or delivering services.
Certain assets which have historical or cultural value, including works of art, historical documents and historical and cultural artifacts are not recognized as tangible capital assets. Land used as a site for a historical collection has been valued at $1. Intangibles and items inherited by right of the Crown, such as Crown lands, forests and mineral resources, are not recognized in the consolidated financial statements because the costs, benefits and economic value of such items cannot be reasonably and verifiably quantified. Assets under construction are not amortized until the asset is available to be put into service.
Calculation of opening balances include, where available, acquisition totals reported in Public Accounts from 1973 to 2004. Surfacing costs have been segregated starting in 2005. Prior to 2005, these costs were included in roads and highways and bridges.
Tangible capital assets are amortized on a straight-line basis over their estimated useful lives as noted in the table that follows. One-half of the annual amortization is charged in the year of acquisition and in the year of disposal.
Included in the closing costs of the various classes as of 31 March 2014 are costs for assets under construction, which are not amortized. These costs are for buildings and land improvements ($123.2 million); bridges, roads and highways ($198.1 million); ferries ($1.2 million), water management systems ($6.5 million), computer hardware ($1.7 million) and computer software ($40.1 million).
| 2014 | PROVINCE OF NEW BRUNSWICK | 40 |
| | | |
NOTES TO THE CONSOLIDATED FINANCIAL STATEMENTS
31 MARCH 2014

1 Adjustments relate primarily to a change in the consolidation method for the Financial and Consumer Services Commission (formerly the New Brunswick Securities Commission).
| 2014 | PROVINCE OF NEW BRUNSWICK | 41 |
| | | |
NOTES TO THE CONSOLIDATED FINANCIAL STATEMENTS
31 March 2014
NOTE 9 BORROWING AUTHORITY
a) Balance of Borrowing Authorityunder the Provincial Loans Act
The balance of borrowing authority granted under the Provincial Loans Act is as follows:
| | | (millions) |
| | | Balance 2013 | | Authority Granted During the Year | | Borrowing During the Year | | Balance 2014 |
| | | | | | | | | |
| Loan Act 2012 | | $ 571.8 | | $ -- | | $ 529.2 | | $ 42.6 |
| Loan Act 2013 | | -- | | 1,100.0 | | 527.7 | | 572.3 |
| | | $ 571.8 | | $ 1,100.0 | | $ 1,056.9 | | $ 614.9 |
Under the authority of section 2 of the Provincial Loans Act, the maximum temporary indebtedness of the Province is $2,200.0 million. At 31 March 2014, the short term borrowing of the Province was $1,371.8 million.
Under the authority of subsection 3(1) of the Provincial Loans Act, the Province may borrow sums required for the repayment, refinancing or renewal of securities issued or for the payment of any loan or liability, repayment of which is guaranteed by the Province. This authority is in addition to the authorities listed above.
b) Borrowing by the Municipal Finance Corporation
The New Brunswick Municipal Finance Corporation has authority under the New Brunswick Municipal Finance Corporation Act to provide financing for municipalities and municipal enterprises. The Province guarantees the debt of the corporation. As at 31 December 2013, long term debt owed by the corporation was $863.6 million. An additional $10.0 million of long term debt was issued by the corporation in March of 2014.
| 2014 | PROVINCE OF NEW BRUNSWICK | 42 |
| | | |
NOTES TO THE CONSOLIDATED FINANCIAL STATEMENTS
31 March 2014
| | | | | | | | | |
| NOTE 10 FUNDED DEBT | | | | | | | | |
The following is a maturity schedule for the total amount of the Province’s Funded Debt. | | | |
| | | | | | | | | | Funded Debt |
| Fiscal Year | Interest | | | Total | | | | | for |
| of | Rate (%) | Currency | Funded | | NB Power | | | Provincial |
| Maturity | Range | Amount | | Debt | | | | | Purposes |
| |
| 2014-2015 | 4.5 | CDN $550.0 | | $ 550.0 | | - | | | $ 550.0 |
| | Floating | CDN $300.0 | | 300.0 | | - | | | 300.0 |
| | | | | 850.0 | | - | | | 850.0 |
| | | | | | | - | | | |
| 2015-2016 | 2.9 | CHF 300.0 | | 321.4 | | | | | 321.4 |
| | 0.0-8.8 | CDN $727.0 | | 727.0 | | (400.0) | | | 327.0 |
| | Floating | CDN $180.0 | | 180.0 | | (180.0) | | | -- |
| | | | | 1,228.4 | | (580.0) | | | 648.4 |
| |
| 2016-2017 | 5.2 | USD $500.0 | | 584.8 | | - | | | 584.8 |
| | 0.0-4.7 | CDN $643.7 | | 643.7 | | (400.0) | | | 243.7 |
| | | | | 1,228.5 | | (400.0) | | | 828.5 |
| |
| 2017-2018 | 0.0-6.8 | CDN $1,549.8 | | 1,549.8 | | (420.0) | | | 1,129.8 |
| |
| 2018-2019 | 2.8 | USD $750.0 | | 734.0 | | (130.0) | | | 604.0 |
| | 0.0-2.2 | CDN $156.9 | | 156.9 | | (100.0) | | | 56.9 |
| | | | | 890.9 | | (230.0) | | | 660.9 |
| 2019-2020 | 8.8-9.8 | USD $400.0 | | 423.0 | | (276.3) | | | 146.7 |
| & After | 0.0-6.3 | CDN $12,489.3 | | 12,489.3 | | (2660.0) | | | 9,829.3 |
| | | | | 12,912.3 | | (2,936.3) | | | 9,976.0 |
| |
| Total Funded Debt | | | 18,659.9 | | (4,566.3) | | | 14,093.6 |
| Less: Debt Issued to the New Brunswick | | | | | | | |
| Immigrant Investor Fund (2009) Ltd. | | 157.4 | | - | | | 157.4 |
| Funded Debt Before Sinking Fund | | 18,502.5 | | (4,566.3) | | | 13,936.2 |
| Less: Sinking Fund Equity | | | 4,287.9 | | (404.0) | | | 3,883.9 |
| Funded Debt Outstanding | | | $ 14,214.6 | | $ (4,162.3) | | | $ 10,052.3 |
| 2014 | PROVINCE OF NEW BRUNSWICK | 43 |
| | | |
NOTES TO THE CONSOLIDATED FINANCIAL STATEMENTS
31 March 2014
Pursuant to section 12 of the Provincial Loans Act, the Minister of Finance maintains a General Sinking Fund for the repayment of funded debt either at maturity or upon redemption in advance of maturity. At 31 March 2014, the equity of the General Sinking Fund accumulated for the repayment of Provincial Debt was $3,883.9 million (2013 -$3,955.8 million). Some of the assets of this Fund are bonds and debentures issued or guaranteed by the Province of New Brunswick. The provincial net book value of these investments at 31 March 2014 was $1,839.5 million ($2,040.8 million 2013).
Because government business enterprises are included in the reporting entity through modified equity accounting, long term debt issued directly by those enterprises is not included in the amount of Funded Debt Outstanding. Note 7 to these consolidated financial statements discloses the long term debt obligations of government business enterprises.
The following amounts, which are payable swap agreements, have been included in the preceding funded debt maturity schedule. They have been reflected in that schedule in the currency payable per each financial swap agreement.
| | | | | | | | |
| | (millions) |
| | 2014 |
| | Payable in | Per Financial | | Canadian |
| Fiscal Year | Original | Swap | | Dollar |
| of Maturity | Currency | Agreement | | Equivalent |
| |
| 2015-2016 | CHF | | 300.0 | CAN | | $ 321.4 | | $ 321.4 |
| 2016-2017 | USD $500.0 | CAN | | $ 584.8 | | 584.8 |
| 2018-2019 | USD $750.0 | CAN | | $ 734.0 | | 734.0 |
| 2020-2021 | USD | | $ 50.0 | CAN | | $ 48.9 | | 48.9 |
| 2022-2023 | USD $100.0 | CAN | | $ 97.8 | | 97.8 |
| |
| | | | | | | | | $ 1,786.9 |
The swap agreements are interest rate and currencyswap agreements.
The following estimated payments are required in each of the next five years to meet the sinking fund provisions of existing debt:
| | | | | | | |
| | | | | (millions) | | | |
| | | | | 2014 | | | |
| | | Total | | | | | Installments on |
| | | Installments | | NB | | | Provincial |
| Fiscal Year | | on Debt | | Power | | | Purpose Debt |
| |
| 2014-2015 | | $ 184.5 | | $ (45.6) | | | $ 138.9 |
| 2015-2016 | | 173.1 | | (43.8) | | | 129.3 |
| 2016-2017 | | 165.7 | | (39.8) | | | 125.9 |
| 2017-2018 | | 155.3 | | (32.8) | | | 122.5 |
| 2018-2019 | | 134.5 | | (30.3) | | | 104.2 |
| 2014 | PROVINCE OF NEW BRUNSWICK | 44 |
| | | |
NOTES TO THE CONSOLIDATED FINANCIAL STATEMENTS
31 March 2014
NOTE 11 DEBT CHARGES
The total cost of interest, exchange, amortization and related expenses is $533.8 million ($508.2 million 2013), which consists of:
| | | | | | |
| | | (millions) | | |
| | | 2014 | | | 2013 | |
| |
| Interest | | $ 813.3 | | | $ 853.8 | |
| Interest on Fredericton – Moncton Highway Capital Lease | | 45.1 | | | 46.9 | |
| Interest on Other Capital Leases | | 12.1 | | | 8.8 | |
| Foreign Exchange Expense | | (6.2) | | | (19.3) | |
| Amortization of Discounts and Premiums | | 8.0 | | | 4.2 | |
| Other Expenses | | 0.8 | | | 0.8 | |
| | | 873.1 | | | 895.2 | |
| Interest Recovery for Debt Incurred for the | | | | | | |
New Brunswick Power Corporation | | (211.2) | | | (234.9) | |
| Service of the Public Debt | | 661.9 | | | 660.3 | |
| Sinking Fund Earnings | | (204.5) | | | (220.7) | |
| | | 457.4 | | | 439.6 | |
| Pension Interest | | 70.4 | | | 62.7 | |
| Interest on Debt to Finance Student Loan Portfolio | | 6.0 | | | 5.9 | |
| | | $ 533.8 | | | $ 508.2 | |
| 2014 | PROVINCE OF NEW BRUNSWICK | 45 |
| | | |
NOTES TO THE CONSOLIDATED FINANCIAL STATEMENTS
31 March 2014
NOTE 12 RETIREMENT BENEFITS
| 1) | Pension Plans |
| a) | Description |
Employees of the Province and certain other entities, as well as members of the Legislative Assembly, are entitled to receive pension benefits. The Pension plans under which these benefits are received are as follows:
| |
| | Date of Latest |
| | Actuarial Valuation |
Plan Name | for Accounting |
| | Purposes |
| |
| Public Service Shared Risk Plan (PSSRP)* | 01 January 2014 |
| Teachers’ Pension Act (TPA) | 01 April 2013 |
| Provincial Court Act and Provincial Court Judges’ Pension Act | |
| (Judge) | 01 April 2013 |
| Members’ Superannuation Act and Members’ Pension Act | |
| (Member) | 01 April 2011 |
| Shared Risk Plan for CUPE Employees of New Brunswick | |
| Hospitals (H-CUPE) | --- |
| Pension Plan for Management Employees of New Brunswick | |
| School Districts (Sch-Mgt) | 31 December 2013 |
| Pension Plan for General Labour, Trades and Services Employees | |
| of New Brunswick School Districts (GLTS) | 31 December 2013 |
| Pension Plan for Full-Time CUPE 2745 Employees of New | |
| Brunswick School Districts (CUPE 2745) | 31 December 2013 |
| Ombudsman Act (Ombud) | --- |
| Shared Risk Plan for Certain Bargaining Employees of | |
| New Brunswick Hospitals (H – CBE) | --- |
| Pension Plan for Part-time and Seasonal Employees (Part-time) | --- |
| Supplementary Employee Retirement Programs (SERP) | 01 April 2013 to 01 |
| | January 2014 |
Pension trust funds distinct from the Consolidated Fund exist for each of these pension plans, except the
Members’ Superannuation Act, Members’ Pension Act, Ombudsman Act and Supplementary Employee Retirement Programs.
| * | Public Service Shared Risk Plan (PSSRP) replaced the Public Service Superannuation Act (PSSA) on January 1, 2014. |
| 2014 | PROVINCE OF NEW BRUNSWICK | 46 |
| | | |
NOTES TO THE CONSOLIDATED FINANCIAL STATEMENTS
31 March 2014
The following is a summary of the contribution levels and basic member benefits for each pension plan.
Complete plan descriptions are contained in the specific plan documentation.

| 2014 | PROVINCE OF NEW BRUNSWICK | 47 |
| | | |
NOTES TO THE CONSOLIDATED FINANCIAL STATEMENTS
31 March 2014
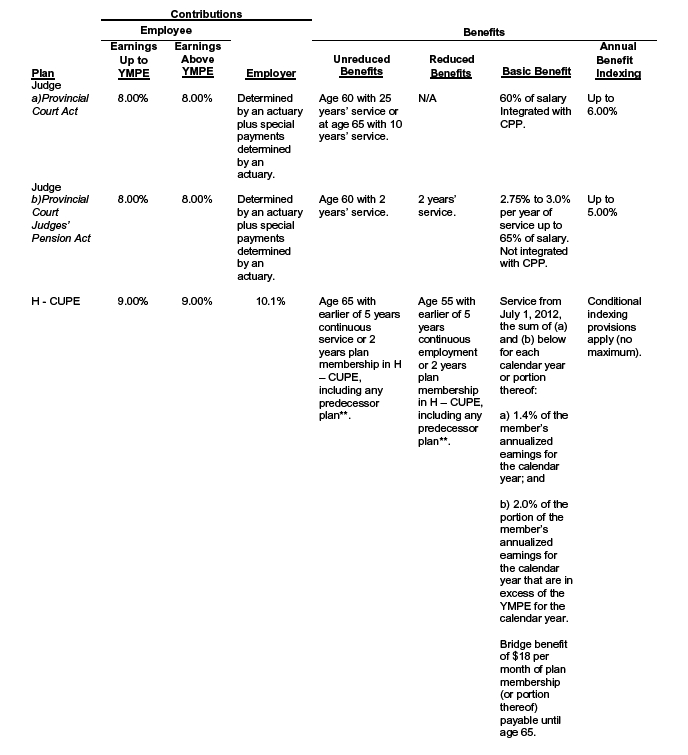
| 2014 | PROVINCE OF NEW BRUNSWICK | 48 |
| | | |
NOTES TO THE CONSOLIDATED FINANCIAL STATEMENTS
31 March 2014
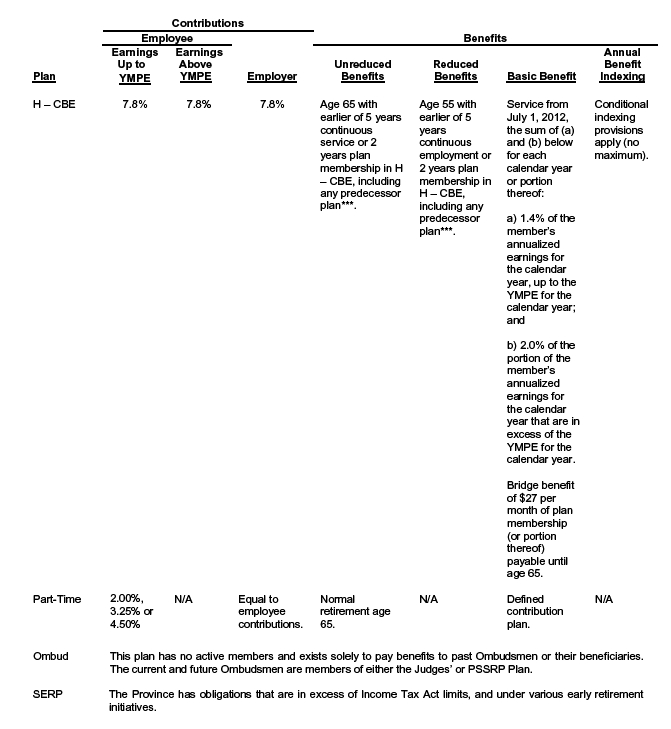
* Predecessor Plan includes the Public Service Superannuation Act (PSSA) pension plan and the Part-Time and Seasonal Pension plan.
** Predecessor Plan includes the Pension Plan for CUPE Employees of New Brunswick Hospitals, the Part-Time Pension Plan and the Pension Plan for Employees of New Brunswick Hospitals.
*** Predecessor Plan includes the Pension Plan for Certain Bargaining Employees of New Brunswick Hospitals, the Part-Time Pension Plan and the Pension Plan for Employees of New Brunswick Hospitals.
| 2014 | PROVINCE OF NEW BRUNSWICK | 49 |
| | | |
NOTES TO THE CONSOLIDATED FINANCIAL STATEMENTS
31 March 2014
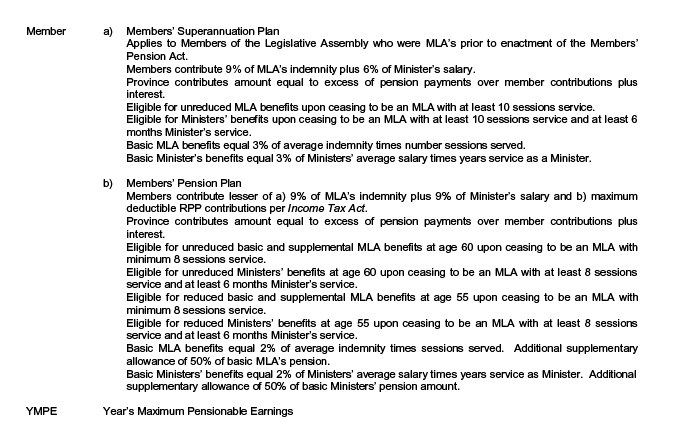
| 2014 | PROVINCE OF NEW BRUNSWICK | 50 |
| | | |
NOTES TO THE CONSOLIDATED FINANCIAL STATEMENTS
31 March 2014
b) Net Pension Liability
With the exception of the PSSRP, the H-CBE plan, the H-CUPE plan and the Part-Time plan, the Province is liable for any excess of accrued pension benefits over pension fund assets. The PSSRP, H–CBE and H–CUPE plans are shared risk plans and the Province’s obligation related to these plans are discussed in Section c) below. The Part-Time plan is a defined contribution plan. The Province’s obligation related to this plan is limited to its annual contributions.
The value of accrued benefits in all defined benefit plans exceeds the value of assets resulting in an actuarial pension liability of $814.1 million ($852.7 million 2013). The calculation of this liability includes estimates of future events and market values of assets which can be volatile. Actual results may differ from the estimates used, creating a need for future adjustments. These adjustments are amortized into expense over the estimated remaining service life of employees due to their tentative nature and that further adjustments are likely to occur in the future. Currently, unamortized adjustments total $814.7 million ($1,002.2 million in 2013). The net pension liability after considering unamortized adjustments is a balance of $0.6 million ($149.5 million in 2013). This net balance, which appears on the Consolidated Statement of Financial Position, reflects the accounting methodology of deferring and amortizing the adjustments. This balance does not represent the actuarial pension liability.
The Provincial share of the net pension liability estimate is based on actuarial valuations for accounting purposes using the projected unit credit method, calculated as at the dates listed above. This method estimates the present value of retirement benefits associated with the period of employee service to the valuation date. These actuarial valuations were based on a number of assumptions about future events, such as rates of return on assets, wage and salary increases and employee turnover and mortality. Section d) of this note lists some of the actuarial assumptions used. Section e) lists selected information about plan members.
c) Shared Risk Pension Plans
The Province currently sponsors three Shared Risk Pension Plans (“SRPP’s”). The former Public Service Superannuation Plan converted to the SRPP model during this fiscal year, and the former pension plans for Certain Bargaining Employees of New Brunswick Hospitals (H-CBE) and CUPE Hospital workers (H-CUPE) converted during the 2012-2013 fiscal year. Each of these SRPP’s share the fundamental concepts of shared risk pensions as defined in the Pension Benefits Act, including the legal separation of the Province from the assets and liabilities of the plan. Each plan follows prescribed steps of making temporary adjustments to contributions and pension benefits to ensure the long term sustainability of the plan. SRPP’s use a risk management approach to provide a targeted benefit to plan members with a high degree of certainty, but without an absolute guarantee.
The Province recognizes that the SRPP model is an evolving area for pensions in Canada and plans of this design are not contemplated in existing accounting standards. Under current standards, a pension plan is generally classified as either a defined contribution plan or a defined benefit plan. SRPP’s have characteristics of both of these traditional formats. Therefore, in determining the appropriate accounting treatment for these plans, an analysis of all facts and circumstances and the exercise of professional judgement was required. Enabling legislation and specific plan documents were key items reviewed in determining the appropriate accounting treatment. The following factors were considered to be relevant in determining if the plans should be accounted for on a defined contribution or a defined benefit basis.
- Level of variability in employer contributions.
- Frequency of variability in employer contributions.
- Likelihood of variability in employer contributions.
- Whether separate accounts are maintained for each employee.
- Whether employee benefits earned in the past may be reduced.
- Communications to plan members.
- Existence of guarantees.
- Presence of constructive or equitable obligations.
| 2014 | PROVINCE OF NEW BRUNSWICK | 51 |
| | | |
NOTES TO THE CONSOLIDATED FINANCIAL STATEMENTS
31 March 2014
While the three plans are considered to be SRPPs as defined by the Pension Benefit Act, each of them has differences in relation to the above factors. As such, each plan had to be assessed on an individual basis in order to determine the appropriate classification. The important elements that lead to the determination of the most appropriate accounting treatment for each of the plans are discussed below. Going forward, the Province will continue to monitor developments in the applicable accounting standards when assessing the most appropriate accounting treatment for plans operating under the SRPP model.
Public Service Shared Risk Plan (“PSSRP”)
The Province has accounted for the PSSRP as a defined benefit multiemployer plan. Key factors that lead to this treatment were the existence of a form of guarantee from the Province and the level of potential variability in employer contributions. These factors were considered to outweigh others that were more indicative of defined contributiontreatment.
While the PSSRP offers no guarantee on any past or future benefits earned, the Province has guaranteed that the dollar value of base pension benefits (i.e. excluding the effect of any indexation arising after conversion) will never go below the amounts that, at the date of conversion, are being paid to retirees or have been earned by active members. The PSSRP is not required to keep benefit payments at any particular level. If the PSSRP adjusts benefits paid to the point where they are reduced below the level that existed at the date of conversion, payments will be made to the impacted individuals from the Consolidated Fund in order to ensure their base benefits do not fall below the level of base benefits accrued at the date of conversion.
During the first fifteen years after conversion, the Province’s regular contribution to the Plan is subject to variability ranging from -3.5% of payroll to +1.5% of payroll. In addition to the regular contribution, the Province is paying temporary contributions during the first ten years after conversion that are also subject to additional variability of -1.25% of payroll during the first five years, and -0.75% of payroll during the remaining five years. After the first fifteen years following conversion, the Province’s regular contribution to the Plan is subject to variability ranging from -2% of payroll to +1.5% of payroll.
As required by standards for defined benefit pension plans, the Province records a net pension liability or asset and pension expense for the PSSRP in these financial statements. Due to the unique nature of the SRPP model, the methodology and assumptions used to estimate these amounts are required to incorporate additional features not generally found in conventional defined benefit plans. Specifically, the measurement of the accrued benefit obligation reflects the best estimate of the effect of risk-sharing and conditional indexation. The funding level of the Plan and the incidence of additional committed contributions are relevant factors in determining this estimate. The best estimate of the obligation has been determined to be equal to the plan assets plus the present value of excess contributions during the first fifteen years after conversion, subject to an upper and lower limit. The upper limit is the accrued benefit obligation measured with an assumption of 100% indexation, and the lower limit assumes 0% indexation. The impact of the guarantee is considered in the development of this estimate – if the initial estimate of the obligation were not to include 100% of the benefits at conversion that are covered by the guarantee, an adjustment would be necessary to reflect the incremental obligation of the Province for these benefits. The guarantee is considered to be an integral part of the overall terms relating to the Plan and as such is not separately recognized but rather included in the overall measurement of the obligation.
Prior to the conversion to the PSSRP, the New Brunswick Power Corporation had accounted for its interest in the Public Service Superannuation Plan using defined benefit accounting. As such, the obligation and assets attributed to the New Brunswick Power Corporation were excluded from the Province’s net pension liability. Upon conversion, the New Brunswick Power Corporation has determined that it will no longer be able to apply defined benefit accounting in its own financial statements, and will be following the guidance for a participating employer in a multiemployer plan. As such, the obligation and assets of the New Brunswick Power Corporation are now recorded directly by the Province. This is consistent with the treatment of other employers participating in the PSSRP.
| 2014 | PROVINCE OF NEW BRUNSWICK | 52 |
| | | |
NOTES TO THE CONSOLIDATED FINANCIAL STATEMENTS
31 March 2014
Shared Risk plan for CUPE Employees of New Brunswick Hospitals (“H-CUPE”)
The Province has accounted for the H-CUPE SRPP as a defined contribution plan. Key factors that lead to this treatment were the defined level of contribution with limited variability and the fact that the benefits, including indexing, other ancillary benefits and base benefits, are not guaranteed under the terms of these plans. These factors were considered to outweigh others that were more persuasive of defined benefit treatment. The Province’s contribution to the Plan is subject to variability ranging from -1.0% of payroll to +0.5% of payroll. There are no temporary contributions being made to this plan.
Consistent with the standards for accounting for defined contribution pension plans, no pension assets, liabilities, distributions, or investment gains or losses are included in these statements. Pension expense consists of employer contributions paid during the year.
Shared Risk plan for Certain Bargaining Employees of New Brunswick Hospitals (“H-CBE”)
The Province has accounted for the H-CBE SRPP as a defined contribution plan. Key factors that lead to this treatment were the defined level of contribution with limited variability and the fact that the benefits, including indexing, other ancillary benefits and base benefits, are not guaranteed under the terms of these plans. These factors were considered to outweigh others that were more persuasive of defined benefit treatment. The Province’s contribution to the Plan is subject to variability ranging from -1.0% of payroll to +0.5% of payroll. There are no temporary contributions being made to this plan.
Consistent with the standards for accounting for defined contribution pension plans, no pension assets, liabilities, distributions, or investment gains or losses are included in these statements. Pension expense consists of employer contributions paid during the year.
d) SummaryPension Information
Details of the net pension liability, unamortized adjustments, pension expense and change in net pension liability are outlined in the following table. The estimated accrued benefits and the value of plan assets reported have been updated to the most recent year end of the applicable pension plan. This was based on a projection of the actuarial assumptions and on actual contribution levels. The plans for hospital and school district employees and the PSSRP have 31 December year ends, however the PSSRP’s net pension liability and pension expense are measured as at 31 March. All other plans have 31 March year ends.
| 2014 | PROVINCE OF NEW BRUNSWICK | 53 |
| | | |
NOTES TO THE CONSOLIDATED FINANCIAL STATEMENTS 31 March 2014 |
| Summary Pension Information | | | | | | | | | | | | | | |
| | (millions) |
| | 2014 | 2013 |
| | PSSRP | TPA | Judge | Member | Sch- Mgt | GLTS | CUPE 2745 | Ombud | H-CUPE | H-CBE | Part- Time | SERP | Total | Total |
| Accrued benefit obligation beginning of year | $ 4,811.7 | $ 4618.4 | $ 61.1 | $ 64.9 | $ 16.3 | $ 295.6 | $ 68.4 | $ -- | $ -- | $ -- | $ -- | $ 210.2 | $10,146.6 | $ 9,318.3 |
| Actuarial (gains) losses | 140.9 | 170.1 | 4.7 | -- | 0.4 | 29.9 | 7.9 | -- | -- | -- | -- | 17.0 | 370.9 | 459.8 |
| Plan amendments 3 | (11.2) | -- | -- | -- | -- | -- | -- | -- | -- | -- | -- | -- | (11.2) | -- |
| Transfer – NB Power | 1,447.9 | -- | -- | -- | -- | -- | -- | -- | -- | -- | -- | -- | 1,447.9 | -- |
| Transfer between plans | (48.1) | -- | -- | -- | -- | -- | -- | -- | -- | -- | -- | 48.1 | -- | -- |
| Benefits accrued | 134.6 | 95.8 | 2.6 | 2.5 | -- | 8.7 | 2.3 | -- | -- | -- | -- | 1.9 | 248.4 | 230.1 |
| Interest | 359.6 | 305.7 | 3.3 | 2.9 | 1.1 | 20.3 | 4.7 | -- | -- | -- | -- | 7.5 | 705.1 | 660.3 |
| Reciprocal payments and refunds | 6.3 | 2.7 | -- | -- | -- | -- | -- | -- | -- | -- | -- | -- | 9.0 | 6.3 |
| Benefit payments | (264.5) | (269.3) | (1.3) | (3.2) | (1.2) | (16.5) | (2.8) | -- | -- | -- | -- | (14.1) | (572.9) | (528.2) |
| | | | | | | | | | | | | | | |
| Accrued benefit obligation | 6,557.2 | 4,923.4 | 70.4 | 67.1 | 16.6 | 338.0 | 80.5 | -- | -- | -- | -- | 270.6 | 12,343.8 | 10,146.6 |
| | | | | | | | | | | | | | | |
| Plan assets beginning of year | 4,458.0 | 4,459.7 | 33.5 | -- | 8.7 | 272.5 | 61.5 | -- | -- | -- | -- | -- | 9,293.9 | 8,674.7 |
| Actuarial gains (losses) | 313.0 | 288.0 | 2.3 | -- | 0.2 | 33.1 | 6.6 | -- | -- | -- | -- | -- | 643.2 | 166.0 |
| Return on plan assets | 325.4 | 283.4 | 2.2 | - | 0.6 | 18.8 | 4.3 | -- | -- | -- | -- | -- | 634.7 | 596.5 |
| Employer contributions | 88.1 | 45.2 | 0.5 | -- | -- | 8.1 | 2.1 | -- | -- | -- | -- | -- | 144.0 | 283.4 |
| Employee contributions | 63.9 | 47.9 | 0.4 | -- | -- | 3.6 | 1.0 | -- | -- | -- | -- | -- | 116.8 | 110.4 |
| Transfer – NB Power | 1,252.7 | -- | -- | -- | -- | -- | -- | -- | -- | -- | -- | -- | 1,252.7 | -- |
| Benefit payments | (264.5) | (269.3) | (1.3) | -- | (1.2) | (16.5) | (2.8) | -- | -- | -- | -- | -- | (555.6) | (511.3) |
| Plan conversion adjustment | -- | -- | -- | -- | -- | -- | -- | -- | -- | -- | -- | -- | -- | (25.8) |
| | | | | | | | | | | | | | | |
| Plan assets | 6,236.6 | 4,854.9 | 37.6 | -- | 8.3 | 319.6 | 72.7 | -- | -- | -- | -- | -- | 11,529.7 | 9,293.9 |
| | | | | | | | | | | | | | | |
| Actuarial Pension Liability | 340.6 | 68.5 | 32.8 | 67.1 | 8.3 | 18.4 | 7.8 | -- | -- | -- | -- | 270.6 | 814.1 | 852.7 |
| | | | | | | | | | | | | | | |
| Unamortized adjustments beginning of year | (464.5) | (490.1) | (5.6) | (5.1) | -- | (27.3) | (9.6) | -- | -- | -- | -- | -- | (1,002.2) | (903.1) |
| New adjustments | 183.3 | 118.0 | (2.4) | -- | (0.2) | 3.3 | (1.3) | -- | -- | -- | -- | (17.0) | 283.7 | (294.0) |
| Transfer – NB Power | (217.1) | -- | -- | -- | -- | -- | -- | -- | -- | -- | -- | -- | (217.1) | -- |
| Amortization | 57.1 | 54.0 | 2.0 | 0.9 | 0.2 | 5.6 | 1.7 | -- | -- | -- | -- | (0.6) | 120.9 | 194.9 |
| | | | | | | | | | | | | | | |
| Unamortized Adjustments | (441.2) | (318.1) | (6.0) | (4.2) | -- | (18.4) | (9.2) | -- | -- | -- | -- | (17.6) | (814.7) | (1,002.2) |
| | | | | | | | | | | | | | | |
| Net Pension Liability 2 | $ (100.6) | $ (249.6) | $ 26.8 | $ 62.9 | $ 8.3 | -- | $ (1.4) | $ -- | $ -- | $ -- | $ -- | $ 253.0 | (0.6) | $ (149.5) |
| 2014 | PROVINCE OF NEW BRUNSWICK | 54 |
| | | |
| 54 |
NOTES TO THE CONSOLIDATED FINANCIAL STATEMENTS 31 March 2014 |
| | | | | | | | | | | | | | | | |
| | (millions) |
| | 2014 | | 2013 |
| PSSRP | TPA | Judge | Member | Sch- Mgt | GLTS | CUPE 2745 | Ombud | H-CUPE | H-CBE | Part- Time | SERP | Total | | Total |
| Expense employers’ share | | | | | | | | | | | | | | | |
| of pension benefits earned | $ 58.7 | $ 50.5 | $ 2.2 | $ 2.0 | $ -- | $ 5.2 | $ 1.3 | $ 0.2 | $ 30.8 | $ 41.0 | $ 2.2 | $ 1.9 | $ 196.0 | | $ 177.4 |
| Interest | 34.2 | 22.3 | 1.1 | 2.9 | 0.5 | 1.5 | 0.4 | -- | -- | -- | -- | 7.5 | 70.4 | | 62.7 |
| Plan amendments 3 | (11.2) | -- | -- | -- | -- | -- | -- | -- | -- | -- | -- | -- | (11.2) | | -- |
| Amortization of adjustments | 68.3 | 54.0 | 2.0 | 0.9 | 0.2 | 5.6 | 1.7 | -- | -- | -- | -- | (0.6) | 132.1 | | 194.9 |
| NB Power net asset assumed on PSSRP conversion | (21.9) | -- | -- | -- | -- | -- | -- | -- | -- | -- | -- | -- | (21.9) | | -- |
| | | | | | | | | | | | | | | | |
| Total pension expense | 128.1 | 126.8 | 5.3 | 5.8 | 0.7 | 12.3 | 3.4 | 0.2 | 30.8 | 41.0 | 2.2 | 8.8 | 365.4 | | 435.0 |
| Employer contributions 1 | 69.8 | 45.0 | 0.5 | 2.7 | -- | 8.1 | 2.1 | 0.2 | 30.8 | 41.0 | 2.2 | 14.1 | 216.5 | | 350.8 |
| Plan conversion adjustment | -- | -- | -- | -- | -- | -- | -- | -- | -- | -- | -- | -- | -- | | (25.8) |
| Transfer between plans | 48.1 | -- | -- | -- | -- | -- | -- | -- | -- | -- | -- | (48.1) | -- | | -- |
| | | | | | | | | | | | | | | | |
| Change in net pension liability | $ 10.2 | $ 81.8 | $ 4.8 | $ 3.1 | $ 0.7 | $ 4.2 | $ 1.3 | $ -- | $ -- | $ -- | $ -- | $ (42.8) | $ 148.9 | | $ 110.0 |
| | | | | | | | | | | | | | | | |
| | | | | | | | | | | | | | | | |
| | | | | | | | | | | | | | | | |
| 1 | Only includes contributions from consolidated fund and entities consolidated |
| 2 | The Province has no liability for the Ombudsman, H-CUPE, H-CBEand Part-Time plans beyond its annual employer contribution thus no information regarding plan assets and liabilities is reported above. |
| 3 | A prescribed accounting determination of the plan amendment to comply w ith PS 3250 and not intended to measure the cost or savings of plan changes. |
| 2014 | PROVINCE OF NEW BRUNSWICK | 55 |
| | | |
NOTES TO THE CONSOLIDATED FINANCIAL STATEMENTS
31 March 2014
e) Actuarial Assumptions
Calculation of the Province’s employee pension obligations and related pension expenditure is based on long term actuarial assumptions except the Members’ Plan where both short and long term assumptions are used. In addition, salary increase assumptions have been refined given wage freeze measures implemented in the short term.
The table below discloses the assumptions used in the actuarial valuations.
| | | |
| | | | Rate of Pension |
| | Rate of Return | | Escalation after |
| Plan | on Assets (%) | Inflation (%) | Retirement (%) |
| |
| PSSRP | 6.35 | 2.25 | 2.25 |
| TPA | 6.50 | 2.25 | 1.95 to 2.15 |
| Judge | 6.50 | 2.25 | 2.05 to 2.15 |
| Sch – Mgt | 6.50 | 2.25 | 1.95 |
| GLTS | 6.50 | 2.25 | 2.00 |
| CUPE 2745 | 6.50 | 2.25 | 2.00 |
| Member | 4.53 | 2.50 | 2.30 to 2.40 |
Annual Wage and Salary Increase Assumptions (%) (excludes promotional scale)
| | | | | |
| | 2014 | 2015 | 2016 | 2017 | 2018 |
| |
| PSSRP | 2.0 | 2.0 | 2.75 | 2.75 | 2.75 |
| TPA | 2.0 | 2.0 | 2.75 | 2.75 | 2.75 |
| Judge | 4.0 | 4.0 | 4.0 | 4.0 | 4.0 |
| Sch – Mgt | 2.0 | 2.0 | 2.75 | 2.75 | 2.75 |
| GLTS | 2.0 | 2.0 | 2.75 | 2.75 | 2.75 |
| CUPE 2745 | 2.0 | 2.0 | 2.75 | 2.75 | 2.75 |
| Member | 3.0 | 3.0 | 3.0 | 3.0 | 3.0 |
These assumptions have been used to determine the amount of the Province’s obligation for pension benefits outstanding and the value of benefits earned by employees during the fiscal year and are based on management’s best estimates. Different assumptions have been used to determine the appropriate level of employee and employer contributions needed to fund the estimated cost of the pension plans.
| 2014 | PROVINCE OF NEW BRUNSWICK | 56 |
| | | |
NOTES TO THE CONSOLIDATED FINANCIAL STATEMENTS
31 March 2014
| | | | | | | | |
| f) Member Data | | | | | | | | |
| |
| The following table lists data about the members of each plan. | | | | | |
| |
| | | Estimated | | | | Average | | |
| | | Average | Number of | | | Annual Salary | | Average |
| | | Remaining Service | Active | Number of | | of | | Annual |
| Plan | | Life (Years) | Contributors | Pensioners | | Contributors | | Pension |
| |
| PSSRP | | 14 | 19,419 | 14,672 | | $ 63,032 | | $ 21,907 |
| TPA | | 16 | 9,946 | 8,722 | | 73,755 | | 30,651 |
| Judge | | 6 | 30 | 28 | | 205,520 | | 47,534 |
| Sch – Mgt | - | -- | N/A | 103 | | N/A | | 12,214 |
| GLTS | | 9 | 2,132 | 1,519 | | 33,288 | | 10,570 |
| CUPE 2745 | | 10 | 1,049 | 399 | | 30,698 | | 7,327 |
| Member | | 10 | | | | | | |
| Member | | | 55 | 87 | | 85,000 | | 27,580 |
| Minister | | | 22 | 39 | | 51,491 | | 6,051 |
The Members’ Pension Plan provides for a benefit based on years of service and salary as a Member and a benefit based on years of service and salary as a Minister. All Ministers are also included as a Member.
2) Retirement Allowances
The Province of New Brunswick’s unionized employees working full-time and part-time hours in government departments, school districts and other agencies are entitled to an allowance upon retirement in accordance with their respective collective agreements.
Effective April 1, 2011, the retirement allowance program has been discontinued for new entrants to the non-bargaining group of employees. For management and non-union employees with a continuous service date before April 1, 2011, the accumulation of retirement allowance credits was discontinued as of March 31, 2013. Eligible employees were provided with the option of a payout in lieu of retirement allowance or to defer their retirement allowance until retirement based on accumulated credits as of March 31, 2013 and salary upon retirement.
This is an unfunded program with no specific assets segregated to meet the obligations when they come due. Actuarial estimates for this future liability have been completed and form the basis for the estimated liability reported in these consolidated financial statements. The latest actuarial valuation was calculated as at 31 March 2014 for employees in Part I - departments, Part II – school system, and Part III – health sector.
Significant economic and demographic assumptions used in the actuarial valuations are:
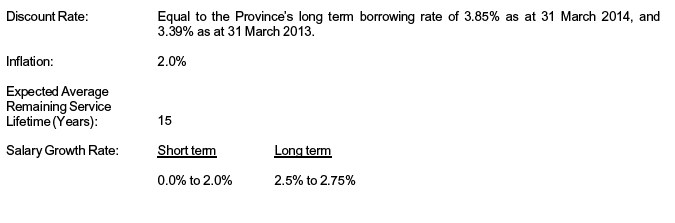
| 2014 | PROVINCE OF NEW BRUNSWICK | 57 |
| | | |
NOTES TO THE CONSOLIDATED FINANCIAL STATEMENTS
31 March 2014
| | | | | | | | | | | | | | | | |
| The following table presents the liability at 31 March: | | | | | | | | | | | | | | | |
| |
| | | | | | | | (millions) | | | | | | | |
| | | | | | | | 2014 | | | | | | | | 2013 | |
| | Part I, II, III | | | | Employees of | | | | Total | | | | Total | |
| | Employees | | | | Other Agencies | | | | | | | | | |
| |
| Accrued benefit obligation beginning of year | | | $ 498.8 | | | | $ 7.4 | | | | $ 506.2 | | | | $ 432.5 | |
| Actuarial (gains) losses | | | (22.0) | | | | (0.2) | | | | (22.2) | | | | 38.6 | |
| Benefits accrued | | | 31.9 | | | | 0.2 | | | | 32.1 | | | | 37.1 | |
| Interest | | | 14.9 | | | | 0.1 | | | | 15.0 | | | | 16.0 | |
| Curtailment costs | | - | -- | | | | -- | | | | -- | | | | 16.8 | |
| Settlement costs | | | 5.9 | | | | -- | | | | 5.9 | | | | -- | |
| Benefit payments | | | (104.9) | | | | (4.0) | | | | (108.9) | | | | (34.8) | |
| |
| Accrued benefit obligation end of year | | | 424.6 | | | | 3.5 | | | | 428.1 | | | | 506.2 | |
| |
| Unamortized adjustments | | | | | | | | | | | | | | | | |
| Opening balance | | | (57.8) | | | | (0.2) | | | | (58.0) | | | | (36.9) | |
| New adjustments | | | 22.0 | | | | 0.2 | | | | 22.2 | | | | (38.6) | |
| Amortization | | | 4.5 | | | | 0.2 | | | | 4.7 | | | | 17.5 | |
| |
| Unamortized Adjustments Ending balance | | | (31.3) | | | | 0.2 | | | | (31.1) | | | | (58.0) | |
| |
| Total Benefit Liability | | | $ 393.3 | | | | $ 3.7 | | | | $ 397.0 | | | | $ 448.2 | |
Other agencies include Service New Brunswick, New Brunswick Investment Management Corporation, New Brunswick Energy and Utilities Board, New Brunswick Legal Aid Services Commission, Financial and Consumer Services Commission and FacilicorpNB Ltd./Ltée.
NOTE 13
SICK LEAVE LIABILITY
The Province of New Brunswick’s employees working full-time and part-time hours in government departments, school districts and other agencies receive sick leave that is earned at varying amounts per group. Unused hours can be carried forward for future paid leave, up to predetermined maximum amounts. This is an unfunded program with no specific assets segregated to meet the obligations when they come due. Actuarial estimates for this future liability have been completed and form the basis for the estimated liability reported in these consolidated financial statements. The latest actuarial valuation was calculated as at 31 March 2014 for government department and school district employees. The latest actuarial valuations were completed between 31 March 2011 and 31 March 2014 for employees of other agencies.
Significant economic and demographic assumptions used in the actuarial valuations are:
| |
Discount Rate: | Equal to the Province’s long term borrowing rate of 3.85% as at 31 March 2014, and 3.39% as at 31 March 2013. |
| |
Expected Average Remaining Service Lifetime (Years): | 9.4 to 22 |
| 2014 | PROVINCE OF NEW BRUNSWICK | 58 |
| | | |
NOTES TO THE CONSOLIDATED FINANCIAL STATEMENTS
31 March 2014
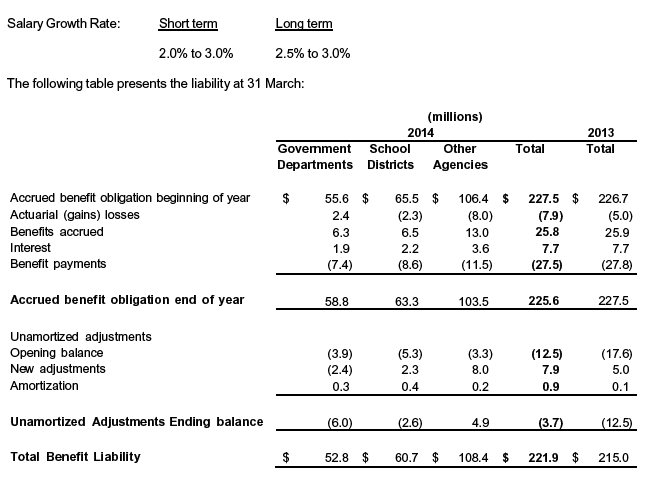
Other agencies include Horizon Health Network, Vitalité Health Network, New Brunswick Community College, Collège communautaire du Nouveau-Brunswick, Service New Brunswick, New Brunswick Investment Management Corporation, Recycle New Brunswick and FacilicorpNB Ltd./Ltée.
NOTE 14 CONTINGENT LIABILITIES
a) GuaranteedLoans
The Province has guaranteed certain debt of entities external to the Provincial Reporting Entity under the authority of various statutes.
Provincial Holdings Ltd. (PHL) is wholly owned by the Province and is responsible for administering industrial development project investments. PHL is included in the Province’s reporting entity as described in Schedule 30. Any resulting losses on loans guaranteed by PHL will be borne by the Province.
At 31 March 2014, the total contingent liability in respect of these guarantees was $86.3 million ($101.6 million 2013), of which the Province has recognized $32.0 million as a liability on the consolidated statement of financial position ($46.0 million 2013).
| 2014 | PROVINCE OF NEW BRUNSWICK | 59 |
| | | |
NOTES TO THE CONSOLIDATED FINANCIAL STATEMENTS
31 March 2014
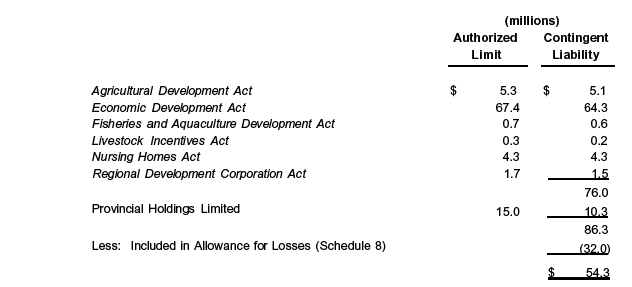
b) New Brunswick Municipal Finance Corporation
The New Brunswick Municipal Finance Corporation (NBMFC) is included in the Province’s reporting entity as described in Schedule 30. The Province guarantees the payment of principal and interest of any borrowing by NBMFC. In the event of a defaulted payment, the Province shall recover such amounts from the defaulting municipality or from the defaulting municipality that has guaranteed the payment due to the Corporation from the defaulting municipal enterprise. As of 31 December 2013, total debenture debt outstanding was $863.6 million ($838.3 million in 2012). An additional $10.0 million of long term debt was issued by the corporation in March of 2014.
c) New Brunswick Credit Union Deposit Insurance Corporation
The New Brunswick Credit Union Deposit Insurance Corporation (NBCUDIC) provides deposit insurance to members of credit unions in New Brunswick to a maximum of $250,000 for each member. NBCUDIC is included in the Province’s reporting entity as described in Schedule 30. As of 31 December 2013, deposits of the credit unions totalled $3.6 billion ($3.5 billion in 2012). In addition, NBCUDIC has guaranteed specific losses up to $2.0 million.
d) EnvironmentalResponsibility
The Province of New Brunswick has assumed responsibility for reclamation and environmental protection of the Restigouche mining site. There is no imminent environmental or health threat from the property as it is being continually monitored and managed. The Province currently holds a cash security in the amount of $0.7 million for remediation. The estimated cost to complete a full reclamation at this site, based on management’s best estimate, is between $5.2 million and $7.6 million over and above the security in place. There has been no decision at this time to proceed with full reclamation of the site.
PHL is responsible for the environmental clean-up of property in Miramichi. The cost for remediation, based on management’s best estimate, has been estimated at $6.5 million.
A decommissioning study of the New Brunswick Power Corporation’s Coleson Cove Generating Station discovered elevated levels of vanadium and nickel in the water and sediment in Shannon Brook, which originates on the Coleson Cove property and flows out to the Musquash Estuary. To date, the work associated with relocating material from the Phase 1 cell has been completed and work continues on the ecological risk assessment and the development of potential sediment management options for the impacted area.
| 2014 | PROVINCE OF NEW BRUNSWICK | 60 |
| | | |
NOTES TO THE CONSOLIDATED FINANCIAL STATEMENTS
31 March 2014
e) Insurance
The Province does not carry general liability insurance or property insurance on its assets except in a few limited instances. Any successful liability claims against the Province and any replacement of lost or damaged property are charged to expense in the year of settlement or replacement.
f) Legal Actions
The Province of New Brunswick is involved in various legal proceedings arising from government activities. Amounts totalling $28.8 million have been accrued in these consolidated financial statements which represents management’s best estimate of the likely losses due to legal actions. The Province of New Brunswick is also involved in various legal actions, some of which may be significant, the outcome of which is not determinable.
NOTE 15
COMMITMENTS
a) Operating Leases
The total future minimum payments under various operating lease agreements, including those of government business enterprises for the rental of space and equipment, amounts to $505.5 million ($521.7 million 2013). Minimum annual lease payments in each of the next five years are as follows:
| | |
| Fiscal Year | | (millions) |
| |
| 2014-2015 | | $ 88.7 |
| 2015-2016 | | 78.4 |
| 2016-2017 | | 71.7 |
| 2017-2018 | | 54.2 |
| 2018-2019 | | 49.2 |
b) Nursing Homes
The Department of Social Development includes in its annual operating budget funding for the repayment of approved long term debt of certain nursing homes. The Department funds the nursing homes through grants which pay the difference between operating expenses and revenue from other sources.
Total long term debt of these nursing homes at 31 March 2014 amounted to approximately $337.9 million ($359.3 million 2013). Of the $337.9 million nursing home debt, the Province has issued guarantees totaling approximately $4.3 million ($5.1 million 2013) which is included as a contingent liability.
c) New Brunswick Lotteries and Gaming Corporation
In August 2013, the Atlantic Lottery Corporation communicated to NBLGC that retained earnings deficits would be recovered from shareholders through withholdings of profit distributions beginning in September 2013 and ending in 2019. The impact on future profit distributions for NBLGC is a decrease of $18.7 million.
d) ContractualObligations
The nature of the government’s activities results in significant multi-year contracts and obligations. The Province currently has outstanding contractual commitments of $2,715.5 million. Significant commitments and agreements are as follows:
| 2014 | PROVINCE OF NEW BRUNSWICK | 61 |
| | | |
NOTES TO THE CONSOLIDATED FINANCIAL STATEMENTS
31 March 2014
| | | | | | | | | | | | | | | |
| | | | | | | (millions) | | | | | | |
| |
| Consolidated Fund Entities | | | | $ | 1,153.0 | | | | | | |
| Other Government Entities | | | | | 1,562.5 | | | | | | |
| |
| |
| Significant commitments and agreements include: | | | | | | | | | | | | | | | |
| |
| Consolidated FundEntities | | | | | | | | | | | | | | | |
| | | | | | | (millions) | | | | | | |
| | | 2015 | | 2016 | | 2017 | | | 2018 | | | 2019 | + | | Totals |
| |
| Educationand EarlyChildhood Development | | | | | | | | | | | | | | | |
| Other Educational Operating Services | | $ 15.8 | | $ 4.1 | | $ 2.0 | | | $ 0.7 | | | $ 0.7 | | | $ 23.3 |
| Environment and Local Government | | | | | | | | | | | | | | | |
| Federal Gas TaxTransfer Fund | | 13.7 | | -- | | -- | | | -- | | | -- | | | 13.7 |
| Finance | | | | | | | | | | | | | | | |
| PropertyAssessment and Taxation System | | | | | | | | | | | | | | | |
| Renewal Initiative | | 0.3 | | 0.1 | | -- | | | -- | | | -- | | | 0.4 |
| Project Management, Marketing,Web and | | | | | | | | | | | | | | | |
| Staffing Services | | 0.7 | | 0.1 | | -- | | | -- | | | -- | | | 0.8 |
| Health | | | | | | | | | | | | | | | |
| Various Health Care Services | | 21.6 | | 9.8 | | 6.4 | | | 5.1 | | | 0.5 | | | 43.4 |
| IntergovernmentalAffairs | | | | | | | | | | | | | | | |
| 2014 World Acadian Conference | | 0.4 | | -- | | -- | | | -- | | | -- | | | 0.4 |
| Justice and Office of AttorneyGeneral | | | | | | | | | | | | | | | |
| Recording Services for Criminal Code Review | | | | | | | | | | | | | | | |
| Board Proceedings | | 0.3 | | -- | | -- | | | -- | | | -- | | | 0.3 |
| Natural Resources | | | | | | | | | | | | | | | |
| Various Agreements Under Natural Resources | | | | | | | | | | | | | | | |
| Management | | 3.0 | | 1.5 | | 0.2 | | | 0.2 | | | -- | | | 4.9 |
| Public Safety | | | | | | | | | | | | | | | |
| Public Police Service Agreement (PPSA) | | 74.5 | | 74.5 | | 74.5 | | | 74.5 | | | 74.5 | | | 372.5 |
| SocialDevelopment | | | | | | | | | | | | | | | |
| Youth Home Operating Costs | | 4.0 | | 1.1 | | -- | | | -- | | | -- | | | 5.1 |
| Advisory, Consulting, and IT Services | | 8.8 | | 1.7 | | -- | | | -- | | | -- | | | 10.5 |
| Tourism, Heritage and Culture | | | | | | | | | | | | | | | |
| Advertising, Publication, Software and Web | | | | | | | | | | | | | | | |
| Service Contracts | | 7.7 | | 6.6 | | 6.3 | | | 5.6 | | | -- | | | 26.2 |
| Building Canada Fund | | | | | | | | | | | | | | | |
| Le Village Historique Acadien | | 0.2 | | -- | | -- | | | -- | | | -- | | | 0.2 |
| TransportationandInfrastructure | | | | | | | | | | | | | | | |
| Various Capital Projects | | 262.9 | | 42.1 | | 30.5 | | | 31.7 | | | 55.2 | | | 422.4 |
| FundyIslands FerryServices Project | | | | | | | | | | | | | | | |
| Operations Agreement | | 14.1 | | 14.5 | | 14.9 | | | 15.2 | | | 155.4 | | | 214.1 |
| National Highways System | | 24.8 | | 0.5 | | -- | | | -- | | | -- | | | 25.3 |
| Permanent Bridges and Highways | | 16.6 | | -- | | -- | | | -- | | | -- | | | 16.6 |
| Rural Road Initiative | | 7.7 | | -- | | -- | | | -- | | | -- | | | 7.7 |
| Subtotal | | 477.1 | | 156.6 | | 134.8 | | | 133.0 | | | 286.3 | | | 1,187.8 |
| |
| Capital Contributions from Outside Sources | | 23.6 | | 11.2 | | -- | | | -- | | | -- | | | 34.8 |
| Total | | $ 453.5 | | $ 145.4 | | $ 134.8 | | | $ 133.0 | | | $ 286.3 | | | $ 1,153.0 |
| 2014 | PROVINCE OF NEW BRUNSWICK | 62 |
| | | |
NOTES TO THE CONSOLIDATED FINANCIAL STATEMENTS
31 March 2014
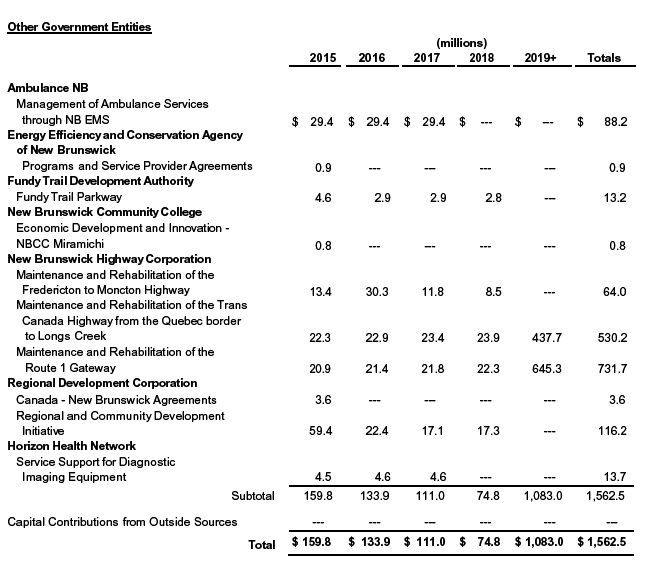
The Province also has contractual obligations and other commitments through its government business enterprises. The New Brunswick Power Corporation has entered into various agreements related to the purchase and transmission of electricity and the supply and delivery of fuel oil and coal.
| 2014 | PROVINCE OF NEW BRUNSWICK | 63 |
| | | |
NOTES TO THE CONSOLIDATED FINANCIAL STATEMENTS
31 March 2014
NOTE 16 SEGMENT REPORTING
Note 16 is intended to provide supplementary information on the province’s revenue and expenses by segment. The segments have been defined based on the accountability and control relationships between the Government and the various organizations within the reporting entity. Although the government controls all the entities included, there are varying levels of accountability. The segments are defined as: Government Departments and Some Agencies; Regional Health Authorities; and Other Crowns and Agencies. An Interaccount Eliminations column is added to eliminate double counting between columns and to reconcile to the Consolidated Statement of Operations. The extent of these items was $6.8 million in the 2014 fiscal year ($7.2 million in 2013). Eliminations between the Province and entities impact asset and liability accounts with respect to tangible capital assets and deferred contributions from the Province.
The Government Departments and Some Agencies segment represents the group most directly accountable to the Board of Management and Cabinet. The segment includes all line departments such as Health, Education and Transportation as well as the following agencies: Arts Development Trust Fund, Atlantic Education International Inc., Economic and Social Inclusion Corporation, Energy Efficiency and Conservation Agency of New Brunswick, Environmental Trust Fund, New Brunswick Agricultural Insurance Commission, New Brunswick Highway Corporation, New Brunswick Housing Corporation, New Brunswick Internal Services Agency, New Brunswick Lotteries and Gaming Corporation, Regional Development Corporation, and Sport Development Trust Fund.
The Regional Health Authorities (RHA’s) are disclosed separately due to the magnitude of their operations and the fact they are somewhat removed from day to day control of the Board of Management and Cabinet.
Other Crowns and Agencies are also somewhat removed and independent with respect to day to day operations yet still controlled by government under the Public Sector Accounting Board’s criteria for control. The organizations included in this segment include: New Brunswick Liquor Corporation, New Brunswick Municipal Finance Corporation, and New Brunswick Power Corporation. Also included with other agencies are the following entities which are consolidated in the Province’s financial statements: Algonquin Golf Limited, Algonquin Properties Limited, Ambulance New Brunswick Inc., Collège communautaire du Nouveau-Brunswick; FacilicorpNB Ltd., Financial and Consumer Services Commission, Forest Protection Limited, Invest NB, Kings Landing Corporation, New Brunswick Community College, New Brunswick Credit Union Deposit Insurance Corporation, New Brunswick Energy and Utilities Board, New Brunswick Health Council, New Brunswick Immigrant Investor Fund (2009) Ltd., New Brunswick Investment Management Corporation, New Brunswick Legal Aid Services Commission, Provincial Holdings Ltd., Recycle New Brunswick and Service New Brunswick.
| 2014 | PROVINCE OF NEW BRUNSWICK | 64 |
| | | |
NOTES TO THE CONSOLIDATED FINANCIAL STATEMENTS
31 MARCH 2014
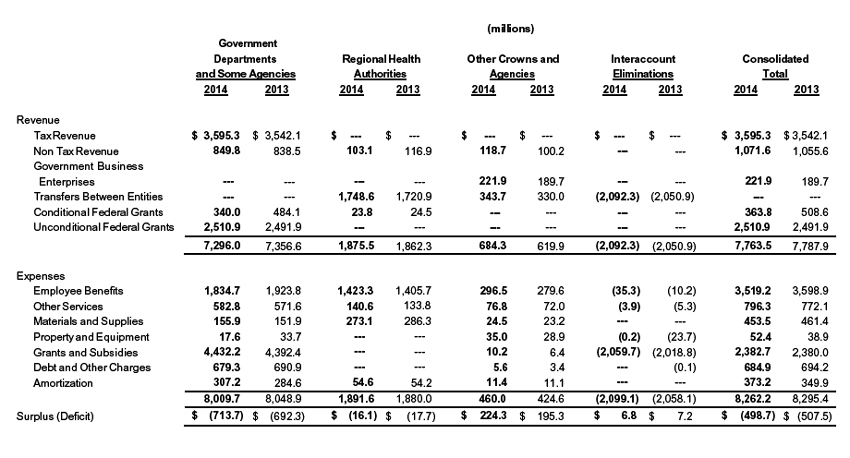
| 2014 | PROVINCE OF NEW BRUNSWICK | 65 |
| | | |
NOTES TO THE CONSOLIDATED FINANCIAL STATEMENTS
31 March 2014
NOTE 17
TRUST FUNDS
The Province is trustee for various trust funds outside the Provincial Reporting Entity.
The following is a summary of the trust fund equities calculated using the method indicated below to value investment assets:
| | | |
| | (millions) |
| | 2014 | | 2013 |
| Cost Method: | | | |
| |
| Margaret R. Lynds Bequest | $ 0.1 | | $ 0.1 |
| Mental Health Trust Fund | 1.3 | | 1.2 |
| Viscount Bennett Bequest | 0.2 | | 0.2 |
| | 1.6 | | 1.5 |
| |
| Market Value Method: | | | |
| |
| Judges’ Superannuation Fund | $ 37.3 | | $ 33.4 |
| Office of the Public Trustee Trust Fund | 10.0 | | 9.2 |
| Pension Plan for the Management Employees | | | |
| of New Brunswick School Districts | 8.3 | | 8.8 |
| Pension Plan for General Labour, Trades and Services | | | |
| Employees of New Brunswick School Districts | 319.7 | | 272.5 |
| Pension Plan for Full-Time CUPE 2745 Employees of | | | |
| New Brunswick School Districts | 72.8 | | 61.6 |
| Teachers’ Pension Trust Fund | 4,844.1 | | 4,451.6 |
| |
| | $ 5,292.2 | | $ 4,837.1 |
The Margaret R. Lynds Bequest awards three annual scholarships of equal value to students pursuing the study of communications at specified universities. The Mental Health Trust Fund is used to pay for psychoanalysis treatment of deserving New Brunswick residents. The income from the Viscount Bennett Bequest is used to develop the Province's historic resources. The Public Trustee of New Brunswick protects the financial and personal interests of the elderly, the mentally challenged, children, missing or deceased persons, when there is no one else able and willing to do so.
As a result of the conversion of the Public Service Superannuation Act plan to the Public Service Shared Risk Plan on 1 January 2014, the Province is no longer the trustee for the plan’s trust fund. As the date of conversion, the Board of Trustees of the Public Service Shared Risk Plan became the trustee of the fund.
| 2014 | PROVINCE OF NEW BRUNSWICK | 66 |
| | | |
NOTES TO THE CONSOLIDATED FINANCIAL STATEMENTS
31 March 2014
NOTE 18 PRIOR PERIOD ADJUSTMENTS
Restatements to Net Debt and Accumulated Deficit
The tables below summarize the impact of the prior period adjustments on the opening net debt and accumulated deficit figures. The paragraphs following the tables provide additional information on these adjustments.
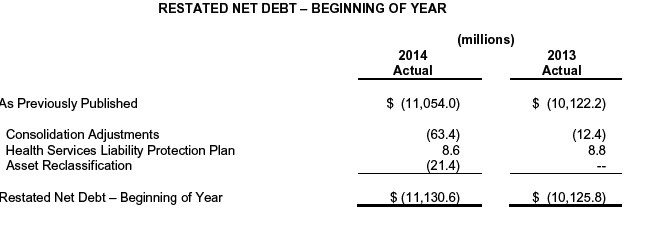
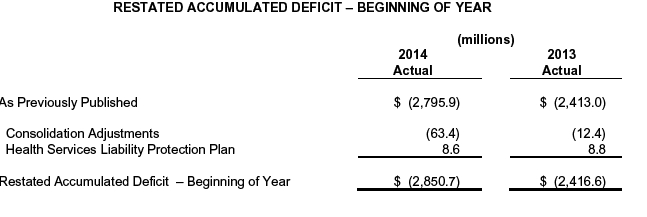
Consolidation Adjustments
On October 1, 2013, the New Brunswick Power Group of Companies, New Brunswick Electric Finance Corporation (NBEFC) and the New Brunswick System Operator were amalgamated into a new vertically integrated Corporation. The amalgamation resulted in a restatement of New Brunswick Power Corporation’s opening retained earnings. For comparative purposes, the 2014 opening net debt and accumulated deficit results of the Province were restated to reflect the impact of the amalgamation. This resulted in a $46.0 million increase in the opening net debt and accumulated deficit of the Province and an offsetting decrease in equity in New Brunswick Power Corporation.
| 2014 | PROVINCE OF NEW BRUNSWICK | 67 |
| | | |
NOTES TO THE CONSOLIDATED FINANCIAL STATEMENTS
31 March 2014
As a result of a change in accounting policy, the New Brunswick Lottery and Gaming Corporation (NBLGC) is now using the modified equity method to account for its investment in the Atlantic Lotteries Corporation. In addition, the results of NBLGC, as reflected in the Province’s 2013 financial statements, were restated to reflect a disbursement calculation which was revised based on information finalized after the release of the Province’s 31 March 2013 financial statements. The Province’s 2013 results have been restated as follows: a decrease in the other comprehensive income of $5.5 million and a decrease in assets of $17.9 million. The opening net debt and accumulated deficit as at 1 April 2012 increased by $12.4 million.
As a result of a change in accounting policy, the financial results of New Brunswick Agricultural Insurance Commission are now being included in these statements using the full consolidation method. This resulted in the restatement of 31 March 2013 financial results as follows: an increase of $7.8 million in revenue and $7.3 million in expenses for a net decrease of $0.5 million in the Province’s annual deficit. There was also a $2.7 and $2.2 million increase in assets and liabilities respectively with an offsetting decrease in the Province’s accumulated deficit and net debt of $0.5 million.
New Brunswick Health Services Liability Protection Plan
The Province retroactively restated the provision for the New Brunswick Health Services Liability Protection Plan to limit the reserve amount to only include claims that have been reported and are expected to be settled at a future date. The provision had previously also included an accrual for incidents that had occurred but had not yet been reported. This restatement resulted in an increase of $0.2 million to the Province’s 2013 expenses, deficit and net debt. The opening net debt and accumulated deficit as at 1 April 2012 decreased by $8.8 million.
Asset Reclassification
As a result of a change in accounting policy, assets previously classified as advances have been reclassified as prepaid expenses. This resulted in an increase in 31 March 2013 net debt of $21.8 million.
NOTE 19 COMPARATIVE FIGURES
Certain 2013 figures have been restated to conform to 2014 presentation.
NOTE 20 SUBSEQUENT EVENTS
Pension Plan Reform
In May 2014, the Teachers’ Pension Act was repealed and replaced with the Teachers’ Pension Plan Act. The pension plan under the Teachers’ Pension Act will be converted on July 1, 2014. Changes to the pension plan are intended to meet the objectives of sustainability, affordability, security, and being equitable to all generations.
In March 2014, legislation was introduced to move members of the Legislative Assembly to a shared risk pension plan. Once the legislation is enacted, the members will contribute to the Public Service Shared Risk Pension Plan. Pensions based on previous service will continue to be paid from general revenues.
The impact of changes to these pension plans is currently being assessed.
| 2014 | PROVINCE OF NEW BRUNSWICK | 68 |
| | | |
SCHEDULES TO THE CONSOLIDATED FINANCIAL STATEMENTS
31 March 2014
| | | |
| | (millions) |
| | 2014 | | 2013 |
| |
| SCHEDULE 1 | | | |
| CASH AND SHORT TERM INVESTMENTS | | | |
| |
| Short Term Investments | $ 901.8 | | $ 1,238.9 |
| Cash | 636.2 | | 57.7 |
| | $ 1,538.0 | | $ 1,296.6 |
| |
| |
| SCHEDULE 2 | | | |
| RECEIVABLES AND ADVANCES | | | |
| |
| Accounts Receivable | | | |
| General Receivables of Government Departments | $ 223.8 | | $ 208.0 |
| General Receivables of Government Entities | 45.0 | | 44.5 |
| | 268.8 | | 252.5 |
| |
| Due from Federal Government | | | |
| Central Government Services | 66.8 | | 82.2 |
| Transportation | 29.0 | | 72.6 |
| Economic Development | 29.0 | | 56.7 |
| Education | 20.4 | | 22.3 |
| Harmonized Sales Tax Rebate | 18.5 | | 16.0 |
| Health | 0.2 | | 0.3 |
| Other | 2.9 | | 4.7 |
| | 166.8 | | 254.8 |
| |
| Guarantee Payouts | 128.1 | | 114.3 |
| |
| Advances | | | |
| Working Capital Advances | 8.2 | | 8.0 |
| Advances of Grants | -- | | 13.9 |
| Other | 4.7 | | 4.3 |
| | 12.9 | | 26.2 |
| |
| Interest Receivable | | | |
| Student Loans | 17.5 | | 16.4 |
| Fisheries and Aquaculture Development Act | 6.6 | | 6.7 |
| Economic Development Act | 5.1 | | 4.8 |
| Agricultural Development Act | 0.1 | | 0.1 |
| Other | 19.9 | | 20.7 |
| | 49.2 | | 48.7 |
| |
| | 625.8 | | 696.5 |
| Less: Allowance for Doubtful Accounts | 267.1 | | 254.1 |
| | $ 358.7 | | $ 442.4 |
| 2014 | PROVINCE OF NEW BRUNSWICK | 69 |
| | | |
SCHEDULES TO THE CONSOLIDATED FINANCIAL STATEMENTS
31 March 2014
| | | | |
| | | (millions) |
| | | 2014 | | 2013 |
| |
| SCHEDULE 3 | | | | |
| TAXES RECEIVABLE | | | | |
| |
| Real Property Tax | | $ 1,100.4 | | $ 1,087.9 |
| Gasoline and Motive Fuels Tax | | 20.6 | | 19.4 |
| Tobacco Tax | | 18.1 | | 20.2 |
| Royalties and Stumpage on Timber | | 13.6 | | 10.6 |
| Sales Tax | - | -- | | 36.6 |
| Other | | 4.7 | | 3.6 |
| | | 1,157.4 | | 1,178.3 |
| Less: Allowance for Doubtful Accounts | | 42.0 | | 38.1 |
| | | $ 1,115.4 | | $ 1,140.2 |
| |
| SCHEDULE 4 | | | | |
| INVENTORIES FOR RESALE | | | | |
| |
| Inventories for Resale | | | | |
| Properties Held for Sale | | $ 3.4 | | $ 3.4 |
| 2014 | PROVINCE OF NEW BRUNSWICK | 70 |
| | | |
| | | | | | | | | | | | | | |
| SCHEDULES TO THE CONSOLIDATED FINANCIAL STATEMENTS |
| 31 March 2014 |
| |
| | | | | | | | (millions) | | | | | |
| | | | | 2014 | | | | | | | 2013 | | | |
| | | | | Allowance | | | | | | | Allowance | | | |
| | | | | for Doubtful | | | | | | | for Doubtful | | | |
| | Amount | | Accounts | | | Net | | Amount | | Accounts | | | Net |
| SCHEDULE 5 | | | | | | | | | | | | | | |
| LOANS | | | | | | | | | | | | | | |
| |
| Loans to Students | | $ 451.3 | | $ 99.4 | | | $ 351.9 | | $ 443.8 | | $ 97.3 | | | $ 346.5 |
| Economic Development Act | | 223.3 | | 91.7 | | | 131.6 | | 241.9 | | 86.7 | | | 155.2 |
| New Brunswick Housing Act | | 31.3 | | 3.7 | | | 27.6 | | 32.6 | | 3.8 | | | 28.8 |
| Fisheries and Aquaculture | | | | | | | | | | | | | | |
| Development Act | | 34.4 | | 21.3 | | | 13.1 | | 35.5 | | 21.3 | | | 14.2 |
| Agricultural Development Act | | 13.8 | | 2.5 | | | 11.3 | | 13.1 | | 2.2 | | | 10.9 |
| Energy Efficiency Upgrade Loans | | 6.3 | | 0.5 | | | 5.8 | | 10.0 | | 0.5 | | | 9.5 |
| L'Office de Stabilisation | | 5.2 | - | -- | | | 5.2 | | 5.2 | - | -- | | | 5.2 |
| Fundy Trail Endowment Fund | | 4.0 | - | -- | | | 4.0 | | 3.8 | - | -- | | | 3.8 |
| Unsatisfied Judgements | | 9.4 | | 9.4 | | - | -- | | 9.4 | | 9.4 | | - | -- |
| La Fondation du quotidien | | | | | | | | | | | | | | |
| francophone | | 4.0 | | 4.0 | | - | -- | | 4.0 | | 4.0 | | - | -- |
| Other Loans | | 32.7 | | 5.6 | | | 27.1 | | 23.3 | | 5.4 | | | 17.9 |
| |
| | | $ 815.7 | | $ 238.1 | | | $ 577.6 | | $ 822.6 | | $ 230.6 | | | $ 592.0 |
| 2014 | PROVINCE OF NEW BRUNSWICK | 71 |
| | | |
SCHEDULES TO THE CONSOLIDATED FINANCIAL STATEMENTS
31 March 2014
| | | | | | | |
| | | | (millions) | |
| |
| | | | 2014 | 2013 | |
| SCHEDULE 6 | | | | | | | |
| EQUITY IN GOVERNMENT BUSINESS ENTERPRISES | | | | | | | |
| |
| New Brunswick Power Corporation | | | $ 399.0 | | | $ - | |
| less: regulatory deferral adjustment (Note 7) | | | (145.6) | | | - | |
| New Brunswick Electric Finance Corporation | | | - | | | 171.9 | |
| New Brunswick Liquor Corporation | | | 18.2 | | | 24.1 | |
| New Brunswick Municipal Finance Corporation | | | 1.1 | | | 1.1 | |
| New Brunswick Securities Commission | | | - | | | 4.0 | |
| | | | $ 272.7 | $ 201.1 | |
| |
| OTHER INVESTMENTS | | | | | | | |
| Other Investments | | | $ 26.2 | $ 40.2 | |
| Atlantic Lottery Corporation | | | (9.8) | | | (17.9) | ) |
| | | | $ 16.4 | $ 22.3 | |
| |
| |
| |
| SCHEDULE 7 | | | | | | | |
| ACCOUNTS PAYABLE AND ACCRUED EXPENSES | | | | | | | |
| |
| Accounts Payable | | | $ 519.8 | $ 501.6 | |
| |
| Due to Canada | | | | | | | |
| Equalization and Canada Health and Social Transfer | | | 41.7 | | | 62.5 | |
| Canada Mortgage and Housing Corporation | | | 30.6 | | | 47.9 | |
| Other Agreements | | | 56.2 | | | 1.1 | |
| | | | 128.5 | | | 111.5 | |
| |
| Accrued Interest | | | | | | | |
| Funded Debt | | | 135.4 | | | 130.8 | |
| Other | | | 69.3 | | | 72.8 | |
| | | | 204.7 | | | 203.6 | |
| |
| Employee Benefits | | | | | | | |
| Retirement Allowances | | | 397.0 | | | 448.2 | |
| Accrued Salaries Payable | | | 293.9 | | | 276.0 | |
| Sick Leave | | | 221.9 | | | 215.0 | |
| Liability for Injured Workers | | | 131.4 | | | 131.9 | |
| | | | 1,044.2 | | | 1,071.1 | |
| |
| Municipal Property Taxes Due to Municipalities | | | 453.8 | | | 445.1 | |
| Holdbacks on Contracts | | | 16.0 | | | 18.4 | |
| Medicare and Out of Province Payments | | | 13.3 | | | 40.9 | |
| Health Services Liability Protection Plan | | | 11.4 | | | 9.7 | |
| Strategic Assistance | | | 1.6 | | | 0.9 | |
| Other | | | 88.8 | | | 115.5 | |
| | | | 584.9 | | | 630.5 | |
| | | | $ 2,482.1 | $ 2,518.3 | |
| 2014 | PROVINCE OF NEW BRUNSWICK | 72 |
| | | |
SCHEDULES TO THE CONSOLIDATED FINANCIAL STATEMENTS
31 March 2014
| | | | | |
| | (millions) |
| |
| | | | 2014 | | 2013 |
| |
| SCHEDULE 8 | | | | | |
| ALLOWANCE FOR LOSSES | | | | | |
| |
| Economic Development | | | $ 29.2 | | $ 33.0 |
| Agriculture, Aquaculture and Fisheries | | | 2.8 | | 13.0 |
| Contingent Liabilities – Guaranteed Loan | | | | | |
| Provision (Note 14(a)) | | | 32.0 | | 46.0 |
| |
| Property Tax Appeals | | | 9.3 | | 6.2 |
| Post-Secondary Education, Training and Labour | | | 0.3 | | 0.1 |
| | | | 9.6 | | 6.3 |
| | | | $ 41.6 | | $ 52.3 |
| |
| |
| SCHEDULE 9 | | | | | |
| DEFERRED REVENUE | | | | | |
| |
| Real Property Taxes | | | $ 367.2 | | $ 364.9 |
| Capital Contributions | | | 59.8 | | 101.8 |
| Motor Vehicle and Operators’ Licenses | | | 58.3 | | 57.2 |
| Other | | | 21.9 | | 21.6 |
| | | | $ 507.2 | | $ 545.5 |
| |
| |
| SCHEDULE 10 | | | | | |
| DEPOSITS HELD IN TRUST | | | | | |
| |
| New Brunswick Immigrant Investor Fund (2009) Ltd | | | $ 157.3 | | $ 100.4 |
| Retention Fund for Fee for Service Physicians | | | 43.5 | | 39.5 |
| Tenants’ Security Deposits | | | 22.2 | | 20.9 |
| Court of Queen’s Bench | | | 8.4 | | 8.2 |
| Mining Licenses – Non-Performance Renewal Fees | | | 7.5 | | 8.6 |
| Scholarship Trusts | | | 3.8 | | 3.9 |
| Contractors’ Deposits | | | 3.5 | | 5.2 |
| Family Support Order Services | | | 1.7 | | 1.4 |
| New Brunswick Crop Reinsurance | | | 1.1 | | 0.6 |
| Sale of Property for Taxes | | | 0.2 | | 0.2 |
| Metallic Minerals Tax | | - | - | | 0.2 |
| Other | | | 80.9 | | 51.4 |
| | | | $ 330.1 | | $ 240.5 |
| 2014 | PROVINCE OF NEW BRUNSWICK | 73 |
| | | |
SCHEDULES TO THE CONSOLIDATED FINANCIAL STATEMENTS
31 March 2014
(millions)
| | | | |
| | | 2014 | | 2013 |
| |
| SCHEDULE 11 | | | | |
| OBLIGATIONS UNDER CAPITAL LEASES | | | | |
| |
| Highways | | $ 638.8 | | $ 665.9 |
| Education | | 47.2 | | 47.9 |
| Protection | | 17.8 | | 68.6 |
| Other | | 12.4 | | 12.3 |
| | | $ 716.2 | | $ 794.7 |
| |
| |
| SCHEDULE 12 | | | | |
| INVENTORIES OF SUPPLIES | | | | |
| |
| Health Supplies and Vaccines | | $ 22.3 | | $ 24.4 |
| Construction and Maintenance Materials | | 12.7 | | 13.4 |
| Machine Repair Parts | | 5.1 | | 5.3 |
| Stationery and Supplies | | 1.5 | | 1.4 |
| Veterinary Supplies | | 1.0 | | 1.1 |
| Educational Textbooks | | 0.8 | | 0.8 |
| Other Supplies | | 4.6 | | 5.9 |
| | | $ 48.0 | | $ 52.3 |
| |
| |
| SCHEDULE 13 | | | | |
| PREPAID AND DEFERRED CHARGES | | | | |
| |
| Unamortized Premiums, Discounts, and | | | | |
| Issue Expenses on Debentures | | $ 145.2 | | $ 69.0 |
| Public Private Partnership Contracts | | 111.3 | | 133.5 |
| Deferred Financing Charges | | 6.3 | | 4.7 |
| Other | | 38.8 | | 42.8 |
| | | $ 301.6 | | $ 250.0 |
| 2014 | PROVINCE OF NEW BRUNSWICK | 74 |
| | | |
SCHEDULES TO THE CONSOLIDATED FINANCIAL STATEMENTS
31 March 2014
| | | | | | |
| | | | | (millions) | | |
| | | 2014 | | 2014 | | 2013 |
| | | Budget | | Actual | | Actual |
| |
| SCHEDULE 14 | | | | | | |
| TAXES | | | | | | |
| |
| Personal Income Tax | | $ 1416.0 | | $ 1,370.3 | | $ 1,223.8 |
| Corporate Income Tax | | 236.4 | | 222.8 | | 209.3 |
| Metallic Minerals Tax | | 2.0 | | 7.0 | | 12.3 |
| | | 1654.4 | | 1,600.1 | | 1,445.4 |
| |
| Provincial Real Property Tax | | 468.7 | | 438.1 | | 438.1 |
| |
| Harmonized Sales Tax | | 1,159.8 | | 1,061.8 | | 1,169.6 |
| Gasoline and Motive Fuels Tax | | 242.0 | | 240.1 | | 239.5 |
| Tobacco Tax | | 157.0 | | 152.9 | | 142.4 |
| Pari-Mutuel Tax | | 0.6 | | 0.5 | | 0.6 |
| | | 1,559.4 | | 1,455.3 | | 1,552.1 |
| |
| Insurance Premium Tax | | 47.2 | | 50.6 | | 49.6 |
| Financial Corporation Capital Tax | | 28.0 | | 27.8 | | 27.6 |
| Penalties and Interest | | 13.8 | | 13.0 | | 16.7 |
| Other | | 11.5 | | 10.4 | | 12.6 |
| | | 100.5 | | 101.8 | | 106.5 |
| | | 3,783.0 | | 3,595.3 | | 3,542.1 |
| |
| |
| SCHEDULE 15 | | | | | | |
| LICENSES AND PERMITS | | | | | | |
| |
| Motor Vehicle | | 122.8 | | 125.7 | | 120.0 |
| Fish and Wildlife | | 6.3 | | 6.5 | | 6.6 |
| Mines | | 1.8 | | 2.2 | | 2.0 |
| Liquor Licenses | | 1.0 | | 1.0 | | 1.0 |
| Other | | 15.8 | | 13.3 | | 15.0 |
| | | 147.7 | | 148.7 | | 144.6 |
| |
| SCHEDULE 16 | | | | | | |
| ROYALTIES | | | | | | |
| |
| Forest | | 72.7 | | 74.1 | | 67.3 |
| Mines | | 38.2 | | 16.8 | | 18.8 |
| | | 110.9 | | 90.9 | | 86.1 |
| 2014 | PROVINCE OF NEW BRUNSWICK | 75 |
| | | |
SCHEDULES TO THE CONSOLIDATED FINANCIAL STATEMENTS
31 March 2014
| | | | | | | | |
| | | | | (millions) | | | | |
| | | 2014 | | 2014 | | | 2013 | |
| | | Budget | | Actual | | | Actual | |
| |
| SCHEDULE 17 | | | | | | | | |
| INCOME FROM GOVERNMENT BUSINESS | | | | | | | | |
| ENTERPRISES | | | | | | | | |
| |
| New Brunswick Liquor Corporation | | $ 162.7 | | $ 161.3 | | | $ 164.1 | |
| New Brunswick Power Corporation | | - | | 55.0 | | | - | |
| add: regulatory deferral adjustment (note 7) | | - | | 5.7 | | | - | |
| New Brunswick Electric Finance Corporation | | 112.0 | | 00 | | | 17.8 | |
| New Brunswick Securities Commission | | 6.2 | | 00 | | | 7.9 | |
| Other Entities | | - | | (0.1 | ) | | (0.1 | ) |
| | | $ 280.9 | | $ 221.9 | | | $ 189.7 | |
| |
| SCHEDULE 18 | | | | | | | | |
| OTHER PROVINCIAL REVENUE | | | | | | | | |
| |
| Sales of Goods and Services | | | | | | | | |
| General | | $ 249.0 | | $ 254.4 | | | $ 222.8 | |
| Institutional | | 28.7 | | 31.4 | | | 30.3 | |
| Leases and Rentals | | 25.4 | | 23.3 | | | 23.3 | |
| Intergovernmental | | 22.8 | | 22.9 | | | 21.1 | |
| Provincial Parks | | 6.4 | | 6.1 | | | 6.0 | |
| Lotteries and Gaming | | 154.5 | | 144.4 | | | 144.8 | |
| Investment Income | | 47.4 | | 41.9 | | | 42.7 | |
| Fines and Penalties | | 11.4 | | 11.1 | | | 12.9 | |
| Other Revenue | | 61.5 | | 92.0 | | | 100.3 | |
| | | $ 607.1 | | $ 627.5 | | | $ 604.2 | |
| |
| SCHEDULE 19 | | | | | | | | |
| UNCONDITIONAL GRANTS | | | | | | | | |
| |
| Canada Health Transfer | | $ 664.0 | | $ 677.3 | | | $ 629.7 | |
| Canada Social Transfer | | 262.3 | | 264.3 | | | 257.2 | |
| Wait Times Reduction Transfer | | 5.3 | | 5.4 | | | 5.4 | |
| Statutory Subsidies | | 1.9 | | 1.9 | | | 1.9 | |
| | | $ 933.5 | | $ 948.9 | | | $ 894.2 | |
| 2014 | PROVINCE OF NEW BRUNSWICK | 76 |
| | | |
| | | | | | |
| | | | | (millions) | | |
| | | 2014 | | 2014 | | 2013 |
| | | Budget | | Actual | | Actual |
| |
| SCHEDULE 20 | | | | | | |
| CONDITIONAL GRANTS | | | | | | |
| |
| Education | | $ 146.8 | | $ 147.5 | | $ 126.6 |
| Economic Development | | 64.6 | | 69.2 | | 70.3 |
| Transportation | | 64.8 | | 62.9 | | 210.7 |
| Central Government Services | | 41.4 | | 40.5 | | 41.0 |
| Health | | 27.6 | | 27.2 | | 26.5 |
| Social Services | | 3.9 | | 3.9 | | 7.2 |
| Other | | 13.2 | | 12.6 | | 26.3 |
| | | $ 280.9 | | $ 221.9 | | $ 189.7 |
| |
| SCHEDULE 21 | | | | | | |
| EDUCATION AND TRAINING | | | | | | |
| |
| Education | | $ 1,113.4 | | $ 1,112.2 | | $ 1, 086.1 |
| Post Secondary Education Services | | 506.4 | | 506.8 | | 498.7 |
| Pension Expense | | 117.9 | | 143.2 | | 151.4 |
| Amortization Expense | | 40.0 | | 41.0 | | 38.8 |
| Public Works and Infrastructure | | 3.2 | | 10.4 | | 8.7 |
| Provision Expense | | 12.0 | | 5.7 | | 3.5 |
| General Government | | 2.0 | | 2.4 | | 0.4 |
| | | $ 1,794.9 | | $ 1,821.8 | | $ 1,787.6 |
| |
| SCHEDULE 22 | | | | | | |
| HEALTH | | | | | | |
| |
| Health Services | | $ 2,674.5 | | $ 2,652.2 | | $ 2,662.2 |
| Pension Expense | | 72.1 | | 71.8 | | 60.2 |
| Amortization Expense | | 59.6 | | 64.3 | | 63.7 |
| Public Works and Infrastructure | | - | | 1.6 | | - |
| | | $ 2,806.2 | | $ 2,789.9 | | $ 2,786.1 |
| 2014 | PROVINCE OF NEW BRUNSWICK | 77 |
| | | |
SCHEDULES TO THE CONSOLIDATED FINANCIAL STATEMENTS
31 March 2014
| | | | | | | | |
| | | | | | (millions) | | | |
| | | | 2014 | | 2014 | | | 2013 |
| | | | Budget | | Actual | | | Actual |
| |
| SCHEDULE 23 | | | | | | | | |
| SOCIAL DEVELOPMENT | | | | | | | | |
| |
| Social Development | | | $ 1,090.4 | | $ 1,070.8 | | | $ 1,045.6 |
| Provision Expense | | | 4.0 | | 3.5 | | | 5.0 |
| Amortization Expense | | | 1.9 | | 2.0 | | | 1.9 |
| General Government | | | 0.3 | | 0.3 | | | 0.3 |
| | | | $ 1,096.6 | | $ 1,076.6 | | | $ 1,052.8 |
| |
| SCHEDULE 24 | | | | | | | | |
| PROTECTION SERVICES | | | | | | | | |
| |
| Public Safety | | | $ 166.6 | | $ 165.4 | | | $ 168.6 |
| Justice | | | 46.5 | | 42.8 | | | 44.6 |
| Attorney General | | | 18.4 | | 17.6 | | | 17.0 |
| Pension Expense | | | 3.9 | | 5.3 | | | 4.1 |
| Amortization Expense | | | 0.1 | | 3.7 | | | 1.8 |
| General Government | | | 0.3 | | 0.3 | | | 0.3 |
| New Brunswick Credit Union Deposit | | | | | | | | |
| Insurance Corporation | | | 0.2 | | 0.2 | | | 0.2 |
| Public Works and Infrastructure | | - | - | | - | | | 0.2 |
| Provision Expense | | | 0.6 | | (0.1) | | | 0.5 |
| | | | $ 236.6 | | $ 235.2 | | | $ 237.3 |
| |
| SCHEDULE 25 | | | | | | | | |
| ECONOMIC DEVELOPMENT | | | | | | | | |
| |
| Economic Development | | | $ 174.9 | | $ 150.8 | | | $ 200.4 |
| Tourism, Heritage and Culture | | | 41.9 | | 41.9 | | | 36.6 |
| Provincial Holdings | | - | - | | 10.8 | | | 5.8 |
| Invest NB | | | 14.1 | | 7.0 | | | 4.7 |
| New Brunswick Immigrant Investor Fund (2009) Ltd. | | | 5.8 | | 5.2 | | | 5.0 |
| Provision Expense | | | 7.0 | | 5.4 | | | 5.8 |
| Post-Secondary Education, Training and Labour | | | 3.6 | | 3.9 | | | 4.1 |
| Kings Landing Corporation | | | 3.6 | | 3.5 | | | 3.7 |
| Amortization Expense | | | 1.2 | | 2.9 | | | 3.0 |
| | | | $ 252.1 | | $ 231.4 | | | $ 269.1 |
| 2014 | PROVINCE OF NEW BRUNSWICK | 78 |
| | | |
SCHEDULES TO THE CONSOLIDATED FINANCIAL STATEMENTS
31 March 2014
| | | | | | | | |
| | | | | | (millions) | | | |
| | | | 2014 | | 2014 | | 2013 | |
| | | | Budget | | Actual | | Actual | |
| |
| SCHEDULE 26 | | | | | | | | |
| LABOUR AND EMPLOYMENT | | | | | | | | |
| |
| Post-Secondary Education, Training and Labour | | | $ 125.6 | | $ 117.7 | | $ 99.9 | |
| General Government | | | 0.6 | | 0.6 | | 0.6 | |
| | | | $ 126.2 | | $ 118.3 | | $ 100.5 | |
| |
| SCHEDULE 27 | | | | | | | | |
| RESOURCES | | | | | | | | |
| |
| Natural Resources | | | $ 103.5 | | $ 103.4 | | $ 103.4 | |
| Agriculture and Aquaculture and Fisheries | | | 40.7 | | 36.6 | | 43.8 | |
| Environment | | | 26.6 | | 25.5 | | 23.5 | |
| Energy Efficiency and Conservation Agency of | | | | | | | | |
| New Brunswick | | | 11.6 | | 14.2 | | 16.7 | |
| Energy and Mines | | | 8.9 | | 8.8 | | 8.3 | |
| New Brunswick Agricultural Insurance Commission | | - | - | | 8.5 | | 9.9 | |
| Forest Protection Limited | | | 5.3 | | 5.2 | | 5.1 | |
| Recycle New Brunswick | | | 5.1 | | 4.9 | | 4.6 | |
| Energy and Utilities Board | | - | - | | 2.7 | | 2.1 | |
| Transportation and Infrastructure | | | 0.2 | | 1.3 | | 0.1 | |
| Amortization Expense | | | 1.2 | | 1.2 | | 1.3 | |
| Provision Expense | | | 3.3 | | 0.4 | | (1.4) | |
| | | | $ 206.4 | | $ 212.7 | | $ 217.4 | |
| |
| SCHEDULE 28 | | | | | | | | |
| TRANSPORTATION AND INFRASTRUCTURE | | | | | | | | |
| |
| Transportation and Infrastructure | | | $ 308.8 | | $ 324.4 | | $ 312.9 | |
| Amortization Expense | | | 252.3 | | 252.8 | | 234.2 | |
| Provision Expense | | | 0.3 | | 0.7 | | 0.6 | |
| | | | $ 561.4 | | $ 577.9 | | $ 547.7 | |
| 2014 | PROVINCE OF NEW BRUNSWICK | 79 |
| | | |
SCHEDULES TO THE CONSOLIDATED FINANCIAL STATEMENTS
31 March 2014
| | | | | | | | | |
| | | | | | (millions) | | | | |
| | | | 2014 | | 2014 | | | 2013 | |
| | | | Budget | | Actual | | | Actual | |
| |
| SCHEDULE 29 | | | | | | | | | |
| GENERAL GOVERNMENT | | | | | | | | | |
| |
| |
| Pension Expense | | | $ 229.4 | | $ 145.1 | | | $ 219.4 | |
| Local Government | | | 121.4 | | 113.4 | | | 113.1 | |
| General Government | | | 169.7 | | 92.2 | | | 129.9 | |
| Service New Brunswick | | | 59.6 | | 55.8 | | | 57.3 | |
| Legislative Assembly | | | 23.1 | | 22.6 | | | 26.6 | |
| New Brunswick Internal Services Agency | | | 24.9 | | 22.4 | | | 20.1 | |
| Finance | | | 21.1 | | 18.7 | | | 17.4 | |
| Executive Council | | | 18.4 | | 16.7 | | | 16.7 | |
| Healthy and Inclusive Communities | | | 17.8 | | 16.6 | | | 13.2 | |
| Government Services | | | 11.6 | | 10.2 | | | 11.4 | |
| New Brunswick Investment Management Corporation | | | 10.2 | | 10.1 | | | 9.0 | |
| Financial and Consumer Services Commission | | - | - | | 8.4 | | | - | |
| Amortization Expense | | | 4.9 | | 5.3 | | | 5.2 | |
| Human Resources | | | 4.0 | | 3.7 | | | 3.3 | |
| New Brunswick Lotteries and Gaming Coporation | | | 6.4 | | 5.4 | | | 2.8 | |
| Office of the Premier | | | 1.6 | | 1.6 | | | 1.6 | |
| Public Works and Infrastructure | | | 0.1 | | - | | | 0.4 | |
| Algonquin Golf and Algonquin Properties | | - | - | | (0.4) | | | 0.2 | |
| Provision Expense | | | 4.0 | | (11.3) | | | (11.0) | |
| | | | $ 728.2 | | $ 536.5 | | | $ 636.6 | |
| 2014 | PROVINCE OF NEW BRUNSWICK | 80 |
| | | |