Department of
Finance
Third Quarter Report
2014-2015
Hon. Roger Melanson
Minister of Finance
February 2015
2014-2015 Third Quarter Report
Published by:
Department of Finance
Government of New Brunswick
P.O. Box 6000
Fredericton, New Brunswick
E3B 5H1
Canada
Internet: www.gnb.ca/finance
February 2015
Translation:
Translation Bureau, Government Services
ISBN 978-1-4605-0498-7
 | Think Recycling! |
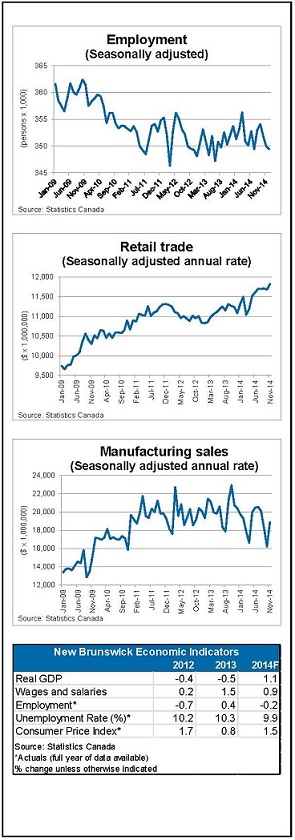
2014 Economic Update | | ● The International Monetary Fund (IMF) is forecasting global economic growth of 3.3 per cent in 2014. This is unchanged from its forecast in the fall edition of its World Economic Outlook, but down from their original forecast. ● U.S. real GDP increased at an annual rate of 5.0 per cent in the third quarter of 2014, building on the gain of 4.6 per cent in the second quarter. Weakness in Q1 has now largely been offset, and growth is back on par with beginning-of-the-year expectations. The IMF is projecting growth of 2.4 per cent for 2014. ● As of third quarter, Canadian real GDP is up 2.6 per cent over prior year levels. The slowing in global economic growth has delayed the expected pickup in exports and business investment. ● The Department of Finance projects real GDP growth of 1.1 per cent for 2014. This compares to the consensus among private sector forecasters of 1.0 per cent for 2014. ● Employment declined by 0.2 per cent in 2014 – the fifth decline in six years. Gains in full- time employment (+0.2%) were not sufficient to offset the decline in part-time employment (-2.1%). Minimal growth was observed in the services- producing sector (+0.3%), while an overall decline was observed in the goods-producing sector (-2.1%). ● Exports (-9.6%) and manufacturing (-6.3%) were impacted by maintenance activity at the Saint John Refinery, as well as by a sharp decline in the price of refined oil products. ● Average weekly earnings are up 3.0 per cent on a year-to-date basis - above the national growth rate of 2.7 per cent. ● Consumer spending continues to show improvement, with retail trade up 3.6 per cent on a year-to-date basis. ● Consumer inflation in the province averaged 1.5 per cent for 2014 - below the national growth rate of 2.0 per cent.
|
2014-2015 Fiscal Update
Based on third quarter information, there is a projected deficit of $255.4 million for 2014- 2015. This is an improvement of $135.7 million compared to the budget deficit of $391.1 million. The improvement is mainly due to $155.5 million in one-time or extraordinary revenue that will not recur.
Net debt is projected to increase $377.1 million year-over-year, a decrease of $153.6 million from the budget estimate of $530.7 million.
Revenue:
Revenue is $218.3 million higher than budget, including $155.5 million in one-time revenue that will not recur. The major variances include:
| · | Harmonized Sales Tax is projected to increase $93.3 million from budget due to positive prior-year adjustments including increases to the national revenue pool, on which HST payments are based. |
| · | Conditional Grants are up $61.1 million mainly due to federal recoveries for Disaster Financial Assistance and one-time funding for New Brunswick related to joining the Cooperative Capital Markets Regulatory System. |
| · | Return on Investment is up $39.3 million primarily as a result of higher projected net income for NB Power. NB Power’s net income increased mainly due to the transition to a shared risk pension plan and investment gains on funds invested for future nuclear decommissioning and used fuel management. This was partially offset by costs related to post-tropical storm Arthur and a longer than expected planned maintenance outage at the Point Lepreau Nuclear Station. |
| · | Metallic Minerals Tax revenue is higher by $16.9 million due to tax audits. |
| · | Special Operating Agency revenue is up $16.4 million mostly due to the new Canada/New Brunswick Federal Gas Tax Fund. |
| · | Personal Income Tax is higher by $12.0 million attributable to an anticipated positive prior- year adjustment related to the 2013 taxation year. |
| · | Provincial Real Property Tax revenue is anticipated to be lower by $15.3 million due to changes in the assessment base, partially offset by the impact of the provincial property tax for New Brunswick businesses returning to the 2012 rate, effective for the 2015 taxation year. |
| · | Corporate Income Tax is lower by $13.1 million attributable to an anticipated negative prior-year adjustment related to the 2013 taxation year. |
| · | Tobacco Tax is down an estimated $10.7 million as a result of lower sales. |
Expense:
Total expenses are projected to be $82.5 million higher than budget. It should be noted, however, that there are more than $60 million of increased expenses which are fully offset by additional revenues.
The major variances include the following:
| · | Education and Early Childhood Development ($32.7 million over): Mainly due to a projected over-expenditure in the Elementary and Secondary Education program as a result of planned improvement and reduction initiatives not being implemented. |
| · | General Government ($6.0 million under): Primarily due to lower than budgeted provision for losses, partially offset by increased expenditures by consolidated entities. |
| · | Health ($34.1 million under): Mainly due to projected under-expenditures in pharmaceutical programs. This is partially offset by a projected over-expenditure in the Medicare program. |
| · | Invest NB ($9.1 million under): Lower than anticipated demand under the Strategic Assistance Program. |
| · | Public Safety ($28.4 million over): Primarily due to Disaster Financial Assistance funding in relation to the spring 2014 flooding and post-tropical storm Arthur. This is partially offset by additional federal revenue. |
| · | Social Development ($5.0 million over): Due to lower than anticipated social assistance caseload decline, implementation delays in achieving efficiencies, and higher than anticipated funding for nursing homes. This is partially offset by a projected under- expenditure related to delays in the Affordable Rental Housing Program. |
| · | Transportation and Infrastructure ($8.7 million over): Primarily due to various cost pressures including Winter Maintenance and increased repairs required under the Summer Maintenance program due to the difficult winter in the prior year. |
| · | Capital Account expense ($27.9 million over): Higher than budgeted capital work to be expensed rather than amortized, including significant weather-related events such as the spring 2014 flooding and post-tropical storm Arthur. |
| · | Special Operating Agencies ($14.7 million over): Projected increased expenditures in various Special Operating Agencies, including the new Canada / New Brunswick Federal Gas Tax Fund. These are fully offset by increased revenue and therefore have no impact on the deficit. |
COMPARATIVE STATEMENT OF SURPLUS OR DEFICIT
Thousands
$
| | | Year Ending March 31 | | | Variance | |
| | | 2015 | | | 2015 | | | 2015 | | | from | |
| | | Estimate | | | 2nd Quarter | | | 3rd Quarter | | | Estimate | |
| Revenue | | | | | | | | | | | | |
| Ordinary Account | | | 7,677,344 | | | | 7,741,152 | | | | 7,876,890 | | | | 199,546 | |
| Capital Account | | | 56,311 | | | | 55,235 | | | | 54,927 | | | | (1,384 | ) |
| Special Purpose Account | | | 62,007 | | | | 61,791 | | | | 65,711 | | | | 3,704 | |
| Special Operating Agencies (net) | | | 44,727 | | | | 60,705 | | | | 61,162 | | | | 16,435 | |
| Sinking Fund Earnings | | | 195,700 | | | | 195,700 | | | | 195,700 | | | | 0 | |
| Total Revenue | | | 8,036,089 | | | | 8,114,583 | | | | 8,254,390 | | | | 218,301 | |
| | | | | | | | | | | | | | | | | |
| Expense | | | | | | | | | | | | | | | | |
| Ordinary Account | | | 7,894,060 | | | | 7,947,787 | | | | 7,930,553 | | | | 36,493 | |
| Capital Account | | | 41,926 | | | | 48,144 | | | | 69,829 | | | | 27,903 | |
| Special Purpose Account | | | 69,656 | | | | 70,235 | | | | 70,373 | | | | 717 | |
| Special Operating Agencies (net) | | | 32,448 | | | | 34,917 | | | | 47,150 | | | | 14,702 | |
| Amortization of Tangible Capital Assets | | | 389,124 | | | | 390,670 | | | | 391,837 | | | | 2,713 | |
| Total Expense | | | 8,427,214 | | | | 8,491,753 | | | | 8,509,742 | | | | 82,528 | |
| | | | | | | | | | | | | | | | | |
| Surplus (Deficit) | | | (391,125 | ) | | | (377,170 | ) | | | (255,352 | ) | | | 135,773 | |
COMPARATIVE STATEMENT OF ORDINARY ACCOUNT REVENUE BY SOURCE
Thousands
$
| | | Year Ending March 31 | | | Variance | |
| | | 2015 | | | 2015 | | | 2015 | | | from | |
| | | Estimate | | | 2nd Quarter | | | 3rd Quarter | | | Estimate | |
| Taxes | | | | | | | | | | | | |
| Personal Income Tax | | | 1,508,000 | | | | 1,508,000 | | | | 1,520,000 | | | | 12,000 | |
| Corporate Income Tax | | | 251,000 | | | | 240,200 | | | | 237,900 | | | | (13,100 | ) |
| Metallic Minerals Tax | | | 0 | | | | 6,300 | | | | 16,866 | | | | 16,866 | |
| Provincial Real Property Tax | | | 481,300 | | | | 460,000 | | | | 466,000 | | | | (15,300 | ) |
| Harmonized Sales Tax | | | 1,146,500 | | | | 1,135,100 | | | | 1,239,800 | | | | 93,300 | |
| Gasoline and Motive Fuels Tax | | | 240,000 | | | | 240,000 | | | | 240,000 | | | | 0 | |
| Tobacco Tax | | | 150,700 | | | | 141,500 | | | | 140,000 | | | | (10,700 | ) |
| Pari-Mutuel Tax | | | 600 | | | | 600 | | | | 600 | | | | 0 | |
| Insurance Premium Tax | | | 47,205 | | | | 51,954 | | | | 51,954 | | | | 4,749 | |
| Real Property Transfer Tax | | | 13,000 | | | | 12,000 | | | | 12,000 | | | | (1,000 | ) |
| Large Corporation Capital Tax | | | 0 | | | | 0 | | | | 1,300 | | | | 1,300 | |
| Financial Corporation Capital Tax | | | 27,000 | | | | 27,000 | | | | 27,000 | | | | 0 | |
| Sub-total: Taxes | | | 3,865,305 | | | | 3,822,654 | | | | 3,953,420 | | | | 88,115 | |
| | | | | | | | | | | | | | | | | |
| Return on Investment | | | 253,994 | | | | 282,933 | | | | 293,343 | | | | 39,349 | |
| Licences and Permits | | | 138,843 | | | | 138,390 | | | | 138,469 | | | | (374 | ) |
| Sale of Goods and Services | | | 291,607 | | | | 288,397 | | | | 296,041 | | | | 4,434 | |
| Lottery and Gaming Revenues | | | 145,730 | | | | 147,227 | | | | 141,213 | | | | (4,517 | ) |
| Royalties | | | 94,255 | | | | 98,655 | | | | 92,980 | | | | (1,275 | ) |
| Fines and Penalties | | | 8,164 | | | | 8,070 | | | | 8,088 | | | | (76 | ) |
| Miscellaneous | | | 48,315 | | | | 53,261 | | | | 57,143 | | | | 8,828 | |
| | | | | | | | | | | | | | | | | |
| TOTAL: OWN SOURCE REVENUE | | | 4,846,213 | | | | 4,839,587 | | | | 4,980,697 | | | | 134,484 | |
| | | | | | | | | | | | | | | | | |
| Unconditional Grants – Canada | | | | | | | | | | | | | | | | |
| Fiscal Equalization Payments | | | 1,665,950 | | | | 1,665,950 | | | | 1,665,950 | | | | 0 | |
| Canada Health Transfer | | | 682,400 | | | | 686,700 | | | | 686,700 | | | | 4,300 | |
| Canada Social Transfer | | | 267,500 | | | | 267,500 | | | | 267,200 | | | | (300 | ) |
| Wait Times Reduction Transfer | | | 0 | | | | 0 | | | | 0 | | | | 0 | |
| Other | | | 1,866 | | | | 1,866 | | | | 1,866 | | | | 0 | |
| Sub-total: Unconditional Grants – Canada | | | 2,617,716 | | | | 2,622,016 | | | | 2,621,716 | | | | 4,000 | |
| | | | | | | | | | | | | | | | | |
| Conditional Grants – Canada | | | 213,415 | | | | 279,549 | | | | 274,477 | | | | 61,062 | |
| | | | | | | | | | | | | | | | | |
| TOTAL: GRANTS FROM CANADA | | | 2,831,131 | | | | 2,901,565 | | | | 2,896,193 | | | | 65,062 | |
| | | | | | | | | | | | | | | | | |
| TOTAL: GROSS ORDINARY REVENUE | | | 7,677,344 | | | | 7,741,152 | | | | 7,876,890 | | | | 199,546 | |
COMPARATIVE STATEMENT OF ORDINARY ACCOUNT EXPENSE
Thousands
$
| | | Year Ending March 31 | | | | | | | |
| | | 2015 | | | 2015 | | | 2015 | | | Variance | |
| DEPARTMENT | | Estimate | | | 2nd Quarter | | | 3rd Quarter | | | from Estimate | |
| | | | | | | | | | | | | | | $ | | % |
| Agriculture, Aquaculture and Fisheries | | | 36,564 | | | | 37,564 | | | | 36,484 | | | | (80 | ) | | | -0.2 | % |
| Economic Development | | | 98,039 | | | | 98,039 | | | | 113,389 | | | | 15,350 | | | | 15.7 | % |
| Education and Early Childhood Development | | | 1,085,771 | | | | 1,123,432 | | | | 1,118,457 | | | | 32,686 | | | | 3.0 | % |
| Efficiency New Brunswick | | | 8,699 | | | | 11,699 | | | | 12,199 | | | | 3,500 | | | | 40.2 | % |
| Energy and Mines | | | 9,130 | | | | 9,130 | | | | 8,630 | | | | (500 | ) | | | -5.5 | % |
| Environment and Local Government | | | 136,903 | | | | 136,001 | | | | 136,853 | | | | (50 | ) | | | 0.0 | % |
| Executive Council Office | | | 17,247 | | | | 17,247 | | | | 17,097 | | | | (150 | ) | | | -0.9 | % |
| Finance | | | 17,967 | | | | 17,917 | | | | 17,567 | | | | (400 | ) | | | -2.2 | % |
| General Government | | | 801,776 | | | | 794,491 | | | | 795,803 | | | | (5,973 | ) | | | -0.7 | % |
| Government Services | | | 54,961 | | | | 59,010 | | | | 59,010 | | | | 4,049 | | | | 7.4 | % |
| Health | | | 2,588,308 | | | | 2,559,464 | | | | 2,554,230 | | | | (34,078 | ) | | | -1.3 | % |
| Healthy and Inclusive Communities | | | 18,537 | | | | 18,037 | | | | 17,837 | | | | (700 | ) | | | -3.8 | % |
| Human Resources | | | 3,514 | | | | 3,489 | | | | 3,464 | | | | (50 | ) | | | -1.4 | % |
| Invest NB | | | 17,638 | | | | 17,638 | | | | 8,513 | | | | (9,125 | ) | | | -51.7 | % |
| Justice | | | 42,699 | | | | 42,619 | | | | 42,449 | | | | (250 | ) | | | -0.6 | % |
| Legislative Assembly | | | 30,001 | | | | 31,921 | | | | 31,260 | | | | 1,259 | | | | 4.2 | % |
| Natural Resources | | | 101,096 | | | | 102,096 | | | | 100,596 | | | | (500 | ) | | | -0.5 | % |
| Office of the Attorney General | | | 18,178 | | | | 18,558 | | | | 18,378 | | | | 200 | | | | 1.1 | % |
| Office of the Premier | | | 1,628 | | | | 1,628 | | | | 1,628 | | | | 0 | | | | 0.0 | % |
| Post-Secondary Education, Training and Labour | | | 593,812 | | | | 595,755 | | | | 596,266 | | | | 2,454 | | | | 0.4 | % |
| Public Safety | | | 145,468 | | | | 173,710 | | | | 173,865 | | | | 28,397 | | | | 19.5 | % |
| Service of the Public Debt | | | 685,000 | | | | 685,000 | | | | 680,000 | | | | (5,000 | ) | | | -0.7 | % |
| Social Development | | | 1,092,059 | | | | 1,100,359 | | | | 1,097,089 | | | | 5,030 | | | | 0.5 | % |
| Tourism, Heritage and Culture | | | 41,218 | | | | 41,053 | | | | 41,113 | | | | (105 | ) | | | -0.3 | % |
| Transportation and Infrastructure | | | 273,447 | | | | 283,072 | | | | 282,141 | | | | 8,694 | | | | 3.2 | % |
| | | | | | | | | | | | | | | | | | | | | |
| Subtotal | | | 7,919,660 | | | | 7,978,929 | | | | 7,964,318 | | | | 44,658 | | | | 0.6 | % |
| | | | | | | | | | | | | | | | | | | | | |
| Tangible Capital Assets and Interaccount | | | | | | | | | | | | | | | | | | | | |
| Transactions | | | (25,600 | ) | | | (31,142 | ) | | | (33,765 | ) | | | (8,165 | ) | | | 31.9 | % |
| | | | | | | | | | | | | | | | | | | | | |
| ORDINARY ACCOUNT EXPENSE | | | 7,894,060 | | | | 7,947,787 | | | | 7,930,553 | | | | 36,493 | | | | 0.5 | % |
COMPARATIVE STATEMENT OF CHANGE IN NET DEBT
Thousands
$
| | | Year Ending March 31 | | | Variance | |
| | | 2015 | | | 2015 | | | 2015 | | | from | |
| | | Estimate | | | 2nd Quarter | | | 3rd Quarter | | | Estimate | |
| Surplus (Deficit) | | | (391,125 | ) | | | (377,170 | ) | | | (255,352 | ) | | | 135,773 | |
| Acquisition of Tangible Capital Assets | | | (528,705 | ) | | | (525,929 | ) | | | (513,591 | ) | | | 15,114 | |
| Amortization of Tangible Capital Assets | | | 389,124 | | | | 390,670 | | | | 391,837 | | | | 2,713 | |
| | | | | | | | | | | | | | | | | |
| (Increase) Decrease in Net Debt | | | (530,706 | ) | | | (512,429 | ) | | | (377,106 | ) | | | 153,600 | |
9