
Department of
Finance
Economic and Fiscal Update
Second Quarter Projections
2015-2016
Economic and Fiscal Update
Second Quarter Projections
2015-2016
Published by:
Department of Finance
Government of New Brunswick
P.O. Box 6000
Fredericton, New Brunswick
E3B 5H1
Canada
Internet: www.gnb.ca/finance November 2015
Translation:
Translation Bureau, Government Services
ISBN 978-1-4605-0506-9
 | Think Recycling! |
2015 Economic Update | | | |
| | · | The International Monetary Fund (IMF) is forecasting global economic growth of 3.1 per cent in 2015. This is a downgrade from its forecast in the July edition of its World Economic Outlook. |
| | |
| · | U.S. real GDP increased at an annual rate of 3.9 per cent in the second quarter of 2015, which represents an improvement over first quarter activity. Despite recent improvement, growth for the year remains below initial projections. |
| | |
| · | According to Statistics Canada, economic activity at the national level declined during the first five months of the year. A decline in oil prices has undermined positive expectations regarding investment and exports. |
| | |
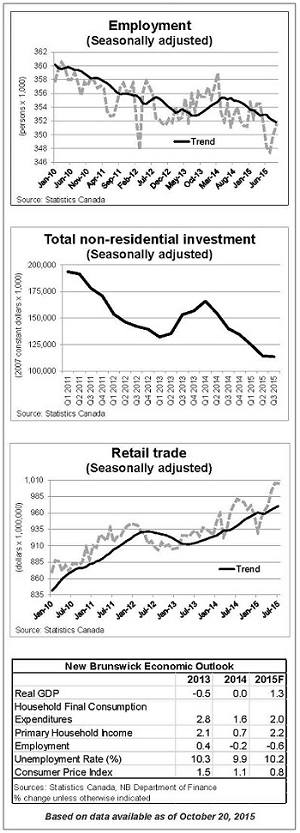
| · | The Department of Finance now projects real GDP growth for New Brunswick of 1.3 per cent for 2015. This is consistent with the consensus among private sector forecasters. |
| | |
| · | The current forecast reflects weaker growth at the national and global level, a decline in manufacturing sales, slower-than-expected growth in investment and continued weakness in the labour market. |
| | |
| · | Some positive drivers remain and include growth in income and retail sales, as well as a supportive exchange rate. |
| | |
| · | Exports (-2.8%) and manufacturing (-7.8%) have both weakened in recent months. Wood products manufacturing remains a bright spot, posting growth of 4.1%. |
| | |
| · | Three-quarters of the way through 2015, employment is down by 1.0 per cent over the year prior. Weakness remains concentrated in the goods sector (-6.0%), while growth in the services- producing sector has been modest (+0.4%). |
| | |
| · | Despite weak employment conditions, average weekly earnings are up 3.1 per cent on a year-to-date basis - above the national growth rate of 2.2 per cent. |
| | |
| · | Consumer spending continues to show improvement, with retail trade up 2.3 per cent on a year-to-date basis. Excluding gasoline station sales, retail trade is up 5.5 per cent. |
| | |
| | |
| | |
| | |
| | |
| | |
| | |
| | |
| | |
| | |
| | |
| | |
|
|
|
|
|
|
2015-2016 Fiscal Update
Based on second quarter information, there is a projected deficit of $453.1 million for 2015-2016. This is an improvement of $23.7 million compared to the budget deficit of $476.8 million.
Net debt is projected to increase by $569.0 million, an improvement of $16.5 million from budget. Net debt is projected to reach $12,991 million by March 31, 2016.
Revenue:
Revenue is $37.1 million higher than budget. The major variances include:
· | Personal Income Tax is higher by $34.0 million attributable to an anticipated underpayment for the 2014 taxation year, which also positively impacts the forecast base for 2015. This counteracts weakness in the economy. |
| |
· | Miscellaneous Revenue is up $11.8 million mainly due to increased revenue from the Regional Health Authorities. |
| |
· | Provincial Real Property Tax is up $10.0 million due to base improvements in the previous year. |
| |
· | Gasoline and Motive Fuels Tax is up $7.8 million due to higher than anticipated gasoline volumes. |
| |
· | Conditional Grants are up $5.0 million predominantly due to federal recoveries for Disaster Financial Assistance. |
| |
· | Tobacco Tax is up $4.2 million as a result of stronger than anticipated volumes. |
| |
· | Return on Investment is down $33.3 million primarily as a result of lower projected net income for NB Power. This is mainly due to unanticipated generation station outages, low water levels for hydro-electric power generation and investment market volatility. |
Expense:
Total expenses were $13.4 million higher than budget.
The major variances include the following:
· | General Government ($7.0 million over): Mainly due to higher than budgeted expenses under Revenue Sharing Agreements with First Nations. |
| |
· | Opportunities New Brunswick ($5.5 million under): Mainly due to lower than anticipated financial assistance to companies. |
| |
· | Public Safety ($12.3 million over): Due to higher than budgeted expenses under the Disaster Financial Assistance program associated with storm and flood events that occurred in 2014, as well as costs associated with damages from the heavy rain event in the fall of 2015. These expenses are partially offset by increased recoveries from the federal government. |
| |
· | Social Development ($7.9 million over): Mainly due to higher than anticipated program delivery costs and the previously announced changes with respect to nursing home funding policies. These increased costs are partially offset by savings in other areas. |
| |
· | Tourism, Heritage and Culture ($2.4 million over): Due to costs associated with the completion of an archaeological impact assessment for the proposed Sisson Mine project. |
| |
· | Special Operating Agency Account ($5.7 million under): Mainly due to lower than anticipated expenses in the Regional Development Corporation Special Operating Agency due to project timing changes from budget. |
PROVINCE OF NEW BRUNSWICK
FISCAL UPDATE
Thousands
$
| | | 2015-2016 Budget | | | 2015-2016 1st Quarter Projection | | | 2015-2016 2nd Quarter Projection | | | Variance from Budget | |
| | | | | | | | | | | | | |
Revenue | | | | | | | | | | | | |
Ordinary Account | | | 7,984,551 | | | | 7,991,662 | | | | 8,023,185 | | | | 38,634 | |
Capital Account | | | 10,705 | | | | 8,424 | | | | 8,424 | | | | (2,281 | ) |
Special Purpose Account | | | 61,342 | | | | 61,104 | | | | 63,006 | | | | 1,664 | |
Special Operating Agencies | | | 57,634 | | | | 57,251 | | | | 56,762 | | | | (872 | ) |
Sinking Fund Earnings | | | 193,700 | | | | 193,700 | | | | 193,700 | | | | 0 | |
Total Revenue | | | 8,307,932 | | | | 8,312,141 | | | | 8,345,077 | | | | 37,145 | |
| | | | | | | | | | | | | | | | | |
Expense | | | | | | | | | | | | | | | | |
Ordinary Account | | | 8,007,021 | | | | 8,005,301 | | | | 8,029,174 | | | | 22,153 | |
Capital Account | | | 82,903 | | | | 85,067 | | | | 80,595 | | | | (2,308 | ) |
Special Purpose Account | | | 74,228 | | | | 74,205 | | | | 74,297 | | | | 69 | |
Special Operating Agencies | | | 53,372 | | | | 52,512 | | | | 47,638 | | | | (5,734 | ) |
Amortization of Tangible Capital Assets | | | 417,238 | | | | 415,652 | | | | 416,507 | | | | (731 | ) |
Total Expense | | | 8,634,762 | | | | 8,632,737 | | | | 8,648,211 | | | | 13,449 | |
| | | | | | | | | | | | | | | | | |
Contingency Reserve | | | (150,000 | ) | | | (150,000 | ) | | | (150,000 | ) | | | 0 | |
| | | | | | | | | | | | | | | | | |
Surplus (Deficit) | | | (476,830 | ) | | | (470,596 | ) | | | (453,134 | ) | | | 23,696 | |
CHANGE IN NET DEBT
Thousands
$
| | | 2015-2016 Budget | | | 2015-2016 1st Quarter Projection | | | 2015-2016 2nd Quarter Projection | | | Variance from Budget | |
| | | | | | | | | | | | | |
Net Debt - Beginning of Year | | | (12,018,306 | ) | | | (12,018,306 | ) | | | (12,421,892 | ) | | | (403,586 | ) |
| | | | | | | | | | | | | | | | | |
Changes in Year | | | | | | | | | | | | | | | | |
| | | | | | | | | | | | | | | | | |
Surplus (Deficit) | | | (476,830 | ) | | | (470,596 | ) | | | (453,134 | ) | | | 23,696 | |
| | | | | | | | | | | | | | | | | |
Investments in Tangible Capital Assets | | | (525,898 | ) | | | (528,911 | ) | | | (532,325 | ) | | | (6,427 | ) |
| | | | | | | | | | | | | | | | | |
Amortization of Tangible Capital Assets | | | 417,238 | | | | 415,652 | | | | 416,507 | | | | (731 | ) |
| | | | | | | | | | | | | | | | | |
(Increase) Decrease in Net Debt | | | (585,490 | ) | | | (583,855 | ) | | | (568,952 | ) | | | 16,538 | |
| | | | | | | | | | | | | | | | | |
Net Debt - End of Year | | | (12,603,796 | ) | | | (12,602,161 | ) | | | (12,990,844 | ) | | | (387,048 | ) |
At second quarter, Net Debt - Beginning of Year has been updated to reflect the ending net debt that was published in the 2014-2015 Consolidated Financial Statements (Public Accounts Volume I).
APPENDIX A
ORDINARY ACCOUNT REVENUE BY SOURCE
Thousands
$
| | 2015-2016 | | | 2015-2016 1st Quarter | | | 2015-2016 2nd Quarter | | | Variance from | |
| | Budget | | | Projection | | | Projection | | | Budget | |
| | | | | | | | | | | | | |
Taxes | | | | | | | | | | | | |
Personal Income Tax | | | 1,587,000 | | | | 1,582,000 | | | | 1,621,000 | | | | 34,000 | |
Corporate Income Tax | | | 258,000 | | | | 258,000 | | | | 258,000 | | | | 0 | |
Provincial Real Property Tax | | | 488,100 | | | | 498,100 | | | | 498,100 | | | | 10,000 | |
Harmonized Sales Tax | | | 1,184,200 | | | | 1,184,200 | | | | 1,184,200 | | | | 0 | |
Gasoline and Motive Fuels Tax | | | 268,200 | | | | 270,200 | | | | 276,000 | | | | 7,800 | |
Tobacco Tax | | | 135,800 | | | | 135,800 | | | | 140,000 | | | | 4,200 | |
Pari-Mutuel Tax | | | 600 | | | | 600 | | | | 420 | | | | (180 | ) |
Insurance Premium Tax | | | 53,546 | | | | 53,546 | | | | 52,229 | | | | (1,317 | ) |
Real Property Transfer Tax | | | 12,000 | | | | 12,000 | | | | 13,000 | | | | 1,000 | |
Financial Corporation Capital Tax | | | 27,000 | | | | 27,000 | | | | 27,000 | | | | 0 | |
Penalties and Interest | | | 13,000 | | | | 13,000 | | | | 13,000 | | | | 0 | |
Subtotal - Taxes | | | 4,027,446 | | | | 4,034,446 | | | | 4,082,949 | | | | 55,503 | |
| | | | | | | | | | | | | | | | | |
Return on Investment | | | 295,765 | | | | 283,160 | | | | 262,481 | | | | (33,284 | ) |
Licences and Permits | | | 148,333 | | | | 148,019 | | | | 147,902 | | | | (431 | ) |
Sale of Goods and Services | | | 325,187 | | | | 324,221 | | | | 323,120 | | | | (2,067 | ) |
Lottery and Gaming Revenues | | | 140,300 | | | | 139,900 | | | | 141,900 | | | | 1,600 | |
Royalties | | | 107,230 | | | | 107,230 | | | | 105,830 | | | | (1,400 | ) |
Fines and Penalties | | | 8,165 | | | | 8,165 | | | | 8,178 | | | | 13 | |
Miscellaneous | | | 61,189 | | | | 72,407 | | | | 73,035 | | | | 11,846 | |
| | | | | | | | | | | | | | | | | |
Total - Own Source Revenue | | | 5,113,615 | | | | 5,117,548 | | | | 5,145,395 | | | | 31,780 | |
| | | | | | | | | | | | | | | | | |
Unconditional Grants – Canada | | | | | | | | | | | | | | | | |
Fiscal Equalization Payments | | | 1,668,900 | | | | 1,668,900 | | | | 1,668,900 | | | | 0 | |
Canada Health Transfer | | | 717,800 | | | | 717,800 | | | | 719,900 | | | | 2,100 | |
Canada Social Transfer | | | 273,400 | | | | 273,400 | | | | 272,900 | | | | (500 | ) |
Other | | | 1,866 | | | | 1,866 | | | | 1,866 | | | | 0 | |
Subtotal - Unconditional Grants – Canada | | | 2,661,966 | | | | 2,661,966 | | | | 2,663,566 | | | | 1,600 | |
| | | | | | | | | | | | | | | | | |
Conditional Grants – Canada | | | 219,252 | | | | 222,143 | | | | 224,219 | | | | 4,967 | |
| | | | | | | | | | | | | | | | | |
Total - Grants from Canada | | | 2,881,218 | | | | 2,884,109 | | | | 2,887,785 | | | | 6,567 | |
| | | | | | | | | | | | | | | | | |
Subtotal | | | 7,994,833 | | | | 8,001,657 | | | | 8,033,180 | | | | 38,347 | |
| | | | | | | | | | | | | | | | | |
Inter-account Transactions | | | (10,282 | ) | | | (9,995 | ) | | | (9,995 | ) | | | 287 | |
| | | | | | | | | | | | | | | | | |
Ordinary Account Revenue | | | 7,984,551 | | | | 7,991,662 | | | | 8,023,185 | | | | 38,634 | |
APPENDIX B
ORDINARY ACCOUNT EXPENSE
Thousands
$
| | | 2015-2016 | | | 2015-2016 1st Quarter | | | 2015-2016 2nd Quarter | | | Variance from | | | | |
| | | Budget | | | Projection | | | Projection | | | Budget | | | % | |
DEPARTMENT | | | | | | | | | | | | | | | |
Agriculture, Aquaculture and Fisheries | | | 37,495 | | | | 37,495 | | | | 37,495 | | | | 0 | | | | 0.0 | % |
Education and Early Childhood Development | | | 1,118,623 | | | | 1,118,623 | | | | 1,118,623 | | | | 0 | | | | 0.0 | % |
Energy and Mines | | | 8,617 | | | | 8,617 | | | | 8,617 | | | | 0 | | | | 0.0 | % |
Environment and Local Government | | | 139,381 | | | | 139,381 | | | | 139,381 | | | | 0 | | | | 0.0 | % |
Executive Council Office | | | 19,148 | | | | 19,038 | | | | 19,023 | | | | (125 | ) | | | -0.7% | |
Finance | | | 17,282 | | | | 17,182 | | | | 17,132 | | | | (150 | ) | | | -0.9% | |
General Government | | | 554,951 | | | | 553,619 | | | | 562,001 | | | | 7,050 | | | | 1.3 | % |
Government Services | | | 53,657 | | | | 53,657 | | | | 53,657 | | | | 0 | | | | 0.0 | % |
Health | | | 2,596,039 | | | | 2,596,039 | | | | 2,596,039 | | | | 0 | | | | 0.0 | % |
Human Resources | | | 3,421 | | | | 3,421 | | | | 3,421 | | | | 0 | | | | 0.0 | % |
Justice | | | 42,491 | | | | 42,491 | | | | 42,491 | | | | 0 | | | | 0.0 | % |
Legislative Assembly | | | 21,721 | | | | 21,721 | | | | 21,721 | | | | 0 | | | | 0.0 | % |
Natural Resources | | | 93,267 | | | | 93,267 | | | | 93,267 | | | | 0 | | | | 0.0 | % |
Office of the Attorney General | | | 17,975 | | | | 17,975 | | | | 18,299 | | | | 324 | | | | 1.8 | % |
Office of the Premier | | | 1,616 | | | | 1,616 | | | | 1,616 | | | | 0 | | | | 0.0 | % |
Opportunities New Brunswick | | | 50,883 | | | | 45,215 | | | | 45,429 | | | | (5,454 | ) | | | -10.7% | |
Other Agencies | | | 259,387 | | | | 258,446 | | | | 259,914 | | | | 527 | | | | 0.2 | % |
Post-Secondary Education, Training and Labour | | | 613,793 | | | | 613,793 | | | | 613,793 | | | | 0 | | | | 0.0 | % |
Public Safety | | | 166,262 | | | | 171,563 | | | | 178,547 | | | | 12,285 | | | | 7.4 | % |
Regional Development Corporation | | | 65,012 | | | | 65,012 | | | | 65,012 | | | | 0 | | | | 0.0 | % |
Service of the Public Debt | | | 685,000 | | | | 685,000 | | | | 685,000 | | | | 0 | | | | 0.0 | % |
Social Development | | | 1,113,693 | | | | 1,115,218 | | | | 1,121,593 | | | | 7,900 | | | | 0.7 | % |
Tourism, Heritage and Culture | | | 52,382 | | | | 54,802 | | | | 54,802 | | | | 2,420 | | | | 4.6 | % |
Transportation and Infrastructure | | | 296,942 | | | | 296,942 | | | | 296,942 | | | | 0 | | | | 0.0 | % |
| | | | | | | | | | | | | | | | | | | | |
Subtotal | | | 8,029,038 | | | | 8,030,133 | | | | 8,053,815 | | | | 24,777 | | | | 0.3 | % |
| | | | | | | | | | | | | | | | | | | | |
Investment in Tangible Capital Assets | | | (11,735 | ) | | | (14,837 | ) | | | (14,646 | ) | | | (2,911 | ) | | | 24.8 | % |
Inter-account Transactions | | | (10,282 | ) | | | (9,995 | ) | | | (9,995 | ) | | | 287 | | | | -2.8% | |
| | | | | | | | | | | | | | | | | | | | |
Ordinary Account Expense | | | 8,007,021 | | | | 8,005,301 | | | | 8,029,174 | | | | 22,153 | | | | 0.3 | % |
APPENDIX C
CAPITAL EXPENDITURES
Thousands
$
| | | 2015-2016 Budget | | | 2015-2016 1st Quarter Projection | | | 2015-2016 2nd Quarter Projection | | | Variance from Budget | |
| | | | | | | | | | | | | |
Regular Capital Investments | | | | | | | | | | | | |
Agriculture, Aquaculture and Fisheries | | | 900 | | | | 500 | | | | 900 | | | | 0 | |
Education and Early Childhood Development | | | 77,111 | | | | 76,129 | | | | 76,277 | | | | (834 | ) |
Environment and Local Government | | | 1,000 | | | | 1,000 | | | | 1,000 | | | | 0 | |
Health | | | 58,900 | | | | 57,021 | | | | 55,456 | | | | (3,444 | ) |
Legislative Assembly | | | 735 | | | | 735 | | | | 735 | | | | 0 | |
Natural Resources | | | 1,510 | | | | 1,510 | | | | 1,510 | | | | 0 | |
Post-Secondary Education, Training and Labour | | | 5,600 | | | | 5,820 | | | | 5,820 | | | | 220 | |
Regional Development Corporation | | | 5,668 | | | | 5,668 | | | | 5,668 | | | | 0 | |
Tourism, Heritage and Culture | | | 1,437 | | | | 1,437 | | | | 1,437 | | | | 0 | |
Transportation and Infrastructure | | | 329,578 | | | | 324,617 | | | | 330,684 | | | | 1,106 | |
Regular Capital Investments | | | 482,439 | | | | 474,437 | | | | 479,487 | | | | (2,952 | ) |
| | | | | | | | | | | | | | | | | |
Strategic Infrastructure Initiative | | | | | | | | | | | | | | | | |
Education and Early Childhood Development | | | 16,250 | | | | 16,891 | | | | 15,924 | | | | (326 | ) |
Health | | | 1,300 | | | | 1,300 | | | | 350 | | | | (950 | ) |
Regional Development Corporation | | | 3,500 | | | | 3,500 | | | | 2,500 | | | | (1,000 | ) |
Tourism, Heritage and Culture | | | 1,127 | | | | 563 | | | | 563 | | | | (564 | ) |
Transportation and Infrastructure | | | 70,610 | | | | 70,610 | | | | 70,610 | | | | 0 | |
Energy Retrofit and Renewable Energy | | | 11,840 | | | | 11,840 | | | | 11,840 | | | | 0 | |
New Strategic Projects | | | 10,000 | | | | 10,000 | | | | 7,000 | | | | (3,000 | ) |
Strategic Infrastructure Initiative | | | 114,627 | | | | 114,704 | | | | 108,787 | | | | (5,840 | ) |
| | | | | | | | | | | | | | | | | |
Total - Capital Expenditures | | | 597,066 | | | | 589,141 | | | | 588,274 | | | | (8,792 | ) |
| | | | | | | | | | | | | | | | | |
Investments in Tangible Capital Assets | | | (514,163 | ) | | | (504,074 | ) | | | (507,679 | ) | | | 6,484 | |
| | | | | | | | | | | | | | | | | |
Capital Account Expense | | | 82,903 | | | | 85,067 | | | | 80,595 | | | | (2,308 | ) |