EXHIBIT 99.9
| Consolidated Financial Statements Volume 1 | |
| 
| |
| | |
| Consolidated Financial Statements Volume 1 | |
| | |
| | |
| PUBLIC
ACCOUNTS for the fiscal year ended 31 March 2016 Printed by Authority of the Legislature Fredericton, N.B. ISSN 0382-1277 ISBN printed version: 978-1-4605-1090-2 ISBN PDF version: 978-1-4605-1091-9 | |
| 
| |
| | |
ii | PROVINCE OF NEW BRUNSWICK | 2016 |
To Her Honour,
The Honourable Jocelyne Roy Vienneau
lieutenant-Governor of the Province of New Brunswick
The undersigned has the honour to submit the Public Accounts of the Province of New Brunswick for the fiscal year ended 31 March 2016.
| | I am, Your Honour, | |
| | |
| 
| |
| | Cathy Rogers Minister of Finance | |
Fredericton, New Brunswick September 2016 | | |
The Honourable Cathy Rogers
Minister of Finance
Madam:
The undersigned has the honour to present to you the Public Accounts of the Province of New Brunswick for the fiscal year ended 31 March 2016.
| | Respectfully submitted, | |
| | |
|  | |
| | Paul Martin, FCPA, FCA Comptroller | |
Fredericton, New Brunswick September 2016 | | |
2016 | PROVINCE OF NEW BRUNSWICK | iii |
TABLE OF CONTENTS
Audited Consolidated Financial Statements
| | Page | |
| | | |
Introduction to Volume I | | | 1 | |
| | | | |
Statement of Responsibility | | | 2 | |
| | | | |
Results for the Year | | | 3 | |
| | | | |
Major Variance Analysis | | | 7 | |
| | | | |
Indicators of Financial Health | | | 13 | |
| | | | |
Independent Auditor's Report | | | 20 | |
| | | | |
Consolidated Statement of Financial Position | | | 21 | |
| | | | |
Consolidated Statement of Operations | | | 22 | |
| | | | |
Consolidated Statement of Cash Flow | | | 23 | |
| | | | |
Consolidated Statement of Change in Net Debt | | | 24 | |
| | | | |
Consolidated Statement of Change in Accumulated Deficit | | | 24 | |
| | | | |
Notes to the Consolidated Financial Statements | | | 25 | |
| | | | |
Schedules to the Consolidated Financial Statements | | | 63 | |
2016 | PROVINCE OF NEW BRUNSWICK | 1 |
INTRODUCTION
VOLUME I
The Public Accounts of the Province of New Brunswick are presented in two volumes.
This volume contains the audited consolidated financial statements of the Provincial Reporting Entity as described in Note 1 to the consolidated financial statements. They include a Consolidated Statement of Financial Position, a Consolidated Statement of Operations, a Consolidated Statement of Cash Flow, a Consolidated Statement of Change in Net Debt and a Consolidated Statement of Change in Accumulated Deficit. This volume also contains the Independent Auditor’s Report, Statement of Responsibility, management’s comments on the Results for the Year, Major Variance Analysis and a discussion of the Indicators of Financial Health of the Province.
Volume II contains unaudited supplementary information to the consolidated financial statements presented in Volume I. It presents summary statements for revenue and expenditure as well as five-year comparative statements. This volume also contains detailed information on Supplementary Appropriations, Funded Debt, statements of the General Sinking Fund and revenue and expenditure by government department.
In addition, the Government includes the following lists on the Office of the Comptroller web site at www.gnb.ca/finance:
| · | Salary information of government employees and employees of certain government organizations in excess of $60,000. Salary information is for the calendar year and is reported under the department where the employee worked at 31 December; |
| | |
| · | Travel and other employee expenses in excess of $12,000 paid during the year to government employees, separated by department; |
| | |
| · | Payments made to suppliers during the year in excess of $25,000 separated by department as well as a global listing including payments made by all departments; |
| | |
| · | Loans disbursed to recipients during the year in excess of $25,000 separated by department. |
2 | PROVINCE OF NEW BRUNSWICK | 2016 |

STATEMENT OF RESPONSIBILITY
The consolidated financial statements of the Province of New Brunswick are prepared each year by the Comptroller as required under section 14 of the Financial Administration Act. The Results for the Year, Major Variance Analysis and Indicators of Financial Health commentaries are prepared jointly by the Department of Finance and the Office of the Comptroller. The consolidated financial statements include a Consolidated Statement of Financial Position, a Consolidated Statement of Operations, a Consolidated Statement of Cash Flow, a Consolidated Statement of Change in Net Debt and a Consolidated Statement of Change in Accumulated Deficit.
Financial statement integrity and objectivity are the responsibility of the Government. To help fulfil this responsibility, systems of internal control have been established to provide reasonable assurance that transactions are properly authorized, executed and reported. The statements are prepared in accordance with the accounting policies described in Note 1 to the Consolidated Financial Statements.
On behalf of the Government:
Cathy Rogers
Minister of Finance
September 2016
2016 | PROVINCE OF NEW BRUNSWICK | 3 |
RESULTS FOR THE YEAR
General Comments
The Province budgeted a deficit of $476.8 million for the March 31, 2016 fiscal year. This included a $150.0 million contingency reserve, intended to protect the Province against potential revenue weakness. Given the numerous factors that impact the economy and revenues which are beyond the Province’s control, the government demonstrated prudence in introducing a contingency reserve in the budget in order to protect the Province from unforeseen circumstances. During the year, the reserve was not required and the budgeted deficit was reduced to $326.8 million.
The Province's summary financial statements, contained in this volume of Public Accounts, report a deficit for the fiscal year ended 31 March 2016 of $260.5 million. This represents a decrease of $66.3 million from the budgeted deficit of $326.8 million. The difference is the result of higher than budgeted revenues of $78.3 million, and higher than budgeted expenses of $12.0 million.
Revenues were $78.3 million higher than budget. Other Provincial Revenue increased $149.3 million due to the inclusion of nursing homes within the provincial reporting entity, the recording of school raised funds (which started in 2015), and higher than budgeted revenues from the New Brunswick Lottery and Gaming Corporation and the Regional Health Authorities. These increases were partially offset by lower than budgeted revenue of $73.3 million from the New Brunswick Power Corporation.
Expenses were $12.0 million higher than budget. The major over-expenditures were in Social Development, mainly due to the inclusion of nursing homes within the provincial reporting entity; in Health due to higher costs in the Regional Health Authorities and the Medicare program; and in Protection Services, mainly due to Disaster Financial Assistance funding associated with various storm events. These increases were offset by a number of under expenditures, particularly in Economic Development and Central Government.
A more detailed discussion of major variances can be found in the major variance section that follows.
Summary Financial Information
(millions)
Consolidated Statement of Financial Position |
| | 2016 | | | 2015 | |
Financial Assets | | $ | 8,584.2 | | | $ | 8,187.8 | |
Liabilities | | | (22,243.8) | | | | (21,306.0) | |
Net Debt | | | (13,659.6) | | | | (13,118.2) | |
Tangible Capital Assets | | | 8,738.5 | | | | 8,585.7 | |
Other Non Financial Assets | | | 219.0 | | | | 234.2 | |
Total Non Financial Assets | | | 8,957.5 | | | | 8,819.9 | |
Accumulated Deficit | | $ | (4,702.1) | | | $ | (4,298.3) | |
Consolidated Statement of Operations |
| | 2016 | | | 2015 | |
Revenue - Provincial Sources | | $ | 5,433.5 | | | $ | 5,429.4 | |
Revenue - Federal Sources | | | 2,952.7 | | | | 3,009.8 | |
Total Revenue | | | 8,386.2 | | | | 8,439.2 | |
Expenses | | | 8,646.7 | | | | 8,800.6 | |
Surplus / (Deficit) | | $ | (260.5) | | | $ | (361.4) | |
Consolidated Statement of Change in Net Debt |
| | 2016 | | | 2015 | |
Opening Net Debt | | $ | (13,118.2) | | | $ | (12,415.1) | |
Increase in Net Debt From Operations | | | (541.4) | | | | (703.1) | |
Ending Net Debt | | $ | (13,659.6) | | | $ | (13,118.2) | |
4 | PROVINCE OF NEW BRUNSWICK | 2016 |
Revenue
Revenues of the Province for the past ten years, as restated, are shown in the table below. The consolidation of nursing homes was accounted for retroactively to opening 2015 net debt and accumulated deficit balances. As such, the impact of the accounting change is only reflected in the
2015 and 2016 numbers below.
($ millions)
| 2007 | 2008 | 2009 | 2010 | 2011 | 2012 | 2013 | 2014 | 2015 | 2016 |
Provincial Sources | 4,221.5 | 4,467.1 | 4,462.0 | 4,178.7 | 4,609.8 | 4,928.8 | 4,784.6 | 4,896.2 | 5,429.4 | 5,433.5 |
Federal Sources | 2,530.9 | 2,720.6 | 2,763.6 | 2,940.8 | 2,930.3 | 2,874.2 | 3,000.5 | 2,877.9 | 3,009.8 | 2,952.7 |
Total Revenue | 6,752.4 | 7,187.7 | 7,225.6 | 7,119.5 | 7,540.1 | 7,803.0 | 7,785.1 | 7,774.1 | 8,439.2 | 8,386.2 |
Average annual revenue growth over the ten-year period is 2.8%. In 2016, year-over-year revenue decreased by 0.6%. Increased revenue from Taxes, Other Provincial Revenue and Unconditional Grants was more than offset by decreased revenue from the New Brunswick Power Corporation and lower Conditional Grants, due in part to one-time revenue received in 2015.
Expense
Expenses of the Province for the past ten years, as restated, are shown in the table below. The consolidation of nursing homes and the change in accounting policy for pensions were accounted for retroactively to opening 2015 net debt and accumulated deficit balances. As such, the impacts of the accounting changes are only reflected in the 2015 and 2016 numbers below.
($ millions)
| 2007 | 2008 | 2009 | 2010 | 2011 | 2012 | 2013 | 2014 | 2015 | 2016 |
Total Expense | 6,475.1 | 6,946.6 | 7,377.6 | 7,815.4 | 8,157.3 | 8,047.8 | 8,318.3 | 8,374.5 | 8,800.6 | 8,646.7 |
Average annual expense growth over the ten-year period is 3.5%. In 2016, expenses decreased by $153.9 million year-over-year, a 1.7% decrease. This was due in large part to a one-time expense associated with the reform of the Teachers’ Pension Plan in 2015, as well as decreased expenses in Economic Development, Transportation and Infrastructure, and Resources. These decreases were partially offset by increased expenses in other areas, including Health and Central Government.
Surplus / (Deficit)
Surpluses (or Deficits) of the Province for the past ten years, as restated, are shown in the table below.
($ millions)
| 2007 | 2008 | 2009 | 2010 | 2011 | 2012 | 2013 | 2014 | 2015 | 2016 |
Surplus/(Deficit) | 277.3 | 241.1 | (152.0) | (695.9) | (617.2) | (244.8) | (533.2) | (600.4) | (361.4) | (260.5) |
The deficit for the year ended 31 March 2016 was $260.5 million, which is lower than the budgeted deficit of $326.8 million. The lower deficit was a result of higher than budgeted revenue of $78.3 million mainly due to the consolidation of nursing homes and higher personal income tax revenue, offset by lower than budgeted revenue from the New Brunswick Power Corporation. Expenses were higher than budgeted by just $12.0 million due to a number of factors, including the consolidation of nursing homes.
Net Debt
Net debt increased by $541.4 million during the year ended 31 March 2016, an increase of $105.9 million from the budgeted increase of $435.5 million. The increase in net debt is related to the operating deficit and net capital asset transactions of highways, hospitals, schools and other buildings.
2016 | PROVINCE OF NEW BRUNSWICK | 5 |
Net Debt
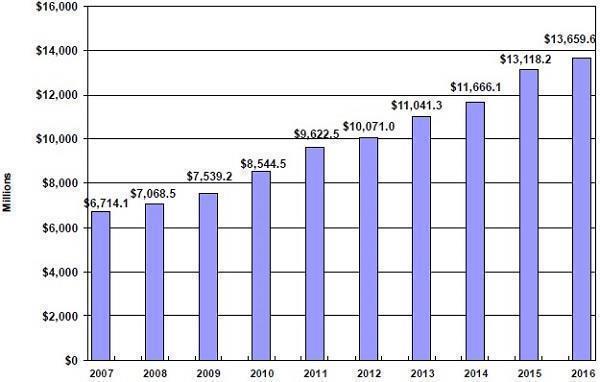
($ millions)
| 2007 | 2008 | 2009 | 2010 | 2011 | 2012 | 2013 | 2014 | 2015 | 2016 |
Net Debt | 6,714.1 | 7,068.5 | 7,539.2 | 8,544.5 | 9,622.5 | 10,071.0 | 11,041.3 | 11,666.1 | 13,118.2 | 13,659.6 |
Cost of Servicing the Public Debt
The Province’s cost of servicing the Public Debt totaled $678.1 million for the year ended 31 March 2016. This represents a slight increase of $0.9 million from 2015, largely due to a higher level of debt which was partially offset by refinancing maturing debt at lower interest rates and the repayment of maturing debt from the sinking fund.
6 | PROVINCE OF NEW BRUNSWICK | 2016 |
Cost of Servicing the Public Debt
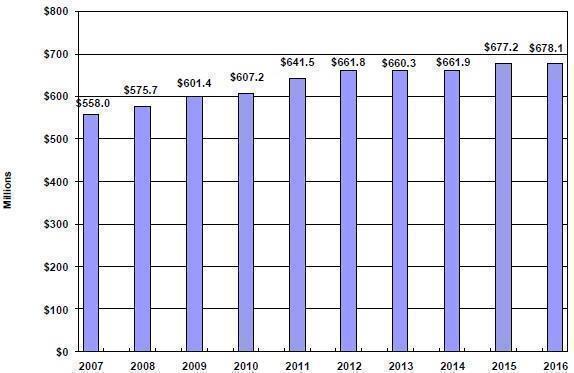
($ millions)
| 2007 | 2008 | 2009 | 2010 | 2011 | 2012 | 2013 | 2014 | 2015 | 2016 |
Cost of Servicing the Public Debt | 558.0 | 575.7 | 601.4 | 607.2 | 641.5 | 661.8 | 660.3 | 661.9 | 677.2 | 678.1 |
2016 | PROVINCE OF NEW BRUNSWICK | 7 |
MAJOR VARIANCE ANALYSIS
Explanations of major variances are described below. In this analysis, comparisons are made between the actual results for 2016 and either the 2016 budget or the actual results for 2015.
REVENUE
Budget 2016 to Actual 2016 Comparison
2016 Budget to Actual ($ millions) | |
Item | | Budget | | | Actual | | | Variance | | | % Variance | |
Provincial Sources | |
Taxes | | | 4,017.2 | | | | 4,029.7 | | | | 12.5 | | | | 0.3 | |
Licenses and Permits | | | 151.7 | | | | 153.8 | | | | 2.1 | | | | 1.4 | |
Royalties | | | 107.2 | | | | 89.3 | | | | (17.9 | ) | | | (16.7 | ) |
Income from Government Business Enterprises | | | 258.0 | | | | 189.1 | | | | (68.9 | ) | | | (26.7 | ) |
Other Provincial Revenue | | | 628.2 | | | | 777.5 | | | | 149.3 | | | | 23.8 | |
Sinking Fund Earnings | | | 193.7 | | | | 194.1 | | | | 0.4 | | | | 0.2 | |
Revenue from Provincial Sources | | | 5,356.0 | | | | 5,433.5 | | | | 77.5 | | | | 1.4 | |
Federal Sources |
Fiscal Equalization | | | 1,668.9 | | | | 1,668.0 | | | | (0.9 | ) | | | (0.1 | ) |
Unconditional Grants | | | 993.1 | | | | 994.7 | | | | 1.6 | | | | 0.2 | |
Conditional Grants | | | 289.9 | | | | 290.0 | | | | 0.1 | | | | - | |
Revenue from Federal Sources | | | 2,951.9 | | | | 2,952.7 | | | | 0.8 | | | | - | |
Total Revenues | | | 8,307.9 | | | | 8,386.2 | | | | 78.3 | | | | 0.9 | |
Taxes
Taxes are up $12.5 million from budget, primarily due to:
| · | Personal Income Tax is up $67.6 million due to an underpayment for the 2014 taxation year and an improved forecast base. |
| · | Gasoline and Motive Fuels Tax is up $16.0 million due to an increase in sales volume. |
| · | Tobacco Tax is up $12.9 million due to higher than anticipated sales volume. |
| · | Harmonized Sales Tax is down $47.4 million reflecting overpayments for the 2009-2015 taxation years. |
| · | Corporate Income Tax is down $32.2 million reflecting an overpayment for the 2014 taxation year and lower in-year payments. |
| · | Financial Corporation Capital Tax is down $5.7 million due to a reduction in capital held by financial institutions. |
Royalties
Royalties are down $17.9 million from budget due to lower than anticipated potash production and the subsequent shutdown of the Picadilly potash mine, and less forest timber being harvested than anticipated.
Income from Government Business Enterprises
Income from Government Business Enterprises is down $68.9 million primarily as a result of $73.3 million less revenue than budgeted from the New Brunswick Power Corporation. The net income of the New Brunswick Power Corporation was less than budgeted due to reduced output at the Point Lepreau Generating Station caused by unplanned outages, higher natural gas prices and reduced revenue due to mild winter weather.
8 | PROVINCE OF NEW BRUNSWICK | 2016 |
Other Provincial Revenue
Other Provincial Revenue is up $149.3 million from budget due to the inclusion of nursing homes within the provincial reporting entity ($84.0 million); higher than anticipated revenues from the New Brunswick Lotteries and Gaming Corporation of $20.8 million, due in part to extraordinary ticket lottery sales; the recording of school raised funds, which started in 2015 ($18.3 million) and higher than budgeted revenue from the Regional Health Authorities ($13.6 million). There were also other miscellaneous revenue increases across various departments and agencies.
Actual 2015 to Actual 2016 Comparison
2015 Actual to 2016 Actual ($ millions) | |
Item | | 2015 Actual | | | 2016
Actual | | | Change | | | %
Change | |
Provincial Sources | |
Taxes | | | 3,983.1 | | | | 4,029.7 | | | | 46.6 | | | | 1.2 | |
Licenses and Permits | | | 149.4 | | | | 153.8 | | | | 4.4 | | | | 2.9 | |
Royalties | | | 97.5 | | | | 89.3 | | | | (8.2 | ) | | | (8.4 | ) |
Income from Government Business Enterprises | | | 270.9 | | | | 189.1 | | | | (81.8 | ) | | | (30.2 | ) |
Other Provincial Revenue | | | 732.6 | | | | 777.5 | | | | 44.9 | | | | 6.1 | |
Sinking Fund Earnings | | | 195.9 | | | | 194.1 | | | | (1.8 | ) | | | (0.9 | ) |
Revenue from Provincial Sources | | | 5,429.4 | | | | 5,433.5 | | | | 4.1 | | | | 0.1 | |
Federal Sources |
Fiscal Equalization Payments | | | 1,666.0 | | | | 1,668.0 | | | | 2.0 | | | | 0.1 | |
Unconditional Grants | | | 955.8 | | | | 994.7 | | | | 38.9 | | | | 4.1 | |
Conditional Grants | | | 388.0 | | | | 290.0 | | | | (98.0 | ) | | | (25.3 | ) |
Revenue from Federal Sources | | | 3,009.8 | | | | 2,952.7 | | | | (57.1 | ) | | | (1.9 | ) |
Total Revenues | | | 8,439.2 | | | | 8,386.2 | | | | (53.0 | ) | | | (0.6 | ) |
Taxes
Taxes are up $46.6 million over the previous fiscal year, mainly due to:
| · | Personal Income Tax is up $130.9 million due to higher in-year payments from the federal government and prior year adjustments. |
| · | Gasoline and Motive Fuels Tax is up $41.4 million due to tax measures announced in the 2015-16 budget and increased sales volume. |
| · | Provincial Real Property Tax is up $13.6 million due to an increase in the assessment base. |
| · | Tobacco Tax is up $5.3 million due to an increase in sales volume. |
| · | Harmonized Sales Tax is down $104.1 million reflecting prior year adjustments offset by an improvement to in-year payments. |
| · | Metallic Minerals Tax is down $21.8 million due to an audit assessment in 2014-15 on past mining activities. |
| · | Corporate Income Tax is down $12.3 million reflecting a reduction in New Brunswick’s projected corporate taxable income upon which New Brunswick’s payments are based. |
| · | Financial Corporation Capital Tax is down $8.1 million due to a reduction in capital held by financial institutions. |
Royalties
Royalties are down $8.2 million to due lower than anticipated potash production and the subsequent shutdown of the Picadilly potash mine.
2016 | PROVINCE OF NEW BRUNSWICK | 9 |
Income From Government Business Enterprises
Income from Government Business Enterprises is down $81.8 million year-over-year largely as a result of lower revenue from the New Brunswick Power Corporation. The Corporation’s net income decreased due to unplanned outages and improvement initiatives at the Point Lepreau Generating Station, reduced revenue due to mild winter weather and lower nuclear investment fund earnings.
Other Provincial Revenue
Other Provincial Revenue is up $44.9 million mainly due to higher overall revenue from the New Brunswick Lotteries and Gaming Corporation of $17.2 million, particularly from extraordinary ticket lottery sales. The Regional Health Authorities had higher revenue of $6.4 million; school districts had increased revenue of $5.3 million, and increased funding of $3.6 million for First Nations education. In addition, there are other miscellaneous revenue increases across various departments and agencies.
Unconditional Grants
Unconditional Grants are up $38.9 million due to legislated growth for the Canada Health Transfer and the Canada Social Transfer.
Conditional Grants
Conditional Grants are down $98.0 million mainly due to one-time funding in 2014-15 related to New Brunswick joining the Cooperative Capital Markets Regulatory System, lower federal recoveries for Disaster Financial Assistance, and lower federal capital recoveries.
EXPENSES
Budget 2016 to Actual 2016 Comparison
2016 Budget to Actual ($ millions) |
Item | | Budget | | | Actual | | | Variance | | | % Variance | |
Education and Training | | | 1,840.2 | | | | 1,846.3 | | | | 6.1 | | | | 0.3 | |
Health | | | 2,864.9 | | | | 2,899.0 | | | | 34.1 | | | | 1.2 | |
Social Development | | | 1,130.3 | | | | 1,196.4 | | | | 66.1 | | | | 5.8 | |
Protection Services | | | 258.0 | | | | 281.3 | | | | 23.3 | | | | 9.0 | |
Economic Development | | | 266.7 | | | | 204.0 | | | | (62.7 | ) | | | (23.5 | ) |
Labour and Employment | | | 133.1 | | | | 135.0 | | | | 1.9 | | | | 1.4 | |
Resources | | | 194.2 | | | | 185.3 | | | | (8.9 | ) | | | (4.6 | ) |
Transportation and Infrastructure | | | 624.1 | | | | 636.0 | | | | 11.9 | | | | 1.9 | |
Central Government | | | 638.2 | | | | 585.3 | | | | (52.9 | ) | | | (8.3 | ) |
Service of the Public Debt | | | 685.0 | | | | 678.1 | | | | (6.9 | ) | | | (1.0 | ) |
Total Expenses | | | 8,634.7 | | | | 8,646.7 | | | | 12.0 | | | | 0.1 | |
Items in the table are reported by functional area. See the related schedule in the consolidated financial statements for additional details.
Education and Training
Education and Training expenses were $6.1 million higher than budget mainly due to increased expenses in the School District Projects Special Purpose Account offset by lower than budgeted expenses in General Government related to the accrual for teachers’ summer pay.
Health
Health expenses were $34.1 million higher than budget mainly due to over-expenditures in the Department of Health, including expenses related to the Regional Health Authorities as well as the Medicare program. These over expenditures were partially offset by lower than anticipated costs in corporate and pharmaceutical programs.
10 | PROVINCE OF NEW BRUNSWICK | 2016 |
Social Development
Social Development expenses were $66.1 million higher than budget mainly due to the inclusion of nursing homes within the provincial reporting entity.
Protection Services
Protection Services were $23.3 million higher than budget due to higher expenses in the Department of Public Safety resulting from Disaster Financial Assistance funding associated with various storm and flood events.
Economic Development
Economic Development expenses were $62.7 million lower than budget mainly due to lower than expected financial assistance in Opportunities New Brunswick. This was mainly due to lower than expected Strategic Assistance expenses, lower than expected expenses in the Regional Development Corporation due to project timing changes, and decreased provision expense.
Labour and Employment
Labour and Employment expenses were $1.9 million higher than budget primarily due to increased demand under the Employment Services, Workforce Expansion, and Training and Skills Development programs.
Resources
Resources expenses were $8.9 million less than budget mainly due to lower than anticipated demand under the Agristability Program, as well as increased investments in tangible capital assets in the Department of Natural Resources.
Transportation and Infrastructure
Transportation expenses were $11.9 million higher than budget mainly due to higher Transportation and Infrastructure expenses related to the Winter Maintenance program, as well as increased provision expense.
Central Government
Central Government expenses were $52.9 million lower than budget mainly due to lower than anticipated expenses in General Government associated with the Retirement Allowance benefit.
2016 | PROVINCE OF NEW BRUNSWICK | 11 |
Actual 2015 to Actual 2016 Comparison
2015 Actual to 2016 Actual ($ millions) |
Item | | 2015 Actual | | | 2016 Actual | | | Change | | | % Change | |
Education and Training | | | 2,083.7 | | | | 1,846.3 | | | | (237.4 | ) | | | (11.4 | ) |
Health | | | 2,830.9 | | | | 2,899.0 | | | | 68.1 | | | | 2.4 | |
Social Development | | | 1,182.3 | | | | 1,196.4 | | | | 14.1 | | | | 1.2 | |
Protection Services | | | 268.7 | | | | 281.3 | | | | 12.6 | | | | 4.7 | |
Economic Development | | | 247.6 | | | | 204.0 | | | | (43.6 | ) | | | (17.6 | ) |
Labour and Employment | | | 122.6 | | | | 135.0 | | | | 12.4 | | | | 10.1 | |
Resources | | | 197.3 | | | | 185.3 | | | | (12.0 | ) | | | (6.1 | ) |
Transportation and Infrastructure | | | 649.7 | | | | 636.0 | | | | (13.7 | ) | | | (2.1 | ) |
Central Government | | | 540.6 | | | | 585.3 | | | | 44.7 | | | | 8.3 | |
Service of the Public Debt | | | 677.2 | | | | 678.1 | | | | 0.9 | | | | 0.1 | |
Total Expenses | | | 8,800.6 | | | | 8,646.7 | | | | (153.9 | ) | | | (1.7 | ) |
Items in the table are reported by functional area. See the related schedule in the consolidated financial statements for additional details.
Education and Training
Education and Training expenses were $237.4 million lower than the previous fiscal year. This was mainly due to a one-time expense associated with the reform of the Teachers’ Pension Plan in 2015.
Health
Health expenses were $68.1 million higher than the previous fiscal year mainly due to an increase in expenses in the Regional Health Authorities associated with wages and inflation, as well as an increase in payments under the Medicare and Drug programs.
Social Development
Social Development expenses were $14.1 million higher than the previous fiscal year mainly due to the opening of new nursing homes and higher service delivery costs, specifically related to Youth Engagement Services and Disability Support Services.
Protection Services
Protection Services were $12.6 million higher than the previous fiscal year due to higher expenses in the Department of Public Safety resulting from Disaster Financial Assistance funding associated with various storm and flood events. This increase was partially offset by a decrease in provision expense.
Economic Development
Economic Development expenses were $43.6 million lower than the previous fiscal year primarily due to decreased expenses in the Regional Development Corporation related to the acceleration of project funding in 2015, as well as lower provision expense.
Labour and Employment
Labour and Employment expenses were $12.4 million higher than the previous fiscal year due to increased clients served under employment programs, as well as the expansion of Advocate Services and setup of the Workers' Compensation Appeals Tribunal.
Resources
Resources expenses were $12.0 million lower than the previous fiscal year mainly due to expenses associated with the Energy Efficiency and Conservation Agency of New Brunswick in 2015.
12 | PROVINCE OF NEW BRUNSWICK | 2016 |
Transportation and Infrastructure
Transportation and Infrastructure expenses were $13.7 million lower than the previous year mainly due to lower winter maintenance costs and provision expense. This was partially offset by increased amortization expense.
Central Government
Central Government expenses were $44.7 million higher than the previous year. This was mainly due to increased expense in Service New Brunswick, General Government, and provision expense.
2016 | PROVINCE OF NEW BRUNSWICK | 13 |
INDICATORS OF FINANCIAL HEALTH
This section provides indicators of progress in the Province’s financial condition using information provided in the Province’s consolidated financial statements as well as other standard socio-economic indicators such as nominal Gross Domestic Product (GDP) data from Statistics Canada.
The analysis of financial indicators is a reporting practice recommended by the Public Sector Accounting Board, and provides results in a manner that improves transparency and provides a clearer understanding of recent trends in the Province’s financial health. Trends over the last ten years (2007 to
2016) are evaluated using the criteria of sustainability, flexibility and vulnerability. Though many potential indicators are available, those found to be the most relevant, measurable and transparent to users of government financial information are included. Similar data series are also widely used by banks and other financial institutions, investors and credit-rating agencies.
In evaluating a government’s financial health, it should be acknowledged that governments have exposure to a number of variables that are beyond their direct scope of control, but still can exert major influences on financial results and indicators. These include but are not limited to:
| · | Changing global economic conditions such as energy prices, commodity prices, investment valuation and inflation; |
| · | Changes to international financial conditions that impact interest rates, currency fluctuations or availability of credit; |
| · | Changes to federal transfers or programs; |
| · | Emergencies such as floods, forest fires and pandemics; |
| · | Developments affecting agencies such as the New Brunswick Power Corporation that are reflected in the Province’s financial statements and; |
| · | Changes in public sector accounting standards. |
Sustainability
Sustainability is the degree to which a government can maintain its existing financial obligations both in respect of its service commitments to the public and financial commitments to creditors, employees and others without increasing the debt or tax burden relative to the economy within which it operates. It is measured in this analysis by:
| · | Net debt as a proportion of GDP; |
| · | Net debt per capita. |
Net Debt as a Proportion of GDP:
Net debt is an indication of the extent to which Provincial government liabilities exceed financial assets. The net debt-to-GDP ratio shows the relationship between net debt and the economy. If the ratio is declining, growth in the economy is exceeding growth in net debt, resulting in improved sustainability. Conversely, an increasing net debt-to-GDP ratio indicates net debt is increasing faster than growth in the economy and serving to reduce the provincial government’s financial sustainability.
Over the last ten years the Province’s ratio of net debt-to-GDP increased from 25.1% to 41.3%. Beginning in 2008, the ratio has trended upwards related to weakened economic circumstances, operating deficits, capital spending, and other factors. In 2012, the ratio stabilized but has increased since due to the above noted factors. The inclusion of nursing homes within the provincial reporting entity and a change in accounting policy related to pensions were both implemented retroactively to the opening 2015 net debt balance. As such, only the 2015 and 2016 net debt numbers were restated, having a major impact on the ratio for those years.
14 | PROVINCE OF NEW BRUNSWICK | 2016 |
Net Debt-to-GDP Ratio
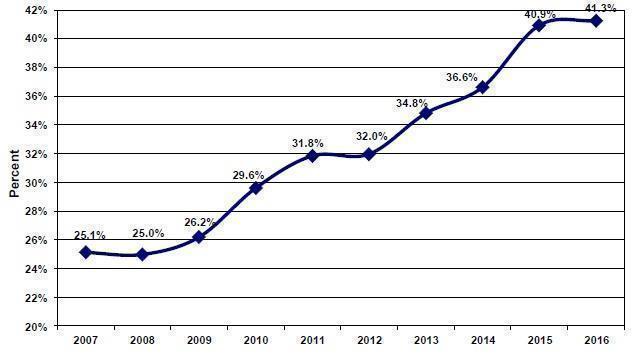
Net Debt-to-GDP Ratio |
Fiscal Year Ending | Net Debt | GDP | Net Debt/GDP |
| ($ millions) | ($ millions) | (%) |
2007 | 6,714.1 | 26,718 | 25.1 |
2008 | 7,068.5 | 28,287 | 25.0 |
2009 | 7,539.2 | 28,779 | 26.2 |
2010 | 8,544.5 | 28,857 | 29.6 |
2011 | 9,622.5 | 30,213 | 31.8 |
2012 | 10,071.0 | 31,500 | 32.0 |
2013 | 11,041.3 | 31,723 | 34.8 |
2014 | 11,666.1 | 31,857 | 36.6 |
2015 | 13,118.2 | 32,056 | 40.9 |
2016 | 13,659.6 | 33,114 | 41.3 |
Net Debt per Capita:
Net debt per capita is a statement of the net debt attributable to each New Brunswick resident. A decrease in net debt per capita suggests the debt burden has improved while an increase implies the debt burden has increased. Over the past ten years the net debt per capita has been trending upwards reflecting weakened economic circumstances, operating deficits, capital spending and other factors including population declines in recent years. The inclusion of nursing homes within the provincial reporting entity and a change in accounting policy related to pensions were both implemented retroactively to the opening 2015 net debt balance. As such, only the 2015 and 2016 net debt numbers were restated, having a major impact on net debt per capita in those years.
2016 | PROVINCE OF NEW BRUNSWICK | 15 |
Net Debt per Capita
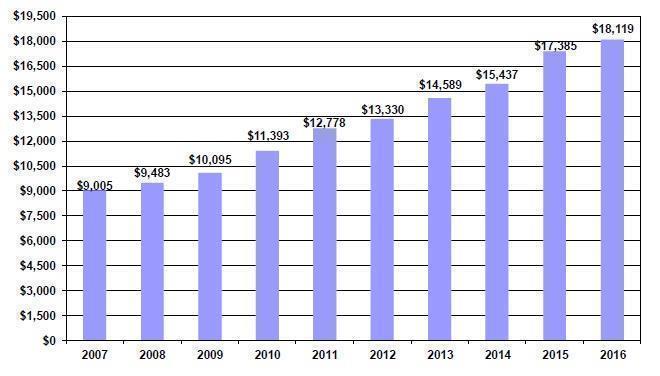
Net Debt per Capita |
Fiscal Year Ending | Net Debt | Population | Net Debt per Capita |
| ($ millions) | (July 1) | ($) |
2007 | 6,714.1 | 745,609 | 9,005 |
2008 | 7,068.5 | 745,407 | 9,483 |
2009 | 7,539.2 | 746,855 | 10,095 |
2010 | 8,544.5 | 749,954 | 11,393 |
2011 | 9,622.5 | 753,044 | 12,778 |
2012 | 10,071.0 | 755,530 | 13,330 |
2013 | 11,041.3 | 756,836 | 14,589 |
2014 | 11,666.1 | 755,718 | 15,437 |
2015 | 13,118.2 | 754,578 | 17,385 |
2016 | 13,659.6 | 753,871 | 18,119 |
Flexibility
Flexibility is the degree to which a government can change its debt or tax burden on the economy within which it operates to meet its existing financial obligations both in respect of its service commitments to the public and financial commitments to creditors, employees and others. It is measured in this analysis by:
| · | Own-source revenue as a proportion of GDP; |
| · | Cost of servicing the public debt as a proportion of total revenue. |
16 | PROVINCE OF NEW BRUNSWICK | 2016 |
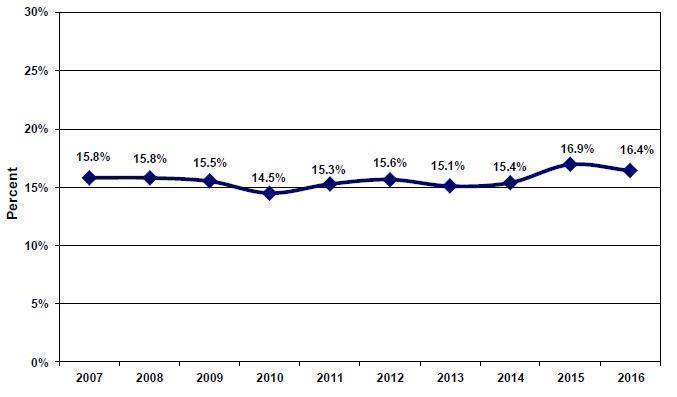
Own-source Revenue as a Proportion of GDP:
This ratio measures own-source revenues of the Provincial government as a percentage of the economy, as measured by nominal GDP. An increase in this ratio indicates that government own-source revenues are growing faster than the economy as a whole, reducing government’s flexibility to increase revenues without slowing growth in the economy. A decrease in the ratio is indicative of the government taking less revenue out of the economy on a relative basis, which increases its flexibility.
Own-source revenue includes revenues from taxation, natural resources, fees, return on investment, lotteries, fines and penalties, etc., and is essentially all revenue minus federal transfers. While more controllable than federal transfers, as the Province can influence revenues through its own tax rates and fiscal policy, own-source revenue is vulnerable to, among other factors:
| · | Net income or revenue of outside agencies whose revenue can fluctuate significantly due to price, volume, accounting changes, weather, etc. (e.g. the New Brunswick Power Corporation) |
| · | Variability in provincial revenues that are collected or estimated by the federal government such as personal and corporate income taxes and the Harmonized Sales Tax; |
| · | Commodity tax revenues such as Metallic Minerals Tax that are vulnerable to world prices. |
Own-source revenue as a proportion of GDP has been relatively stable, with an increase in this ratio the past few years.
Own-source Revenue as a Proportion of GDP
2016 | PROVINCE OF NEW BRUNSWICK | 17 |
Own-source Revenue as a Proportion of GDP |
Fiscal Year Ending | Own-source Revenue | GDP | Own-source Revenue as a Proportion of GDP |
| ($ millions) | ($ millions) | (%) |
2007 | 4,221.5 | 26,718 | 15.8 |
2008 | 4,467.1 | 28,287 | 15.8 |
2009 | 4,462.0 | 28,779 | 15.5 |
2010 | 4,178.7 | 28,857 | 14.5 |
2011 | 4,609.8 | 30,213 | 15.3 |
2012 | 4,928.8 | 31,500 | 15.6 |
2013 | 4,784.6 | 31,723 | 15.1 |
2014 | 4,896.2 | 31,857 | 15.4 |
2015 | 5,429.4 | 32,056 | 16.9 |
2016 | 5,433.5 | 33,114 | 16.4 |
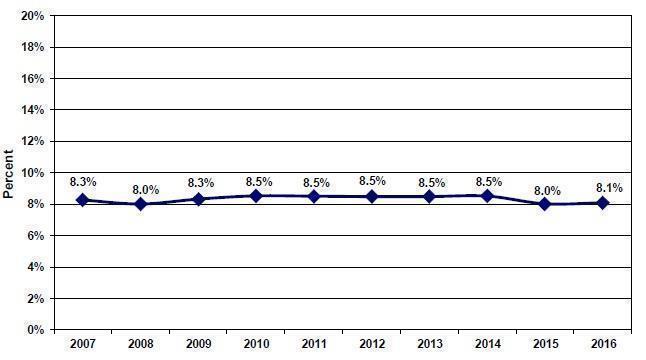
Cost of Servicing the Public Debt as a Proportion of Total Revenue:
Debt service costs as a proportion of total revenue is an indicator of the Province’s ability to satisfy existing credit requirements in the context of the government’s overall revenue. Debt service costs can be impacted by variables outside the direct control of government, such as credit ratings, interest rates, financial markets and currency fluctuations. Investment in public infrastructure resulting in a change in the stock of debt can also influence borrowing requirements.
The Province’s proportion of debt service costs to revenue has been relatively stable. In 2015 and 2016 the ratio has dropped to a lower level signifying that debt service costs are a smaller proportion of Provincial revenues overall, allowing the Province more financial resources to provide essential programs and services.
Cost of Servicing the Public Debt as a Proportion of Total Revenue
18 | PROVINCE OF NEW BRUNSWICK | 2016 |
Cost of Servicing the Public Debt as a Proportion of Total Revenue |
Fiscal Year Ending | Cost of Servicing the Public Debt | Total Revenue | Cost of Servicing the
Public Debt as a
Proportion of Total Revenue |
| ($ millions) | ($ millions) | (%) |
2007 | 558.0 | 6,752.4 | 8.3 |
2008 | 575.7 | 7,187.7 | 8.0 |
2009 | 601.4 | 7,225.6 | 8.3 |
2010 | 607.2 | 7,119.5 | 8.5 |
2011 | 641.5 | 7,540.1 | 8.5 |
2012 | 661.8 | 7,803.0 | 8.5 |
2013 | 660.3 | 7,785.1 | 8.5 |
2014 | 661.9 | 7,774.1 | 8.5 |
2015 | 677.2 | 8,439.2 | 8.0 |
2016 | 678.1 | 8,386.2 | 8.1 |
Vulnerability
Vulnerability is the degree to which a government is dependent on sources of funding outside its control or influence or is exposed to risks that could impair its ability to meet its existing financial obligations both in respect of its service commitments to the public and financial commitments to creditors, employees and others. A common measurement of vulnerability is federal government transfers as a proportion of revenue.
Federal Government Transfers as a Proportion of Total Revenue:
Revenue from federal sources is comprised of conditional and unconditional grants from the federal government, including:
| · | Fiscal Equalization Program payments; |
| · | The Canada Health Transfer and the Canada Social Transfer; |
| · | Conditional grants or capital revenue in support of economic development, infrastructure, education and labour training and other areas. |
Federal transfer payments can be affected by federal fiscal policy decisions, the normal annual estimate process that guides federal payments under the Equalization Program and Canada Health and Social Transfers, as well as timing and conditions related to conditional grants.
Comparing the level of federal transfers to total revenue provides an indication of the vulnerability of the Province. Generally, if the ratio is increasing, the Province is increasingly reliant on federal transfers, resulting in increased vulnerability. If the ratio is declining, vulnerability is diminished.
Federal government transfers as a proportion of total revenue reached a high of 41.3% in 2010. In that year, provincial-source revenues contracted as the effects of the economic slowdown hampered revenues and the NBEFC experienced a significant net loss. At the same time, federal stimulus funding supported federal-source revenue growth. Since then the ratio has declined to the current rate of 35.2%, its lowest level in the past decade.
2016 | PROVINCE OF NEW BRUNSWICK | 19 |
Federal Government Transfers as a Proportion of Total Revenue
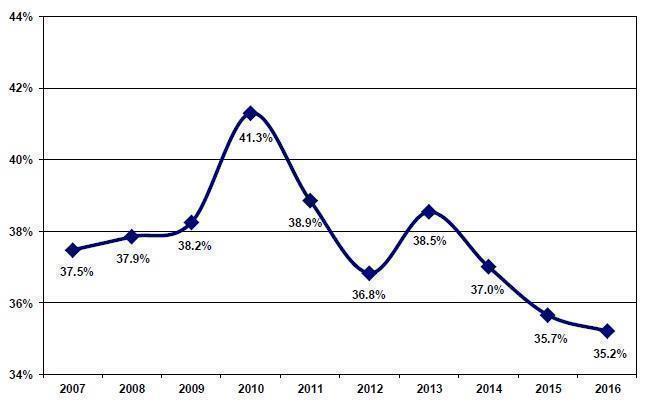
Federal Government Transfers as a Proportion of Total Revenue |
Fiscal Year Ending | Federal Government Transfers | Total Revenue | Federal Government
Transfers as a
Proportion of Total
Revenue |
| ($ millions) | ($ millions) | (%) |
2007 | 2,530.9 | 6,752.4 | 37.5 |
2008 | 2,720.6 | 7,187.7 | 37.9 |
2009 | 2,763.6 | 7,225.6 | 38.2 |
2010 | 2,940.8 | 7,119.5 | 41.3 |
2011 | 2,930.3 | 7,540.1 | 38.9 |
2012 | 2,874.2 | 7,803.0 | 36.8 |
2013 | 3,000.5 | 7,785.1 | 38.5 |
2014 | 2,877.9 | 7,774.1 | 37.0 |
2015 | 3,009.8 | 8,439.2 | 35.7 |
2016 | 2,952.7 | 8,386.2 | 35.2 |
AUDITOR GENERAL OF NEW BRUNSWICK | | 
| | VERIFICATEUR GENERAL DU NOUVEAU-BRUNSWICK |
INDEPENDENT AUDITOR'S REPORT
To the Legislative Assembly
Province of New Brunswick
Report on the consolidated financial statements
I have audited the accompanying consolidated financial statements of the Province of New Brunswick, which comprise the consolidated statement of financial position as at March 31, 2016, and the consolidated statements of operations, cash flow, change in net debt and change in accumulated deficit for the year then ended, and a summary of significant accounting policies and other explanatory information.
Management's Responsibility for the Consolidated Financial Statements
Management is responsible for the preparation and fair presentation of these consolidated financial statements in accordance with Canadian public sector accounting standards, and for such internal control as management determines is necessary to enable the preparation of consolidated financial statements that are free from material misstatement, whether due to fraud or error.
Auditor's Responsibility
My responsibility is to express an opinion on these consolidated financial statements based on my audit. I conducted my audit in accordance with Canadian generally accepted auditing standards. Those standards require that I comply with ethical requirements and plan and perform the audit to obtain reasonable assurance about whether the consolidated financial statements are free from material misstatement.
An audit involves performing procedures to obtain audit evidence about the amounts and disclosures in the consolidated financial statements. The procedures selected depend on the auditor's judgment, including the assessment of the risks of material misstatement of the consolidated financial statements, whether due to fraud or error. In making those risk assessments, the auditor considers internal control relevant to the entity's preparation and fair presentation of the consolidated financial statements in order to design audit procedures that are appropriate in the circumstances, but not for the purpose of expressing an opinion on the effectiveness of the entity's internal control. An audit also includes evaluating the appropriateness of accounting policies used and the reasonableness of accounting estimates made by management, as well as evaluating the overall presentation of the consolidated financial statements.
I believe that the audit evidence I have obtained is sufficient and appropriate to provide a basis for my audit opinion.
Opinion
In my opinion, the consolidated financial statements present fairly, in all material respects, the financial position of the Province of New Brunswick as at March 31, 2016, and the results of its operations, its cash flows, changes in its net debt and changes in its accumulated deficit for the year then ended in accordance with Canadian public sector accounting standards.
| | |  | |
| | | |
Fredericton, New Brunswick | | Kim MacPherson, CPA, CA | |
September 27, 2016 | | Auditor General | |
P.O. Box 758
Fredericton, New Brunswick E3B 5B4
2016 | PROVINCE OF NEW BRUNSWICK | 21 |
CONSOLIDATED STATEMENT OF FINANCIAL POSITION
as at 31 March
| | | | (millions) | |
Schedule | | | 2016 | | | | 2015 | |
| FINANCIAL ASSETS | | | | | | | | |
1 | Cash and Short Term Investments | | $ | 2,141.1 | | | $ | 1,682.2 | |
2 | Receivables and Advances | | | 303.2 | | | | 339.2 | |
3 | Taxes Receivable | | | 1,168.3 | | | | 1,238.1 | |
4 | Inventories for Resale | | | 0.3 | | | | 1.7 | |
5 | Loans | | | 623.2 | | | | 629.3 | |
6 | Equity in Government Business Enterprises (Note 6) | | | 97.7 | | | | 214.5 | |
| Sinking Fund Equity (Note 9) | | | 4,201.3 | | | | 4,049.6 | |
6 | Other Investments | | | 49.1 | | | | 33.2 | |
| Total Financial Assets | | | 8,584.2 | | | | 8,187.8 | |
| | | | | | | | | |
| LIABILITIES | | | | | | | | |
| Short Term Borrowing (Note 4) | | | 1,680.1 | | | | 1,268.1 | |
7 | Accounts Payable and Accrued Expenses | | | 2,726.0 | | | | 2,694.7 | |
8 | Allowance for Losses | | | 25.3 | | | | 38.8 | |
9 | Deferred Revenue | | | 506.3 | | | | 490.1 | |
10 | Deposits Held in Trust | | | 362.0 | | | | 375.7 | |
11 | Obligations under Capital Leases (Note 5) | | | 733.9 | | | | 767.6 | |
| Net Pension Liability (Note 11) | | | 641.8 | | | | 628.5 | |
| | | | 6,675.4 | | | | 6,263.5 | |
| | | | | | | | | |
| Funded Debt (Note 9) | | | 20,107.1 | | | | 19,711.1 | |
| Borrowing for New Brunswick Power Corporation | | | (4,514.3 | ) | | | (4,607.1 | ) |
| Funded Debt for Provincial Purposes | | | 15,592.8 | | | | 15,104.0 | |
| Unamortized Premiums and Discounts | | | (40.8 | ) | | | (80.9 | ) |
| Unrealized Foreign Exchange Gains | | | 16.4 | | | | 19.4 | |
| | | | 15,568.4 | | | | 15,042.5 | |
| Total Liabilities | | | 22,243.8 | | | | 21,306.0 | |
| NET DEBT | | | (13,659.6 | ) | | | (13,118.2 | ) |
| NON-FINANCIAL ASSETS | | | | | | | | |
| Tangible Capital Assets (Note 7) | | | 8,738.5 | | | | 8,585.7 | |
12 | Inventories of Supplies | | | 49.4 | | | | 51.5 | |
13 | Prepaid and Deferred Charges | | | 169.6 | | | | 182.7 | |
| Total Non-Financial Assets | | | 8,957.5 | | | | 8,819.9 | |
| ACCUMULATED DEFICIT | | $ | (4,702.1 | ) | | $ | (4,298.3 | ) |
| | | | | | | | | |
| Contingent Liabilities - Note 13 | | | | | | | | |
| Commitments - Note 14 | | | | | | | | |
The accompanying notes are an integral part of these consolidated financial statements.

Paul Martin, FCPA, FCA
Comptroller
22 | PROVINCE OF NEW BRUNSWICK | 2016 |
CONSOLIDATED STATEMENT OF OPERATIONS
for the fiscal year ended 31 March
| | | (millions) | |
Schedule | | 2016
Budget | | | 2016
Actual | | | 2015
Actual | |
| REVENUE | | | | | | | | | |
| | | | | | | | | | |
| Provincial Sources | | | | | | | | | |
14 | Taxes | | $ | 4,017.2 | | | $ | 4,029.7 | | | $ | 3,983.1 | |
15 | Licenses and Permits | | | 151.7 | | | | 153.8 | | | | 149.4 | |
16 | Royalties | | | 107.2 | | | | 89.3 | | | | 97.5 | |
17 | Income from Government Business Enterprises | | | 258.0 | | | | 189.1 | | | | 270.9 | |
18 | Other Provincial Revenue | | | 628.2 | | | | 777.5 | | | | 732.6 | |
| Sinking Fund Earnings | | | 193.7 | | | | 194.1 | | | | 195.9 | |
| | | | 5,356.0 | | | | 5,433.5 | | | | 5,429.4 | |
| Federal Sources | | | | | | | | | | | | |
| Fiscal Equalization Payments | | | 1,668.9 | | | | 1,668.0 | | | | 1,666.0 | |
19 | Unconditional Grants | | | 993.1 | | | | 994.7 | | | | 955.8 | |
20 | Conditional Grants | | | 289.9 | | | | 290.0 | | | | 388.0 | |
| | | | 2,951.9 | | | | 2,952.7 | | | | 3,009.8 | |
| | | | 8,307.9 | | | | 8,386.2 | | | | 8,439.2 | |
| EXPENSE | | | | | | | | | | | | |
21 | Education and Training | | | 1,840.2 | | | | 1,846.3 | | | | 2,083.7 | |
22 | Health | | | 2,864.9 | | | | 2,899.0 | | | | 2,830.9 | |
23 | Social Development | | | 1,130.3 | | | | 1,196.4 | | | | 1,182.3 | |
24 | Protection Services | | | 258.0 | | | | 281.3 | | | | 268.7 | |
25 | Economic Development | | | 266.7 | | | | 204.0 | | | | 247.6 | |
26 | Labour and Employment | | | 133.1 | | | | 135.0 | | | | 122.6 | |
27 | Resources | | | 194.2 | | | | 185.3 | | | | 197.3 | |
28 | Transportation and Infrastructure | | | 624.1 | | | | 636.0 | | | | 649.7 | |
29 | Central Government | | | 638.2 | | | | 585.3 | | | | 540.6 | |
| Service of the Public Debt (Note 10) | | | 685.0 | | | | 678.1 | | | | 677.2 | |
| | | | 8,634.7 | | | | 8,646.7 | | | | 8,800.6 | |
| | | | | | | | | | | | | |
| ANNUAL DEFICIT (Note 2) | | $ | (326.8 | ) | | $ | (260.5 | ) | | $ | (361.4 | ) |
The accompanying notes are an integral part of these consolidated financial statements.
2016 | PROVINCE OF NEW BRUNSWICK | 23 |
CONSOLIDATED STATEMENT OF CASH FLOW
for the fiscal year ended 31 March
| | (millions) | |
| | 2016 | | | 2015 | |
OPERATING ACTIVITIES | | | | | | |
| | | | | | |
Deficit | | $ | (260.5 | ) | | $ | (361.4 | ) |
Non Cash Items | | | | | | | | |
Amortization of Premiums, Discounts and Issue Expenses | | | 7.1 | | | | 10.1 | |
Foreign Exchange Expense | | | (5.8 | ) | | | (5.8 | ) |
(Decrease) Increase in Provision for Losses | | | (3.0 | ) | | | 48.5 | |
Amortization of Tangible Capital Assets | | | 426.8 | | | | 406.0 | |
Loss on Disposal or Impairment of Tangible Capital Assets | | | 6.5 | | | | 15.1 | |
Sinking Fund Earnings | | | (194.1 | ) | | | (195.9 | ) |
Losses on Foreign Exchange Settlements | | | 2.7 | | | | 2.5 | |
Increase in Net Pension Liability (Note 11) | | | 13.3 | | | | 272.8 | |
Increase (Decrease) in Deferred Revenue | | | 16.2 | | | | (18.0 | ) |
Changes in Working Capital | | | | | | | | |
Decrease in Accounts Receivable | | | 29.1 | | | | 13.6 | |
Decrease (Increase) in Taxes Receivable | | | 66.8 | | | | (125.9 | ) |
Decrease (Increase) in Inventories | | | 3.5 | | | | (0.2 | ) |
Decrease (Increase) in Prepaid and Deferred Charges | | | 13.1 | | | | (7.3 | ) |
Increase in Accounts Payable and Accrued Expenses | | | 31.3 | | | | 59.9 | |
(Decrease) Increase in Deposits Held in Trust | | | (13.7 | ) | | | 42.1 | |
Net Cash From Operating Activities | | | 139.3 | | | | 156.1 | |
| | | | | | | | |
INVESTING ACTIVITIES | | | | | | | | |
| | | | | | | | |
Increase in Investments, Loans and Advances | | | 106.2 | | | | 42.1 | |
Other Comprehensive Loss | | | (143.3 | ) | | | (162.6 | ) |
Net Cash Used in Investing Activities | | | (37.1 | ) | | | (120.5 | ) |
| | | | | | | | |
CAPITAL TRANSACTIONS | | | | | | | | |
| | | | | | | | |
Acquisition of Capital Assets (Note 7) | | | (586.1 | ) | | | (591.0 | ) |
| | | | | | | | |
FINANCING ACTIVITIES | | | | | | | | |
| | | | | | | | |
Proceeds from Issuance of Funded Debt | | | 1,653.9 | | | | 1,644.5 | |
Purchase of NB Power Debentures | | | (494.4 | ) | | | --- | |
Elimination of Debentures held by NB Immigrant Investor Fund | | | (0.2 | ) | | | (17.0 | ) |
Received from Sinking Fund for Redemption of Debentures and Payment of Exchange | | | 196.1 | | | | 173.1 | |
(Decrease) Increase in Obligations under Capital Leases | | | (33.7 | ) | | | 51.5 | |
Sinking Fund Installments | | | (153.7 | ) | | | (142.9 | ) |
Increase (Decrease) in Short Term Borrowing | | | 412.0 | | | | (153.6 | ) |
Funded Debt Matured | | | (637.2 | ) | | | (852.4 | ) |
Net Cash from Financing Activities | | | 942.8 | | | | 703.2 | |
| | | | | | | | |
INCREASE IN CASH DURING YEAR | | | 458.9 | | | | 147.8 | |
CASH AND SHORT TERM INVESTMENTS - BEGINNING OF YEAR | | | 1,682.2 | | | | 1,534.4 | |
CASH AND SHORT TERM INVESTMENTS - END OF YEAR | | $ | 2,141.1 | | | $ | 1,682.2 | |
The accompanying notes are an integral part of these consolidated financial statements.
24 | PROVINCE OF NEW BRUNSWICK | 2016 |
CONSOLIDATED STATEMENT OF CHANGE IN NET DEBT
for the fiscal year ended 31 March
| | (millions) | |
| | 2016 Budget | | | 2016 Actual | | | 2015 Actual | |
RESTATED NET DEBT - BEGINNING OF YEAR (NOTE 17) | | | | | | | | | |
| | $ | (12,421.9 | ) | | $ | (13,118.2 | ) | | $ | (12,415.1 | ) |
CHANGES IN YEAR | | | | | | | | | | | | |
Annual Deficit | | | (326.8 | ) | | | (260.5 | ) | | | (361.4 | ) |
Other Comprehensive Loss | | | --- | | | | (143.3 | ) | | | (162.6 | ) |
Acquisition of Tangible Capital Assets (Note 7) | | | (525.9 | ) | | | (586.1 | ) | | | (591.0 | ) |
Amortization of Tangible Capital Assets (Note 7) | | | 417.2 | | | | 426.8 | | | | 406.0 | |
Loss on Disposal or Impairment of Tangible Capital Assets | | | --- | | | | 6.5 | | | | 15.1 | |
Net Change in Supplies Inventories | | | --- | | | | 2.1 | | | | (1.9 | ) |
Net Change in Prepaid Expenses | | | --- | | | | 13.1 | | | | (7.3 | ) |
INCREASE IN NET DEBT | | | (435.5 | ) | | | (541.4 | ) | | | (703.1 | ) |
NET DEBT - END OF YEAR | | $ | (12,857.4 | ) | | $ | (13,659.6 | ) | | $ | (13,118.2 | ) |
CONSOLIDATED STATEMENT OF CHANGE IN ACCUMULATED DEFICIT
for the fiscal year ended 31 March
| | (millions) | |
| | 2016 Budget | | | 2016 Actual | | | 2015 Actual | |
RESTATED ACCUMULATED DEFICIT - BEGINNING OF YEAR (NOTE 17) | | $ | (3,961.3 | ) | | $ | (4,298.3 | ) | | | (3,774.3 | ) |
| | | | | | | | | | | | |
Annual Deficit | | | (326.8 | ) | | | (260.5 | ) | | | (361.4 | ) |
Other Comprehensive Loss | | | --- | | | | (143.3 | ) | | | (162.6 | ) |
| | | | | | | | | | | | |
ACCUMULATED DEFICIT - END OF YEAR | | $ | (4,288.1 | ) | | $ | (4,702.1 | ) | | $ | (4,298.3 | ) |
The accompanying notes are an integral part of these consolidated financial statements.
2016 | PROVINCE OF NEW BRUNSWICK | 25 |
NOTES TO THE CONSOLIDATED FINANCIAL STATEMENTS
31 March 2016
NOTE 1 SUMMARY OF SIGNIFICANT ACCOUNTING POLICIES
a) Basis of Accounting
These consolidated financial statements are prepared in accordance with Canadian public sector accounting standards.
b) Provincial Reporting Entity
These consolidated financial statements include the accounts of organizations that are controlled by the Province. A complete listing of the organizations within the Province’s government reporting entity is provided in Schedule 30.
Legally established trust funds which the Province administers but does not control are not included as Provincial assets or liabilities. These consolidated financial statements disclose the equity balances of the trust funds administered by the Province in Note 16.
c) Principles of Consolidation
The accounts of organizations within the Province’s government reporting entity are included in these consolidated financial statements through one of the following accounting methods:
Consolidation Method
This method combines the accounts of distinct organizations. It requires uniform accounting policies for the organizations. The Province does not adjust the tangible capital asset policies of organizations that are consolidated using this method to those of the Province in cases where the adjustment would be immaterial. Inter- organizational balances and transactions are eliminated under this method. This method reports the organizations as if they were one organization.
Modified Equity Method
This method is used for government business enterprises (GBEs). GBEs are defined in Note 6 to these consolidated financial statements. The modified equity method reports a GBE’s net assets as an investment on the Province’s Consolidated Statement of Financial Position. The net income of the GBE is reported as income from government business enterprises on the Province’s Consolidated Statement of Operations. Inter-organizational transactions and balances are not eliminated. All gains or losses arising from inter-organizational transactions between GBEs and other government organizations are eliminated. The accounting policies of GBEs are not adjusted to conform with those of other government organizations.
Transaction Method
This method records only transactions between the Province and the other organizations. The transaction method is used when the appropriate methods would not produce a materially different result.
d) Changes in Accounting Policy
Nursing Homes Consolidation
Effective 1 April 2015, the Province retroactively changed its accounting policy to include within the Provincial Reporting Entity not-for-profit nursing homes operating in New Brunswick. As a result of this change, the financial results of Province’s not-for-profit nursing homes are now included in the Province’s consolidated financial statements using the full consolidation method. Note 17 discloses the impact of the change in accounting policy on prior periods. A complete listing of the organizations within the Province’s government reporting entity is provided in Schedule 30.
26 | PROVINCE OF NEW BRUNSWICK | 2016 |
NOTES TO THE CONSOLIDATED FINANCIAL STATEMENTS
31 March 2016
Target Benefit Pension Plans
Effective 1 April 2015, the Province retroactively changed its accounting policy for Target Benefit Pension Plans. The Province previously accounted for these plans as defined contribution plans, and is now applying defined benefit and joint defined benefit accounting treatment to these plans. Further detail can be found in Note 11(b). Note 17 discloses the impact of the change in accounting policy on prior periods.
e) Future Changes in Accounting Policy
New Standards
The Public Sector Accounting Board issued sections PS 2200 - Related Party Disclosures, PS 3210 – Assets, PS3320 - Contingent Assets, PS 3380 - Contractual Rights and PS 3420 – Inter-entity Transactions with effective dates of 1 April 2017. The Board also issued section PS 3430 - Restructuring Transactions with an effective date of 1 April 2018.
The Province plans to adopt these new and amended standards on the effective date and is currently analyzing the impact of the standards on its consolidated financial statements.
PS 3450 - Financial Instruments and PS 2601 - Foreign Currency Translation
The Public Sector Accounting Board issued section PS 3450 - Financial Instruments with an effective date of 1 April 2019. Under this new standard, financial instruments will be assigned a measurement category of either fair value, cost or amortized cost. Until a financial instrument is derecognized, any gains or losses that arise due to fair value remeasurement will be reported on the Statement of Remeasurement Gains and Losses. Adoption of this standard requires the adoption of PS 2601 - Foreign Currency Translation, PS 1201 - Financial Statement Presentation and PS 3041 - Portfolio Investments in the same fiscal year.
f) Specific Accounting Policies
Asset Classification
Assets are classified as either financial or non-financial. Financial assets are assets that could be used to discharge existing liabilities or finance future operations and are not to be consumed in the normal course of operations. Non- financial assets are acquired, constructed or developed assets that do not provide resources to discharge existing liabilities but are employed to deliver government services, may be consumed in normal operations and are not for resale. Non-financial assets include tangible capital assets, prepaid and deferred charges and inventories of supplies.
Financial Assets
Cash and Short Term Investments
Cash and short term investments are recorded at cost, which approximates market value. Short term investments include highly liquid investments that are readily convertible to known amounts of cash, with maturity dates of six months or less. Cash and short term investments include $855.0 million ($784.3 million 2015) in short term investments issued by the New Brunswick Power Corporation.
Inventories for Resale
Inventories for resale are recorded at the lower of cost or net realizable value. Properties held for resale are reported as a financial asset and include land and fixtures acquired or constructed for the purpose of sale. Properties held for resale also include properties acquired through foreclosure.
2016 | PROVINCE OF NEW BRUNSWICK | 27 |
NOTES TO THE CONSOLIDATED FINANCIAL STATEMENTS
31 March 2016
Loans
Loans are initially recorded at cost, and reported at the lower of cost and net recoverable value through a valuation allowance. Changes in the valuation allowance are recognized in expense. Interest revenue is recognized on a loan when earned, and ceases to be accrued when the collectability of either the principal or interest is not reasonably assured.
Loans issued under the Opportunities New Brunswick Act, Agricultural Development Act, and Fisheries and Aquaculture Development Act facilitate the establishment, development, or maintenance of industry in a variety of areas. As such, the nature and terms of the loans under these Acts vary. Loans to students are interest free while the student is in full-time studies and becomes repayable with interest six months after the student leaves post-secondary studies. The maximum repayment term is fifteen years. Loans issued under the New Brunswick Housing Act may offer concessionary interest rates, and are repayable over a period not to exceed twenty-five years.
Other Investments
Investments are recorded at cost, which approximates market value. Where there has been a loss in the value of an investment that is other than a temporary decline, the investment is written down to recognize this loss.
Sinking Funds
The General Sinking Fund is maintained by the Minister of Finance under the authority of section 12 of the Provincial Loans Act (“Act”). This Act provides that the Minister shall maintain one or more sinking funds for the payment of funded debt either at maturity or upon redemption in advance of maturity. Typically, redemptions are only made after the related Provincial purpose portion of the debt has been outstanding a minimum of twenty years.
Sinking fund installments are paid into the General Sinking Fund on or before the anniversary date of each issue of funded debt, at the prescribed rate of a minimum of 1% of the outstanding principal.
Sinking fund investments in bonds and debentures are reported at par value less unamortized discounts less premiums and the unamortized balance of unrealized foreign exchange gains or losses. Short-term deposits are reported at cost. The Province’s sinking fund is invested in eligible securities as defined in the Act.
New Brunswick Power Corporation (NB Power) is contractually obligated to pay to the Province the amount of the sinking fund installment required each year in respect of the debentures issued by the Province on behalf of the New Brunswick Power Corporation.
The following table shows the components of the Sinking Fund:
| | | (millions) | |
| | | Consolidated Fund | | | | NB Power | | | | Total | |
| | | | | | | | | | | | |
Fund Equity, beginning of year | | $ | 4,049.6 | | | $ | 471.3 | | | $ | 4,520.9 | |
Sinking Fund Earnings | | | 194.1 | | | | 27.6 | | | | 221.7 | |
Installments | | | 153.7 | | | | 44.6 | | | | 198.3 | |
Paid for Debt Retirement | | | (196.1 | ) | | | (79.8 | ) | | | (275.9 | ) |
| | | | | | | | | | | | |
Fund Equity, end of year | | $ | 4,201.3 | | | $ | 463.7 | | | $ | 4,665.0 | |
28 | PROVINCE OF NEW BRUNSWICK | 2016 |
NOTES TO THE CONSOLIDATED FINANCIAL STATEMENTS
31 March 2016
Liabilities
Allowances
Allowances have been established for loans and accounts receivable, loan guarantees and other possible losses. These allowances are disclosed in the schedules to the consolidated financial statements.
Obligations resulting from guaranteed loans are recorded as liabilities when management determines that a loss is probable with changes in this allowance recorded annually.
Each outstanding loan guarantee under the Opportunities New Brunswick Act is reviewed on a quarterly basis. An allowance for loss on loan guarantees is established when management determines that a loss is probable. A loss is considered probable when one or more of the following factors is present:
| · | a decline in the financial position of the borrower; |
| · | economic conditions in which the borrower operates indicate the borrower’s inability to repay the loan; |
| · | collection experience for the loan. |
Losses on guaranteed loans under the Agriculture Development Act and the Fisheries and Aquaculture Development Act for classes that have similar standards are calculated using an average rate based on past experience and trends.
Amounts due to the Province but deemed uncollectible are written off from the accounts of the Province once the write-off has been approved by either the Board of Management or Secretary to the Board of Management depending on the dollar value involved.
Retirement benefits
Retirement benefits include various retirement benefit plans and other employee future benefit plans where the province has an obligation to provide benefits to employees. Liabilities for these plans are calculated using the projected benefit method prorated on service, using various assumptions based on management’s best estimate. Pension fund assets are valued at marked-related values. The cost of benefits earned is attributed to the period that the employee provides service. Changes in the liability resulting from experience gains or losses and changes in actuarial assumptions are amortized over the expected average remaining service life of the related plan. Gains and losses arising from plan amendments are recognized in the period of the plan amendment. The plans accounted for using this method are the Provincial Court Act and the Provincial Court Judges’ Pension Act, the Members’ Superannuation Act and the Members’ Pension Act, the Pension Plan for Management Employees of New Brunswick School Districts, the Pension Plan for General Labour, Trades and Services Employees of New Brunswick School Districts, the Pension Plan for Full-Time CUPE 2745 Employees of New Brunswick School Districts, the Pension Plan for Management Employees’ of New Brunswick Nursing Homes, the Pension Plan for General and Service Employees’ of New Brunswick Nursing Homes, the Pension Plan for Nursing and Paramedical Employees’ of New Brunswick Nursing Homes, the Supplementary Retirement Plan, and the Retirement Allowance program.
Target Benefit Pension Plans are accounted for similar to the above plans except they are governed by an Agreement and Declaration of Trust which restricts access to the plan assets. On this basis, the Province records the value of the plan net assets as nil when these plans are in a net asset position. When these plans are in a net obligation position, the Province records a liability for its share. The plans accounted for using this method are: the Public Service Shared Risk Pension Plan, the New Brunswick Teachers’ Pension Plan, the Shared Risk Plan for CUPE Employees of New Brunswick Hospitals, and the Shared Risk Plan for Certain Bargaining Employees of New Brunswick Hospitals.
The Province also contributes to the Pension Plan for Part-Time and Seasonal Employees. For this plan, the Board of Trustees has the obligation to provide benefits to its members. As such, no liability is recorded by the Province. The cost recorded by the Province for this plan equals the amount of the Province’s required contribution for the period.
2016 | PROVINCE OF NEW BRUNSWICK | 29 |
NOTES TO THE CONSOLIDATED FINANCIAL STATEMENTS
31 March 2016
Sick Leave
The cost of accumulating, non-vesting sick leave benefits are determined by an actuarial valuation, using management’s best estimate of salary escalation, accumulated sick days at retirement, long term inflation rates and discount rates.
Liability for Injured Workers
The Province provides workers’ compensation benefits on a self-insured basis. Work Safe New Brunswick administers the claims on the Province’s behalf and charges a fee for this service. The liability for injured workers is determined using a number of methods to estimate future payments including: the annuity method, the loss development method, and the aggregate claims method. Future payments are then discounted to determine the present value. Annual claim payments are expensed by each department and are reported in the functional expense area related to the program in which the employee worked. The net change in the liability, excluding actual claims costs, is reported under central government.
Borrowing on Behalf of New Brunswick Power Corporation
The Province, as represented by the Consolidated Fund, has issued long term debt securities on behalf of the New Brunswick Power Corporation in exchange for debentures with like terms and conditions. This financing arrangement was used to obtain more favourable debt servicing costs.
The New Brunswick Power Corporation debentures received by the Province are reported in the Statement of Financial Position of these consolidated financial statements as a reduction of Funded Debt. The transactions involving these securities, including the debt servicing costs, are not part of the budget plan of the Province’s Consolidated Fund.
Non-Financial Assets
Tangible Capital Assets
Tangible capital assets are assets of the Province which have useful lives greater than one year. Certain dollar thresholds for capitalization have been established for practical purposes.
Tangible capital asset policies of government entities which are consolidated in these consolidated financial statements are not adjusted to conform to Provincial policies in cases where the differences are not material. The areas in which tangible capital asset policies could differ include amortization rate, estimated useful life and capitalization threshold.
Capital Leases
Long term leases, under which the Province, as lessee, assumes substantially all the benefits and risks of ownership of leased property, are classified as capital leases although certain minimum dollar thresholds are in place for practical reasons. The present value of a capital lease is accounted for as a tangible capital asset and an obligation at the inception of the lease.
Inventories of Supplies
Inventories of supplies for use are recorded at the lower of cost or net realizable value. Inventories of supplies are reported as a non-financial asset.
30 | PROVINCE OF NEW BRUNSWICK | 2016 |
NOTES TO THE CONSOLIDATED FINANCIAL STATEMENTS
31 March 2016
Revenues
Tax Revenue
Official estimates received from the federal government are used as the basis for determining federal tax revenue. Federal tax revenue amounts for the current year reflect prior year adjustments based on returns or more recent economic data.
Provincial real property tax is recognized based on the calculation of applying the relevant provincial and local service district tax rates to the assessed property value. Adjustments are made to current year revenue for future assessments and allowance for doubtful accounts.
Other provincial tax revenue is recognized based on the self-assessed returns of tax payers and tax collectors (e.g. retailers and wholesalers). This revenue is subsequently adjusted for future tax assessments and allowance for doubtful accounts. Other provincial tax revenue is also recognized from direct payments made by tax payers in completing certain types of transactions.
Grant Revenue
Government transfers are recognized as grant revenue in the period during which the transfer is authorized and all eligibility criteria have been met, except when and to the extent that the transfer gives rise to an obligation that meets the definition of a liability. Transfers meeting the definition of a liability are recorded as deferred revenue and are recognized as revenue when transfer stipulations are met. Capital projects for which the stipulation of project completion had not been met as at 31 March 2016 have been recorded as deferred capital contributions in Schedule 9. Major transfers recognized during the period include fiscal equalization payments and other transfers disclosed in Schedule 19.
Expenses
Grant Expense
Grants, entitlements and other government transfers are recognized as expense in the period during which the event giving rise to the transfer has occurred, provided that the transfer has been authorized and all eligibility criteria have been met by the recipient. Major government transfers during the period include: grants to universities, grants to municipalities, and funding provided through social and employment programs.
Debt Charges
Interest and other debt service charges are reported in the Consolidated Statement of Operations as Service of the Public Debt except as described below:
As government business enterprises are included in the Provincial Reporting Entity through modified equity accounting, the cost of servicing their debt is not included in the Service of the Public Debt expense. The cost of servicing the debt of government business enterprises is an expense included in the calculation of their net profit or loss for the year.
Interest costs imputed on the Province’s Net Pension Liability are recorded as part of pension expense, which is included in various expense functions.
Interest on debt to finance the Student Loan Portfolio is recorded as part of the Education and Training expense function.
Interest on CMHC debentures and Nursing Home debt is recorded as part of the Social Development expense function.
2016 | PROVINCE OF NEW BRUNSWICK | 31 |
NOTES TO THE CONSOLIDATED FINANCIAL STATEMENTS
31 March 2016
Interest earned on the assets of the General Sinking Fund and on other provincial assets is reported as revenue.
Note 10 to these consolidated financial statements reports the components of the Service of the Public Debt Expense function and total debt charges.
Operating Leases
All leases under which the Province does not assume substantially all the benefits and risks of ownership related to the leased property are classified as operating leases. Each rental payment required by an operating lease is recorded as an expense when it is due.
Concessionary Loans
There are two situations in which the Province charges loan disbursements entirely as expenses. These are:
| · | Loan agreements which commit the Province to provide future grants to the debtor to be used to repay the loan. |
| | |
| · | Loan agreements which include forgiveness provisions if the forgiveness is considered likely. |
In both these situations, the loan is charged to expense when it is disbursed.
Loans that are significantly concessionary because they earn a low rate of return are originally recorded as assets at the net present value of the expected future cash flows. The net present value is calculated using the Province’s borrowing rate at the time the loan was issued. The difference between the nominal value of the loan and its net present value is recorded as an expense.
g) Foreign Currency Translation and Risk Management
The Province's assets, liabilities and contingent liabilities denominated in foreign currencies are translated to Canadian dollars at the year-end rates of exchange, except where such items have been hedged or are subject to interest rate and currency swap agreements. In such cases, the rates established by the hedge or the agreements are used in the translation. Exchange gains and losses are included in the Consolidated Statement of Operations except for the unrealized exchange gains and losses arising on the translation of long term items, which are deferred and amortized on a straight line basis over the remaining life of the related assets or liabilities. Revenue and expense items are translated at the rates of exchange in effect at the respective transaction dates.
The Province borrows funds in both domestic and foreign capital markets and manages its existing debt portfolio to achieve the lowest debt costs within specified risk parameters. As a result, the Province may be exposed to foreign exchange risk. Foreign exchange or currency risk is the risk that the principal and interest payments on foreign debt will fluctuate in Canadian dollar terms due to fluctuations in foreign exchange rates.
In accordance with risk management policy guidelines, the Province uses various financial instruments and techniques to manage exposure to foreign currency risk. These financial instruments include currency forwards, cross-currency swaps and purchases of foreign denominated assets into the Province’s sinking fund.
As at 31 March 2016, the full amount of the Province’s outstanding foreign denominated debt (1,400 million US$) has been hedged by entering into cross-currency swaps, which convert the interest and principal payable from the original currency to Canadian dollars. As the entire foreign denominated debt portfolio has been hedged, the Province has no foreign currency exposure.
h) Measurement Uncertainty
Measurement uncertainty exists when there is uncertainty in the determination of the amount at which an item is recorded in the financial statements. Such uncertainty exists when there is a variance between the recognized or disclosed amount and another reasonably possible amount. Many items are measured using management’s best estimate, based on assumptions that reflect the most probable set of economic conditions and planned courses of action at the time of financial statement preparation. Estimates are updated to reflect new information as it becomes available. Actual results could differ from these estimates.
32 | PROVINCE OF NEW BRUNSWICK | 2016 |
NOTES TO THE CONSOLIDATED FINANCIAL STATEMENTS
31 March 2016
Significant estimates used in these consolidated financial statements include:
| - | Uncertainty relating to the determination of federal and provincial source tax revenues arising due to possible revisions of tax revenue amounts as a result of reassessments of prior tax periods or the timing of instalment payments. Due to its nature, the extent to which possible revisions and tax instalments will impact the estimate cannot be reasonably determined. |
| | |
| - | Uncertainty in the estimation of the amount of Canada Health Transfers and Canada Social Transfers arising from variances between the estimated and actual national and provincial tax points, or the provincial share of national population figures. Due to the numerous factors involved in the determination of such figures by the federal government, the extent to which their variability will impact the estimate cannot be reasonably determined. |
| | |
| - | Uncertainty related to the determination of the obligation or expense for pensions and other employee future benefits arising because actual results may differ from the Province’s assumptions used to estimate the amount of benefits that employees will receive and the investment return on plan assets. Due to the numerous factors that could impact the assumptions used, the extent to which their variability will impact the estimate cannot be reasonably determined. |
| | |
| - | Uncertainty relating to the allocation of payments for public private partnership road contracts arising because amortization of the capital improvement work commences in the year the rehabilitation work is expected to be performed, which may not reflect when the work is actually completed by the contractors. This may impact the timing of amortization expense and the classification of payments as a prepaid expense, accrued expenditure, or tangible capital asset. Due to the unpredictability of future events, the extent of the measurement uncertainty cannot be reasonably determined. |
| | |
| - | Uncertainty relating to the determination of the amount of accruals for the remediation of contaminated sites, future payments related to contingent liabilities, valuation allowances for loans, investments and accounts receivable, and the estimated useful lives of tangible capital assets arising because these amounts are based on probable outcomes and the use of estimates. Due to the unpredictability of future events, the extent of the measurement uncertainty cannot be reasonably determined. |
| | |
| - | Uncertainty relating to the consolidation of not-for-profit nursing homes operating in the Province arising because audited financial statements were not available for all nursing homes at the time of consolidation, and because some nursing homes use accounting frameworks and accounting policies that differ from those of the Province. The extent of these differences is not expected to be material. |
NOTE 2 BUDGET
The budget figures included in these consolidated financial statements are the amounts published in the Main Estimates, adjusted for transfers from the Supplementary Funding Provision Program. The Supplementary Funding Provision Program is an appropriation which provides funding to other programs for costs associated with contract settlements and other requirements not budgeted in a specific program.
The budgeted deficit presented in Main Estimates is $476.8 million, compared to $326.8 million presented in these financial statements. The Main Estimates budgeted deficit includes a contingency reserve of $150.0 million which was not used during the year.
2016 | PROVINCE OF NEW BRUNSWICK | 33 |
NOTES TO THE CONSOLIDATED FINANCIAL STATEMENTS
31 March 2016
Effective 1 October 2015, the New Brunswick Internal Services Agency, FacilicorpNB Ltd., Service New Brunswick and the Department of Government Services were amalgamated to form a new corporation called Service New Brunswick. The budget figures for these entities have been reallocated to reflect this change.
Budget figures for the year ending 31 March 2016 reflect the acquisition of tangible capital assets and amortization expense. These amounts are disclosed in the Main Estimates as a separate schedule.
NOTE 3 SPECIAL PURPOSE ACCOUNTS
Special Purpose Account revenue earned but not spent accumulates as a surplus in that account and may be spent in future years for the purposes specified. At 31 March 2016, the accumulated surplus in all Special Purpose Accounts totaled $117.6 million ($120.7 million 2015). This total is a component of net debt and accumulated deficit.
Descriptions of Major Special Purpose Accounts
CMHC
CMHC funding is used to provide funding for the operation of the programs that fall under the administration of the Social Housing Agreement. Fund revenues include interest earned on the fund, interest earned from second mortgages, and the cumulative excess of funding for social housing not spent to date. Expenditures from the fund are for approved CMHC program funding, any annual excess of which may be carried over for future program expenditures until the agreement expiration date in 2034. The accumulated surplus in CMHC funding at 31 March 2016 was $25.7 million ($32.9 million 2015).
Environmental Trust Fund
The Environmental Trust Fund provides financial assistance for eligible projects that are within the following categories: protection, restoration, sustainable development, conservation, education and beautification. Actual costs are reimbursed by the Environmental Trust Fund for eligible activities. The accumulated surplus as at 31 March 2016 was $23.3 million ($22.4 million 2015).
School District Self-Sustaining Accounts
Self-Sustaining Accounts record school district revenue and expenses for non-educational services such as the rental of school facilities, cafeteria operations and foreign student tuition fees. These special purpose accounts also record partnership activities with third parties to provide resources, services or grants to students. The accumulated surplus in school district self-sustaining accounts at 31 March 2016 was $38.0 million ($30.7 million 2015).
34 | PROVINCE OF NEW BRUNSWICK | 2016 |
NOTES TO THE CONSOLIDATED FINANCIAL STATEMENTS
31 March 2016
The following table summarizes the change in the accumulated Special Purpose Account surplus:
| | 2015 | | | (millions) 2016 | |
| | Accumulated
Surplus | | | Revenue | | | Expense | | | Accumulated
Surplus | |
| | | | | | | | | | | | |
Archives Trust Account | | $ | 0.1 | | | $ | --- | | | $ | --- | | | $ | 0.1 | |
Arts Development Trust Fund | | --- | | | | 0.7 | | | | 0.7 | | | --- | |
Child Centered Family Justice Fund | | | --- | | | | 0.5 | | | | 0.5 | | | | --- | |
CMHC | | | 32.9 | | | | 7.7 | | | | 14.9 | | | | 25.7 | |
Environmental Trust Fund | | | 22.4 | | | | 8.8 | | | | 7.9 | | | | 23.3 | |
Fish Stocking Fund | | | 1.0 | | | | 0.4 | | | | 0.4 | | | | 1.0 | |
Fred Magee Account | | | 0.4 | | | | --- | | | | --- | | | | 0.4 | |
GONB | | | --- | | | | 0.3 | | | | 0.1 | | | | 0.2 | |
Grand Lake Meadows | | | 0.1 | | | | --- | | | | --- | | | | 0.1 | |
Historic Places | | | 0.1 | | | | --- | | | | --- | | | | 0.1 | |
Health Services Liability Protection Plan | | | 0.1 | | | | 2.4 | | | | 2.5 | | | | --- | |
International Projects | | | --- | | | | 0.4 | | | | 0.4 | | | | --- | |
Johann Wordel Account | | | 0.1 | | | | --- | | | | 0.1 | | | | --- | |
Land Management Account | | | 10.3 | | | | 0.5 | | | | 1.7 | | | | 9.1 | |
Library Account | | | 0.3 | | | | 0.5 | | | | 0.5 | | | | 0.3 | |
Medical Research Assistance Account | | | 1.4 | | | | 0.1 | | | | 0.4 | | | | 1.1 | |
Municipal Police Assistance | | | 3.4 | | | | 1.0 | | | | 0.9 | | | | 3.5 | |
National Safety Code Agreement | | | --- | | | | 0.2 | | | | 0.2 | | | | --- | |
NB 911 Service Fund | | | 8.3 | | | | 5.3 | | | | 7.5 | | | | 6.1 | |
NB Community College Scholarship Account | | | 1.2 | | | | --- | | | | 0.9 | | | | 0.3 | |
Provincial Parks | | | 0.3 | | | | 0.1 | | | | --- | | | | 0.4 | |
Provincial Proceeds of Crime | | | 0.4 | | | | 0.2 | | | | --- | | | | 0.6 | |
Public/Private Partnership Projects | | | 0.2 | | | | --- | | | | --- | | | | 0.2 | |
Renovation of Old Government House | | | 0.2 | | | | --- | | | | --- | | | | 0.2 | |
School District Scholarship and Trusts | | | --- | | | | 0.2 | | | | 0.2 | | | | --- | |
School District Self-Sustaining Accounts | | | 30.7 | | | | 46.3 | | | | 39.0 | | | | 38.0 | |
Sport Development Trust Fund | | | --- | | | | 0.5 | | | | 0.5 | | | | --- | |
Strait Crossing Finance Inc. | | | --- | | | | 0.1 | | | | 0.1 | | | | --- | |
Suspended Driver - Alcohol Re-Education | | | 0.2 | | | | 0.3 | | | | 0.3 | | | | 0.2 | |
Trail Management Trust Fund | | | 1.3 | | | | 1.7 | | | | 1.2 | | | | 1.8 | |
Training Recoverable Projects | | | 3.2 | | | | 1.9 | | | | 2.1 | | | | 3.0 | |
Victim Services Account | | | 0.8 | | | | 2.5 | | | | 2.8 | | | | 0.5 | |
Wildlife Trust Fund | | | 1.3 | | | | 1.3 | | | | 1.2 | | | | 1.4 | |
| | $ | 120.7 | | | $ | 83.9 | | | $ | 87.0 | | | $ | 117.6 | |
2016 | PROVINCE OF NEW BRUNSWICK | 35 |
NOTES TO THE CONSOLIDATED FINANCIAL STATEMENTS
31 March 2016
NOTE 4 SHORT TERM BORROWING
Short term borrowing is recorded at cost, which approximates market value. Short term borrowing consists of $1,648.2 million ($1,218.2 million 2015) in treasury bills with interest rates ranging from 0.50% - 0.71%, maturing between 5 April and 14 December 2016 and $31.9 million ($49.9 million 2015) of bank indebtedness with interest rates ranging from 2.55% - 6.20%.
NOTE 5 OBLIGATIONS UNDER CAPITAL LEASES
The total future principal and interest payments for capital leases amount to $1,210.8 million ($1,298.9 million 2015). That amount includes $733.9 million ($767.6 million 2015) in principal and $476.9 million ($531.3 million 2015) in interest.
Minimum annual principal and interest payments in each of the next five years are as follows:
Fiscal Year | | (millions) | |
| | | | |
2016-2017 | | $ | 92.8 | |
2017-2018 | | $ | 91.7 | |
2018-2019 | | $ | 91.4 | |
2019-2020 | | $ | 90.6 | |
2020-2021 | | $ | 90.4 | |
NOTE 6 GOVERNMENT BUSINESS ENTERPRISES
A Government Business Enterprise is an organization accountable to the Legislative Assembly that has the power to contract in its own name, has the financial and operating authority to carry on a business, sells goods and services to customers outside the Provincial Reporting Entity as its principal activity, and that can, in the normal course of its operations, maintain its operations and meet its liabilities from revenues received from sources outside the Provincial Reporting Entity.
The following is a list of Government Business Enterprises, and their fiscal year ends, which are included in the Provincial Reporting Entity as listed in Schedule 30 to these consolidated financial statements.
New Brunswick Liquor Corporation (Liquor) | 27-03-16 |
New Brunswick Municipal Finance Corporation (Municipal Finance) | 31-12-15 |
New Brunswick Power Corporation (Power) | 31-03-16 |
36 | PROVINCE OF NEW BRUNSWICK | 2016 |
NOTES TO THE CONSOLIDATED FINANCIAL STATEMENTS
31 March 2016
The following table presents condensed financial information of these Government Business Enterprises.
| | (millions) | |
| | | | | Municipal | | | | | | | |
Assets | | Liquor | | | Finance | | | Power | | | Total | |
| | | | | | | | | | | | |
Cash and Equivalents | | $ | 4.4 | | | $ | 0.9 | | | $ | 2.0 | | | $ | 7.3 | |
Receivables | | | 4.8 | | | | 3.1 | | | | 236.0 | | | | 243.9 | |
Prepaids | | | 0.6 | | | | --- | | | | 11.0 | | | | 11.6 | |
Inventories | | | 29.6 | | | | --- | | | | 204.0 | | | | 233.6 | |
Derivative Assets | | | --- | | | | --- | | | | 17.0 | | | | 17.0 | |
Fixed Assets | | | 10.2 | | | | --- | | | | 4,237.0 | | | | 4,247.2 | |
Long Term Assets | | | --- | | | | --- | | | | 675.0 | | | | 675.0 | |
Regulatory Assets | | | --- | | | | --- | | | | 1,021.0 | | | | 1,021.0 | |
Long Term Notes Receivable | | | --- | | | | 866.8 | | | | 16.0 | | | | 882.8 | |
Sinking Fund Receivable | | | --- | | | | --- | | | | 464.0 | | | | 464.0 | |
Intangible Assets | | | 4.5 | | | | --- | | | | 33.0 | | | | 37.5 | |
Total Assets | | $ | 54.1 | | | | 870.8 | | | | 6,916.0 | | | | 7,840.9 | |
| | | | | | | | | | | | | | | | |
Liabilities | | | | | | | | | | | | | | | | |
Payables | | $ | --- | | | $ | 3.1 | | | $ | 296.0 | | | $ | 299.1 | |
Currrent Liabilities | | | 17.5 | | | | --- | | | | 1,350.0 | | | | 1,367.5 | |
Deferred Liabilities | | | --- | | | | --- | | | | 939.0 | | | | 939.0 | |
Other Long Term Liabilities | | | 4.8 | | | | --- | | | | --- | | | | 4.8 | |
Long Term Debt | | | --- | | | | 866.8 | | | | 4,124.0 | | | | 4,990.8 | |
Total Liabilities | | | 22.3 | | | | 869.9 | | | | 6,709.0 | | | | 7,601.2 | |
| | | | | | | | | | | | | | | | |
Equity | | | | | | | | | | | | | | | | |
Retained Earnings | | | 31.8 | | | | 0.9 | | | | 420.0 | | | | 452.7 | |
Accumulated Other Comprehensive Income | | | --- | | | | --- | | | | (213.0 | ) | | | (213.0 | ) |
Total Equity | | | 31.8 | | | | 0.9 | | | | 207.0 | | | | 239.7 | |
Total Liabilities and Equity | | $ | 54.1 | | | $ | 870.8 | | | $ | 6,916.0 | | | $ | 7,840.9 | |
| | | | | | | | | | | | | | | | |
Net Income | | | | | | | | | | | | | | | | |
Revenue | | $ | 413.2 | | | $ | 32.9 | | | $ | 1,791.0 | | | $ | 2,237.1 | |
Expenses | | | (241.7 | ) | | | (0.3 | ) | | | (1,546.0 | ) | | | (1,788.0 | ) |
Interest and Related Expense | | | --- | | | | (32.7 | ) | | | (233.0 | ) | | | (265.7 | ) |
Net Income | | $ | 171.5 | | | $ | (0.1 | ) | | $ | 12.0 | | | $ | 183.4 | |
| | | | | | | | | | | | | | | | |
Accumulated Other Comprehensive Income | | | | | | | | | | | | | | | | |
Accumulated Other Comprehensive Income, Beginning of Year | | $ | --- | | | $ | --- | | | $ | (72.0 | ) | | $ | (72.0 | ) |
Other Comprehensive Income, For the Year | | | --- | | | | --- | | | | (141.0 | ) | | | (141.0 | ) |
Accumulated Other Comprehensive Income, End of Year | | $ | --- | | | $ | --- | | | $ | (213.0 | ) | | $ | (213.0 | ) |
2016 | PROVINCE OF NEW BRUNSWICK | 37 |
NOTES TO THE CONSOLIDATED FINANCIAL STATEMENTS
31 March 2016
The financial information of Government Business Enterprises is prepared according to the accounting standards applicable to each reporting entity, using accounting policies that are appropriate for the industry segment in which they operate. These accounting policies may not be consistent with accounting policies used by other organizations under the Provincial Reporting Entity.
New Brunswick Liquor Corporation
The New Brunswick Liquor Corporation was established under the New Brunswick Liquor Corporation Act. Its business activity is the purchase, distribution and sale of alcoholic beverages throughout the Province of New Brunswick. The Corporation’s financial statements are prepared in accordance with International Financial Reporting Standards.
Subsequent to the New Brunswick Liquor Corporation’s 27 March 2016 year end, payments were made to the Province in the amount of $7.9 million. This has been reflected in the consolidated financial statements of the Province.
New Brunswick Municipal Finance Corporation
The Municipal Finance Corporation was established under the New Brunswick Municipal Finance Corporation Act. Its purpose is to provide financing for municipalities and municipal enterprises through a central borrowing authority. The Province is guarantor of all debt issued by the Corporation. The Corporation’s financial statements are prepared in accordance with International Financial Reporting Standards.
New Brunswick Power Corporation
The New Brunswick Power Corporation was established as a Crown Corporation of the Province of New Brunswick in 1920 by enactment of the New Brunswick Electric Power Act. In 2004, the New Brunswick Power Corporation continued as the New Brunswick Power Holding Corporation with new subsidiary operating companies (collectively the NB Power Group of Companies). On 1 October 2013, by enactment of the New Brunswick Electricity Act, the New Brunswick Power Group of Companies became a single, integrated Crown Corporation. The Corporation’s financial statements are prepared in accordance with International Financial Reporting Standards.
Prior to the above noted amalgamation on 1 October 2013, the financial results of the New Brunswick Power Group of Companies were recorded in the New Brunswick Electric Finance Corporation (NBEFC) using the modified equity method, with any unrealized intercompany gains or losses being eliminated upon consolidation. NBEFC’s financial results were then consolidated with those of the Province, also using the modified equity method.
Over the period 2009 – 2013, NBEFC’s net income was reduced by $153.1 million of unrealized intercompany gains related to expenses deferred under the rate regulatory accounting practice used by the New Brunswick Power Group of Companies. Due to the subsequent amalgamation of the New Brunswick Power Group of Companies and NBEFC, the Province is recognizing the total amount of $153.1 million in net income over the 27 year estimated useful life of Point Lepreau. For the fiscal year ended 31 March 2016, $5.7 million was amortized into the Province’s income. On the consolidated statement of financial position, the Province’s investment in the New Brunswick Power Corporation has been reduced by the remaining amount of the regulatory deferral ($134.1 million).
The amount of $4,124.0 million shown as long-term debt of the New Brunswick Power Corporation has been borrowed by the Province.
38 | PROVINCE OF NEW BRUNSWICK | 2016 |
NOTES TO THE CONSOLIDATED FINANCIAL STATEMENTS
31 March 2016
The New Brunswick Power Corporation’s long-term debt principal repayment schedule is as follows:
Year Ending | | (millions)
Principal Repayment | |
| | | |
March 31, 2018 | | $ | 420.0 | |
March 31, 2019 | | | 410.0 | |
March 31, 2020 | | | 450.0 | |
March 31, 2021 | | | 360.0 | |
March 31. 2022 and thereafter | | | 2,475.0 | |
Unamortized premiums | | | 9.0 | |
Total Long-term portion | | $ | 4,124.0 | |
NOTE 7 TANGIBLE CAPITAL ASSETS
Tangible capital assets include acquired, built, developed and improved tangible assets, whose useful life extends beyond the fiscal year and which are intended to be used on an ongoing basis for producing goods or delivering services.
Certain assets which have historical or cultural value, including works of art, historical documents and historical and cultural artifacts are not recognized as tangible capital assets. Land used as a site for a historical collection has been valued at $1. Intangibles and items inherited by right of the Crown, such as Crown lands, forests and mineral resources, are not recognized in the consolidated financial statements because the costs, benefits and economic value of such items cannot be reasonably and verifiably quantified. Assets under construction are not amortized until the asset is available to be put into service.
Calculation of opening balances include, where available, acquisition totals reported in Public Accounts from 1973 to 2004. Surfacing costs have been segregated starting in 2005. Prior to 2005, these costs were included in roads and highways and bridges.
Tangible capital assets are amortized on a straight-line basis over their estimated useful lives as noted in the table that follows. One-half of the annual amortization is charged in the year of acquisition and in the year of disposal.
Included in the closing costs of the various asset classes as of 31 March 2016 are costs for assets under construction, which are not amortized. These costs are: buildings and land improvements ($113.9 million); bridges, roads and highways ($118.1 million); ferries ($9.4 million), water management systems ($5.7 million), computer hardware ($0.2 million) and computer software ($24.3 million). Also included in the closing costs are capital lease amounts as follows: buildings and land improvements – cost $270.9 million, accumulated amortization of $34.7 million; roads, bridges and highways – cost $843.0 million, accumulated amortization $244.5 million; and vehicles and equipment - cost $14.1 million, accumulated amortization $6.9 million.
2016 | PROVINCE OF NEW BRUNSWICK | 39 |
NOTES TO THE CONSOLIDATED FINANCIAL STATEMENTS
31 March 2016
| | (millions)
2016 | | 2015 | |
| | Land | | Buildings and Land Improvements | | Machinery and Equipment | | Ferries | | Vehicles and Mobile Heavy Equipment | | Roads, Bridges and Highways | | Dams and Water Management Systems | | Computer Hardware and Software | | Total | | Total | |
| | | | | | | | | | | | | | | | | | | | | |
Estimated Useful Life (Years) | | Indefinite | | 20-40 | | 5-15 | | 40-50 | | 5-20 | | 20-50 | | 20-50 | | | 5 | | | | | |
| | | | | | | | | | | | | | | | | | | | | | |
Cost | | | | | | | | | | | | | | | | | | | | | | |
Opening Costs | | $ | 370.1 | | $ | 4,510.7 | | $ | 663.6 | | $ | 116.5 | | $ | 241.7 | | $ | 8,380.8 | | $ | 37.2 | | $ | 175.3 | | $ | 14,495.9 | | $ | 14,008.8 | |
Additions | | | 1.1 | | | 194.9 | | | 32.3 | | | 6.5 | | | 21.9 | | | 312.7 | | | 4.9 | | | 11.8 | | | 586.1 | | | 591.0 | |
Disposals | | | (0.4 | ) | | (6.0 | ) | | (19.1 | ) | | --- | | | (18.1 | ) | | (0.5 | ) | | (1.4 | ) | | (6.2 | ) | | (51.7 | ) | | (103.9 | ) |
Adjustments | | | --- | | | (81.5 | ) | | 81.5 | | | --- | | | --- | | | --- | | | --- | | | (2.7 | ) | | (2.7 | ) | | --- | |
Impairments | | | --- | | | (0.2 | ) | | --- | | | --- | | | -- | | | --- | | | --- | | | --- | | | (0.2 | ) | | --- | |
Closing Costs | | | 370.8 | | | 4,617.9 | | | 758.3 | | | 123.0 | | | 245.5 | | | 8,693.0 | | | 40.7 | | | 178.2 | | | 15,027.4 | | | 14,495.9 | |
Accumulated Amortization | | | | | | | | | | | | | | | | | | | | | |
Opening Accumulated Amortization | | | --- | | | 1,942.2 | | | 494.8 | | | 16.9 | | | 156.7 | | | 3,209.4 | | | 5.5 | | | 84.7 | | | 5,910.2 | | | 5,593.0 | |
Amortization | | | --- | | | 115.4 | | | 31.3 | | | 2.8 | | | 16.7 | | | 240.0 | | | 1.0 | | | 19.6 | | | 426.8 | | | 406.0 | |
Disposals | | | --- | | | (5.6 | ) | | (19.1 | ) | | --- | | | (18.1 | ) | | (0.1 | ) | | --- | | | (4.4 | ) | | (47.3 | ) | | (85.8 | ) |
Adjustments | | | --- | | | (66.4 | ) | | 66.4 | | | --- | | | --- | | | --- | | | --- | | | (0.8 | ) | | (0.8 | ) | | (3.0 | ) |
Closing Accumulated Amortization | | | --- | | | 1,985.6 | | | 573.4 | | | 19.7 | | | 155.3 | | | 3,449.3 | | | 6.5 | | | 99.1 | | | 6,288.9 | | | 5,910.2 | |
| | | | | | | | | | | | | | | | | | | | | | | | | | | | | | | |
Net Book Value | | $ | 370.8 | | $ | 2,632.3 | | $ | 184.9 | | $ | 103.3 | | $ | 90.2 | | $ | 5,243.7 | | $ | 34.2 | | $ | 79.1 | | $ | 8,738.5 | | $ | 8,585.7 | |
40 | PROVINCE OF NEW BRUNSWICK | 2016 |
NOTES TO THE CONSOLIDATED FINANCIAL STATEMENTS
31 March 2016
NOTE 8 BORROWING AUTHORITY
a) Balance of Borrowing Authority under the Provincial Loans Act
The balance of borrowing authority granted under the Provincial Loans Act is as follows:
| | (millions) | |
| | Balance 2015 | | | Authority
Granted
During
the Year | | | Borrowing During the Year | | | Balance 2016 | |
| | | | | | | | | | | | |
Loan Act 2012 | | $ | 25.6 | | | $ | --- | | | $ | 0.2 | | | $ | 25.4 | |
Loan Act 2014 | | | 524.1 | | | | --- | | | | 524.1 | | | | --- | |
Loan Act 2015 | | | --- | | | | 800.0 | | | | 93.6 | | | | 706.4 | |
| | $ | 549.7 | | | $ | 800.0 | | | $ | 617.9 | | | $ | 731.8 | |
Under the authority of section 2 of the Provincial Loans Act, the maximum temporary indebtedness of the Province is $2,200.0 million. At 31 March 2016, the short term borrowing of the Province was $1,648.2 million ($1,218.2 million 2015).
Under the authority of subsection 3(1) of the Provincial Loans Act, the Province may borrow sums required for the repayment, refinancing or renewal of securities issued or for the payment of any loan or liability, repayment of which is guaranteed by the Province. This authority is in addition to the authorities listed above.
b) Borrowing by the Municipal Finance Corporation
The New Brunswick Municipal Finance Corporation has authority under the New Brunswick Municipal Finance Corporation Act to provide financing for municipalities and municipal enterprises. The Province guarantees the debt of the corporation. As at 31 December 2015, long term debt owed by the corporation was $866.8 million ($879.3 million 2014).
2016 | PROVINCE OF NEW BRUNSWICK | 41 |
NOTES TO THE CONSOLIDATED FINANCIAL STATEMENTS
31 March 2016
NOTE 9 FUNDED DEBT
The following is a maturity schedule for the total amount of the Province’s Funded Debt.
| | | | | (millions) | |
Fiscal Year of Maturity | | Interest Rate (%) Range | | | Currency Amount | | | Total Funded Debt | | | NB Power | | | Funded Debt for Provincial Purposes | |
| | | | | | | | | | | | | | | | | | | | | | |
2016-2017 | | | 5.2 | | | USD | | $ | 500.0 | | | | 584.8 | | | | (100.0 | ) | | | 484.8 | |
| | 0.0-4.7 | | | CAD | | $ | 643.7 | | | | 643.7 | | | | (300.0 | ) | | | 343.7 | |
| | | | | | | | | | | | | 1,228.5 | | | | (400.0 | ) | | | 828.5 | |
| | | | | | | | | | | | | | | | | | | | | | |
2017-2018 | | 0.0-6.8 | | | CAD | | $ | 1,549.8 | | | | 1,549.8 | | | (420.0 | ) | | | 1,129.8 | |
| | | | | | | | | | | | | | | | | | | | |
2018-2019 | | | 2.8 | | | USD | | $ | 750.0 | | | | 734.0 | | | (130.0 | ) | | | 604.0 | |
| | 0.0-2.2 | | | CAD | | $ | 406.9 | | | | 406.9 | | | | (280.0 | ) | | | 126.9 | |
| | | | | | | | | | | | | 1,140.9 | | | | (410.0 | ) | | | 730.9 | |
| | | | | | | | | | | | | | | | | | | | |
2019-2020 | | 0.0-6.8 | | | CAD | | $ | 964.1 | | | | 964.1 | | | (450.0 | ) | | | 514.1 | |
| | Floating | | | CAD | | $ | 350.0 | | | | 350.0 | | | | --- | | | | 350.0 | |
| | | | | | | | | | | | | 1,314.1 | | | | (450.0 | ) | | | 864.1 | |
| | | | | | | | | | | | | | | | | | | | | |
2020-2021 | | | 9.8 | | | USD | | $ | 200.0 | | | | 243.5 | | | (194.6 | ) | | | 48.9 | |
| | 0.0-6.8 | | | CAD | | $ | 1,418.1 | | | | 1,418.1 | | | | (165.0 | ) | | | 1,253.1 | |
| | | | | | | | | | | | | 1,661.6 | | | | (359.6 | ) | | | 1,302.0 | |
| | | | | | | | | | | | | | | | | | | | | |
2021-2022 | | | 8.8 | | | USD | | $ | 200.0 | | | | 227.5 | | | (129.7 | ) | | | 97.8 | |
& After | | 1.6-6.7 | | | CAD | | $ | 12,599.4 | | | | 12,599.4 | | | | (2,345.0 | ) | | | 10,254.4 | |
| | | | | | | | | | | | | 12,826.9 | | | | (2,474.7 | ) | | | 10,352.2 | |
Total Funded Debt | | | 19,721.8 | | | | (4,514.3 | ) | | | 15,207.5 | |
| | | | | | | | | | | | |
Add: CMHC Debentures (Interest rate: 0.9% - 11.0%; Maturity date: 2017 - 2032) | | | 85.3 | | | | --- | | | | 85.3 | |
| | | | | | | | | | | | |
Add: Nursing Home Mortgages (Interest rate: 1.1% - 14.0%; Maturity date: 2016 - 2038) | | | 447.7 | | | | --- | | | | 447.7 | |
| | | | | | | | | | | | |
Less: Debt Issued to the New Brunswick Immigrant Investor Fund (2009) Ltd. | | | 147.7 | | | | --- | | | | 147.7 | |
| | | | | | | | | | | | |
Funded Debt Before Sinking Fund | | | 20,107.1 | | | | (4,514.3 | ) | | | 15,592.8 | |
| | | | | | | | | | | | |
Less: Sinking Fund Equity | | | 4,665.0 | | | | (463.7 | ) | | | 4,201.3 | |
| | | | | | | | | | | | |
Funded Debt Outstanding | | $ | 15,442.1 | | | $ | (4,050.6 | ) | | $ | 11,391.5 | |
42 | PROVINCE OF NEW BRUNSWICK | 2016 |
NOTES TO THE CONSOLIDATED FINANCIAL STATEMENTS
31 March 2016
Pursuant to section 12 of the Provincial Loans Act, the Minister of Finance maintains a General Sinking Fund for the repayment of funded debt either at maturity or upon redemption in advance of maturity. At 31 March 2016, the equity of the General Sinking Fund accumulated for the repayment of Provincial Debt was $4,201.3 million ($4,049.6 million 2015). The market value of the General Sinking Fund is $4,880.9 million ($4,950.3 million 2015). Some of the assets of this Fund are bonds and debentures issued or guaranteed by the Province of New Brunswick. The provincial net book value of these investments at 31 March 2016 was $1,642.3 million ($1,646.8 million 2015).
Because government business enterprises are included in the reporting entity through modified equity accounting, long term debt issued directly by those enterprises is not included in the amount of Funded Debt Outstanding. Note 6 to these consolidated financial statements discloses the long term debt obligations of government business enterprises.
The following amounts, which are payable swap agreements, have been included in the preceding funded debt maturity schedule. They have been reflected in that schedule in the currency payable per each financial swap agreement.
| | (millions) | |
Fiscal Year of Maturity | | Payable in Original Currency | | Per Financial Swap Agreement | | Canadian Dollar Equivalent | |
2016-2017 | | USD $500.0 | | CAN $584.8 | | $ | 584.8 | |
2018-2019 | | USD $750.0 | | CAN $734.0 | | | 734.0 | |
2020-2021 | | USD $50.0 | | CAN $48.9 | | | 48.9 | |
2022-2023 | | USD $100.0 | | CAN $97.8 | | | 97.8 | |
| | | | | | $ | 1,465.5 | |
The swap agreements are interest rate and currency swap agreements.
The CMHC Debenture principal repayment schedule is as follows:
| | (millions) | |
Fiscal Year | | Principal Repayment | |
2016-2017 | | $ | 9.0 | |
2017-2018 | | $ | 9.2 | |
2018-2019 | | $ | 9.5 | |
2019-2020 | | $ | 10.0 | |
2020-2021 and thereafter | | $ | 47.6 | |
2016 | PROVINCE OF NEW BRUNSWICK | 43 |
NOTES TO THE CONSOLIDATED FINANCIAL STATEMENTS
31 March 2016
Nursing Home Mortgages
Fiscal Year | | (millions) Principal Repayment | |
2016-2017 | | $ | 28.1 | |
2017-2018 | | $ | 42.5 | |
2018-2019 | | $ | 25.0 | |
2019-2020 | | $ | 36.8 | |
2020-2021 and thereafter | | $ | 315.3 | |
The following estimated payments are required in each of the next five years to meet the sinking fund provisions of existing debt:
| | (millions) | |
Fiscal Year | | Total Installments on Debt | | | NB Power | | | Installments on Provincial Purpose Debt | |
2016-2017 | | $ | 200.5 | | | $ | (45.1 | ) | | $ | 155.4 | |
2017-2018 | | $ | 187.3 | | | $ | (41.1 | ) | | $ | 146.2 | |
2018-2019 | | $ | 159.4 | | | $ | (33.8 | ) | | $ | 125.6 | |
2019-2020 | | $ | 157.8 | | | $ | (32.8 | ) | | $ | 125.0 | |
2020-2021 | | $ | 144.6 | | | $ | (28.2 | ) | | $ | 116.4 | |
44 | PROVINCE OF NEW BRUNSWICK | 2016 |
NOTES TO THE CONSOLIDATED FINANCIAL STATEMENTS
31 March 2016
NOTE 10 DEBT CHARGES
The total cost of interest, exchange, amortization and related expenses is $511.4 million ($542.6 million 2015), which consists of:
| | (millions) | |
| | 2016 | | | 2015 | |
Interest | | $ | 822.9 | | | $ | 828.1 | |
Interest on Fredericton – Moncton Highway Capital Lease | | | 41.0 | | | | 43.1 | |
Interest on Other Capital Leases | | | 10.2 | | | | 7.5 | |
Foreign Exchange Expense | | | (5.8 | ) | | | (5.8 | ) |
Amortization of Discounts and Premiums | | | 7.1 | | | | 10.1 | |
Other Expenses | | | 0.9 | | | | 0.8 | |
| | | 876.3 | | | | 883.8 | |
Interest Recovery for Debt Incurred for the New Brunswick Power Corporation | | | (198.2 | ) | | | (206.6 | ) |
Service of the Public Debt | | | 678.1 | | | | 677.2 | |
Sinking Fund Earnings | | | (194.1 | ) | | | (195.9 | ) |
| | | 484.0 | | | | 481.3 | |
Pension Interest | | | 5.4 | | | | 38.2 | |
Interest on Debt to Finance Student Loan Portfolio | | | 4.7 | | | | 6.1 | |
Interest on CMHC Debentures | | | 2.8 | | | | 2.6 | |
Interest on Nursing Home Debt | | | 14.5 | | | | 14.4 | |
| | $ | 511.4 | | | $ | 542.6 | |
2016 | PROVINCE OF NEW BRUNSWICK | 45 |
NOTES TO THE CONSOLIDATED FINANCIAL STATEMENTS
31 March 2016
NOTE 11 RETIREMENT BENEFITS
a) Description
Employees of the Province and certain other entities, as well as members of the Legislative Assembly, are entitled to receive retirement benefits under a number of plans. The following is a summary of the funding and member benefits. Complete plan descriptions are contained in the specific plan documentation.
Defined Benefit Pension Plans
Eligible non-teaching employees of school districts participate in the Pension Plan for Management Employees of New Brunswick School Districts (Sch-Mgt), the Pension Plan for General Labour, Trades and Services Employees of New Brunswick School Districts (GLTS), or the Pension Plan for Full-Time CUPE 2745 Employees of New Brunswick School Districts (CUPE 2745). Each plan provides a basic pension benefit based on years of service and salary, along with capped annual inflation protection. Employees contribute up to 6.5% of earnings to the CUPE 2745 plan and up to 7.0% of earnings to the GLTS plan. There are no current contributors to the Sch-Mgt plan as it has been curtailed. The Province contributes an amount as determined by the actuary in order to fund the benefits. Pension trust funds, distinct from the Consolidated Fund, exist for each plan. The GLTS and CUPE 2745 trust funds invest in fixed income securities and equities. The Sch-Mgt trust fund invests in various fixed income, equity, inflation linked, and alternative investment pooled funds.
Provincial Court Judges receive pension benefits under the Provincial Court Act and the Provincial Court Judges’ Pension Act (Judge). The basic pension benefit is based on years of service and salary, along with capped annual inflation protection. Judges contribute 8.0% of earnings, and the Province contributes an amount as determined by the actuary to fund the benefits. A pension trust fund, distinct from the Consolidated Fund, exists to fund a portion of the benefits. A portion of the benefits payable to the Judges is paid from the Consolidated Fund. The trust fund invests in various fixed income, equity, inflation linked, and alternative investment pooled funds.
Members of the Legislative Assembly previously earned pension benefits under the Members’ Superannuation Act and Members’ Pension Act (Member). These plans have been curtailed. The Plans provide a pension benefit based on salary and number of years of service as a Minister, and average indemnity and number of sessions served as an MLA plus additional supplementary allowances. There is no segregated pension trust fund for these plans. The Province pays benefits as they become due out of the Consolidated Fund.
Certain pension benefits relating to early retirement initiatives, enhanced provisions for Deputy Ministers and Ministers, and benefits on salary in excess of the maximum salary covered under the Public Service Shared Risk Pension Plan are provided for under the Supplementary Retirement Plan (SERP). The excess employer and employee contributions relating to the Public Service Shared Risk Pension Plan are deposited into a Retirement Compensation Arrangement, which was established in 2015 to receive contributions and pay benefits. As at 31 March, $11.4 million has been deposited into the account. Benefit payments are currently being paid out of the Consolidated Fund.
Certain eligible employees of nursing homes participate in either the Pension Plan for Management Employees’ of New Brunswick Nursing Homes (NH-Mgt) or the Pension Plan for Nursing and Paramedical Employees’ of New Brunswick Nursing Homes (NH-N&P). The Plans provide a pension benefit based on years of service and salary, along with capped annual inflation protection. Employees contribute 5.8% of earnings up to YMPE and 7.5% of earnings in excess of YMPE to the NH-Mgt plan, and 5.3% of earning up to YMPE and 7.0% of earnings in excess of YMPE to the NH-N&P plan. The nursing homes contribute an amount required, as determined by the actuary, to fund the benefits. Pension trust funds, distinct from the Consolidated Fund, exist for each plan. The trust funds invest in fixed income securities, equities, and alternative investments.
Certain eligible employees of nursing homes participate in the Pension Plan for General and Service Employees’ of New Brunswick Nursing Homes (NH-G&S). A future annual pension benefit accrues to employees as they provide service based on a percentage of salary, and is subject to capped inflation protection from the time it is earned. Employees contribute 6.5% of earnings up to YMPE and 9.03% of earnings in excess of YMPE toward current service, and the nursing homes are required to match this contribution. If special payments are required, regulations specify that they are to be shared equally by employees and employers, and that the amount cannot exceed 25% of the current service cost contribution. Additional amortization payments related to an unfunded liability that existed at 30 June 2008 are currently being paid by the employer. A pension trust fund, distinct from the Consolidated Fund, exists for the plan. The trust fund invests in fixed income securities, equities, and alternative investments.
46 | PROVINCE OF NEW BRUNSWICK | 2016 |
NOTES TO THE CONSOLIDATED FINANCIAL STATEMENTS
31 March 2016
Defined Contribution Pension Plans
Eligible part-time, seasonal and contract employees of the Province may participate in the Pension Plan for Part- Time and Seasonal Employees (Part-time). Employees may contribute 2.0%, 3.25%, or 4.5% of earnings. The Province matches the employee contribution, and has no further benefit obligation. The contributions, along with earnings, are attributed to separate member accounts which are used to fund the future retirement benefit.
Target Benefit Pension Plans
As of 31 March 2016, four provincially sponsored pension plans (collectively “the Plans”) have been converted to a new form of pension plan which targets a retirement benefit as opposed to guaranteeing it. The Shared Risk Plan for CUPE Employees of New Brunswick Hospital (H-CUPE) and the Shared Risk Plan for Certain Bargaining Employees of New Brunswick Hospitals (H-CBE) converted on 1 July 2012. The Public Service Shared Risk Pension Plan (PSSRP) converted on 1 January 2014, and the New Brunswick Teachers’ Pension Plan (NBTPP) converted on 1 July 2014.
Each plan is governed by a Board of Trustees to which the Province has appointed one-half of the members. Once appointed, the Province does not have the right to remove a trustee. The boards are fully responsible for the management of the plans, including investment of the assets and administration of the plan. Each plan has a funding policy which outlines actions the Board of Trustees must take in the event the plan is not fully funded based on actuarial valuations. The required actions and timing differ from plan to plan and include adjustment of ancillary benefits including CPI adjustments, adjustment of employer and employee contributions and adjustment of base pension benefits. The funding policy also prescribes the required actions when these plans return to a funded position. The Plans are jointly funded by employees and the Province. Contribution rates are prescribed by the pension plan Board of Trustees in accordance with the plan documents, which establish the maximum amounts by which the rates can be increased or decreased from the following contribution rates:
| | Employee | | Employ |
PSSRP | | 7.5% below YMPE, 10.7% above YMPE | | 12.5% (Includes temporary contribution of 1.25%) |
NBTPP | | 9.0% below YMPE, 10.7% above YMPE | | 11.5% below YMPE, 13.2% above YMPE |
H-CUPE | | 9.0% | | 10.1% |
H-CBE | | 7.8% | | 7.8% |
(YMPE – year’s maximum pensionable earnings)
A targeted pension benefit, based on a percentage of salary, accrues to employees as they provide service. Subject to the terms of the funding policy, the benefit may be adjusted for inflation from the time it is earned. Future benefits and benefits already earned may be adjusted by the plans’ boards of trustees, based on the funding status of each plan and in accordance with specified steps outlined in the funding policy.
The Province has guaranteed that retirement benefits for members of the PSSRP will never be less than the base benefit level at the time of conversion. On conversion, the primary obligation for paying retirement benefits to the members of the former Public Service Superannuation Plan and the assets of this plan were transferred to the trustees of the PSSRP. While the assets and primary obligation to pay benefits were transferred, should the PSSRP Board of Trustees reduce benefits below base benefit level at conversion, the Province will have an obligation as a result of the guarantee. No guarantee has been provided to members of any other converted pension plan.
2016 | PROVINCE OF NEW BRUNSWICK | 47 |
NOTES TO THE CONSOLIDATED FINANCIAL STATEMENTS
31 March 2016
Separate pension trust funds exist for each of the plans. The PSSRP and NBTPP trust funds invest in various fixed income, equity, inflation linked, and alternative investment pooled funds. The H-CUPE and H-CBE trust fund investment policies allow for investment in fixed income securities, equities, real estate and infrastructure.
Retirement Allowance Plan
The Province provides other employee future benefits in the form of an allowance paid at retirement, which is based on years of service to a maximum of 25 years and salary at retirement. This is an unfunded program, with no segregated assets to pay benefits. Effective 1 April 2011, the program has been discontinued for new entrants to the non-bargaining group of employees. For management and non-union employees with a continuous service date before 1 April 2011, the accumulation of retirement allowance credits was discontinued as of 31 March 2013. Eligible employees were provided with the option of a payout in lieu of retirement allowance or to defer their retirement allowance until retirement based on accumulated credits as of 31 March 2013 and salary upon retirement. For certain bargaining groups, the accumulation of retirement allowance credits will be discontinued with effective dates ranging from 31 March 2016 to 31 March 2019, depending on the bargaining group. Eligible employees have been provided with the option of a payout in lieu of retirement allowance, with some bargaining groups allowing employees to voluntarily receive their payout in lieu before the date of discontinuance. The Province has recorded an expense of $18.8 million ($0.4 million 2015) to reflect the impact of the curtailment on the measurement of the accrued benefit obligation.
b) Net Retirement Benefit Liability
For the defined benefit pension plans, the Province is liable for any excess of accrued pension benefits over pension fund assets. The target benefit plans are governed by an Agreement and Declaration of Trust, which restricts access to the plan assets. The Province records the value of plan net assets as nil when the plans are in a net asset position. When the plans are in a net obligation position, the province records a liability for its share (100% for the Public Service Shared Risk Pension Plan due to the pre-conversion base benefit guarantee, and 50% for the remaining three plans). Settlement of the obligation will occur in future periods as contributions maintain a fully funded plan status over time. For the defined contribution plan, the Province’s obligation is limited to the contribution required for the period. A liability would only be recorded if the Province had not paid the required annual contribution. For the Retirement Allowance Plan, the Province is liable for the accrued benefit obligation.
As at 31 March 2016, the value of accrued benefits for all defined benefit pension plans exceeded the value of plan assets resulting in an actuarial benefit liability of $520.1 million ($526.0 million 2015). The calculation of this liability includes estimates of future events and market values of assets which can be volatile. Actual results may differ from the estimates used, creating a need for future adjustments. These adjustments are amortized into expense over the estimated remaining service life of employees, due to their tentative nature and the fact that further adjustments are likely to occur in the future. Currently, unamortized adjustments total $102.6 million ($124.6 million 2015). A valuation adjustment of $1.8 million ($5.8 million 2015) has been recorded to reflect the portion of the adjusted benefit asset of individual plans that exceeds the expected future economic benefit. The net pension liability after considering unamortized adjustments and valuation allowance is $419.3 million ($407.2 million 2015). This net balance, which is included in the amount reported on the Consolidated Statement of Financial Position, reflects the accounting methodology of deferring and amortizing the adjustments. This balance does not represent the actuarial pension liability.
The Province accounts for the NH-G&S plan as a joint defined benefit plan, where only the Province’s portion of the net benefit liability is included in the amount reported on the Consolidated Financial Statement of Financial Position. The Province has also recorded an accrued benefit obligation for a schedule of amortization payments relating to an unfunded liability that existed as at 30 June 2008. Since the participating nursing homes and plan members share current service cost and special payments not related to the 30 June 2008 amortization schedule, the Province records 50% of the plan’s accrued benefit obligation, net of the present value of the amortization payments, and 50% of total plan assets. As at 31 March 2016, the Plan had an actuarial benefit liability of $63.0 million ($28.0 million 2015). Included in the amounts reported under defined benefit plans above is $38.9 million ($22.3 million 2015) for the Province’s share of the plan’s actuarial benefit liability, and $24.4 million ($27.5 million 2015) for the Province’s share of the plan’s net benefit liability after unamortized adjustments of $(14.5) million ($5.2 million 2015).
48 | PROVINCE OF NEW BRUNSWICK | 2016 |
NOTES TO THE CONSOLIDATED FINANCIAL STATEMENTS
31 March 2016
As at 31 March 2016, the value of the Province’s share of accrued benefits for all target benefit pension plans exceeded the value of the plan assets resulting in an actuarial benefit liability of $374.2 million ($(113.7) million 2015). The calculation of this liability includes estimates of future events and market values of assets which can be volatile. Actual results may differ from the estimates used, creating a need for future adjustments. These adjustments are amortized into expense over the estimated remaining service life of employees, due to their tentative nature and the fact that further adjustments are likely to occur in the future. Currently, unamortized adjustments total $578.4 million ($20.0 million 2015). A valuation adjustment of $426.7 million ($355.0 million 2015) has been recorded to reflect the portion of the adjusted benefit asset of individual plans that exceeds the expected future economic benefit. The net pension liability after considering unamortized adjustments and valuation allowance is $222.5 million ($221.3 million 2015). This net balance, which is included in the amount reported on the Consolidated Statement of Financial Position, reflects the accounting methodology of deferring and amortizing the adjustments. This balance does not represent the actuarial pension liability.
The value of accrued benefits in the Retirement Allowance Plan totals $463.1 million ($516.2 million 2015). The calculation of this liability includes estimates of future events which can be volatile. Actual results may differ from the estimates used, creating a need for future adjustments. These adjustments are amortized into expense over the estimated remaining service life of employees, due to their tentative nature and the fact that further adjustments are likely to occur in the future. Currently, unamortized adjustments total $5.7 million ($(64.8) million 2015). The net benefit liability after considering unamortized adjustments is $468.8 million ($451.4 million 2015).
The estimate of the Provincial share of the net pension and other employee future benefits liability is based on actuarial valuations for accounting purposes using the projected unit credit method, calculated as at the dates listed in Section d). This method estimates the present value of retirement benefits associated with the period of employee service to the valuation date. In the years that accounting valuations are not prepared, the obligation is calculated by an extrapolation from the previous valuation. These actuarial valuations were based on a number of assumptions about future events, such as rates of return on assets, wage and salary increases and employee turnover and mortality disclosed in sections d) and e). Pension assets are measured at fair value. The obligation and assets of H-CUPE, H-CBE and the non-teaching school district plans (Sch-Mgt, GLTS, CUPE 2745) have been measured at 31 December. All other plans are measured at 31 March.
2016 | PROVINCE OF NEW BRUNSWICK | 49 |
NOTES TO THE CONSOLIDATED FINANCIAL STATEMENTS
31 March 2016
c) Summary Retirement Benefits Information
Retirement Benefit Liability and Expense (millions)
| | 2016 | | | 2015 | |
| | Pensions | | | Retirement Allowance | | | Total | | | Pensions | | | Retirement Allowance | | | Total | |
| | | | | | | | | | | | | | | | | | | | | | | | |
Accrued benefit obligation beginning of year | | $ | 12,114.2 | | | $ | 516.2 | | | $ | 12,630.4 | | | $ | 13,889.6 | | | $ | 463.1 | | | $ | 14,352.7 | |
Actuarial (gains) losses | | | 87.8 | | | | (69.4 | ) | | | 18.4 | | | | 434.9 | | | | 41.1 | | | | 476.0 | |
Ran amendments | | | --- | | | | --- | | | | --- | | | | (183.2 | ) | | | --- | | | | (183.2 | ) |
Ran settlements | | | --- | | | | --- | | | | --- | | | | (2,481.3 | ) | | | --- | | | | (2,481.3 | ) |
Curtailment costs | | | | | | | 18.8 | | | | 18.8 | | | | 0.1 | | | | 0.4 | | | | 0.5 | |
Transfer from other agencies | | | 0.9 | | | | --- | | | | 0.9 | | | | --- | | | | --- | | | | --- | |
Benefits accrued | | | 317.4 | | | | 37.3 | | | | 354.7 | | | | 320.3 | | | | 33.5 | | | | 353.8 | |
Interest | | | 720.6 | | | | 13.1 | | | | 733.7 | | | | 742.7 | | | | 18.3 | | | | 761.0 | |
Benefit payments | | | (602.5 | ) | | | (52.9 | ) | | | (655.4 | ) | | | (608.9 | ) | | | (40.2 | ) | | | (649.1 | ) |
Accrued benefit obligation end of year | | | 12,638.4 | | | | 463.1 | | | | 13,101.5 | | | | 12,114.2 | | | | 516.2 | | | | 12,630.4 | |
| | | | | | | | | | | | | | | | | | | | | | | | |
Ran assets beginning of year | | | 11,701.9 | | | | --- | | | | 11,701.9 | | | | 12,928.1 | | | | --- | | | | 12,928.1 | |
Actuarial gains (losses) | | | (508.9 | ) | | | --- | | | | (508.9 | ) | | | 694.9 | | | | --- | | | | 694.9 | |
Expected return on plan assets | | | 715.2 | | | | --- | | | | 715.2 | | | | 704.5 | | | | --- | | | | 704.5 | |
Employer contributions | | | 257.2 | | | | --- | | | | 257.2 | | | | 260.9 | | | | --- | | | | 260.9 | |
Employee contributions | | | 177.7 | | | | --- | | | | 177.7 | | | | 183.6 | | | | --- | | | | 183.6 | |
Ran settlements | | | --- | | | | --- | | | | --- | | | | (2,465.4 | ) | | | --- | | | | (2,465.4 | ) |
Benefit payments | | | (599.0 | ) | | | --- | | | | (599.0 | ) | | | (604.7 | ) | | | --- | | | | (604.7 | ) |
Plan assets end of year | | | 11,744.1 | | | | | | | | 11,744.1 | | | | 11,701.9 | | | | | | | | 11,701.9 | |
| | | | | | | | | | | | | | | | | | | | | | | | |
Actuarial Benefit Liability | | | 894.3 | | | | 463.1 | | | | 1,357.4 | | | | 412.3 | | | | 516.2 | | | | 928.5 | |
| | | | | | | | | | | | | | | | | | | | | | | | |
Unamortized Adjustments | | | (681.0 | ) | | | 5.7 | | | | (675.3 | ) | | | (144.6 | ) | | | (64.8 | ) | | | (209.4 | ) |
Valuation Adjustment | | | 428.5 | | | | --- | | | | 428.5 | | | | 360.8 | | | | --- | | | | 360.8 | |
Net Benefit Liability | | $ | 641.8 | | | $ | 468.8 | | | $ | 1,110.6 | | | $ | 628.5 | | | $ | 451.4 | | | $ | 1,079.9 | |
| | | | | | | | | | | | | | | | | | | | | | | | |
Expense | | | | | | | | | | | | | | | | | | | | | | | | |
Employers’ share of benefits earned | | $ | 174.8 | | | $ | 37.3 | | | $ | 212.1 | | | $ | 159.4 | | | $ | 33.5 | | | $ | 192.9 | |
Net interest | | | 5.4 | | | | 13.1 | | | | 18.5 | | | | 38.2 | | | | 18.3 | | | | 56.5 | |
Ran amendments | | | --- | | | | --- | | | | --- | | | | (183.2 | ) | | | --- | | | | (183.2 | ) |
Curtailment costs | | | --- | | | | 18.8 | | | | 18.8 | | | | 0.1 | | | | 0.4 | | | | 0.5 | |
Adjustments recognized due to plan amendment | | | --- | | | | --- | | | | --- | | | | 130.9 | | | | --- | | | | 130.9 | |
Amortization of adjustments | | | 60.3 | | | | 1.7 | | | | 62.0 | | | | 53.4 | | | | 7.3 | | | | 60.7 | |
Change in valuation adjustment | | | 67.5 | | | | --- | | | | 67.5 | | | | 247.0 | | | | --- | | | | 247.0 | |
Ran settlements | | | --- | | | | --- | | | | --- | | | | 115.0 | | | | --- | | | | 115.0 | |
Benefit expense, defined benefit and target benefit
pension plans and Retirement Allowance Ran | | | 308.0 | | | | 70.9 | | | | 378.9 | | | | 560.8 | | | | 59.5 | | | | 620.3 | |
Benefit expense, defined contribution pension plan | | | 1.8 | | | | | | | | 1.8 | | | | 1.8 | | | | | | | | 1.8 | |
Total retirement benefit expense | | $ | 309.8 | | | $ | 70.9 | | | $ | 380.7 | | | $ | 562.6 | | | $ | 59.5 | | | $ | 622.1 | |
50 | PROVINCE OF NEW BRUNSWICK | 2016 |
NOTES TO THE CONSOLIDATED FINANCIAL STATEMENTS
31 March 2016
The defined benefit pension plans and target benefit pension plans have a combined actuarial pension liability of $641.8 million ($628.5 million 2015). This total includes plans that have assets in excess of the accrued benefit obligation. The plans with assets in excess of accrued benefit obligations have assets totaling $2,732.5 million ($9,845.9 million 2015) and an accrued benefit obligation totaling $2,591.0 million ($9,487.9 million 2015), resulting in net actuarial pension liability of $(141.5) million ($(358.0) million 2015).
The pension fund one-year rate of return as at 31 March 2016 for Judge is 1.98% (14.64% 2015), NH-Mgt -1.19% (12.15% 2015), NH-N&P -1.13% (12.32% 2015), NH-G&S -0.94% (12.29% 2015), PSSRP 1.73% (13.59% 2015) and NBTPP 1.55% (14.65% 2015). The one-year rate of return as at 31 December 2015 for Sch-Mgt is 5.62% (8.10% 2014), GLTS 3.91% (10.14% 2014), CUPE 2745 4.10% (9.78% 2014), H-CUPE 3.1% (10.0% 2014) and H-CBE 5.8% (11.1% 2014).
d) Actuarial Assumptions
Calculation of the Province's pension and other employee future benefit obligations and related expense is based on long term actuarial assumptions. Salary increase assumptions have been refined to include the short term.
The table below discloses the assumptions used in the actuarial valuations.
Plan | | Date of Latest Actuarial Valuation | | Discount Rate and Expected Rate of Return (%) | | Inflation (%) | | Rate of Pension Escalation after Retirement (%) | | Annual Wage and Salary Increase (%) | |
| | | | | | | | | | Short-Term | | Long-Term | |
Judge | | 01 Apr 2013 | | 6.15 | | 2.25 | | 2.05 to 2.15 | | 4.00 | | 4.00 | |
Sch-Mgt | | 31 Dec 2015 | | 6.05 | | 2.25 | | 1.95 | | 1.50 | | 2.75 | |
GLTS | | 31 Dec 2015 | | 6.05 | | 2.25 | | 2.00 | | 1.50 | | 2.75 | |
CUPE 2745 | | 31 Dec 2015 | | 6.05 | | 2.25 | | 2.00 | | 1.50 | | 2.75 | |
Member | | 31 Mar 2015 | | 3.19 | | 1.50 | | 1.29 | | n/a | | n/a | |
SERP | | 01 Jan 2014 | | 3.19 | | 1.50 | | 1.29 | | 1.50 | | 2.00 | |
NH-Mgt | | 31 Dec 2014 | | 6.20 | | 2.25 | | 2.25 | | 1.50 | | 2.75 | |
NH-N&P | | 31 Dec 2014 | | 6.20 | | 2.25 | | 2.25 | | 1.50 | | 2.75 | |
NH-G&S | | 31 Dec 2014 | | 6.20 | | 2.25 | | 2.00 | | 1.50 | | 2.75 | |
PSSRP | | 01 Jan 2015 | | 6.00 | | 2.25 | | 1.93 | | 1.50 | | 2.75 | |
NBTPP | | 30 Jun 2014 | | 6.15 | | 2.25 | | 1.69 | | 2.75 | | 2.75 | |
H-CBE | | 31 Dec 2014 | | 5.70 | | 2.25 | | 1.88 | | 1.50 | | 3.00 | |
H-CUPE | | 31 Dec 2014 | | 5.45 | | 2.25 | | 2.13 | | 1.50 | | 2.75 | |
Retirement | | | | | | | | | | | | | |
Allowance | | 31 Mar 2015 | | 3.19 | | 1.50 | | n/a | | 1.50 | | 2.00 to 2.75 | |
_________
* excludes promotional scale
These assumptions, which are based on management's best estimate, have been used to determine the amount of the Province's obligation for pension and other employee future benefits outstanding and the value of benefits earned by employees during the fiscal year. Different assumptions have been used to determine the appropriate level of employee and employer contributions needed to fund the estimated cost of the plans.
2016 | PROVINCE OF NEW BRUNSWICK | 51 |
NOTES TO THE CONSOLIDATED FINANCIAL STATEMENTS
31 March 2016
e) Member Data
The following table lists data about the members of each plan.
Plan | | Estimated Average Remaining Service Life (Years) | | | Number of Active Contributors | | | Number of Pensioners | | | Average Annual Salary of Contributors | | | Average Annual Pension | |
Judges’ | | 6 | | | 34 | | | 26 | | | $ | 247,886 | | | $ | 48,523 | |
Sch – Mgt | | --- | | | --- | | | 104 | | | | n/a | | | $ | 12,678 | |
GLTS | | 8 | | | 2,155 | | | 1,628 | | | $ | 33,185 | | | $ | 11,132 | |
CUPE 2745 | | 10 | | | 1,049 | | | 451 | | | $ | 30,790 | | | $ | 7,667 | |
Member | | | | | | | | | | | | | | | | | |
Member | | --- | | | --- | | | 93 | | | | n/a | | | $ | 27,894 | |
Minister | | --- | | | --- | | | 48 | | | | n/a | | | $ | 6,103 | |
SERP | | 15 | | | 308 | | | 3,274 | | | $ | 93,126 | | | $ | 4,137 | |
NH-Mgt | | 7 | | | 213 | | | 205 | | | $ | 72,000 | | | $ | 11,400 | |
NH-N&P | | 9 | | | 553 | | | 279 | | | $ | 55,548 | | | $ | 9,600 | |
NH-G&S | | 12 | | | 4,588 | | | 1,953 | | | $ | 32,677 | | | $ | 6,120 | |
PSSRP | | 15 | | | 17,484 | | | 15,229 | | | $ | 66,234 | | | $ | 22,811 | |
NBTPP | | 17 | | | 9,145 | | | 8,562 | | | $ | 72,900 | | | $ | 31,100 | |
H-CBE | | 15 | | | 8,593 | | | 2,352 | | | $ | 65,216 | | | $ | 18,134 | |
H-CUPE | | 12 | | | 8,534 | | | 3,288 | | | $ | 39,485 | | | $ | 9,723 | |
The Members’ Pension Plan provides for a benefit based on years of service and salary as a Member and a benefit based on years of service and salary as a Minister. All Ministers are also included as a Member.
The average annual salary of contributors under the SERP relates to the amount in excess of the maximum salary covered under the PSSRP.
NOTE 12 SICK LEAVE LIABILITY
The Province of New Brunswick’s employees working full-time and part-time hours in government departments, school districts and other agencies receive sick leave that is earned at varying amounts per group. Unused hours can be carried forward for future paid leave, up to predetermined maximum amounts. This is an unfunded program with no specific assets segregated to meet the obligations when they come due. Actuarial estimates for this future liability have been completed and form the basis for the estimated liability reported in these consolidated financial statements. The latest actuarial valuation was calculated as at 31 March 2015 for government department and school district employees. The latest actuarial valuations were completed between 31 March 2014 and 31 March 2015 for employees of other agencies. The sick leave liability for nursing homes has been estimated using summarized data of nursing home employees, and experience of employees in the Province’s health care sector.
For the year ended 31 March 2016, the Province expensed $0.6 million for this program ($5.1 million in 2015).
Significant economic and demographic assumptions used in the actuarial valuations are:
Discount Rate: | Equal to the Province’s long term borrowing rate of 3.19% as at 31 March 2016, and 2.67% as at 31 March 2015. |
| |
Expected Average Remaining Service Lifetime (Years): | 10.2 to 23 |
| | | | |
12 Salary Growth Rate: | Short term | | Long term | |
| 1.5% | | 2.0 % to 3.0% | |
52 | PROVINCE OF NEW BRUNSWICK | 2016 |
NOTES TO THE CONSOLIDATED FINANCIAL STATEMENTS
31 March 2016
The following table presents the liability at 31 March:
| | | | | | | | (millions)
2016 | | | | | | | | | 2015 | |
| | Government
Departments | | | School Districts | | | Nursing Homes | | | Other
Agencies | | | Total | | | Total | |
Accrued benefit obligation | | | | | | | | | | | | | | | | | | | | | | | | |
beginning of year | | $ | 45.9 | | | $ | 80.2 | | | $ | 21.4 | | | $ | 107.9 | | | $ | 255.4 | | | $ | 246.4 | |
Actuarial (gains) losses | | | (3.4 | ) | | | (6.1 | ) | | | (2.1 | ) | | | (10.3 | ) | | | (21.9 | ) | | | 4.3 | |
Benefits accrued | | | 4.3 | | | | 6.7 | | | | 2.0 | | | | 10.5 | | | | 23.5 | | | | 26.4 | |
Interest | | | 1.2 | | | | 2.1 | | | | 0.6 | | | | 2.8 | | | | 6.7 | | | | 9.4 | |
Benefit payments | | | (5.7 | ) | | | (8.2 | ) | | | (3.1 | ) | | | (13.0 | ) | | | (30.0 | ) | | | (31.1 | ) |
| | | | | | | | | | | | | | | | | | | | | | | | |
Accrued benefit obligation end of year | | | 42.3 | | | | 74.7 | | | | 18.8 | | | | 97.9 | | | | 233.7 | | | | 255.4 | |
| | | | | | | | | | | | | | | | | | | | | | | | |
Unamortized adjustments | | | | | | | | | | | | | | | | | | | | | | | | |
Opening balance | | | 4.9 | | | | (19.7 | ) | | | (1.2 | ) | | | 8.4 | | | | (7.6 | ) | | | (3.7 | ) |
New adjustments | | | 3.4 | | | | 6.1 | | | | 2.1 | | | | 10.3 | | | | 21.9 | | | | (4.3 | ) |
Amortization | | | (0.4 | ) | | | 1.5 | | | | (0.1 | ) | | | (0.6 | ) | | | 0.4 | | | | 0.4 | |
| | | | | | | | | | | | | | | | | | | | | | | | |
Unamortized Adjustments ending balance | | | 7.9 | | | | (12.1 | ) | | | 0.8 | | | | 18.1 | | | | 14.7 | | | | (7.6 | ) |
| | | | | | | | | | | | | | | | | | | | | | | | |
Total Benefit Liability | | $ | 50.2 | | | $ | 62.6 | | | $ | 19.6 | | | $ | 116.0 | | | $ | 248.4 | | | $ | 247.8 | |
Other agencies include College communautaire du Nouveau-Brunwick, Financial and Consumer Services Commission, Horizon Health Network, New Brunswick Community College, New Brunswick Legal Aid Services Commission, New Brunswick Investment Management Corporation, Recycle New Brunswick, Service New Brunswick and Vitalite Health Network
2016 | PROVINCE OF NEW BRUNSWICK | 53 |
NOTES TO THE CONSOLIDATED FINANCIAL STATEMENTS
31 March 2016
NOTE 13 GUARANTEES, LIABILITIES FOR CONTAMINATED SITES AND CONTINGENT LIABILITIES
a) Guarantees
Loan Guarantees
The Province has guaranteed certain debt of entities external to the Provincial Reporting Entity under the authority of various statutes. Guarantees issued under the Agriculture Development Act, Opportunities New Brunswick Act, Livestock Incentives Act and the Regional Development Corporation Act are issued to facilitate the establishment, development or maintenance of industry in a variety of areas. Loans guaranteed under these acts have guarantee fees ranging from 0% to 1.5% and maturity dates from 2010 to 2031.
Provincial Holdings Ltd. (PHL) is wholly owned by the Province and is responsible for administering industrial development project investments.
At 31 March 2016, the total contingent liability in respect of these guarantees was $63.4 million ($75.1 million 2015), of which the Province has recognized $21.0 million as a liability on the consolidated statement of financial position ($33.0 million 2015).
| | | | | (millions) | | | | |
| | Authorized Limit | | | Principal Guaranteed | | | Allowance for Loss (Schedule 8) | |
Agricultural Development Act | | $ | 2.2 | | | $ | 2.2 | | | $ | 2.1 | |
Opportunities New Brunswick Act | | $ | 52.5 | | | | 51.3 | | | | 17.0 | |
Livestock Incentives Act | | $ | 0.2 | | | | 0.1 | | | | | |
Regional Development Corporation Act | | $ | 3.2 | | | | 2.3 | | | | 1.3 | |
| | | | | | | 55.9 | | | | 20.4 | |
Provincial Holdings Limited | | $ | 7.5 | | | | 7.5 | | | | 0.6 | |
| | | | | | $ | 63.4 | | | $ | 21.0 | |
Other Guarantees
The New Brunswick Municipal Finance Corporation (NBMFC) is included in the Province's reporting entity as described in Schedule 30. The Province guarantees the payment of principal and interest of any borrowing by NBMFC. In the event of a defaulted payment, the Province shall recover such amounts from the defaulting municipality or from the defaulting municipality that has guaranteed the payment due to the Corporation from the defaulting municipal enterprise. As of 31 December 2015, total debenture debt outstanding was $ 866.8 million ($879.3 million 2014).
The New Brunswick Credit Union Deposit Insurance Corporation (NBCUDIC) provides deposit insurance to members of credit unions in New Brunswick to a maximum of $250,000 for each member. NBCUDIC is included in the Province's reporting entity as described in Schedule 30. As of 31 December 2015, deposits of the credit unions totalled $3.8 billion ($3.7 billion 2014). In addition, NBCUDIC has guaranteed specific losses up to $2.0 million.
One nursing home has guaranteed the debt of a related party. As at 31 March 2016, the guarantee totalled $1.1 million ($1.2 million 2015).
54 | PROVINCE OF NEW BRUNSWICK | 2016 |
NOTES TO THE CONSOLIDATED FINANCIAL STATEMENTS
31 March 2016
b) Contaminated Sites
The Province recognizes a liability for the remediation of a contaminated site when the Province is responsible for remediation of the site and the cost of remediation can be reasonably estimated. In 2016, a liability of $40.9 million ($42.2 million 2015) has been accrued for the remediation of contaminated sites. This liability includes the net present value of $0.9 million of remediation costs to be incurred over the next five years. The net present value was calculated using a discount rate equal to the Province’s five year borrowing rate of 1.73% as at 31 March 2016. The liability is based on management’s best estimate of the cost of remediation, using information available as at 31 March 2016. In accordance with PS 3260, in cases where uncertainty exists regarding the existence of contamination or the cost of remediation, no liability has been recognized. The estimated liability will be updated in future periods as new information becomes available.
The liability for contaminated sites is recognized in the statement of financial position under accounts payable and accrued expenses.
The following table discloses the total liability by nature and source:
| | | (millions) | |
Types of Sites | | Nature of Contaminate | | Source of Contamination | | Number of Sites | | | Liability | | | Estimated Recovery | |
| | | | | | | | | | | | | | | | |
Office/ Commercial/ Industrial | | Metals, petroleum hydrocarbons, polyaromatic hydrocarbons, BTEX, etc. | | Activities associated with the operations of an office, commercial or industrial facility could result in contamination from fuel storage or handling, waste sites, use of metal-based paint, etc. Sites often have multiple sources of contamination. | | | 16 | | | $ | 5.5 | | | $ | --- | |
| | | | | | | | | | | | | | | | |
Mineral Exploration Sites | | Heavy metals, petroleum hydrocarbons, etc. | | Mining activities; activities associated with mine operations e.g., fuel storage tanks, fuel handling, waste sites, etc. Sites often have multiple sources of contamination. | | | 3 | | | | 33.4 | | | | --- | |
| | | | | | | | | | | | | | | | |
Fuel Related Practices | | Petroleum hydrocarbons, polyaromatic hydrocarbons, BTEX, etc. | | Activities associated with fuel storage and handling, e.g., aboveground storage tanks, underground storage tanks, fuel handling areas, pipelines, fueling stations, etc. | | | 46 | | | | 2.0 | | | | --- | |
TOTAL | | | | | | | 65 | | | $ | 40.9 | | | $ | --- | |
An additional environmental liability of $14.0 million has been accrued by the New Brunswick Power Corporation. The liability is included in the investment balance of the New Brunswick Power Corporation.
c) Contingent Liabilities
Insurance
The Province does not carry general liability insurance or property insurance on its assets except in a few limited instances. Any successful liability claims against the Province and any replacement of lost or damaged property are charged to expense in the year of settlement or replacement.
Legal Actions
The Province of New Brunswick is involved in various legal proceedings arising from government activities. Amounts totalling $28.7 million ($40.0 million 2015) have been accrued in these consolidated financial statements which represents management’s best estimate of the likely losses due to legal actions. The Province of New Brunswick is also involved in various legal actions, some of which may be significant, the outcome of which is not determinable.
2016 | PROVINCE OF NEW BRUNSWICK | 55 |
NOTES TO THE CONSOLIDATED FINANCIAL STATEMENTS
31 March 2016
NOTE 14 COMMITMENTS
a) Operating Leases
The total future minimum payments under various operating lease agreements, including those of government business enterprises for the rental of space and equipment, amounts to $393.5 million ($465.5 million 2015). Minimum annual lease payments in each of the next five years are as follows:
Fiscal Year | | (millions) | |
| | | | |
2016-2017 | | $ | 81.9 | |
2017-2018 | | $ | 68.2 | |
2018-2019 | | $ | 54.6 | |
2019-2020 | | $ | 45.8 | |
2020-2021 | | $ | 35.0 | |
b) New Brunswick Lotteries and Gaming Corporation
In August 2013, the Atlantic Lottery Corporation communicated to New Brunswick Lotteries and Gaming Corporation that a pension deficit would be recovered from shareholders through withholdings of profit distributions beginning in September 2013 and ending in 2019. As of 31 March 2016, the impact on future profit distributions for New Brunswick Lotteries and Gaming Corporation is a decrease of $11.2 million in aggregate.
c) Contractual Obligations
The nature of the government’s activities results in significant multi-year contracts and obligations. The Province currently has outstanding contractual commitments of $2,757.7 million. Significant commitments and agreements are as follows:
| | (millions) | |
| | | |
Consolidated Fund Entities | | $ | 833.5 | |
Other Government Entities | | $ | 1,924.2 | |
Significant commitments and agreements include:
56 | PROVINCE OF NEW BRUNSWICK | 2016 |
NOTES TO THE CONSOLIDATED FINANCIAL STATEMENTS
31 March 2016
Consolidated Fund Entities
| | (millions) | |
| | 2017 | | | 2018 | | | 2019 | | | 2020 | | | 2021+ | | | Totals | |
Education and Early Childhood Development | | | | | | | | | | | | | | | | | | |
Other Educational Operating Services | | $ | 8.9 | | | $ | 4.8 | | | $ | 3.3 | | | $ | 3.0 | | | $ | 2.5 | | | $ | 22.5 | |
Environment and Local Government | | | | | | | | | | | | | | | | | | | | | | | | |
Animal Control Services for Local Service Districts | | | 0.6 | | | | 0.6 | | | | 0.6 | | | | 0.4 | | | | --- | | | | 2.2 | |
Energy and Mines | | | | | | | | | | | | | | | | | | | | | | | | |
Various agreements Under Energy and Mines | | | 0.7 | | | | --- | | | | --- | | | | --- | | | | --- | | | | 0.7 | |
Finance | | | | | | | | | | | | | | | | | | | | | | | | |
Property Assessment and Taxation System | | | | | | | | | | | | | | | | | | | | | | | | |
Renewal Initiative | | | 0.1 | | | | --- | | | | --- | | | | --- | | | | --- | | | | 0.1 | |
Project Management, Marketing, Web and Staffing Services | | | 0.1 | | | | --- | | | | --- | | | | --- | | | | --- | | | | 0.1 | |
General Government | | | | | | | | | | | | | | | | | | | | | | | | |
Development and Coaching of Lean Six Sigma | | | | | | | | | | | | | | | | | | | | | | | | |
methodology | | | 1.0 | | | | --- | | | | --- | | | | --- | | | | --- | | | | 1.0 | |
Health | | | | | | | | | | | | | | | | | | | | | | | | |
Various Health Care Services | | | 18.5 | | | | 10.8 | | | | 3.0 | | | | --- | | | | --- | | | | 32.3 | |
Natural Resources | | | | | | | | | | | | | | | | | | | | | | | | |
Various Agreements Under Natural Resources | | | | | | | | | | | | | | | | | | | | | | | | |
Management | | | 4.6 | | | | 0.4 | | | | --- | | | | --- | | | | --- | | | | 5.0 | |
Public Safety | | | | | | | | | | | | | | | | | | | | | | | | |
Public Police Service Agreement (PPSA) | | | 84.8 | | | | 84.2 | | | | 84.2 | | | | 81.6 | | | | 81.6 | | | | 416.4 | |
Social Development | | | | | | | | | | | | | | | | | | | | | | | | |
Home Support Services | | | 10.5 | | | | --- | | | | --- | | | | --- | | | | --- | | | | 10.5 | |
Family Support Services | | | 2.8 | | | | --- | | | | --- | | | | --- | | | | --- | | | | 2.8 | |
Advisory, Consulting, and IT Services | | | 3.8 | | | | --- | | | | --- | | | | --- | | | | --- | | | | 3.8 | |
Adult Developmental Activities, | | | | | | | | | | | | | | | | | | | | | | | | |
Programs & Training | | | 1.2 | | | | 1.2 | | | | --- | | | | --- | | | | --- | | | | 2.4 | |
Tourism, Heritage and Culture | | | | | | | | | | | | | | | | | | | | | | | | |
Advertising, Publication, Software and Web | | | | | | | | | | | | | | | | | | | | | | | | |
Service Contracts | | | 7.9 | | | | 1.2 | | | | 0.1 | | | | --- | | | | --- | | | | 9.2 | |
Transportation and Infrastructure | | | | | | | | | | | | | | | | | | | | | | | | |
Various Capital Projects | | | 60.3 | | | | 7.0 | | | | 1.3 | | | | 0.8 | | | | 1.0 | | | | 70.4 | |
Deer Island Ferry Services Project | | | 1.1 | | | | --- | | | | --- | | | | --- | | | | --- | | | | 1.1 | |
Fundy Islands Ferry Services Project | | | 18.9 | | | | 19.3 | | | | 19.9 | | | | 20.4 | | | | 157.4 | | | | 235.9 | |
Operations Agreement | | | | | | | | | | | | | | | | | | | | | | | | |
National Highways System | | | 1.9 | | | | --- | | | | --- | | | | --- | | | | --- | | | | 1.9 | |
Permanent Bridges and Highways | | | 44.2 | | | | 6.9 | | | | --- | | | | 0.1 | | | | --- | | | | 51.2 | |
Rural Road Initiative | | | 1.0 | | | | --- | | | | --- | | | | --- | | | | --- | | | | 1.0 | |
Subtotal | | | 272.9 | | | | 136.4 | | | | 112.4 | | | | 106.3 | | | | 242.5 | | | | 870.5 | |
Capital Contributions from Outside Sources | | | 14.4 | | | | 17.9 | | | | 4.7 | | | | --- | | | | --- | | | | 37.0 | |
Total | | $ | 258.5 | | | $ | 118.5 | | | $ | 107.7 | | | $ | 106.3 | | | $ | 242.5 | | | $ | 833.5 | |
2016 | PROVINCE OF NEW BRUNSWICK | 57 |
NOTES TO THE CONSOLIDATED FINANCIAL STATEMENTS
31 March 2016
Other Government Entities
| | (millions) |
| | 2017 | | | 2018 | | | 2019 | | | 2020 | | | 2021+ | | | Totals | |
Ambulance NB | | | | | | | | | | | | | | | | | | |
Management of Ambulance Services | | | | | | | | | | | | | | | | | | |
through NB EMS | | $ | 29.9 | | | $ | --- | | | $ | --- | | | $ | --- | | | $ | --- | | | $ | 29.9 | |
Fundy Trail Development Authority | | | | | | | | | | | | | | | | | | | | | | | | |
Fundy Trail Parkway | | | 2.9 | | | | 2.3 | | | | --- | | | | --- | | | | --- | | | | 5.2 | |
New Brunswick Highway Corporation | | | | | | | | | | | | | | | | | | | | | | | | |
Maintenance and Rehabilitation of the | | | | | | | | | | | | | | | | | | | | | | | | |
Fredericton to Moncton Highway | | | 11.5 | | | | 11.5 | | | | 11.5 | | | | 11.5 | | | | 89.3 | | | | 135.3 | |
Maintenance and Rehabilitation of the Trans | | | | | | | | | | | | | | | | | | | | | | | | |
Canada Highway from the Quebec border | | | | | | | | | | | | | | | | | | | | | | | | |
to Longs Creek | | | 22.9 | | | | 23.4 | | | | 23.9 | | | | 24.5 | | | | 585.4 | | | | 680.1 | |
Maintenance and Rehabilitation of the | | | | | | | | | | | | | | | | | | | | | | | | |
Route 1 Gateway | | | 21.4 | | | | 21.9 | | | | 22.4 | | | | 22.9 | | | | 682.3 | | | | 770.9 | |
Nursing Homes | | | | | | | | | | | | | | | | | | | | | | | | |
Construction Contract | | | 9.1 | | | | --- | | | | --- | | | | --- | | | | --- | | | | 9.1 | |
Opportunities NB | | | | | | | | | | | | | | | | | | | | | | | | |
IT and Consulting Services | | | 0.1 | | | | --- | | | | --- | | | | --- | | | | --- | | | | 0.1 | |
Regional Development Corporation | | | | | | | | | | | | | | | | | | | | | | | | |
Canada - New Brunswick Agreements | | | 1.7 | | | | 21.1 | | | | 4.4 | | | | 1.4 | | | | --- | | | | 28.6 | |
Regional and Community Development Initiative | | | 15.0 | | | | 50.7 | | | | 49.1 | | | | 43.1 | | | | 24.1 | | | | 182.0 | |
Service New Brunswick | | | | | | | | | | | | | | | | | | | | | | | | |
Technology agreements | | | 20.1 | | | | 11.1 | | | | 10.9 | | | | 10.1 | | | | 26.4 | | | | 78.6 | |
Horizon Health Network | | | | | | | | | | | | | | | | | | | | | | | | |
Service Support for Diagnostic Imaging | | | | | | | | | | | | | | | | | | | | | | | | |
Equipment | | | 4.4 | | | | --- | | | | --- | | | | --- | | | | --- | | | | 4.4 | |
Total | | $ | 139.0 | | | $ | 142.0 | | | $ | 122.2 | | | $ | 113.5 | | | $ | 1,407.5 | | | $ | 1,924.2 | |
The Province also has contractual obligations and other commitments through its government business enterprises. The New Brunswick Power Corporation has entered into various agreements related to the purchase and transmission of electricity and the supply and delivery of fuel oil and coal.
58 | PROVINCE OF NEW BRUNSWICK | 2016 |
NOTES TO THE CONSOLIDATED FINANCIAL STATEMENTS
31 March 2016
NOTE 15 SEGMENT REPORTING
Note 15 is intended to provide supplementary information on the Province’s revenue and expenses by segment. The segments have been defined based on the accountability and control relationships between the Government and the various organizations within the reporting entity. Although the government controls all the entities included, there are varying levels of accountability. The segments are defined as: Government Departments and Some Agencies; Regional Health Authorities; and Other Consolidated Entities. An Interaccount Eliminations column is added to eliminate double counting between columns and to reconcile to the Consolidated Statement of Operations. The extent of these items was $3.4 million in 2016 ($(12.7) million 2015). Eliminations between the Province and entities impact asset and liability accounts with respect to tangible capital assets and deferred contributions from the Province. Transactions between segments are recorded at cost.
The Government Departments and Some Agencies segment represents the group most directly accountable to the Board of Management and Cabinet. The segment includes all line departments such as Health, Education and Transportation as well as the following agencies: Arts Development Trust Fund, Atlantic Education International Inc., Economic and Social Inclusion Corporation, Environmental Trust Fund, New Brunswick Agricultural Insurance Commission, New Brunswick Highway Corporation, New Brunswick Housing Corporation, New Brunswick Lotteries and Gaming Corporation, Regional Development Corporation, and Sport Development Trust Fund.
The Regional Health Authorities (RHA’s) are disclosed separately due to the magnitude of their operations and the fact they are somewhat removed from day to day control of the Board of Management and Cabinet.
Other Consolidated Entities are also somewhat removed and independent with respect to day to day operations yet still controlled by government under the Public Sector Accounting Board’s criteria for control. The organizations included in this segment are: New Brunswick Liquor Corporation, New Brunswick Municipal Finance Corporation, and New Brunswick Power Corporation. Also included with other agencies are the following entities which are consolidated in the Province’s financial statements: Algonquin Golf Limited, Algonquin Properties Limited,
Ambulance New Brunswick Inc., Collège communautaire du Nouveau-Brunswick; Financial and Consumer Services Commission, Forest Protection Limited, Kings Landing Corporation, New Brunswick Community College, New Brunswick Credit Union Deposit Insurance Corporation, New Brunswick Energy and Utilities Board, New Brunswick Health Council, New Brunswick Immigrant Investor Fund (2009) Ltd., New Brunswick Investment Management Corporation, New Brunswick Legal Aid Services Commission, Opportunities NB, Provincial Holdings Ltd., Recycle New Brunswick, Service New Brunswick and not-for-profit nursing homes operating in New Brunswick.
2016 | PROVINCE OF NEW BRUNSWICK | 59 |
NOTES TO THE CONSOLIDATED FINANCIAL STATEMENTS
31 March 2016
| | Government | | (millions) | |
| | Departments | | Regional Health | | Other Consolidated | | Inter account | | Consolidated | |
| | and Some Agencies | | Authorities | | Entities | | Eliminations | | Total | |
| | 2016 | | 2015 | | 2016 | | 2015 | | 2016 | | 2015 | | 2016 | | 2015 | | 2016 | | 2015 | |
Revenue | | | | | | | | | | | | | | | | | | | | | |
Tax Revenue | | $ | 4,029.7 | | $ | 3,983.1 | | $ | --- | | $ | --- | | $ | --- | | $ | --- | | $ | --- | | $ | --- | | $ | 4,029.7 | | $ | 3,983.1 | |
Non Tax Revenue | | | 884.9 | | | 851.9 | | | 118.0 | | | 110.2 | | | 211.8 | | | 213.3 | | | --- | | | --- | | | 1,214.7 | | | 1,175.4 | |
Government Business Enterprises | | | --- | | | --- | | | --- | | | --- | | | 189.1 | | | 270.9 | | | --- | | | --- | | | 189.1 | | | 270.9 | |
Transfers Between Entities | | | 6.0 | | | 6.0 | | | 1,717.2 | | | 1,785.4 | | | 774.6 | | | 624.7 | | | (2,497.8 | ) | | (2,416.1 | ) | | --- | | | --- | |
Conditional Federal Grants | | | 266.9 | | | 364.2 | | | 23.1 | | | 23.8 | | | --- | | | --- | | | --- | | | --- | | | 290.0 | | | 388.0 | |
Unconditional Federal Grants | | | 2,662.7 | | | 2,621.8 | | | --- | | | --- | | | --- | | | --- | | | --- | | | --- | | | 2,662.7 | | | 2,621.8 | |
| | | 7,850.2 | | | 7,827.0 | | | 1,858.3 | | | 1,919.4 | | | 1,175.5 | | | 1,108.9 | | | (2,497.8 | ) | | (2,416.1 | ) | | 8,386.2 | | | 8,439.2 | |
| | | | | | | | | | | | | | | | | | | | | | | | | | | | | | | |
Expenses | | | | | | | | | | | | | | | | | | | | | | | | | | | | | | | |
Employee Benefits | | | 1,885.4 | | | 2,104.8 | | | 1,371.1 | | | 1,348.4 | | | 560.8 | | | 567.8 | | | (34.6 | ) | | (12.0 | ) | | 3,782.7 | | | 4,009.0 | |
Other Services | | | 1,389.8 | | | 1,292.3 | | | 95.2 | | | 131.7 | | | 95.1 | | | 108.3 | | | (25.3 | ) | | (8.7 | ) | | 1,554.8 | | | 1,523.6 | |
Materials and Supplies | | | 208.7 | | | 202.4 | | | 348.2 | | | 302.2 | | | 65.3 | | | 45.8 | | | (1.4 | ) | | (2.7 | ) | | 620.8 | | | 547.7 | |
Property and Equipment | | | 20.8 | | | 71.6 | | | --- | | | --- | | | 23.0 | | | 39.5 | | | (0.9 | ) | | (63.9 | ) | | 42.9 | | | 47.2 | |
Grants and Subsidies | | | 1,453.7 | | | 1,500.3 | | | --- | | | --- | | | 24.4 | | | 5.6 | | | --- | | | --- | | | 1,478.1 | | | 1,505.9 | |
Transfers Between Entities | | | 2,437.8 | | | 2,314.5 | | | --- | | | --- | | | --- | | | --- | | | (2,437.8 | ) | | (2,314.5 | ) | | --- | | | --- | |
Debt and Other Charges | | | 732.9 | | | 742.5 | | | --- | | | --- | | | 8.9 | | | 20.3 | | | (1.2 | ) | | (1.6 | ) | | 740.6 | | | 761.2 | |
Amortization | | | 345.3 | | | 326.5 | | | 62.3 | | | 60.7 | | | 19.2 | | | 18.8 | | | --- | | | --- | | | 426.8 | | | 406.0 | |
| | | 8,474.4 | | | 8,554.9 | | | 1,876.8 | | | 1,843.0 | | | 796.7 | | | 806.1 | | | (2,501.2 | ) | | (2,403.4 | ) | | 8,646.7 | | | 8,800.6 | |
Surplus (Deficit) | | $ | (624.2 | ) | $ | (727.9 | ) | $ | (18.5 | ) | $ | 76.4 | | $ | 378.8 | | $ | 302.8 | | $ | 3.4 | | $ | (12.7 | ) | $ | (260.5 | ) | $ | (361.4 | ) |
60 | PROVINCE OF NEW BRUNSWICK | 2016 |
NOTES TO THE CONSOLIDATED FINANCIAL STATEMENTS
31 March 2016
NOTE 16 TRUST FUNDS
The Province is trustee for various trust funds outside the Provincial Reporting Entity.
The following is a summary of the trust fund equities calculated using the method indicated below to value investment assets:
| | (millions) | |
| | 2016 | | | 2015 | |
Cost Method: | | | | | | |
| | | | | | | | |
Margaret R. Lynds Bequest | | $ | 0.1 | | | $ | 0.1 | |
Mental Health Trust Fund | | | 1.4 | | | | 1.3 | |
Viscount Bennett Bequest | | | 0.2 | | | | 0.2 | |
| | $ | 1.7 | | | $ | 1.6 | |
Market Value Method: | | | | | | | | |
| | | | | | | | |
Judges' Superannuation Fund | | $ | 43.2 | | | $ | 42.0 | |
Office of the Public Trustee Trust Fund | | | 10.1 | | | | 10.1 | |
Pension Plan for the Management Employees | | | | | | | | |
of New Brunswick School Districts | | | 6.6 | | | | 7.6 | |
Pension Plan for General Labour, Trades and Services | | | | | | | | |
Employees of New Brunswick School Districts | | | 341.3 | | | | 339.2 | |
Pension Plan for Full-Time CUPE 2745 Employees of | | | | | | | | |
New Brunswick School Districts | | | 80.1 | | | | 78.0 | |
| | $ | 481.3 | | | $ | 476.9 | |
The Margaret R. Lynds Bequest awards three annual scholarships of equal value to students pursuing the study of communications at specified universities. The Mental Health Trust Fund is used to pay for psychoanalysis treatment of deserving New Brunswick residents. The income from the Viscount Bennett Bequest is used to develop the Province's historic resources. The Public Trustee of New Brunswick protects the financial and personal interests of the elderly, the mentally challenged, children, missing or deceased persons, when there is no one else able and willing to do so.
2016 | PROVINCE OF NEW BRUNSWICK | 61 |
NOTES TO THE CONSOLIDATED FINANCIAL STATEMENTS
31 March 2016
NOTE 17 PRIOR PERIOD ADJUSTMENTS
Restatements to Net Debt and Accumulated Deficit
The tables below summarize the impact of the prior period adjustments on the opening net debt and accumulated deficit figures. The paragraphs following the tables provide additional information on these adjustments.
RESTATED NET DEBT - BEGINNING OF YEAR
| | (millions) | |
| | 2016 | | | 2015 | |
| | Actual | | | Actual | |
NET DEBT - BEGINNING OF YEAR | | | | | | |
| | | | | | |
As Previously Published | | $ | (12,421.9 | ) | | $ | (11,811.3 | ) |
| | | | | | | | |
Nursing Homes | | | (521.7 | ) | | | (497.7 | ) |
Target Benefit Pension Plans | | | (221.3 | ) | | | (224.7 | ) |
Unamortized Premiums and Discounts | | | 80.9 | | | | 145.2 | |
Liability for Injured Workers | | | (41.0 | ) | | | (23.2 | ) |
Government Business Enterprises | | | 6.8 | | | | (3.4 | ) |
| | | | | | | | |
RESTATED NET DEBT - BEGINNING OF YEAR | | $ | (13,118.2 | ) | | $ | (12,415.1 | ) |
RESTATED ACCUMULATED DEFICIT - BEGINNING OF YEAR
| | | (millions) | |
| | | 2016 | | | 2015 | |
| | | Actual | | | Actual | |
ACCUMULATED DEFICIT - BEGINNING OF YEAR | | | | | | | |
| | | | | | | |
As Previously Published | | | $ | (3,961.3 | ) | | $ | (3,426.1 | ) |
| | | | | | | | | |
Nursing Homes | | | | (81.5 | ) | | | (96.9 | ) |
Target Benefit Pension Plans | | | | (221.3 | ) | | | (224.7 | ) |
Liability for Injured Workers | | | | (41.0 | ) | | | (23.2 | ) |
Government Business Enterprises | | | | 6.8 | | | | (3.4 | ) |
| | | | | | | | | |
RESTATED ACCUMULATED DEFICIT | | | | | | | | | |
-BEGINNING OF YEAR | | | $ | (4,298.3 | ) | | $ | (3,774.3 | ) |
62 | PROVINCE OF NEW BRUNSWICK | 2016 |
NOTES TO THE CONSOLIDATED FINANCIAL STATEMENTS
31 March 2016
Nursing Home Consolidation
As a result of a change in accounting policy, the financial results of not-for-profit nursing homes located in New
Brunswick are now being included in the Province’s consolidated financial statements using the full consolidation method. See schedule 30 for a listing of nursing homes included within the government reporting entity. The change resulted in a restatement of 31 March 2015 financial results as follows: an increase of $37.2 million in financial assets, $440.3 million in non-financial assets, $462.1 million in liabilities, $75.1 million in revenue and $59.7 million in expenses. Closing net debt increased by $521.7 million and accumulated deficit increased by $81.5 million. Opening net debt and accumulated deficit as at 1 April 2014 increased by $497.7 and $96.9 million respectively.
Target Benefit Pension Plans
Effective 1 April 2015, the Province retroactively changed its accounting policy for Target Benefit Pension Plans as described in Note 1 d) to the consolidated financial statements. The Province’s 2015 consolidated financial statements have been restated as follows: a decrease of $3.4 million in pension expense and an increase of $221.3 million in closing net debt, accumulated deficit and pension liability. Opening net debt and accumulated deficit as at 1 April 2014 increased by $224.7 million.
Financial Statement Presentation Change
As a result of a change in financial statement presentation in the current year, unamortized premiums, discounts, and issue expenses on debentures previously classified as non-financial assets are now included in the calculation of total funded debt. The impact of this change is a decrease in net debt of $80.9 million as at 31 March 2015. Opening net debt as at 1 April 2014 also decreased by $145.2 million.
Liability for Injured Workers
As a result of an assessment of the Province’s liability for injured workers, it was determined that an adjustment was required to the previously recognized liability and expense amounts. For the year ended 31 March 2015, the adjustment resulted in an increase in opening net debt and accumulated deficit of $23.2 million, an increase in expenses of $17.8 million and an increase in the Province’s liability for injured workers of $41.0 million. Net debt and accumulated deficit as at 31 March 2015 also increased by $41.0 million.
Government Business Enterprises
Effective 1 April 2015, NB Power adopted International Financial Reporting Standards, which resulted in a restatement of their 2015 financial results. NB Liquor also restated their 2015 results for the correction of an error. The impact of these restatements on the Province’s 31 March 2015 consolidated financial statements is as follows: an increase in revenue of $26.2 million, an increase in other comprehensive loss of $16.0 million, an increase in assets and a decrease in accumulated deficit and net debt of $6.8 million. Opening net debt and accumulated deficit as at April 1, 2014 increased by $3.4 million.
NOTE 18 COMPARATIVE FIGURES
Certain of the 2015 figures have been reclassified to conform to the presentation adopted for 2016.
2016 | PROVINCE OF NEW BRUNSWICK | 63 |
SCHEDULES TO THE CONSOLIDATED FINANCIAL STATEMENTS
31 March 2016
| | (millions) | |
| | 2016 | | | 2015 | |
SCHEDULE 1 | | | | | | |
CASH AND SHORT TERM INVESTMENTS | | | | | | |
| | | | | | |
Cash | | $ | 1,215.2 | | | $ | 842.0 | |
Short Term Investments | | | 925.9 | | | | 840.2 | |
| | $ | 2,141.1 | | | $ | 1,682.2 | |
SCHEDULE 2 | | | | | | | | |
RECEIVABLES AND ADVANCES | | | | | | | | |
| | | | | | | | |
Accounts Receivable | | | | | | | | |
General Receivables of Government Departments | | $ | 219.6 | | | $ | 224.5 | |
General Receivables of Government Entities | | | 63.8 | | | | 53.6 | |
| | | 283.4 | | | | 278.1 | |
Less: Allowance for Doubtful Accounts | | | 100.0 | | | | 112.2 | |
| | | 183.4 | | | | 165.9 | |
Due from Federal Government | | | | | | | | |
| | | | | |
Central Government Services | | | 56.7 | | | | 80.6 | |
Transportation | | | 19.1 | | | | 5.1 | |
Harmonized Sales Tax Rebate | | | 15.4 | | | | 20.6 | |
Economic Development | | | 6.9 | | | | 5.7 | |
Education | | | 2.3 | | | | 38.1 | |
Other | | | 3.2 | | | | 3.5 | |
| | | 103.6 | | | | 153.6 | |
| | | | | | | | |
Guarantee Payouts | | | 126.7 | | | | 129.7 | |
Less: Allowance for Doubtful Accounts | | | 125.9 | | | | 126.2 | |
| | | 0.8 | | | | 3.5 | |
Advances | | | | | | | | |
| | | | | |
Working Capital Advances | | | 4.2 | | | | 4.7 | |
Other | | | 5.2 | | | | 5.5 | |
| | | 9.4 | | | | 10.2 | |
Less: Allowance for Doubtful Accounts | | | 4.2 | | | | 4.5 | |
| | | 5.2 | | | | 5.7 | |
Interest Receivable | | | | | | | | |
Student Loans | | | 21.1 | | | | 19.4 | |
Fisheries and Aquaculture Development Act | | | 6.6 | | | | 6.5 | |
Opportunities New Brunswick Act | | | 4.8 | | | | 5.1 | |
Agricultural Development Act | | | 0.3 | | | | 0.2 | |
Other | | | 19.4 | | | | 19.7 | |
| | | 52.2 | | | | 50.9 | |
Less: Allowance for Doubtful Accounts | | | 42.0 | | | | 40.4 | |
| | | 10.2 | | | | 10.5 | |
| | $ | 303.2 | | | $ | 339.2 | |
64 | PROVINCE OF NEW BRUNSWICK | 2016 |
SCHEDULES TO THE CONSOLIDATED FINANCIAL STATEMENTS
31 March 2016
| | (millions) | |
| | 2016 | | | 2015 | |
SCHEDULE 3 | | | | | | |
TAXES RECEIVABLE | | | | | | |
| | | | | | |
Real Property Tax | | $ | 1,141.9 | | | $ | 1,146.6 | |
Gasoline and Motive Fuels Tax | | | 23.9 | | | | 22.3 | |
Tobacco Tax | | | 18.4 | | | | 17.2 | |
Royalties and Stumpage on Timber | | | 12.5 | | | | 20.7 | |
Metallic Minerals Tax | | | 0.1 | | | | --- | |
Sales Tax | | | --- | | | | 63.4 | |
Other | | | 4.1 | | | | 8.5 | |
| | | 1,200.9 | | | | 1,278.7 | |
Less: Allowance for Doubtful Accounts | | | 32.6 | | | | 40.6 | |
| | $ | 1,168.3 | | | $ | 1,238.1 | |
SCHEDULE 4 | | | | | | | | |
INVENTORIES FOR RESALE | | | | | | | | |
| | | | | | | | |
Inventories for Resale | | | | | | | | |
Properties Held for Sale | | $ | 0.3 | | | $ | 1.7 | |
2016 | PROVINCE OF NEW BRUNSWICK | 65 |
SCHEDULES TO THE CONSOLIDATED FINANCIAL STATEMENTS
31 March 2016
| | (millions) | |
| | 2016 | | | 2015 | |
| | | | | Allowance | | | | | | | | | Allowance | | | | |
| | | | | for Doubtful | | | | | | | | | for Doubtful | | | | |
| | Amount | | | Accounts | | | Net | | | Amount | | | Accounts | | | Net | |
SCHEDULE 5 | | | | | | | | | | | | | | | | | | |
LOANS | | | | | | | | | | | | | | | | | | |
| | | | | | | | | | | | | | | | | | |
Loans to Students | | $ | 464.9 | | | $ | 105.0 | | | $ | 359.9 | | | $ | 455.2 | | | $ | 101.6 | | | $ | 353.6 | |
Opportunities New Brunswick Act | | | 226.5 | | | | 94.0 | | | | 132.5 | | | | 216.5 | | | | 98.9 | | | | 117.6 | |
New Brunswick Housing Act | | | 89.9 | | | | 7.2 | | | | 82.7 | | | | 104.6 | | | | 5.9 | | | | 98.7 | |
Agricultural Development Act | | | 15.0 | | | | 3.4 | | | | 11.6 | | | | 14.5 | | | | 2.6 | | | | 11.9 | |
Fisheries and Aquaculture | | | | | | | | | | | | | | | | | | | | | | | | |
Development Act | | | 33.3 | | | | 22.4 | | | | 10.9 | | | | 34.7 | | | | 21.2 | | | | 13.5 | |
L'Office de Stabilisation | | | 5.4 | | | | --- | | | | 5.4 | | | | 5.3 | | | | --- | | | | 5.3 | |
Fundy Trail Endowment Fund | | | 4.3 | | | | --- | | | | 4.3 | | | | 4.1 | | | | --- | | | | 4.1 | |
Energy Efficiency Upgrade Loans | | | --- | | | | --- | | | | --- | | | | 3.7 | | | | 0.7 | | | | 3.0 | |
Unsatisfied Judgements | | | 9.4 | | | | 9.4 | | | | --- | | | | 9.4 | | | | 9.4 | | | | --- | |
La Fondation du quotidien | | | | | | | | | | | | | | | | | | | | | | | | |
francophone | | | 4.0 | | | | 4.0 | | | | --- | | | | 4.0 | | | | 4.0 | | | | --- | |
Other Loans | | | 31.2 | | | | 15.3 | | | | 15.9 | | | | 38.8 | | | | 17.2 | | | | 21.6 | |
| | | | | | | | | | | | | | | | | | | | | | | | |
| | $ | 883.9 | | | $ | 260.7 | | | $ | 623.2 | | | $ | 890.8 | | | $ | 261.5 | | | $ | 629.3 | |
66 | PROVINCE OF NEW BRUNSWICK | 2016 |
SCHEDULES TO THE CONSOLIDATED FINANCIAL STATEMENTS
31 March 2016
| | (millions) | |
| | 2016 | | | 2015 | |
SCHEDULE 6 | | | | | | |
EQUITY IN GOVERNMENT BUSINESS ENTERPRISES | | | | | | |
| | | | | | |
New Brunswick Power Corporation | | $ | 207.0 | | | $ | 336.0 | |
less: regulatory deferral adjustment (Note 6) | | | (134.1 | ) | | | (139.8 | ) |
New Brunswick Liquor Corporation | | | 23.9 | | | | 17.3 | |
New Brunswick Municipal Finance Corporation | | | 0.9 | | | | 1.0 | |
| | $ | 97.7 | | | $ | 214.5 | |
OTHER INVESTMENTS | | | | | | | | |
Other Investments | | $ | 51.4 | | | $ | 44.9 | |
Atlantic Lottery Corporation | | | (2.3 | ) | | | (11.7 | ) |
| | $ | 49.1 | | | $ | 33.2 | |
SCHEDULE 7 | | | | | | | | |
ACCOUNTS PAYABLE AND ACCRUED EXPENSES | | | | | | | | |
| | | | | | | | |
Accounts Payable | | $ | 520.7 | | | $ | 571.2 | |
Due to Canada | | | | | | | | |
Equalization and Canada Health and Social Transfer | | | 0.9 | | | | 20.8 | |
Other Agreements | | | 57.7 | | | | 2.2 | |
| | | 58.6 | | | | 23.0 | |
Accrued Interest | | | | | | | | |
Funded Debt | | | 141.9 | | | | 141.9 | |
Other | | | 62.6 | | | | 66.0 | |
| | | 204.5 | | | | 207.9 | |
Employee Benefits | | | | | | | | |
Retirement Allowances (Note 11) | | | 468.8 | | | | 451.4 | |
Accrued Salaries Payable | | | 391.6 | | | | 341.3 | |
Sick Leave (Note 12) | | | 248.4 | | | | 247.8 | |
Liability for Injured Workers | | | 180.5 | | | | 175.9 | |
| | | 1,289.3 | | | | 1,216.4 | |
| | | | | | | | |
Municipal Property Taxes Due to Municipalities | | | 473.5 | | | | 466.8 | |
Liability for Contaminated Sites (Note 13) | | | 40.9 | | | | 42.2 | |
Medicare and Out of Province Payments | | | 38.4 | | | | 48.5 | |
Holdbacks on Contracts | | | 16.4 | | | | 12.9 | |
Health Services Liability Protection Plan | | | 10.3 | | | | 12.1 | |
Other | | | 73.4 | | | | 93.7 | |
| | | 652.9 | | | | 676.2 | |
| | $ | 2,726.0 | | | $ | 2,694.7 | |
2016 | PROVINCE OF NEW BRUNSWICK | 67 |
SCHEDULES TO THE CONSOLIDATED FINANCIAL STATEMENTS
31 March 2016
| | (millions) | |
| | 2016 | | | 2015 | |
SCHEDULE 8 | | | | | | |
ALLOWANCE FOR LOSSES | | | | | | |
| | | | | | |
Economic Development | | $ | 18.9 | | | $ | 30.6 | |
Agriculture, Aquaculture and Fisheries | | | 2.1 | | | | 2.4 | |
Contingent Liabilities - Guaranteed Loan Provision (Note 13) | | | 21.0 | | | | 33.0 | |
Property Tax Appeals | | | 4.0 | | | | 5.5 | |
Post-Secondary Education, Training and Labour | | | 0.3 | | | | 0.3 | |
| | | 4.3 | | | | 5.8 | |
| | $ | 25.3 | | | $ | 38.8 | |
SCHEDULE 9 | | | | | | | | |
DEFERRED REVENUE | | | | | | | | |
| | | | | | | | |
Real Property Taxes | | $ | 389.3 | | | $ | 387.9 | |
Motor Vehicle and Operators' Licenses | | | 62.2 | | | | 58.6 | |
Capital Contributions | | | 21.8 | | | | 18.1 | |
Other | | | 33.0 | | | | 25.5 | |
| | $ | 506.3 | | | $ | 490.1 | |
SCHEDULE 10 | | | | | | | | |
DEPOSITS HELD IN TRUST | | | | | | | | |
| | | | | | | | |
New Brunswick Immigrant Investor Fund (2009) Ltd. | | $ | 148.1 | | | $ | 174.1 | |
Retention Fund for Fee for Service Physicians | | | 51.0 | | | | 48.7 | |
Tenants' Security Deposits | | | 24.1 | | | | 22.8 | |
Court of Queen's Bench | | | 10.3 | | | | 8.8 | |
Mining Licenses - Non-Performance Renewal Fees | | | 6.8 | | | | 7.0 | |
Scholarship Trusts | | | 3.9 | | | | 3.8 | |
New Brunswick Crop Reinsurance | | | 2.8 | | | | 0.9 | |
Contractors' Deposits | | | 2.4 | | | | 2.7 | |
Family Support Order Services | | | 1.8 | | | | 1.9 | |
Sale of Property for Taxes | | | 0.5 | | | | 0.2 | |
Other | | | 110.3 | | | | 104.8 | |
| | $ | 362.0 | | | $ | 375.7 | |
68 | PROVINCE OF NEW BRUNSWICK | 2016 |
SCHEDULES TO THE CONSOLIDATED FINANCIAL STATEMENTS
31 March 2016
| | (millions) | |
| | 2016 | | | 2015 | |
SCHEDULE 11 | | | | | | |
OBLIGATIONS UNDER CAPITAL LEASES | | | | | | |
| | | | | | | | |
Highways | | $ | 577.8 | | | $ | 609.4 | |
Health | | | 94.1 | | | | 94.7 | |
Education | | | 45.6 | | | | 46.4 | |
Protection | | | 16.4 | | | | 17.1 | |
| | $ | 733.9 | | | $ | 767.6 | |
SCHEDULE 12 | | | | | | | | |
INVENTORIES OF SUPPLIES | | | | | | | | |
| | | | | | | | |
Health Supplies and Vaccines | | $ | 20.8 | | | $ | 21.7 | |
Construction and Maintenance Materials | | | 13.9 | | | | 14.5 | |
Machine Repair Parts | | | 5.2 | | | | 5.0 | |
Veterinary Supplies | | | 1.2 | | | | 1.0 | |
Educational Textbooks | | | 0.7 | | | | 0.7 | |
Stationery and Supplies | | | 0.2 | | | | 1.5 | |
Other Supplies | | | 7.4 | | | | 7.1 | |
| | $ | 49.4 | | | $ | 51.5 | |
SCHEDULE 13 | | | | | | | | |
PREPAID AND DEFERRED CHARGES | | | | | | | | |
| | | | | | | | |
Public Private Partnership Contracts | | $ | 130.2 | | | $ | 126.9 | |
Deferred Financing Charges | | | 3.2 | | | | 5.3 | |
Other | | | 36.2 | | | | 50.5 | |
| | $ | 169.6 | | | $ | 182.7 | |
2016 | PROVINCE OF NEW BRUNSWICK | 69 |
SCHEDULES TO THE CONSOLIDATED FINANCIAL STATEMENTS
31 March 2016
| | (millions) | |
| | 2016 | | | 2016 | | | 2015 | |
| | Budget | | | Actual | | | Actual | |
SCHEDULE 14 | | | | | | | | | |
TAXES | | | | | | | | | |
| | | | | | | | | | | | |
Personal Income Tax | | $ | 1,587.0 | | | $ | 1,654.6 | | | $ | 1,523.7 | |
Corporate Income Tax | | | 258.0 | | | | 225.8 | | | | 238.1 | |
Metallic Minerals Tax | | | --- | | | | 0.1 | | | | 21.9 | |
| | | 1,845.0 | | | | 1,880.5 | | | | 1,783.7 | |
Provincial Real Property Tax | | | 477.8 | | | | 480.4 | | | | 466.8 | |
| | | | | | | | | | | | |
Harmonized Sales Tax | | | 1,184.2 | | | | 1,136.8 | | | | 1,240.9 | |
Gasoline and Motive Fuels Tax | | | 268.2 | | | | 284.2 | | | | 242.8 | |
Tobacco Tax | | | 135.8 | | | | 148.7 | | | | 143.4 | |
Pari-mutuel Tax | | | 0.6 | | | | 0.4 | | | | 0.4 | |
| | | 1,588.8 | | | | 1,570.1 | | | | 1,627.5 | |
Insurance Premium Tax | | | 53.6 | | | | 53.0 | | | | 49.3 | |
Financial Corporation Capital Tax | | | 27.0 | | | | 21.3 | | | | 29.4 | |
Penalties and Interest | | | 13.0 | | | | 11.3 | | | | 13.2 | |
Other | | | 12.0 | | | | 13.1 | | | | 13.2 | |
| | | 105.6 | | | | 98.7 | | | | 105.1 | |
| | $ | 4,017.2 | | | $ | 4,029.7 | | | $ | 3,983.1 | |
SCHEDULE 15 | | | | | | | | | | | | |
LICENSES AND PERMITS | | | | | | | | | | | | |
| | | | | | | | | | | | |
Motor Vehicle | | $ | 129.3 | | | $ | 132.0 | | | $ | 127.8 | |
Fish and Wildlife | | | 6.0 | | | | 6.2 | | | | 6.6 | |
Mines | | | 1.9 | | | | 1.6 | | | | 1.5 | |
Liquor Licenses | | | 0.9 | | | | 0.9 | | | | 0.7 | |
Other | | | 13.6 | | | | 13.1 | | | | 12.8 | |
| | $ | 151.7 | | | $ | 153.8 | | | $ | 149.4 | |
SCHEDULE 16 | | | | | | | | | | | | |
ROYALTIES | | | | | | | | | | | | |
| | | | | | | | | | | | |
Forest | | $ | 87.1 | | | $ | 76.2 | | | $ | 77.1 | |
Mines | | | 20.1 | | | | 13.1 | | | | 20.4 | |
| | $ | 107.2 | | | $ | 89.3 | | | $ | 97.5 | |
70 | PROVINCE OF NEW BRUNSWICK | 2016 |
SCHEDULES TO THE CONSOLIDATED FINANCIAL STATEMENTS
31 March 2016
| | (millions) | |
| | 2016 | | | 2016 | | | 2015 | |
| | Budget | | | Actual | | | Actual | |
SCHEDULE 17 | | | | | | | | | |
INCOME FROM GOVERNMENT BUSINESS ENTERPRISES | | | | | | | | | |
| | | | | | | | | |
New Brunswick Liquor Corporation | | $ | 167.0 | | | $ | 171.5 | | | $ | 165.3 | |
New Brunswick Power Corporation | | | 91.0 | | | | 12.0 | | | | 100.0 | |
add: regulatory deferral adjustment (Note 6) | | | --- | | | | 5.7 | | | | 5.7 | |
Other Entities | | | --- | | | | (0.1 | ) | | | (0.1 | ) |
| | $ | 258.0 | | | $ | 189.1 | | | $ | 270.9 | |
SCHEDULE 18 | | | | | | | | | | | | |
OTHER PROVINCIAL REVENUE | | | | | | | | | | | | |
| | | | | | | | | | | | |
Sales of Goods and Services | | | | | | | | | | | | |
General | | $ | 251.5 | | | $ | 255.4 | | | $ | 249.8 | |
Leases and Rentals | | | 24.4 | | | | 104.9 | | | | 109.4 | |
Intergovernmental | | | 37.2 | | | | 37.9 | | | | 36.4 | |
Institutional | | | 29.7 | | | | 32.9 | | | | 31.6 | |
Provincial Parks | | | 6.6 | | | | 7.2 | | | | 6.3 | |
Lotteries and Gaming | | | 141.5 | | | | 162.3 | | | | 145.1 | |
Investment Income | | | 39.2 | | | | 39.1 | | | | 39.7 | |
Fines and Penalties | | | 11.4 | | | | 11.7 | | | | 11.5 | |
Other Revenue | | | 86.7 | | | | 126.1 | | | | 102.8 | |
| | $ | 628.2 | | | $ | 777.5 | | | $ | 732.6 | |
SCHEDULE 19 | | | | | | | | | | | | |
UNCONDITIONAL GRANTS | | | | | | | | | | | | |
| | | | | | | | | | | | |
Canada Health Transfer | | $ | 717.8 | | | $ | 719.9 | | | $ | 686.7 | |
Canada Social Transfer | | | 273.4 | | | | 272.9 | | | | 267.2 | |
Statutory Subsidies | | | 1.9 | | | | 1.9 | | | | 1.9 | |
| | $ | 993.1 | | | $ | 994.7 | | | $ | 955.8 | |
2016 | PROVINCE OF NEW BRUNSWICK | 71 |
SCHEDULES TO THE CONSOLIDATED FINANCIAL STATEMENTS
31 March 2016
| | (millions) | |
| | 2016 | | | 2016 | | | 2015 | |
| | Budget | | | Actual | | | Actual | |
SCHEDULE 20 | | | | | | | | | |
CONDITIONAL GRANTS | | | | | | | | | |
| | | | | | | | | | | | |
Education | | $ | 142.5 | | | $ | 139.6 | | | $ | 145.5 | |
Economic Development | | | 48.7 | | | | 46.1 | | | | 44.8 | |
Central Government Services | | | 42.0 | | | | 40.4 | | | | 41.5 | |
Health | | | 24.0 | | | | 24.1 | | | | 26.6 | |
Transportation | | | 5.2 | | | | 12.3 | | | | 44.6 | |
Social Services | | | 3.9 | | | | 3.9 | | | | 3.9 | |
Other | | | 23.6 | | | | 23.6 | | | | 81.1 | |
| | $ | 289.9 | | | $ | 290.0 | | | $ | 388.0 | |
SCHEDULE 21 | | | | | | | | | | | | |
EDUCATION AND TRAINING | | | | | | | | | | | | |
| | | | | | | | | | | | |
Education | | $ | 1,174.5 | | | $ | 1,184.8 | | | $ | 1,161.1 | |
Post-Secondary Education Services | | | 513.9 | | | | 514.7 | | | | 513.5 | |
Pension Expense | | | 91.4 | | | | 95.5 | | | | 342.3 | |
Amortization Expense | | | 46.6 | | | | 47.9 | | | | 44.4 | |
Public Works and Infrastructure | | | 5.3 | | | | 8.4 | | | | 5.2 | |
Provision Expense | | | 6.5 | | | | 3.0 | | | | 11.5 | |
General Government | | | 2.0 | | | | (8.0 | ) | | | 5.7 | |
| | $ | 1,840.2 | | | $ | 1,846.3 | | | $ | 2,083.7 | |
SCHEDULE 22 | | | | | | | | | | | | |
HEALTH | | | | | | | | | | | | |
| | | | | | | | | | | | |
Health Services | | $ | 2,713.7 | | | $ | 2,742.3 | | | $ | 2,680.9 | |
Pension Expense | | | 78.4 | | | | 77.5 | | | | 70.5 | |
Amortization Expense | | | 72.8 | | | | 75.2 | | | | 73.0 | |
Public Works and Infrastructure | | | --- | | | | 4.0 | | | | 6.5 | |
| | $ | 2,864.9 | | | $ | 2,899.0 | | | $ | 2,830.9 | |
72 | PROVINCE OF NEW BRUNSWICK | 2016 |
SCHEDULES TO THE CONSOLIDATED FINANCIAL STATEMENTS
31 March 2016
| | (millions) | |
| | 2016 | | | 2016 | | | 2015 | |
| | Budget | | | Actual | | | Actual | |
SCHEDULE 23 | | | | | | | | | |
SOCIAL DEVELOPMENT | | | | | | | | | |
| | | | | | | | | | | | |
Social Development | | $ | 1,124.1 | | | $ | 1,171.0 | | | $ | 1,144.6 | |
Amortization Expense | | | 1.9 | | | | 7.1 | | | | 9.2 | |
Pension Expense | | | --- | | | | 12.4 | | | | 21.0 | |
Provision Expense | | | 4.0 | | | | 5.6 | | | | 7.2 | |
General Government | | | 0.3 | | | | 0.3 | | | | 0.3 | |
| | $ | 1,130.3 | | | $ | 1,196.4 | | | $ | 1,182.3 | |
SCHEDULE 24 | | | | | | | | | | | | |
PROTECTION SERVICES | | | | | | | | | | | | |
| | | | | | | | | | | | |
Public Safety | | $ | 181.5 | | | $ | 205.7 | | | $ | 189.4 | |
Justice | | | 44.6 | | | | 45.1 | | | | 44.0 | |
Attorney General | | | 18.9 | | | | 18.6 | | | | 18.4 | |
Pension Expense | | | 6.7 | | | | 5.7 | | | | 5.6 | |
Amortization Expense | | | 5.1 | | | | 5.1 | | | | 4.4 | |
General Government | | | 0.4 | | | | 0.5 | | | | 0.4 | |
Provision Expense | | | 0.6 | | | | 0.3 | | | | 6.3 | |
New Brunswick Credit Union Deposit Insurance Corporation | | | 0.2 | | | | 0.3 | | | | 0.2 | |
| | $ | 258.0 | | | $ | 281.3 | | | $ | 268.7 | |
SCHEDULE 25 | | | | | | | | | | | | |
ECONOMIC DEVELOPMENT | | | | | | | | | | | | |
| | | | | | | | | | | | |
Regional Development Corporation | | $ | 139.8 | | | $ | 117.2 | | | $ | 143.8 | |
Tourism, Heritage and Culture | | | 61.0 | | | | 59.3 | | | | 53.2 | |
Opportunities NB | | | 44.5 | | | | 28.3 | | | | --- | |
Invest NB | | | --- | | | | --- | | | | 6.8 | |
Post-Secondary Education, Training and Labour | | | 3.7 | | | | 4.1 | | | | 3.8 | |
Amortization Expense | | | 4.9 | | | | 3.7 | | | | 3.4 | |
Kings Landing Corporation | | | 3.7 | | | | 3.5 | | | | 3.5 | |
New Brunswick Immigrant Investor Fund (2009) Ltd. | | | 0.1 | | | | 2.4 | | | | 2.0 | |
Provincial Holdings Ltd. | | | 2.5 | | | | 1.4 | | | | 1.2 | |
Economic Development | | | --- | | | | --- | | | | 22.2 | |
Provision Expense | | | 6.5 | | | | (15.9 | ) | | | 7.7 | |
| | $ | 266.7 | | | $ | 204.0 | | | $ | 247.6 | |
2016 | PROVINCE OF NEW BRUNSWICK | 73 |
SCHEDULES TO THE CONSOLIDATED FINANCIAL STATEMENTS
31 March 2016
| | (millions) | |
| | 2016 | | | 2016 | | | 2015 | |
| | Budget | | | Actual | | | Actual | |
SCHEDULE 26 | | | | | | | | | |
LABOUR AND EMPLOYMENT | | | | | | | | | |
| | | | | | | | | | | | |
Post-Secondary Education, Training and Labour | | $ | 132.5 | | | $ | 134.1 | | | $ | 121.7 | |
General Government | | | 0.6 | | | | 0.6 | | | | 0.6 | |
Amortization Expense | | | --- | | | | 0.3 | | | | 0.3 | |
| | $ | 133.1 | | | $ | 135.0 | | | $ | 122.6 | |
SCHEDULE 27 | | | | | | | | | | | | |
RESOURCES | | | | | | | | | | | | |
| | | | | | | | | | | | |
Natural Resources | | $ | 92.4 | | | $ | 90.3 | | | $ | 99.9 | |
Agriculture and Aquaculture and Fisheries | | | 36.3 | | | | 36.2 | | | | 30.2 | |
Environment | | | 25.4 | | | | 23.9 | | | | 20.5 | |
Energy and Mines | | | 9.5 | | | | 9.2 | | | | 10.2 | |
Forest Protection Limited | | | 8.6 | | | | 7.7 | | | | 7.3 | |
New Brunswick Agricultural Insurance Commission | | | 8.1 | | | | 6.1 | | | | 6.5 | |
Recycle New Brunswick | | | 5.2 | | | | 4.9 | | | | 5.2 | |
Energy and Utilities Board | | | 3.7 | | | | 3.3 | | | | 3.1 | |
Provision Expense | | | 3.3 | | | | 2.4 | | | | (0.2 | ) |
Amortization Expense | | | 1.3 | | | | 1.3 | | | | 1.3 | |
Energy Efficiency and Conservation Agency of | | | | | | | | | | | | |
New Brunswick | | | --- | | | | --- | | | | 13.3 | |
Transportation and Infrastructure | | | 0.4 | | | | --- | | | | --- | |
| | $ | 194.2 | | | $ | 185.3 | | | $ | 197.3 | |
SCHEDULE 28 | | | | | | | | | | | | |
TRANSPORTATION AND INFRASTRUCTURE | | | | | | | | | | | | |
| | | | | | | | | | | | |
Transportation and Infrastructure | | $ | 345.8 | | | $ | 354.2 | | | $ | 366.0 | |
Amortization Expense | | | 278.0 | | | | 278.4 | | | | 263.6 | |
Provision Expense | | | 0.3 | | | | 3.4 | | | | 20.1 | |
| | $ | 624.1 | | | $ | 636.0 | | | $ | 649.7 | |
74 | PROVINCE OF NEW BRUNSWICK | 2016 |
SCHEDULES TO THE CONSOLIDATED FINANCIAL STATEMENTS
31 March 2016
| | (millions) | |
| | 2016 | | | 2016 | | | 2015 | |
| | Budget | | | Actual | | | Actual | |
SCHEDULE 29 | | | | | | | | | |
CENTRAL GOVERNMENT | | | | | | | | | |
General Government | | $ | 187.7 | | | $ | 136.2 | | | $ | 124.9 | |
Pension Expense | | | 125.4 | | | | 118.7 | | | | 123.2 | |
Local Government | | | 119.6 | | | | 115.0 | | | | 114.6 | |
Service New Brunswick - Current | | | 68.6 | | | | 69.7 | | | | --- | |
Service New Brunswick - Former | | | 30.0 | | | | 28.9 | | | | 59.6 | |
Legislative Assembly | | | 22.6 | | | | 22.6 | | | | 31.3 | |
Executive Council | | | 20.0 | | | | 19.9 | | | | 17.9 | |
Finance | | | 15.6 | | | | 15.1 | | | | 17.1 | |
New Brunswick Investment Management Corporation | | | 11.2 | | | | 12.2 | | | | 10.9 | |
Financial and Consumer Services Commission | | | 10.3 | | | | 11.1 | | | | 9.8 | |
New Brunswick Internal Services Agency | | | 11.9 | | | | 10.7 | | | | 23.9 | |
Amortization Expense | | | 6.6 | | | | 7.8 | | | | 6.4 | |
Human Resources | | | 3.4 | | | | 3.3 | | | | 3.3 | |
New Brunswick Lotteries and Gaming Corporation | | | 2.3 | | | | 3.2 | | | | 4.5 | |
Office of the Premier | | | 1.6 | | | | 1.6 | | | | 2.7 | |
Public Works and Infrastructure | | | 0.2 | | | | 0.1 | | | | 0.1 | |
Provision Expense | | | (3.5 | ) | | | 3.5 | | | | (19.9 | ) |
Government Services | | | 4.7 | | | | 5.7 | | | | 10.3 | |
| | $ | 638.2 | | | $ | 585.3 | | | $ | 540.6 | |
2016 | PROVINCE OF NEW BRUNSWICK | 75 |
SCHEDULES TO THE CONSOLIDATED FINANCIAL STATEMENTS
31 March 2016
SCHEDULE 30
PROVINCIAL REPORTING ENTITY
The Provincial Reporting Entity is comprised of certain organizations that are controlled by the government. These organizations are the Consolidated Fund, the General Sinking Fund and the agencies, commissions and corporations listed below. Further information regarding the accounting methods used to consolidate these organizations can be found in Note 1.
Organizations using the Consolidation Method:
Algonquin Golf Limited Algonquin Properties Limited Ambulance New Brunswick Inc. Arts Development Trust Fund Atlantic Education International Inc. Collège communautaire du Nouveau- Brunswick Economic and Social Inclusion Corporation Environmental Trust Fund Financial and Consumer Services Commission Forest Protection Limited Horizon Health Network Kings Landing Corporation New Brunswick Community College New Brunswick Agricultural Insurance Commission New Brunswick Credit Union Deposit Insurance Corporation | | New Brunswick Energy and Utilities Board New Brunswick Health Council New Brunswick Highway Corporation New Brunswick Housing Corporation New Brunswick Immigrant Investor Fund (2009) Ltd. New Brunswick Investment Management Corporation New Brunswick Legal Aid Services Commission New Brunswick Lotteries and Gaming Corporation Opportunities New Brunswick Provincial Holdings Ltd Recycle New Brunswick Regional Development Corporation Service New Brunswick Sport Development Trust Fund Vitalité Health Network |
Nursing Homes using the Consolidation Method:
Campbellton Nursing Home Inc. Campobello Lodge Inc. Carleton Manor Inc Carleton-Kirk Lodge Central Carleton Nursing Home Inc. Central New Brunswick Nursing Home Inc. Dalhousie Nursing Home Inc. Dr. V. A. Snow Centre Inc Drew Nursing Home Forest Dale Home Inc. Foyer Assomption Foyer Notre-Dame-de-Lourdes Inc. Foyer Notre-Dame de Saint-Léonard Inc. Foyer Saint-Antoine Foyer Ste-Élizabeth Inc. Fredericton South Nursing Home Inc. (Pine Grove Nursing Home) Fundy Nursing Home Grand Manan Nursing Home Inc. Jordan Lifecare Centre Inc. Kennebec Manor Inc. Kenneth E. Spencer Memorial Home Inc. Kings Way Care Centre Inc. | | Kiwanis Nursing Home Inc. La Villa Sormany Inc. Le Foyer St Thomas de la Vallée de Memramcook Inc. – Dr. Camille E. Gaudet Les Résidences Inkerman Inc. Les Résidences Jodin Inc. Les Résidences Lucien Saindon Inc. Les Résidences Mgr Chiasson Inc. Lincourt Manor Inc. Loch Lomond Villa Inc. Manoir Édith B. Pinet Inc. Manoir Saint-Jean Baptiste Inc. Mill Cove Nursing Home Inc. Miramichi Senior Citizens Home Inc. Mount St. Joseph of Chatham, N.B. Nashwaak Villa Inc. Passamaquoddy Lodge Inc. Résidence Mgr Melanson Inc. Rexton Lions Nursing Home Inc. River View Manor Inc. Rocmaura Inc. Tabusintac Nursing Home Inc. The Church of St. John and St. Stephen Home Inc. |
76 | PROVINCE OF NEW BRUNSWICK | 2016 |
SCHEDULES TO THE CONSOLIDATED FINANCIAL STATEMENTS
31 March 2016
The Salvation Army - Lakeview Manor | | Villa St-Joseph Inc. |
Tobique Valley Manor Inc. | | W. G. Bishop Nursing Home |
Turnbull Nursing Home Inc. | | Wauklehegan Manor Inc. |
Victoria Glen Manor Inc. | | Westford Nursing Home |
Villa Beauséjour Inc. | | White Rapids Manor Inc. |
Villa des Chutes / Falls Villa | | Woolastook Long Term Care Facility Inc. (Orchard |
Villa du Repos Inc. | | View) |
Villa Maria Inc. | | York Manor Inc. |
Villa Providence Shédiac Inc. | | |
| | |
Organizations using the Modified Equity Method: | | |
| | |
New Brunswick Liquor Corporation | | New Brunswick Power Corporation |
New Brunswick Municipal Finance Corporation | | |
| | |
Organizations using the Transaction Method: | | |
| | |
New Brunswick Arts Board | | New Brunswick Public Libraries Foundation |
New Brunswick Insurance Board | | Premier's Council on the Status of Disabled Persons |
New Brunswick Museum | | Strait Crossing Finance Inc. |