
Treasury Board and
Department of Finance
Economic, Strategic Program
Review and Fiscal Update
First Quarter 2017–2018

Economic, Strategic Program Review and Fiscal Update
First Quarter 2017–2018
Published by:
Treasury Board and Department of Finance
Government of New Brunswick
P.O. Box 6000
Fredericton, New Brunswick
E3B 5H1
Canada
Internet: www.gnb.ca/finance
August 2017
Translation:
Translation Bureau, Service New Brunswick
ISBN 978-1-4605-1866-3
 Think Recycling!
2017 Economic Update
| | · The International Monetary Fund (IMF) is projecting global economic growth of 3.5 per cent in 2017. Buoyant financial markets along with a recovery in manufacturing and global trade are expected to support growth. · Real GDP in the U.S. increased at an annualized rate of 2.6 per cent in the second quarter of 2017, an improvement on the 1.2 per cent growth recorded in the previous quarter. Notwithstanding the slow start to the year, the IMF projects growth of 2.1 per cent for 2017, a decrease of 0.2 per cent from earlier expectations. |
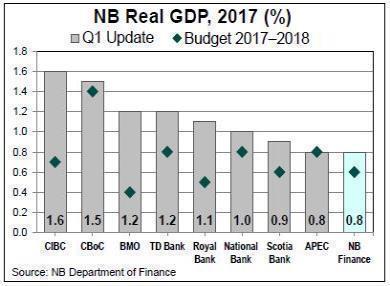
| | · The Bank of Canada (BoC) has raised its forecast for the Canadian economy and now projects growth of 2.8 per cent for 2017. This favourable outlook, backed by strong economic data, prompted the BoC to raise its key policy rate for the first time since 2010. · The Department of Finance projects real GDP growth of 0.8 per cent for 2017, up from the 0.6 per cent forecasted at the time of the 2017–2018 Budget. The consensus among private sector forecasters now places growth at 1.2 per cent for 2017. |
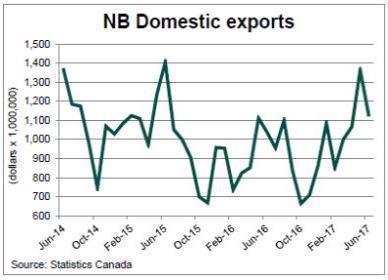
| | · While many key economic indicators have shown improvement and have been reflected in forecast expectations, a number of headwinds still remain on the horizon, particularly those related to international trade. · Despite the uncertainty surrounding foreign trade, merchandise exports are up 17.8 per cent on a year-to-date basis. The uptick in exports has been driven mainly by refined petroleum products and seafood products. · Labour market conditions are steadily improving as evidenced by a 0.8 per cent increase in employment year-to-date. Approximately 2,700 net new jobs have so far been created across both the goods producing and service sectors, with full-time gains offsetting part-time losses. |
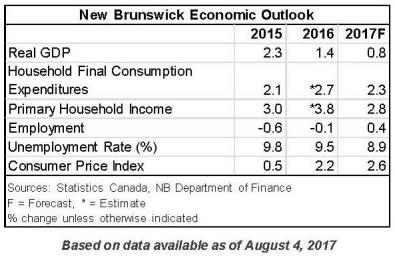
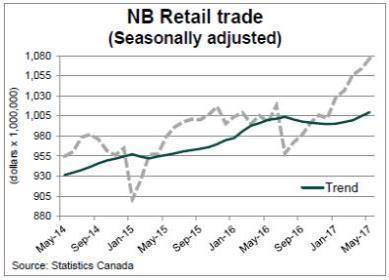
| | · Average weekly earnings have recorded modest growth of 0.9 per cent year-to-date. Increased household spending has also contributed to retail sales being up 5.0 per cent for the five-month period ending in May. · Consumer inflation in the province has averaged 2.7 per cent on a year-to-date basis, higher than the national rate of 1.6 per cent. |
Strategic Program Review Update
| · | Strategic Program Review (SPR) was an inclusive and transparent process with input sought from the public to help identify savings and revenues in order to eliminate the province’s deficit. |
| |
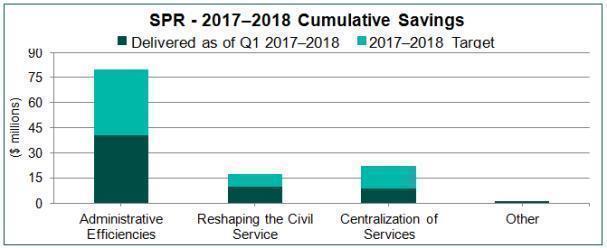
| · | Based on first quarter information, the projected cumulative savings by March 31, 2018, will be approximately $222 million; additional savings will be realized as projects are implemented. |
| |
| · | We are on track to deliver 94.5 per cent of the cumulative savings target of $235 million for 2017–2018. The major variances include: |
| o | Centralization of common services ($7 million under): Mainly due to the double counting of procurement savings within other SPR initiatives. |
| | |
| o | Education and Early Childhood Development ($3.5 million under): Mainly due to a change in demographics in student population associated with Syrian students. |
| · | By 2020, the Strategic Program Review is expected to yield $296 million in expenditure reductions and $293 million in revenue measures, for a grand total of $589 million. |
Strategic Program Review First Quarter Projections (in $ Thousands) |
Savings Initiatives | Achieved to date 2017–2018 | 2017–2018 Target | 2017–2018 Forecast | 2020–2021 Target | 2020–2021 Forecast |
2015–2016 Savings | $115,200 | $115,200 | $115,200 | $115,200 | $115,200 |
Administrative Efficiencies | $40,680 | $79,770 | $72,755 | $102,145 | $102,145 |
Reshaping the Civil Service | $10,131 | $17,199 | $18,598 | $24,959 | $24,959 |
Centralization of Services | $9,115 | $22,090 | $14,852 | $52,125 | $52,125 |
Other | $784 | $743 | $743 | $1,262 | $1,262 |
Total | $175,910 | $235,002 | $222,148 | $295,691 | $295,691 |
| · | Administrative Efficiencies: Projects include but are not limited to administration of Municipal Tax Warrant ($2.0 million), elimination of Municipal Fine Revenue Sharing ($1.5 million), standardization of budget processes ($1.4 million), and Vacant Bed Days policy compliance ($800,000). General administrative efficiencies such as rationalization of phone lines, computers and subscriptions, as well as continuous process improvement efforts, have resulted in savings of $35 million. |
| |
| · | Reshaping the Civil Service: Projects include but are not limited to reforming Transportation and Infrastructure ($6.5 million) and rightsizing the civil service, including combining positions and eliminating unneeded positions ($3.6 million). |
| |
| · | Centralization of Services: Projects include but are not limited to centralization of common services at Service New Brunswick ($7.8 million), consolidation of Lab Services ($600,000), Land Registry centralization ($400,000), and Human Resources centralization ($300,000). |
| |
| · | Other: Projects include but are not limited to Visitor Information Centre closures ($195,000) and Off-Road Vehicle Enforcement ($150,000). |
2017–2018 Fiscal Update
Based on first quarter information, there is a projected deficit of $156.1 million for 2017–2018. This is an improvement of $35.8 million compared to the budgeted deficit of $191.9 million.
Net debt is projected to increase by $325.6 million, a decrease of $36.5 million from budget. Net debt is projected to reach $14.3 billion by March 31, 2018.
Revenue:
Revenue is $10.6 million higher than budget. The major variances include:
| · | Miscellaneous Revenue is up $16.7 million mainly due to recoveries related to HST, increased revenue from the Regional Health Authorities and various other accounts across departments. |
| |
| · | Corporate Income Tax is up $5.6 million due to an increase in the national corporate taxable income forecast on which payments are based. |
| |
| · | Conditional Grants are up $4.0 million due to higher recoveries for various federally funded programs. |
| |
| · | Return on Investment is down $10.0 million mainly due to lower net income being projected by the New Brunswick Liquor Corporation. |
| |
| · | Provincial Real Property Tax is down $5.0 million due to the tax base being lower than forecasted. |
| |
| · | Tobacco Tax is down $4.0 million due to a higher than anticipated decrease in volume. |
Expense:
Total expenses are projected to be $25.2 million below budget. The major variances include the following:
| · | Energy and Resource Development is $3.1 million higher than budget mainly due to the purchase of LiDar mapping data, which is offset by additional revenue. |
| |
| · | General Government is under budget by $30.4 million mainly due to lower than planned expense for retirement allowance. |
| |
| · | Health is $11.4 million over budget mainly due to higher than expected expenses under the Medicare program partially offset by under-expenditures in other programs. |
| |
| · | Justice and Public Safety is $6.0 million over budget mainly due to additional expenses under the Disaster Financial Assistance program due to the 2017 ice storm. These expenses are partially offset by increased recoveries from the federal government. |
| |
| · | Post-Secondary Education, Training and Labour is $6.0 million over budget mainly due to additional expenditures in employment programs resulting from an expected increase in federal funding. |
| |
| · | Service of the Public Debt is $10.0 million below budget due to lower than expected short- term interest expense. |
| |
| · | Social Development is $9.8 million over budget mainly due to increased costs in the Housing Services Program (partially offset by lower expenses in the Special Purpose Account), and higher expenses in the Nursing Home Services program. |
| |
| · | Capital Account Expense is $4.4 million lower than budget mainly due to lower expenses in the Department of Transportation and Infrastructure. |
| |
| · | Special Purpose Accounts are under budget by $8.5 million mainly due to lower expenses in Justice and Public Safety and Social Development. |
PROVINCE OF NEW BRUNSWICK
FISCAL UPDATE
Thousands
$
| | 2017–2018 | | | 2017–2018 1st Quarter | | | Variance from | |
| | Budget | | | Projection | | | Budget | |
Revenue Ordinary Account | | | 8,749,709 | | | | 8,760,265 | | | | 10,556 | |
Capital Account | | | 34,663 | | | | 33,438 | | | | (1,225 | ) |
Special Purpose Account | | | 79,505 | | | | 79,566 | | | | 61 | |
Special Operating Agencies | | | 135,916 | | | | 137,123 | | | | 1,207 | |
Sinking Fund Earnings | | | 188,900 | | | | 188,900 | | | | 0 | |
Total Revenue | | | 9,188,693 | | | | 9,199,292 | | | | 10,599 | |
| | | | | | | | | | | | |
Expense | | | | | | | | | | | | |
Ordinary Account | | | 8,523,323 | | | | 8,512,725 | | | | (10,598 | ) |
Capital Account | | | 163,698 | | | | 159,300 | | | | (4,398 | ) |
Special Purpose Account | | | 94,666 | | | | 86,129 | | | | (8,537 | ) |
Special Operating Agencies | | | 138,149 | | | | 139,430 | | | | 1,281 | |
Amortization of Tangible Capital Assets | | | 460,802 | | | | 457,807 | | | | (2,995 | ) |
Total Expense | | | 9,380,638 | | | | 9,355,391 | | | | (25,247 | ) |
| | | | | | | | | | | | |
Surplus (Deficit) | | | (191,945 | ) | | | (156,099 | ) | | | 35,846 | |
CHANGE IN NET DEBT
Thousands
$
| | 2017–2018 | | | 2017–2018 1st Quarter | | | Variance from | |
| | Budget | | | Projection | | | Budget | |
| | | | | | | | | |
Net Debt - Beginning of Year | | | (13,997,406 | ) | | | (13,997,406 | ) | | | 0 | |
| | | | | | | | | | | | |
Changes in Year | | | | | | | | | | | | |
| | | | | | | | | | | | |
Surplus (Deficit) | | | (191,945 | ) | | | (156,099 | ) | | | 35,846 | |
| | | | | | | | | | | | |
Investments in Tangible Capital Assets | | | (630,925 | ) | | | (627,304 | ) | | | 3,621 | |
| | | | | | | | | | | | |
Amortization of Tangible Capital Assets | | | 460,802 | | | | 457,807 | | | | (2,995 | ) |
| | | | | | | | | | | | |
(Increase) Decrease in Net Debt | | | (362,068 | ) | | | (325,596 | ) | | | 36,472 | |
| | | | | | | | | | | | |
Net Debt - End of Year | | | (14,359,474 | ) | | | (14,323,002 | ) | | | 36,472 | |
APPENDIX A
ORDINARY ACCOUNT REVENUE BY SOURCE
Thousands
$
| | 2017–2018 | | | 2017–2018 1st Quarter | | | Variance from | |
| | Budget | | | Projection | | | Budget | |
| | | | | | | | | |
Taxes | | | | | | | | | | | | |
Personal Income Tax | | | 1,681,000 | | | | 1,681,000 | | | | 0 | |
Corporate Income Tax | | | 334,400 | | | | 340,000 | | | | 5,600 | |
Metallic Minerals Tax | | | 1,000 | | | | 1,900 | | | | 900 | |
Provincial Real Property Tax | | | 515,000 | | | | 510,000 | | | | (5,000 | ) |
Harmonized Sales Tax: net of credit | | | 1,418,600 | | | | 1,418,600 | | | | 0 | |
Gasoline and Motive Fuels Tax | | | 286,000 | | | | 286,000 | | | | 0 | |
Tobacco Tax | | | 164,000 | | | | 160,000 | | | | (4,000 | ) |
Pari-Mutuel Tax | | | 420 | | | | 420 | | | | 0 | |
Insurance Premium Tax | | | 55,600 | | | | 55,600 | | | | 0 | |
Real Property Transfer Tax | | | 23,000 | | | | 25,000 | | | | 2,000 | |
Financial Corporation Capital Tax | | | 27,000 | | | | 27,000 | | | | 0 | |
Penalties and Interest | | | 13,000 | | | | 12,000 | | | | (1,000 | ) |
Subtotal - Taxes | | | 4,519,020 | | | | 4,517,520 | | | | (1,500 | ) |
| | | | | | | | | | | | |
Return on Investment | | | 282,686 | | | | 272,718 | | | | (9,968 | ) |
Licences and Permits | | | 151,838 | | | | 155,139 | | | | 3,301 | |
Sale of Goods and Services | | | 432,158 | | | | 432,844 | | | | 686 | |
Lottery and Gaming Revenues | | | 152,457 | | | | 155,816 | | | | 3,359 | |
Royalties | | | 70,280 | | | | 69,730 | | | | (550 | ) |
Fines and Penalties | | | 8,215 | | | | 8,315 | | | | 100 | |
Miscellaneous | | | 82,379 | | | | 99,058 | | | | 16,679 | |
Total - Own Source Revenue | | | 5,699,033 | | | | 5,711,140 | | | | 12,107 | |
| | | | | | | | | | | | |
Unconditional Grants – Canada | | | | | | | | | | | | |
Fiscal Equalization Payments | | | 1,760,300 | | | | 1,760,300 | | | | 0 | |
Canada Health Transfer | | | 768,400 | | | | 768,400 | | | | 0 | |
Canada Social Transfer | | | 284,400 | | | | 284,400 | | | | 0 | |
Other | | | 1,866 | | | | 1,866 | | | | 0 | |
Subtotal - Unconditional Grants – Canada | | | 2,814,966 | | | | 2,814,966 | | | | 0 | |
| | | | | | | | | | | | |
Conditional Grants – Canada | | | 246,938 | | | | 250,940 | | | | 4,002 | |
| | | | | | | | | | | | |
Total - Grants from Canada | | | 3,061,904 | | | | 3,065,906 | | | | 4,002 | |
| | | | | | | | | | | | |
Subtotal | | | 8,760,937 | | | | 8,777,046 | | | | 16,109 | |
| | | | | | | | | | | | |
Inter-account Transactions | | | (11,228 | ) | | | (16,781 | ) | | | (5,553 | ) |
| | | | | | | | | | | | |
Ordinary Account Revenue | | | 8,749,709 | | | | 8,760,265 | | | | 10,556 | |
APPENDIX B
ORDINARY ACCOUNT EXPENSE
Thousands
$
| | 2017–2018 | | | 2017–2018 1st Quarter | | | Variance from | | | | |
| | Budget | | | Projection | | | Budget | | | % | |
DEPARTMENT | | | | | | | | | | | | |
Agriculture, Aquaculture and Fisheries | | | 33,532 | | | | 33,285 | | | | (247 | ) | | | -0.7 | % |
Education and Early Childhood Development | | | 1,188,434 | | | | 1,188,434 | | | | 0 | | | | 0.0 | % |
Energy and Resource Development | | | 102,422 | | | | 105,490 | | | | 3,068 | | | | 3.0 | % |
Environment and Local Government | | | 140,298 | | | | 140,298 | | | | 0 | | | | 0.0 | % |
Executive Council Office | | | 11,938 | | | | 11,938 | | | | 0 | | | | 0.0 | % |
Finance | | | 10,514 | | | | 10,514 | | | | 0 | | | | 0.0 | % |
General Government | | | 792,395 | | | | 762,007 | | | | (30,388 | ) | | | -3.8 | % |
Health | | | 2,657,185 | | | | 2,668,565 | | | | 11,380 | | | | 0.4 | % |
Justice and Public Safety | | | 228,581 | | | | 234,565 | | | | 5,984 | | | | 2.6 | % |
Legislative Assembly | | | 21,696 | | | | 21,897 | | | | 201 | | | | 0.9 | % |
Office of the Attorney General | | | 18,293 | | | | 18,293 | | | | 0 | | | | 0.0 | % |
Office of the Premier | | | 1,598 | | | | 1,598 | | | | 0 | | | | 0.0 | % |
Opportunities New Brunswick | | | 45,421 | | | | 45,341 | | | | (80 | ) | | | -0.2 | % |
Other Agencies | | | 369,188 | | | | 368,007 | | | | (1,181 | ) | | | -0.3 | % |
Post-Secondary Education, Training and Labour | | | 619,639 | | | | 625,656 | | | | 6,017 | | | | 1.0 | % |
Regional Development Corporation | | | 64,355 | | | | 64,355 | | | | 0 | | | | 0.0 | % |
Service of the Public Debt | | | 701,000 | | | | 691,000 | | | | (10,000 | ) | | | -1.4 | % |
Social Development | | | 1,168,418 | | | | 1,178,168 | | | | 9,750 | | | | 0.8 | % |
Tourism, Heritage and Culture | | | 60,184 | | | | 60,184 | | | | 0 | | | | 0.0 | % |
Transportation and Infrastructure | | | 302,109 | | | | 302,699 | | | | 590 | | | | 0.2 | % |
Treasury Board | | | 16,417 | | | | 16,417 | | | | 0 | | | | 0.0 | % |
| | | | | | | | | | | | | | | | |
Subtotal | | | 8,553,617 | | | | 8,548,711 | | | | (4,906 | ) | | | -0.1 | % |
| | | | | | | | | | | | | | | | |
Investment in Tangible Capital Assets | | | (19,066 | ) | | | (19,205 | ) | | | (139 | ) | | | 0.7 | % |
Inter-account Transactions | | | (11,228 | ) | | | (16,781 | ) | | | (5,553 | ) | | | 49.5 | % |
| | | | | | | | | | | | | | | | |
Ordinary Account Expense | | | 8,523,323 | | | | 8,512,725 | | | | (10,598 | ) | | | -0.1 | % |
APPENDIX C
CAPITAL EXPENDITURES
Thousands
$
| | 2017–2018 | | | 2017–2018 1st Quarter | | | Variance from | |
| | Budget | | | Projection | | | Budget | |
| | | | | | | | | | | | |
Regular Capital Investments | | | | | | | | | | | | |
Agriculture, Aquaculture and Fisheries | | | 100 | | | | 100 | | | | 0 | |
Education and Early Childhood Development | | | 43,067 | | | | 46,240 | | | | 3,173 | |
Energy and Resource Development | | | 2,900 | | | | 1,650 | | | | (1,250 | ) |
Health | | | 95,808 | | | | 95,599 | | | | (209 | ) |
Justice and Public Safety | | | 114 | | | | 114 | | | | 0 | |
Legislative Assembly | | | 450 | | | | 450 | | | | 0 | |
Post-Secondary Education, Training and Labour | | | 5,695 | | | | 5,706 | | | | 11 | |
Regional Development Corporation | | | 14,100 | | | | 14,100 | | | | 0 | |
Social Development | | | 5,200 | | | | 5,200 | | | | 0 | |
Tourism, Heritage and Culture | | | 3,920 | | | | 3,920 | | | | 0 | |
Transportation and Infrastructure | | | 394,837 | | | | 392,019 | | | | (2,818 | ) |
Regular Capital Investments | | | 566,191 | | | | 565,098 | | | | (1,093 | ) |
| | | | | | | | | | | | |
Strategic Infrastructure Initiative | | | | | | | | | | | | |
Agriculture, Aquaculture and Fisheries | | | 500 | | | | 500 | | | | 0 | |
Education and Early Childhood Development | | | 40,540 | | | | 38,047 | | | | (2,493 | ) |
Health | | | 13,883 | | | | 8,261 | | | | (5,622 | ) |
Regional Development Corporation | | | 78,370 | | | | 74,115 | | | | (4,255 | ) |
Tourism, Heritage and Culture | | | 6,650 | | | | 6,650 | | | | 0 | |
Transportation and Infrastructure | | | 19,275 | | | | 24,525 | | | | 5,250 | |
Energy Retrofit and Renewable Energy | | | 20,250 | | | | 20,250 | | | | 0 | |
Strategic Infrastructure Initiative | | | 179,468 | | | | 172,348 | | | | (7,120 | ) |
| | | | | | | | | | | | |
Recoveries | | | 29,898 | | | | 29,953 | | | | 55 | |
| | | | | | | | | | | | |
Total - Capital Expenditures | | | 775,557 | | | | 767,399 | | | | (8,158 | ) |
| | | | | | | | | | | | |
Investments in Tangible Capital Assets | | | (611,859 | ) | | | (608,099 | ) | | | 3,760 | |
| | | | | | | | | | | | |
Capital Account Expense | | | 163,698 | | | | 159,300 | | | | (4,398 | ) |