Exhibit 99.9
Treasury Board and Department of Finance
Economic and Fiscal Update
Second Quarter 2018–2019
Economic and Fiscal Update
Second Quarter 2018–2019
Published by:
Treasury Board and Department of Finance
Government of New Brunswick
P.O. Box 6000
Fredericton, New Brunswick
E3B 5H1
Canada
Internet: www.gnb.ca/finance
December 2018
Translation:
Translation Bureau, Service New Brunswick
ISBN 978-1-4605-1884-7
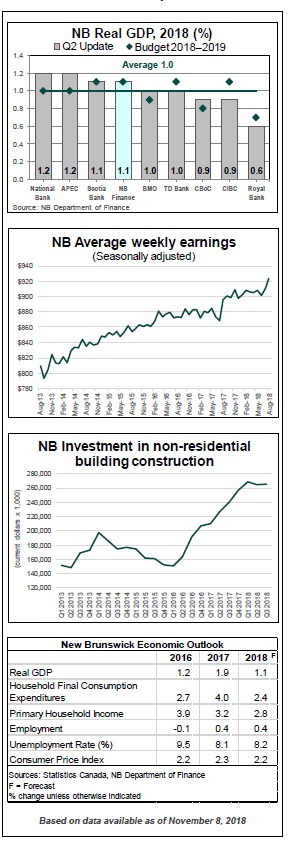
2018 Economic Update
| ● The International Monetary Fund (IMF) is projecting slower global economic growth than was projected in April, resulting in their revised forecast standing at 3.7 per cent for 2018. Some key factors linked to the lower outlook are trade tensions and slower growth in emerging markets. ● After a 2.2 per cent increase in the first quarter, the U.S. real GDP increased at an annual rate of4.2 per cent in the second quarter, mainly driven by a rise in personal consumption expenditures and higher exports. Moreover, the IMF is projecting growth in the U.S. of 2.9 per cent for 2018. ● The Bank of Canada (BoC) anticipates growth of 2.1 per cent in 2018. Solid gains in both foreign and domestic demand, and continuing favourable financial conditions will be the key drivers. ● The Department of Finance projects real GDP growth for New Brunswick of 1.1 per cent for 2018. This is consistent with the 1.0 per cent growth rate consensus among private sector forecasters. ● Labour market conditions continue to show modest growth. Employment is up by 0.4 per cent for the January-October period. ● Average weekly earnings are up 3.2 per cent on a year-to-date basis due to gains in the service producing industries. The national average weekly earnings are up 2.9 per cent. ● Domestic exports have increased 11.8 per cent so far this year. Advances were mainly driven by gains in energy products, and basic and industrial chemical, plastic and rubber products. ● Manufacturing sales are up by 11.6 per cent on a year-to-date basis, caused by gains in both the non-durable goods industries and the durable goods industries. Wood product manufacturing shows continued strength, posting growth of 30.8 per cent. ● Housing starts in the province have increased2.3 per cent through the first three quarters of the year, while investment in non-residential building construction has increased by 18.7 per cent. ● Consumer inflationin the province has averaged 2.3 per cent so far this year, slightly lower than the national rate of 2.4 per cent. |
2018–2019 Fiscal Update
Based on second quarter information, there is a projected deficit of $131.4 million for 2018–2019. This is an improvement of $57.3 million compared to the budgeted deficit of
$188.7 million.
Second Quarter Fiscal Summary |
| | 2018–2019 2nd Quarter Projection | |
| Revenue | 9,427.3 | 9,578.9 | 151.7 |
| Expense | 9,616.0 | 9,710.4 | 94.4 |
| Surplus (Deficit) | (188.7) | (131.4) | 57.3 |
Net debt is projected to increase by $337.8 million, an improvement of $34.5 million from budget. Net debt is projected to reach $14.3 billion by March 31, 2019.
Revenue:
Revenue is $151.7 million higher than budget. The major variances include:
●
Corporate Income Tax revenue is up $91.1 million due to the anticipated improvement to both in-year and prior-year revenue reflecting stronger than expected 2017 assessments and a higher forecast of national corporate taxable income.
●
Conditional Grants are up $56.5 million mainly due to projected recoveries under the Disaster Financial Assistance program and the new Healthy Seniors Pilot Project.
●
Personal Income Tax revenue is up $39.0 million from budget due to a strengthened forecast base and an anticipated positive prior-year adjustment related to the 2017 taxation year.
●
Unconditional Grants are up $29.8 million to reflect official federal estimates for the Canada Health Transfer and the Canada Social Transfer, including the positive impact of revised population estimates based upon the 2016 Census.
●
Sale of Goods and Services is up $6.3 million mainly due to increased projections of revenue from the Regional Health Authorities and Department of Health recovery levy, as well as various other accounts across departments.
●
Return on Investment is down $45.6 million mainly as a result of lower net income being projected by the New Brunswick Power Corporation. This is due to a lower-than-planned rate increase, a delay in the implementation of this increase, as well as higher in-and-out- of-province fuel and purchased power costs.
●
Capital Revenue is down $13.4 million as a result of lower recoveries due to changes in the timing of work under the New Building Canada Fund.
●
Tobacco Tax is down $10.0 million due to lower than projected volumes.
●
Special Operating Agencies revenue is down $7.1 million mainly due to the timing of projects being completed.
●
Cannabis-related revenue is down $3.9 million to reflect the October 17, 2018 legalization date. This includes reductions in the projected Cannabis Duty, revenues from the Cannabis Management Corporation, and the Cannabis Education and Awareness Fund.
Expense:
Total expenses are projected to be over budget by $94.4 million. The major variances include the following:
●
Justice and Public Safety is $67.2 million over budget mainly due to expenses incurred under the Disaster Financial Assistance program primarily associated with the 2018 spring flood. These expenses are offset to a large extent by federal recoveries.
●
Social Development is $36.6 million over budget mainly due to the high costs in the Disability Support Services program, Child Welfare Services program, Housing program, and expenses in the Aging Secretariat Program (offset by federal revenue from the Healthy Seniors Pilot Project).
●
Special Purpose Accounts are over budget by $15.6 million mainly due to the reallocation of various projects from the Capital Budget to the Climate Change Fund. This is partially offset by lower Capital Account expense.
●
Post-Secondary Education, Training and Labour is $7.2 million over budget mainly due to additional expenditures in the Student Financial Assistance program.
●
Other Agencies are $3.0 million over budget mainly due to increased expenditures associated with several consolidated entities (offset by an increase in revenue).
●
Amortization Expense is $2.7 million under budget mainly due to implementation delays in various projects.
●
General Government is under budget by $6.5 million mainly due to lower than expected expenses in Supplementary Funding Provision and Pension and Employee Benefits.
●
Service of the Debt is $10 million lower primarily due to higher interest income earned.
PROVINCE OF NEW BRUNSWICK
FISCAL UPDATE
Thousands
$
| | | | | |
| | | | | |
| | | | | |
| Revenue | | | | |
| Ordinary Account | 8,946,303.00 | 9,033,020.00 | 9,121,659.00 | 175,356.00 |
| Capital Account | 48,264.00 | 44,121.00 | 34,903.00 | (13,361.00) |
| Special Purpose Account | 117,289.00 | 118,526.00 | 114,073.00 | (3,216.00) |
| Special Operating Agencies | 124,198.00 | 118,848.00 | 117,076.00 | (7,122.00) |
| Sinking Fund Earnings | 191,200.00 | 191,200.00 | 191,200.00 | 0 |
| Total Revenue | 9,427,254.00 | 9,505,715.00 | 9,578,911.00 | 151,657.00 |
| | | | | |
| Expense | | | | |
| Ordinary Account | 8,773,358.00 | 8,840,815.00 | 8,867,260.00 | 93,902.00 |
| Capital Account | 153,502.00 | 147,967.00 | 139,763.00 | (13,739.00) |
| Special Purpose Account | 86,099.00 | 101,305.00 | 101,728.00 | 15,629.00 |
| Special Operating Agencies | 117,635.00 | 120,844.00 | 118,913.00 | 1,278.00 |
| Amortization of Tangible Capital Assets | 485,398.00 | 482,173.00 | 482,688.00 | (2,710.00) |
| Total Expense | 9,615,992.00 | 9,693,104.00 | 9,710,352.00 | 94,360.00 |
| | | | | |
| Surplus (Deficit) | (188,738.00) | (187,389.00) | (131,441.00) | 57,297.00 |
CHANGE IN NET DEBT
Thousands
$
| | | | | |
| | | | | |
| | | | | |
| Net Debt - Beginning of Year | (14,099,847.00) | (14,099,847.00) | (13,926,249.00) | 173,598.00 |
| | | | | |
| Changes in Year | | | | |
| | | | | |
| Surplus (Deficit) | (188,738.00) | (187,389.00) | (131,441.00) | 57,297.00 |
| Investments in Tangible Capital Assets | (668,993.00) | (680,199.00) | (689,086.00) | (20,093.00) |
| Amortization of Tangible Capital Assets | 485,398.00 | 482,173.00 | 482,688.00 | (2,710.00) |
| (Increase) Decrease in Net Debt | (372,333.00) | (385,415.00) | (337,839.00) | 34,494.00 |
| Net Debt - End of Year | (14,472,180.00) | (14,485,262.00) | (14,26,088) | 208,092.00 |
At second quarter, Net Debt - Beginning of Year has been updated to reflect the ending net debt that was published in the 2017–2018 Consolidated Financial Statements (Public Accounts Volume I).
APPENDIX A
ORDINARY ACCOUNT REVENUE BY SOURCE
Thousands
$
| | | | | |
| | | | | |
| | | | | |
| Taxes | | | | |
| Personal Income Tax | 1,682,000 | 1,702,000 | 1,721,000 | 39,000 |
| Corporate Income Tax | 311,800 | 311,800 | 402,900 | 91,100 |
| Metallic Minerals Tax | 1,900 | 1,900 | 1,900 | - |
| Provincial Real Property Tax | 514,750 | 514,750 | 518,000 | 3,250 |
| Harmonized Sales Tax: net of credit | 1,492,500 | 1,492,500 | 1,492,500 | - |
| Gasoline and Motive Fuels Tax | 248,600 | 248,600 | 246,600 | (2,000) |
| Tobacco Tax | 156,000 | 152,000 | 146,000 | (10,000) |
| Pari-Mutuel Tax | 500 | 500 | 500 | - |
| Insurance Premium Tax | 57,600 | 59,600 | 59,600 | 2,000 |
| Real Property Transfer Tax | 25,000 | 28,000 | 28,000 | 3,000 |
| Financial Corporation Capital Tax | 27,000 | 27,000 | 27,000 | - |
| Cannabis Duty | 6,000 | 3,600 | 3,600 | (2,400) |
| Penalties and Interest. | 13,000 | 13,000 | 13,000 | - |
| Subtotal - Taxes | 4,536,650 | 4,555,250 | 4,660,600 | 123,950 |
| | | | | |
| Return on Investment | 264,235 | 263,451 | 218,652 | (45,583) |
| Licences and Permits | 158,479 | 160,900 | 161,010 | 2,531 |
| Sale of Goods and Services | 448,125 | 453,155 | 454,455 | 6,330 |
| Royalties | 69,730 | 69,730 | 69,730 | - |
| Agency Revenues | 160,900 | 161,100 | 161,100 | 200 |
| Fines and Penalties | 6,804 | 6,804 | 6,804 | - |
| Miscellaneous. | 91,578 | 92,598 | 93,038 | 1,460 |
| Total - Own Source Revenue | 5,736,501 | 5,762,988 | 5,825,389 | 88,888 |
| | | | | |
| Unconditional Grants – Canada | | | | |
| Fiscal Equalization Payments | 1,873,898 | 1,873,898 | 1,873,898 | - |
| Canada Health Transfer | 791,900 | 791,900 | 813,669 | 21,769 |
| Canada Social Transfer | 290,600 | 290,600 | 298,662 | 8,062 |
| Other | 1,866 | 1,866 | 1,866 | - |
| Subtotal - Unconditional Grants – Canada | 2,958,264 | 2,958,264 | 2,988,095 | 29,831 |
| | | | | |
| Conditional Grants – Canada | 266,466 | 326,696 | 322,961 | 56,495 |
| Total - Grants from Canada | 3,224,730 | 3,284,960 | 3,311,056 | 86,326 |
| Subtotal | 8,961,231 | 9,047,948 | 9,136,445 | 175,214 |
| Inter-account Transactions | (14,928) | (14,928) | (14,786) | 142 |
| Ordinary Account Revenue | 8,946,303 | 9,033,020 | 9,121,659 | 175,356 |
APPENDIX B
ORDINARY ACCOUNT EXPENSE
Thousands
$
| | | | | | |
| | | | | | |
| | | | | | |
| DEPARTMENT | | | | | |
| Agriculture, Aquaculture and Fisheries | 37,196 | 38,696 | 38,596 | 1,400 | 0 |
| Education and Early Childhood Development | 1,258,007 | 1,253,007 | 1,258,007 | - | - |
| Energy and Resource Development | 101,820 | 102,820 | 103,220 | 1,400 | 0 |
| Environment and Local Government | 142,035 | 142,505 | 142,670 | 635 | 0 |
| Executive Council Office | 12,546 | 12,521 | 12,521 | (25) | (0) |
| Finance | 10,797 | 10,797 | 10,797 | - | - |
| General Government | 792,547 | 777,055 | 786,037 | (6,510) | (0) |
| Health | 2,753,351 | 2,753,351 | 2,753,351 | - | - |
| Justice and Public Safety | 231,885 | 283,749 | 299,111 | 67,226 | 0 |
| Legislative Assembly | 30,717 | 30,717 | 30,717 | - | - |
| Office of the Attorney General | 20,256 | 20,256 | 20,256 | - | - |
| Office of the Premier | 1,598 | 1,598 | 1,598 | - | - |
| Opportunities New Brunswick | 47,186 | 45,492 | 46,986 | (200) | (0) |
| Other Agencies | 386,108 | 390,997 | 389,112 | 3,004 | 0 |
| Post-Secondary Education, Training and Labour | 644,758 | 649,006 | 651,908 | 7,150 | 0 |
| Regional Development Corporation | 70,148 | 70,148 | 70,148 | - | - |
| Service of the Public Debt. | 675,000 | 665,000 | 665,000 | (10,000) | (0) |
| Social Development | 1,194,547 | 1,231,147 | 1,231,147 | 36,600 | 0 |
| Tourism, Heritage and Culture | 62,633 | 62,693 | 62,693 | 60 | �� 0 |
| Transportation and Infrastructure | 307,404 | 307,404 | 307,404 | - | - |
| Treasury Board | 16,342 | 16,267 | 15,848 | (494) | (0) |
| | | | | | |
| Subtotal. | 8,796,881 | 8,865,226 | 8,897,127 | 100,246 | 0 |
| | | | | | |
| Investment in Tangible Capital Assets | (7,195) | (8,083) | (12,881) | (5,686) | 1 |
| Inter-account Transactions | (16,328) | (16,328) | (16,986) | (658) | 0 |
| | | | | | |
| Ordinary Account Expense | 8,773,358 | 8,840,815 | 8,867,260 | 93,902 | 0 |
APPENDIX C
CAPITAL EXPENDITURES
Thousands
$
| | | | | |
| | | | | |
| | | | | |
| Provincial Source Capital Investments | | | | |
| Agriculture, Aquaculture and Fisheries | 2,300 | 2,300 | 2,300 | - |
| Education and Early Childhood Development | 103,303 | 91,411 | 87,313 | (15,990) |
| Energy and Resource Development | 4,220 | 3,020 | 3,070 | (1,150) |
| Environment and Local Government | 1,000 | 1,000 | 1,300 | 300 |
| Health | 96,892 | 108,606 | 132,136 | 35,244 |
| Justice and Public Safety | 3,215 | 3,215 | 1,030 | (2,185) |
| Legislative Assembly | 50 | 50 | 50 | - |
| Post-Secondary Education, Training and Labour | 6,251 | 6,251 | 6,269 | 18 |
| Regional Development Corporation | 77,455 | 81,486 | 75,580 | (1,875) |
| Social Development | 12,000 | 12,000 | 12,000 | - |
| Tourism, Heritage and Culture | 12,590 | 15,530 | 14,412 | 1,822 |
| Transportation and Infrastructure | 448,870 | 451,787 | 446,212 | (2,658) |
| Subtotal - Provincial Source Capital Investments | 768,146 | 776,656 | 781,672 | 13,526 |
| | | | | |
| Other Source Capital Investments | | | | |
| Transportation and Infrastructure | 41,690 | 37,405 | 28,274 | (13,416) |
| Other Departments | 5,464 | 6,022 | 6,022 | 558 |
| Subtotal - Other Source Capital Investments | 47,154 | 43,427 | 34,296 | (12,858) |
| | | | | |
| Total - Capital Expenditures | 815,300 | 820,083 | 815,968 | 668 |
| | | | | |
| Investments in Tangible Capital Assets | (661,798) | (672,116) | (676,205) | (14,407) |
| | | | | |
| Capital Account Expense | 153,502 | 147,967 | 139,763 | (13,739) |