Table of Contents
| | Page |
| | |
| Map of the Province | 3 |
| Summary of Economic and Financial Information | 4 |
| General Information | 6 |
| The Economy | 9 |
| Revenue and Expenditure of the Province | 22 |
| Financing | 33 |
| Consolidation of New Brunswick Public Sector Debt | 38 |
| Public Sector Pension Liabilities | 39 |
| New Brunswick Power Corporation | 40 |
Funded Debt Outstanding as at 31st March 2019 | 41 |
| Foreign Exchange | 42 |
| Sources of Information | 42 |
All dollar amounts herein are in Canadian dollars unless otherwise specified. On December 20th, 2019 the daily average exchange rate for United States (U.S.) dollars as reported by the Bank of Canada, expressed in Canadian dollars was $1.3164.
Financial data for the Province of New Brunswick ("New Brunswick" or the "Province") have been rounded. Certain information presented in tabular form may not add to the total presented due to such rounding.
Compound annual rates of growth are computed by using the "geometric average method" which is based on first and last year observations of the variables rather than all observations over the period concerned.
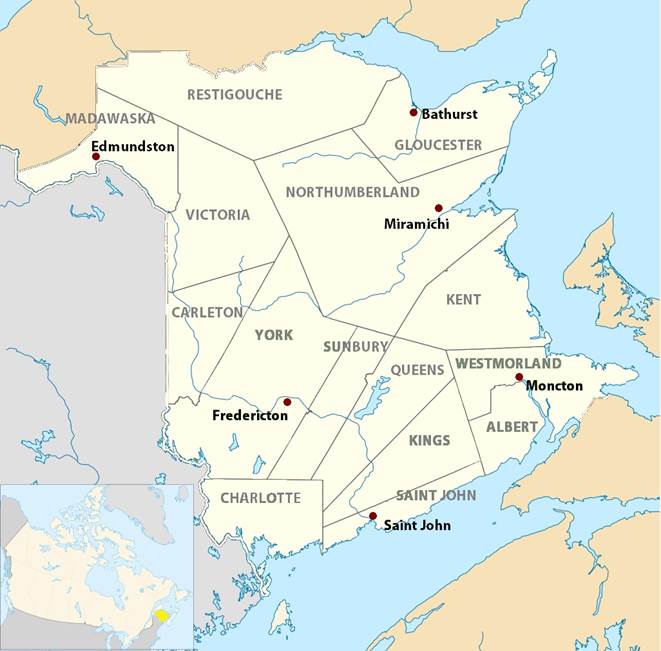
MAP OF NEW BRUNSWICK
SUMMARY OF ECONOMIC AND FINANCIAL INFORMATION FOR NEW BRUNSWICK
The following summary information is qualified in its entirety by the information contained herein:
Summary
| | Year Ended December 31, | |
| | | | | | | | CAGR1 % |
| | 2014 | 2015 | 2016 | 2017 | 2018 | | 2014-2018 |
| | (In millions of dollars unless otherwise indicated) |
| Economy | | | | | | | |
| Gross domestic product (current dollars) | 32,462 | 33,453 | 34,330 | 35,825 | 36,966 | | 3.3% |
| Primary household income | 22,574 | 22,797 | 23,232 | 23,939 | 24,711 | | 2.3% |
| Retail trade | 11,479.3 | 11,730.2 | 11,977.9 | 12,792.1 | 13,012.9 | | 3.2% |
| Manufacturing sales | 18,764.7 | 16,918.6 | 16,257.3 | 18,743.4 | 18,536.9 | | -0.3% |
| Foreign commodity exports | 13,031.8 | 12,210.2 | 10,642.3 | 12,856.6 | 12,593.6 | | -0.9% |
| Population (July 1; thousands) | 759.0 | 758.8 | 763.4 | 766.8 | 770.9 | | 0.4% |
| Employment (thousands) | 353.9 | 351.8 | 351.5 | 352.9 | 353.8 | | 0.0% |
| Unemployment rate | 9.9% | 9.8% | 9.5% | 8.1% | 8.0% | | -- |
| Consumer price index (% change) | 1.5% | 0.5% | 2.2% | 2.3% | 2.1% | | -- |
| Gross domestic product (real; % change) | 0.1% | 0.7% | 0.8% | 2.2% | 0.8% | | -- |
Source Statistics Canada: numbers are subject to adjustment
1Compound annual growth rate
| | Year Ending March 31 |
| | 2016 | 2017 | 2018 | 2019 | Budget Estimates 2020 |
| | (In millions of dollars) |
| Government Finance | | | | | |
| Ordinary Account (Surplus) Deficit | 57.1 | (101.4) | (398.0) | (427.9) | (432.8) |
| Net Capital Expenditure | 546.2 | 579.4 | 663.2 | 717.7 | 578.1 |
| (Surplus) Deficit on Special Purpose Account | 3.1 | 1.7 | 2.7 | (7.1) | 4.8 |
| (Surplus) Deficit on Special Operating Agency | (1.8) | (10.2) | (1.5) | (7.0) | 6.2 |
| Earnings from Sinking Fund | (194.1) | (192.8) | (189.8) | (195.5) | (205.5) |
| Accounting adjustments on consolidation | 131.6 | (108.0) | 29.4 | (47.5) | - |
| Increase (Decrease) in Net Debt | 542.1 | 168.8 | 105.9 | 32.7 | (49.2) |
| Adjustments related to non-financial assets | (281.7) | (51.8) | (173.0) | (105.4) | 26.1 |
| Annual (Surplus) Deficit | 260.5 | 117.0 | (67.0) | (72.6) | (23.1) |
| | 2015 | 2016 | 2017 | 2018 | 2019 |
| | (In millions of dollars unless indicated) |
| | |
Provincial Purpose Funded Debt 1 | | | | | |
| Gross Provincial Purpose Funded Debt | 14,813.40 | 15,740.50 | 16,569.60 | 17,233.50 | 18,003.90 |
| Less Sinking Funds | 4,049.60 | 4,201.30 | 4,212.70 | 4,418.50 | 4,776.40 |
| Net Provincial Purpose Funded Debt | 10,763.80 | 11,539.20 | 12,356.90 | 12,815.00 | 13,227.50 |
| | | | | | |
| As a Percent of GDP | 32.2% | 33.6% | 34.5% | 34.7% | 35.1% |
| | 2015 | 2016 | 2017 | 2018 | 2019 |
| | (In millions of dollars) |
Funded Debt Used for Advances to NB Power2 | | | | | |
| Gross Advances | 4,607.1 | 4,514.3 | 4,422.7 | 4,412.3 | 4,624.0 |
| Less Sinking Funds | 471.3 | 463.7 | 503.0 | 505.1 | 561.9 |
| Net Advances | 4,135.8 | 4,050.6 | 3,919.7 | 3,907.2 | 4,062.1 |
| | 2015 | 2016 | 2017 | 2018 | 2019 |
| | (In millions of dollars) |
| | | | | | |
| Contingent Liabilities | 42.1 | 42.4 | 30.4 | 23.2 | 21.9 |
1 Foreign currency issues are expressed as the Canadian dollar equivalent at fiscal year-end rates of exchange or, where hedges are in place, at the rates of exchange established by such hedges.
2 Foreign currency issues are expressed as the Canadian dollar equivalent at fiscal year-end rates of exchange.
GENERAL INFORMATION
Introduction
New Brunswick (“New Brunswick” or the “Province”) is located on the eastern seaboard of Canada and is one of the four Atlantic Provinces. New Brunswick has a total area of 28,355 square miles of which about 12,981 square miles is Crown land owned by the Province. The Saint John River flows for a distance of over 300 miles through the Province to its mouth on the Bay of Fundy. The Province's population is concentrated principally in the valleys of the Saint John and other rivers.
A large part of New Brunswick is covered by forests which constitute a major natural resource. Other natural resources include fish and shellfish, farmland and base metals, coal, potash, limestone and other minerals. The location of the Province provides the advantage of cost effective water transportation for its products to export markets in the eastern U.S., Great Britain and Western Europe. The City of Saint John, located at the mouth of the Saint John River on the Bay of Fundy, is home to one of North America’s largest oil refineries and is one of the two principal seaports in eastern Canada that remain open throughout the year. Consequently, some Canadian shipping, which would otherwise pass through the St. Lawrence River, is diverted to the Saint John port during the winter months.
According to Statistics Canada, the population of the Province on July 1, 2019 was estimated at 776, 827. The three largest urban areas of New Brunswick and their respective populations are Moncton (152,604), Saint John (130,107) and Fredericton (108,054), the capital of the Province.
Government
Canada consists of a federation of provinces and federal territories with a constitutional division of powers between the federal and provincial governments established by the Constitution Act, 1867 and the Constitution Act, 1982. Under these Acts the provinces are assigned jurisdiction over health, social services, education, municipal institutions, property and civil rights, natural resources and other matters of purely private or local concern. The Parliament of Canada has jurisdiction over all areas not assigned exclusively to the provincial legislatures, including such matters as the federal public debt and property, the regulation of trade and commerce, currency and coinage, banks and banking, national defense, the postal services, railways and navigation, and employment insurance.
The Constitution Act, 1982 provides for enlarged provincial jurisdiction over, and taxation of, certain natural resources and electrical energy, a Charter of Rights and Freedoms, including language rights, the principles of the reduction of regional economic disparities and the making of fiscal equalization payments to certain provinces by the Government of Canada, and for the amendment of the constitution in Canada. Each province owns mineral and other resources on its provincial Crown Lands and may own sub-surface resources on its other lands.
The executive power in New Brunswick is vested in the Lieutenant-Governor acting on the advice of the Executive Council. The Executive Council is responsible to the Legislative Assembly. The Lieutenant-Governor, who is the representative of the Queen, is appointed by the Governor-General of Canada in Council on the recommendation of the Prime Minister of Canada. The current Lieutenant-Governor is the Honourable Brenda L. Murphy. Members of the Executive Council are appointed by the Lieutenant-Governor on the nomination of the Premier from members of the Legislative Assembly.
Legislative power is exercised by the Legislative Assembly and legislation becomes effective upon the assent of the Lieutenant-Governor unless otherwise specified in the legislation. The Legislative Assembly is elected for a term of four years and may be dissolved at any time by the Lieutenant-Governor. The last general election occurred on September 24, 2018. Currently there is a Progressive Conservative Government led by Premier Blaine Higgs.
International Trade Agreements
The Canada-U.S. Free Trade Agreement and the successor North American Free Trade Agreement (“NAFTA”) have provided the Province of New Brunswick with an extraordinary advantage in the U.S. market. Even as the United States implements more regional/bilateral free trade agreements, which have tended to erode this exclusive relationship, the United States remains Canada and New Brunswick’s number one export market. At the request of the United States, Canada, Mexico and the United States began talks on renegotiating NAFTA in August 2017.
Intensive negotiations were conducted throughout September 2018 between Canada and the United States resulted in an agreement in principle on September 30, 2018. The revised agreement, replacing NAFTA, is known as the Canada-United States- Mexico Agreement (“CUSMA”). The CUSMA was signed on November 30, 2018. Each government is undertaking its respective ratification process to enable the coming into force of the CUSMA. In late November 2019, tripartite talks resumed to deal with outstanding concerns of US lawmakers with a view to enabling ratification by the United States. On December 10, 2019, the three parties signed an addendum to the agreement and all three parties have expressed confidence in their respective ratification processes.
On February 12, 2010, Canada and the United States signed the Canada-U.S. Agreement on Procurement (“CUSPA”) which includes for the first time provincial and territorial procurement commitments under the World Trade Organization’s (“WTO”) Government Procurement Agreement (“GPA”). Negotiations to modernize the WTO’s GPA and to expand market access opportunities for the parties to this agreement, including the provinces and territories of Canada, were successfully concluded in December 2011. The revised GPA entered into force on April 6, 2014, some two years after the protocol amending the GPA was originally adopted. Canadian suppliers are guaranteed non-discriminatory access to opportunities in the government procurement markets of 47 WTO members.
The WTO remains the cornerstone of Canadian trade policy. New Brunswick is supportive of Canada’s position on the negotiating framework for the Doha Development Round and for the WTO as an institution. The Province participates actively on federal/provincial committees concerned with implementation, dispute settlement and negotiation aspects of international trade and investment agreements.
However as multilateral WTO negotiations have lagged in recent years, the Government of Canada has become more aggressive with its regional free trade agenda. Canada is a signatory to fourteen free trade agreements, including NAFTA, CETA, CPTPP and more recently CUSMA, which will replace NAFTA. Nine of these have been entered into since 2009. Other than CETA, CPTPP and the CUSMA, the two most recent agreements are with South Korea (signed on March 11, 2014 and in force January 1, 2015) and the Ukraine (signed July 11, 2016 and in force August 1, 2017). In addition, the “Canada-Israel Free Trade Amending Protocol 2018” was signed on May 28, 2018 and came into force on September 1, 2019. Bilateral free trade negotiations are ongoing with MERCOSUR (Argentina, Brazil, Paraguay and Uruguay) the Pacific Alliance, India, Japan, the Caribbean Community, the Dominican Republic and several Central America countries, Morocco and Singapore. Exploratory talks are also ongoing with the Association of Southeast Asian Nations.
In February 2016 the TPP was signed by 12 countries: Australia, Brunei, Chile, Malaysia, New Zealand, Peru, Singapore, the United States, Vietnam, Canada, Mexico and Japan. In January 2017 the United States declared that it would not ratify the TPP. The 11 remaining countries committed to reaching a new deal. On January 23, 2018, negotiations concluded on what is now known as the Comprehensive and Progressive Agreement for Trans-Pacific Partnership (“CPTPP”). The Canadian Parliament ratified Canada’s membership in the CPTPP and the agreement entered into force on December 30, 2018 for Canada and the five other member countries (Australia, Japan, Mexico, New Zealand, and Singapore) that completed their ratification procedures. The CPTPP enters into force for the remaining countries as they ratify the agreement.
The Canada-European Union (“EU”) Comprehensive Economic and Trade Agreement (“CETA”) was signed on October 30, 2016 and entered into force on September 21, 2017. CETA covers virtually all sectors and aspects of Canada-EU trade in order to eliminate or reduce barriers. CETA addresses everything from tariffs to product standards, investment, professional certification and many other areas of activity. The agreement’s broad scope includes improved access to EU markets for goods and services; greater certainty, transparency, and protection for investments; and new opportunities in EU procurement markets. Prior to CETA’s entry into force, only 25% of EU tariff lines on Canadian goods were duty-free. Upon CETA’s entry into force, the EU removed tariffs on 98% of its tariff lines. Once CETA is fully implemented, the EU will have eliminated tariffs on 99% of its tariff lines. Since coming into force, CETA has led to a 7.7% increase in trade of goods and services between Canada and the EU.
On September 12, 2006, Canada and the United States signed the Softwood Lumber Agreement (“SLA”) which excluded Atlantic Canada from the “export measures”, not the terms of the SLA overall. This allowed all softwood lumber of Atlantic origin to continue to enter the United States duty free, export tax free and with no quota restrictions. The SLA ended on October 12, 2015 with no further agreement in place.
On November 25, 2016 a Coalition of U.S. softwood lumber producers filed a petition with the U.S. Department of Commerce (DOC) alleging that Canadian federal and provincial governments provided countervailable subsidies to Canadian softwood lumber producers. It also alleged that Canadian producers were dumping lumber into the U.S. market, either by selling lumber products in the United States for less than they sell them in Canada, or by selling these products below the cost of production. The Coalition claims that it has been injured and threatened with injury by this subsidization and dumping. On December 16, 2016, the DOC announced antidumping duty (AD) and countervailing duty (CVD) investigations of imports of certain softwood lumber products from Canada, including for the first time, imports from New Brunswick, the only Atlantic Province named in the petition.
On November 2, 2017 the DOC made its final determination which resulted in J.D. Irving Ltd receiving a combined AD and CVD rate of 9.92% while the remaining New Brunswick producers received an “all other” rate of 20.83%. On November 14, 2017 the Government of Canada announced that it would be appealing the DOC decision to a Chapter 19 NAFTA Panel and launched litigation via the World Trade Organization over anti-dumping and countervailing duties. Both of those processes are ongoing. New Brunswick also initiated its own NAFTA Chapter 19 challenge and is supporting the Government of Canada on its challenge at the WTO.
THE ECONOMY
Economic Update - 2019 Year-to-Date (as of November 28, 2019)
New Brunswick’s economy throughout the first three quarters of 2019 has performed as expected. In 2019, the economy is projected to expand by 0.6% as forecasted at the time of the 2019-2020 Budget. For the first 10 months, employment was up by 0.8% (+3,000 jobs) compared to the first 10 months of 2018. Part-time employment has increased by 7.1% (+3,600 jobs) year-to-date while full-time positions are down by 0.2% (-600 jobs) year-to-date. Amidst the growth in employment, average weekly earnings have so far recorded gains of 3.0%, while the national average weekly earnings are up by 2.5%. Increased consumer spending has contributed to modest growth in retail sales which have so far recorded gains of 1.5% for the nine-month period ending in September. Year-to-date growth in manufacturing sales (-12.3%) and international trade (-8.3%) continues to be restrained largely due to the decline in production at the Saint John refinery. Declines were recorded in the manufacturing sales of both non-durable goods industries (-13.5%) and durable goods industries (-6.3%) over the nine-month period ending in September. Furthermore, wood product manufacturing is also down by 9.5% on a year-to-date basis. Total housing starts are up by 40.1% year-to-date driven mainly by strong gains in multi-unit construction (+90.2%) in the province. Consumer inflation came in at 1.6% during the first 10 months of the year, below the national average of 1.9%.
Developments in 2018 - Summary
The Canadian economy expanded in 2018, as real Gross Domestic Product (GDP) grew by 2.0% - down from the 3.2% growth recorded in the previous year. After 3.0% growth in 2017, business gross fixed capital formation stayed relatively flat in 2018, up by 0.4% with increases in investment in non-residential structures, machinery and equipment (+1.4%) offsetting the declines observed in residential structures (-1.6%) investment. Exports to other countries increased by 3.1%, more than doubling the growth observed in 2017 of 1.4%. Government and household final consumption expenditure also increased by 3.0% and 2.2% respectively. Real GDP growth among the provinces was led by British Columbia (+2.6%), Prince Edward Island (+2.6%) and Quebec (+2.5%). Only Newfoundland and Labrador recorded a decline of 3.5% in their real GDP. Canadian nominal GDP increased by 3.9%.
Statistics Canada estimates that real GDP for New Brunswick increased by 0.8% in 2018 following a 2.2% expansion in the previous year. Growth was driven by gains in government final consumption expenditure (+4.2%); and in business gross fixed capital formation (+2.2%), where higher investment in machinery and equipment (+6.6%) and in residential structures (+2.7%) offset a decline in business investment in non-residential structures (-5.4%). Household final consumption expenditure slowed to 0.8%, compared with a 2.9% upturn in 2017. Nominal GDP increased by 3.2% in 2018.
On an industry-basis, the services producing industries recorded growth of 1.5% while the goods-producing industries saw a decline of 1.5%. Overall, growth was led by public administration (+3.0%), real estate and rental and leasing (+2.5%), and health care and social assistance (+2.1%). The largest declines were observed in wholesale trade (-4.7%), manufacturing (-4.4%) and agriculture, forestry, fishing and hunting (-1.5%).
Employment grew by 0.3% (+900 jobs) in 2018 driven by modest gains in both full-time (+700) and part-time jobs (+200). Following four consecutive years of decline, New Brunswick’s labour force increased by 0.2% (+600 individuals) in 2018.
Driven by gains in the services-producing industries, average weekly earnings picked up in 2018, growing by 2.8%, a growth rate slightly above the national average of 2.6%.
Growth in consumer spending slowed down in 2018 when compared to the previous year, with retail sales growing modestly by 1.7%, an increase of $220.8 million. Growth across the retail sector was broad-based with seven of the eleven subsectors reporting higher sales volumes, with gasoline stations and food and beverage stores registering over two thirds of the gains for the year. Motor vehicle and parts dealers, health and personal care stores, and sporting goods, hobby, book and music stores recorded the most declines in 2018. Wholesale trade decreased by 0.7% this year, following an increase of 4.4% in 2017.
Manufacturing sales declined by 1.1% in 2018, following a year of growth of 15.3%. The decrease in manufacturing sales was mainly attributed to the decline in production after an explosion at the Saint John refinery during a regularly scheduled maintenance project in the fall. Losses observed in non-durable goods industries (-2.8%) more than offset the gains in durable goods industries (+7.1%). Wood product manufacturing continued to register strong growth for a seventh straight year, rising by 17.2% in 2018.
Although exports displayed gains over the first nine months of 2018, a notable slowdown was observed during the fourth quarter after the refinery explosion, offsetting the previously strong performance and bringing exports down by 2.0% to $12.6 billion. Lower exports of basic and industrial chemical, plastic and rubber products (-10.4%) and energy products (-5.9%) were the main contributors to the weakening of exports in the province.
Preliminary estimates from Statistics Canada suggest that capital investment in New Brunswick decreased by 0.4% to $4.0 billion in 2018. For a third straight year, strong gains were made in non-residential building construction investment, increasing by 8.4% in the year; while residential investment decreased by 6.7% following an increase of 9.7% in 2017.
After registering strong growth of 26.4% in 2017, housing starts flattened, growing by 0.2% in 2018 to 2,328 units. Housing activity increased in Fredericton (+17.8%) and Saint John (+1.1%) in 2018 while Moncton’s decreased by 22.6%.
Inflation slightly decelerated in 2018, with the consumer price index (CPI) growing by 2.1%, below the national average of 2.3%. Higher prices for transportation (+4.0%) and alcoholic beverages, tobacco products and recreational cannabis (+3.7%) were responsible for the rise in inflation.
Economic Activity
In 2018, the nominal value of New Brunswick’s GDP was estimated at $36,966 million, or $47,950 per capita. Over the 2014 – 2018 period, GDP at market prices grew at a compound annual growth rate of 3.3%, above the national growth rate of 2.8%.
Over the period 2014 – 2018, real GDP from the goods producing industries increased by 6.8%. While the manufacturing sector was flat during the five-year period, increased output was observed in construction (+15.9%), in agriculture, forestry, fishing and hunting (+14.0%) and in the mining, quarrying. and oil and gas extraction industry (+9.3%). The service producing industries on the other hand has recorded more modest growth over that same period with real GDP increasing by 4.3%.
Correspondingly, the services-producing sector has lowered its share of total output and now accounts for approximately 74.9% of total real GDP in 2018, down from 75.3% in 2014. Transportation and warehousing (+9.2%) and real estate and renting and leasing (+8.7%) along with finance and insurance (+8.6%) and retail trade (+7.4) have been the main contributors to growth in the services sector over that time period.
The gross value of manufacturing sales decreased at a compound annual growth rate of -0.3% (in current prices) over the 2014 – 2018 period, while foreign exports of commodities decreased at a compound annual growth rate of -0.9% (in current prices).
Primary household income has increased from $22,574 million in 2014 to $24,711 million in 2018 (in current prices), resulting in a compound annual growth rate of 2.3%. On a per capita basis, primary household income increased from $29,743 to $32,054 (in current prices) over the same period, growing at a compound annual growth rate of 1.9%. Retail trade for New Brunswick increased from $11,479 million to $13,013 million, totaling a compound annual growth rate of 3.2% (in current prices) over the same period.
Structure of the Economy
Contributions from natural resources (particularly the mining industry) to the New Brunswick economy has stabilized in recent years, following the closure of the province’s largest base metal mine and the more recent closure of the province’s only potash mine earlier in the decade. Furthermore, in 2018, the manufacturing sector saw a major decline in output due to the decline in production at the Saint John refinery. Nonetheless, gains in the construction and utilities sectors have partially offset the decline from the manufacturing and natural resources sectors in the goods-producing industries. Overall, the contribution from the goods-producing industries now accounts for approximately 25.2% of total real GDP, up from 24.7% in 2014, while the services-producing industries account for 74.9%, down from 75.3% in 2014.
The following table shows real GDP by industry in New Brunswick for the years 2014 to 2018, valued in chained 2012 dollars.
The following table sets forth selected indices of economic activity for New Brunswick and for Canada as a whole.
Selected Economic Indicators
| |
| | Year Ended December 31, | |
| | | | | | | CAGR1 % |
| | 2014 | 2015 | 2016 | 2017 | 2018 | 2014-2018 |
| | (In millions of dollars unless otherwise indicated) |
| Gross domestic product; income-based (current dollars) | | | | | | |
| New Brunswick | 32,462 | 33,453 | 34,330 | 35,825 | 36,966 | 3.3% |
| Canada | 1,994,898 | 1,990,441 | 2,025,535 | 2,141,107 | 2,223,856 | 2.8% |
| Gross domestic product (real) | | | | | | |
| New Brunswick | 31,747 | 31,954 | 32,213 | 32,917 | 33,195 | 1.1% |
| Canada | 1,923,422 | 1,936,100 | 1,955,488 | 2,017,492 | 2,058,117 | 1.7% |
| Primary household income | | | | | | |
| New Brunswick | 22,574 | 22,797 | 23,232 | 23,939 | 24,711 | 2.3% |
| Canada | 1,294,345 | 1,344,925 | 1,340,817 | 1,402,005 | 1,456,673 | 3.0% |
| Primary household income per capita (dollars) | | | | | | |
| New Brunswick | 29,743 | 30,042 | 30,434 | 31,221 | 32,054 | 1.9% |
| Canada | 36,525 | 37,670 | 37,132 | 38,366 | 39,308 | 1.9% |
| Gross domestic product per capita; income-based (dollars) | | | | | | |
| New Brunswick | 42,771 | 44,084 | 44,973 | 46,722 | 47,950 | 2.9% |
| Canada | 56,294 | 55,750 | 56,094 | 58,591 | 60,011 | 1.6% |
| Retail trade | 11,479 | 11,730 | 11,978 | 12,792 | 13,013 | 3.2% |
| Manufacturing sales | 18,765 | 16,919 | 16,257 | 18,743 | 18,537 | -0.3% |
| Foreign commodity exports | 13,032 | 12,210 | 10,642 | 12,857 | 12,594 | -0.9% |
| Consumer price index (% change) | | | | | | |
| New Brunswick | 1.5% | 0.5% | 2.2% | 2.3% | 2.1% | - |
| Canada | 2.0% | 1.1% | 1.4% | 1.6% | 2.3% | - |
| Unemployment rate | | | | | | |
| New Brunswick | 9.9% | 9.8% | 9.5% | 8.1% | 8.0% | - |
| Canada | 6.9% | 6.9% | 7.0% | 6.3% | 5.8% | - |
Real Gross Domestic Product at basic prices, by Industry
| | For Year Ended December 31, | |
| | | | | | | CAGR1 % |
| | 2014 | 2015 | 2016 | 2017 | 2018 | 2014-2018 |
| | (In millions of chained 2012 dollars) | |
| Goods-producing industries | | | | | | |
| Agriculture, forestry, fishing and hunting | 899.8 | 959.9 | 989.1 | 1,041.5 | 1,025.8 | 3.3% |
| Mining, quarrying, and oil and gas extraction | 362.4 | 457.8 | 373.3 | 399.7 | 396.0 | 2.2% |
| Utilities | 1,168.9 | 1,135.2 | 1,162.8 | 1,188.7 | 1,195.3 | 0.6% |
| Construction | 1,796.2 | 1,838.9 | 1,913.4 | 2,036.9 | 2,081.0 | 3.7% |
| Manufacturing | 2,903.0 | 2,968.1 | 2,990.8 | 3,035.7 | 2,902.0 | 0.0% |
| Total goods-producing Industries | 7,176.8 | 7,411.8 | 7,501.1 | 7,777.8 | 7,662.2 | 1.6% |
Service-producing Industries | | | | | | |
| Wholesale trade | 1,056.5 | 1,029.8 | 1,009.5 | 1,033.2 | 985.0 | -1.7% |
| Retail trade | 1,839.5 | 1,832.6 | 1,845.6 | 1,973.4 | 1,976.3 | 1.8% |
| Transportation and warehousing | 1,439.0 | 1,443.3 | 1,506.4 | 1,542.8 | 1,570.9 | 2.2% |
| Information and cultural industries | 862.1 | 857.0 | 867.9 | 874.0 | 884.8 | 0.7% |
| Finance and insurance | 1,516.7 | 1,544.7 | 1,585.7 | 1,641.3 | 1,647.5 | 2.1% |
| Real estate and renting and leasing | 3,623.0 | 3,694.4 | 3,767.1 | 3,842.6 | 3,937.0 | 2.1% |
| Professional, scientific and technical services | 953.2 | 960.8 | 953.0 | 968.7 | 1,006.1 | 1.4% |
| Management of companies and enterprises | 137.0 | 134.0 | 114.2 | 104.8 | 99.5 | -7.7% |
| Administrative and support, waste management and remediation services | 1,188.0 | 1,188.3 | 1,168.6 | 1,164.1 | 1,156.5 | -0.7% |
| Educational services | 1,832.1 | 1,816.6 | 1,828.0 | 1,835.6 | 1,866.3 | 0.5% |
| Health care and social assistance | 2,766.2 | 2,751.7 | 2,790.3 | 2,824.0 | 2,883.1 | 1.0% |
| Arts, entertainment and recreation | 178.8 | 156.0 | 151.8 | 153.7 | 155.8 | -3.4% |
| Accommodation and food services | 595.7 | 637.3 | 651.2 | 653.1 | 662.3 | 2.7% |
| Other services (except public administration) | 592.2 | 574.7 | 561.3 | 563.2 | 569.5 | -1.0% |
| Public administration | 3,282.2 | 3,251.0 | 3,251.9 | 3,291.9 | 3,391.2 | 0.8% |
| Total service-producing Industries | 21,866.0 | 21,876.6 | 22,060.1 | 22,468.6 | 22,799.9 | 1.1% |
| Total gross domestic product | 29,039.6 | 29,275.7 | 29,546.0 | 30,223.9 | 30,446.6 | 1.2% |
Labour Force
For the second consecutive year, employment in New Brunswick grew, up by 0.3% from 2017 to 2018, to 353,800. Gains were registered in both full-time (+700) and part-time (+200) employment. Employment in the services-producing sector edged up while it decreased in the goods-producing sector. Notable job gains were recorded in the health care and social assistance (+2,200), public administration (+1,200), and forestry, fishing, mining, quarrying, oil and gas (+1,200) industries. The most significant declines in employment were concentrated in the trade (-2,900), construction (-1,500), and other services (except public administration) (-800) industries. The Canadian labour market added more than 241,000 jobs in 2018; this represents a 1.3% year-over year increase in the level of employment.
With the labour force and employment improving at similar rates, the unemployment rate declined slightly to 8.0% in 2018, the lowest rate observed since 2007. This resulted in the number of persons being considered unemployed falling by approximately 300 individuals to 30,700. The unemployment rate for males decreased, falling from 9.8% to 9.3%, while it increased for females from 6.2% to 6.6%. The national unemployment rate also fell to 5.8% in 2018, the lowest rate observed in the last 42 years of available data.
Labour Force
| | For Year Ended December 31, |
| | | | | | |
| | 2014 | 2015 | 2016 | 2017 | 2018 |
| | (In thousands unless otherwise indicated) |
| Population 15 years and over | 621.7 | 622.0 | 623.4 | 624.7 | 627.4 |
| Labour force | 393.0 | 390.2 | 388.6 | 383.9 | 384.5 |
| Labour force employed | 353.9 | 351.8 | 351.5 | 352.9 | 353.8 |
| Labour force unemployed | 39.1 | 38.4 | 37.1 | 31.0 | 30.7 |
| Unemployment rate (%) | | | | | |
| New Brunswick | 9.9 | 9.8 | 9.5 | 8.1 | 8.0 |
| Canada | 6.9 | 6.9 | 7.0 | 6.3 | 5.8 |
| Participation rate (%) | | | | | |
| New Brunswick | 63.2 | 62.7 | 62.3 | 61.5 | 61.3 |
| Canada | 66.0 | 65.8 | 65.7 | 65.8 | 65.4 |
Source: Statistics Canada
New Brunswick unless otherwise stated
Employment by Industry
| | 2014 | 2015 | 2016 | 2017 | 2018 |
| | (In thousands unless otherwise indicated) |
| Goods-producing sector | 76.2 | 72.7 | 72.8 | 73.3 | 73.1 |
| Agriculture | 4.1 | 4.1 | 5.2 | 5.1 | 6.0 |
| Forestry, fishing, mining, quarrying, oil and gas | 12.0 | 10.7 | 9.5 | 8.3 | 9.5 |
| Utilities | 3.9 | 3.5 | 3.7 | 3.5 | 3.1 |
| Construction | 28.2 | 24.6 | 24.1 | 24.8 | 23.3 |
| Manufacturing | 28.0 | 29.8 | 30.4 | 31.7 | 31.3 |
| Services-producing sector | 277.7 | 279.1 | 278.6 | 279.6 | 280.7 |
| Wholesale and retail trade | 57.2 | 55.5 | 57.4 | 56.3 | 53.4 |
| Transportation and warehousing | 16.3 | 19.2 | 19.1 | 17.3 | 18.2 |
| Finance, insurance, real estate and leasing | 14.9 | 14.6 | 16.9 | 16.9 | 16.7 |
| Professional, scientific and technical services | 17.4 | 16.6 | 15.0 | 15.6 | 16.1 |
| Business, building and other support services | 19.6 | 18.8 | 16.3 | 16.3 | 16.2 |
| Educational services | 25.6 | 27.4 | 25.4 | 26.2 | 26.4 |
| Health care and social assistance | 52.1 | 51.9 | 53.4 | 57.8 | 60.0 |
| Information, culture and recreation | 11.0 | 11.7 | 12.4 | 10.8 | 11.4 |
| Accommodation and food services | 24.1 | 24.3 | 22.3 | 23.8 | 23.3 |
| Other services (except public administration) | 16.9 | 15.4 | 16.5 | 15.3 | 14.5 |
| Public administration | 22.5 | 23.7 | 23.8 | 23.3 | 24.5 |
| | | | | | |
| Total | 353.9 | 351.8 | 351.5 | 352.9 | 353.8 |
Source: Statistics Canada
Primary Industries
Mining
In 2018, New Brunswick was Canada’s largest producer of peat, representing over 30% of the national peat production, and Canada’s sole lead producer. Other locally produced minerals include zinc, stone, and sand and gravel. In 2018, the preliminary estimates of overall value of mineral production was estimated at $344.8 million, a 13.1% decrease from 2017 and a 21.5% reduction compared to 2014. Offsetting the gains recorded in metallic mineral production of 1.3%, non-metallic mineral production has decreased for the fourth consecutive year, falling by 25.3% in 2018. Lower peat production, following the destruction of a major peat moss factory in Baie-Sainte Anne, caused much of the weakening in the non-metallic mineral production. Nonetheless, higher lead and copper production supported much of the gains in metallic mineral production.
Annual production results as reported by the Trevali Mining Corp. show that Caribou mine produced 72.0 million pounds of payable zinc, 25.3 million payable pounds of lead and approximately 0.7 million ounces of payable silver. The mine generated over US$82.9 million in revenues in 2018.
The $579-million Sisson Mine project received federal environmental assessment approval in June 2017. However, regulatory and permitting work required for mine construction and operation continues, further delaying the mine’s construction start date. It is expected that construction of the tungsten and molybdenum mine will create 500 jobs with an additional 300 jobs expected during the mine's 27-year lifespan.
Mineral Production
| | Year Ended December 31, |
| | | | | | |
| | 2014 | 2015 | 2016 | 2017 | 2018 |
| | (In millions of dollars) |
| Metallic minerals | 0.0 | 39.6 | 148.6 | 181.6 | 183.9 |
| Non-metallic minerals | 439.1 | 404.9 | 226.2 | 215.3 | 160.9 |
| Total | 439.1 | 444.5 | 374.8 | 396.9 | 344.8 |
Source: Natural Resources Canada
Forestry
Nearly 83% of the land area of New Brunswick is forested and 51% of the forested land is owned by the Province as Crown land. 95% of Crown land is subject to timber licenses or harvest agreements. Harvest activities on Crown land generated $72.4 million in Crown royalties for the fiscal year ended March 31, 2019. This represents a 1.2% decrease over the previous fiscal year. The Province received $68.4 million of these royalties from licensee and sub-licensee harvest activities and $4.0 million was forwarded to New Brunswick First Nation Communities in accordance and in association with First Nation harvesting activities.
The following table sets forth the most recently published estimates of forest production in New Brunswick for the years 2013 through 2017.
Forest Production
| | Year Ended December 31, |
| | | | | | |
| | 2013 | 2014 | 2015 | 2016 | 2017 |
| | (In thousands of cubic metres) |
| Logs and bolts | 4,810 | 5,309 | 5,309 | 5,302 | 5,303 |
| Pulpwood | 4,722 | 4,451 | 4,015 | 4,007 | 4,008 |
| Other (industrial roundwood) | 2 | n/d | n/d | n/d | n/d |
| Fuelwood | 367 | 409 | 38 | 36 | 36 |
| Total | 9,902 | 10,168 | 9,363 | 9,345 | 9,347 |
Source: National Forestry Database
Note: Due to incomplete details, totals may not always agree.
Agriculture
Total farm cash receipts in the Province were $698.1 million in 2018, up 13.4% from the previous year. Both total crop receipts and total livestock and livestock products receipts were up by 20.2% and 4.3%, respectively.
The 2016 Census of Agriculture counted 2,255 farms in New Brunswick, down from 2,611 farms (or a 13.6% decline) in 2011. There were 3,005 farm operators in 2016, a 13.4% decline from 2011, and their average age increased slightly from 55.5 years to 55.6 years over the five-year period. Total farm area in New Brunswick declined 10.9% between 2011 and 2016, to 835,329 acres in 2016. However, the average area per farm increased to 370 acres in 2016 from 359 acres in 2011.
New Brunswick’s total area of land in fruits, berries and nuts rose 52.4% from 2011, to 45,480 acres in 2016. The increase was driven mainly by the expansion of blueberries whose area increased 55.6% to 43,369 acres. The province ranked second in Canada for total number of maple taps with 2.3 million taps in 2016, an increase of 20.5% from 2011. Fruit and tree nut farms accounted for 18.4% of all farms in New Brunswick in 2016, followed by beef farms (14.6%), hay farms (14.1%) and dairy farms (8.9%).
Fishing
New Brunswick is one of the country’s largest exporters of fish and seafood products with approximately $1.7 billion in export sales in 2018, an 1.0% decrease from the previous year. The top export commodities were lobster valued at $840.6 million, salmon valued at $416.0 million, and crab valued at $236.7 million. The United States continues to be the province’s largest seafood export market, with sales to the U.S. valuing approximately $1.4 billion in 2018, which represented roughly 81% of all foreign purchases.
Secondary Industries
Manufacturing
New Brunswick manufacturers reported sales of $18.5 billion in 2018, representing a 1.1% decrease from the $18.7 billion recorded in the previous year. Sales continue to be below the 2013 peak level, when manufacturing sales at the time surpassed the $20 billion mark.
Between the period 2014-2018, sales of durable goods increased by 15.5% and now accounts for approximately 19% of total manufacturing sales, up from roughly 16% in 2014. Over that same period, non-durable manufacturing sales declined by 4.7%. Wood product manufacturing continued to be a bright spot, with sales rising by 17.2% in 2018, marking the seventh consecutive year of growth. Nationally, manufacturing sales increased by 5.4%. The manufacturing sector represents 10.1% of provincial GDP.
Manufacturing employment decreased by 1.3% in 2018, which now results in 31,300 individuals being employed in the sector.
Maritime Iron, the $1.5 billion iron-ore processing plant proposed for northern New Brunswick, announced in July 2019 that it has entered into a Relationship, Capacity and Indigenous Knowledge Study Agreement with various First Nations communities around the region. The plant has received $625,000 from the province over the past three years for ‘pre-feasibility’ studies. The company wants to start building next year and start production in 2022, depending on feasibility studies. The construction phase of the company would create 1,300 jobs and would employ more than 200 people in its operational phase.
The table below sets forth the leading industrial groups in New Brunswick’s manufacturing sector, according to gross selling value of factory sales, for the years 2014 through 2018.
Gross Selling Value of Factory Sales
| | Year Ended December 31, | |
| | | | | | | | CAGR1 |
| | 2014 | 2015 | 2016 | 2017 | 2018 | | 2014-2018 |
| Industry | (In millions of dollars) | | |
| Non-durable product manufacturing | 15,800.1 | 13,800.2 | 13,156.8 | 15,582.8 | 15,152.9 | | -1.0% |
| Durable product manufacturing | 2,964.5 | 3,118.5 | 3,100.5 | 3,160.7 | 3,384.0 | | 3.4% |
| Total | 18,764.7 | 16,918.6 | 16,257.3 | 18,743.4 | 18,536.9 | | -0.3% |
1Compound annual growth rate
Source: Statistics Canada
Service Industries
Trade
New Brunswick’s retail sales surpassed $13 billion for the first time in 2018, after a strong growth of 1.7% over 2017. Seven of the eleven subsectors reported higher sales, with gasoline stations and food and beverage stores, when combined, representing over two thirds of the gains for the year. The retail trade industry now accounts for approximately 6.3% of provincial GDP.
After a 4.4% increase in 2017, wholesale trade slightly weakened on a year-over-year basis, down by 0.7% in 2018. Gains in building material and supplies merchant wholesalers (7.6%), machinery, equipment and supplies merchant wholesalers (5.1%), and motor vehicle and motor vehicle parts and accessories merchant wholesalers (0.5%) were offset by the losses recorded in food, beverage and tobacco merchant wholesalers (-15.2%). The wholesale industry accounts for 3.1% of provincial GDP.
Provincial employment across both trade industries when combined decreased by 5.2% (-2,900 jobs) in 2018. Nonetheless, on a seasonally-adjusted basis, average weekly earnings recorded robust gains of 10.8% in wholesale trade and 6.4% in retail trade industries.
Transportation and Warehousing
After a 9.4% reduction in 2017, employment across the transportation and warehousing industry rebounded by 5.2% in 2018 to 18,200 from 17,300 jobs in the previous year. Average weekly earnings also augmented in this sector, up by 3.1%. This sector accounts for 5.5% of provincial GDP.
Total cargo tonnage at the port of Saint John decreased by over 5 million metric tonnes in 2018 when compared to the previous year, with overall cargo tonnage handled at 25.1 million metric tonnes, a 17.7% drop over 2017. After an extraordinarily high year in dry and liquid bulk in 2017, both sectors at Port Saint John returned to historically normal levels in 2018, declining by 24.5% and 17.5% respectively. The number of cruise ship passengers increased by 8.0% to 159,545 in 2018 while ship calls rose to 69, up from 65 in the previous year.
Finance and Real Estate
Employment across the finance, insurance, real estate and leasing industry slightly declined to 16,700 jobs in 2018 compared to 16,900 in 2018. Output from this industry increased by 1.8% in 2018 and now accounts for 17.9% of total provincial GDP.
Tourism
Employment in the accommodation and food services industry declined by 2.1% (-500 jobs) to 23,300 in 2018, following a 6.7% increase in 2017. Average weekly earnings in the industry stayed relatively unchanged, up by 0.2%. The number of rooms sold by accommodations rose by 3.0% to 1.9 million, with the occupancy rate staying at 58% from the previous year.
More than 173,300 rooms were sold to international visitors in 2018, representing approximately 0.4% increase from the previous year.
Foreign Trade
Trade
| | Year Ended December 31, |
| | | | | | |
| | 2014 | 2015 | 2016 | 2017 | 2018 |
| | (In millions of dollars unless otherwise indicated) |
| Exports of Goods and Services | 25,585 | 24,618 | 23,641 | 26,341 | 26,579 |
| Exports to other countries | 14,869 | 13,682 | 12,436 | 14,170 | 14,464 |
| Exports of goods to other countries | 13,662 | 12,428 | 11,125 | 12,822 | 13,081 |
| Exports of services to other countries | 1,207 | 1,254 | 1,311 | 1,348 | 1,383 |
| Exports to other provinces | 10,716 | 10,936 | 11,205 | 12,171 | 12,115 |
| Exports of goods to other provinces | 5,845 | 6,112 | 6,217 | 6,848 | 6,693 |
| Exports of services to other provinces | 4,871 | 4,824 | 4,988 | 5,323 | 5,422 |
| Ratio of Exports to Nominal GDP | 78.8% | 73.6% | 68.9% | 73.5% | 71.9% |
| | | | | | |
| Imports of Goods and Services | 31,106 | 29,665 | 28,935 | 32,500 | 32,922 |
| Imports from other countries | 19,240 | 17,636 | 16,994 | 19,926 | 20,217 |
| Imports of goods from other countries | 17,967 | 16,303 | 15,598 | 18,443 | 18,707 |
| Imports of services from other countries | 1,273 | 1,333 | 1,396 | 1,483 | 1,510 |
| Imports from other provinces | 11,866 | 12,029 | 11,941 | 12,574 | 12,705 |
| Imports of goods from other provinces | 5,116 | 5,032 | 4,779 | 5,033 | 4,778 |
| Imports of services from other provinces | 6,750 | 6,997 | 7,162 | 7,541 | 7,927 |
| Ratio of Imports to Nominal GDP | 95.8% | 88.7% | 84.3% | 90.7% | 89.1% |
| | | | | | |
| Trade Balance | -5,521 | -5,047 | -5,294 | -6,159 | -6,343 |
| | | | | | |
| Gross Domestic Product at Market Prices | 32,462 | 33,453 | 34,330 | 35,825 | 36,966 |
| |
| Source: Statistics Canada |
On an economic accounts basis, the overall value of New Brunswick’s total export of goods and services was estimated at $26,579 million in 2018, an 0.9% increase from 2017. The provincial economy –still heavily reliant on foreign trade- has its international exports as a percentage of nominal GDP at 39% in 2018, down from 46% in 2014. Nationally, foreign bound exports accounted for 32% of Canadian nominal GDP in 2018.
Foreign Exports of Commodities
The U.S. market still accounts for the bulk of the province’s export sales. In 2018, the United States purchased 90.2% of the Province’s foreign commodity exports, relatively unchanged from 90.4% in 2017. Basic and industrial chemical, plastic and rubber products reported a decrease in its share of total foreign commodity exports to 29.0% in 2018, a decrease of 2.8 percentage points from 2017. Energy products accounted for 26.3% of all commodity exports in 2018, down from 27.2% in the previous year. Furthermore, 20.0% of export earnings are due to forestry products and building and packaging materials.
The table below shows foreign exports of commodities from New Brunswick for the years 2014 to 2018. The largest component, basic and industrial chemical, plastic and rubber products, decreased at a compound annual growth rate of 5.6% over that period. Exports of energy products decreased at a compound annual rate of 3.9%, while forestry products and building and packaging materials rose by 6.7%.
Foreign Exports of Commodities
| | Year Ended December 31, | |
| | | | | | | | CAGR1 (%) |
| | 2014 | 2015 | 2016 | 2017 | 2018 | | 2014-2018 |
| | (In millions of dollars) | |
| Farm, fish and intermediate food products | 414.8 | 552.4 | 671.9 | 619.6 | 685.5 | | 13.4% |
| Energy products | 3,882.2 | 3,821.1 | 2,652.1 | 3,495.9 | 3,289.0 | | -4.1% |
| Metal ores and non-metallic minerals | 233.2 | 242.2 | 12.1 | 9.7 | 54.6 | | -30.4% |
| Metal and non-metallic mineral products | 330.9 | 254.4 | 224.7 | 334.2 | 379.3 | | 3.5% |
| Basic and industrial chemical, plastic and rubber products | 4,610.4 | 3,336.5 | 3,101.8 | 4,083.8 | 3,659.7 | | -5.6% |
| Forestry products and building and packaging materials | 1,954.7 | 2,028.0 | 2,071.2 | 2,314.1 | 2,530.2 | | 6.7% |
| Industrial machinery, equipment and parts | 100.5 | 129.1 | 150.1 | 127.7 | 141.9 | | 9.0% |
| Electronic and electrical equipment and parts | 44.1 | 64.3 | 54.2 | 59.7 | 66.4 | | 10.8% |
| Motor vehicles and parts | 12.1 | 22.4 | 32.0 | 33.7 | 57.8 | | 47.9% |
| Aircraft and other transportation equipment and parts | 17.4 | 16.7 | 24.2 | 38.4 | 24.7 | | 9.0% |
| Consumer goods | 1,371.7 | 1,673.0 | 1,576.9 | 1,670.9 | 1,636.8 | | 4.5% |
| Special transactions trade | 59.8 | 70.0 | 71.1 | 68.9 | 67.8 | | 3.2% |
| Total | 13,031.8 | 12,210.2 | 10,642.3 | 12,856.6 | 12,593.6 | | -0.9% |
| | | | | | | | | |
1Compound annual growth rate
Totals may not add up due to the adoption of the chain Fisher deflation methodology
Source: Statistics Canada
Totals may not add up due to the adoption of the chain Fisher deflation methodology
Foreign Imports of Commodities
The table below shows foreign imports of commodities to New Brunswick for the years 2014 to 2018. The largest component, energy products, increased by 19.0% from 2017 to 2018 which was largely attributable to the increase in oil price.
Foreign Imports of Commodities
| | Year Ended December 31, | | |
| | | | | | | | CAGR1 (%) |
| | 2014 | 2015 | 2016 | 2017 | 2018 | | 2014-2018 |
| | (In millions of dollars) |
| Farm, fish and intermediate food products | 548.0 | 631.6 | 713.2 | 514.3 | 608.9 | | 2.7% |
| Energy products | 9,266.8 | 6,181.6 | 4,965.7 | 7,431.7 | 8,868.6 | | -1.1% |
| Metal ores and non-metallic minerals | 585.9 | 605.6 | 488.6 | 483.0 | 329.0 | | -13.4% |
| Metal and non-metallic mineral products | 230.0 | 218.3 | 219.8 | 222.3 | 218.8 | | -1.2% |
| Basic and industrial chemical, plastic and rubber products | 562.1 | 647.4 | 610.6 | 511.7 | 653.5 | | 3.8% |
| Forestry products and building and packaging materials | 395.2 | 391.4 | 371.5 | 379.5 | 401.2 | | 0.4% |
| Industrial machinery, equipment and parts | 464.1 | 570.7 | 499.3 | 548.6 | 581.6 | | 5.8% |
| Electronic and electrical equipment and parts | 194.5 | 185.1 | 214.7 | 169.6 | 186.1 | | -1.1% |
| Motor vehicles and parts | 406.1 | 449.4 | 400.8 | 426.8 | 447.3 | | 2.4% |
| Aircraft and other transportation equipment and parts | 130.0 | 73.0 | 126.7 | 82.6 | 123.4 | | -1.3% |
| Consumer goods | 533.2 | 579.8 | 603.4 | 621.3 | 579.5 | | 2.1% |
| Special transactions trade | 32.8 | 29.5 | 30.8 | 35.5 | 31.9 | | -0.7% |
| Total | 13,348.7 | 10,563.3 | 9,245.1 | 11,426.9 | 13,029.9 | | -0.6% |
1Compound annual growth rate
Totals may not add up due to the adoption of the chain Fisher deflation methodology
Source: Statistics Canada
New Investment
Preliminary estimates from Statistics Canada suggest that capital investment in New Brunswick decreased by 0.4% to approximately $4.0 billion in 2018. Investment in the private sector rose by 1.1%, while the public sector was down by 2.3%.
Significant losses observed in the agriculture, forestry, fishing and hunting (-14.3%), utilities (-12.2%) and public administration (-8.4%) industries’ investment more than offset the increases recorded in educational services (+36.4%), real estate and rental and leasing (+29.6%), and manufacturing (+4.8%) investment.
Spending on machinery and equipment investment was up by 3.3% while there was a 3.1% decline in non-residential construction expenditures.
Residential investment decreased by 6.7% in 2018. Growth in housing starts was flat in 2018, up by 0.2%. Gains recorded in the multiple-unit starts (+2.5%) were partially offset by the losses in single-detached-unit starts (-2.1%). Housing construction activity was up in Fredericton (+17.8%) and Saint John (+1.1%) while it decreased in Moncton, down by 22.6%.
Non-residential building construction investment increased by 8.4% in 2018 supported by increases in institutional and governmental (+23.8%) and industrial (+18.0%) construction investments.
After a 2.9% increase recorded in 2017, employment in the construction industry dropped, declining by 6.0% to 23,300 jobs in 2018. Nonetheless, real GDP increased by 2.2% and the industry now accounts for 6.6% of total provincial GDP.
REVENUE AND EXPENDITURE OF THE PROVINCE
General Information
Under the Constitution Act, 1867 and the Constitution Act, 1982 provincial legislatures are given certain exclusive powers, including the power to impose direct taxation within the provinces to raise revenue for provincial purposes and the power to borrow money on the sole credit of the provinces.
The Financial Administration Act governs the receipt of public money, the disbursement of public funds, the control of expenditures, and the keeping and auditing of public accounts of the Province. All public monies are to be deposited to the credit of the Province and constitute the Consolidated Fund of the Province. Monies necessary for the carrying out of the operations of the provincial government for each fiscal year are voted by the Legislative Assembly, with the exception of those expenditures for which provision has already been made through existing legislative authority. In addition, under the authority of the Financial Administration Act, should the occasion arise when the Legislative Assembly is not in session, the Lieutenant-Governor in Council may order the issue of a special warrant authorizing payment out of the Consolidated Fund for an expenditure required urgently for the public good which was not provided for by the Legislative Assembly. Amounts appropriated under special warrant must be approved at the next session of the Legislative Assembly.
In accordance with the Financial Administration Act and certain other Acts, funds received for a special purpose are to be disbursed for that purpose. Unlike other budgetary accounts, any unspent balance of these funds may be spent in subsequent fiscal years without appropriation by the Legislative Assembly. At March 31, 2019, the balance of unspent special purpose funds was $120.6 million.
Funds may also be considered as Special Operating Agency Funds. Revenue may be generated by the Agencies or from transfers from other budgetary accounts. Any unspent balance of these funds may, with permission from the Treasury Board as per the Financial Administration Act, be carried forward to subsequent fiscal years. At March 31, 2019, the balance of unspent special operating funds approved for carry-over was $44.1 million. All transactions between the Special Operating Agencies and provincial departments are eliminated from the Province's combined statement of revenue and expenditure.
Volume 1 of the public accounts contains the consolidated financial statements of the Province which are subject to audit by the Auditor General. The Auditor General is an official responsible under the provisions of the Auditor General Act for the examination of the accounts of the Province and for reporting thereon annually to the Legislative Assembly. The consolidated financial statements include certain organizations that are accountable to the Legislative Assembly and are included in the Provincial Reporting Entity as described in Note 1(b) and (c) to the consolidated financial statements. The methods by which the various organizations are included in the Province's consolidated financial statements are also outlined in Schedule 30.
Each fiscal year, the Minister of Finance and Treasury Board delivers a budget and the Estimates of Revenue and Expenditure (the "Budget Estimates") to the Legislative Assembly. The Minister of Finance reports on the status of the budget plan during the year. The Budget Estimates include the revenue and expenditures of some provincially-created Boards, Commissions and Crown corporations, or the net profits of such entities, or the provincial contribution towards the operations of such entities, as well as funds advanced through such entities to various individuals and enterprises in the form of repayable loans and investments.
The following table sets forth information regarding the surplus (deficit) for the four fiscal years ended March 31, 2019 and the Budget Estimates for the fiscal year ending March 31, 2020.
Comparative Statement of Surplus (Deficit)
| | Year Ending March 31 |
| | | | | | | Budget Estimates |
| BUDGETARY ACCOUNTS | | 2016 | 2017 | 2018 | 2019 | 2020 |
| | (In thousands of dollars) |
| Ordinary Account | | | | | | |
| Revenues | | 8,045,529 | 8,509,671 | 8,912,833 | 9,248,328 | 9,468,087 |
| Expenditures | | 8,102,656 | 8,408,302 | 8,514,876 | 8,820,471 | 9,035,295 |
| Deficit | | (57,127) | 101,369 | 397,957 | 427,857 | 432,792 |
| Capital Account | | | | | | |
| Revenues | | 24,846 | 22,597 | 32,273 | 34,757 | 22,545 |
| Expenditures | | 571,047 | 602,044 | 695,470 | 752,420 | 600,596 |
| Deficit | | (546,201) | (579,447) | (663,197) | (717,663) | (578,051) |
| Special Purpose Account | | | | | | |
| Revenues | | 83,763 | 85,165 | 85,119 | 134,338 | 76,093 |
| Expenditures | | 86,877 | 86,884 | 87,789 | 127,191 | 80,878 |
| Surplus (Deficit) | | (3,114) | (1,719) | (2,670) | 7,147 | (4,785) |
Special Operating Agency Account | | | | | | |
| Revenues | | 143,762 | 190,015 | 281,721 | 227,574 | 190,261 |
| Expenditures | | 141,989 | 179,834 | 280,180 | 220,596 | 196,500 |
| Surplus | | 1,773 | 10,181 | 1,541 | 6,978 | (6,239) |
| | | | | | | |
| Sinking Fund Earnings | | 194,132 | 192,848 | 189,803 | 195,487 | 205,490 |
| Accounting Adjustments | | | | | | |
| Revenue | | (95,472) | (98,116) | (162,780) | (143,438) | (116,778) |
| Expenditure | | 36,136 | (206,080)
| (133,413)
| (190,923) | (116,778) |
| | | | | | | |
| Consolidated and Operating Revenue | | 8,396,560 | 8,902,180 | 9,338,969 | 9,697,046 | 9,845,698 |
| | | | | | | |
| Consolidated Expenditures | | 8,938,705 | 9,070,984 | 9,444,902 | 9,729,755 | 9,796,491 |
| Add: Amortization Expense | | 427,356 | 463,520 | 473,559 | 496,068 | 504,525 |
| Less: Gross Investment in Tangible Capital Assets | | (587,290) | (615,752) | (641,670) | (671,447) | (478,459) |
| Other Accounting Adjustments | | (121,758) | 100,464 | (4,840) | 70,027 | ---
|
| Operating Expense | | 8,657,013 | 9,019,216 | 9,271,951 | 9,624,403 | 9,822,557 |
| Contingency Reserve | | | | | | |
Surplus (Deficit) | | (260,453) | (117,036) | 67,018 | 72,643 | 23,141 |
| | | | | | | |
| Increase in Net Debt from Operations | | (542,145) | (168,804) | (105,933) | (32,709) | 49,207 |
Changes in Cash Flow
The following table sets forth the changes in cash flow of the Province for the four fiscal years ended March 31, 2019 and the Budget Estimates for the fiscal year ending March 31, 2020.
Changes in Cash Flow
| | | | | | Budget Estimates1 |
| | 2016 | 2017 | 2018 | 2019 | 2020 |
| | (In millions of dollars) |
| Operating Transactions | | | | | |
| Surplus (Deficit) | (260.4) | (117.0) | 67.0 | 72.6 | 23.1 |
| Non-Cash Items | | | | | |
| Amortization of Premiums, Discounts and Issue Expenses | 7.1 | 7.2 | 7.6 | 8.6 | - |
| Foreign Exchange Expense | (5.8) | (5.8) | (6.0) | (5.0) | - |
| Increase in Provision for Losses | (3.0) | 21.4 | 11.4 | 11.3 | - |
| Sinking Fund Earnings | (194.1) | (192.8) | (189.8) | (195.5) | (205.5) |
| Amortization of Tangible Capital Assets | 427.4 | 463.5 | 473.6 | 496.1 | 504.5 |
| Loss on Disposals and Impairments of Tangible Capital | | | | | |
| Assets | 6.5 | 7.7 | 9.3 | 22.8 | - |
| Actual Losses Due to Foreign Exchange | 2.7 | 2.8 | 2.9 | 1.9 | - |
| Decrease (increase) in Pension Surplus | 13.3 | 35.3 | 10.2 | 27.5 | - |
| (Decrease) increase in Deferred Revenue | 16.4 | 23.1 | 19.4 | 89.0 | - |
| (Increase) decrease in Working Capital | 129.9 | (9.7) | (24.2) | (2.4) | - |
| Net Cash Used In Operating Activities | 140.0 | 235.7 | 381.4 | 526.9 | 322.1 |
| | | | | | |
Investing Transactions | | | | | |
| Decrease (increase) in Investments, Loans and Advances | 106.6 | (146.1) | (26.0) | (54.7) | (67.1) |
| Non-Cash Adjustment in Investing Activities | (143.5) | 92.4
| (8.3) | 19.2
| - |
| Net Cash Used In Investing Activities | (36.9) | (53.7) | (34.3) | (35.5) | (67.1) |
| | | | | | |
| Capital Transactions | | | | | |
| Purchase of Capital Assets | (587.3) | (615.7) | (641.7) | (671.4) | (478.5) |
| | | | | | |
| Financing Transactions | | | | | |
| Net Proceeds from Issuance of Funded Debt | 1,159.2 | 1,657.2 | 1,761.4 | 1,521.1 | - |
Received from Sinking Fund for Redemption of Debentures and Payment of Exchange | 196.1 | 338.8 | 150.0 | --- | - |
| Increase (decrease) in Obligations Under Capital Leases | (33.7) | (22.7) | (81.1) | (44.1) | - |
| Sinking Fund Installments | (153.7) | (157.3) | (165.9) | (162.4) | - |
Short term borrowing Funded Debt Matured | 412.0 (637.2) | 0.5 (790.4) | (19.7) (1,114.6) | (103.2) (691.8) | - - |
| Net Cash from Financing Activities | 942.7 | 1,026.1 | 530.1 | 519.6 | - |
| | | | | | |
| Increase (decrease) in Cash Position during Year | 458.5 | 592.4 | 235.5 | 339.6 | (223.5) |
| Cash Position – Beginning of Year | 1,683.7 | 2,142.2 | 2,734.6 | 2,970.1 | 3,309.7 |
| Cash Position – End of Year | 2,142.2 | 2,734.6 | 2,970.1 | 3,309.7 | 3,086.2 |
| | | | | | |
| Cash Represented by | | | | | |
| Cash and Short term Investments | 2,142.2 | 2,734.6 | 2,970.1 | 3,309.7 | 3,086.2 |
1 The Budget Estimates do not include estimates of total borrowing requirements of the Province. For information with respect to financial requirements of the Province and with respect to maturing debt of the Province, see Financing-Financial Requirements” and “Financing-Funded Debt Maturity Schedule”, respectively.
(-) Denotes no estimate provided.
2018-2019 Budget Estimates
For the fiscal year ended March 31, 2019 there was a surplus of $72.6 million. This represents an improvement of $261.3 million from the budgeted deficit of $188.7 million. Operating revenues were $9,697.1 million, $269.8 million higher than the budgeted amount of $9,427.3 million. Revenues were up due to higher than budgeted Corporate Income Tax and Personal Income Tax revenue, higher revenues from nursing homes, higher interest revenue, and higher Canada Health and Social Transfers. These increases were partially offset by lower than budgeted revenue from the New Brunswick Power Corporation. Operating expenses were $9,624.5 million, $8.5 million higher than the budgeted amount of $9,616.0 million. Expenses were up due to higher than budgeted expense in Protection Services, Social Development, Transportation and Infrastructure, Education and Training, and Health. This was partially offset by lower expenses for Central Government, Economic Development and Service of the Public Debt. Net debt increased by $32.7 million for the year compared to the budgeted increase of $372.3 million.
Major Sources of Ordinary Account Revenue for 2019-2020
The major sources of ordinary account revenue for the Province are payments from the federal government, consumption taxes and income taxes. For the fiscal year ending March 31, 2020, the Province’s revenue is estimated at $9,468.1 million, projecting an increase of 2.4% from the fiscal year ended March 31, 2019. Overall this represents a projected increase of $219.8 million in revenue. The principal factors that have increased revenue are Federal Government Payments ($181.2 million), Consumption Taxes ($99.9 million), offset by decreased Corporate Income Tax (-$61.8 million).
The following table shows the percentage sources of ordinary account revenue beginning with fiscal year ended March 31, 2016 through to the Budget Estimates for the fiscal year ending March 31, 2020.
Ordinary Account Revenue Sources
| | Year Ending March 31, | |
| | | Budget Estimates | CAGR1
|
| | 2016 | 2017 | 2018 | 2019 | 2020 | 2016-2020 |
| | (%) | |
| Taxes | | | | | | |
| Personal Income | 20.6 | 19.3 | 18.0 | 19.3 | 18.7 | | 1.7 |
| Corporate Income | 3.1 | 4.2 | 5.3 | 5.1 | 4.3 | | 13.3 |
| Consumption | 19.5 | 20.0 | 21.3 | 20.1 | 20.7 | | 5.7 |
| Property | 6.2 | 6.2 | 6.1 | 5.9 | 6.0 | | 3.3 |
| Miscellaneous | 0.8 | 0.8 | 0.8 | 0.8 | 0.9 | | 6.1 |
| Total Taxes | 50.1 | 50.5 | 51.5 | 51.3 | 50.6 | | 4.4 |
| | | | | | | | |
| Other Revenue | | | | | | | |
| Licenses, Permits and Fees | 7.1 | 7.1 | 6.9 | 6.8 | 6.6 | | 2.2 |
| Federal Government Payments | 35.8 | 35.5 | 34.6 | 35.7 | 36.8 | | 4.9 |
| Government Business Enterprises | 4.4 | 4.2 | 4.0 | 3.7 | 3.9 | | 1.4 |
| Miscellaneous | 2.6 | 2.7 | 3.0 | 2.5 | 2.1 | | (1.4) |
| Total Revenue | 100.0 | 100.0 | 100.0 | 100.0 | 100.0 | | |
Total Ordinary Account Revenue (millions of dollars) | 8,045.5 | 8,509.7 | 8,912.8 | 9,248.3 | 9,468.1 | | 4.2 |
1 Compound annual growth rate
Personal and Corporate Income Taxes
Personal Income Taxes
New Brunswick’s provincial personal and corporate income taxes are collected and administered by the federal government under a federal-provincial tax collection agreement.
The table below shows the New Brunswick provincial personal income tax rates from 2017 to 2019.
2017 | 2018 | 2019 |
9.68% on first $41,059 | 9.68% on first $41,675 | 9.68% on first $42,592 |
14.82% on $41,059 to $82,119 | 14.82% on $41,675 to $83,351 | 14.82% on $42,592 to $85,184 |
16.52% on $82,119 to $133,507 | 16.52% on $83,351 to $135,510 | 16.52% on $85,184 to $138,491 |
17.84% on $133,507 to $152,100 20.3% over $152,100 | 17.84% on $135,510 to $154,382 20.3% over $154,382 | 17.84% on $138,491 to $157,778 20.3% over $157,778 |
Provincial income tax credit amounts and tax brackets are indexed annually by national CPI.
Effective January 1, 2019 the New Brunswick Tuition Tax Credit is reinstated. Individuals will be able to claim this personal income tax credit when they file their annual tax return in 2020. Furthermore, tuition amounts paid in 2017 and 2018 will be available to be claimed for tuition tax credit purposes for the 2019 and subsequent taxation years.
Corporate Income Taxes
The corporate income tax (“CIT”) is calculated as a percentage of corporate taxable income as defined for federal tax purposes. The current general corporate income tax rate is 14 per cent.
New Brunswick’s small business CIT rate is 2.5 per cent and applies to the first $500,000 of active business income of small Canadian-controlled private corporations. The benefit of this rate is reduced for businesses with capital of more than $10 million and does not apply to those with taxable capital in excess of $15 million.
Effective January 1, 2019, the federal government introduced a measure which phases out access to the federal small business corporate income tax rate based on the amount of passive investment income earned by a corporation. New Brunswick did not parallel this federal measure. Maintaining the current rules for the New Brunswick small business limit will avoid a corporate income tax rate increase from 2.5% to 14% on active business income for those small businesses impacted by the federal changes.
Capital Taxes
New Brunswick does not apply a capital tax on businesses except for deposit accepting financial institutions. For banks, loan companies and trust companies, New Brunswick applies a capital tax on paid-up capital in excess of $10 million. The Province administers the capital tax on financial institutions. The Financial Corporations Capital Tax is deductible for federal and provincial corporate income tax purposes.
The Financial Corporation Capital Tax (FCCT) rate for banks is 5%. The rate for other types of deposit accepting financial institutions is 4%.
Harmonized Sales Tax
Effective April 1, 1997, New Brunswick eliminated its provincial retail sales tax and adopted a harmonized sales tax (“HST”). The HST is a value-added tax composed of the federal goods and services tax (“GST”) and a provincial component. The federal government administers the HST. The tax adopts the federal GST base and therefore applies to all goods and services subject to tax under the federal Excise Tax Act.
The current provincial portion of the HST rate in New Brunswick is 10%. The current joint federal-provincial HST rate in New Brunswick is 15%.
New Brunswick provides an HST credit to help protect low-to-middle income New Brunswickers. A refundable provincial HST credit is provided in the amount of $300 for individuals, $300 for spouse or equivalent, and $100 per child under the age of 19 is provided. Single parent families receive a $300 credit for their first child. The full HST credit is provided to New Brunswickers with a family income of less than $35,000 per year. The credit is reduced by two cents for every dollar of income above $35,000 per year. This means that individuals with income of less than $50,000 per year, or a family of two adults and two children with income of less than $75,000 per year could receive some benefit from the HST credit.
Under the HST, businesses receive full input tax credits for tax paid on business purchases. As with the federal GST, the HST provides the same tax-free status for certain goods offered under the GST (e.g. basic groceries). In addition, a number of rebates and credits are available. Books receive a point-of-sale rebate on the 10% provincial portion of the HST.
Gasoline and Motive Fuel Taxes
The gasoline tax is 15.5 cents per litre and the motive fuel tax (diesel) is 21.5 cents per litre. The tax rates for other taxable fuels are as follows: 2.5 cents per litre on aviation fuel; 4.3 cents per litre on locomotive fuel; and, 6.7 cents per litre on propane.
Tobacco Tax
Tobacco taxes are an important tool that governments can use to help discourage smoking and pay for the additional costs smoking imposes on the health care system.
The tobacco tax is 25.52 cents per cigarette or gram of loose or fine cut tobacco.
The tax rate that is applied to cigars is 75% of the normal retail price.
Cannabis Duty Rate
The federal government legalized cannabis for sale effective October 17, 2018.
In December 2017, FPT finance ministers agreed in principle to a coordinated cannabis duty, for an initial two-year period, which will be administered and collected by the federal government. In late-June 2018 New Brunswick signed its bilateral agreement.
The federal government imposes the “federal cannabis duty rates” at the higher of $1 per gram or 10% of a product price, through a federally-administrated coordinated framework.
For the initial two years, this tax room will be shared on the following basis: 75% to provincial and territorial governments; 25% to the federal government. Any federal revenue in excess of $100 million (prorated on a fiscal year basis) will be allocated to provinces.
The amended regulations setting out the rules governing the legal production and sale of edible cannabis, cannabis extracts and cannabis topicals came into force on October 17, 2019. It is expected that a limited selection of products will appear gradually in physical or online stores, and no earlier than mid-December 2019.
Property Taxes
New Brunswick levies a provincial real property tax of $1.1233 per $100 of assessment on property classified as non-owner-occupied residential housing. The provincial tax rate on property classified as other residential is set at $1.2173 per $100 of assessment. A provincial property tax rate of $0.4115 per $100 assessment is imposed on all owner-occupied residential property not within a municipality or in a former Local Service District (LSD) now located in a rural community. Non-residential property is subject to a provincial rate of $2.1860 per $100 of assessment. In addition to the residential and non-residential property tax rates, the Province applies a cost of assessment levy of 1.94 cents per $100 of assessment.
Municipal/local taxes are imposed to defray the cost of providing local services that are not provided by the Province. In the case of incorporated municipalities, municipal taxes are collected by the Province and are remitted back to the municipality. In unincorporated areas, the local tax is collected and retained by the Province, as the Province provides and pays for the provision of local services. On behalf of the Office of the Rentalsman, a fee of 4.86 cents per $100 of assessment is also imposed on residential property that is not owner-occupied and is not exempt under the Assessment Act.
The real property transfer tax is a one-time payment on the purchase of a property when the deed is registered. The real property transfer tax rate is 1% and applies to the greater of the sale price or assessed value of the property.
Federal-Provincial Fiscal Arrangements
Fiscal Equalization Payments
New Brunswick is one of six provinces to receive fiscal equalization payments from the federal government. The Equalization Program assists provinces in providing reasonably comparable levels of public services at reasonably comparable levels of taxation. New Brunswick's equalization payment for the fiscal year ended March 31, 2018 was $1,760.3 million and for the fiscal year ended March 31, 2019 was $1,873.9 million. Fiscal equalization payments accounted for 19.8% of total ordinary revenue for the fiscal year ended March 31, 2018 and 20.3% of the total ordinary revenue for the fiscal year ended March 31, 2019.
Canada Health Transfer (“CHT”) and Canada Social Transfer (“CST”)
In 2018-2019 the federal government provided annual funding through the CHT and CST in support of health care, post-secondary education, social assistance and services, early childhood development, and early learning and child care to provinces and territories. For the fiscal year ended March 31, 2018, major health and social transfers totaled $1,055.6 million which accounted for 11.8% of total ordinary revenue. For the fiscal year ended March 31, 2019, major health and social transfers totaled $1,112.4 million which accounted for 12.0% of total ordinary revenue. The legislated growth of the total CHT cash envelope grew at 6% annually through 2016-2017. Beginning 2017-2018, the total CHT cash envelope will grow in line with a three-year moving average of nominal GDP, with a 3% floor. The legislated growth of the total CST cash envelope will continue to grow at 3%.
Fiscal Stabilization Program
Under the Fiscal Stabilization Program, the federal government may make unconditional payments to a Province when total revenues of that Province, as per the federal definition, fall short of the previous year’s total due to a downturn in economic activity.
Major Ordinary Account Expenditure
For the fiscal year ended March 31, 2019 the Province's ordinary expenditure was $8,820.5 million, 4% higher than the ordinary expenditure for the fiscal year ended March 31, 2018. The net increase of $305.6 million was due in large part to increased expenditures in Education and Training, Social and Community Services, Health, Protection Services and Transportation and Infrastructure. These increases were partially offset by decreased expenditures in other areas, including Economic Development and Service of the Public Debt. The total budget for ordinary account expenditures for the year ending March 31, 2020 is $9,035.3 million.
Ordinary Account Expenditure
| | Year Ending March 31, |
| | | | | | | Budget Estimates |
| | | 2016 | 2017 | 2018 | 2019 | 2020 |
| | (In millions of dollars)
|
| Central Government | | 914.1 | 1,057.3 | 1,059.6 | 1,099.9 | 1,275.2 |
| Economic Development | | 138.1 | 213.4 | 183.9 | 170.7 | 163.9 |
| Education and Training | | 1,707.8 | 1,740.9 | 1,792.1 | 1,873.0 | 1,886.9 |
| Labour and Employment | | 134.6 | 138.3 | 134.3 | 144.3 | 150.4 |
| Social and Community Services | | 1,114.6 | 1,182.1 | 1,195.0 | 1,228.2 | 1,239.1 |
| Health | | 2,695.2 | 2,689.0 | 2,754.5 | 2,829.7 | 2,888.1 |
| Protection Services | | 270.9 | 259.7 | 263.9 | 333.4 | 289.5 |
| Resources | | 152.2 | 157.1 | 151.0 | 154.9 | 153.4 |
| Service of the Public Debt | | 678.1 | 673.3 | 666.6 | 648.3 | 677.0 |
| Transportation and Infrastructure | | 297.1 | 297.2 | 314.0 | 338.1 | 311.8 |
| | | 8,102.7 | 8,408.3 | 8,514.9 | 8,820.5 | 9,035.3 |
Economic Development
Budgeted Economic Development expenditure of $163.9 million represents 1.8% of the total budgeted expenditure for the fiscal year ending March 31, 2020 and is made up of the Department of Tourism, Heritage and Culture ($53.8 million), Opportunities New Brunswick ($40.0 million), and the Regional Development Corporation ($70.1 million).
Education and Training
The Province budgeted $1,886.9 million (20.9% of total budgeted expenditure) for the fiscal year ending March 31, 2020 for Education and Training expenditures. This is made up of estimated operating expenditures of elementary and secondary schools totaling $1,294.7 million, budgeted operating grants to universities estimated at $276.9 million, estimated grants and costs for the New Brunswick Community Colleges of $208.8 million, and General Government expenditures estimated at $106.5 million.
Labour and Employment
The Labour and Employment expenditure budget of $150.4 million represents 1.7% of the total budgeted expenditures for the fiscal year ending March 31, 2020. This is made up of estimated operating expenditures of the Department of Post-Secondary Education, Training and Labour.
Social and Community Services
The total budgeted expenditures in this area for the March 31, 2020 fiscal year are $1,239.1 million (13.7% of total budgeted expenditures). This is made up of programs with the Department of Social Development ($1,235.1 million) and a portion of General Government ($4.0 million). Programs included in the Department of Social Development are: an income security program, a child welfare and youth services program, funding for individuals in Nursing Homes and Special Care Homes and assistance for individuals and families in the acquisition and/or retention of suitable accommodations.
Health
The total budgeted expenditures in this area for the March 31, 2020 fiscal year are $2,888.1 million, 32.0% of total budgeted expenditure. The Province pays operating expenditures of approved public hospitals to cover the cost of supplying hospital services. The Province also operates a comprehensive medical services payment plan (Medicare), which covers the costs of eligible medical services incurred by registered residents. For the fiscal year ending March 31, 2020, expenditure on health services is estimated at $2,803.5 million for the Department of Health and $84.6 million for a portion of General Government.
Protection Services
The Protection Services budgeted expenditure of $289.5 million represents 3.2% of total expenditure budgeted for the fiscal year ending March 31, 2020 and is made up of the Department of Justice and the Office of the Attorney General ($55.7 million), a portion of the Department of Public Safety ($227.5 million) and a portion of General Government ($6.3 million).
Resources
Budgeted expenditure for Resources is $153.4 million and represents 1.7% of the total budgeted expenditure for the fiscal year ending March 31, 2020 and is made up of the Department of Agriculture, Aquaculture and Fisheries ($40.2 million), a portion of the Department of Environment and Local Government ($13.4 million), the Department of Energy and Resource Development ($96.5 million) and a portion of General Government ($3.3 million).
Transportation and Infrastructure
The Transportation and Infrastructure services budgeted expenditures of $311.8 million represents 3.4% of the total budgeted expenditure for the fiscal year ending March 31, 2020. The Province budgeted $311.5 million for the planning, design and maintenance of highways and public buildings, and the operation of ferry services and $0.3 million for a portion of General Government.
Central Government
The Central Government expenditure of $1,275.2 million estimated for the fiscal year ending March 31, 2020 represents 14.1% of total budgeted expenditure and is made up of expenditures of the Department of Finance ($35.9 million), a portion of the Department of Environment and Local Government ($139.3 million), General Government ($652.6 million), other central agencies ($43.9 million), and Consolidated Entities ($403.5 million).
Service of the Public Debt
For the fiscal year ending March 31, 2020 the estimate of $677.0 million for servicing the debt of the Province including interest, foreign exchange, amortization, and other debt management expenditures represents 7.5% of the total budgeted expenditure.
Net Capital Expenditures
The following table shows the gross capital expenditure for the four fiscal years ended March 31, 2019 and the Budget Estimates for the fiscal year ending March 31, 2020. The table also shows the total amount of recoveries through cost-sharing agreements with the federal government.
Net Capital Expenditure
| | | | | | | Estimate |
| | | 2016 | 2017 | 2018 | 2019 | 2020 |
| | | (In thousands of dollars) |
| | | |
| EXPENDITURES | | |
| Bridges | | 64,003 | 63,155 | 57,144 | 56,221 | 43,960 |
| Economic and Regional Development | | 14,906 | 32,877 | 69,407 | 63,352 | 47,800 |
| Highways | | 293,042 | 299,752 | 318,801 | 333,918 | 231,125 |
| Hospitals | | 52,012 | 58,332 | 81,803 | 107,125 | 123,760 |
| Maritime Provinces Higher Education | | | | | | |
| Commission – Capital Grants | | 2,000 | 2,000 | 2,000 | 2,000 | 2,000 |
| Other Public Buildings | | 32,944 | 27,459 | 51,665 | 81,284 | 44,189 |
| Permanent Parks | | 1,876 | 2,174 | 9,805 | 9,659 | 12,945 |
| Schools | | 94,010 | 96,402 | 86,090 | 79,223 | 60,242 |
| Vehicles | | 14,143 | 14,467 | 16,131 | 16,530 | 14,000 |
| Other | | 2,111 | 5,426 | 2,624 | 3,108 | 20,575 |
| | | 571,047 | 602,044 | 695,470 | 752,420 | 600,596 |
| RECOVERIES | | | | | | |
| Recoveries from Canada - Highways | | 16,893 | 13,565 | 23,903 | 25,340 | 18,455 |
| Other Recoveries | | 7,953 | 9,032 | 8,370 | 9,417 | 4,090 |
| | | 24,846 | 22,597 | 32,273 | 34,757 | 22,545 |
| Net Capital Expenditures | | 546,201 | 579,447 | 663,197 | 717,663 | 578,051 |
Special Operating Agencies
Revenue may be generated by the Special Operating Agencies or from transfers from other budgetary accounts. Expenditures are incurred by the agencies in delivering the programs they offer and may be of a capital or operating nature. For the fiscal year ending March 31, 2020, gross revenue is estimated at $190.3 million from the various agencies and expenditures are estimated at $196.5 million.
Loans and Advances
The Province has followed a policy of promoting economic development through the provision of financial assistance to industry. Such assistance has been channeled principally through Opportunities New Brunswick, the Department of Social Development, the Department of Agriculture, Aquaculture and Fisheries, Provincial Holdings Ltd., and Post-Secondary Education, Training and Labour and may take the form of repayable loans, guarantees of bank loans and bond issues and equity investments. Funds required for repayable loans and advances are appropriated annually by the Legislative Assembly and are included in the Province's annual borrowing requirements. Allowances for amounts for which collection is doubtful are reviewed annually and the net balances of loans and advances less allowances are reflected in the Province's accounts.
Economic Development
The Minister responsible for Opportunities New Brunswick is responsible for assistance provided under the Opportunities New Brunswick Act:
The Opportunities New Brunswick Act authorizes the Minister to provide financial assistance to aid and encourage the establishment or development of industry on such terms and conditions as are specified by the Lieutenant-Governor in Council. At March 31, 2019, loans and guarantees under the Opportunities New Brunswick Act amounted to approximately $257.1 million. The allowance for doubtful accounts on these loans and guarantees amounted to $133.2 million.
Agriculture, Aquaculture, and Fisheries
The Minister of Agriculture, Aquiculture and Fisheries is responsible for assistance provided under the Agricultural Development Act and the Fisheries and Aquaculture Development Act:
The Agricultural Development Act provides aid to farmers and farm-related businesses by way of loans, grants and loan guarantees to increase income and employment in rural areas of the Province. At March 31, 2019, loans and guarantees outstanding were $7.9 million. The allowance for doubtful accounts totaled $4.4 million.
The Fisheries and Aquaculture Development Act provides financial assistance mainly by way of direct loans to fishermen to purchase and operate fishing vessels and equipment. At March 31, 2019, loans and guarantees outstanding amounted to $21.6 million. The allowance for doubtful accounts totaled $17.6 million.
Social Development
The Department of Social Development carries out the provincial government's housing policies. Loans are issued pursuant to the New Brunswick Housing Act. At March 31, 2019, loans under the New Brunswick Housing Act totaled $61.5 million. The allowance for doubtful accounts on these loans totaled $11.3 million. In accordance with Canadian public sector accounting standards, loans that will be repaid through future provincial appropriations are expensed at the time of issue.
Post-Secondary Education, Training and Labour
The Department of Post-Secondary Education, Training and Labour administers the Student Loan Program which provides financial assistance to New Brunswick residents attending post-secondary institutions. At March 31, 2019, the total of student loans outstanding was $521.8 million. The allowance for doubtful accounts on these loans totaled $120.1 million.
FINANCING
Financing Requirements
Net loans and advances, sinking fund installments and the difference between the cash contributions made to the pension funds and the amounts expensed according to the CPA Canada Handbook as well as several other relatively small items are not included in the budget since they are non-budgetary items. Borrowing requirements associated with the budget and the aforementioned items for the fiscal year ended March 31, 2019 were $1,839.0 million and for the fiscal year ending March 31, 2020 are estimated at approximately $1,799.0 million. These amounts include borrowing on behalf of NB Power in the amount of $600 million for the fiscal year ending March 31, 2020 and $610 for the fiscal year ended March 31, 2019.
Non-Public Borrowing
The Province borrows from two non-public sources, the Canada Pension Plan (“CPP”) and the New Brunswick Immigrant Investor Fund (2009) Ltd (“NBIIF”).
The CPP is a compulsory national pension plan in which all provinces other than Quebec participate. Prior to 1998 funds were invested in non-marketable securities issued by participating provinces, provincially guaranteed Crown corporations and the federal government at a rate based on the federal government's long-term public market borrowing costs. Changes to CPP legislation in 1998 allowed for new funds flowing into the CPP to be invested in domestic and foreign equities and for provincial bonds previously issued to the CPP to be rolled over upon maturity on a one-time basis at a cost equal to the respective province’s market rate. At March 31, 2019, New Brunswick had outstanding borrowings from the CPP of $834.3 million.
The NBIIF was established as a Crown corporation under the Department of Business New Brunswick to manage NB’s share of funds from a federal immigrant program. The federal government program was established to attract immigrants to Canada. Under this program potential immigrants may make a financial investment of $800,000 as part of a requirement for attaining Canadian citizenship. The proceeds are divided and distributed among the participating provinces. A federal government condition of the program is that investors receive their principal back after five years. To ensure that this occurred, the NBIIF invested a portion of the money received from investors (collected by the federal government) in five year zero coupon government bonds. The Province of New Brunswick issued bonds directly to the NBIIF to the exact maturity date required. The first bonds were issued in February of 2011. The NBIIF bonds began maturing in September 2015. At March 31, 2019, New Brunswick had outstanding borrowings from NBIIF of $17.2 million.
Public Borrowing
At March 31, 2019, the Province had outstanding long-term borrowings for provincial purposes from non-CPP and NBIIF sources totaling $17,152.4 million through the issue and sale of debentures and notes, such securities being denominated in Canadian dollars and U.S. dollars. Not included in this amount is $4,624.0 million borrowed on behalf of NB Power.
Trend and Distribution of Borrowing
The trend and distribution of the amounts and sources of the Province's annual debt financing over the past five fiscal years is shown below.
Funded Debt
| | Year Ended March 31, |
| | 2015 | 2016 | 2017 | 2018 | 2019 |
| | (In millions of dollars) |
| | | | | | |
| Canada Pension Plan Liabilities | 834.3 | 834.3 | 834.3 | 834.3 | 834.3 |
| New Brunswick Immigrant Investor Fund (2009) Ltd. | 174.5 | 147.7 | 104 | 74.2 | 17.2 |
| Provincial Purpose Public Debt | 13,804.60 | 14,758.50 | 15,631.30 | 16,325.00 | 17,152.40 |
| Advances to NB Power | 4,607.10 | 4,514.30 | 4,422.70 | 4,412.30 | 4,624.00 |
| Total | 19,420.50 | 20,254.80 | 20,992.30 | 21,645.80 | 22,627.90 |
Growthof Funded Debt for Provincial Purposes
The following tables illustrate the rate of change of the Province's outstanding provincial purpose funded debt and certain ratios relating that growth to economic indicators. The following tables do not include $0 million borrowed during fiscal 2015, $480 million borrowed during fiscal 2016, $300 million borrowed during fiscal 2017, $420 million borrowed during fiscal 2018 and $610 million borrowed during fiscal 2019 on behalf of NB Power.
The Province is required by legislation to pay annually into a sinking fund the Canadian currency equivalent of not less than 1% of all provincial purpose funded debt. Sinking fund installments are invested in approved securities including direct and guaranteed obligations of the Province. Interest earned on such investments is added to the sinking fund and is reinvested in approved securities. At March 31, 2019 the value of the sinking fund applicable to debt issued for provincial purposes amounted to $4,776.4 million. For the fiscal year ended March 31, 2019, earnings on investments held for the repayment of provincial purpose debt amounted to $195.5 million.
Outstanding Net Provincial Purpose Funded Debt1
(In millions of dollars unless otherwise indicated)
At March 31, | Canadian Dollars | US Dollars | Swiss Francs | Euro | Total2 | Value of Sinking Funds | Net Provincial Purpose Funded Debt | Change over Previous Year (%) |
| | | | | | | | | |
| 2015 | 13,156.5 | 1,400.0 | 300 | | 14,813.4 | 4,049.6 | 10,763.8 | 5.4 |
| 2016 | 14,505.0 | 1,400.0 | 0 | | 15,740.5 | 4,201.3 | 11,539.2 | 7.2 |
| 2017 | 15,009.9 | 900.0 | 600 | | 16,569.6 | 4,212.7 | 12,356.9 | 7.1 |
| 2018 | 15,039.7 | 1,400.0 | 600 | | 17,233.5 | 4,418.5 | 12,815.0 | 3.7 |
| 2019 | 15,482.5 | 1,150.0 | 700 | 105 | 18.003.9 | 4,776.4 | 13,227.5 | 3.2 |
Comparative Debt Statistics
| | Year ended March 31,
|
| | 2015 | 2016 | 2017 | 2018 | 2019 |
| | (In millions of dollars unless otherwise indicated)
|
Gross Domestic Product at market prices3 | 33,453 | 34,330 | 35,825 | 36,966 | 37,668 |
Household Income3 | 22,797 | 23,232 | 23,939 | 24,711 | 25,452 |
| | | | | | |
| Total Revenue | 8,439.2 | 8,386.2 | 8,902.2 | 9,339.0 | 9,697.1 |
| Net Funded Debt | 10,763.8 | 11,539.2 | 12,356.9 | 12,815.0 | 13,227.5 |
| As % of Gross Domestic Product | 32.2% | 33.6% | 34.5% | 34.7% | 35.1% |
As % of Household Income | 47.2% | 49.7% | 51.6% | 51.9% | 52.0% |
As % of Ordinary Revenue | 127.5% | 137.6% | 138.8% | 137.2% | 136.4% |
1 Debt securities are reported in the currency in which they were originally issued. Some issues have been hedged into Canadian dollars.
2 Debt securities payable in foreign currencies are expressed as the Canadian dollar equivalent at fiscal year-end rates of exchange or, where hedges are in place, at the rates of exchange established by such hedges.
3 2019 value based on NB Department of Finance forecast
Provincial Purpose Funded Debt Maturity Schedule
For Securities Outstanding at March 31, 2019
(In millions of dollars1 )
Year ended | | | | | Total in |
31-Mar | CAD$ | USD | CHF | EUR | CAD$2 |
| | | | | | |
| 2020 | 864.0 | | | | 864.0 |
| 2021 | 1,253.1 | 50 | | | 1,302.0 |
| 2022 | 661.4 | | | | 661.4 |
| 2023 | 873.2 | 600 | | | 1,605.0 |
| 2024 | 1,121.2 | | | | 1,121.2 |
| | | | | | |
| 2020-2024 | 4,772.9 | 650 | | | 5,553.7 |
| 2025-2029 | 3,466.3 | 500 | 300 | | 4,501.4 |
| 2030-2034 | 550.0 | | 400 | | 1,098.0 |
| 2035-2039 | 1,202.6 | | | | 1,202.6 |
| 2040-2044 | 3,319.8 | | | | 3,319.8 |
| 2045+ | 1,690.0 | | | 105 | 1,847.5 |
| | | | | | |
| Total Funded Debt | 15,001.6 | 1,150 | 700 | 105 | 17,523.0 |
| | | | | | |
| CMHC Debentures | 50.2 | | | | 50.2 |
| Nursing Home Mortgages | 430.7 | | | | 430.7 |
| | | | | | |
| | | | | | |
| Total | 15,482.5 | 1,150 | 700 | 105 | 18,003.9 |
1 Debt securities are shown in currency in which they were issued.
2 Debt securities payable in foreign currencies are expressed as the Canadian dollar equivalent as some of that debt may have been swapped.
From April 1, 2019 to date the Province has borrowed $1,201 million including $600 million on behalf of New Brunswick Power.
Unfunded Debt
The Province follows an accrual accounting system, as such, expenditures are allocated to the year in which they were incurred regardless of the date of payment resulting in the establishment of accounts payable and accrued liabilities. Such unfunded debt is not secured by debt instruments.
At March 31, 2019, the Province's unfunded debt was as follows:
| | At March 31, 2019 |
| | (In millions of dollars) |
| | | |
| Bank Advances and Short Term Borrowing | | 1,557.7 |
| Trust Deposits | | 227.0 |
| Accounts Payable and Accrued Expenditures | | 3,016.2 |
| Deferred Revenue | | 638.6 |
| | | |
| Total Unfunded Debt | | 5,439.5 |
This unfunded debt is partially offset by assets of the Province in the amount of $5,167.0 million, represented by $3,309.7 million of cash and short term investments, $406.2 million of receivables and advances, $1,254.5 million of taxes receivable, $51.7 million of inventories, and $144.9 million of prepaid and deferred charges.
Contingent Liabilities
The following table summarizes outstanding contingent liabilities at March 31, 2019 with comparable numbers as at March 31, 2018:
| | 2018 | 2019 |
| Bank Loans | | |
| Under Various Acts | 36.6 | 30.6 |
| Less: Provision for Possible Losses | 13.4 | 8.9 |
| Total Contingent Liabilities | 23.2 | 21.7 |
Due to the adoption of the definition of the Reporting Entity recommended by PSAB of the CPA Canada Handbook, guarantees associated with the debt of the New Brunswick Municipal Finance Corporation are not included in the previous table. These guarantees are as follows:
| | At December 31, (In millions of dollars) |
| | | |
| | 2017 | 2018 |
| | | |
| Bonds, Debentures and Notes | | |
| New Brunswick Municipal Finance Corporation | 883.1 | 942.4 |
| Accrued Interest | 2.8 | 2.9 |
| Total | 885.9 | 945.3 |
| | | |
CONSOLIDATION OF NEW BRUNSWICK PUBLIC SECTOR DEBT
Other than the Province, NB Power and the New Brunswick Municipal Finance Corporation, municipalities are the only public sector entities with outstanding debt. Municipalities, with the exception of the City of Saint John, are required to obtain approval from the provincial government before borrowing money for capital expenditures.
Consolidated Funded Debt of the New Brunswick Public Sector
(In millions of dollars)
| Province of New Brunswick | | |
| | Funded Debt | 18,003.90 |
| | Less: Sinking Funds | 4,776.40 |
| | | 13,227.50 |
| Municipalities | | |
| | Funded Debt | 942.4 |
| Total Public Sector Debt | | 14,169.90 |
Information in the foregoing table relative to the Province is at March 31, 2018, and information relative to municipalities is the amount outstanding at December 31, 2017. Excluded is $4,062.1 million (net of sinking funds of $561.9 million) borrowed by the Province on behalf of NB Power. This debt is paid out of the operating revenues of NB Power rather than out of provincial revenues.
VESTCOR CORPORATION
Formed in July 2016, Vestcor Corp., which owns Vestcor Inc., is an independent private not-for-profit holding company under the Vestcor Act of the New Brunswick Legislature. The organization is jointly owned by the New Brunswick Public Service Pension Plan and the New Brunswick Teacher’s Pension Plan.
On October 1, 2016, Under the Vestcor Act, the N.B. Investment Management Corporation was continued as Vestcor Investment Management Corporation, while the operations of the Pension and Employee Benefits Division of the Province of New Brunswick’s Department of Human Resources were transferred to Vestcor Pension Services Corporation. As of January 1, 2018, these two subsidiaries were integrated and form Vestcor Inc.
INFORMATION RELATING TO PUBLIC SECTOR PENSION LIABILITIES
CROSS REFERENCE SHEET
Information Relating to Public Sector Pension Liabilities | Exhibit 99.5 - 2019 Volume 1 Consolidated Financial Statements |
| PROVINCE OF NEW BRUNSWICK | |
| Retirement Benefits | Page 30 |
| | Exhibit 99.5 |
| | |
| | |
| Defined Benefit Pension Plans | Page 49-50 |
| | Exhibit 99.5 |
| | |
| Defined Contribution Pension Plans | Page 50 |
| | Exhibit 99.5 |
| | |
| | |
| Target Benefit Pension Plans | Page 50-51 |
| Exhibit 99.5 | |
| | |
| | |
| Retirement Allowance Plan | Page 51 |
| | Exhibit 99.5 |
| | |
| Retirement Benefit Liability and Expense (millions) | Page 51-55 |
| | Exhibit 99.5 |
NEW BRUNSWICK POWER CORPORATION
CROSS REFERENCE SHEET
| Information Relating to New Brunswick Power | Exhibit 99.6 – New Brunswick Power Annual Report |
| About New Brunswick Power | Page iii |
| | Exhibit 99.6 |
| | |
| Notes to Financial Statements, note 1 Description of Business | Page 49 |
| | Exhibit 99.6 |
| | |
| New Brunswick Power | Pages 118-120 |
| | Exhibit 99.6 |
| | |
| Reliability Excellence | Pages 13-14 |
| | Exhibit 99.6 |
| | |
| Financial and Operating Performance Factors | Pages 20-23 |
| | Exhibit 99.6 |
| | |
| | |
| Financial Performance | Pages 24-34 |
| | Exhibit 99.6 |
| | |
| | |
| Notes to Financial Statements, note 29 Business Combination | Page 106 |
| | Exhibit 99.6 |
| | |
| | |
| Statistical Overview | Pages 107-112 |
| (includes Statements of Generation, Sales, Revenue, | Exhibit 99.6 |
| In Province Generation, Operating Statistics, Earnings Summary, | |
| Financial Position Summary, Cash Flow Summary, | |
| Other Expenses and Income, Financial Ratios, Other Statistics, | |
| Capital Management.) |
FUNDED DEBT OUTSTANDING AS AT 31st MARCH 2019
CROSS REFERENCE SHEET
Information Relating to New Brunswick Funded Debt | Exhibit 99.8 – Province of New Brunswick, Canada Excerpt of Volume 2 Supplementary Information Public Accounts for the fiscal year ended 31 March 2019 |
| | |
Funded Debt Outstanding as at 31st March 2019 | Pages 30-36 |
| | Exhibit 99.8 (unaudited) |
FOREIGN EXCHANGE
Canada maintains a floating exchange rate for the Canadian dollar to permit the rate to be determined by fundamental market forces without intervention except as required to maintain orderly conditions.
Spot exchange rates for the U.S. dollar, Euro and Swiss franc in Canada, expressed in Canadian dollars, are shown in the table below for 2014 through 2018.
Average of Noon Spot Rates | 2014 | 2015 | 2016 | 2017 | 2018 |
| U.S. Dollar | 1.1045 | 1.2787 | 1.3248 | 1.2986 | 1.2957 |
| Swiss Franc | 1.2078 | 1.3286 | 1.3450 | 1.3189 | 1.3246 |
| Euro | 1.4671 | 1.4182 | 1.4660 | 1.4650 | 1.5302 |
Source: Bank of Canada
SOURCES OF INFORMATION
Information included herein which is designated as being taken from a publication of the Province or Canada, or any agency or instrumentality of either, is included herein upon the authority of such publication as an official public document.
All financial information of the Province contained herein was obtained from the annual Budget and Main Estimates, any financial reviews pertaining thereto and the Public Accounts, or was prepared by representatives of the Province of New Brunswick in their official capacities. The information set forth under "Province of New Brunswick", and other than as described in the preceding paragraph, was prepared by representatives of the Province of New Brunswick in their official capacities.