*The Registrant is filing this annual report on a voluntary basis.
The information set forth below is to be furnished:
1. In respect of each issue of securities of the registrant registered, a brief statement as to:
(a) The general effect of any material modifications, not previously reported, of the rights of the holders of such securities.
None.
(b) The title and the material provisions of any law, decree or administrative action, not previously reported, by reason of which the security is not being serviced in accordance with the terms thereof.
None.
(c) The circumstances of any other failure, not previously reported, to pay principal, interest, or any sinking fund or amortization installment.
None.
2. A statement as of the close of the last fiscal year of the registrant giving the total outstanding of:
(a) Internal funded debt of the registrant. (Total to be stated in the currency of the registrant. If any internal funded debt is payable in a foreign currency, it should not be included under this paragraph (a), but under paragraph (b) of this item.)
Reference is made to page 60 of Exhibit 99.5 and pages 37-41 of Exhibit 99.10 hereto.
(b) External funded debt of the registrant. (Totals to be stated in the respective currencies in which payable. No statement needs to be furnished as to intergovernmental debt.)
Reference is made to page 60 of Exhibit 99.5 and pages 37-41 of Exhibit 99.10 hereto.
3.A statement giving the title, date of issue, date of maturity, interest rate and amount outstanding, together with the currency or currencies in which payable, of each issue of funded debt of the registrant outstanding as of the close of the last fiscal year of the registrant.
Reference is made to page 60 of Exhibit 99.5 and pages 36-41 of Exhibit 99.9 hereto.
the total amount outstanding, as shown in Item 3, into the following:
i
(1) Total amount held by or for the account of the registrant.
As at March 31, 2022, the total amount held by or for the account of the registrant was as follows:
Date of
Maturity
Interest
Rate (%)
Series
Amount
Outstanding
Amount Held in
Sinking Fund
Date
Issued
May 1, 2022
8.75
EI
USD 200,000,000
15,067,000
May 1992
(2) Total estimated amount held by nationals of the registrant (or if registrant is other than a national government by the nationals of its national government); this estimate need be furnished only if it is practicable to do so.
Not practicable to furnish.
(3) Total amount otherwise outstanding.
Date of Maturity
Interest Rate (%)
Series
Amount Outstanding
Month Issued
May 1, 2022
8.75
EI
USD 184,933,000
May 1992
December 12, 2022
2.50
HY
USD 500,000,000
Dec 2017
February 24, 2028
3.625
HW
USD 500,000,000
May 2018
(b) If a substantial amount is set forth in answer to paragraph (a)(1) above, describe briefly the method employed by the registrant to reacquire such securities.
The Province of New Brunswick sinking fund is a general investment type fund. The Provincial Loans Act and in some cases the terms and conditions of the debenture issue specify the minimum rate at which sinking fund installments will be made. Purchases of bonds into the fund are generally discretionary. Many of the bonds purchased into the fund are New Brunswick or New Brunswick guaranteed bonds. The Province is also permitted to buy debt instruments issued or guaranteed by the Government of Canada or any province of Canada and other debt instruments defined by the Provincial Loans Act.
5.A statement as of the close of the last fiscal year of the registrant giving the estimated total of:
(a) Internal floating indebtedness of the registrant. (Total to be stated in the currency of the registrant.)
Not applicable.
(b) External floating indebtedness of the registrant. (Total to be stated in the respective currencies in which payable.)
Reference is made to page 60 of Exhibit 99.5 and pages 36-41 of Exhibit 99.9 hereto.
6. Statements of the receipts, classified by source, and of the expenditures, classified by purpose, of the registrant for each fiscal year of the registrant ended since the close of the latest fiscal year for which such information was previously reported. These statements should be so itemized as to be reasonably informative and should cover both ordinary and extraordinary receipts and expenditures; there should be indicated separately, if practicable, the amount of receipts pledged or otherwise specifically allocated to any issue registered, indicating the issue.
Reference is made to pages 32-34 of Exhibit 99.5 and pages 24-35 of Exhibit 99.10 hereto.
7. (a) If any foreign exchange control, not previously reported, has been established by the registrant (or if the registrant is other than a national government, by its national government), briefly describe the effect of any such action, not previously updated.
None.
(b) If any foreign exchange control previously reported has been discontinued or materially modified, briefly describe the effect of any such action, not previously reported.
Not applicable.
ii
This annual report comprises:
(a) Pages numbered ii to vi consecutively.
(b) The following exhibits:
99.3
Province of New Brunswick 2022-2023 Budget (incorporated by reference to exhibit 99.1, 99.2, 99.3 of Amendment No. 2 to the Annual Report of the Province of New Brunswick filed on Form 18-K/A, dated March 22, 2022.)
99.5
Province of New Brunswick Public Accounts for the fiscal year ended March 31, 2022 Volume 1 Financial Statements (incorporated by reference to Amendment No. 1 to the Annual Report of the Province of New Brunswick filed on Form 18-K/A, dated October 17th, 2022.)
99.6
New Brunswick Power Annual Report 2021-2022 (incorporated by reference to Amendment No. 1 to the Annual Report of the Province of New Brunswick filed on Form 18-K/A, dated October 17, 2022).
99.9
Information relating to New Brunswick Funded Debt (unaudited) (incorporated by reference to Amendment No. 3 to the Annual Report of the Province of New Brunswick filed on Form 18-K/A, dated December 22, 2022).
99.10
Current Description of the Province of New Brunswick
This annual report is filed subject to the Instructions for Form 18‑K for Foreign Governments and Political Subdivisions Thereof.
SIGNATURE
Pursuant to the requirements of the Securities Exchange Act of 1934, the registrant has duly caused this annual report to be signed on its behalf by the undersigned, thereunto duly authorized, at Fredericton, New Brunswick, Canada on the 23rd day of December 2022.
Province of New Brunswick
By:
/s/ Peter Kieley
Name:
Peter Kieley
Title:
Assistant Deputy Minister Department of Finance and Treasury Board
iii
EXHIBIT INDEX
Exhibit Number
Description
99.3
Province of New Brunswick 2022-2023 Budget (incorporated by reference to exhibit 99.1, 99.2, 99.3 of Amendment No. 2 to the Annual Report of the Province of New Brunswick filed on Form 18-K/A, dated March 22, 2022.)
99.5
Province of New Brunswick Public Accounts for the fiscal year ended March 31, 2022 Volume 1 Financial Statements (incorporated by reference to Amendment No. 1 to the Annual Report of the Province of New Brunswick filed on Form 18-K/A, dated October 17, 2022.)
99.6
New Brunswick Power Annual Report 2021-2022 (incorporated by reference to Amendment No. 1 to the Annual Report of the Province of New Brunswick filed on Form 18-K/A, dated October 17, 2022).
99.9
Information relating to New Brunswick Funded Debt (unaudited) (incorporated by reference to Amendment No. 3 to the Annual Report of the Province of New Brunswick filed on Form 18-K/A, dated December 22, 2022).
99.10
Current Description of the Province of New Brunswick
iv
Exhibit “99.10” Current Province of New Brunswick Description
December 23, 2022
1
Exhibit “99.10” Current Province of New Brunswick Description
Table of Contents
Page
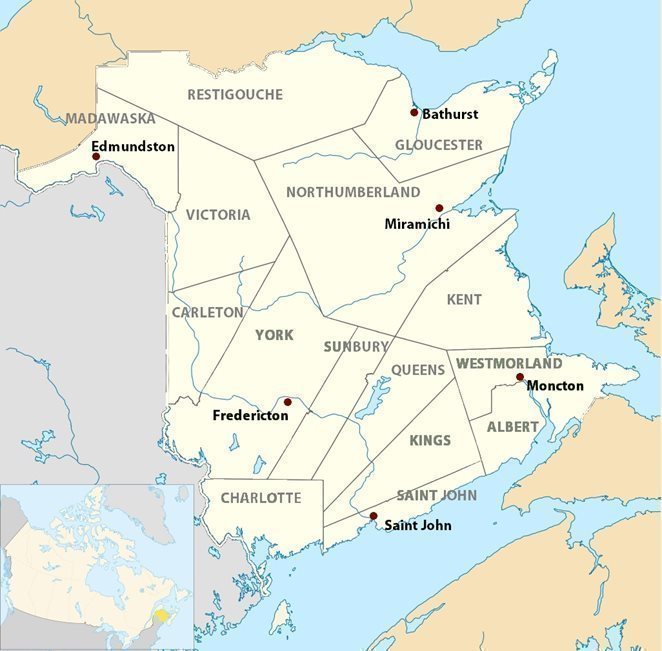
Map of the Province
3
Summary of Economic and Financial Information
4
General Information
6
The Economy
8
Revenue and Expenditure of the Province
21
Financing
33
Consolidation of New Brunswick Public Sector Debt
39
Public Sector Pension Liabilities
40
New Brunswick Power Corporation
41
Funded Debt Outstanding as at 31st March 2021
42
Foreign Exchange
43
Sources of Information
43
All dollar amounts herein are in Canadian dollars unless otherwise specified. On December 22, 2022 , the daily average exchange rate for United States (U.S.) dollars as reported by the Bank of Canada, expressed in Canadian dollars was $1.3000.
Financial data for the Province of New Brunswick ("New Brunswick" or the "Province") have been rounded. Certain information presented in tabular form may not add to the total presented due to such rounding.
Compound annual rates of growth are computed by using the "geometric average method" which is based on first and last year observations of the variables rather than all observations over the period concerned.
2
Exhibit “99.10” Current Province of New Brunswick Description
MAP OF NEW BRUNSWICK
3
Exhibit “99.10” Current Province of New Brunswick Description
SUMMARY OF ECONOMIC AND FINANCIAL INFORMATION FOR NEW BRUNSWICK
The following summary information is qualified in its entirety by the information contained herein:
Summary
Year Ended December 31,
CAGR1%
2017
2018
2019
2020
2021
2017-2021
(In millions of dollars unless otherwise indicated)
Economy
Gross domestic product (current dollars)
35,828
37,158
38,057
37,445
42,608
4.4
%
Primary household income
23,932
24,578
25,243
25,020
27,187
3.2
%
Retail trade
12,791
13,003
13,278
13,420
15,117
4.3
%
Manufacturing sales
18,728
18,490
18,413
15,174
20,864
2.7
%
Foreign commodity exports
12,856
12,615
13,090
10,307
14,749
3.5
%
Population (July 1st; thousands)
766.6
770.3
777.1
783.0
790.4
0.9
%
Employment (thousands)
356.3
358.4
361.1
351.6
360.5
0.3
%
Unemployment rate
8.2
%
8.0
%
8.1
%
10.0
%
9.0
%
--
Consumer price index (% change)
2.3
%
2.1
%
1.7
%
0.2
%
3.8
%
--
Gross domestic product (real; % change)
2.5
%
1.2
%
1.3
%
-2.7
%
5.9
%
--
Source Statistics Canada: numbers are subject to adjustment
1Compound annual growthrate
Year Ending March 31,
2019
2020
2021
2022
Budget Estimates
2023
(In millions of dollars)
Government Finance
Ordinary Account (Surplus) Deficit
(427.9
)
(419.6
)
(721.6
)
(1,140.7
)
(513.8
)
Net Capital Expenditure
717.7
525.3
522.2
585.0
702.4
(Surplus) Deficit on Special Purpose Account
(7.1
)
(6.7
)
(12.3
)
(31.2
)
15.5
(Surplus) Deficit on Special Operating Agency
(7.0
)
(10.6
)
(14.8
)
(31.3
)
19.1
Earnings from Sinking Fund
(195.5
)
(204.7
)
(203.1
)
(208.5
)
(207.7
)
Accounting adjustments on consolidation
(47.5
)
79.6
(40.4
)
(262.7
)
-
Increase (Decrease) in Net Debt
32.7
(36.8
)
(470.0
)
(1,089.4
)
15.5
Adjustments related to non-financial assets
(105.4
)
(11.9
)
61.4
312.1
(50.7
)
Annual (Surplus) Deficit
(72.6
)
(48.7
)
(408.5
)
(777.3
)
(35.2
)
4
Exhibit “99.10” Current Province of New Brunswick Description
Year Ended March 31,
2018
2019
2020
2021
2022
(In millions of dollars unless indicated)
Provincial Purpose Funded Debt 1
Gross Provincial Purpose Funded Debt
17,233.50
18,003.90
18,402.10
18,314.20
18,394.10
Less Sinking Funds
4,418.50
4,776.40
5,157.30
5,501.90
5,887.70
Net Provincial Purpose Funded Debt
12,815.00
13,227.50
13,244.80
12,812.30
12,506.40
As a Percent of GDP
34.5
%
34.8
%
35.3
%
32.0
%
27.0
%
2018
2019
2020
2021
2022
(In millions of dollars)
Funded Debt Used for
Advances to NB Power2
Gross Advances
4,412.3
4,624.0
4,794.7
4,700.8
4,600.0
Less Sinking Funds
505.1
561.9
593.6
409.9
500.5
Net Advances
3,907.2
4,062.1
4,201.1
4,290.9
4,099.5
2018
2019
2020
2021
2022
(In millions of dollars)
Contingent Liabilities
23.2
21.9
6.2
7.8
7.4
1 Foreign currency issues are expressed as the Canadian dollar equivalent at fiscal year-end rates of exchange or, where hedges are in place, at the rates of exchange established by such hedges.
5
Exhibit “99.10” Current Province of New Brunswick Description
GENERAL INFORMATION
Introduction
New Brunswick is located on the eastern seaboard of Canada and is one of the four Atlantic Provinces. New Brunswick has a total area of 28,355 square miles of which about 12,981 square miles is Crown land owned by the Province. The Saint John River flows for a distance of over 300 miles through the Province to its mouth on the Bay of Fundy. The Province's population is concentrated principally in the valleys of the Saint John and other rivers.
A large part of New Brunswick is covered by forests which constitute a major natural resource. Other natural resources include fish and shellfish, farmland and base metals, coal, potash, limestone and other minerals. The location of the Province provides the advantage of cost-effective water transportation for its products to export markets in the eastern U.S., Great Britain, and Western Europe. The City of Saint John, located at the mouth of the Saint John River on the Bay of Fundy, is home to one of North America’s largest oil refineries and is one of the two principal seaports in eastern Canada that remain open throughout the year. Consequently, some Canadian shipping, which would otherwise pass through the St. Lawrence River, is diverted to the Saint John port during the winter months.
According to Statistics Canada, the population of the Province on July 1, 2022, was estimated at 812,061. The latest estimates (as of July 1, 2021) for the three largest urban areas of New Brunswick and their respective populations are Moncton (162,422), Saint John (132,499) and Fredericton (112,138), the capital of the Province.
Government
Canada consists of a federation of provinces and federal territories with a constitutional division of powers between the federal and provincial governments established by the Constitution Act, 1867 and the Constitution Act, 1982. Under these Acts the provinces are assigned jurisdiction over health, social services, education, municipal institutions, property and civil rights, natural resources, and other matters of purely private or local concern. The Parliament of Canada has jurisdiction over all areas not assigned exclusively to the provincial legislatures, including such matters as the federal public debt and property, the regulation of trade and commerce, currency and coinage, banks and banking, national defense, the postal services, railways and navigation, and employment insurance.
The Constitution Act, 1982 provides for enlarged provincial jurisdiction over, and taxation of, certain natural resources and electrical energy, a Charter of Rights and Freedoms, including language rights, the principles of the reduction of regional economic disparities and the making of fiscal equalization payments to certain provinces by the Government of Canada, and for the amendment of the constitution in Canada. Each province owns mineral and other resources on its provincial Crown Lands and may own sub-surface resources on its other lands.
The executive power in New Brunswick is vested in the Lieutenant-Governor acting on the advice of the Executive Council. The Executive Council is responsible to the Legislative Assembly. The Lieutenant-Governor, who is the representative of the King, is appointed by the Governor-General of Canada in Council on the recommendation of the Prime Minister of Canada. The current Lieutenant-Governor is the Honourable Brenda L. Murphy. Members of the Executive Council are appointed by the Lieutenant-Governor, on the nomination of the Premier from members of the Legislative Assembly.
Legislative power is exercised by the Legislative Assembly and legislation becomes effective upon the assent of the Lieutenant-Governor unless otherwise specified in the legislation. The Legislative Assembly is elected for a term of four years and may be dissolved at any time by the Lieutenant-Governor. The last general election occurred on September 14, 2020. Currently there is a Progressive Conservative Government led by Premier Blaine Higgs.
6
Exhibit “99.10” Current Province of New Brunswick Description
International Trade Agreements
The World Trade Organization (WTO) has remained the cornerstone of Canadian trade policy; Canada has been proactively working towards keeping the trade policies transparent and predictable. New Brunswick supports Canada’s negotiating framework for the Doha Development Round and the WTO as an institution. The Province participates actively on federal/provincial committees concerned with implementation, dispute settlement and negotiation aspects of international trade and investment agreements.
As multilateral WTO negotiations have lagged recently, the Government of Canada has become more aggressive with its regional free trade agenda. As such, Canada is a signatory to a number of free trade agreements, including Canada-European Union (“E.U.”) Comprehensive Economic and Trade Agreement (CETA), the Comprehensive and Progressive Agreement for Trans-Pacific Partnership (CPTPP) and the Canada-United States-Mexico Agreement (CUSMA), which replaced the North American Free Trade Agreement (NAFTA).
In the meantime, Canada currently negotiates FTAs with trading partners such as the UK, India, Indonesia and ASEAN.
The Canada-United Kingdom Trade Continuity Agreement (Canada-UK TCA) came into force on April 1, 2021. The Agreement replicates the main benefits of the CETA to ensure continuity in Canada’s trade with the U.K. following the U.K.’s departure from the E.U. On March 24, 2022, Canada and the United Kingdom launched negotiations toward a Free Trade Agreement (FTA). The U.K. is Canada’s third-largest partner country for trade in goods and services, and the ninth-largest export destination in 2021, accounting for roughly 0.3% of New Brunswick’s total goods exports. The United Kingdom is also a key source of foreign direct investment (FDI) and science and technology partnerships. Further negotiations between Canada and the U.K. on a new bilateral FTA may improve trade relations between New Brunswick and the U.K. while also presenting an economic opportunity to New Brunswick to export more goods such as fuel wood, especially now with the fuel poverty the U.K. is facing due to the ongoing Russian-Ukrainian war.
The CUSMA, which came into effect on July 1, 2020, and its predecessor, NAFTA, have provided the Province of New Brunswick with an extraordinary advantage in the U.S. market. Even as the United States implements more regional/bilateral free trade agreements, which have tended to erode this exclusive relationship, the U.S. remains Canada’s and New Brunswick’s biggest export market.
On January 23, 2018, eleven countries negotiated and concluded the Comprehensive and Progressive Agreement for Trans-Pacific Partnership (CPTPP) which is a free trade agreement between Canada and six other countries in the Asia-Pacific region: Australia, Japan, Mexico, New Zealand, Singapore and Vietnam. Once fully implemented, CPTPP will also include Brunei, Chile, Malaysia and Peru. The Canadian Parliament ratified Canada’s membership in the CPTPP, and the Agreement entered into force on December 30, 2018. The CPTPP enters into force for the remaining countries as they ratify the Agreement.
The CETA was signed on October 30, 2016, and entered into force on September 21, 2017. CETA covers all sectors and aspects of Canada-EU trade virtually to eliminate or reduce the trade barriers, the scope of which ranges from tariffs to product standards, investment, professional certification, and many other areas of activity. The broad spectrum of the Agreement includes improved access to E.U. markets for goods and services, greater certainty, transparency, investment protection, and new opportunities in E.U. procurement markets. Before CETA entered into force, only 25% of E.U. tariff lines on Canadian goods were duty-free. Upon CETA’s entry into force, the E.U. removed tariffs on 98% of its tariff lines. Once CETA is fully implemented, the E.U. will have eliminated tariffs on 99% of its tariff lines.
Since 2016, an investigation and subsequent reviews were initiated by the U.S., alleging that Canadian federal and provincial governments provided countervailable subsidies to Canadian softwood lumber producers. It also alleged that Canadian producers were dumping lumber into the U.S. market. This litigation process continues through various channels, including NAFTA, the WTO and the U.S. Court of International Trade (CIT). The Government of New Brunswick, the Government of Canada (GOC) and other affected provinces and the Canadian lumber industry continue to participate in various reviews required by the U.S. government and challenge these duties through different appeals channels.
7
Exhibit “99.10” Current Province of New Brunswick Description
SUMMARY OF ECONOMIC AND FINANCIAL INFORMATION FOR NEW BRUNSWICK
The following summary information is qualified in its entirety by the information contained herein:
THE ECONOMY
Summary
Year Ended December 31,
CAGR1%
2017
2018
2019
2020
2021
2017-2021
(In millions of dollars unless otherwise indicated)
Economy
Gross domestic product (current dollars)
35,828
37,158
38,057
37,445
42,608
4.4
%
Primary household income
23,932
24,578
25,243
25,020
27,187
3.2
%
Retail trade
12,791
13,003
13,278
13,420
15,117
4.3
%
Manufacturing sales
18,728
18,490
18,413
15,174
20,864
2.7
%
Foreign commodity exports
12,856
12,615
13,090
10,307
14,749
3.5
%
Population (July 1st; thousands)
766.6
770.3
777.1
783.0
790.4
0.9
%
Employment (thousands)
356.3
358.4
361.1
351.6
360.5
0.3
%
Unemployment rate
8.2
%
8.0
%
8.1
%
10.0
%
9.0
%
--
Consumer price index (% change)
2.3
%
2.1
%
1.7
%
0.2
%
3.8
%
--
Gross domestic product (real; % change)
2.5
%
1.2
%
1.3
%
-2.7
%
5.9
%
--
Source Statistics Canada: numbers are subject to adjustment
1Compound annual growth rate
Economic Update - 2022 Year-to-Date (as of Dec. 09, 2022)
New Brunswick’s economy has continued to grow in 2022, albeit at a slower pace than in 2021. The sharp acceleration experienced would be difficult to sustain, given the special circumstances brought about by the COVID-19 pandemic and the winding down of related restrictions in 2021. In New Brunswick, a tight labour market is expected to contribute to slower growth of 2.2% in 2022, down from 5.9% in 2021.
Employment was up by 2.3% (+8,300 jobs) at the end of the first eleven months of 2022, compared to the same period in 2021. The same comparison shows part-time employment decreased by 8.8% (-4,900 jobs), while full-time positions increased by 4.3% (+13,200 jobs). Average weekly earnings have recorded gains of 8.5% from September 2021 to September 2022. Retail sales saw a 7.8% increase in the first nine months of 2022.
Year-to-date growth in international exports (+33.1%) and manufacturing sales (+34.2%) continued strong. The latest data shows that sales are up for non-durable goods (+41.8%) and durable goods (+5.2%), whereas wood product manufacturing has recorded a decrease of 3.5% for the year-to-date period ending in September. Additionally, the Consumer Price Index (CPI) has expanded by 7.3% YTD in New Brunswick, compared to a growth of 6.9% YTD at the national level. New Brunswick’s housing market has performed well within the first nine months of the year. The market has recorded a 25.4% increase in housing starts, the loss observed in single-detached units (-2.6%) being more than offset by the gain in multiples (+41.6%). From the January-to-October period of 2022, home sales in the province dropped by 18.6% from the same period last year and YTD average prices were up 19.2%. The population is estimated at 812,061 as of July 1st, 2022, a 2.7% increase from last year, the second highest amongst provinces.
8
Exhibit “99.10” Current Province of New Brunswick Description
Developments in 2021 – Summary
As the economy bounced back from pandemic-related restrictions and disruptions in 2021, Canada’s economy grew by 5.0%, a performance mirrored by most provinces. Notably among the provinces and territories, Yukon grew by 10.0% while Saskatchewan was the only province to experience a decline (-0.9%). New Brunswick grew at a rate of 5.9%, in line with neighboring Nova Scotia (+6.2%) and below Prince Edward Island (+7.9%). In nominal terms, the Canadian economy grew 13.6%.
New Brunswick’s growth of 5.9% was driven, among other factors, by gross fixed capital formation’s rise of 7.1% - in turn spurred by a 19.1% growth in residential structures. Also noteworthy were the expansion of household final expenditure (+3.9%), evenly affected by services expenditure (+4.0%) and goods expenditure (+3.8%). General governments final consumption expenditure accelerated by 4.9%. Exports rose by 4.3%, whereas imports registered a more modest upturn of 2.2%. Nominal GDP for the Province increased by 13.8% in 2021.
Of the twenty major industries, eighteen recorded gains, and thirteen of those regained their pre-pandemic level of output. The services-producing industries grew by 5.4%, with the goods-producing industry recording a 7.1% expansion. The most notable performances were recorded by agriculture, forestry, fishing and hunting (+19.7%); professional, scientific and technical services (+11.9%); wholesale trade (+11.7%); and utilities (+10.8%). Contractions were only recorded on the management of companies and enterprises (-27.3%); and arts, entertainment and recreation industries (-0.4%). Transportation and warehousing; and accommodation and food services also recorded strong growth (+7.2% in both industries), although not enough to lift them back to pre-pandemic levels.
2021 saw the number of employed in New Brunswick increase by 8,900 to a total number of 360,500, just short of the pre-pandemic level of 361,100. The increment is due to advances in both full-time (+4,700) and part-time (+4,100) employment. Overall participation rate reached 60.9%, up from 60.4% the year before.
Average weekly earnings registered gains in the service producing industries (+1.2%) which, coupled with a slightly higher increment in the goods producing industries (+2.2%), brought about an overall uptick of 1.4%, compared to a Canadian average of 3.1%.
Growth in consumer demand picked up considerably in 2021 when compared to the previous year, with retail sales growing by 12.6%, an increase of $1.7 billion. All retail subsectors with available data reported higher sales volume. Standing out were furniture and home furnishings stores (+30.9%); gasoline stations (+27.6%); building material and garden equipment and supplies dealers (+21.9%) and motor vehicle and parts dealers (+19.0%). Wholesale trade also recovered by recording an increase of 23.3%, after expanding by 0.7% the year before.
The spike in demand also led to a break in the trend of three consecutive years of decline in manufacturing sales. As a result, manufacturing sales increased by 37.5% to reach $20.8 billion in 2021.Both non-durable (+38.7%) and durable (+32.7%) goods industries recorded sizeable increases.
The upward trend is also noticeable in foreign trade. The $14.7 billion in exports registered in 2021 are 43.1% higher than the previous year. The spike is due to increased demand after the easing of pandemic restrictions as well as higher commodity prices, which also impacted imports to the province, up 47.4% to $13.4 billion. These changes account for a trade surplus of $1.4 billion.
Preliminary estimates from Statistics Canada indicate that capital investment in New Brunswick has increased to $3.9 billion. This was driven by a 6.6% increase in the private sector, which was partly offset by a 5.6% decline in the public sector to an overall effect of a 1.4% gain over the previous year. Despite the increase, capital investment was still 3.9% short of the pre-pandemic level of $4.0 billion.
Following two years of double-digit percentage growth, housing starts increased by 9.9% in 2021 to 3,829 units. Housing activity was on the rise in Fredericton (+15.3%), Moncton (+2.2%) and Saint John (+1.7%).
Inflation as measured by the consumer price index (CPI) accelerated to 3.8% in New Brunswick, compared to a rise of 3.4% in Canada. Transportation (+10.3%) was the main contributor to the hike in the index.
9
Exhibit “99.10” Current Province of New Brunswick Description
Economic Activity
New Brunswick’s nominal GDP was estimated at $42,608 million in 2021, or $ 53,907 per capita. Over the five-year period from 2017 to 2021, the nominal GDP at market prices in New Brunswick grew at an annual rate of 4.4%, slightly higher than the national growth rate of 4.1%. During this same time, the real GDP in New Brunswick increased at a compound annual rate of 1.4%, while the real GDP in Canada grew at a rate of 1.1%.
From 2017 to 2021, the real GDP from the goods-producing industries has increased by 6.7%. Over this time, agriculture, forestry, fishing, and hunting saw a 15.4% increase in growth, while utilities experienced a 15.8% increase. However, mining, quarrying, and oil and gas extraction suffered a loss of 20.4% over the same period.
As for the service-producing industries, overall growth was 5.3% over 2017-2021. This was spurred by wholesale trade (+19.2%); information and cultural industries (+17.1%); professional, scientific and technical services (+14.3%); finance and insurance (+14.1%); and retail trade (+11.1%). The effects of the pandemic are still felt in arts, entertainment and recreation (-24.9%); and accommodation and food services (-19.1%).
As a result of these shifts, the goods-producing sector has increased its share of real GDP to 26.2% in 2021, up from 25.9% in 2017. In the services sector, the largest magnitude increases over this time were recorded in real estate and renting and leasing (+$324.8 million); finance and insurance (+$236.0 million) and health care and social assistance (+$286.0 million).
Over the five years ending in 2021, the gross value of manufacturing sales increased at a compound annual rate of 2.7% (in current prices), while the same measure for foreign exports of commodities increased at a rate of 3.5% (in current prices). Retail trade increased at a 4.3% annual rate during the same period (in current prices).
Primary household income has increased from $23,932 million in 2017 to $27,187 million in 2021, resulting in a compound annual growth rate of 3.2%. On a per capita basis, primary household income increased from $31,218 to $34,397 over the period, growing at a compound annual rate of 2.5%. All measures are in current prices.
10
Exhibit “99.10” Current Province of New Brunswick Description
Selected Economic Indicators
For Year Ended December 31,
CAGR1 %
2017
2018
2019
2020
2021
2017-2021
(In millions of dollars unless otherwise indicated)
Gross domestic product per capita; income-based (dollars)
New Brunswick
46,735
48,238
48,971
47,823
53,907
3.6
%
Canada
58,575
60,318
61,529
58,139
65,651
2.9
%
Retail trade
12,791
13,003
13,278
13,420
15,117
4.3
%
Manufacturing sales
18,728
18,490
18,413
15,174
20,864
2.7
%
Foreign commodity exports
12,856
12,615
13,090
10,307
14,749
3.5
%
Consumer price index (% change)
New Brunswick
2.3
%
2.1
%
1.7
%
0.2
%
3.8
%
--
Canada
1.6
%
2.3
%
1.9
%
0.7
%
3.4
%
--
Unemployment rate
New Brunswick
8.2
%
8.0
%
8.1
%
10.0
%
9.0
%
--
Canada
6.4
%
5.9
%
5.7
%
9.5
%
7.5
%
--
1Compound annual growth rate
Source: Statistics Canada
11
Exhibit “99.10” Current Province of New Brunswick Description
Structure of the Economy
After the COVID-19 pandemic led to one of the deepest economic contractions in New Brunswick in 2020, the provincial economy rebounded strongly in 2021. All sectors in the goods-producing industries experienced growth in 2021, for a total growth of 7.1% across all goods-producing industries. This amounted to the sector increasing its share of total GDP to 26.2% in 2021, up from 25.9% in 2020. In the service-producing industries, total growth was 5.4%. Only two of the subsectors registered declines: arts, entertainment and recreation (-0.4%); and management of companies and enterprises (-27.3%). Among service-producing industries that experienced robust recoveries from the 2020 contraction are professional, scientific and technical services (+11.9%); wholesale trade (+11.7); and health care and social assistance (+9.1%).
The following table shows real GDP by industry in New Brunswick for the years 2017 to 2021, valued in chained 2012 dollars.
Real Gross Domestic Product at basic prices, by Industry
For Year Ended December 31,
CAGR1 %
2017
2018
2019
2020
2021
2017-2021
(In millions of chained 2012 dollars)
Goods-producing industries
Agriculture, forestry, fishing and hunting
1,022.8
950.2
1,061.7
986.4
1180.3
4.6
%
Mining, quarrying, and oil and gas extraction
400.5
369.6
335.4
314.7
318.7
0.3
%
Utilities
1,153.6
1,165.7
1,307.4
1,205.5
1,336.0
2.6
%
Construction
2,152.7
2,312.0
2,076.4
2,169.9
2,261.1
1.0
%
Manufacturing
3,029.3
2,995.5
3,067.9
3,041.3
3,180.2
1.1
%
Total goods-producing Industries
7,841.3
7,867.8
7,927.6
7,813.6
8,367.2
1.7
%
Service-producing Industries
Wholesale trade
1,023.4
1,035.8
1,102.1
1,091.8
1,219.5
2.8
%
Retail trade
1,924.5
1,960.6
2,012.1
2,024.9
2,137.5
1.4
%
Transportation and warehousing
1,581.3
1,492.2
1,461.6
1,338.8
1,435.2
1.8
%
Information and cultural industries
872.4
936.9
992.2
999.7
1,021.8
0.5
%
Finance and insurance
1,675.8
1,703.4
1,745.0
1,847.5
1,911.8
0.9
%
Real estate and renting and leasing
3,847.7
3,933.4
3,979.6
4,023.9
4,172.5
0.9
%
Professional, scientific and technical services
964.0
1,016.4
1,049.5
985.0
1,102.3
2.9
%
Management of companies and enterprises
109.5
89.1
72.1
47.7
34.7
-7.6
%
Administrative and support, waste management and remediation services
1,104.7
1,079.0
1,029.6
892.7
904.8
0.3
%
Educational services
1,819.0
1,860.1
1,892.6
1,837.3
1,924.7
1.2
%
Health care and social assistance
2,816.0
2,894.7
2,961.1
2,843.4
3,102.0
2.2
%
Arts, entertainment and recreation
160.1
165.2
172.2
120.8
120.3
-0.1
%
Accommodation and food services
643.4
650.8
665.5
485.4
520.3
1.8
%
Other services (except public administration)
580.3
600.5
598.4
525.9
545.9
0.9
%
Public administration
3,305.5
3,383.5
3,420.4
3,377.9
3,508.0
0.9
%
Total service-producing Industries
22,430.1
22,800.6
23,139.6
22,397.8
23,610.1
1.3
%
Total gross domestic product
30,243.0
30,645.4
31,046.5
30,181.2
31,937.1
1.4
%
Source: Statistics Canada
Totals may not add up due to the adoption of the chain Fisher deflation methodology.
1 Compound Annual Growth Rate
12
Exhibit “99.10” Current Province of New Brunswick Description
Labour Force
Recovery after the pandemic led to employment in New Brunswick increasing by 2.5% between 2020 and 2021, to 360,500 workers. Gains were recorded in both part-time employment (+7.9%, +4,100 jobs) and full-time employment (+1.6%, +4,700 jobs). Despite overall results, however, the goods producing industries showed a loss of 1,500 jobs in 2021, a 2.1% drop in the level of employment. Losses were recorded in three of the five main industries in the sector, the exceptions being agriculture (+8.2%, +400 jobs) and utilities (+5.4%, +200 jobs). Losses in the goods-producing sector were offset by a 3.7% expansion in the service-producing sector. Nine of the eleven industries in the sector recorded gains, notably public administration (+10.0%, +2,800 jobs); transportation and warehousing (+8.0%, +1,400 jobs); and educational services (+7.1%, +1,900 jobs). Industries that experienced job losses were information, culture and recreation (-3.9%, -400 jobs); and business, building and other support services (-1.3%, -200 jobs). Nationwide, the recovery meant employment grew 4.8%, with 866,200 jobs being created in 2021.
The unemployment rate in 2021 decreased to 9.0%. The number of unemployed was down by 3,400 individuals to 35,700 in 2021. The unemployment rate for women decreased by 0.7 percentage points to 7.5% while that of men fell from 11.7% in 2020 to 10.5% in 2021. An unemployment rate of 7.5% was recorded at the national level, a decrease of 2.0 percentage points.
Labour Force*
For Year Ended December 31,
2017
2018
2019
2020
2021
(In thousands unless otherwise indicated)
Population 15 years and over
633.2
636.9
642.7
646.9
650.7
Labour force
387.9
389.7
393.0
390.7
396.2
Labour force employed
356.3
358.4
361.1
351.6
360.5
Labour force unemployed
31.7
31.3
31.9
39.1
35.7
Unemployment rate (%)
New Brunswick
8.2
8.0
8.1
10.0
9.0
Canada
6.4
5.9
5.7
9.5
7.5
Participation rate (%)
New Brunswick
61.3
61.2
61.1
60.4
60.9
Canada
65.6
65.3
65.6
64.1
65.1
Source: Statistics Canada
*New Brunswick unless otherwise stated
Employment by Industry
2017
2018
2019
2020
2021
(In thousands unless otherwise indicated)
Goods-producing sector
74.2
75.0
76.2
72.2
70.7
Agriculture
5.2
6.2
5.8
4.9
5.3
Forestry, fishing, mining, quarrying, oil and gas
8.5
9.8
10.2
9.8
9.0
Utilities
3.6
3.3
3.6
3.7
3.9
Construction
24.6
23.5
25.0
24.2
23.5
Manufacturing
32.3
32.2
31.5
29.6
29.0
Services-producing sector
282.1
283.4
285.0
279.4
289.8
Wholesale and retail trade
57.6
54.3
52.1
55.1
56.2
Transportation and warehousing
17.6
18.3
18.9
17.5
18.9
Finance, insurance, real estate and leasing
17.5
17.0
16.7
16.3
17.4
Professional, scientific and technical services
15.6
16.4
17.2
17.5
17.9
Business, building and other support services
16.1
16.3
16.3
15.2
15.0
Educational services
26.3
26.8
27.5
26.8
28.7
Health care and social assistance
57.9
60.3
61.0
59.4
59.4
Information, culture and recreation
11.0
11.5
13.1
10.2
9.8
Accommodation and food services
24.2
23.6
21.9
19.9
21.0
Other services (except public administration)
14.9
14.4
14.0
13.7
14.8
Public administration
23.3
24.6
26.2
27.9
30.7
Total
356.3
358.4
361.1
351.6
360.5
Source: Statistics Canada
13
Exhibit “99.10” Current Province of New Brunswick Description
Primary Industries-
Mining
Mineral production in New Brunswick increased 51.4% to $275.2 million in 2021. The expansion, however, was not enough to lift production back to the pre-pandemic level of $450.9 million (2019). The difference is due to mining operations being stopped by Trevali Mining Corporation since March 2020 due to the coronavirus. The expansion recorded in 2021 is mostly attributed to non-metallic minerals production.
Mineral Production
Year Ended December 31,
2017
2018
2019
2020
2021P
(In millions of dollars)
Metallic minerals
181.6
222.3
258.3
-
80.3
Non-metallic minerals
215.3
176
192.6
181.7
194.9
Total
396.9
398.3
450.9
181.7
275.2
Source: Natural Resources Canada
Forestry
Nearly 86% of the land area of New Brunswick is forested and 50% of the forested land is owned by the Province as Crown land, 30% is private woodlots, and 20% is industrial freehold. 98% of Crown land is subject to timber licenses or harvest agreements. In addition to private and industrial landowners, there are 357 forestry and logging companies and 87 support businesses. In 2020, the most recent year with available data, the primary forest sector generated $472.1 million in revenues. About 68% of these revenues were generated by softwood (mainly spruce-fir-jack pine), with hardwood contributing the remaining 32%.
Harvest activities on Crown land generated $74.7 million in Crown royalties for the fiscal year ended March 31, 2022. This represents an 8.4% increase over the previous fiscal year. The Province received $71.2 million of these royalties from the licensee and sub-licensee harvest activities and $3.5 million was forwarded to New Brunswick First Nation Communities in accordance with First Nation Commercial Harvesting Agreements.
The following table sets forth the most recently published estimates of forest production in New Brunswick for the years 2015 through 2020.
Forest Production
Year Ended December 31,
2016
2017
2018
2019
2020
(In thousands of cubic metres)
Logs and bolts
5,302
5,303
5,310
5,300
5,300
Pulpwood
4,007
4,008
4,014
4,005
4,005
Other (industrial roundwood)
0
0
2
0
0
Fuelwood
36
36
36
36
36
Total
9,345
9,347
9,363
9,341
9,341
Source: National Forestry Database
Note: Due to rounding, totals may not always agree.
14
Exhibit “99.10” Current Province of New Brunswick Description
Agriculture
Total farm cash receipts in the Province were $996.9 million in 2021, up 14.8% from the previous year. The result was influenced by a 17.6% expansion in the value of total crop receipts. Total livestock and livestock products receipts were up 8.9%.
The 2021 Census of Agriculture counted 1,851 farms in New Brunswick, down from 2,255 farms (or a 17.9% decline) in the 2016 Census. There were 2,475 farm operators in 2021, a 17.6% decline from 2016, and their average age increased from 55.6 years to 57.0 years over the five-year period. Total farm area in New Brunswick declined 18.0% since 2016 to 685,378 acres in 2021. The average area per farm was 370 acres in 2021, the same average as in 2016.
New Brunswick’s total area of land in tame hay decreased 11.2% from 2016 to 142,738 acres in 2021. Conversely, total acreage in potatoes increased 13.0% from 2016 to 52,259 acres in 2021. The Province continued to rank second in Canada for the total number of maple taps with 3.5 million taps in 2021, up 54.2% from 2.3 million taps in 2016. Tame hay farms accounted for 36.6% of all crop farms in New Brunswick in 2021.
Total cattle measured by number of animals dropped 16.2% in the Province from 2016 to 2021. Total dairy cows decreased by 7.9% from 18,031 animals in 2016 to 16,599 in 2021, and beef cows went from 13,610 animals in 2016 to 11,017 in 2021, a 19.1% drop. Over the same period total pigs increased 16.3%, from 30,715 to 35,717 animals.
Fishing
New Brunswick is one of the country’s largest exporters of fish and seafood products with approximately $1.9 billion in exports sales in 2021, which is up 54.7% from the previous year and a 24.4% increase from the pre-pandemic level of $1.5 billion, the recovery coming after the outbreak of the pandemic presented significant challenges for the industry and drove sales down. Within those products, top exports in 2021 were lobster - valued at $1.2 billion, crab valued at $364.6 million, and salmon valued at $401.4 million. The largest market for the province’s seafood exports continues to be the United States, with sales of $1.6 billion to that country in 2021, or 86.8% of total foreign purchases.
Secondary Industries
Manufacturing
Reported sales of New Brunswick manufacturers rebounded from $15.2 billion in 2020 to $20.9 billion in 2021, a 37.5% increase. Notably, the amount is 13.3% higher than the pre-pandemic figure of $18.4 billion (2019). On the national level, manufacturing sales registered an increase of 17.7% in 2020.
Provincial sales of non-durable goods, which represent 79.9% of total manufacturing sales, expanded by 38.7%, while durable goods increased 32.7% in 2021. New Brunswick’s wood product manufacturing registered an increase of 45.8% from 2020, up to $2.6 billion, the best performance for the subsector in the available time series.
The manufacturing sector had 29,000 employees in 2021, a decrease of 2.0% compared to 2020. Average weekly earnings for the sector grew 2.0% to $1,063.17 in 2021.
The table below sets forth the leading industrial groups in New Brunswick’s manufacturing sector, according to the gross selling value of factory sales, for the years 2017 through 2021.
15
Exhibit “99.10” Current Province of New Brunswick Description
Gross Selling Value of Factory Sales
Year Ended December 31,
CAGR1
2017
2018
2019
2020
2021
2017-2021
Industry
(In millions of dollars)
Non-durable product manufacturing
15,558.3
15,112.6
15,123.7
12,012.7
16,667.1
1.7
%
Durable product manufacturing
3,170.2
3,377.8
3,289.1
3,161.8
4,196.9
7.3
%
Total
18,728.5
18,490.4
18,412.8
15,174.5
20,864.0
2.7
%
1Compound annual growth rate
Source: Statistics Canada
Service Industries
Trade
Retail trade in New Brunswick climbed to $15.1 billion in 2021, an increase of 12.6%, while nationally retail trade saw a 11.8% expansion. Higher provincial sales (in dollar terms) were reported in all subsectors with available data. Notable gains were reported in furniture and home furnishings stores; building material and garden equipment and supplies dealers; motor vehicles and parts dealers; and gasoline stations. Retail trade represents 6.7% of provincial real GDP and in 2021 employed 46,300 people.
Wholesale trade sales grew by 23.3% on a year-over-year basis, following an increase of 0.7% in 2020. Gains were recorded across all subsectors with available data, notably for food, beverage and tobacco merchant wholesalers (+43.0%); and building material and supplies merchant wholesalers (+25.4%). The wholesale trade industry accounts for 3.8% of provincial real GDP and employed 9,900 people.
Provincial employment across both trade industries when combined increased by 2.0% (+1,100 jobs) in 2021. Average weekly earnings in the retail trade industries decreased slightly (-0.2%), while the wholesale trade industries saw an increase (+0.7%).
Transportation and Warehousing
Employment across the transportation and warehousing industry expanded by 1,400 jobs (+8.0%) in 2021 compared to the previous year. Average weekly earnings in this sector decreased by 1.8%. This sector accounts for 4.5% of provincial real GDP.
Port Saint John reported its overall cargo tonnage for 2021 at 28.8 million metric tonnes, representing a 10.9% increase over the previous year figure. Dry bulk exports more than doubled in 2021, driven mainly by an expansion in potash exports to 1.6 million metric tonnes (from 619,230 metric tonnes in 2020) – a 167% increase. Liquid bulk saw a 7.1% expansion in 2021. Port Saint John experienced its second year with zero cruise visits after Transport Canada suspending cruise in Canadian waters in 2020, due to the pandemic. The suspension was lifted in November 2021.
Finance and Real Estate
Employment across the finance, insurance, real estate and leasing industry slightly increased to 17,400 jobs in 2021 compared to 16,300 in 2020. Output from this industry increased by 3.6% in 2021 and now accounts for 19.1% of total provincial real GDP.
Tourism
Employment in the accommodation and food services industry expanded by 5.5% (+1,100 jobs) to 21,000 in 2021, following a 9.1% decrease in 2020. Average weekly earnings in the industry grew by 4.9%. The number of rooms sold by accommodations in 2021 recovered by 43.5% to 1,146,667, with the occupancy rate up from 27% in 2020 to 37% in 2021. Despite the recovery, room sales in 2021 remained below pre-pandemic levels.
Room sales to international travelers increased to 50,723 in 2021, up from 26,157 the previous year, a 93.9% expansion. 673,112 rooms were sold to New Brunswick residents, which accounted for a 28.7% increase over the 523,030 sold the year before.
16
Exhibit “99.10” Current Province of New Brunswick Description
Foreign Trade
Trade
Year Ended December 31,
2017
2018
2019
2020
2021
(In millions of dollars unless otherwise indicated)
Exports of Goods and Services
25,875
26,002
26,556
23,178
29,700
Exports to other countries
14,051
13,849
14,297
11,774
16,481
Exports of goods to other countries
12,681
12,484
12,769
10,520
15,065
Exports of services to other countries
1,370
1,365
1,528
1,254
1,416
Exports to other provinces
11,824
12,153
12,259
11,404
13,219
Exports of goods to other provinces
6,785
7,116
7,421
6,351
8,190
Exports of services to other provinces
5,039
5,037
4,838
5,053
5,029
Ratio of Exports to Nominal GDP
72.20
%
70.00
%
69.80
%
61.90
%
69.70
%
Imports of Goods and Services
31,833
32,462
32,854
29,227
34,576
Imports from other countries
19,292
19,938
20,260
16,571
20,373
Imports of goods from other countries
17,811
18,324
18,560
15,220
18,985
Imports of services from other countries
1,481
1,614
1,700
1,351
1,388
Imports from other provinces
12,541
12,524
12,594
12,656
14,203
Imports of goods from other provinces
4,994
4,853
4,813
5,026
5,936
Imports of services from other provinces
7,547
7,671
7,781
7,630
8,267
Ratio of Imports to Nominal GDP
88.80
%
87.40
%
86.30
%
78.10
%
81.10
%
Trade Balance
-5,958
-6,460
-6,298
-6,049
-4,876
Gross Domestic Product at Market Prices
35,828
37,158
38,057
37,445
42,608
Totals may not add up due to rounding
Source: Statistics Canada
On an economic accounts basis, the overall value of New Brunswick’s total export of goods and services was estimated at $29,700 million in 2021 (in nominal terms), up 28.1% from 2020. International exports as a percentage of nominal GDP was 38.7% in 2021, down from 39.2% in 2017. Nationally, foreign bound exports accounted for approximately 30.9% of Canadian nominal GDP in 2021.
Foreign Exports of Commodities
The U.S. market still accounts for the bulk of the province’s export sales. In 2021, the United States purchased 92.3% of the province’s foreign commodity exports, up from 90.9% in 2020. Basic and industrial chemical, plastic and rubber products reported an increase in its share of total foreign commodity exports to 32.3% in 2021, up 4.7 percentage points from 2020. Energy products accounted for 22.8% of all commodity exports in 2021, down from 23.3% in the previous year. Furthermore, 21.9% of export earnings were due to forestry products and building and packaging materials in 2021, representing a decrease of 1.2 percentage points from 2020.
17
Exhibit “99.10” Current Province of New Brunswick Description
The table below shows foreign exports of commodities from New Brunswick for the years 2017 to 2021. The largest component, basic and industrial chemical, plastic and rubber products, increased at a compound annual rate of 3.9% over that period. Exports of energy products decreased at a compound annual rate of 1.0%, while forestry products and building and packaging materials rose by 8.7%.
Foreign Exports of Commodities
Year Ended December 31,
CAGR1 (%)
2017
2018
2019
2020
2021
2017-2021
(In millions of dollars)
Farm, fish and intermediate food products
619.3
684.2
648.7
547.0
740.0
4.6
%
Energy products
3,495.9
3,316.2
2,930.4
2,403.0
3,355.5
-1.0
%
Metal ores and non-metallic minerals
9.7
54.6
55.4
126.5
39.0
41.6
%
Metal and non-metallic mineral products
334.2
379.3
323.7
170.9
106.1
-24.9
%
Basic and industrial chemical, plastic and rubber products
4,083.8
3,659.6
4,235.3
2,844.0
4,758.9
3.9
%
Forestry products and building and packaging materials
2,314.1
2,527.6
2,480.8
2,379.8
3,232.0
8.7
%
Industrial machinery, equipment and parts
127.7
141.8
168.3
136.8
158.4
5.5
%
Electronic and electrical equipment and parts
59.7
66.4
74.3
70.8
79.9
7.6
%
Motor vehicles and parts
33.7
57.7
56.9
43.0
52.9
11.9
%
Aircraft and other transportation equipment and parts
38.4
24.7
135.5
33.3
26.1
-9.2
%
Consumer goods
1,670.9
1,634.7
1,908.4
1,487.9
2,138.0
6.4
%
Special transactions trade
68.9
67.8
69.7
63.4
61.8
-2.7
%
Total
12,856.3
12,614.5
13,089.8
10,307.0
14,748.6
3.5
%
1Compound annual growth rate
Totals may not add up due to rounding.
Source: Statistics Canada
18
Exhibit “99.10” Current Province of New Brunswick Description
Foreign Imports of Commodities
The table below shows foreign imports of commodities to New Brunswick for the years 2017 to 2021. The largest component, energy products, increased by 60.6% from 2020 to 2021.
Foreign Imports of Commodities
Year Ended December 31,
CAGR1 (%)
2017
2018
2019
2020
2021
2017-2021
(In millions of dollars)
Farm, fish and intermediate food products
514.3
608.9
631.7
478.6
775.2
10.8
%
Energy products
7,457.7
8,911.1
8,304.9
5,823.8
9,351.8
5.8
%
Metal ores and non-metallic minerals
483.0
329.0
210.9
29.5
22.2
-53.7
%
Metal and non-metallic mineral products
222.4
219.0
197.2
178.6
219.4
-0.3
%
Basic and industrial chemical, plastic and rubber products
511.5
652.6
744.9
445.6
629.7
5.3
%
Forestry products and building and packaging materials
379.6
401.1
379.8
368.1
430.9
3.2
%
Industrial machinery, equipment and parts
548.7
581.8
542.5
486.2
478.4
-3.4
%
Electronic and electrical equipment and parts
169.6
186.1
203.4
189.2
173.5
0.6
%
Motor vehicles and parts
426.9
447.3
428.7
385.1
454.8
1.6
%
Aircraft and other transportation equipment and parts
82.6
123.1
108.5
49.8
96.9
4.1
%
Consumer goods
621.3
579.5
607.7
598.0
692.0
2.7
%
Special transactions trade
35.5
31.9
28.6
29.4
33.2
-1.7
%
Total
11,452.9
13,071.4
12,388.8
9,062.0
13,357.9
3.9
%
1Compound annual growth rate
Totals may not add up due to rounding.
Source: Statistics Canada
19
Exhibit “99.10” Current Province of New Brunswick Description
New Investment
Preliminary estimates from Statistics Canada suggest that capital investment in New Brunswick increased to $3.9 billion in 2021, up from $3.8 billion the year before (+1.4%). Investment in the public sector dropped 5.6%, while the private sector was up 6.6%.
Gains in investment were observed in 8 out of 13 sectors with available data, with the largest hikes occurring in information and cultural industries (+$169.6 million); and health care and social assistance (+$47.2 million). The largest drops were recorded only in public administration (-$172.4 million); and agriculture, forestry, fishing and hunting (-$103.1 million).
Spending on machinery and equipment investment (in nominal dollar terms) was up by 0.7% while there was an 1.9% uptick in non-residential construction expenditures.
Residential investment increased by 34.7% in 2021, following a 10.1% expansion in the previous year. Housing starts had another good year, growing 9.9% to reach 3,829 total units in 2021. Multiple-unit starts registered a slight gain of 0.9% while single-detached unit starts expanded by 32.2% in 2021. Activity was up in the three main urban centers, led by Fredericton (+15.3%), followed by Moncton (+2.2%) and Saint John (+1.7%).
Non-residential building construction investment declined by 6.5% in 2021. Increases in institutional and governmental construction (+18.5%); and commercial (+0.6%) were not sufficient to offset the 35.3% decline in industrial construction.
Employment in the construction industry decreased by 2.9% to 23,500 jobs in 2021. The industry now accounts for 7.1% of total provincial GDP, on par with the 2020 share.
20
Exhibit “99.10” Current Province of New Brunswick Description
REVENUE AND EXPENDITURE OF THE PROVINCE
General Information
Under the Constitution Act, 1867 and the Constitution Act, 1982 provincial legislatures are given certain exclusive powers, including the power to impose direct taxation within the provinces to raise revenue for provincial purposes and the power to borrow money on the sole credit of the provinces.
The Financial Administration Act governs the receipt of public money, the disbursement of public funds, the control of expenditures, and the keeping and auditing of public accounts of the Province. All public monies are to be deposited to the credit of the Province and constitute the Consolidated Fund of the Province. Monies necessary for the carrying out of the operations of the provincial government for each fiscal year are voted by the Legislative Assembly, with the exception of those expenditures for which provision has already been made through existing legislative authority. In addition, under the authority of the Financial Administration Act, should the occasion arise when the Legislative Assembly is not in session, the Lieutenant-Governor in Council may order the issue of a special warrant authorizing payment out of the Consolidated Fund for an expenditure required urgently for the public good which was not provided for by the Legislative Assembly. Amounts appropriated under special warrant must be approved at the next session of the Legislative Assembly.
In accordance with the Financial Administration Act and certain other Acts, funds received for a special purpose are to be disbursed for that purpose. Unlike other budgetary accounts, any unspent balance of these funds may be spent in subsequent fiscal years without appropriation by the Legislative Assembly. At March 31, 2022, the balance of unspent special purpose funds was $170.8 million.
Funds may also be considered as Special Operating Agency Funds. Revenue may be generated by the Agencies or from transfers from other budgetary accounts. Any unspent balance of these funds may, with permission from the Treasury Board as per the Financial Administration Act, be carried forward to subsequent fiscal years. At March 31, 2022, the balance of unspent special operating funds approved for carry-over was $89.7 million. All transactions between the Special Operating Agencies and provincial departments are eliminated from the Province's combined statement of revenue and expenditure.
Volume 1 of the public accounts contains the consolidated financial statements of the Province which are subject to audit by the Auditor General. The Auditor General is an official responsible under the provisions of the Auditor General Act for the examination of the accounts of the Province and for reporting thereon annually to the Legislative Assembly. The consolidated financial statements include certain organizations that are accountable to the Legislative Assembly and are included in the Provincial Reporting Entity as described in Note 1(b) and (c) to the consolidated financial statements. The methods by which the various organizations are included in the Province's consolidated financial statements are also outlined in Schedule 26.
Each fiscal year, the Minister of Finance and Treasury Board delivers a budget and the Estimates of Revenue and Expenditure (the "Budget Estimates") to the Legislative Assembly. The Minister of Finance and Treasury Board reports on the status of the budget plan during the year. The Budget Estimates include the revenue and expenditures of some provincially-created Boards, Commissions and Crown corporations, or the net profits of such entities, or the provincial contribution towards the operations of such entities, as well as funds advanced through such entities to various individuals and enterprises in the form of repayable loans and investments.
The following table sets forth information regarding the surplus (deficit) for the four fiscal years ended March 31, 2022 and the Budget Estimates for the fiscal year ending March 31, 2023.
21
Exhibit “99.10” Current Province of New Brunswick Description
Comparative Statement of Surplus (Deficit)
Year Ending March 31
Estimates
BUDGETARY ACCOUNTS
2019
2020
2021
2022
2023
(In thousands of dollars)
Ordinary Account
Revenues
9,248,328
9,450,104
9,918,810
10,901,385
10,779,024
Expenditures
8,820,471
9,030,494
9,197,252
9,760,692
10,265,226
Deficit
427,857
419,610
721,558
1,140,693
513,798
Capital Account
Revenues
34,757
23,291
32,638
47,287
44,415
Expenditures
752,420
548,626
554,805
632,294
746,794
Deficit
(717,663
)
(525,335
)
(522,167
)
(585,007
)
(702,379
)
Special Purpose Account
Revenues
134,338
103,034
83,558
146,114
129,072
Expenditures
127,191
96,288
71,298
114,876
144,609
Surplus (Deficit)
7,147
6,746
12,260
31,238
(15,537
)
Special Operating Agency Account
Revenues
227,574
226,838
163,223
265,762
313,430
Expenditures
220,596
216,196
148,388
234,502
332,494
Surplus
6,978
10,642
14,835
31,260
(19,064
)
Sinking Fund Earnings
195,487
204,712
203,085
208,497
207,700
Accounting Adjustments
Revenue
(143,438
)
(182,814
)
(45,982
)
151,057
(127,591
)
Expenditure
(190,923
)
(103,241
)
(86,373
)
(111,627
)
(127,591
)
Consolidated and Operating Revenue
9,697,046
9,825,165
10,355,332
11,720,102
11,346,050
Consolidated Expenditures
9,729,755
9,788,363
9,885,370
10,630,737
11,361,532
Add: Amortization Expense
496,068
508,573
514,776
539,070
574,574
Less: Gross Investment in Tangible Capital Assets
(671,447
)
(464,492
)
(500,700
)
(560,434
)
(625,281
)
Other Accounting Adjustments
70,027
(56,016
)
47,353
333,434
---
Operating Expense
9,624,403
9,776,428
9,946,799
10,942,807
11,310,825
Contingency Reserve
Surplus (Deficit)
72,643
48,737
408,533
777,295
35,225
Decrease (increase) in Net Debt from Operations
(32,709
)
36,802
469,962
1,089,365
(15,482
)
Changes in Cash Flow
The following table sets forth the changes in cash flow of the Province for the four fiscal years ended March 31, 2022 and the Budget Estimates for the fiscal year ending March 31, 2023.
22
Exhibit “99.10” Current Province of New Brunswick Description
Changes in Cash Flow
Budget
Estimates1
2019
2020
2021
2022
2023
(In millions of dollars)
Operating Transactions
Surplus (Deficit)
72.6
48.7
408.5
777.3
35.2
Non-Cash Items
Amortization of Premiums, Discounts and Issue Expenses
8.6
5.9
(0.1
)
(6.6
)
-
Foreign Exchange Expense
(5.0
)
(7.2
)
(4.9
)
(2.5
)
-
Increase in Provision for Losses
11.3
34.0
27.9
2.5
-
Sinking Fund Earnings
(195.5
)
(204.7
)
(203.1
)
(208.5
)
(207.7
)
Amortization of Tangible Capital Assets
496.1
508.6
514.8
539.1
574.6
Loss on Disposals and Impairments of Tangible Capital Assets
22.8
21.0
46.4
6.3
-
Gain on Restructuring
---
(23.2
)
---
---
-
Actual Losses Due to Foreign Exchange
1.9
4.1
2.9
0.6
-
Increase in Net Pension Liability
27.5
20.6
35.1
4.2
-
(Decrease) increase in Deferred Revenue
89.0
(1.6
)
22.2
56.9
-
Increase in Working Capital
(2.4
)
(99.5
)
31.1
(14.3
)
-
Net Cash From Operating Activities
526.9
306.7
880.8
1,155.0
402.1
Investing Transactions
Decrease (increase) in Investments, Loans and Advances
(54.7
)
56.7
(46.6
)
(396.8
)
(79.8
)
Non-Cash Adjustment in Investing Activities
19.2
(66.8
)
37.1
329.0
-
Net Cash Used In Investing Activities
(35.5
)
(10.1
)
(9.5
)
(67.8
)
(79.8
)
Capital Transactions
Purchase of Capital Assets
(671.4
)
(464.5
)
(500.7
)
(560.4
)
(625.3
)
Financing Transactions
Net Proceeds from Issuance of Funded Debt
1,521.1
1,319.4
1,361.2
806.7
-
Received from Sinking Fund for Redemption of Debentures and Payment of Exchange
---
---
48.9
---
-
Increase (decrease) in Obligations Under Capital Leases
(44.1
)
(44.7
)
(48.6
)
(47.3
)
-
Sinking Fund Installments
(162.4
)
(176.2
)
(190.5
)
(177.3
)
-
Short term borrowing
(103.2
)
(408.5
)
(147.9
)
(200.6
)
Funded Debt Matured
(691.8
)
(858.3
)
(1,337.9
)
(706.8
)
-
Net Cash (Used in) From Financing Activities
519.6
(168.3
)
(314.8
)
(325.3
)
---
Increase (decrease) in Cash Position during Year
339.6
(336.2
)
55.8
201.5
(303.0
)
Cash Position – Beginning of Year
2,970.1
3,309.7
2,973.5
3,029.3
3,230.8
Cash Position – End of Year
3,309.7
2,973.5
3,029.3
3,230.8
2,927.8
Cash Represented by
Cash and Short term Investments
3,309.7
2,973.5
3,029.3
3,230.8
2,927.8
1 The Budget Estimates do not include estimates of total borrowing requirements of the Province. For information with respect to financial requirements of the Province and with respect to maturing debt of the Province, see Financing-Financial Requirements” and “Financing-Funded Debt Maturity Schedule”, respectively.
(-) Denotes no estimate provided.
23
Exhibit “99.10” Current Province of New Brunswick Description
2021-2022 Budget Estimates
For the fiscal year ended March 31, 2022, there was a surplus of $777.3 million. This represents an improvement of $1,022.1 million from the budgeted deficit of $244.8 million. Operating revenues were $11,390.8 million, $1,010.2 million higher than the budgeted amount of $10,380.6 million. Revenues were up mainly due to higher than budgeted taxation revenue, mostly attributable to Harmonized Sales Tax, Personal Income Tax and Corporate Income Tax sources. Operating expenses were $10,613.5 million, $11.9 million lower than the budgeted amount of $10,625.4 million. Expenses were down mainly due to lower than budgeted expenses in Central Government and Economic Development. This was partially offset by higher expenditures in Health. Net debt decreased by $1,089.5 million for the year compared to the budgeted increase of $240.8 million.
Major Sources of Ordinary Account Revenue for 2022-2023
The major sources of ordinary account revenue for the Province are payments from the federal government, consumption taxes and income taxes. For the fiscal year ending March 31, 2023, the Province’s revenue is budgeted at $10,779.0 million, projecting a decrease of 1.1% from the fiscal year ended March 31, 2022. Overall, this represents a projected decrease of $122.4 million in revenue. The principal factors that have decreased revenue are Miscellaneous revenues ($103.9 million), Corporate Income Taxes ($36.4 million), Government Business Enterprises revenue ($35.1 million) and Consumption Taxes ($25.5 million), partially offset by increased Federal Government Payments ($71.3 million).
The following table shows the percentage sources of ordinary account revenue beginning with fiscal year ended March 31, 2019 through to the Budget Estimates for the fiscal year ending March 31, 2023.
Ordinary Account Revenue Sources
Year Ending March 31,
Budget Estimates
CAGR1
2019
2020
2021
2022
2023
2019-2023
(%)
Taxes
Personal Income
19.3
20.0
18.5
17.8
18.1
2.3
Corporate Income
5.1
3.8
3.8
5.0
4.7
2.2
Consumption
20.1
20.2
19.2
20.9
20.9
4.9
Property
5.9
6.0
6.0
5.7
5.7
3.0
Miscellaneous
0.8
0.9
1.0
0.9
0.9
6.1
Total Taxes
51.3
50.9
48.5
50.4
50.5
3.5
Other Revenue
Licenses, Permits and Fees
6.8
6.6
6.1
6.0
6.1
1.0
Federal Government Payments
35.7
36.9
40.5
36.8
37.9
5.5
Government Business Enterprises
3.4
2.9
3.3
4.0
3.7
6.7
Miscellaneous
2.8
2.7
1.6
2.8
1.8
(6.6
)
Total Revenue
100.0
100.0
100.0
100.0
100.0
Total Ordinary Account Revenue (millions of dollars)
9,248.3
9,450.1
9,918.8
10,901.4
10,779.0
3.9
1 Compound annual growth rate
24
Exhibit “99.10” Current Province of New Brunswick Description
Personal and Corporate Income Taxes
Personal Income Taxes
New Brunswick’s provincial personal and corporate income taxes are collected and administered by the federal government under a federal-provincial tax collection agreement.
Effective for the 2021 taxation year, the New Brunswick provincial personal income tax rate on the first tax bracket was reduced from 9.68% to 9.4%, and the Low-Income Tax Reduction threshold increased from $17,630 to $17,840.
The table below shows the New Brunswick provincial personal income tax rates from 2019 to 2021.
2019
2020
2021
9.68%
9.68%
9.40%
on first $42,592
on first $43,401
on first $43,835
14.82% on
14.82% on
14.82% on
$42,592 to $85,184
$43,401 to $86,803
$43,835 to $87,671
16.52% on
16.52% on
16.52% on
$85,184 to $138,491
$86,803 to $141,122
$87,671 to $142,534
17.84% on
17.84% on
17.84% on
$138,491 to $157,778
$141,122 to $160,776
$142,534 to $162,383
20.3% over $157,778
20.3% over $160,776
20.3% over $162,383
Tax brackets and most provincial income tax credit amounts are indexed annually by national CPI.
Corporate Income Taxes
The corporate income tax (“CIT”) is calculated as a percentage of corporate taxable income as defined for federal tax purposes. The current general corporate income tax rate is 14 per cent.
New Brunswick’s small business CIT rate is 2.5 per cent and applies to the first $500,000 of active business income of small Canadian-controlled private corporations. The benefit of this rate is reduced for businesses with capital of more than $10 million and does not apply to those with taxable capital in excess of $15 million.
Capital Taxes
New Brunswick does not apply a capital tax on businesses except for deposit accepting financial institutions. For banks, loan companies and trust companies, New Brunswick applies a capital tax on paid-up capital in excess of $10 million. The Province administers the capital tax on financial institutions. The Financial Corporations Capital Tax is deductible for federal and provincial corporate income tax purposes.
25
Exhibit “99.10” Current Province of New Brunswick Description
The Financial Corporation Capital Tax (FCCT) rate for banks is 5%. The rate for other types of deposit accepting financial institutions is 4%.
Harmonized Sales Tax
Effective April 1, 1997, New Brunswick eliminated its provincial retail sales tax and adopted a harmonized sales tax (“HST”). The HST is a value-added tax composed of the federal goods and services tax (“GST”) and a provincial component. The federal government administers the HST. The tax adopts the federal GST base and therefore applies to all goods and services subject to tax under the federal Excise Tax Act.
The current provincial portion of the HST rate in New Brunswick is 10%. The current joint federal-provincial HST rate in New Brunswick is 15%.
New Brunswick provides an HST credit to help protect low-to-middle income New Brunswickers. A refundable provincial HST credit is provided in the amount of $300 for individuals, $300 for spouse or equivalent, and $100 per child under the age of 19. Single parent families receive a $300 credit for their first child. The full HST credit is provided to New Brunswickers with a family income of less than $35,000 per year. The credit is reduced by two cents for every dollar of income above $35,000 per year. This means that individuals with income of less than $50,000 per year, or a family of two adults and two children with income of less than $75,000 per year could receive some benefit from the HST credit.
Under the HST, businesses receive full input tax credits for tax paid on business purchases. As with the federal GST, the HST provides the same tax-free status for certain goods offered under the GST (e.g. basic groceries). In addition, a number of rebates and credits are available. Books receive a point-of-sale rebate on the 10% provincial portion of the HST.
Gasoline and Motive Fuel Taxes
The current gasoline tax rate is 10.87 cents per litre and the motive fuel tax (diesel) rate is 15.45 cents per litre. The tax rates for other taxable fuels are as follows: 2.5 cents per litre on aviation fuel; 4.3 cents per litre on locomotive fuel; and, 6.7 cents per litre on propane.
Carbon Tax
Effective April 1, 2020, the New Brunswick carbon tax was implemented, replacing the federally-imposed carbon tax under the federal backstop. The made-in-New Brunswick approach applies to 20 separate fuels, and carbon tax rates are set in accordance with the federal schedule.
Beginning April 1, 2021, the tax on carbon emitting products was increased from $30 per tonne to $40 per tonne, resulting in a carbon charge on gasoline of 8.84 cents per litre and 10.73 cents per litre on diesel.
Tobacco Tax
Tobacco taxes are an important tool that governments can use to help discourage smoking and pay for the additional costs smoking imposes on the health care system.
The tobacco tax is 25.52 cents per cigarette or gram of loose or fine cut tobacco.
The tax rate that is applied to cigars is 75% of the normal retail price.
26
Exhibit “99.10” Current Province of New Brunswick Description
Cannabis Duty Rate
The federal government legalized the sale of cannabis, dried cannabis, cannabis oils, plants and seeds, effective October 17, 2018. On October 17, 2019, the sale of cannabis extracts, topicals and edibles was also legalized for sale beginning in December 2019.
In December 2017, FPT finance ministers agreed in principle to a coordinated cannabis duty, for an initial two-year period, which will be administered and collected by the federal government. In late-June 2018 New Brunswick signed its bilateral agreement - Coordinated Cannabis Taxation Agreement (CCTA).
The federal government imposes the “federal cannabis duty rates” at the higher of $1 per gram or 10% of a product price, through a federally administrated coordinated framework for dried cannabis, cannabis plants and seeds. Cannabis edibles, extracts and topicals are taxed at a flat rate of $0.01/milligram of THC (no tax is applied to CBD only products in these categories)
This tax room is shared on the following basis: 75% to provincial and territorial governments; 25% to the federal government.
The Cannabis Taxation Policy Committee (CTPC) will continue to acquire and exchange data going forward and continue to monitor issues, with a view to identify conclusive market trends and provide meaningful policy recommendations on the coordinated cannabis taxation regime. Further review of this regime has been delayed due to the COVID-19 pandemic.
Property Taxes
New Brunswick levies a provincial real property tax of $1.1233 per $100 of assessment on property classified as non-owner-occupied residential housing. The provincial tax rate on property classified as other residential is set at $1.2173 per $100 of assessment. A provincial property tax rate of $0.4115 per $100 assessment is imposed on all owner-occupied residential property not within a municipality or in a former Local Service District (LSD) now located in a rural community. Non-residential property is subject to a provincial rate of $2.1860 per $100 of assessment. In addition to the residential and non-residential property tax rates, the Province applies a cost of assessment levy of 1.94 cents per $100 of assessment.
Municipal/local taxes are imposed to defray the cost of providing local services that are not provided by the Province. In the case of incorporated municipalities, municipal taxes are collected by the Province and are remitted back to the municipality. In unincorporated areas, the local tax is collected and retained by the Province, as the Province provides and pays for the provision of local services. On behalf of the Residential Tenancies Tribunal under the Residential Tenancies Act, a fee of 4.86 cents per $100 of assessment is also imposed on residential property that is not owner-occupied and is not exempt under the Assessment Act.
The real property transfer tax is a one-time payment on the purchase of a property when the deed is registered. The real property transfer tax rate is 1% and applies to the greater of the sale price or assessed value of the property.
Federal-Provincial Fiscal Arrangements
Fiscal Equalization Payments
New Brunswick is one of five provinces to receive fiscal equalization payments from the federal government. The Equalization Program assists provinces in providing reasonably comparable levels of public services at reasonably comparable levels of taxation. New Brunswick's equalization payment for the fiscal year ended March 31, 2021 was $2,210.3 million and for the fiscal year ended March 31, 2022 was $2,274.4 million. Fiscal equalization payments accounted for 22.3% of total ordinary revenue for the fiscal year ended March 31, 2021 and 20.9% of the total ordinary revenue for the fiscal year ended March 31, 2022.
27
Exhibit “99.10” Current Province of New Brunswick Description
Canada Health Transfer (“CHT”) and Canada Social Transfer (“CST”)
In 2021-2022 the federal government provided annual funding through the CHT and CST in support of health care, post-secondary education, social assistance and services, early childhood development, and early learning and child care to provinces and territories. For the fiscal year ended March 31, 2021, major health and social transfers totaled $1,168.8 million which accounted for 11.8% of total ordinary revenue. For the fiscal year ended March 31, 2022, major health and social transfers totaled $1,291.8 million which accounted for 11.8% of total ordinary revenue. The legislated growth of the total CHT cash envelope grew at 6% annually through 2016-2017. Beginning 2017-2018, the total CHT cash envelope will grow in line with a three -year moving average of nominal GDP, with a 3% floor. The legislated growth of the total CST cash envelope will continue to grow at 3%.
Fiscal Stabilization Program
Under the Fiscal Stabilization Program, the federal government may make unconditional payments to a Province when total revenues of that Province, as per the federal definition, fall short of the previous year’s total due to a downturn in economic activity.
Major Ordinary Account Expenditure
For the fiscal year ended March 31, 2022, the Province's ordinary expenditure was $9,760.7 million, 6% higher than the ordinary expenditure for the fiscal year ended March 31, 2021. The net increase of $563.5 million was due in large part to increased expenditures in Health, Education and Training, Social Development and Transportation and Infrastructure. These increases were partially offset by decreased expenditures in other areas, including Central Government and Service of the Public Debt. The total budget for ordinary account expenditures for the year ending March 31, 2023 is $10,265.2 million.
Ordinary Account Expenditure
Year Ending March 31,
Estimates
Budget
2019
2020
2021
2022
2023
(In millions of dollars)
Central Government
775.7
781.0
839.5
778.2
1,151.6
Economic Development
188.3
181.7
153.4
175.2
192.3
Education and Training
1,925.3
1,997.8
1,998.4
2,146.1
2,272.2
Labour and Employment
144.3
175.7
136.8
147.6
147.4
Social Development
1,322.3
1,358.3
1,367.5
1,459.0
1,546.8
Health
2,972.3
3,086.2
3,189.2
3,512.6
3,455.2
Protection Services
334.9
311.1
340.9
336.0
322.4
Resources
171.0
165.6
187.4
199.8
193.1
Service of the Public Debt
648.3
642.6
646.7
634.5
634.0
Transportation and Infrastructure
338.1
330.5
337.4
371.7
350.2
8,820.5
9,030.5
9,197.2
9,760.7
10,265.2
28
Exhibit “99.10” Current Province of New Brunswick Description
Economic Development
Budgeted Economic Development expenditure of $192.3 million represents 1.9% of the total budgeted expenditure for the fiscal year ending March 31, 2023 and is made up of the Department of Tourism, Heritage and Culture ($68.7 million), Opportunities New Brunswick ($55.1 million), the Regional Development Corporation ($50.6 million), and Consolidated Entities ($17.9 million).
Education and Training
The Province budgeted $2,272.2 million (22.1% of total budgeted expenditure) for the fiscal year ending March 31, 2023 for Education and Training expenditures. This is made up of estimated operating expenditures of elementary and secondary schools totaling $1,572.6 million, budgeted operating grants to universities estimated at $292.1 million, estimated grants to the New Brunswick Community Colleges of $102.5 million and other post-secondary budgeted expenses of $115.1 million, General Government expenditures estimated at $114.3 million, and expenditures of Consolidated Entities estimated at $75.6 million.
Labour and Employment
The Labour and Employment expenditure budget of $147.4 million represents 1.4% of the total budgeted expenditures for the fiscal year ending March 31, 2023. This is made up of estimated operating expenditures related to labour and employment of the Department of Post-Secondary Education, Training and Labour ($146.7 million) and Consolidated Entities ($0.7 million).
Social Development
The total budgeted expenditures in this area for the March 31, 2023 fiscal year are $1,546.8 million (15.1% of total budgeted expenditures). This is made up of programs with the Department of Social Development ($1,467.6 million), a portion of General Government ($4.0 million), and Consolidated Entities ($75.2 million). Programs included in the Department of Social Development are: an income security program, a child welfare and youth services program, funding for individuals in Nursing Homes and Special Care Homes and assistance for individuals and families in the acquisition and/or retention of suitable accommodations.
Health
The total budgeted expenditures in this area for the March 31, 2023 fiscal year are $3,455.2 million, 33.7% of total budgeted expenditure. The Province pays operating expenditures of approved public hospitals to cover the cost of supplying hospital services. The Province also operates a comprehensive medical services payment plan (Medicare), which covers the costs of eligible medical services incurred by registered residents. For the fiscal year ending March 31, 2023, expenditure on health services is estimated at $3,239.4 million for the Department of Health, $83.4 million for a portion of General Government, and $132.4 million for Consolidated Entities.
Protection Services
The Protection Services budgeted expenditure of $322.4 million represents 3.1% of total expenditure budgeted for the fiscal year ending March 31, 2023, and is made up of the Department of Justice and Public Safety ($314.3 million), a portion of General Government ($4.9 million), and Consolidated Entities ($3.2 million).
Resources
Budgeted expenditure for Resources is $193.1 million and represents 1.9% of the total budgeted expenditure for the fiscal year ending March 31, 2023, and is made up of the Department of Agriculture, Aquaculture and Fisheries ($45.5 million), a portion of the Department of Environment and Local Government ($12.9 million), the Department of Natural Resources and Energy Development ($101.7 million), a portion of General Government ($3.3 million), and Consolidated Entities ($29.7 million).
29
Exhibit “99.10” Current Province of New Brunswick Description
Transportation and Infrastructure
The Transportation and Infrastructure services budgeted expenditures of $350.2 million represents 3.4% of the total budgeted expenditure for the fiscal year ending March 31, 2023. The Province budgeted $349.9 million for the planning, design and maintenance of highways and public buildings, and the operation of ferry services and $0.3 million for a portion of General Government.
Central Government
The Central Government expenditure of $1,151.6 million estimated for the fiscal year ending March 31, 2023 represents 11.2% of total budgeted expenditure and is made up of expenditures of the Department of Finance and Treasury Board ($29.8 million), a portion of the Department of Environment and Local Government ($154.8 million), General Government ($844.7 million), other central agencies ($53.3 million), and Consolidated Entities ($69.0 million).
Service of the Public Debt
For the fiscal year ending March 31, 2023, the estimate of $634.0 million for servicing the debt of the Province including interest, foreign exchange, amortization, and other debt management expenditures represents 6.2% of the total budgeted expenditure.
Net Capital Expenditures
The following table shows the gross capital expenditure for the four fiscal years ended March 31, 2022 and the Budget Estimates for the fiscal year ending March 31, 2023. The table also shows the total amount of recoveries through cost-sharing agreements with the federal government.
Net Capital Expenditure
Estimate
2019
2020
2021
2022
2023
(In thousands of dollars)
EXPENDITURES
Bridges
56,221
40,941
23,412
45,076
60,886
Economic and Regional Development
63,352
47,800
38,485
37,242
35,000
Highways
333,918
225,605
276,004
268,140
277,959
Hospitals
107,125
91,347
90,915
108,469
153,199
Maritime Provinces Higher Education
Commission – Capital Grants
2,000
2,000
1,999
2,286
2,000
Other Public Buildings
81,284
56,531
42,545
77,647
92,635
Permanent Parks
9,659
9,452
9,561
10,364
9,020
Schools
79,223
57,836
53,164
63,018
84,710
Vehicles
16,530
14,578
16,246
17,414
22,000
Other
3,108
2,536
2,474
2,638
9,385
752,420
548,626
554,805
632,294
746,794
RECOVERIES
Recoveries from Canada - Highways
25,340
16,846
20,000
39,899
41,815
Other Recoveries
9,417
6,445
12,638
7,388
2,600
34,757
23,291
32,638
47,287
44,415
Net Capital Expenditures
717,663
525,335
522,167
585,007
702,379
30
Exhibit “99.10” Current Province of New Brunswick Description
Special Operating Agencies
Revenue may be generated by the Special Operating Agencies or from transfers from other budgetary accounts. Expenditures are incurred by the agencies in delivering the programs they offer and may be of a capital or operating nature. For the fiscal year ending March 31, 2023, gross revenue is estimated at $313.4 million from the various agencies and expenditures are estimated at $332.5 million.
Loans and Advances
The Province has followed a policy of promoting economic development through the provision of financial assistance to industry. Such assistance has been channeled principally through Opportunities New Brunswick, the Regional Development Corporation, the Department of Social Development, the Department of Agriculture, Aquaculture and Fisheries, and Post-Secondary Education, Training and Labour and may take the form of repayable loans, guarantees of bank loans and bond issues and equity investments. Funds required for repayable loans and advances are appropriated annually by the Legislative Assembly and are included in the Province's annual borrowing requirements. Allowances for amounts for which collection is doubtful are reviewed annually and the net balances of loans and advances less allowances are reflected in the Province's accounts.
Economic Development
The Minister responsible for Opportunities New Brunswick is responsible for assistance provided under the Opportunities New Brunswick Act:
The Opportunities New Brunswick Act authorizes the Minister to provide financial assistance to aid and encourage the establishment or development of industry on such terms and conditions as are specified by the Lieutenant-Governor in Council. At March 31, 2022, loans and guarantees under the Opportunities New Brunswick Act amounted to approximately $184.3 million. The allowance for doubtful accounts on these loans and guarantees amounted to $106.3 million.
The Minister responsible for Regional Development Corporation is responsible for assistance provided under the Regional Development Corporation Act:
The Regional Development Corporation administers and manages agreements between the Province and the Government of Canada as assigned by the Lieutenant-Governor in Council. They provide assistance to the establishment and development of enterprises and institutions, the development of tourism and recreation facilities and assist municipalities and rural communities in planning and developing works or projects of benefit to the general public. At March 31, 2022, the total of loans outstanding was $17.9 million. The allowance for doubtful accounts on these loans totaled $3.5 million.
Agriculture, Aquaculture, and Fisheries
The Minister of Agriculture, Aquiculture and Fisheries is responsible for assistance provided under the Agricultural Development Act and the Fisheries and Aquaculture Development Act:
The Agricultural Development Act provides aid to farmers and farm-related businesses by way of loans, grants and loan guarantees to increase income and employment in rural areas of the Province. At March 31, 2022, loans and guarantees outstanding were $11.4 million. The allowance for doubtful accounts totaled $7.5 million.
The Fisheries and Aquaculture Development Act provides financial assistance mainly by way of direct loans to fishermen to purchase and operate fishing vessels and equipment. At March 31, 2022, loans and guarantees outstanding amounted to $12.9 million. The allowance for doubtful accounts totaled $7.7 million.
31
Exhibit “99.10” Current Province of New Brunswick Description
Social Development
The Department of Social Development carries out the provincial government's housing policies. Loans are issued pursuant to the New Brunswick Housing Act. At March 31, 2022, loans under the New Brunswick Housing Act totaled $41.2 million. The allowance for doubtful accounts on these loans totaled $11.3 million. In accordance with Canadian public sector accounting standards, loans that will be repaid through future provincial appropriations are expensed at the time of issue.
Post-Secondary Education, Training and Labour
The Department of Post-Secondary Education, Training and Labour administers the Student Loan Program which provides financial assistance to New Brunswick residents attending post-secondary institutions. At March 31, 2022, the total of student loans outstanding was $582.4 million. The allowance for doubtful accounts on these loans totaled $157.1 million.
32
Exhibit “99.10” Current Province of New Brunswick Description
FINANCING
Financing Requirements
Net loans and advances, sinking fund installments and the difference between the cash contributions made to the pension funds and the amounts expensed according to the CPA Canada Handbook as well as several other relatively small items are not included in the budget since they are non-budgetary items. Borrowing requirements associated with the budget and the aforementioned items for the fiscal year ended March 31, 2022, were $1,087.0 million and for the fiscal year ending March 31, 2023, are estimated at approximately $1,263.0 million. These amounts include borrowing on behalf of NB Power in the amount of $400 million for the fiscal year ending March 31, 2023, and $300 for the fiscal year ended March 31, 2022.
Non-Public Borrowing
The Province borrows from two non-public sources, the Canada Pension Plan (“CPP”) and the New Brunswick Immigrant Investor Fund (2009) Ltd (“NBIIF”).
The CPP is a compulsory national pension plan in which all provinces other than Quebec participate. Prior to 1998 funds were invested in non-marketable securities issued by participating provinces, provincially guaranteed Crown corporations and the federal government at a rate based on the federal government's long-term public market borrowing costs. Changes to CPP legislation in 1998 allowed for new funds flowing into the CPP to be invested in domestic and foreign equities and for provincial bonds previously issued to the CPP to be rolled over upon maturity on a one-time basis at a cost equal to the respective province’s market rate. At March 31, 2022, New Brunswick had outstanding borrowings from the CPP of $659.6 million.
The NBIIF was established as a Crown corporation under the Department of Business New Brunswick to manage NB’s share of funds from a federal immigrant program. The federal government program was established to attract immigrants to Canada. Under this program potential immigrants may make a financial investment of $800,000 as part of a requirement for attaining Canadian citizenship. The proceeds are divided and distributed among the participating provinces. A federal government condition of the program is that investors receive their principal back after five years. To ensure that this occurred, the NBIIF invested a portion of the money received from investors (collected by the federal government) in five year zero coupon government bonds. The Province of New Brunswick issued bonds directly to the NBIIF to the exact maturity date required. The first bonds were issued in February of 2011. The NBIIF bonds began maturing in September 2015. At March 31, 2022, New Brunswick had outstanding borrowings from NBIIF of $0.0 million.
Public Borrowing
At March 31, 2022, the Province had outstanding long-term borrowings for provincial purposes from non-CPP and NBIIF sources totaling $17,734.5 million through the issue and sale of debentures and notes, such securities being denominated in Canadian dollars, Swiss Franc, Euro and U.S. dollars. Not included in this amount is $4,600.0 million borrowed on behalf of NB Power.
33
Exhibit “99.10” Current Province of New Brunswick Description
Trend and Distribution of Borrowing
The trend and distribution of the amounts and sources of the Province's annual debt financing over the past five fiscal years is shown below.
Funded Debt
Year Ended March 31,
2018
2019
2020
2021
2022
(In millions of dollars)
Canada Pension Plan Liabilities
834.3
834.3
787.4
734.4
659.6
New Brunswick Immigrant Investor Fund (2009) Ltd.
74.2
17.2
1
0
0
Provincial Purpose Public Debt
16,325.00
17,152.40
17,613.70
17,579.80
17,734.50
Advances to NB Power
4,412.30
4,624.00
4,794.70
4,700.80
4,600.00
Total
21,645.80
22,627.90
23,196.80
23,015.00
22,994.10
Growth of Funded Debt for Provincial Purposes
The following tables illustrate the rate of change of the Province's outstanding provincial purpose funded debt and certain ratios relating that growth to economic indicators. The following tables do not include $420 million borrowed during fiscal 2018, $610 million borrowed during fiscal 2019, $600 million borrowed during fiscal 2020, $300 million borrowed during fiscal 2021 and $300 million borrowed during fiscal 2022 on behalf of NB Power.
The Province is required by legislation to pay annually into a sinking fund the Canadian currency equivalent of not less than 1% of all provincial purpose funded debt. Sinking fund installments are invested in approved securities including direct and guaranteed obligations of the Province. Interest earned on such investments is added to the sinking fund and is reinvested in approved securities. At March 31, 2022 the value of the sinking fund applicable to debt issued for provincial purposes amounted to $5,887.7 million. For the fiscal year ended March 31, 2022, earnings on investments held for the repayment of provincial purpose debt amounted to $208.5 million.
Outstanding Net Provincial Purpose Funded Debt1
(In millions of dollars unless otherwise indicated)
At March 31,
Canadian Dollars
US
Dollars
Swiss
Francs
Euro
Total2
Value of Sinking Funds
Net Provincial Purpose Funded Debt
Change over Previous
Year (%)
2018
15,039.7
1,400.0
600.0
17,233.5
4,418.5
12,815.0
3.7
2019
15,482.5
1,150.0
700.0
105.0
18.003.9
4,776.4
13,227.5
3.2
2020
15,580.2
1,150.0
925.0
105.0
18,402.2
5,157.3
13,244.9
0.1
2021
15,541.1
1,100.0
925.0
105.0
18,314.1
5,501.9
12,812.2
-3.3
2022
15,621.0
1,100.0
925.0
105.0
18,394.1
5,887.7
12,506.4
-2.4
34
Exhibit “99.10” Current Province of New Brunswick Description
Comparative Debt Statistics
Year ended March 31,
2018
2019
2020
2021
2022
(In millions of dollars unless otherwise indicated)
Gross domestic product at market prices 3
37,158
38,057
37,445
42,608
46,315
Primary household income 3
24,578
25,243
25,020
27,187
28,954
Total revenue
9,339.0
9,697.1
9,891.9
10,318.2
11,390.8
Net Funded Debt 1, 2
12,815.0
13,227.5
13,244.8
12,812.3
12,506.4
As % of Gross Domestic Product
34.5
%
34.8
%
35.4
%
30.1
%
27.0
%
As % of Household Income (restated)
52.1
%
52.4
%
52.9
%
47.1
%
43.2
%
As % of Ordinary Revenue
137.2
%
136.4
%
133.9
%
124.2
%
109.8
%
1 Debt securities are reported in the currency in which they were originally issued. Some issues have been hedged into Canadian dollars.
2 Debt securities payable in foreign currencies are expressed as the Canadian dollar equivalent at fiscal year-end rates of exchange or, where hedges are in place, at the rates of exchange established by such hedges.
3 2022 value based on NB Department of Finance forecast
35
Exhibit “99.10” Current Province of New Brunswick Description
Provincial Purpose Funded Debt Maturity Schedule
For Securities Outstanding at March 31, 2022
(In millions of dollars1 )
Year ended
Total in
31-Mar
CAD$
USD
CHF
EUR
CAD$2
2023
873.2
600
1,605.0
2024
1,121.2
1,121.2
2025
867.1
867.1
2026
1,019.2
1,019.2
2027
1,000.0
1,000.0
2023-2027
4,880.7
650.0
-
5,612.5
2028-2032
2,566.6
500.0
700.0
4,149.7
2033-2037
1,673.2
100.0
1,806.8
2038-2042
2,107.6
125.0
2,274.6
2043-2047
2,241.7
2,241.7
2048+
1,790.0
105.0
1,947.5
Total Funded Debt
15,259.63
1,100.00
925.00
105.00
18,032.7
CMHC Debentures
23.9
0
23.9
Nursing Home Mortgages
337.5
0
337.5
Total
15,621.03
1,100.00
925.00
105.00
18,394.1
1 Debt securities are shown in currency in which they were issued.
2 Debt securities payable in foreign currencies are expressed as the Canadian dollar equivalent as some of that debt may have been swapped.
From April 1, 2022 to date the Province has borrowed $1,300 million including $400 million on behalf of New Brunswick Power.
36
Exhibit “99.10” Current Province of New Brunswick Description
Unfunded Debt
The Province follows an accrual accounting system, as such, expenditures are allocated to the year in which they were incurred regardless of the date of payment resulting in the establishment of accounts payable and accrued liabilities. Such unfunded debt is not secured by debt instruments.
At March 31, 2022, the Province's unfunded debt was as follows:
At March 31,2022
(In millions of dollars)
Bank Advances and Short-Term Borrowing
800.7
Trust Deposits
220.1
Accounts Payable and Accrued Expenditures
3,437.70
Deferred Revenue
716.1
Total Unfunded Debt
5,174.60
This unfunded debt is partially offset by assets of the Province in the amount of $5,549.5 million, represented by $3,230.8 million of cash and short-term investments, $513.9 million of receivables and advances, $1,560.1 million of taxes receivable, $131.5 million of inventories, and $113.2 million of prepaid and deferred charges.
Contingent Liabilities
The following table summarizes outstanding contingent liabilities at March 31, 2022 with comparable numbers as at March 31, 2021:
2021
2022
Bank Loans
Under Various Acts
17.8
19.7
Less: Provision for Possible Losses
10
9.3
Total Contingent Liabilities
7.8
10.4
Due to the adoption of the definition of the Reporting Entity recommended by PSAB of the CPA Canada Handbook, guarantees associated with the debt of the New Brunswick Municipal Finance Corporation are not included in the previous table. These guarantees are as follows:
At December 31,
(In millions of dollars)
2020
2021
Bonds, Debentures and Notes
New Brunswick Municipal Finance Corporation
938.9
889.5
Accrued Interest
2.5
2.8
Total
941.4
892.3
37
Exhibit “99.10” Current Province of New Brunswick Description
CONSOLIDATION OF NEW BRUNSWICK PUBLIC SECTOR DEBT
Other than the Province, NB Power and the New Brunswick Municipal Finance Corporation, municipalities are the only public sector entities with outstanding debt. Municipalities, with the exception of the City of Saint John, are required to obtain approval from the provincial government before borrowing money for capital expenditures.
Consolidated Funded Debt of the New Brunswick Public Sector
(In millions of dollars)
Province of New Brunswick
Funded Debt
18,394.10
Less: Sinking Funds
5,887.70
12,506.40
Municipalities
Funded Debt
889.5
Total Public Sector Debt
13,395.90
Information in the foregoing table relative to the Province is at March 31, 2022, and information relative to municipalities is the amount outstanding at December 31, 2021. Excluded is $4,099.5 million (net of sinking funds of $500.5 million) borrowed by the Province on behalf of NB Power. This debt is paid out of the operating revenues of NB Power rather than out of provincial revenues.
38
Exhibit “99.10” Current Province of New Brunswick Description
VESTCOR CORPORATION
Formed in July 2016, Vestcor Corp., which owns Vestcor Inc., is an independent private not-for-profit holding company under the Vestcor Act of the New Brunswick Legislature. The organization is jointly owned by the New Brunswick Public Service Pension Plan and the New Brunswick Teacher’s Pension Plan.
On October 1, 2016, under the Vestcor Act, the N.B. Investment Management Corporation was continued as Vestcor Investment Management Corporation, while the operations of the Pension and Employee Benefits Division of the Province of New Brunswick’s Department of Human Resources were transferred to Vestcor Pension Services Corporation. As of January 1, 2018, these two subsidiaries were integrated and form Vestcor Inc.
39
Exhibit “99.10” Current Province of New Brunswick Description
INFORMATION RELATING TO PUBLIC SECTOR PENSION LIABILITIES
CROSS REFERENCE SHEET
Information Relating to Public Sector Pension Liabilities
Statistical Overview(includes Statements of Generation, Sales, Revenue, In Province Generation, Operating Statistics, Earnings Summary, Financial Position Summary, Cash Flow Summary, Finance Costs and Investment Income, Financial Ratios, Other Statistics, Capital Management.)
Page 116-123
Exhibit 99.6
41
Exhibit “99.10” Current Province of New Brunswick Description
FUNDED DEBT OUTSTANDING AS AT 31st MARCH 2022
CROSS REFERENCE SHEET
Information Relating to New Brunswick Funded Debt
Exhibit 99.10– Province of New Brunswick, Canada Excerpt of Volume 2 Supplementary Information Public Accounts for the fiscal year ended 31 March 2022
Funded Debt Outstanding as at 31st March 2022
Pages 36-41
Exhibit 99.9 (unaudited)
42
Exhibit “99.10” Current Province of New Brunswick Description
FOREIGN EXCHANGE
Canada maintains a floating exchange rate for the Canadian dollar to permit the rate to be determined by fundamental market forces without intervention except as required to maintain orderly conditions.
Annual average exchange rates for the U.S. dollar, Euro and Swiss franc in Canada, expressed in Canadian dollars, are shown in the table below for 2017 through 2021.
Annual Average Exchange Rates
2017
2018
2019
2020
2021
U.S. Dollar
1.2986
1.2957
1.3269
1.3415
1.2535
Swiss Franc
1.3189
1.3246
1.3352
1.4294
1.3713
Euro
1.4650
1.5302
1.4856
1.5298
1.4828
Source: Bank of Canada
SOURCES OF INFORMATION
Information included herein which is designated as being taken from a publication of the Province or Canada, or any agency or instrumentality of either, is included herein upon the authority of such publication as an official public document.
All financial information of the Province contained herein was obtained from the annual Budget and Main Estimates, any financial reviews pertaining thereto and the Public Accounts, or was prepared by representatives of the Province of New Brunswick in their official capacities. The information set forth under "Province of New Brunswick", and other than as described in the preceding paragraph, was prepared by representatives of the Province of New Brunswick in their official capacities.
43
We use cookies on this site to provide a more responsive and personalized service. Continuing to browse, clicking I Agree, or closing this banner indicates agreement. See our Cookie Policy for more information.