UNITED STATES
SECURITIES AND EXCHANGE COMMISSION
Washington, D.C. 20549
FORM N-CSR
CERTIFIED SHAREHOLDER REPORT OF REGISTERED
MANAGEMENT INVESTMENT COMPANIES
Investment Company Act file number: | 811-06094 |
| |
Exact name of registrant as specified in charter: | Aberdeen Latin America Equity Fund, Inc. |
| |
Address of principal executive offices: | 1735 Market Street, 32nd Floor Philadelphia, PA 19103 |
| |
| |
Name and address of agent for service: | Ms. Andrea Melia Aberdeen Asset Management Inc. 1735 Market Street, 32nd Floor Philadelphia, PA 19103 |
| |
Registrant’s telephone number, including area code: | 866-839-5205 |
| |
Date of fiscal year end: | December 31 |
| |
Date of reporting period: | June 30, 2012 |
Item 1. Reports to Stockholders.

Closed-end funds have a one-time initial public offering and then are subsequently traded on the secondary market through one of the stock exchanges. The investment return and principal value will fluctuate so that an investor’s shares may be worth more or less than the original cost. Shares of closed-end funds may trade above (a premium) or below (a discount) the net asset value (NAV) of the fund’s portfolio. Past performance does not guarantee future results. Foreign securities are more volatile, harder to price and less liquid than U.S. securities. These risks may be enhanced in emerging market countries. Concentrating investments in a single country, region or industry may subject a fund to greater price volatility and risk of loss than more diverse funds. Investors should consider a fund’s investment objectives, risks, charges and expenses carefully before investing. A copy of the prospectus for Aberdeen Asia-Pacific Income Fund, Inc. and Aberdeen Chile Fund, Inc. and Aberdeen Global Income Fund, Inc. that contains this and other information about the fund may be obtained by calling 866-839-5205. Please read the prospectus carefully before investing. Investing in funds involves risk, including possible loss of principal. Aberdeen Asset Management Inc., 1735 Market Street, 32nd Floor, Philadelphia, PA 19103. NOT FDIC INSURED | NO BANK GUARANTEE | MAY LOSE VALUE
Letter to Shareholders (unaudited)
Dear Shareholder,
We present this Semi-Annual Report which covers the activities of Aberdeen Latin America Equity Fund, Inc. (the “Fund”) for the six-month period ended June 30, 2012. The Fund’s principal investment objective is to seek long-term capital appreciation by investing primarily in Latin American equity securities.
Net Asset Value Performance
For the six-month period ended June 30, 2012, the total return to shareholders of the Fund based on the net asset value (“NAV”) of the Fund was 6.8% versus a return of (0.4)% for the Fund’s benchmark, the MSCI EM Latin America Index.
Share Price Performance
For the six-month period ended June 30, 2012, based on market price, the Fund’s total return was 6.5%, assuming reinvestment of dividends and distributions. The Fund’s share price increased 6.4% over the six months, from $30.10 on December 31, 2011 to $32.03 on June 30, 2012. The Fund’s share price on June 30, 2012 represented a discount of 9.7% to the NAV per share of $35.46 on that date, compared with a discount of 9.4% to the NAV per share of $33.23 on December 31, 2011.
Portfolio Holdings Disclosure
The Fund files its complete schedule of portfolio holdings with the SEC for the first and third quarters of each fiscal year on Form N-Q. The Fund’s Forms N-Q are available on the SEC’s website at http://www.sec.gov and may be reviewed and copied at the SEC’s Public Reference Room in Washington, D.C. Information about the operation of the Public Reference Room may be obtained by calling 1-800-SEC-0330. In addition, the Fund makes the information on Form N-Q available to shareholders on the Fund’s website at www.aberdeenlaq.com or upon request and without charge by calling Investor Relations toll-free at 1-866-839-5205.
Proxy Voting
A description of the policies and procedures that the Fund uses to determine how to vote proxies relating to portfolio securities, and information regarding how the Fund voted proxies relating to portfolio securities during the most recent twelve months ended June 30 is available by August 30 of the relevant year: (i) upon request and without charge by calling Investor Relations toll-free at 1-866-839-5205; and (ii) on the SEC’s website at http://www.sec.gov.
Investor Relations Information
As part of our ongoing commitment to provide information to our shareholders, I invite you to visit the Fund on the web at www.aberdeenlaq.com. From this page, you can view monthly fact sheets, portfolio manager commentary, distribution and performance information, updated daily fact sheets courtesy of Morningstar®, conduct portfolio charting and access other timely data.
Please take a look at Aberdeen’s Closed-End Fund Talk Channel, where you can watch fund manager web casts and view our latest short films. For replays of recent broadcasts or to register for upcoming events, please visit Aberdeen’s Closed-End Fund Talk Channel at www.aberdeen-asset.us/aam.nsf/usClosed/aberdeentv.
Please ensure that you are enrolled in our email services, which feature timely news from our portfolio managers around the world. Enroll today at www.aberdeen-asset.us/aam.nsf/usclosed/email and be among the first to receive the latest closed-end fund news, announcements of upcoming fund manager web casts, films and other information. Please note that Aberdeen does not share our shareholder information with any other organizations.
Please contact us if you have any questions by:
· | Calling toll free at 1-866-839-5205 in the United States; |
| |
· | Emailing InvestorRelations@aberdeen-asset.com; |
| |
· | Visiting Aberdeen Closed-End Fund Center at http://www.aberdeen-asset.us/aam.nsf/usClosed/home |
| |
· | Visiting the Fund at www.aberdeenlaq.com. |
Yours sincerely,

Christian Pittard
President
| Aberdeen Latin America Equity Fund, Inc. | 1 |
Report of the Investment Advisor (unaudited)
Market Review
Latin American equities posted marginal gains during the first half of 2012 and lagged the broader emerging markets asset class. Colombia and Mexico led the region, whereas Brazil was the main laggard. Initially, stockmarkets were supported by abundant liquidity in the global financial system, as well as improving U.S. economic data and corporate earnings. However, the decline in commodity prices during the second quarter pared gains, although sentiment improved towards the end of the period after European leaders agreed to ease conditions for recapitalizing beleaguered Spanish lenders.
The pace of economic activity varied across the region: Mexico benefited from the recovery in exports; Peru was boosted by government stimulus; and Chile’s economy was lifted by manufacturing activity. On the other hand, growth decelerated in Argentina, as well as in Brazil, amid falling exports.
In view of the slowdown in growth, policy intervention increased across the region. Signalling the urgency to support their economies, central banks in Brazil and Chile cut interest rates; in particular, Brazil’s rates hit a record low of 8.5%. The Brazilian government extended tax cuts on consumer goods to aid local manufacturers, while maintaining
an existing 6% tax on short-term foreign loans to stem the real’s appreciation. It will also raise levies on foreign goods to encourage the purchase of more locally-made products and boost domestic demand.
Outlook
Investor sentiment is still extremely dependent on how the market perceives policy decisions. The growing gap between what investors expect governments to do and the unsustainability of these expected measures will likely cause future market turbulence. Given the fluid nature of the Eurozone situation, we remain cautious on the regional economic and market outlook. Any deterioration in the Eurozone debt crisis, in our view, is likely to intensify risk aversion, which could lead to a sell-off in riskier assets such as the Brazilian Real and the Mexican Peso. In Mexico, the recent presidential victory of Enrique Pena Nieto has spurred hopes of fiscal and energy sector reforms, though we believe any political instability incited by the opposition could hamper developments in policymaking. For the most part, however, we believe regional policymakers have the ability to provide economic support through monetary easing.
Aberdeen Asset Managers Limited
Dividend Reinvestment and Direct Stock Purchase Plan
Computershare Trust Company, N.A., the Fund’s transfer agent, sponsors and administers a Dividend Reinvestment and Direct Stock Purchase Plan (the “Plan”), which is available to shareholders.
The Plan allows registered shareholders and first time investors to buy and sell shares and automatically reinvest dividends and capital gains through our transfer agent. This is a cost-effective way to invest in the Fund.
Please note that for both purchases and reinvestment purposes, shares will be purchased in the open market at the current share price and cannot be issued directly by the Fund.
For more information about the Plan and a brochure that includes the terms and conditions of the Plan, please call Computershare at 1-800-647-0584 or visit www.computershare.com/buyaberdeen.
2 | Aberdeen Latin America Equity Fund, Inc. | |
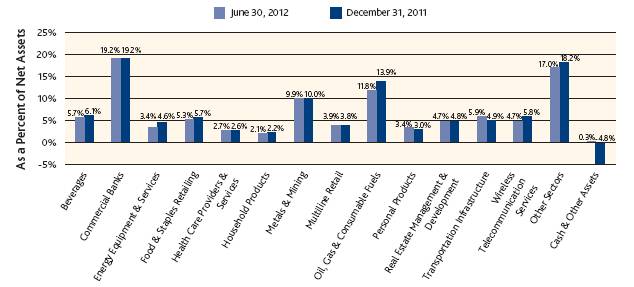
Portfolio Summary (unaudited)
Sector Allocation
Top 10 Holdings, by Issuer (unaudited)
| | Holding | | Sector | | Country | | Percent of Net Assets | |
1. | | Vale S.A., ADR | | Metals & Mining | | Brazil | | 8.8% | |
2. | | Petroleo Brasileiro S.A., ADR | | Oil, Gas & Consumable Fuels | | Brazil | | 7.7% | |
3. | | Banco Bradesco S.A. | | Commercial Banks | | Brazil | | 7.6% | |
4. | | Grupo Financiero Banorte S.A.B. de C.V. | | Commercial Banks | | Mexico | | 4.9% | |
5. | | América Móvil S.A.B. de C.V., Series L | | Wireless Telecommunication Services | | Mexico | | 4.7% | |
6. | | Fomento Economico Mexicano S.A.B. de C.V., ADR | | Beverages | | Mexico | | 4.6% | |
7. | | Itau Unibanco Holding S.A., PN, ADR | | Commercial Banks | | Brazil | | 4.4% | |
8. | | Multiplan Empreendimentos Imobiliarios S.A. | | Real Estate Management & Development | | Brazil | | 4.3% | |
9. | | Ultrapar Participacoes S.A., ADR | | Oil, Gas & Consumable Fuels | | Brazil | | 4.2% | |
10. | | Lojas Renner S.A. | | Multiline Retail | | Brazil | | 3.6% | |
Average Annual Returns (unaudited)
| | 1 Year | | 3 Years | | 5 Years | | 10 Years | |
Net Asset Value (NAV) | | (11.62)% | | 16.44% | | 4.72% | | 21.04% | |
Market Value | | (12.23)% | | 16.31% | | 5.47% | | 22.06% | |
MSCI EM Latin America | | (18.33)% | | 8.88% | | 1.54% | | 20.55% | |
Aberdeen Asset Managers Limited (and its predecessor Aberdeen Asset Management Investment Services Limited) has voluntarily waived fees and/or reimbursed expenses, without which performance would be lower. Waivers and/or reimbursements are subject to change and may be discontinued at any time. Returns represent past performance. Total investment return at net asset value is based on changes in the net asset value of Fund shares and assumes reinvestment of dividends and distributions, if any, at market prices pursuant to the Fund’s dividend reinvestment program. Total investment return at market value is based on changes in the market price at which the Fund’s shares traded on the NYSE MKT during the period and assumes reinvestment of dividends and distributions, if any, at market prices pursuant to the Fund’s dividend reinvestment program. Because the Fund’s shares trade in the stock market based on investor demand, the Fund may trade at a price higher or lower than its NAV. Therefore, returns are calculated based on both market price and NAV. Past performance is no guarantee of future results. The performance information provided does not reflect the deduction of taxes that a shareholder would pay on distributions received from the fund. The current performance of the Fund may be lower or higher than the figures shown. The Fund’s yield, return, market price and NAV will fluctuate. Performance information current to the most recent month-end is available by calling 866-839-5205.
The annualized gross expense ratio is 1.22%. The annualized net expense ratio after fee waivers and/or expense reimbursements is 1.20%.
| Aberdeen Latin America Equity Fund, Inc. | 3 |
Portfolio of Investments (unaudited)
No. of
Shares | | Description | | Value | |
| | | |
EQUITY SECURITIES—99.7% | | | |
ARGENTINA—3.4% | | | |
ENERGY EQUIPMENT & SERVICES—3.4% | | | |
260,000 | | Tenaris S.A., ADR (cost $9,665,225) | | $ 9,092,200 | |
BRAZIL—61.3% | | | |
COMMERCIAL BANKS—12.0% | | | |
1,035,246 | | Banco Bradesco S.A. | | 12,885,810 | |
477,382 | | Banco Bradesco S.A., PN | | 7,116,165 | |
164,300 | | Banco Itaú Holding Financeira S.A., PN | | 2,314,188 | |
665,286 | | Itau Unibanco Holding S.A., PN, ADR | | 9,260,781 | |
| | | | 31,576,944 | |
COMMERCIAL SERVICES & SUPPLIES—1.4% | | | |
244,200 | | Valid Solucoes e Servicos de Seguranca em Meios de Pagamento e Identificacao S.A. | | 3,647,498 | |
DIVERSIFIED FINANCIAL SERVICES—1.1% | | | |
573,563 | | BM&F Bovespa S.A. | | 2,927,070 | |
FOOD PRODUCTS—1.0% | | | |
170,368 | | BRF—Brasil Foods S.A. | | 2,577,786 | |
HEALTH CARE PROVIDERS & SERVICES—2.7% | | | |
286,000 | | Amil Participações S.A. | | 2,862,136 | |
831,000 | | Odontoprev S.A. | | 4,220,164 | |
| | | | 7,082,300 | |
MACHINERY—0.9% | | | |
251,844 | | WEG S.A. | | 2,443,834 | |
MEDIA—0.7% | | | |
177,000 | | Saraiva S.A. Livreiros Editores, PN | | 1,956,385 | |
METALS & MINING—9.9% | | | |
180,800 | | Bradespar S.A., PN | | 2,965,174 | |
1,190,000 | | Vale S.A., ADR | | 23,216,900 | |
| | | | 26,182,074 | |
MULTILINE RETAIL—3.6% | | | |
344,096 | | Lojas Renner S.A. | | 9,653,876 | |
OIL, GAS & CONSUMABLE FUELS—11.8% | | | |
1,118,433 | | Petroleo Brasileiro S.A., ADR | | 20,288,375 | |
484,000 | | Ultrapar Participacoes S.A., ADR | | 10,977,120 | |
| | | | 31,265,495 | |
PERSONAL PRODUCTS—3.4% | | | |
383,000 | | Natura Cosmeticos S.A. | | 8,962,410 | |
REAL ESTATE MANAGEMENT & DEVELOPMENT—4.3% | | | |
460,097 | | Multiplan Empreendimentos Imobiliarios S.A. | | 11,261,324 | |
ROAD & RAIL—1.5% | | | |
261,000 | | Localiza Rent a Car S.A. | | 3,943,913 | |
SOFTWARE—1.1% | | | |
150,000 | | Totvs S.A. | | 2,890,217 | |
SPECIALTY RETAIL—0.9% | | | |
129,000 | | Cia Hering | | 2,447,050 | |
4 | Aberdeen Latin America Equity Fund, Inc. | |
Portfolio of Investments (unaudited) (continued)
No. of
Shares | | Description | | Value | |
| | | |
EQUITY SECURITIES (continued) | | | |
BRAZIL (continued) | | | |
TEXTILES, APPAREL & LUXURY GOODS—1.7% | | | |
294,667 | | Arezzo Industria e Comercio S.A. | | $ 4,386,628 | |
TOBACCO—1.9% | | | |
338,000 | | Souza Cruz S.A. | | 4,961,036 | |
TRANSPORTATION INFRASTRUCTURE—1.4% | | | |
245,400 | | Wilson Sons Limited, BDR | | 3,726,512 | |
| | Total Brazil (cost $121,066,485) | | 161,892,352 | |
CHILE—7.1% | | | |
AIRLINES—0.2% | | | |
23,143 | | Latam Airlines Group S.A. | | 605,438 | |
BEVERAGES—1.1% | | | |
318,000 | | Embotelladora Andina S.A., PNB | | 1,740,030 | |
540,000 | | Viña Concha y Toro S.A. | | 1,056,815 | |
| | | | 2,796,845 | |
CHEMICALS—0.4% | | | |
18,800 | | Sociedad Química y Minera de Chile S.A., PNB | | 1,050,472 | |
COMMERCIAL BANKS—1.3% | | | |
11,421,376 | | Banco de Chile | | 1,603,212 | |
25,113,969 | | Banco Santander Chile | | 1,872,201 | |
| | | | 3,475,413 | |
ELECTRIC UTILITIES—0.5% | | | |
3,780,000 | | Enersis S.A. | | 1,422,775 | |
INDUSTRIAL CONGLOMERATES—0.7% | | | |
18,518 | | Antarchile S.A. | | 288,374 | |
98,000 | | Empresas COPEC S.A. | | 1,447,230 | |
| | | | 1,735,604 | |
IT SERVICES—0.6% | | | |
592,000 | | Sonda S.A. | | 1,663,393 | |
MULTILINE RETAIL—0.3% | | | |
77,000 | | S.A.C.I. Falabella | | 711,952 | |
PAPER & FOREST PRODUCTS—0.4% | | | |
298,570 | | Empresas CMPC S.A. | | 1,186,529 | |
REAL ESTATE MANAGEMENT & DEVELOPMENT—0.5% | | | |
692,000 | | Parque Arauco S.A. | | 1,229,915 | |
WATER UTILITIES—1.1% | | | |
84,144 | | Inversiones Aguas Metropolitanas S.A., ADR(a)(b) | | 2,817,949 | |
| | Total Chile (cost $11,630,400) | | 18,696,285 | |
COLOMBIA—2.3% | | | |
COMMERCIAL BANKS—1.0% | | | |
179,000 | | Bancolombia S.A. | | 2,708,630 | |
FOOD & STAPLES RETAILING—1.3% | | | |
209,901 | | Almacenes Exito S.A. | | 3,477,601 | |
| | Total Colombia (cost $5,171,346) | | 6,186,231 | |
| Aberdeen Latin America Equity Fund, Inc. | 5 |
Portfolio of Investments (unaudited) (continued)
No. of
Shares | | Description | | Value | |
| | | |
EQUITY SECURITIES (continued) | | | |
LATIN AMERICA—0.1% | | | |
VENTURE CAPITAL—0.1% | | | |
2,503,967 | (c) | JPMorgan Latin America Capital Partners, L.P. (cost $917,439)(b)(d)(e)(f)(g) | | $ 158,226 | |
MEXICO—25.4% | | | |
BEVERAGES—4.6% | | | |
136,402 | | Fomento Economico Mexicano S.A.B. de C.V., ADR | | 12,173,879 | |
COMMERCIAL BANKS—4.9% | | | |
2,507,000 | | Grupo Financiero Banorte S.A.B. de C.V. | | 12,956,257 | |
FOOD & STAPLES RETAILING—3.9% | | | |
1,536,000 | | Organización Soriana S.A.B. de C.V.(e) | | 4,824,576 | |
2,091,000 | | Wal-Mart de México S.A.B. de C.V., Series V | | 5,594,413 | |
| | | | 10,418,989 | |
HOUSEHOLD DURABLES—0.7% | | | |
1,799,741 | | Urbi Desarrollos Urbanos S.A.B. de C.V.(e) | | 1,732,323 | |
HOUSEHOLD PRODUCTS—2.1% | | | |
2,793,000 | | Kimberly-Clark de Mexico S.A.B. de C.V. | | 5,470,969 | |
TRANSPORTATION INFRASTRUCTURE—4.5% | | | |
365,000 | | Grupo Aeroportuario del Centro Norte S.A.B. de C.V., ADR | | 5,986,000 | |
74,134 | | Grupo Aeroportuario del Sureste S.A.B. de C.V., ADR | | 5,787,641 | |
| | | | 11,773,641 | |
WIRELESS TELECOMMUNICATION SERVICES—4.7% | | | |
9,566,310 | | América Móvil S.A.B. de C.V., Series L | | 12,506,762 | |
| | Total Mexico (cost $39,585,403) | | 67,032,820 | |
GLOBAL—0.1% | | | |
VENTURE CAPITAL—0.1% | | | |
2,237,292 | (c) | Emerging Markets Ventures l, L.P. (cost $838,407)(b)(d)(e)(f)(g) | | 150,793 | |
| | Total Equity Securities (cost $188,874,705) | | 263,208,907 | |
Principal
Amount
(000’s) | | | |
SHORT-TERM INVESTMENT—0.2% | | | |
UNITED KINGDOM—0.2% | | | |
$622 | | Citibank London, overnight deposit, 0.03%, 07/02/12 (cost $622,000) | | 622,000 | |
| | Total Investments—99.9% (cost $189,496,705) | | 263,830,907 | |
| | Cash and Other Assets in Excess of Liabilities—0.1% | | 275,306 | |
| | Net Assets—100.0% | | $ 264,106,213 | |
(a) | SEC Rule 144A security. Such securities are traded only among “qualified institutional buyers.” |
(b) | Illiquid Security. |
(c) | Represents contributed capital. |
(d) | Restricted security, not readily marketable. |
(e) | Non-income producing security. |
(f) | Security was fair valued as of June 30, 2012. Security is valued at fair value as determined in good faith by, or under the direction of, the Board of Directors (the “Board”) under procedures established by the Board. |
(g) | As of June 30, 2012, the aggregate amount of open commitments for the Fund is $812,869. |
6 | Aberdeen Latin America Equity Fund, Inc. | |
Portfolio of Investments (unaudited) (concluded)
ADR | American Depositary Receipts. |
BDR | Brazilian Depositary Receipts. |
PN | Preferred Shares. |
PNB | Preferred Shares, Class B. |
See Notes to Financial Statements.
| Aberdeen Latin America Equity Fund, Inc. | 7 |
Statement of Assets and Liabilities (unaudited) | | | |
As of June 30, 2012 | | | |
| | | |
| | | |
Assets | | | |
Investments, at value (Cost $189,496,705) | | $263,830,907 | |
Cash (including $753,993 of foreign currencies with a cost of $767,645) | | 500,327 | |
Dividends receivable | | 716,334 | |
Reimbursement receivable and other assets | | 10,000 | |
Prepaid expenses | | 73 | |
Total assets | | 265,057,641 | |
| | | |
Liabilities | | | |
Investment advisory fees payable (Note 3) | | 527,975 | |
Directors’ fees payable | | 41,557 | |
Administration fees payable (Note 3) | | 25,786 | |
Investor Relations fees payable (Note 3) | | 17,697 | |
Chilean repatriation taxes (Note 2) | | 174,039 | |
Accrued expenses and other liabilities | | 164,374 | |
Total liabilities | | 951,428 | |
| | | |
Net Assets | | $264,106,213 | |
| | | |
Net Assets consist of | | | |
Capital stock, $0.001 par value (Note 5) | | $ 7,449 | |
Paid-in capital | | 185,585,048 | |
Distributions in excess of net investment income | | (473,454 | ) |
Accumulated net realized gain on investments and foreign currency related transactions | | 4,666,036 | |
Net unrealized appreciation on investments and foreign currency translation | | 74,321,134 | |
Net Assets applicable to shares outstanding | | $264,106,213 | |
Net asset value per share, based on 7,448,517 shares issued and outstanding | | $ 35.46 | |
| | | |
| | | |
See Notes to Financial Statements. | | | |
| | | |
| | | |
| | | |
| | | |
| | | |
| | | |
| | | |
| | | |
| | | |
| | | |
| | | |
| | | |
| | | |
| | | |
| | | |
| | | |
| | | |
| | | |
| | | |
| | | |
8 | Aberdeen Latin America Equity Fund, Inc. | |
| | | |
| | | |
| | | | | |
Statement of Operations (unaudited) | | | |
For the Six Months Ended June 30, 2012 | | | |
| | | |
| | | |
Investment Income | | | |
| | | |
Income: | | | |
Dividends and other income | | $ 4,327,530 | |
Less: Foreign taxes withheld | | (254,484 | ) |
Total investment income | | 4,073,046 | |
| | | |
Expenses: | | | |
Investment advisory fees (Note 3) | | 1,118,638 | |
Custodian’s fees and expenses | | 99,179 | |
Directors’ fees and expenses | | 86,456 | |
Administration fees (Note 3) | | 80,653 | |
Legal fees and expenses | | 73,086 | |
Investor relations fees and expenses (Note 3) | | 37,231 | |
Insurance expense | | 36,009 | |
Reports to shareholders and proxy solicitation | | 32,629 | |
Independent auditor’s fees and expenses | | 31,740 | |
Transfer agent’s fees and expenses | | 11,748 | |
Miscellaneous | | 22,639 | |
Chilean taxes (Note 2) | | 26,204 | |
Total expenses | | 1,656,212 | |
Less: Fee waivers and reimbursements (Note 3) | | (31,652 | ) |
Net expenses | | 1,624,560 | |
| | | |
Net investment income | | 2,448,486 | |
| | | |
Net Realized and Unrealized Gain/(Loss) on Investments and Foreign Currency Related Transactions | | | |
| | | |
Net realized gain/(loss) on: | | | |
Investment transactions | | 4,454,471 | |
Foreign currency transactions | | (219,132 | ) |
Net change in unrealized appreciation of investments and foreign currency translation (Note 2) | | 10,111,534 | |
Net realized and unrealized gain on investments and foreign currency transactions | | 14,346,873 | |
Net Increase in Net Assets Resulting from Operations | | $16,795,359 | |
| | | |
| | | |
See Notes to Financial Statements. | | | |
| | | |
| | | |
| | | |
| | | |
| | | |
| | | |
| | | |
| | | |
| | | |
| | | |
| | | |
| | | |
| Aberdeen Latin America Equity Fund, Inc. | 9 |
| | | |
| | | |
| | | | | |
Statements of Changes in Net Assets | | | | | |
| | | | | |
| | | | | |
| | For the
Six Months Ended
June 30, 2012
(unaudited) | | For the
Year Ended
December 31, 2011 | |
Increase/(Decrease) in Net Assets | | | | | |
Operations: | | | | | |
Net investment income | | $ 2,448,486 | | $ 5,313,908 | |
Net realized gain on investments and foreign currency related transactions | | 4,235,339 | | 10,000,190 | |
Net change in unrealized appreciation/(depreciation) on investments and foreign currency translations | | 10,111,534 | | (65,479,477 | ) |
Net increase/(decrease) in net assets resulting from operations | | 16,795,359 | | (50,165,379 | ) |
| | | | | |
Dividends and distributions to shareholders from: | | | | | |
Net investment income | | (194,034 | ) | (4,859,636 | ) |
Net realized gain on investments | | – | | (9,942,578 | ) |
Total dividends and distributions to shareholders | | (194,034 | ) | (14,802,214 | ) |
Total increase/(decrease) in net assets | | 16,601,325 | | (64,967,593 | ) |
| | | | | |
Net Assets | | | | | |
Beginning of period | | 247,504,888 | | 312,472,481 | |
End of period* | | $264,106,213 | | $247,504,888 | |
| |
* Includes distributions in excess of net investment income of $(473,454) and $(2,727,906), respectively. | |
| | | | | |
| | | | | |
See Notes to Financial Statements. | | | | | |
| | | | | |
| |
| |
| |
| |
| |
| |
| |
| |
| |
| |
| |
| |
| |
| |
| |
| |
| |
| |
| |
| |
| |
| |
| |
| | | |
10 | Aberdeen Latin America Equity Fund, Inc. | |
| | | |
| | | |
| | | | | | | | | | | |
Financial Highlights
| | For the
Six Months
Ended
June 30, 2012 | | For the Fiscal Years Ended December 31, | |
| | (unaudited) | | 2011 | | 2010 | | 2009 | | 2008 | | 2007 | |
| | | | | | | | | | | | | |
PER SHARE OPERATING PERFORMANCE | | | | | | | | | | | | | |
Net asset value, beginning of period | | $33.23 | | $41.95 | | $43.41 | | $21.26 | | $53.19 | | $46.23 | |
| | | | | | | | | | | | | |
Net investment income(a) | | 0.33 | | 0.71 | | 0.44 | | 0.58 | | 0.55 | | 0.71 | |
Net realized and unrealized gain/(loss) on investments and foreign currency related transactions | | 1.93 | | (7.44 | ) | 8.19 | | 22.54 | | (28.97 | ) | 18.79 | |
| | | | | | | | | | | | | |
Net increase/(decrease) in net assets resulting from operations | | 2.26 | | (6.73 | ) | 8.63 | | 23.12 | | (28.42 | ) | 19.50 | |
Dividends and distributions to shareholders: | | | | | | | | | | | | | |
Net investment income | | (0.03 | ) | (0.65 | ) | (0.47 | ) | (1.00 | ) | (0.45 | ) | (0.76 | ) |
Net realized gain | | – | | (1.34 | ) | (9.62 | ) | – | | (3.15 | ) | (11.79 | ) |
| | | | | | | | | | | | | |
Total dividends and distributions to shareholders | | (0.03 | ) | (1.99 | ) | (10.09 | ) | (1.00 | ) | (3.60 | ) | (12.55 | ) |
| | | | | | | | | | | | | |
Anti-dilutive impact due to capital shares tendered | | – | | – | | – | | 0.03 | | 0.09 | | 0.01 | |
| | | | | | | | | | | | | �� |
Net asset value, end of period | | $35.46 | | $33.23 | | $41.95 | | $43.41 | | $21.26 | | $53.19 | |
| | | | | | | | | | | | | |
Market value, end of period | | $32.03 | | $30.10 | | $38.72 | | $39.42 | | $18.29 | | $47.31 | |
| | | | | | | | | | | | | |
Total Investment Return Based on:(b) | | | | | | | | | | | | | |
Market value | | 6.49% | | (17.47% | ) | 24.75% | | 120.93% | | (54.99% | ) | 42.45% | |
Net asset value | | 6.79% | | (15.90% | ) | 22.74% | | 109.30% | | (53.46% | ) | 50.46% | |
| | | | | | | | | | | | | |
Ratio/Supplementary Data | | | | | | | | | | | | | |
Net assets, end of period (000 omitted) | | $264,106 | | $247,505 | | $312,472 | | $265,101 | | $131,298 | | $335,699 | |
Average net assets (000 omitted) | | $273,030 | | $291,612 | | $268,440 | | $194,682 | | $280,540 | | $353,192 | |
Ratio of expenses to average net assets(c) | | 1.20% | (d) | 1.18% | | 1.35% | | 1.28% | | 1.19% | | 1.14% | |
Ratio of expenses to average net assets, excluding fee waivers(c) | | 1.22% | (d) | 1.18% | | 1.35% | | 1.28% | | 1.20% | | 1.14% | |
Ratio of expenses to average net assets, excluding taxes | | 1.18% | (d) | 1.16% | | 1.27% | | 1.21% | | 1.18% | | 1.11% | |
Ratio of net investment income to average net assets | | 1.80% | (d) | 1.82% | | 1.03% | | 1.84% | | 1.24% | | 1.28% | |
Portfolio turnover rate | | 5.98% | | 11.93% | | 7.52% | | 75.70% | | 16.55% | | 26.33% | |
(a) | Based on average shares outstanding. |
(b) | Total investment return is calculated assuming a purchase of common stock on the first day and a sale on the last day of each reporting period. Dividends and distributions, if any, are assumed, for purposes of this calculation to be reinvested at prices obtained under the Fund’s dividend reinvestment plan. Total investment return does not reflect brokerage commissions. |
(c) | Ratios reflect actual expenses incurred by the Fund. Amounts are net of fee waivers and inclusive of Chilean taxes. |
(d) | Annualized. |
See Notes to Financial Statements.
| | Aberdeen Latin America Equity Fund, Inc. | 11 |
Notes to Financial Statements (unaudited)
1. Organization
Aberdeen Latin America Equity Fund, Inc. (the “Fund”), formerly The Latin America Equity Fund, Inc., was incorporated in Maryland on April 17, 1990 and commenced investment operations on October 30, 1991. The Fund is registered under the Investment Company Act of 1940, as amended (the “1940 Act”), as a closed-end, non-diversified management investment company. The Fund trades on the NYSE MKT under the ticker symbol “LAQ”.
The Fund seeks long-term capital appreciation by investing primarily in Latin American equity securities.
2. Significant Accounting Policies
The following is a summary of significant accounting policies followed by the Fund in the preparation of its financial statements. The financial statements of the Fund are prepared in accordance with accounting principles generally accepted in the United States of America (“GAAP”). The preparation of financial statements requires management to make estimates and assumptions that affect the reported amounts of assets and liabilities, disclosure of contingent assets and liabilities at the date of the financial statements, and the reported amounts of income and expenses for the period. Actual results could differ from those estimates. The U.S. Dollar is used as both the functional and reporting currency.
(a) Security Valuation:
The Fund is required to value its securities at fair value, which is defined as the price that would be received to sell an asset or paid to transfer a liability in an orderly transaction between market participants at the measurement date.
Securities are valued as of the “Valuation Time.” The Valuation Time is as of the close of regular trading on the New York Stock Exchange (usually 4:00 p.m. Eastern Time). Equity securities are typically valued at the last quoted sale price. If there is no sale price available, the last quoted mean price provided by an independent pricing service approved by the Board of Directors of the Fund (the “Board”) is used. Securities traded on NASDAQ are valued at the NASDAQ official closing price. Prices are typically obtained from the primary market or exchange on which each security trades. Investment companies are valued at net asset value as reported by such company. Securities using this pricing methodology are categorized as Level 1 investments for purposes of ASU 820. The Fund does not adjust the quoted price for Level 1 investments.
Securities listed on a foreign exchange are valued either at fair value (see description below) or at the last sale price at the close of the exchange on which the security is principally traded. Foreign securities,
currencies, and other assets and liabilities denominated in foreign currencies are translated into U.S. Dollars at the exchange rate of said currencies against the U.S. Dollar, as of the Valuation Time, as provided by an independent pricing service approved by the Board.
The Fund’s equity securities that are traded on a foreign exchange or market which closes prior to the Fund’s Valuation Time are fair valued by an independent pricing service. The fair value of each such security generally is calculated by applying a valuation factor provided by the independent pricing service to the last sales price for that security. The Fund receives a factor for each security from a third party pricing provider. If the pricing service is unable to provide a valuation factor for a security, the security will continue to be valued at the last sale price at the close of the exchange on which it is principally traded, subject to adjustment by the Fund’s Pricing Committee, if deemed necessary. When the fair value prices are utilized, the value assigned to the foreign securities may not be the same as quoted or published prices of the securities on their primary markets. These factors are based on inputs such as, depositary receipts, S&P 500 Index/S&P 500 Futures, Nikkei 225 Futures, sector indices/ETFs, exchange rates, and historical opening and closing prices of each security. Securities using this valuation factor are categorized as Level 2 investments.
Securities for which market quotations are not readily available, or for which an independent pricing service does not provide a value or provides a value that does not represent fair value in the judgment of the Fund’s investment adviser or designee, are valued at fair value under procedures approved by the Board. In addition, fair value determinations are required for securities whose value is affected by a “significant” event that materially affects the value of a domestic or foreign security which occurs subsequent to the time of the close of the principal market on which such domestic or foreign security trades and before the Valuation Time (i.e., a “subsequent event”). Typically, this will involve events occurring after the close of a foreign market on which a security trades and before the next Valuation Time.
The Fund also invests in venture capital private placement securities, which are deemed to be restricted securities. These securities are valued at fair value as determined in good faith by, or under the direction of, the Board under procedures established by the Board in the absence of readily ascertainable market values. The Fund’s estimate of fair value assumes a willing buyer and a willing seller neither of whom are acting under the compulsion to buy or sell. Although these securities may be resold in privately negotiated transactions, the prices realized on such sales could differ from the prices originally paid by the Fund or the current carrying values, and the difference could be material. These securities are categorized as Level 3 investments. Level 3 investments have significant unobservable inputs, as they trade infrequently. In
12 | Aberdeen Latin America Equity Fund, Inc. | |
Notes to Financial Statements (unaudited) (continued)
determining the fair value of these investments, management uses the market approach which includes as the primary input the capital balance reported; however, adjustments to the reported capital balance may be made based on various factors, including, but not limited to, the attributes of the interest held, including the rights and obligations, and any restrictions or illiquidity of such interests, and the fair value of these venture capital investments.
For the six months ended June 30, 2012, there have been no changes to the valuation procedures approved by the Board.
The Fund utilizes a three-tier fair value hierarchy to establish a classification of fair value measurements for disclosure purposes. The Level in the fair value hierarchy within which the fair value measurement falls in its entirety is determined based on the lowest level input that is significant to the fair value measurement in its entirety. Inputs refer broadly to the assumptions that market participants would use in pricing the asset or liability, including assumptions about risk, for example, the risk inherent in a particular valuation technique used to measure fair value including such a pricing model and/or the risk inherent in the inputs to the valuation technique. Inputs may be observable or unobservable.
Observable inputs are inputs that reflect the assumptions market participants would use in pricing the asset or liability, which are based on market data obtained from sources independent of the reporting entity. Unobservable inputs are inputs that reflect the reporting entity’s own assumptions about the assumptions market participants would use in pricing the asset or liability developed based on the best information available in the circumstances.
The three-tier hierarchy of inputs is summarized in the three broad Levels listed below.
Level 1 – quoted prices in active markets for identical investments.
Level 2 – other significant observable inputs (including quoted prices for similar securities, interest rates, prepayment speeds, credit risk, etc.).
Level 3 – significant unobservable inputs (including the Fund’s own assumptions in determining the fair value of investments, information provided by the underlying investee companies such as publicly traded prices, financial statements, capital statements).
The inputs or methodology used for valuing securities are not necessarily an indication of the risk associated with investing in those securities.
The following is a summary of the inputs used as of June 30, 2012 in valuing the Fund’s investments carried at value. Refer to the Schedule of Investments for a detailed breakout of the security types:
Investments, at value | | Level 1 | | Level 2 | | Level 3 | | Balance as of
06/30/2012 | |
Airlines | | $605,438 | | $– | | $– | | $605,438 | |
Beverages | | 14,970,724 | | – | | – | | 14,970,724 | |
Chemicals | | 1,050,472 | | – | | – | | 1,050,472 | |
Commercial Banks | | 50,717,244 | | – | | – | | 50,717,244 | |
Commercial Services & Supplies | | 3,647,498 | | – | | – | | 3,647,498 | |
Diversified Financial Services | | 2,927,070 | | – | | – | | 2,927,070 | |
Electric Utilities | | 1,422,775 | | – | | – | | 1,422,775 | |
Energy Equipment & Services | | 9,092,200 | | – | | – | | 9,092,200 | |
Food & Staples Retailing | | 13,896,590 | | – | | – | | 13,896,590 | |
Food Products | | 2,577,786 | | – | | – | | 2,577,786 | |
Health Care Providers & Services | | 7,082,300 | | – | | – | | 7,082,300 | |
Household Durables | | 1,732,323 | | – | | – | | 1,732,323 | |
Household Products | | 5,470,969 | | – | | – | | 5,470,969 | |
Industrial Conglomerates | | 1,735,604 | | – | | – | | 1,735,604 | |
IT Services | | 1,663,393 | | – | | – | | 1,663,393 | |
Machinery | | 2,443,834 | | – | | – | | 2,443,834 | |
Media | | 1,956,385 | | – | | – | | 1,956,385 | |
Metals & Mining | | 26,182,074 | | – | | – | | 26,182,074 | |
Multiline Retail | | 10,365,828 | | – | | – | | 10,365,828 | |
Oil, Gas & Consumable Fuels | | 31,265,495 | | – | | – | | 31,265,495 | |
Paper & Forest Products | | 1,186,529 | | – | | – | | 1,186,529 | |
| Aberdeen Latin America Equity Fund, Inc. | 13 |
Notes to Financial Statements (unaudited) (continued)
Investments, at value | | Level 1 | | Level 2 | | Level 3 | | Balance as of
06/30/2012 | |
Personal Products | | $8,962,410 | | $– | | $– | | $8,962,410 | |
Real Estate Management & Development | | 12,491,239 | | – | | – | | 12,491,239 | |
Road & Rail | | 3,943,913 | | – | | – | | 3,943,913 | |
Software | | 2,890,217 | | – | | – | | 2,890,217 | |
Specialty Retail | | 2,447,050 | | – | | – | | 2,447,050 | |
Textiles, Apparel & Luxury Goods | | 4,386,628 | | – | | – | | 4,386,628 | |
Tobacco | | 4,961,036 | | – | | – | | 4,961,036 | |
Transportation Infrastructure | | 15,500,153 | | – | | – | | 15,500,153 | |
Venture Capital | | – | | – | | 309,019 | | 309,019 | |
Water Utilities | | 2,817,949 | | – | | – | | 2,817,949 | |
Wireless Telecommunication Services | | 12,506,762 | | – | | – | | 12,506,762 | |
Short-Term Investments | | – | | 622,000 | | – | | 622,000 | |
Total | | $262,899,888 | | $622,000 | | $309,019 | | $263,830,907 | |
For movements between the levels within the fair value hierarchy, the Fund has adopted a policy of recognizing transfers at the end of each period. During the six months ended June 30, 2012, there were no transfers between levels and no significant changes to the fair valuation methodologies.
| | Fair Value at
06/30/12 | | Valuation Technique | | Unobservable Inputs | | Range (Weighted Average) | |
Venture Capital | | $309,019 | | Partner Capital Value/Net
Asset Value | | Expenses | | 6.0% – 6.6% (6.3) | |
The significant unobservable inputs used in the fair value measurement of the Fund’s private equity holdings are audited financial statements, expenses incurred from the partnership, interim financial statements, capital call, distributions and publicly traded securities. Significant increases (decreases) in any of those inputs in isolation would result in a significantly lower (higher) fair value measurement.
The following is a reconciliation of investments in which significant unobservable inputs (Level 3) were used in determining value:
| Investments,
at value | | Balance
as of
12/31/2011 | | Accrued
discounts/
premiums | | Realized
gain/(loss) | | Change in
unrealized
appreciation/
(depreciation) | | Purchases | | Sales | | Transfers
into
Level 3 | | Transfers
out of
Level 3 | | Balance
as of
06/30/2012 | |
| Venture Capital | | $322,225 | | $– | | $– | | $(13,206) | | $– | | $– | | $– | | $– | | $309,019 | |
| Total | | $322,225 | | $– | | $– | | $(13,206) | | $– | | $– | | $– | | $– | | $309,019 | |
Change in unrealized appreciation/depreciation relating to Level 3 investments still held at June 30, 2012 is $(13,206).
14 | Aberdeen Latin America Equity Fund, Inc. | |
Notes to Financial Statements (unaudited) (continued)
(b) Short-Term Investment:
The Fund sweeps available cash into a short-term time deposit available through Brown Brothers Harriman & Co. (“BBH & Co.”), the Fund’s custodian. The short-term time deposit is a variable rate account classified as a short-term investment.
(c) Foreign Currency Transactions:
Foreign currency amounts are translated into U.S. Dollars on the following basis:
(i) market value of investment securities, other assets and liabilities at the rate of exchange at the Valuation Time; and
(ii) purchases and sales of investment securities, income and expenses at the relevant rates of exchange prevailing on the respective dates of such transactions.
The Fund does not isolate that portion of gains and losses on investments in equity securities which is due to changes in the foreign exchange rates from that which is due to changes in market prices of equity securities. Accordingly, realized and unrealized foreign currency gains and losses with respect to such securities are included in the reported net realized and unrealized gains and losses on investment transactions balances.
The Fund reports certain foreign currency related transactions and foreign taxes withheld on security transactions as components of realized gains for financial reporting purposes, whereas such foreign currency related transactions are treated as ordinary income for U.S. federal income tax purposes.
Net unrealized currency gains or losses from valuing foreign currency denominated assets and liabilities at period end exchange rates are reflected as a component of net unrealized appreciation/depreciation in value of investments, and translation of other assets and liabilities denominated in foreign currencies.
Net realized foreign exchange gains or losses represent foreign exchange gains and losses from transactions in foreign currencies and forward foreign currency contracts, exchange gains or losses realized between the trade date and settlement date on security transactions, and the difference between the amounts of interest and dividends recorded on the Fund’s books and the U.S. dollar equivalent of the amounts actually received.
Foreign security and currency transactions may involve certain considerations and risks not typically associated with those of domestic origin, including unanticipated movements in the value of the foreign currency relative to the U.S. Dollar. When the U.S. Dollar rises in value against foreign currency, the Fund’s investments denominated in that
currency will lose value because its currency is worth fewer U.S. Dollars; the opposite effect occurs if the U.S. Dollar falls in relative value.
(d) Security Transactions and Investment Income:
Securities transactions are recorded on the trade date. Realized and unrealized gains/(losses) from security and currency transactions are calculated on the identified cost basis. Dividend income is recorded on the ex-dividend date except for certain dividends on foreign securities, which are recorded as soon as the Fund is informed after the ex-dividend date. Interest income is recorded on an accrual basis. Expenses are recorded on an accrual basis.
(e) Distributions:
On an annual basis, the Fund intends to distribute its net realized capital gains, if any, by way of a final distribution to be declared during the calendar quarter ending December 31. Dividends and distributions to shareholders are recorded on the ex-dividend date.
Dividends and distributions to shareholders are determined in accordance with federal income tax regulations, which may differ from GAAP. These differences are primarily due to differing treatments for foreign currencies.
(f) Federal Income Taxes and Foreign Taxes:
The Fund intends to continue to qualify as a “regulated investment company” by complying with the provisions available to certain investment companies, as defined in Subchapter M of the Internal Revenue Code, and to make distributions of net investment income and net realized capital gains sufficient to relieve the Fund from all, or substantially all, federal income taxes. Therefore, no federal income tax provision is required.
Income received by the Fund from sources within Latin America may be subject to withholding and other taxes imposed by such countries. Also, certain Latin American countries impose taxes on funds remitted or repatriated from such countries.
For Chilean securities, the Fund accrues foreign taxes on realized gains as a liability and reduction of realized/unrealized gains in an amount equal to what the Fund would owe if the securities were sold on the valuation date as a liability and reduction of realized/unrealized gains. Taxes on foreign income are recorded when the related income is recorded. For the six months ended June 30, 2012, the Fund incurred $26,204 of such expense.
The Fund recognizes the tax benefits of uncertain tax positions only where the position is ‘‘more likely than not’’ to be sustained assuming examination by tax authorities. Management of the Fund has concluded that there are no significant uncertain tax positions that
| | Aberdeen Latin America Equity Fund, Inc. | 15 |
Notes to Financial Statements (unaudited) (continued)
would require recognition in the financial statements. Since tax authorities can examine previously filed tax returns, the Fund’s U.S. federal tax returns for each of the four years up to the period ended December 31, 2011 are subject to such review.
(g) Partnership Accounting Policy:
The Fund records its pro-rata share of the income/(loss) and capital gains/(losses) allocated from the underlying partnerships and adjusts the cost of the underlying partnerships accordingly. These amounts are included in the Fund’s Statement of Operations.
3. Agreements and Transactions With Affiliates
(a) Investment Adviser and Former Sub-Adviser:
Aberdeen Asset Managers Limited (“AAML”) serves as the Fund’s investment adviser with respect to all investments. AAML is a direct wholly-owned subsidiary of Aberdeen Asset Management PLC. On March 1, 2012, the previous investment adviser, Aberdeen Asset Management Investment Services Limited (“AAMISL”), merged into AAML, which assumed the investment advisory responsibility for the Fund. There was no change to the portfolio management team or the level or nature of the services provided to the Fund as a result of the merger and the same resources available to AAMISL for the management and compliance oversight of the Fund are available to AAML. AAML receives as compensation for its advisory services from the Fund, an annual fee, calculated weekly and paid quarterly, equal to 1.00% of the first $100 million of the Fund’s average weekly market value or net assets (whichever is lower), 0.90% of the next $50 million and 0.80% of amounts above $150 million. AAML has voluntarily agreed to waive a portion of its advisory fee. For the six months ended June 30, 2012, AAML earned $1,118,638 for advisory services, of which AAML waived $5,498. Amounts shown as paid to AAML include amounts paid to AAMISL prior to March 1, 2012.
On December 6, 2011, the Board, including a majority of the Directors that are not deemed “interested persons” (as that term is defined in Section 2(a)(19) of the 1940 Act) of the Fund or the Fund’s investment adviser, voted to terminate the Fund’s sub-advisory agreement with Celfin Capital Servicios Financieros S.A. (“Celfin”), effective February 4, 2012. For its services as the Fund’s sub-adviser with respect to Chilean investments, Celfin was paid a fee out of the advisory fee, calculated weekly and paid quarterly, at an annual rate of 0.10% of the Fund’s average weekly market value or net assets (whichever is lower). For the period from January 1, 2012 to February 4, 2012, Celfin earned $22,055 for sub-advisory services to the Fund.
For the period from January 1, 2012 to February 4, 2012, Celfin did not receive any broker commissions from portfolio transactions executed on behalf of the Fund.
(b) Fund Administration:
BBH & Co. is the U.S. Administrator for the Fund and certain other funds advised by AAML and its affiliates (collectively the “Funds”). The Funds pay BBH & Co. a monthly administration and fund accounting service fee at an annual rate of 0.02% of the Funds’ aggregate assets up to $250 million, 0.015% for the next $250 million and 0.01% in excess of $500 million.
Each Fund pays its pro rata portion of the fee based on its level of assets with a monthly minimum of $2,500. For the six months ended June 30, 2012, BBH & Co. earned $20,252 from the Fund for administrative and fund accounting services.
Celfin Capital S.A. Administradora de Fondos de Capital Extranjero (“AFCE”) serves as the Fund’s Chilean administrator. For its services, AFCE is paid an annual fee by the Fund equal to the greater of 2,000 Unidad de Fomentos (“U.F.s”) (approximately $94,500 at June 30, 2012) or 0.10% of the Fund’s average weekly market value or net assets invested in Chile (whichever is lower) and an annual reimbursement of out-of-pocket expenses not to exceed 500 U.F.s (approximately $23,625 at June 30. 2012). In addition, an accounting fee is also paid to AFCE. For the six months ended June 30, 2012, the administration fees and accounting fees amounted to $55,788 and $4,613, respectively. AAML has agreed to absorb 50% of the fees payable to the Fund’s Chilean administrator in 2012, for the six months ended June 30, 2012 the reimbursement amounted to $26,154.
(c) Investor Relations:
Under the terms of an Investor Relations Services Agreement, Aberdeen Asset Management Inc. (“AAMI”), an affiliate of AAML, provides investor relations services to the Fund and certain other funds.
Pursuant to the terms of the Investor Relations Services Agreement, AAMI provides, among other things, objective and timely information to shareholders based on publicly-available information; provides information efficiently through the use of technology while offering shareholders immediate access to knowledgeable investor relations representatives; develops and maintains effective communications with investment professionals from a wide variety of firms; creates and maintains investor relations communication materials such as fund manager interviews, films and webcasts, published white papers, magazine and articles and other relevant materials discussing the Fund’s investment results, portfolio positioning and outlook; develops and maintains of effective communications with large institutional shareholders; responds to specific shareholder questions; and reports activities and results to the Board and management detailing insight into general shareholder sentiment.
16 | Aberdeen Latin America Equity Fund, Inc. | | |
Notes to Financial Statements (unaudited) (continued)
For the six months ended June 30, 2012, the Fund paid fees of approximately $35,876 for investor relations services. Investor relations fees and expenses in the Statement of Operations include certain out-of-pocket expenses.
(d) Director Purchase Plan:
Fifty percent (50%) of the annual retainer of the Independent Directors is invested in Fund shares and, at the option of each Independent Director, 100% of the annual retainer can be invested in shares of the Fund. During the six months ended June 30, 2012, no shares were purchased pursuant to the Directors compensation plan. As of June 30, 2012, the Directors as a group owned less than 1% of the Fund’s outstanding shares.
4. Investment Transactions
For the six months ended June 30, 2012, Fund purchases and sales of securities, other than short-term investments, were $16,228,764 and $26,648,868, respectively.
5. Capital
The authorized capital stock of the Fund is 100,000,000 shares of common stock, $0.001 par value. As of June 30, 2012, the Fund had 7,448,517 shares issued and outstanding.
On September 1, 2010 the Board of Directors declared the payment of an elective cash distribution to be paid in the amount of $9.282 per share of common stock, on October 29, 2010, to shareholders of record at the close of business on September 14, 2010. As announced, the
distribution was payable in the Fund’s common stock. However, shareholders had the option to request that their distributions be paid in cash in lieu of common stock. The aggregate amount of cash distributions to all shareholders was limited to 10% of the aggregate dollar amount of the total distribution. Because the cash distribution requests exceeded this limit, the Fund pro rated the cash distribution among all shareholders who made such requests. Shareholders who requested cash distributions received $1.46436 per share or 15.78% of the distribution in cash and received the balance in the Fund’s common stock. For purposes of computing the stock portion of the dividend, the common stock distributed was valued at $37.99 per share, which equalled the average closing price of the Fund’s common shares on the NYSE MKT (formerly, the NYSE Amex) on October 21, 2010 and the two preceding trading days. Following the closing of the elective cash distribution the Fund’s number of outstanding shares was 7,448,517.
6. Credit Facility
The Fund is a party to a joint credit facility along with certain other Funds. The current facility matures on November 9, 2012. The Funds agreed to a $10 million committed revolving joint credit facility with BBH & Co. for temporary or emergency purposes. Under the terms of the joint credit facility, the Funds pay an aggregate commitment fee on the average unused amount of the credit facility. In addition, the Funds pay interest on borrowings at the Overnight LIBOR rate plus a spread. For the six months ended June 30, 2012, the Fund had no borrowings under the joint credit facility.
7. Restricted Securities
Certain of the Fund’s investments are restricted as to resale and are valued at fair value as determined in good faith by, or under the direction of, the Board under procedures established by the Board in the absence of readily ascertainable market values.
Security | | Acquisition Date(s) | | Cost | | Fair Value
At 06/30/12 | | Percent of
Net Assets | | Distributions
Received | | Open
Commitments | |
Emerging Markets Ventures l, L.P. | | 01/22/98 – 01/10/06 | | $838,407 | | $150,793 | | 0.06 | | $2,506,031 | | $262,708 | |
JPMorgan Latin America Capital Partners, L.P. | | 04/10/00 – 10/20/09 | | 917,439 | | 158,226 | | 0.06 | | 2,508,571 | | 550,161 | |
Total | | | | $1,755,846 | | $309,019 | | 0.12 | | $5,014,602 | | $812,869 | |
The Fund may incur certain costs in connection with the disposition of the above securities.
| | Aberdeen Latin America Equity Fund, Inc. | 17 |
Notes to Financial Statements (unaudited) (continued)
8. Share Repurchase Program
Effective November 1, 2009, the Board authorized management to make open market purchases from time to time in an amount up to 10% of the Fund’s outstanding shares whenever the Fund’s shares are trading at a discount to net asset value of 12% or more. Open market purchases may also be made within the discretion of management if the discount is less than 12%. The Board has instructed management to report repurchase activity to it regularly, and to post the number of shares repurchased on the Fund’s website on a monthly basis. For the six months ended June 30, 2012, the Fund did not repurchase any shares through this program.
9. Portfolio Investment Risks
(a) Risks Associated with Foreign Securities and Currencies:
Investments in securities of foreign issuers carry certain risks not ordinarily associated with investments in securities of U.S. issuers. Such risks include, among others, currency risk, information risk and political risk. Currency risk results from securities denominated in currencies other than U.S. Dollars that are subject to changes in value due to fluctuations in exchange rates. Information risk arises with respect to foreign securities when key information about foreign issuers may be inaccurate or unavailable. Political risk includes future political and economic developments, and the possible imposition of exchange controls or other foreign governmental laws and restrictions. In addition, with respect to certain countries, there is the possibility of expropriation of assets, confiscatory taxation, political or social instability or diplomatic developments, which could adversely affect investments in those countries. Other risks of investing in foreign securities include liquidity and valuation risks.
Certain countries also may impose substantial restrictions on investments in their capital markets by foreign entities, including restrictions on investments in issuers of industries deemed sensitive to relevant national interests. These factors may limit the investment opportunities available and result in a lack of liquidity and high price volatility with respect to securities of issuers from developing countries.
Some countries require governmental approval for the repatriation of investment income, capital or the proceeds of sales of securities by foreign investors. In addition, if there is deterioration in a country’s balance of payments or for other reasons, a country may impose temporary restrictions on foreign capital remittances abroad. Amounts repatriated prior to the end of specified periods may be subject to taxes as imposed by a foreign country.
(b) Risks Associated with Latin American Markets:
The Latin American securities markets are substantially smaller, less liquid and more volatile than the major securities markets in the United States. A high proportion of the securities of many companies in Latin American countries may be held by a limited number of persons, which may limit the number of securities available for the investment by the Fund. The limited liquidity of Latin American country securities markets may also affect the Fund’s ability to acquire or dispose of securities at the price and time it wishes to do so.
(c) Risks Associated with Restricted Securities:
The Fund, subject to local investment limitations, may invest up to 10% of its assets (at the time of commitment) in illiquid equity securities, including securities of private equity funds (whether in corporate or partnership form) that invest primarily in emerging markets. When investing through another investment fund, the Fund will bear its proportionate share of the expenses incurred by that underlying fund, including management fees. Such securities are expected to be illiquid which may involve a high degree of business and financial risk and may result in substantial losses. Because of the current absence of any liquid trading market for these investments, the Fund may take longer to liquidate these positions than would be the case for publicly traded securities. Although these securities may be resold in privately negotiated transactions, the prices realized on such sales could be substantially less than those originally paid by the Fund or the current carrying values and these differences could be material. Further, companies whose securities are not publicly traded may not be subject to the disclosure and other investor protection requirements applicable to companies whose securities are publicly traded.
(d) Risks Associated with European Markets:
A number of countries in Europe have experienced severe economic and financial difficulties. Many non-governmental issuers, and even certain governments, have defaulted on, or been forced to restructure, their debts; many other issuers have faced difficulties obtaining credit or refinancing existing obligations; financial institutions have in many cases required government or central bank support, have needed to raise capital, and/or have been impaired in their ability to extend credit; and financial markets in Europe and elsewhere have experienced extreme volatility and declines in asset values and liquidity. These difficulties may continue, worsen or spread within and without Europe. Whether or not the Fund invests in securities of issuers located in Europe or with significant exposure to European issuers or countries, these events could negatively affect the value and liquidity of the Fund’s investments.
18 | Aberdeen Latin America Equity Fund, Inc. | | |
Notes to Financial Statements (unaudited) (concluded)
10. Contingencies
In the normal course of business, the Fund may provide general indemnifications pursuant to certain contracts and organizational documents. The Fund’s maximum exposure under these arrangements is dependent on future claims that may be made against the Fund and, therefore, cannot be estimated; however, based on experience, the risk of loss from such claims is considered remote.
11. Tax Information
At June 30, 2012, the identified cost for federal income tax purposes, the gross unrealized appreciation from investments for those securities having an excess of value over cost, the gross unrealized depreciation
from investments for those securities having an excess of cost over value and the net unrealized appreciation from investments were $189,496,705 $89,491,493, $(15,157,291) and $74,334,202, respectively.
12. Subsequent Events
Management has evaluated the need for disclosures and/or adjustments resulting from subsequent events through the date the financial statements were issued. Based on this evaluation, no adjustments were required to the financial statements as of June 30, 2012.
| | Aberdeen Latin America Equity Fund, Inc. | 19 |
Results of Annual General Meeting of Shareholders (unaudited)
The Annual Meeting of Shareholders of the Fund was held on March 22, 2012 at 1735 Market Street, Philadelphia, Pennsylvania. The description of the proposals and number of shares voted at the meeting are as follows:
(1) To re-elect certain directors to the Board of Directors of the Fund:
| | Votes For | | Votes
Withheld | |
Enrique R. Arzac | | 3,664,052 | | 2,181,545 | |
Lawrence J. Fox | | 4,691,746 | | 1,153,851 | |
Directors whose term of office continued beyond this meeting are as follows: James J. Cattano, Steven N. Rappaport, and Martin M. Torino.
Supplemental Information (unaudited)
As described in Note 3, above, AAML now serves as the Fund’s investment adviser. AAMISL, the previous investment adviser, merged into AAML on March 1, 2012. Information regarding the Fund Board’s most approval of the renewal of the investment advisory agreement with AAMISL, which occurred in December 2011, was disclosed in the Fund’s Annual Report for the period ending December 31, 2011. In September 2011, prior to the six-month period covered by this report, the Fund Board had approved the transition of advisory responsibilities from AAMISL to AAML. In light of this prior approval, and in light of the absence of any change to the portfolio management team or the nature and level of the services provided to the Fund as a result of the merger, and the fact that the same resources available to AAMISL for the management and compliance oversight of the Fund are available to AAML, the approval of the renewal described in the section titled “Supplemental Information” in the Fund’s Annual Report for the period ending December 31, 2011, was done in the context of the upcoming merger, and the findings with respect to AAMISL apply equally to AAML.
20 | Aberdeen Latin America Equity Fund, Inc. | | |
Corporate Information
Directors | | Chilean Administrator |
Enrique R. Arzac, Chairman | | Celfin Capital Servicios Financieros S.A. |
James J. Cattano | | Apoquindo 3721, Piso 19 |
Lawrence J. Fox | | Santiago, Chile |
Steven N. Rappaport | | |
Martin M. Torino | | Shareholder Servicing Agent |
| | Computershare Trust Company, N.A. |
Officers | | 250 Royall Street |
Christian Pittard, President | | Canton, MA 02021 |
Jeffrey Cotton, Vice President and Chief Compliance Officer | | |
Andrea Melia, Treasurer and Chief Financial Officer | | Independent Registered Public Accounting Firm |
Megan Kennedy, Vice President and Secretary | | PricewaterhouseCoopers LLP |
Alan Goodson, Vice President | | 300 Madison Avenue |
Joanne Irvine, Vice President | | New York, NY 10017 |
Devan Kaloo, Vice President | | |
Jennifer Nichols, Vice President | | Legal Counsel |
Nick Robinson, Vice President | | Willkie Farr & Gallagher LLP |
Lucia Sitar, Vice President | | 787 Seventh Avenue |
Hugh Young, Vice President | | New York, NY 10019 |
Sharon Ferrari, Assistant Treasurer | | |
Heather Hasson, Assistant Secretary | | Independent Director Legal Counsel |
| | Goodwin Proctor LLP |
Investment Adviser | | 901 New York Avenue |
Aberdeen Asset Managers Limited | | Washington, DC 20001 |
Bow Bells House | | |
1 Bread Street | | Investor Relations |
London, United Kingdom | | Aberdeen Asset Management Inc. |
EC4M 9HH | | 1735 Market Street, 32nd Floor |
| | Philadelphia, PA 19103 |
U.S. Administrator & Custodian | | 1-866-839-5205 |
Brown Brothers Harriman & Co. | | InvestorRelations@aberdeen-asset.com |
40 Water Street | | |
Boston, MA 02109 | | |

Aberdeen Asset Managers Limited
The accompanying Financial Statements as of June 30, 2012, were not audited and accordingly, no opinion is expressed thereon.
Notice is hereby given in accordance with Section 23(c) of the Investment Company Act of 1940 that the Fund may purchase, from time to time, shares of its common stock in the open market.
Shares of Aberdeen Latin America Equity Fund, Inc. are traded on the NYSE MKT Exchange under the symbol “LAQ”. Information about the Fund’s net asset value and market price is available at www.aberdeenlaq.com.
This report, including the financial information herein, is transmitted to the shareholders of Aberdeen Latin America Equity Fund, Inc. for their general information only. It does not have regard to the specific investment objectives, financial situation and the particular needs of any specific person. Past performance is no guarantee of future returns.

Item 2. Code of Ethics.
This item is inapplicable to semi-annual report on Form N-CSR.
Item 3. Audit Committee Financial Expert.
This item is inapplicable to semi-annual report on Form N-CSR.
Item 4. Principal Accountant Fees and Services.
This item is inapplicable to semi-annual report on Form N-CSR.
Item 5. Audit Committee of Listed Registrants.
This item is inapplicable to semi-annual report on Form N-CSR.
Item 6. Schedule of Investments.
(a) Included as part of the Report to Shareholders filed under Item 1 of this Form N-CSR.
(b) Not applicable.
Item 7. Disclosure of Proxy Voting Policies and Procedures for Closed-End Management Investment Companies.
This item is inapplicable to semi-annual report on Form N-CSR.
Item 8. Portfolio Managers of Closed-End Management Investment Companies.
(a) This item is inapplicable to semi-annual report on Form N-CSR.
(b) During the period ended June 30, 2012, there were no changes in any of the Portfolio Managers identified in the Registrant’s Annual Report on Form N-CSR filed on March 8, 2012.
Item 9. Purchases of Equity Securities by Closed-End Management Investment Company and Affiliated Purchasers.
Period | (a) Total Number of
Shares Purchased | (b) Average Price Paid per Share | (c) Total Number
of Shares
Purchased as Part
of Publicly
Announced Plans
or Programs | (d) Maximum
Number of Shares
that May Yet Be
Purchased Under
the Plans or
Programs1 |
January 1, 2012 through January 31, 2012 | 0 | 0 | 0 | 345,575 |
February 1, 2012 | 0 | 0 | 0 | 345,575 |
through February 28, 2012 | | | | |
March 1, 2012 through March 31, 2012 | 0 | 0 | 0 | 345,575 |
April 1, 2012 through April 30, 2012 | 0 | 0 | 0 | 345,575 |
May 1, 2012 through May 31, 2012 | 0 | 0 | 0 | 345,575 |
June 1, 2012 through June 30, 2012 | 0 | 0 | 0 | 345,575 |
Total | 0 | 0 | 0 | 345,575 |
1 The plan was announced on November 16, 2007. The program authorizes management to make open market purchases from time to time in an amount up to 10% of the Fund’s outstanding shares. Such purchases may be made when the Fund’s shares are trading at a discount to net asset value of 12% or more. The plan does not have an expiration date.
Item 10. Submission of Matters to a Vote of Security Holders.
During the period ended June 30, 2012, there were no material changes to the procedures by which shareholders may recommend nominees to the Registrant’s Board of Directors.
Item 11. Controls and Procedures.
(a) The Registrant’s principal executive and principal financial officers, or persons performing similar functions, have concluded that the Registrant’s disclosure controls and procedures (as defined in Rule 30a-3(c) under the Investment Company Act of 1940, as amended (the “1940 Act”) (17 CFR 270.30a-3(c))) are effective, as of a date within 90 days of the filing date of this report that includes the disclosure required by this paragraph, based on their evaluation of the controls and procedures required by Rule 30a-3(b) under the 1940 Act (17 CFR 270.30a-3(b)) and Rules 13a-15(b) or 15d-15(b) under the Securities Exchange Act of 1934, as amended (the “Exchange Act”) (17 CFR 240.13a-15(b) or 240.15d-15(b)).
(b) There have been no changes in the Registrant’s internal control over financial reporting that occurred during the second fiscal quarter of the period covered by this report that have materially affected, or are reasonably likely to materially affect, the registrant’s internal control over financial reporting.
Item 12. Exhibits.
(a)(1) | Not applicable. |
| |
(a)(2) | The certifications of the registrant as required by Rule 30a-2(a) under the 1940 Act are exhibits to this report. |
| |
(a)(3) | Not applicable. |
| |
(b) | The certifications of the registrant as required by Rule 30a-2(b) under the 1940 Act are an exhibit to this report. |
SIGNATURES
Pursuant to the requirements of the Securities Exchange Act of 1934 and the Investment Company Act of 1940, the Registrant has duly caused this report to be signed on its behalf by the undersigned, thereunto duly authorized.
By: /s/ Christian Pittard
Christian Pittard, President of Aberdeen Latin America Equity Fund, Inc.
Date: August 31, 2012
Pursuant to the requirements of the Securities Exchange Act of 1934 and the Investment Company Act of 1940, this report has been signed below by the following persons on behalf of the Registrant and in the capacities and on the dates indicated.
Aberdeen Latin America Equity Fund, Inc.
By: /s/ Christian Pittard
Christian Pittard, President of Aberdeen Latin America Equity Fund, Inc.
Date: August 31, 2012
By: /s/ Andrea Melia
Andrea Melia, Treasurer and Chief Financial Officer of Aberdeen Latin America Equity Fund, Inc.
Date: August 31, 2012
EXHIBIT LIST
12(a)(2) – Rule 30a-2(a) Certifications
12(b) – Rule 30a-2(b) Certifications