Exhibit 99.1

Annual Meeting Presentation May 21, 2019 1 Carbon Energy Corporation
IMPORTANT DISCLOSURES 2 Forward - Looking Statements The slides contain certain forward - looking statements within the meaning of Section 27 A of the Securities Act of 1933 , as amended (the “Securities Act”), and Section 21 E of the Securities Exchange Act of 1934 , as amended (the “Exchange Act”) . Except for historical information, statements made in the slide presentation, including those relating to the Company’s strategies, estimated and anticipated production, expenditures, infrastructure, estimated costs, number of wells to be drilled, estimated reserves, reserve potential, recoverable reserves, and financial position are forward - looking statements as defined by the Securities and Exchange Commission . These statements are based on assumptions and estimates that management believes are reasonable based on currently available information ; however, management’s assumptions and the Company's future performance are subject to a wide range of business risks and uncertainties and there is no assurance that these goals and projections can or will be met . Any number of factors could cause actual results to differ materially from those in the forward - looking statements, including, but not limited to, the volatility of oil and gas prices, the costs and results of drilling and operations, the timing of production, mechanical and other inherent risks associated with oil and gas production, weather, the availability of drilling equipment, changes in interest rates, litigation, uncertainties about reserve estimates, and environmental risk . We caution you not place undue reliance on these forward - looking statements, which speak only as of the date reflected in the slide presentation, and we undertake no obligation to publicly update or revise any forward - looking statements . Further information on risks and uncertainties is available in the Company’s filings with the Securities and Exchange Commission, which are incorporated by reference . Actual quantities of oil and gas that may be ultimately recovered from Carbon’s interests will differ substantially from our estimates . Factors affecting ultimate recovery include the scope of Carbon’s drilling program, which will be directly affected by the availability of capital, drilling and production costs, commodity prices, availability of drilling services and equipment, drilling results, lease expirations, transportation constraints, regulatory approvals, field spacing rules, recovery of gas in place, length of horizontal laterals, actual drilling results, and geological and mechanical factors affecting recovery rates and other factors . Estimates of resource potential may change significantly as development of our resource plays provides additional data . Investors are urged to consider closely the disclosure in our filings with the SEC available upon request to : Corporate Secretary, Carbon Energy Corporation, 1700 Broadway, Suite 1170 , Denver, Colorado 80290 ; tel : ( 720 ) 407 - 7030 . You can also obtain our public filings from the SEC’s website, http : //www . sec . gov . Non - GAAP Measures The slide presentation contains certain references to EBITDA value, which is a non - GAAP financial measure, as defined under Regulation G of the rules and regulations of the SEC . EBITDA “EBITDA” is a non - GAAP financial measure . We define EBITDA as net income or loss before interest expense, taxes, depreciation, depletion and amortization, accretion of asset retirement obligations and unrealized commodity gains/losses . EBITDA is consolidated including non - controlling interests and as used and defined by us, may not be comparable to similarly titled measures employed by other companies and are not measures of performance calculated in accordance with GAAP . EBITDA should not be considered in isolation or as a substitute for operating income, net income or loss, cash flows provided by or used in operating, investing and financing activities, or other income or cash flow statement data prepared in accordance with GAAP . EBITDA provides no information regarding a company’s capital structure, borrowings, interest costs, capital expenditures, and working capital movement or tax position . EBITDA does not represent funds available for discretionary use because those funds are required for debt service, capital expenditures, working capital, income taxes, franchise taxes, exploration and development expenses, and other commitments and obligations . However, our management believes EBITDA is useful to an investor in evaluating our operating performance because the measure is widely used by investors in the oil and natural gas industry to measure a company’s operating performance without regard to items excluded from the calculation of such term, which can vary substantially from company to company depending upon accounting methods and book value of assets, capital structure and the method by which assets were acquired, among other factors ; and help investors to more meaningfully evaluate and compare the results of our operations from period to period by removing the effect of our capital structure from our operating structure ; and are used by our management for various purposes, including as a measure of operating performance, in presentations to our board of directors, as a basis for strategic planning and forecasting and by our lenders pursuant to a covenant under our credit facility . There are significant limitations to using EBITDA as a measure of performance, including the inability to analyze the effect of certain recurring and non - recurring items that materially affect our net income or loss, the lack of comparability of results of operations of different companies and the different methods of calculating EBITDA reported by different companies .
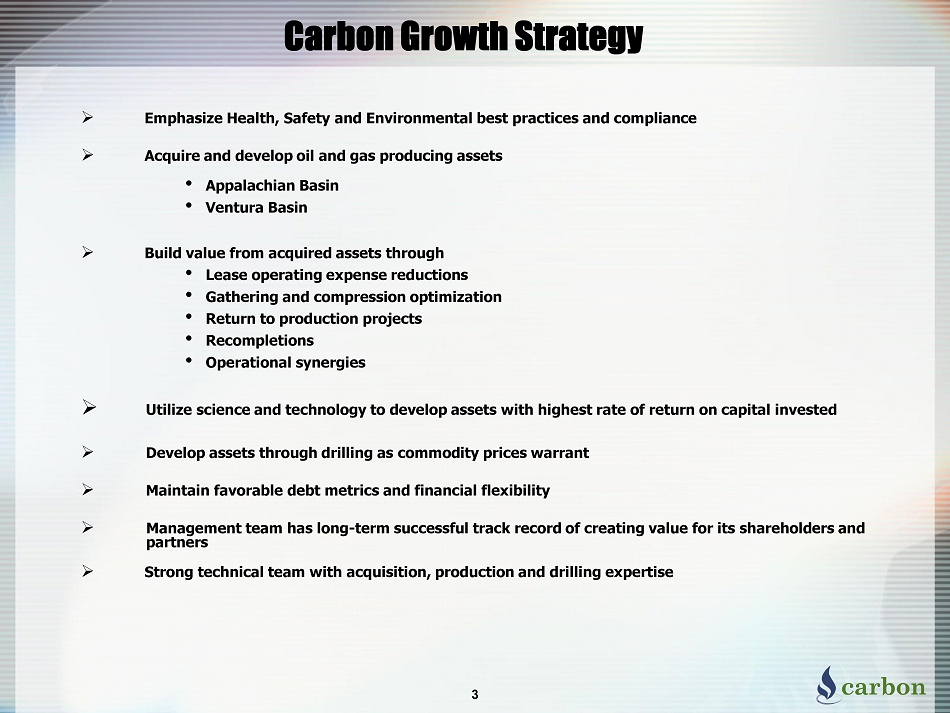
» Emphasize Health, Safety and Environmental best practices and compliance » Acquire and develop oil and gas producing assets • Appalachian Basin • Ventura Basin » Build value from acquired assets through • Lease operating expense reductions • Gathering and compression optimization • Return to production projects • Recompletions • Operational synergies » Utilize science and technology to develop assets with highest rate of return on capital invested » Develop assets through drilling as commodity prices warrant » Maintain favorable debt metrics and financial flexibility » Management team has long - term successful track record of creating value for its shareholders and partners » Strong technical team with acquisition, production and drilling expertise Carbon Growth Strategy 3
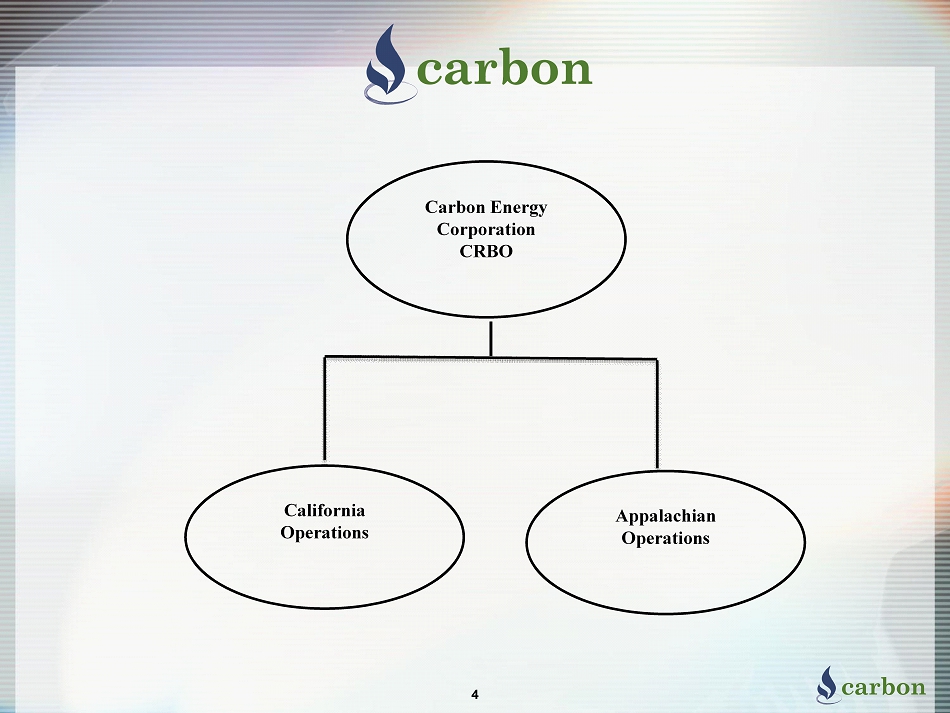
Carbon Energy Corporation CRBO California Operations 4 Appalachian Operations

Carbon Energy Corporation 100% 5 Carbon California Company, LLC 53.92%
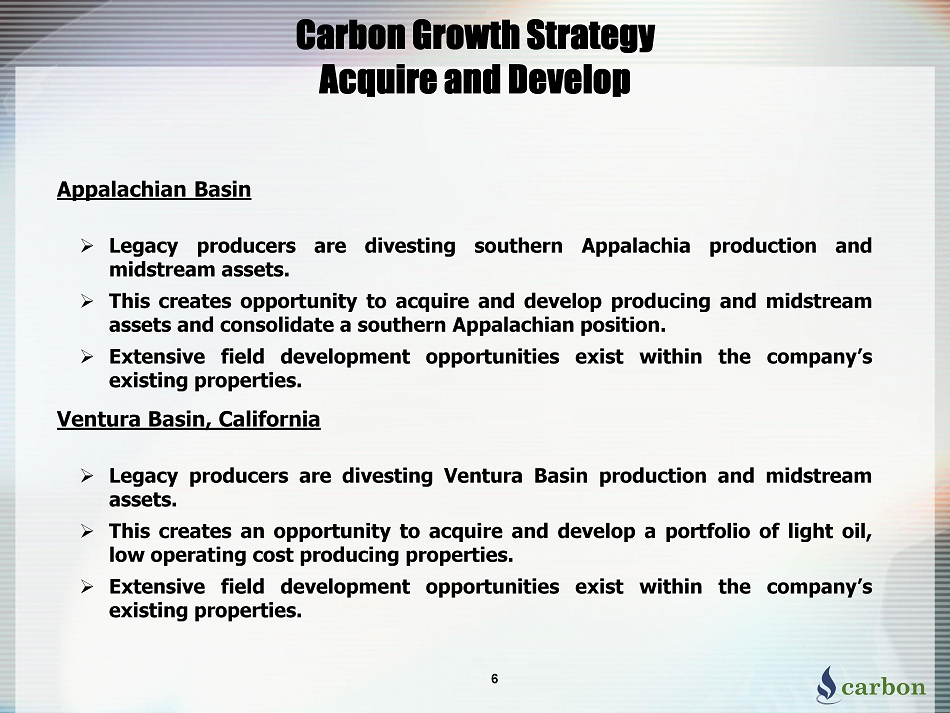
6 Carbon Growth Strategy Acquire and Develop » Legacy producers are divesting Ventura Basin production and midstream assets . » This creates an opportunity to acquire and develop a portfolio of light oil, low operating cost producing properties . » Extensive field development opportunities exist within the company’s existing properties . Appalachian Basin » Legacy producers are divesting southern Appalachia production and midstream assets . » This creates opportunity to acquire and develop producing and midstream assets and consolidate a southern Appalachian position . » Extensive field development opportunities exist within the company’s existing properties . Ventura Basin, California

2018 Highlights 7 » Emphasis on Health, Safety and Environmental best practices and compliance » Name change to Carbon Energy Corporation, June 1, 2018 » Sespe Field acquisition, Ventura Basin, May 1, 2018 » Acquire balance of interest in Carbon Appalachian Company, LLC, December 31, 2018 » Integration of acquired assets with existing Carbon properties » Increase in reserves, production and cash flow through development programs » Significant operating cost reductions
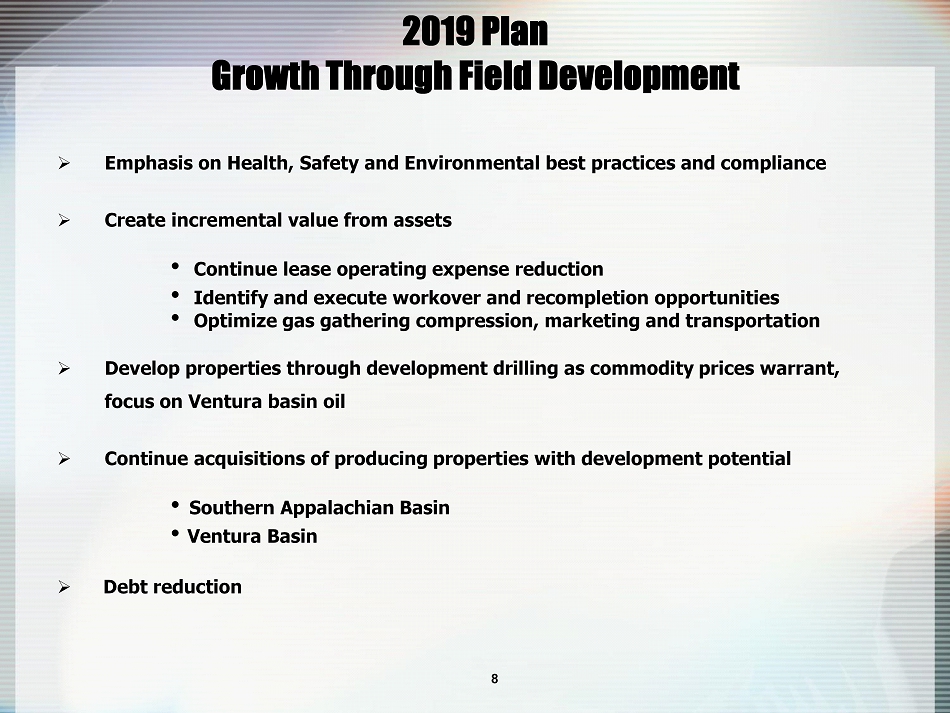
2019 Plan Growth Through Field Development » Emphasis on Health, Safety and Environmental best practices and compliance » Create incremental value from assets • Continue lease operating expense reduction • Identify and execute workover and recompletion opportunities • Optimize gas gathering compression, marketing and transportation » Develop properties through development drilling as commodity prices warrant, focus on Ventura basin oil » Continue acquisitions of producing properties with development potential • Southern Appalachian Basin • Ventura Basin 8 » Debt reduction
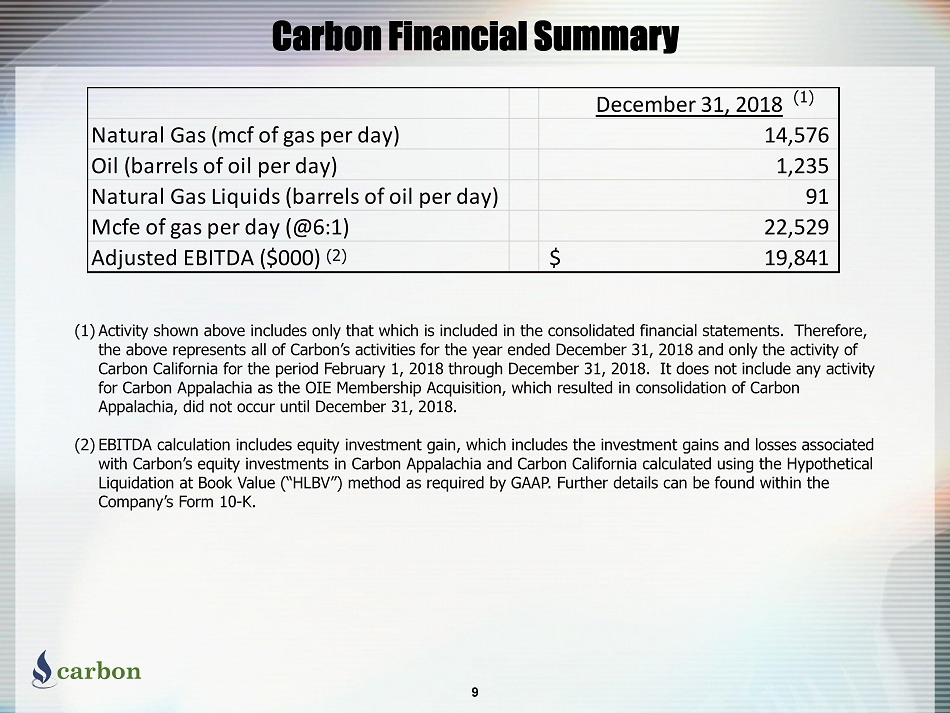
Carbon Financial Summary 9 (1) Activity shown above includes only that which is included in the consolidated financial statements. Therefore, the above represents all of Carbon’s activities for the year ended December 31, 2018 and only the activity of Carbon California for the period February 1, 2018 through December 31, 2018. It does not include any activity for Carbon Appalachia as the OIE Membership Acquisition, which resulted in consolidation of Carbon Appalachia, did not occur until December 31, 2018. (2) EBITDA calculation includes equity investment gain, which includes the investment gains and losses associated with Carbon’s equity investments in Carbon Appalachia and Carbon California calculated using the Hypothetical Liquidation at Book Value (“HLBV”) method as required by GAAP. Further details can be found within the Company’s Form 10 - K. December 31, 2018 Natural Gas (mcf of gas per day) 14,576 Oil (barrels of oil per day) 1,235 Natural Gas Liquids (barrels of oil per day) 91 Mcfe of gas per day (@6:1) 22,529 Adjusted EBITDA ($000) 19,841$ (1) (2)
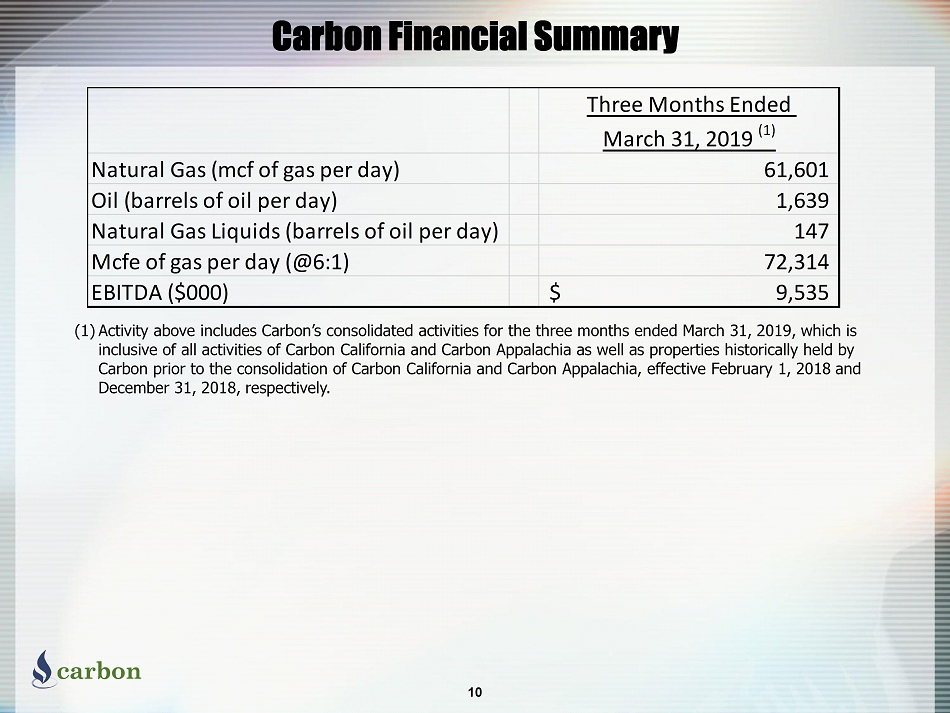
Carbon Financial Summary 10 (1) Activity above includes Carbon’s consolidated activities for the three months ended March 31, 2019, which is inclusive of all activities of Carbon California and Carbon Appalachia as well as properties historically held by Carbon prior to the consolidation of Carbon California and Carbon Appalachia, effective February 1, 2018 and December 31, 2018, respectively. Three Months Ended March 31, 2019 (1) Natural Gas (mcf of gas per day) 61,601 Oil (barrels of oil per day) 1,639 Natural Gas Liquids (barrels of oil per day) 147 Mcfe of gas per day (@6:1) 72,314 EBITDA ($000) 9,535$
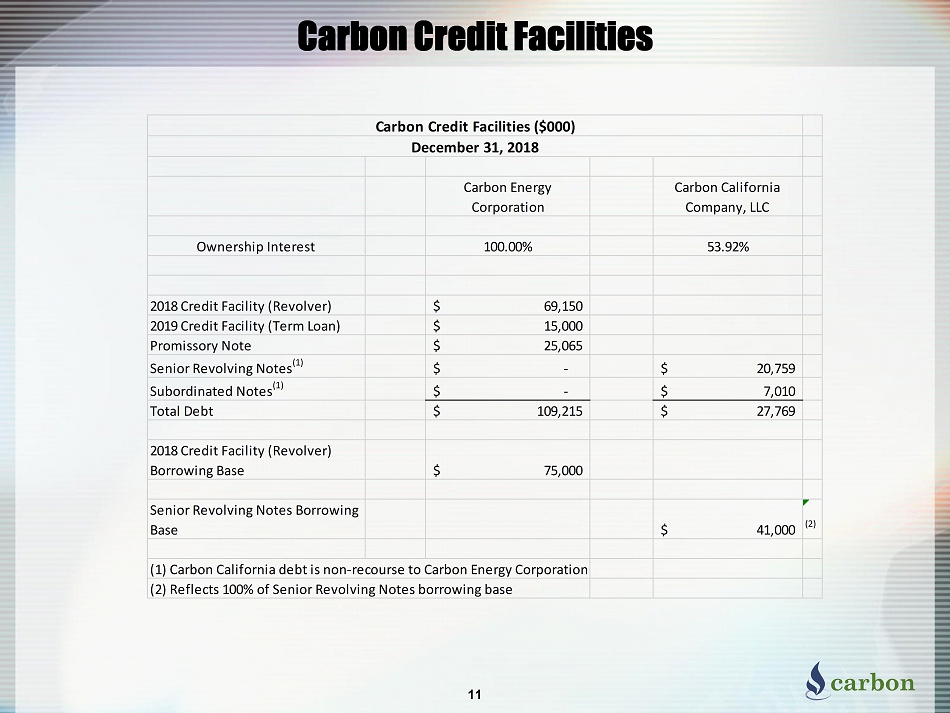
Carbon Credit Facilities 11 Carbon Energy Corporation Carbon California Company, LLC Ownership Interest 100.00% 53.92% 2018 Credit Facility (Revolver) 69,150$ 2019 Credit Facility (Term Loan) 15,000$ Promissory Note 25,065$ Senior Revolving Notes (1) -$ 20,759$ Subordinated Notes (1) -$ 7,010$ Total Debt 109,215$ 27,769$ 2018 Credit Facility (Revolver) Borrowing Base 75,000$ Senior Revolving Notes Borrowing Base 41,000$ (2) (1) Carbon California debt is non-recourse to Carbon Energy Corporation (2) Reflects 100% of Senior Revolving Notes borrowing base Carbon Credit Facilities ($000) December 31, 2018
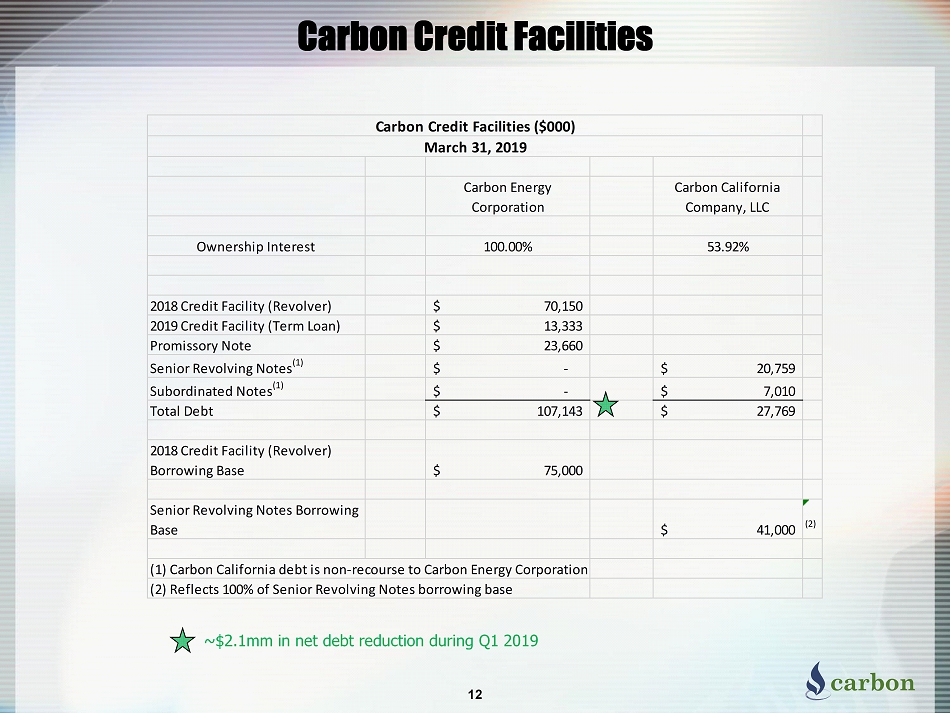
Carbon Credit Facilities 12 Carbon Energy Corporation Carbon California Company, LLC Ownership Interest 100.00% 53.92% 2018 Credit Facility (Revolver) 70,150$ 2019 Credit Facility (Term Loan) 13,333$ Promissory Note 23,660$ Senior Revolving Notes (1) -$ 20,759$ Subordinated Notes (1) -$ 7,010$ Total Debt 107,143$ 27,769$ 2018 Credit Facility (Revolver) Borrowing Base 75,000$ Senior Revolving Notes Borrowing Base 41,000$ (2) (1) Carbon California debt is non-recourse to Carbon Energy Corporation (2) Reflects 100% of Senior Revolving Notes borrowing base Carbon Credit Facilities ($000) March 31, 2019 ~$2.1mm in net debt reduction during Q1 2019

13 MBO MMCF MBBL MMBOE BCFE %Oil + NGL %GAS NPV @ 10% Carbon 1,382 429,999 - 73 438 2% 98% 237,488$ Carbon California 9,445 11,919 1,037 12 75 84% 16% 136,827$ Combined 10,827 441,918 1,037 86 513 14% 86% 374,315$ MBO MMCF MBBL MMBOE BCFE %Oil + NGL %GAS NPV @ 10% Carbon 1,382 429,985 - 73 438 2% 98% 237,473$ Carbon California 4,919 6,308 534 7 39 84% 16% 68,995$ Combined 6,301 436,293 534 80 477 9% 91% 306,468$ MBO MMCF MBBL MMBOE BCFE %Oil + NGL %GAS NPV @ 10% Carbon - 14 - 0 0 0% 0% 15$ Carbon California 2,067 2,927 260 3 17 83% 17% 37,188$ Combined 2,067 2,941 260 3 17 83% 17% 37,203$ MBO MMCF MBBL MMBOE BCFE %Oil + NGL %GAS NPV @ 10% Carbon - - - - - 0% 0% -$ Carbon California 2,460 2,683 243 3 19 86% 14% 30,644$ Combined 2,460 2,683 243 3 19 86% 14% 30,644$ SEC 18Q4 Price Basis: CRBO Ownership Position Average First Day of Month Prices Trailing 12 Months Carbon 100% $65.56 per barrel of oil CAC 100% $3.100 per MMBtu of gas CCC 53.92% Proved Developed Producing Proved Developed Non-Producing Proved Undeveloped Total Proved Carbon Energy Corporation Proved Reserves Summary As of January 1, 2019 SEC 18Q4 Prices
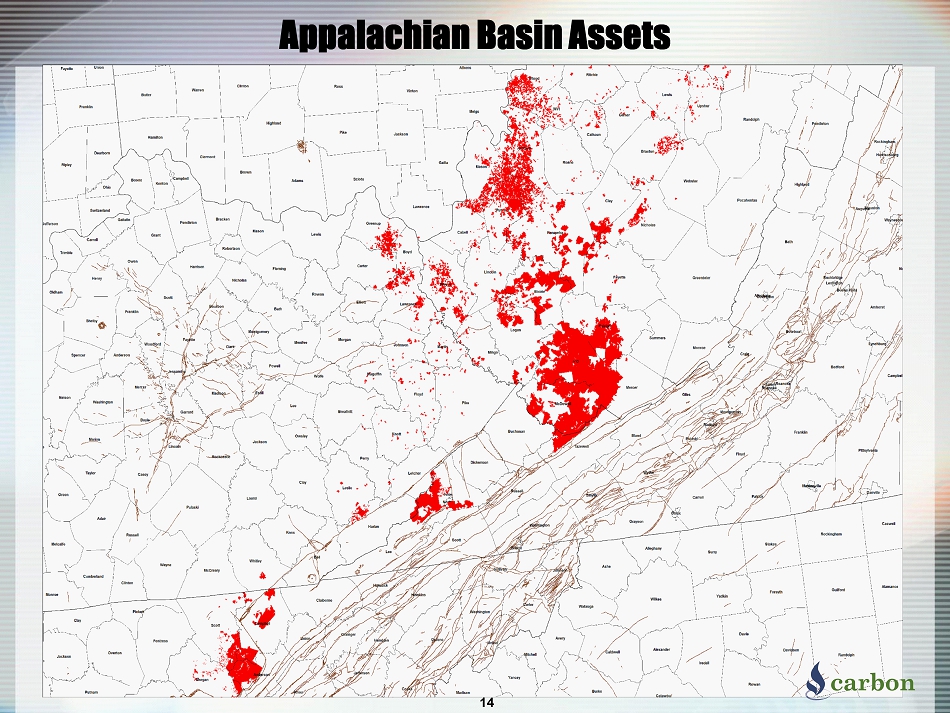
Appalachian Basin Assets 14
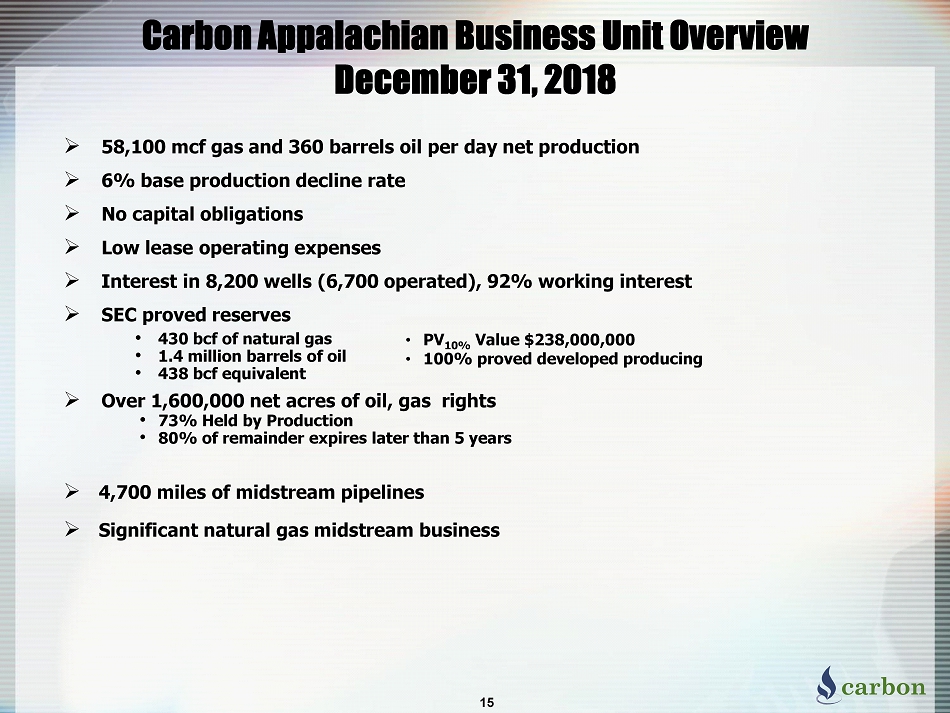
» 58,100 mcf gas and 360 barrels oil per day net production » 6% base production decline rate » No capital obligations » Low lease operating expenses » Interest in 8,200 wells (6,700 operated), 92% working interest » SEC proved reserves • 430 bcf of natural gas • 1.4 million barrels of oil • 438 bcf equivalent » Over 1,600,000 net acres of oil, gas rights • 73% Held by Production • 80% of remainder expires later than 5 years » 4,700 miles of midstream pipelines » Significant natural gas midstream business Carbon Appalachian Business Unit Overview December 31, 2018 15 • PV 10% Value $238,000,000 • 100% proved developed producing
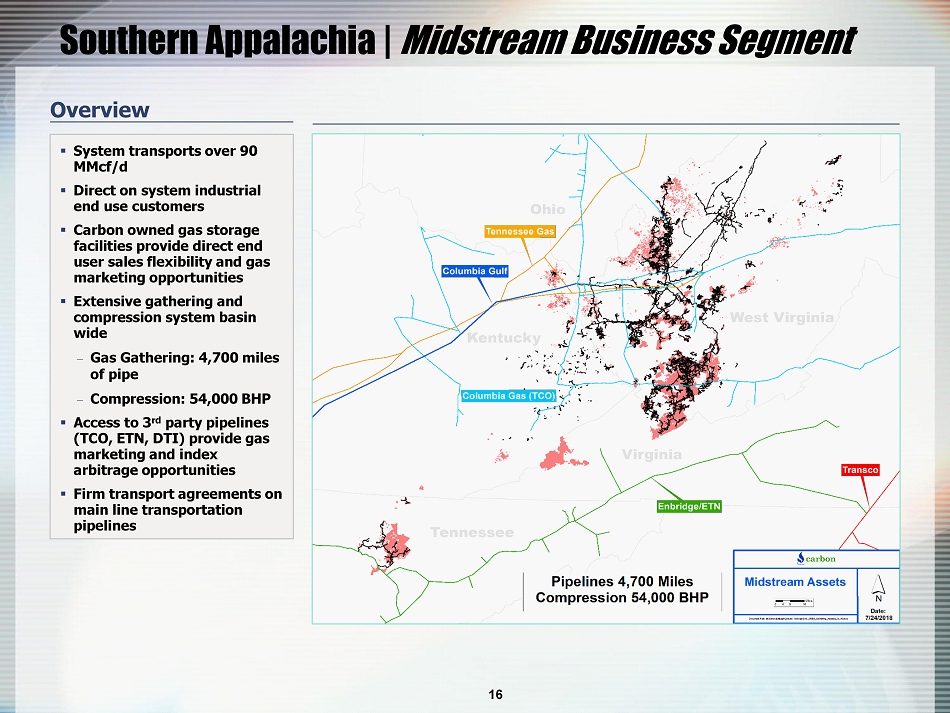
Southern Appalachia | Midstream Business Segment Overview ▪ System transports over 90 MMcf /d ▪ Direct on system industrial end use customers ▪ Carbon owned gas storage facilities provide direct end user sales flexibility and gas marketing opportunities ▪ Extensive gathering and compression system basin wide Gas Gathering: 4,700 miles of pipe Compression: 54,000 BHP ▪ Access to 3 rd party pipelines (TCO, ETN, DTI) provide gas marketing and index arbitrage opportunities ▪ Firm transport agreements on main line transportation pipelines 16
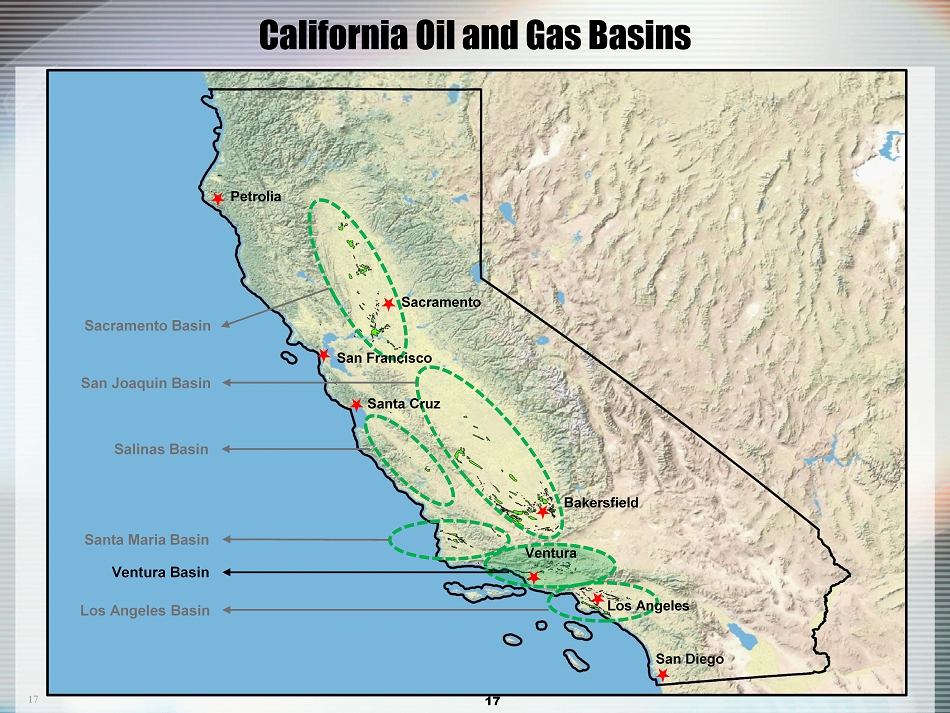
17 _______________________________ San Diego Bakersfield Petrolia California Oil and Gas Basins Santa Cruz Ventura Los Angeles Sacramento San Francisco Sacramento Basin San Joaquin Basin Salinas Basin Santa Maria Basin Ventura Basin Los Angeles Basin 17
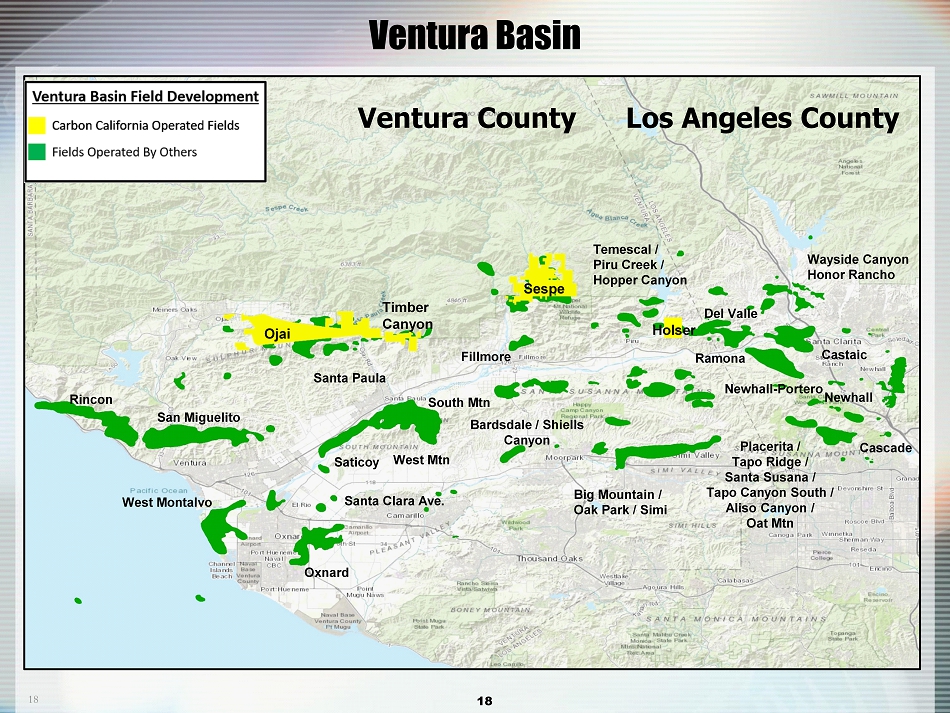
18 _______________________________ Ventura County Sespe Ojai Rincon San Miguelito West Montalvo Oxnard Saticoy South Mtn Bardsdale / Shiells Canyon Big Mountain / Oak Park / Simi Temescal / Piru Creek / Hopper Canyon Wayside Canyon Honor Rancho Santa Clara Ave. Cascade Timber Canyon Placerita / Tapo Ridge / Santa Susana / Tapo Canyon South / Aliso Canyon / Oat Mtn Fillmore West Mtn Los Angeles County Ramona Del Valle Newhall - Portero Castaic Newhall Santa Paula Holser Ventura Basin 18
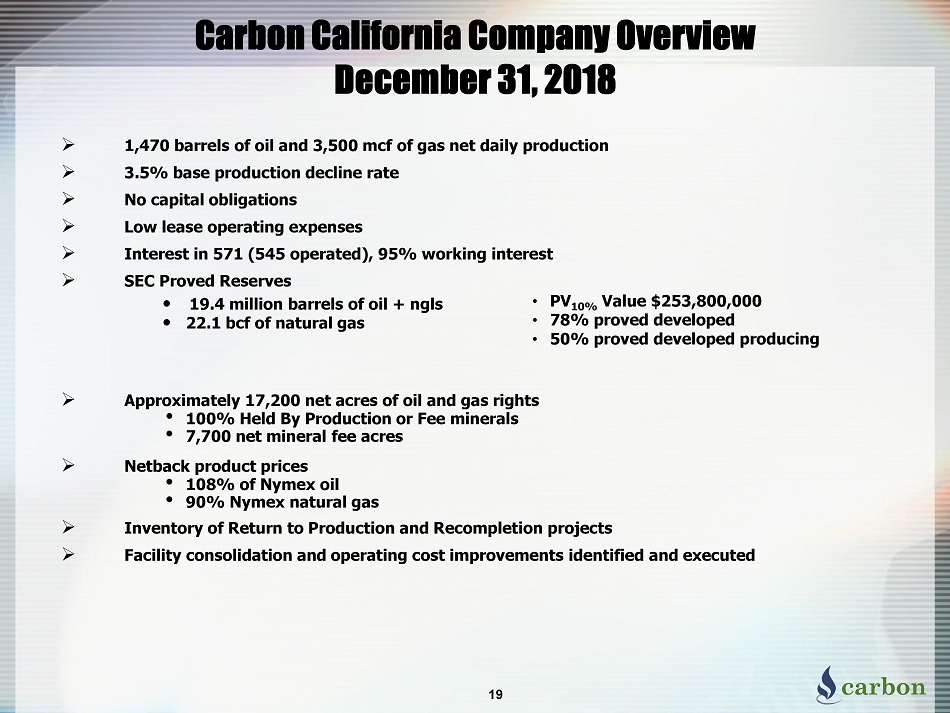
» 1,470 barrels of oil and 3,500 mcf of gas net daily production » 3.5% base production decline rate » No capital obligations » Low lease operating expenses » Interest in 571 (545 operated), 95% working interest » SEC Proved Reserves • 19.4 million barrels of oil + ngls • 22.1 bcf of natural gas » Approximately 17,200 net acres of oil and gas rights • 100% Held By Production or Fee minerals • 7,700 net mineral fee acres » Netback product prices • 108% of Nymex oil • 90% Nymex natural gas » Inventory of Return to Production and Recompletion projects » Facility consolidation and operating cost improvements identified and executed Carbon California Company Overview December 31, 2018 19 • PV 10% Value $253,800,000 • 78% proved developed • 50% proved developed producing
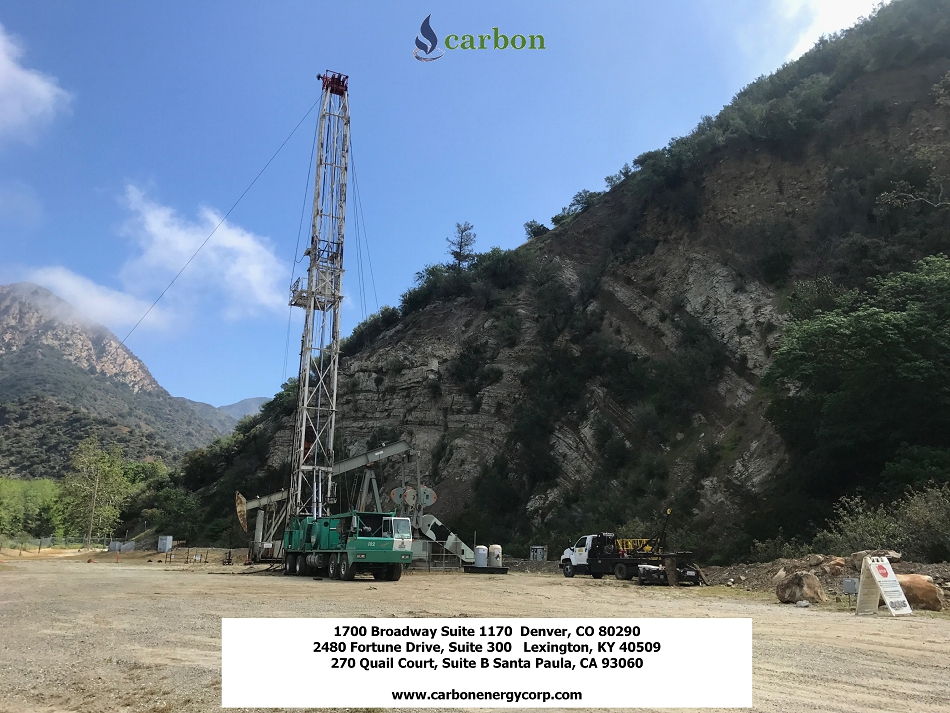
1700 Broadway Suite 1170 Denver, CO 80290 2480 Fortune Drive, Suite 300 Lexington, KY 40509 270 Quail Court, Suite B Santa Paula, CA 93060 www.carbonenergycorp.com


