The
TORRAY
FUND
SEMI-ANNUAL REPORT
June 30, 2019
The Torray Fund
Suite 750 W
7501 Wisconsin Avenue
Bethesda, Maryland 20814
funds.torray.com
(301) 493-4600
(855) 753-8174
Please see page 2 for important information regarding access to The Torray Fund Annual and Semi-Annual Shareholder Reports.
The Torray Fund
Letter to Shareholders
July 16, 2019
Dear Fellow Shareholders:
The Torray Fund advanced 15.05% in the first half of 2019, compared to gains of 18.54% for the Standard & Poor’s 500 Index and 16.24% for the Russell 1000 Value Index. As a result of portfolio actions described below, the Fund’s position in money market reserves and U.S. Treasury bills at mid-year was 7.83%, compared to 14.80% at year-end 2018.
There was modest activity in our portfolio year to date as we added to several holdings on weakness and took partial profits in one on strength. In June, DowDuPont (DWDP) completed its separation into three companies – Dow, Inc. (DOW), DuPont de Nemours, Inc. (DD) and Corteva, Inc. (CTVA). We believe each will benefit from improved capital allocation policies as independent businesses. Additional shares of Dow and DowDuPont were purchased prior to the final separation with proceeds from the complete sale of Hewlett Packard Enterprises (HPE). Finally, we initiated a new position in J.P. Morgan Chase (JPM) during the second quarter. J.P. Morgan Chase is a high-quality money center bank, the shares of which weakened following the broad market sell-off at the end of 2018. The company never lost money during the 2008-09 downturn, and the dividend today is more than twice the pre-cut level in 2008. We purchased shares at 11x estimated earnings and 1.8x tangible book value. The dividend yield at our cost is 3.1%.
As the longest U.S. economic expansion is now in its 10th year, it is interesting to note that there is approximately $13 trillion of fixed income obligations worldwide with negative yields. Who would have thought that a safe investment is one where the lender pays the borrower? It is our feeling that equity valuations in general remain supported by unusually accommodative monetary policies. We cannot forecast when this might change. However, we believe that the actions of the Federal Reserve and other central banks around the world distort the real cost of capital and encourage aggressive investment activity. In response, as we continue to implement our long-term value approach, we are careful not to pay for expectations which depend on continuance of favorable conditions. As one measure, we note that the estimated forward price earnings ratio of the Fund is 11.5-to-1, well below that of the S&P 500 at 17-to-1. Our message, as always, is to stay the course.
Thank you for your trust and support.
Sincerely,
| |  |  |  |
| | | | |
| | Robert E. Torray | Shawn M. Hendon | Brian R. Zaczynski |
The Torray Fund
IMPORTANT INFORMATION
Beginning on January 1, 2021, as permitted by regulations adopted by the Securities and Exchange Commission, paper copies of the Fund’s prospectus, annual and semi-annual shareholder reports will no longer be sent by mail, unless you specifically request paper copies of the reports. Instead, the reports will be made available on the Fund’s website, https://funds.torray.com/literature.html, and you will be notified by mail each time a report is posted and provided with a website link to access the report.
If you invest through a financial intermediary and have already elected to receive shareholder reports electronically, you will not be affected by this change and you need not take any action. You may elect to receive shareholder reports and other communications from the Fund electronically anytime by contacting your financial intermediary (such as a broker-dealer or bank) or, if you are a direct investor, by calling 1-800-626-9769 or by contacting the Fund in writing c/o U.S. Bank Global Fund Services, P.O. Box 701, Milwaukee, WI 53201-0701.
You may elect to receive all future reports in paper free of charge. If you invest through a financial intermediary, you can contact your financial intermediary to request that you continue to receive paper copies of your shareholder reports. If you invest directly with the Fund, you can call 1-800-626-9769 or contact the Fund in writing c/o U.S. Bank Global Fund Services, P.O. Box 701, Milwaukee, WI 53201-0701, to let the Fund know you wish to continue receiving paper copies of your shareholder reports. Your election to receive reports in paper will apply to all funds held in your account if you invest through your financial intermediary or all funds held with the fund complex if you invest directly with the Fund.
| | |
| Mutual fund investing involves risk including the possible loss of principal value. At times, the Fund’s portfolio may be more concentrated than that of a more diversified fund subjecting it to greater fluctuation and risk. | |
| | |
The Torray Fund
PERFORMANCE DATA
As of June 30, 2019 (unaudited)
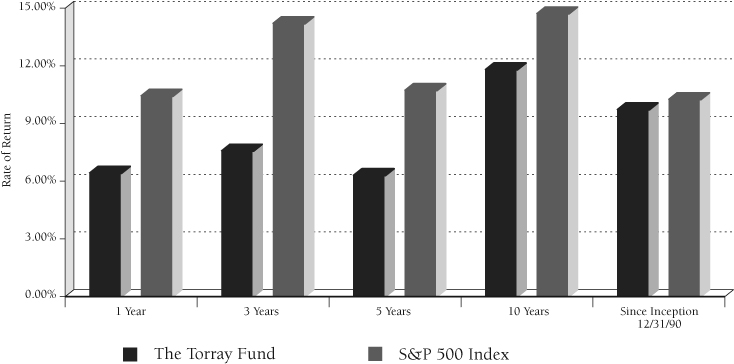
Average Annual Returns on an Investment in
The Torray Fund vs. the S&P 500 Index
For the periods ended June 30, 2019:
| | | | | | Since | |
| | | | | | Inception | |
| | 1 Year | 3 Years | 5 Years | 10 Years | 12/31/90 | |
| The Torray Fund | 6.41% | 7.56% | 6.29% | 11.79% | 9.71% | |
| S&P 500 Index | 10.42% | 14.19% | 10.71% | 14.70% | 10.24% | |
Cumulative Returns for the 28½ years ended June 30, 2019
| | The Torray Fund | 1,300.99% | |
| | S&P 500 Index | 1,507.11% | |
The returns quoted represent past performance and do not guarantee future results. Investment return and principal value will fluctuate so that shares, when redeemed, may be worth more or less than their original cost. Current performance may be lower or higher..
The Torray Fund
PERFORMANCE DATA (continued)
As of June 30, 2019 (unaudited)
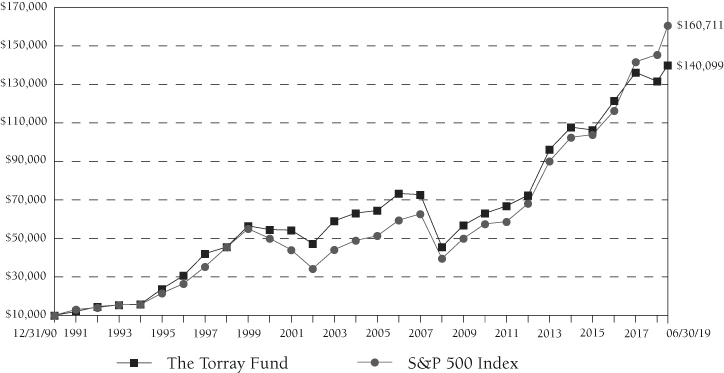
Change in Value of $10,000 Invested
on December 31, 1990 (commencement of operations) to:
| | 12/31/90 | 12/31/95 | 12/31/00 | 12/31/05 | 12/31/10 | 12/31/15 | 06/30/19 |
| The Torray Fund | $10,000 | $23,774 | $54,563 | $64,476 | $63,039 | $106,342 | $140,099 |
| S&P 500 Index | $10,000 | $21,544 | $49,978 | $51,354 | $57,511 | $103,952 | $160,711 |
The returns quoted represent past performance and do not guarantee future results. Investment return and principal value will fluctuate so that shares, when redeemed, may be worth more or less than their original cost. Current performance may be lower or higher. For performance current to the most recent month end, please call (800) 626-9769. The returns shown do not reflect the deduction of taxes a shareholder would pay on the redemption of fund shares and distributions. As of the most recent prospectus, the Fund’s Gross Expense Ratio is 1.17%. The Fund’s Net Expense Ratio is 1.08%, after fee waiver and expense reimbursement, will contractually remain in effect through April 30, 2020. Returns on both The Torray Fund and the S&P 500 Index assume reinvestment of all dividends and distributions. The S&P 500 Index is an unmanaged index consisting of 500 U.S. large-cap stocks. It is not possible to invest directly in an index. Current and future portfolio holdings are subject to change and risk. Mutual fund investing involves risk, including the possible loss of principal value. At times, the Fund’s portfolio may be more concentrated than that of a more diversified fund, subjecting it to greater fluctuation and risk.
The Torray Fund
FUND PROFILE
As of June 30, 2019 (unaudited)
| DIVERSIFICATION (% of net assets) | | | |
| Financials | | | 36.1 | % |
| Information Technology | | | 16.1 | % |
| Industrials | | | 10.3 | % |
| Health Care | | | 8.2 | % |
| Energy | | | 7.8 | % |
| Communication Services | | | 5.9 | % |
| Materials | | | 4.1 | % |
| Consumer Discretionary | | | 3.7 | % |
| Short-Term Investments | | | 7.8 | % |
| | | | 100.0 | % |
| TOP TEN EQUITY HOLDINGS (% of net assets) | |
| | 1. | | American Express Co. | | | 6.0 | % |
| | 2. | | Bank of America Corp. | | | 5.1 | % |
| | 3. | | Loews Corp. | | | 4.8 | % |
| | 4. | | Cisco Systems, Inc. | | | 4.5 | % |
| | 5. | | BP plc – ADR | | | 4.2 | % |
| | 6. | | American International Group, Inc. | | | 4.0 | % |
| | 7. | | Marsh & McLennan Cos., Inc. | | | 3.8 | % |
| | 8. | | Johnson & Johnson | | | 3.7 | % |
| | 9. | | General Motors Co. | | | 3.7 | % |
| | 10. | | Royal Dutch Shell plc – ADR – Class A | | | 3.6 | % |
| | | | | | | 43.4 | % |
| PORTFOLIO CHARACTERISTICS | | |
| Net Assets (millions) | | $412 |
| Number of Equity Holdings | | 29 |
| Portfolio Turnover | | 3.97%* |
| P/E Multiple (forward) | | 11.9x |
| Trailing Weighted Average Dividend Yield | | 1.9% |
| Market Capitalization (billions) | Average | $124 |
| | Median | $67 |
The Torray Fund
SCHEDULE OF INVESTMENTS
As of June 30, 2019 (unaudited)
| | Shares | | Market Value | |
| COMMON STOCKS – 92.2% | |
| | | | | | | |
36.1% FINANCIALS† | |
| | | 200,250 | | American Express Co. | | $ | 24,718,860 | |
| | | 729,300 | | Bank of America Corp. | | | 21,149,700 | |
| | | 364,400 | | Loews Corp. | | | 19,921,748 | |
| | | 311,700 | | American International Group, Inc. | | | 16,607,376 | |
| | | 156,818 | | Marsh & McLennan Cos., Inc. | | | 15,642,595 | |
| | | 65,400 | | Berkshire Hathaway, Inc. – Class B* | | | 13,941,318 | |
| | | 92,950 | | Chubb Ltd. | | | 13,690,606 | |
| | | 253,400 | | Wells Fargo & Co. | | | 11,990,888 | |
| | | 99,100 | | JPMorgan Chase & Co. | | | 11,079,380 | |
| | | | | | | | 148,742,471 | |
| | | | | | | | | |
| 16.1% INFORMATION TECHNOLOGY | |
| | | 336,900 | | Cisco Systems, Inc. | | | 18,438,537 | |
| | | 103,550 | | International Business Machines Corp. | | | 14,279,545 | |
| | | 252,700 | | Intel Corp. | | | 12,096,749 | |
| | | 569,400 | | HP, Inc. | | | 11,837,826 | |
| | | 475,900 | | Western Union Co. | | | 9,465,651 | |
| | | | | | | | 66,118,308 | |
| | | | | | | | | |
| 10.3% INDUSTRIALS | |
| | | 166,350 | | Eaton Corp. plc | | | 13,853,628 | |
| | | 63,400 | | General Dynamics Corp. | | | 11,527,388 | |
| | | 63,600 | | Stanley Black & Decker, Inc. | | | 9,197,196 | |
| | | 746,097 | | General Electric Co. | | | 7,834,018 | |
| | | | | | | | 42,412,230 | |
| | | | | | | | | |
| 8.2% HEALTH CARE | |
| | | 108,924 | | Johnson & Johnson | | | 15,170,935 | |
| | | 40,150 | | Becton Dickinson & Co. | | | 10,118,201 | |
| | | 34,650 | | UnitedHealth Group Inc. | | | 8,454,947 | |
| | | | | | | | 33,744,083 | |
| | | | | | | | | |
| 7.8% ENERGY | |
| | | 417,620 | | BP plc – ADR | | | 17,414,754 | |
| | | 224,900 | | Royal Dutch Shell plc – ADR – Class A | | | 14,634,243 | |
| | | | | | | | 32,048,997 | |
See notes to the financial statements.
The Torray Fund
SCHEDULE OF INVESTMENTS (continued)
As of June 30, 2019 (unaudited)
| | Shares | | Market Value | |
| 5.9% COMMUNICATION SERVICES | |
| | | 864,500 | | TEGNA, Inc. | | $ | 13,097,175 | |
| | | 380,500 | | Viacom, Inc. – Class B | | | 11,365,535 | |
| | | | | | | | 24,462,710 | |
| | | | | | | | | |
| 4.1% MATERIALS | |
| | | 97,900 | | DuPont de Nemours, Inc. | | | 7,349,353 | |
| | | 133,533 | | Dow, Inc. | | | 6,584,512 | |
| | | 97,899 | | Corteva, Inc. | | | 2,894,873 | |
| | | | | | | | 16,828,738 | |
| | | | | | | | | |
| 3.7% CONSUMER DISCRETIONARY | |
| | | 391,300 | | General Motors Co. | | | 15,076,789 | |
| TOTAL COMMON STOCKS | |
| (cost $256,935,757) | | | 379,434,326 | |
| | | | | | | | | |
| SHORT-TERM INVESTMENTS – 7.8% | |
| 1.0% MONEY MARKET FUND | |
| | | 4,333,557 | | Fidelity Investments Money Market Funds Government | | | | |
| | | | | Portfolio – Class I, 2.25%^ | | | 4,333,557 | |
| | | | | | | | | |
| | Par
| | | | |
| 6.8% U.S. TREASURY OBLIGATION | |
| | $ | 28,000,000 | | U.S. Treasury Bill, 2.23%, 7/18/2019□ | | | 27,968,796 | |
| TOTAL SHORT-TERM INVESTMENTS | |
| (cost $32,302,353) | | | 32,302,353 | |
| TOTAL INVESTMENTS – 100.0% | |
| (cost $289,238,110) | | | 411,736,679 | |
| OTHER ASSETS AND LIABILITIES, NET – 0.0% | | | (125,914 | ) |
| TOTAL NET ASSETS – 100.0% | | $ | 411,610,765 | |
| † | As of June 30, 2019, the Fund had a significant portion of its assets invested in this sector. See Note 8 in the Notes to the Financial Statements. |
| * | Non-income producing security. |
| ^ | The rate shown is the annualized seven-day effective yield as of June 30, 2019. |
□ | The rate shown is the effective yield as of June 30, 2019. |
ADR – American Depositary Receipt
The Global Industry Classification Standard (“GICS”®) was developed by and is the exclusive property of MSCI, Inc. (“MSCI”) and Standard & Poor’s Financial Services LLC (“S&P”). GICS is a service mark of MSCI and S&P and has been licensed for use.
See notes to the financial statements.
The Torray Fund
STATEMENT OF ASSETS AND LIABILITIES
As of June 30, 2019 (unaudited)
| | ASSETS: | |
| | Investments in securities at value | | | |
| | (cost $289,238,110) | | $ | 411,736,679 | |
| | Cash | | | 9,500 | |
| | Receivable for fund shares sold | | | 6,448 | |
| | Dividends & interest receivable | | | 313,612 | |
| | Prepaid expenses | | | 17,273 | |
| | TOTAL ASSETS | | | 412,083,512 | |
| | | | | | |
| | LIABILITIES: | |
| | Payable for fund shares redeemed | | | 69,654 | |
| | Payable to investment manager | | | 303,035 | |
| | Accrued expenses and other liabilities | | | 100,058 | |
| | TOTAL LIABILITIES | | | 472,747 | |
| | | | | | |
| | NET ASSETS | | $ | 411,610,765 | |
| | | | | | |
| | NET ASSETS CONSIST OF: | |
| | Shares of beneficial interest ($1 stated value, | | | | |
| | 8,301,129 shares outstanding, unlimited shares authorized) | | $ | 8,301,129 | |
| | Paid-in capital in excess of par | | | 275,020,487 | |
| | Total distributable earnings | | | 128,289,149 | |
| | | | | | |
| | TOTAL NET ASSETS | | $ | 411,610,765 | |
| | Net Asset Value, Offering and Redemption Price per Share | | $ | 49.58 | |
See notes to the financial statements.
The Torray Fund
STATEMENT OF OPERATIONS
For the six months ended June 30, 2019 (unaudited)
| | INVESTMENT INCOME: | |
| | Dividend income (net of withholding of $63,422) | | $ | 4,556,431 | |
| | Interest income | | | 489,965 | |
| | Total investment income | | | 5,046,396 | |
| | | | | | |
| | EXPENSES: | |
| | Management fees (See Note 4) | | | 1,988,489 | |
| | Fund administration & accounting fees | | | 86,492 | |
| | Transfer agent fees & expenses | | | 80,296 | |
| | Trustees’ fees | | | 40,680 | |
| | Insurance expense | | | 38,329 | |
| | Federal & state registration fees | | | 17,820 | |
| | Legal fees | | | 16,964 | |
| | Audit fees | | | 11,946 | |
| | Printing, postage & mailing fees | | | 11,249 | |
| | Custody fees | | | 8,833 | |
| | Compliance support fees | | | 3,982 | |
| | Total expenses before waiver | | | 2,305,080 | |
| | Less: waiver from investment manager (See Note 4) | | | (179,603 | ) |
| | Net expenses | | | 2,125,477 | |
| | | | | | |
| | NET INVESTMENT INCOME | | | 2,920,919 | |
| | | |
| | REALIZED AND UNREALIZED GAIN ON INVESTMENTS: | |
| | Net realized gain on investments | | | 5,130,237 | |
| | Net change in unrealized appreciation on investments | | | 47,093,289 | |
| | Net realized and unrealized gain on investments | | | 52,223,526 | |
| | | | | | |
| | NET INCREASE IN NET ASSETS RESULTING FROM OPERATIONS | | $
| 55,144,445 | |
See notes to the financial statements.
The Torray Fund
STATEMENTS OF CHANGES IN NET ASSETS
For the periods indicated:
| | | | Six months ended | | | | |
| | | | 06/30/19 | | | Year ended | |
| | | | (unaudited) | | | 12/31/18 | |
| | Increase (Decrease) in Net Assets | | | | | | |
| | Resulting from Operations: | | | | | | |
| | Net investment income | | $ | 2,920,919 | | | $ | 5,408,288 | |
| | Net realized gain on investments | | | 5,130,237 | | | | 3,354,740 | |
| | Net change in unrealized | | | | | | | | |
| | appreciation on investments | | | 47,093,289 | | | | (53,248,227 | ) |
| | Net increase (decrease) in net assets | | | | | | | | |
| | resulting from operations | | | 55,144,445 | | | | (44,485,199 | ) |
| | | | | | | | | | |
| | Distributions to Shareholders: | | | | | | | | |
| | Total distributions to shareholders | | | (3,296,105 | ) | | | (8,305,241 | ) |
| | | | | | | | | | |
| | Shares of Beneficial Interest: | | | | | | | | |
| | Net decrease from share transactions (Note 5) | | | (11,210,521 | ) | | | (23,924,783 | ) |
| | Total increase (decrease) in net assets | | | 40,637,819 | | | | (76,715,223 | ) |
| | Net Assets – Beginning of Period | | | 370,972,946 | | | | 447,688,169 | |
| | Net Assets – End of Period | | $ | 411,610,765 | | | $ | 370,972,946 | |
See notes to the financial statements.
The Torray Fund
FINANCIAL HIGHLIGHTS
For a Fund share outstanding throughout each period presented.
PER SHARE DATA:
| | | Six months | | | | | | | | | | | | | | | | |
| | | ended | | | | | | | | | | | | | | | | |
| | | 06/30/19 | | | Years ended December 31: | |
| | | (unaudited) | | | 2018 | | | 2017 | | | 2016 | | | 2015 | | | 2014 | |
| Net Asset Value, | | | | | | | | | | | | | | | | | | |
| Beginning of Period | | $ | 43.450 | | | $ | 49.600 | | | $ | 47.600 | | | $ | 45.510 | | | $ | 48.110 | | | $ | 43.400 | |
| Investment operations | | | | | | | | | | | | | | | | | | | | | | | | |
Net investment income(1) | | | 0.347 | | | | 0.619 | | | | 0.550 | | | | 0.563 | | | | 0.445 | | | | 0.458 | |
| Net realized and unrealized | | | | | | | | | | | | | | | | | | | | | | | | |
| gain (loss) on securities | | | 6.178 | | | | (5.806 | ) | | | 5.091 | | | | 5.780 | | | | (1.088 | ) | | | 4.743 | |
| Total from | | | | | | | | | | | | | | | | | | | | | | | | |
| investment operations | | | 6.525 | | | | (5.187 | ) | | | 5.641 | | | | 6.343 | | | | (0.643 | ) | | | 5.201 | |
| Less distributions from: | | | | | | | | | | | | | | | | | | | | | | | | |
| Net investment income | | | (0.395 | ) | | | (0.620 | ) | | | (0.576 | ) | | | (0.560 | ) | | | (0.479 | ) | | | (0.491 | ) |
| Net capital gains | | | — | | | | (0.343 | ) | | | (3.065 | ) | | | (3.693 | ) | | | (1.478 | ) | | | — | |
| Total distributions | | | (0.395 | ) | | | (0.963 | ) | | | (3.641 | ) | | | (4.253 | ) | | | (1.957 | ) | | | (0.491 | ) |
| Net Asset Value, | | | | | | | | | | | | | | | | | | | | | | | | |
| End of Period | | $ | 49.580 | | | $ | 43.450 | | | $ | 49.600 | | | $ | 47.600 | | | $ | 45.510 | | | $ | 48.110 | |
| | | | | | | | | | | | | | | | | | | | | | | | | |
TOTAL RETURN(2) | | | 15.05 | %* | | | -10.60 | % | | | 12.07 | % | | | 14.29 | % | | | -1.36 | % | | | 12.04 | % |
| | |
| SUPPLEMENTAL DATA AND RATIOS: | |
| Net assets, end | | | | | | | | | | | | | | | | | | | | | | | | |
| of period (000’s omitted) | | $ | 411,611 | | | $ | 370,973 | | | $ | 447,688 | | | $ | 428,418 | | | $ | 393,778 | | | $ | 423,854 | |
| Ratios of expenses | | | | | | | | | | | | | | | | | | | | | | | | |
| to average net assets: | | | | | | | | | | | | | | | | | | | | | | | | |
| Before expense waiver | | | 1.16 | %** | | | 1.16 | % | | | 1.16 | % | | | 1.07 | % | | | 1.16 | % | | | 1.15 | % |
| After expense waiver | | | 1.07 | %** | | | 1.07 | % | | | 1.07 | % | | | 1.07 | % | | | 1.16 | % | | | 1.15 | % |
| Ratios of net investment income | | | | | | | | | | | | | | | | | | | | | | | | |
| to average net assets | | | 1.47 | %** | | | 1.28 | % | | | 1.11 | % | | | 1.19 | % | | | 0.95 | % | | | 1.01 | % |
| Portfolio turnover rate | | | 3.97 | %* | | | 4.18 | % | | | 19.38 | % | | | 9.46 | % | | | 10.77 | % | | | 15.68 | % |
(1) | Calculated based on average amount of shares outstanding during the period. |
(2) | Past performance is not predictive of future performance. Returns assume reinvestment of all dividends and distributions. |
| * | Not annualized |
| ** | Annualized |
| | |
See notes to the financial statements.
The Torray Fund
NOTES TO FINANCIAL STATEMENTS
As of June 30, 2019 (unaudited)
NOTE 1 — ORGANIZATION
The Torray Fund (“Fund”) is a separate diversified series of The Torray Fund (“Trust”). The Trust is registered under the Investment Company Act of 1940, as amended, as an open-end management investment company. The Trust is organized as a business trust under Massachusetts law. The Fund’s investment objectives are to build investor wealth over extended periods and to minimize shareholder capital gains tax liability by limiting the realization of long- and short-term gains. The Fund invests principally in common stock of larger-capitalization companies that generally have demonstrated records of profitability, conservative financial structures and shareholder-oriented management. The Fund seeks to invest in such companies when it believes that valuations are modest relative to earnings, cash flow or asset values. Large capitalization companies are those with market capitalizations of $8 billion or more. Investments are held as long as the issuers’ fundamentals remain intact, and the Fund believes issuers’ shares are reasonably valued. There can be no assurance that the Fund’s investment objectives will be achieved. The Fund is an investment company and accordingly follows the investment companies accounting and reporting guidance of the Financial Accounting Standards Board (“FASB”) Accounting Standards Codification Topic 946 Financial Services – Investment Companies.
NOTE 2 — SIGNIFICANT ACCOUNTING POLICIES
The following is a summary of accounting policies followed by the Fund in the preparation of its financial statements. These policies are in conformity with accounting principles generally accepted in the United States of America (“GAAP”).
Security Valuation – All investments in securities are recorded at their estimated fair value, as described in Note 3.
Federal Income Taxes – The Fund complies with the requirements of subchapter M of the Internal Revenue Code of 1986, as amended, necessary to qualify as a regulated investment company and distributes substantially all net taxable investment income and net realized gains to shareholders in a manner which results in no tax cost to the Fund. Therefore, no federal income tax provision is required. As of and during the period ended June 30, 2019, the Fund did not have any tax positions that did not meet the “more-likely-than-not” threshold of being sustained by the applicable tax authority. As of and during the period ended June 30, 2019, the Fund did not have liabilities for any unrecognized tax benefits. The Fund recognizes interest and penalties, if any, related to unrecognized tax benefits on uncertain tax positions as income tax expense in the Statement of Operations. As of and during the period ended June 30, 2019, the Fund did not incur any interest or penalties. The Fund is not subject to examination by U.S. tax authorities for tax years prior to December 31, 2015.
Security Transactions and Investment Income – The Fund follows industry practice and records security transactions on the trade date. Realized gains and losses on sales of securities are calculated on the basis of identified cost. Dividend income is recorded on the ex-dividend date and interest income is recorded on an accrual basis. Withholding taxes on foreign dividends have been provided for in accordance with the Fund’s understanding of the applicable country’s tax rules and regulations. Discounts and premiums on securities purchased are amortized over the expected life of the respective securities using the constant yield method.
The Torray Fund
NOTES TO FINANCIAL STATEMENTS (continued)
As of June 30, 2019 (unaudited)
The Fund distributes all net investment income, if any, quarterly and net realized capital gains, if any, annually. Distributions to shareholders are recorded on the ex-dividend date. The treatment for financial reporting purposes of distributions made to shareholders during the year from net investment income or net realized capital gains may differ from their ultimate treatment for federal income tax purposes. These differences are caused primarily by differences in the timing of the recognition of certain components of income, expense or realized capital gain for federal income tax purposes. Where such differences are permanent in nature, GAAP requires that they be reclassified in the components of the net assets based on their ultimate characterization for federal income tax purposes. Any such reclassifications will have no effect on net assets, results of operations or net asset values per share of the Fund.
Use of Estimates – The preparation of financial statements in conformity with GAAP requires management to make estimates and assumptions that affect the reported amounts of assets and liabilities and disclosure of contingent assets and liabilities at the date of the financial statements and the reported amounts of revenues and expenses during the reporting period. Actual results could differ from those estimates.
NOTE 3 — SECURITIES VALUATION
The Fund has adopted authoritative fair value accounting standards which establish an authoritative definition of fair value and set out a hierarchy for measuring fair value. These standards require additional disclosures about the various inputs and valuation techniques used to develop the measurements of fair value, a discussion of changes in valuation techniques and related inputs during the period and expanded disclosure of valuation levels for major security types. These inputs are summarized in the three broad levels listed below:
| | • | Level 1 – | Unadjusted quoted prices in active markets for identical assets or liabilities that the Fund has the ability to access. |
| | | | |
| | • | Level 2 – | Observable inputs other than quoted prices included in Level 1 that are observable for the asset or liability, either directly or indirectly. These inputs may include quoted prices for the identical instrument on an inactive market, prices for similar instruments, interest rates, prepayment speeds, credit risk, yield curves, default rates and similar data. |
| | | | |
| | • | Level 3 – | Unobservable inputs for the asset or liability, to the extent relevant observable inputs are not available, representing the Fund’s own assumptions about the assumptions a market participant would use in valuing the asset or liability, and would be based on the best information available. |
Following is a description of the valuation techniques applied to the Fund’s major categories of assets and liabilities measured at fair value on a recurring basis. The Fund’s investments are carried at fair value.
Equity Securities – Securities that are primarily traded on a national securities exchange are valued at the last sale price on the exchange on which they are primarily traded on the day of valuation or, if there has been no sale on such day, at the mean between the bid and ask prices. Securities traded primarily in the Nasdaq Global Market System for which market quotations are readily available are valued using the Nasdaq Official Closing Price (“NOCP”). If the NOCP is not available, such securities are valued at the last sale price on the day of valuation, or if there has been no sale on such day.
The Torray Fund
NOTES TO FINANCIAL STATEMENTS (continued)
As of June 30, 2019 (unaudited)
at the mean between the bid and ask prices. To the extent these securities are actively traded and valuation adjustments are not applied, they are categorized in Level 1 of the fair value hierarchy. If the market for a particular security is not active, and the mean between bid and ask prices is used, these securities are categorized in Level 2 of the fair value hierarchy.
Short-Term Investments – Investments in money market funds are valued at their net asset value per share. To the extent these securities are actively traded and valuation adjustments are not applied, they are categorized in Level 1 of the fair value hierarchy. Short-term debt securities (maturing in 60 days or less), such as U.S. Treasury Bills, are valued at amortized cost, which approximates market value and are categorized in Level 2 of the fair value hierarchy.
Securities for which market quotations are not readily available, or if the closing price does not represent fair value, are valued following procedures approved by the Board of Trustees. As of June 30, 2019, no Fund portfolio securities were priced using the Trust’s fair value guidelines.
The inputs or methodology used for valuing securities are not an indication of the risk associated with investing in those securities. The following is a summary of the inputs used to value the Fund’s securities as of June 30, 2019:
| | | Level 1 | | | Level 2 | | | Level 3 | | | Total | |
| Common Stocks | | $ | 379,434,326 | | | $ | — | | | $ | — | | | $ | 379,434,326 | |
| Short-Term Investments | | | 4,333,557 | | | | 27,968,796 | | | | — | | | | 32,302,353 | |
| Total Investments in Securities | | $ | 383,767,883 | | | $ | 27,968,796 | | | $ | — | | | $ | 411,736,679 | |
Refer to the Schedule of Investments for further information on the classification of investments.
NOTE 4 — MANAGEMENT FEES AND OTHER TRANSACTIONS WITH AFFILIATES
The Trust has an agreement (“Management Contract”) with Torray LLC (the “Manager”) to furnish investment advisory services and to pay for certain operating expenses of the Fund. Pursuant to the Management Contract between the Trust and the Manager, the Manager is entitled to receive, on a monthly basis, an annual management fee equal to 1.00% of the Fund’s average daily net assets. For the period ended June 30, 2019, the Fund incurred management fees of $1,988,489.
The Manager and the Fund have entered into an Operating Expenses Limitation Agreement (the “Agreement”) whereby the Manager has contractually agreed prospectively for the term of Agreement to waive its management fee and reimburse the Fund for its current Operating Expenses so as to limit the Fund’s current Operating Expenses to an annual rate, expressed as a percentage of the Fund’s average annual net assets, to 1.00%. For purposes of the Agreement, the term “Operating Expenses” includes the Manager’s management fee and all other expenses necessary or appropriate for the operation of the Fund, excluding any front-end or contingent deferred loads, taxes, leverage, interest, brokerage commissions, acquired fund fees and expenses, trustee fees and expenses, auditor fees and expenses, legal fees and expenses, insurance costs, registration and filing fees, printing, postage and mailing expenses, expenses incurred in connection with any merger or reorganization, or extraordinary expenses such as litigation. Fees waived and expenses paid by the Manager are not eligible for recoupment. The Agreement will remain in effect until April 30, 2020.
The Torray Fund
NOTES TO FINANCIAL STATEMENTS (continued)
As of June 30, 2019 (unaudited)
U.S. Bancorp Fund Services, LLC (the “Administrator”), doing business as U.S. Bank Global Fund Services, acts as the Fund’s Administrator, Transfer Agent, and Fund Accountant. U.S. Bank, N.A. (the “Custodian”) serves as the Custodian to the Fund. The Custodian is an affiliate of the Administrator. The Administrator performs various administrative and accounting services for the Fund. The Administrator prepares various federal and state regulatory filings, reports and returns for the Fund; prepares reports and materials to be supplied to the Trustees; monitors the activities of the Custodian; coordinates the payment of the Fund’s expenses and reviews the Fund’s expense accruals. As compensation for its services, the Administrator is entitled to a monthly fee at an annual rate based upon the average daily net assets of the Fund, subject to annual minimums. Fees incurred by the Fund for administration and accounting, transfer agency, custody and compliance support services for the period ended June 30, 2019, are disclosed in the Statement of Operations.
Certain officers and Trustees of the Fund are also officers and/or shareholders of the Advisor, and are not paid by the Fund for serving in such capacities.
NOTE 5 — SHARES OF BENEFICIAL INTEREST TRANSACTIONS
Transactions in shares of beneficial interest were as follows:
| | | Six Months ended | | | Year ended | |
| | | 06/30/19 | | | 12/31/18 | |
| | | Shares | | | Amount | | | Shares | | | Amount | |
| Shares sold | | | 7,467 | | | $ | 357,598 | | | | 48,032 | | | $ | 2,332,073 | |
| Reinvestments of distributions | | | 62,964 | | | | 3,037,068 | | | | 163,010 | | | | 7,687,188 | |
| Shares redeemed | | | (306,611 | ) | | | (14,605,187 | ) | | | (700,333 | ) | | | (33,944,044 | ) |
| | $ | (11,210,521 | ) | | | (489,291 | ) | | $ | (23,924,783 | ) | | $
| (236,180 | ) |
As of June 30, 2019, the Trust’s officers, Trustees and affiliated persons and their families directly or indirectly controlled 1,726,266 shares or 20.8% of the Fund.
NOTE 6 — INVESTMENT TRANSACTIONS
Purchases and sales of investment securities, other than short-term investments, for the period ended June 30, 2019, aggregated $26,049,690 and $14,080,835, respectively.
NOTE 7 — TAX MATTERS
Distributions to shareholders are determined in accordance with United States federal income tax regulations, which may differ from GAAP.
The Torray Fund
NOTES TO FINANCIAL STATEMENTS (continued)
As of June 30, 2019 (unaudited)
The tax character of distributions paid during the six months ended June 30, 2019, and the year ended December 31, 2018, the Fund’s most recently completed fiscal year end, were as follows:
| | | June 30, 2019 | | | | |
| | | (unaudited) | | | 2018 | |
| Distributions paid from: | | | | | | |
| Ordinary income* | | $ | 3,296,105 | | | $ | 8,305,241 | |
| Long-term capital gains | | | — | | | | — | |
| | | $ | 3,296,105 | | | $ | 8,305,241 | |
| | * | For federal income tax purposes, distributions of short-term capital gains are treated as ordinary income. |
As of December 31, 2018, the components of distributable earnings on a tax basis were as follows:
| | Undistributed ordinary income | | $ | 1,035,529 | |
| | Unrealized appreciation | | | 75,405,280 | |
| | Total accumulated earnings | | $ | 76,440,809 | |
As of December 31, 2018, the Fund did not have any capital loss carryovers. A regulated investment company may elect for any taxable year to treat any portion of any qualified late year loss as arising on the first day of the next taxable year. Qualified late year losses are certain capital and ordinary losses which occur during the portion of the Fund’s taxable year subsequent to October 31. For the taxable period ended December 31, 2018, the Fund did not have any late year losses.
The cost basis of investments for federal income tax purposes at June 30, 2019, and December 31, 2018, the Fund’s most recently completed fiscal year end, were as follows:
| | | June 30, 2019 | | | | |
| | | (unaudited) | | | 2018 | |
| Gross unrealized appreciation | | $ | 137,035,768 | | | $ | 100,499,299 | |
| Gross unrealized depreciation | | | (14,537,199 | ) | | | (25,094,019 | ) |
| Net unrealized appreciation | | | 122,498,569 | | | | 75,405,280 | |
| Cost | | $ | 289,238,110 | | | $ | 295,653,614 | |
The difference between book-basis and tax-basis unrealized appreciation is attributable to differences in the treatment of partnerships.
The Torray Fund
NOTES TO FINANCIAL STATEMENTS (continued)
As of June 30, 2019 (unaudited)
NOTE 8 — SECTOR RISK
As of June 30, 2019, the Fund had a significant portion of its assets invested in the financials sector. The financials sector may be more greatly impacted by the performance of the overall economy, interest rates, competition, and consumer confidence spending.
For purposes of financial statement reporting, 36.1% of portfolio holdings at period end were classified according to Global Industry Classification Standards (GICS) as belonging to the financials sector. However, the Fund believes the actual financials concentration risk to be below that shown for the financials sector, as several of the constituent companies are diversified holding companies, with portions of their businesses falling outside the sector.
NOTE 9 — COMMITMENTS AND CONTINGENCIES
The Fund indemnifies its officers and Trustees for certain liabilities that may arise from their performance of their duties to the Fund. Additionally, in the normal course of business, the Fund enters into contracts that contain a variety of representations and warranties which provide general indemnifications. The Fund’s maximum exposure under these arrangements is unknown, as this would involve future claims that may be made against the Fund that have not yet occurred.
NOTE 10 — SUBSEQUENT EVENTS
Management has evaluated the impact of all subsequent events on the Fund through the date these financial statements were issued and has determined that there were no subsequent events requiring recognition or disclosure in the financial statements.
The Torray Fund
ABOUT YOUR FUND’S EXPENSES
As of June 30, 2019 (unaudited)
We believe it is important for you to understand the impact of costs on your investment. All mutual funds have operating expenses. As a shareholder of the Fund, you incur ongoing costs, including management fees, and other fund expenses. Operating expenses, which are deducted directly from the Fund’s gross income, directly reduce the investment return of the Fund.
A mutual fund’s expenses are expressed as a percentage of its average net assets. This figure is known as the expense ratio. The following examples are intended to help you understand the ongoing costs (in dollars) of investing in the Fund and to compare these costs with the ongoing costs of investing in other mutual funds. The examples below are based on an investment of $1,000 made at the beginning of the period and held for the entire period from January 1, 2019 to June 30, 2019.
The table below illustrates the Fund’s cost in two ways:
Actual Fund Return This section helps you estimate the actual expenses that you paid over the period. The “Ending Account Value” shown is derived from the Fund’s actual return, and the third column shows the operating expenses that would have been paid by an investor who started with $1,000 in the Fund. You may use the information here, together with the amount invested, to estimate the expenses that you paid over the period.
To do so, simply divide your account value by $1,000 (for example, an $8,600 account value divided by $1,000 = 8.6), then multiply the result by the number given for the Fund under the heading “Expenses Paid During Period” below.
Hypothetical 5% Return This section is intended to help you compare your Fund’s costs with those of other mutual funds. It assumes that the Fund had an annual return of 5% before expenses, and that the expense ratio is unchanged. In this case, because the return used is not the Fund’s actual return, the results do not apply to your investment. The example is useful in making comparisons because the Commission requires all mutual funds to calculate expenses based on a 5% return. You can assess the Fund’s costs by comparing this hypothetical example with the hypothetical examples that appear in shareholder reports of other funds.
Note that expenses shown in the table are meant to highlight and help you compare ongoing costs only. The Fund does not charge transactions fees, such as purchase or redemption fees, nor does it carry a “sales load.”
The calculation assumes no shares were bought or sold during the period. Your actual costs may have been higher or lower, depending on the amount of your investment and the timing of any purchases or redemptions.
More information about the Fund’s expenses, including recent annual expense ratios, can be found in this report. For additional information on operating expenses and other shareholder costs, please refer to the Fund’s prospectus.
| | Beginning | Ending | |
| | Account Value | Account Value | Expenses Paid |
| | January 1, 2019 | June 30, 2019 | During Period(1) |
Based on Actual Fund Return(2) | $1,000.00 | $1,150.50 | $5.71 |
| Based on Hypothetical 5% Return (before expenses) | $1,000.00 | $1,019.49 | $5.36 |
(1) | Expenses are equal to the Fund’s annualized expense ratio for the most recent six-month period of 1.07%, multiplied by the average account value over the period, multiplied by 181/365 to reflect the one-half year period. |
(2) | Based on the actual returns for the six-month period ended June 30, 2019 of 15.05%. |
The Torray Fund
PORTFOLIO HOLDINGS, PROXY VOTING AND PROCEDURES
As of June 30, 2019 (unaudited)
The Fund files its complete schedule of portfolio holdings with the Securities and Exchange Commission (the “Commission”) for the first and third quarters of each fiscal year on Form N-Q. The Fund’s Forms N-Q are available on the Commission’s website at http://www.sec.gov. The Fund’s Forms N-Q may be reviewed and copied at the Commission’s Public Reference Room in Washington, D.C. Information on the operation of the Commissions Public Reference Room may be obtained by calling 1-800-SEC-0330.
A description of the policies and procedures that the Fund uses to determine how to vote proxies relating to portfolio securities is available without charge, upon request, by calling 1-855-753-8174.
Information regarding how the Fund voted proxies relating to portfolio securities during the most recent 12-month period ended June 30 is available without charge, upon request, by calling 1-855-753-8174; and on the Commission’s website at http://www.sec.gov.
PRIVACY NOTICE
The Fund collects only relevant information about you that the law allows or requires it to have in order to conduct its business and properly service you. The Fund collects financial and personal information about you (“Personal Information”) directly (e.g., information on account applications and other forms, such as your name, address, and social security number, and information provided to access account information or conduct account transactions online, such as password, account number, e-mail address, and alternate telephone number), and indirectly (e.g., information about your transactions with us, such as transaction amounts, account balance and account holdings).
The Fund does not disclose any non-public personal information about its shareholders or former shareholders other than for everyday business purposes such as to process a transaction, service an account, respond to court orders and legal investigations or as otherwise permitted by law. Third parties that may receive this information include companies that provide transfer agency, technology and administrative services to the Fund, as well as the Fund’s investment adviser who is an affiliate of the Fund. If you maintain a retirement/educational custodial account directly with the Fund, we may also disclose your Personal Information to the custodian for that account for shareholder servicing purposes. The Fund limits access to your Personal Information provided to unaffiliated third parties to information necessary to carry out their assigned responsibilities to the Fund. All shareholder records will be disposed of in accordance with applicable law. The Fund maintains physical, electronic and procedural safeguards to protect your Personal Information and requires its third party service providers with access to such information to treat your Personal Information with the same high degree of confidentiality.
In the event that you hold shares of the Fund through a financial intermediary, including, but not limited to, a broker-dealer, credit union, bank or trust company, the privacy policy of your financial intermediary governs how your non-public personal information is shared with unaffiliated third parties.
TRUSTEES
Carol T. Crawford
Bruce C. Ellis
William M Lane
Wayne H. Shaner
INVESTMENT ADVISOR
Torray LLC
OFFICERS
Robert E. Torray
William M Lane
Nicholas C. Haffenreffer
Shawn M. Hendon
Suzanne E. Kellogg
INDEPENDENT REGISTERED
PUBLIC ACCOUNTING FIRM
BBD, LLP
1835 Market Street, 3rd Floor
Philadelphia, PA 19103
ADMINISTRATOR AND TRANSFER AGENT
U.S. Bancorp Fund Services, LLC
615 E. Michigan Street
Milwaukee, WI 53202
LEGAL COUNSEL
Bernstein Shur
100 Middle Street, 6th Floor
Portland, ME 04104
Distributed by Foreside Funds Distributors LLC
400 Berwyn Park, 899 Cassatt Road
Berwyn, PA 19132
Date of first use, August 2019
This report is not authorized for distribution to prospective
investors unless preceded or accompanied by a current
prospectus. All indices are unmanaged groupings of stocks
that are not available for investment.
Item 2. Code of Ethics.
Not applicable for semi-annual reports.
Item 3. Audit Committee Financial Expert.
Not applicable for semi-annual reports.
Item 4. Principal Accountant Fees and Services.
Not applicable for semi-annual reports.
Item 5. Audit Committee of Listed Registrants.
Not applicable for semi-annual reports.
Item 6. Schedule of Investments.
| (a) | Schedule of Investments is included as part of the report to shareholders filed under Item 1 of this Form. |
Item 7. Disclosure of Proxy Voting Policies and Procedures for Closed-End Management Investment Companies.
Not applicable to open-end investment companies.
Item 8. Portfolio Managers of Closed-End Management Investment Companies.
Not applicable to open-end investment companies.
Item 9. Purchases of Equity Securities by Closed‑End Management Investment Company and Affiliated Purchases.
Not applicable to open-end investment companies.
Item 10. Submission of Matters to a Vote of Security Holders.
There have been no material changes to the procedures by which shareholders may recommend nominees to the registrant’s board of trustees.
Item 11. Controls and Procedures.
(a) | The Registrant’s President and Treasurer have reviewed the Registrant's disclosure controls and procedures (as defined in Rule 30a-3(c) under the Investment Company Act of 1940 (the “Act”)) as of a date within 90 days of the filing of this report, as required by Rule 30a-3(b) under the Act and Rules 13a-15(b) or 15d‑15(b) under the Securities Exchange Act of 1934. Based on their review, such officers have concluded that the disclosure controls and procedures are effective in ensuring that information required to be disclosed in this report is appropriately recorded, processed, summarized and reported and made known to them by others within the Registrant and by the Registrant’s service provider. |
(b) | There were no significant changes in the Registrant's internal control over financial reporting (as defined in Rule 30a-3(d) under the Act) that occurred during the second fiscal quarter of the period covered by this report that has materially affected, or is reasonably likely to materially affect, the Registrant's internal control over financial reporting. |
Item 12. Disclosure of Securities Lending Activities for Closed-End Management Investment Companies.
Not applicable to open-end investment companies.
Item 13. Exhibits.
(a) | (1) Any code of ethics or amendment thereto, that is subject of the disclosure required by Item 2, to the extent that the registrant intends to satisfy Item 2 requirements through filing an exhibit. Not applicable for semi-annual reports. |
(2) Certifications pursuant to Section 302 of the Sarbanes-Oxley Act of 2002. Filed herewith.
(3) Any written solicitation to purchase securities under Rule 23c‑1 under the Act sent or given during the period covered by the report by or on behalf of the registrant to 10 or more persons. Not applicable to open-end investment companies.
(4) Change in the registrant’s independent public accountant. There was no change in the registrant’s independent public accountant for the period covered by this report.
| (b) | Certification pursuant to Section 906 of the Sarbanes‑Oxley Act of 2002. Furnished herewith. |
SIGNATURES
Pursuant to the requirements of the Securities Exchange Act of 1934 and the Investment Company Act of 1940, the registrant has duly caused this report to be signed on its behalf by the undersigned, thereunto duly authorized.
(Registrant) The Torray Fund
By (Signature and Title)* /s/ Robert E. Torray
Robert E. Torray, President
Date September 3, 2019
Pursuant to the requirements of the Securities Exchange Act of 1934 and the Investment Company Act of 1940, this report has been signed below by the following persons on behalf of the registrant and in the capacities and on the dates indicated.
By (Signature and Title)* /s/ Robert E. Torray
Robert E. Torray, President
Date September 3, 2019
By (Signature and Title)* /s/ William M Lane
William M Lane, Treasurer
* Print the name and title of each signing officer under his or her signature.