Table of Contents
UNITED STATES SECURITIES AND EXCHANGE COMMISSION
Washington, D.C. 20549
Form 10-K
| þ | ANNUAL REPORT PURSUANT TO SECTION 13 OR 15(d) OF THE SECURITIES EXCHANGE ACT OF 1934 |
For the fiscal year ended December 31, 2009
OR
| o | TRANSITION REPORT PURSUANT TO SECTION 13 OR 15(d) OF THE SECURITIES EXCHANGE ACT OF 1934 |
For the transition period from to
Commission file number 000-26481
FINANCIAL INSTITUTIONS, INC.
(Exact name of registrant as specified in its charter)
| NEW YORK | 16-0816610 | |
| (State or other jurisdiction of incorporation or organization) | (I.R.S. Employer Identification No.) | |
| 220 LIBERTY STREET, WARSAW, NEW YORK | 14569 | |
| (Address of principal executive offices) | (ZIP Code) |
Registrant’s telephone number, including area code:(585) 786-1100
Securities registered under Section 12(b) of the Exchange Act:
| Title of each class | Name of exchange on which registered | |
| Common stock, par value $.01 per share | NASDAQ Global Select Market |
Securities registered under Section 12(g) of the Exchange Act:NONE
Indicate by check mark if the regsitrant is a well-known seasoned issuer, as defined in Rule 405 of the Securities Act.Yeso Noþ
Indicate by check mark if the registrant is not required to file reports pursuant to Section 13 or Section 15(d) of the Act.Yeso Noþ
Indicate by check mark whether the registrant (1) has filed all reports required to be filed by Section 13 or 15(d) of the Securities Exchange Act of 1934 during the past 12 months (or for such shorter period that the registrant was required to file such reports), and (2) has been subject to such filing requirements for the past 90 days.Yesþ Noo
Indicate by check mark whether the registrant has submitted electronically and posted on its corporate Web site, if any, every Interactive Data File required to be submitted and posted pursuant to Rule 405 of Regulation S-T (§ 232.405 of this chapter) during the preceding 12 months (or for such shorter period that the registrant was required to submit and post such files).Yeso Noo
Indicate by check mark if disclosure of delinquent filers pursuant to Item 405 of Regulation S-K (§ 229.405 of this chapter) is not contained herein, and will not be contained, to the best of the registrant’s knowledge, in definitive proxy or information statements incorporated by reference in Part III of this form 10-K or any amendment to this Form 10-K.o
Indicate by check mark whether the regsitrant is a large accelerated filer, an accelerated filer, a non-accelerated filer, or a smaller reporting company. See definitions of “large accelerated filer,” “accelerated filer” and “smaller reporting company” in Rule 12b-2 of the Exchange Act.
| Large accelerated filero | Accelerated filerþ | Non-accelerated filero | Smaller reporting companyo |
Indicate by check mark whether the registrant is a shell company (as defined in Rule 12b-2 of the Exchange Act).Yeso Noþ
The aggregate market value of common equity held by non-affiliates of the registrant, as computed by reference to the June 30, 2009 closing price reported by NASDAQ, was $138,170,500.
As of March 1, 2010, there were issued and outstanding, exclusive of treasury shares, 10,919,608 shares of the registrant’s common stock.
DOCUMENTS INCORPORATED BY REFERENCE
Portions of the Proxy Statement for the 2010 Annual Meeting of Shareholders are incorporated by reference in Part III.
TABLE OF CONTENTS
| PAGE | ||||||||
| PART I | ||||||||
| 5 | ||||||||
| 19 | ||||||||
| 24 | ||||||||
| 25 | ||||||||
| 26 | ||||||||
| 26 | ||||||||
| PART II | ||||||||
| 27 | ||||||||
| 29 | ||||||||
| 32 | ||||||||
| 57 | ||||||||
| 59 | ||||||||
| 104 | ||||||||
| 104 | ||||||||
| 104 | ||||||||
| PART III | ||||||||
| 105 | ||||||||
| 105 | ||||||||
| 105 | ||||||||
| 105 | ||||||||
| 105 | ||||||||
| PART IV | ||||||||
| 106 | ||||||||
| 108 | ||||||||
| Exhibit 12 | ||||||||
| Exhibit 21 | ||||||||
| Exhibit 23 | ||||||||
| Exhibit 31.1 | ||||||||
| Exhibit 31.2 | ||||||||
| Exhibit 32 | ||||||||
| Exhibit 99.1 | ||||||||
| Exhibit 99.2 | ||||||||
Table of Contents
PART I
FORWARD LOOKING INFORMATION
Statements in this Annual Report on Form 10-K that are based on other than historical data are forward-looking within the meaning of the Private Securities Litigation Reform Act of 1995. Forward-looking statements provide current expectations or forecasts of future events and include, among others:
| • | statements with respect to the beliefs, plans, objectives, goals, guidelines, expectations, anticipations, and future financial condition, results of operations and performance of Financial Institutions, Inc. (“the parent” or “FII”) and its subsidiaries (collectively “the Company,” “we,” “our,” “us”); |
| • | statements preceded by, followed by or that include the words “may,” “could,” “should,” “would,” “believe,” “anticipate,” “estimate,” “expect,” “intend,” “plan,” “projects,” or similar expressions. |
These forward-looking statements are not guarantees of future performance, nor should they be relied upon as representing management’s views as of any subsequent date. Forward-looking statements involve significant risks and uncertainties and actual results may differ materially from those presented, either expressed or implied, in this Annual Report on Form 10-K, including, but not limited to, those presented in the Management’s Discussion and Analysis. Factors that might cause such differences include, but are not limited to:
| • | the Company’s ability to successfully execute its business plans, manage its risks, and achieve its objectives; |
| • | changes in political and economic conditions, including the political and economic effects of the current economic crisis and other major developments, including wars, military actions and terrorist attacks; |
| • | changes in financial market conditions, either internationally, nationally or locally in areas in which the Company conducts its operations, including without limitation, reduced rates of business formation and growth, commercial and residential real estate development and real estate prices; |
| • | fluctuations in markets for equity, fixed-income, commercial paper and other securities, including availability, market liquidity levels, and pricing; |
| • | changes in interest rates, the quality and composition of the loan and securities portfolios, demand for loan products, deposit flows and competition; |
| • | acquisitions and integration of acquired businesses; |
| • | increases in the levels of losses, customer bankruptcies, claims and assessments; |
| • | changes in fiscal, monetary, regulatory, trade and tax policies and laws, including policies of the United States (“U.S.”) Department of Treasury (the “Treasury”) and the Federal Reserve Board (“FRB”); |
| • | the Company’s participation or lack of participation in governmental programs implemented under the Emergency Economic Stabilization Act (“EESA”) and the American Recovery and Reinvestment Act (“ARRA”), including without limitation the Troubled Asset Relief Program (“TARP”), the Capital Purchase Program (“CPP”), and the Temporary Liquidity Guarantee Program (“TLGP”) and the impact of such programs and related regulations on the Company and on international, national, and local economic and financial markets and conditions; |
| • | the impact of the EESA and the ARRA and related rules and regulations on the business operations and competitiveness of the Company and other participating American financial institutions, including the impact of the executive compensation limits of these acts, which may impact the ability of the Company and other American financial institutions to retain and recruit executives and other personnel necessary for their businesses and competitiveness; |
| • | the impact of certain provisions of the EESA and ARRA and related rules and regulations on the attractiveness of governmental programs to mitigate the effects of the current economic crisis, including the risks that certain financial institutions may elect not to participate in such programs, thereby decreasing the effectiveness of such programs; |
| • | continuing consolidation in the financial services industry; |
| • | new litigation or changes in existing litigation; |
| • | success in gaining regulatory approvals, when required; |
| • | changes in consumer spending and savings habits; |
| • | increased competitive challenges and expanding product and pricing pressures among financial institutions; |
- 3 -
Table of Contents
FORWARD LOOKING INFORMATION (Continued)
| • | demand for financial services in the Company’s market areas; |
| • | inflation and deflation; |
| • | technological changes and the Company’s implementation of new technologies; |
| • | the Company’s ability to develop and maintain secure and reliable information technology systems; |
| • | legislation or regulatory changes which adversely affect the Company’s operations or business; |
| • | the Company’s ability to comply with applicable laws and regulations; |
| • | changes in accounting policies or procedures as may be required by the Financial Accounting Standards Board or regulatory agencies; |
| • | increased costs of deposit insurance and changes with respect to Federal Deposit Insurance Corporation (“FDIC”) insurance coverage levels; and |
| • | further declines in the market value of the Company’s publicly traded stock price or declines in the Company’s ability to generate future cash flows may increase the potential that goodwill recorded on the Company’s consolidated statement of financial position be designated as impaired and that the Company may incur a goodwill write-down in the future. |
The Company cautions readers not to place undue reliance on any forward-looking statements, which speak only as of the date made, and advises readers that various factors, including those described above, could affect the Company’s financial performance and could cause the Company’s actual results or circumstances for future periods to differ materially from those anticipated or projected. See also Item 1A, Risk Factors, in this Form 10-K.
Except as required by law, the Company does not undertake, and specifically disclaims any obligation to publicly release any revisions to any forward-looking statements to reflect the occurrence of anticipated or unanticipated events or circumstances after the date of such statements.
- 4 -
Table of Contents
ITEM 1. BUSINESS
GENERAL
Financial Institutions, Inc. is a financial holding company organized in 1931 under the laws of New York State (“New York” or “NYS”). Through its subsidiaries, including its wholly-owned, New York State chartered banking subsidiary, Five Star Bank, Financial Institutions, Inc. provides deposit, lending and other financial services to individuals and businesses in Central and Western New York. All references in this Form 10-K to the parent company are to Financial Institutions, Inc. (“FII”). Unless otherwise indicated or unless the context requires otherwise, all references in this Form 10-K to “the Company” means Financial Institutions, Inc. and its subsidiaries on a consolidated basis. Five Star Bank is referred to as Five Star Bank, “FSB” or “the Bank”. The parent company is a legal entity separate and distinct from its subsidiaries, assisting those subsidiaries by providing financial resources and management. The Company’s executive offices are located at 220 Liberty Street, Warsaw, New York.
We conduct our business primarily through our banking subsidiary, Five Star Bank, which adopted its current name in 2005 when the Company merged three of its bank subsidiaries, Wyoming County Bank, National Bank of Geneva and Bath National Bank into its New York chartered bank subsidiary, First Tier Bank & Trust, which was then renamed Five Star Bank. In addition, our business operations include a broker-dealer subsidiary, Five Star Investment Services, Inc. (100% owned) (“FSIS”).
In February 2001, the FISI Statutory Trust I (the “Trust”) was formed to facilitate the private placement of $16.2 million in capital securities. FII capitalized the Trust with a $502 thousand investment in the Trust’s common securities. The Trust is accounted for as an unconsolidated subsidiary. Therefore, the Company’s consolidated statements of financial position reflect the $16.7 million in junior subordinated debentures as a liability and the $502 thousand investment in the Trust’s common securities is included in other assets.
OTHER INFORMATION
This annual report, including the exhibits and schedules filed as part of the annual report, may be inspected at the public reference facility maintained by the SEC at its public reference room at 100 F. Street, N.E., Room 1580, Washington, DC 20549 and copies of all or any part thereof may be obtained from that office upon payment of the prescribed fees. You may call the SEC at 1-800-SEC-0330 for further information on the operation of the public reference room and you can request copies of the documents upon payment of a duplicating fee, by writing to the SEC. In addition, the SEC maintains a website that contains reports, proxy and information statements and other information regarding registrants, including us, that file electronically with the SEC which can be accessed at www.sec.gov.
The Company also makes available, free of charge through its website atwww.fiiwarsaw.com, all reports filed with the SEC, including our Annual Report on Form 10-K, Quarterly Reports on Form 10-Q and Current Reports on Form 8-K, as well as any amendments to those reports, as soon as reasonably practicable after those documents are filed with, or furnished to, the SEC. Information available on our website is not a part of, and is not incorporated into, this annual report on Form 10-K.
MARKET AREAS AND COMPETITION
The Company provides a wide range of consumer and commercial banking and financial services to individuals, municipalities and businesses through a network of 51 offices and over 70 ATMs in fourteen contiguous counties of Western and Central New York: Allegany, Cattaraugus, Cayuga, Chautauqua, Chemung, Erie, Genesee, Livingston, Monroe, Ontario, Seneca, Steuben, Wyoming and Yates Counties.
The Company’s market area is geographically and economically diversified in that it serves both rural markets and the larger more affluent markets of suburban Rochester and suburban Buffalo. Rochester and Buffalo are the two largest cities in New York outside of New York City, with combined metropolitan area populations of over two million people. The Company anticipates increasing its presence in and around these metropolitan statistical areas in the coming years.
The Company faces significant competition in both making loans and attracting deposits, as Western and Central New York have a high density of financial institutions. The Company’s competition for loans comes principally from commercial banks, savings banks, savings and loan associations, mortgage banking companies, credit unions, insurance companies and other financial service companies. Its most direct competition for deposits has historically come from commercial banks, savings banks and credit unions. The Company faces additional competition for deposits from non-depository competitors such as the mutual fund industry, securities and brokerage firms and insurance companies.
- 5 -
Table of Contents
LENDING ACTVITIES
General
The Company offers a broad range of loans including commercial and agricultural working capital and revolving lines of credit, commercial and agricultural mortgages, equipment loans, crop and livestock loans, residential mortgage loans and home equity loans and lines of credit, home improvement loans, automobile loans and personal loans. Newly originated and refinanced fixed rate residential mortgage loans are either retained in the Company’s portfolio or sold to the secondary market and servicing rights are retained.
The Company continually evaluates and updates its lending policy. The key elements of the Company’s lending philosophy include the following:
| • | To ensure consistent underwriting, all employees must share a common view of the risks inherent in lending activities as well as the standards to be applied in underwriting and managing credit risk; |
| • | Pricing of credit products should be risk-based; |
| • | The loan portfolio must be diversified to limit the potential impact of negative events; and |
| • | Careful, timely exposure monitoring through dynamic use of our risk rating system is required to provide early warning and assure proactive management of potential problems. |
Commercial, Commercial Real Estate and Agricultural Lending
The Company originates commercial loans in its primary market areas and underwrites them based on the borrower’s ability to service the loan from operating income. The Company offers a broad range of commercial lending products, including term loans and lines of credit. Short and medium-term commercial loans, primarily collateralized, are made available to businesses for working capital (including inventory and receivables), business expansion (including acquisition of real estate, expansion and improvements) and the purchase of equipment. As a general practice, where possible, a collateral lien is placed on any available real estate, equipment or other assets owned by the borrower and a personal guarantee of the owner is obtained. As of December 31, 2009, $49.5 million, or 27%, of the aggregate commercial loan portfolio were at fixed rates, while $136.9 million, or 73%, were at variable rates. The Company utilizes government loan guarantee programs where available and appropriate. See “Government Guarantee Programs” below.
In addition to commercial loans secured by real estate, the Company makes commercial real estate loans to finance the purchase of real property, which generally consists of real estate with completed structures. Commercial real estate loans are secured by first liens on the real estate and are typically amortized over a 10 to 20 year period. The underwriting analysis includes credit verification, appraisals and a review of the borrower’s financial condition and repayment capacity. As of December 31, 2009, $78.2 million, or 25%, of the aggregate commercial real estate loan portfolio were at fixed rates, while $230.7 million, or 75%, were at variable rates.
Agricultural loans are offered for short-term crop production, farm equipment and livestock financing and agricultural real estate financing, including term loans and lines of credit. Short and medium-term agricultural loans, primarily collateralized, are made available for working capital (crops and livestock), business expansion (including acquisition of real estate, expansion and improvement) and the purchase of equipment. As of December 31, 2009, $11.3 million, or 27%, of the agricultural loan portfolio were at fixed rates, while $30.6 million, or 73%, were at variable rates. The Company utilizes government loan guarantee programs where available and appropriate. See “Government Guarantee Programs” below.
Government Guarantee Programs
The Company participates in government loan guarantee programs offered by the Small Business Administration (“SBA”), U.S. Department of Agriculture, Rural Economic and Community Development and Farm Service Agency, among others. As of December 31, 2009, the Company had loans with an aggregate principal balance of $44.4 million that were covered by guarantees under these programs. The guarantees only cover a certain percentage of these loans. By participating in these programs, the Company is able to broaden its base of borrowers while minimizing credit risk.
Consumer Lending
The Company offers a variety of loan products to its consumer customers located in Western and Central New York, including home equity loans and lines of credit, automobile loans, secured installment loans and various other types of secured and unsecured personal loans. At December 31, 2009, outstanding consumer loan balances were concentrated in indirect automobile loans and home equity products.
The Company indirectly originates, through dealers, consumer indirect automobile loans. The consumer indirect loan portfolio is primarily comprised of new and used automobile loans with terms that typically range from 36 to 84 months. The Company has expanded its relationships with franchised new car dealers, primarily in our general market area, and has selectively originated a mix of new and used automobile loans from those dealers. As of December 31, 2009, the consumer indirect portfolio totaled $352.6 million, nearly all of which were fixed rate automobile loans.
- 6 -
Table of Contents
The Company also originates, independently of the indirect loans described above, consumer automobile loans, recreational vehicle loans, boat loans, home improvement loans, closed-end home equity loans, home equity lines of credit, personal loans (collateralized and uncollateralized) and deposit account collateralized loans. The terms of these loans typically range from 12 to 180 months and vary based upon the nature of the collateral and the size of loan. The majority of the consumer lending program is underwritten on a secured basis using the customer’s home or the financed automobile, mobile home, boat or recreational vehicle as collateral. As of December 31, 2009, $121.5 million, or 53%, of consumer and home equity loans were at fixed rates, while $108.5 million, or 47%, were at variable rates.
Residential Mortgage Lending
The Company originates fixed and variable rate one-to-four family residential mortgages collateralized by owner-occupied properties located in its market areas. The Company offers a variety of real estate loan products, which are generally amortized for periods up to 30 years. Loans collateralized by one-to-four family residential real estate generally have been originated in amounts of no more than 80% of appraised value or have mortgage insurance. Mortgage title insurance and hazard insurance are normally required. The Company sells certain one-to-four family residential mortgages to the secondary mortgage market and typically retains the right to service the mortgages. To assure maximum salability of the residential loan products for possible resale, the Company has formally adopted the underwriting, appraisal, and servicing guidelines of the Federal Home Loan Mortgage Corporation (“FHLMC”) as part of its standard loan policy. As of December 31, 2009, the residential mortgage servicing portfolio totaled $349.8 million, the majority of which have been sold to FHLMC. As of December 31, 2009, $103.5 million, or 72%, of residential real estate loans retained in portfolio were at fixed rates, while $40.7 million, or 28%, were at variable rates. The Company does not engage in sub-prime or other high-risk residential mortgage lending as a line-of-business.
Credit Administration
The Company’s loan policy establishes standardized underwriting guidelines, as well as the loan approval process and the committee structures necessary to facilitate and insure the highest possible loan quality decision-making in a timely and businesslike manner. The policy establishes requirements for extending credit based on the size, risk rating and type of credit involved. The policy also sets limits on individual loan officer lending authority and various forms of joint lending authority, while designating which loans are required to be approved at the committee level.
The Company’s credit objectives are as follows:
| • | Compete effectively and service the legitimate credit needs of our target market; |
| • | Enhance our reputation for superior quality and timely delivery of products and services; |
| • | Provide pricing that reflects the entire relationship and is commensurate with the risk profiles of our borrowers; |
| • | Retain, develop and acquire profitable, multi-product, value added relationships with high quality borrowers; |
| • | Focus on government guaranteed lending and establish a specialization in this area to meet the needs of the small businesses in our communities; and |
| • | Comply with the relevant laws and regulations. |
The Company’s policy includes loan reviews, under the supervision of the Audit and Risk Oversight committees of the Board of Directors and directed by the Chief Risk Officer, in order to render an independent and objective evaluation of the Company’s asset quality and credit administration process.
Risk ratings are assigned to loans in the commercial, commercial real estate and agricultural portfolios. The risk ratings are specifically used as follows:
| • | Profile the risk and exposure in the loan portfolio and identify developing trends and relative levels of risk; |
| • | Identify deteriorating credits; and |
| • | Reflect the probability that a given customer may default on its obligations. |
Through the loan approval process, loan administration and loan review program, management seeks to continuously monitor the credit risk profile of the Company and assesses the overall quality of the loan portfolio and adequacy of the allowance for loan losses.
The Company has several procedures in place to assist in maintaining the overall quality of its loan portfolio. Delinquent loan reports are monitored by credit administration to identify adverse levels and trends. Loans, including impaired loans, are generally classified as non-accruing if they are past due as to maturity or payment of principal or interest for a period of more than 90 days, unless such loans are well-collateralized and in the process of collection. Loans that are on a current payment status or past due less than 90 days may also be classified as non-accruing if repayment in full of principal and/or interest is uncertain.
- 7 -
Table of Contents
Allowance for Loan Losses
The allowance for loan losses is established through charges or credits to earnings in the form of a provision (credit) for loan losses. The allowance reflects management’s estimate of the amount of probable loan losses in the portfolio, based on factors such as:
| • | Specific allocations for individually analyzed credits; |
| • | Risk assessment process; |
| • | Historical net charge-off experience; |
| • | Evaluation of the loan portfolio with loan reviews; |
| • | Levels and trends in delinquent and non-accruing loans; |
| • | Trends in volume and terms; |
| • | Effects of changes in lending policy; |
| • | Experience, ability and depth of management; |
| • | National and local economic trends and conditions; |
| • | Concentrations of credit; |
| • | Interest rate environment; |
| • | Customer leverage; |
| • | Information (availability of timely financial information); and |
| • | Collateral values. |
The Company’s methodology in the estimation of the allowance for loan losses includes the following broad areas:
| 1. | Impaired commercial, commercial real estate and agricultural loans, generally in excess of $50 thousand are reviewed individually and assigned a specific loss allowance, if considered necessary, in accordance with U.S. generally accepted accounting principles (“GAAP”). |
| 2. | The remaining portfolios of commercial, commercial real estate and agricultural loans are segmented by risk rating into the following loan classification categories: uncriticized or pass, special mention and substandard. Uncriticized loans, special mention loans and all substandard loans not assigned a specific loss allowance are assigned allowance allocations based on historical net loan charge-off experience for each of the respective loan categories, supplemented with additional reserve amounts, if considered necessary, based upon qualitative factors. These qualitative factors include the levels and trends in delinquencies and non-accruing loans; trends in volume and terms of loans; effects of changes in lending policy; experience, ability, and depth of management; national and local economic conditions; concentrations of credit, interest rate environment; customer leverage; information (availability of timely financial information); and collateral values, among others. |
| 3. | The consumer loan portfolio is segmented into six types of loans: residential real estate, home equity loans, home equity lines of credit, consumer direct, consumer indirect, and overdrafts. Allowance allocations for the real estate related loan portfolios (residential and home equity) are based on the average loss experience for the previous eight quarters, supplemented with qualitative factors similar to the elements described above. Allowance allocations for the consumer direct and consumer indirect portfolios are based on vintage analyses performed with loss data collected over the previous 48 months and 36 months, respectively. The allocations on these portfolios are also supplemented with qualitative factors. The allowance allocation for overdrafts is based on an analysis of the aging of overdrafts as of each quarter end with larger loss assumptions assigned by the aging of accounts. |
Management presents a quarterly review of the adequacy of the allowance for loan losses to the Company’s Board of Directors based on the methodology described above. See also the sections titled “Analysis of Allowance for Loan Losses” and “Allocation of Allowance for Loan Losses” in Part II, Item 7, “Management’s Discussion and Analysis of Financial Condition and Results of Operations.”
- 8 -
Table of Contents
INVESTMENT ACTIVITIES
The Company’s investment policy is contained within its overall Asset-Liability Management and Investment Policy. This policy dictates that investment decisions will be made based on the safety of the investment, liquidity requirements, potential returns, cash flow targets, need for collateral and desired risk parameters. In pursuing these objectives, the Company considers the ability of an investment to provide earnings consistent with factors of quality, maturity, marketability, pledgeable nature and risk diversification. The Company’s Treasurer, guided by the ALCO Committee, is responsible for investment portfolio decisions within the established policies.
The Company’s investment securities strategy centers on providing liquidity to meet loan demand and redeeming liabilities, meeting pledging requirements, managing credit risks, managing overall interest rate risks and maximizing portfolio yield. The Company’s current policy generally limits security purchases to the following:
| • | U.S. treasury securities; |
| • | U.S. government agency securities, which are securities issued by official Federal government bodies (e.g. the Government National Mortgage Association (“GNMA”)) and U.S. government-sponsored enterprise (“GSE”) securities, which are securities issued by independent organizations that are in part sponsored by the federal government (e.g. the Federal Home Loan Bank (“FHLB”) system, the Federal National Mortgage Association (“FNMA”), FHLMC, SBA and the Federal Farm Credit Bureau (“FFCB”)); |
| • | Mortgage-backed securities (“MBS”) include mortgage-backed pass-through securities (“pass-throughs”) and collateralized mortgage obligations (“CMO”) issued by GNMA, FNMA and FHLMC. See also the section titled “Investing Activities” in Part II, Item 7, “Management’s Discussion and Analysis of Financial Condition and Results of Operations;” |
| • | Investment grade municipal securities, including revenue, tax and bond anticipation notes, statutory installment notes and general obligation bonds; |
| • | Certain creditworthy un-rated securities issued by municipalities; |
| • | Certificates of deposit; |
| • | Equity securities at the holding company level; and |
| • | Limited partnership investments in Small Business Investment Companies (“SBIC”). |
SOURCES OF FUNDS
The Company’s primary sources of funds are deposits, borrowed funds and repurchase agreements, scheduled amortization and prepayments of principal from loans and mortgage-backed securities, maturities and calls of investment securities and funds provided by operations.
The Company offers a variety of deposit account products with a range of interest rates and terms. The deposit accounts consist of noninterest-bearing demand, interest-bearing demand, savings, money market, club accounts and certificates of deposit. The Company also offers certificates of deposit with balances in excess of $100,000 to local municipalities, businesses, and individuals as well as Individual Retirement Accounts and other qualified plan accounts. The flow of deposits is influenced significantly by general economic conditions, prevailing interest rates and competition. The Company’s deposits are obtained predominantly from the areas in which its branch offices are located. The Company relies primarily on competitive pricing of its deposit products, customer service and long-standing relationships with customers to attract and retain these deposits. The Company has also utilized certificate of deposit sales in the national brokered market (“brokered deposits”) as a wholesale funding source, however, the Company had no brokered deposits at December 31, 2009. The Company’s borrowings consist mainly of advances entered into with the FHLB, the Federal Reserve’s Term Auction Facility, federal funds purchased and securities sold under repurchase agreements.
OPERATING SEGMENTS
The Company’s primary operating segment is its subsidiary bank, FSB. The Company’s brokerage subsidiary, FSIS, is also deemed an operating segment; however it does not meet the applicable thresholds for separation.
- 9 -
Table of Contents
SUPERVISION AND REGULATION
General
FII and FSB are subject to extensive federal and state laws and regulations that impose restrictions on, and provide for regulatory oversight of, FII’s and FSB’s operations. These laws and regulations are generally intended to protect depositors and not shareholders. Any change in any applicable statute or regulation could have a material effect on FII’s and FSB’s business.
The supervision and regulation of financial and bank holding companies and their subsidiaries is intended primarily for the protection of depositors, the deposit insurance funds regulated by the FDIC and the banking system as a whole, and not for the protection of shareholders or creditors of bank holding companies. The various bank regulatory agencies have broad enforcement power over bank holding companies and banks, including the power to impose substantial fines, operational restrictions and other penalties for violations of laws and regulations.
The Company is also affected by various governmental requirements and regulations, general economic conditions, and the fiscal and monetary policies of the federal government and the FRB. The monetary policies of the FRB influence to a significant extent the overall growth of loans, investments, deposits, interest rates charged on loans, and interest rates paid on deposits. The nature and impact of future changes in monetary policies are often not predictable.
The following description summarizes some of the laws to which the Company is subject. References to applicable statutes and regulations are brief summaries and do not claim to be complete. They are qualified in their entirety by reference to such statutes and regulations. Management believes the Company is in compliance in all material respects with these laws and regulations. Changes in the laws, regulations or policies that impact the Company cannot necessarily be predicted, but they may have a material effect on the Company’s consolidated financial position, consolidated results of operations, or liquidity.
Regulation of FII
FII is a financial holding company registered under the Bank Holding Company Act of 1956, as amended, and is subject to supervision, regulation and examination by the FRB. The Bank Holding Company Act and other federal laws subject bank holding companies to particular restrictions on the types of activities in which they may engage, and to a range of supervisory requirements and activities, including regulatory enforcement actions for violations of laws and regulations.
Regulatory Restrictions on Dividends; Source of Strength.It is the policy of the FRB that bank holding companies should pay cash dividends on common stock only out of income available over the past year, and only if prospective earnings retention is consistent with the holding company’s expected future needs and financial condition. The policy provides that bank holding companies should not maintain a level of cash dividends that undermines the bank holding company’s ability to serve as a source of strength to its subsidiaries.
Under FRB policy, a bank holding company is expected to act as a source of financial strength to each of its subsidiaries and commit resources to their support. Such support may be required at times when, absent this FRB policy, a holding company may not be inclined to provide it. As discussed below, a bank holding company in certain circumstances could be required to guarantee the capital plan of an undercapitalized banking subsidiary.
Safe and Sound Banking Practices.Bank holding companies are not permitted to engage in unsafe and unsound banking practices. The FRB’s Regulation Y, for example, generally requires a holding company to give the FRB prior notice of any redemption or repurchase of its own equity securities, if the consideration to be paid, together with the consideration paid for any repurchases or redemptions in the preceding year, is equal to 10% or more of the company’s consolidated net worth. The FRB may oppose the transaction if it believes that the transaction would constitute an unsafe or unsound practice or would violate any law or regulation. Depending upon the circumstances, the FRB could take the position that paying a dividend would constitute an unsafe or unsound banking practice.
The FRB has broad authority to prohibit activities of bank holding companies and their non-banking subsidiaries which represent unsafe and unsound banking practices or which constitute violations of laws or regulations, and can assess civil money penalties for certain activities conducted on a knowing and reckless basis, if those activities caused a substantial loss to a depository institution. The penalties can be as high as $1,000,000 for each day the activity continues.
Anti-Tying Restrictions.Bank holding companies and their affiliates are prohibited from tying the provision of certain services, such as extensions of credit, to other services offered by a holding company or its affiliates. In 2002, the FRB adopted Regulation W, a comprehensive synthesis of prior opinions and interpretations under Sections 23A and 23B of the Federal Reserve Act. Regulation W contains an extensive discussion of tying arrangements, which could impact the way banks and bank holding companies transact business with affiliates.
- 10 -
Table of Contents
Capital Adequacy Requirements.The FRB has adopted a system using risk-based capital guidelines to evaluate the capital adequacy of bank holding companies. Under the guidelines, specific categories of assets are assigned different risk weights, based generally on the perceived credit risk of the asset. These risk weights are multiplied by corresponding asset balances to determine a “risk-weighted” asset base. The guidelines require a minimum total risk-based capital ratio of 8.0% (of which at least 4.0% is required to consist of Tier 1 capital elements). Total capital is the sum of Tier 1 and Tier 2 capital. As of December 31, 2009, the Company’s ratio of Tier 1 capital to total risk-weighted assets was 11.95% and the ratio of total capital to total risk-weighted assets was 13.21%. See also the section titled “Capital Resources” in Part II, Item 7, “Management’s Discussion and Analysis of Financial Condition and Results of Operations” and Note 10, Regulatory Matters, of the notes to consolidated financial statements.
In addition to the risk-based capital guidelines, the FRB uses a leverage ratio as an additional tool to evaluate the capital adequacy of bank holding companies. The leverage ratio is a company’s Tier 1 capital divided by quarterly average consolidated assets. Certain highly rated bank holding companies may maintain a minimum leverage ratio of 3.0%, but other bank holding companies may be required to maintain a leverage ratio of up to 200 basis points above the regulatory minimum. As of December 31, 2009, the Company’s leverage ratio was 7.96%.
The federal banking agencies’ risk-based and leverage ratios are minimum supervisory ratios generally applicable to banking organizations that meet certain specified criteria, assuming that they have the highest regulatory rating. Banking organizations not meeting these criteria are expected to operate with capital positions well above the minimum ratios. The federal bank regulatory agencies may set capital requirements for a particular banking organization that are higher than the minimum ratios when circumstances warrant. FRB guidelines also provide that banking organizations experiencing internal growth or making acquisitions will be expected to maintain strong capital positions substantially above the minimum supervisory levels, without significant reliance on intangible assets.
Imposition of Liability for Undercapitalized Subsidiaries.Bank regulators are required to take “prompt corrective action” to resolve problems associated with insured depository institutions whose capital declines below certain levels. In the event an institution becomes “undercapitalized,” it must submit a capital restoration plan. The capital restoration plan will not be accepted by the regulators unless each company having control of the undercapitalized institution guarantees the subsidiary’s compliance with the capital restoration plan up to a certain specified amount. Any such guarantee from a depository institution holding company is entitled to a priority of payment in bankruptcy.
The aggregate liability of the holding company of an undercapitalized bank is limited to the lesser of 5% of the institution’s assets at the time it became undercapitalized or the amount necessary to cause the institution to be “adequately capitalized.” The bank regulators have greater power in situations where an institution becomes “significantly” or “critically” undercapitalized or fails to submit a capital restoration plan. For example, a bank holding company controlling such an institution can be required to obtain prior FRB approval of proposed dividends, or might be required to consent to a consolidation or to divest the troubled institution or other affiliates.
Acquisitions by Bank Holding Companies.The Bank Holding Company Act requires every bank holding company to obtain the prior approval of the FRB before it may acquire all or substantially all of the assets of any bank, or ownership or control of any voting shares of any bank, if after such acquisition it would own or control, directly or indirectly, more than 5% of the voting shares of such bank. In approving bank acquisitions by bank holding companies, the FRB is required to consider the financial and managerial resources and future prospects of the bank holding company and the banks involved, the convenience and needs of the communities to be served, and various competitive factors.
Control Acquisitions.The Change in Bank Control Act prohibits a person or group of persons from acquiring “control” of a bank holding company unless the FRB has been notified and has not objected to the transaction. Under a rebuttable presumption established by the FRB, the acquisition of 10% or more of a class of voting stock of a bank holding company with a class of securities registered under Section 12 of the Exchange Act, would, under the circumstances set forth in the presumption, constitute acquisition of control of the Company.
In addition, any entity is required to obtain the approval of the FRB under the Bank Holding Company Act before acquiring 25% (5% in the case of an acquirer that is a bank holding company) or more of the Company’s outstanding common stock, or otherwise obtaining control or a “controlling influence” over the Company.
- 11 -
Table of Contents
Regulation of FSB
Five Star Bank (“FSB” or the “Bank”) is a New York chartered bank and a member of the Federal Reserve System. The FDIC, through the Deposit Insurance Fund (“DIF”), insures deposits of the Bank. The supervision and regulation of FSB subjects the Bank to special restrictions, requirements, potential enforcement actions and periodic examination by the FDIC, the FRB and the New York State Banking Department (“NYSBD”). Because the FRB regulates the holding company parent, the FRB also has supervisory authority that directly affects FSB.
Restrictions on Transactions with Affiliates and Insiders.Transactions between the holding company and its subsidiaries, including the Bank, are subject to Section 23A of the Federal Reserve Act, and to the requirements of Regulation W. In general, Section 23A imposes limits on the amount of such transactions, and also requires certain levels of collateral for loans to affiliated parties. It also limits the amount of advances to third parties, which are collateralized by the securities, or obligations of FII or its subsidiaries.
Affiliate transactions are also subject to Section 23B of the Federal Reserve Act, and to the requirements of Regulation W which generally requires that certain transactions between the holding company and its affiliates be on terms substantially the same, or at least as favorable to the Bank, as those prevailing at the time for comparable transactions with or involving other nonaffiliated persons.
The restrictions on loans to directors, executive officers, principal shareholders and their related interests (collectively referred to herein as “insiders”) contained in the Federal Reserve Act and Regulation O apply to all insured institutions and their subsidiaries and holding companies. These restrictions include limits on loans to one borrower and conditions that must be met before such a loan can be made. There is also an aggregate limitation on all loans to insiders and their related interests. These loans cannot exceed the institution’s total unimpaired capital and surplus, and the FDIC may determine that a lesser amount is appropriate. Insiders are subject to enforcement actions for knowingly accepting loans in violation of applicable restrictions.
Restrictions on Distribution of Subsidiary Bank Dividends and Assets.Dividends paid by the Bank provide a substantial part of FII’s operating funds and, for the foreseeable future, it is anticipated that dividends paid by the Bank will continue to be its principal source of operating funds. Capital adequacy requirements serve to limit the amount of dividends that may be paid by the subsidiaries. Under federal law, the subsidiaries cannot pay a dividend if, after paying the dividend, a particular subsidiary will be “undercapitalized.” The FDIC may declare a dividend payment to be unsafe and unsound even though the bank would continue to meet its capital requirements after the dividend.
Because FII is a legal entity separate and distinct from its subsidiaries, FII’s right to participate in the distribution of assets of any subsidiary upon the subsidiary’s liquidation or reorganization will be subject to the prior claims of the subsidiary’s creditors. In the event of a liquidation or other resolution of an insured depository institution, the claims of depositors and other general or subordinated creditors are entitled to a priority of payment over the claims of holders of any obligation of the institution to its shareholders, including any depository bank holding company (such as FII) or any shareholder or creditor thereof.
Examinations.The NYSBD, the FRB and the FDIC periodically examine and evaluate the Bank. Based upon such examinations, the appropriate regulator may revalue the assets of the institution and require that it establish specific reserves to compensate for the difference between what the regulator determines the value to be and the book value of such assets.
Audit Reports.Insured institutions with total assets of $500 million or more at the beginning of a fiscal year must submit annual audit reports prepared by independent auditors to federal and state regulators. In some instances, the audit report of the institution’s holding company can be used to satisfy this requirement. Auditors must receive examination reports, supervisory agreements and reports of enforcement actions. In addition, financial statements prepared in accordance with GAAP, management’s certifications concerning responsibility for the financial statements, internal controls and compliance with legal requirements designated by the FDIC, and if total assets exceed $1.0 billion, an attestation by the auditor regarding the statements of management relating to the internal controls must be submitted. The FDIC Improvement Act of 1991 requires that independent audit committees be formed, consisting of outside directors only. The committees of institutions with assets of more than $3.0 billion must include members with experience in banking or financial management must have access to outside counsel and must not include representatives of large customers.
Capital Adequacy Requirements.The FDIC has adopted regulations establishing minimum requirements for the capital adequacy of insured institutions. The FDIC may establish higher minimum requirements if, for example, a bank has previously received special attention or has a high susceptibility to interest rate risk. The most recent notification from the FDIC categorized the Bank as well capitalized under the regulatory framework for prompt corrective action.
The FDIC’s risk-based capital guidelines generally require banks to have a minimum ratio of Tier 1 capital to total risk-weighted assets of 4.0% and a ratio of total capital to total risk-weighted assets of 8.0%. The capital categories have the same definitions for the Company. As of December 31, 2009, the ratio of Tier 1 capital to total risk-weighted assets for the Bank was 11.33% and the ratio of total capital to total risk-weighted assets was 12.58%. The FDIC’s leverage guidelines require banks to maintain Tier 1 capital of no less than 4.0% of average total assets, except in the case of certain highly rated banks for which the requirement is 3.0% of average total assets. As of December 31, 2009, the ratio of Tier 1 capital to quarterly average total assets (leverage ratio) was 7.53% for FSB. For further discussion, see Note 10, Regulatory Matters, of the notes to consolidated financial statements included in Item 8 of this Annual Report on Form 10-K.
- 12 -
Table of Contents
Corrective Measures for Capital Deficiencies. The federal banking regulators are required to take “prompt corrective action” with respect to capital-deficient institutions. Agency regulations define, for each capital category, the levels at which institutions are “well-capitalized,” “adequately capitalized,” “undercapitalized,” “significantly undercapitalized” and “critically undercapitalized.” A “well-capitalized” bank has a total risk-based capital ratio of 10.0% or higher; a Tier 1 risk-based capital ratio of 6.0% or higher; a leverage ratio of 5.0% or higher; and is not subject to any written agreement, order or directive requiring it to maintain a specific capital level for any capital measure. An “adequately capitalized” bank has a total risk-based capital ratio of 8.0% or higher; a Tier 1 risk-based capital ratio of 4.0% or higher; a leverage ratio of 4.0% or higher (3.0% or higher if the bank was rated a composite 1 in its most recent examination report and is not experiencing significant growth); and does not meet the criteria for a well-capitalized bank. A bank is “undercapitalized” if it fails to meet any one of the “adequately capitalized” ratios.
In addition to requiring undercapitalized institutions to submit a capital restoration plan, agency regulations contain broad restrictions on certain activities of undercapitalized institutions including asset growth, acquisitions, branch establishment and expansion into new lines of business. With certain exceptions, an insured depository institution is prohibited from making capital distributions, including dividends, and is prohibited from paying management fees to control persons if the institution would be undercapitalized after any such distribution or payment.
As an institution’s capital decreases, the FDIC’s enforcement powers become more severe. A significantly undercapitalized institution is subject to mandated capital raising activities, restrictions on interest rates paid and transactions with affiliates, removal of management and other restrictions. The FDIC has only very limited discretion in dealing with a critically undercapitalized institution and is virtually required to appoint a receiver or conservator.
Banks with risk-based capital and leverage ratios below the required minimums may also be subject to certain administrative actions, including the termination of deposit insurance upon notice and hearing, or a temporary suspension of insurance without a hearing in the event the institution has no tangible capital.
Deposit Insurance Assessments.The FDIC maintains the DIF by assessing depository institutions an insurance premium on a quarterly basis. The amount of the assessment is a function of the institution’s risk category, of which there are four, and assessment base. An institution’s risk category is determined according to its supervisory ratings and capital levels and is used to determine the institution’s assessment rate. The assessment rate for risk categories are calculated according to a formula, which relies on supervisory ratings and either certain financial ratios or long-term debt ratings. An insured bank’s assessment base is determined by the balance of its insured deposits. Because the system is risk-based, it allows banks to pay lower assessments to the FDIC as their capital level and supervisory ratings improve. By the same token, if these indicators deteriorate, the institution will have to pay higher assessments to the FDIC.
Under the Federal Deposit Insurance Act, the FDIC Board has the authority to set the annual assessment rate range for the various risk categories within certain regulatory limits and to impose special assessments upon insured depository institutions when deemed necessary by the FDIC’s Board. As part of the Deposit Insurance Fund Restoration Plan adopted by the FDIC in October 2008, on February 27, 2009, the FDIC adopted the final rule modifying the risk-based assessment system, which set initial base assessment rates between 12 and 45 basis points, beginning April 1, 2009. The FDIC imposed an emergency special assessment on June 30, 2009, which totaled $923 thousand and was collected in September 2009. In addition, in September 2009, the FDIC extended the Restoration Plan period to eight years. On November 12, 2009, the FDIC adopted a final rule requiring prepayment of 13 quarters of FDIC premiums. The Bank’s required prepayment amounted to $9.9 million and was collected in December 2009.
DIF-insured institutions pay a Financing Corporation (“FICO”) assessment in order to fund the interest on bonds issued in the 1980s in connection with the failures in the thrift industry. For the fourth quarter of 2009, the FICO assessment is equal to 1.06 basis points for each $100 in domestic deposits. These assessments will continue until the bonds mature in 2019. The FDIC bills and collects this assessment on behalf of FICO.
Enforcement Powers.The FDIC, the NYSBD and the FRB have broad enforcement powers, including the power to terminate deposit insurance, impose substantial fines and other civil and criminal penalties and appoint a conservator or receiver. Failure to comply with applicable laws, regulations and supervisory agreements could subject the Company or the Bank, as well as the officers, directors and other institution-affiliated parties of these organizations, to administrative sanctions and potentially substantial civil money penalties.
Federal Home Loan Bank System.FSB is a member of the FHLB System, which consists of 12 regional branches. The FHLB System provides a central credit facility primarily for member institutions. As members of the FHLB of New York (“FHLBNY”), the Bank is required to acquire and hold shares of capital stock in the FHLB. The minimum investment requirement is determined by a “membership” investment component and an “activity-based” investment component. Under the “membership” component, a certain minimum investment in capital stock is required to be maintained as long as the institution remains a member of the FHLB. Under the “activity-based” component, members are required to purchase capital stock in proportion to the volume of certain transactions with the FLHB. As of December 31, 2009, FSB complied with these requirements.
- 13 -
Table of Contents
Community Reinvestment Act.The Community Reinvestment Act of 1977 (“CRA”) and the regulations issued hereunder are intended to encourage banks to help meet the credit needs of their service area, including low and moderate income neighborhoods, consistent with the safe and sound operations of the banks. These regulations also provide for regulatory assessment of a bank’s record in meeting the needs of its service area when considering applications regarding establishing branches, mergers or other bank or branch acquisitions. The Financial Institutions Reform, Recovery and Enforcement Act of 1989 requires federal banking agencies to make public a rating of a bank’s performance under the CRA. In the case of a bank holding company, the CRA performance record of the banks involved in the transaction are reviewed in connection with the filing of an application to acquire ownership or control of shares or assets of a bank or to merge with any other bank holding company. An unsatisfactory record can substantially delay or block the transaction. FSB received a rating of “outstanding” as of its most recent CRA performance evaluation.
Consumer Laws and Regulations.In addition to the laws and regulations discussed herein, the Bank is also subject to certain consumer laws and regulations that are designed to protect consumers in transactions with banks. While the list set forth herein is not exhaustive, these laws and regulations include, among others, the Truth in Lending Act, the Truth in Savings Act, the Electronic Funds Transfer Act, the Expedited Funds Availability Act, the Equal Credit Opportunity Act, the Fair Housing Act, the Home Mortgage Disclosure Act and the Real Estate Settlement Procedures Act. These laws and regulations mandate certain disclosure requirements and regulate the manner in which financial institutions must deal with customers when taking deposits or making loans to such customers. The Bank must comply with the applicable provisions of these consumer protection laws and regulations as part of their ongoing customer relations. The Check Clearing for the 21st Century Act (“Check 21 Act” or “the Act”), which became effective on October 28, 2004, creates a new negotiable instrument, called a “substitute check”, which banks are required to accept as the legal equivalent of a paper check if it meets the requirements of the Act. The Act is designed to facilitate check truncation, to foster innovation in the check payment system, and to improve the payment system by shortening processing times and reducing the volume of paper checks.
Gramm-Leach-Bliley Act
The Gramm-Leach-Bliley Act (“Gramm-Leach”) was signed into law on November 12, 1999. Gramm-Leach permits, subject to certain conditions, combinations among banks, securities firms and insurance companies. Under Gramm-Leach, bank holding companies are permitted to offer their customers virtually any type of financial service including banking, securities underwriting, insurance (both underwriting and agency), and merchant banking. In order to engage in these additional financial activities, a bank holding company must qualify and register with the Board of Governors of the Federal Reserve System as a “financial holding company” by demonstrating that each of its subsidiaries is “well capitalized,” “well managed,” and has at least a “satisfactory” rating under the CRA. During the second quarter of 2008, FII received FRB approval for an election to re-instate its status as a financial holding company, which the Company terminated during 2003. The change in status did not affect the activities being conducted by the Company or its subsidiaries. Gramm-Leach establishes that the federal banking agencies will regulate the banking activities of financial holding companies and banks’ financial subsidiaries, the SEC will regulate their securities activities and state insurance regulators will regulate their insurance activities. Gramm-Leach also provides new protections against the transfer and use by financial institutions of consumers’ nonpublic, personal information.
The major provisions of Gramm-Leach include:
Financial Holding Companies and Financial Activities.Title I establishes a comprehensive framework to permit affiliations among commercial banks, insurance companies, securities firms, and other financial service providers by revising and expanding the Bank Holding Company Act framework to permit a holding company system to engage in a full range of financial activities through qualification as a new entity known as a financial holding company. A bank holding company that qualifies as a financial holding company can expand into a wide variety of services that are financial in nature, if its subsidiary depository institutions are “well-managed”, “well-capitalized” and have received at least a “satisfactory” rating on their last CRA examination. Services that have been deemed to be financial in nature include securities underwriting, dealing and market making, sponsoring mutual funds and investment companies, insurance underwriting and agency activities and merchant banking.
Securities Activities.Title II narrows the exemptions from the securities laws previously enjoyed by banks, requires the FRB and the SEC to work together to draft rules governing certain securities activities of banks and creates a new, voluntary investment bank holding company.
Insurance Activities.Title III restates the proposition that the states are the functional regulators for all insurance activities, including the insurance activities of federally chartered banks, and bars the states from prohibiting insurance activities by depository institutions. The law encourages the states to develop uniform or reciprocal rules for the licensing of insurance agents.
- 14 -
Table of Contents
Privacy.Under Title V, federal banking regulators were required to adopt rules that have limited the ability of banks and other financial institutions to disclose non-public information about consumers to nonaffiliated third parties. These limitations require disclosure of privacy policies to consumers and, in some circumstances, allow consumers to prevent disclosure of certain personal information to a nonaffiliated third party. Federal banking regulators issued final rules on May 10, 2000 to implement the privacy provisions of Title V. Under the rules, financial institutions must provide:
| • | Initial notices to customers about their privacy policies, describing the conditions under which they may disclose nonpublic personal information to nonaffiliated third parties and affiliates; |
| • | Annual notices of their privacy policies to current customers; and |
| • | A reasonable method for customers to “opt out” of disclosures to nonaffiliated third parties. |
The Bank is in full compliance with the rules.
Safeguarding Confidential Customer Information.Under Title V, federal banking regulators are required to adopt rules requiring financial institutions to implement a program to protect confidential customer information. In January 2000, the federal banking agencies adopted guidelines requiring financial institutions to establish an information security program to:
| • | Identify and assess the risks that may threaten customer information; |
| • | Develop a written plan containing policies and procedures to manage and control these risks; |
| • | Implement and test the plan; and |
| • | Adjust the plan on a continuing basis to account for changes in technology, the sensitivity of customer information and internal or external threats to information security. |
The Bank approved security programs appropriate to its size and complexity and the nature and scope of its operations prior to the effective date of the regulatory guidelines. The implementation of the programs is an ongoing process.
USA Patriot Act
As part of the Uniting and Strengthening America by Providing Appropriate Tools Required to Intercept and Obstruct Terrorism Act of 2001 (“USA Patriot Act”), signed into law on October 26, 2001, Congress adopted the International Money Laundering Abatement and Financial Anti-Terrorism Act of 2001 (“AML”). AML authorizes the Secretary of the Treasury, in consultation with the heads of other government agencies, to adopt special measures applicable to banks, bank holding companies or other financial institutions. During 2002, the Department of Treasury issued a number of regulations relating to enhanced recordkeeping and reporting requirements for certain financial transactions that are of primary money laundering concern, due diligence requirements concerning the beneficial ownership of certain types of accounts, and restrictions or prohibitions on certain types of accounts with foreign financial institutions. Covered financial institutions also are barred from dealing with foreign “shell” banks. In addition, AML expands the circumstances under which funds in a bank account may be forfeited and requires covered financial institutions to respond under certain circumstances to requests for information from federal banking agencies within 120 hours.
Regulations were also adopted during 2002 to implement minimum standards to verify customer identity, to encourage cooperation among financial institutions, federal banking agencies, and law enforcement authorities regarding possible money laundering or terrorist activities, to prohibit the anonymous use of “concentration accounts,” and to require all covered financial institutions to have in place a Bank Secrecy Act compliance program. AML also amends the Bank Holding Company Act and the Bank Merger Act to require the federal banking agencies to consider the effectiveness of a financial institution’s anti-money laundering activities when reviewing an application under these acts.
The Bank has in place a Bank Secrecy Act compliance program, and it engages in very few transactions of any kind with foreign financial institutions or foreign persons.
Sarbanes-Oxley Act
On July 30, 2002, the President signed into law the Sarbanes-Oxley Act of 2002 (the “Act”) implementing legislative reforms intended to address corporate and accounting fraud. In addition to the establishment of a new accounting oversight board that enforces auditing, quality control and independence standards and is funded by fees from all publicly traded companies, the law restricts accounting firms from providing both auditing and consulting services to the same client. To ensure auditor independence, any non-audit services being provided to an audit client requires pre-approval by the issuer’s audit committee members. In addition, the audit partners must be rotated. The Act requires chief executive officers and chief financial officers, or their equivalent, to certify to the accuracy of periodic reports filed with the SEC, subject to civil and criminal penalties if they knowingly or willfully violate this certification requirement. In addition, under the Act, legal counsel is required to report evidence of a material violation of the securities laws or a breach of fiduciary duty by a company to its chief executive officer or its chief legal officer, and, if such officer does not appropriately respond, to report such evidence to the audit committee or other similar committee of the board of directors or the board itself.
- 15 -
Table of Contents
Longer prison terms and increased penalties are also applied to corporate executives who violate federal securities laws, the period during which certain types of suits can be brought against a company or its officers has been extended, and bonuses issued to top executives prior to restatement of a company’s financial statements are subject to disgorgement if such restatement was due to corporate misconduct. Executives are also prohibited from insider trading during retirement plan “blackout” periods, and loans to company executives are restricted. The Act accelerates the time frame for disclosures by public companies, as they must immediately disclose any material changes in their financial condition or operations. Directors and executive officers must also provide information for most changes in ownership in a company’s securities within two business days of the change.
The Act also prohibits any officer or director of a company or any other person acting under their direction from taking any action to fraudulently influence, coerce, manipulate or mislead any independent public or certified accountant engaged in the audit of the company’s financial statements for the purpose of rendering the financial statement’s materially misleading. The Act also requires the SEC to prescribe rules requiring inclusion of an internal control report and assessment by management in the annual report to stockholders. In addition, the Act requires that each financial report required to be prepared in accordance with (or reconciled to) accounting principles generally accepted in the United States of America and filed with the SEC reflect all material correcting adjustments that are identified by a “registered public accounting firm” in accordance with accounting principles generally accepted in the United States of America and the rules and regulations of the SEC.
As directed by Section 302(a) of the Act, the Company’s chief executive officer and chief financial officer are each required to certify that the Company’s quarterly and annual reports do not contain any untrue statement of a material fact. The Act imposes several requirements, including having these officers certify that: they are responsible for establishing, maintaining and regularly evaluating the effectiveness of the Company’s internal controls; they have made certain disclosures to the Company’s auditors and the Audit Committee of the Board of Directors about the Company’s internal controls; and they have included information in the Company’s quarterly and annual reports about their evaluation and whether there have been significant changes in the Company’s internal controls or in other factors that could significantly affect internal controls during the last quarter.
Fair Credit Reporting Act and Fair and Accurate Transactions Act
In 1970, the U. S. Congress enacted the Fair Credit Reporting Act (the “FCRA”) in order to ensure the confidentiality, accuracy, relevancy and proper utilization of consumer credit report information. Under the framework of the FCRA, the United States has developed a highly advanced and efficient credit reporting system. The information contained in that broad system is used by financial institutions, retailers and other creditors of every size in making a wide variety of decisions regarding financial transactions. Employers and law enforcement agencies have also made wide use of the information collected and maintained in databases made possible by the FCRA. The FCRA affirmatively preempts state law in a number of areas, including the ability of entities affiliated by common ownership to share and exchange information freely, the requirements on credit bureaus to reinvestigate the contents of reports in response to consumer complaints, among others. By its terms, the preemption provisions of the FCRA were to terminate as of December 31, 2003. With the enactment of the Fair and Accurate Transactions Act (the “FACT Act”) in late 2003, the preemption provisions of FCRA were extended, although the FACT Act imposes additional requirements on entities that gather and share consumer credit information. The FACT Act required the FRB and the Federal Trade Commission (“FTC”) to issue final regulations within nine months of the effective date of the Act. A series of regulations and announcements have been promulgated, including a joint FTC/FRB announcement of effective dates for FCRA amendments, the FTC’s “Free Credit Report” rule, revisions to the FTC’s FACT Act Rules, the FTC’s final rules on identity theft and proof of identity, the FTC’s final regulation on consumer information and records disposal, the FTC’s final summaries and the final rule on prescreen notices.
- 16 -
Table of Contents
Emergency Economic Stabilization Act of 2008
On October 3, 2008, President Bush signed into law the Emergency Economic Stabilization Act of 2008 (“EESA”), giving the Treasury authority to take certain actions to restore liquidity and stability to the U.S. banking markets. Based upon its authority in the EESA, a number of programs to implement EESA have been announced. Those programs include the following:
| • | Capital Purchase Program. Pursuant to this program, the Treasury, on behalf of the U.S. government, purchased preferred stock, along with warrants to purchase common stock, from certain financial institutions, including bank holding companies, savings and loan holding companies and banks or savings associations not controlled by a holding company. The investment has a dividend rate of 5% per year, until the fifth anniversary of the Treasury’s investment and a dividend of 9% thereafter. | ||
| During the time the Treasury holds securities issued pursuant to this program, participating financial institutions are required to comply with certain provisions regarding executive compensation and corporate governance. Participation in this program also imposes certain restrictions upon an institution’s dividends to common shareholders and stock repurchase activities. As described further herein, we elected to participate in the CPP and received $37.5 million pursuant to the program. | |||
| While any senior preferred stock is outstanding, we may pay dividends on our common stock, provided that all accrued and unpaid dividends for all past dividend periods on the senior preferred stock are fully paid. Prior to the third anniversary of the UST’s purchase of the Senior Preferred Stock, unless the senior preferred stock has been redeemed or the UST has transferred all of the senior preferred stock to third parties, the consent of the UST will be required for us to increase our quarterly common stock dividend above $0.10 per share. |
| • | Temporary Liquidity Guarantee Program. This program contained both (i) a debt guarantee component (“Debt Guarantee Program”), whereby the FDIC will guarantee until June 30, 2012, the senior unsecured debt issued by eligible financial institutions between October 14, 2008 and October 31, 2009 (although a limited, six-month emergency guarantee facility has been established by the FDIC whereby certain participating entities can apply to the FDIC for permission to issue FDIC-guaranteed debt during the period from October 31, 2009 through April 30, 2010); and (ii) a transaction account guarantee (“TAG”) component (“TAG Program”), whereby the FDIC will insure 100% of noninterest bearing deposit transaction accounts held at eligible financial institutions, such as payment processing accounts, payroll accounts and working capital accounts through December 31, 2009. The Company opted into the TAG Program but not the Debt Guarantee Program, which concluded on October 31, 2009. On August 26, 2009, the FDIC approved the final rule extending the TAG Program for six months until June 30, 2010, and increased the applicable TAG assessment fees during that six month period. The Company did not opt out of the TAG program extension, which is expected to increase future FDIC insurance costs. |
| • | Temporary increase in deposit insurance coverage. Pursuant to the EESA, the FDIC temporarily raised the basic limit on federal deposit insurance coverage from $100,000 to $250,000 per depositor. The EESA provides that the basic deposit insurance limit will return to $100,000 after December 31, 2009, but the temporary increase has been extended through December 31, 2013, and is permanent for certain retirement accounts (including IRAs). |
| • | Change in Tax Treatment of Fannie Mae and Freddie Mac Preferred Stock. Section 301 of the EESA changes the tax treatment of gains or losses from the sale or exchange of FNMA or FHLMC preferred stock by an “applicable financial institution,” such as FSB, by stating that a gain or loss on Fannie Mae or Freddie Mac preferred stock shall be treated as ordinary gain or loss instead of capital gain or loss, as was previously the case. This change, which was enacted in the 2008 fourth quarter, provides tax relief to banking organizations that have suffered losses on certain direct and indirect investments in Fannie Mae and Freddie Mac preferred stock. As a result, the Company was able to recognize as an ordinary loss the other-than-temporary-impairment (“OTTI”) charge on its investment in auction rate preferred equity securities, which were collateralized by FNMA and FHLMC preferred stock, for the year ended December 31, 2008. |
Impact of Inflation and Changing Prices
The Company’s financial statements included herein have been prepared in accordance with GAAP, which requires the Company to measure financial position and operating results principally using historic dollars. Changes in the relative value of money due to inflation or recession are generally not considered. The primary effect of inflation on the operations of the Company is reflected in increased operating costs. In the Company’s view, changes in interest rates affect the financial condition of a financial institution to a far greater degree than changes in the inflation rate. While interest rates are generally influenced by changes in the inflation rate, they do not necessarily change at the same rate or in the same magnitude. Interest rates are sensitive to many factors that are beyond the control of the Company, including changes in the expected rate of inflation, general and local economic conditions and the monetary and fiscal policies of the United States government, its agencies and various other governmental regulatory authorities.
- 17 -
Table of Contents
Regulatory and Economic Policies
The Company’s business and earnings are affected by general and local economic conditions and by the monetary and fiscal policies of the U.S. government, its agencies and various other governmental regulatory authorities. The FRB regulates the supply of money in order to influence general economic conditions. Among the instruments of monetary policy available to the FRB are (i) conducting open market operations in U.S. government obligations, (ii) changing the discount rate on financial institution borrowings, (iii) imposing or changing reserve requirements against financial institution deposits, and (iv) restricting certain borrowings and imposing or changing reserve requirements against certain borrowings by financial institutions and their affiliates. These methods are used in varying degrees and combinations to directly affect the availability of bank loans and deposits, as well as the interest rates charged on loans and paid on deposits. For that reason, the policies of the FRB could have a material effect on the earnings of the Company.
EMPLOYEES
At December 31, 2009, the Company had 513 full-time and 107 part-time employees. None of the employees are subject to a collective bargaining agreement and management believes its relations with employees are good.
EXECUTIVE OFFICERS OF REGISTRANT
The following table sets forth current information regarding the Company’s executive officers and certain other significant employees (ages are as of the 2010 Annual Meeting).
| Starting | ||||||||||
| Name | Age | In | Positions/Offices | |||||||
| Peter G. Humphrey | 55 | 1977 | President and Chief Executive Officer of FII and Five Star Bank. | |||||||
| Karl F. Krebs | 54 | 2009 | Executive Vice President and Chief Financial Officer of FII and Five Star Bank. Senior Financial Specialist at West Valley Environmental Services, LLC prior to joining FII in 2009. President of Robar General Funding Corp. from 2006 to 2008. Senior Vice President and Line-of-Business Finance Director at Five Star Bank from 2005 to 2006 and Senior Vice President at Wyoming County Bank from 2004 to 2005. | |||||||
| Martin K. Birmingham | 43 | 2005 | Executive Vice President and Regional President / Commercial Banking Executive Officer of Five Star Bank. Senior Team Leader and Regional President of the Rochester Market at Bank of America (formally Fleet Boston Financial) from 2000 to 2005. | |||||||
| George D. Hagi | 57 | 2006 | Executive Vice President and Chief Risk Officer of FII and Five Star Bank. Senior Vice President and Director of Risk Management at First National Bankshares of Florida and FNB Corp. from 1997 to 2005. | |||||||
| Richard J. Harrison | 64 | 2003 | Executive Vice President and Senior Retail Lending Administrator of Five Star Bank. Executive Vice President and Chief Credit Officer at Savings Bank of the Finger Lakes from 2000 to 2003. | |||||||
| Kevin B. Klotzbach | 57 | 2001 | Senior Vice President and Treasurer of Five Star Bank. | |||||||
| R. Mitchell McLaughlin | 52 | 1981 | Executive Vice President and Chief Information Officer of Five Star Bank. | |||||||
| Matthew T. Murtha | 55 | 2000 | Senior Vice President and Director of Sales and Marketing of Five Star Bank. | |||||||
| Bruce H. Nagle | 61 | 2006 | Senior Vice President and Director of Human Resources of FII and Five Star Bank. Vice President of Human Resources at University of Pittsburgh Medical Center from 2000 to 2006. | |||||||
| John L. Rizzo | 60 | 2010 | Senior Vice President and Corporate Secretary of FII and Five Star Bank. Counsel (in-house) for FII and Five Star Bank from 2007 to 2010. Genesee County (New York) Attorney from 1976 to 2010. | |||||||
| John J. Witkowski | 47 | 2005 | Executive Vice President and Regional President / Retail Banking Executive Officer of Five Star Bank. Senior Vice President and Director of Sales for Business Banking / Client Development Group at Bank of America from 1993 to 2005. | |||||||
- 18 -
Table of Contents
ITEM 1A. RISK FACTORS
Making or continuing an investment in securities issued by the Company, including its common stock, involves certain risks that you should carefully consider. The risks and uncertainties described below are not the only risks that may have a material adverse effect on the Company. Additional risks and uncertainties also could adversely affect the Company’s business, financial condition and results of operations. If any of the following risks actually occur, the Company’s business, financial condition or results of operations could be negatively affected, the market price for your securities could decline, and you could lose all or a part of your investment. Further, to the extent that any of the information contained in this Annual Report on Form 10-K constitutes forward-looking statements, the risk factors set forth below also are cautionary statements identifying important factors that could cause the Company’s actual results to differ materially from those expressed in any forward-looking statements made by or on behalf of the Company.
The Company’s business may be adversely impacted by adverse conditions in the financial markets and economic conditions generally.
The capital and credit markets have been experiencing unprecedented levels of volatility and disruption for more than a year. In some cases, the markets have produced downward pressure on stock prices and credit availability for certain issuers without regard to those issuers’ underlying financial strength. As a consequence of the recession that the United States now finds itself in, business activity across a wide range of industries face serious difficulties due to the lack of consumer spending and the extreme lack of liquidity in the global credit markets. Unemployment has also increased significantly.
A sustained weakness or weakening in business and economic conditions generally or specifically in the principal markets in which the Company does business could have one or more of the following material adverse impacts on the Company’s business, financial condition and results of operations:
| • | An impairment of securities in our investment portfolio; |
| • | A decrease in the demand for loans and other products and services offered by the Company; |
| • | A decrease in the value of our loans held for sale or other assets secured by consumer or commercial real estate; |
| • | An impairment of certain intangible assets, such as goodwill; |
| • | An increase in the number of clients and counterparties who become delinquent, file for protection under bankruptcy laws or default on their loans or other obligations to the Company. An increase in the number of delinquencies, bankruptcies or defaults could result in a higher level of non-performing assets, net charge-offs, provision for loan losses, and valuation adjustments on loans held for sale. |
Current market developments may adversely impact the Company’s industry and business.
Dramatic declines in the housing market during the prior year, with falling home prices and increasing foreclosures and unemployment, have resulted in, and may continue to result in, significant write-downs of asset values by the Company and other financial institutions, including government-sponsored entities and major commercial and investment banks. These write-downs, initially of mortgage-backed securities but spreading to credit default swaps and other derivative securities, have caused many financial institutions to seek additional capital, to merge with larger and stronger institutions and, in some cases, to fail. Reflecting concern about the stability of the financial markets generally and the strength of counterparties, many lenders and institutional investors have reduced, and in some cases, ceased to provide funding to borrowers including financial institutions.
This market turmoil and tightening of credit have led to an increased level of commercial and consumer delinquencies, lack of consumer confidence, increased market volatility and widespread reduction of business activity generally. The resulting lack of available credit, lack of confidence in the financial sector, increased volatility in the financial markets and reduced business activity could have a material adverse impact on the Company’s business, financial condition or results of operations.
Further negative market developments may affect consumer confidence levels and may cause adverse changes in payment patterns, causing increases in delinquencies and default rates, which may impact our charge-offs and provisions for credit losses. A worsening of these conditions would likely exacerbate the adverse effects of these difficult market conditions on the financial services industry and could have a material adverse impact on the Company’s business, financial condition or results of operations.
The Company is subject to liquidity risks.
The Company maintains liquidity primarily through customer deposits and other funding sources. If economic influences change so that we do not have access to short-term credit, or our depositors withdraw a substantial amount of their funds for other uses, the Company might experience liquidity issues. Our efforts to monitor and manage liquidity risk may not be successful or sufficient to deal with dramatic or unanticipated reductions in our liquidity. In such events, our cost of funds may increase, thereby reducing our net interest revenue, or we may need to sell a portion of our investment and/or loan portfolio, which, depending upon market conditions, could result in our realizing a loss.
- 19 -
Table of Contents
The soundness of other financial institutions, including the FHLB, could adversely impact the Company.
The Company’s ability to engage in routine funding transactions could be adversely affected by the actions and commercial soundness of other financial institutions. Financial services institutions are interrelated as a result of counterparty relationships. The Company has exposure to many different industries and counterparties, and routinely executes transactions with counterparties in the financial services industry. An important counterparty for the Company, in terms of liquidity, is the FHLBNY, which the Company uses as its primary source of long-term wholesale funding. At December 31, 2009, the Company had a total of $30.1 million in borrowed funds with FHLBNY.
There are twelve regional branches of the FHLB, including FHLBNY. Several members have warned that they have either breached risk-based capital requirements or that they are close to breaching those requirements. To conserve capital, some FHLB branches are suspending dividends, cutting dividend payments, and not buying back excess FHLB stock that members hold. FHLBNY has stated that they expect to be able to continue to pay dividends, redeem excess capital stock, and provide competitively priced advances in the future. The most severe problems in the FHLB system have been at some of the other FHLB branches. Nonetheless, the twelve FHLB branches are jointly liable for the consolidated obligations of the FHLB system. To the extent that one FHLB branch cannot meet its obligations to pay its share of debt, other FHLB branches may be called upon to make the payment.
As a member of the FHLB system, the Company is required to hold stock in FHLBNY. The carrying value and fair value of the Company’s FHLBNY common stock as of December 31, 2009 was $3.3 million based on its par value. In an extreme situation, it is possible that the capitalization of an FHLB, including FHLBNY, could be substantially diminished or reduced to zero. Consequently, given that there is no market for the Company’s FHLBNY common stock, there is a risk that the investment could be determined to be impaired in the future.
Deterioration in the soundness of FHLBNY or the FHLB system could have a material adverse impact on the Company’s business, financial condition, results of operations or liquidity.
The Company’s municipal bond portfolio may be adversely affected by the political, economic and legislative environment in New York State.
Approximately 20% of our investment securities portfolio at December 31, 2009, is comprised of municipal securities issued by or on behalf of New York and its political subdivisions, agencies or instrumentalities, the interest on which is exempt from regular federal income tax. Risks associated with investing in municipal securities include political, economic and regulatory factors which may affect the issuers.
In response to the current national economic downturn, governmental cost burdens may be reallocated among federal, state and local governments. In addition, laws enacted in the future by Congress or state legislatures or referenda could extend the time for payment of principal and/or interest, or impose other constraints on enforcement of such obligations, or on the ability of municipalities to levy taxes. Other factors including national economic, social and environmental policies and conditions, which are not within the control of the issuers of the bonds, could affect or have an adverse impact on the financial condition of the issuers. Issuers of municipal securities might seek protection under the bankruptcy laws. Investments in municipal securities are subject to the risk that the issuer could default on its obligations. Such a default could result from the inadequacy of the sources of revenues from which interest and principal payments are to be made or the assets collateralizing such obligations.
The current fiscal situation in New York may lead nationally recognized rating agencies to downgrade its debt obligations. It is uncertain how the financial markets may react to any potential future ratings downgrade in New York’s debt obligations. However, the fallout from the recent budgetary crisis and a possible ratings downgrade could adversely affect the value of New York’s obligations, which could result in a material adverse impact on the Company’s business, financial condition, results of operations or liquidity.
The value of certain securities in the Company’s investment securities portfolio may be negatively affected by disruptions in the market for these securities.
In addition to interest rate risk typically associated with an investment portfolio, the market for certain investment securities held within the Company’s investment portfolio has, over the past year, become much less liquid. This coupled with uncertainty surrounding the credit risk associated with the underlying collateral has caused material discrepancies in valuation estimates obtained from third parties. The Company values some of its investments using internally developed cash flow and valuation models, which include certain subjective estimates which are believed to reflect the estimates a purchaser of such securities would use if such a transaction were to occur. The volatile market may affect the value of these securities, such as through reduced valuations due to the perception of heightened credit and liquidity risks, in addition to interest rate risk typically associated with these securities. There can be no assurance that the declines in market value associated with these disruptions will not result in impairments of these assets, which could have a material adverse impact on the Company’s business, financial condition, results of operations or liquidity.
- 20 -
Table of Contents
The limitations on incentive compensation contained in the ARRA may adversely affect the Company’s ability to retain its highest performing employees.
The limitations placed on incentive compensation in the interim final TARP regulations issued under the ARRA have created restrictions on the amount and form of incentive compensation that may impact negatively the Company’s ability to create a compensation structure that permits it to retain its highest performing employees.
Participants in the CPP are subject to certain restrictions on dividends, repurchases of common stock and executive compensation.
The Company is subject to restrictions on dividends, repurchases of common stock, and executive compensation. Compliance with these restrictions and other restrictions may increase the Company’s costs and limit its ability to pursue business opportunities. Additionally, any reduction of, or the elimination of, the Company’s common stock dividend in the future could adversely affect the market price of the Company’s common stock. The current restrictions, as well as any possible future restrictions, associated with participation in the CPP could have a material adverse impact on the Company’s business, financial condition, results of operations.
Negative perceptions associated with our continued participation in the Treasury’s TARP may adversely affect our ability to retain customers, attract investors, and compete for new business opportunities.
Several financial institutions which also participated in the CPP have repurchased their TARP preferred stock. There can be no assurance as to the timing or manner in which the Company may repurchase its TARP preferred stock from the Treasury. Our customers, employees and counterparties in our current and future business relationships could draw negative implications regarding the strength of the Company as a financial institution based on our continued participation in the TARP following the exit of one or more of our competitors or other financial institutions. Any such negative perceptions could impair our ability to effectively compete with other financial institutions for business or to retain high performing employees. If this were to occur, the Company’s business, financial condition, and results of operations may be adversely affected, perhaps materially.
The Company has not yet attempted to obtain permission to repay TARP funds.
In order to repay the TARP funds we received, we must first receive approval from our primary federal regulator who will then forward our application to the Treasury. To date, we have not attempted to obtain the necessary governmental approval to repay such funds. Until we repay our TARP funds, we will continue to be subject to the constraints imposed on us by the federal government in connection with such funds.
FDIC insurance premiums may increase materially.
During 2008 and continuing in 2009, higher levels of bank failures have dramatically increased resolution costs of the FDIC, and depleted the DIF. In addition, the FDIC and the U.S. Congress have taken action to increase federal deposit insurance coverage, placing additional stress on the DIF. In order to maintain a strong funding position and restore reserve ratios of the DIF, the FDIC increased assessment rates of insured institutions uniformly by seven cents for every $100 of deposits beginning with the first quarter of 2009, with additional changes beginning April 1, 2009, which require riskier institutions to pay a larger share of premiums by factoring in rate adjustments based on secured liabilities and unsecured debt levels. To further support the rebuilding of the DIF, the FDIC imposed a special assessment on each insured institution, equal to five basis points of the institution’s total assets minus Tier 1 capital as of September 30, 2009. For our Bank, there was a charge of $923 thousand, which was recorded during the second quarter of 2009. The FDIC has indicated that future special assessments are possible, although it has not determined the magnitude or timing of any future assessments. In December 2009, we paid a pre-payment of the FDIC’s estimated assessment total for the next three years for our Bank, totaling approximately $9.9 million. This amount was included in Other Assets in the consolidated balance sheet at December 31, 2009, and will be amortized, subject to adjustments imposed by the FDIC, over the next three years.
We are generally unable to control the amount of premiums that we are required to pay for FDIC insurance. If there are additional bank or financial institution failures, we may be required to pay even higher FDIC premiums. Our expenses for 2009 were significantly and adversely affected by the increased premiums and the special assessment. These increases and assessment and any future increases in insurance premiums or additional special assessments could have a material adverse impact on the Company’s business, financial condition, results of operations or liquidity.
The Company may need to raise additional capital in the future and such capital may not be available when needed or at all.
The Company may need to raise additional capital in the future to provide sufficient capital resources and liquidity to meet the Company’s commitments and business needs. The Company’s ability to raise additional capital, if needed, will depend on, among other things, conditions in the capital markets at that time, which are outside of the Company’s control, and its financial performance.
The Company cannot assure that such capital will be available to it on acceptable terms or at all. Any occurrence that may limit the Company’s access to the capital markets, such as a decline in the confidence of debt purchasers, depositors of FSB or counterparties participating in the capital markets, or a downgrade of the Company’s debt rating, may adversely affect the Company’s capital costs and ability to raise capital and, in turn, its liquidity. An inability to raise additional capital on acceptable terms when needed could have a material adverse impact on the Company’s business, financial condition, results of operations or liquidity.
- 21 -
Table of Contents
FII is a financial holding company and is dependent on its banking subsidiary for dividends, distributions and other payments.
The parent company, FII, is a legal entity separate and distinct from its banking and other subsidiaries. FII’s principal source of cash flow, including cash flow to pay dividends to its shareholders and principal and interest on its outstanding debt, is dividends from FSB. There are statutory and regulatory limitations on the payment of dividends by FSB to the parent company, as well as by FII to its shareholders. Regulations of both the Federal Reserve and the State of New York affect the ability of FSB to pay dividends and other distributions, as well as make loans to FII. The Bank is currently required to obtain approval from the NYS Banking Department for dividend payments. If FSB is unable to make dividend payments to FII and sufficient capital is not otherwise available, FII may not be able to make dividend payments to its common shareholders or principal and interest payments on its outstanding debt. See also the section titled “Supervision and Regulation—Restrictions on Distribution of Subsidiary Bank Dividends and Assets” of this Annual Report on Form 10-K.
Future issuances of additional securities could result in dilution of your ownership.
The Company may determine from time to time to issue additional securities to raise additional capital, support growth, or to make acquisitions. In July 2009, the Company filed a Form S-3 registration statement for issuance of up to $50 million of common stock, where proceeds from an offering would be used for general corporate purposes. Further, the Company may issue stock options or other stock grants to retain and motivate its employees. These issuances of the Company’s securities may dilute the ownership interests of existing shareholders.
The Company may not pay dividends on its common stock.
Shareholders of the Company’s common stock are only entitled to receive such dividends as the Company’s Board of Directors may declare out of funds legally available for such payments. Although the Company has historically declared cash dividends on its common stock, it is not required to do so and may reduce or eliminate its common stock dividend in the future. This could adversely affect the market price of the Company’s common stock. Also, participation in the CPP limits our ability to increase our dividend or to repurchase our common stock, for so long as any securities issued under such program remain outstanding, as discussed in greater detail below.
If the Company experiences greater credit losses than anticipated, earnings may be adversely impacted.
As a lender, the Company is exposed to the risk that its customers will be unable to repay their loans according to their terms and that any collateral securing the payment of their loans may not be sufficient to assure repayment. Credit losses are inherent in the business of making loans and could have a material adverse impact on the Company’s results of operations.
The Company makes various assumptions and judgments about the collectibility of its loan portfolio, including the creditworthiness of its borrowers and the value of the real estate and other assets serving as collateral, and provides an allowance for estimated loan losses based on a number of factors. The Company believes that the allowance for loan losses is adequate. However, if the Company’s assumptions or judgments are wrong, its allowance for loan losses may not be sufficient to cover its actual credit losses. The Company may have to increase the allowance in the future in response to the request of one of its primary banking regulators, to adjust for changing conditions and assumptions, or as a result of any deterioration in the quality of its loan portfolio. The actual amount of future provisions for credit losses may vary from the amount of past provisions.
Geographic concentration in one market may unfavorably impact the Company’s operations.
Substantially all of the Company’s business and operations are concentrated in the Western and Central New York region. As a result of this geographic concentration, the Company’s results depend largely on economic conditions in these and surrounding areas. Deterioration in economic conditions in this market could:
| • | increase loan delinquencies; |
| • | increase problem assets and foreclosures; |
| • | increase claims and lawsuits; |
| • | decrease the demand for our products and services; and |
| • | decrease the value of collateral for loans, especially real estate, in turn reducing customers’ borrowing power, the value of assets associated with non-performing loans and collateral coverage. |
Generally, the Company makes loans to small to mid-sized businesses whose success depends on the regional economy. These businesses generally have fewer financial resources in terms of capital or borrowing capacity than larger entities. Adverse economic and business conditions in these market areas could reduce the Company’s growth rate, affect our borrowers’ ability to repay their loans and, consequently, adversely affect the Company’s business, financial condition and performance. For example, the Company places substantial reliance on real estate as collateral for its loan portfolio. A sharp downturn in real estate values in our market area could leave many of these loans inadequately collateralized. If the Company is required to liquidate the collateral securing a loan to satisfy the debt during a period of reduced real estate values, the impact on the Company’s results of operations could be materially adverse. See also the section titled “Market Area and Competition” of this Annual Report on Form 10-K.
- 22 -
Table of Contents
The market price of shares of the Company’s common stock may fluctuate.
The market price of the Company’s common stock could be subject to significant fluctuations due to a change in sentiment in the market regarding the Company’s operations or business prospects. Such risks may be affected by:
| • | Operating results that vary from the expectations of management, securities analysts and investors; |
| • | Developments in the Company’s business or in the financial sector generally; |
| • | Regulatory changes affecting the financial services industry generally or the Company’s business and operations; |
| • | The operating and securities price performance of companies that investors consider to be comparable to the Company; |
| • | Announcements of strategic developments, acquisitions and other material events by the Company or its competitors; |
| • | Changes in the credit, mortgage and real estate markets, including the markets for mortgage-related securities; and |
| • | Changes in global financial markets and global economies and general market conditions, such as interest or foreign exchange rates, stock, commodity, credit or asset valuations or volatility. |
Stock markets in general and the Company’s common stock in particular have, over the past year, and continue to be experiencing significant price and volume volatility. As a result, the market price of the Company’s common stock may continue to be subject to similar market fluctuations that may be unrelated to its operating performance or prospects. Increased volatility could result in a decline in the market price of the Company’s common stock and may make it more difficult for shareholders to liquidate the common stock.
The Company’s market value could result in an impairment of goodwill.
The Company’s goodwill is evaluated for impairment on an annual basis or when triggering events or circumstances indicate impairment may exist. Significant and sustained declines in the Company’s stock price and market capitalization, significant declines in the Company’s expected future cash flows, significant adverse changes in the business climate or slower growth rates could result in impairment of goodwill. If impairment of goodwill was determined to exist, the Company would be required to write down its goodwill as a charge to earnings, which could have a material adverse impact on the Company’s results of operations or financial condition. For further discussion, see Note 1, Summary of Significant Accounting Policies, and Note 6, Goodwill and Other Intangible Assets, to the Consolidated Financial Statements included in Item 8 of this Annual Report on Form 10-K.
Changes in interest rates could adversely impact the Company’s results of operations and financial condition.
The banking industry’s earnings depend largely on the relationship between the yield on earning assets, primarily loans and investments, and the cost of funds, primarily deposits and borrowings. This relationship, known as the interest rate spread, is subject to fluctuation and is affected by economic and competitive factors which influence interest rates, the volume and mix of interest-earning assets and interest-bearing liabilities and the level of non-performing assets. Fluctuations in interest rates affect the demand of customers for the Company’s products and services. The Bank is subject to interest rate risk to the degree that interest-bearing liabilities re-price or mature more slowly or more rapidly or on a different basis than interest-earning assets. Significant fluctuations in interest rates could have a material adverse impact on the Company’s business, financial condition, results of operations or liquidity. For additional information regarding interest rate risk, see Part II, Item 7A, “Quantitative and Qualitative Disclosures About Market Risk” of this Annual Report on Form 10-K.
Industry competition may have an adverse impact on the Company’s success.
The Company’s profitability depends on its ability to compete successfully. The Company operates in a highly competitive environment where certain of its competitors are larger and have more resources. In the Company’s market areas, it faces competition from commercial banks, savings and loan associations, credit unions, internet banks, finance companies, insurance companies, brokerage and investment banking firms, and other financial intermediaries that offer similar services. Some of the Company’s non-bank competitors are not subject to the same extensive regulations that govern FII or FSB and may have greater flexibility in competing for business. The Company expects competition to intensify among financial services companies due to the recent consolidation of certain competing financial institutions and the conversion of certain investment banks to bank holding companies. Should competition in the financial services industry intensify, the Company’s ability to market its products and services may be adversely impacted.
- 23 -
Table of Contents
The Company’s deferred tax assets may not ultimately be realized or its tax positions may be subject to challenge by the IRS.
The Company’s deferred tax assets may provide significant future tax savings to the Company. The Company’s use of these deferred tax benefits may depend on a number of factors including the ability of the Company to generate significant taxable income; the absence of a future ownership change of the Company that could limit or eliminate the tax benefits; the acceptance by the taxing authorities of the positions taken on the Company’s tax returns as to the amount and timing of its income and expenses; and future changes in laws or regulations relating to tax deductions and net operating losses.
The Company assesses the likelihood that deferred tax assets will be realizable based on future taxable income and, if necessary, establishes a valuation allowance for those deferred tax assets determined to not likely be realizable. Management judgment is required in determining the appropriate recognition of deferred tax assets and liabilities, including projections of future taxable income. There can be no absolute assurance, however, that the net deferred assets will ultimately be realized.
The Company’s information systems may experience an interruption or breach in security.
The Company depends upon data processing, software, communication and information exchange on a variety of computing platforms and networks and over the internet. Despite instituted safeguards, the Company cannot be certain that all of its systems are entirely free from vulnerability to attack or other technological difficulties or failures. The Company relies on the services of a variety of vendors to meet its data processing and communication needs. If information security is breached or other technology difficulties or failures occur, information may be lost or misappropriated, services and operations may be interrupted and the Company could be exposed to claims from customers. Any of these results could have a material adverse impact on the Company’s business, financial condition, results of operations or liquidity.
ITEM 1B. UNRESOLVED STAFF COMMENTS
Not applicable.
- 24 -
Table of Contents
ITEM 2. PROPERTIES
The Company believes that its properties have been adequately maintained, are in good operating condition and are suitable for its business as presently conducted. The Company conducts banking operations at the following locations.
| Location | Type | Owned or Leased | Lease Expiration | |||
| Allegany | Branch | Owned | — | |||
| Amherst | Branch | Leased | February 2020 | |||
| Attica | Branch | Owned | — | |||
| Auburn | Branch | Owned | — | |||
| Avoca | Branch | Owned | — | |||
| Batavia | Branch | Leased | December 2016 | |||
| Batavia (In-Store) | Branch | Leased | July 2014 | |||
| Bath | Branch | Owned | — | |||
| Bath | Drive-up Branch | Owned | — | |||
| Caledonia | Branch | Leased | July 2012 | |||
| Canandaigua | Branch | Owned | — | |||
| Cuba | Branch | Owned | — | |||
| Dansville | Branch | Ground Leased | March 2014 | |||
| Dundee | Branch | Owned | — | |||
| East Aurora | Branch | Leased | January 2013 | |||
| Ellicottville | Branch | Owned | — | |||
| Elmira | Branch | Owned | — | |||
| Elmira Heights | Branch | Leased | August 2011 | |||
| Erwin | Branch | Leased | October 2010 | |||
| Geneseo | Branch | Owned | — | |||
| Geneva | Branch | Owned | — | |||
| Geneva | Drive-up Branch | Owned | — | |||
| Geneva (Plaza) | Branch | Ground Leased | January 2016 | |||
| Greece | Branch | Leased | June 2023 | |||
| Hammondsport | Branch | Owned | — | |||
| Henrietta | Branch | Leased | June 2023 | |||
| Honeoye Falls | Branch | Leased | September 2017 | |||
| Hornell | Branch | Owned | — | |||
| Horseheads | Branch | Leased | September 2012 | |||
| Lakeville | Branch | Owned | — | |||
| Lakewood | Branch | Owned | — | |||
| Leroy | Branch | Owned | — | |||
| Mount Morris | Branch | Owned | — | |||
| Naples | Branch | Owned | — | |||
| North Chili | Branch | Owned | — | |||
| North Java | Branch | Owned | — | |||
| North Warsaw | Branch | Owned | — | |||
| Olean | Branch | Owned | — | |||
| Olean | Drive-up Branch | Owned | — | |||
| Orchard Park | Branch | Ground Leased | January 2019 | |||
| Ovid | Branch | Owned | — | |||
| Pavilion | Branch | Owned | — | |||
| Penn Yan | Branch | Owned | — | |||
| Pittsford | Administrative Offices | Leased | April 2017 | |||
| Salamanca | Branch | Owned | — | |||
| Strykersville | Branch | Owned | — | |||
| Victor | Branch | Owned | — | |||
| Warsaw (220 Liberty Street) | Headquarters | Owned | — | |||
| Warsaw (29 North Main Street) | Administrative Offices | Owned | — | |||
| Warsaw (55 North Main Street) | Main Branch | Owned | — | |||
| Waterloo | Branch | Owned | — | |||
| Wayland | Branch | Owned | — | |||
| Wyoming | Branch | Leased | March 2010 | |||
| Yorkshire | Branch | Ground Leased | November 2012 |
- 25 -
Table of Contents
ITEM 3. LEGAL PROCEEDINGS
From time to time the Company is a party to or otherwise involved in legal proceedings arising in the normal course of business. Management does not believe that there is any pending or threatened proceeding against the Company, which, if determined adversely, would have a material adverse effect on the Company’s business, results of operations or financial condition.
ITEM 4. RESERVED
- 26 -
Table of Contents
PART II
| ITEM 5. | MARKET FOR REGISTRANT’S COMMON EQUITY, RELATED SHAREHOLDER MATTERS AND ISSUER PURCHASES OF EQUITY SECURITIES |
The Company’s common stock is traded on the NASDAQ Global Select Market under the ticker symbol “FISI.” At December 31, 2009, 10,820,268 shares of the Company’s stock were outstanding and held by approximately 1,100 shareholders of record. During 2009, the high sales price of our common stock was $15.99 and the low sales price was $3.27. The closing price per share of common stock on December 31, 2009, the last trading day of the Company’s fiscal year, was $11.78. The Company declared dividends of $0.40 per common share during the year ended December 31, 2009. See additional information regarding the market price and dividends paid filed herewith in Part II, Item 6, “Selected Financial Data.”
The Company has paid regular quarterly cash dividends on its common stock and its Board of Directors presently intends to continue this practice, subject to the need for those funds for debt service and other purposes. However, the payment of dividends by the Company is subject to continued compliance with minimum regulatory capital requirements and CPP restrictions. See the discussions in the section captioned “Supervision and Regulation” included in Part I, Item 1, “Business”, in the section captioned “Liquidity and Capital Resources” included in Part II, Item 7, in “Management’s Discussion and Analysis of Financial Condition and Results of Operations” and in Note 10, Regulatory Matters, in the accompanying financial statements included in Part II, Item 8, “Financial Statements and Supplementary Data”, all of which are included elsewhere in this report and incorporated herein by reference thereto.
Equity Compensation Plan Information
The following table sets forth, as of December 31, 2009, information about our equity compensation plans that have been approved by our shareholders, including the number of shares of our common stock exercisable under all outstanding options, warrants and rights, the weighted average exercise price of all outstanding options, warrants and rights and the number of shares available for future issuance under our equity compensation plans. We have no equity compensation plans that have not been approved by our shareholders.
| Number of securities | ||||||||||||
| Weighted average | remaining for future | |||||||||||
| Number of securities to | exercise price | issuance under equity | ||||||||||
| be issued upon exercise | of outstanding | compensation plans | ||||||||||
| of outstanding options, | options, warrants | (excluding securities | ||||||||||
| Plan Category | warrants and rights | and rights | reflected in column (a)) | |||||||||
| Equity compensation plans approved by shareholders | 536,506 | (1) | $ | 20.30 | (1) | 923,646 | (2) | |||||
| Equity compensation plans not approved by shareholders | — | $ | — | — | ||||||||
| (1) | Includes 77,772 shares of unvested restricted stock awards outstanding as of December 31, 2009. The weighted average exercise price excludes such awards. | |
| (2) | Represents the 940,000 aggregate shares approved for issuance under the Company’s two active equity compensation plans, reduced by 16,354 shares, which is the 9,972 restricted stock awards issued under these plans to date plus an adjustment of 6,382 shares. Pursuant to the terms of the plans, for purposes of calculating the number of shares available for issuance, each share of common stock granted pursuant to a restricted stock award shall count as 1.64 shares of common stock. |
- 27 -
Table of Contents
Stock Performance Graph
The stock performance graph below compares (a) the cumulative total return on the Company’s common stock for the period beginning December 31, 2004 as reported by the NASDAQ Global Market, through December 31, 2009, (b) the cumulative total return on stocks included in the NASDAQ Composite Index over the same period, and (c) the cumulative total return, as compiled by SNL Financial L.C., of Major Exchange (NYSE, AMEX and NASDAQ) Banks with $1 billion to $5 billion in assets over the same period. Cumulative return assumes the reinvestment of dividends. The graph was prepared by SNL Financial, LC and is expressed in dollars based on an assumed investment of $100.
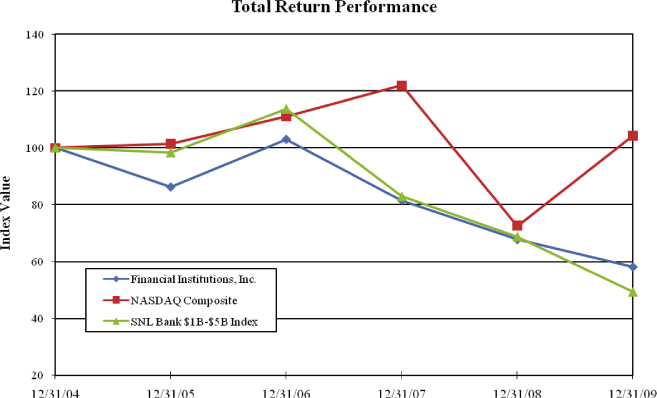
| Period Ending | ||||||||||||||||||||||||
| Index | 12/31/04 | 12/31/05 | 12/31/06 | 12/31/07 | 12/31/08 | 12/31/09 | ||||||||||||||||||
| Financial Institutions, Inc. | 100.00 | 86.17 | 102.86 | 81.43 | 67.72 | 58.08 | ||||||||||||||||||
| NASDAQ Composite | 100.00 | 101.37 | 111.03 | 121.92 | 72.49 | 104.31 | ||||||||||||||||||
| SNL Bank $1B-$5B Index | 100.00 | 98.29 | 113.74 | 82.85 | 68.72 | 49.26 | ||||||||||||||||||
- 28 -
Table of Contents
ITEM 6. SELECTED FINANCIAL DATA
| At or for the year ended December 31, | ||||||||||||||||||||
| (Dollars in thousands, except per share data) | 2009 | 2008 | 2007 | 2006 | 2005 | |||||||||||||||
Selected financial condition data: | ||||||||||||||||||||
| Total assets | $ | 2,062,389 | $ | 1,916,919 | $ | 1,857,876 | $ | 1,907,552 | $ | 2,022,392 | ||||||||||
| Loans, net | 1,243,265 | 1,102,330 | 948,652 | 909,434 | 972,090 | |||||||||||||||
| Investment securities | 620,074 | 606,038 | 754,720 | 775,536 | 833,448 | |||||||||||||||
| Deposits | 1,742,955 | 1,633,263 | 1,575,971 | 1,617,695 | 1,717,261 | |||||||||||||||
| Borrowings | 106,390 | 70,820 | 68,210 | 87,199 | 115,199 | |||||||||||||||
| Shareholders’ equity | 198,294 | 190,300 | 195,322 | 182,388 | 171,757 | |||||||||||||||
Common shareholders’ equity(1) | 144,876 | 137,226 | 177,741 | 164,765 | 154,123 | |||||||||||||||
Tangible common shareholders’ equity(2) | 107,507 | 99,577 | 139,786 | 126,502 | 115,440 | |||||||||||||||
Selected operations data: | ||||||||||||||||||||
| Interest income | $ | 94,482 | $ | 98,948 | $ | 105,212 | $ | 103,070 | $ | 103,887 | ||||||||||
| Interest expense | 22,217 | 33,617 | 47,139 | 43,604 | 36,395 | |||||||||||||||
| Net interest income | 72,265 | 65,331 | 58,073 | 59,466 | 67,492 | |||||||||||||||
| Provision (credit) for loan losses | 7,702 | 6,551 | 116 | (1,842 | ) | 28,532 | ||||||||||||||
| Net interest income after provision (credit) for loan losses | 64,563 | 58,780 | 57,957 | 61,308 | 38,960 | |||||||||||||||
Noninterest income (loss)(3) | 18,795 | (48,778 | ) | 20,680 | 21,911 | 29,384 | ||||||||||||||
| Noninterest expense | 62,777 | 57,461 | 57,428 | 59,612 | 65,492 | |||||||||||||||
| Income (loss) from continuing operations before income taxes | 20,581 | (47,459 | ) | 21,209 | 23,607 | 2,852 | ||||||||||||||
| Income tax expense (benefit) from continuing operations | 6,140 | (21,301 | ) | 4,800 | 6,245 | (1,766 | ) | |||||||||||||
| Income (loss) from continuing operations | 14,441 | (26,158 | ) | 16,409 | 17,362 | 4,618 | ||||||||||||||
| Loss on discontinued operations, net of tax | — | — | — | — | 2,452 | |||||||||||||||
| Net income (loss) | $ | 14,441 | $ | (26,158 | ) | $ | 16,409 | $ | 17,362 | $ | 2,166 | |||||||||
| Preferred stock dividends and accretion | �� | 3,697 | 1,538 | 1,483 | 1,486 | 1,488 | ||||||||||||||
| Net income (loss) applicable to common shareholders | $ | 10,744 | $ | (27,696 | ) | $ | 14,926 | $ | 15,876 | $ | 678 | |||||||||
Stock and related per share data: | ||||||||||||||||||||
| Earnings (loss) from continuing operations per common share: | ||||||||||||||||||||
| Basic | $ | 0.99 | $ | (2.54 | ) | $ | 1.34 | $ | 1.40 | $ | 0.28 | |||||||||
| Diluted | 0.99 | (2.54 | ) | 1.33 | 1.40 | 0.28 | ||||||||||||||
| Earnings (loss) per common share: | ||||||||||||||||||||
| Basic | 0.99 | (2.54 | ) | 1.34 | 1.40 | 0.06 | ||||||||||||||
| Diluted | 0.99 | (2.54 | ) | 1.33 | 1.40 | 0.06 | ||||||||||||||
| Cash dividends declared on common stock | 0.40 | 0.54 | 0.46 | 0.34 | 0.40 | |||||||||||||||
Common book value per share(1) | 13.39 | 12.71 | 16.14 | 14.53 | 13.60 | |||||||||||||||
Tangible common book value per share(2) | 9.94 | 9.22 | 12.69 | 11.15 | 10.19 | |||||||||||||||
| Market price (NASDAQ: FISI): | ||||||||||||||||||||
| High | 15.99 | 22.50 | 23.71 | 25.38 | 24.93 | |||||||||||||||
| Low | 3.27 | 10.06 | 16.18 | 17.43 | 15.52 | |||||||||||||||
| Close | 11.78 | 14.35 | 17.82 | 23.05 | 19.62 | |||||||||||||||
| (1) | Excludes preferred shareholders’ equity. | |
| (2) | Excludes preferred shareholders’ equity, goodwill and other intangible assets. | |
| (3) | The 2009 and 2008 figures include OTTI charges of $4.7 million and $68.2 million, respectively. There were no OTTI charges in the other years presented. |
- 29 -
Table of Contents
| At or for the year ended December 31, | ||||||||||||||||||||
| (Dollars in thousands, except per share data) | 2009 | 2008 | 2007 | 2006 | 2005 | |||||||||||||||
Selected financial ratios and other data: | ||||||||||||||||||||
Performance ratios: | ||||||||||||||||||||
| Net income (loss) (returns on): | ||||||||||||||||||||
| Average assets | 0.71 | % | -1.37 | % | 0.86 | % | 0.90 | % | 0.10 | % | ||||||||||
| Average equity | 7.43 | -14.30 | 8.84 | 9.86 | 1.22 | |||||||||||||||
Average common equity(1) | 7.61 | -16.84 | 8.89 | 10.02 | 0.43 | |||||||||||||||
Average tangible common equity(2) | 10.37 | -21.87 | 11.50 | 13.23 | 0.56 | |||||||||||||||
Common dividend payout ratio(3) | 40.40 | NA | 34.33 | 24.29 | 666.67 | |||||||||||||||
| Net interest margin (fully tax-equivalent) | 4.04 | 3.93 | 3.53 | 3.55 | 3.65 | |||||||||||||||
Efficiency ratio(4) | 65.52 | % | 64.07 | % | 68.77 | % | 69.78 | % | 70.18 | % | ||||||||||
Capital ratios: | ||||||||||||||||||||
| Leverage ratio | 7.96 | % | 8.05 | % | 9.35 | % | 8.91 | % | 7.60 | % | ||||||||||
| Tier 1 risk-based capital | 11.95 | 11.83 | 15.74 | 15.85 | 13.75 | |||||||||||||||
| Total risk-based capital | 13.21 | 13.08 | 16.99 | 17.10 | 15.01 | |||||||||||||||
Equity to assets(5) | 9.55 | 9.60 | 9.73 | 9.08 | 8.37 | |||||||||||||||
Common equity to assets(1) (5) | 6.94 | 8.63 | 8.81 | 8.17 | 7.54 | |||||||||||||||
Tangible common equity to tangible assets(2)(5) | 5.19 | % | 6.78 | % | 6.95 | % | 6.32 | % | 5.80 | % | ||||||||||
Asset quality (6): | ||||||||||||||||||||
| Non-performing loans | $ | 8,681 | $ | 8,196 | $ | 8,077 | $ | 15,840 | $ | 18,037 | ||||||||||
| Non-performing assets | 10,442 | 9,252 | 9,498 | 17,043 | 19,713 | |||||||||||||||
| Allowance for loan losses | 20,741 | 18,749 | 15,521 | 17,048 | 20,231 | |||||||||||||||
| Net loan charge-offs | $ | 5,710 | $ | 3,323 | $ | 1,643 | $ | 1,341 | $ | 47,487 | ||||||||||
| Total non-performing loans to total loans | 0.69 | % | 0.73 | % | 0.84 | % | 1.71 | % | 1.82 | % | ||||||||||
| Total non-performing assets to total assets | 0.51 | 0.48 | 0.51 | 0.89 | 0.97 | |||||||||||||||
| Net charge-offs to average loans | 0.47 | 0.32 | 0.18 | 0.14 | 4.27 | |||||||||||||||
| Allowance for loan losses to total loans | 1.64 | 1.67 | 1.61 | 1.84 | 2.04 | |||||||||||||||
| Allowance for loan losses to non-performing loans | 239 | % | 229 | % | 192 | % | 108 | % | 112 | % | ||||||||||
Other data: | ||||||||||||||||||||
| Number of branches | 51 | 52 | 50 | 50 | 50 | |||||||||||||||
| Full time equivalent employees | 572 | 600 | 621 | 640 | 700 | |||||||||||||||
| (1) | Excludes preferred shareholders’ equity. | |
| (2) | Excludes preferred shareholders’ equity, goodwill and other intangible assets. | |
| (3) | Common dividend payout ratio equals dividends declared during the year divided by earnings per share for the year. There is no ratio shown for years where the Company both declared a dividend and incurred a loss because the ratio would result in a negative payout since the dividend declared (paid out) will always be greater than 100% of earnings. | |
| (4) | Efficiency ratio equals noninterest expense less other real estate expense and amortization of intangible assets as a percentage of net revenue, defined as the sum of tax-equivalent net interest income and noninterest income before net gains and impairment charges on investment securities, proceeds from company owned life insurance included in income, and net gains from the sales of commercial-related loans held for sale and trust relationships (all from continuing operations). | |
| (5) | Ratios calculated using average balances for the periods shown. | |
| (6) | Ratios exclude non-accruing commercial-related loans held for sale ($577 thousand for 2005 and zero for all other years presented) from non-performing loans and exclude loans held for sale from total loans. |
- 30 -
Table of Contents
SELECTED QUARTERLY DATA
| 2009 | ||||||||||||||||
| Fourth | Third | Second | First | |||||||||||||
| (Dollars in thousands, except per share data) | Quarter | Quarter | Quarter | Quarter | ||||||||||||
| Interest income | $ | 24,390 | $ | 23,697 | $ | 23,302 | $ | 23,093 | ||||||||
| Interest expense | 5,175 | 5,619 | 5,657 | 5,766 | ||||||||||||
| Net interest income | 19,215 | 18,078 | 17,645 | 17,327 | ||||||||||||
| Provision for loan losses | 1,088 | 2,620 | 2,088 | 1,906 | ||||||||||||
| Net interest income, after provision for loan losses | 18,127 | 15,458 | 15,557 | 15,421 | ||||||||||||
| Noninterest income | 5,183 | 4,406 | 4,515 | 4,691 | ||||||||||||
| Noninterest expense | 15,117 | 15,142 | 16,440 | 16,078 | ||||||||||||
| Income before income taxes | 8,193 | 4,722 | 3,632 | 4,034 | ||||||||||||
| Income tax expense | 2,756 | 1,313 | 1,004 | 1,067 | ||||||||||||
| Net income | $ | 5,437 | $ | 3,409 | $ | 2,628 | $ | 2,967 | ||||||||
| Preferred stock dividends | 927 | 927 | 925 | 918 | ||||||||||||
| Net income applicable to common shareholders | $ | 4,510 | $ | 2,482 | $ | 1,703 | $ | 2,049 | ||||||||
Earnings per common share(1): | ||||||||||||||||
| Basic | $ | 0.42 | $ | 0.23 | $ | 0.16 | $ | 0.19 | ||||||||
| Diluted | 0.42 | 0.23 | 0.16 | 0.19 | ||||||||||||
| Market price (NASDAQ: FISI): | ||||||||||||||||
| High | $ | 12.25 | $ | 15.00 | $ | 15.99 | $ | 14.95 | ||||||||
| Low | 9.71 | 9.90 | 6.98 | 3.27 | ||||||||||||
| Close | 11.78 | 9.97 | 13.66 | 7.62 | ||||||||||||
| Dividends declared | $ | 0.10 | $ | 0.10 | $ | 0.10 | $ | 0.10 | ||||||||
| 2008 | ||||||||||||||||
| Fourth | Third | Second | First | |||||||||||||
| (Dollars in thousands, except per share data) | Quarter | Quarter | Quarter | Quarter | ||||||||||||
| Interest income | $ | 24,582 | $ | 24,558 | $ | 24,536 | $ | 25,272 | ||||||||
| Interest expense | 7,269 | 7,812 | 8,349 | 10,187 | ||||||||||||
| Net interest income | 17,313 | 16,746 | 16,187 | 15,085 | ||||||||||||
| Provision for loan losses | 2,586 | 1,891 | 1,358 | 716 | ||||||||||||
| Net interest income, after provision for loan losses | 14,727 | 14,855 | 14,829 | 14,369 | ||||||||||||
| Noninterest (loss) income | (25,106 | ) | (29,348 | ) | 932 | 4,744 | ||||||||||
| Noninterest expense | 15,394 | 13,409 | 14,385 | 14,273 | ||||||||||||
| (Loss) income before income taxes | (25,773 | ) | (27,902 | ) | 1,376 | 4,840 | ||||||||||
| Income tax (benefit) expense | (22,631 | ) | 524 | (255 | ) | 1,061 | ||||||||||
| Net (loss) income | $ | (3,142 | ) | $ | (28,426 | ) | $ | 1,631 | $ | 3,779 | ||||||
| Preferred stock dividends | 426 | 371 | 370 | 371 | ||||||||||||
| Net (loss) income applicable to common shareholders | $ | (3,568 | ) | $ | (28,797 | ) | $ | 1,261 | $ | 3,408 | ||||||
(Loss) earnings per common share(1): | ||||||||||||||||
| Basic | $ | (0.33 | ) | $ | (2.68 | ) | $ | 0.12 | $ | 0.31 | ||||||
| Diluted | (0.33 | ) | (2.68 | ) | 0.12 | 0.31 | ||||||||||
| Market price (NASDAQ: FISI): | ||||||||||||||||
| High | $ | 20.27 | $ | 22.50 | $ | 20.00 | $ | 20.78 | ||||||||
| Low | 10.06 | 14.82 | 15.25 | 15.10 | ||||||||||||
| Close | 14.35 | 20.01 | 16.06 | 18.95 | ||||||||||||
| Dividends declared | $ | 0.10 | $ | 0.15 | $ | 0.15 | $ | 0.14 | ||||||||
| (1) | Earnings (loss) per share data is computed independently for each of the quarters presented. Therefore, the sum of the quarterly earnings or loss per common share amounts may not equal the total for the year. |
- 31 -
Table of Contents
| ITEM 7. | MANAGEMENT’S DISCUSSION AND ANALYSIS OF FINANCIAL CONDITION AND RESULTS OF OPERATIONS |
GENERAL
The following discussion is management’s analysis to assist in the understanding and evaluation of the consolidated financial condition and results of operations of the Company. It should be read in conjunction with the consolidated financial statements and related notes filed herewith in Part II, Item 8, “Financial Statements and Supplementary Data” and the description of the business filed herewith in Part I, Item 1, “Business.”
OVERVIEW
Financial Institutions, Inc. is a financial holding company headquartered in New York State, providing banking and nonbanking financial services to individuals and businesses primarily in its Central and Western New York footprint. The Company, principally through its wholly-owned banking subsidiary, provides a wide range of services, including business and consumer loan and depository services, as well as other traditional banking services. Through its nonbanking subsidiary, the Company provides brokerage services to supplement the banking business.
The Company’s primary sources of revenue, through its banking subsidiary, are net interest income (predominantly from loans and deposits, and also from investment securities and other funding sources), and noninterest income, particularly fees and other revenue from financial services provided to customers or ancillary services tied to loans and deposits. Business volumes and pricing drive revenue potential, and tend to be influenced by overall economic factors, including market interest rates, business spending, consumer confidence, economic growth, and competitive conditions within the marketplace.
Net income allocated to common shareholders for 2009 was $10.7 million (compared to net loss allocated to shareholders of $27.7 million in 2008), diluted earnings per common share were $0.99 (versus diluted loss per common share of $2.54 for 2008), net interest income was $72.3 million on a margin of 4.04% (compared to $65.3 million on a margin of 3.93% for 2008), and the provision for loan losses was $7.7 million with net charge offs to average loans of 0.47% (compared to a provision of $6.6 million and a net charge off ratio of 0.32% for 2008).
Total loans increased $142.9 million or 13% between year-end 2009 and 2008, with increases in most loan categories (including commercial loans up $71.6 million and consumer indirect loans up $97.6 million). On average, loans increased $184.9 million or 18%, primarily from a $128.0 million in consumer indirect loans.
Total deposits increased $109.7 million or 7% between year-end 2009 and 2008, primarily attributable to noninterest-bearing demand and certificates of deposits. On average, total deposits increased $113.2 million or 7% over 2008, primarily in certificates of deposit. Deposit growth remains a key to improving net interest income and the quality of earnings in 2010. Competition for deposits remains high. The changes in FDIC insurance have been beneficial to deposit growth. Future deposit levels could be affected by changes in these programs. For example, deposits could be affected by the termination of the TAG Program at June 30, 2010 (see Part I, Item 1, Section “Emergency Economic Stabilization Act of 2008” for a detailed discussion of the TAG Program).
Noninterest income of $18.8 million in 2009 included OTTI write-downs of $4.7 million and net gains from security sales of $3.4 million. Noninterest loss of $48.8 million in 2008 included OTTI write-downs of $68.2 million and net gains from security sales of $288 thousand. Excluding those securities transactions, noninterest income was up $883 thousand in 2009 from 2008, primarily from income from company owned life insurance and mortgage banking income (including a $360 increase in gains on sales of loans to the secondary market and a $644 thousand increase in loan servicing income), partially offset by a decrease in net core fee-based revenue categories (down $571 thousand, and defined as service charges on deposit accounts, ATM and debit fees, and broker-dealer fees and commissions).
Noninterest expense of $62.8 million grew $5.3 million or 9% over 2008. Salaries and employee benefits were $33.6 million, up $2.2 million or 7% versus 2008, of which $2.1 million was fringe benefits expense. On average, full time equivalent employees decreased 4% between 2009 and 2008 (from 610 for 2008 to 586 for 2009). Non-personnel noninterest expenses on an aggregate basis were up $3.1 million or 12% over 2008, primarily due to higher FDIC insurance assessments.
The Company’s sale of preferred shares under the Treasury’s TARP in December 2008 increased shareholders’ equity by $37.5 million. The Company is evaluating repayment alternatives relative to the TARP funds to determine the most economically beneficial option for the Company and shareholders.
- 32 -
Table of Contents
MANAGEMENT’S DISCUSSION AND ANALYSIS
PERFORMANCE SUMMARY
The Company’s reported net income of $14.4 million for the year ended December 31, 2009, compared to a net loss of $26.2 million for the year ended December 31, 2008. For 2009, net income allocated to common shareholders was $10.7 million, or $0.99 for both basic and diluted earnings per common share. Net loss allocated to common shareholders was $27.7 million for 2008, or a net loss of $2.54 for both basic and diluted earnings per common share. Cash dividends of $0.40 per common share were paid in 2009, compared to cash dividends of $0.54 per common share paid in 2008. Key factors behind these results are discussed below.
| • | The recent market conditions have been marked with general economic and industry declines with an impact on consumer confidence, business and personal financial performance, and commercial and residential real estate markets, resulting in an increase in nonperforming loans, net charge offs, and provision for loan losses. Nonperforming loans were $8.7 million at December 31, 2009, compared to $8.2 million at December 31, 2008. Net charge offs were $5.7 million in 2009 (or 0.47% of average loans) compared to $3.3 million in 2008 (or 0.32% of average loans). The provision for loan losses was $7.7 million and $6.6 million, respectively, for 2009 and 2008. At year-end 2009, the allowance for loan losses represented 1.64% of total loans (covering 239% of non-performing loans), compared to 1.67% (covering 229% of nonperforming loans) at year-end 2008. See also sections, “Allowance for Loan Losses” and “Non-performing and Potential Problem Loans” for additional information on net charge-offs and non-performing loans. |
| • | At December 31, 2009, total loans were $1.264 billion, up 13% from year-end 2008, primarily in commercial based and indirect auto loans. Total deposits at December 31, 2009, were $1.743 billion, up 7% from year-end 2008, primarily attributable to higher noninterest-bearing demand and certificates of deposits. |
| • | Taxable equivalent net interest income was $75.0 million for 2009 or 8% higher than $69.6 million in 2008. Taxable equivalent interest income decreased $6.1 million, while interest expense decreased by $11.4 million. The increase in taxable equivalent net interest income was a function of both favorable volume variances (increasing taxable equivalent net interest income by $2.6 million) and rate variances (increasing taxable equivalent net interest income by $2.7 million). See also section, “Net Interest Income” for additional information on taxable equivalent net interest income and net interest margin. |
| • | The net interest margin for 2009 was 4.04%, 11 basis points higher than 3.93% in 2008. The increase in net interest margin was attributable to a 30 basis point increase in interest rate spread (the net of a 90 basis point decrease in the cost of interest-bearing liabilities and a 60 basis decrease in the yield on earning assets), partially offset by a 19 basis point lower contribution from net free funds (primarily attributable to lower rates on interest-bearing liabilities reducing the value of noninterest-bearing deposits and other net free funds). |
| • | Noninterest income was $18.8 million for 2009. Core fee-based revenues (defined as service charges on deposit accounts, ATM and debit fees, and broker-dealer fees and commissions) totaled $14.7 million for 2009, down $571 thousand or 4% from $15.3 million for 2008. Net mortgage banking income was $2.0 million for 2009, compared to $1.0 million in 2008, an increase of $1.0 million from 2008, primarily attributable to higher secondary mortgage production experienced during 2009 due to the low interest rate environment and the favorable impact on refinance activity. For additional discussion concerning noninterest income see section, “Noninterest Income.” |
| • | Net investment securities losses (defined as net gain on disposal of investment securities and impairment charges on investment securities) were $1.2 million and for 2009, compared to net investment securities losses of $67.9 million for 2008, primarily attributable to other-than-temporary write-downs on investment securities. |
| • | Noninterest expense for 2009 was $62.8 million, an increase of $5.3 million or 9% over 2008. FDIC assessments increased $3.0 million, salaries and employee benefits increased $2.2 million, and collectively all remaining noninterest expense categories were up $142 thousand compared to 2008. The efficiency ratio (as defined under Part II, Item 6, “Selected Financial Data”) was 65.52% for 2009 and 64.07% for 2008. For additional discussion regarding noninterest expense see section, “Noninterest Expense.” |
| • | Income tax expense for 2009 was $6.1 million, compared to income tax benefit of $21.3 million for 2008. The change in income tax was primarily due to the increase to pretax income from a pretax loss between the years. For additional discussion concerning income tax see section, “Income Taxes.” |
- 33 -
Table of Contents
MANAGEMENT’S DISCUSSION AND ANALYSIS
ANALYSIS OF FINANCIAL CONDITION
OVERVIEW
At December 31, 2009, the Company had total assets of $2.062 billion, an increase of 8% from $1.917 billion as of December 31, 2008, primarily a result of the continued growth of its core business of loans and deposits. Loans totaled $1.264 billion as of December 31, 2009, up $142.9 million, or 13%, when compared to $1.121 billion as of December 31, 2008. The increase in loans was primarily attributed to the expansion of the indirect lending program and commercial business development efforts. Nonperforming assets totaled $10.4 million as of December 31, 2009, up $1.2 million from a year ago, primarily due to the addition of non-performing investment securities for which the Company has stopped accruing interest. Total deposits amounted to $1.743 billion and $1.633 billion as of December 31, 2009 and 2008, respectively. As of December 31, 2009, total borrowed funds were $106.4 million, comparable to $70.8 million as of December 31, 2008. Book value per common share was $13.39 and $12.71 as of December 31, 2009 and 2008, respectively. As of December 31, 2009 the Company’s total shareholders’ equity was $198.3 million compared to $190.3 million a year earlier.
INVESTING ACTIVITIES
The following table summarizes the composition of the available for sale and held to maturity security portfolios (in thousands).
| Investment Securities Portfolio Composition | ||||||||||||||||||||||||
| At December 31, | ||||||||||||||||||||||||
| 2009 | 2008 | 2007 | ||||||||||||||||||||||
| Amortized | Fair | Amortized | Fair | Amortized | Fair | |||||||||||||||||||
| Cost | Value | Cost | Value | Cost | Value | |||||||||||||||||||
Securities available for sale: | ||||||||||||||||||||||||
| U.S. Government agency and government-sponsored enterprise securities | $ | 134,564 | $ | 134,105 | $ | 67,871 | $ | 68,173 | $ | 158,920 | $ | 158,940 | ||||||||||||
| State and political subdivisions | 80,812 | 83,659 | 129,572 | 131,711 | 171,294 | 172,601 | ||||||||||||||||||
| Mortgage-backed securities: | ||||||||||||||||||||||||
| Agency mortgage-backed securities | 356,044 | 356,355 | 297,278 | 303,105 | 239,427 | 238,101 | ||||||||||||||||||
| Non-Agency mortgage-backed securities | 5,087 | 5,160 | 42,296 | 39,447 | 58,371 | 57,771 | ||||||||||||||||||
| Asset-backed securities | 1,295 | 1,222 | 3,918 | 3,918 | 34,115 | 33,198 | ||||||||||||||||||
| Equity securities | — | — | 923 | 1,152 | 33,930 | 34,630 | ||||||||||||||||||
| Total available for sale securities | 577,802 | 580,501 | 541,858 | 547,506 | 696,057 | 695,241 | ||||||||||||||||||
Securities held to maturity: | ||||||||||||||||||||||||
| State and political subdivisions | 39,573 | 40,629 | 58,532 | 59,147 | 59,479 | 59,902 | ||||||||||||||||||
| Total investment securities | $ | 617,375 | $ | 621,130 | $ | 600,390 | $ | 606,653 | $ | 755,536 | $ | 755,143 | ||||||||||||
- 34 -
Table of Contents
MANAGEMENT’S DISCUSSION AND ANALYSIS
Impairment Assessment
The Company reviews investment securities on an ongoing basis for the presence of other-than-temporary-impairment (“OTTI”) with formal reviews performed quarterly. Declines in the fair value of held-to-maturity and available-for-sale securities below their cost that are deemed to be other than temporary are reflected in earnings as realized losses to the extent the impairment is related to credit losses or the security is no longer intended to be held until the recovery of amortized cost. The amount of the impairment related to other factors is recognized in other comprehensive income. Evaluating whether the impairment of a debt security is other than temporary involves assessing i.) the intent to sell the debt security or ii.) the likelihood of being required to sell the security before the recovery of its amortized cost basis. In determining whether the other-than temporary impairment includes a credit loss, the Company uses its best estimate of the present value of cash flows expected to be collected from the debt security considering factors such as: a.) the length of time and the extent to which the fair value has been less than the amortized cost basis, b.) adverse conditions specifically related to the security, an industry, or a geographic area, c.) the historical and implied volatility of the fair value of the security, d.) the payment structure of the debt security and the likelihood of the issuer being able to make payments that increase in the future, e.) failure of the issuer of the security to make scheduled interest or principal payments, f.) any changes to the rating of the security by a rating agency, and g.) recoveries or additional declines in fair value subsequent to the balance sheet date.
As of December 31, 2009, management does not have the intent to sell any of the securities in a loss position and believes that it is likely that it will not be required to sell any such securities before the anticipated recovery of amortized cost. The unrealized losses are largely due to increases in market interest rates over the yields available at the time the underlying securities were purchased. The fair value is expected to recover as the bonds approach their maturity date or repricing date or if market yields for such investments decline. Management does not believe any of the securities in a loss position are impaired due to reasons of credit quality. Accordingly, as of December 31, 2009, management has concluded that unrealized losses on its investment securities are temporary and no further impairment loss has been realized in the Company’s consolidated statements of operations. The following discussion provides further details of the Company’s assessment of the securities portfolio by investment category.
The table below summarizes unrealized losses in each category of the securities portfolio at the end of the periods indicated (in thousands).
| Unrealized Losses on Investment Securities | ||||||||||||||||||||||||
| At December 31, | ||||||||||||||||||||||||
| 2009 | 2008 | 2007 | ||||||||||||||||||||||
| Unrealized | % of | Unrealized | % of | Unrealized | % of | |||||||||||||||||||
| Losses | Total | Losses | Total | Losses | Total | |||||||||||||||||||
Securities available for sale: | ||||||||||||||||||||||||
| U.S. Government agency and government-sponsored enterprise securities | $ | 545 | 19.8 | % | $ | 307 | 7.3 | % | $ | 324 | 7.5 | % | ||||||||||||
| State and political subdivisions | 3 | 0.1 | 42 | 1.0 | 261 | 6.0 | ||||||||||||||||||
| Mortgage-backed securities: | ||||||||||||||||||||||||
| Agency mortgage-backed securities | 1,638 | 59.3 | 981 | 23.1 | 1,868 | 43.2 | ||||||||||||||||||
| Non-Agency mortgage-backed securities | 330 | 12.0 | 2,854 | 67.3 | 890 | 20.6 | ||||||||||||||||||
| Asset-backed securities | 244 | 8.8 | — | — | 972 | 22.5 | ||||||||||||||||||
| Equity securities | — | — | 52 | 1.2 | — | — | ||||||||||||||||||
| Total available for sale securities | 2,760 | 100.0 | 4,236 | 99.9 | 4,315 | 99.8 | ||||||||||||||||||
Securities held to maturity: | ||||||||||||||||||||||||
| State and political subdivisions | — | — | 4 | 0.1 | 8 | 0.2 | ||||||||||||||||||
| Total investment securities | $ | 2,760 | 100.0 | % | $ | 4,240 | 100.0 | % | $ | 4,323 | 100.0 | % | ||||||||||||
U.S. Government Agencies and Government Sponsored Enterprises (“GSE”).As of December 31, 2009, there were 30 securities in the U.S. Government agencies and GSE portfolio that were in an unrealized loss position. These securities had an aggregate amortized cost of $94.0 million and unrealized losses of $545 thousand. Of the securities in an unrealized loss position, 8 securities with a total amortized cost of $10.0 million and unrealized losses of $185 thousand were in an unrealized loss position for 12 months or longer. Because the decline in fair value is attributable to changes in interest rates and illiquidity, and not credit quality, and because the Company does not have the intent to sell these securities and it is likely that it will not be required to sell the securities before their anticipated recovery, the Company does not consider these securities to be other-than-temporarily impaired at December 31, 2009.
- 35 -
Table of Contents
MANAGEMENT’S DISCUSSION AND ANALYSIS
State and Political Subdivisions.At December 31, 2009, the state and political subdivisions portfolio (“municipals”) totaled $123.2 million, of which $83.7 million was classified as available for sale. As of that date, $39.5 million was classified as held to maturity, with a fair value of $40.6 million. As of December 31, 2009, there were 3 municipals that were in an unrealized loss position. These securities had an aggregate amortized cost of $153 thousand and unrealized losses of $3 thousand.
Agency Mortgage-backed Securities.At December 31, 2009, with the exception of the non-Agency mortgage-backed securities (“non-Agency MBS”) discussed below, all of the mortgage-backed securities held by the Company were issued by U.S. government sponsored entities and agencies (“Agency MBS”), primarily FNMA and the FHLMC. The contractual cash flows of the Company’s Agency MBS are guaranteed by FNMA, FHLMC or GNMA. FNMA and FHLMC are government sponsored enterprises that were placed under the conservatorship of the U.S. government during the third quarter of 2008. The GNMA mortgage-backed securities are backed by the full faith and credit of the U.S. government. The Company sold Agency MBS securities with an amortized cost totaling $152.9 million during the year ended December 31, 2009, and realized a gain of $5.9 million on those sales.
Given the high credit quality inherent in Agency MBS, the Company does not consider any of the unrealized losses as of December 31, 2009, on such MBS to be credit related. As a result of its analyses, the Company determined at December 31, 2009 that the unrealized losses on its Agency MBS are temporary. At December 31, 2009, the Company did not intend to sell any of Agency MBS that were in an unrealized loss position, all of which were performing in accordance with their terms.
Non-Agency Mortgage-backed Securities.The Company’s non-Agency MBS portfolio consists of positions in five privately issued whole loan collateralized mortgage obligations with a fair value of $5.2 million and net unrealized gains of approximately $70 thousand at December 31, 2009. As of that date, there were two non-Agency MBS with an aggregate amortized cost of $3.3 million and unrealized losses of $330 thousand that have been in an unrealized loss position for 12 months or longer.
The Company sold 12 non-Agency MBS with aggregate amortized costs of $24.3 million during the year ended December 31, 2009, realizing net losses totaling $3.0 million on those sales. Of the securities sold, the Company had recognized OTTI charges totaling $2.2 million on four of the securities, of which $1.7 million was recorded during 2009.
As of December 31, 2009, there were three non-Agency MBS with an aggregate amortized cost of $1.8 million rated below investment grade. None of these securities was in an unrealized loss position. To date, the Company has recognized aggregate OTTI charges due to reasons of credit quality of $6.0 million against these securities, of which $660 thousand was recorded during 2009.
As a result of its analyses, the Company determined at December 31, 2009 that the unrealized losses on its non-Agency MBS are temporary. These temporary unrealized losses are believed to be primarily related to an overall widening in liquidity spreads related to the reduced liquidity and uncertainty in the markets and not the credit quality of the individual issuer or underlying assets. At December 31, 2009, the Company did not intend to sell any of its non-Agency MBS that were in an unrealized loss position prior to recovery of amortized cost.
Asset-backed Securities (“ABS”).As of December 31, 2009, the carrying value of the ABS portfolio totaled $1.3 million and consisted of positions in 15 securities, the majority of which are pooled trust preferred securities (“TPS”) collateralized by preferred debt issued primarily by financial institutions and, to a lesser extent, insurance companies located throughout the United States. As a result of some issuers defaulting and others electing to defer interest payments on the preferred debt which collateralize the securities, the Company considered the TPS to be non-performing and stopped accruing interest on the investments during 2009.
During the year ended December 31, 2009, the Company recognized OTTI charges totaling $2.3 million against all but one of these ABS, all of which were acquired prior to November 2007. Since the second quarter of 2008, the Company has written down each of the securities in the ABS portfolio, resulting in OTTI charges totaling $32.3 million through December 31, 2009. The Company expects to recover the remaining carrying value of $1.3 million, representing the Company’s maximum exposure to future OTTI charges on the current ABS portfolio. As of December 31, 2009, each of the securities in the ABS portfolio was rated below investment grade. There were 9 ABS securities in a loss position with an aggregate amortized cost of $522 thousand and unrealized losses totaling $244 thousand as of December 31, 2009. Each of these securities has been in loss position for less than 12 months.
Equity Securities.During the first quarter of 2009 the Company liquidated its equity securities portfolio, which consisted of auction rate preferred equity securities collateralized by FNMA and FHLMC preferred stock and common equity securities. A $152 thousand loss was realized on the sale of the equity securities portfolio, comprised of aggregate losses totaling $242 thousand related to the preferred equity securities and an aggregate gain of $90 thousand from sale of the common equity securities.
Other Investments.Recently, credit concern surrounding the Federal Home Loan Bank system has been widespread. As a member of the FHLB the Bank is required to hold FHLB stock. The amount of required FHLB stock is based on the Bank’s asset size and the amount of borrowings from the FHLB. The Company has assessed the ultimate recoverability of its FHLB stock and believes no impairment currently exists. The Company’s ownership of FHLB stock, which totaled $3.3 million at December 31, 2009, is included in other assets and recorded at cost.
As a member of the FRB system, the Company is required to maintain a specified investment in FRB stock based on a ratio relative to the Company’s capital. FRB stock totaled $3.9 million at December 31, 2009, is included in other assets and recorded at cost.
- 36 -
Table of Contents
MANAGEMENT’S DISCUSSION AND ANALYSIS
Below Investment Grade Securities
The Company’s non-Agency MBS and ABS are rated by a nationally recognized rating agency, such as Moody’s Investors Services, Inc. (“Moody’s”), Standard & Poor’s Corporation (“S&P”) or Fitch, Inc. (collectively, “Rating Agencies”). The rating indicates the opinion of the Rating Agency as to the credit worthiness of the investment, indicating the obligor’s ability to meet its financial commitment on the obligation. Investment grade includes all securities with Fitch/S&P ratings above BB+ and Moody’s ratings above Ba1. Securities with a Fitch/S&P rating below BBB- and Moody’s ratings below Baa3 are considered to be below investment grade. The Company uses the lowest rating provided by either of the Rating Agencies when classifying each security as investment grade or below investment grade.
The following table provides detail of securities rated below investment grade (dollars in thousands).
| As of December 31, 2009 | OTTI losses recognized in earnings | |||||||||||||||||||||||||||||||
| Number | Unrealized | For the year ended | ||||||||||||||||||||||||||||||
| Current | of | Par | Amortized | Fair | Gains | December 31, | Total | |||||||||||||||||||||||||
| Rating(1) | Cusips | Value | Cost | Value | (Losses) | 2008 | 2009 | to Date | ||||||||||||||||||||||||
Securities with unrealized gains: | ||||||||||||||||||||||||||||||||
| Non-Agency MBS: | ||||||||||||||||||||||||||||||||
| Ba1/CCC | 1 | $ | 1,404 | $ | 609 | $ | 646 | $ | 37 | $ | 626 | $ | 166 | $ | 792 | |||||||||||||||||
CC/B(2) | 1 | 2,411 | 672 | 672 | — | 1,240 | 494 | 1,734 | ||||||||||||||||||||||||
CC(3) | 1 | 3,814 | 492 | 859 | 367 | 3,513 | — | 3,513 | ||||||||||||||||||||||||
| 3 | 7,629 | 1,773 | 2,177 | 404 | 5,379 | 660 | 6,039 | |||||||||||||||||||||||||
| Asset-backed securities: | ||||||||||||||||||||||||||||||||
Baa3/CC(4) | 1 | 661 | 68 | 206 | 138 | 545 | 50 | 595 | ||||||||||||||||||||||||
Caa2/CCC(5) | 1 | 1,996 | 36 | 36 | — | 1,615 | 313 | 1,928 | ||||||||||||||||||||||||
Caa3/CC(6) | 1 | 3,000 | 59 | 70 | 11 | 2,860 | — | 2,860 | ||||||||||||||||||||||||
Ca/CCC(5) | 1 | 2,977 | 37 | 56 | 19 | 2,435 | 476 | 2,911 | ||||||||||||||||||||||||
Ca/CC(6) | 2 | 9,050 | 573 | 576 | 3 | 7,773 | 495 | 8,268 | ||||||||||||||||||||||||
| 6 | 17,684 | 773 | 944 | 171 | 15,228 | 1,334 | 16,562 | |||||||||||||||||||||||||
| Total securities with unrealized gains | 9 | 25,313 | 2,546 | 3,121 | 575 | 20,607 | 1,994 | 22,601 | ||||||||||||||||||||||||
Securities with unrealized losses: | ||||||||||||||||||||||||||||||||
| Asset-backed securities: | ||||||||||||||||||||||||||||||||
Ca/CC(6) | 4 | 6,392 | 337 | 166 | (171 | ) | 5,481 | 437 | 5,918 | |||||||||||||||||||||||
| Ca/C | 2 | 3,144 | 45 | 28 | (17 | ) | 2,826 | 147 | 2,973 | |||||||||||||||||||||||
C/CC(6) | 2 | 5,029 | 80 | 65 | (15 | ) | 4,570 | 388 | 4,958 | |||||||||||||||||||||||
| Ca/D | 1 | 2,000 | 60 | 18 | (42 | ) | 1,868 | 8 | 1,876 | |||||||||||||||||||||||
| Total securities with unrealized losses | 9 | 16,565 | 522 | 277 | (245 | ) | 14,745 | 980 | 15,725 | |||||||||||||||||||||||
| 18 | $ | 41,878 | $ | 3,068 | $ | 3,398 | $ | 330 | $ | 35,352 | $ | 2,974 | $ | 38,326 | ||||||||||||||||||
| (1) | Ratings presented are Moody’s/Fitch except as noted. | |
| (2) | Ratings presented are Fitch /S&P. | |
| (3) | Rating presented is S&P. | |
| (4) | Ratings presented are Moody’s/S&P. | |
| (5) | Securities were further downgraded by Fitch to a rating of CC during February 2010. | |
| (6) | Securities were further downgraded by Fitch to a rating of C during February 2010. |
During 2009 the Company realized losses totaling $1.6 million from the sale of three non-Agency MBS securities which were rated below investment grade. At the time of sale, the securities had a combined adjusted carrying value of $4.1 million. The adjusted carrying value reflects impairment charges of $1.7 million and $539 thousand taken against the securities during the years ended December 31, 2009 and 2008, respectively.
- 37 -
Table of Contents
MANAGEMENT’S DISCUSSION AND ANALYSIS
LENDING ACTIVITIES
The composition of the Company’s loan portfolio, excluding loans held for sale and including net unearned income and net deferred fees and costs, is summarized as follows (in thousands):
| Loan Portfolio Composition | ||||||||||||||||||||||||||||||||||||||||
| At December 31, | ||||||||||||||||||||||||||||||||||||||||
| 2009 | 2008 | 2007 | 2006 | 2005 | ||||||||||||||||||||||||||||||||||||
| Amount | Percent | Amount | Percent | Amount | Percent | Amount | Percent | Amount | Percent | |||||||||||||||||||||||||||||||
| Commercial | $ | 186,386 | 14.8 | % | $ | 158,543 | 14.1 | % | $ | 136,780 | 14.2 | % | $ | 105,806 | 11.4 | % | $ | 116,444 | 11.7 | % | ||||||||||||||||||||
| Commercial real estate | 308,873 | 24.4 | 262,234 | 23.4 | 245,797 | 25.5 | 243,966 | 26.4 | 264,727 | 26.7 | ||||||||||||||||||||||||||||||
| Agricultural | 41,872 | 3.3 | 44,706 | 4.0 | 47,367 | 4.9 | 56,808 | 6.1 | 75,018 | 7.5 | ||||||||||||||||||||||||||||||
| Residential real estate | 144,215 | 11.4 | 177,683 | 15.8 | 166,863 | 17.3 | 163,243 | 17.6 | 168,498 | 17.0 | ||||||||||||||||||||||||||||||
| Consumer indirect | 352,611 | 27.9 | 255,054 | 22.8 | 134,977 | 14.0 | 106,443 | 11.5 | 85,237 | 8.6 | ||||||||||||||||||||||||||||||
| Consumer direct and home equity | 230,049 | 18.2 | 222,859 | 19.9 | 232,389 | 24.1 | 250,216 | 27.0 | 282,397 | 28.5 | ||||||||||||||||||||||||||||||
| Total loans | 1,264,006 | 100.0 | % | 1,121,079 | 100.0 | % | 964,173 | 100.0 | % | 926,482 | 100.0 | % | 992,321 | 100.0 | % | |||||||||||||||||||||||||
| Allowance for loan losses | 20,741 | 18,749 | 15,521 | 17,048 | 20,231 | |||||||||||||||||||||||||||||||||||
| Total loans, net | $ | 1,243,265 | $ | 1,102,330 | $ | 948,652 | $ | 909,434 | $ | 972,090 | ||||||||||||||||||||||||||||||
Total loans increased 13%, or $142.9 million, to $1.264 billion as of December 31, 2009 from $1.121 billion as of December 31, 2008, primarily attributed to the expansion of the indirect lending program and commercial business development efforts, offset by a reduction in agricultural and residential real estate loans.
Commercial loans and commercial real estate loans increased $74.5 million to $495.3 million as of December 31, 2009 from $420.8 million as of December 31, 2008, a result of the Company’s continued focus on commercial business development programs. Agricultural loans decreased $2.8 million, to $41.9 million as of December 31, 2009 from $44.7 million as of December 31, 2008. Competition and adherence to strict credit standards has led to payments outpacing new loan originations in the agricultural portfolio.
Residential real estate loans decreased $33.5 million to $144.2 million as of December 31, 2009 in comparison to $177.7 million as of December 31, 2008. This category of loans decreased as the majority of newly originated and refinanced residential mortgages were sold to the secondary market. In addition, the Company securitized and sold $16.0 million in residential real estate loans during the second quarter of 2009. The Company does not engage in sub-prime or other high-risk residential mortgage lending as a line-of-business.
Parts of the country have experienced a significant decline in real estate values that has led, in some cases, to the debt on the real estate exceeding the value of the real estate. The Western and Central New York markets the Company serves have not generally experienced, to this point, such conditions. Should deterioration in real estate values in the markets we serve occur, the value and liquidity of real estate securing the Company’s loans could become impaired. While the Company is not engaged in the business of sub-prime lending, a decline in the value of residential or commercial real estate could have a material adverse effect on the value of property used as collateral for our loans.
The consumer indirect portfolio increased 38% to $352.6 million as of December 31, 2009 from $255.1 million as of December 31, 2008. The Company increased its indirect portfolio by managing existing and developing new relationships with over 250 franchised auto dealers, primarily in Western and Central New York. During the year ended December 31, 2009 the Company originated $199.1 million in indirect auto loans with a mix of approximately 32% new auto and 68% used auto. This compares with $180.9 million in indirect loan auto originations with a mix of approximately 38% new auto and 62% used auto for the same period in 2008.
There is increased risk associated with auto and consumer loans during economic downturns as increased unemployment and inflationary costs may make it more difficult for some borrowers to repay their loans. While the asset quality of these portfolios is currently good, deterioration in the economy of the regions where these loans were extended could have an adverse impact on the amount of credit losses the Company experiences in the future.
Loans Held for Sale and Mortgage Servicing Rights.Loans held for sale (not included in the loan portfolio composition table) totaled $421 thousand and $1.0 million as of December 31, 2009 and 2008, respectively, all of which were residential real estate loans.
The Company sells certain qualifying newly originated and refinanced residential real estate mortgages on the secondary market. The sold and serviced residential real estate loan portfolio increased to $349.8 million as of December 31, 2009 from $315.7 million as of December 31, 2008. The increase in the sold and serviced portfolio resulted from an increase in residential loan origination and refinancing volumes, complemented by the Company’s securitization and sale of $16.0 million in residential real estate loans during the second quarter of 2009.
- 38 -
Table of Contents
MANAGEMENT’S DISCUSSION AND ANALYSIS
Allowance for Loan Losses
The following table summarizes the activity in the allowance for loan losses (in thousands).
| Loan Loss Analysis | ||||||||||||||||||||
| Year Ended December 31, | ||||||||||||||||||||
| 2009 | 2008 | 2007 | 2006 | 2005 | ||||||||||||||||
| Allowance for loan losses, beginning of year | $ | 18,749 | $ | 15,521 | $ | 17,048 | $ | 20,231 | $ | 39,186 | ||||||||||
Charge-offs(1): | ||||||||||||||||||||
| Commercial | 2,317 | 675 | 562 | 1,195 | 12,980 | |||||||||||||||
| Commercial real estate | 355 | 1,190 | 439 | 501 | 15,397 | |||||||||||||||
| Agricultural | 43 | 47 | 56 | 379 | 18,543 | |||||||||||||||
| Residential real estate | 225 | 320 | 319 | 278 | 56 | |||||||||||||||
| Consumer indirect | 3,637 | 2,011 | 988 | 532 | 775 | |||||||||||||||
| Consumer direct and home equity | 1,253 | 1,216 | 1,531 | 1,314 | 1,535 | |||||||||||||||
| Total charge-offs | 7,830 | 5,459 | 3,895 | 4,199 | 49,286 | |||||||||||||||
| Recoveries: | ||||||||||||||||||||
| Commercial | 407 | 664 | 972 | 1,417 | 864 | |||||||||||||||
| Commercial real estate | 130 | 280 | 216 | 132 | 280 | |||||||||||||||
| Agricultural | 41 | 55 | 168 | 389 | 57 | |||||||||||||||
| Residential real estate | 12 | 26 | 50 | 71 | 5 | |||||||||||||||
| Consumer indirect | 1,030 | 548 | 235 | 224 | 261 | |||||||||||||||
| Consumer direct and home equity | 500 | 563 | 611 | 625 | 332 | |||||||||||||||
| Total recoveries | 2,120 | 2,136 | 2,252 | 2,858 | 1,799 | |||||||||||||||
| Net charge-offs | 5,710 | 3,323 | 1,643 | 1,341 | 47,487 | |||||||||||||||
| Provision (credit) for loan losses | 7,702 | 6,551 | 116 | (1,842 | ) | 28,532 | ||||||||||||||
| Allowance for loan losses, end of year | $ | 20,741 | $ | 18,749 | $ | 15,521 | $ | 17,048 | $ | 20,231 | ||||||||||
| Net charge-offs to average loans | 0.47 | % | 0.32 | % | 0.18 | % | 0.14 | % | 4.27 | % | ||||||||||
| Allowance to end of period loans | 1.64 | % | 1.67 | % | 1.61 | % | 1.84 | % | 2.04 | % | ||||||||||
| Allowance to end of period non-performing loans | 239 | % | 229 | % | 192 | % | 108 | % | 112 | % | ||||||||||
| (1) | During 2005 the Company transferred $169.0 million in commercial-related loans to held for sale, at an estimated fair value less costs to sell of $132.3 million, resulting in $36.7 million in commercial-related charge-offs. In the second half of 2005, the Company realized a net gain of $9.4 million on the ultimate sale or settlement of commercial-related loans held for sale. |
- 39 -
Table of Contents
MANAGEMENT’S DISCUSSION AND ANALYSIS
The following table sets forth the allocation of the allowance for loan losses by loan category as of the dates indicated. The allocation is made for analytical purposes and is not necessarily indicative of the categories in which actual losses may occur. The total allowance is available to absorb losses from any segment of the loan portfolio (in thousands).
| Allowance for Loan Losses by Loan Category | ||||||||||||||||||||||||||||||||||||||||
| At December 31, | ||||||||||||||||||||||||||||||||||||||||
| 2009 | 2008 | 2007 | 2006 | 2005 | ||||||||||||||||||||||||||||||||||||
| Percentage | Percentage | Percentage | Percentage | Percentage | ||||||||||||||||||||||||||||||||||||
| Loan | of loans by | Loan | of loans by | Loan | of loans by | Loan | of loans by | Loan | of loans by | |||||||||||||||||||||||||||||||
| Loss | category to | Loss | category to | Loss | category to | Loss | category to | Loss | category to | |||||||||||||||||||||||||||||||
| Allowance | total loans | Allowance | total loans | Allowance | total loans | Allowance | total loans | Allowance | total loans | |||||||||||||||||||||||||||||||
| Commercial | $ | 4,060 | 14.8 | % | $ | 2,871 | 14.1 | % | $ | 1,878 | 14.2 | % | $ | 2,443 | 11.4 | % | $ | 4,098 | 11.7 | % | ||||||||||||||||||||
| Commercial real estate | 5,991 | 24.4 | 4,052 | 23.4 | 3,751 | 25.5 | 4,458 | 26.4 | 6,564 | 26.7 | ||||||||||||||||||||||||||||||
| Agricultural | 994 | 3.3 | 1,012 | 4.0 | 1,516 | 4.9 | 1,887 | 6.1 | 2,187 | 7.5 | ||||||||||||||||||||||||||||||
| Residential real estate | 1,251 | 11.4 | 2,516 | 15.8 | 1,763 | 17.3 | 1,748 | 17.6 | 1,252 | 17.0 | ||||||||||||||||||||||||||||||
| Consumer indirect | 6,837 | 27.9 | 5,152 | 22.8 | 2,284 | 14.0 | 1,749 | 11.5 | 1,032 | 8.6 | ||||||||||||||||||||||||||||||
| Consumer direct and home equity | 1,608 | 18.2 | 3,146 | 19.9 | 2,667 | 24.1 | 2,833 | 27.0 | 2,504 | 28.5 | ||||||||||||||||||||||||||||||
Unallocated(1) | — | — | — | — | 1,662 | — | 1,930 | — | 2,594 | — | ||||||||||||||||||||||||||||||
| Total | $ | 20,741 | 100.0 | % | $ | 18,749 | 100.0 | % | $ | 15,521 | 100.0 | % | $ | 17,048 | 100.0 | % | $ | 20,231 | 100.0 | % | ||||||||||||||||||||
| (1) | During 2008 management revised estimation techniques related to allocation of the allowance to specific loan segments. The result was the elimination of the unallocated portion of the allowance for loan losses and allocation of the entire balance to specific loan segments. |
Management believes that the allowance for loan losses at December 31, 2009 is adequate to cover probable losses in the loan portfolio at that date. Factors beyond the Company’s control, however, such as general national and local economic conditions, can adversely impact the adequacy of the allowance for loan losses. As a result, no assurance can be given that adverse economic conditions or other circumstances will not result in increased losses in the portfolio or that the allowance for loan losses will be sufficient to meet actual loan losses.
Non-performing and Potential Problem Loans
The following table sets forth information regarding non-performing assets (in thousands):
| Delinquent and Non-performing Assets | ||||||||||||||||||||
| At December 31, | ||||||||||||||||||||
| 2009 | 2008 | 2007 | 2006 | 2005 | ||||||||||||||||
| Non-accruing loans: | ||||||||||||||||||||
| Commercial | $ | 650 | $ | 510 | $ | 827 | $ | 2,205 | $ | 4,389 | ||||||||||
| Commercial real estate | 1,872 | 2,360 | 2,825 | 4,661 | 6,985 | |||||||||||||||
| Agricultural | 416 | 310 | 481 | 4,836 | 2,786 | |||||||||||||||
| Residential real estate | 2,376 | 3,365 | 2,987 | 3,127 | 2,615 | |||||||||||||||
| Consumer indirect | 621 | 445 | 278 | 166 | 63 | |||||||||||||||
| Consumer direct and home equity | 887 | 1,199 | 677 | 842 | 923 | |||||||||||||||
| Total non-accruing loans | 6,822 | 8,189 | 8,075 | 15,837 | 17,761 | |||||||||||||||
| Restructured loans | — | — | — | — | — | |||||||||||||||
| Accruing loans contractually past due over 90 days | 1,859 | 7 | 2 | 3 | 276 | |||||||||||||||
| Total non-performing loans | 8,681 | 8,196 | 8,077 | 15,840 | 18,037 | |||||||||||||||
| Foreclosed assets | 746 | 1,007 | 1,421 | 1,203 | 1,099 | |||||||||||||||
| Non-accruing commercial-related loans held for sale | — | — | — | — | 577 | |||||||||||||||
| Non-performing investment securities | 1,015 | 49 | — | — | — | |||||||||||||||
| Total non-performing assets | $ | 10,442 | $ | 9,252 | $ | 9,498 | $ | 17,043 | $ | 19,713 | ||||||||||
| Non-performing loans to total loans | 0.69 | % | 0.73 | % | 0.84 | % | 1.71 | % | 1.82 | % | ||||||||||
| Non-performing assets to total assets | 0.51 | % | 0.48 | % | 0.51 | % | 0.89 | % | 0.97 | % | ||||||||||
- 40 -
Table of Contents
MANAGEMENT’S DISCUSSION AND ANALYSIS
Approximately $3.0 million, or 44.5%, of the $6.8 million in non-accruing loans as of December 31, 2009 were current with respect to payment of principal and interest, but were classified as non-accruing because repayment in full of principal and/or interest was uncertain. For non-accruing loans outstanding as of December 31, 2009, the amount of interest income forgone totaled $388 thousand.
At December 31, 2009, non-performing loans included one commercial relationship totaling $1.9 million which was past due in excess of 90 days but continued to accrue interest. During the first quarter of 2010 the Company received payments for substantially all of the principal and interest due for this relationship and expects to receive the remaining amounts in the near term.
Potential problem loans are loans that are currently performing, but information known about possible credit problems of the borrowers causes management to have concern as to the ability of such borrowers to comply with the present loan payment terms and may result in disclosure of such loans as nonperforming at some time in the future. These loans remain in a performing status due to a variety of factors, including payment history, the value of collateral supporting the credits, and/or personal or government guarantees. Management considers loans classified as substandard, which continue to accrue interest, to be potential problem loans. The Company identified $18.4 million and $20.5 million in loans that continued to accrue interest which were classified as substandard as of December 31, 2009 and 2008, respectively.
FUNDING ACTIVITIES
Deposits
The following table summarizes the composition of the Company’s deposits (dollars in thousands).
| At December 31, | ||||||||||||||||||||||||
| 2009 | 2008 | 2007 | ||||||||||||||||||||||
| Amount | Percent | Amount | Percent | Amount | Percent | |||||||||||||||||||
| Noninterest-bearing demand | $ | 324,303 | 18.6 | % | $ | 292,586 | 17.9 | % | $ | 286,362 | 18.2 | % | ||||||||||||
| Interest-bearing demand | 363,698 | 20.9 | 344,616 | 21.1 | 335,314 | 21.3 | ||||||||||||||||||
| Savings and money market | 368,603 | 21.1 | 348,594 | 21.3 | 346,639 | 22.0 | ||||||||||||||||||
| Certificates of deposit < $100,000 | 512,969 | 29.5 | 482,863 | 29.6 | 453,140 | 28.7 | ||||||||||||||||||
| Certificates of deposit of $100,000 or more | 173,382 | 9.9 | 164,604 | 10.1 | 154,516 | 9.8 | ||||||||||||||||||
| $ | 1,742,955 | 100.0 | % | $ | 1,633,263 | 100.0 | % | $ | 1,575,971 | 100.0 | % | |||||||||||||
The Company offers a variety of deposit products designed to attract and retain customers, with the primary focus on building and expanding long-term relationships. At December 31, 2009, total deposits were $1.743 billion, representing an increase of $109.7 million for the year. Certificates of deposit were 39.4% and 39.7% of total deposits at December 31, 2009 and 2008, respectively.
Nonpublic deposits represent the largest component of the Company’s funding sources and totaled $1.387 billion and $1.280 billion as of December 31, 2009 and 2008, respectively. The Company has managed this segment of funding through a strategy of competitive pricing that minimizes the number of customer relationships that have only a single service high cost deposit account. Nonpublic deposit levels were positively impacted by the expansion of the Company’s branch network in the greater Rochester area, where de novo branches were added in Henrietta and Greece during the third and fourth quarters of 2008, respectively. The Company had no brokered deposits outstanding at December 31, 2009 or 2008.
As an additional source of funding, the Company offers a variety of public deposit products to the many towns, villages, counties and school districts within our market. Public deposits generally range from 20% to 25% of the Company’s total deposits. There is a high degree of seasonality in this component of funding, as the level of deposits varies with the seasonal cash flows for these public customers. The Company maintains the necessary levels of short-term liquid assets to accommodate the seasonality associated with public deposits. As of December 31, 2009, total public deposits were $355.9 million compared to $352.8 million as of December 31, 2008. In general, the number of public relationships remained stable in comparison to prior year.
Short-term Borrowings
Short-term borrowings from the FHLB are used to satisfy funding requirements resulting from daily fluctuations in deposit, loan and investment activities. FHLB borrowings are collateralized by certain investment securities, FHLB stock owned by the Company and certain qualifying loans. At December 31, 2009, short-term borrowings consisted of Federal funds purchased of $9.4 million, $35.1 million of overnight repurchase agreements and a $15.0 million advance from the Federal Reserve’s Term Auction Facility. At December 31, 2008, short-term borrowings consisted of overnight repurchase agreements of $23.5 million.
- 41 -
Table of Contents
MANAGEMENT’S DISCUSSION AND ANALYSIS
The following table summarizes information relating to the Company’s short-term borrowings (dollars in thousands).
| At or for the Year Ended December 31, | ||||||||||||
| 2009 | 2008 | 2007 | ||||||||||
| Year-end balance | $ | 59,543 | $ | 23,465 | $ | 25,643 | ||||||
| Year-end weighted average interest rate | 0.59 | % | 0.48 | % | 2.71 | % | ||||||
| Maximum outstanding at any month-end | $ | 85,912 | $ | 56,861 | $ | 44,944 | ||||||
| Average balance during the year | $ | 43,092 | $ | 38,028 | $ | 29,048 | ||||||
| Average interest rate for the year | 0.63 | % | 1.90 | % | 2.97 | % | ||||||
Long-term Borrowings
Long-term borrowings totaled $46.8 million at December 31, 2009 and consisted of $30.0 million in FHLB repurchase agreements entered into during 2008, $145 thousand of FHLB amortizing advances and $16.7 million in junior subordinated debentures.
In February 2001, the Company established FISI Statutory Trust I (the “Trust”), which issued 16,200 fixed rate pooled trust preferred securities with a liquidation preference of $1,000 per security. The trust preferred securities represent an interest in the related junior subordinated debentures of the Company, which were purchased by the Trust and have substantially the same payment terms as these trust preferred securities. The subordinated debentures mature in 2031 and are the only assets of the Trust and interest payments from the debentures finance the distributions paid on the trust preferred securities. Distributions on the debentures are payable quarterly at a fixed interest rate equal to 10.20%. The Company incurred $487 thousand in costs related to the issuance that are being amortized over 20 years using the straight-line method. The Trust is accounted for as an unconsolidated subsidiary.
Shareholders’ Equity
Shareholders’ equity increased by $8.0 million in 2009 to $198.3 million at December 31, 2009, primarily due to net income of $14.4 million, partially offset by common and preferred dividends of $8.0 million. For detailed information on shareholders’ equity, see Note 11, Shareholders’ Equity, of the notes to consolidated financial statements.
The Company’s sale of preferred shares under the Treasury’s TARP in December 2008 increased shareholders’ equity by $37.5 million. The Company is evaluating repayment alternatives relative to the TARP funds to determine the most economically beneficial option for the Company and shareholders.
The Company and Bank are subject to various regulatory capital requirements. At December 31, 2009, both the Company and the Bank exceeded all regulatory requirements. For detailed information on regulatory capital, see Note 10, Regulatory Matters, of the notes to consolidated financial statements.
GOODWILL
The carrying amount of goodwill totaled $37.4 million as of December 31, 2009 and 2008. The goodwill relates to the Company’s primary subsidiary and reporting unit, Five Star Bank. The Company performs a goodwill impairment test on an annual basis or more frequently if events and circumstances warrant.
The Company has historically considered total market capitalization as an indicator of fair value based on the trading price of its common stock compared to the carrying value of common equity. However, given the extreme volatility in the stock market during recent years and the impact that the credit crisis and the recession had on the stock market, management concluded that it was more appropriate to consider multiple approaches in assessing its goodwill for potential impairment.
At March 31, 2009, the Company concluded that events had occurred and circumstances had changed which may indicate the existence of potential impairment of goodwill. These indicators included a significant decline in the Company’s stock price and deterioration in the banking industry. The Company utilized a valuation consultant to perform an interim assessment of its goodwill. The assessment included a weighted combination of valuation techniques, which incorporated both income and market based valuation approaches. The income based valuation approach, which carried the most weight, was based on a dividend discount analysis that calculated cash flows on projected financial results assuming a change of control transaction. The significant factors and assumptions used in the discounted dividend analysis included: management’s financial projections, projected dividend stream based on minimum capital requirements, change of control cost synergies, a multiple of terminal price-to-earnings and the discount rate used to calculate the present value of future cash flows. The valuation also included market based valuation approaches, which included application of median pricing multiples from recent actual acquisitions of companies of similar size, as well as, application of change of control premiums to trading value. The valuation resulted in a fair value that exceeded the carrying value of common equity by greater than 10%. Based primarily on the results of this valuation, management concluded that no impairment of goodwill existed.
- 42 -
Table of Contents
MANAGEMENT’S DISCUSSION AND ANALYSIS
The Company continued to monitor the valuation analysis and key assumptions that drove the valuation throughout the remainder of 2009, including as of September 30, the annual evaluation date. The Company also considered the improvement in its financial performance, as well as improved market and industry conditions in general, which occurred subsequent to the March 31, 2009 goodwill impairment analysis. Based on its ongoing evaluation and assessments, the Company concluded no impairment of goodwill existed during and as of the year ended December 31, 2009.
Declines in the market value of the Company’s publicly traded stock price or declines in the Company’s ability to generate future cash flows may increase the potential that goodwill recorded on the Company’s consolidated statement of financial condition be designated as impaired and that the Company may incur a goodwill write-down in the future.
- 43 -
Table of Contents
MANAGEMENT’S DISCUSSION AND ANALYSIS
RESULTS OF OPERATIONS FOR THE YEARS ENDED
DECEMBER 31, 2009 AND DECEMBER 31, 2008
DECEMBER 31, 2009 AND DECEMBER 31, 2008
Net Interest Income
Net interest income in the consolidated statements of operations (which excludes the taxable equivalent adjustment) was $72.3 million in 2009 compared to $65.3 million in 2008. The taxable equivalent adjustments (the adjustments to bring tax-exempt interest to a level that would yield the same after-tax income had that income been subject to a taxation using a 34% tax rate) of $2.7 million and $4.3 million for 2009 and 2008, respectively, resulted in fully taxable equivalent net interest income of $75.0 million in 2009 and $69.6 million in 2008.
Net interest income is the primary source of the Corporation’s revenue. Net interest income is the difference between interest income on interest-earning assets, such as loans and investment securities, and the interest expense on interest-bearing deposits and other borrowings used to fund interest-earning and other assets or activities. Net interest income is affected by changes in interest rates and by the amount and composition of earning assets and interest-bearing liabilities, as well as the sensitivity of the balance sheet to changes in interest rates, including characteristics such as the fixed or variable nature of the financial instruments, contractual maturities and repricing frequencies.
Interest rate spread and net interest margin are utilized to measure and explain changes in net interest income. Interest rate spread is the difference between the yield on earning assets and the rate paid for interest-bearing liabilities that fund those assets. The net interest margin is expressed as the percentage of net interest income to average earning assets. The net interest margin exceeds the interest rate spread because noninterest-bearing sources of funds (“net free funds”), principally noninterest-bearing demand deposits and stockholders’ equity, also support earning assets. To compare tax-exempt asset yields to taxable yields, the yield on tax-exempt investment securities is computed on a taxable equivalent basis. Net interest income, interest rate spread, and net interest margin are discussed on a taxable equivalent basis.
Taxable equivalent net interest income of $75.0 million for 2009 was $5.3 million or 8% higher than 2008. The increase in taxable equivalent net interest income was a combination of favorable volume variances (as balance sheet changes in both volume and mix increased taxable equivalent net interest income by $2.6 million) and favorable interest rate changes (as the impact of changes in the interest rate environment and product pricing increased taxable equivalent net interest income by $2.7 million). The change in mix and volume of earning assets increased taxable equivalent interest income by $4.8 million, while the change in volume and composition of interest-bearing liabilities decreased interest expense by $2.2 million, for a net favorable volume impact of $2.6 million on taxable equivalent net interest income. Rate changes on earning assets reduced interest income by $10.8 million, while changes in rates on interest-bearing liabilities lowered interest expense by $13.5 million, for a net favorable rate impact of $2.7 million.
The net interest margin for 2009 was 4.04%, compared to 3.93% in 2008. The 11 basis point improvement in net interest margin was attributable to a 30 basis point increase in interest rate spread (the net of a 90 basis point decrease in the cost of interest-bearing liabilities and a 60 basis decrease in the yield on earning assets), partially offset by a 19 basis point lower contribution from net free funds (primarily attributable to lower rates on interest-bearing liabilities reducing the relative value of noninterest-bearing deposits and other net free funds).
While unchanged during 2009, the Federal Reserve lowered interest rates seven times (for a total interest rate reduction of 400 basis points) during 2008. At December 31, 2009, the Federal Funds rate was 0.25%, unchanged from December 31, 2008.
For 2009, the yield on average earning assets of 5.23% was 60 basis points lower than 2008. Loan yields also decreased 60 basis points (to 6.01%). Commercial loans in particular, down 97 basis points, experienced lower yields given the repricing of adjustable rate loans and competitive pricing pressures in a low interest rate environment. The yield on securities and short-term investments was down 84 basis points to 4.00%, also impacted by the lower interest rate environment and prepayment speeds of mortgage-related investment securities purchased at a premium. Overall, earning asset rate changes reduced interest income by $10.8 million.
The cost of average interest-bearing liabilities of 1.46% in 2009 was 90 basis points lower than 2008. The average cost of interest-bearing deposits was 1.33% in 2009, 87 basis points lower than 2008, reflecting the lower rate environment, mitigated by a focus on product pricing to retain balances. The cost of wholesale funding (comprised of short-term borrowings and long-term borrowings) decreased 118 basis points to 3.47% for 2009, with short-term borrowings down 127 basis points and long-term borrowings down 52 basis points. The interest-bearing liability rate changes resulted in $13.6 million lower interest expense.
Average interest-earning assets of $1.857 billion in 2009 were $84.7 million or 5% higher than 2008. Average investment securities decreased $111.9 million as a result of mortgage-related investment securities sales and maturities. Average loans increased $184.9 million or 18%, with a $68.6 million increase in commercial loans and a $128.4 million increase in consumer loans, offset by a $12.1 million decrease in residential real-estate loans.
Average interest-bearing liabilities of $1.525 billion in 2009 were up $98.1 million or 7% versus 2008, attributable to higher average deposit balances. On average, interest-bearing deposits grew $99.8 million, while average noninterest-bearing demand deposits (a principal component of net free funds) increased by $13.4 million. Average wholesale funding decreased $1.7 million, the net of $5.1 million increase and $6.8 million decrease in short-term and long-term borrowings, respectively.
- 44 -
Table of Contents
MANAGEMENT’S DISCUSSION AND ANALYSIS
The following tables present, for the periods indicated, information regarding: (i) the average balance sheet; (ii) the amount of interest income from interest-earning assets and the resulting annualized yields (tax-exempt yields have been adjusted to a tax-equivalent basis using the applicable Federal tax rate in each year); (iii) the amount of interest expense on interest-bearing liabilities and the resulting annualized rates; (iv) net interest income; (v) net interest rate spread; (vi) net interest income as a percentage of average interest-earning assets (“net interest margin”); and (vii) the ratio of average interest-earning assets to average interest-bearing liabilities. Investment securities are at amortized cost for both held to maturity and available for sale securities. Loans include net unearned income, net deferred loan fees and costs and non-accruing loans. Dollar amounts are shown in thousands.
| Years ended December 31, | ||||||||||||||||||||||||||||||||||||
| 2009 | 2008 | 2007 | ||||||||||||||||||||||||||||||||||
| Average | Average | Average | Average | Average | Average | |||||||||||||||||||||||||||||||
| Balance | Interest | Rate | Balance | Interest | Rate | Balance | Interest | Rate | ||||||||||||||||||||||||||||
Interest-earning assets: | ||||||||||||||||||||||||||||||||||||
| Federal funds sold and other interest-earning deposits | $ | 37,214 | $ | 82 | 0.22 | % | $ | 26,568 | $ | 619 | 2.33 | % | $ | 31,756 | $ | 1,662 | 5.23 | % | ||||||||||||||||||
| Investment securities: | ||||||||||||||||||||||||||||||||||||
| Taxable | 454,552 | 16,466 | 3.62 | 487,687 | 21,882 | 4.49 | 557,035 | 25,414 | 4.56 | |||||||||||||||||||||||||||
| Tax-exempt | 155,054 | 7,920 | 5.11 | 233,864 | 13,065 | 5.59 | 254,083 | 14,343 | 5.65 | |||||||||||||||||||||||||||
| Total investment securities | 609,606 | 24,386 | 4.00 | 721,551 | 34,947 | 4.84 | 811,118 | 39,757 | 4.90 | |||||||||||||||||||||||||||
| Loans held for sale | 1,899 | 95 | 5.00 | 821 | 51 | 6.23 | 770 | 54 | 6.99 | |||||||||||||||||||||||||||
| Loans: | ||||||||||||||||||||||||||||||||||||
| Commercial | 184,269 | 8,667 | 4.70 | 147,015 | 9,141 | 6.22 | 117,784 | 9,728 | 8.26 | |||||||||||||||||||||||||||
| Commercial real estate | 284,603 | 17,882 | 6.28 | 250,387 | 17,086 | 6.82 | 246,396 | 18,230 | 7.40 | |||||||||||||||||||||||||||
| Agricultural | 42,126 | 2,373 | 5.63 | 45,035 | 3,126 | 6.94 | 53,356 | 4,351 | 8.16 | |||||||||||||||||||||||||||
| Residential real estate | 159,156 | 9,605 | 6.04 | 171,262 | 10,710 | 6.25 | 165,226 | 10,815 | 6.55 | |||||||||||||||||||||||||||
| Consumer indirect | 313,239 | 21,838 | 6.97 | 185,197 | 13,098 | 7.07 | 118,152 | 8,067 | 6.83 | |||||||||||||||||||||||||||
| Consumer direct and home equity | 224,720 | 12,246 | 5.45 | 224,343 | 14,462 | 6.45 | 236,910 | 17,315 | 7.31 | |||||||||||||||||||||||||||
| Total loans | 1,208,113 | 72,611 | 6.01 | 1,023,239 | 67,623 | 6.61 | 937,824 | 68,506 | 7.30 | |||||||||||||||||||||||||||
| Total interest-earning assets | 1,856,832 | 97,174 | 5.23 | 1,772,179 | 103,240 | 5.83 | 1,781,468 | 109,979 | 6.17 | |||||||||||||||||||||||||||
| Less: Allowance for loan losses | 20,355 | 16,287 | 16,587 | |||||||||||||||||||||||||||||||||
| Other noninterest-earning assets | 197,439 | 149,453 | 142,156 | |||||||||||||||||||||||||||||||||
| Total assets | $ | 2,033,916 | $ | 1,905,345 | $ | 1,907,037 | ||||||||||||||||||||||||||||||
Interest-bearing liabilities: | ||||||||||||||||||||||||||||||||||||
| Deposits: | ||||||||||||||||||||||||||||||||||||
| Interest-bearing demand | $ | 365,873 | 772 | 0.21 | $ | 347,702 | 3,246 | 0.93 | $ | 338,326 | 5,760 | 1.70 | ||||||||||||||||||||||||
| Savings and money market | 383,697 | 1,090 | 0.28 | 369,926 | 3,773 | 1.02 | 346,131 | 5,863 | 1.69 | |||||||||||||||||||||||||||
| Certificates of deposit | 685,259 | 17,228 | 2.51 | 617,381 | 22,330 | 3.62 | 672,239 | 31,091 | 4.63 | |||||||||||||||||||||||||||
| Total interest-bearing deposits | 1,434,829 | 19,090 | 1.33 | 1,335,009 | 29,349 | 2.20 | 1,356,696 | 42,714 | 3.15 | |||||||||||||||||||||||||||
| Short-term borrowings | 43,092 | 270 | 0.63 | 38,028 | 721 | 1.90 | 29,048 | 864 | 2.97 | |||||||||||||||||||||||||||
| Long-term borrowings | 46,913 | 2,857 | 6.09 | 53,687 | 3,547 | 6.61 | 51,561 | 3,561 | 6.91 | |||||||||||||||||||||||||||
| Total interest-bearing liabilities | 1,524,834 | 22,217 | 1.46 | 1,426,724 | 33,617 | 2.36 | 1,437,305 | 47,139 | 3.28 | |||||||||||||||||||||||||||
| Noninterest-bearing deposits | 293,852 | 280,467 | 266,239 | |||||||||||||||||||||||||||||||||
| Other liabilities | 20,890 | 15,249 | 17,966 | |||||||||||||||||||||||||||||||||
| Shareholders’ equity | 194,340 | 182,905 | 185,527 | |||||||||||||||||||||||||||||||||
| Total liabilities and shareholders’ equity | $ | 2,033,916 | $ | 1,905,345 | $ | 1,907,037 | ||||||||||||||||||||||||||||||
| Net interest income (tax-equivalent) | $ | 74,957 | $ | 69,623 | $ | 62,840 | ||||||||||||||||||||||||||||||
| Interest rate spread | 3.77 | % | 3.47 | % | 2.89 | % | ||||||||||||||||||||||||||||||
| Net earning assets | $ | 331,998 | $ | 345,455 | $ | 344,163 | ||||||||||||||||||||||||||||||
| Net interest margin (tax-equivalent) | 4.04 | % | 3.93 | % | 3.53 | % | ||||||||||||||||||||||||||||||
| Ratio of average interest-earning assets to average interest-bearing liabilities | 121.77 | % | 124.21 | % | 123.95 | % | ||||||||||||||||||||||||||||||
- 45 -
Table of Contents
MANAGEMENT’S DISCUSSION AND ANALYSIS
Rate /Volume Analysis
The following table presents, on a tax equivalent basis, the relative contribution of changes in volumes and changes in rates to changes in net interest income for the periods indicated. The change in interest not solely due to changes in volume or rate has been allocated in proportion to the absolute dollar amounts of the change in each (in thousands):
| December 31, 2009 vs. 2008 | December 31, 2008 vs. 2007 | |||||||||||||||||||||||
| Increase/(Decrease) | Increase/(Decrease) | |||||||||||||||||||||||
| Due to Change in | Total Net | Due to Change in | Total Net | |||||||||||||||||||||
| Average | Average | Increase | Average | Average | Increase | |||||||||||||||||||
| Volume | Rate | (Decrease) | Volume | Rate | (Decrease) | |||||||||||||||||||
Interest-earning assets: | ||||||||||||||||||||||||
| Federal funds sold and other interest-earning deposits | $ | 179 | $ | (716 | ) | $ | (537 | ) | $ | (238 | ) | $ | (805 | ) | $ | (1,043 | ) | |||||||
| Investment securities: | ||||||||||||||||||||||||
| Taxable | (1,412 | ) | (4,004 | ) | (5,416 | ) | (3,118 | ) | (414 | ) | (3,532 | ) | ||||||||||||
| Tax-exempt | (4,102 | ) | (1,043 | ) | (5,145 | ) | (1,131 | ) | (147 | ) | (1,278 | ) | ||||||||||||
| Total investment securities | (4,977 | ) | (5,584 | ) | (10,561 | ) | (4,343 | ) | (467 | ) | (4,810 | ) | ||||||||||||
| Loans held for sale | 56 | (12 | ) | 44 | 4 | (7 | ) | (3 | ) | |||||||||||||||
| Loans: | ||||||||||||||||||||||||
| Commercial | 2,028 | (2,502 | ) | (474 | ) | 2,115 | (2,702 | ) | (587 | ) | ||||||||||||||
| Commercial real estate | 2,218 | (1,422 | ) | 796 | 291 | (1,435 | ) | (1,144 | ) | |||||||||||||||
| Agricultural | (192 | ) | (561 | ) | (753 | ) | (627 | ) | (598 | ) | (1,225 | ) | ||||||||||||
| Residential real estate | (740 | ) | (365 | ) | (1,105 | ) | 387 | (492 | ) | (105 | ) | |||||||||||||
| Consumer indirect | 8,930 | (190 | ) | 8,740 | 4,732 | 299 | 5,031 | |||||||||||||||||
| Consumer direct and home equity | 24 | (2,240 | ) | (2,216 | ) | (885 | ) | (1,968 | ) | (2,853 | ) | |||||||||||||
| Total loans | 11,481 | (6,493 | ) | 4,988 | 5,949 | (6,832 | ) | (883 | ) | |||||||||||||||
| Total interest-earning assets | 4,772 | (10,838 | ) | (6,066 | ) | (570 | ) | (6,169 | ) | (6,739 | ) | |||||||||||||
Interest-bearing liabilities: | ||||||||||||||||||||||||
| Deposits: | ||||||||||||||||||||||||
| Interest-bearing demand | 162 | (2,636 | ) | (2,474 | ) | 156 | (2,670 | ) | (2,514 | ) | ||||||||||||||
| Savings and money market | 135 | (2,818 | ) | (2,683 | ) | 379 | (2,469 | ) | (2,090 | ) | ||||||||||||||
| Certificates of deposit | 2,257 | (7,359 | ) | (5,102 | ) | (2,386 | ) | (6,375 | ) | (8,761 | ) | |||||||||||||
| Total interest-bearing deposits | 2,056 | (12,315 | ) | (10,259 | ) | (673 | ) | (12,692 | ) | (13,365 | ) | |||||||||||||
| Short-term borrowings | 85 | (536 | ) | (451 | ) | 222 | (365 | ) | (143 | ) | ||||||||||||||
| Long-term borrowings | (426 | ) | (264 | ) | (690 | ) | 144 | (158 | ) | (14 | ) | |||||||||||||
| Total interest-bearing liabilities | 2,177 | (13,577 | ) | (11,400 | ) | (345 | ) | (13,177 | ) | (13,522 | ) | |||||||||||||
| Change in net interest income | $ | 2,595 | $ | 2,739 | $ | 5,334 | $ | (225 | ) | $ | 7,008 | $ | 6,783 | |||||||||||
- 46 -
Table of Contents
MANAGEMENT’S DISCUSSION AND ANALYSIS
Provision for Loan Losses
The provision for loan losses totaled $7.7 million for the year ended December 31, 2009, versus $6.6 million for 2008. The increase in the provision was due to increased net charge-offs and increases in loan portfolio outstandings during 2009. See the “Analysis on Allowance for Loan Losses” and “Allocation of Allowance for Loan Losses” sections for further discussion.
Noninterest Income (Loss)
Noninterest income was $18.8 million for 2009. Core fee-based revenues (defined as service charges on deposit accounts, ATM and debit fees, and broker-dealer fees and commissions) totaled $14.7 million for 2009, down $571 thousand or 4% from $15.3 million for 2008. Net mortgage banking income was $2.0 million for 2009, compared to $1.0 million in 2008, an increase of $1.0 million from 2008, primarily attributable to higher secondary mortgage production experienced during 2009.
The following table summarizes the Company’s noninterest income (loss) for the years ended December 31 (in thousands):
| 2009 | 2008 | 2007 | ||||||||||
| Service charges on deposits | $ | 10,065 | $ | 10,497 | $ | 10,932 | ||||||
| ATM and debit card | 3,610 | 3,313 | 2,883 | |||||||||
| Loan servicing | 1,308 | 664 | 928 | |||||||||
| Company owned life insurance | 1,096 | 563 | 1,255 | |||||||||
| Broker-dealer fees and commissions | 1,022 | 1,458 | 1,396 | |||||||||
| Net gain on sale of loans held for sale | 699 | 339 | 779 | |||||||||
| Net gain on disposal of investment securities | 3,429 | 288 | 207 | |||||||||
| Impairment charges on investment securities | (4,666 | ) | (68,215 | ) | — | |||||||
| Net gain on sale of other assets | 180 | 305 | 102 | |||||||||
| Other | 2,052 | 2,010 | 2,198 | |||||||||
| Total noninterest income (loss) | $ | 18,795 | $ | (48,778 | ) | $ | 20,680 | |||||
Service charges on deposits were $10.1 million, $432 thousand or 4% lower than 2008. The decrease was primarily attributable to lower nonsufficient funds (down $505 thousand to $8.3 million), offset by an increase in other service charges of (up $73 thousand to $1.8 million).
ATM and debit card income was $3.6 million for 2009, an increase of $297 thousand or 9%, compared to 2008, as the increased popularity of electronic banking and transaction processing has resulted in higher ATM and debit card point-of-sale usage fees.
Loan servicing income represents fees earned for servicing mortgage loans sold to third parties, net of amortization expense and impairment losses, if any, associated with capitalized mortgage servicing assets. Loan servicing income increased $644 thousand for the year ended December 31, 2009 compared to 2008, mainly from an increase in the sold and serviced residential real estate portfolio and a recovery in the fair value of capitalized mortgage servicing assets.
The Company invested $20.0 million in company owned life insurance during the third quarter of 2008, resulting in the $533 thousand increase when comparing company owned life insurance income for the year ended December 31, 2009 to 2008.
Broker-dealer fees and commissions were down $436 thousand or 30%, compared to 2008. Broker-dealer fees and commissions fluctuate mainly due to sales volume, which has declined during 2009 as a result of current market and economic conditions.
Net gain on sale of loans held for sale increased $360 thousand compared to the prior year, due primarily to higher gains on sales and related income resulting from increased volumes. Secondary mortgage production was $89.0 million for 2009, compared to $28.5 million for 2008. In addition, the 2008 income includes $104 thousand in net gains from the sale of student loans. The Company exited the student loan business in 2008.
The $3.4 million net gain on disposal of investment securities for 2009 is comprised of $6.8 million in gross gains, primarily from securities issued by U.S. government sponsored agencies, and $3.4 million in gross losses on sales of privately issued whole loan CMOs and auction rate securities. The $288 thousand net gain on disposal of investment securities for 2008 is comprised of $291 thousand in gross gains and $3 thousand in gross losses.
The $4.7 million of impairment charges on investment securities for 2009 is comprised of valuation write-downs of $2.4 million on pooled TPS and $2.3 million on privately issued whole loan CMOs. The $68.2 million of impairment charges on investment securities for 2008 is comprised of valuation write-downs of $30.0 million on pooled TPS, $5.9 million on privately issued whole loan CMOs and $32.3 million on auction-rate securities.
- 47 -
Table of Contents
MANAGEMENT’S DISCUSSION AND ANALYSIS
Noninterest Expense
Noninterest expense for 2009 was $62.8 million, an increase of $5.3 million or 9% over 2008. FDIC assessments increased $3.0 million, salaries and employee benefits increased $2.2 million, and collectively all remaining noninterest expense categories were up $142 thousand compared to 2008. The following table summarizes the Company’s noninterest expense for the years ended December 31 (in thousands):
| 2009 | 2008 | 2007 | ||||||||||
| Salaries and employee benefits | $ | 33,634 | $ | 31,437 | $ | 33,175 | ||||||
| Occupancy and equipment | 11,062 | 10,502 | 9,903 | |||||||||
| FDIC assessments | 3,651 | 674 | 289 | |||||||||
| Professional services | 2,524 | 2,141 | 2,080 | |||||||||
| Computer and data processing | 2,340 | 2,433 | 2,126 | |||||||||
| Supplies and postage | 1,846 | 1,800 | 1,662 | |||||||||
| Advertising and promotions | 949 | 1,453 | 1,402 | |||||||||
| Other | 6,771 | 7,021 | 6,791 | |||||||||
| Total noninterest expense | $ | 62,777 | $ | 57,461 | $ | 57,428 | ||||||
Salaries and employee benefits (which includes salary-related expenses and fringe benefit expenses) was $33.6 million for 2009, up $2.2 million or 7% from 2008. Average full-time equivalent employees (“FTEs”) were 586 for 2009, down 4% from 610 for 2008. Salary-related expenses were relatively unchanged at $25.2 million for 2009 and $25.1 million for 2008, a result of fewer FTEs offset by higher incentives and commissions. Fringe benefit expenses increased $2.1 million or 34%, primarily from higher pension and post-retirement benefit costs.
Compared to 2008, occupancy and equipment expenses of $11.1 million were up $560 thousand or 5%, primarily a result of additional expenses related to the opening of two new branches at the end of 2008, combined with increased software maintenance costs.
FDIC assessments, comprised mostly of deposit insurance paid to the FDIC, increased $3.0 million for the year ended December 31, 2009. The increases resulted from a combination of an increase in deposit levels subject to insurance premiums, higher FDIC insurance premium rates during 2009 and a $923 thousand special assessment during the second quarter of 2009, coupled with utilization of approximately $451 thousand in carryforward credits that reduced expense during the first nine months of 2008.
Professional services expense of $2.5 million increased $383 thousand or 18%, primarily due to higher legal and other professional consultant costs associated with loan workouts and other corporate activities and projects.
Advertising and promotions expense of $949 thousand and other noninterest expense of $6.8 million, collectively, were down $754 thousand or 9%, reflecting efforts to control selected discretionary expenses.
The efficiency ratio for the year ended December 31, 2009 was 65.52% compared with 64.07% for 2008. The diminished efficiency ratio is reflective of noninterest expense increasing by larger margin than the higher level of net interest income. The efficiency ratio equals noninterest expense less other real estate expense and amortization of intangible assets as a percentage of net revenue, defined as the sum of tax-equivalent net interest income and noninterest income before net gains and impairment charges on investment securities and proceeds from company owned life insurance included in income.
Income Taxes
The Company recognized income tax expense of $6.1 million for 2009 compared to an income tax benefit of $21.3 million for 2008. The change in income tax was primarily due to the Company having pre-tax income for 2009 versus a pre-tax loss for 2008. The Company’s effective tax rates were 29.8% in 2009 and (44.9)% in 2008. Effective tax rates are affected by income and expense items that are not subject to Federal or state taxation. The Company’s income tax provision reflects the impact of such items, including tax-exempt interest income from municipal securities, tax-exempt earnings on bank-owned life insurance and the effect of certain state tax credits. The unusual 2008 effective tax benefit rate results from the relationship between the size of the favorable permanent differences and pre-tax loss.
- 48 -
Table of Contents
MANAGEMENT’S DISCUSSION AND ANALYSIS
RESULTS OF OPERATIONS FOR THE YEARS ENDED
DECEMBER 31, 2008 AND DECEMBER 31, 2007
DECEMBER 31, 2008 AND DECEMBER 31, 2007
Net Interest Income
Net interest income, the principal source of the Company’s earnings, was $65.3 million in 2008 compared to $58.1 million in 2007. Net interest margin was 3.93% for the year ended December 31, 2008, an increase of 40 basis points from 3.53% for the same period last year. The 40 basis point increase in net interest margin was partially offset by a decline in average interest-earning assets of $9.3 million to $1.772 billion as of December 31, 2008 compared to $1.781 billion for the same period last year, which resulted in the $7.3 million increase in net interest income. The increase in net interest margin resulted from the average cost of funds decreasing 74 basis points while average earning asset yield decreased only 34 basis points. In 2008, earning asset yield benefited from a higher percentage of earning assets being deployed in higher yielding loan assets.
Average total loans for the year ended December 31, 2008 were $1.023 billion, up $85.4 million when compared with $937.8 million for the same period last year. The higher average consumer indirect and commercial portfolios more than offset the drop in the average consumer and home equity portfolio. Average total investment securities (excluding federal funds sold and other interest-bearing deposits) totaled $721.6 million for the year ended December 31, 2008, down from $811.1 million for the same period last year.
The Company’s yield on average earning assets was 5.83% for 2008, down 34 basis points from 6.17% in 2007. The Company’s loan portfolio yield was 6.61% for 2008, down 69 basis points from 2007, and the tax-equivalent investment yield was 4.84% for 2008, down 6 basis points from 2007.
Total average interest-bearing deposits were $1.335 billion for the year ended December 31, 2008, down slightly from $1.357 billion for the same period in 2007. Fewer certificates of deposit, including brokered certificates of deposit, contributed to the decline. Average short-term borrowings amounted to $38.0 million for 2008, up from $29.0 million for 2007. Average long-term borrowings totaled $53.7 million for the year ended December 31, 2008, up slightly from $51.6 million for the same period last year.
The rate on interest-bearing liabilities for the year ended December 31, 2008 was 2.36%, a decrease of 92 basis points from 2007. The decrease primarily resulted from lower general market interest rates experienced in 2008 and a favorable shift to lower cost funding sources.
Provision for Loan Losses
The provision for loan losses totaled $6.5 million for the year ended December 31, 2008, versus $116 thousand for 2007. The increase in the provision was primarily due to growth in the consumer indirect loan portfolio and a $1.7 million increase in net charge-offs during 2008. See the “Analysis on Allowance for Loan Losses” and “Allocation of Allowance for Loan Losses” sections for further discussion.
Noninterest Income
Service charges on deposits declined to $10.5 million for the year ended December 31, 2008 compared with $10.9 million for the same period in 2007, a result of fewer customer overdrafts and related service fees.
ATM and debit card income totaled $3.3 million and $2.9 million for the years ended December 31, 2008 and 2007, respectively. ATM and debit card income has increased as a result of higher ATM usage fees and an increase in customer utilization of debit card point-of-sale transactions. Broker-dealer fees and commissions increased due to slightly higher sales volumes.
Loan servicing income in 2008 was adversely impacted by a $343 thousand impairment charge on capitalized mortgage servicing assets that resulted from an increase in prepayment assumptions used to value capitalized mortgage servicing assets, a direct result of the decline in mortgage interest rates experienced in 2008. The impairment charge recorded in 2007 totaled $18 thousand.
For the year ended December 31, 2007, company owned life insurance included $1.1 million in income from the receipt of insurance proceeds. The Company invested $20.0 million in company owned life insurance during the third quarter of 2008, which would have resulted in an increase in income compared to prior year absent the death benefit proceeds received in 2007.
Net gain on sale of loans held for sale declined compared to prior year due primarily to lower student loan sale volumes, which resulted from increased competition and changing market conditions for student loans as the Company exited the business in 2008. For the years ended December 31, 2008 and 2007, student loan sale net gains were $104 thousand and $478 thousand, respectively.
The net gain on sale of other assets includes gains and losses on premises, equipment, other real estate (“ORE”) and repossessed assets and the increase in the net gain for 2008 was favorable in comparison to 2007.
The impairment charges on investment securities totaled $68.2 million in 2008. See the “Investing Activities” section for further discussion.
- 49 -
Table of Contents
MANAGEMENT’S DISCUSSION AND ANALYSIS
Noninterest Expense
For the year ended December 31, 2008, salaries and benefits totaled $31.4 million, down $1.7 million from the prior year. The factors that contributed to the decline were as follows: a reduction in annual incentive compensation as certain senior management incentive targets contingent on 2008 financial results were not achieved; an increase in the amount of salaries and wages allocated to deferred direct loan origination costs due to higher loan origination volumes; and lastly, a reduction in full-time equivalent employees (“FTEs”) to 600 as of year-end 2008, a decrease of 21 FTEs compared to prior year-end.
The Company experienced a 6% increase in occupancy and equipment expenses in 2008 to $10.5 million, compared to $9.9 million in 2007. The increase was partly a result of the expansion of the branch network in the Rochester area, as de novo branches were added in Henrietta and Greece during the third and fourth quarters of 2008, respectively. Also contributing to the increase in 2008 were technology upgrades and higher service contract related expenses associated with equipment and computer software.
FDIC assessments, comprised mostly of deposit insurance paid to the FDIC, increased $385 thousand for the year ended December 31, 2008. The Company had carryforward credits which it utilized to reduce deposit insurance expense during 2007 and a portion of 2008. These carryforward credits were fully utilized during the first nine months of 2008.
Professional fees and services increased 3% for the year ended December 31, 2008 compared to 2007, primarily due to costs incurred in 2008 associated with valuation of the investment securities portfolio.
Computer and data processing costs increased 14% in 2008 compared to the prior year, primarily due to higher debit card data transaction processing expense due to increased customer point-of-sale transaction volumes.
Supplies and postage increased 8% for the year ended December 31, 2008 versus 2007, primarily the result of higher postage costs.
Other expenses increased 3% or $230 thousand for the year ended December 31, 2008. A $557 thousand prepayment charge on borrowed funds was partly offset by lower levels of commercial-related loan workout expenses and other real estate expense (“ORE”) expenses in 2008.
The efficiency ratio for the year ended December 31, 2008 was 64.07% compared with 68.77% for 2007. The improved efficiency ratio is reflective of the higher level of net interest income and relatively flat noninterest expense. The efficiency ratio equals noninterest expense less other real estate expense and amortization of intangible assets as a percentage of net revenue, defined as the sum of tax-equivalent net interest income and noninterest income before net gains and impairment charges on investment securities, proceeds from company owned life insurance included in income and net gain on sale of trust relationships.
Income Taxes
The income tax (benefit) expense amounted to $(21.3) million and $4.8 million for the years ended December 31, 2008 and 2007, respectively. The fluctuation in income tax expense corresponded in general with the level of net income before tax. The Company’s effective tax rates were (44.9)% in 2008 and 22.6% in 2007. Effective tax rates are affected by income and expense items that are not subject to Federal or state taxation. The Company’s income tax provision reflects the impact of such items, including tax-exempt interest income from municipal securities, tax-exempt earnings on bank-owned life insurance and the effect of certain state tax credits. The unusual 2008 effective tax benefit rate results from the relationship between the size of the favorable permanent differences and pre-tax loss.
- 50 -
Table of Contents
MANAGEMENT’S DISCUSSION AND ANALYSIS
2009 FOURTH QUARTER RESULTS
For the fourth quarter of 2009, the Company’s net income was $5.4 million or $0.42 per diluted share, compared with net income of $3.4 million or $0.23 per diluted share for the third quarter of 2009 and a net loss of $3.1 million or ($0.33) per diluted share for the fourth quarter of 2008.
Net interest income for the fourth quarter of 2009 was $19.2 million, an increase of $1.9 million or 11% over the fourth quarter of 2008. Net interest margin was 4.06% for the fourth quarter of 2009, a decrease of 1 basis point from the fourth quarter of 2008. An improved mix of earning assets, primarily driven by growth in the loan portfolio, coupled with a significant decline in funding costs were the primary factors driving the performance of net interest income and margin.
Noninterest income for the quarter ended December 31, 2009 was $5.2 million, compared with a noninterest loss of $25.1 million in 2008. Other-than-temporary impairment charges (“OTTI”) on investment securities included in noninterest income amounted to $565 thousand during the fourth quarter of 2009. Absent the OTTI charges and net gains from security sales, noninterest income increased 11% for the quarterly period ended December 31, 2009, from the same period in 2008.
Noninterest expense for the fourth quarter of 2009 was $15.1 million, a decrease of $277 thousand from the fourth quarter of 2008. A one-time prepayment charge on borrowed funds of $557 thousand incurred during the fourth quarter of 2008 was most significant cause for the decrease.
Total assets at December 31, 2009 were $2.062 billion, down $75.8 million from $2.138 billion at September 30, 2009. Total loans were $1.264 billion and represented 61% of total assets at December 31, 2009, compared to $1.259 billion and 59% of total assets at September 30, 2009. Total deposits decreased $54.2 million to $1.743 billion at December 31, 2009, versus $1.797 billion at September 30, 2009, due to seasonal reductions in public deposits. Total investment securities were $620.1 million at December 31, 2009, down $50.7 million from $670.8 million at September 30, 2009.
Net charge-offs decreased by $128 thousand from the fourth quarter of 2008 to $1.1 million, or 0.35% of average loans. The provision for loan losses was $1.1 million for the quarter, compared with $2.6 million in the same quarter a year ago. At December 31, 2009, non-performing loans totaled $8.7 million, or 0.69% of total loans, an increase of $2.9 million from the third quarter. Included in non-performing loans at December 31, 2009 was one commercial relationship totaling $1.9 million which was past due in excess of 90 days but continued to accrue interest. The Company received a payment of principal and interest of approximately $1.7 million during January 2010 and expects to receive a substantial portion of the remaining principal and interest before the end of the first quarter of 2010. At December 31, 2009, non-performing assets totaled $10.4 million, which included $1.0 million in non-performing investment securities on which interest payments are no longer being accrued and any payments received are being applied to principal.
- 51 -
Table of Contents
MANAGEMENT’S DISCUSSION AND ANALYSIS
LIQUIDITY AND CAPITAL RESOURCES
The objective of maintaining adequate liquidity is to assure the ability of the Company to meet its financial obligations. These obligations include the withdrawal of deposits on demand or at their contractual maturity, the repayment of matured borrowings, the ability to fund new and existing loan commitments and the ability to take advantage of new business opportunities. The Company achieves liquidity by maintaining a strong base of core customer funds, maturing short-term assets, its ability to sell or pledge securities, lines-of-credit, and access to the financial and capital markets.
Liquidity for the Bank is managed through the monitoring of anticipated changes in loans, the investment portfolio, core deposits and wholesale funds. The strength of the Bank’s liquidity position is a result of its base of core customer deposits. These core deposits are supplemented by wholesale funding sources that include credit lines with the other banking institutions, the FHLB and the FRB.
The primary sources of liquidity for FII are dividends from the Bank and access to financial and capital markets. Dividends from the Bank are limited by various regulatory requirements related to capital adequacy and earnings trends. The Bank relies on cash flows from operations, core deposits, borrowings and short-term liquid assets. FSIS relies on cash flows from operations and funds from FII when necessary.
The Company’s cash and cash equivalents were $43.0 million as of December 31, 2009, down from $55.2 million as of December 31, 2008. The Company’s net cash provided by operating activities totaled $22.3 million and the principal source of operating activity cash flow was net income adjusted for noncash income and expense items and changes in other assets and other liabilities. Net cash used in investing activities totaled $172.2 million, which included net loan origination funding of $165.7 million and net securities transactions of $6.2 million. Net cash provided by financing activities of $137.7 million was attributed to the $109.7 million and $36.1 million increase in deposits and borrowings, respectively, partially offset by $7.5 million in cash paid for dividends.
Contractual Obligations and Other Commitments
The following table summarizes the maturities of various contractual obligations and other commitments (in thousands):
| At December 31, 2009 | ||||||||||||||||||||
| Within 1 | Over 1 to 3 | Over 3 to 5 | Over 5 | |||||||||||||||||
| year | years | Years | years | Total | ||||||||||||||||
Certificates of deposit (1) | $ | 526,549 | $ | 140,489 | $ | 18,968 | $ | 345 | $ | 686,351 | ||||||||||
| Long-term borrowings | 20,080 | 10,065 | — | 16,702 | 46,847 | |||||||||||||||
| Operating leases | 1,135 | 2,098 | 1,757 | 4,386 | 9,376 | |||||||||||||||
| Supplemental executive retirement plans | 92 | 282 | 282 | 754 | 1,410 | |||||||||||||||
Limited partnership investments(2) | 772 | 1,543 | 772 | — | 3,087 | |||||||||||||||
Commitments to extend credit(3) | 316,688 | — | — | — | 316,688 | |||||||||||||||
Standby letters of credit(3) | 6,887 | — | — | — | 6,887 | |||||||||||||||
| (1) | Includes the maturity of certificates of deposit amounting to $100 thousand or more as follows: $75.3 million in three months or less; $29.5 million between three months and six months; $51.1 million between six months and one year; and $17.5 million over one year. | |
| (2) | The Company has committed to capital investments in several limited partnerships of up to $5.6 million. As of December 31, 2009, the Company has contributed $2.5 million to the partnerships, including $383 thousand during 2009. | |
| (3) | The Company does not expect all of the commitments to extend credit and standby letters of credit to be funded. Thus, the total commitment amounts do not necessarily represent the Company’s future cash requirements. |
With the exception of the Company’s obligations in connection with its trust preferred securities and in connection with its irrevocable loan commitments, the Company had no other off-balance sheet arrangements that have or are reasonably likely to have a current or future effect on its financial condition, changes in financial condition, revenues or expenses, results of operations, liquidity, capital expenditures or capital resources that is material to investors. For additional information on off-balance sheet arrangements, see Note 1, Summary of Significant Accounting Policies and Note 9, Commitments and Contingencies, in the notes to the accompanying consolidated financial statements.
The Company’s sale of preferred shares under the Treasury’s TARP in December 2008 increased shareholders’ equity by $37.5 million. The Company is evaluating repayment alternatives relative to the TARP funds to determine the most economically beneficial option for the Company and shareholders.
- 52 -
Table of Contents
MANAGEMENT’S DISCUSSION AND ANALYSIS
Security Yields and Maturities Schedule
The following table sets forth certain information regarding the amortized cost (“Cost”), weighted average yields (“Yield”) and contractual maturities of the Company’s debt securities portfolio as of December 31, 2009. Actual maturities may differ from the contractual maturities presented, because borrowers may have the right to call or prepay certain investments. No tax-equivalent adjustments were made to the weighted average yields (in thousands).
| Due after five | ||||||||||||||||||||||||||||||||||||||||
| Due in one year | Due from one to | years through | Due after ten | |||||||||||||||||||||||||||||||||||||
| or less | five years | ten years | years | Total | ||||||||||||||||||||||||||||||||||||
| Cost | Yield | Cost | Yield | Cost | Yield | Cost | Yield | Cost | Yield | |||||||||||||||||||||||||||||||
Available for sale debt securities: | ||||||||||||||||||||||||||||||||||||||||
| U.S. Government agencies and government-sponsored enterprises | $ | — | — | % | $ | 84,017 | 2.02 | % | $ | 30,935 | 1.62 | % | $ | 19,612 | 0.85 | % | $ | 134,564 | 1.76 | % | ||||||||||||||||||||
| State and political subdivisions | 23,537 | 3.51 | 49,856 | 3.61 | 7,419 | 3.36 | — | — | 80,812 | 3.56 | ||||||||||||||||||||||||||||||
| Mortgage-backed securities | 29,004 | 3.79 | 36,060 | 4.11 | 13,799 | 3.79 | 282,268 | 3.67 | 361,131 | 3.73 | ||||||||||||||||||||||||||||||
| Asset-backed securities | — | — | — | — | — | — | 1,295 | 1.86 | 1,295 | 1.86 | ||||||||||||||||||||||||||||||
| 52,541 | 3.66 | 169,933 | 2.93 | 52,153 | 2.44 | 303,175 | 3.66 | 577,802 | 3.33 | |||||||||||||||||||||||||||||||
Held to maturity debt securities: | ||||||||||||||||||||||||||||||||||||||||
| State and political subdivisions | 30,238 | 2.56 | 7,361 | 4.09 | 1,542 | 4.85 | 432 | 5.42 | 39,573 | 2.97 | ||||||||||||||||||||||||||||||
| $ | 82,779 | 3.26 | % | $ | 177,294 | 2.98 | % | $ | 53,695 | 2.51 | % | $ | 303,607 | 3.66 | % | $ | 617,375 | 3.31 | % | |||||||||||||||||||||
Contractual Loan Maturity Schedule
The following table summarizes the contractual maturities of the Company’s loan portfolio at December 31, 2009. Loans, net of deferred loan origination costs, include principal amortization and non-accruing loans. Demand loans having no stated schedule of repayment or maturity and overdrafts are reported as due in one year or less (in thousands).
| Due in less | Due from one | Due after five | ||||||||||||||
| than one year | to five years | years | Total | |||||||||||||
| Commercial | $ | 135,251 | $ | 48,741 | $ | 2,394 | $ | 186,386 | ||||||||
| Commercial real estate | 82,474 | 150,377 | 76,022 | 308,873 | ||||||||||||
| Agricultural | 21,002 | 15,826 | 5,044 | 41,872 | ||||||||||||
| Residential real estate | 32,201 | 68,027 | 43,987 | 144,215 | ||||||||||||
| Consumer indirect | 123,829 | 220,453 | 8,329 | 352,611 | ||||||||||||
| Consumer direct and home equity | 63,931 | 119,031 | 47,087 | 230,049 | ||||||||||||
| Total loans | $ | 458,688 | $ | 622,455 | $ | 182,863 | $ | 1,264,006 | ||||||||
| Loans maturing after one year: | ||||||||||||||||
| With a predetermined interest rate | $ | 399,133 | $ | 70,498 | $ | 469,631 | ||||||||||
| With a floating or adjustable rate | 223,322 | 112,365 | 335,687 | |||||||||||||
| Total loans maturing after one year | $ | 622,455 | $ | 182,863 | $ | 805,318 | ||||||||||
- 53 -
Table of Contents
MANAGEMENT’S DISCUSSION AND ANALYSIS
Capital Resources
The FRB has adopted a system using risk-based capital guidelines to evaluate the capital adequacy of bank holding companies on a consolidated basis. The guidelines require a minimum Tier 1 leverage ratio of 4.00%, a minimum Tier 1 capital ratio of 4.00% and a minimum total risk-based capital ratio of 8.00%. The following table reflects the ratios and their components (in thousands):
| 2009 | 2008 | |||||||
| Total shareholders’ equity | $ | 198,294 | $ | 190,300 | ||||
| Less: Unrealized gain (loss) on securities available for sale, net of tax | 1,655 | 3,463 | ||||||
| Unrecognized net periodic pension & postretirement benefits (costs), net of tax | (5,357 | ) | (7,476 | ) | ||||
| Disallowed goodwill and other intangible assets | 37,369 | 37,650 | ||||||
| Disallowed deferred tax assets | 17,214 | 22,437 | ||||||
| Plus: Qualifying trust preferred securities | 16,200 | 16,200 | ||||||
| Tier 1 capital | $ | 163,613 | $ | 150,426 | ||||
| Adjusted average total assets (for leverage capital purposes) | $ | 2,054,699 | $ | 1,869,111 | ||||
| Tier 1 leverage ratio (Tier 1 capital to adjusted average total assets) | 7.96 | % | 8.05 | % | ||||
| Total Tier 1 capital | $ | 163,613 | $ | 150,426 | ||||
| Plus: Qualifying allowance for loan losses | 17,153 | 15,936 | ||||||
| Total risk-based capital | $ | 180,766 | $ | 166,362 | ||||
| Net risk-weighted assets | $ | 1,368,653 | $ | 1,272,028 | ||||
| Tier 1 capital ratio (Tier 1 capital to net risk-weighted assets) | 11.95 | % | 11.83 | % | ||||
| Total risk-based capital ratio (Total risk-based capital to net risk-weighted assets) | 13.21 | % | 13.08 | % | ||||
CRITICAL ACCOUNTING ESTIMATES
The Company’s consolidated financial statements are prepared in accordance with GAAP and are consistent with predominant practices in the financial services industry. Application of critical accounting policies, which are those policies that management believes are the most important to the Company’s financial position and results, requires management to make estimates, assumptions, and judgments that affect the amounts reported in the consolidated financial statements and accompanying notes and are based on information available as of the date of the financial statements. Future changes in information may affect these estimates, assumptions and judgments, which, in turn, may affect amounts reported in the financial statements.
The Company has numerous accounting policies, of which the most significant are presented in Note 1, Summary of Significant Accounting Policies, of the notes to consolidated financial statements. These policies, along with the disclosures presented in the other financial statement notes and in this discussion, provide information on how significant assets, liabilities, revenues and expenses are reported in the consolidated financial statements and how those reported amounts are determined. Based on the sensitivity of financial statement amounts to the methods, assumptions, and estimates underlying those amounts, management has determined that the accounting policies with respect to the allowance for loan losses, valuation of goodwill and deferred tax assets, the valuation of securities and determination of OTTI, and accounting for defined benefit plans require particularly subjective or complex judgments important to the Company’s financial position and results of operations, and, as such, are considered to be critical accounting policies as discussed below. These estimates and assumptions are based on management’s best estimates and judgment and are evaluated on an ongoing basis using historical experience and other factors, including the current economic environment. The Company adjusts these estimates and assumptions when facts and circumstances dictate. Illiquid credit markets and volatile equity have combined with declines in consumer spending to increase the uncertainty inherent in these estimates and assumptions. As future events cannot be determined with precision, actual results could differ significantly from the Company’s estimates.
Adequacy of the Allowance for Loan Losses
The allowance for loan losses represents management’s estimate of probable credit losses inherent in the loan portfolio. Determining the amount of the allowance for loan losses is considered a critical accounting estimate because it requires significant judgment and the use of subjective measurements including management’s assessment of the internal risk classifications of loans, changes in the nature of the loan portfolio, industry concentrations and the impact of current local, regional and national economic factors on the quality of the loan portfolio. Changes in these estimates and assumptions are reasonably possible and may have a material impact on the Company’s consolidated financial statements, results of operations or liquidity.
- 54 -
Table of Contents
MANAGEMENT’S DISCUSSION AND ANALYSIS
A commercial-related loan is considered impaired when, based on current information and events, it is probable that a creditor will be unable to collect all amounts of principal and interest under the original terms of the agreement and all loans restructured in a troubled debt restructuring. Accordingly, the Company evaluates impaired commercial-related loans individually, primarily based on the net realizable value of the collateral, as the majority of the Company’s impaired loans are collateral dependent.
Loans, including impaired loans, are generally classified as non-accruing if they are past due as to maturity or payment of principal or interest for a period of more than 90 days, unless such loans are well-collateralized and in the process of collection. Loans that are on a current payment status or past due less than 90 days may also be classified as non-accruing if repayment in full of principal and/or interest is uncertain.
For additional discussion related to the Company’s accounting policies for the allowance for loan losses, see the sections titled “Analysis of Allowance for Loan Losses” and “Allocation of Allowance for Loan Losses” in Part II, Item 7, “Management’s Discussion and Analysis of Financial Condition and Results of Operations” and Note 1, Summary of Significant Accounting Policies, of the notes to consolidated financial statements.
Valuation of Goodwill
Goodwill represents the excess of cost over the fair value of the net assets of businesses acquired. Goodwill and intangible assets acquired in a business combination and determined to have an indefinite useful life are not amortized. Instead, these assets are subject to at least an annual impairment review and more frequently if certain impairment indicators are in evidence. Goodwill impairment testing is performed at the segment (or “reporting unit”) level. Currently, the Company’s goodwill is evaluated at the entity level as there is only one material reporting unit. Fair value of the reporting unit is considered based on total market capitalization or discounted cash flow projections using various estimates and assumptions, including discount rate, tangible equity ratio and change in control premium. Changes in the estimates and assumptions are reasonably possible and may have a material impact on the Company’s consolidated financial statements, results of operations or liquidity. For additional discussion related to the Company’s accounting policy for goodwill and other intangible assets, see Note 1, Summary of Significant Accounting Policies, of the notes to consolidated financial statements.
Valuation of Deferred Tax Assets
The determination of deferred tax expense or benefit is based on changes in the carrying amounts of assets and liabilities that generate temporary differences. The carrying value of the Company’s net deferred tax assets assumes that the Company will be able to generate sufficient future taxable income based on estimates and assumptions (after consideration of historical taxable income as well as tax planning strategies). If these estimates and related assumptions change, the Company may be required to record valuation allowances against its deferred tax assets resulting in additional income tax expense in the consolidated statements of operations. Management evaluates its deferred tax assets on a quarterly basis and assesses the need for a valuation allowance, if any. A valuation allowance is established when management believes that it is more likely than not that some portion of its deferred tax assets will not be realized. Changes in valuation allowance from period to period are included in the Company’s tax provision in the period of change. For additional discussion related to the Company’s accounting policy for income taxes see Note 14, Income Taxes, of the notes to consolidated financial statements.
Valuation and Other Than Temporary Impairment of Securities
The Company records all of its securities that are classified as available for sale at fair value. The fair value of equity securities are determined using public quotations, when available. Where quoted market prices are not available, fair values are estimated based on dealer quotes, pricing models, discounted cash flow methodologies, or similar techniques for which the determination of fair value may require significant judgment or estimation. Fair values of public bonds and those private securities that are actively traded in the secondary market have been determined through the use of third-party pricing services using market observable inputs. Private placement securities and other corporate fixed maturities where the Company does not receive a public quotation are valued using a variety of acceptable valuation methods. Market rates used are applicable to the yield, credit quality and average maturity of each security. Private equity securities may also utilize internal valuation methodologies appropriate for the specific asset. Fair values might also be determined using broker quotes or through the use of internal models or analysis.
Securities are evaluated quarterly to determine whether a decline in their fair value is other than temporary. Management utilizes criteria such as, the current intent or requirement to hold or sell, the magnitude and duration of the decline and, when appropriate, consideration of negative changes in expected cash flows, creditworthiness, near term prospects of issuers, the level of credit subordination, estimated loss severity, and delinquencies, to determine whether a loss in value is other than temporary. The term “other than temporary” is not intended to indicate that the decline is permanent, but indicates that the prospect for a near-term recovery of value is not necessarily favorable. Declines in the fair value of investment securities below their cost that are deemed to be other than temporary are reflected in earnings as realized losses to the extent the impairment is related to credit issues or concerns, or the security is intended to be sold. The amount of impairment related to non-credit related factors on securities not intended to be sold is recognized in other comprehensive income.
- 55 -
Table of Contents
MANAGEMENT’S DISCUSSION AND ANALYSIS
Defined Benefit Pension Plan
Management is required to make various assumptions in valuing its defined benefit pension plan assets and liabilities. These assumptions include, but are not limited to, the expected long-term rate of return on plan assets, the weighted average discount rate used to value certain liabilities and the rate of compensation increase. The Company uses a third-party specialist to assist in making these estimates and assumptions. Changes in these estimates and assumptions are reasonably possible and may have a material impact on the Company’s consolidated financial statements, results of operations or liquidity.
RECENT ACCOUNTING PRONOUNCEMENTS
See Note 1, Summary of Significant Accounting Policies — Recent Accounting Pronouncements, in the notes to consolidated financial statements for a discussion of recent accounting pronouncements.
- 56 -
Table of Contents
ITEM 7A. QUANTITATIVE AND QUALITATIVE DISCLOSURES ABOUT MARKET RISK
The principal objective of the Company’s interest rate risk management is to evaluate the interest rate risk inherent in assets and liabilities, determine the appropriate level of risk to the Company given its business strategy, operating environment, capital and liquidity requirements and performance objectives, and manage the risk consistent with the guidelines approved by FII’s Board of Directors. The Company’s management is responsible for reviewing with the Board its activities and strategies, the effect of those strategies on the net interest margin, the fair value of the portfolio and the effect that changes in interest rates will have on the portfolio and exposure limits. Management has developed an Asset-Liability Policy that meets strategic objectives and regularly reviews the activities of the Bank.
Net Interest Income at Risk Analysis
The primary tool the Company uses to manage interest rate risk is a “rate shock” simulation to measure the rate sensitivity of the statement of financial condition. Rate shock simulation is a modeling technique used to estimate the impact of changes in rates on net interest income and economic value of equity. The following table sets forth the results of the modeling analysis as of December 31, 2009 (dollars in thousands):
| Net Interest Income | Economic Value of Equity | |||||||||||||||||||||||
| Changes ininterest rate | Amount | Change | Amount | Change | ||||||||||||||||||||
| + 300 basis points | $ | 77,667 | $ | 1,887 | 2.49 | % | $ | 382,072 | $ | (17,550 | ) | (4.39 | )% | |||||||||||
| + 200 basis points | 77,038 | 1,258 | 1.66 | 389,616 | (10,006 | ) | (2.50 | ) | ||||||||||||||||
| + 100 basis points | 76,405 | 624 | 0.82 | 397,666 | (1,956 | ) | (0.49 | ) | ||||||||||||||||
| - 100 basis points | 72,533 | (3,248 | ) | (4.29 | ) | 390,784 | (8,838 | ) | (2.21 | ) | ||||||||||||||
The Company measures net interest income at risk by estimating the changes in net interest income resulting from instantaneous and sustained parallel shifts in interest rates of different magnitudes over a period of 12 months. As of December 31, 2009, a 100 basis point increase in rates would increase net interest income by $624 thousand, or 0.8%, over the next twelve-month period. A 100 basis point decrease in rates would decrease net interest income by $3.2 million, or 4.3%, over a twelve-month period. As of December 31, 2009, a 100 basis point increase in rates would decrease the economic value of equity by $2.0 million, or 0.5%, over the next twelve-month period. A 100 basis point decrease in rates would decrease the economic value of equity by $8.8 million, or 2.2%, over a twelve-month period. This simulation is based on management’s assumption as to the effect of interest rate changes on assets and liabilities and assumes a parallel shift of the yield curve. It also includes certain assumptions about the future pricing of loans and deposits in response to changes in interest rates. Further, it assumes that delinquency rates would not change as a result of changes in interest rates, although there can be no assurance that this will be the case. While this simulation is a useful measure as to net interest income at risk due to a change in interest rates, it is not a forecast of the future results and is based on many assumptions that, if changed, could cause a different outcome.
In addition to the changes in interest rate scenarios listed above, the Company typically runs other scenarios to measure interest rate risk, which vary depending on the economic and interest rate environments.
- 57 -
Table of Contents
The following table presents an analysis of the Company’s interest rate sensitivity gap position at December 31, 2009. All interest-earning assets and interest-bearing liabilities are shown based on the earlier of their contractual maturity or re-pricing date. The expected maturities are presented on a contractual basis or, if more relevant, based on projected call dates. Investment securities are at amortized cost for both securities available for sale and securities held to maturity. Loans, net of deferred loan origination costs, include principal amortization adjusted for estimated prepayments (principal payments in excess of contractual amounts) and non-accruing loans. Borrowings include junior subordinated debentures. Because the interest rate sensitivity levels shown in the table could be changed by external factors such as loan prepayments and liability decay rates or by factors controllable by the Company such as asset sales, it is not an absolute reflection of our potential interest rate risk profile (in thousands).
| At December 31, 2009 | ||||||||||||||||||||
| Over Three | Over | |||||||||||||||||||
| Three | Months | One Year | ||||||||||||||||||
| Months | Through | Through | Over | |||||||||||||||||
| or Less | One Year | Five Years | Five Years | Total | ||||||||||||||||
| INTEREST-EARNING ASSETS: | ||||||||||||||||||||
| Federal funds sold and interest-earning deposits in other banks | $ | 85 | $ | — | $ | — | $ | — | $ | 85 | ||||||||||
| Investment securities | 114,564 | 153,068 | 241,123 | 108,620 | 617,375 | |||||||||||||||
| Loans | 425,288 | 220,328 | 533,766 | 85,045 | 1,264,427 | |||||||||||||||
| Total interest-earning assets | $ | 539,937 | $ | 373,396 | $ | 774,889 | $ | 193,665 | 1,881,887 | |||||||||||
| Cash and due from banks | 42,874 | |||||||||||||||||||
Other assets(1) | 137,628 | |||||||||||||||||||
| Total assets | $ | 2,062,389 | ||||||||||||||||||
| INTEREST-BEARING LIABILITIES: | ||||||||||||||||||||
| Interest-bearing demand, savings and money market | $ | 732,301 | $ | — | $ | — | $ | — | $ | 732,301 | ||||||||||
| Certificates of deposit | 192,100 | 334,449 | 159,457 | 345 | 686,351 | |||||||||||||||
| Borrowings | 59,543 | 20,080 | 10,065 | 16,702 | 106,390 | |||||||||||||||
| Total interest-bearing liabilities | $ | 983,944 | $ | 354,529 | $ | 169,522 | $ | 17,047 | 1,525,042 | |||||||||||
| Noninterest-bearing deposits | 324,303 | |||||||||||||||||||
| Other liabilities | 14,750 | |||||||||||||||||||
| Total liabilities | 1,864,095 | |||||||||||||||||||
| Shareholders’ equity | 198,294 | |||||||||||||||||||
| Total liabilities and shareholders’ equity | $ | 2,062,389 | ||||||||||||||||||
| Interest sensitivity gap | $ | (444,007 | ) | $ | 18,867 | $ | 605,367 | $ | 176,618 | $ | 356,845 | |||||||||
| Cumulative gap | $ | (444,007 | ) | $ | (425,140 | ) | $ | 180,227 | $ | 356,845 | ||||||||||
Cumulative gap ratio(2) | 54.9 | % | 68.2 | % | 112.0 | % | 123.4 | % | ||||||||||||
| Cumulative gap as a percentage of total assets | (21.5 | )% | (20.6 | )% | 8.7 | % | 17.3 | % | ||||||||||||
| (1) | Includes net unrealized gain on securities available for sale and allowance for loan losses. | |
| (2) | Cumulative total interest-earning assets divided by cumulative total interest-bearing liabilities. |
For purposes of interest rate risk management, the Company directs more attention on simulation modeling, such as “net interest income at risk” as previously discussed, rather than gap analysis. The net interest income at risk simulation modeling is considered by management to be more informative in forecasting future income at risk.
- 58 -
Table of Contents
ITEM 8. FINANCIAL STATEMENTS AND SUPPLEMENTARY DATA
FINANCIAL INSTITUTIONS, INC. AND SUBSIDIARIES
Index to Consolidated Financial Statements
Index to Consolidated Financial Statements
| Page | ||||
| 60 | ||||
| 61 | ||||
| 62 | ||||
| 63 | ||||
| 64 | ||||
| 65 | ||||
| 67 | ||||
| 68 | ||||
- 59 -
Table of Contents
Management’s Report on Internal Control over Financial Reporting
Management is responsible for establishing and maintaining adequate internal control over financial reporting for Financial Institutions, Inc. and its subsidiaries (the “Company”), as such term is defined in Exchange Act Rules 13a-15(f). The Company’s system of internal control over financial reporting has been designed to provide reasonable assurance to the Company’s management and board of directors regarding the reliability of financial reporting and the preparation and fair presentation of financial statements for external purposes in accordance with accounting principles generally accepted in the United States of America.
Any system of internal control over financial reporting, no matter how well designed, has inherent limitations, including the possibility that a control can be circumvented or overridden and misstatements due to error or fraud may occur and not be detected. Also, because of changes in conditions, internal control effectiveness may vary over time. Accordingly, even an effective system of internal control will provide only reasonable assurance with respect to financial statement preparation and presentation.
The Company’s management has assessed the effectiveness of the Company’s internal control over financial reporting as of December 31, 2009. To make this assessment, we used the criteria for effective internal control over financial reporting described inInternal Control — Integrated Framework, issued by the Committee of Sponsoring Organizations of the Treadway Commission. Based on our assessment and based on such criteria, we believe that, as of December 31, 2009, the Company’s internal control over financial reporting was effective.
The Company’s independent registered public accounting firm that audited the Company’s consolidated financial statements has issued an attestation report on internal control over financial reporting as of December 31, 2009. That report appears herein.
/s/ Peter G. Humphrey | /s/ Karl F. Krebs | |||||
| March 12, 2010 | March 12, 2010 |
- 60 -
Table of Contents
Report of Independent Registered Public Accounting Firm
The Board of Directors and Shareholders
Financial Institutions, Inc.:
Financial Institutions, Inc.:
We have audited Financial Institutions, Inc. and subsidiaries’ (the Company) internal control over financial reporting as of December 31, 2009, based on criteria established inInternal Control—Integrated Frameworkissued by the Committee of Sponsoring Organizations of the Treadway Commission (COSO). The Company’s management is responsible for maintaining effective internal control over financial reporting and for its assessment of the effectiveness of internal control over financial reporting, included in the accompanying Management Report. Our responsibility is to express an opinion on the Company’s internal control over financial reporting based on our audit.
We conducted our audit in accordance with the standards of the Public Company Accounting Oversight Board (United States). Those standards require that we plan and perform the audit to obtain reasonable assurance about whether effective internal control over financial reporting was maintained in all material respects. Our audit included obtaining an understanding of internal control over financial reporting, assessing the risk that a material weakness exists, and testing and evaluating the design and operating effectiveness of internal control based on the assessed risk. Our audit also includes performing such other procedures as we considered necessary in the circumstances. We believe that our audit provides a reasonable basis for our opinion.
A company’s internal control over financial reporting is a process designed to provide reasonable assurance regarding the reliability of financial reporting and the preparation of financial statements for external purposes in accordance with generally accepted accounting principles. A company’s internal control over financial reporting includes those policies and procedures that (1) pertain to the maintenance of records that, in reasonable detail, accurately and fairly reflect the transactions and dispositions of the assets of the company; (2) provide reasonable assurance that transactions are recorded as necessary to permit preparation of financial statements in accordance with generally accepted accounting principles, and that receipts and expenditures of the company are being made only in accordance with authorizations of management and directors of the company; and (3) provide reasonable assurance regarding prevention or timely detection of unauthorized acquisition, use, or disposition of the company’s assets that could have a material effect on the financial statements.
Because of its inherent limitations, internal control over financial reporting may not prevent or detect misstatements. Also, projections of any evaluation of effectiveness to future periods are subject to the risk that controls may become inadequate because of changes in conditions, or that the degree of compliance with the policies or procedures may deteriorate.
In our opinion, the Company maintained, in all material respects, effective internal control over financial reporting as of December 31, 2009, based on criteria established inInternal Control—Integrated Frameworkissued by the Committee of Sponsoring Organizations of the Treadway Commission (COSO).
We also have audited, in accordance with the standards of the Public Company Accounting Oversight Board (United States), the consolidated statements of financial condition of the Company as of December 31, 2009 and 2008, and the related consolidated statements of operations, changes in shareholders’ equity, and cash flows for each of the years in the three-year period ended December 31, 2009, and our report dated March 12, 2010 expressed an unqualified opinion on those consolidated financial statements.
/s/ KPMG LLP
Rochester, New York
March 12, 2010
March 12, 2010
- 61 -
Table of Contents
Report of Independent Registered Public Accounting Firm
The Board of Directors and Shareholders
Financial Institutions, Inc.:
Financial Institutions, Inc.:
We have audited the accompanying consolidated statements of financial condition of Financial Institutions, Inc. and subsidiaries (the Company) as of December 31, 2009 and 2008, and the related consolidated statements of operations, changes in shareholders’ equity, and cash flows for each of the years in the three-year period ended December 31, 2009. These consolidated financial statements are the responsibility of the Company’s management. Our responsibility is to express an opinion on these consolidated financial statements based on our audits.
We conducted our audits in accordance with the standards of the Public Company Accounting Oversight Board (United States). Those standards require that we plan and perform the audit to obtain reasonable assurance about whether the financial statements are free of material misstatement. An audit includes examining, on a test basis, evidence supporting the amounts and disclosures in the financial statements. An audit also includes assessing the accounting principles used and significant estimates made by management, as well as evaluating the overall financial statement presentation. We believe that our audits provide a reasonable basis for our opinion.
In our opinion, the consolidated financial statements referred to above present fairly, in all material respects, the consolidated financial position of the Company as of December 31, 2009 and 2008, and the results of their operations and their cash flows for each of the years in the three-year period ended December 31, 2009, in conformity with U.S. generally accepted accounting principles.
We also have audited, in accordance with the standards of the Public Company Accounting Oversight Board (United States), the Company’s internal control over financial reporting as of December 31, 2009, based on criteria established inInternal Control — Integrated Frameworkissued by the Committee of Sponsoring Organizations of the Treadway Commission (COSO), and our report dated March 12, 2010 expressed an unqualified opinion on the effectiveness of the Company’s internal control over financial reporting.
/s/ KPMG LLP
Rochester, New York
March 12, 2010
March 12, 2010
- 62 -
Table of Contents
FINANCIAL INSTITUTIONS, INC. AND SUBSIDIARIES
Consolidated Statements of Financial Condition
| December 31, | ||||||||
| (Dollars in thousands, except share and per share data) | 2009 | 2008 | ||||||
ASSETS | ||||||||
| Cash and cash equivalents: | ||||||||
| Cash and due from banks | $ | 42,874 | $ | 34,528 | ||||
| Federal funds sold and interest-bearing deposits in other banks | 85 | 20,659 | ||||||
| Total cash and cash equivalents | 42,959 | 55,187 | ||||||
| Securities available for sale, at fair value | 580,501 | 547,506 | ||||||
| Securities held to maturity, at amortized cost (fair value of $40,629 and $59,147, respectively) | 39,573 | 58,532 | ||||||
| Loans held for sale | 421 | 1,013 | ||||||
| Loans | 1,264,006 | 1,121,079 | ||||||
| Less: Allowance for loan losses | 20,741 | 18,749 | ||||||
| Loans, net | 1,243,265 | 1,102,330 | ||||||
| Company owned life insurance | 24,867 | 23,692 | ||||||
| Premises and equipment, net | 34,783 | 36,712 | ||||||
| Goodwill | 37,369 | 37,369 | ||||||
| Other assets | 58,651 | 54,578 | ||||||
| Total assets | $ | 2,062,389 | $ | 1,916,919 | ||||
LIABILITIES AND SHAREHOLDERS’ EQUITY | ||||||||
| Deposits: | ||||||||
| Noninterest-bearing demand | $ | 324,303 | $ | 292,586 | ||||
| Interest-bearing demand | 363,698 | 344,616 | ||||||
| Savings and money market | 368,603 | 348,594 | ||||||
| Certificates of deposit | 686,351 | 647,467 | ||||||
| Total deposits | 1,742,955 | 1,633,263 | ||||||
| Short-term borrowings | 59,543 | 23,465 | ||||||
| Long-term borrowings | 46,847 | 47,355 | ||||||
| Other liabilities | 14,750 | 22,536 | ||||||
| Total liabilities | 1,864,095 | 1,726,619 | ||||||
| Commitments and contingencies (Note 9) | ||||||||
| Shareholders’ equity: | ||||||||
| Series A 3% Preferred Stock, $100 par value; 1,533 shares authorized and issued | 153 | 153 | ||||||
| Series A Preferred Stock, $100 par value; 7,503 shares authorized and issued; aggregate liquidation preference $37,515; net of $1,672 and $2,016 discount, respectively | 35,843 | 35,499 | ||||||
| Series B-1 8.48% Preferred Stock, $100 par value, 200,000 shares authorized, 174,223 shares issued | 17,422 | 17,422 | ||||||
| Total preferred equity | 53,418 | 53,074 | ||||||
| Common stock, $0.01 par value, 50,000,000 shares authorized, 11,348,122 shares issued | 113 | 113 | ||||||
| Additional paid-in capital | 26,940 | 26,397 | ||||||
| Retained earnings | 131,371 | 124,952 | ||||||
| Accumulated other comprehensive loss | (3,702 | ) | (4,013 | ) | ||||
| Treasury stock, at cost — 527,854 and 550,103 shares, respectively | (9,846 | ) | (10,223 | ) | ||||
| Total shareholders’ equity | 198,294 | 190,300 | ||||||
| Total liabilities and shareholders’ equity | $ | 2,062,389 | $ | 1,916,919 | ||||
See accompanying notes to the consolidated financial statements.
- 63 -
Table of Contents
FINANCIAL INSTITUTIONS, INC. AND SUBSIDIARIES
Consolidated Statements of Operations
| Years ended December 31, | ||||||||||||
| (Dollars in thousands, except per share amounts) | 2009 | 2008 | 2007 | |||||||||
| Interest income: | ||||||||||||
| Interest and fees on loans | $ | 72,706 | $ | 67,674 | $ | 68,560 | ||||||
| Interest and dividends on investment securities | 21,694 | 30,655 | 34,990 | |||||||||
| Other interest income | 82 | 619 | 1,662 | |||||||||
| Total interest income | 94,482 | 98,948 | 105,212 | |||||||||
| Interest expense: | ||||||||||||
| Deposits | 19,090 | 29,349 | 42,714 | |||||||||
| Short-term borrowings | 270 | 721 | 864 | |||||||||
| Long-term borrowings | 2,857 | 3,547 | 3,561 | |||||||||
| Total interest expense | 22,217 | 33,617 | 47,139 | |||||||||
| Net interest income | 72,265 | 65,331 | 58,073 | |||||||||
| Provision for loan losses | 7,702 | 6,551 | 116 | |||||||||
| Net interest income after provision for loan losses | 64,563 | 58,780 | 57,957 | |||||||||
| Noninterest income (loss): | ||||||||||||
| Service charges on deposits | 10,065 | 10,497 | 10,932 | |||||||||
| ATM and debit card | 3,610 | 3,313 | 2,883 | |||||||||
| Loan servicing | 1,308 | 664 | 928 | |||||||||
| Company owned life insurance | 1,096 | 563 | 1,255 | |||||||||
| Broker-dealer fees and commissions | 1,022 | 1,458 | 1,396 | |||||||||
| Net gain on sale of loans held for sale | 699 | 339 | 779 | |||||||||
| Net gain on disposal of investment securities | 3,429 | 288 | 207 | |||||||||
| Impairment charges on investment securities | (4,666 | ) | (68,215 | ) | — | |||||||
| Net gain on sale and disposal of other assets | 180 | 305 | 102 | |||||||||
| Other | 2,052 | 2,010 | 2,198 | |||||||||
| Total noninterest income (loss) | 18,795 | (48,778 | ) | 20,680 | ||||||||
| Noninterest expense: | ||||||||||||
| Salaries and employee benefits | 33,634 | 31,437 | 33,175 | |||||||||
| Occupancy and equipment | 11,062 | 10,502 | 9,903 | |||||||||
| FDIC assessments | 3,651 | 674 | 289 | |||||||||
| Professional services | 2,524 | 2,141 | 2,080 | |||||||||
| Computer and data processing | 2,340 | 2,433 | 2,126 | |||||||||
| Supplies and postage | 1,846 | 1,800 | 1,662 | |||||||||
| Advertising and promotions | 949 | 1,453 | 1,402 | |||||||||
| Other | 6,771 | 7,021 | 6,791 | |||||||||
| Total noninterest expense | 62,777 | 57,461 | 57,428 | |||||||||
| Income (loss) before income taxes | 20,581 | (47,459 | ) | 21,209 | ||||||||
| Income tax expense (benefit) | 6,140 | (21,301 | ) | 4,800 | ||||||||
| Net income (loss) | $ | 14,441 | $ | (26,158 | ) | $ | 16,409 | |||||
| Preferred stock dividends, net of accretion | 3,697 | 1,538 | 1,483 | |||||||||
| Net income (loss) allocated to common shareholders | $ | 10,744 | $ | (27,696 | ) | $ | 14,926 | |||||
| Earnings (loss) per common share (Note 15): | ||||||||||||
| Basic | $ | 0.99 | $ | (2.54 | ) | $ | 1.34 | |||||
| Diluted | $ | 0.99 | $ | (2.54 | ) | $ | 1.33 | |||||
See accompanying notes to the consolidated financial statements.
- 64 -
Table of Contents
FINANCIAL INSTITUTIONS, INC. AND SUBSIDIARIES
Consolidated Statements of Changes in Shareholders’ Equity
Years ended December 31, 2009, 2008 and 2007
| Accumulated | ||||||||||||||||||||||||||||
| Additional | Other | Total | ||||||||||||||||||||||||||
| (Dollars in thousands, | Preferred | Common | Paid-in | Retained | Comprehensive | Treasury | Shareholders’ | |||||||||||||||||||||
| except per share data) | Equity | Stock | Capital | Earnings | Income (Loss) | Stock | Equity | |||||||||||||||||||||
Balance at January 1, 2007 | $ | 17,623 | $ | 113 | $ | 24,222 | $ | 148,947 | $ | (8,404 | ) | $ | (113 | ) | $ | 182,388 | ||||||||||||
| Comprehensive income: | ||||||||||||||||||||||||||||
| Net income | — | — | — | 16,409 | — | — | 16,409 | |||||||||||||||||||||
| Other comprehensive income, net of tax | — | — | — | — | 9,071 | — | 9,071 | |||||||||||||||||||||
| Total comprehensive income | 25,480 | |||||||||||||||||||||||||||
| Repurchase of common shares | — | — | — | — | — | (7,203 | ) | (7,203 | ) | |||||||||||||||||||
| Repurchase of Series B-1 8.48% Preferred Stock | (42 | ) | — | — | — | — | — | (42 | ) | |||||||||||||||||||
| Share-based compensation plans: | ||||||||||||||||||||||||||||
| Share-based compensation | — | — | 955 | — | — | — | 955 | |||||||||||||||||||||
| Stock options exercised | — | — | (53 | ) | — | — | 304 | 251 | ||||||||||||||||||||
| Restricted stock awards issued | — | — | (344 | ) | — | — | 344 | — | ||||||||||||||||||||
| Directors’ retainer | — | — | (2 | ) | — | — | 107 | 105 | ||||||||||||||||||||
| Cash dividends declared: | ||||||||||||||||||||||||||||
| Series A 3% Preferred-$3.00 per share | — | — | — | (5 | ) | — | — | (5 | ) | |||||||||||||||||||
| Series B-1 8.48% Preferred-$8.48 per share | — | — | — | (1,478 | ) | — | — | (1,478 | ) | |||||||||||||||||||
| Common-$0.46 per share | — | — | — | (5,129 | ) | — | — | (5,129 | ) | |||||||||||||||||||
Balance at December 31, 2007 | $ | 17,581 | $ | 113 | $ | 24,778 | $ | 158,744 | $ | 667 | $ | (6,561 | ) | $ | 195,322 | |||||||||||||
| Comprehensive income: | ||||||||||||||||||||||||||||
| Net loss | — | — | — | (26,158 | ) | — | — | (26,158 | ) | |||||||||||||||||||
| Other comprehensive loss, net of tax | — | — | — | — | (4,680 | ) | — | (4,680 | ) | |||||||||||||||||||
| Total comprehensive loss | (30,838 | ) | ||||||||||||||||||||||||||
| Cumulative effect of adoption of new accounting pronouncements | — | — | — | (241 | ) | — | — | (241 | ) | |||||||||||||||||||
| Repurchase of common shares | — | — | — | — | — | (4,818 | ) | (4,818 | ) | |||||||||||||||||||
| Repurchase of Series A 3% preferred stock | (6 | ) | — | 3 | — | — | — | (3 | ) | |||||||||||||||||||
| Warrant issued in connection with Series A Preferred Stock | — | — | 2,025 | — | — | — | 2,025 | |||||||||||||||||||||
| Issue shares of Series A Preferred Stock | 37,515 | — | — | — | — | — | 37,515 | |||||||||||||||||||||
| Discount on Series A Preferred Stock | (2,025 | ) | — | — | — | — | — | (2,025 | ) | |||||||||||||||||||
| Share-based compensation plans: | ||||||||||||||||||||||||||||
| Share-based compensation | — | — | 603 | 30 | — | — | 633 | |||||||||||||||||||||
| Stock options exercised | — | — | (12 | ) | — | — | 44 | 32 | ||||||||||||||||||||
| Restricted stock awards issued | — | — | (998 | ) | — | — | 998 | — | ||||||||||||||||||||
| Directors’ retainer | — | — | (2 | ) | — | — | 114 | 112 | ||||||||||||||||||||
| Accrued undeclared cumulative dividend on Series A Preferred Stock, net of amortization | 9 | — | — | (56 | ) | — | — | (47 | ) | |||||||||||||||||||
| Cash dividends declared: | ||||||||||||||||||||||||||||
| Series A 3% Preferred-$3.00 per share | — | — | — | (5 | ) | — | — | (5 | ) | |||||||||||||||||||
| Series B-1 8.48% Preferred-$8.48 per share | — | — | — | (1,477 | ) | — | — | (1,477 | ) | |||||||||||||||||||
| Common-$0.54 per share | — | — | — | (5,885 | ) | — | — | (5,885 | ) | |||||||||||||||||||
Balance at December 31, 2008 | $ | 53,074 | $ | 113 | $ | 26,397 | $ | 124,952 | $ | (4,013 | ) | $ | (10,223 | ) | $ | 190,300 | ||||||||||||
Continued on next page
See accompanying notes to the consolidated financial statements.
- 65 -
Table of Contents
FINANCIAL INSTITUTIONS, INC. AND SUBSIDIARIES
Consolidated Statements of Changes in Shareholders’ Equity (Continued)
Years ended December 31, 2009, 2008 and 2007
Consolidated Statements of Changes in Shareholders’ Equity (Continued)
Years ended December 31, 2009, 2008 and 2007
| Accumulated | ||||||||||||||||||||||||||||
| Additional | Other | Total | ||||||||||||||||||||||||||
| (Dollars in thousands, | Preferred | Common | Paid-in | Retained | Comprehensive | Treasury | Shareholders’ | |||||||||||||||||||||
| except per share data) | Equity | Stock | Capital | Earnings | Income (Loss) | Stock | Equity | |||||||||||||||||||||
Balance at December 31, 2008 | $ | 53,074 | $ | 113 | $ | 26,397 | $ | 124,952 | $ | (4,013 | ) | $ | (10,223 | ) | $ | 190,300 | ||||||||||||
Balance carried forward | ||||||||||||||||||||||||||||
| Comprehensive income: | ||||||||||||||||||||||||||||
| Net income | — | — | — | 14,441 | — | — | 14,441 | |||||||||||||||||||||
| Other comprehensive income, net of tax | — | — | — | — | 311 | — | 311 | |||||||||||||||||||||
| Total comprehensive income | 14,752 | |||||||||||||||||||||||||||
| Issuance costs of Series A Preferred Stock | — | — | (68 | ) | — | — | — | (68 | ) | |||||||||||||||||||
| Share-based compensation plans: | ||||||||||||||||||||||||||||
| Share-based compensation | — | — | 852 | 2 | — | — | 854 | |||||||||||||||||||||
| Stock options exercised | — | — | (4 | ) | — | — | 19 | 15 | ||||||||||||||||||||
| Restricted stock awards issued, net | — | — | (207 | ) | — | — | 207 | — | ||||||||||||||||||||
| Directors’ retainer | (30 | ) | 151 | 121 | ||||||||||||||||||||||||
| Accrued undeclared cumulative dividend on Series A Preferred Stock, net of amortization | 344 | — | — | (537 | ) | — | — | (193 | ) | |||||||||||||||||||
| Cash dividends declared: | ||||||||||||||||||||||||||||
| Series A 3% Preferred-$3.00 per share | — | — | — | (5 | ) | — | — | (5 | ) | |||||||||||||||||||
| Series A Preferred-$223.61 per share | — | — | — | (1,678 | ) | — | — | (1,678 | ) | |||||||||||||||||||
| Series B-1 8.48% Preferred-$8.48 per share | — | — | — | (1,477 | ) | — | — | (1,477 | ) | |||||||||||||||||||
| Common-$0.40 per share | — | — | — | (4,327 | ) | — | — | (4,327 | ) | |||||||||||||||||||
Balance at December 31, 2009 | $ | 53,418 | $ | 113 | $ | 26,940 | $ | 131,371 | $ | (3,702 | ) | $ | (9,846 | ) | $ | 198,294 | ||||||||||||
See accompanying notes to the consolidated financial statements.
- 66 -
Table of Contents
FINANCIAL INSTITUTIONS, INC. AND SUBSIDIARIES
Consolidated Statements of Cash Flows
| Years ended December 31, | ||||||||||||
| (Dollars in thousands) | 2009 | 2008 | 2007 | |||||||||
| Cash flows from operating activities: | ||||||||||||
| Net income (loss) | $ | 14,441 | $ | (26,158 | ) | $ | 16,409 | |||||
| Adjustments to reconcile net income (loss) to net cash provided by operating activities: | ||||||||||||
| Depreciation and amortization | 4,067 | 3,959 | 3,991 | |||||||||
| Net amortization (accretion) of premiums and discounts on securities | 2,587 | 390 | (185 | ) | ||||||||
| Provision for loan losses | 7,702 | 6,551 | 116 | |||||||||
| Share-based compensation | 854 | 633 | 955 | |||||||||
| Deferred income tax expense (benefit) | 7,470 | (23,848 | ) | 715 | ||||||||
| Proceeds from sale of loans held for sale | 90,290 | 28,685 | 48,048 | |||||||||
| Originations of loans held for sale | (88,999 | ) | (28,453 | ) | (47,183 | ) | ||||||
| Increase in company owned life insurance | (1,096 | ) | (563 | ) | (111 | ) | ||||||
| Net gain on sale of loans held for sale | (699 | ) | (339 | ) | (779 | ) | ||||||
| Net gain on disposal of investment securities | (3,429 | ) | (288 | ) | (207 | ) | ||||||
| Impairment charge on investment securities | 4,666 | 68,215 | — | |||||||||
| Net gain on sale and disposal of other assets | (180 | ) | (305 | ) | (102 | ) | ||||||
| (Increase) decrease in other assets | (8,773 | ) | (1,322 | ) | 3,510 | |||||||
| Decrease in other liabilities | (6,633 | ) | (5,866 | ) | (2,406 | ) | ||||||
| Net cash provided by operating activities | 22,268 | 21,291 | 22,771 | |||||||||
| Cash flows from investing activities: | ||||||||||||
| Purchases of investment securities: | ||||||||||||
| Available for sale | (602,259 | ) | (310,191 | ) | (307,049 | ) | ||||||
| Held to maturity | (29,280 | ) | (54,925 | ) | (54,926 | ) | ||||||
| Proceeds from principal payments, maturities and calls on investment securities: | ||||||||||||
| Available for sale | 353,545 | 337,704 | 308,323 | |||||||||
| Held to maturity | 46,891 | 57,325 | 36,169 | |||||||||
| Proceeds from sale of securities available for sale | 224,928 | 58,368 | 49,350 | |||||||||
| Net loan originations | (165,716 | ) | (161,414 | ) | (41,778 | ) | ||||||
| Purchases of company owned life insurance | (79 | ) | (20,112 | ) | (58 | ) | ||||||
| Proceeds from sales of other assets | 1,709 | 1,783 | 1,307 | |||||||||
| Purchases of premises and equipment | (1,959 | ) | (6,333 | ) | (3,407 | ) | ||||||
| Net cash used in investing activities | (172,220 | ) | (97,795 | ) | (12,069 | ) | ||||||
| Cash flows from financing activities: | ||||||||||||
| Net increase (decrease) in deposits | 109,692 | 57,292 | (41,724 | ) | ||||||||
| Net increase (decrease) in short-term borrowings | 36,078 | (2,178 | ) | (6,668 | ) | |||||||
| Proceeds from long-term borrowings | — | 30,000 | — | |||||||||
| Repayments of long-term borrowings | (508 | ) | (25,212 | ) | (12,321 | ) | ||||||
| Purchases of preferred and common shares | — | (4,821 | ) | (7,245 | ) | |||||||
| Proceeds from issuance of preferred and common shares, net of issuance costs | (68 | ) | 35,602 | 105 | ||||||||
| Proceeds from issuance of common stock warrant | — | 2,025 | — | |||||||||
| Proceeds from stock options exercised | 15 | 32 | 251 | |||||||||
| Cash dividends paid to preferred shareholders | (3,160 | ) | (1,482 | ) | (1,483 | ) | ||||||
| Cash dividends paid to common shareholders | (4,325 | ) | (6,240 | ) | (4,716 | ) | ||||||
| Net cash provided by (used in) financing activities | 137,724 | 85,018 | (73,801 | ) | ||||||||
| Net (decrease) increase in cash and cash equivalents | (12,228 | ) | 8,514 | (63,099 | ) | |||||||
| Cash and cash equivalents, beginning of period | 55,187 | 46,673 | 109,772 | |||||||||
| Cash and cash equivalents, end of period | $ | 42,959 | $ | 55,187 | $ | 46,673 | ||||||
See accompanying notes to the consolidated financial statements.
- 67 -
Table of Contents
FINANCIAL INSTITUTIONS, INC. AND SUBSIDIARIES
NOTES TO CONSOLIDATED FINANCIAL STATEMENTS
December 31, 2009, 2008 and 2007
(1.) SUMMARY OF SIGNIFICANT ACCOUNTING POLICIES
Financial Institutions, Inc., a financial holding company organized under the laws of New York State (“New York” or “NYS”), and its subsidiaries provide deposit, lending and other financial services to individuals and businesses in Central and Western New York. The Company owns all of the capital stock of Five Star Bank, a New York State chartered bank, and Five Star Investment Services, Inc., a broker-dealer subsidiary offering noninsured investment products. The Company also owns 100% of FISI Statutory Trust I (the “Trust”), which was formed in February 2001 for the purpose of issuing trust preferred securities. References to “the Company” mean the consolidated reporting entities and references to “the Bank” mean Five Star Bank.
The accounting and reporting policies conform to general practices within the banking industry and to U.S. generally accepted accounting principles (“GAAP”). Prior years’ consolidated financial statements are re-classified whenever necessary to conform to the current year’s presentation.
The Financial Accounting Standards Board’s (“FASB”) Accounting Standards Codification (“ASC”) became effective on July 1, 2009. At that date, the ASC became FASB’s officially recognized source of authoritative GAAP applicable to all public and non-public non-governmental entities, superseding existing FASB, American Institute of Certified Public Accountants, Emerging Issues Task Force and related literature. Rules and interpretive releases of the Securities and Exchange Commission (“SEC”) under the authority of federal securities laws are also sources of authoritative GAAP for SEC registrants. All other accounting literature is considered non-authoritative. The switch to the ASC affects the way companies refer to GAAP in financial statements and accounting policies. Citing particular content in the ASC involves specifying the unique numeric path to the content through the Topic, Subtopic, Section and Paragraph structure.
The following is a description of the Company’s significant accounting policies.
(a.) Principles of Consolidation
The consolidated financial statements include the accounts of the Company and its subsidiaries. The Trust is not included in the consolidated financial statements of the Company. All significant intercompany accounts and transactions have been eliminated in consolidation.
(b.) Use of Estimates
In preparing the consolidated financial statements in conformity with GAAP, management is required to make estimates and assumptions that affect the reported amount of assets and liabilities as of the date of the statement of financial condition and reported amounts of revenue and expenses during the reporting period. Material estimates relate to the determination of the allowance for loan losses, assumptions used in the defined benefit pension plan accounting, the carrying value of goodwill and deferred tax assets, and the valuation and other than temporary impairment considerations related to the securities portfolio. These estimates and assumptions are based on management’s best estimates and judgment and are evaluated on an ongoing basis using historical experience and other factors, including the current economic environment. The Company adjusts these estimates and assumptions when facts and circumstances dictate. Illiquid credit markets and volatile equity have combined with declines in consumer spending to increase the uncertainty inherent in these estimates and assumptions. As future events cannot be determined with precision, actual results could differ significantly from the Company’s estimates.
(c.) Cash Flow Reporting
Cash and cash equivalents include cash and due from banks, federal funds sold and interest-bearing deposits in other banks. Net cash flows are reported for loans, deposit transactions and short-term borrowings.
Supplemental cash flow information is summarized as follows for the years ended December 31 (in thousands):
| 2009 | 2008 | 2007 | ||||||||||
| Cash paid during the year for: | ||||||||||||
| Interest expense | $ | 21,682 | $ | 37,160 | $ | 49,687 | ||||||
| Income taxes, net of income tax refunds | (1,312 | ) | 3,797 | 4,031 | ||||||||
| Non-cash activity: | ||||||||||||
| Real estate and other assets acquired in settlement of loans | $ | 1,096 | $ | 1,185 | $ | 2,443 | ||||||
| Dividends declared and unpaid | 1,692 | 1,497 | 1,805 | |||||||||
| (Decrease) increase in net unsettled security purchases | (1,348 | ) | 1,453 | 336 | ||||||||
| Loans securitized and sold | 15,983 | — | — | |||||||||
- 68 -
Table of Contents
FINANCIAL INSTITUTIONS, INC. AND SUBSIDIARIES
NOTES TO CONSOLIDATED FINANCIAL STATEMENTS
December 31, 2009, 2008 and 2007
NOTES TO CONSOLIDATED FINANCIAL STATEMENTS
December 31, 2009, 2008 and 2007
(1.) SUMMARY OF SIGNIFICANT ACCOUNTING POLICIES (Continued)
(d.) Investment Securities
Investment securities are classified as either available for sale or held to maturity. Debt securities that management has the positive intent and ability to hold to maturity are classified as held to maturity and are recorded at amortized cost. Other investment securities are classified as available for sale and recorded at fair value, with unrealized gains and losses excluded from earnings and reported as a component of shareholders’ equity.
Purchase premiums and discounts are recognized in interest income using the interest method over the terms of the securities. Securities are evaluated periodically to determine whether a decline in their fair value is other than temporary. Management utilizes criteria such as, the current intent to hold or sell, the magnitude and duration of the decline and, when appropriate, consideration of negative changes in expected cash flows, creditworthiness, near term prospects of issuers, the level of credit subordination, estimated loss severity, and delinquencies, to determine whether a loss in value is other than temporary. The term “other than temporary” is not intended to indicate that the decline is permanent, but indicates that the prospect for a near-term recovery of value is not necessarily favorable. Declines in the fair value of investment securities below their cost that are deemed to be other than temporary are reflected in earnings as realized losses to the extent the impairment is related to credit issues or concerns, or the security is intended to be sold. The amount of impairment related to non-credit related factors is recognized in other comprehensive income. Gains and losses on the sale of securities are recorded on the trade date and are determined using the specific identification method.
(e.) Loans Held for Sale
Loans held for sale are recorded at the lower of aggregated cost or fair value. If necessary, a valuation allowance is recorded by a charge to income for unrealized losses attributable to changes in market interest rates. Subsequent increases in fair value are adjusted through the valuation allowance, but only to the extent of the valuation allowance. Gains and losses on the disposition of loans held for sale are determined on the specific identification method. Loan servicing fees are recognized on an accrual basis.
The Company originates and sells certain residential real estate loans in the secondary market. The Company typically retains the right to service the mortgages upon sale. The Company makes the determination of whether or not to identify the mortgage as a loan held for sale at the time the application is received from the borrower based on the Company’s intent and ability to hold the loan.
Capitalized mortgage servicing rights are recorded at their fair value at the time a loan is sold and servicing rights are retained. Capitalized mortgage servicing rights are reported in other assets in the consolidated statements of financial position and are amortized to noninterest income in the consolidated statements of operations in proportion to and over the period of estimated net servicing income. The Company uses a valuation model that calculates the present value of future cash flows to determine the fair value of servicing rights. In using this valuation method, the Company incorporates assumptions to estimate future net servicing income, which include estimates of the cost to service the loan, the discount rate, an inflation rate and prepayment speeds. The carrying value of originated mortgage servicing rights is periodically evaluated for impairment. Impairment is determined by stratifying rights by predominant risk characteristics, such as interest rates and terms, using discounted cash flows and market-based assumptions. Impairment is recognized through a valuation allowance, to the extent that fair value is less than the capitalized asset. Subsequent increases in fair value are adjusted through the valuation allowance, but only to the extent of the valuation allowance.
The Company also extends rate lock commitments to borrowers related to the origination of residential mortgage loans. To mitigate the interest rate risk inherent in these rate lock commitments, as well as closed mortgage loans held for sale, the Company enters into forward sale commitments to sell individual mortgage loans. Rate lock and forward sale commitments are considered derivatives and are recorded at fair value. These amounts were not significant at December 31, 2009 and 2008. The mortgage forward sale commitments are primarily with Federal Home Loan Mortgage Corporation (“FHLMC”), State of New York Mortgage Agency (“SONYMA”) or Federal Housing Agency (“FHA”).
Loan servicing income (a component of noninterest income in the consolidated statements of operations) consists of fees earned for servicing mortgage loans sold to third parties, net of amortization expense and impairment losses associated with capitalized mortgage servicing assets.
(f.) Loans
Loans are stated at the principal amount outstanding, net of unearned income and deferred direct loan origination fees and costs, which are accreted or amortized to interest income based on the interest method. Accrual of interest on loans is suspended and all unpaid accrued interest is reversed when management believes that reasonable doubt exists with respect to the collectibility of principal or interest.
- 69 -
Table of Contents
FINANCIAL INSTITUTIONS, INC. AND SUBSIDIARIES
NOTES TO CONSOLIDATED FINANCIAL STATEMENTS
December 31, 2009, 2008 and 2007
NOTES TO CONSOLIDATED FINANCIAL STATEMENTS
December 31, 2009, 2008 and 2007
(1.) SUMMARY OF SIGNIFICANT ACCOUNTING POLICIES (Continued)
Loans, including impaired loans, are generally classified as non-accruing if they are past due as to maturity or payment of principal or interest for a period of more than 90 days, unless such loans are well-collateralized and in the process of collection. Loans that are on a current payment status or past due less than 90 days may also be classified as non-accruing if repayment in full of principal and/or interest is uncertain.
Loans may be returned to accrual status when all principal and interest amounts contractually due (including arrearages) are reasonably assured of repayment and there is a sustained period of repayment performance (generally a minimum of six months) in accordance with the contractual terms of the loan.
While a loan is classified as non-accruing, payments received are generally used to reduce the principal balance. When the future collectibility of the recorded loan balance is expected, interest income may be recognized on a cash basis. In the case where a non-accruing loan had been partially charged-off, recognition of interest on a cash basis is limited to that which would have been recognized on the recorded loan balance at the contractual interest rate. Interest collections in excess of that amount are recorded as recoveries to the allowance for loan losses until prior charge-offs have been fully recovered.
Commercial-related loans are considered impaired when, based on current information and events, it is probable that a creditor will be unable to collect all amounts of principal and interest under the original terms of the agreement and all loans that are restructured in a troubled debt restructuring. Accordingly, the Company evaluates impaired commercial and agricultural loans individually based on the present value of future cash flows discounted at the loan’s effective interest rate, or at the loan’s observable market price or fair value of the collateral, if the loan is collateral dependent. The majority of the Company’s impaired loans are collateral dependent.
(g.) Allowance for Loan Losses
The allowance for loan losses is established through charges to earnings in the form of a provision for loan losses. When a loan or portion of a loan is determined to be uncollectible, the portion deemed uncollectible is charged against the allowance and subsequent recoveries, if any, are credited to the allowance.
The Company periodically evaluates the allowance for loan losses in order to maintain the allowance at a level that represents management’s estimate of probable losses in the loan portfolio at the statement of financial condition date. Management’s evaluation of the allowance is based on a continuing review of the loan portfolio.
For larger balance commercial-related loans, the Company conducts a periodic assessment on a loan-by-loan basis of losses, when it is deemed probable, based upon known facts and circumstances, that full contractual interest and principal on an individual loan will not be collected in accordance with its contractual terms, and the loan is considered impaired. An impairment reserve is typically established based upon the net realizable value of the collateral, as a majority of the Company’s impaired loans are collateral dependent. Generally, impaired loans include loans in non-accruing status, loans that have been assigned a specific allowance for credit losses, loans that have been partially charged off, and loans designated as a troubled debt restructuring. Problem commercial loans are assigned various risk ratings under the Company’s loan monitoring procedures.
The allowance for loan losses for smaller balance homogeneous loans are estimated based on historical charge-off experience, levels and trends of delinquent and non-accruing loans, trends in volume and terms, effects of changes in lending policy, the experience, ability and depth of management, national and local economic trends and conditions, and concentrations of credit risk.
While management evaluates currently available information in establishing the allowance for loan losses, future adjustments to the allowance may be necessary if conditions differ substantially from the assumptions used in making the evaluations. In addition, various regulatory agencies, as an integral part of their examination process, periodically review a financial institution’s allowance for loan losses. Such agencies may require the financial institution to recognize additions to the allowance based on their judgments about information available to them at the time of their examination.
(h.) Company Owned Life Insurance
The Company holds life insurance policies on certain current and former employees. The Company is the owner and beneficiary of the policies. The cash surrender value of these policies is included as an asset on the consolidated statements of financial condition, and any increase in cash surrender value is recorded as noninterest income on the consolidated statements of operations. In the event of the death of an insured individual under these policies, the Company would receive a death benefit which would be recorded as noninterest income.
- 70 -
Table of Contents
FINANCIAL INSTITUTIONS, INC. AND SUBSIDIARIES
NOTES TO CONSOLIDATED FINANCIAL STATEMENTS
December 31, 2009, 2008 and 2007
NOTES TO CONSOLIDATED FINANCIAL STATEMENTS
December 31, 2009, 2008 and 2007
(1.) SUMMARY OF SIGNIFICANT ACCOUNTING POLICIES (Continued)
(i.) Premises and Equipment
Premises and equipment are stated at cost, less accumulated depreciation and amortization. Depreciation is computed on the straight-line method over the estimated useful lives of the assets. The Company generally amortizes buildings and building improvements over a period of 15 to 39 years and furniture and equipment over a period of 3 to 10 years. Leasehold improvements are amortized over the shorter of the lease term or the useful life of the improvements. Premises and equipment are periodically reviewed for impairment or when circumstances present indicators of impairment.
(j.) Goodwill and Other Intangible Assets
Goodwill represents the excess of the purchase price over the fair value of net assets acquired in accordance with the purchase method of accounting for business combinations. Goodwill is not being amortized, but is required to be tested for impairment annually or more often if certain events occur. Goodwill impairment testing is performed at the segment (or “reporting unit”) level. Currently, the Company’s goodwill is evaluated at the entity level as there is only one reporting unit. Goodwill is assigned to reporting units at the date it is initially recorded. Once goodwill has been assigned to reporting units, it no longer retains its association with a particular acquisition, and all of the activities within a reporting unit, whether acquired or organically grown, are available to support the value of the goodwill.
Other intangible assets are being amortized on the straight-line method, over the expected periods to be benefited. Other intangible assets are periodically reviewed for impairment or when events or changed circumstances may affect the underlying basis of the assets.
(k.) Federal Home Loan Bank (“FHLB”) and Federal Reserve Bank (“FRB”) Stock
The non-marketable investments in FHLB and FRB stock are included in other assets in the consolidated statements of financial condition at par value or cost and are periodically reviewed for impairment. The dividends received relative to these investments are included in other noninterest income in the consolidated statements of operations.
As a member of the FHLB system, the Company is required to maintain a specified investment in FHLB of New York (“FHLBNY”) stock in proportion to the volume of certain transactions with the FHLB. FHLBNY stock totaled $3.3 million and $3.2 million as of December 31, 2009 and 2008, respectively. Deterioration in the soundness of the FHLB System may increase the potential that the investments in FHLB stock recorded on the Company’s consolidated statements of financial condition be designated as impaired and that the Company may incur a write-down in the future.
As a member of the FRB system, the Company is required to maintain a specified investment in FRB stock based on a ratio relative to the Company’s capital. FRB stock totaled $3.9 million and $2.8 million as of December 31, 2009 and 2008, respectively.
(l.) Equity Method Investments
The Company has investments in limited partnerships and accounts for these investments under the equity method. These investments are included in other assets in the consolidated statements of financial condition and totaled $2.7 million and $2.4 million as of December 31, 2009 and 2008, respectively.
(m.) Other Real Estate Owned
Other real estate owned consists of properties formerly pledged as collateral to loans, which have been acquired by the Company through foreclosure proceedings or acceptance of a deed in lieu of foreclosure. Upon transfer of a loan to foreclosure status, an appraisal is obtained and any difference of the loan balance over the fair value, less estimated costs to sell, is recorded against the allowance for loan losses. Other real estate owned is subsequently recorded at the lower of cost or fair value, less estimated costs to sell. Expenses and subsequent adjustments to the fair value are treated as other noninterest expense in the consolidated statements of operations.
(n.) Treasury Stock
Acquisitions of treasury stock are recorded at cost. The reissuance of shares in treasury is recorded at weighted-average cost.
- 71 -
Table of Contents
FINANCIAL INSTITUTIONS, INC. AND SUBSIDIARIES
NOTES TO CONSOLIDATED FINANCIAL STATEMENTS
December 31, 2009, 2008 and 2007
NOTES TO CONSOLIDATED FINANCIAL STATEMENTS
December 31, 2009, 2008 and 2007
(1.) SUMMARY OF SIGNIFICANT ACCOUNTING POLICIES (Continued)
(o.) Employee Benefits
The Company participates in a non-contributory defined benefit pension plan for certain employees who met participation requirements. The Company also provides post-retirement benefits, principally health and dental care, to employees of a previously acquired entity. The Company has closed the pension and post-retirement plans to new participants. The actuarially determined pension benefit is based on years of service and the employee’s highest average compensation during five consecutive years of employment. The Company’s policy is to at least fund the minimum amount required by the Employment Retirement Income Security Act of 1974 (“ERISA”). The cost of the pension and post-retirement plans are based on actuarial computations of current and future benefits for employees, and is charged to noninterest expense in the consolidated statements of operations.
The Company recognizes an asset or a liability for a plans’ overfunded status or underfunded status, respectively, in the consolidated financial statements and reports changes in the funded status as a component of other comprehensive income, net of applicable taxes, in the year in which changes occur. Prior to 2008, the assets and obligations that determine future funded status were measured as of September 30 of each year. Beginning in 2008, the measurement date was changed to December 31 to coincide with the end of the Company’s fiscal year. The effect of changing the measurement date resulted in a $43 thousand increase to retained earnings.
(p.) Share-Based Compensation Plans
Compensation expense for stock options and restricted stock awards is based on the fair value of the award on the measurement date, which, for the Company, is the date of grant and is recognized ratably over the service period of the award. The fair value of stock options is estimated using the Black-Scholes option-pricing model. The fair value of restricted stock awards is generally the market price of the Company’s stock on the date of grant.
Share-based compensation expense is included in the consolidated statements of operations under salaries and employee benefits for awards granted to management and in other noninterest expense for awards granted to directors.
(q.) Income Taxes
Income taxes are accounted for using the asset and liability method. Deferred tax assets and liabilities are recognized for the future tax consequences attributable to differences between the financial statement carrying amounts of existing assets and liabilities and their respective tax bases. Deferred tax assets and liabilities are measured using enacted tax rates in effect for the year in which those temporary differences are expected to be recovered or settled. The effect of a change in tax rates on deferred tax assets and liabilities is recognized in income in the period that includes the enactment date. A valuation allowance is recognized on deferred tax assets if, based upon the weight of available evidence, it is more likely than not that some or all of the assets may not be realized. The Company recognizes interest and/or penalties related to income tax matters in income tax expense.
(r.) Earnings (Loss) Per Share
Effective January 1, 2009, the Company adopted new authoritative accounting guidance under ASC Topic 260, “Earnings Per Share,” which provides that unvested share-based payment awards that contain nonforfeitable rights to dividends or dividend equivalents (whether paid or unpaid) are participating securities and shall be included in the computation of earnings per share pursuant to the two-class method. The Company has determined that its outstanding non-vested stock awards are participating securities. Accordingly, effective January 1, 2009, earnings per common share is computed using the two-class method prescribed under FASB ASC Topic 260. All previously reported earnings per common share data has been retrospectively adjusted to conform to the new computation method. The adoption and resulting adjustments to conform to the new guidance did not have a material impact on the Company’s consolidated financial statements.
Under the two-class method, basic earnings per common share is computed by dividing net earnings allocated to common stock by the weighted-average number of common shares outstanding during the applicable period, excluding outstanding participating securities. Diluted earnings per common share is computed using the weighted-average number of shares determined for the basic earnings per common share computation plus the dilutive effect of stock compensation using the treasury stock method. A reconciliation of the weighted-average shares used in calculating basic earnings per common share and the weighted average common shares used in calculating diluted earnings per common share for the reported periods is provided in Note 15 - Earnings (Loss) Per Share.
- 72 -
Table of Contents
FINANCIAL INSTITUTIONS, INC. AND SUBSIDIARIES
NOTES TO CONSOLIDATED FINANCIAL STATEMENTS
December 31, 2009, 2008 and 2007
NOTES TO CONSOLIDATED FINANCIAL STATEMENTS
December 31, 2009, 2008 and 2007
(1.) SUMMARY OF SIGNIFICANT ACCOUNTING POLICIES (Continued)
(s.) Financial Instruments with Off-Balance Sheet Risk
The Company’s financial instruments with off-balance sheet risk are commercial stand-by letters of credit and loan commitments. These financial instruments are reflected in the statements of financial condition upon funding.
(t.) Recent Accounting Pronouncements
FASB ASC 105 “Generally Accepted Accounting Principles” establishes the Codification as the single source of authoritative GAAP except for rules and interpretive releases of the SEC, which are sources of authoritative GAAP for SEC registrants. The provisions of FASB ASC 105 were adopted for the period ending September 30, 2009 and did not have a material effect on the Company’s consolidated financial statements.
FASB ASC 810-10-25, the consolidation guidance related to variable interest entities (“VIEs”), was amended to modify the approach used to evaluate VIEs and add disclosure requirements about an enterprise’s involvement with VIEs. These provisions are effective at the beginning of an entity’s annual reporting period that begins after November 15, 2009 and for interim periods within that period. The Company does not expect the adoption of this consolidation guidance to have a material effect on its consolidated financial statements.
FASB ASC 860 “Transfers and Servicing” was amended to eliminate the concept of a “qualifying special-purpose entity” and change the requirements for derecognizing financial assets. The amendment requires additional disclosures intended to provide greater transparency about transfers of financial assets, including securitization transactions, and an entity’s continuing involvement in and exposure to the risks related to transferred financial assets. This updated guidance is effective for fiscal years beginning after November 15, 2009. The Company does not expect the adoption of this guidance to have a material effect on its consolidated financial statements.
FASB ASC 825-10-65 “Financial Instruments”, FASB ASC 320-10-65 “Investments-Debt and Equity Securities”, and FASB ASC 820-10-65, “Fair Value Measurements and Disclosures” provide additional guidance on fair value measurements and impairments of securities. FASB ASC 825-10-65 requires that the fair value of all financial instruments be disclosed in both interim and annual reporting periods. FASB ASC 320-10-65 modifies the criteria used to assess other-than-temporary impairment (“OTTI”) of debt securities and collectability of cash flows, bifurcates the recognition of OTTI between earnings and other comprehensive income, and requires expanded and more frequent disclosures about OTTI. At the time of adoption, management concluded that previously recorded impairment charges resulted from securities impaired due to reasons of credit quality. As a result, no cumulative-effect adjustments were required to be recorded at adoption. FASB ASC 820-10-65 permits adjustments to estimated fair values of assets and liabilities when, due to a significant decrease in the volume and level of market activity or evidence that a market is not orderly, and when the valuation technique used does not fairly represent the price at which willing market participants would transact at the measurement date under current market conditions. In addition, FASB ASC 820-10 -65 requires disclosures about inputs and valuation techniques used to measure fair values for both interim and annual reporting periods. The recent accounting guidance in the preceding three FASB ASC’s was adopted for the reporting period ending June 30, 2009 and did not have a material effect on the Company’s consolidated financial statements.
FASB ASC 715-20-65 “Compensation — Retirement Benefits” expands the disclosure requirements for plan assets of defined benefit pensions or other postretirement plans. For plans subject to this statement, entities are required to provide more detailed information about (1) investment policies and strategies, (2) categories of plan assets, (3) fair value measurements of plan assets, and (4) significant concentrations of risk. FASB ASC 715-20-65 is effective for fiscal years ending after December 15, 2009. The provisions of this FASB ASC were adopted for the reporting period ending December 31, 2009 and the required disclosures are reported in Note 16 — Employee Benefit Plans. Additional new authoritative accounting guidance under ASC Topic 715, “Compensation—Retirement Benefits,” requires the recognition of a liability and related compensation expense for endorsement split-dollar life insurance policies that provide a benefit to an employee that extends to post-retirement periods. Under ASC Topic 715, life insurance policies purchased for the purpose of providing such benefits do not effectively settle an entity’s obligation to the employee. Accordingly, the entity must recognize a liability and related compensation expense during the employee’s active service period based on the future cost of insurance to be incurred during the employee’s retirement. The Company adopted the new authoritative accounting guidance under ASC Topic 715 on January 1, 2008 as a change in accounting principle through a cumulative-effect adjustment to retained earnings totaling $284 thousand.
- 73 -
Table of Contents
FINANCIAL INSTITUTIONS, INC. AND SUBSIDIARIES
NOTES TO CONSOLIDATED FINANCIAL STATEMENTS
December 31, 2009, 2008 and 2007
NOTES TO CONSOLIDATED FINANCIAL STATEMENTS
December 31, 2009, 2008 and 2007
(1.) SUMMARY OF SIGNIFICANT ACCOUNTING POLICIES (Continued)
FASB ASC 815-10-65 “Derivatives and Hedging” expands the disclosure requirements for derivative instruments and hedging activities. For instruments subject to this FASB ASC, entities are required to disclose how and why such instruments are being used, where values, gains and losses are reported within financial statements, and the existence and nature of credit-risk-related contingent features. Additionally, entities are required to provide more specific disclosures about the volume of their derivative activity. The accounting guidance in this FASB ASC was adopted on January 1, 2009 and did not have a material effect on the Company’s consolidated financial statements.
(2.) INVESTMENT SECURITIES
The amortized cost and estimated fair value of investment securities are summarized below (in thousands).
| December 31, 2009 | ||||||||||||||||
| Amortized | Unrealized | Unrealized | Fair | |||||||||||||
| Cost | Gains | Losses | Value | |||||||||||||
Securities available for sale: | ||||||||||||||||
| U.S. Government agencies and government sponsored enterprises | $ | 134,564 | $ | 86 | $ | 545 | $ | 134,105 | ||||||||
| State and political subdivisions | 80,812 | 2,850 | 3 | 83,659 | ||||||||||||
| Mortgage-backed securities: | ||||||||||||||||
| Federal National Mortgage Association | 75,108 | 629 | 259 | 75,478 | ||||||||||||
| Federal Home Loan Mortgage Corporation | 37,321 | 413 | 56 | 37,678 | ||||||||||||
| Government National Mortgage Association | 110,576 | 97 | 342 | 110,331 | ||||||||||||
| Collateralized mortgage obligations: | ||||||||||||||||
| Federal National Mortgage Association | 16,274 | 250 | 94 | 16,430 | ||||||||||||
| Federal Home Loan Mortgage Corporation | 20,879 | 504 | 14 | 21,369 | ||||||||||||
| Government National Mortgage Association | 95,886 | 56 | 873 | 95,069 | ||||||||||||
| Privately issued | 5,087 | 403 | 330 | 5,160 | ||||||||||||
| Total collateralized mortgage obligations | 138,126 | 1,213 | 1,311 | 138,028 | ||||||||||||
| Total mortgage-backed securities | 361,131 | 2,352 | 1,968 | 361,515 | ||||||||||||
| Asset-backed securities | 1,295 | 171 | 244 | 1,222 | ||||||||||||
| Total available for sale securities | $ | 577,802 | $ | 5,459 | $ | 2,760 | $ | 580,501 | ||||||||
Securities held to maturity: | ||||||||||||||||
| State and political subdivisions | $ | 39,573 | $ | 1,056 | $ | — | $ | 40,629 | ||||||||
- 74 -
Table of Contents
FINANCIAL INSTITUTIONS, INC. AND SUBSIDIARIES
NOTES TO CONSOLIDATED FINANCIAL STATEMENTS
December 31, 2009, 2008 and 2007
NOTES TO CONSOLIDATED FINANCIAL STATEMENTS
December 31, 2009, 2008 and 2007
(2.) INVESTMENT SECURITIES (Continued)
| December 31, 2008 | ||||||||||||||||
| Amortized | Unrealized | Unrealized | Fair | |||||||||||||
| Cost | Gains | Losses | Value | |||||||||||||
Securities available for sale: | ||||||||||||||||
| U.S. Government agencies and government sponsored enterprises | $ | 67,871 | $ | 609 | $ | 307 | $ | 68,173 | ||||||||
| State and political subdivisions | 129,572 | 2,181 | 42 | 131,711 | ||||||||||||
| Mortgage-backed securities: | ||||||||||||||||
| Federal National Mortgage Association | 136,348 | 3,725 | 86 | 139,987 | ||||||||||||
| Federal Home Loan Mortgage Corporation | 94,960 | 2,649 | 14 | 97,595 | ||||||||||||
| Government National Mortgage Association | 1,926 | 17 | 25 | 1,918 | ||||||||||||
| Collateralized mortgage obligations: | ||||||||||||||||
| Federal National Mortgage Association | 17,856 | 74 | 642 | 17,288 | ||||||||||||
| Federal Home Loan Mortgage Corporation | 44,838 | 334 | 214 | 44,958 | ||||||||||||
| Government National Mortgage Association | 1,350 | 9 | — | 1,359 | ||||||||||||
| Privately issued | 42,296 | 5 | 2,854 | 39,447 | ||||||||||||
| Total collateralized mortgage obligations | 106,340 | 422 | 3,710 | 103,052 | ||||||||||||
| Total mortgage-backed securities | 339,574 | 6,813 | 3,835 | 342,552 | ||||||||||||
| Asset-backed securities | 3,918 | — | — | 3,918 | ||||||||||||
| Equity securities | 923 | 281 | 52 | 1,152 | ||||||||||||
| Total available for sale securities | $ | 541,858 | $ | 9,884 | $ | 4,236 | $ | 547,506 | ||||||||
Securities held to maturity: | ||||||||||||||||
| State and political subdivisions | $ | 58,532 | $ | 619 | $ | 4 | $ | 59,147 | ||||||||
Interest and dividends on securities for the years ended December 31, 2009, 2008 and 2007 is summarized as follows (in thousands):
| 2009 | 2008 | 2007 | ||||||||||
| Taxable interest | $ | 16,466 | $ | 21,882 | $ | 25,414 | ||||||
| Tax-exempt interest | 5,228 | 8,773 | 9,576 | |||||||||
| Total interest and dividends on securities | $ | 21,694 | $ | 30,655 | $ | 34,990 | ||||||
Sales of securities available for sale were as follows (in thousands):
| 2009 | 2008 | 2007 | ||||||||||
| Proceeds from sales | $ | 224,928 | $ | 58,368 | $ | 49,350 | ||||||
| Gross realized gains | 6,826 | 291 | 209 | |||||||||
| Gross realized losses | 3,397 | 3 | 2 | |||||||||
- 75 -
Table of Contents
FINANCIAL INSTITUTIONS, INC. AND SUBSIDIARIES
NOTES TO CONSOLIDATED FINANCIAL STATEMENTS
December 31, 2009, 2008 and 2007
NOTES TO CONSOLIDATED FINANCIAL STATEMENTS
December 31, 2009, 2008 and 2007
(2.) INVESTMENT SECURITIES (Continued)
The scheduled maturities of securities available for sale and securities held to maturity at December 31, 2009 are shown below. Actual expected maturities may differ from contractual maturities because issuers may have the right to call or prepay obligations (in thousands).
| Amortized | Fair | |||||||
| Cost | Value | |||||||
Debt securities available for sale: | ||||||||
| Due in one year or less | $ | 52,541 | $ | 53,081 | ||||
| Due from one to five years | 169,933 | 172,584 | ||||||
| Due after five years through ten years | 52,153 | 52,685 | ||||||
| Due after ten years | 303,175 | 302,151 | ||||||
| $ | 577,802 | $ | 580,501 | |||||
Debt securities held to maturity: | ||||||||
| Due in one year or less | $ | 30,238 | $ | 30,474 | ||||
| Due from one to five years | 7,361 | 7,877 | ||||||
| Due after five years through ten years | 1,542 | 1,763 | ||||||
| Due after ten years | 432 | 515 | ||||||
| $ | 39,573 | $ | 40,629 | |||||
The following tables show the investments’ gross unrealized losses (excluding unrealized losses that have been written down through the consolidated statements of operations) and fair value, aggregated by investment category and length of time that individual securities have been in a continuous unrealized loss position at December 31, 2009 and 2008 (in thousands).
| December 31, 2009 | ||||||||||||||||||||||||
| Less than 12 months | 12 months or longer | Total | ||||||||||||||||||||||
| Fair | Unrealized | Fair | Unrealized | Fair | Unrealized | |||||||||||||||||||
| Value | Losses | Value | Losses | Value | Losses | |||||||||||||||||||
Securities available for sale: | ||||||||||||||||||||||||
| U.S. Government agencies and government sponsored enterprises | $ | 83,480 | $ | 360 | $ | 10,003 | $ | 185 | $ | 93,483 | $ | 545 | ||||||||||||
| State and political subdivisions | — | — | 150 | 3 | 150 | 3 | ||||||||||||||||||
| Mortgage-backed securities: | ||||||||||||||||||||||||
| Federal National Mortgage Association | 24,964 | 258 | 643 | 1 | 25,607 | 259 | ||||||||||||||||||
| Federal Home Loan Mortgage Corporation | 5,627 | 56 | — | — | 5,627 | 56 | ||||||||||||||||||
| Government National Mortgage Association | 55,304 | 342 | — | — | 55,304 | 342 | ||||||||||||||||||
| Collateralized mortgage obligations: | ||||||||||||||||||||||||
| Federal National Mortgage Association | 353 | 2 | 5,384 | 92 | 5,737 | 94 | ||||||||||||||||||
| Federal Home Loan Mortgage Corporation | 490 | 1 | 814 | 13 | 1,304 | 14 | ||||||||||||||||||
| Government National Mortgage Association | 79,645 | 873 | — | — | 79,645 | 873 | ||||||||||||||||||
| Privately issued | — | — | 2,985 | 330 | 2,985 | 330 | ||||||||||||||||||
| Total collateralized mortgage obligations | 80,488 | 876 | 9,183 | 435 | 89,671 | 1,311 | ||||||||||||||||||
| Total mortgage-backed securities | 166,383 | 1,532 | 9,826 | 436 | 176,209 | 1,968 | ||||||||||||||||||
| Asset-backed securities | 278 | 244 | — | — | 278 | 244 | ||||||||||||||||||
Total temporarily impaired securities | $ | 250,141 | $ | 2,136 | $ | 19,979 | $ | 624 | $ | 270,120 | $ | 2,760 | ||||||||||||
There were no unrealized losses in held to maturity securities at December 31, 2009.
- 76 -
Table of Contents
FINANCIAL INSTITUTIONS, INC. AND SUBSIDIARIES
NOTES TO CONSOLIDATED FINANCIAL STATEMENTS
December 31, 2009, 2008 and 2007
NOTES TO CONSOLIDATED FINANCIAL STATEMENTS
December 31, 2009, 2008 and 2007
(2.) INVESTMENT SECURITIES (Continued)
| December 31, 2008 | ||||||||||||||||||||||||
| Less than 12 months | 12 months or longer | Total | ||||||||||||||||||||||
| Fair | Unrealized | Fair | Unrealized | Fair | Unrealized | |||||||||||||||||||
| Value | Losses | Value | Losses | Value | Losses | |||||||||||||||||||
Securities available for sale: | ||||||||||||||||||||||||
| U.S. Government agencies and government sponsored enterprises | $ | 50 | $ | 1 | $ | 11,704 | $ | 306 | $ | 11,754 | $ | 307 | ||||||||||||
| State and political subdivisions | 6,191 | 41 | 84 | 1 | 6,275 | 42 | ||||||||||||||||||
| Mortgage-backed securities: | ||||||||||||||||||||||||
| Federal National Mortgage Association | 10,432 | 65 | 484 | 21 | 10,916 | 86 | ||||||||||||||||||
| Federal Home Loan Mortgage Corporation | 5,533 | 14 | — | — | 5,533 | 14 | ||||||||||||||||||
| Government National Mortgage Association | 227 | 3 | 1,059 | 22 | 1,286 | 25 | ||||||||||||||||||
| Collateralized mortgage obligations: | ||||||||||||||||||||||||
| Federal National Mortgage Association | 828 | 1 | 7,181 | 641 | 8,009 | 642 | ||||||||||||||||||
| Federal Home Loan Mortgage Corporation | — | — | 7,224 | 214 | 7,224 | 214 | ||||||||||||||||||
| Privately issued | 24,425 | 2,045 | 10,975 | 809 | 35,400 | 2,854 | ||||||||||||||||||
| Total collateralized mortgage obligations | 25,253 | 2,046 | 25,380 | 1,664 | 50,633 | 3,710 | ||||||||||||||||||
| Total mortgage-backed securities | 41,445 | 2,128 | 26,923 | 1,707 | 68,368 | 3,835 | ||||||||||||||||||
| Equity securities | 310 | 52 | — | — | 310 | 52 | ||||||||||||||||||
| Total available for sale securities | 47,996 | 2,222 | 38,711 | 2,014 | 86,707 | 4,236 | ||||||||||||||||||
Securities held to maturity: | ||||||||||||||||||||||||
| State and political subdivisions | 554 | 4 | — | — | 554 | 4 | ||||||||||||||||||
Total temporarily impaired securities | $ | 48,550 | $ | 2,226 | $ | 38,711 | $ | 2,014 | $ | 87,261 | $ | 4,240 | ||||||||||||
The Company reviews investment securities on an ongoing basis for the presence of other-than-temporary-impairment (“OTTI”) with formal reviews performed quarterly. Declines in the fair value of held-to-maturity and available-for-sale securities below their cost that are deemed to be other than temporary are reflected in earnings as realized losses to the extent the impairment is related to credit issues or concerns, or the security is intended to be sold. The amount of the impairment related to non-credit related factors is recognized in other comprehensive income. Evaluating whether the impairment of a debt security is other than temporary involves assessing i.) the intent to sell the debt security or ii.) the likelihood of being required to sell the security before the recovery of its amortized cost basis. In determining whether the other-than temporary impairment includes a credit loss, the Company uses its best estimate of the present value of cash flows expected to be collected from the debt security considering factors such as: a.) the length of time and the extent to which the fair value has been less than the amortized cost basis, b.) adverse conditions specifically related to the security, an industry, or a geographic area, c.) the historical and implied volatility of the fair value of the security, d.) the payment structure of the debt security and the likelihood of the issuer being able to make payments that increase in the future, e.) failure of the issuer of the security to make scheduled interest or principal payments, f.) any changes to the rating of the security by a rating agency, and g.) recoveries or additional declines in fair value subsequent to the balance sheet date.
The following summarizes the amounts of OTTI recognized during the years ended December 31, 2009 and 2008 by investment category. There was no OTTI recognized in 2007 (in thousands).
| 2009 | 2008 | |||||||
| Mortgage-backed securities — Privately issued whole loan CMOs | $ | 2,353 | $ | 5,918 | ||||
| Asset-backed securities — Trust preferred securities | 2,313 | 29,974 | ||||||
| Equity securities — Auction rate securities | — | 32,323 | ||||||
| $ | 4,666 | $ | 68,215 | |||||
As of December 31, 2009, management does not have the intent to sell any of the securities in a loss position and believes that it is likely that it will not be required to sell any such securities before the anticipated recovery of amortized cost. The unrealized losses are largely due to increases in market interest rates over the yields available at the time the underlying securities were purchased. The fair value is expected to recover as the bonds approach their maturity date or repricing date or if market yields for such investments decline.
- 77 -
Table of Contents
FINANCIAL INSTITUTIONS, INC. AND SUBSIDIARIES
NOTES TO CONSOLIDATED FINANCIAL STATEMENTS
December 31, 2009, 2008 and 2007
NOTES TO CONSOLIDATED FINANCIAL STATEMENTS
December 31, 2009, 2008 and 2007
(2.) INVESTMENT SECURITIES (Continued)
Management does not believe any of the securities in a loss position are impaired due to reasons of credit quality. Accordingly, as of December 31, 2009, management has concluded that unrealized losses on its investment securities are temporary and no further impairment loss has been realized in the Company’s consolidated statements of operations.
Further deterioration in credit quality and/or a continuation of the current imbalances in liquidity that exist in the marketplace might adversely effect the fair values of the Company’s investment portfolio and may increase the potential that certain unrealized losses will be designated as other than temporary in future periods and that the Company will incur additional write-downs in the future.
(3.) LOANS HELD FOR SALE AND MORTGAGE SERVICING RIGHTS
Loans held for sale were entirely comprised of residential real estate mortgages and totaled $421 thousand and $1.0 million as of December 31, 2009 and 2008, respectively.
The Company sells certain qualifying newly originated or refinanced residential real estate mortgages on the secondary market. Residential real estate mortgages serviced for others, which are not included in the consolidated statements of financial condition, amounted to $349.8 million and $315.7 million as of December 31, 2009 and 2008, respectively. The activity in capitalized mortgage servicing assets, included in other assets in the consolidated statements of financial condition, is summarized as follows for the years ended December 31 (in thousands):
| 2009 | 2008 | 2007 | ||||||||||
| Mortgage servicing assets, beginning of year | $ | 925 | $ | 1,000 | $ | 1,165 | ||||||
| Originations | 952 | 230 | 307 | |||||||||
| Amortization | (343 | ) | (305 | ) | (472 | ) | ||||||
| Mortgage servicing assets, end of year | 1,534 | 925 | 1,000 | |||||||||
| Valuation allowance | (185 | ) | (362 | ) | (19 | ) | ||||||
| Mortgage servicing assets, net, end of year | $ | 1,349 | $ | 563 | $ | 981 | ||||||
During 2009 the Company pooled $16.0 million of one-to-four family residential mortgage loans and converted the loans to FHLMC securities. The Company retained servicing responsibilities for this securitization. The mortgage-backed securities received in exchange for the loans were classified as available-for-sale and subsequently sold. The $564 thousand gain recognized on the sale of the securities is included in the consolidated statements of operations under net gain on disposal of investment securities. The Company did not securitize any loans in 2008 or 2007.
(4.) LOANS
Loans receivable, including net unearned income and net deferred fees and costs of $16.5 million and $12.3 million as of December 31, 2009 and December 31, 2008, respectively, are summarized as follows (in thousands):
| 2009 | 2008 | |||||||
| Commercial | $ | 186,386 | $ | 158,543 | ||||
| Commercial real estate | 308,873 | 262,234 | ||||||
| Agricultural | 41,872 | 44,706 | ||||||
| Residential real estate | 144,215 | 177,683 | ||||||
| Consumer indirect | 352,611 | 255,054 | ||||||
| Consumer direct and home equity | 230,049 | 222,859 | ||||||
| Total loans | 1,264,006 | 1,121,079 | ||||||
| Less: Allowance for loan losses | 20,741 | 18,749 | ||||||
| Total loans, net | $ | 1,243,265 | $ | 1,102,330 | ||||
The Company’s significant concentrations of credit risk in the loan portfolio relate to a geographic concentration in the communities that the Company serves.
- 78 -
Table of Contents
FINANCIAL INSTITUTIONS, INC. AND SUBSIDIARIES
NOTES TO CONSOLIDATED FINANCIAL STATEMENTS
December 31, 2009, 2008 and 2007
NOTES TO CONSOLIDATED FINANCIAL STATEMENTS
December 31, 2009, 2008 and 2007
(4.) LOANS (Continued)
The table below details additional information on the loan portfolio as of December 31 of the year indicated (in thousands):
| 2009 | 2008 | 2007 | ||||||||||
| Non-accruing loans | $ | 6,822 | $ | 8,189 | $ | 8,075 | ||||||
| Interest income that would have been recorded if loans had been performing in accordance with original terms | 388 | 546 | 713 | |||||||||
| Accruing loans 90 days or more delinquent | 1,859 | 7 | 2 | |||||||||
| Balance of impaired loans, end of period | 2,938 | 3,180 | 4,132 | |||||||||
| Balance of impaired loans requiring a specific allowance, end of period | 1,932 | 599 | 1,572 | |||||||||
| Allowance relating to impaired loans included in allowance for loan losses | 854 | 142 | 454 | |||||||||
| Average balance of impaired loans | 3,785 | 3,088 | 6,446 | |||||||||
| Interest income recognized on impaired loans | 69 | — | — | |||||||||
There were no restructured loans outstanding at December 31, 2009 or 2008.
The following table sets forth the changes in the allowance for loan losses for the years ended December 31 (in thousands):
| 2009 | 2008 | 2007 | ||||||||||
| Allowance for loan losses, beginning of year | $ | 18,749 | $ | 15,521 | $ | 17,048 | ||||||
| Charge-offs | 7,830 | 5,459 | 3,895 | |||||||||
| Recoveries | 2,120 | 2,136 | 2,252 | |||||||||
| Net charge-offs | 5,710 | 3,323 | 1,643 | |||||||||
| Provision for loan losses | 7,702 | 6,551 | 116 | |||||||||
| Allowance for loan losses, end of year | $ | 20,741 | $ | 18,749 | $ | 15,521 | ||||||
(5.) PREMISES AND EQUIPMENT, NET
Major classes of premises and equipment at December 31, 2009 and 2008 are summarized as follows (in thousands):
| 2009 | 2008 | |||||||
| Land and land improvements | $ | 4,334 | $ | 4,334 | ||||
| Buildings and leasehold improvements | 39,553 | 39,298 | ||||||
| Furniture, fixtures, equipment and vehicles | 23,771 | 24,480 | ||||||
| Premises and equipment | 67,658 | 68,112 | ||||||
| Accumulated depreciation and amortization | (32,875 | ) | (31,400 | ) | ||||
| Premises and equipment, net | $ | 34,783 | $ | 36,712 | ||||
Depreciation and amortization expense, included in occupancy and equipment expense in the consolidated statements of operations, amounted to $3.8 million for the year ended December 31, 2009 and $3.7 million for each of the years ended December 31, 2008 and 2007.
- 79 -
Table of Contents
FINANCIAL INSTITUTIONS, INC. AND SUBSIDIARIES
NOTES TO CONSOLIDATED FINANCIAL STATEMENTS
December 31, 2009, 2008 and 2007
NOTES TO CONSOLIDATED FINANCIAL STATEMENTS
December 31, 2009, 2008 and 2007
(6.) GOODWILL AND OTHER INTANGIBLE ASSETS
The carrying amount of goodwill totaled $37.4 million as of December 31, 2009 and 2008. The goodwill relates to the Company’s primary subsidiary and reporting unit, Five Star Bank. The Company performs a goodwill impairment test on an annual basis or more frequently if events and circumstances warrant.
The Company has historically considered total market capitalization as an indicator of fair value based on the trading price of its common stock compared to the carrying value of common equity. However, given the extreme volatility in the stock market during recent years and the impact that the credit crisis and the recession had on the stock market, management concluded that it was more appropriate to consider multiple approaches in assessing its goodwill for potential impairment.
At March 31, 2009, the Company concluded that events had occurred and circumstances had changed which may indicate the existence of potential impairment of goodwill. These indicators included a significant decline in the Company’s stock price and deterioration in the banking industry. The Company utilized a valuation consultant to perform an interim assessment of its goodwill. The assessment included a weighted combination of valuation techniques, which incorporated both income and market based valuation approaches. The income based valuation approach, which carried the most weight, was based on a dividend discount analysis that calculated cash flows on projected financial results assuming a change of control transaction. The significant factors and assumptions used in the discounted dividend analysis included: management’s financial projections, projected dividend stream based on minimum capital requirements, change of control cost synergies, a multiple of terminal price-to-earnings and the discount rate used to calculate the present value of future cash flows. The valuation also included market based valuation approaches, which included application of median pricing multiples from recent actual acquisitions of companies of similar size, as well as, application of change of control premiums to trading value. The valuation resulted in a fair value that exceeded the carrying value of common equity by greater than 10% on a weighted basis. Based primarily on the results of this valuation, management concluded that no impairment of goodwill existed.
The Company continued to monitor the valuation analysis and key assumptions that drove the valuation throughout the remainder of 2009, including as of September 30, the annual evaluation date, considering updated assumptions as of September 30 and December 31, 2009, taking into consideration improvements in Company financial performance, as well as improved market and industry conditions in general, which occurred subsequent to the March 31, 2009 goodwill impairment analysis. Based on its ongoing evaluation and assessments, the Company concluded no impairment of goodwill existed during and as of the year ended December 31, 2009 as the valuation resulted in a fair value that exceeded the carrying value of common equity as of September 30 and December 31, 2009.
Declines in the market value of the Company’s publicly traded stock price or declines in the Company’s ability to generate future cash flows may increase the potential that goodwill recorded on the Company’s consolidated statement of financial condition be designated as impaired and that the Company may incur a goodwill write-down in the future.
Other intangible assets, included in other assets in the consolidated statements of financial condition, consist entirely of core deposit intangibles and are summarized as follows as of December 31 (in thousands):
| 2009 | 2008 | |||||||
| Other intangible assets | $ | 11,263 | $ | 11,263 | ||||
| Accumulated amortization | (11,263 | ) | (10,983 | ) | ||||
| Other intangible assets, net | $ | — | $ | 280 | ||||
Intangible amortization expense for these other intangible assets amounted to $280 thousand for the year ended December 31, 2009 and $307 thousand for each of the years ended December 31, 2008 and 2007. Amortization of other intangible assets was computed using the straight-line method over the estimated lives of the respective assets (primarily 5 and 7 years).
- 80 -
Table of Contents
FINANCIAL INSTITUTIONS, INC. AND SUBSIDIARIES
NOTES TO CONSOLIDATED FINANCIAL STATEMENTS
December 31, 2009, 2008 and 2007
NOTES TO CONSOLIDATED FINANCIAL STATEMENTS
December 31, 2009, 2008 and 2007
(7.) DEPOSITS
A summary of deposits at December 31, 2009 and 2008 are as follows (dollars in thousands):
| 2009 | 2008 | |||||||
| Noninterest-bearing demand | $ | 324,303 | $ | 292,586 | ||||
| Interest-bearing demand | 363,698 | 344,616 | ||||||
| Savings and money market | 368,603 | 348,594 | ||||||
| Certificates of deposit, due: | ||||||||
| Within one year | 526,549 | 546,266 | ||||||
| One to two years | 132,289 | 78,963 | ||||||
| Two to three years | 8,200 | 7,625 | ||||||
| Three to five years | 18,968 | 14,102 | ||||||
| Thereafter | 345 | 511 | ||||||
| Total certificates of deposits | 686,351 | 647,467 | ||||||
| Total deposits | $ | 1,742,955 | $ | 1,633,263 | ||||
Certificates of deposit in denominations of $100,000 or more at December 31, 2009, 2008 and 2007 amounted to $173.4 million, $164.6 million and $154.5 million, respectively. Interest expense on those certificates totaled $3.2 million, $5.7 million and $9.5 million in 2009, 2008 and 2007, respectively.
Interest expense by deposit type for the years ended December 31, 2009, 2008 and 2007 is summarized as follows (in thousands):
| 2009 | 2008 | 2007 | ||||||||||
| Interest-bearing demand | $ | 772 | $ | 3,246 | $ | 5,760 | ||||||
| Savings and money market | 1,090 | 3,773 | 5,863 | |||||||||
| Certificates of deposit | 17,228 | 22,330 | 31,091 | |||||||||
| Total interest expense on deposits | $ | 19,090 | $ | 29,349 | $ | 42,714 | ||||||
(8.) BORROWINGS
Outstanding borrowings are summarized as follows as of December 31 (in thousands):
| 2009 | 2008 | |||||||
| Short-term borrowings: | ||||||||
| Federal funds purchased | $ | 9,419 | $ | — | ||||
| Repurchase agreements | 35,124 | 23,465 | ||||||
| Other short-term borrowings | 15,000 | — | ||||||
| Total short-term borrowings | 59,543 | 23,465 | ||||||
| Long-term borrowings: | ||||||||
| FHLB advances and repurchase agreements | 30,145 | 30,653 | ||||||
| Junior subordinated debentures | 16,702 | 16,702 | ||||||
| Total long-term borrowings | 46,847 | 47,355 | ||||||
| Total borrowings | $ | 106,390 | $ | 70,820 | ||||
The Company classifies borrowings as short-term or long-term in accordance with the original terms of the agreement. At December 31, 2009, the Company’s short-term and long-term borrowings had weighted average rates of 0.59% and 6.01%, respectively.
Short-term Borrowings
Federal funds purchased are short-term borrowings that typically mature within one to ninety days. Federal funds purchased totaled $9.4 million at December 31, 2009. There were no federal funds purchased outstanding at December 31, 2008. Repurchase agreements are secured overnight borrowings with customers. These short-term repurchase agreements amounted to $35.1 million and $23.5 million as of December 31, 2009 and 2008, respectively. Other short-term borrowings at December 31, 2009 consisted of an advance from the Federal Reserve’s Term Auction Facility.
- 81 -
Table of Contents
FINANCIAL INSTITUTIONS, INC. AND SUBSIDIARIES
NOTES TO CONSOLIDATED FINANCIAL STATEMENTS
December 31, 2009, 2008 and 2007
NOTES TO CONSOLIDATED FINANCIAL STATEMENTS
December 31, 2009, 2008 and 2007
(8.) BORROWINGS (Continued)
Long-term Borrowings
The Company has credit capacity with the FHLB and can borrow through facilities that include an overnight line of credit, amortizing and term advances, and repurchase agreements. The FHLB credit capacity is collateralized by securities from the Company’s investment portfolio and certain qualifying loans. FHLB advances totaled $145 thousand and $653 thousand as of December 31, 2009 and 2008, respectively. The advances mature on various dates through 2011 and had a weighted average rate of 6.92% and 6.03% at December 31, 2009 and 2008, respectively. FHLB repurchase agreements are stated at the amount of cash received in connection with the transaction. The Company may be required to provide additional collateral based on the fair value of the underlying securities. FHLB repurchase agreements totaled $30.0 million at both December 31, 2009 and 2008. The FHLB repurchase agreements mature on various dates through 2011 and bear fixed interest rates ranging from 3.48% to 3.98% with a weighted average rate of 3.67% at December 31, 2009.
Scheduled minimum future principal payments on FHLB advances and repurchase agreements at December 31, 2009 were as follows (in thousands):
| 2010 | $ | 20,080 | ||
| 2011 | 10,065 | |||
| $ | 30,145 | |||
In February 2001, the Company formed Financial Institutions Statutory Trust I (the “Trust”) for the sole purpose of issuing trust preferred securities. The Company’s $502 thousand investment in the common equity of the Trust is classified in the consolidated statements of financial condition as other assets and $16.7 million of related debentures are classified as long-term borrowings. In 2001, the Company incurred costs relating to the issuance of the debentures totaling $487 thousand. These costs, which are included in other assets on the consolidated statements of financial condition, were deferred and are being amortized to interest expense using the straight-line method over a twenty year period.
The Company, through the Trust, issued 16,200 fixed rate pooled trust preferred securities with a liquidation preference of $1,000 per security. The trust preferred securities represent an interest in the related subordinated debentures of the Company, which were purchased by the Trust and have substantially the same payment terms as these trust preferred securities. The subordinated debentures are the only assets of the Trust and interest payments from the debentures finance the distributions paid on the trust preferred securities. Distributions on the debentures are payable semi-annually at a fixed interest rate of 10.20%. The trust preferred securities are subject to mandatory redemption at the liquidation preference, in whole or in part, upon repayment of the subordinated debentures at maturity or their earlier redemption. The subordinated debentures are redeemable prior to the maturity date of February 1, 2031, at the option of the Company on or after February 1, 2011, in whole at any time thereafter or in part from time to time thereafter. The subordinated debentures are also redeemable at any time, in whole, but not in part, upon the occurrence of specific events defined within the trust indenture. The Company has the option to defer distributions on the subordinated debentures from time to time for a period not to exceed 20 consecutive quarters, however the Company has not opted to defer any payments to date.
Interest expense on borrowings for the years ended December 31, 2009, 2008 and 2007 is summarized as follows (in thousands):
| 2009 | 2008 | 2007 | ||||||||||
| Short-term borrowings | $ | 270 | $ | 721 | $ | 864 | ||||||
| Long-term borrowings | 2,857 | 3,547 | 3,561 | |||||||||
| Total interest expense on borrowings | $ | 3,127 | $ | 4,268 | $ | 4,425 | ||||||
- 82 -
Table of Contents
FINANCIAL INSTITUTIONS, INC. AND SUBSIDIARIES
NOTES TO CONSOLIDATED FINANCIAL STATEMENTS
December 31, 2009, 2008 and 2007
NOTES TO CONSOLIDATED FINANCIAL STATEMENTS
December 31, 2009, 2008 and 2007
(9.) COMMITMENTS AND CONTINGENCIES
Financial Instruments with Off-Balance Sheet Risk
The Company has financial instruments with off-balance sheet risk established in the normal course of business to meet the financing needs of its customers. These financial instruments include commitments to extend credit and standby letters of credit. These instruments involve, to varying degrees, elements of credit and interest rate risk extending beyond amounts recognized in the financial statements.
The Company’s exposure to credit loss in the event of nonperformance by the other party to the financial instrument for commitments to extend credit and standby letters of credit is essentially the same as that involved with extending loans to customers. The Company uses the same credit underwriting policies in making commitments and conditional obligations as for on-balance sheet instruments.
At December 31, 2009 and 2008, the off-balance sheet commitments consist of the following (in thousands):
| 2009 | 2008 | |||||||
| Commitments to extend credit | $ | 316,688 | $ | 339,454 | ||||
| Standby letters of credit | 6,887 | 7,902 | ||||||
Commitments to extend credit are agreements to lend to a customer as long as there is no violation of any condition established in the contract. Commitments generally have fixed expiration dates or other termination clauses and may require payment of a fee. Commitments may expire without being drawn upon; therefore the total commitment amounts do not necessarily represent future cash requirements. Each customer’s creditworthiness is evaluated on a case-by-case basis. The amount of collateral obtained, if any, is based on management’s credit evaluation of the borrower. Standby letters of credit are conditional lending commitments issued by the Company to guarantee the performance of a customer to a third party. These standby letters of credit are primarily issued to support private borrowing arrangements. The credit risk involved in issuing standby letters of credit is essentially the same as that involved in extending loan facilities to customers.
The Company also extends rate lock agreements to borrowers related to the origination of residential mortgage loans. To mitigate the interest rate risk inherent in these rate lock agreements when the Company intends to sell the related loan, once originated, as well as closed residential mortgage loans held for sale, the Company enters into forward commitments to sell individual residential mortgages. Rate lock agreements and forward commitments are considered derivatives and are recorded at fair value. As of December 31, 2009 and 2008, the total notional amount of these derivatives held by the Company amounted to $9.4 million and $21.3 million, respectively. The fair value of these derivatives in a gain position were recorded as other assets, while the fair value of these derivatives in a loss position were recorded as other liabilities in the consolidated statements of financial condition. In addition, the net change in the fair values of these derivatives was recognized as other noninterest income or other noninterest expense in the consolidated statements of operations. These fair values and changes in fair values were not significant as of or for the years ended December 31, 2009 and 2008.
Lease Obligations
The Company is obligated under a number of noncancellable operating lease agreements for land, buildings and equipment. Certain of these leases provide for escalation clauses and contain renewal options calling for increased rentals if the lease is renewed. Future minimum payments by year and in the aggregate, under the noncancellable leases with initial or remaining terms of one year or more, are as follows at December 31, 2009 (in thousands):
| 2010 | $ | 1,135 | ||
| 2011 | 1,065 | |||
| 2012 | 1,033 | |||
| 2013 | 894 | |||
| 2014 | 863 | |||
| Thereafter | 4,386 | |||
| $ | 9,376 | |||
Rent expense relating to these operating leases, included in occupancy and equipment expense in the statements of operations, was $1.5 million, $1.1 million and $970 thousand in 2009, 2008 and 2007, respectively.
Contingent Liabilities
In the ordinary course of business there are various threatened and pending legal proceedings against the Company. Based on consultation with outside legal counsel, management believes that the aggregate liability, if any, arising from such litigation would not have a material adverse effect on the Company’s consolidated financial statements.
- 83 -
Table of Contents
FINANCIAL INSTITUTIONS, INC. AND SUBSIDIARIES
NOTES TO CONSOLIDATED FINANCIAL STATEMENTS
December 31, 2009, 2008 and 2007
NOTES TO CONSOLIDATED FINANCIAL STATEMENTS
December 31, 2009, 2008 and 2007
(10.) REGULATORY MATTERS
General
The supervision and regulation of financial and bank holding companies and their subsidiaries is intended primarily for the protection of depositors, the deposit insurance funds regulated by the FDIC and the banking system as a whole, and not for the protection of shareholders or creditors of bank holding companies. The various bank regulatory agencies have broad enforcement power over financial holding companies and banks, including the power to impose substantial fines, operational restrictions and other penalties for violations of laws and regulations and for safety and soundness considerations.
Capital
Banks and financial holding companies are subject to various regulatory capital requirements administered by state and federal banking agencies. Failure to meet minimum capital requirements can initiate certain mandatory and possibly additional discretionary, actions by regulators that, if undertaken, could have a direct material impact on the Company’s consolidated financial statements. Capital adequacy guidelines and, additionally for banks, prompt corrective action regulations, involve quantitative measures of assets, liabilities, and certain off-balance sheet items calculated under regulatory accounting practices. Capital amounts and classifications are also subject to qualitative judgments by regulators about components, risk weighting and other factors.
Quantitative measures established by regulation to ensure capital adequacy require the Company and the Bank to maintain minimum amounts and ratios of Total and Tier 1 capital to risk-weighted assets and of Tier 1 capital to average assets (all as defined in the regulations). These minimum amounts and ratios are included in the table below.
The Company’s and the Bank’s Tier 1 capital consists of shareholders’ equity excluding unrealized gains and losses on securities available for sale (except for unrealized losses which have been determined to be other than temporary and recognized as expense in the consolidated statements of operations), goodwill and other intangible assets and disallowed portions of deferred tax assets. Tier 1 capital for the Company also includes, subject to limitation, $16.7 million of trust preferred securities issued by FISI Statutory Trust I and $37.5 million of preferred stock issued to the U.S. Department of Treasury (the “Treasury”) through the Treasury’s Troubled Asset Relief Program (“TARP”) (see Note 11, Shareholders’ Equity). The Company and the Bank’s total capital are comprised of Tier 1 capital for each entity plus a permissible portion of the allowance for loan losses.
- 84 -
Table of Contents
FINANCIAL INSTITUTIONS, INC. AND SUBSIDIARIES
NOTES TO CONSOLIDATED FINANCIAL STATEMENTS
December 31, 2009, 2008 and 2007
NOTES TO CONSOLIDATED FINANCIAL STATEMENTS
December 31, 2009, 2008 and 2007
(10.) REGULATORY MATTERS (Continued)
The Tier 1 and total capital ratios are calculated by dividing the respective capital amounts by risk-weighted assets. Risk-weighted assets are calculated based on regulatory requirements and include total assets, excluding goodwill and other intangible assets and disallowed portions of deferred tax assets, allocated by risk weight category and certain off-balance sheet items (primarily loan commitments and securities more than one level below investment grade that are subject to the low level exposure rule). The leverage ratio is calculated by dividing Tier 1 capital by adjusted quarterly average total assets, which exclude goodwill and other intangible assets and disallowed portions of deferred tax assets.
The Company’s and the Bank’s actual and required capital ratios as of December 31, 2009 and 2008 were as follows (dollars in thousands):
| For Capital | ||||||||||||||||||||||||
| Actual | Adequacy Purposes | Well Capitalized | ||||||||||||||||||||||
| Amount | Ratio | Amount | Ratio | Amount | Ratio | |||||||||||||||||||
December 31, 2009: | ||||||||||||||||||||||||
| Tier 1 leverage: | ||||||||||||||||||||||||
| Company | $ | 163,613 | 7.96 | % | $ | 82,188 | 4.00 | % | $ | 102,735 | 5.00 | % | ||||||||||||
| Bank (FSB) | 154,316 | 7.53 | 82,018 | 4.00 | 102,522 | 5.00 | ||||||||||||||||||
| Tier 1 capital (to risk-weighted assets): | ||||||||||||||||||||||||
| Company | 163,613 | 11.95 | 54,746 | 4.00 | 82,119 | 6.00 | ||||||||||||||||||
| Bank (FSB) | 154,316 | 11.33 | 54,475 | 4.00 | 81,712 | 6.00 | ||||||||||||||||||
| Total risk-based capital (to risk-weighted assets): | ||||||||||||||||||||||||
| Company | 180,766 | 13.21 | 109,492 | 8.00 | 136,865 | 10.00 | ||||||||||||||||||
| Bank (FSB) | 171,385 | 12.58 | 108,949 | 8.00 | 136,186 | 10.00 | ||||||||||||||||||
December 31, 2008: | ||||||||||||||||||||||||
| Tier 1 leverage: | ||||||||||||||||||||||||
| Company | $ | 150,426 | 8.05 | % | $ | 74,764 | 4.00 | % | $ | 93,456 | 5.00 | % | ||||||||||||
| Bank (FSB) | 120,484 | 6.46 | 74,586 | 4.00 | 93,232 | 5.00 | ||||||||||||||||||
| Tier 1 capital (to risk-weighted assets): | ||||||||||||||||||||||||
| Company | 150,426 | 11.83 | 50,881 | 4.00 | 76,322 | 6.00 | ||||||||||||||||||
| Bank (FSB) | 120,484 | 9.52 | 50,624 | 4.00 | 75,936 | 6.00 | ||||||||||||||||||
| Total risk-based capital (to risk-weighted assets): | ||||||||||||||||||||||||
| Company | 166,362 | 13.08 | 101,762 | 8.00 | 127,203 | 10.00 | ||||||||||||||||||
| Bank (FSB) | 136,340 | 10.77 | 101,248 | 8.00 | 126,560 | 10.00 | ||||||||||||||||||
Five Star Bank has been notified by its regulator that, as of its most recent regulatory examination, it is regarded as well capitalized under the regulatory framework for prompt corrective action. Such determination has been made based on the Bank’s Tier 1, total capital, and leverage ratios. There have been no conditions or events since this notification that management believes would change the Bank’s categorization as well capitalized under the aforementioned ratios.
Federal Reserve Requirements
The Bank is required to maintain a reserve balance at the Federal Reserve Bank of New York. The reserve requirement for the Bank totaled $1.0 million as of December 31, 2009 and 2008.
Dividend Restrictions
In the ordinary course of business, the Company is dependent upon dividends from Five Star Bank to provide funds for the payment of interest expense on the junior subordinated debentures, dividends to shareholders and to provide for other cash requirements. Banking regulations may limit the amount of dividends that may be paid. Approval by regulatory authorities is required if the effect of dividends declared would cause the regulatory capital of the Bank to fall below specified minimum levels. Approval is also required if dividends declared exceed the net profits for that year combined with the retained net profits for the preceding two years. The Bank is currently required to obtain approval from the NYS Banking Department for dividends payments.
In addition, pursuant to the terms of the Treasury’s TARP Capital Purchase Program (see Note 11, Shareholders’ Equity), the Company may not declare or pay any cash dividends on its common stock other than regular quarterly cash dividends of not more than $0.10 without the consent of the U.S. Treasury.
- 85 -
Table of Contents
FINANCIAL INSTITUTIONS, INC. AND SUBSIDIARIES
NOTES TO CONSOLIDATED FINANCIAL STATEMENTS
December 31, 2009, 2008 and 2007
NOTES TO CONSOLIDATED FINANCIAL STATEMENTS
December 31, 2009, 2008 and 2007
(11.) SHAREHOLDERS’ EQUITY
The Company’s authorized capital stock consists of 50,210,000 shares of capital stock, 50,000,000 of which are common stock, par value $0.01 per share, and 210,000 of which are preferred stock, par value $100.00 per share, which is designated into two classes, Class A of which 10,000 shares are authorized, and Class B of which 200,000 shares are authorized. There are two series of Class A Preferred Stock; Series A 3% Preferred Stock and the Series A Preferred Stock. There is one series of Class B Preferred Stock; Series B-1 8.48% Preferred Stock. As of December 31, 2009, there were 183,259 shares of preferred stock issued and outstanding.
Common Stock
The changes in shares of common stock outstanding were as follows for the years ended December 31:
| 2009 | 2008 | |||||||
| Shares outstanding at beginning of period | 10,798,019 | 11,011,151 | ||||||
| Restricted stock awards issued | 13,172 | 51,500 | ||||||
| Stock options exercised | 1,010 | 2,317 | ||||||
| Directors’ retainer | 8,067 | 5,912 | ||||||
| Treasury stock purchases | — | (272,861 | ) | |||||
| Shares outstanding at end of period | 10,820,268 | 10,798,019 | ||||||
Treasury Stock
There were no repurchases of the Company’s stock during 2009. The Company repurchased 272,861 shares of its common stock in open market transactions at an aggregate cost of $4.8 million during the year ended December 31, 2008.
Preferred Stock and Warrant
Series A 3% Preferred Stock.As of December 31, 2009, there were 1,533 shares of Series A 3% Preferred Stock issued and outstanding. Holders of Series A 3% Preferred Stock are entitled to receive an annual dividend of $3.00 per share, which is cumulative and payable quarterly. Holders of Series A 3% Preferred Stock have no pre-emptive right in, or right to purchase or subscribe for, any additional shares of the Company’s capital stock and have no voting rights. Dividend or dissolution payments to the Class A shareholders must be declared and paid, or set apart for payment, before any dividends or dissolution payments can be declared and paid, or set apart for payment, to the holders of Class B Preferred Stock or Common Stock. The Series A 3% Preferred Stock is not convertible into any other of the Company’s securities.
Series A Preferred Stock and Warrant.In December 2008, under the U.S. Department of the Treasury’s (“Treasury”) TARP Capital Purchase Program, the Company entered into a Securities Purchase Agreement—Standard Terms with the U.S. Treasury pursuant to which, among other things, the Company sold to the U.S. Treasury for an aggregate purchase price of $37.5 million, 7,503 shares of fixed rate cumulative perpetual preferred stock, Series A (Series A Preferred Stock) and a warrant to purchase up to 378,175 shares of common stock, par value $0.01 per share (the “Warrant”), of the Company. The Company’s Series A Preferred Stock qualifies as Tier 1 capital in accordance with regulatory capital requirements (see Note 10, Regulatory Matters).
The Series A Preferred Stock ranks senior to the Company’s common shares andpari passu, which is at an equal level in the capital structure, with existing preferred shares (Series A 3% Preferred Stock), other than preferred shares which by their terms rank junior to any other existing preferred shares (Series B-1 8.48% Preferred Stock). The Series A Preferred Stock pays a compounding cumulative dividend, in cash, at a rate of 5% per annum through February 15, 2014, and 9% per annum thereafter on the liquidation preference of $5,000 per share. The Company is prohibited from paying any dividend with respect to shares of common stock, other junior securities or preferred stock rankingpari passuwith the Series A Preferred Stock or repurchasing or redeeming any shares of the Company’s common shares, other junior securities or preferred stock rankingpari passuwith the Series A Preferred Stock in any quarter unless all accrued and unpaid dividends are paid on the Series A Preferred Stock for all past dividend periods (including the latest completed dividend period), subject to certain limited exceptions. The Series A Preferred Stock is non-voting, other than class voting rights on matters that could adversely affect the Series A Preferred Stock. The U.S. Treasury may also transfer the Series A Preferred Stock to a third party at any time.
- 86 -
Table of Contents
FINANCIAL INSTITUTIONS, INC. AND SUBSIDIARIES
NOTES TO CONSOLIDATED FINANCIAL STATEMENTS
December 31, 2009, 2008 and 2007
NOTES TO CONSOLIDATED FINANCIAL STATEMENTS
December 31, 2009, 2008 and 2007
(11.) SHAREHOLDERS’ EQUITY (Continued)
The Warrant has a term of 10 years and is exercisable at any time, in whole or in part, at an exercise price of $14.88 per share (subject to certain anti-dilution adjustments). The U.S. Treasury may not exercise the Warrant for, or transfer the Warrant with respect to, more than half of the initial shares of common stock underlying the Warrant prior to the earlier of (i) the date on which the Company receives aggregate gross proceeds of not less than $37.5 million from one or more qualified equity offerings and (ii) December 31, 2009. The number of shares to be delivered upon settlement of the Warrant would have been reduced by 50% if the Company receives aggregate gross proceeds of at least 100% of the aggregate liquidation preference of the Series A Preferred Stock ($37.5 million) from one or more qualified equity offerings prior to December 31, 2009.
Under the original terms of the CPP, the Company could not redeem the Series A Preferred Stock prior to February 15, 2012 except with proceeds from a qualified offering. However, the American Recovery and Reinvestment Act of 2009 (“ARRA”), provides that the Secretary of Treasury shall permit a recipient of funds under TARP, subject to consultation with the recipient’s appropriate Federal banking agency, to repay such assistance without regard to whether the recipient has replaced such funds from any other source or to any waiting period. ARRA further provides that when the recipient repays such assistance, the Secretary of Treasury shall liquidate the warrants associated with the assistance at the current market price. The Company will be subject to existing supervisory procedures for approving redemption requests for capital instruments if it elects to repay the TARP funds. The FRB will weigh the Company’s desire to redeem the Series A Preferred Stock against the contribution of Treasury capital to the Company’s overall soundness, capital adequacy and ability to lend.
The $37.5 million in proceeds was allocated to the Series A Preferred Stock and the Warrant based on their relative fair values at issuance ($35.5 million was allocated to the Series A Preferred Stock and $2.0 million to the Warrant). The difference between the initial value allocated to the Series A Preferred Stock of $35.5 million and the liquidation value of $37.5 million is being charged to retained earnings as an adjustment to the dividend yield using the effective yield method. The amount charged to retained earnings is deducted from the numerator in calculating basic and diluted earnings per share during the related reporting period (see Note 15, Earnings (Loss) per Share).
The Company is currently evaluating repayment options relative to the TARP funds to determine the most economically beneficial option for both the Company and shareholders.
Series B-1 8.48% Preferred Stock.As of December 31, 2009, there were 174,223 shares of Series B-1 8.48% Preferred Stock issued and outstanding. Holders of Series B-1 8.48% Preferred Stock are entitled to receive an annual dividend of $8.48 per share, which is cumulative and payable quarterly. Holders of Series B-1 8.48% Preferred Stock have no pre-emptive right in, or right to purchase or subscribe for, any additional shares of the Company’s capital stock and have no voting rights. Accumulated dividends on the Series B-1 8.48% Preferred Stock do not bear interest, and the Series B-1 8.48% Preferred Stock is not subject to redemption. Dividend or dissolution payments to the Class B shareholders must be declared and paid, or set apart for payment, before any dividends or dissolution payments are declared and paid, or set apart for payment, to the holders of Common Stock. The Series B-1 8.48% Preferred Stock is not convertible into any other of the Company’s securities.
- 87 -
Table of Contents
FINANCIAL INSTITUTIONS, INC. AND SUBSIDIARIES
NOTES TO CONSOLIDATED FINANCIAL STATEMENTS
December 31, 2009, 2008 and 2007
NOTES TO CONSOLIDATED FINANCIAL STATEMENTS
December 31, 2009, 2008 and 2007
(12.) COMPREHENSIVE INCOME (LOSS)
Total comprehensive income (loss) is reported in the accompanying consolidated statements of changes in shareholders’ equity. Information related to comprehensive income (loss) for the years ended December 31 was as follows (in thousands):
| Pre-tax Amount | Tax Expense (Benefit) | Net-of-tax Amount | ||||||||||
2009 | ||||||||||||
| Securities available for sale: | ||||||||||||
| Change in net unrealized gain/loss during the period | $ | (4,186 | ) | $ | (1,619 | ) | $ | (2,567 | ) | |||
| Reclassification adjustment for gains included in income | (3,429 | ) | (1,327 | ) | (2,102 | ) | ||||||
| Reclassification adjustment for impairment charges included in income | 4,666 | 1,805 | 2,861 | |||||||||
| (2,949 | ) | (1,141 | ) | (1,808 | ) | |||||||
| Change in net actuarial gain/loss and prior service benefit (cost) on defined benefit pension and post-retirement plans | 3,457 | 1,338 | 2,119 | |||||||||
| Other comprehensive income | $ | 508 | $ | 197 | 311 | |||||||
| Net income | 14,441 | |||||||||||
| Comprehensive income | $ | 14,752 | ||||||||||
2008 | ||||||||||||
| Securities available for sale: | ||||||||||||
| Change in net unrealized gain/loss during the period | $ | (61,464 | ) | $ | (23,778 | ) | $ | (37,686 | ) | |||
| Reclassification adjustment for gains included in income | (288 | ) | (111 | ) | (177 | ) | ||||||
| Reclassification adjustment for impairment charges included in income | 68,215 | 26,389 | 41,826 | |||||||||
| 6,463 | 2,500 | 3,963 | ||||||||||
| Change in net actuarial gain/loss and prior service benefit (cost) on defined benefit pension and post-retirement plans | (14,098 | ) | (5,455 | ) | (8,643 | ) | ||||||
| Other comprehensive loss | $ | (7,635 | ) | $ | (2,955 | ) | (4,680 | ) | ||||
| Net loss | (26,158 | ) | ||||||||||
| Comprehensive loss | $ | (30,838 | ) | |||||||||
2007 | ||||||||||||
| Securities available for sale: | ||||||||||||
| Change in net unrealized gain/loss during the period | $ | 10,530 | $ | 4,103 | $ | 6,427 | ||||||
| Reclassification adjustment for gains included in income | (207 | ) | (80 | ) | (127 | ) | ||||||
| 10,323 | 4,023 | 6,300 | ||||||||||
| Change in net actuarial gain/loss and prior service benefit (cost) on defined benefit pension and post-retirement plans | 4,531 | 1,760 | 2,771 | |||||||||
| Other comprehensive income | $ | 14,854 | $ | 5,783 | 9,071 | |||||||
| Net income | 16,409 | |||||||||||
| Comprehensive income | $ | 25,480 | ||||||||||
The components of accumulated other comprehensive income (loss), net of tax, as of December 31 were as follows (in thousands):
| 2009 | 2008 | |||||||
| Net actuarial loss and prior service cost on defined benefit pension and post-retirement plans | $ | (5,357 | ) | $ | (7,476 | ) | ||
| Net unrealized gain on securities available for sale | 1,655 | 3,463 | ||||||
| $ | (3,702 | ) | $ | (4,013 | ) | |||
- 88 -
Table of Contents
FINANCIAL INSTITUTIONS, INC. AND SUBSIDIARIES
NOTES TO CONSOLIDATED FINANCIAL STATEMENTS
December 31, 2009, 2008 and 2007
NOTES TO CONSOLIDATED FINANCIAL STATEMENTS
December 31, 2009, 2008 and 2007
(13.) SHARE-BASED COMPENSATION
The Company maintains certain stock-based compensation plans, approved by the Company’s shareholders that are administered by the Board, or the Management Development and Compensation Committee of the Board. On May 6, 2009 the shareholders of the Company approved two share-based compensation plans, the 2009 Management Stock Incentive Plan (“Management Plan”) and the 2009 Directors’ Stock Incentive Plan (“Director’s Plan”). An aggregate of 690,000 shares has been reserved for issuance by the Company under the terms of the Management Plan pursuant to the grant of incentive stock options (not to exceed 500,000 shares), non-qualified stock options and restricted stock grants all which are defined in the plan. An aggregate of 250,000 shares has been reserved for issuance by the Company under the terms of the Director’s Plan pursuant to the grant of non-qualified stock options and restricted stock grants, all which are defined in the plan. Under both plans, for purposes of calculating the number of shares of common stock available for issuance, each share of common stock granted pursuant to a restricted stock grant shall count as 1.64 shares of common stock. As of December 31, 2009, there were approximately 237,000 and 687,000 shares available for grant under the Director’s Plan and Management Plan, respectively, of which 61% were available for issuance as restricted stock grants.
Under the Management Plan and the Director’s Plan (the “Plans”), the Board (or the Compensation Committee) may establish and prescribe grant guidelines including various terms and conditions for the granting of stock-based compensation. For stock options, the exercise price of each option equals the market price of the Company’s stock on the date of the grant. All options expire after a period of ten years from the date of grant and generally become fully exercisable over a period of 3 to 5 years from the grant date. When option recipients exercise their options, the Company issues shares from treasury stock and records the proceeds as additions to capital. For restricted stock, shares generally vests over 2 to 3 years from the grant date. Vesting of the shares may be based on years of service, established performance measures or both. If restricted stock grants are forfeited before they vest, the shares are reacquired into treasury stock.
The share-based compensation plans were established to allow for the granting of compensation awards to attract, motivate and retain employees, executive officers and non-employee directors who contribute to the success and profitability of the Company and to give such persons a proprietary interest in the Company, thereby enhancing their personal interest in the Company’s success.
The share-based compensation expense for the years ended December 31, 2009, 2008 and 2007 was as follows (in thousands):
| 2009 | 2008 | 2007 | ||||||||||
| Stock options: | ||||||||||||
| Management Stock Incentive Plan | $ | 222 | $ | 378 | $ | 571 | ||||||
| Director Stock Incentive Plan | 46 | 40 | 220 | |||||||||
| Total stock option expense | 268 | 418 | 791 | |||||||||
| Restricted stock awards: | ||||||||||||
| Management Stock Incentive Plan | 488 | 215 | 164 | |||||||||
| Director Stock Incentive Plan | 98 | — | — | |||||||||
| Total restricted stock award expense | 586 | 215 | 164 | |||||||||
| Total share-based compensation | $ | 854 | $ | 633 | $ | 955 | ||||||
The restricted stock award expense for 2009 and 2008 included $2 thousand and $30 thousand, respectively, of dividends for unearned shares in the restricted stock plan which is accounted for as compensation expense.
The following is a summary of stock option activity for the year ended December 31, 2009 (dollars in thousands, except per share amounts):
| Weighted | ||||||||||||||||
| Weighted | Average | |||||||||||||||
| Average | Remaining | Aggregate | ||||||||||||||
| Number of | Exercise | Contractual | Intrinsic | |||||||||||||
| Options | Price | Term | Value | |||||||||||||
| Outstanding at beginning of year | 582,885 | $ | 19.14 | |||||||||||||
| Granted | — | — | ||||||||||||||
| Exercised | (1,010 | ) | 14.00 | |||||||||||||
| Forfeited | (8,500 | ) | 18.48 | |||||||||||||
| Expired | (114,641 | ) | 14.61 | |||||||||||||
| Outstanding at end of year | 458,734 | 20.30 | 5.25 years | $ | — | |||||||||||
| Exercisable at end of year | 369,004 | 20.76 | 4.64 years | $ | — | |||||||||||
- 89 -
Table of Contents
FINANCIAL INSTITUTIONS, INC. AND SUBSIDIARIES
NOTES TO CONSOLIDATED FINANCIAL STATEMENTS
December 31, 2009, 2008 and 2007
NOTES TO CONSOLIDATED FINANCIAL STATEMENTS
December 31, 2009, 2008 and 2007
(13.) SHARE-BASED COMPENSATION (Continued)
As of December 31, 2009, there was $196 thousand of unrecognized compensation expense related to unvested stock options that is expected to be recognized over a weighted average period of 1.59 years.
The aggregate intrinsic value (the amount by which the market price of the stock on the date of exercise exceeded the market price of the stock on the date of grant) of option exercises for the years ended December 31, 2009, 2008 and 2007 was $1 thousand, $10 thousand, and $52 thousand, respectively. The total cash received as a result of option exercises under stock compensation plans for the years ended December 31, 2009, 2008 and 2007 was $14 thousand, $32 thousand, and $251 thousand, respectively. The tax benefits realized in connection with these stock option exercises were not significant.
The Company uses the Black-Scholes valuation method to estimate the fair value of its stock option awards. This method is dependent on certain assumption. There were no stock options awarded during 2009. The following is a summary of the stock options granted as well as the weighted average assumptions used to compute the fair value of the options for the periods ended December 31, 2008 and 2007:
| 2008 | 2007 | |||||||
| Options granted | 61,100 | 90,700 | ||||||
| Grant date weighted average fair value per share | $ | 5.09 | $ | 7.09 | ||||
| Grant date weighted average share price | $ | 16.98 | $ | 19.49 | ||||
| Risk-free interest rate | 3.40 | % | 4.76 | % | ||||
| Expected dividend yield | 3.48 | % | 2.21 | % | ||||
| Expected stock price volatility | 38.60 | % | 39.36 | % | ||||
| Expected life (in years) | 6.19 | 5.94 | ||||||
In the table above the risk-free interest rate is the U.S. Treasury rate commensurate with the expected life of option on the date of their grant. The expected stock price volatility is based upon historical activity of the Company’s stock over a span of time equal to the expected life of the options. The expected life for options granted is based upon based on historical experience for the Plans.
The following is a summary of restricted stock award activity for the year ended December 31, 2009:
| Weighted | ||||||||
| Average | ||||||||
| Market | ||||||||
| Number of | Price at | |||||||
| Shares | Grant Date | |||||||
| Outstanding at beginning of year | 81,800 | $ | 19.35 | |||||
| Granted | 58,472 | 13.33 | ||||||
| Vested | (17,200 | ) | 18.61 | |||||
| Forfeited | (45,300 | ) | 19.23 | |||||
| Outstanding at end of year | 77,772 | $ | 15.05 | |||||
As of December 31, 2009, there was $399 thousand of unrecognized compensation expense related to unvested restricted stock awards that is expected to be recognized over a weighted average period of 1.36 years.
- 90 -
Table of Contents
FINANCIAL INSTITUTIONS, INC. AND SUBSIDIARIES
NOTES TO CONSOLIDATED FINANCIAL STATEMENTS
December 31, 2009, 2008 and 2007
NOTES TO CONSOLIDATED FINANCIAL STATEMENTS
December 31, 2009, 2008 and 2007
(14.) INCOME TAXES
Total income tax expense (benefit) was allocated as follows for the years ended December 31 (in thousands):
| 2009 | 2008 | 2007 | ||||||||||
| Income tax expense (benefit) | $ | 6,140 | $ | (21,301 | ) | $ | 4,800 | |||||
| Shareholder’s equity | 197 | (2,955 | ) | 5,783 | ||||||||
The income tax provision (benefit) for the years ended December 31, 2009, 2008 and 2007 consisted of the following (in thousands):
| 2009 | 2008 | 2007 | ||||||||||
| Current tax (benefit) expense: | ||||||||||||
| Federal | $ | (1,355 | ) | $ | 2,043 | $ | 3,572 | |||||
| State | 25 | 504 | 513 | |||||||||
| Total current tax (benefit) expense | (1,330 | ) | 2,547 | 4,085 | ||||||||
| Deferred tax expense (benefit): | ||||||||||||
| Federal | 6,189 | (19,640 | ) | 126 | ||||||||
| State | 1,281 | (4,208 | ) | 589 | ||||||||
| Total deferred tax expense (benefit) | 7,470 | (23,848 | ) | 715 | ||||||||
| Total income tax expense (benefit): | $ | 6,140 | $ | (21,301 | ) | $ | 4,800 | |||||
Income tax expense (benefit) differed from the statutory federal income tax rate as follows:
| 2009 | 2008 | 2007 | ||||||||||
| Statutory federal tax rate | 34.0 | % | (34.0 | )% | 34.0 | % | ||||||
| Increase (decrease) resulting from: | ||||||||||||
| Tax exempt interest income | (8.6 | ) | (5.2 | ) | (13.6 | ) | ||||||
| Non-taxable earnings on company owned life insurance | (1.8 | ) | (0.4 | ) | (2.0 | ) | ||||||
| Dividend received deduction | (0.1 | ) | (0.8 | ) | (1.5 | ) | ||||||
| State taxes, net of federal tax benefit | 4.2 | (5.2 | ) | 3.4 | ||||||||
| Nondeductible expenses | 1.0 | 0.2 | 0.4 | |||||||||
| Disallowed interest expense | 0.5 | 0.5 | 1.8 | |||||||||
| Other, net | 0.6 | — | 0.1 | |||||||||
| Effective tax rate | 29.8 | % | (44.9 | )% | 22.6 | % | ||||||
- 91 -
Table of Contents
FINANCIAL INSTITUTIONS, INC. AND SUBSIDIARIES
NOTES TO CONSOLIDATED FINANCIAL STATEMENTS
December 31, 2009, 2008 and 2007
NOTES TO CONSOLIDATED FINANCIAL STATEMENTS
December 31, 2009, 2008 and 2007
| (14.) | INCOME TAXES (Continued) |
The Company’s net deferred tax asset is included in other assets in the Consolidated Statements of Condition. The tax effects of temporary differences that give rise to the deferred tax assets and deferred tax liabilities at December 31, 2009 and 2008 are as follows (in thousands):
| 2009 | 2008 | |||||||
| Deferred tax assets: | ||||||||
| Other than temporary impairment of investment securities | $ | 14,827 | $ | 26,389 | ||||
| Allowance for loan losses | 7,418 | 6,619 | ||||||
| Tax attribute carryforward benefits | 5,559 | 2,689 | ||||||
| Share-based compensation | 1,033 | 794 | ||||||
| Interest on non-accruing loans | 788 | 595 | ||||||
| Core deposit intangible | 258 | 332 | ||||||
| Accrued pension costs | 92 | 2,494 | ||||||
| Other | 580 | 374 | ||||||
| Gross deferred tax assets | 30,555 | 40,286 | ||||||
| Deferred tax liabilities: | ||||||||
| Deferred loan origination costs | 3,290 | 4,458 | ||||||
| Net unrealized gain on securities available for sale | 1,044 | 2,185 | ||||||
| Depreciation and amortization | 1,283 | 1,342 | ||||||
| Loan servicing assets | 522 | 218 | ||||||
| Other | 1 | 2 | ||||||
| Gross deferred tax liabilities | 6,140 | 8,205 | ||||||
| Net deferred tax asset | $ | 24,415 | $ | 32,081 | ||||
The Company recognizes deferred income taxes for the estimated future tax effects of differences between the tax and financial statement bases of assets and liabilities considering enacted tax laws. These differences result in deferred tax assets and liabilities, which are included in other assets in the Company’s consolidated statements of condition. The Company also assesses the likelihood that deferred tax assets will be realizable based on, among other considerations, future taxable income and establishes, if necessary, a valuation allowance for those deferred tax assets determined to not likely be realizable. A deferred tax asset valuation allowance is recognized if, based on the weight of available evidence (both positive and negative), it is more likely than not that some portion or all of the deferred tax assets will not be realized. The future realization of deferred tax benefits depends upon the existence of sufficient taxable income within the carry-back and carry-forward periods. Management judgment is required in determining the appropriate recognition of deferred tax assets and liabilities, including projections of future taxable income.
Based upon the Company’s historical and projected future levels of pre-tax and taxable income, the scheduled reversals of taxable temporary differences to offset future deductible amounts, and prudent and feasible tax planning strategies, management believes it is more likely than not that the deferred tax assets will be realized. As such, no valuation allowance has been recorded as of December 31, 2009 or 2008.
The Company and its subsidiaries are subject to federal and New York State (“NYS”) income taxes. The federal income tax years currently open for audit are 2007 through 2009. The NYS income tax years currently open for audit are 2006 through 2009.
At December 31, 2009, the Company has federal and NYS net operating loss carryforwards of approximately $58 thousand and $7.9 million, respectively. The federal and NYS net operating loss carryforwards begin to expire in 2021. The Company also has federal and NYS tax credits of approximately $5.2 million and $53 thousand, respectively, which have an unlimited carryforward period. The federal and NYS net operating loss carryforwards are subject to annual limitations imposed by the Internal Revenue Code (“IRC”). The Company believes the limitations will not prevent the carryforward benefits from being utilized.
The Company’s unrecognized tax benefits and changes in unrecognized tax benefits were not significant as of or for the years ended December 31, 2009 and 2008. There were no interest or penalties recorded in the income statement in income tax expense for the year ended December 31, 2009. As of December 31, 2009, there were no amounts accrued for interest or penalties related to uncertain tax positions.
- 92 -
Table of Contents
FINANCIAL INSTITUTIONS, INC. AND SUBSIDIARIES
NOTES TO CONSOLIDATED FINANCIAL STATEMENTS
December 31, 2009, 2008 and 2007
NOTES TO CONSOLIDATED FINANCIAL STATEMENTS
December 31, 2009, 2008 and 2007
(15.) EARNINGS (LOSS) PER SHARE
The following table presents a reconciliation of the earnings and shares used in calculating basic and diluted EPS for each of the years ended December 31, 2009, 2008 and 2007 (in thousands, except per share amounts).
| 2009 | 2008 | 2007 | ||||||||||
| Net income (loss) allocated to common shareholders | $ | 10,744 | $ | (27,696 | ) | $ | 14,926 | |||||
| Less: Earnings (loss) allocated to participating securities | 87 | (230 | ) | — | ||||||||
| Earnings (loss) allocated to common shares outstanding | $ | 10,657 | $ | (27,466 | ) | $ | 14,926 | |||||
| Weighted average common shares used to calculate basic EPS | 10,730 | 10,818 | 11,154 | |||||||||
| Add: Effect of common stock equivalents | 39 | — | 30 | |||||||||
| Weighted average common shares used to calculate diluted EPS | 10,769 | 10,818 | 11,184 | |||||||||
| Earnings (loss) per common share: | ||||||||||||
| Basic | $ | 0.99 | $ | (2.54 | ) | $ | 1.34 | |||||
| Diluted | $ | 0.99 | $ | (2.54 | ) | $ | 1.33 | |||||
| Shares subject to the following securities, outstanding as of December 31 of the respective year, were excluded from the computation of diluted EPS because the effect would be antidilutive: | ||||||||||||
| Stock options | 459 | 583 | 381 | |||||||||
| Restricted stock awards | — | 82 | 30 | |||||||||
| Warrant | 378 | 378 | — | |||||||||
| 837 | 1,043 | 411 | ||||||||||
(16.) EMPLOYEE BENEFIT PLANS
Defined Benefit Pension Plan
The Company participates in The New York State Bankers Retirement System (the “Plan”), which is a defined benefit pension plan covering substantially all employees, subject to the limitations related to the plan closure effective December 31, 2006. The benefits are based on years of service and the employee’s highest average compensation during five consecutive years of employment. The defined benefit plan was closed to new participants effective December 31, 2006. Only employees hired on or before December 31, 2006 and who met participation requirements on or before January 1, 2008 are eligible to receive benefits.
The following table provides a reconciliation of the changes in the plan’s benefit obligations, fair value of assets and a statement of the funded status at their respective measurement dates (in thousands):
| December 31, | December 31, | |||||||
| 2009 | 2008(a) | |||||||
| Change in projected benefit obligation: | ||||||||
| Projected benefit obligation at beginning of period | $ | (30,878 | ) | $ | (25,102 | ) | ||
| Service cost | (1,689 | ) | (1,820 | ) | ||||
| Interest cost | (1,826 | ) | (1,953 | ) | ||||
| Actuarial loss | (489 | ) | (3,767 | ) | ||||
| Benefits paid and plan expenses | 1,441 | 1,764 | ||||||
| Projected benefit obligation at end of period | (33,441 | ) | (30,878 | ) | ||||
| Change in plan assets: | ||||||||
| Fair value of plan assets at beginning of period | 24,431 | 28,431 | ||||||
| Actual return (loss) on plan assets | 5,132 | (7,436 | ) | |||||
| Employer contributions | 5,081 | 5,200 | ||||||
| Benefits paid and plan expenses | (1,441 | ) | (1,764 | ) | ||||
| Fair value of plan assets as of end of period | 33,203 | 24,431 | ||||||
| Unfunded status at end of period | $ | (238 | ) | $ | (6,447 | ) | ||
| (a) | Beginning in 2008, the plan’s measurement date was changed from September 30 to December 31. As a result, the 2008 period includes the 15 months of activity from September 30, 2007 through December 31, 2008. |
- 93 -
Table of Contents
FINANCIAL INSTITUTIONS, INC. AND SUBSIDIARIES
NOTES TO CONSOLIDATED FINANCIAL STATEMENTS
December 31, 2009, 2008 and 2007
NOTES TO CONSOLIDATED FINANCIAL STATEMENTS
December 31, 2009, 2008 and 2007
(16.) EMPLOYEE BENEFIT PLANS (Continued)
The accumulated benefit obligation was $29.5 million and $27.1 million at December 31, 2009 and 2008, respectively.
The Company’s funding policy is to contribute, at a minimum, an actuarially determined amount that will satisfy the minimum funding requirements determined under the appropriate sections of Internal Revenue Code. The Company satisfied the minimum required contribution to its pension plan of $1.5 million for the 2010 fiscal year prior to December 31, 2009.
Estimated benefit payments under the pension plan over the next ten years at December 31, 2009 are as follows (in thousands):
| 2010 | $ | 1,264 | ||
| 2011 | 1,357 | |||
| 2012 | 1,465 | |||
| 2013 | 1,538 | |||
| 2014 | 1,657 | |||
| 2015 – 2019 | 10,886 |
Net periodic pension cost consists of the following components for the years ended December 31 (in thousands):
| 2009 | 2008 | 2007 | ||||||||||
| Service cost | $ | 1,689 | $ | 1,456 | $ | 1,498 | ||||||
| Interest cost on projected benefit obligation | 1,826 | 1,562 | 1,473 | |||||||||
| Expected return on plan assets | (1,848 | ) | (2,094 | ) | (1,907 | ) | ||||||
| Amortization of unrecognized loss | 728 | — | 31 | |||||||||
| Amortization of unrecognized prior service cost | 11 | 11 | 11 | |||||||||
| Net periodic pension cost | $ | 2,406 | $ | 935 | $ | 1,106 | ||||||
The actuarial assumptions used to determine the net periodic pension cost were as follows:
| 2009 | 2008 | 2007 | ||||||||||
| Weighted average discount rate | 6.03 | % | 6.35 | % | 5.82 | % | ||||||
| Rate of compensation increase | 3.50 | % | 3.50 | % | 3.50 | % | ||||||
| Expected long-term rate of return | 7.50 | % | 7.50 | % | 7.50 | % | ||||||
| The actuarial assumptions used to determine the projected benefit obligation were as follows: | ||||||||||||
| 2009 | 2008 | 2007 | ||||||||||
| Weighted average discount rate | 5.89 | % | 6.03 | % | 6.35 | % | ||||||
| Rate of compensation increase | 3.50 | % | 3.50 | % | 3.50 | % | ||||||
The weighted average discount rate was based upon the projected benefit cash flows and the market yields of high grade corporate bonds that are available to pay such cash flows.
- 94 -
Table of Contents
FINANCIAL INSTITUTIONS, INC. AND SUBSIDIARIES
NOTES TO CONSOLIDATED FINANCIAL STATEMENTS
December 31, 2009, 2008 and 2007
NOTES TO CONSOLIDATED FINANCIAL STATEMENTS
December 31, 2009, 2008 and 2007
(16.) EMPLOYEE BENEFIT PLANS (Continued)
The weighted average expected long-term rate of return is estimated based on current trends in Plan’s assets as well as projected future rates of return on those assets and reasonable actuarial assumptions based on the guidance provided by Actuarial Standard of Practice No. 27, “Selection of Economic Assumptions for Measuring Pension Obligations”, for long term inflation, and the real and nominal rate of investment return for a specific mix of asset classes. The following assumptions were used in determining the long-term rate of return:
| Equity securities | Dividend discount model, the smoothed earnings yield model and the equity risk premium model | |
| Fixed income securities | Current yield-to-maturity and forecasts of future yields | |
| Other financial instruments | Comparison of the specific investment’s risk to that of fixed income and equity instruments and using judgment |
The long term rate of return considers historical returns. Adjustments were made to historical returns in order to reflect expectations of future returns. These adjustments were due to factor forecasts by economists and long-term U.S. Treasury yields to forecast long-term inflation. In addition forecasts by economists and others for long-term GDP growth were factored into the development of assumptions for earnings growth and per capital income. The Plan’s overall investment strategy is to achieve a mix of approximately 97% of investments for long-term growth and 3% for near-term benefit payments with a wide diversification of asset types, fund strategies, and fund managers. The target allocations for Plan assets are shown in the table below. Cash equivalents consist primarily of short term investment funds. Equity securities primarily include investments in common stock and depository receipts. Fixed income securities include corporate bonds, government issues and mortgage backed securities. Other financial instruments primarily include rights and warrants.
Effective March 2009, the Plan revised its investment guidelines. The Plan currently prohibits its investment managers from purchasing the following investments;
| Equity securities | Securities in emerging market countries as defined by the Morgan Stanley Emerging Markets Index, Short sales, Unregistered securities and Margin purchases | |
| Fixed income securities | Securities of BBB quality or less, CMOs that have an inverse floating rate and whose payments don’t include principal or which aren’t certified and guaranteed by the U.S. Government, ABSs that aren’t issued or guaranteed by the U.S., or its agencies or its instrumentalities, Non-agency residential subprime or ALT-A MBSs and Structured Notes | |
| Other financial instruments | Unhedged currency exposure in countries not defined as “high income economies” by the World Bank |
All other investments not prohibited by the Plan are permitted. At December 31, 2009 the Plan holds certain investments which are no longer deemed acceptable to acquire. These positions will be liquidated when the investment managers deem that such liquidation is in the best interest of the Plan.
| Weighted | ||||||||||||||||
| Average | ||||||||||||||||
| Target | Percentage of Plan Assets | Expected | ||||||||||||||
| Allocation | at December 31, | Long-term | ||||||||||||||
| 2010 | 2009 | 2008 | Rate of Return | |||||||||||||
| Asset category: | ||||||||||||||||
| Cash equivalents | 0 – 20 | % | 13.6 | % | 10.0 | % | — | |||||||||
| Equity securities | 40 – 60 | 45.9 | 48.0 | 4.60 | % | |||||||||||
| Fixed income securities | 40 – 60 | 40.5 | 41.4 | 2.10 | ||||||||||||
| Other financial instruments | 0 – 5 | — | 0.6 | — | ||||||||||||
- 95 -
Table of Contents
FINANCIAL INSTITUTIONS, INC. AND SUBSIDIARIES
NOTES TO CONSOLIDATED FINANCIAL STATEMENTS
December 31, 2009, 2008 and 2007
NOTES TO CONSOLIDATED FINANCIAL STATEMENTS
December 31, 2009, 2008 and 2007
(16.) EMPLOYEE BENEFIT PLANS (Continued)
In accordance with ASC 820, the following table (rounded to the nearest thousands) represents the Plan’s fair value hierarchy for its financial assets (investments) measured at fair value on a recurring basis as of December 31, 2009 (in thousands):
| Level 1 | Level 2 | Level 3 | Total | |||||||||||||
| Inputs | Inputs | Inputs | Fair Value | |||||||||||||
| Cash equivalents: | ||||||||||||||||
| Short term investment funds | $ | — | $ | 4,197 | $ | — | $ | 4,197 | ||||||||
| Equity securities: | ||||||||||||||||
| Common stock | 15,016 | — | — | 15,016 | ||||||||||||
| Depository receipts | 210 | — | — | 210 | ||||||||||||
| Other equities | 166 | — | — | 166 | ||||||||||||
| Total equities | 15,392 | — | — | 15,392 | ||||||||||||
| Fixed income securities: | ||||||||||||||||
| Corporate bonds | — | 3,200 | — | 3,200 | ||||||||||||
| Government issues | — | 5,590 | — | 5,590 | ||||||||||||
| Collateralized mortgage obligations | — | 813 | — | 813 | ||||||||||||
| FHLMC | — | 1,359 | — | 1,359 | ||||||||||||
| FNMA | — | 2,094 | — | 2,094 | ||||||||||||
| GNMA I | — | 369 | — | 369 | ||||||||||||
| Other fixed income securities | — | 189 | — | 189 | ||||||||||||
| Total fixed income securities | — | 13,614 | — | 13,614 | ||||||||||||
| Total Plan investments | $ | 15,392 | $ | 17,811 | $ | — | $ | 33,203 | ||||||||
The following is a reconciliation of Level 3 assets for which significant unobservable inputs were used to determine fair value (in thousands):
| Balance at beginning of year | $ | 132 | ||
| Change in unrealized appreciation (depreciation) | 54 | |||
| Realized loss | (58 | ) | ||
| Sale proceeds | (128 | ) | ||
| Balance at end of year | $ | — | ||
Postretirement Benefit Plan
Prior to December 31, 2001, an entity acquired by the Company provided health and dental care benefits to retired employees who met specified age and service requirements through a postretirement health and dental care plan in which both the acquired entity and the retirees shared the cost. The plan provided for substantially the same medical insurance coverage as for active employees until their death and was integrated with Medicare for those retirees aged 65 or older. In 2001, the plan’s eligibility requirements were amended to curtail eligible benefit payments to only retired employees and active participants who were fully vested under the Plan. In 2003, retirees under age 65 began contributing to health coverage at the same cost-sharing level as that of active employees. The retirees aged 65 or older were offered new Medicare supplemental plans as alternatives to the plan historically offered. The cost sharing of medical coverage was standardized throughout the group of retirees aged 65 or older. In addition, to be consistent with the administration of the Company’s dental plan for active employees, all retirees who continued dental coverage began paying the full monthly premium. The accrued liability included in other liabilities in the consolidated statements of financial condition related to this plan amounted to $155 thousand and $144 thousand as of December 31, 2009 and 2008, respectively. The postretirement expense for the plan that was included in salaries and employee benefits in the consolidated statements of operations was not significant for the years ended December 31, 2009, 2008 and 2007. The plan is not funded.
- 96 -
Table of Contents
FINANCIAL INSTITUTIONS, INC. AND SUBSIDIARIES
NOTES TO CONSOLIDATED FINANCIAL STATEMENTS
December 31, 2009, 2008 and 2007
NOTES TO CONSOLIDATED FINANCIAL STATEMENTS
December 31, 2009, 2008 and 2007
(16.) EMPLOYEE BENEFIT PLANS (Continued)
The components of accumulated other comprehensive loss related to the defined benefit plan and postretirement benefit plan, on a pre-tax basis at December 31, are summarized below (in thousands):
| 2009 | 2008 | |||||||
Defined benefit plan: | ||||||||
| Net actuarial loss | $ | (9,056 | ) | $ | (12,579 | ) | ||
| Prior service cost | (143 | ) | (155 | ) | ||||
| (9,199 | ) | (12,734 | ) | |||||
Postretirement benefit plan: | ||||||||
| Net actuarial loss | (248 | ) | (238 | ) | ||||
| Prior service credit | 710 | 778 | ||||||
| 462 | 540 | |||||||
| Total recognized in accumulated other comprehensive loss | $ | (8,737 | ) | $ | (12,194 | ) | ||
Changes in plan assets and benefit obligations recognized in other comprehensive income (loss) on a pre-tax basis during the years ended December 31 are as follows (in thousands):
| 2009 | 2008 | |||||||
Defined benefit plan: | ||||||||
| Net actuarial gain (loss) | $ | 2,795 | $ | (14,097 | ) | |||
| Amortization of net loss | 728 | — | ||||||
| Amortization of prior service cost | 12 | 14 | ||||||
| 3,535 | (14,083 | ) | ||||||
Postretirement benefit plan: | ||||||||
| Net actuarial gain (loss) | (10 | ) | 70 | |||||
| Amortization of prior service credit | (68 | ) | (85 | ) | ||||
| (78 | ) | (15 | ) | |||||
| Total recognized in other comprehensive income (loss) | $ | 3,457 | $ | (14,098 | ) | |||
For the year ending December 31, 2010, the estimated net loss and prior service cost for the plan that will be amortized from accumulated other comprehensive income into net periodic benefit cost is $458 thousand and $12 thousand, respectively.
Defined Contribution Plan
Employees that meet certain age and service requirements are eligible to participate in the Company sponsored 401(k) plan. Under the plan, participants may make contributions, in the form of salary deferrals, up to the maximum Internal Revenue Code limit. The Company matches a participant’s contributions up to 4.5% of compensation, calculated as 100% of the first 3% of compensation and 50% of the next 3% of compensation deferred by the participant. The Company may also make additional discretionary matching contributions, although no such additional discretionary contributions were made in 2009, 2008 or 2007. The expense included in salaries and employee benefits in the consolidated statements of operations for this plan amounted to $914 thousand, $993 thousand and $869 thousand in 2009, 2008 and 2007, respectively.
Supplemental Executive Retirement Plans
The Company maintains a non-qualified supplemental executive retirement plan (“SERP”) for one current and one former executive. The Company has accrued a liability, all of which is unfunded, of $957 thousand as of December 31, 2009. The Company recorded expense of $648 thousand and $309 thousand in connection with these SERPs during the years ended December 31, 2009 and 2008, respectively. There were no amounts recorded for these SERPs prior to 2008.
- 97 -
Table of Contents
FINANCIAL INSTITUTIONS, INC. AND SUBSIDIARIES
NOTES TO CONSOLIDATED FINANCIAL STATEMENTS
December 31, 2009, 2008 and 2007
NOTES TO CONSOLIDATED FINANCIAL STATEMENTS
December 31, 2009, 2008 and 2007
(17.) FAIR VALUE MEASUREMENTS
Determination of Fair Value — Assets Measured at Fair Value on a Recurring and Nonrecurring Basis
Valuation Hierarchy
The fair value of an asset or liability is the price that would be received to sell that asset or paid to transfer that liability in an orderly transaction occurring in the principal market (or most advantageous market in the absence of a principal market) for such asset or liability. ASC Topic 820, “Fair Value Measurements and Disclosures,” establishes a fair value hierarchy for valuation inputs that gives the highest priority to quoted prices in active markets for identical assets or liabilities and the lowest priority to unobservable inputs. The fair value hierarchy is as follows:
| • | Level 1— Unadjusted quoted prices in active markets for identical assets or liabilities that the reporting entity has the ability to access at the measurement date. |
| • | Level 2— Inputs other than quoted prices included in Level 1 that are observable for the asset or liability, either directly or indirectly. These might include quoted prices for similar assets or liabilities in active markets, quoted prices for identical or similar assets or liabilities in markets that are not active, inputs other than quoted prices that are observable for the asset or liability (such as interest rates, volatilities, prepayment speeds, credit risks, etc.) or inputs that are derived principally from or corroborated by market data by correlation or other means. |
| • | Level 3— Unobservable inputs for determining the fair values of assets or liabilities that reflect an entity’s own assumptions about the assumptions that market participants would use in pricing the assets or liabilities. |
In general, fair value is based upon quoted market prices, where available. If such quoted market prices are not available, fair value is based upon internally developed models that primarily use, as inputs, observable market-based parameters. Valuation adjustments may be made to ensure that financial instruments are recorded at fair value. These adjustments may include amounts to reflect counterparty credit quality and the company’s creditworthiness, among other things, as well as unobservable parameters. Any such valuation adjustments are applied consistently over time. The Company’s valuation methodologies may produce a fair value calculation that may not be indicative of net realizable value or reflective of future fair values. While management believes the Company’s valuation methodologies are appropriate and consistent with other market participants, the use of different methodologies or assumptions to determine the fair value of certain financial instruments could result in a different estimate of fair value at the reporting date. Furthermore, the reported fair value amounts have not been comprehensively revalued since the presentation dates, and therefore, estimates of fair value after the balance sheet date may differ significantly from the amounts presented herein. A more detailed description of the valuation methodologies used for assets and liabilities measured at fair value, as well as the general classification of such instruments pursuant to the valuation hierarchy, is set forth below.
Investment Securities.Publicly traded equity securities (stocks) are reported at fair value utilizing Level 1 inputs. Pooled trust preferred securities are reported at fair value utilizing Level 3 inputs. Fair values for these securities are determined through the use of internal valuation methodologies appropriate for the specific asset, which may include the use of a discounted expected cash flow analysis or the use of broker quotes. Other securities classified as available for sale are reported at fair value utilizing Level 2 inputs. For these securities, the Company obtains fair value measurements from an independent pricing service. The fair value measurements consider observable data that may include dealer quotes, market spreads, cash flows, the U.S. Treasury yield curve, live trading levels, trade execution data, market consensus prepayment speeds, credit information and the bond’s terms and conditions, among other things.
- 98 -
Table of Contents
FINANCIAL INSTITUTIONS, INC. AND SUBSIDIARIES
NOTES TO CONSOLIDATED FINANCIAL STATEMENTS
December 31, 2009, 2008 and 2007
NOTES TO CONSOLIDATED FINANCIAL STATEMENTS
December 31, 2009, 2008 and 2007
(17.) FAIR VALUE MEASUREMENTS (Continued)
Assets Measured at Fair Value on a Recurring Basis
Assets measured and recorded at fair value on a recurring basis as of December 31, 2009 and 2008 were as follows (in thousands):
| Level 1 | Level 2 | Level 3 | Total | |||||||||||||
| Inputs | Inputs | Inputs | Fair Value | |||||||||||||
December 31, 2009: | ||||||||||||||||
| Securities available for sale: | ||||||||||||||||
| U.S. Government agencies and government sponsored enterprises | $ | — | $ | 134,105 | $ | — | $ | 134,105 | ||||||||
| State and political subdivisions | — | 83,659 | — | 83,659 | ||||||||||||
| Mortgage-backed securities | — | 361,515 | — | 361,515 | ||||||||||||
| Asset-backed securities: | ||||||||||||||||
| Trust preferred securities | — | — | 1,015 | 1,015 | ||||||||||||
| Other | — | 207 | — | 207 | ||||||||||||
| $ | — | $ | 579,486 | $ | 1,015 | $ | 580,501 | |||||||||
December 31, 2008: | ||||||||||||||||
| Securities available for sale: | ||||||||||||||||
| U.S. Government agencies and government sponsored enterprises | $ | — | $ | 68,173 | $ | — | $ | 68,173 | ||||||||
| State and political subdivisions | — | 131,711 | — | 131,711 | ||||||||||||
| Mortgage-backed securities | — | 342,552 | — | 342,552 | ||||||||||||
| Asset-backed securities: | ||||||||||||||||
| Trust preferred securities | — | — | 3,772 | 3,772 | ||||||||||||
| Other | — | 146 | — | 146 | ||||||||||||
| Equity securities | 624 | 528 | — | 1,152 | ||||||||||||
| $ | 624 | $ | 543,110 | $ | 3,772 | $ | 547,506 | |||||||||
Changes in Level 3 Fair Value Measurements
The reconciliation for all assets measured at fair value on a recurring basis using significant unobservable inputs (Level 3) for the years ended December 31, 2009 and 2008, is as follows (in thousands):
| 2009 | 2008 | |||||||
| Securities available for sale (Level 3), beginning of year | $ | 3,772 | $ | — | ||||
| Transfers into Level 3 | — | 33,307 | ||||||
| Capitalized interest | 296 | — | ||||||
| Principal paydowns and amortization of premiums | (9 | ) | (106 | ) | ||||
| Coupon payments applied to principal | (273 | ) | — | |||||
| Total losses (realized/unrealized): | ||||||||
| Included in earnings | (2,263 | ) | (29,429 | ) | ||||
| Included in other comprehensive income | (508 | ) | — | |||||
| Securities available for sale (Level 3), end of year | $ | 1,015 | $ | 3,772 | ||||
- 99 -
Table of Contents
FINANCIAL INSTITUTIONS, INC. AND SUBSIDIARIES
NOTES TO CONSOLIDATED FINANCIAL STATEMENTS
December 31, 2009, 2008 and 2007
NOTES TO CONSOLIDATED FINANCIAL STATEMENTS
December 31, 2009, 2008 and 2007
(17.) FAIR VALUE MEASUREMENTS (Continued)
Financial Assets and Liabilities Measured at Fair Value on a Nonrecurring Basis
Certain financial assets and financial liabilities are measured at fair value on a nonrecurring basis; that is, the instruments are not measured at fair value on an ongoing basis but are subject to fair value adjustments in certain circumstances (for example, when there is evidence of impairment). Examples of these nonrecurring uses of fair value include: loans held for sale, mortgage servicing assets and collateral dependent impaired loans. As of December 31, 2009, the Company had no liabilities measured at fair value on a nonrecurring basis.
Loans held for sale are carried at the lower of cost or fair value. As of December 31, 2009, loans held for sale were reduced to their fair value of $421 thousand by a $4 thousand increase in their valuation allowance. Fair value is based on observable market rates for comparable loan products which is considered a level 2 fair value measurement.
Mortgage servicing rights (“MSR”) are carried at the lower of cost or fair value. Due primarily to a decline in the estimated prepayment speed of the Company’s sold loan portfolio with servicing retained the fair value of the Company’s MSR increased during 2009. As a result of this increase, the Company reduced its corresponding valuation allowance by $177 thousand during the year ended December 31, 2009. A valuation allowance of $185 thousand existed as of December 31, 2009. The mortgage servicing rights are a Level 3 fair value measurement, as fair value is determined by calculating the present value of the future servicing cash flows from the underlying mortgage loans.
Certain impaired loans were remeasured and reported at fair value through a specific valuation allowance allocation of the allowance for loan losses based upon the fair value of the underlying collateral. Impaired loans with a carrying value of $1.9 million were reduced by specific valuation allowance allocations totaling $854 thousand to a total reported fair value of $1.1 million. The collateral dependent impaired loans are a Level 2 fair measurement, as fair value is determined based upon estimates of the fair value of the collateral underlying the impaired loans typically using appraisals of comparable property or valuation guides.
Nonfinancial Assets and Nonfinancial Liabilities
Certain nonfinancial assets measured at fair value on a non-recurring basis include nonfinancial assets and nonfinancial liabilities measured at fair value in the second step of a goodwill impairment test, and intangible assets and other nonfinancial long-lived assets measured at fair value for impairment assessment. There were no nonfinancial assets or nonfinancial liabilities measured at fair value during the year ended December 31, 2009.
Fair Value of Financial Instruments
The Fair Value of Financial Instruments Subsection of the ASC requires disclosure of the fair value of financial assets and financial liabilities, including those financial assets and financial liabilities that are not measured and reported at fair value on a recurring basis or non-recurring basis.
The following discussion describes the valuation methodologies used for assets and liabilities measured or disclosed at fair value. The techniques utilized in estimating the fair values of financial instruments are reliant on the assumptions used, including discount rates and estimates of the amount and timing of future cash flows. Care should be exercised in deriving conclusions about our business, its value or financial position based on the fair value information of financial instruments presented below.
Fair value estimates are made at a specific point in time, based on available market information and judgments about the financial instrument, including estimates of timing, amount of expected future cash flows and the credit standing of the issuer. Such estimates do not consider the tax impact of the realization of unrealized gains or losses. In some cases, the fair value estimates cannot be substantiated by comparison to independent markets. In addition, the disclosed fair value may not be realized in the immediate settlement of the financial instrument.
- 100 -
Table of Contents
FINANCIAL INSTITUTIONS, INC. AND SUBSIDIARIES
NOTES TO CONSOLIDATED FINANCIAL STATEMENTS
December 31, 2009, 2008 and 2007
NOTES TO CONSOLIDATED FINANCIAL STATEMENTS
December 31, 2009, 2008 and 2007
(17.) FAIR VALUE MEASUREMENTS (Continued)
The estimated fair value approximates carrying value for cash and cash equivalents, FHLB and FRB stock, company owned life insurance, accrued interest receivable, short-term borrowings and accrued interest payable. Fair value estimates for other financial instruments are discussed below.
Loans held for sale.The fair value is based on estimates, quoted market prices and investor commitments.
Loans.For variable rate loans that re-price frequently, fair value approximates carrying amount. The fair value for fixed rate loans is estimated through discounted cash flow analysis using interest rates currently being offered on loans with similar terms and credit quality. For criticized and classified loans, fair value is estimated by discounting expected cash flows at a rate commensurate with the risk associated with the estimated cash flows, or estimates of fair value discounts based on observable market information.
Deposits.The fair values for demand accounts, money market and savings deposits are equal to their carrying amounts. The fair values of certificates of deposit are estimated using a discounted cash flow approach that applies prevailing market interest rates for similar maturity instruments.
Long-term borrowings (excluding junior subordinated debentures).The fair value for long-term borrowings is estimated using a discounted cash flow approach that applies prevailing market interest rates for similar maturity instruments.
Junior subordinated debentures.The fair value for the junior subordinated debentures is estimated using a discounted cash flow approach that applies prevailing market interest rates for similar maturity instruments.
The fair value of a financial instrument is the current amount that would be exchanged between willing parties, other than in a forced liquidation. Fair value is best determined based upon quoted market prices. However, in many instances, there are no quoted market prices for the Company’s various financial instruments. In cases where quoted market prices are not available, fair values are based on estimates using present value or other valuation techniques. Those techniques are significantly affected by the assumptions used, including the discount rate and estimates of future cash flows. Accordingly, the fair value estimates may not be realized in an immediate settlement of the instrument. The accounting guidelines exclude certain financial instruments and all non-financial instruments from its disclosure requirements. Accordingly, the aggregate fair value amounts presented at December 31, 2009 and December 31, 2008 may not necessarily represent the underlying fair value of the Company.
The carrying values and fair values of financial instruments at December 31, 2009 and 2008 are as follows (in thousands):
| December 31, 2009 | December 31, 2008 | |||||||||||||||
| Estimated | Estimated | |||||||||||||||
| Carrying | Fair | Carrying | Fair | |||||||||||||
| Amount | Value | Amount | Value | |||||||||||||
Financial assets: | ||||||||||||||||
| Cash and cash equivalents | $ | 42,959 | $ | 42,959 | $ | 55,187 | $ | 55,187 | ||||||||
| Securities available for sale | 580,501 | 580,501 | 547,506 | 547,506 | ||||||||||||
| Securities held to maturity | 39,573 | 40,629 | 58,532 | 59,147 | ||||||||||||
| Loans held for sale | 421 | 421 | 1,013 | 1,032 | ||||||||||||
| Loans | 1,243,265 | 1,290,136 | 1,102,330 | 1,169,660 | ||||||||||||
| Company owned life insurance | 24,867 | 24,867 | 23,692 | 23,692 | ||||||||||||
| Accrued interest receivable | 7,386 | 7,386 | 7,556 | 7,556 | ||||||||||||
| FHLB and FRB stock | 7,185 | 7,185 | 6,035 | 6,035 | ||||||||||||
Financial liabilities: | ||||||||||||||||
| Demand, savings and money market deposits | 1,056,604 | 1,056,604 | 985,796 | 985,796 | ||||||||||||
| Certificate of deposit | 686,351 | 692,429 | 647,467 | 654,334 | ||||||||||||
| Short-term borrowings | 59,543 | 59,543 | 23,465 | 23,465 | ||||||||||||
| Long-term borrowings (excluding junior subordinated debentures) | 30,145 | 30,886 | 30,653 | 32,005 | ||||||||||||
| Junior subordinated debentures | 16,702 | 10,741 | 16,702 | 12,232 | ||||||||||||
| Accrued interest payable | 7,576 | 7,576 | 7,041 | 7,041 | ||||||||||||
- 101 -
Table of Contents
FINANCIAL INSTITUTIONS, INC. AND SUBSIDIARIES
NOTES TO CONSOLIDATED FINANCIAL STATEMENTS
December 31, 2009, 2008 and 2007
NOTES TO CONSOLIDATED FINANCIAL STATEMENTS
December 31, 2009, 2008 and 2007
(18.) PARENT COMPANY FINANCIAL INFORMATION
The following condensed statements of condition of the Parent as of December 31, 2009 and 2008 and the related condensed statements of operations and cash flows for 2009, 2008 and 2007 should be read in conjunction with consolidated financial statements and related notes (in thousands):
| Condensed Statements of Condition | 2009 | 2008 | ||||||
| Assets: | ||||||||
| Cash and due from subsidiaries | $ | 7,727 | $ | 27,163 | ||||
| Securities available for sale, at fair value | — | 624 | ||||||
| Investment in and receivables due from subsidiaries | 203,986 | 176,780 | ||||||
| Other assets | 5,698 | 4,885 | ||||||
| Total assets | $ | 217,411 | $ | 209,452 | ||||
| Liabilities and shareholders’ equity: | ||||||||
| Junior subordinated debentures | $ | 16,702 | $ | 16,702 | ||||
| Other liabilities | 2,415 | 2,450 | ||||||
| Shareholders’ equity | 198,294 | 190,300 | ||||||
| Total liabilities and shareholders’ equity | $ | 217,411 | $ | 209,452 | ||||
| Condensed Statements of Operations | 2009 | 2008 | 2007 | |||||||||
| Dividends from subsidiaries and associated companies | $ | 5,051 | $ | 11,251 | $ | 14,151 | ||||||
| Management and service fees from subsidiaries | 603 | 418 | 631 | |||||||||
| Other income | 182 | 74 | 94 | |||||||||
| Total income | 5,836 | 11,743 | 14,876 | |||||||||
| Operating expenses | 4,436 | 4,363 | 4,684 | |||||||||
| Income before income tax benefit and equity in undistributed earnings (distributions in excess of earnings) of subsidiaries | 1,400 | 7,380 | 10,192 | |||||||||
| Income tax benefit | 1,286 | 1,499 | 1,491 | |||||||||
| Income before equity in undistributed earnings (distributions in excess of earnings) of subsidiaries | 2,686 | 8,879 | 11,683 | |||||||||
| Equity in undistributed earnings (distributions in excess of earnings) of subsidiaries | 11,755 | (35,037 | ) | 4,726 | ||||||||
| Net income (loss) | $ | 14,441 | $ | (26,158 | ) | $ | 16,409 | |||||
- 102 -
Table of Contents
FINANCIAL INSTITUTIONS, INC. AND SUBSIDIARIES
NOTES TO CONSOLIDATED FINANCIAL STATEMENTS
December 31, 2009, 2008 and 2007
NOTES TO CONSOLIDATED FINANCIAL STATEMENTS
December 31, 2009, 2008 and 2007
| (18.) | PARENT COMPANY FINANCIAL INFORMATION (Continued) |
| Condensed Statements of Cash Flows | 2009 | 2008 | 2007 | |||||||||
| Cash flows from operating activities: | ||||||||||||
| Net income (loss) | $ | 14,441 | $ | (26,158 | ) | $ | 16,409 | |||||
| Adjustments to reconcile net income (loss) to net cash provided by operating activities: | ||||||||||||
| (Equity in undistributed earnings) distributions in excess of earnings of subsidiaries | (11,755 | ) | 35,037 | (4,726 | ) | |||||||
| Depreciation and amortization | 318 | 427 | 521 | |||||||||
| Share-based compensation | 854 | 633 | 955 | |||||||||
| Decrease (increase) in other assets | 797 | (763 | ) | (242 | ) | |||||||
| (Decrease) increase in other liabilities | (230 | ) | (258 | ) | (2,421 | ) | ||||||
| Net cash provided by operating activities | 4,425 | 8,918 | 10,496 | |||||||||
| Cash flows from investing activities: | ||||||||||||
| Purchase of investment assets, net of disposals | (1,323 | ) | (99 | ) | 189 | |||||||
| Capital investment in subsidiary bank | (15,000 | ) | (20,000 | ) | — | |||||||
| Net cash (used in) provided by investing activities | (16,323 | ) | (20,099 | ) | 189 | |||||||
| Cash flows from financing activities: | ||||||||||||
| Purchase of preferred and common shares | — | (4,821 | ) | (7,245 | ) | |||||||
| Proceeds from issuance of preferred and common shares, net of issuance costs | (68 | ) | 35,602 | 105 | ||||||||
| Proceeds from issuance of common stock warrant | — | 2,025 | — | |||||||||
| Proceeds from stock options exercised | 15 | 32 | 251 | |||||||||
| Dividends paid | (7,485 | ) | (7,722 | ) | (6,199 | ) | ||||||
| Net cash (used in) provided by financing activities | (7,538 | ) | 25,116 | (13,088 | ) | |||||||
| Net (decrease) increase in cash and cash equivalents | (19,436 | ) | 13,935 | (2,403 | ) | |||||||
| Cash and cash equivalents as of beginning of year | 27,163 | 13,228 | 15,631 | |||||||||
| Cash and cash equivalents as of end of the year | $ | 7,727 | $ | 27,163 | $ | 13,228 | ||||||
- 103 -
Table of Contents
| ITEM 9. | CHANGES IN AND DISAGREEMENTS WITH ACCOUNTANTS ON ACCOUNTING AND FINANCIAL DISCLOSURE |
None.
ITEM 9A. CONTROLS AND PROCEDURES
Effectiveness of Controls and Procedures
As of the end of the period covered by this report, the Company carried out an evaluation, under the supervision and with the participation of the Company’s management, including the Company’s Chief Executive Officer and Chief Financial Officer, of the effectiveness of the design and operation of the Company’s disclosure controls and procedures pursuant to Rule 13a-15(b), as adopted by the Securities and Exchange Commission (“SEC”) under the Securities Exchange Act of 1934 (“Exchange Act”). Based upon that evaluation, the Chief Executive Officer and Chief Financial Officer concluded that the Company’s disclosure controls and procedures were effective as of the end of the period covered by this annual report.
Disclosure controls and procedures are the controls and other procedures that are designed to ensure that information required to be disclosed in the reports that the Company files or submits under the Exchange Act is recorded, processed, summarized and reported within the time periods specified in the SEC’s rules and forms. Disclosure controls and procedures include, without limitation, controls and procedures designed to ensure that information required to be disclosed in the reports that the Company files or submits under the Exchange Act is accumulated and communicated to management, including the Chief Executive Officer and Chief Financial Officer, as appropriate, to allow timely decisions regarding required disclosure.
All internal control systems, no matter how well designed, have inherent limitations. Therefore, even those systems determined effective can provide only reasonable assurance with respect to financial statement preparation and presentation.
Management Report on Internal Control over Financial Reporting and Attestation Report of Independent Registered Public Accounting Firm
Management of Financial Institutions, Inc. (the Company) is responsible for establishing and maintaining adequate internal control over financial reporting. Management assessed the Company’s internal control over financial reporting based on criteria established in Internal Control—Integrated Framework issued by the Committee of Sponsoring Organizations of the Treadway Commission (COSO). Based on this assessment, management has concluded that, as of December 31, 2009, the Company maintained effective internal control over financial reporting. Management’s Report on Internal Control over Financial Reporting is included under Item 8 “Financial Statements and Supplementary Data” in Part II of this Form 10-K.
KPMG LLP, a registered public accounting firm, has audited the consolidated financial statements included in the annual report, and has issued an attestation report on the effectiveness of the Company’s internal control over financial reporting. The Report of Independent Registered Public Accounting Firm that attests the effectiveness of internal control over financial reporting is included under Item 8 “Financial Statements and Supplementary Data” in Part II of this Form 10-K.
Changes in Internal Control over Financial Reporting
There were no changes in the Company’s internal control over financial reporting that occurred during the quarter ended December 31, 2009 that have materially affected, or are reasonably likely to materially affect, the Company’s internal control over financial reporting.
ITEM 9B. OTHER INFORMATION
Not applicable.
- 104 -
Table of Contents
PART III
ITEM 10. DIRECTORS, EXECUTIVE OFFICERS AND CORPORATE GOVERNANCE
In response to this Item, the information set forth in the Company’s Proxy Statement for its 2010 Annual Meeting of Shareholders (the “2010 Proxy Statement”) to be filed within 120 days following the end of the Company’s fiscal year, under the headings “Election of Directors and Information with Respect to Board of Directors,” and “Section 16(a) Beneficial Ownership Reporting Compliance” is incorporated herein by reference.
The information under the heading “Executive Officers of the Registrant” in Part I, Item 1 of this Form 10-K is also incorporated herein by reference.
Information concerning the Company’s Audit Committee and the Audit Committee’s financial expert is set forth under the caption “Corporate Governance Information” in the 2010 Proxy Statement and is incorporated herein by reference.
The Company has adopted a Code of Business Conduct and Ethics that applies to its principal executive officer, principal financial officer, principal accounting officer or controller, or persons performing similar functions. The Code of Business Conduct and Ethics is posted on the Company’s internet website at www.fiiwarsaw.com. In addition, the Company will provide a copy of the Code of Business Conduct and Ethics to anyone, without charge, upon request addressed to Director of Human Resources at Financial Institutions, Inc., 220 Liberty Street, Warsaw, NY 14569. The Company intends to disclose any amendment to, or waiver from, a provision of its Code of Business Conduct and Ethics that applies to the Company’s principal executive officer, principal financial officer, principal accounting officer or controller, or persons performing similar functions, and that relates to any element of the Code of Business Conduct and Ethics, by posting such information on the Company’s website.
ITEM 11. EXECUTIVE COMPENSATION
In response to this Item, the information set forth in the 2010 Proxy Statement under the heading “Executive Compensation” is incorporated herein by reference.
| ITEM 12. | SECURITY OWNERSHIP OF CERTAIN BENEFICIAL OWNERS AND MANAGEMENT AND RELATED STOCKHOLDER MATTERS |
In response to this Item, the information set forth in the 2010 Proxy Statement under the heading “Stock Ownership” is incorporated herein by reference. The information under the heading “Equity Compensation Plan Information” in Part II, Item 5 of this Form 10-K is also incorporated herein by reference.
ITEM 13. CERTAIN RELATIONSHIPS AND RELATED TRANSACTIONS, AND DIRECTOR INDEPENDENCE
In response to this Item, the information set forth in the 2010 Proxy Statement under the headings “Certain Relationships and Related Party Transactions” and “Corporate Governance Information” is incorporated herein by reference.
ITEM 14. PRINCIPAL ACCOUNTANT FEES AND SERVICES
In response to this Item, the information set forth in the 2010 Proxy Statement under the headings “Audit Committee Report” and “Independent Auditors” is incorporated herein by reference.
- 105 -
Table of Contents
PART IV
ITEM 15. EXHIBITS AND FINANCIAL STATEMENT SCHEDULES
| (a) | FINANCIAL STATEMENTS |
Reference is made to the Index to Consolidated Financial Statements of Financial Institutions, Inc. and Subsidiaries under Item 8 “Financial Statements and Supplementary Data” in Part II of this Form 10-K.
| (b) | EXHIBITS |
The following is a list of all exhibits filed or incorporated by reference as part of this Report.
| Exhibit | ||||||
| Number | Description | Location | ||||
| 3.1 | Amended and Restated Certificate of Incorporation of the Company | Incorporated by reference to Exhibit 3.1 of the Form 10-K for the year ended December 31, 2008, dated March 12, 2009 | ||||
| 3.2 | Amended and Restated Bylaws of the Company | Incorporated by reference to Exhibit 3.4 of the Form 10-K for the year ended December 31, 2008, dated March 12, 2009 | ||||
| 4.1 | Warrant to Purchase Common Stock, dated December 23, 2008 issued by the Registrant to the United States Department of the Treasury | Incorporated by reference to Exhibit 4.2 of the Form 8-K, dated December 19, 2008 | ||||
| 10.1 | 1999 Management Stock Incentive Plan | Incorporated by reference to Exhibit 10.1 of the S-1 Registration Statement | ||||
| 10.2 | Amendment Number One to the FII 1999 Management Stock Incentive Plan | Incorporated by reference to Exhibit 10.1 of the Form 8-K, dated July 28, 2006 | ||||
| 10.3 | Form of Non-Qualified Stock Option Agreement Pursuant to the FII 1999 Management Stock Incentive Plan | Incorporated by reference to Exhibit 10.2 of the Form 8-K, dated July 28, 2006 | ||||
| 10.4 | Form of Restricted Stock Award Agreement Pursuant to the FII 1999 Management Stock Incentive Plan | Incorporated by reference to Exhibit 10.3 of the Form 8-K, dated July 28, 2006 | ||||
| 10.5 | Form of Restricted Stock Award Agreement Pursuant to the FII 1999 Management Stock Incentive Plan | Incorporated by reference to Exhibit 10.1 of the Form 8-K, dated January 23, 2008 | ||||
| 10.6 | 1999 Directors Stock Incentive Plan | Incorporated by reference to Exhibit 10.2 of the S-1 Registration Statement | ||||
| 10.7 | Amendment to the 1999 Director Stock Incentive Plan | Incorporated by reference to Exhibit 10.7 of the Form 10-K for the year ended December 31, 2008, dated March 12, 2009 | ||||
| 10.8 | 2009 Management Stock Incentive Plan | Incorporated by reference to Exhibit 10.8 of the Form 10-Q for the quarterly period ended June 30, 2009, dated August 5, 2009 | ||||
| 10.9 | 2009 Directors’ Stock Incentive Plan | Incorporated by reference to Exhibit 10.9 of the Form 10-Q for the quarterly period ended June 30, 2009, dated August 5, 2009 | ||||
| 10.10 | Form of Restricted Stock Award Agreement Pursuant to the FII 2009 Management Stock Incentive Plan | Incorporated by reference to Exhibit 10.1 of the Form 8-K, dated January 19, 2010 | ||||
| 10.11 | Form of Restricted Stock Award Agreement Pursuant to the FII 2009 Management Stock Incentive Plan | Incorporated by reference to Exhibit 10.1 of the Form 8-K, dated March 1, 2010 | ||||
| 10.12 | Form of Restricted Stock Award Agreement Pursuant to the FII 2009 Management Stock Incentive Plan | Incorporated by reference to Exhibit 10.2 of the Form 8-K, dated March 1, 2010 | ||||
| 10.13 | Amended Stock Ownership Requirements, dated December 14, 2005 | Incorporated by reference to Exhibit 10.19 of the Form 10-K for the year ended December 31, 2005, dated March 15, 2006 | ||||
- 106 -
Table of Contents
| Exhibit | ||||||
| Number | Description | Location | ||||
| 10.14 | Executive Agreement with Peter G. Humphrey | Incorporated by reference to Exhibit 10.1 of the Form 8-K, dated June 30, 2005 | ||||
| 10.15 | Executive Agreement with James T. Rudgers | Incorporated by reference to Exhibit 10.2 of the Form 8-K, dated June 30, 2005 | ||||
| 10.16 | Executive Agreement with Ronald A. Miller | Incorporated by reference to Exhibit 10.3 of the Form 8-K, dated June 30, 2005 | ||||
| 10.17 | Executive Agreement with Martin K. Birmingham | Incorporated by reference to Exhibit 10.4 of the Form 8-K, dated June 30, 2005 | ||||
| 10.18 | Agreement with Peter G. Humphrey | Incorporated by reference to Exhibit 10.6 of the Form 8-K, dated June 30, 2005 | ||||
| 10.19 | Executive Agreement with John J. Witkowski | Incorporated by reference to Exhibit 10.7 of the Form 8-K, dated September 14, 2005 | ||||
| 10.20 | Executive Agreement with George D. Hagi | Incorporated by reference to Exhibit 10.7 of the Form 8-K, dated February 2, 2006 | ||||
| 10.21 | Voluntary Retirement Agreement with James T. Rudgers | Incorporated by reference to Exhibit 10.1 of the Form 8-K, dated September 24, 2008 | ||||
| 10.22 | Amendment to Voluntary Retirement Agreement with James T. Rudgers | Incorporated by reference to Exhibit 10.1 of the Form 8-K, dated July 1, 2009 | ||||
| 10.23 | Voluntary Retirement Agreement with Ronald A. Miller | Incorporated by reference to Exhibit 10.2 of the Form 8-K, dated September 24, 2008 | ||||
| 10.24 | Amendment to Voluntary Retirement Agreement with Ronald A. Miller | Incorporated by reference to Exhibit 10.1 of the Form 8-K, dated March 3, 2010 | ||||
| 10.25 | Letter Agreement, dated December 23, 2008, including the Securities Purchase Agreement-Standard Terms attached thereto, by and between the Company and the United States Department of the Treasury | Incorporated by reference to Exhibit 10.1 of the Form 8-K, dated December 19, 2008 | ||||
| 11.1 | Statement of Computation of Per Share Earnings | Incorporated by reference to Note 15 of the Registrant’s audited consolidated financial statements under Item 8 filed herewith. | ||||
| 12 | Ratio of Earnings to Fixed Charges and Preferred Dividends | Filed Herewith | ||||
| 21 | Subsidiaries of Financial Institutions, Inc. | Filed Herewith | ||||
| 23 | Consent of Independent Registered Public Accounting Firm | Filed Herewith | ||||
| 31.1 | Certification pursuant to Section 302 of the Sarbanes-Oxley Act of 2002 — Principal Executive Officer | Filed Herewith | ||||
| 31.2 | Certification pursuant to Section 302 of the Sarbanes-Oxley Act of 2002 — Principal Financial Officer | Filed Herewith | ||||
| 32 | Certification pursuant to18 U.S.C. Section 1350, as adopted pursuant to Section 906 of the Sarbanes-Oxley Act of 2002 | Filed Herewith | ||||
| 99.1 | Certification of Chief Executive Officer pursuant to Section 111(b)(4) of the Emergency Economic Stabilization Act | Filed Herewith | ||||
| 99.2 | Certification of Chief Financial Officer pursuant to Section 111(b)(4) of the Emergency Economic Stabilization Act | Filed Herewith | ||||
- 107 -
Table of Contents
SIGNATURES
Pursuant to the requirements of Section 13 or 15(d) of the Exchange Act, the registrant caused this report to be signed on its behalf by the undersigned, thereunto duly authorized.
| FINANCIAL INSTITUTIONS, INC. | ||||
| March 12, 2010 | /s/ Peter G. Humphrey | |||
| Peter G. Humphrey | ||||
| President & Chief Executive Officer | ||||
Pursuant to the requirements of the Securities Exchange Act of 1934, this report has been signed below by the following persons on behalf of the registrant and in the capacities and on the dates indicated.
| Signatures | Title | Date | ||
/s/ Peter G. Humphrey | Director, President and Chief Executive Officer (Principal Executive Officer) | March 12, 2010 | ||
/s/ Karl F. Krebs | Executive Vice President and Chief Financial Officer (Principal Financial and Accounting Officer) | March 12, 2010 | ||
/s/ Karl V. Anderson, Jr. | Director | March 12, 2010 | ||
/s/ John E. Benjamin | Director | March 12, 2010 | ||
/s/ Thomas P. Connolly | Director | March 12, 2010 | ||
/s/ Barton P. Dambra | Director | March 12, 2010 | ||
/s/ Samuel M. Gullo | Director | March 12, 2010 | ||
/s/ Susan R. Holliday | Director | March 12, 2010 | ||
/s/ Erland E. Kailbourne | Director, Chairman | March 12, 2010 | ||
/s/ Robert N. Latella | Director | March 12, 2010 | ||
/s/ James L. Robinson | Director | March 12, 2010 | ||
/s/ James H. Wyckoff | Director | March 12, 2010 |
- 108 -