UNITED STATES
SECURITIES AND EXCHANGE COMMISSION
Washington, D.C. 20549
FORM N-CSR
CERTIFIED SHAREHOLDER REPORT OF
REGISTERED MANAGEMENT INVESTMENT COMPANIES
Investment Company Act file number 811-6102
MFS SERIES TRUST VI
(Exact name of registrant as specified in charter)
500 Boylston Street, Boston, Massachusetts 02116
(Address of principal executive offices) (Zip code)
Susan S. Newton
Massachusetts Financial Services Company
500 Boylston Street
Boston, Massachusetts 02116
(Name and address of agents for service)
Registrant’s telephone number, including area code: (617) 954-5000
Date of fiscal year end: October 31
Date of reporting period: October 31, 2009
| ITEM 1. | REPORTS TO STOCKHOLDERS. |

MFS® Global Equity Fund
SIPC Contact Information:
You may obtain information about the Securities Investor Protection Corporation (“SIPC”), including the SIPC Brochure, by contacting SIPC either by telephone (202-371-8300) or by accessing SIPC’s website address (www.sipc.org).
The report is prepared for the general information of shareholders. It is authorized for distribution to prospective investors only when preceded or accompanied by a current prospectus.
NOT FDIC INSURED Ÿ MAY LOSE VALUE Ÿ NO BANK GUARANTEE
10/31/09
LGE-ANN

LETTER FROM THE CEO
Dear Shareholders:
There remains some question as to when the global economy will achieve a sustainable recovery. While some economists and market watchers are optimistic that the worst is behind us, a number also agree with U.S. Federal Reserve Board Chairman Ben Bernanke who said in September that “even though from a technical perspective the recession is very likely over at this point, it’s still going to feel like a very weak economy for some time.”
Have we in fact turned the corner? We have seen tremendous rallies in the markets over the past six months. The Fed has cut interest rates aggressively toward zero to support credit markets, global deleveraging has helped diminish inflationary concerns, and stimulus measures have put more money in the hands of the government and individuals to keep the economy moving. Still, unemployment remains high, consumer confidence and spending continue to waiver, and the housing market, while improving, has a long way to go to recover.
Regardless of lingering market uncertainties, MFS® is confident that the fundamental principles of long-term investing will always apply. We encourage investors to speak with their advisors to identify and research long-term investment opportunities thoroughly. Global research continues to be one of the hallmarks of MFS, along with a unique collaboration between our portfolio managers and sector analysts, who regularly discuss potential investments before making both buy and sell decisions.
As we continue to dig out from the worst financial crisis in decades, keep in mind that while the road back to sustainable recovery will be slow, gradual, and even bumpy at times, conditions are significantly better than they were six months ago.
Respectfully,

Robert J. Manning
Chief Executive Officer and Chief Investment Officer
MFS Investment Management®
December 15, 2009
The opinions expressed in this letter are subject to change, may not be relied upon for investment advice, and no forecasts can be guaranteed.
1
PORTFOLIO COMPOSITION
Portfolio structure

| | |
| Top ten holdings | | |
| Nestle S.A. | | 3.5% |
| Heineken N.V. | | 2.7% |
| Roche Holding AG | | 2.6% |
| Linde AG | | 2.5% |
| LVMH Moet Hennessy Louis Vuitton S.A. | | 2.4% |
| Reckitt Benckiser Group PLC | | 2.1% |
| Diageo PLC | | 2.1% |
| Oracle Corp. | | 2.0% |
| NIKE, Inc., “B” | | 2.0% |
| 3M Co. | | 2.0% |
| | |
| Equity sectors | | |
| Consumer Staples | | 19.3% |
| Health Care | | 16.4% |
| Financial Services | | 11.8% |
| Retailing | | 9.6% |
| Technology | | 8.5% |
| Basic Materials | | 8.3% |
| Leisure | | 6.8% |
| Energy | | 5.2% |
| Industrial Goods & Services | | 4.1% |
| Transportation | | 3.9% |
| Utilities & Communications | | 2.5% |
| Special Products & Services | | 2.2% |
| Autos & Housing | | 0.4% |
| |
| Country weightings (w) | | |
| United States | | 39.4% |
| France | | 13.3% |
| Switzerland | | 12.9% |
| United Kingdom | | 9.7% |
| Germany | | 7.5% |
| Japan | | 6.1% |
| Netherlands | | 6.0% |
| Canada | | 1.4% |
| South Korea | | 1.2% |
| Other Countries | | 2.5% |
| (w) | Country weightings are based on the valuation currency of each security. |
Percentages are based on net assets as of 10/31/09.
The portfolio is actively managed and current holdings may be different.
2
MANAGEMENT REVIEW
Summary of Results
For the twelve months ended October 31, 2009, Class A shares of the MFS Global Equity Fund (the “fund”) provided a total return of 18.90%, at net asset value. This compares with a return of 19.21% for the fund’s benchmark, the MSCI World Index.
Market Environment
The global economy and financial markets experienced substantial deterioration and extraordinary volatility over most of the reporting period. Through the first quarter of 2009, the strong headwinds in the U.S. included accelerated deterioration in the housing market, anemic corporate investment, a rapidly declining job market, and a much tighter credit environment. During the very early stages of the period, a series of tumultuous financial events hammered markets. As a result of this turbulent news, global equity markets pushed significantly lower and credit markets witnessed the worst market decline since the beginning of the credit crisis. The synchronized global downturn in economic activity experienced in the fourth quarter of 2008 and the first quarter of 2009 was among the most intense in the post-World War II period. Not only did Europe and Japan fall into very deep recessions, but an increasingly powerful engine of global growth – emerging markets – also contracted almost across the board. The subsequent recovery in global activity has been similarly synchronized, led importantly by emerging Asian economies, but broadening to include most of the global economy to varying degrees. Primary drivers of the recovery include an unwinding of the inventory destocking that took place earlier, as well as massive fiscal and monetary stimulus. As a result, credit conditions and equity indices improved considerably during the second half of the period. Nevertheless, the degree of financial and macroeconomic dislocation remained significant.
During the first half of the reporting period, the Fed implemented its final interest rate cut, while making increasing use of its new lending facilities to alleviate ever-tightening credit markets. On the fiscal front, the U.S. Treasury designed and began implementing a massive fiscal stimulus package. As inflationary concerns diminished in the face of global deleveraging, and equity and credit markets deteriorated more sharply, central banks around the world also cut interest rates dramatically. Globally, policy makers increasingly sought to coordinate their rescue efforts, which resulted in a number of international actions, such as the establishment of swap lines between the Federal Reserve and a number of other central banks, as well as a substantial increase in the financial resources of the International Monetary Fund. By the middle of the period, several central banks had approached their lower bound on policy rates
3
Management Review – continued
and were examining the implementation and ramifications of quantitative easing as a means to further loosen monetary policy to offset the continuing fall in global economic activity. However, by the end of the period, there were broadening signs that the worst of the global macroeconomic deterioration had passed, which caused the subsequent rise in asset valuations. As most asset prices rebounded in the second half of the period and the demand for liquidity waned, the debate concerning monetary exit strategies had begun, creating added uncertainty regarding the forward path of policy rates.
Detractors from Performance
Stock selection in the basic materials sector detracted from the fund’s performance relative to the MSCI World Index. Not holding strong-performing mining giant BHP Billiton (U.K.) held back relative results as the stock significantly outperformed the benchmark over the reporting period.
Security selection in the special products and services sector also hindered relative returns. No individual securities within this sector were among the fund’s top relative detractors.
Stock selection in the consumer staples sector was another negative area of relative performance. Overweight positions in household and cosmetics manufacturer Kao Corp. (Japan) and premium drink manufacturer Diageo PLC (U.K.) were top relative detractors over the reporting period. Diageo’s shares lagged the market during the latest quarter after the company reported lower-than-expected sales.
Individual securities in other sectors that hurt relative returns included financial services provider Bank of New York Mellon, Swiss pharmaceutical and diagnostic company Roche Holding, and medical device manufacturers, Synthes Inc. (Switzerland) and Medtronic. Shares of Medtronic were hurt by short-term concerns about the growth of the business along with pressure from hospitals to cut costs. Not owning computer maker Apple and Spanish bank Banco Santander also dampened relative results as both of these benchmark constituents turned in strong performance for the period.
Contributors to Performance
Stock selection in the industrial goods and services sector was a primary contributor to relative performance. The fund’s holdings of strong-performing Legrand S.A. (France), an industry leader of products and systems for electrical installations, and electrical distribution and energy management company Schneider Electric S.A. (France) bolstered results. Schneider Electric posted better-than-expected first-half earnings and announced that economic conditions were improving, albeit slowly, in industrial markets. The company has reined in costs in an effort to adapt to the difficult economic environment.
4
Management Review – continued
Not owning weak-performing diversified industrial conglomerate General Electric also helped.
Strong stock selection in the retailing sector also benefited relative returns. Our overweight positions in luxury goods company LVMH Moët Hennessy Louis Vuitton (France), British luxury clothing retailer Burberry Group, and drug store operator Walgreen boosted relative results as all three stocks significantly outperformed the benchmark over the reporting period. Shares of Louis Vuitton rose due to increased sales of its fashions division, highlighting the resilience of the brand. Sales of its handbags and leather goods were strong in emerging market countries during the period. Management has committed to continue to reduce costs but plans to maintain expenditure on its leading brands to continue to gain market share.
Elsewhere, our underweight positions in integrated oil and gas company Exxon Mobil aided relative performance. Avoiding several weak-performing firms, including German car maker Volkswagen, financial services firm Citigroup, and bank operator Bank of America, also helped.
During the reporting period, the fund’s currency exposure was a contributor to relative performance. All of MFS’ investment decisions are driven by the fundamentals of each individual opportunity and as such, it is common for our funds to have different currency exposures than the benchmark.
Respectfully,
| | |
| David Mannheim | | Roger Morley |
| Portfolio Manager | | Portfolio Manager |
Note to Shareholders: Effective October 1, 2009, Roger Morley became a co-manager of the fund. Previously, the fund was co-managed by Simon Todd.
The views expressed in this report are those of the portfolio managers only through the end of the period of the report as stated on the cover and do not necessarily reflect the views of MFS or any other person in the MFS organization. These views are subject to change at any time based on market or other conditions, and MFS disclaims any responsibility to update such views. These views may not be relied upon as investment advice or an indication of trading intent on behalf of any MFS portfolio. References to specific securities are not recommendations of such securities, and may not be representative of any MFS portfolio’s current or future investments.
5
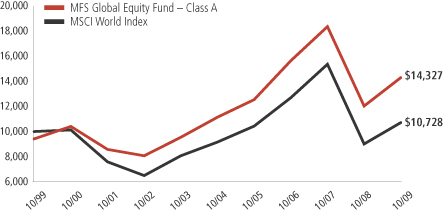
PERFORMANCE SUMMARY THROUGH 10/31/09
The following chart illustrates a representative class of the fund’s historical performance in comparison to its benchmark(s). Performance results include the deduction of the maximum applicable sales charge and reflect the percentage change in net asset value, including reinvestment of dividends and capital gains distributions. The performance of other share classes will be greater than or less than that of the class depicted below. Benchmarks are unmanaged and may not be invested in directly. Benchmark returns do not reflect sales charges, commissions or expenses. (See Notes to Performance Summary.)
Performance data shown represents past performance and is no guarantee of future results. Investment return and principal value fluctuate so your shares, when sold, may be worth more or less than the original cost; current performance may be lower or higher than quoted. The performance shown does not reflect the deduction of taxes, if any, that a shareholder would pay on fund distributions or the redemption of fund shares.
Growth of a Hypothetical $10,000 Investment
6
Performance Summary – continued
Total Returns through 10/31/09
Average annual without sales charge
| | | | | | | | | | | | | | |
| | | Share class | | Class inception date | | 1-yr | | 5-yr | | 10-yr | | Life (t) | | |
| | | A | | 9/07/93 | | 18.90% | | 5.11% | | 4.28% | | N/A | | |
| | | B | | 12/29/86 | | 18.04% | | 4.33% | | 3.50% | | N/A | | |
| | | C | | 1/03/94 | | 18.02% | | 4.33% | | 3.50% | | N/A | | |
| | | I | | 1/02/97 | | 19.23% | | 5.38% | | 4.53% | | N/A | | |
| | | R1 | | 4/01/05 | | 18.05% | | N/A | | N/A | | 2.84% | | |
| | | R2 | | 10/31/03 | | 18.59% | | 4.72% | | N/A | | 6.48% | | |
| | | R3 | | 4/01/05 | | 18.94% | | N/A | | N/A | | 3.60% | | |
| | | R4 | | 4/01/05 | | 19.25% | | N/A | | N/A | | 3.89% | | |
| Comparative benchmark | | | | | | | | | | |
| | | MSCI World Index (f) | | 19.21% | | 3.20% | | 0.71% | | N/A | | |
| Average annual with sales charge | | | | | | | | | | |
| | | A
With Initial Sales Charge (5.75%) | | 12.06% | | 3.87% | | 3.66% | | N/A | | |
| | | B
With CDSC (Declining over six years from 4% to 0%) (x) | | 14.04% | | 4.04% | | 3.50% | | N/A | | |
| | | C
With CDSC (1% for 12 months) (x) | | 17.02% | | 4.33% | | 3.50% | | N/A | | |
Class I, R1, R2, R3, and R4 shares do not have a sales charge.
CDSC – Contingent Deferred Sales Charge.
| (f) | Source: FactSet Research Systems Inc. |
| (t) | For the period from the class inception date through the stated period end (for those share classes with less than 10 years of performance history). No comparative benchmark information is provided for “life” periods. (See Notes to Performance Summary.) |
| (x) | Assuming redemption at the end of the applicable period. |
Benchmark Definition
Morgan Stanley Capital International (MSCI) World Index – a market capitalization-weighted index that is designed to measure equity market performance in the global developed markets.
It is not possible to invest directly in an index.
Notes to Performance Summary
Average annual total return represents the average annual change in value for each share class for the periods presented. Life returns are presented where the share class has less than 10 years of performance history and represent the average annual total return from the class inception date to the stated period
7
Performance Summary – continued
end date. As the fund’s share classes may have different inception dates, the life returns may represent different time periods and may not be comparable. As a result, no comparative benchmark performance information is provided for life periods.
Performance results reflect any applicable expense subsidies and waivers in effect during the periods shown. Without such subsidies and waivers the fund’s performance results would be less favorable. Please see the prospectus and financial statements for complete details.
From time to time the fund may receive proceeds from litigation settlements, without which performance would be lower.
8
EXPENSE TABLE
Fund expenses borne by the shareholders during the period, May 1, 2009 through October 31, 2009
As a shareholder of the fund, you incur two types of costs: (1) transaction costs, including sales charges (loads) on certain purchase or redemption payments, and (2) ongoing costs, including management fees; distribution and service (12b-1) fees; and other fund expenses. This example is intended to help you understand your ongoing costs (in dollars) of investing in the fund and to compare these costs with the ongoing costs of investing in other mutual funds.
The example is based on an investment of $1,000 invested at the beginning of the period and held for the entire period May 1, 2009 through October 31, 2009.
Actual Expenses
The first line for each share class in the following table provides information about actual account values and actual expenses. You may use the information in this line, together with the amount you invested, to estimate the expenses that you paid over the period. Simply divide your account value by $1,000 (for example, an $8,600 account value divided by $1,000 = 8.6), then multiply the result by the number in the first line under the heading entitled “Expenses Paid During Period” to estimate the expenses you paid on your account during this period.
Hypothetical Example for Comparison Purposes
The second line for each share class in the following table provides information about hypothetical account values and hypothetical expenses based on the fund’s actual expense ratio and an assumed rate of return of 5% per year before expenses, which is not the fund’s actual return. The hypothetical account values and expenses may not be used to estimate the actual ending account balance or expenses you paid for the period. You may use this information to compare the ongoing costs of investing in the fund and other funds. To do so, compare this 5% hypothetical example with the 5% hypothetical examples that appear in the shareholder reports of the other funds.
Please note that the expenses shown in the table are meant to highlight your ongoing costs only and do not reflect any transactional costs, such as sales charges (loads). Therefore, the second line for each share class in the table is useful in comparing ongoing costs only, and will not help you determine the relative total costs of owning different funds. In addition, if these transactional costs were included, your costs would have been higher.
9
Expense Table – continued
| | | | | | | | | | |
Share
Class | | | | Annualized
Expense
Ratio | | Beginning
Account Value
5/01/09 | | Ending
Account Value
10/31/09 | | Expenses
Paid During
Period (p)
5/01/09-10/31/09 |
| A | | Actual | | 1.45% | | $1,000.00 | | $1,265.59 | | $8.28 |
| | Hypothetical (h) | | 1.45% | | $1,000.00 | | $1,017.90 | | $7.38 |
| B | | Actual | | 2.21% | | $1,000.00 | | $1,261.30 | | $12.60 |
| | Hypothetical (h) | | 2.21% | | $1,000.00 | | $1,014.06 | | $11.22 |
| C | | Actual | | 2.20% | | $1,000.00 | | $1,261.17 | | $12.54 |
| | Hypothetical (h) | | 2.20% | | $1,000.00 | | $1,014.12 | | $11.17 |
| I | | Actual | | 1.21% | | $1,000.00 | | $1,267.40 | | $6.92 |
| | Hypothetical (h) | | 1.21% | | $1,000.00 | | $1,019.11 | | $6.16 |
| R1 | | Actual | | 2.20% | | $1,000.00 | | $1,260.84 | | $12.54 |
| | Hypothetical (h) | | 2.20% | | $1,000.00 | | $1,014.12 | | $11.17 |
| R2 | | Actual | | 1.70% | | $1,000.00 | | $1,263.90 | | $9.70 |
| | Hypothetical (h) | | 1.70% | | $1,000.00 | | $1,016.64 | | $8.64 |
| R3 | | Actual | | 1.45% | | $1,000.00 | | $1,265.66 | | $8.28 |
| | Hypothetical (h) | | 1.45% | | $1,000.00 | | $1,017.90 | | $7.38 |
| R4 | | Actual | | 1.20% | | $1,000.00 | | $1,267.58 | | $6.86 |
| | Hypothetical (h) | | 1.20% | | $1,000.00 | | $1,019.16 | | $6.11 |
| (h) | 5% class return per year before expenses. |
| (p) | Expenses paid is equal to each class’ annualized expense ratio, as shown above, multiplied by the average account value over the period, multiplied by the number of days in the period, divided by the number of days in the year. Expenses paid do not include any applicable sales charges (loads). If these transaction costs had been included, your costs would have been higher. |
10
PORTFOLIO OF INVESTMENTS
10/31/09
The Portfolio of Investments is a complete list of all securities owned by your fund. It is categorized by broad-based asset classes.
| | | | | |
| Common Stocks - 99.0% | | | | | |
| | | | | |
| Issuer | | Shares/Par | | Value ($) |
| Alcoholic Beverages - 6.1% | | | | | |
| Diageo PLC | | 519,327 | | $ | 8,464,139 |
| Grupo Modelo S.A. de C.V., “C” (a) | | 227,800 | | | 1,035,160 |
| Heineken N.V. | | 247,150 | | | 10,953,372 |
| Pernod Ricard S.A. | | 53,311 | | | 4,449,479 |
| | | | | |
| | | | | $ | 24,902,150 |
| Apparel Manufacturers - 6.5% | | | | | |
| Burberry Group PLC | | 399,630 | | $ | 3,519,982 |
| Compagnie Financiere Richemont S.A. | | 177,275 | | | 4,963,285 |
| LVMH Moet Hennessy Louis Vuitton S.A. | | 96,000 | | | 9,959,270 |
| NIKE, Inc., “B” | | 130,240 | | | 8,098,323 |
| | | | | |
| | | | | $ | 26,540,860 |
| Automotive - 0.4% | | | | | |
| Harley-Davidson, Inc. | | 62,470 | | $ | 1,556,752 |
| | |
| Biotechnology - 0.3% | | | | | |
| Actelion Ltd. (a) | | 21,168 | | $ | 1,166,803 |
| | |
| Broadcasting - 5.0% | | | | | |
| Omnicom Group, Inc. | | 164,500 | | $ | 5,639,060 |
| Vivendi S.A. | | 105,013 | | | 2,908,659 |
| Walt Disney Co. | | 271,940 | | | 7,442,998 |
| WPP Group PLC | | 513,992 | | | 4,609,440 |
| | | | | |
| | | | | $ | 20,600,157 |
| Brokerage & Asset Managers - 1.0% | | | | | |
| Deutsche Boerse AG | | 51,860 | | $ | 4,206,746 |
| | |
| Business Services - 1.6% | | | | | |
| Accenture Ltd., “A” | | 139,690 | | $ | 5,179,705 |
| DST Systems, Inc. (a) | | 36,070 | | | 1,504,480 |
| | | | | |
| | | | | $ | 6,684,185 |
| Chemicals - 3.4% | | | | | |
| 3M Co. | | 109,400 | | $ | 8,048,558 |
| Givaudan S.A. | | 7,764 | | | 5,746,831 |
| | | | | |
| | | | | $ | 13,795,389 |
11
Portfolio of Investments – continued
| | | | | |
| Issuer | | Shares/Par | | Value ($) |
| | | | | |
| Common Stocks - continued | | | | | |
| Computer Software - 2.0% | | | | | |
| Oracle Corp. | | 388,790 | | $ | 8,203,469 |
| | |
| Computer Software - Systems - 1.2% | | | | | |
| Canon, Inc. | | 133,300 | | $ | 5,002,195 |
| | |
| Conglomerates - 0.6% | | | | | |
| Smiths Group PLC | | 178,069 | | $ | 2,604,974 |
| | |
| Construction - 0.0% | | | | | |
| Sherwin-Williams Co. | | 2,700 | | $ | 154,008 |
| | |
| Consumer Products - 5.1% | | | | | |
| Beiersdorf AG | | 25,680 | | $ | 1,579,420 |
| International Flavors & Fragrances, Inc. | | 32,770 | | | 1,248,209 |
| Kao Corp. | | 188,100 | | | 4,225,017 |
| Procter & Gamble Co. | | 83,885 | | | 4,865,330 |
| Reckitt Benckiser Group PLC | | 175,600 | | | 8,730,864 |
| | | | | |
| | | | | $ | 20,648,840 |
| Electrical Equipment - 3.6% | | | | | |
| Legrand S.A. | | 154,640 | | $ | 4,199,668 |
| Rockwell Automation, Inc. | | 83,100 | | | 3,402,945 |
| Schneider Electric S.A. | | 67,657 | | | 7,027,409 |
| | | | | |
| | | | | $ | 14,630,022 |
| Electronics - 3.6% | | | | | |
| Hirose Electric Co. Ltd. | | 12,300 | | $ | 1,274,679 |
| Hoya Corp. | | 201,400 | | | 4,410,788 |
| Intel Corp. | | 210,070 | | | 4,014,438 |
| Samsung Electronics Co. Ltd. | | 8,387 | | | 5,048,734 |
| | | | | |
| | | | | $ | 14,748,639 |
| Energy - Independent - 1.0% | | | | | |
| INPEX Holdings, Inc. | | 506 | | $ | 4,140,171 |
| | |
| Energy - Integrated - 3.7% | | | | | |
| Chevron Corp. | | 53,470 | | $ | 4,092,594 |
| Exxon Mobil Corp. | | 31,210 | | | 2,236,821 |
| Royal Dutch Shell PLC | | 145,750 | | | 4,334,903 |
| TOTAL S.A. | | 76,960 | | | 4,582,714 |
| | | | | |
| | | | | $ | 15,247,032 |
12
Portfolio of Investments – continued
| | | | | |
| Issuer | | Shares/Par | | Value ($) |
| | | | | |
| Common Stocks - continued | | | | | |
| Food & Beverages - 8.1% | | | | | |
| General Mills, Inc. | | 79,500 | | $ | 5,240,640 |
| Groupe Danone | | 69,981 | | | 4,204,767 |
| J.M. Smucker Co. | | 85,489 | | | 4,507,835 |
| Nestle S.A. | | 303,807 | | | 14,122,472 |
| PepsiCo, Inc. | | 86,690 | | | 5,249,080 |
| | | | | |
| | | | | $ | 33,324,794 |
| Food & Drug Stores - 2.5% | | | | | |
| Lawson, Inc. | | 24,000 | | $ | 1,071,623 |
| Tesco PLC | | 333,046 | | | 2,222,504 |
| Walgreen Co. | | 182,660 | | | 6,910,028 |
| | | | | |
| | | | | $ | 10,204,155 |
| Gaming & Lodging - 0.9% | | | | | |
| Ladbrokes PLC | | 674,020 | | $ | 1,346,288 |
| William Hill PLC | | 885,210 | | | 2,434,731 |
| | | | | |
| | | | | $ | 3,781,019 |
| Insurance - 1.9% | | | | | |
| AXA | | 205,620 | | $ | 5,109,898 |
| Swiss Reinsurance Co. | | 64,528 | | | 2,629,121 |
| | | | | |
| | | | | $ | 7,739,019 |
| Machinery & Tools - 0.5% | | | | | |
| Fanuc Ltd. | | 22,500 | | $ | 1,889,896 |
| | |
| Major Banks - 5.6% | | | | | |
| Bank of New York Mellon Corp. | | 216,873 | | $ | 5,781,834 |
| Erste Group Bank AG | | 43,746 | | | 1,757,790 |
| Goldman Sachs Group, Inc. | | 23,640 | | | 4,022,819 |
| Intesa Sanpaolo S.p.A (a) | | 397,332 | | | 1,673,901 |
| Standard Chartered PLC | | 165,925 | | | 4,074,492 |
| State Street Corp. | | 135,850 | | | 5,702,983 |
| | | | | |
| | | | | $ | 23,013,819 |
| Medical Equipment - 9.0% | | | | | |
| Alcon, Inc. | | 18,160 | | $ | 2,593,066 |
| DENTSPLY International, Inc. | | 102,710 | | | 3,385,322 |
| Essilor International S.A. | | 31,540 | | | 1,768,002 |
| Medtronic, Inc. | | 181,060 | | | 6,463,842 |
| Sonova Holding AG | | 12,203 | | | 1,255,703 |
| St. Jude Medical, Inc. (a) | | 81,300 | | | 2,770,704 |
| Synthes, Inc. | | 36,600 | | | 4,343,340 |
13
Portfolio of Investments – continued
| | | | | |
| Issuer | | Shares/Par | | Value ($) |
| | | | | |
| Common Stocks - continued | | | | | |
| Medical Equipment - continued | | | | | |
| Thermo Fisher Scientific, Inc. (a) | | 96,570 | | $ | 4,345,650 |
| Waters Corp. (a) | | 87,760 | | | 5,040,057 |
| Zimmer Holdings, Inc. (a) | | 92,540 | | | 4,864,828 |
| | | | | |
| | | | | $ | 36,830,514 |
| Natural Gas - Distribution - 1.2% | | | | | |
| GDF Suez | | 120,189 | | $ | 5,030,052 |
| | |
| Network & Telecom - 1.7% | | | | | |
| Cisco Systems, Inc. (a) | | 296,050 | | $ | 6,764,743 |
| | |
| Oil Services - 0.5% | | | | | |
| National Oilwell Varco, Inc. (a) | | 45,980 | | $ | 1,884,720 |
| | |
| Other Banks & Diversified Financials - 3.3% | | | | | |
| Aeon Credit Service Co. Ltd. | | 103,000 | | $ | 984,962 |
| American Express Co. | | 94,220 | | | 3,282,625 |
| Julius Baer Group Ltd. | | 91,764 | | | 3,454,455 |
| Komercni Banka A.S. | | 7,933 | | | 1,576,708 |
| UBS AG (a) | | 257,520 | | | 4,312,519 |
| | | | | |
| | | | | $ | 13,611,269 |
| Pharmaceuticals - 7.1% | | | | | |
| Bayer AG | | 90,460 | | $ | 6,265,704 |
| GlaxoSmithKline PLC | | 86,350 | | | 1,773,329 |
| Johnson & Johnson | | 80,840 | | | 4,773,602 |
| Merck KGaA | | 60,860 | | | 5,724,075 |
| Roche Holding AG | | 66,280 | | | 10,619,504 |
| | | | | |
| | | | | $ | 29,156,214 |
| Printing & Publishing - 0.9% | | | | | |
| Wolters Kluwer N.V. | | 166,360 | | $ | 3,711,893 |
| | |
| Railroad & Shipping - 1.4% | | | | | |
| Canadian National Railway Co. | | 115,826 | | $ | 5,587,446 |
| | |
| Specialty Chemicals - 4.9% | | | | | |
| L’Air Liquide S.A. | | 49,483 | | $ | 5,345,110 |
| Linde AG | | 99,500 | | | 10,405,325 |
| Praxair, Inc. | | 28,260 | | | 2,244,974 |
| Shin-Etsu Chemical Co. Ltd. | | 36,300 | | | 1,912,286 |
| | | | | |
| | | | | $ | 19,907,695 |
14
Portfolio of Investments – continued
| | | | | |
| Issuer | | Shares/Par | | Value ($) |
| | | | | |
| Common Stocks - continued | | | | | |
| Specialty Stores - 0.6% | | | | | |
| Abercrombie & Fitch Co., “A” | | 52,950 | | $ | 1,737,819 |
| Sally Beauty Holdings, Inc. (a) | | 106,630 | | | 719,753 |
| | | | | |
| | | | | $ | 2,457,572 |
| Telephone Services - 0.7% | | | | | |
| Singapore Telecommunications Ltd. | | 1,290,975 | | $ | 2,674,648 |
| | |
| Trucking - 2.5% | | | | | |
| TNT N.V. | | 207,769 | | $ | 5,504,727 |
| United Parcel Service, Inc., “B” | | 87,160 | | | 4,678,749 |
| | | | | |
| | | | | $ | 10,183,476 |
| Utilities - Electric Power - 0.6% | | | | | |
| E.ON AG | | 63,486 | | $ | 2,426,669 |
| Total Common Stocks (Identified Cost, $385,577,173) | | | | $ | 405,012,005 |
| | |
| Money Market Funds (v) - 0.6% | | | | | |
MFS Institutional Money Market Portfolio, 0.13%,
at Cost and Net Asset Value | | 2,272,358 | | $ | 2,272,358 |
| Total Investments (Identified Cost, $387,849,531) | | | | $ | 407,284,363 |
| | |
| Other Assets, Less Liabilities - 0.4% | | | | | 1,694,869 |
| Net Assets - 100.0% | | | | $ | 408,979,232 |
| (a) | Non-income producing security. |
| (v) | Underlying fund that is available only to investment companies managed by MFS. The rate quoted is the annualized seven-day yield of the fund at period end. |
The following abbreviations are used in this report and are defined:
| PLC | | Public Limited Company |
See Notes to Financial Statements
15
Financial Statements
STATEMENT OF ASSETS AND LIABILITIES
At 10/31/09
This statement represents your fund’s balance sheet, which details the assets and liabilities comprising the total value of the fund.
| | | |
| Assets | | | |
Investments- | | | |
Non-affiliated issuers, at value (identified cost, $385,577,173) | | $405,012,005 | |
Underlying funds, at cost and value | | 2,272,358 | |
Total investments, at value (identified cost, $387,849,531) | | $407,284,363 | |
Foreign currency, at value (identified cost, $300,209) | | 307,818 | |
Receivables for | | | |
Investments sold | | 1,023,078 | |
Fund shares sold | | 364,725 | |
Interest and dividends | | 1,135,639 | |
Total assets | | $410,115,623 | |
| Liabilities | | | |
Payables for | | | |
Investments purchased | | $459,457 | |
Fund shares reacquired | | 364,324 | |
Payable to affiliates | | | |
Investment adviser | | 30,536 | |
Shareholder servicing costs | | 113,146 | |
Distribution and service fees | | 12,101 | |
Administrative services fee | | 597 | |
Payable for independent Trustees’ compensation | | 45,771 | |
Accrued expenses and other liabilities | | 110,459 | |
Total liabilities | | $1,136,391 | |
Net assets | | $408,979,232 | |
| Net assets consist of | | | |
Paid-in capital | | $403,609,615 | |
Unrealized appreciation (depreciation) on investments and translation of assets and liabilities in foreign currencies | | 19,466,887 | |
Accumulated net realized gain (loss) on investments and foreign currency transactions | | (17,436,991 | ) |
Undistributed net investment income | | 3,339,721 | |
Net assets | | $408,979,232 | |
Shares of beneficial interest outstanding | | 20,406,698 | |
| | | | | | |
| | | Net assets | | Shares
outstanding | | Net asset value
per share (a) |
Class A | | $285,345,206 | | 14,053,709 | | $20.30 |
Class B | | 29,963,516 | | 1,579,814 | | 18.97 |
Class C | | 27,990,114 | | 1,525,357 | | 18.35 |
Class I | | 30,416,828 | | 1,464,979 | | 20.76 |
Class R1 | | 4,140,184 | | 222,456 | | 18.61 |
Class R2 | | 19,226,954 | | 971,802 | | 19.78 |
Class R3 | | 11,265,411 | | 557,600 | | 20.20 |
Class R4 | | 631,019 | | 30,981 | | 20.37 |
| (a) | Maximum offering price per share was equal to the net asset value per share for all share classes, except for Class A, for which the maximum offering price per share was $21.54. On sales of $50,000 or more, the maximum offering price of Class A shares is reduced. A contingent deferred sales charge may be imposed on redemptions of Class A, Class B, and Class C shares. Redemption price per share was equal to the net asset value per share for Classes I, R1, R2, R3, and R4. |
See Notes to Financial Statements
16
Financial Statements
STATEMENT OF OPERATIONS
Year ended 10/31/09
This statement describes how much your fund earned in investment income and accrued in expenses. It also describes any gains and/or losses generated by fund operations.
| | | |
| Net investment income | | | |
Income | | | |
Dividends | | $10,192,613 | |
Interest | | 147,747 | |
Dividends from underlying funds | | 10,075 | |
Foreign taxes withheld | | (783,336 | ) |
Total investment income | | $9,567,099 | |
Expenses | | | |
Management fee | | $3,402,034 | |
Distribution and service fees | | 1,314,314 | |
Shareholder servicing costs | | 917,857 | |
Administrative services fee | | 80,771 | |
Independent Trustees’ compensation | | 16,887 | |
Custodian fee | | 116,270 | |
Shareholder communications | | 47,758 | |
Auditing fees | | 74,658 | |
Legal fees | | 50,955 | |
Miscellaneous | | 136,478 | |
Total expenses | | $6,157,982 | |
Fees paid indirectly | | (689 | ) |
Reduction of expenses by investment adviser | | (2,409 | ) |
Net expenses | | $6,154,884 | |
Net investment income | | $3,412,215 | |
Realized and unrealized gain (loss) on investments
and foreign currency transactions | | | |
Realized gain (loss) (identified cost basis) | | | |
Investment transactions (net of $168 country tax) | | $(15,154,319 | ) |
Foreign currency transactions | | (1,209 | ) |
Net realized gain (loss) on investments
and foreign currency transactions | | $(15,155,528 | ) |
Change in unrealized appreciation (depreciation) | | | |
Investments | | $78,513,140 | |
Translation of assets and liabilities in foreign currencies | | 43,660 | |
Net unrealized gain (loss) on investments
and foreign currency translation | | $78,556,800 | |
Net realized and unrealized gain (loss) on investments
and foreign currency | | $63,401,272 | |
Change in net assets from operations | | $66,813,487 | |
See Notes to Financial Statements
17
Financial Statements
STATEMENTS OF CHANGES IN NET ASSETS
These statements describe the increases and/or decreases in net assets resulting from operations, any distributions, and any shareholder transactions.
| | | | | | |
| | | Years ended 10/31 | |
| | | 2009 | | | 2008 | |
| Change in net assets | | | | | | |
| From operations | | | | | | |
Net investment income | | $3,412,215 | | | $5,659,309 | |
Net realized gain (loss) on investments and foreign currency transactions | | (15,155,528 | ) | | 31,159,324 | |
Net unrealized gain (loss) on investments and foreign currency translation | | 78,556,800 | | | (271,887,501 | ) |
Change in net assets from operations | | $66,813,487 | | | $(235,068,868 | ) |
| Distributions declared to shareholders | | | | | | |
From net investment income | | $(5,518,224 | ) | | $(3,751,949 | ) |
From net realized gain on investments | | (24,477,858 | ) | | (77,211,225 | ) |
Total distributions declared to shareholders | | $(29,996,082 | ) | | $(80,963,174 | ) |
Change in net assets from fund share transactions | | $(38,241,298 | ) | | $(45,733,031 | ) |
Total change in net assets | | $(1,423,893 | ) | | $(361,765,073 | ) |
| Net assets | | | | | | |
At beginning of period | | 410,403,125 | | | 772,168,198 | |
At end of period (including undistributed net investment
income of $3,339,721 and $5,448,295, respectively) | | $408,979,232 | | | $410,403,125 | |
See Notes to Financial Statements
18
Financial Statements
FINANCIAL HIGHLIGHTS
The financial highlights table is intended to help you understand the fund’s financial performance for the past 5 years (or life of a particular share class, if shorter). Certain information reflects financial results for a single fund share. The total returns in the table represent the rate by which an investor would have earned (or lost) on an investment in the fund share class (assuming reinvestment of all distributions) held for the entire period.
| | | | | | | | | | | | | | |
| Class A | | Years ended 10/31 |
| | | 2009 | | | 2008 | | | 2007 | | | 2006 | | | 2005 |
Net asset value, beginning of period | | $18.51 | | | $31.71 | | | $30.78 | | | $25.79 | | | $22.92 |
| Income (loss) from investment operations | | | | | | | | | | | | |
Net investment income (d) | | $0.17 | | | $0.27 | | | $0.33 | | | $0.48 | | | $0.06 |
Net realized and unrealized gain (loss)
on investments and foreign currency | | 3.02 | | | (10.09 | ) | | 4.54 | | | 5.68 | | | 2.81 |
Total from investment operations | | $3.19 | | | $(9.82 | ) | | $4.87 | | | $6.16 | | | $2.87 |
| Less distributions declared to shareholders | | | | | | | | | | | | |
From net investment income | | $(0.29 | ) | | $(0.19 | ) | | $(0.63 | ) | | $— | | | $— |
From net realized gain on investments | | (1.11 | ) | | (3.19 | ) | | (3.31 | ) | | (1.17 | ) | | — |
Total distributions declared to shareholders | | $(1.40 | ) | | $(3.38 | ) | | $(3.94 | ) | | $(1.17 | ) | | $— |
Net asset value, end of period | | $20.30 | | | $18.51 | | | $31.71 | | | $30.78 | | | $25.79 |
Total return (%) (r)(s)(t) | | 18.90 | | | (34.51 | ) | | 17.41 | | | 24.73 | | | 12.52 |
Ratios (%) (to average net assets)
and Supplemental data: | | | | | | | | | | | | | | |
Expenses before expense reductions (f) | | 1.53 | | | 1.44 | | | 1.46 | | | 1.45 | | | 1.55 |
Expenses after expense reductions (f) | | 1.53 | | | 1.44 | | | 1.46 | | | 1.45 | | | 1.55 |
Net investment income | | 0.99 | | | 1.05 | | | 1.10 | | | 1.72 | | | 0.22 |
Portfolio turnover | | 17 | | | 23 | | | 27 | | | 39 | | | 39 |
Net assets at end of period (000 omitted) | | $285,345 | | | $260,535 | | | $474,901 | | | $465,394 | | | $402,985 |
See Notes to Financial Statements
19
Financial Highlights – continued
| | | | | | | | | | | | | | | |
| Class B | | Years ended 10/31 | |
| | | 2009 | | | 2008 | | | 2007 | | | 2006 | | | 2005 | |
Net asset value, beginning of period | | $17.25 | | | $29.79 | | | $29.12 | | | $24.64 | | | $22.06 | |
| Income (loss) from investment operations | | | | | | | | | | | | | | | |
Net investment income (loss) (d) | | $0.04 | | | $0.06 | | | $0.12 | | | $0.27 | | | $(0.13 | ) |
Net realized and unrealized gain (loss)
on investments and foreign currency | | 2.83 | | | (9.41 | ) | | 4.25 | | | 5.38 | | | 2.71 | |
Total from investment operations | | $2.87 | | | $(9.35 | ) | | $4.37 | | | $5.65 | | | $2.58 | |
| Less distributions declared to shareholders | | | | | | | | | | | | | | | |
From net investment income | | $(0.04 | ) | | $— | | | $(0.39 | ) | | $— | | | $— | |
From net realized gain on investments | | (1.11 | ) | | (3.19 | ) | | (3.31 | ) | | (1.17 | ) | | — | |
Total distributions declared to shareholders | | $(1.15 | ) | | $(3.19 | ) | | $(3.70 | ) | | $(1.17 | ) | | $— | |
Net asset value, end of period | | $18.97 | | | $17.25 | | | $29.79 | | | $29.12 | | | $24.64 | |
Total return (%) (r)(s)(t) | | 18.04 | | | (34.99 | ) | | 16.51 | | | 23.77 | | | 11.70 | |
Ratios (%) (to average net assets)
and Supplemental data: | | | | | | | | | | | | | | | |
Expenses before expense reductions (f) | | 2.29 | | | 2.19 | | | 2.21 | | | 2.20 | | | 2.30 | |
Expenses after expense reductions (f) | | 2.29 | | | 2.19 | | | 2.21 | | | 2.20 | | | 2.30 | |
Net investment income (loss) | | 0.25 | | | 0.25 | | | 0.41 | | | 1.02 | | | (0.53 | ) |
Portfolio turnover | | 17 | | | 23 | | | 27 | | | 39 | | | 39 | |
Net assets at end of period (000 omitted) | | $29,964 | | | $38,111 | | | $102,296 | | | $139,656 | | | $148,434 | |
| |
| Class C | | Years ended 10/31 | |
| | | 2009 | | | 2008 | | | 2007 | | | 2006 | | | 2005 | |
Net asset value, beginning of period | | $16.79 | | | $29.11 | | | $28.58 | | | $24.19 | | | $21.66 | |
| Income (loss) from investment operations | | | | | | | | | | | | | | | |
Net investment income (loss) (d) | | $0.04 | | | $0.07 | | | $0.08 | | | $0.25 | | | $(0.12 | ) |
Net realized and unrealized gain (loss)
on investments and foreign currency | | 2.73 | | | (9.17 | ) | | 4.20 | | | 5.31 | | | 2.65 | |
Total from investment operations | | $2.77 | | | $(9.10 | ) | | $4.28 | | | $5.56 | | | $2.53 | |
| Less distributions declared to shareholders | | | | | | | | | | | | | | | |
From net investment income | | $(0.10 | ) | | $(0.03 | ) | | $(0.44 | ) | | $— | | | $— | |
From net realized gain on investments | | (1.11 | ) | | (3.19 | ) | | (3.31 | ) | | (1.17 | ) | | — | |
Total distributions declared to shareholders | | $(1.21 | ) | | $(3.22 | ) | | $(3.75 | ) | | $(1.17 | ) | | $— | |
Net asset value, end of period | | $18.35 | | | $16.79 | | | $29.11 | | | $28.58 | | | $24.19 | |
Total return (%) (r)(s)(t) | | 18.02 | | | (34.99 | ) | | 16.51 | | | 23.84 | | | 11.68 | |
Ratios (%) (to average net assets)
and Supplemental data: | | | | | | | | | | | | | | | |
Expenses before expense reductions (f) | | 2.28 | | | 2.19 | | | 2.21 | | | 2.20 | | | 2.30 | |
Expenses after expense reductions (f) | | 2.28 | | | 2.19 | | | 2.21 | | | 2.20 | | | 2.30 | |
Net investment income (loss) | | 0.24 | | | 0.30 | | | 0.29 | | | 0.96 | | | (0.53 | ) |
Portfolio turnover | | 17 | | | 23 | | | 27 | | | 39 | | | 39 | |
Net assets at end of period (000 omitted) | | $27,990 | | | $26,139 | | | $50,903 | | | $41,351 | | | $33,975 | |
See Notes to Financial Statements
20
Financial Highlights – continued
| | | | | | | | | | | | | | | |
| Class I | | Years ended 10/31 | |
| | | 2009 | | | 2008 | | | 2007 | | | 2006 | | | 2005 | |
Net asset value, beginning of period | | $18.92 | | | $32.33 | | | $31.32 | | | $26.15 | | | $23.23 | |
| Income (loss) from investment operations | | | | | | | | | | | | | | | |
Net investment income (d) | | $0.23 | | | $0.34 | | | $0.40 | | | $0.56 | | | $0.12 | |
Net realized and unrealized gain (loss)
on investments and foreign currency | | 3.08 | | | (10.30 | ) | | 4.62 | | | 5.78 | | | 2.85 | |
| Total from investment operations | | $3.31 | | | $(9.96 | ) | | $5.02 | | | $6.34 | | | $2.97 | |
| Less distributions declared to shareholders | | | | | | | | | | | | | | | |
From net investment income | | $(0.36 | ) | | $(0.26 | ) | | $(0.70 | ) | | $— | | | $(0.05 | ) |
From net realized gain on investments | | (1.11 | ) | | (3.19 | ) | | (3.31 | ) | | (1.17 | ) | | — | |
Total distributions declared to shareholders | | $(1.47 | ) | | $(3.45 | ) | | $(4.01 | ) | | $(1.17 | ) | | $(0.05 | ) |
Net asset value, end of period | | $20.76 | | | $18.92 | | | $32.33 | | | $31.32 | | | $26.15 | |
Total return (%) (r)(s) | | 19.23 | | | (34.34 | ) | | 17.66 | | | 25.09 | | | 12.79 | |
Ratios (%) (to average net assets)
and Supplemental data: | | | | | | | | | | | | | | | |
Expenses before expense reductions (f) | | 1.29 | | | 1.19 | | | 1.21 | | | 1.20 | | | 1.30 | |
Expenses after expense reductions (f) | | 1.28 | | | 1.19 | | | 1.21 | | | 1.20 | | | 1.30 | |
Net investment income | | 1.33 | | | 1.32 | | | 1.31 | | | 1.95 | | | 0.47 | |
Portfolio turnover | | 17 | | | 23 | | | 27 | | | 39 | | | 39 | |
Net assets at end of period (000 omitted) | | $30,417 | | | $49,022 | | | $77,689 | | | $63,714 | | | $41,493 | |
| |
| Class R1 | | Years ended 10/31 | |
| | | 2009 | | | 2008 | | | 2007 | | | 2006 | | | 2005 (i) | |
Net asset value, beginning of period | | $17.02 | | | $29.60 | | | $29.06 | | | $24.61 | | | $23.89 | |
| Income (loss) from investment operations | | | | | | | | | | | | | | | |
Net investment income (loss) (d) | | $0.03 | | | $0.06 | | | $0.03 | | | $0.21 | | | $(0.15 | ) |
Net realized and unrealized gain (loss)
on investments and foreign currency | | 2.78 | | | (9.31 | ) | | 4.29 | | | 5.41 | | | 0.87 | (g) |
Total from investment operations | | $2.81 | | | $(9.25 | ) | | $4.32 | | | $5.62 | | | $0.72 | |
| Less distributions declared to shareholders | | | | | | | | | | | | | | | |
From net investment income | | $(0.11 | ) | | $(0.14 | ) | | $(0.47 | ) | | $— | | | $— | |
From net realized gain on investments | | (1.11 | ) | | (3.19 | ) | | (3.31 | ) | | (1.17 | ) | | — | |
Total distributions declared to shareholders | | $(1.22 | ) | | $(3.33 | ) | | $(3.78 | ) | | $(1.17 | ) | | $— | |
Net asset value, end of period | | $18.61 | | | $17.02 | | | $29.60 | | | $29.06 | | | $24.61 | |
Total return (%) (r)(s) | | 18.05 | | | (35.04 | ) | | 16.38 | | | 23.68 | | | 3.01 | (n) |
Ratios (%) (to average net assets)
and Supplemental data: | | | | | | | | | | | | | | | |
Expenses before expense reductions (f) | | 2.27 | | | 2.23 | | | 2.33 | | | 2.40 | | | 2.50 | (a) |
Expenses after expense reductions (f) | | 2.27 | | | 2.23 | | | 2.30 | | | 2.30 | | | 2.47 | (a) |
Net investment income (loss) | | 0.22 | | | 0.26 | | | 0.12 | | | 0.78 | | | (1.06 | )(a) |
Portfolio turnover | | 17 | | | 23 | | | 27 | | | 39 | | | 39 | |
Net assets at end of period (000 omitted) | | $4,140 | | | $3,304 | | | $4,208 | | | $1,348 | | | $672 | |
See Notes to Financial Statements
21
Financial Highlights – continued
| | | | | | | | | | | | | | | |
| Class R2 | | Years ended 10/31 | |
| | | 2009 | | | 2008 | | | 2007 | | | 2006 | | | 2005 | |
Net asset value, beginning of period | | $18.06 | | | $31.08 | | | $30.27 | | | $25.48 | | | $22.76 | |
| Income (loss) from investment operations | | | | | | | | | | | | | | | |
Net investment income (loss) (d) | | $0.12 | | | $0.21 | | | $0.14 | | | $0.39 | | | $(0.06 | ) |
Net realized and unrealized gain (loss)
on investments and foreign currency | | 2.94 | | | (9.88 | ) | | 4.52 | | | 5.57 | | | 2.78 | |
Total from investment operations | | $3.06 | | | $(9.67 | ) | | $4.66 | | | $5.96 | | | $2.72 | |
| Less distributions declared to shareholders | | | | | | | | | | | | | | | |
From net investment income | | $(0.23 | ) | | $(0.16 | ) | | $(0.54 | ) | | $— | | | $— | |
From net realized gain on investments | | (1.11 | ) | | (3.19 | ) | | (3.31 | ) | | (1.17 | ) | | — | |
Total distributions declared to shareholders | | $(1.34 | ) | | $(3.35 | ) | | $(3.85 | ) | | $(1.17 | ) | | $— | |
Net asset value, end of period | | $19.78 | | | $18.06 | | | $31.08 | | | $30.27 | | | $25.48 | |
Total return (%) (r)(s) | | 18.59 | | | (34.70 | ) | | 16.94 | | | 24.22 | | | 11.95 | |
Ratios (%) (to average net assets)
and Supplemental data: | | | | | | | | | | | | | | | |
Expenses before expense reductions (f) | | 1.78 | | | 1.71 | | | 1.88 | | | 1.94 | | | 2.06 | |
Expenses after expense reductions (f) | | 1.78 | | | 1.71 | | | 1.85 | | | 1.84 | | | 2.05 | |
Net investment income (loss) | | 0.74 | | | 0.83 | | | 0.48 | | | 1.42 | | | (0.25 | ) |
Portfolio turnover | | 17 | | | 23 | | | 27 | | | 39 | | | 39 | |
Net assets at end of period (000 omitted) | | $19,227 | | | $17,298 | | | $21,364 | | | $6,501 | | | $3,032 | |
| | | | | | | | | | | | | | | |
| Class R3 | | Years ended 10/31 | |
| | | 2009 | | | 2008 | | | 2007 | | | 2006 | | | 2005 (i) | |
Net asset value, beginning of period | | $18.41 | | | $31.56 | | | $30.71 | | | $25.77 | | | $24.90 | |
| Income (loss) from investment operations | | | | | | | | | | | | | | | |
Net investment income (d) | | $0.16 | | | $0.26 | | | $0.24 | | | $0.04 | | | $0.02 | |
Net realized and unrealized gain (loss)
on investments and foreign currency | | 3.02 | | | (10.05 | ) | | 4.56 | | | 6.07 | | | 0.85 | (g) |
Total from investment operations | | $3.18 | | | $(9.79 | ) | | $4.80 | | | $6.11 | | | $0.87 | |
| Less distributions declared to shareholders | | | | | | | | | | | | | | | |
From net investment income | | $(0.28 | ) | | $(0.17 | ) | | $(0.64 | ) | | $— | | | $— | |
From net realized gain on investments | | (1.11 | ) | | (3.19 | ) | | (3.31 | ) | | (1.17 | ) | | — | |
Total distributions declared to shareholders | | $(1.39 | ) | | $(3.36 | ) | | $(3.95 | ) | | $(1.17 | ) | | $— | |
Net asset value, end of period | | $20.20 | | | $18.41 | | | $31.56 | | | $30.71 | | | $25.77 | |
Total return (%) (r)(s) | | 18.94 | | | (34.56 | ) | | 17.22 | | | 24.54 | | | 3.49 | (n) |
Ratios (%) (to average net assets)
and Supplemental data: | | | | | | | | | | | | | | | |
Expenses before expense reductions (f) | | 1.52 | | | 1.47 | | | 1.61 | | | 1.63 | | | 1.73 | (a) |
Expenses after expense reductions (f) | | 1.52 | | | 1.47 | | | 1.61 | | | 1.63 | | | 1.73 | (a) |
Net investment income | | 0.96 | | | 1.04 | | | 0.81 | | | 0.14 | | | 0.13 | (a) |
Portfolio turnover | | 17 | | | 23 | | | 27 | | | 39 | | | 39 | |
Net assets at end of period (000 omitted) | | $11,265 | | | $8,939 | | | $14,293 | | | $8,703 | | | $84 | |
See Notes to Financial Statements
22
Financial Highlights – continued
| | | | | | | | | | | | | | | |
| Class R4 | | Years ended 10/31 | |
| | | 2009 | | | 2008 | | | 2007 | | | 2006 | | | 2005 (i) | |
| Net asset value, beginning of period | | $18.56 | | | $31.80 | | | $30.86 | | | $25.81 | | | $24.90 | |
| Income (loss) from investment operations | | | | | | | | | | | | | | | |
Net investment income (d) | | $0.22 | | | $0.37 | | | $0.05 | | | $0.53 | | | $0.08 | |
Net realized and unrealized gain (loss)
on investments and foreign currency | | 3.03 | | | (10.17 | ) | | 4.87 | | | 5.69 | | | 0.83 | (g) |
| Total from investment operations | | $3.25 | | | $(9.80 | ) | | $4.92 | | | $6.22 | | | $0.91 | |
| Less distributions declared to shareholders | | | | | | | | | | | | | | | |
From net investment income | | $(0.33 | ) | | $(0.25 | ) | | $(0.67 | ) | | $— | | | $— | |
From net realized gain on investments | | (1.11 | ) | | (3.19 | ) | | (3.31 | ) | | (1.17 | ) | | — | |
Total distributions declared to shareholders | | $(1.44 | ) | | $(3.44 | ) | | $(3.98 | ) | | $(1.17 | ) | | $— | |
Net asset value, end of period | | $20.37 | | | $18.56 | | | $31.80 | | | $30.86 | | | $25.81 | |
Total return (%) (r)(s) | | 19.25 | | | (34.40 | ) | | 17.58 | | | 24.95 | | | 3.65 | (n) |
Ratios (%) (to average net assets)
and Supplemental data: | | | | | | | | | | | | | | | |
Expenses before expense reductions (f) | | 1.28 | | | 1.23 | | | 1.31 | | | 1.29 | | | 1.44 | (a) |
Expenses after expense reductions (f) | | 1.28 | | | 1.23 | | | 1.31 | | | 1.29 | | | 1.44 | (a) |
Net investment income | | 1.25 | | | 1.39 | | | 0.23 | | | 1.88 | | | 0.54 | (a) |
Portfolio turnover | | 17 | | | 23 | | | 27 | | | 39 | �� | | 39 | |
Net assets at end of period (000 omitted) | | $631 | | | $552 | | | $5,297 | | | $65 | | | $52 | |
Any redemption fees charged by the fund during the 2005 fiscal year resulted in a per share impact of less than $0.01.
| (d) | Per share data is based on average shares outstanding. |
| (f) | Ratios do not reflect reductions from fees paid indirectly, if applicable. |
| (g) | The per share amount varies from the net realized and unrealized gain/loss for the period because of the timing of sales of fund shares and the per share amount of realized and unrealized gains and losses at such time. |
| (i) | For the period from the class’ inception, April 1, 2005, through the stated period end. |
| (r) | Certain expenses have been reduced without which performance would have been lower. |
| (s) | From time to time the fund may receive proceeds from litigation settlements, without which performance would be lower. |
| (t) | Total returns do not include any applicable sales charges. |
See Notes to Financial Statements
23
NOTES TO FINANCIAL STATEMENTS
| (1) | | Business and Organization |
MFS Global Equity Fund (the fund) is a series of MFS Series Trust VI (the trust). The trust is organized as a Massachusetts business trust and is registered under the Investment Company Act of 1940, as amended, as an open-end management investment company.
| (2) | | Significant Accounting Policies |
General – The preparation of financial statements in conformity with U.S. generally accepted accounting principles requires management to make estimates and assumptions that affect the reported amounts of assets and liabilities, and disclosure of contingent assets and liabilities at the date of the financial statements and the reported amounts of revenues and expenses during the reporting period. In making these estimates and assumptions, management has considered the effects, if any, of events occurring after the date of the fund’s Statement of Assets and Liabilities through December 17, 2009 which is the date that the financial statements were issued. Actual results could differ from those estimates. The fund can invest in foreign securities, including securities of emerging market issuers. Investments in foreign securities are vulnerable to the effects of changes in the relative values of the local currency and the U.S. dollar and to the effects of changes in each country’s legal, political, and economic environment. The markets of emerging markets countries are generally more volatile than the markets of developed countries with more mature economies. All of the risks of investing in foreign securities previously described are heightened when investing in emerging markets countries.
Investment Valuations – Equity securities, including restricted equity securities, are generally valued at the last sale or official closing price as provided by a third-party pricing service on the market or exchange on which they are primarily traded. Equity securities, for which there were no sales reported that day, are generally valued at the last quoted daily bid quotation as provided by a third-party pricing service on the market or exchange on which such securities are primarily traded. Equity securities held short, for which there were no sales reported for that day, are generally valued at the last quoted daily ask quotation as provided by a third-party pricing service on the market or exchange on which such securities are primarily traded. Short-term instruments with a maturity at issuance of 60 days or less generally are valued at amortized cost, which approximates market value. Forward foreign currency contracts are generally valued at the mean of bid and asked prices for the time period interpolated from rates provided by a third-party pricing service for proximate time periods. Open-end investment companies are generally valued
24
Notes to Financial Statements – continued
at net asset value per share. Securities and other assets generally valued on the basis of information from a third-party pricing service may also be valued at a broker/dealer bid quotation. Values obtained from third-party pricing services can utilize both transaction data and market information such as yield, quality, coupon rate, maturity, type of issue, trading characteristics, and other market data. The values of foreign securities and other assets and liabilities expressed in foreign currencies are converted to U.S. dollars using the mean of bid and asked prices for rates provided by a third-party pricing service.
The Board of Trustees has delegated primary responsibility for determining or causing to be determined the value of the fund’s investments (including any fair valuation) to the adviser pursuant to valuation policies and procedures approved by the Board. If the adviser determines that reliable market quotations are not readily available, investments are valued at fair value as determined in good faith by the adviser in accordance with such procedures under the oversight of the Board of Trustees. Under the fund’s valuation policies and procedures, market quotations are not considered to be readily available for most types of debt instruments and floating rate loans and many types of derivatives. These investments are generally valued at fair value based on information from third-party pricing services. In addition, investments may be valued at fair value if the adviser determines that an investment’s value has been materially affected by events occurring after the close of the exchange or market on which the investment is principally traded (such as foreign exchange or market) and prior to the determination of the fund’s net asset value, or after the halting of trading of a specific security where trading does not resume prior to the close of the exchange or market on which the security is principally traded. Events that occur on a frequent basis after foreign markets close (such as developments in foreign markets and significant movements in the U.S. markets) and prior to the determination of the fund’s net asset value may be deemed to have a material affect on the value of securities traded in foreign markets. Accordingly, the fund’s foreign equity securities may often be valued at fair value. The adviser generally relies on third-party pricing services or other information (such as the correlation with price movements of similar securities in the same or other markets; the type, cost and investment characteristics of the security; the business and financial condition of the issuer; and trading and other market data) to assist in determining whether to fair value and at what value to fair value an investment. The value of an investment for purposes of calculating the fund’s net asset value can differ depending on the source and method used to determine value. When fair valuation is used, the value of an investment used to determine the fund’s net asset value may differ from quoted or published prices for the same investment. There can be no assurance that the fund could
25
Notes to Financial Statements – continued
obtain the fair value assigned to an investment if it were to sell the investment at the same time at which the fund determines its net asset value per share.
The fund has adopted FASB Accounting Standard Codification 820, Fair Value Measurements and Disclosures (“ASC 820”), which provides a single definition of fair value, a hierarchy for measuring fair value and expanded disclosures about fair value measurements.
Various inputs are used in determining the value of the fund’s assets or liabilities carried at market value. These inputs are categorized into three broad levels. In certain cases, the inputs used to measure fair value may fall into different levels of the fair value hierarchy. In such cases, an investment’s level within the fair value hierarchy is based on the lowest level of input that is significant to the fair value measurement. The fund’s assessment of the significance of a particular input to the fair value measurement in its entirety requires judgment, and considers factors specific to the investment. Level 1 includes unadjusted quoted prices in active markets for identical assets or liabilities. Level 2 includes other significant observable market-based inputs (including quoted prices for similar securities, interest rates, prepayment speed, and credit risk). Level 3 includes unobservable inputs, which may include the adviser’s own assumptions in determining the fair value of investments. Other financial instruments are derivative instruments not reflected in total investments, such as futures, forwards, swap contracts, and written options. The following is a summary of the levels used as of October 31, 2009 in valuing the fund’s assets or liabilities carried at market value:
| | | | | | | | |
| Investments at Value | | Level 1 | | Level 2 | | Level 3 | | Total |
| Equity Securities: | | | | | | | | |
United States | | $158,653,361 | | $— | | $— | | $158,653,361 |
France | | 5,345,110 | | 49,239,917 | | — | | 54,585,027 |
Switzerland | | 3,454,455 | | 49,159,577 | | — | | 52,614,032 |
United Kingdom | | 1,346,288 | | 38,434,455 | | — | | 39,780,743 |
Germany | | 9,930,821 | | 20,677,118 | | — | | 30,607,939 |
Japan | | — | | 24,911,616 | | — | | 24,911,616 |
Netherlands | | 15,288,280 | | 9,216,620 | | — | | 24,504,900 |
Canada | | 5,587,446 | | — | | — | | 5,587,446 |
South Korea | | — | | 5,048,734 | | — | | 5,048,734 |
Other Countries | | 2,611,868 | | 6,106,339 | | — | | 8,718,207 |
| Mutual Funds | | 2,272,358 | | — | | — | | 2,272,358 |
| Total Investments | | $204,489,987 | | $202,794,376 | | $— | | $407,284,363 |
Country disclosure is based on the country of domicile. For further information regarding security characteristics, see the Portfolio of Investments.
Repurchase Agreements – The fund may enter into repurchase agreements with approved counterparties. Each repurchase agreement is recorded at cost.
26
Notes to Financial Statements – continued
The fund requires that the securities collateral in a repurchase transaction be transferred to a custodian. The fund monitors, on a daily basis, the value of the collateral to ensure that its value, including accrued interest, is greater than amounts owed to the fund under each such repurchase agreement.
Foreign Currency Translation – Purchases and sales of foreign investments, income, and expenses are converted into U.S. dollars based upon currency exchange rates prevailing on the respective dates of such transactions or on the reporting date for foreign denominated receivables and payables. Gains and losses attributable to foreign currency exchange rates on sales of securities are recorded for financial statement purposes as net realized gains and losses on investments. Gains and losses attributable to foreign exchange rate movements on receivables, payables, income and expenses are recorded for financial statement purposes as foreign currency transaction gains and losses. That portion of both realized and unrealized gains and losses on investments that results from fluctuations in foreign currency exchange rates is not separately disclosed.
Derivatives – The fund may use derivatives for different purposes, including to earn income and enhance returns, to increase or decrease exposure to a particular market, to manage or adjust the risk profile of the fund, or as alternatives to direct investments. Derivatives may be used for hedging or non-hedging purposes. While hedging can reduce or eliminate losses, it can also reduce or eliminate gains. When the fund uses derivatives as an investment to increase market exposure, or for hedging purposes, gains and losses from derivative instruments may be substantially greater than the derivative’s original cost.
Derivative instruments include written options, purchased options, futures contracts, forward foreign currency exchange contracts, and swap agreements. For the year ended October 31, 2009, the fund did not invest in any derivative instruments and accordingly there is no impact to the financial statements.
Security Loans – JPMorgan Chase and Co. (“Chase”), as lending agent, may loan the securities of the fund to certain qualified institutions (the “Borrowers”) approved by the fund. The loans are collateralized by cash and/or U.S. Treasury and federal agency obligations in an amount typically at least equal to the market value of the securities loaned. The market value of the loaned securities is determined at the close of business of the fund and any additional required collateral is delivered to the fund on the next business day. Chase provides the fund with indemnification against Borrower default. The fund bears the risk of loss with respect to the investment of cash collateral. On loans collateralized by cash, the cash collateral is invested in short-term securities. A portion of the income generated upon investment of the collateral is remitted to the Borrowers, and the remainder is allocated between the fund
27
Notes to Financial Statements – continued
and the lending agent. On loans collateralized by U.S. Treasury and/or federal agency obligations, a fee is received from the Borrower, and is allocated between the fund and the lending agent. Income from securities lending is included in interest income on the Statement of Operations. The dividend and interest income earned on the securities loaned is accounted for in the same manner as other dividend and interest income. At October 31, 2009, there were no securities on loan.
Indemnifications – Under the fund’s organizational documents, its officers and Trustees may be indemnified against certain liabilities and expenses arising out of the performance of their duties to the fund. Additionally, in the normal course of business, the fund enters into agreements with service providers that may contain indemnification clauses. The fund’s maximum exposure under these agreements is unknown as this would involve future claims that may be made against the fund that have not yet occurred.
Investment Transactions and Income – Investment transactions are recorded on the trade date. Interest income is recorded on the accrual basis. All premium and discount is amortized or accreted for financial statement purposes in accordance with U.S. generally accepted accounting principles. Dividends received in cash are recorded on the ex-dividend date. Certain dividends from foreign securities will be recorded when the fund is informed of the dividend if such information is obtained subsequent to the ex-dividend date. Dividend and interest payments received in additional securities are recorded on the ex-dividend or ex-interest date in an amount equal to the value of the security on such date.
The fund may receive proceeds from litigation settlements. Any proceeds received from litigation involving portfolio holdings are reflected in the Statement of Operations in realized gain/loss if the security has been disposed of by the fund or in unrealized gain/loss if the security is still held by the fund. Any other proceeds from litigation not related to portfolio holdings are reflected as other income in the Statement of Operations.
Fees Paid Indirectly – The fund’s custody fee may be reduced according to an arrangement that measures the value of cash deposited with the custodian by the fund. This amount, for the year ended October 31, 2009, is shown as a reduction of total expenses on the Statement of Operations.
Tax Matters and Distributions – The fund intends to qualify as a regulated investment company, as defined under Subchapter M of the Internal Revenue Code, and to distribute all of its taxable income, including realized capital gains. As a result, no provision for federal income tax is required. The fund’s federal tax returns for the prior three fiscal years remain subject to examination by the Internal Revenue Service. Foreign taxes, if any, have been accrued by the fund in the accompanying financial statements.
28
Notes to Financial Statements – continued
Distributions to shareholders are recorded on the ex-dividend date. Income and capital gain distributions are determined in accordance with income tax regulations, which may differ from U.S. generally accepted accounting principles. Certain capital accounts in the financial statements are periodically adjusted for permanent differences in order to reflect their tax character. These adjustments have no impact on net assets or net asset value per share. Temporary differences which arise from recognizing certain items of income, expense, gain or loss in different periods for financial statement and tax purposes will reverse at some time in the future. Distributions in excess of net investment income or net realized gains are temporary overdistributions for financial statement purposes resulting from differences in the recognition or classification of income or distributions for financial statement and tax purposes.
Book/tax differences primarily relate to wash sale loss deferrals and foreign taxes.
The tax character of distributions declared to shareholders for the last two fiscal years is as follows:
| | | | |
| | | 10/31/09 | | 10/31/08 |
| Ordinary income (including any short-term capital gains) | | $6,854,304 | | $6,806,080 |
| Long-term capital gain | | 23,141,778 | | 74,157,094 |
| Total distributions | | $29,996,082 | | $80,963,174 |
The federal tax cost and the tax basis components of distributable earnings were as follows:
| | | |
| As of 10/31/09 | | | |
| Cost of investments | | $393,188,278 | |
| Gross appreciation | | 61,146,814 | |
| Gross depreciation | | (47,050,729 | ) |
| Net unrealized appreciation (depreciation) | | $14,096,085 | |
| |
| Undistributed ordinary income | | 3,396,906 | |
| Capital loss carryforwards | | (12,098,244 | ) |
| Other temporary differences | | (25,130 | ) |
As of October 31, 2009, the fund had capital loss carryforwards available to offset future realized gains. Such losses expire as follows:
Multiple Classes of Shares of Beneficial Interest – The fund offers multiple classes of shares, which differ in their respective distribution and service fees. The fund’s income, realized and unrealized gain (loss), and common expenses are allocated to shareholders based on the daily net assets of each class. Dividends are declared separately for each class. Differences in per share
29
Notes to Financial Statements – continued
dividend rates are generally due to differences in separate class expenses. Class B shares will convert to Class A shares approximately eight years after purchase. The fund’s distributions declared to shareholders as reported on the Statements of Changes in Net Assets are presented by class as follows:
| | | | | | | | |
| | | From net investment
income | | From net realized gain on
investments |
| | | Year ended
10/31/09 | | Year ended
10/31/08 | | Year ended
10/31/09 | | Year ended
10/31/08 |
| Class A | | $3,942,190 | | $2,818,327 | | $15,275,424 | | $47,448,511 |
| Class B | | 75,804 | | — | | 2,341,277 | | 9,708,653 |
| Class C | | 149,053 | | 43,366 | | 1,722,265 | | 5,397,030 |
| Class I | | 942,596 | | 616,920 | | 2,933,832 | | 7,640,525 |
| Class J (f) | | 28,315 | | — | | 384,108 | | 1,481,047 |
| Class R (b) | | — | | — | | — | | 471,843 |
| Class R1 | | 21,512 | | 25,251 | | 216,806 | | 569,906 |
| Former Class R2 (b) | | — | | 4,110 | | — | | 102,375 |
| Class R2 | | 219,417 | | 120,877 | | 1,052,907 | | 2,356,874 |
| Class R3 | | 129,672 | | 82,742 | | 518,575 | | 1,524,560 |
| Class R4 | | 9,665 | | 40,356 | | 32,664 | | 509,901 |
| Total | | $5,518,224 | | $3,751,949 | | $24,477,858 | | $77,211,225 |
| (b) | At the close of business on April 18, 2008, Class R and Class R2 shares converted into Class R3 shares. Following this conversion, Class R3, Class R4, and Class R5 shares were renamed Class R2, Class R3, and Class R4 shares, respectively. |
| (f) | Class J shares closed on February 27, 2009. |
| (3) | | Transactions with Affiliates |
Investment Adviser – The fund has an investment advisory agreement with MFS to provide overall investment management and related administrative services and facilities to the fund.
The management fee is computed daily and paid monthly at the following annual rates:
| | | |
| First $1 billion of average daily net assets | | 0.90 | % |
| Next $1 billion of average daily net assets | | 0.75 | % |
| Average daily net assets in excess of $2 billion | | 0.65 | % |
The management fee incurred for the year ended October 31, 2009 was equivalent to an annual effective rate of 0.90% of the fund’s average daily net assets.
Distributor – MFS Fund Distributors, Inc. (MFD), a wholly-owned subsidiary of MFS, as distributor, received $22,843 for the year ended October 31, 2009, as its portion of the initial sales charge on sales of Class A shares of the fund.
The Board of Trustees has adopted a distribution plan for certain class shares pursuant to Rule 12b-1 of the Investment Company Act of 1940.
The fund’s distribution plan provides that the fund will pay MFD for services provided by MFD and financial intermediaries in connection with the
30
Notes to Financial Statements – continued
distribution and servicing of certain share classes. One component of the plan is a distribution fee paid to MFD and another component of the plan is a service fee paid to MFD. MFD may subsequently pay all, or a portion, of the distribution and/or service fees to financial intermediaries.
Distribution Plan Fee Table:
| | | | | | | | | | |
| | | Distribution
Fee Rate (d) | | Service
Fee Rate (d) | | Total
Distribution
Plan (d) | | Annual
Effective
Rate (e) | | Distribution
and Service
Fee |
| Class A | | — | | 0.25% | | 0.25% | | 0.25% | | $612,907 |
| Class B | | 0.75% | | 0.25% | | 1.00% | | 1.00% | | 302,663 |
| Class C | | 0.75% | | 0.25% | | 1.00% | | 1.00% | | 244,493 |
| Class J (f) | | 0.70% | | 0.25% | | 0.95% | | 0.95% | | 15,660 |
| Class R1 | | 0.75% | | 0.25% | | 1.00% | | 1.00% | | 33,525 |
| Class R2 | | 0.25% | | 0.25% | | 0.50% | | 0.50% | | 82,816 |
| Class R3 | | — | | 0.25% | | 0.25% | | 0.25% | | 22,250 |
| Total Distribution and Service Fees | | | | | | | | $1,314,314 |
| (d) | In accordance with the distribution plan for certain classes, the fund pays distribution and/or service fees equal to these annual percentage rates of each class’ average daily net assets. The distribution and service fee rates disclosed by class represent the current rates in effect at the end of the reporting period. Any rate changes, if applicable, are detailed below. |
| (e) | The annual effective rates represent actual fees incurred under the distribution plan for the year ended October 31, 2009 based on each class’ average daily net assets. Prior to March 1, 2009, payment of the 0.10% annual Class A distribution fee was not in effect. Effective March 1, 2009, the 0.10% Class A annual distribution fee was eliminated. |
| (f) | Includes fees that MFD pays to financial intermediaries and for services rendered as the fund’s agent company in Japan. Class J shares closed on February 27, 2009. |
Certain Class A shares purchased prior to September 1, 2008 are subject to a contingent deferred sales charge (CDSC) in the event of a shareholder redemption within 12 months of purchase. Certain Class A shares purchased on or subsequent to September 1, 2008 are subject to a CDSC in the event of a shareholder redemption within 24 months of purchase. Class C shares are subject to a CDSC in the event of a shareholder redemption within 12 months of purchase. Class B shares are subject to a CDSC in the event of a shareholder redemption within six years of purchase. All contingent deferred sales charges are paid to MFD and during the year ended October 31, 2009, were as follows:
| | |
| | | Amount |
| Class A | | $601 |
| Class B | | 33,444 |
| Class C | | 1,165 |
Shareholder Servicing Agent – MFS Service Center, Inc. (MFSC), a wholly-owned subsidiary of MFS, receives a fee from the fund for its services as shareholder servicing agent calculated as a percentage of the average daily net assets of the fund as determined periodically under the supervision of the fund’s Board of Trustees. For the year ended October 31, 2009, the fee was
31
Notes to Financial Statements – continued
$376,097, which equated to 0.0994% annually of the fund’s average daily net assets. MFSC also receives payment from the fund for out-of-pocket expenses, sub-accounting and other shareholder servicing costs which may be paid to affiliated and unaffiliated service providers. For the year ended October 31, 2009, these out-of-pocket expenses, sub-accounting and other shareholder servicing costs amounted to $541,760.
Administrator – MFS provides certain financial, legal, shareholder communications, compliance, and other administrative services to the fund. Under an administrative services agreement, the fund partially reimburses MFS the costs incurred to provide these services. The fund is charged an annual fixed amount of $17,500 plus a fee based on average daily net assets. The administrative services fee incurred for the year ended October 31, 2009 was equivalent to an annual effective rate of 0.0213% of the fund’s average daily net assets.
Trustees’ and Officers’ Compensation – The fund pays compensation to independent Trustees in the form of a retainer, attendance fees, and additional compensation to Board and Committee chairpersons. The fund does not pay compensation directly to Trustees or officers of the fund who are also officers of the investment adviser, all of whom receive remuneration for their services to the fund from MFS. Certain officers and Trustees of the fund are officers or directors of MFS, MFD, and MFSC.
Prior to December 31, 2001, the fund had an unfunded defined benefit plan (“DB plan”) for independent Trustees. As of December 31, 2001, the Board took action to terminate the DB plan with respect to then-current and any future independent Trustees, such that the DB Plan covers only certain of those former independent Trustees who retired on or before December 31, 2001. Effective January 1, 2002, accrued benefits under the DB Plan for then-current independent Trustees who continued were credited to an unfunded retirement deferral plan (the “Retirement Deferral plan”), which was established for and exists solely with respect to these credited amounts, and is not available for other deferrals by these or other independent Trustees. Although the Retirement Deferral plan is unfunded, amounts deferred under the plan are periodically adjusted for investment experience as if they had been invested in shares of the fund. The DB Plan resulted in a pension expense of $2,481 and the Retirement Deferral plan resulted in a net decrease in expense of $1,127. Both amounts are included in independent Trustees’ compensation for the year ended October 31, 2009. The liability for deferred retirement benefits payable to certain independent Trustees under both plans amounted to $43,956 at October 31, 2009, and is included in payable for independent Trustees’ compensation on the Statement of Assets and Liabilities.
32
Notes to Financial Statements – continued
Other – This fund and certain other funds managed by MFS (the funds) have entered into services agreements (the Agreements) which provide for payment of fees by the funds to Tarantino LLC and Griffin Compliance LLC in return for the provision of services of an Independent Chief Compliance Officer (ICCO) and Assistant ICCO, respectively, for the funds. The ICCO and Assistant ICCO are officers of the funds and the sole members of Tarantino LLC and Griffin Compliance LLC, respectively. The funds can terminate the Agreements with Tarantino LLC and Griffin Compliance LLC at any time under the terms of the Agreements. For the year ended October 31, 2009, the aggregate fees paid by the fund to Tarantino LLC and Griffin Compliance LLC were $4,664 and are included in miscellaneous expense on the Statement of Operations. MFS has agreed to reimburse the fund for a portion of the payments made by the fund in the amount of $2,409, which is shown as a reduction of total expenses in the Statement of Operations. Additionally, MFS has agreed to bear all expenses associated with office space, other administrative support, and supplies provided to the ICCO and Assistant ICCO.
The fund may invest in a money market fund managed by MFS which seeks a high level of current income consistent with preservation of capital and liquidity. Income earned on this investment is included in dividends from underlying funds on the Statement of Operations. This money market fund does not pay a management fee to MFS.
Purchases and sales of investments, other than U.S. Government securities, purchased option transactions, and short-term obligations, aggregated $65,344,952 and $129,927,444, respectively.
33
Notes to Financial Statements – continued
| (5) | | Shares of Beneficial Interest |
The fund’s Declaration of Trust permits the Trustees to issue an unlimited number of full and fractional shares of beneficial interest. Transactions in fund shares were as follows:
| | | | | | | | | |
| | | Year ended
10/31/09 | | Year ended
10/31/08 |
| | | Shares | | Amount | | Shares | | | Amount |
| Shares sold | | | | | | | | | |
Class A | | 2,510,880 | | $42,460,515 | | 3,506,592 | | | $95,399,638 |
Class B | | 208,083 | | 3,359,888 | | 194,481 | | | 4,693,530 |
Class C | | 223,886 | | 3,432,199 | | 219,281 | | | 5,312,965 |
Class I | | 1,345,704 | | 25,170,599 | | 898,905 | | | 23,842,778 |
Class J (f) | | 546 | | 8,423 | | 0 | (1) | | 101 |
Class R (b) | | — | | — | | 103,206 | | | 3,103,883 |
Class R1 | | 49,237 | | 775,046 | | 97,315 | | | 2,523,558 |
Former Class R2 (b) | | — | | — | | 11,265 | | | 290,282 |
Class R2 | | 222,986 | | 3,694,023 | | 519,532 | | | 13,638,414 |
Class R3 | | 176,420 | | 2,920,809 | | 163,648 | | | 4,385,440 |
Class R4 | | 6,578 | | 114,499 | | 36,818 | | | 959,139 |
| | 4,744,320 | | $81,936,001 | | 5,751,043 | | | $154,149,728 |
| Shares issued to shareholders in reinvestment of distributions | | | | | | | | | |
Class A | | 1,076,556 | | $17,946,135 | | 1,691,798 | | | $46,930,408 |
Class B | | 144,427 | | 2,264,623 | | 339,588 | | | 8,839,547 |
Class C | | 102,679 | | 1,556,612 | | 191,843 | | | 4,859,367 |
Class I | | 227,891 | | 3,876,428 | | 291,885 | | | 8,257,445 |
Class J (f) | | 225 | | 3,465 | | 320 | | | 8,220 |
Class R (b) | | — | | — | | 14,427 | | | 397,452 |
Class R1 | | 15,495 | | 238,318 | | 23,168 | | | 595,157 |
Former Class R2 (b) | | — | | — | | 4,106 | | | 106,485 |
Class R2 | | 75,143 | | 1,223,324 | | 91,329 | | | 2,477,751 |
Class R3 | | 39,075 | | 648,247 | | 58,215 | | | 1,607,302 |
Class R4 | | 2,536 | | 42,329 | | 19,816 | | | 550,257 |
| | 1,684,027 | | $27,799,481 | | 2,726,495 | | | $74,629,391 |
34
Notes to Financial Statements – continued
| | | | | | | | | | | | |
| | | Year ended
10/31/09 | | | Year ended
10/31/08 | |
| | | Shares | | | Amount | | | Shares | | | Amount | |
| Shares reacquired | | | | | | | | | | | | |
Class A | | (3,610,383 | ) | | $(60,136,121 | ) | | (6,098,268 | ) | | $(159,848,690 | ) |
Class B | | (982,347 | ) | | (15,265,083 | ) | | (1,757,804 | ) | | (43,292,551 | ) |
Class C | | (358,451 | ) | | (5,364,955 | ) | | (602,595 | ) | | (13,968,493 | ) |
Class I | | (2,699,865 | ) | | (54,504,065 | ) | | (1,002,335 | ) | | (25,479,010 | ) |
Class J (f) | | (382,972 | ) | | (4,967,052 | ) | | (89,229 | ) | | (2,074,392 | ) |
Class R (b) | | — | | | — | | | (324,950 | ) | | (9,283,684 | ) |
Class R1 | | (36,348 | ) | | (542,946 | ) | | (68,569 | ) | | (1,626,339 | ) |
Former Class R2 (b) | | — | | | — | | | (44,102 | ) | | (1,104,978 | ) |
Class R2 | | (284,182 | ) | | (4,684,394 | ) | | (340,460 | ) | | (8,412,921 | ) |
Class R3 | | (143,339 | ) | | (2,375,596 | ) | | (189,298 | ) | | (4,692,381 | ) |
Class R4 | | (7,861 | ) | | (136,568 | ) | | (193,516 | ) | | (4,728,711 | ) |
| | (8,505,748 | ) | | $(147,976,780 | ) | | (10,711,126 | ) | | $(274,512,150 | ) |
| Net change | | | | | | | | | | | | |
Class A | | (22,947 | ) | | $270,529 | | | (899,878 | ) | | $(17,518,644 | ) |
Class B | | (629,837 | ) | | (9,640,572 | ) | | (1,223,735 | ) | | (29,759,474 | ) |
Class C | | (31,886 | ) | | (376,144 | ) | | (191,471 | ) | | (3,796,161 | ) |
Class I | | (1,126,270 | ) | | (25,457,038 | ) | | 188,455 | | | 6,621,213 | |
Class J (f) | | (382,201 | ) | | (4,955,164 | ) | | (88,909 | ) | | (2,066,071 | ) |
Class R (b) | | — | | | — | | | (207,317 | ) | | (5,782,349 | ) |
Class R1 | | 28,384 | | | 470,418 | | | 51,914 | | | 1,492,376 | |
Former Class R2 (b) | | — | | | — | | | (28,731 | ) | | (708,211 | ) |
Class R2 | | 13,947 | | | 232,953 | | | 270,401 | | | 7,703,244 | |
Class R3 | | 72,156 | | | 1,193,460 | | | 32,565 | | | 1,300,361 | |
Class R4 | | 1,253 | | | 20,260 | | | (136,882 | ) | | (3,219,315 | ) |
| | (2,077,401 | ) | | $(38,241,298 | ) | | (2,233,588 | ) | | $(45,733,031 | ) |
| (b) | At the close of business on April 18, 2008, Class R and Class R2 shares converted into Class R3 shares. Following this conversion, Class R3, Class R4, and Class R5 shares were renamed Class R2, Class R3, and Class R4 shares, respectively. |
| (f) | Class J shares closed on February 27, 2009. |
The fund and certain other funds managed by MFS participate in a $1.1 billion unsecured committed line of credit, subject to a $1 billion sublimit, provided by a syndication of banks under a credit agreement. Borrowings may be made for temporary financing needs. Interest is charged to each fund, based on its borrowings, generally at a rate equal to the higher of the Federal Reserve funds rate or one month LIBOR plus an agreed upon spread. A commitment fee, based on the average daily, unused portion of the committed line of credit, is allocated among the participating funds at the end of each calendar quarter. In addition, the fund and other funds managed by MFS have established
35
Notes to Financial Statements – continued
unsecured uncommitted borrowing arrangements with certain banks for temporary financing needs. Interest is charged to each fund, based on its borrowings, at a rate equal to the Federal Reserve funds rate plus an agreed upon spread. For the year ended October 31, 2009, the fund’s commitment fee and interest expense were $5,413 and $6,133, respectively, and are included in miscellaneous expense on the Statement of Operations.
| (7) | | Transactions in Underlying Funds-Affiliated Issuers |
An affiliated issuer may be considered one in which the fund owns 5% or more of the outstanding voting securities, or a company which is under common control. For the purposes of this report, the fund assumes the following to be affiliated issuers:
| | | | | | | | | |
| Underlying Funds | | Beginning
Shares/Par
Amount | | Acquisitions
Shares/Par
Amount | | Dispositions
Shares/Par
Amount | | | Ending
Shares/Par
Amount |
MFS Institutional Money
Market Portfolio | | 2,072,364 | | 58,125,216 | | (57,925,222 | ) | | 2,272,358 |
| | | | |
| Underlying Funds | | Realized
Gain (Loss) | | Capital Gain
Distributions | | Dividend
Income | | | Ending
Value |
MFS Institutional Money
Market Portfolio | | $— | | $— | | $10,075 | | | $2,272,358 |
36
REPORT OF INDEPENDENT REGISTERED PUBLIC ACCOUNTING FIRM
To the Trustees of MFS Series Trust VI and Shareholders of MFS Global Equity Fund:
We have audited the accompanying statement of assets and liabilities of MFS Global Equity Fund (the Fund), (one of the portfolios comprising MFS Series Trust VI), including the portfolio of investments, as of October 31, 2009, and the related statement of operations for the year then ended, the statements of changes in net assets for each of the two years in the period then ended, and the financial highlights for each of the periods indicated therein. These financial statements and financial highlights are the responsibility of the Fund’s management. Our responsibility is to express an opinion on these financial statements and financial highlights based on our audits.
We conducted our audits in accordance with the standards of the Public Company Accounting Oversight Board (United States). Those standards require that we plan and perform the audit to obtain reasonable assurance about whether the financial statements and financial highlights are free of material misstatement. We were not engaged to perform an audit of the Fund’s internal control over financial reporting. Our audits included consideration of internal control over financial reporting as a basis for designing audit procedures that are appropriate in the circumstances, but not for the purpose of expressing an opinion on the effectiveness of the Fund’s internal control over financial reporting. Accordingly, we express no such opinion. An audit also includes examining, on a test basis, evidence supporting the amounts and disclosures in the financial statements and financial highlights, assessing the accounting principles used and significant estimates made by management, and evaluating the overall financial statement presentation. Our procedures included confirmation of securities owned as of October 31, 2009, by correspondence with the custodian and brokers or by other appropriate auditing procedures where replies from brokers were not received. We believe that our audits provide a reasonable basis for our opinion.
In our opinion, the financial statements and financial highlights referred to above present fairly, in all material respects, the financial position of MFS Global Equity Fund at October 31, 2009, the results of its operations for the year then ended, the changes in its net assets for each of the two years in the period then ended, and its financial highlights for each of the periods indicated therein, in conformity with U.S. generally accepted accounting principles.

Boston, Massachusetts
December 17, 2009
37
TRUSTEES AND OFFICERS —
IDENTIFICATION AND BACKGROUND
The Trustees and officers of the Trust, as of December 1, 2009, are listed below, together with their principal occupations during the past five years. (Their titles may have varied during that period.) The address of each Trustee and officer is 500 Boylston Street, Boston, Massachusetts 02116.
| | | | | | |
Name, Date of Birth | | Position(s) Held
with Fund | | Trustee/Officer
Since (h) | | Principal Occupations During
the Past Five Years & Other
Directorships (j) |
| INTERESTED TRUSTEES | | | | |
Robert J. Manning (k)
(born 10/20/63) | | Trustee | | February 2004 | | Massachusetts Financial Services Company, Chief Executive Officer, President, Chief Investment Officer and Director |
Robert C. Pozen (k)
(born 8/08/46) | | Trustee | | February 2004 | | Massachusetts Financial Services Company, Chairman (since February 2004); Medtronic, Inc, (medical devices), Director (since 2004); Harvard Business School (education), Senior Lecturer (since 2008); Bell Canada Enterprises (telecommunications), Director (until February 2009); The Bank of New York, Director (finance), (March 2004 to May 2005); Telesat (satellite communications), Director (until November 2007) |
| INDEPENDENT TRUSTEES | | | | |
David H. Gunning
(born 5/30/42) | | Trustee and Chair of Trustees | | January 2004 | | Retired; Cleveland-Cliffs Inc. (mining products and service provider), Vice Chairman/Director (until May 2007); Lincoln Electric Holdings, Inc. (welding equipment manufacturer), Director; Development Alternatives, Inc. (consulting), Director/Non Executive Chairman; Southwest Gas Corp. (natural gas distribution), Director (until May 2004); Portman Limited (mining), Director (until 2008) |
38
Trustees and Officers – continued
| | | | | | |
Name, Date of Birth | | Position(s) Held
with Fund | | Trustee/Officer
Since (h) | | Principal Occupations During
the Past Five Years & Other
Directorships (j) |
Robert E. Butler (n) (born 11/29/41) | | Trustee | | January 2006 | | Consultant – investment company industry regulatory and compliance matters (since July 2002); PricewaterhouseCoopers LLP (professional services firm), Partner (until 2002) |
Lawrence H. Cohn, M.D.
(born 3/11/37) | | Trustee | | June 1989 | | Brigham and Women’s Hospital, Senior Cardiac Surgeon (since 2005); Harvard Medical School, Professor of Cardiac Surgery; Partners HealthCare, Physician Director of Medical Device Technology (since 2006); Brigham and Women’s Hospital, Chief of Cardiac Surgery (until 2005) |
Maureen R. Goldfarb
(born 4/6/55) | | Trustee | | January 2009 | | Private investor; John Hancock Financial Services, Inc., Executive Vice President (until 2004); John Hancock Mutual Funds, Trustee and Chief Executive Officer (until 2004) |
William R. Gutow
(born 9/27/41) | | Trustee | | December 1993 | | Private investor and real estate consultant; Capital Entertainment Management Company (video franchise), Vice Chairman; Atlantic Coast Tan (tanning salons), Vice Chairman (until 2007); Texas Donuts (donut franchise), Vice Chairman (until 2009) |
Michael Hegarty
(born 12/21/44) | | Trustee | | December 2004 | | Private investor; AXA Financial (financial services and insurance), Vice Chairman and Chief Operating Officer (until 2001); The Equitable Life Assurance Society (insurance), President and Chief Operating Officer (until 2001) |
J. Atwood Ives
(born 5/01/36) | | Trustee | | February 1992 | | Private investor; KeySpan Corporation (energy related services), Director (until 2004) |
39
Trustees and Officers – continued
| | | | | | |
Name, Date of Birth | | Position(s) Held
with Fund | | Trustee/Officer
Since (h) | | Principal Occupations During
the Past Five Years & Other
Directorships (j) |
John P. Kavanaugh
(born 11/4/54) | | Trustee | | January 2009 | | Private investor; The Hanover Insurance Group, Inc., Vice President and Chief Investment Officer (until 2006); Allmerica Investment Trust, Allmerica Securities Trust and Opus Investment Trust (investment companies), Chairman, President and Trustee (until 2006) |
J. Dale Sherratt
(born 9/23/38) | | Trustee | | June 1989 | | Insight Resources, Inc. (acquisition planning specialists), President; Wellfleet Investments (investor in health care companies), Managing General Partner |
Laurie J. Thomsen
(born 8/05/57) | | Trustee | | March 2005 | | New Profit, Inc. (venture philanthropy), Executive Partner (since 2006); Private investor; The Travelers Companies (commercial property liability insurance), Director; Prism Venture Partners (venture capital), Co-founder and General Partner (until June 2004) |
Robert W. Uek
(born 5/18/41) | | Trustee | | January 2006 | | Consultant to investment company industry; PricewaterhouseCoopers LLP (professional services firm), Partner (until 1999); TT International Funds (mutual fund complex), Trustee (until 2005); Hillview Investment Trust II Funds (mutual fund complex), Trustee (until 2005) |
| OFFICERS | | | | | | |
Maria F. Dwyer (k)
(born 12/01/58) | | President | | March 2004 | | Massachusetts Financial Services Company, Executive Vice President and Chief Regulatory Officer (since March 2004) Chief Compliance Officer (since December 2006); Fidelity Management & Research Company, Vice President (prior to March 2004); Fidelity Group of Funds, President and Treasurer (until March 2004) |
40
Trustees and Officers – continued
| | | | | | |
Name, Date of Birth | | Position(s) Held
with Fund | | Trustee/Officer
Since (h) | | Principal Occupations During
the Past Five Years & Other
Directorships (j) |
Christopher R. Bohane (k)
(born 1/18/74) | | Assistant Secretary and Assistant Clerk | | July 2005 | | Massachusetts Financial Services Company, Vice President and Senior Counsel |
John M. Corcoran (k)
(born 04/13/65) | | Treasurer | | October 2008 | | Massachusetts Financial Services Company, Senior Vice President (since October 2008); State Street Bank and Trust (financial services provider), Senior Vice President, (until September 2008) |
Ethan D. Corey (k)
(born 11/21/63) | | Assistant Secretary and Assistant Clerk | | July 2005 | | Massachusetts Financial Services Company, Senior Vice President and Associate General Counsel (since 2004); Dechert LLP (law firm), Counsel (prior to December 2004) |
David L. DiLorenzo (k)
(born 8/10/68) | | Assistant Treasurer | | July 2005 | | Massachusetts Financial Services Company, Vice President (since June 2005); JP Morgan Investor Services, Vice President (until June 2005) |
Timothy M. Fagan (k)
(born 7/10/68) | | Assistant Secretary and Assistant Clerk | | September 2005 | | Massachusetts Financial Services Company, Vice President and Senior Counsel (since September 2005); John Hancock Advisers, LLC, Vice President, Senior Attorney and Chief Compliance Officer (until August 2005) |
Mark D. Fischer (k)
(born 10/27/70) | | Assistant Treasurer | | July 2005 | | Massachusetts Financial Services Company, Vice President (since May 2005); JP Morgan Investment Management Company, Vice President (until May 2005) |
41
Trustees and Officers – continued
| | | | | | |
Name, Date of Birth | | Position(s) Held
with Fund | | Trustee/Officer
Since (h) | | Principal Occupations During
the Past Five Years & Other
Directorships (j) |
Robyn L. Griffin
(born 7/04/75) | | Assistant Independent Chief Compliance Officer | | August 2008 | | Griffin Compliance LLC (provider of compliance services), Principal (since August 2008); State Street Corporation (financial services provider), Mutual Fund Administration Assistant Vice President (October 2006 – July 2008); Liberty Mutual Group (insurance), Personal Market Assistant Controller (April 2006 – October 2006); Deloitte & Touche LLP (professional services firm), Senior Manager (prior to April 2006) |
Brian E. Langenfeld (k)
(born 3/07/73) | | Assistant Secretary and Assistant Clerk | | June 2006 | | Massachusetts Financial Services Company, Vice President and Senior Counsel (since May 2006); John Hancock Advisers, LLC, Assistant Vice President and Counsel (until April 2006) |
Ellen Moynihan (k)
(born 11/13/57) | | Assistant Treasurer | | April 1997 | | Massachusetts Financial Services Company, Senior Vice President |
Susan S. Newton (k)
(born 3/07/50) | | Assistant Secretary and Assistant Clerk | | May 2005 | | Massachusetts Financial Services Company, Senior Vice President and Associate General Counsel (since April 2005); John Hancock Advisers, LLC, Senior Vice President, Secretary and Chief Legal Officer (until April 2005) |
Susan A. Pereira (k)
(born 11/05/70) | | Assistant Secretary and Assistant Clerk | | July 2005 | | Massachusetts Financial Services Company, Vice President and Senior Counsel (since June 2004); Bingham McCutchen LLP (law firm), Associate (until June 2004) |
Mark N. Polebaum (k)
(born 5/01/52) | | Secretary and Clerk | | January 2006 | | Massachusetts Financial Services Company, Executive Vice President, General Counsel and Secretary (since January 2006); Wilmer Cutler Pickering Hale and Dorr LLP (law firm), Partner (until January 2006) |
42
Trustees and Officers – continued
| | | | | | |
Name, Date of Birth | | Position(s) Held
with Fund | | Trustee/Officer
Since (h) | | Principal Occupations During
the Past Five Years & Other
Directorships (j) |
Frank L. Tarantino
(born 3/07/44) | | Independent Chief Compliance Officer | | June 2004 | | Tarantino LLC (provider of compliance services), Principal (since June 2004); CRA Business Strategies Group (consulting services), Executive Vice President (until June 2004) |
Richard S. Weitzel (k)
(born 7/16/70) | | Assistant Secretary and Assistant Clerk | | October 2007 | | Massachusetts Financial Services Company, Vice President and Assistant General Counsel (since 2004); Massachusetts Department of Business and Technology, General Counsel (until April 2004) |
James O. Yost (k)
(born 6/12/60) | | Assistant Treasurer | | September 1990 | | Massachusetts Financial Services Company, Senior Vice President |
| (h) | Date first appointed to serve as Trustee/officer of an MFS fund. Each Trustee has served continuously since appointment unless indicated otherwise. For the period from December 15, 2004 until February 22, 2005, Messrs. Pozen and Manning served as Advisory Trustees. For the period March 2008 until October 2008, Ms. Dwyer served as Treasurer of the Funds. |
| (j) | Directorships or trusteeships of companies required to report to the Securities and Exchange Commission (i.e., “public companies”). |
| (k) | “Interested person” of the Trust within the meaning of the Investment Company Act of 1940 (referred to as the 1940 Act), which is the principal federal law governing investment companies like the fund, as a result of position with MFS. The address of MFS is 500 Boylston Street, Boston, Massachusetts 02116. |
| (n) | In 2004 and 2005, Mr. Butler provided consulting services to the independent compliance consultant retained by MFS pursuant to its settlement with the SEC concerning market timing and related matters. The terms of that settlement required that compensation and expenses related to the independent compliance consultant be borne exclusively by MFS and, therefore, MFS paid Mr. Butler for the services he rendered to the independent compliance consultant. In 2004 and 2005, MFS paid Mr. Butler a total of $351,119.29. |
Each Trustee (except Messrs. Butler, Kavanaugh and Uek and Ms. Goldfarb) has been elected by shareholders and each Trustee and officer holds office until his or her successor is chosen and qualified or until his or her earlier death, resignation, retirement or removal. The Trust held a shareholders’ meeting in 2005 to elect Trustees, and will hold a shareholders’ meeting at least once every five years thereafter, to elect Trustees. Messrs. Butler, Kavanaugh, Sherratt, Uek and Ms. Thomsen are members of the Trust’s Audit Committee.
Each of the Fund’s Trustees and officers holds comparable positions with certain other funds of which MFS or a subsidiary is the investment adviser or distributor, and, in the case of the officers, with certain affiliates of MFS. As of January 1, 2009, the Trustees served as board members of 104 funds within the MFS Family of Funds.
43
Trustees and Officers – continued
The Statement of Additional Information for the Fund and further information about the Trustees are available without charge upon request by calling 1-800-225-2606.
| | |
| Investment Adviser | | Custodian |
Massachusetts Financial Services Company
500 Boylston Street, Boston, MA 02116-3741 | | JPMorgan Chase Bank
One Chase Manhattan Plaza, New York, NY 10081 |
| Distributor | | Independent Registered Public Accounting Firm |
MFS Fund Distributors, Inc.
500 Boylston Street, Boston, MA 02116-3741 | | Ernst & Young LLP
200 Clarendon Street, Boston, MA 02116 |
| Portfolio Managers | | |
| David Mannheim | | |
| Roger Morley | | |
44
BOARD REVIEW OF INVESTMENT ADVISORY AGREEMENT
The Investment Company Act of 1940 requires that both the full Board of Trustees and a majority of the non-interested (“independent”) Trustees, voting separately, annually approve the continuation of the Fund’s investment advisory agreement with MFS. The Trustees consider matters bearing on the Fund and its advisory arrangements at their meetings throughout the year, including a review of performance data at each regular meeting. In addition, the independent Trustees met several times over the course of three months beginning in May and ending in July, 2009 (“contract review meetings”) for the specific purpose of considering whether to approve the continuation of the investment advisory agreement for the Fund and the other investment companies that the Board oversees (the “MFS Funds”). The independent Trustees were assisted in their evaluation of the Fund’s investment advisory agreement by independent legal counsel, from whom they received separate legal advice and with whom they met separately from MFS during various contract review meetings. The independent Trustees were also assisted in this process by the MFS Funds’ Independent Chief Compliance Officer, a full-time senior officer appointed by and reporting to the independent Trustees.
In connection with their deliberations regarding the continuation of the investment advisory agreement, the Trustees, including the independent Trustees, considered such information and factors as they believed, in light of the legal advice furnished to them and their own business judgment, to be relevant. The investment advisory agreement for the Fund was considered separately, although the Trustees also took into account the common interests of all MFS Funds in their review. As described below, the Trustees considered the nature, quality, and extent of the various investment advisory, administrative, and shareholder services performed by MFS under the existing investment advisory agreement and other arrangements with the Fund.
In connection with their contract review meetings, the Trustees received and relied upon materials that included, among other items: (i) information provided by Lipper Inc., an independent third party, on the investment performance of the Fund for various time periods ended December 31, 2008 and the investment performance of a group of funds with substantially similar investment classifications/objectives (the “Lipper performance universe”), (ii) information provided by Lipper Inc. on the Fund’s advisory fees and other expenses and the advisory fees and other expenses of comparable funds identified by Lipper, Inc. (the “Lipper expense group”), (iii) information provided by MFS on the advisory fees of comparable portfolios of other clients of MFS, including institutional separate accounts and other clients, (iv) information as to whether and to what extent applicable expense waivers,
45
Board Review of Investment Advisory Agreement – continued
reimbursements or fee “breakpoints” are observed for the Fund, (v) information regarding MFS’ financial results and financial condition, including MFS’ and certain of its affiliates’ estimated profitability from services performed for the Fund and the MFS Funds as a whole, (vi) MFS’ views regarding the outlook for the mutual fund industry and the strategic business plans of MFS, (vii) descriptions of various functions performed by MFS for the Funds, such as compliance monitoring and portfolio trading practices, and (viii) information regarding the overall organization of MFS, including information about MFS’ senior management and other personnel providing investment advisory, administrative and other services to the Fund and the other MFS Funds. The comparative performance, fee and expense information prepared and provided by Lipper Inc. was not independently verified and the independent Trustees did not independently verify any information provided to them by MFS.
The Trustees’ conclusion as to the continuation of the investment advisory agreement was based on a comprehensive consideration of all information provided to the Trustees and not the result of any single factor. Some of the factors that figured particularly in the Trustees’ deliberations are described below, although individual Trustees may have evaluated the information presented differently from one another, giving different weights to various factors. It is also important to recognize that the fee arrangements for the Fund and other MFS Funds are the result of years of review and discussion between the independent Trustees and MFS, that certain aspects of such arrangements may receive greater scrutiny in some years than in others, and that the Trustees’ conclusions may be based, in part, on their consideration of these same arrangements during the course of the year and in prior years.
Based on information provided by Lipper Inc., the Trustees reviewed the Fund’s total return investment performance as well as the performance of peer groups of funds over various time periods. The Trustees placed particular emphasis on the total return performance of the Fund’s Class A shares in comparison to the performance of funds in its Lipper performance universe over the three-year period ended December 31, 2008, which the Trustees believed was a long enough period to reflect differing market conditions. The total return performance of the Fund’s Class A shares was in the 1st quintile relative to the other funds in the universe for this three-year period (the 1st quintile being the best performers and the 5th quintile being the worst performers). The total return performance of the Fund’s Class A shares was in the 2nd quintile for the one-year period and the 1st quintile for the five-year period ended December 31, 2008 relative to the Lipper performance universe. Because of the passage of time, these performance results are likely to differ from the performance results for more recent periods, including those shown elsewhere in this report.
46
Board Review of Investment Advisory Agreement – continued
In the course of their deliberations, the Trustees took into account information provided by MFS in connection with the contract review meetings, as well as during investment review meetings conducted with portfolio management personnel during the course of the year regarding the Fund’s performance. After reviewing these and related factors, the Trustees concluded, within the context of their overall conclusions regarding the investment advisory agreement, that they were satisfied with MFS’ responses and efforts relating to investment performance.
In assessing the reasonableness of the Fund’s advisory fee, the Trustees considered, among other information, the Fund’s advisory fee and the total expense ratio of the Fund’s Class A shares as a percentage of average daily net assets and the advisory fee and total expense ratios of peer groups of funds based on information provided by Lipper Inc. The Trustees considered that, according to the Lipper data (which takes into account any fee reductions or expense limitations that were in effect during the Fund’s last fiscal year), the Fund’s effective advisory fee rate was higher than the Lipper expense group median, and the Fund’s total expense ratio was approximately at the Lipper expense group median.
The Trustees also considered the advisory fees charged by MFS to institutional accounts. In comparing these fees, the Trustees considered information provided by MFS as to the generally broader scope of services provided by MFS to the Fund in comparison to institutional accounts, the higher demands placed on MFS’ investment personnel and trading infrastructure as a result of the daily cash in-flows and out-flows of the Fund, and the impact on MFS and expenses associated with the more extensive regulatory regime to which the Fund is subject in comparison to institutional accounts.
The Trustees also considered whether the Fund is likely to benefit from any economies of scale in the management of the Fund in the event of growth in assets of the Fund. They noted that the Fund’s advisory fee rate schedule is currently subject to contractual breakpoints that reduce the Fund’s advisory fee rate on average daily net assets over $1 billion and $2 billion. The Trustees concluded that the existing breakpoints were sufficient to allow the Fund to benefit from economies of scale as its assets grow.
The Trustees also considered information prepared by MFS relating to MFS’ costs and profits with respect to the Fund, the MFS Funds considered as a group, and other investment companies and accounts advised by MFS, as well as MFS’ methodologies used to determine and allocate its costs to the MFS Funds, the Fund and other accounts and products for purposes of estimating profitability.
After reviewing these and other factors described herein, the Trustees concluded, within the context of their overall conclusions regarding the
47
Board Review of Investment Advisory Agreement – continued
investment advisory agreement, that the advisory fees charged to the Fund represent reasonable compensation in light of the services being provided by MFS to the Fund.
In addition, the Trustees considered MFS’ resources and related efforts to continue to retain, attract and motivate capable personnel to serve the Fund. The Trustees also considered current and developing conditions in the financial services industry, including the entry into the industry of large and well-capitalized companies which are spending, and appear to be prepared to continue to spend, substantial sums to engage personnel and to provide services to competing investment companies. In this regard, the Trustees also considered the financial resources of MFS and its ultimate parent, Sun Life Financial Inc. The Trustees also considered the advantages and possible disadvantages to the Fund of having an adviser that also serves other investment companies as well as other accounts.
The Trustees also considered the nature, quality, cost, and extent of administrative, transfer agency, and distribution services provided to the Fund by MFS and its affiliates under agreements and plans other than the investment advisory agreement, including any 12b-1 fees the Fund pays to MFS Fund Distributors, Inc., an affiliate of MFS. The Trustees also considered the nature, extent and quality of certain other services MFS performs or arranges for on the Fund’s behalf, which may include securities lending programs, directed expense payment programs, class action recovery programs, and MFS’ interaction with third-party service providers, principally custodians and sub-custodians. The Trustees concluded that the various non-advisory services provided by MFS and its affiliates on behalf of the Funds were satisfactory.
The Trustees also considered benefits to MFS from the use of the Fund’s portfolio brokerage commissions, if applicable, to pay for investment research and various other factors. Additionally, the Trustees considered so-called “fall-out benefits” to MFS such as reputational value derived from serving as investment manager to the Fund.
Based on their evaluation of factors that they deemed to be material, including those factors described above, the Board of Trustees, including a majority of the independent Trustees, concluded that the Fund’s investment advisory agreement with MFS should be continued for an additional one-year period, commencing August 1, 2009.
A discussion regarding the Board’s most recent review and renewal of the fund’s Investment Advisory Agreement with MFS is available by clicking on the fund’s name under “Mutual Funds” in the “Products and Performance” section of the MFS Web site (mfs.com).
48
PROXY VOTING POLICIES AND INFORMATION
A general description of the MFS funds’ proxy voting policies and procedures is available without charge, upon request, by calling
1-800-225-2606, by visiting the Proxy Voting section of mfs.com or by visiting the SEC’s Web site at http://www.sec.gov.
Information regarding how the fund voted proxies relating to portfolio securities during the most recent twelve-month period ended June 30 is available without charge by visiting the Proxy Voting section of mfs.com or by visiting the SEC’s Web site at http://www.sec.gov.
QUARTERLY PORTFOLIO DISCLOSURE
The fund will file a complete schedule of portfolio holdings with the Securities and Exchange Commission (the Commission) for the first and third quarters of each fiscal year on Form N-Q. The fund’s Form N-Q may be reviewed and copied at the:
Public Reference Room
Securities and Exchange Commission
100 F Street, NE, Room 1580
Washington, D.C. 20549
Information on the operation of the Public Reference Room may be obtained by calling the Commission at 1-800-SEC-0330. The fund’s Form N-Q is available on the EDGAR database on the Commission’s Internet Web site at http://www.sec.gov, and copies of this information may be obtained, upon payment of a duplicating fee, by electronic request at the following e-mail address: publicinfo@sec.gov or by writing the Public Reference Section at the above address.
A shareholder can also obtain the quarterly portfolio holdings report at mfs.com.
FURTHER INFORMATION
From time to time, MFS may post important information about the fund or the MFS funds on the MFS web site (mfs.com). This information is available by visiting the “News & Commentary” section of mfs.com or by clicking on the fund’s name under “Mutual Funds” in the “Products and Performance” section of mfs.com.
FEDERAL TAX INFORMATION (unaudited)
The fund will notify shareholders of amounts for use in preparing 2009 income tax forms in January 2010. The following information is provided pursuant to provisions of the Internal Revenue Code.
The fund designates the maximum amount allowable as qualified dividend income eligible for the 15% tax rate.
The fund designates $25,456,000 as capital gain dividends paid during the fiscal year.
For corporate shareholders, 53.11% of the ordinary income dividends paid during the fiscal year qualify for the corporate dividends received deduction.
Income derived from foreign sources was $6,525,377. The fund intends to pass through foreign tax credits of $672,719 for the fiscal year.
49
MFS® PRIVACY NOTICE
Privacy is a concern for every investor today. At MFS Investment Management® and the MFS funds, we take this concern very seriously. We want you to understand our policies about the investment products and services that we offer, and how we protect the nonpublic personal information of investors who have a direct relationship with us and our wholly owned subsidiaries.
Throughout our business relationship, you provide us with personal information. We maintain information and records about you, your investments, and the services you use. Examples of the nonpublic personal information we maintain include
| | Ÿ | | data from investment applications and other forms |
| | Ÿ | | share balances and transactional history with us, our affiliates, or others |
| | Ÿ | | facts from a consumer reporting agency |
We do not disclose any nonpublic personal information about our customers or former customers to anyone, except as permitted by law. We may share nonpublic personal information with third parties or certain of our affiliates in connection with servicing your account or processing your transactions. We may share information with companies or financial institutions that perform marketing services on our behalf or with other financial institutions with which we have joint marketing arrangements, subject to any legal requirements.
Authorization to access your nonpublic personal information is limited to appropriate personnel who provide products, services, or information to you. We maintain physical, electronic, and procedural safeguards to help protect the personal information we collect about you.
If you have any questions about the MFS privacy policy, please call 1-800-225-2606 any business day.
Note: If you own MFS products or receive MFS services in the name of a third party such as a bank or broker-dealer, their privacy policy may apply to you instead of ours.
50
CONTACT US
Web site
mfs.com
MFS TALK
1-800-637-8255
24 hours a day
Account service and literature
Shareholders
1-800-225-2606
Investment professionals
1-800-343-2829
Retirement plan services
1-800-637-1255
Mailing address
MFS Service Center, Inc.
P.O. Box 55824
Boston, MA 02205-5824
Overnight mail
MFS Service Center, Inc.
c/o Boston Financial Data Services
30 Dan Road
Canton, MA 02021-2809

Save paper with eDelivery. MFS® will send you prospectuses, reports, and proxies directly via e-mail so you will get information faster with less mailbox clutter.  To sign up: 1. go to mfs.com. 2. log in via MFS® Access. 3. select eDelivery. If you own your MFS fund shares through a financial institution or a retirement plan, MFS® TALK, MFS Access, and eDelivery may not be available to you.

MFS® Global Total Return Fund
SIPC Contact Information:
You may obtain information about the Securities Investor Protection Corporation (“SIPC”), including the SIPC Brochure, by contacting SIPC either by telephone (202-371-8300) or by accessing SIPC’s website address (www.sipc.org).
The report is prepared for the general information of shareholders. It is authorized for distribution to prospective investors only when preceded or accompanied by a current prospectus.
NOT FDIC INSURED Ÿ MAY LOSE VALUE Ÿ NO BANK GUARANTEE
10/31/09
MWT-ANN

LETTER FROM THE CEO
Dear Shareholders:
There remains some question as to when the global economy will achieve a sustainable recovery. While some economists and market watchers are optimistic that the worst is behind us, a number also agree with U.S. Federal Reserve Board Chairman Ben Bernanke who said in September that “even though from a technical perspective the recession is very likely over at this point, it’s still going to feel like a very weak economy for some time.”
Have we in fact turned the corner? We have seen tremendous rallies in the markets over the past six months. The Fed has cut interest rates aggressively toward zero to support credit markets, global deleveraging has helped diminish inflationary concerns, and stimulus measures have put more money in the hands of the government and individuals to keep the economy moving. Still, unemployment remains high, consumer confidence and spending continue to waiver, and the housing market, while improving, has a long way to go to recover.
Regardless of lingering market uncertainties, MFS® is confident that the fundamental principles of long-term investing will always apply. We encourage investors to speak with their advisors to identify and research long-term investment opportunities thoroughly. Global research continues to be one of the hallmarks of MFS, along with a unique collaboration between our portfolio managers and sector analysts, who regularly discuss potential investments before making both buy and sell decisions.
As we continue to dig out from the worst financial crisis in decades, keep in mind that while the road back to sustainable recovery will be slow, gradual, and even bumpy at times, conditions are significantly better than they were six months ago.
Respectfully,

Robert J. Manning
Chief Executive Officer and Chief Investment Officer
MFS Investment Management®
December 15, 2009
The opinions expressed in this letter are subject to change, may not be relied upon for investment advice, and no forecasts can be guaranteed.
1
PORTFOLIO COMPOSITION
Portfolio structure (i)
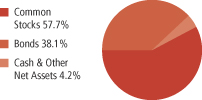
| | |
| Top ten holdings (i) | | |
| Government of Japan, 1.7%, 2017 | | 4.8% |
| Republic of Italy, 4.75%, 2013 | | 3.4% |
| Republic of Italy, 5.25%, 2017 | | 2.3% |
| Nestle S.A. | | 1.9% |
| Kingdom of Spain, 5%, 2012 | | 1.6% |
| Vodafone Group PLC | | 1.6% |
| Government of Japan, 2.1%, 2024 | | 1.5% |
| Sanofi-Aventis S.A. | | 1.4% |
| Lockheed Martin Corp. | | 1.3% |
| Republic of Ireland, 4.6%, 2016 | | 1.3% |
| |
| Equity sectors | | |
| Financial Services | | 10.7% |
| Health Care | | 8.1% |
| Consumer Staples | | 8.0% |
| Utilities & Communications | | 6.4% |
| Energy | | 5.6% |
| Industrial Goods & Services | | 4.9% |
| Technology | | 3.8% |
| Leisure | | 2.8% |
| Special Products & Services | | 2.1% |
| Retailing | | 1.6% |
| Basic Materials | | 1.4% |
| Transportation | | 1.3% |
| Autos & Housing | | 1.0% |
| | |
| Fixed income sectors (i) | | |
| Non-U.S. Government Bonds | | 27.4% |
| U.S. Treasury Securities | | 5.0% |
| Emerging Markets Bonds | | 2.4% |
| Mortgage-Backed Securities | | 1.5% |
| Commercial Mortgage-Backed Securities | | 0.8% |
| U.S. Government Agencies | | 0.7% |
| High Grade Corporates | | 0.3% |
| |
| Country weightings (i) | | |
| United States | | 35.9% |
| Japan | | 16.0% |
| United Kingdom | | 10.7% |
| France | | 6.2% |
| Italy | | 6.2% |
| Switzerland | | 4.9% |
| Germany | | 4.2% |
| Netherlands | | 3.8% |
| Spain | | 2.9% |
| Other Countries | | 9.2% |
| (i) | For purposes of this presentation, the bond component includes accrued interest amounts and may be positively or negatively impacted by the equivalent exposure from any derivative holdings, if applicable. |
Percentages are based on net assets as of 10/31/09, unless otherwise noted.
The portfolio is actively managed and current holdings may be different.
2
MANAGEMENT REVIEW
Summary of Results
For the twelve months ended October 31, 2009, Class A shares of the MFS Global Total Return Fund (the “fund”) provided a total return of 16.10%, at net asset value. This compares with a return of 19.21% for the fund’s benchmark, the MSCI World Index. The fund’s other benchmark, a blended benchmark comprised of 60% of the MSCI World Index and 40% of the JPMorgan Global Government Bond Index (unhedged), which closely resembles the equity and fixed income allocations of the fund, generated a total return of 18.35%. The JPMorgan Global Government Bond Index (unhedged) generated a return of 15.55% over the same period.
Market Environment
The global economy and financial markets experienced substantial deterioration and extraordinary volatility over most of the reporting period. Through the first quarter of 2009, the strong headwinds in the U.S. included accelerated deterioration in the housing market, anemic corporate investment, a rapidly declining job market, and a much tighter credit environment. During the very early stages of the period, a series of tumultuous financial events hammered markets. As a result of this turbulent news, global equity markets pushed significantly lower and credit markets witnessed the worst market decline since the beginning of the credit crisis. The synchronized global downturn in economic activity experienced in the fourth quarter of 2008 and the first quarter of 2009 was among the most intense in the post-World War II period. Not only did Europe and Japan fall into very deep recessions, but an increasingly powerful engine of global growth – emerging markets – also contracted almost across the board. The subsequent recovery in global activity has been similarly synchronized, led importantly by emerging Asian economies, but broadening to include most of the global economy to varying degrees. Primary drivers of the recovery include an unwinding of the inventory destocking that took place earlier, as well as massive fiscal and monetary stimulus. As a result, credit conditions and equity indices improved considerably during the second half of the period. Nevertheless, the degree of financial and macroeconomic dislocation remained significant.
During the first half of the reporting period, the Fed implemented its final interest rate cut, while making increasing use of its new lending facilities to alleviate ever-tightening credit markets. On the fiscal front, the U.S. Treasury designed and began implementing a massive fiscal stimulus package. As inflationary concerns diminished in the face of global deleveraging, and equity and credit markets deteriorated more sharply, central banks around the world also cut interest rates dramatically. Globally, policy makers increasingly sought
3
Management Review – continued
to coordinate their rescue efforts, which resulted in a number of international actions, such as the establishment of swap lines between the Federal Reserve and a number of other central banks, as well as a substantial increase in the financial resources of the International Monetary Fund. By the middle of the period, several central banks had approached their lower bound on policy rates and were examining the implementation and ramifications of quantitative easing as a means to further loosen monetary policy to offset the continuing fall in global economic activity. However, by the end of the period, there were broadening signs that the worst of the global macroeconomic deterioration had passed, which caused the subsequent rise in asset valuations. As most asset prices rebounded in the second half of the period and the demand for liquidity waned, the debate concerning monetary exit strategies had begun, creating added uncertainty regarding the forward path of policy rates.
Detractors from Performance
Within the equity portion of the fund, stock selection and, to a lesser extent, our underweighted position in the basic materials sector detracted from performance relative to the MSCI World Index. Not holding strong-performing mining giant BHP Billiton (U.K.) held back relative results as this stock significantly outperformed the benchmark over the reporting period.
Security selection in the special products and services and energy sectors also hindered relative returns. No individual securities within either sector were among the fund’s top relative detractors.
Individual securities in other sectors that hurt relative returns included defense contractor Lockheed Martin, household and cosmetics manufacturer Kao Corp. (Japan), telecommunications company KDDI Corp. (Japan), financial services provider Bank of New York Mellon, and cosmetics maker Kose Corp. (Japan) (aa). Shares of Lockheed Martin fell on concerns about the future outlook for defense spending and weaker-than-expected earnings results towards the later part of the reporting period. Elsewhere, our ownership in shares of tobacco firm Japan Tobacco, and not owning computer maker Apple and Spanish bank Banco Santander, also dampened relative results.
The fund’s cash position was a detractor from relative performance. The fund holds cash to buy new holdings and to provide liquidity. In a period when equity markets rose, as measured by the fund’s benchmark, holding cash hurt performance versus the benchmark, which has no cash position.
Within the fixed income portion of the fund, there were no factors that materially detracted from performance relative to the JPMorgan Global Government Bond Index (unhedged).
4
Management Review – continued
Contributors to Performance
Within the equity portion of the fund, stock selection in the transportation and utilities and communications sectors benefited relative performance. No individual holdings within either sector were among the fund’s top relative contributors for the reporting period.
Security selection in the autos and housing sector also contributed to relative returns. Swiss plumbing equipment maker Geberit was a standout relative performer within this sector. Shares of Geberit appreciated due to a combination of better-than-expected results and a strong balance sheet. The company’s above average dividend yield also helped its shares to outperform over the reporting period. Avoiding weak-performing German car maker Volkswagen also helped.
Elsewhere, the fund’s holdings of strong-performing financial services company DNB Holding A.S.A. (Norway), investment banking firm Goldman Sachs Group, electrical installation products make Legrand S.A. (France), lock maker ASSA ABLOY, and homecare products company Henkel KGaA (Germany) were top relative contributors. The strong rebound in most credit-sensitive financials during the second half of the reporting period pushed shares of DNB up sharply in excess of the market. Not holding poor-performing diversified industrial conglomerate General Electric and financial services firm Citigroup, and the timing of our ownership in shares of pharmaceutical firm Wyeth Pharmaceutical (g), also had a positive effect on relative returns.
Within the fixed income portion of the fund, a greater exposure to emerging markets debt and commercial mortgage-backed securities benefited performance relative to the JPMorgan Global Government Bond Index (unhedged). Our exposure to Japanese, Australian, and Norwegian currencies and our overweight position in Treasury Inflation-Protected Securities (TIPS) also helped.
An underweight position in Italy through March of 2009 was another key contributor to relative results. Beginning in April 2009, the fund’s overweight in Italy, Ireland, Greece, Austria, Portugal, and Spain also boosted relative performance.
Respectfully,
| | | | |
| Nevin Chitkara | | Steven Gorham | | Matthew Ryan |
| Portfolio Manager | | Portfolio Manager | | Portfolio Manager |
| | |
| Benjamin Stone | | Erik Weisman | | Barnaby Wiener |
| Portfolio Manager | | Portfolio Manager | | Portfolio Manager |
| (aa) | Security is not a benchmark constituent. |
| (g) | Security was not held in the portfolio at period end. |
5
Management Review – continued
Note to Shareholders: Effective April 9, 2009, Benjamin Stone became a co-manager of the fund.
The views expressed in this report are those of the portfolio managers only through the end of the period of the report as stated on the cover and do not necessarily reflect the views of MFS or any other person in the MFS organization. These views are subject to change at any time based on market or other conditions, and MFS disclaims any responsibility to update such views. These views may not be relied upon as investment advice or an indication of trading intent on behalf of any MFS portfolio. References to specific securities are not recommendations of such securities, and may not be representative of any MFS portfolio’s current or future investments.
6
PERFORMANCE SUMMARY THROUGH 10/31/09
The following chart illustrates a representative class of the fund’s historical performance in comparison to its benchmark(s). Performance results include the deduction of the maximum applicable sales charge and reflect the percentage change in net asset value, including reinvestment of dividends and capital gains distributions. The performance of other share classes will be greater than or less than that of the class depicted below. Benchmarks are unmanaged and may not be invested in directly. Benchmark returns do not reflect sales charges, commissions or expenses. (See Notes to Performance Summary.)
Performance data shown represents past performance and is no guarantee of future results. Investment return and principal value fluctuate so your shares, when sold, may be worth more or less than the original cost; current performance may be lower or higher than quoted. The performance shown does not reflect the deduction of taxes, if any, that a shareholder would pay on fund distributions or the redemption of fund shares.
Growth of a Hypothetical $10,000 Investment
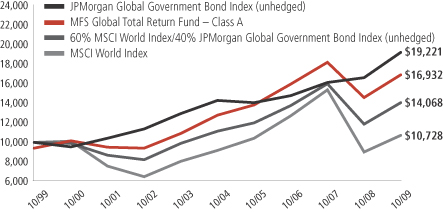
7
Performance Summary – continued
Total Returns through 10/31/09
Average annual without sales charge
| | | | | | | | | | | | | | |
| | | Share class | | Class inception date | | 1-yr | | 5-yr | | 10-yr | | Life (t) | | |
| | | A | | 9/04/90 | | 16.10% | | 5.79% | | 6.03% | | N/A | | |
| | | B | | 9/07/93 | | 15.27% | | 5.11% | | 5.34% | | N/A | | |
| | | C | | 1/03/94 | | 15.22% | | 5.10% | | 5.34% | | N/A | | |
| | | I | | 1/02/97 | | 16.27% | | 6.16% | | 6.40% | | N/A | | |
| | | R1 | | 4/01/05 | | 15.20% | | N/A | | N/A | | 4.07% | | |
| | | R2 | | 10/31/03 | | 15.81% | | 5.51% | | N/A | | 7.21% | | |
| | | R3 | | 4/01/05 | | 16.10% | | N/A | | N/A | | 4.85% | | |
| | | R4 | | 4/01/05 | | 16.33% | | N/A | | N/A | | 5.15% | | |
| Comparative benchmarks | | | | | | | | | | |
| | | MSCI World Index (f) | | 19.21% | | 3.20% | | 0.71% | | N/A | | |
| | | 60% MSCI World/40% JPMorgan Global
Government Bond Index (unhedged) (f) | | 18.35% | | 4.74% | | 3.47% | | N/A | | |
| | | JPMorgan Global Government Bond
Index (unhedged) (f) | | 15.55% | | 6.07% | | 6.75% | | N/A | | |
| Average annual with sales charge | | | | | | | | | | |
| | | A
With Initial Sales Charge (5.75%) | | 9.42% | | 4.55% | | 5.41% | | N/A | | |
| | | B
With CDSC (Declining over six years from 4% to 0%) (x) | | 11.27% | | 4.82% | | 5.34% | | N/A | | |
| | | C
With CDSC (1% for 12 months) (x) | | 14.22% | | 5.10% | | 5.34% | | N/A | | |
Class I, R1, R2, R3, and R4 shares do not have a sales charge.
CDSC – Contingent Deferred Sales Charge.
| (f) | Source: FactSet Research Systems Inc. |
| (t) | For the period from the class inception date through the stated period end (for those share classes with less than 10 years of performance history). No comparative benchmark information is provided for “life” periods. (See Notes to Performance Summary.) |
| (x) | Assuming redemption at the end of the applicable period. |
Benchmark Definitions
JPMorgan Global Government Bond Index (unhedged) – measures developed government bond markets around the world.
Morgan Stanley Capital International (MSCI) World Index – a market capitalization-weighted index that is designed to measure equity market performance in the global developed markets.
It is not possible to invest directly in an index.
8
Performance Summary – continued
Notes to Performance Summary
Average annual total return represents the average annual change in value for each share class for the periods presented. Life returns are presented where the share class has less than 10 years of performance history and represent the average annual total return from the class inception date to the stated period end date. As the fund’s share classes may have different inception dates, the life returns may represent different time periods and may not be comparable. As a result, no comparative benchmark performance information is provided for life periods.
Performance results reflect any applicable expense subsidies and waivers in effect during the periods shown. Without such subsidies and waivers the fund’s performance results would be less favorable. Please see the prospectus and financial statements for complete details.
From time to time the fund may receive proceeds from litigation settlements, without which performance would be lower.
9
EXPENSE TABLE
Fund expenses borne by the shareholders during the period,
May 1, 2009 through October 31, 2009
As a shareholder of the fund, you incur two types of costs: (1) transaction costs, including sales charges (loads) on certain purchase or redemption payments, and (2) ongoing costs, including management fees; distribution and service (12b-1) fees; and other fund expenses. This example is intended to help you understand your ongoing costs (in dollars) of investing in the fund and to compare these costs with the ongoing costs of investing in other mutual funds.
The example is based on an investment of $1,000 invested at the beginning of the period and held for the entire period May 1, 2009 through October 31, 2009.
Actual Expenses
The first line for each share class in the following table provides information about actual account values and actual expenses. You may use the information in this line, together with the amount you invested, to estimate the expenses that you paid over the period. Simply divide your account value by $1,000 (for example, an $8,600 account value divided by $1,000 = 8.6), then multiply the result by the number in the first line under the heading entitled “Expenses Paid During Period” to estimate the expenses you paid on your account during this period.
Hypothetical Example for Comparison Purposes
The second line for each share class in the following table provides information about hypothetical account values and hypothetical expenses based on the fund’s actual expense ratio and an assumed rate of return of 5% per year before expenses, which is not the fund’s actual return. The hypothetical account values and expenses may not be used to estimate the actual ending account balance or expenses you paid for the period. You may use this information to compare the ongoing costs of investing in the fund and other funds. To do so, compare this 5% hypothetical example with the 5% hypothetical examples that appear in the shareholder reports of the other funds.
Please note that the expenses shown in the table are meant to highlight your ongoing costs only and do not reflect any transactional costs, such as sales charges (loads). Therefore, the second line for each share class in the table is useful in comparing ongoing costs only, and will not help you determine the relative total costs of owning different funds. In addition, if these transactional costs were included, your costs would have been higher.
10
Expense Table – continued
| | | | | | | | | | |
Share
Class | | | | Annualized
Expense
Ratio | | Beginning
Account Value
5/01/09 | | Ending
Account Value
10/31/09 | | Expenses
Paid During
Period (p)
5/01/09-10/31/09 |
| A | | Actual | | 1.25% | | $1,000.00 | | $1,181.45 | | $6.87 |
| | Hypothetical (h) | | 1.25% | | $1,000.00 | | $1,018.90 | | $6.36 |
| B | | Actual | | 2.00% | | $1,000.00 | | $1,176.91 | | $10.97 |
| | Hypothetical (h) | | 2.00% | | $1,000.00 | | $1,015.12 | | $10.16 |
| C | | Actual | | 2.00% | | $1,000.00 | | $1,176.18 | | $10.97 |
| | Hypothetical (h) | | 2.00% | | $1,000.00 | | $1,015.12 | | $10.16 |
| I | | Actual | | 1.00% | | $1,000.00 | | $1,182.35 | | $5.50 |
| | Hypothetical (h) | | 1.00% | | $1,000.00 | | $1,020.16 | | $5.09 |
| R1 | | Actual | | 2.00% | | $1,000.00 | | $1,177.22 | | $10.98 |
| | Hypothetical (h) | | 2.00% | | $1,000.00 | | $1,015.12 | | $10.16 |
| R2 | | Actual | | 1.50% | | $1,000.00 | | $1,180.36 | | $8.24 |
| | Hypothetical (h) | | 1.50% | | $1,000.00 | | $1,017.64 | | $7.63 |
| R3 | | Actual | | 1.25% | | $1,000.00 | | $1,180.89 | | $6.87 |
| | Hypothetical (h) | | 1.25% | | $1,000.00 | | $1,018.90 | | $6.36 |
| R4 | | Actual | | 1.00% | | $1,000.00 | | $1,182.86 | | $5.50 |
| | Hypothetical (h) | | 1.00% | | $1,000.00 | | $1,020.16 | | $5.09 |
| (h) | 5% class return per year before expenses. |
| (p) | Expenses paid is equal to each class’ annualized expense ratio, as shown above, multiplied by the average account value over the period, multiplied by the number of days in the period, divided by the number of days in the year. Expenses paid do not include any applicable sales charges (loads). If these transaction costs had been included, your costs would have been higher. |
11
PORTFOLIO OF INVESTMENTS
10/31/09
The Portfolio of Investments is a complete list of all securities owned by your fund. It is categorized by broad-based asset classes.
| | | | | |
| Common Stocks - 57.7% | | | | | |
| Issuer | | Shares/Par | | Value ($) |
| | | | | |
| Aerospace - 3.1% | | | | | |
| Cobham PLC | | 807,340 | | $ | 2,902,302 |
| Lockheed Martin Corp. | | 133,750 | | | 9,200,663 |
| Northrop Grumman Corp. | | 98,840 | | | 4,954,849 |
| United Technologies Corp. | | 71,290 | | | 4,380,771 |
| | | | | |
| | | | | $ | 21,438,585 |
| Alcoholic Beverages - 0.8% | | | | | |
| Heineken N.V. | | 129,040 | | $ | 5,718,890 |
| | |
| Apparel Manufacturers - 0.6% | | | | | |
| Compagnie Financiere Richemont S.A. | | 51,047 | | $ | 1,429,197 |
| NIKE, Inc., “B” | | 44,990 | | | 2,797,478 |
| | | | | |
| | | | | $ | 4,226,675 |
| Broadcasting - 2.2% | | | | | |
| Fuji Television Network, Inc. | | 1,071 | | $ | 1,570,482 |
| Nippon Television Network Corp. | | 12,530 | | | 1,642,781 |
| Omnicom Group, Inc. | | 71,690 | | | 2,457,533 |
| Vivendi S.A. | | 172,488 | | | 4,777,587 |
| Walt Disney Co. | | 124,920 | | | 3,419,060 |
| WPP Group PLC | | 192,754 | | | 1,728,603 |
| | | | | |
| | | | | $ | 15,596,046 |
| Brokerage & Asset Managers - 0.4% | | | | | |
| Daiwa Securities Group, Inc. | | 468,000 | | $ | 2,487,245 |
| | |
| Business Services - 1.5% | | | | | |
| Accenture Ltd., “A” | | 113,720 | | $ | 4,216,738 |
| Bunzl PLC | | 202,680 | | | 2,206,736 |
| Nomura Research Institute Ltd. | | 55,600 | | | 1,206,243 |
| USS Co. Ltd. | | 46,370 | | | 2,777,909 |
| | | | | |
| | | | | $ | 10,407,626 |
| Chemicals - 1.4% | | | | | |
| 3M Co. | | 31,270 | | $ | 2,300,534 |
| Givaudan S.A. | | 3,980 | | | 2,945,954 |
| PPG Industries, Inc. | | 80,400 | | | 4,536,972 |
| | | | | |
| | | | | $ | 9,783,460 |
12
Portfolio of Investments – continued
| | | | | |
| Issuer | | Shares/Par | | Value ($) |
| | | | | |
| Common Stocks - continued | | | | | |
| Computer Software - 0.4% | | | | | |
| Oracle Corp. | | 146,560 | | $ | 3,092,416 |
| | |
| Computer Software - Systems - 1.2% | | | | | |
| Fujitsu Ltd. | | 289,000 | | $ | 1,680,371 |
| International Business Machines Corp. | | 31,400 | | | 3,787,154 |
| Konica Minolta Holdings, Inc. | | 325,500 | | | 3,036,102 |
| | | | | |
| | | | | $ | 8,503,627 |
| Conglomerates - 0.3% | | | | | |
| Tomkins PLC | | 654,650 | | $ | 1,801,173 |
| | |
| Construction - 1.0% | | | | | |
| Geberit AG | | 28,614 | | $ | 4,738,839 |
| Sherwin-Williams Co. | | 37,700 | | | 2,150,408 |
| | | | | |
| | | | | $ | 6,889,247 |
| Consumer Products - 2.2% | | | | | |
| Henkel KGaA, IPS | | 100,070 | | $ | 4,538,458 |
| Kao Corp. | | 262,200 | | | 5,889,417 |
| Kose Corp. | | 101,900 | | | 2,235,894 |
| Procter & Gamble Co. | | 40,405 | | | 2,343,490 |
| | | | | |
| | | | | $ | 15,007,259 |
| Consumer Services - 0.3% | | | | | |
| Benesse Holdings, Inc. | | 44,000 | | $ | 1,951,391 |
| | |
| Electrical Equipment - 1.0% | | | | | |
| Legrand S.A. | | 110,010 | | $ | 2,987,619 |
| OMRON Corp. | | 108,500 | | | 1,837,296 |
| Spectris PLC | | 217,980 | | | 2,416,475 |
| | | | | |
| | | | | $ | 7,241,390 |
| Electronics - 1.6% | | | | | |
| Halma PLC | | 288,131 | | $ | 1,074,065 |
| Intel Corp. | | 165,820 | | | 3,168,820 |
| Samsung Electronics Co. Ltd. | | 5,966 | | | 3,591,362 |
| Taiwan Semiconductor Manufacturing Co. Ltd., ADR | | 311,494 | | | 2,971,653 |
| | | | | |
| | | | | $ | 10,805,900 |
| Energy - Independent - 1.0% | | | | | |
| Apache Corp. | | 32,980 | | $ | 3,104,078 |
| Devon Energy Corp. | | 39,200 | | | 2,536,632 |
| EOG Resources, Inc. | | 20,070 | | | 1,638,916 |
| | | | | |
| | | | | $ | 7,279,626 |
13
Portfolio of Investments – continued
| | | | | |
| Issuer | | Shares/Par | | Value ($) |
| | | | | |
| Common Stocks - continued | | | | | |
| Energy - Integrated - 4.4% | | | | | |
| Chevron Corp. | | 99,410 | | $ | 7,608,841 |
| Exxon Mobil Corp. | | 59,820 | | | 4,287,299 |
| Hess Corp. | | 43,030 | | | 2,355,462 |
| Royal Dutch Shell PLC, “A” | | 261,410 | | | 7,752,738 |
| TOTAL S.A. | | 139,350 | | | 8,297,833 |
| | | | | |
| | | | | $ | 30,302,173 |
| Food & Beverages - 3.1% | | | | | |
| General Mills, Inc. | | 22,670 | | $ | 1,494,406 |
| J.M. Smucker Co. | | 22,243 | | | 1,172,873 |
| Kellogg Co. | | 36,620 | | | 1,887,395 |
| Nestle S.A. | | 280,941 | | | 13,059,546 |
| Nong Shim Co. Ltd. | | 8,130 | | | 1,650,412 |
| PepsiCo, Inc. | | 38,110 | | | 2,307,561 |
| | | | | |
| | | | | $ | 21,572,193 |
| Food & Drug Stores - 1.0% | | | | | |
| CVS Caremark Corp. | | 87,920 | | $ | 3,103,576 |
| Kroger Co. | | 82,190 | | | 1,901,055 |
| Lawson, Inc. | | 38,600 | | | 1,723,527 |
| | | | | |
| | | | | $ | 6,728,158 |
| Insurance - 3.3% | | | | | |
| Allstate Corp. | | 129,910 | | $ | 3,841,439 |
| Aon Corp. | | 50,090 | | | 1,928,966 |
| Hiscox Ltd. | | 317,165 | | | 1,658,021 |
| ING Groep N.V. (a) | | 141,090 | | | 1,824,184 |
| Jardine Lloyd Thompson Group PLC | | 261,580 | | | 1,942,756 |
| MetLife, Inc. | | 153,460 | | | 5,222,244 |
| Muenchener Ruckversicherungs-Gesellschaft AG | | 16,690 | | | 2,647,123 |
| Travelers Cos., Inc. | | 35,380 | | | 1,761,570 |
| Zurich Financial Services AG | | 8,510 | | | 1,948,205 |
| | | | | |
| | | | | $ | 22,774,508 |
| Leisure & Toys - 0.2% | | | | | |
| NAMCO BANDAI Holdings, Inc. | | 108,700 | | $ | 1,120,268 |
| | |
| Machinery & Tools - 0.8% | | | | | |
| ASSA ABLOY AB, “B” | | 177,260 | | $ | 3,156,676 |
| Neopost S.A. | | 30,260 | | | 2,650,381 |
| | | | | |
| | | | | $ | 5,807,057 |
14
Portfolio of Investments – continued
| | | | | |
| Issuer | | Shares/Par | | Value ($) |
| | | | | |
| Common Stocks - continued | | | | | |
| Major Banks - 5.6% | | | | | |
| Bank of New York Mellon Corp. | | 221,678 | | $ | 5,909,935 |
| Credit Agricole S.A. | | 176,855 | | | 3,396,529 |
| Goldman Sachs Group, Inc. | | 32,560 | | | 5,540,735 |
| HSBC Holdings PLC | | 423,910 | | | 4,687,213 |
| JPMorgan Chase & Co. | | 127,370 | | | 5,320,245 |
| PNC Financial Services Group, Inc. | | 33,100 | | | 1,619,914 |
| State Street Corp. | | 76,250 | | | 3,200,975 |
| Sumitomo Mitsui Financial Group, Inc. | | 97,200 | | | 3,338,746 |
| UniCredito Italiano S.p.A. (a) | | 739,530 | | | 2,473,879 |
| Wells Fargo & Co. | | 108,700 | | | 2,991,424 |
| | | | | |
| | | | | $ | 38,479,595 |
| Medical Equipment - 1.3% | | | | | |
| Becton, Dickinson & Co. | | 23,560 | | $ | 1,610,562 |
| Medtronic, Inc. | | 67,770 | | | 2,419,389 |
| Smith & Nephew PLC | | 431,709 | | | 3,819,450 |
| Synthes, Inc. | | 11,040 | | | 1,310,122 |
| | | | | |
| | | | | $ | 9,159,523 |
| Network & Telecom - 0.6% | | | | | |
| Nokia Oyj | | 350,230 | | $ | 4,419,381 |
| | |
| Oil Services - 0.2% | | | | | |
| National Oilwell Varco, Inc. (a) | | 36,720 | | $ | 1,505,153 |
| | |
| Other Banks & Diversified Financials - 1.2% | | | | | |
| Bangkok Bank Public Co. Ltd. | | 445,500 | | $ | 1,478,981 |
| DNB Holding A.S.A. (a) | | 303,800 | | | 3,485,393 |
| Hachijuni Bank Ltd. | | 176,000 | | | 1,031,371 |
| Sapporo Hokuyo Holdings, Inc. | | 212,900 | | | 713,807 |
| Unione di Banche Italiane Scpa | | 89,196 | | | 1,273,042 |
| | | | | |
| | | | | $ | 7,982,594 |
| Pharmaceuticals - 6.8% | | | | | |
| Abbott Laboratories | | 83,010 | | $ | 4,197,816 |
| Daiichi Sankyo Co. Ltd. | | 110,100 | | | 2,178,803 |
| GlaxoSmithKline PLC | | 349,660 | | | 7,180,804 |
| Hisamitsu Pharmaceutical Co., Inc. | | 17,300 | | | 592,645 |
| Johnson & Johnson | | 67,870 | | | 4,007,724 |
| Merck & Co., Inc. (a) | | 108,850 | | | 3,366,731 |
| Merck KGaA | | 27,870 | | | 2,621,261 |
| Pfizer, Inc. | | 248,040 | | | 4,224,121 |
| Roche Holding AG | | 54,280 | | | 8,696,842 |
15
Portfolio of Investments – continued
| | | | | |
| Issuer | | Shares/Par | | Value ($) |
| | | | | |
| Common Stocks - continued | | | | | |
| Pharmaceuticals - continued | | | | | |
| Sanofi-Aventis S.A. | | 134,210 | | $ | 9,809,786 |
| | | | | |
| | | | | $ | 46,876,533 |
| Printing & Publishing - 0.4% | | | | | |
| Reed Elsevier PLC | | 332,213 | | $ | 2,520,120 |
| | |
| Real Estate - 0.2% | | | | | |
| Deutsche Wohnen AG (a) | | 117,200 | | $ | 1,336,511 |
| | |
| Telecommunications - Wireless - 2.5% | | | | | |
| KDDI Corp. | | 1,185 | | $ | 6,296,681 |
| Vodafone Group PLC | | 5,039,115 | | | 11,148,993 |
| | | | | |
| | | | | $ | 17,445,674 |
| Telephone Services - 2.6% | | | | | |
| AT&T, Inc. | | 245,840 | | $ | 6,310,713 |
| China Unicom Ltd. | | 1,026,000 | | | 1,316,200 |
| Royal KPN N.V. | | 387,050 | | | 7,017,169 |
| Telefonica S.A. | | 133,060 | | | 3,713,958 |
| | | | | |
| | | | | $ | 18,358,040 |
| Tobacco - 1.9% | | | | | |
| British American Tobacco PLC | | 126,310 | | $ | 4,032,992 |
| Japan Tobacco, Inc. | | 871 | | | 2,427,719 |
| Philip Morris International, Inc. | | 139,800 | | | 6,620,928 |
| | | | | |
| | | | | $ | 13,081,639 |
| Trucking - 1.3% | | | | | |
| TNT N.V. | | 153,258 | | $ | 4,060,487 |
| Yamato Holdings Co. Ltd. | | 348,800 | | | 5,186,997 |
| | | | | |
| | | | | $ | 9,247,484 |
| Utilities - Electric Power - 1.3% | | | | | |
| Dominion Resources, Inc. | | 75,524 | | $ | 2,574,613 |
| E.ON AG | | 101,284 | | | 3,871,448 |
| FPL Group, Inc. | | 29,760 | | | 1,461,216 |
| PPL Corp. | | 42,480 | | | 1,250,611 |
| | | | | |
| | | | | $ | 9,157,888 |
| Total Common Stocks (Identified Cost, $377,110,791) | | | | $ | 400,105,048 |
16
Portfolio of Investments – continued
| | | | | | |
| Bonds - 37.7% | | | | | | |
| Issuer | | Shares/Par | | Value ($) |
| | | | | | |
| Asset Backed & Securitized - 0.8% | | | | | | |
| Bayview Commercial Asset Trust, FRN, 0.896%, 2023 (z) | | CAD | 560,000 | | $ | 372,291 |
| Commercial Mortgage Asset Trust, FRN, 0.851%, 2032 (i)(z) | | $ | 11,996,860 | | | 340,903 |
| Commercial Mortgage Pass-Through Certificates, FRN, 0.435%, 2017 (n) | | | 1,400,000 | | | 1,194,790 |
| Commercial Mortgage Pass-Through Certificates, FRN, 0.445%, 2017 (n) | | | 1,645,178 | | | 1,436,642 |
| First Union National Bank Commercial Mortgage Trust, FRN, 0.897%, 2043 (i)(n) | | | 22,583,344 | | | 215,262 |
| Greenwich Capital Commercial Funding Corp., FRN, 5.918%, 2038 | | | 945,000 | | | 906,083 |
| JPMorgan Chase Commercial Mortgage Securities Corp., FRN, 5.882%, 2051 | | | 1,110,000 | | | 977,819 |
| | | | | | |
| | | | | | $ | 5,443,790 |
| Building - 0.0% | | | | | | |
| Odebrecht Finance Ltd., 7%, 2020 (z) | | $ | 104,000 | | $ | 98,280 |
| | |
| Emerging Market Quasi-Sovereign - 1.5% | | | | | | |
| Banco do Brasil S.A., 8.5%, 2049 (z) | | $ | 100,000 | | $ | 102,900 |
| BNDES Participacoes S.A., 6.5%, 2019 (n) | | | 292,000 | | | 307,330 |
| Empresa Nacional del Petroleo, 6.25%, 2019 (n) | | | 651,000 | | | 694,144 |
| Gaz Capital S.A., 8.125%, 2014 (n) | | | 751,000 | | | 793,281 |
| KazMunaiGaz Finance B.V., 11.75%, 2015 (n) | | | 1,164,000 | | | 1,390,980 |
| Majapahit Holding B.V., 7.75%, 2020 (z) | | | 774,000 | | | 767,436 |
| Mubadala Development Co., 7.625%, 2019 (n) | | | 654,000 | | | 742,290 |
| National Agricultural Co., 5%, 2014 (n) | | | 100,000 | | | 101,783 |
| Pemex Project Funding Master Trust, 5.75%, 2018 | | | 653,000 | | | 646,470 |
| Petrobras International Finance Co., 7.875%, 2019 | | | 679,000 | | | 767,270 |
| Petrobras International Finance Co., 5.75%, 2020 | | | 100,000 | | | 99,700 |
| Petrobras International Finance Co., 6.875%, 2040 | | | 700,000 | | | 699,300 |
| Petroleum Co. of Trinidad & Tobago Ltd., 6%, 2022 | | | 774,000 | | | 719,820 |
| Qtel International Finance Ltd., 7.875%, 2019 (n) | | | 967,000 | | | 1,128,421 |
| Ras Laffan Liquefied Natural Gas Co. Ltd., 6.75%, 2019 (n) | | | 1,200,000 | | | 1,323,724 |
| | | | | | |
| | | | | | $ | 10,284,849 |
| Emerging Market Sovereign - 0.7% | | | | | | |
| Emirate of Abu Dhabi, 6.75%, 2019 (n) | | $ | 375,000 | | $ | 428,628 |
| Republic of Brazil, 5.625%, 2041 | | | 695,000 | | | 653,300 |
| Republic of Croatia, 6.75%, 2019 (z) | | | 765,000 | | | 772,076 |
| Republic of Peru, 7.125%, 2019 | | | 601,000 | | | 682,135 |
| Republic of Peru, 7.35%, 2025 | | | 700,000 | | | 803,250 |
| Republic of Poland, 6.375%, 2019 | | | 953,000 | | | 1,049,406 |
17
Portfolio of Investments – continued
| | | | | | |
| Issuer | | Shares/Par | | Value ($) |
| | | | | | |
| Bonds - continued | | | | | | |
| Emerging Market Sovereign - continued | | | | | | |
| State of Qatar, 6.55%, 2019 (n) | | $ | 535,000 | | $ | 596,525 |
| | | | | | |
| | | | | | $ | 4,985,320 |
| Forest & Paper Products - 0.1% | | | | | | |
| Inversiones CMPC S.A., 6.125%, 2019 (z) | | $ | 376,000 | | $ | 376,331 |
| | |
| International Market Quasi-Sovereign - 0.3% | | | | | | |
| Canada Housing Trust, 4.6%, 2011 (n) | | CAD | 1,910,000 | | $ | 1,870,619 |
| | |
| International Market Sovereign - 26.8% | | | | | | |
| Dutch Government, 3.75%, 2014 | | EUR | 5,145,000 | | $ | 7,975,056 |
| Federal Republic of Germany, 5%, 2011 | | EUR | 1,599,000 | | | 2,499,794 |
| Federal Republic of Germany, 3.75%, 2013 | | EUR | 1,884,000 | | | 2,932,428 |
| Federal Republic of Germany, 6.25%, 2030 | | EUR | 4,195,000 | | | 7,965,389 |
| Government of Canada, 4.5%, 2015 | | CAD | 1,381,000 | | | 1,390,011 |
| Government of Canada, 4.25%, 2018 | | CAD | 664,000 | | | 658,078 |
| Government of Canada, 5.75%, 2033 | | CAD | 339,000 | | | 394,961 |
| Government of Japan, 1.3%, 2014 | | JPY | 400,000,000 | | | 4,569,025 |
| Government of Japan, 1.7%, 2017 | | JPY | 2,838,000,000 | | | 32,928,777 |
| Government of Japan, 2.1%, 2024 | | JPY | 911,000,000 | | | 10,427,957 |
| Government of Japan, 2.2%, 2027 | | JPY | 715,700,000 | | | 8,140,160 |
| Government of Japan, 2.4%, 2037 | | JPY | 286,350,000 | | | 3,279,341 |
| Kingdom of Belgium, 5.5%, 2017 | | EUR | 3,429,000 | | | 5,789,101 |
| Kingdom of Spain, 5%, 2012 | | EUR | 7,083,000 | | | 11,294,597 |
| Kingdom of Spain, 4.6%, 2019 | | EUR | 2,996,000 | | | 4,711,388 |
| Kingdom of Sweden, 4.5%, 2015 | | SEK | 8,550,000 | | | 1,310,580 |
| Republic of Finland, 3.875%, 2017 | | EUR | 2,612,000 | | | 4,007,164 |
| Republic of France, 6%, 2025 | | EUR | 4,586,000 | | | 8,325,888 |
| Republic of France, 4.75%, 2035 | | EUR | 1,733,000 | | | 2,768,069 |
| Republic of Ireland, 4.6%, 2016 | | EUR | 5,765,000 | | | 8,874,669 |
| Republic of Italy, 4.75%, 2013 | | EUR | 14,514,000 | | | 23,028,775 |
| Republic of Italy, 5.25%, 2017 | | EUR | 9,505,000 | | | 15,699,749 |
| United Kingdom Treasury, 8%, 2015 | | GBP | 3,656,000 | | | 7,673,684 |
| United Kingdom Treasury, 8%, 2021 | | GBP | 2,017,000 | | | 4,621,419 |
| United Kingdom Treasury, 4.25%, 2036 | | GBP | 2,755,000 | | | 4,582,008 |
| | | | | | |
| | | | | | $ | 185,848,068 |
| Local Authorities - 0.3% | | | | | | |
| Metropolitan Transportation Authority, NY (Build America Bonds), 7.336%, 2039 | | $ | 610,000 | | $ | 734,288 |
University of California Rev. (Build America Bonds), 5.77%, 2043 | | | 505,000 | | | 527,644 |
18
Portfolio of Investments – continued
| | | | | | |
| Issuer | | Shares/Par | | Value ($) |
| | | | | | |
| Bonds - continued | | | | | | |
| Local Authorities - continued | | | | | | |
| Utah Transit Authority Sales Tax Rev. (Build America Bonds), “B”, 5.937%, 2039 | | $ | 790,000 | | $ | 833,655 |
| | | | | | |
| | | | | | $ | 2,095,587 |
| Mortgage Backed - 1.5% | | | | | | |
| Fannie Mae, 4.77%, 2012 | | $ | 1,161,832 | | $ | 1,227,280 |
| Fannie Mae, 4.518%, 2013 | | | 79,985 | | | 84,101 |
| Fannie Mae, 5.37%, 2013 | | | 264,959 | | | 285,580 |
| Fannie Mae, 4.78%, 2015 | | | 351,461 | | | 372,219 |
| Fannie Mae, 4.79%, 2015 | | | 367,733 | | | 389,291 |
| Fannie Mae, 4.856%, 2015 | | | 277,762 | | | 293,153 |
| Fannie Mae, 5.5%, 2015-2024 | | | 326,148 | | | 351,247 |
| Fannie Mae, 5.09%, 2016 | | | 362,000 | | | 387,921 |
| Fannie Mae, 5.423%, 2016 | | | 335,393 | | | 365,898 |
| Fannie Mae, 4.989%, 2017 | | | 244,950 | | | 261,371 |
| Fannie Mae, 5.05%, 2017 | | | 330,000 | | | 352,830 |
| Fannie Mae, 5.161%, 2018 | | | 782,992 | | | 843,964 |
| Fannie Mae, 5.1%, 2019 | | | 344,050 | | | 366,238 |
| Fannie Mae, 5.18%, 2019 | | | 344,084 | | | 369,481 |
| Fannie Mae, 6.16%, 2019 | | | 314,919 | | | 350,264 |
| Fannie Mae, 5%, 2025 | | | 280,235 | | | 284,116 |
| Freddie Mac, 5.085%, 2019 | | | 589,000 | | | 630,272 |
| Freddie Mac, 5%, 2023-2028 | | | 2,677,528 | | | 2,749,752 |
| Freddie Mac, 4%, 2024 | | | 127,088 | | | 128,046 |
| Freddie Mac, 5.5%, 2026 | | | 189,827 | | | 194,621 |
| | | | | | |
| | | | | | $ | 10,287,645 |
| Other Banks & Diversified Financials - 0.1% | | | | | | |
| Eurasian Development Bank, 7.375%, 2014 (n) | | $ | 665,000 | | $ | 688,275 |
| | |
| U.S. Government Agencies and Equivalents - 0.7% | | | | | | |
| Aid-Egypt, 4.45%, 2015 | | $ | 1,113,000 | | $ | 1,186,202 |
| Small Business Administration, 5.09%, 2025 | | | 167,644 | | | 177,605 |
| Small Business Administration, 5.21%, 2026 | | | 2,096,467 | | | 2,227,887 |
| Small Business Administration, 5.31%, 2027 | | | 1,121,291 | | | 1,211,732 |
| | | | | | |
| | | | | | $ | 4,803,426 |
| U.S. Treasury Obligations - 4.9% | | | | | | |
| U.S. Treasury Bonds, 4.75%, 2017 | | $ | 6,564,000 | | $ | 7,296,812 |
| U.S. Treasury Bonds, 8%, 2021 | | | 2,235,000 | | | 3,148,905 |
| U.S. Treasury Bonds, 6.875%, 2025 | | | 1,172,000 | | | 1,553,815 |
| U.S. Treasury Notes, 4.75%, 2012 | | | 7,732,000 | | | 8,366,867 |
| U.S. Treasury Notes, 4.125%, 2015 | | | 5,478,000 | | | 5,938,064 |
19
Portfolio of Investments – continued
| | | | | | |
| Issuer | | Shares/Par | | Value ($) |
| | | | | | |
| Bonds - continued | | | | | | |
| U.S. Treasury Obligations - continued | | | | | | |
| U.S. Treasury Notes, TIPS, 2%, 2016 | | $ | 7,600,188 | | $ | 7,994,448 |
| | | | | | |
| | | | | | $ | 34,298,911 |
| Total Bonds (Identified Cost, $243,727,242) | | | | | $ | 261,081,101 |
| | |
| Money Market Funds (v) - 4.4% | | | | | | |
MFS Institutional Money Market Portfolio, 0.13%,
at Cost and Net Asset Value | | | 30,281,275 | | $ | 30,281,275 |
| | |
| Issuer/Expiration Date/Strike Price | | Number of
Contracts | | |
| Call Options Purchased - 0.0% | | | | | | |
Mexican Peso - November 2009 @ $12.794
(Premiums Paid, $8,413) (a) | | | 17,502,192 | | $ | 5,179 |
| Total Investments (Identified Cost, $651,127,721) | | | | | $ | 691,472,603 |
| | |
| Other Assets, Less Liabilities - 0.2% | | | | | | 1,672,884 |
| Net Assets - 100.0% | | | | | $ | 693,145,487 |
| (a) | Non-income producing security. |
| (i) | Interest only security for which the fund receives interest on notional principal (Par amount). Par amount shown is the notional principal and does not reflect the cost of the security. |
| (n) | Securities exempt from registration under Rule 144A of the Securities Act of 1933. These securities may be sold in the ordinary course of business in transactions exempt from registration, normally to qualified institutional buyers. At period end, the aggregate value of these securities was $12,912,694, representing 1.9% of net assets. |
| (v) | Underlying fund that is available only to investment companies managed by MFS. The rate quoted is the annualized seven-day yield of the fund at period end. |
| (z) | Restricted securities are not registered under the Securities Act of 1933 and are subject to legal restrictions on resale. These securities generally may be resold in transactions exempt from registration or to the public if the securities are subsequently registered. Disposal of these securities may involve time-consuming negotiations and prompt sale at an acceptable price may be difficult. The fund holds the following restricted securities: |
| | | | | | |
| Restricted Securities | | Acquisition
Date | | Cost | | Current
Market
Value |
| Banco do Brasil S.A., 8.5%, 2049 | | 10/13/09 | | $100,000 | | $102,900 |
Bayview Commercial Asset Trust, FRN,
0.896%, 2023 | | 5/25/06 | | 506,329 | | 372,291 |
Commercial Mortgage Asset Trust, FRN,
0.851%, 2032 | | 8/25/03 | | 380,212 | | 340,903 |
| Inversiones CMPC S.A., 6.125%, 2019 | | 10/29/09 | | 372,680 | | 376,331 |
| Majapahit Holding B.V., 7.75%, 2020 | | 10/30/09 | | 767,436 | | 767,436 |
| Odebrecht Finance Ltd., 7%, 2020 | | 10/14/09 | | 102,115 | | 98,280 |
20
Portfolio of Investments – continued
| | | | | | |
| Restricted Securities - continued | | Acquisition
Date | | Cost | | Current
Market
Value |
| Republic of Croatia, 6.75%, 2019 | | 10/29/09-10/30/09 | | $766,415 | | $772,076 |
| Total Restricted Securities | | | | | | $2,830,217 |
| % of Net Assets | | | | | | 0.4% |
The following abbreviations are used in this report and are defined:
| ADR | | American Depository Receipt |
| FRN | | Floating Rate Note. Interest rate resets periodically and may not be the rate reported at period end. |
| IPS | | International Preference Stock |
| PLC | | Public Limited Company |
| TIPS | | Treasury Inflation Protected Security |
Abbreviations indicate amounts shown in currencies other than the U.S. dollar. All amounts are stated in U.S. dollars unless otherwise indicated. A list of abbreviations is shown below:
Derivative Contracts at 10/31/09
Forward Foreign Currency Exchange Contracts at 10/31/09
| | | | | | | | | | | | | | |
| Type | | Currency | | Counterparty | | Contracts to
Deliver/
Receive | | Settlement
Date Range | | In
Exchange
For | | Contracts
at Value | | Net
Unrealized
Appreciation
(Depreciation) |
| Asset Derivatives | | | | | | | | |
| SELL | | AUD | | UBS AG | | 1,064,000 | | 11/27/09 | | $960,909 | | $955,632 | | $5,277 |
| BUY | | BRL | | Barclays Bank PLC | | 364,000 | | 11/24/09 | | 198,690 | | 205,741 | | 7,051 |
| BUY | | BRL | | Deutsche Bank AG | | 706,000 | | 11/03/09 | | 398,712 | | 400,772 | | 2,060 |
| SELL | | BRL | | Deutsche Bank AG | | 706,000 | | 11/03/09 | | 404,909 | | 400,772 | | 4,137 |
| SELL | | BRL | | HSBC Bank | | 706,000 | | 11/03/09 | | 404,933 | | 400,772 | | 4,161 |
| SELL | | CAD | | Barclays Bank PLC | | 651,000 | | 12/14/09 | | 621,717 | | 601,636 | | 20,081 |
| BUY | | EUR | | HSBC Bank | | 1,147,000 | | 12/16/09 | | 1,682,821 | | 1,687,818 | | 4,997 |
| BUY | | EUR | | JPMorgan Chase Bank | | 4,135,394 | | 1/13/10 | | 6,078,967 | | 6,084,722 | | 5,755 |
| SELL | | EUR | | UBS AG | | 7,785,746 | | 12/16/09 | | 11,540,714 | | 11,456,777 | | 83,937 |
| BUY | | GBP | | Barclays Bank PLC | | 219,433 | | 1/13/10 | | 348,529 | | 360,010 | | 11,481 |
| BUY | | GBP | | Deutsche Bank AG | | 219,433 | | 1/13/10 | | 348,547 | | 360,010 | | 11,463 |
21
Portfolio of Investments – continued
| | | | | | | | | | | | | | | |
| Type | | Currency | | Counterparty | | Contracts to
Deliver/
Receive | | Settlement
Date Range | | In
Exchange
For | | Contracts
at Value | | Net
Unrealized
Appreciation
(Depreciation) | |
| Asset Derivatives - continued | | | | | | | | | |
| BUY | | IDR | | Credit Suisse Group | | 2,995,650,000 | | 11/02/09 | | $308,798 | | $313,681 | | $4,883 | |
| BUY | | IDR | | JPMorgan Chase Bank | | 3,815,587,000 | | 11/02/09 | | 396,713 | | 399,538 | | 2,825 | |
| SELL | | IDR | | Credit Suisse Group | | 2,995,650,000 | | 11/02/09 | | 315,000 | | 313,681 | | 1,319 | |
| SELL | | IDR | | JPMorgan Chase Bank | | 6,833,623,000 | | 11/02/09-11/13/09 | | 720,704 | | 714,372 | | 6,332 | |
| BUY | | JPY | | Barclays Bank PLC | | 33,284,000 | | 1/13/10 | | 366,986 | | 369,925 | | 2,939 | |
| BUY | | JPY | | HSBC Bank | | 214,593,000 | | 12/16/09 | | 2,362,214 | | 2,384,561 | | 22,347 | |
| BUY | | JPY | | Merrill Lynch International Bank | | 41,658,000 | | 1/13/10 | | 459,512 | | 462,995 | | 3,483 | |
| BUY | | MXN | | Merrill Lynch International Bank | | 5,090,000 | | 11/25/09 | | 377,835 | | 384,394 | | 6,559 | |
| SELL | | MXN | | JPMorgan Chase Bank | | 6,935,639 | | 11/09/09 | | 529,726 | | 524,868 | | 4,858 | |
| BUY | | NOK | | Citibank N.A. | | 10,428,316 | | 11/25/09 | | 1,796,421 | | 1,819,786 | | 23,365 | |
| SELL | | NOK | | UBS AG | | 3,775,000 | | 1/13/10 | | 666,332 | | 657,425 | | 8,907 | |
| | | | | | | | | | | | | | | |
| | | | | | | | | | | | | | $248,217 | |
| | | | | | | | | | | | | | | |
| | | | |
| Liability Derivatives | | | | | | | | | |
| BUY | | AUD | | Goldman Sachs International | | 299,000 | | 1/13/10 | | $273,601 | | $267,223 | | $(6,378 | ) |
| BUY | | AUD | | UBS AG | | 2,317,504 | | 11/27/09 | | 2,131,837 | | 2,081,466 | | (50,371 | ) |
| BUY | | BRL | | HSBC Bank | | 1,070,000 | | 11/03/09-12/02/09 | | 617,253 | | 606,174 | | (11,079 | ) |
| BUY | | CAD | | Barclays Bank PLC | | 894,000 | | 1/13/10 | | 864,662 | | 826,210 | | (38,452 | ) |
| BUY | | CAD | | UBS AG | | 652,077 | | 12/14/09 | | 625,133 | | 602,631 | | (22,502 | ) |
| BUY | | DKK | | Goldman Sachs International | | 1,565,000 | | 11/25/09 | | 313,713 | | 309,322 | | (4,391 | ) |
| BUY | | DKK | | UBS AG | | 8,684,486 | | 1/29/10 | | 1,724,841 | | 1,714,506 | | (10,335 | ) |
| BUY | | EUR | | Citibank N.A. | | 1,019,000 | | 12/16/09-1/13/10 | | 1,514,498 | | 1,499,398 | | (15,100 | ) |
| BUY | | EUR | | UBS AG | | 4,968,048 | | 12/16/09 | | 7,346,948 | | 7,310,516 | | (36,432 | ) |
| SELL | | EUR | | JPMorgan Chase Bank | | 3,366,493 | | 12/16/09 | | 4,923,563 | | 4,953,817 | | (30,254 | ) |
| SELL | | EUR | | Barclays Bank PLC | | 1,119,000 | | 12/16/09 | | 1,644,820 | | 1,646,616 | | (1,796 | ) |
| SELL | | EUR | | UBS AG | | 9,437,431 | | 12/16/09 | | 13,797,050 | | 13,887,242 | | (90,192 | ) |
| SELL | | GBP | | Deutsche Bank AG | | 177,000 | | 1/13/10 | | 289,618 | | 290,393 | | (775 | ) |
| BUY | | IDR | | JPMorgan Chase Bank | | 6,013,686,000 | | 11/13/09 | | 641,032 | | 628,514 | | (12,518 | ) |
22
Portfolio of Investments – continued
| | | | | | | | | | | | | | | |
| Type | | Currency | | Counterparty | | Contracts to
Deliver/
Receive | | Settlement
Date Range | | In
Exchange
For | | Contracts
at Value | | Net
Unrealized
Appreciation
(Depreciation) | |
| Liability Derivatives - continued | | | | | | | | | |
| SELL | | IDR | | JPMorgan Chase Bank | | 2,995,650,000 | | 11/02/09 | | $308,798 | | $313,681 | | $(4,883 | ) |
| BUY | | JPY | | JPMorgan Chase Bank | | 2,374,614,158 | | 1/13/10 | | 26,431,150 | | 26,391,920 | | (39,230 | ) |
| SELL | | JPY | | Barclays Bank PLC | | 2,609,000 | | 12/16/09 | | 28,340 | | 28,991 | | (651 | ) |
| BUY | | KRW | | JPMorgan Chase Bank | | 1,286,214,000 | | 11/13/09-11/16/09 | | 1,102,084 | | 1,087,779 | | (14,305 | ) |
| SELL | | KRW | | Deutsche Bank AG | | 782,960,000 | | 11/16/09 | | 654,102 | | 662,153 | | (8,051 | ) |
| BUY | | NOK | | Goldman Sachs International | | 1,287,000 | | 11/25/09 | | 229,764 | | 224,587 | | (5,177 | ) |
| BUY | | SEK | | HSBC Bank | | 145,579 | | 1/28/10 | | 21,420 | | 20,536 | | (884 | ) |
| BUY | | TRY | | JPMorgan Chase Bank | | 560,000 | | 11/25/09 | | 372,811 | | 371,078 | | (1,733 | ) |
| | | | | | | | | | | | | | | |
| | | | | | | | | | | | | | $(405,489 | ) |
| | | | | | | | | | | | | | | |
At October 31, 2009, the fund had sufficient cash and/or other liquid securities to cover any commitments under these derivative contracts.
See Notes to Financial Statements
23
Financial Statements
STATEMENT OF ASSETS AND LIABILITIES
At 10/31/09
This statement represents your fund’s balance sheet, which details the assets and liabilities comprising the total value of the fund.
| | | |
| Assets | | | |
Investments- | | | |
Non-affiliated issuers, at value (identified cost, $620,846,446) | | $661,191,328 | |
Underlying funds, at cost and value | | 30,281,275 | |
Total investments, at value (identified cost, $651,127,721) | | $691,472,603 | |
Cash | | 797,849 | |
Restricted cash | | 310,000 | |
Foreign currency, at value (identified cost, $7,341) | | 7,344 | |
Receivables for | | | |
Forward foreign currency exchange contracts | | 248,217 | |
Investments sold | | 2,409,164 | |
Fund shares sold | | 2,679,244 | |
Interest and dividends | | 3,881,330 | |
Total assets | | $701,805,751 | |
| Liabilities | | | |
Payables for | | | |
Forward foreign currency exchange contracts | | $405,489 | |
Investments purchased | | 6,233,888 | |
Fund shares reacquired | | 1,596,716 | |
Payable to affiliates | | | |
Investment adviser | | 40,130 | |
Shareholder servicing costs | | 129,292 | |
Distribution and service fees | | 26,677 | |
Administrative services fee | | 951 | |
Payable for independent Trustees’ compensation | | 60,326 | |
Accrued expenses and other liabilities | | 166,795 | |
Total liabilities | | $8,660,264 | |
Net assets | | $693,145,487 | |
| Net assets consist of | | | |
Paid-in capital | | $708,940,804 | |
Unrealized appreciation (depreciation) on investments and translation of assets and liabilities in foreign currencies (net of $32,686 deferred country tax) | | 40,213,144 | |
Accumulated net realized gain (loss) on investments and foreign currency transactions | | (57,561,999 | ) |
Undistributed net investment income | | 1,553,538 | |
Net assets | | $693,145,487 | |
Shares of beneficial interest outstanding | | 55,287,501 | |
| | | | | | |
| | | Net assets | | Shares
outstanding | | Net asset value
per share (a) |
Class A | | $434,535,765 | | 34,790,179 | | $12.49 |
Class B | | 53,054,369 | | 4,158,830 | | 12.76 |
Class C | | 155,006,659 | | 12,279,155 | | 12.62 |
Class I | | 15,696,652 | | 1,266,442 | | 12.39 |
Class R1 | | 2,459,827 | | 195,549 | | 12.58 |
Class R2 | | 5,458,683 | | 439,947 | | 12.41 |
Class R3 | | 4,593,055 | | 368,633 | | 12.46 |
Class R4 | | 22,340,477 | | 1,788,766 | | 12.49 |
| (a) | Maximum offering price per share was equal to the net asset value per share for all share classes, except for Class A, for which the maximum offering price per share was $13.25. On sales of $50,000 or more, the offering price of Class A shares is reduced. A contingent deferred sales charge may be imposed on redemptions of Class A, Class B, and Class C shares. Redemption price per share was equal to the net asset value per share for Classes I, R1, R2, R3, and R4. |
See Notes to Financial Statements
24
Financial Statements
STATEMENT OF OPERATIONS
Year ended 10/31/09
This statement describes how much your fund earned in investment income and accrued in expenses. It also describes any gains and/or losses generated by fund operations.
| | | |
| Net investment income | | | |
Income | | | |
Dividends | | $11,707,476 | |
Interest | | 6,987,471 | |
Dividends from underlying funds | | 135,744 | |
Foreign taxes withheld | | (666,025 | ) |
Total investment income | | $18,164,666 | |
Expenses | | | |
Management fee | | $5,031,636 | |
Distribution and service fees | | 2,958,332 | |
Shareholder servicing costs | | 990,442 | |
Administrative services fee | | 123,125 | |
Independent Trustees’ compensation | | 28,490 | |
Custodian fee | | 183,134 | |
Shareholder communications | | 64,191 | |
Auditing fees | | 69,074 | |
Legal fees | | 19,070 | |
Miscellaneous | | 155,526 | |
Total expenses | | $9,623,020 | |
Fees paid indirectly | | (1,376 | ) |
Reduction of expenses by investment adviser | | (752,218 | ) |
Net expenses | | $8,869,426 | |
Net investment income | | $9,295,240 | |
Realized and unrealized gain (loss) on investments
and foreign currency transactions | | | |
Realized gain (loss) (identified cost basis) | | | |
Investment transactions (net of $181 deferred country tax) | | $(55,367,886 | ) |
Futures contracts | | 480,722 | |
Foreign currency transactions | | 2,367,073 | |
Net realized gain (loss) on investments
and foreign currency transactions | | $(52,520,091 | ) |
Change in unrealized appreciation (depreciation) | | | |
Investments (net of $32,686 increase in deferred country tax) | | $134,617,375 | |
Futures contracts | | (149,073 | ) |
Translation of assets and liabilities in foreign currencies | | (585,533 | ) |
Net unrealized gain (loss) on investments
and foreign currency translation | | $133,882,769 | |
Net realized and unrealized gain (loss) on investments
and foreign currency | | $81,362,678 | |
Change in net assets from operations | | $90,657,918 | |
See Notes to Financial Statements
25
Financial Statements
STATEMENTS OF CHANGES IN NET ASSETS
These statements describe the increases and/or decreases in net assets resulting from operations, any distributions, and any shareholder transactions.
| | | | | | |
| | | Years ended 10/31 | |
| | | 2009 | | | 2008 | |
| Change in net assets | | | | | | |
| From operations | | | | | | |
Net investment income | | $9,295,240 | | | $11,769,684 | |
Net realized gain (loss) on investments and
foreign currency transactions | | (52,520,091 | ) | | 28,458,944 | |
Net unrealized gain (loss) on investments and
foreign currency translation | | 133,882,769 | | | (185,095,868 | ) |
Change in net assets from operations | | $90,657,918 | | | $(144,867,240 | ) |
| Distributions declared to shareholders | | | | | | |
From net investment income | | $(17,925,328 | ) | | $(25,320,781 | ) |
From net realized gain on investments | | (5,137,989 | ) | | (45,914,795 | ) |
Total distributions declared to shareholders | | $(23,063,317 | ) | | $(71,235,576 | ) |
Change in net assets from fund share transactions | | $48,771,030 | | | $101,770,721 | |
Total change in net assets | | $116,365,631 | | | $(114,332,095 | ) |
| Net assets | | | | | | |
At beginning of period | | 576,779,856 | | | 691,111,951 | |
At end of period (including undistributed net investment
income of $1,553,538 and $10,361,247, respectively) | | $693,145,487 | | | $576,779,856 | |
See Notes to Financial Statements
26
Financial Statements
FINANCIAL HIGHLIGHTS
The financial highlights table is intended to help you understand the fund’s financial performance for the past 5 years (or life of a particular share class, if shorter). Certain information reflects financial results for a single fund share. The total returns in the table represent the rate by which an investor would have earned (or lost) on an investment in the fund share class (assuming reinvestment of all distributions) held for the entire period.
| | | | | | | | | | | | | | | |
| Class A | | Years ended 10/31 | |
| | | 2009 | | | 2008 | | | 2007 | | | 2006 | | | 2005 | |
Net asset value, beginning of period | | $11.23 | | | $15.66 | | | $15.05 | | | $14.30 | | | $14.73 | |
| Income (loss) from investment operations | |
Net investment income (d) | | $0.20 | | | $0.27 | | | $0.29 | | | $0.28 | | | $0.24 | |
Net realized and unrealized gain (loss) on investments and foreign currency | | 1.53 | | | (3.10 | ) | | 1.67 | | | 1.80 | | | 0.94 | |
Total from investment operations | | $1.73 | | | $(2.83 | ) | | $1.96 | | | $2.08 | | | $1.18 | |
| Less distributions declared to shareholders | |
From net investment income | | $(0.37 | ) | | $(0.56 | ) | | $(0.30 | ) | | $(0.22 | ) | | $(0.56 | ) |
From net realized gain on investments | | (0.10 | ) | | (1.04 | ) | | (1.05 | ) | | (1.11 | ) | | (1.05 | ) |
Total distributions declared to shareholders | | $(0.47 | ) | | $(1.60 | ) | | $(1.35 | ) | | $(1.33 | ) | | $(1.61 | ) |
Net asset value, end of period | | $12.49 | | | $11.23 | | | $15.66 | | | $15.05 | | | $14.30 | |
Total return (%) (r)(s)(t) | | 16.10 | | | (19.92 | ) | | 13.89 | | | 15.62 | | | 8.26 | |
| Ratios (%) (to average net assets) and Supplemental data: | | | | | | | | | | | | | | | |
Expenses before expense reductions (f) | | 1.39 | | | 1.42 | | | 1.46 | | | 1.52 | | | 1.52 | |
Expenses after expense reductions (f) | | 1.27 | | | 1.30 | | | 1.30 | | | 1.30 | | | 1.48 | |
Net investment income | | 1.77 | | | 1.97 | | | 1.97 | | | 1.95 | | | 1.64 | |
Portfolio turnover | | 75 | | | 96 | | | 66 | | | 82 | | | 82 | |
Net assets at end of period (000 omitted) | | $434,536 | | | $368,117 | | | $450,366 | | | $403,848 | | | $353,745 | |
See Notes to Financial Statements
27
Financial Highlights – continued
| | | | | | | | | | | | | | | |
| Class B | | Years ended 10/31 | |
| | | 2009 | | | 2008 | | | 2007 | | | 2006 | | | 2005 | |
Net asset value, beginning of period | | $11.46 | | | $15.93 | | | $15.28 | | | $14.47 | | | $14.82 | |
| Income (loss) from investment operations | | | | | | | | | | | | | | | |
Net investment income (d) | | $0.12 | | | $0.18 | | | $0.20 | | | $0.19 | | | $0.14 | |
Net realized and unrealized gain (loss) on investments and foreign currency | | 1.57 | | | (3.15 | ) | | 1.70 | | | 1.82 | | | 0.95 | |
Total from investment operations | | $1.69 | | | $(2.97 | ) | | $1.90 | | | $2.01 | | | $1.09 | |
| Less distributions declared to shareholders | | | | | | | | | | | | | | | |
From net investment income | | $(0.29 | ) | | $(0.46 | ) | | $(0.20 | ) | | $(0.09 | ) | | $(0.39 | ) |
From net realized gain on investments | | (0.10 | ) | | (1.04 | ) | | (1.05 | ) | | (1.11 | ) | | (1.05 | ) |
Total distributions declared to shareholders | | $(0.39 | ) | | $(1.50 | ) | | $(1.25 | ) | | $(1.20 | ) | | $(1.44 | ) |
Net asset value, end of period | | $12.76 | | | $11.46 | | | $15.93 | | | $15.28 | | | $14.47 | |
Total return (%) (r)(s)(t) | | 15.27 | | | (20.39 | ) | | 13.16 | | | 14.84 | | | 7.56 | |
| Ratios (%) (to average net assets) and Supplemental data: | | | | | | | | | | | | | | | |
Expenses before expense reductions (f) | | 2.11 | | | 2.07 | | | 2.11 | | | 2.17 | | | 2.17 | |
Expenses after expense reductions (f) | | 1.98 | | | 1.95 | | | 1.95 | | | 1.95 | | | 2.13 | |
Net investment income | | 1.05 | | | 1.32 | | | 1.32 | | | 1.29 | | | 0.98 | |
Portfolio turnover | | 75 | | | 96 | | | 66 | | | 82 | | | 82 | |
Net assets at end of period (000 omitted) | | $53,054 | | | $59,239 | | | $95,689 | | | $115,336 | | | $124,013 | |
| |
| Class C | | Years ended 10/31 | |
| | | 2009 | | | 2008 | | | 2007 | | | 2006 | | | 2005 | |
Net asset value, beginning of period | | $11.35 | | | $15.80 | | | $15.18 | | | $14.39 | | | $14.76 | |
| Income (loss) from investment operations | | | | | | | | | | | | | | | |
Net investment income (d) | | $0.12 | | | $0.18 | | | $0.20 | | | $0.19 | | | $0.15 | |
Net realized and unrealized gain (loss) on investments and foreign currency | | 1.54 | | | (3.12 | ) | | 1.68 | | | 1.81 | | | 0.94 | |
Total from investment operations | | $1.66 | | | $(2.94 | ) | | $1.88 | | | $2.00 | | | $1.09 | |
| Less distributions declared to shareholders | | | | | | | | | | | | | | | |
From net investment income | | $(0.29 | ) | | $(0.47 | ) | | $(0.21 | ) | | $(0.10 | ) | | $(0.41 | ) |
From net realized gain on investments | | (0.10 | ) | | (1.04 | ) | | (1.05 | ) | | (1.11 | ) | | (1.05 | ) |
Total distributions declared to shareholders | | $(0.39 | ) | | $(1.51 | ) | | $(1.26 | ) | | $(1.21 | ) | | $(1.46 | ) |
Net asset value, end of period | | $12.62 | | | $11.35 | | | $15.80 | | | $15.18 | | | $14.39 | |
Total return (%) (r)(s)(t) | | 15.22 | | | (20.39 | ) | | 13.12 | | | 14.87 | | | 7.59 | |
| Ratios (%) (to average net assets) and Supplemental data: | | | | | | | | | | | | | | | |
Expenses before expense reductions (f) | | 2.11 | | | 2.07 | | | 2.11 | | | 2.17 | | | 2.16 | |
Expenses after expense reductions (f) | | 1.99 | | | 1.95 | | | 1.95 | | | 1.95 | | | 2.12 | |
Net investment income | | 1.04 | | | 1.32 | | | 1.32 | | | 1.29 | | | 1.00 | |
Portfolio turnover | | 75 | | | 96 | | | 66 | | | 82 | | | 82 | |
Net assets at end of period (000 omitted) | | $155,007 | | | $123,754 | | | $132,343 | | | $99,019 | | | $75,974 | |
See Notes to Financial Statements
28
Financial Highlights – continued
| | | | | | | | | | | | | | | |
| Class I | | Years ended 10/31 | |
| | | 2009 | | | 2008 | | | 2007 | | | 2006 | | | 2005 | |
Net asset value, beginning of period | | $11.16 | | | $15.55 | | | $14.95 | | | $14.23 | | | $14.69 | |
| Income (loss) from investment operations | | | | | | | | | | | | | | | |
Net investment income (d) | | $0.20 | | | $0.31 | | | $0.35 | | | $0.32 | | | $0.29 | |
Net realized and unrealized gain (loss) on investments and foreign currency | | 1.54 | | | (3.05 | ) | | 1.66 | | | 1.79 | | | 0.93 | |
Total from investment operations | | $1.74 | | | $(2.74 | ) | | $2.01 | | | $2.11 | | | $1.22 | |
| Less distributions declared to shareholders | | | | | | | | | | | | | | | |
From net investment income | | $(0.41 | ) | | $(0.61 | ) | | $(0.36 | ) | | $(0.28 | ) | | $(0.63 | ) |
From net realized gain on investments | | (0.10 | ) | | (1.04 | ) | | (1.05 | ) | | (1.11 | ) | | (1.05 | ) |
Total distributions declared to shareholders | | $(0.51 | ) | | $(1.65 | ) | | $(1.41 | ) | | $(1.39 | ) | | $(1.68 | ) |
Net asset value, end of period | | $12.39 | | | $11.16 | | | $15.55 | | | $14.95 | | | $14.23 | |
Total return (%) (r)(s) | | 16.27 | | | (19.51 | ) | | 14.31 | | | 16.00 | | | 8.65 | |
| Ratios (%) (to average net assets) and Supplemental data: | | | | | | | | | | | | | | | |
Expenses before expense reductions (f) | | 1.09 | | | 1.07 | | | 1.11 | | | 1.12 | | | 1.16 | |
Expenses after expense reductions (f) | | 0.99 | | | 0.95 | | | 0.95 | | | 0.95 | | | 1.12 | |
Net investment income | | 1.76 | | | 2.31 | | | 2.34 | | | 2.28 | | | 1.99 | |
Portfolio turnover | | 75 | | | 96 | | | 66 | | | 82 | | | 82 | |
Net assets at end of period (000 omitted) | | $15,697 | | | $3,066 | | | $3,691 | | | $4,133 | | | $3,170 | |
| |
| Class R1 | | Years ended 10/31 | |
| | | 2009 | | | 2008 | | | 2007 | | | 2006 | | | 2005 (i) | |
Net asset value, beginning of period | | $11.32 | | | $15.77 | | | $15.17 | | | $14.40 | | | $14.42 | |
| Income (loss) from investment operations | | | | | | | | | | | | | | | |
Net investment income (d) | | $0.12 | | | $0.17 | | | $0.17 | | | $0.18 | | | $0.08 | |
Net realized and unrealized gain (loss) on investments and foreign currency | | 1.54 | | | (3.11 | ) | | 1.69 | | | 1.81 | | | 0.06 | (g) |
Total from investment operations | | $1.66 | | | $(2.94 | ) | | $1.86 | | | $1.99 | | | $0.14 | |
| Less distributions declared to shareholders | | | | | | | | | | | | | | | |
From net investment income | | $(0.30 | ) | | $(0.47 | ) | | $(0.21 | ) | | $(0.11 | ) | | $(0.16 | ) |
From net realized gain on investments | | (0.10 | ) | | (1.04 | ) | | (1.05 | ) | | (1.11 | ) | | — | |
Total distributions declared to shareholders | | $(0.40 | ) | | $(1.51 | ) | | $(1.26 | ) | | $(1.22 | ) | | $(0.16 | ) |
Net asset value, end of period | | $12.58 | | | $11.32 | | | $15.77 | | | $15.17 | | | $14.40 | |
Total return (%) (r)(s) | | 15.20 | | | (20.42 | ) | | 13.00 | | | 14.78 | | | 0.99 | (n) |
| Ratios (%) (to average net assets) and Supplemental data: | | | | | | | | | | | | | | | |
Expenses before expense reductions (f) | | 2.10 | | | 2.11 | | | 2.24 | | | 2.39 | | | 2.34 | (a) |
Expenses after expense reductions (f) | | 1.99 | | | 1.98 | | | 2.05 | | | 2.05 | | | 2.28 | (a) |
Net investment income | | 1.02 | | | 1.26 | | | 1.11 | | | 1.23 | | | 0.91 | (a) |
Portfolio turnover | | 75 | | | 96 | | | 66 | | | 82 | | | 82 | |
Net assets at end of period (000 omitted) | | $2,460 | | | $1,161 | | | $1,044 | | | $363 | | | $52 | |
See Notes to Financial Statements
29
Financial Highlights – continued
| | | | | | | | | | | | | | | |
| Class R2 | | Years ended 10/31 | |
| | | 2009 | | | 2008 | | | 2007 | | | 2006 | | | 2005 | |
Net asset value, beginning of period | | $11.17 | | | $15.57 | | | $14.97 | | | $14.24 | | | $14.67 | |
| Income (loss) from investment operations | | | | | | | | | | | | | | | |
Net investment income (d) | | $0.18 | | | $0.24 | | | $0.23 | | | $0.25 | | | $0.18 | |
Net realized and unrealized gain (loss) on investments and foreign currency | | 1.51 | | | (3.06 | ) | | 1.68 | | | 1.77 | | | 0.94 | |
Total from investment operations | | $1.69 | | | $(2.82 | ) | | $1.91 | | | $2.02 | | | $1.12 | |
| Less distributions declared to shareholders | | | | | | | | | | | | | | | |
From net investment income | | $(0.35 | ) | | $(0.54 | ) | | $(0.26 | ) | | $(0.18 | ) | | $(0.50 | ) |
From net realized gain on investments | | (0.10 | ) | | (1.04 | ) | | (1.05 | ) | | (1.11 | ) | | (1.05 | ) |
Total distributions declared to shareholders | | $(0.45 | ) | | $(1.58 | ) | | $(1.31 | ) | | $(1.29 | ) | | $(1.55 | ) |
Net asset value, end of period | | $12.41 | | | $11.17 | | | $15.57 | | | $14.97 | | | $14.24 | |
Total return (%) (r)(s) | | 15.81 | | | (19.98 | ) | | 13.57 | | | 15.19 | | | 7.87 | |
| Ratios (%) (to average net assets) and Supplemental data: | | | | | | | | | | | | | | | |
Expenses before expense reductions (f) | | 1.61 | | | 1.59 | | | 1.80 | | | 1.94 | | | 1.92 | |
Expenses after expense reductions (f) | | 1.49 | | | 1.47 | | | 1.60 | | | 1.60 | | | 1.87 | |
Net investment income | | 1.57 | | | 1.81 | | | 1.58 | | | 1.76 | | | 1.24 | |
Portfolio turnover | | 75 | | | 96 | | | 66 | | | 82 | | | 82 | |
Net assets at end of period (000 omitted) | | $5,459 | | | $3,202 | | | $2,306 | | | $1,185 | | | $159 | |
| |
| Class R3 | | Years ended 10/31 | |
| | | 2009 | | | 2008 | | | 2007 | | | 2006 | | | 2005 (i) | |
Net asset value, beginning of period | | $11.21 | | | $15.62 | | | $15.02 | | | $14.28 | | | $14.26 | |
| Income (loss) from investment operations | | | | | | | | | | | | | | | |
Net investment income (d) | | $0.20 | | | $0.28 | | | $0.29 | | | $0.31 | | | $0.14 | |
Net realized and unrealized gain (loss) on investments and foreign currency | | 1.53 | | | (3.08 | ) | | 1.66 | | | 1.75 | | | 0.07 | (g) |
Total from investment operations | | $1.73 | | | $(2.80 | ) | | $1.95 | | | $2.06 | | | $0.21 | |
| Less distributions declared to shareholders | | | | | | | | | | | | | | | |
From net investment income | | $(0.38 | ) | | $(0.57 | ) | | $(0.30 | ) | | $(0.21 | ) | | $(0.19 | ) |
From net realized gain on investments | | (0.10 | ) | | (1.04 | ) | | (1.05 | ) | | (1.11 | ) | | — | |
Total distributions declared to shareholders | | $(0.48 | ) | | $(1.61 | ) | | $(1.35 | ) | | $(1.32 | ) | | $(0.19 | ) |
Net asset value, end of period | | $12.46 | | | $11.21 | | | $15.62 | | | $15.02 | | | $14.28 | |
Total return (%) (r)(s) | | 16.10 | | | (19.80 | ) | | 13.84 | | | 15.53 | | | 1.48 | (n) |
| Ratios (%) (to average net assets) and Supplemental data: | | | | | | | | | | | | | | | |
Expenses before expense reductions (f) | | 1.36 | | | 1.35 | | | 1.50 | | | 1.57 | | | 1.54 | (a) |
Expenses after expense reductions (f) | | 1.24 | | | 1.23 | | | 1.35 | | | 1.35 | | | 1.50 | (a) |
Net investment income | | 1.78 | | | 2.02 | | | 1.94 | | | 2.10 | | | 1.70 | (a) |
Portfolio turnover | | 75 | | | 96 | | | 66 | | | 82 | | | 82 | |
Net assets at end of period (000 omitted) | | $4,593 | | | $3,431 | | | $3,951 | | | $1,303 | | | $51 | |
See Notes to Financial Statements
30
Financial Highlights – continued
| | | | | | | | | | | | | | | |
| Class R4 | | Years ended 10/31 | |
| | | 2009 | | | 2008 | | | 2007 | | | 2006 | | | 2005 (i) | |
Net asset value, beginning of period | | $11.24 | | | $15.65 | | | $15.03 | | | $14.29 | | | $14.26 | |
| Income (loss) from investment operations | | | | |
Net investment income (d) | | $0.23 | | | $0.29 | | | $0.28 | | | $0.25 | | | $0.17 | |
Net realized and unrealized gain (loss) on investments and foreign currency | | 1.53 | | | (3.05 | ) | | 1.71 | | | 1.87 | | | 0.06 | (g) |
| Total from investment operations | | $1.76 | | | $(2.76 | ) | | $1.99 | | | $2.12 | | | $0.23 | |
| Less distributions declared to shareholders | | | | |
From net investment income | | $(0.41 | ) | | $(0.61 | ) | | $(0.32 | ) | | $(0.27 | ) | | $(0.20 | ) |
From net realized gain on investments | | (0.10 | ) | | (1.04 | ) | | (1.05 | ) | | (1.11 | ) | | — | |
Total distributions declared to shareholders | | $(0.51 | ) | | $(1.65 | ) | | $(1.37 | ) | | $(1.38 | ) | | $(0.20 | ) |
| Net asset value, end of period | | $12.49 | | | $11.24 | | | $15.65 | | | $15.03 | | | $14.29 | |
| Total return (%) (r)(s) | | 16.33 | | | (19.53 | ) | | 14.13 | | | 15.95 | | | 1.62 | (n) |
| Ratios (%) (to average net assets) and Supplemental data: | | | | | | | | | | | | | | | |
Expenses before expense reductions (f) | | 1.11 | | | 1.05 | | | 1.21 | | | 1.30 | | | 1.24 | (a) |
Expenses after expense reductions (f) | | 0.99 | | | 0.95 | | | 1.05 | | | 1.05 | | | 1.20 | (a) |
Net investment income | | 2.07 | | | 2.15 | | | 2.00 | | | 1.77 | | | 2.00 | (a) |
Portfolio turnover | | 75 | | | 96 | | | 66 | | | 82 | | | 82 | |
Net assets at end of period (000 omitted) | | $22,340 | | | $14,809 | | | $428 | | | $661 | | | $51 | |
Any redemption fees charged by the fund during the 2005 fiscal year resulted in a per share impact of less than $0.01.
| (d) | Per share data is based on average shares outstanding. |
| (f) | Ratios do not reflect reductions from fees paid indirectly, if applicable. |
| (g) | The per share amount varies from the net realized and unrealized gain/loss for the period because of the timing of sales of fund shares and the per share amount of realized and unrealized gains and losses at such time. |
| (i) | For the period from the class’ inception, April 1, 2005 (Classes R1, R3, and R4) through the stated period end. |
| (r) | Certain expenses have been reduced without which performance would have been lower. |
| (s) | From time to time the fund may receive proceeds from litigation settlements, without which performance would be lower. |
| (t) | Total returns do not include any applicable sales charges. |
See Notes to Financial Statements
31
NOTES TO FINANCIAL STATEMENTS
| (1) | | Business and Organization |
MFS Global Total Return Fund (the fund) is a series of MFS Series Trust VI (the trust). The trust is organized as a Massachusetts business trust and is registered under the Investment Company Act of 1940, as amended, as an open-end management investment company.
| (2) | | Significant Accounting Policies |
General – The preparation of financial statements in conformity with U.S. generally accepted accounting principles requires management to make estimates and assumptions that affect the reported amounts of assets and liabilities, and disclosure of contingent assets and liabilities at the date of the financial statements and the reported amounts of revenues and expenses during the reporting period. In making these estimates and assumptions, management has considered the effects, if any, of events occurring after the date of the fund’s Statement of Assets and Liabilities through December 17, 2009 which is the date that the financial statements were issued. Actual results could differ from those estimates. The fund can invest in foreign securities, including securities of emerging market issuers. Investments in foreign securities are vulnerable to the effects of changes in the relative values of the local currency and the U.S. dollar and to the effects of changes in each country’s legal, political, and economic environment. The markets of emerging markets countries are generally more volatile than the markets of developed countries with more mature economies. All of the risks of investing in foreign securities previously described are heightened when investing in emerging markets countries.
Investment Valuations – Equity securities, including restricted equity securities, are generally valued at the last sale or official closing price as provided by a third-party pricing service on the market or exchange on which they are primarily traded. Equity securities, for which there were no sales reported that day, are generally valued at the last quoted daily bid quotation as provided by a third-party pricing service on the market or exchange on which such securities are primarily traded. Equity securities held short, for which there were no sales reported for that day, are generally valued at the last quoted daily ask quotation as provided by a third-party pricing service on the market or exchange on which such securities are primarily traded. Debt instruments and floating rate loans (other than short-term instruments), including restricted debt instruments, are generally valued at an evaluated or composite bid as provided by a third-party pricing service. Short-term instruments with a maturity at issuance of 60 days or less generally are valued at amortized cost, which approximates market value. Exchange-traded options
32
Notes to Financial Statements – continued
are generally valued at the last sale or official closing price as provided by a third-party pricing service on the exchange on which such options are primarily traded. Exchange-traded options for which there were no sales reported that day are generally valued at the last daily bid quotation as provided by a third-party pricing service on the exchange on which such options are primarily traded. Options not traded on an exchange are generally valued at a broker/dealer bid quotation. Foreign currency options are generally valued using an external pricing model that uses market data from a third-party source. Futures contracts are generally valued at last posted settlement price as provided by a third-party pricing service on the market on which they are primarily traded. Futures contracts for which there were no trades that day for a particular position are generally valued at the closing bid quotation as provided by a third-party pricing service on the market on which such futures contracts are primarily traded. Forward foreign currency contracts are generally valued at the mean of bid and asked prices for the time period interpolated from rates provided by a third-party pricing service for proximate time periods. Open-end investment companies are generally valued at net asset value per share. Securities and other assets generally valued on the basis of information from a third-party pricing service may also be valued at a broker/dealer bid quotation. Values obtained from third-party pricing services can utilize both transaction data and market information such as yield, quality, coupon rate, maturity, type of issue, trading characteristics, and other market data. The values of foreign securities and other assets and liabilities expressed in foreign currencies are converted to U.S. dollars using the mean of bid and asked prices for rates provided by a third-party pricing service.
The Board of Trustees has delegated primary responsibility for determining or causing to be determined the value of the fund’s investments (including any fair valuation) to the adviser pursuant to valuation policies and procedures approved by the Board. If the adviser determines that reliable market quotations are not readily available, investments are valued at fair value as determined in good faith by the adviser in accordance with such procedures under the oversight of the Board of Trustees. Under the fund’s valuation policies and procedures, market quotations are not considered to be readily available for most types of debt instruments and floating rate loans and many types of derivatives. These investments are generally valued at fair value based on information from third-party pricing services. In addition, investments may be valued at fair value if the adviser determines that an investment’s value has been materially affected by events occurring after the close of the exchange or market on which the investment is principally traded (such as foreign exchange or market) and prior to the determination of the fund’s net asset value, or after the halting of trading of a specific security where trading does not resume prior to the close of the exchange or market on which the security
33
Notes to Financial Statements – continued
is principally traded. Events that occur on a frequent basis after foreign markets close (such as developments in foreign markets and significant movements in the U.S. markets) and prior to the determination of the fund’s net asset value may be deemed to have a material affect on the value of securities traded in foreign markets. Accordingly, the fund’s foreign equity securities may often be valued at fair value. The adviser generally relies on third-party pricing services or other information (such as the correlation with price movements of similar securities in the same or other markets; the type, cost and investment characteristics of the security; the business and financial condition of the issuer; and trading and other market data) to assist in determining whether to fair value and at what value to fair value an investment. The value of an investment for purposes of calculating the fund’s net asset value can differ depending on the source and method used to determine value. When fair valuation is used, the value of an investment used to determine the fund’s net asset value may differ from quoted or published prices for the same investment. There can be no assurance that the fund could obtain the fair value assigned to an investment if it were to sell the investment at the same time at which the fund determines its net asset value per share.
The fund has adopted FASB Accounting Standard Codification 820, Fair Value Measurements and Disclosures (“ASC 820”), which provides a single definition of fair value, a hierarchy for measuring fair value and expanded disclosures about fair value measurements.
Various inputs are used in determining the value of the fund’s assets or liabilities carried at market value. These inputs are categorized into three broad levels. In certain cases, the inputs used to measure fair value may fall into different levels of the fair value hierarchy. In such cases, an investment’s level within the fair value hierarchy is based on the lowest level of input that is significant to the fair value measurement. The fund’s assessment of the significance of a particular input to the fair value measurement in its entirety requires judgment, and considers factors specific to the investment. Level 1 includes unadjusted quoted prices in active markets for identical assets or liabilities. Level 2 includes other significant observable market-based inputs (including quoted prices for similar securities, interest rates, prepayment speed, and credit risk). Level 3 includes unobservable inputs, which may include the adviser’s own assumptions in determining the fair value of investments. Other financial instruments are derivative instruments not reflected in total investments, such as futures, forwards, swap contracts, and written options. The following is a summary of
34
Notes to Financial Statements – continued
the levels used as of October 31, 2009 in valuing the fund’s assets or liabilities carried at market value:
| | | | | | | | | | |
| Investments at Value | | Level 1 | | Level 2 | | | Level 3 | | Total | |
| Equity Securities: | | | | | | | | | | |
United States | | $163,092,003 | | $— | | | $— | | $163,092,003 | |
United Kingdom | | 14,960,072 | | 41,912,369 | | | — | | 56,872,441 | |
Japan | | — | | 50,925,693 | | | — | | 50,925,693 | |
Switzerland | | — | | 34,128,705 | | | — | | 34,128,705 | |
France | | — | | 31,919,735 | | | — | | 31,919,735 | |
Netherlands | | 5,718,890 | | 12,901,840 | | | — | | 18,620,730 | |
Germany | | 2,621,261 | | 12,393,539 | | | — | | 15,014,800 | |
South Korea | | 1,650,412 | | 3,591,361 | | | — | | 5,241,773 | |
Finland | | — | | 4,419,381 | | | — | | 4,419,381 | |
Other Countries | | 6,133,509 | | 13,741,454 | | | — | | 19,874,963 | |
| U.S. Treasury Bonds & U.S. Government Agency & Equivalents | | — | | 39,102,336 | | | — | | 39,102,336 | |
| Non-U.S. Sovereign Debt | | — | | 203,677,133 | | | — | | 203,677,133 | |
| Corporate Bonds | | — | | 2,095,587 | | | — | | 2,095,587 | |
| Residential Mortgage-Backed Securities | | — | | 10,287,646 | | | — | | 10,287,646 | |
| Commercial Mortgage-Backed Securities | | — | | 5,443,791 | | | — | | 5,443,791 | |
| Foreign Bonds | | — | | 474,611 | | | — | | 474,611 | |
| Mutual Funds | | 30,281,275 | | — | | | — | | 30,281,275 | |
| Total Investments | | $224,457,422 | | $467,015,181 | | | $— | | $691,472,603 | |
| | | | |
| Other Financial Instruments | | | | | | | | | | |
| Forward Currency Contracts | | $— | | $(157,272 | ) | | $— | | $(157,272 | ) |
Country disclosure is based on the country of domicile. For further information regarding security characteristics, see the Portfolio of Investments.
Inflation-Adjusted Debt Securities – The fund invests in inflation-adjusted debt securities issued by the U.S. Treasury. The fund may also invest in inflation-adjusted debt securities issued by U.S. Government agencies and instrumentalities other than the U.S. Treasury and by other entities such as U.S. and foreign corporations and foreign governments. The principal value of these debt securities is adjusted through income according to changes in the Consumer Price Index or another general price or wage index. These debt securities typically pay a fixed rate of interest, but this fixed rate is applied to the inflation-adjusted principal amount. The principal paid at maturity of the debt security is typically equal to the inflation-adjusted principal amount, or the security’s original par value, whichever is greater. Other types of inflation-adjusted securities may use other methods to adjust for other measures of inflation.
35
Notes to Financial Statements – continued
Foreign Currency Translation – Purchases and sales of foreign investments, income, and expenses are converted into U.S. dollars based upon currency exchange rates prevailing on the respective dates of such transactions or on the reporting date for foreign denominated receivables and payables. Gains and losses attributable to foreign currency exchange rates on sales of securities are recorded for financial statement purposes as net realized gains and losses on investments. Gains and losses attributable to foreign exchange rate movements on receivables, payables, income and expenses are recorded for financial statement purposes as foreign currency transaction gains and losses. That portion of both realized and unrealized gains and losses on investments that results from fluctuations in foreign currency exchange rates is not separately disclosed.
Derivatives – The fund may use derivatives for different purposes, including to earn income and enhance returns, to increase or decrease exposure to a particular market, to manage or adjust the risk profile of the fund, or as alternatives to direct investments. Derivatives may be used for hedging or non-hedging purposes. While hedging can reduce or eliminate losses, it can also reduce or eliminate gains. When the fund uses derivatives as an investment to increase market exposure, or for hedging purposes, gains and losses from derivative instruments may be substantially greater than the derivative’s original cost.
In this reporting period the fund adopted the disclosure provisions of FASB Accounting Standard Codification 815, Derivatives and Hedging (“ASC 815”). ASC 815 requires enhanced disclosures about the fund’s use of and accounting for derivative instruments and the effect of derivative instruments on the fund’s results of operations and financial position. Tabular disclosure regarding derivative fair value and gain/loss by contract type (e.g., interest rate contracts, foreign exchange contracts, credit contracts, etc.) is required and derivatives accounted for as hedging instruments under ASC 815 must be disclosed separately from those that do not qualify for hedge accounting. Even though the fund may use derivatives in an attempt to achieve an economic hedge, the fund’s derivatives are not accounted for as hedging instruments under ASC 815 because investment companies account for their derivatives at fair value and record any changes in fair value in current period earnings.
Derivative instruments include written options, purchased options, futures contracts, forward foreign currency exchange contracts, and swap agreements. The fund’s period end derivatives, as presented in the Portfolio of Investments and the associated Derivative Contract Tables, generally are indicative of the volume of its derivative activity during the period.
36
Notes to Financial Statements – continued
The following table presents, by major type of derivative contract, the fair value, on a gross basis, of the asset and liability components of derivatives held by the fund at October 31, 2009:
| | | | | | | | | | | |
| | | | | Asset Derivatives | | Liability Derivatives | |
| | | | | Location on Statement of Assets and Liabilities | | Fair Value | | Location on Statement of Assets and Liabilities | | Fair Value | |
| Foreign Exchange Contracts | | Forward
Foreign
Currency
Exchange
Contracts | | Receivable for forward foreign currency exchange contracts | | $248,217 | | Payable for forward foreign currency exchange contracts | | $(405,489 | ) |
| | Currency
Options
Purchased | | Total investments, at value | | 5,179 | | Total investments, at value | | — | |
Total
Derivatives not Accounted for as
Hedging Instruments Under ASC 815 | | | | | | $253,396 | | | | $(405,489 | ) |
The following table presents, by major type of derivative contract, the realized gain (loss) on derivatives held by the fund for the year ended October 31, 2009 as reported in the Statement of Operations:
| | | | | | | | | |
| | | Investment
Transactions
(i.e.,
Purchased
Options) | | | Futures
Contracts | | Foreign
Currency
Transactions | | Total |
| Interest Rate Contracts | | $(23,203 | ) | | $480,722 | | $— | | $457,519 |
| Foreign Exchange Contracts | | (15,443 | ) | | — | | 1,194,166 | | 1,178,723 |
Total | | $(38,646 | ) | | $480,722 | | $1,194,166 | | $1,636,242 |
The following table presents, by major type of derivative contract, the change in unrealized appreciation (depreciation) on derivatives held by the fund for the year ended October 31, 2009 as reported in the Statement of Operations:
| | | | | | | | | | | | |
| | | Investments
(i.e.,
Purchased
Options) | | | Futures
Contracts | | | Translation
of Assets
and
Liabilities in
Foreign
Currencies | | | Total | |
| Interest Rate Contracts | | $— | | | $(149,073 | ) | | $— | | | $(149,073 | ) |
| Foreign Exchange Contracts | | (108,308 | ) | | — | | | (907,181 | ) | | (1,015,489 | ) |
Total | | $(108,308 | ) | | $(149,073 | ) | | $(907,181 | ) | | $(1,164,562 | ) |
37
Notes to Financial Statements – continued
Derivative counterparty credit risk is managed through formal evaluation of the creditworthiness of all potential counterparties. On certain over-the-counter derivatives, the fund attempts to reduce its exposure to counterparty credit risk by entering into an International Swaps and Derivatives Association (ISDA) Master Agreement on a bilateral basis with each of the counterparties with whom it undertakes a significant volume of transactions. The ISDA Master Agreement gives each party to the agreement the right to terminate all transactions traded under such agreement if there is a certain deterioration in the credit quality of the other party. The ISDA Master Agreement gives the fund the right, upon an event of default by the applicable counterparty or a termination of the agreement, to close out all transactions traded under such agreement and to net amounts owed under each transaction to one net amount payable by one party to the other. This right to close out and net payments across all transactions traded under the ISDA Master Agreement could result in a reduction of the fund’s credit risk to such counterparty equal to any amounts payable by the fund under the applicable transactions, if any. However, absent an event of default by the counterparty or a termination of the agreement, the ISDA Master Agreement does not result in an offset of reported balance sheet assets and liabilities across transactions between the fund and the applicable counterparty.
Collateral requirements differ by type of derivative. Collateral or margin requirements are set by the broker or exchange clearing house for exchange traded derivatives (i.e., futures and exchange-traded options) while collateral terms are contract specific for over-the-counter traded derivatives (i.e., forwards, swaps and over-the-counter options). For derivatives traded under an ISDA Master Agreement, the collateral requirements are netted across all transactions traded under such agreement and one amount is posted from one party to the other to collateralize such obligations. Cash collateral that has been pledged to cover obligations of the fund under derivative contracts will be reported separately on the Statement of Assets and Liabilities as restricted cash. Securities collateral pledged for the same purpose is noted in the Portfolio of Investments.
Purchased Options – The fund may purchase call or put options for a premium. Purchased options entitle the holder to buy or sell a specified number of shares or units of a particular security, currency or index at a specified price at a specified date or within a specified period of time. Purchasing call options may be used to hedge against an anticipated increase in the dollar cost of securities or currency to be acquired or to increase the fund’s exposure to an underlying instrument. Purchasing put options may hedge against a decline in the value of portfolio securities or currency.
38
Notes to Financial Statements – continued
The premium paid is initially recorded as an investment in the Statement of Assets and Liabilities. That investment is subsequently marked-to-market daily with the difference between the premium paid and the market value of the purchased option being recorded as unrealized appreciation or depreciation. Premiums paid for purchased options which have expired are treated as realized losses on investments in the Statement of Operations. Upon the exercise or closing of a purchased option, the premium paid is either added to the cost of the security or financial instrument in the case of a call option, or offset against the proceeds on the sale of the underlying security or financial instrument in the case of a put option, in order to determine the realized gain or loss on investments.
The risk in purchasing an option is that the fund pays a premium whether or not the option is exercised. The fund’s maximum risk of loss due to counterparty credit risk is limited to the market value of the option. For over-the-counter options, this risk is mitigated in cases where there is an ISDA Master Agreement between the fund and the counterparty providing for netting as described above and for posting of collateral by the counterparty to the fund to cover the fund’s exposure to the counterparty under such ISDA Master Agreement.
Futures Contracts – The fund may use futures contracts to gain or to hedge against broad market, interest rate or currency exposure. A futures contract represents a commitment for the future purchase or sale of an asset at a specified price on a specified date.
Upon entering into a futures contract, the fund is required to deposit with the broker, either in cash or securities, an initial margin in an amount equal to a certain percentage of the notional amount of the contract. Subsequent payments (variation margin) are made or received by the fund each day, depending on the daily fluctuations in the value of the contract, and are recorded for financial statement purposes as unrealized gain or loss by the fund until the contract is closed or expires at which point the gain or loss on futures is realized.
The fund bears the risk of interest rates, exchange rates or securities prices moving unexpectedly, in which case, the fund may not achieve the anticipated benefits of the futures contracts and may realize a loss. While futures may present less counterparty risk to the fund since the contracts are exchange traded and the exchange’s clearinghouse guarantees payments to the broker, there is still counterparty credit risk due to the insolvency of the broker. The fund’s maximum risk of loss due to counterparty credit risk is equal to the margin posted by the fund to the broker plus any gains or minus any losses on the outstanding futures contracts.
39
Notes to Financial Statements – continued
Forward Foreign Currency Exchange Contracts – The fund may enter into forward foreign currency exchange contracts for the purchase or sale of a specific foreign currency at a fixed price on a future date to hedge the fund’s currency risk or for non-hedging purposes. For hedging purposes, the fund may enter into contracts to deliver or receive foreign currency that the fund will receive from or use in its normal investment activities. The fund may also use contracts to hedge against declines in the value of foreign currency denominated securities due to unfavorable exchange rate movements. For non-hedging purposes, the fund may enter into contracts with the intent of changing the relative exposure of the fund’s portfolio of securities to different currencies to take advantage of anticipated exchange rate changes.
Forward foreign currency exchange contracts are adjusted by the daily exchange rate of the underlying currency and any unrealized gains or losses are recorded as a receivable or payable for forward foreign currency exchange contracts until the contract settlement date. On contract settlement date, any gain or loss on the contract is recorded as realized gains or losses on foreign currency transactions.
Risks may arise upon entering into these contracts from unanticipated movements in the value of the contract and from the potential inability of counterparties to meet the terms of their contracts. The fund’s maximum risk due to counterparty credit risk is the notional amount of the contract. This risk is mitigated in cases where there is an ISDA Master Agreement between the fund and the counterparty providing for netting as described above and for posting of collateral by the counterparty to the fund to cover the fund’s exposure to the counterparty under such ISDA Master Agreement.
Security Loans – JPMorgan Chase and Co. (“Chase”), as lending agent, may loan the securities of the fund to certain qualified institutions (the “Borrowers”) approved by the fund. The loans are collateralized by cash and/or U.S. Treasury and federal agency obligations in an amount typically at least equal to the market value of the securities loaned. The market value of the loaned securities is determined at the close of business of the fund and any additional required collateral is delivered to the fund on the next business day. Chase provides the fund with indemnification against Borrower default. The fund bears the risk of loss with respect to the investment of cash collateral. On loans collateralized by cash, the cash collateral is invested in short-term securities. A portion of the income generated upon investment of the collateral is remitted to the Borrowers, and the remainder is allocated between the fund and the lending agent. On loans collateralized by U.S. Treasury and/or federal agency obligations, a fee is received from the Borrower, and is allocated between the fund and the lending agent. Income from securities lending is included in interest income on the Statement of Operations. The dividend and
40
Notes to Financial Statements – continued
interest income earned on the securities loaned is accounted for in the same manner as other dividend and interest income. At October 31, 2009, there were no securities on loan.
Indemnifications – Under the fund’s organizational documents, its officers and Trustees may be indemnified against certain liabilities and expenses arising out of the performance of their duties to the fund. Additionally, in the normal course of business, the fund enters into agreements with service providers that may contain indemnification clauses. The fund’s maximum exposure under these agreements is unknown as this would involve future claims that may be made against the fund that have not yet occurred.
Investment Transactions and Income – Investment transactions are recorded on the trade date. Interest income is recorded on the accrual basis. All premium and discount is amortized or accreted for financial statement purposes in accordance with U.S. generally accepted accounting principles. Inflation-indexed bonds are fixed-income securities whose principal value is periodically adjusted upward or downward to the rate of inflation. Interest is accrued based on the principal value, which is adjusted for inflation. Any increase or decrease in the principal amount of an inflation-indexed bond is recorded as an increase or decrease in interest income, respectively, even though the adjusted principal is not received until maturity. Dividends received in cash are recorded on the ex-dividend date. Certain dividends from foreign securities will be recorded when the fund is informed of the dividend if such information is obtained subsequent to the ex-dividend date. Dividend and interest payments received in additional securities are recorded on the ex-dividend or ex-interest date in an amount equal to the value of the security on such date.
The fund may receive proceeds from litigation settlements. Any proceeds received from litigation involving portfolio holdings are reflected in the Statement of Operations in realized gain/loss if the security has been disposed of by the fund or in unrealized gain/loss if the security is still held by the fund. Any other proceeds from litigation not related to portfolio holdings are reflected as other income in the Statement of Operations.
Fees Paid Indirectly – The fund’s custody fee may be reduced according to an arrangement that measures the value of cash deposited with the custodian by the fund. This amount, for the year ended October 31, 2009, is shown as a reduction of total expenses on the Statement of Operations.
Tax Matters and Distributions – The fund intends to qualify as a regulated investment company, as defined under Subchapter M of the Internal Revenue Code, and to distribute all of its taxable income, including realized capital gains. As a result, no provision for federal income tax is required. The fund’s federal tax returns for the prior three fiscal years remain subject to
41
Notes to Financial Statements – continued
examination by the Internal Revenue Service. Foreign taxes, if any, have been accrued by the fund in the accompanying financial statements.
Distributions to shareholders are recorded on the ex-dividend date. Income and capital gain distributions are determined in accordance with income tax regulations, which may differ from U.S. generally accepted accounting principles. Certain capital accounts in the financial statements are periodically adjusted for permanent differences in order to reflect their tax character. These adjustments have no impact on net assets or net asset value per share. Temporary differences which arise from recognizing certain items of income, expense, gain or loss in different periods for financial statement and tax purposes will reverse at some time in the future. Distributions in excess of net investment income or net realized gains are temporary overdistributions for financial statement purposes resulting from differences in the recognition or classification of income or distributions for financial statement and tax purposes.
Book/tax differences primarily relate to amortization and accretion of debt securities, wash sale loss deferrals, straddle loss deferrals, foreign currency transactions, and derivative transactions.
The tax character of distributions declared to shareholders for the last two fiscal years is as follows:
| | | | |
| | | 10/31/09 | | 10/31/08 |
| Ordinary income (including any short-term capital gains) | | $20,246,569 | | $29,539,881 |
| Long-term capital gain | | 2,816,748 | | 41,695,695 |
| Total distributions | | $23,063,317 | | $71,235,576 |
The federal tax cost and the tax basis components of distributable earnings were as follows:
| | | |
| As of 10/31/09 | | | |
| Cost of investments | | $679,897,091 | |
| Gross appreciation | | 41,977,779 | |
| Gross depreciation | | (30,402,267 | ) |
| Net unrealized appreciation (depreciation) | | $11,575,512 | |
| |
| Undistributed ordinary income | | 4,182,462 | |
| Capital loss carryforwards | | (29,528,346 | ) |
| Other temporary differences | | (2,024,945 | ) |
As of October 31, 2009 the fund had capital loss carryforwards available to offset future realized gains. Such losses expire as follows:
42
Notes to Financial Statements – continued
Multiple Classes of Shares of Beneficial Interest – The fund offers multiple classes of shares, which differ in their respective distribution and service fees. The fund’s income, realized and unrealized gain (loss), and common expenses are allocated to shareholders based on the daily net assets of each class. Dividends are declared separately for each class. Differences in per share dividend rates are generally due to differences in separate class expenses. Class B shares will convert to Class A shares approximately eight years after purchase. The fund’s distributions declared to shareholders as reported on the Statements of Changes in Net Assets are presented by class as follows:
| | | | | | | | |
| | | From net investment
income | | From net realized gain on
investments |
| | | Year ended
10/31/09 | | Year ended
10/31/08 | | Year ended
10/31/09 | | Year ended
10/31/08 |
| Class A | | $12,338,579 | | $17,575,586 | | $3,312,990 | | $30,160,577 |
| Class B | | 1,385,167 | | 2,647,458 | | 497,581 | | 6,024,949 |
| Class C | | 3,219,302 | | 4,572,849 | | 1,098,013 | | 8,844,105 |
| Class I | | 144,587 | | 159,733 | | 28,470 | | 247,954 |
| Class R (b) | | — | | 21,938 | | — | | 79,848 |
| Class R1 | | 31,505 | | 46,194 | | 9,991 | | 90,896 |
| Former Class R2 (b) | | — | | 2,968 | | — | | 9,207 |
| Class R2 | | 111,515 | | 115,951 | | 28,393 | | 161,893 |
| Class R3 | | 118,389 | | 156,312 | | 30,776 | | 261,637 |
| Class R4 | | 576,284 | | 21,792 | | 131,775 | | 33,729 |
| Total | | $17,925,328 | | $25,320,781 | | $5,137,989 | | $45,914,795 |
| (b) | At the close of business on April 18, 2008, Class R and Class R2 shares converted into Class R3 shares. Following this conversion, Class R3, Class R4, and Class R5 shares were renamed Class R2, Class R3, and Class R4 shares, respectively. |
| (3) | | Transactions with Affiliates |
Investment Adviser – The fund has an investment advisory agreement with MFS to provide overall investment management and related administrative services and facilities to the fund.
The management fee is computed daily and paid monthly at an annual rate of 0.84% of the fund’s average daily net assets. The investment adviser has agreed in writing to reduce its management fee to 0.75% of average daily net assets in excess of $500 million and 0.70% of average daily net assets in excess of $1.0 billion. This written agreement will continue until modified by the fund’s Board of Trustees, but such agreement will continue at least until February 28, 2011. This management fee reduction amounted to $89,531, which is shown as a reduction of total expenses in the Statement of Operations. The management fee incurred for the year ended October 31, 2009 was equivalent to an annual effective rate of 0.82% of the fund’s average daily net assets.
Prior to March 1, 2009, the investment adviser had agreed in writing to pay a portion of the fund’s total annual operating expenses, exclusive of interest,
43
Notes to Financial Statements – continued
taxes, extraordinary expenses, brokerage and transaction costs, and investment-related expenses, such that total annual fund operating expenses did not exceed the following rates annually of the fund’s average daily net assets.
| | | | | | | | | | | | | | |
| Class A | | Class B | | Class C | | Class I | | Class R1 | | Class R2 | | Class R3 | | Class R4 |
| 1.30% | | 1.95% | | 1.95% | | 0.95% | | 1.95% | | 1.45% | | 1.20% | | 0.95% |
Effective March 1, 2009, the investment adviser has agreed in writing to pay a portion of the fund’s total annual operating expenses, exclusive of interest, taxes, extraordinary expenses, brokerage and transaction costs, and investment-related expenses, such that total annual fund operating expenses do not exceed the following rates annually of the fund’s average daily net assets.
| | | | | | | | | | | | | | |
| Class A | | Class B | | Class C | | Class I | | Class R1 | | Class R2 | | Class R3 | | Class R4 |
| 1.25% | | 2.00% | | 2.00% | | 1.00% | | 2.00% | | 1.50% | | 1.25% | | 1.00% |
This written agreement will continue until modified by the fund’s Board of Trustees, but such agreement will continue at least until February 28, 2011. For the year ended October 31, 2009, this reduction amounted to $658,848 and is reflected as a reduction of total expenses in the Statement of Operations.
Distributor – MFS Fund Distributors, Inc. (MFD), a wholly-owned subsidiary of MFS, as distributor, received $157,650 for the year ended October 31, 2009, as its portion of the initial sales charge on sales of Class A shares of the fund.
The Board of Trustees has adopted a distribution plan for certain class shares pursuant to Rule 12b-1 of the Investment Company Act of 1940.
The fund’s distribution plan provides that the fund will pay MFD for services provided by MFD and financial intermediaries in connection with the distribution and servicing of certain share classes. One component of the plan is a distribution fee paid to MFD and another component of the plan is a service fee paid to MFD. MFD may subsequently pay all, or a portion, of the distribution and/or service fees to financial intermediaries.
Distribution Plan Fee Table:
| | | | | | | | | | |
| | | Distribution
Fee Rate (d) | | Service
Fee Rate (d) | | Total
Distribution
Plan (d) | | Annual
Effective
Rate (e) | | Distribution
and Service
Fee |
| Class A | | — | | 0.25% | | 0.25% | | 0.28% | | $1,073,305 |
| Class B | | 0.75% | | 0.25% | | 1.00% | | 1.00% | | 513,610 |
| Class C | | 0.75% | | 0.25% | | 1.00% | | 1.00% | | 1,324,343 |
| Class R1 | | 0.75% | | 0.25% | | 1.00% | | 1.00% | | 16,907 |
| Class R2 | | 0.25% | | 0.25% | | 0.50% | | 0.50% | | 20,850 |
| Class R3 | | — | | 0.25% | | 0.25% | | 0.25% | | 9,317 |
| Total Distribution and Service Fees | | | | | | $2,958,332 |
| (d) | In accordance with the distribution plan for certain classes, the fund pays distribution and/or service fees equal to these annual percentage rates of each class’ average daily net assets. The distribution and service |
44
Notes to Financial Statements – continued
| | fee rates disclosed by class represent the current rates in effect at the end of the reporting period. Any rate changes, if applicable, are detailed below. |
| (e) | The annual effective rates represent actual fees incurred under the distribution plan for the year ended October 31, 2009 based on each class’ average daily net assets. Prior to March 1, 2009, a 0.10% Class A annual distribution fee was paid by the fund. Effective March 1, 2009, the 0.10% Class A annual distribution fee was eliminated. |
Certain Class A shares purchased prior to September 1, 2008 are subject to a contingent deferred sales charge (CDSC) in the event of a shareholder redemption within 12 months of purchase. Certain Class A shares purchased on or subsequent to September 1, 2008 are subject to a CDSC in the event of a shareholder redemption within 24 months of purchase. Class C shares are subject to a CDSC in the event of a shareholder redemption within 12 months of purchase. Class B shares are subject to a CDSC in the event of a shareholder redemption within six years of purchase. All contingent deferred sales charges are paid to MFD and during the year ended October 31, 2009, were as follows:
| | |
| | | Amount |
| Class A | | $13 |
| Class B | | 97,353 |
| Class C | | 46,526 |
Shareholder Servicing Agent – MFS Service Center, Inc. (MFSC), a wholly-owned subsidiary of MFS, receives a fee from the fund for its services as shareholder servicing agent calculated as a percentage of the average daily net assets of the fund as determined periodically under the supervision of the fund’s Board of Trustees. For the year ended October 31, 2009, the fee was $423,977, which equated to 0.0707% annually of the fund’s average daily net assets. MFSC also receives payment from the fund for out-of-pocket expenses, sub-accounting and other shareholder servicing costs which may be paid to affiliated and unaffiliated service providers. For the year ended October 31, 2009, these out-of-pocket expenses, sub-accounting and other shareholder servicing costs amounted to $566,465.
Administrator – MFS provides certain financial, legal, shareholder communications, compliance, and other administrative services to the fund. Under an administrative services agreement, the fund partially reimburses MFS the costs incurred to provide these services. The fund is charged an annual fixed amount of $17,500 plus a fee based on average daily net assets. The administrative services fee incurred for the year ended October 31, 2009 was equivalent to an annual effective rate of 0.0205% of the fund’s average daily net assets.
Trustees’ and Officers’ Compensation – The fund pays compensation to independent Trustees in the form of a retainer, attendance fees, and additional compensation to Board and Committee chairpersons. The fund does not pay compensation directly to Trustees or officers of the fund who are also officers
45
Notes to Financial Statements – continued
of the investment adviser, all of whom receive remuneration for their services to the fund from MFS. Certain officers and Trustees of the fund are officers or directors of MFS, MFD, and MFSC.
Prior to December 31, 2001, the fund had an unfunded defined benefit plan (“DB plan”) for independent Trustees. As of December 31, 2001, the Board took action to terminate the DB plan with respect to then-current and any future independent Trustees, such that the DB Plan covers only certain of those former independent Trustees who retired on or before December 31, 2001. Effective January 1, 2002, accrued benefits under the DB Plan for then-current independent Trustees who continued were credited to an unfunded retirement deferral plan (the “Retirement Deferral plan”), which was established for and exists solely with respect to these credited amounts, and is not available for other deferrals by these or other independent Trustees. Although the Retirement Deferral plan is unfunded, amounts deferred under the plan are periodically adjusted for investment experience as if they had been invested in shares of the fund. The DB Plan resulted in a pension expense of $1,506 and the Retirement Deferral plan resulted in an expense of $2,561. Both amounts are included in independent Trustees’ compensation for the year ended October 31, 2009. The liability for deferred retirement benefits payable to certain independent Trustees under both Plans amounted to $57,351 at October 31, 2009, and is included in payable for independent Trustees’ compensation on the Statement of Assets and Liabilities.
Other – This fund and certain other funds managed by MFS (the funds) have entered into services agreements (the Agreements) which provide for payment of fees by the funds to Tarantino LLC and Griffin Compliance LLC in return for the provision of services of an Independent Chief Compliance Officer (ICCO) and Assistant ICCO, respectively, for the funds. The ICCO and Assistant ICCO are officers of the funds and the sole members of Tarantino LLC and Griffin Compliance LLC, respectively. The funds can terminate the Agreements with Tarantino LLC and Griffin Compliance LLC at any time under the terms of the Agreements. For the year ended October 31, 2009, the aggregate fees paid by the fund to Tarantino LLC and Griffin Compliance LLC were $7,286 and are included in miscellaneous expense on the Statement of Operations. MFS has agreed to reimburse the fund for a portion of the payments made by the fund in the amount of $3,839, which is shown as a reduction of total expenses in the Statement of Operations. Additionally, MFS has agreed to bear all expenses associated with office space, other administrative support, and supplies provided to the ICCO and Assistant ICCO.
The fund may invest in a money market fund managed by MFS which seeks a high level of current income consistent with preservation of capital and liquidity. Income earned on this investment is included in dividends from
46
Notes to Financial Statements – continued
underlying funds on the Statement of Operations. This money market fund does not pay a management fee to MFS.
Purchases and sales of investments, other than purchased option transactions, and short-term obligations, were as follows:
| | | | |
| | | Purchases | | Sales |
| U.S. Government securities | | $48,030,661 | | $41,789,891 |
| Investments (non-U.S. Government securities) | | $432,047,257 | | $374,964,254 |
| (5) | | Shares of Beneficial Interest |
The fund’s Declaration of Trust permits the Trustees to issue an unlimited number of full and fractional shares of beneficial interest. Transactions in fund shares were as follows:
| | | | | | | | |
| | | Year ended
10/31/09 | | Year ended
10/31/08 |
| | | Shares | | Amount | | Shares | | Amount |
| Shares sold | | | | | | | | |
Class A | | 11,682,288 | | $130,138,397 | | 11,176,995 | | $153,049,097 |
Class B | | 1,089,264 | | 12,719,454 | | 1,364,519 | | 19,159,016 |
Class C | | 4,456,234 | | 50,128,364 | | 4,727,130 | | 65,466,697 |
Class I | | 1,120,063 | | 13,323,923 | | 110,815 | | 1,497,348 |
Class R (b) | | — | | — | | 27,480 | | 400,930 |
Class R1 | | 171,874 | | 1,871,239 | | 80,239 | | 1,135,488 |
Former Class R2 (b) | | — | | — | | 843 | | 11,865 |
Class R2 | | 238,872 | | 2,493,088 | | 213,390 | | 2,914,128 |
Class R3 | | 90,904 | | 1,027,889 | | 140,476 | | 1,946,615 |
Class R4 | | 665,782 | | 6,952,110 | | 1,294,569 | | 14,568,837 |
| | 19,515,281 | | $218,654,464 | | 19,136,456 | | $260,150,021 |
| Shares issued to shareholders in reinvestment of distributions | | | | | | | | |
Class A | | 1,251,939 | | $13,653,006 | | 2,990,121 | | $42,048,073 |
Class B | | 140,888 | | 1,557,128 | | 498,123 | | 7,177,502 |
Class C | | 286,981 | | 3,141,823 | | 660,380 | | 9,400,331 |
Class I | | 13,243 | | 143,389 | | 29,261 | | 407,687 |
Class R (b) | | — | | — | | 4,281 | | 60,852 |
Class R1 | | 3,789 | | 41,481 | | 9,658 | | 137,090 |
Former Class R2 (b) | | — | | — | | 845 | | 12,175 |
Class R2 | | 10,675 | | 115,729 | | 19,292 | | 268,864 |
Class R3 | | 13,703 | | 149,165 | | 29,829 | | 417,949 |
Class R4 | | 64,699 | | 708,059 | | 3,957 | | 55,521 |
| | 1,785,917 | | $19,509,780 | | 4,245,747 | | $59,986,044 |
47
Notes to Financial Statements – continued
| | | | | | | | | | | | |
| | | Year ended
10/31/09 | | | Year ended
10/31/08 | |
| | | Shares | | | Amount | | | Shares | | | Amount | |
| Shares reacquired | | | | | | | | | | | | |
Class A | | (10,910,647 | ) | | $(119,973,085 | ) | | (10,165,821 | ) | | $(136,030,985 | ) |
Class B | | (2,239,522 | ) | | (24,975,751 | ) | | (2,700,350 | ) | | (37,416,930 | ) |
Class C | | (3,365,091 | ) | | (37,519,549 | ) | | (2,860,066 | ) | | (38,245,481 | ) |
Class I | | (141,718 | ) | | (1,642,056 | ) | | (102,585 | ) | | (1,350,323 | ) |
Class R (b) | | — | | | — | | | (105,799 | ) | | (1,507,780 | ) |
Class R1 | | (82,701 | ) | | (913,644 | ) | | (53,509 | ) | | (718,916 | ) |
Former Class R2 (b) | | — | | | — | | | (10,455 | ) | | (149,814 | ) |
Class R2 | | (96,240 | ) | | (1,038,462 | ) | | (94,126 | ) | | (1,230,919 | ) |
Class R3 | | (42,033 | ) | | (464,719 | ) | | (117,161 | ) | | (1,611,928 | ) |
Class R4 | | (259,850 | ) | | (2,865,948 | ) | | (7,727 | ) | | (102,268 | ) |
| | (17,137,802 | ) | | $(189,393,214 | ) | | (16,217,599 | ) | | $(218,365,344 | ) |
| Net change | | | | | | | | | | | | |
Class A | | 2,023,580 | | | $23,818,318 | | | 4,001,295 | | | $59,066,185 | |
Class B | | (1,009,370 | ) | | (10,699,169 | ) | | (837,708 | ) | | (11,080,412 | ) |
Class C | | 1,378,124 | | | 15,750,638 | | | 2,527,444 | | | 36,621,547 | |
Class I | | 991,588 | | | 11,825,256 | | | 37,491 | | | 554,712 | |
Class R (b) | | — | | | — | | | (74,038 | ) | | (1,045,998 | ) |
Class R1 | | 92,962 | | | 999,076 | | | 36,388 | | | 553,662 | |
Former Class R2 (b) | | — | | | — | | | (8,767 | ) | | (125,774 | ) |
Class R2 | | 153,307 | | | 1,570,355 | | | 138,556 | | | 1,952,073 | |
Class R3 | | 62,574 | | | 712,335 | | | 53,144 | | | 752,636 | |
Class R4 | | 470,631 | | | 4,794,221 | | | 1,290,799 | | | 14,522,090 | |
| | 4,163,396 | | | $48,771,030 | | | 7,164,604 | | | $101,770,721 | |
| (b) | At the close of business on April 18, 2008, Class R and Class R2 shares converted into Class R3 shares. Following this conversion, Class R3, Class R4, and Class R5 shares were renamed Class R2, Class R3, and Class R4 shares, respectively. |
The fund and certain other funds managed by MFS participate in a $1.1 billion unsecured committed line of credit, subject to a $1 billion sublimit, provided by a syndication of banks under a credit agreement. Borrowings may be made for temporary financing needs. Interest is charged to each fund, based on its borrowings, generally at a rate equal to the higher of the Federal Reserve funds rate or one month LIBOR plus an agreed upon spread. A commitment fee, based on the average daily, unused portion of the committed line of credit, is allocated among the participating funds at the end of each calendar quarter. In addition, the fund and other funds managed by MFS have established unsecured uncommitted borrowing arrangements with certain banks for temporary financing needs. Interest is charged to each fund, based on its borrowings, at a rate equal to the Federal Reserve funds rate plus an agreed upon spread. For the year ended October 31, 2009, the fund’s commitment fee
48
Notes to Financial Statements – continued
and interest expense were $8,704 and $13, respectively, and are included in miscellaneous expense on the Statement of Operations.
| (7) | | Transactions in Underlying Funds-Affiliated Issuers |
An affiliated issuer may be considered one in which the fund owns 5% or more of the outstanding voting securities, or a company which is under common control. For the purposes of this report, the fund assumes the following to be affiliated issuers:
| | | | | | | | | |
| Underlying Funds | | Beginning
Shares/Par
Amount | | Acquisitions
Shares/Par
Amount | | Dispositions
Shares/Par
Amount | | | Ending
Shares/Par
Amount |
MFS Institutional Money
Market Portfolio | | 40,216,892 | | 195,483,413 | | (205,419,030 | ) | | 30,281,275 |
| | | | |
| Underlying Funds | | Realized
Gain (Loss) | | Capital Gain
Distributions | | Dividend
Income | | | Ending
Value |
MFS Institutional Money
Market Portfolio | | $— | | $— | | $135,744 | | | $30,281,275 |
49
REPORT OF INDEPENDENT REGISTERED PUBLIC ACCOUNTING FIRM
To the Trustees of MFS Series Trust VI and Shareholders of MFS Global Total Return Fund:
We have audited the accompanying statement of assets and liabilities of MFS Global Total Return Fund (the Fund), (one of the portfolios comprising MFS Series Trust VI), including the portfolio of investments, as of October 31, 2009, and the related statement of operations for the year then ended, the statements of changes in net assets for each of the two years in the period then ended, and the financial highlights for each of the periods indicated therein. These financial statements and financial highlights are the responsibility of the Fund’s management. Our responsibility is to express an opinion on these financial statements and financial highlights based on our audits.
We conducted our audits in accordance with the standards of the Public Company Accounting Oversight Board (United States). Those standards require that we plan and perform the audit to obtain reasonable assurance about whether the financial statements and financial highlights are free of material misstatement. We were not engaged to perform an audit of the Fund’s internal control over financial reporting. Our audits included consideration of internal control over financial reporting as a basis for designing audit procedures that are appropriate in the circumstances, but not for the purpose of expressing an opinion on the effectiveness of the Fund’s internal control over financial reporting. Accordingly, we express no such opinion. An audit also includes examining, on a test basis, evidence supporting the amounts and disclosures in the financial statements and financial highlights, assessing the accounting principles used and significant estimates made by management, and evaluating the overall financial statement presentation. Our procedures included confirmation of securities owned as of October 31, 2009, by correspondence with the Fund’s custodian and brokers or by other appropriate auditing procedures where replies from brokers were not received. We believe that our audits provide a reasonable basis for our opinion.
In our opinion, the financial statements and financial highlights referred to above present fairly, in all material respects, the financial position of MFS Global Total Return Fund at October 31, 2009, the results of its operations for the year then ended, the changes in its net assets for each of the two years in the period then ended, and its financial highlights for each of the periods indicated therein, in conformity with U.S. generally accepted accounting principles.

Boston, Massachusetts
December 17, 2009
50
TRUSTEES AND OFFICERS — IDENTIFICATION AND BACKGROUND
The Trustees and officers of the Trust, as of December 1, 2009, are listed below, together with their principal occupations during the past five years. (Their titles may have varied during that period.) The address of each Trustee and officer is 500 Boylston Street, Boston, Massachusetts 02116.
| | | | | | |
Name, Date of Birth | | Position(s) Held
with Fund | | Trustee/Officer
Since (h) | | Principal Occupations During
the Past Five Years & Other
Directorships (j) |
| INTERESTED TRUSTEES | | | | |
Robert J. Manning (k)
(born 10/20/63) | | Trustee | | February 2004 | | Massachusetts Financial Services Company, Chief Executive Officer, President, Chief Investment Officer and Director |
Robert C. Pozen (k)
(born 8/08/46) | | Trustee | | February 2004 | | Massachusetts Financial Services Company, Chairman (since February 2004); Medtronic, Inc, (medical devices), Director (since 2004); Harvard Business School (education), Senior Lecturer (since 2008); Bell Canada Enterprises (telecommunications), Director (until February 2009); The Bank of New York, Director (finance), (March 2004 to May 2005); Telesat (satellite communications), Director (until November 2007) |
| INDEPENDENT TRUSTEES | | | | |
David H. Gunning
(born 5/30/42) | | Trustee and Chair of Trustees | | January 2004 | | Retired; Cleveland-Cliffs Inc. (mining products and service provider), Vice Chairman/Director (until May 2007); Lincoln Electric Holdings, Inc. (welding equipment manufacturer), Director; Development Alternatives, Inc. (consulting), Director/Non Executive Chairman; Southwest Gas Corp. (natural gas distribution), Director (until May 2004); Portman Limited (mining), Director (until 2008) |
51
Trustees and Officers – continued
| | | | | | |
Name, Date of Birth | | Position(s) Held
with Fund | | Trustee/Officer
Since (h) | | Principal Occupations During
the Past Five Years & Other
Directorships (j) |
Robert E. Butler (n) (born 11/29/41) | | Trustee | | January 2006 | | Consultant – investment company industry regulatory and compliance matters (since July 2002); PricewaterhouseCoopers LLP (professional services firm), Partner (until 2002) |
Lawrence H. Cohn, M.D.
(born 3/11/37) | | Trustee | | June 1989 | | Brigham and Women’s Hospital, Senior Cardiac Surgeon (since 2005); Harvard Medical School, Professor of Cardiac Surgery; Partners HealthCare, Physician Director of Medical Device Technology (since 2006); Brigham and Women’s Hospital, Chief of Cardiac Surgery (until 2005) |
Maureen R. Goldfarb
(born 4/6/55) | | Trustee | | January 2009 | | Private investor; John Hancock Financial Services, Inc., Executive Vice President (until 2004); John Hancock Mutual Funds, Trustee and Chief Executive Officer (until 2004) |
William R. Gutow
(born 9/27/41) | | Trustee | | December 1993 | | Private investor and real estate consultant; Capital Entertainment Management Company (video franchise), Vice Chairman; Atlantic Coast Tan (tanning salons), Vice Chairman (until 2007); Texas Donuts (donut franchise), Vice Chairman (until 2009) |
Michael Hegarty
(born 12/21/44) | | Trustee | | December 2004 | | Private investor; AXA Financial (financial services and insurance), Vice Chairman and Chief Operating Officer (until 2001); The Equitable Life Assurance Society (insurance), President and Chief Operating Officer (until 2001) |
J. Atwood Ives
(born 5/01/36) | | Trustee | | February 1992 | | Private investor; KeySpan Corporation (energy related services), Director (until 2004) |
52
Trustees and Officers – continued
| | | | | | |
Name, Date of Birth | | Position(s) Held
with Fund | | Trustee/Officer
Since (h) | | Principal Occupations During
the Past Five Years & Other
Directorships (j) |
John P. Kavanaugh
(born 11/4/54) | | Trustee | | January 2009 | | Private investor; The Hanover Insurance Group, Inc., Vice President and Chief Investment Officer (until 2006); Allmerica Investment Trust, Allmerica Securities Trust and Opus Investment Trust (investment companies), Chairman, President and Trustee (until 2006) |
J. Dale Sherratt
(born 9/23/38) | | Trustee | | June 1989 | | Insight Resources, Inc. (acquisition planning specialists), President; Wellfleet Investments (investor in health care companies), Managing General Partner |
Laurie J. Thomsen
(born 8/05/57) | | Trustee | | March 2005 | | New Profit, Inc. (venture philanthropy), Executive Partner (since 2006); Private investor; The Travelers Companies (commercial property liability insurance), Director; Prism Venture Partners (venture capital), Co-founder and General Partner (until June 2004) |
Robert W. Uek
(born 5/18/41) | | Trustee | | January 2006 | | Consultant to investment company industry; PricewaterhouseCoopers LLP (professional services firm), Partner (until 1999); TT International Funds (mutual fund complex), Trustee (until 2005); Hillview Investment Trust II Funds (mutual fund complex), Trustee (until 2005) |
| OFFICERS | | | | | | |
Maria F. Dwyer (k)
(born 12/01/58) | | President | | March 2004 | | Massachusetts Financial Services Company, Executive Vice President and Chief Regulatory Officer (since March 2004) Chief Compliance Officer (since December 2006); Fidelity Management & Research Company, Vice President (prior to March 2004); Fidelity Group of Funds, President and Treasurer (until March 2004) |
53
Trustees and Officers – continued
| | | | | | |
Name, Date of Birth | | Position(s) Held
with Fund | | Trustee/Officer
Since (h) | | Principal Occupations During
the Past Five Years & Other
Directorships (j) |
Christopher R. Bohane (k)
(born 1/18/74) | | Assistant Secretary and Assistant Clerk | | July 2005 | | Massachusetts Financial Services Company, Vice President and Senior Counsel |
John M. Corcoran (k)
(born 04/13/65) | | Treasurer | | October 2008 | | Massachusetts Financial Services Company, Senior Vice President (since October 2008); State Street Bank and Trust (financial services provider), Senior Vice President, (until September 2008) |
Ethan D. Corey (k)
(born 11/21/63) | | Assistant Secretary and Assistant Clerk | | July 2005 | | Massachusetts Financial Services Company, Senior Vice President and Associate General Counsel (since 2004); Dechert LLP (law firm), Counsel (prior to December 2004) |
David L. DiLorenzo (k)
(born 8/10/68) | | Assistant Treasurer | | July 2005 | | Massachusetts Financial Services Company, Vice President (since June 2005); JP Morgan Investor Services, Vice President (until June 2005) |
Timothy M. Fagan (k)
(born 7/10/68) | | Assistant Secretary and Assistant Clerk | | September 2005 | | Massachusetts Financial Services Company, Vice President and Senior Counsel (since September 2005); John Hancock Advisers, LLC, Vice President, Senior Attorney and Chief Compliance Officer (until August 2005) |
Mark D. Fischer (k)
(born 10/27/70) | | Assistant Treasurer | | July 2005 | | Massachusetts Financial Services Company, Vice President (since May 2005); JP Morgan Investment Management Company, Vice President (until May 2005) |
54
Trustees and Officers – continued
| | | | | | |
Name, Date of Birth | | Position(s) Held
with Fund | | Trustee/Officer
Since (h) | | Principal Occupations During
the Past Five Years & Other
Directorships (j) |
Robyn L. Griffin
(born 7/04/75) | | Assistant Independent Chief Compliance Officer | | August 2008 | | Griffin Compliance LLC (provider of compliance services), Principal (since August 2008); State Street Corporation (financial services provider), Mutual Fund Administration Assistant Vice President (October 2006 – July 2008); Liberty Mutual Group (insurance), Personal Market Assistant Controller (April 2006 – October 2006); Deloitte & Touche LLP (professional services firm), Senior Manager (prior to April 2006) |
Brian E. Langenfeld (k)
(born 3/07/73) | | Assistant Secretary and Assistant Clerk | | June 2006 | | Massachusetts Financial Services Company, Vice President and Senior Counsel (since May 2006); John Hancock Advisers, LLC, Assistant Vice President and Counsel (until April 2006) |
Ellen Moynihan (k)
(born 11/13/57) | | Assistant Treasurer | | April 1997 | | Massachusetts Financial Services Company, Senior Vice President |
Susan S. Newton (k)
(born 3/07/50) | | Assistant Secretary and Assistant Clerk | | May 2005 | | Massachusetts Financial Services Company, Senior Vice President and Associate General Counsel (since April 2005); John Hancock Advisers, LLC, Senior Vice President, Secretary and Chief Legal Officer (until April 2005) |
Susan A. Pereira (k)
(born 11/05/70) | | Assistant Secretary and Assistant Clerk | | July 2005 | | Massachusetts Financial Services Company, Vice President and Senior Counsel (since June 2004); Bingham McCutchen LLP (law firm), Associate (until June 2004) |
Mark N. Polebaum (k)
(born 5/01/52) | | Secretary and Clerk | | January 2006 | | Massachusetts Financial Services Company, Executive Vice President, General Counsel and Secretary (since January 2006); Wilmer Cutler Pickering Hale and Dorr LLP (law firm), Partner (until January 2006) |
55
Trustees and Officers – continued
| | | | | | |
Name, Date of Birth | | Position(s) Held
with Fund | | Trustee/Officer
Since (h) | | Principal Occupations During
the Past Five Years & Other
Directorships (j) |
Frank L. Tarantino
(born 3/07/44) | | Independent Chief Compliance Officer | | June 2004 | | Tarantino LLC (provider of compliance services), Principal (since June 2004); CRA Business Strategies Group (consulting services), Executive Vice President (until June 2004) |
Richard S. Weitzel (k)
(born 7/16/70) | | Assistant Secretary and Assistant Clerk | | October 2007 | | Massachusetts Financial Services Company, Vice President and Assistant General Counsel (since 2004); Massachusetts Department of Business and Technology, General Counsel (until April 2004) |
James O. Yost (k)
(born 6/12/60) | | Assistant Treasurer | | September 1990 | | Massachusetts Financial Services Company, Senior Vice President |
| (h) | Date first appointed to serve as Trustee/officer of an MFS fund. Each Trustee has served continuously since appointment unless indicated otherwise. For the period from December 15, 2004 until February 22, 2005, Messrs. Pozen and Manning served as Advisory Trustees. For the period March 2008 until October 2008, Ms. Dwyer served as Treasurer of the Funds. |
| (j) | Directorships or trusteeships of companies required to report to the Securities and Exchange Commission (i.e., “public companies”). |
| (k) | “Interested person” of the Trust within the meaning of the Investment Company Act of 1940 (referred to as the 1940 Act), which is the principal federal law governing investment companies like the fund, as a result of position with MFS. The address of MFS is 500 Boylston Street, Boston, Massachusetts 02116. |
| (n) | In 2004 and 2005, Mr. Butler provided consulting services to the independent compliance consultant retained by MFS pursuant to its settlement with the SEC concerning market timing and related matters. The terms of that settlement required that compensation and expenses related to the independent compliance consultant be borne exclusively by MFS and, therefore, MFS paid Mr. Butler for the services he rendered to the independent compliance consultant. In 2004 and 2005, MFS paid Mr. Butler a total of $351,119.29. |
Each Trustee (except Messrs. Butler, Kavanaugh and Uek and Ms. Goldfarb) has been elected by shareholders and each Trustee and officer holds office until his or her successor is chosen and qualified or until his or her earlier death, resignation, retirement or removal. The Trust held a shareholders’ meeting in 2005 to elect Trustees, and will hold a shareholders’ meeting at least once every five years thereafter, to elect Trustees. Messrs. Butler, Kavanaugh, Sherratt, Uek and Ms. Thomsen are members of the Trust’s Audit Committee.
Each of the Fund’s Trustees and officers holds comparable positions with certain other funds of which MFS or a subsidiary is the investment adviser or distributor, and, in the case of the officers, with certain affiliates of MFS. As of January 1, 2009, the Trustees served as board members of 104 funds within the MFS Family of Funds.
56
Trustees and Officers – continued
The Statement of Additional Information for the Fund and further information about the Trustees are available without charge upon request by calling 1-800-225-2606.
| | |
| Investment Adviser | | Custodian |
Massachusetts Financial Services Company
500 Boylston Street, Boston, MA 02116-3741 | | JPMorgan Chase Bank
One Chase Manhattan Plaza, New York, NY 10081 |
| Distributor | | Independent Registered Public Accounting Firm |
MFS Fund Distributors, Inc.
500 Boylston Street, Boston, MA 02116-3741 | | Ernst & Young LLP
200 Clarendon Street, Boston, MA 02116 |
| Portfolio Managers | | |
| Nevin Chitkara | | |
| Steven Gorham | | |
Matthew Ryan | | |
| Benjamin Stone | | |
| Erik Weisman | | |
| Barnaby Wiener | | |
57
BOARD REVIEW OF INVESTMENT ADVISORY AGREEMENT
The Investment Company Act of 1940 requires that both the full Board of Trustees and a majority of the non-interested (“independent”) Trustees, voting separately, annually approve the continuation of the Fund’s investment advisory agreement with MFS. The Trustees consider matters bearing on the Fund and its advisory arrangements at their meetings throughout the year, including a review of performance data at each regular meeting. In addition, the independent Trustees met several times over the course of three months beginning in May and ending in July, 2009 (“contract review meetings”) for the specific purpose of considering whether to approve the continuation of the investment advisory agreement for the Fund and the other investment companies that the Board oversees (the “MFS Funds”). The independent Trustees were assisted in their evaluation of the Fund’s investment advisory agreement by independent legal counsel, from whom they received separate legal advice and with whom they met separately from MFS during various contract review meetings. The independent Trustees were also assisted in this process by the MFS Funds’ Independent Chief Compliance Officer, a full-time senior officer appointed by and reporting to the independent Trustees.
In connection with their deliberations regarding the continuation of the investment advisory agreement, the Trustees, including the independent Trustees, considered such information and factors as they believed, in light of the legal advice furnished to them and their own business judgment, to be relevant. The investment advisory agreement for the Fund was considered separately, although the Trustees also took into account the common interests of all MFS Funds in their review. As described below, the Trustees considered the nature, quality, and extent of the various investment advisory, administrative, and shareholder services performed by MFS under the existing investment advisory agreement and other arrangements with the Fund.
In connection with their contract review meetings, the Trustees received and relied upon materials that included, among other items: (i) information provided by Lipper Inc., an independent third party, on the investment performance of the Fund for various time periods ended December 31, 2008 and the investment performance of a group of funds with substantially similar investment classifications/objectives (the “Lipper performance universe”), (ii) information provided by Lipper Inc. on the Fund’s advisory fees and other expenses and the advisory fees and other expenses of comparable funds identified by Lipper Inc. (the “Lipper expense group”), (iii) information provided by MFS on the advisory fees of comparable portfolios of other clients of MFS, including institutional separate accounts and other clients, (iv) information as to whether and to what extent applicable expense waivers,
58
Board Review of Investment Advisory Agreement – continued
reimbursements or fee “breakpoints” are observed for the Fund, (v) information regarding MFS’ financial results and financial condition, including MFS’ and certain of its affiliates’ estimated profitability from services performed for the Fund and the MFS Funds as a whole, (vi) MFS’ views regarding the outlook for the mutual fund industry and the strategic business plans of MFS, (vii) descriptions of various functions performed by MFS for the Funds, such as compliance monitoring and portfolio trading practices, and (viii) information regarding the overall organization of MFS, including information about MFS’ senior management and other personnel providing investment advisory, administrative and other services to the Fund and the other MFS Funds. The comparative performance, fee and expense information prepared and provided by Lipper Inc. was not independently verified and the independent Trustees did not independently verify any information provided to them by MFS.
The Trustees’ conclusion as to the continuation of the investment advisory agreement was based on a comprehensive consideration of all information provided to the Trustees and not the result of any single factor. Some of the factors that figured particularly in the Trustees’ deliberations are described below, although individual Trustees may have evaluated the information presented differently from one another, giving different weights to various factors. It is also important to recognize that the fee arrangements for the Fund and other MFS Funds are the result of years of review and discussion between the independent Trustees and MFS, that certain aspects of such arrangements may receive greater scrutiny in some years than in others, and that the Trustees’ conclusions may be based, in part, on their consideration of these same arrangements during the course of the year and in prior years.
Based on information provided by Lipper Inc., the Trustees reviewed the Fund’s total return investment performance as well as the performance of peer groups of funds over various time periods. The Trustees placed particular emphasis on the total return performance of the Fund’s Class A shares in comparison to the performance of funds in its Lipper performance universe over the three-year period ended December 31, 2008, which the Trustees believed was a long enough period to reflect differing market conditions. The total return performance of the Fund’s Class A shares was in the 1st quintile relative to the other funds in the universe for this three-year period (the 1st quintile being the best performers and the 5th quintile being the worst performers). The total return performance of the Fund’s Class A shares was in the 1st quintile for each of the one and five-year periods ended December 31, 2008 relative to the Lipper performance universe. Because of the passage of time, these performance results are likely to differ from the performance results for more recent periods, including those shown elsewhere in this report.
59
Board Review of Investment Advisory Agreement – continued
In the course of their deliberations, the Trustees took into account information provided by MFS in connection with the contract review meetings, as well as during investment review meetings conducted with portfolio management personnel during the course of the year regarding the Fund’s performance. After reviewing these and related factors, the Trustees concluded, within the context of their overall conclusions regarding the investment advisory agreement, that they were satisfied with MFS’ responses and efforts relating to investment performance.
In assessing the reasonableness of the Fund’s advisory fee, the Trustees considered, among other information, the Fund’s advisory fee and the total expense ratio of the Fund’s Class A shares as a percentage of average daily net assets and the advisory fee and total expense ratios of peer groups of funds based on information provided by Lipper Inc. The Trustees considered that MFS currently observes an expense limitation for the Fund. The Trustees also considered that, according to the Lipper data (which takes into account any fee reductions or expense limitations that were in effect during the Fund’s last fiscal year), the Fund’s effective advisory fee rate and total expense ratio were each higher than the Lipper expense group median.
The Trustees also considered the advisory fees charged by MFS to institutional accounts. In comparing these fees, the Trustees considered information provided by MFS as to the generally broader scope of services provided by MFS to the Fund in comparison to institutional accounts, the higher demands placed on MFS’ investment personnel and trading infrastructure as a result of the daily cash in-flows and out-flows of the Fund, and the impact on MFS and expenses associated with the more extensive regulatory regime to which the Fund is subject in comparison to institutional accounts.
The Trustees also considered whether the Fund is likely to benefit from any economies of scale in the management of the Fund in the event of growth in assets of the Fund. They noted that MFS has agreed in writing to reduce its advisory fee on average daily net assets over $500 million and $1 billion, which may not be changed without the Trustees’ approval. The Trustees concluded that the existing breakpoints were sufficient to allow the Fund to benefit from economies of scale as its assets grow.
The Trustees also considered information prepared by MFS relating to MFS’ costs and profits with respect to the Fund, the MFS Funds considered as a group, and other investment companies and accounts advised by MFS, as well as MFS’ methodologies used to determine and allocate its costs to the MFS Funds, the Fund and other accounts and products for purposes of estimating profitability.
After reviewing these and other factors described herein, the Trustees concluded, within the context of their overall conclusions regarding the
60
Board Review of Investment Advisory Agreement – continued
investment advisory agreement, that the advisory fees charged to the Fund represent reasonable compensation in light of the services being provided by MFS to the Fund.
In addition, the Trustees considered MFS’ resources and related efforts to continue to retain, attract and motivate capable personnel to serve the Fund. The Trustees also considered current and developing conditions in the financial services industry, including the entry into the industry of large and well-capitalized companies which are spending, and appear to be prepared to continue to spend, substantial sums to engage personnel and to provide services to competing investment companies. In this regard, the Trustees also considered the financial resources of MFS and its ultimate parent, Sun Life Financial Inc. The Trustees also considered the advantages and possible disadvantages to the Fund of having an adviser that also serves other investment companies as well as other accounts.
The Trustees also considered the nature, quality, cost, and extent of administrative, transfer agency, and distribution services provided to the Fund by MFS and its affiliates under agreements and plans other than the investment advisory agreement, including any 12b-1 fees the Fund pays to MFS Fund Distributors, Inc., an affiliate of MFS. The Trustees also considered the nature, extent and quality of certain other services MFS performs or arranges for on the Fund’s behalf, which may include securities lending programs, directed expense payment programs, class action recovery programs, and MFS’ interaction with third-party service providers, principally custodians and sub-custodians. The Trustees concluded that the various non-advisory services provided by MFS and its affiliates on behalf of the Funds were satisfactory.
The Trustees also considered benefits to MFS from the use of the Fund’s portfolio brokerage commissions, if applicable, to pay for investment research and various other factors. Additionally, the Trustees considered so-called “fall-out benefits” to MFS such as reputational value derived from serving as investment manager to the Fund.
Based on their evaluation of factors that they deemed to be material, including those factors described above, the Board of Trustees, including a majority of the independent Trustees, concluded that the Fund’s investment advisory agreement with MFS should be continued for an additional one-year period, commencing August 1, 2009.
A discussion regarding the Board’s most recent review and renewal of the fund’s Investment Advisory Agreement with MFS is available by clicking on the fund’s name under “Mutual Funds” in the “Products and Performance” section of the MFS Web site (mfs.com).
61
PROXY VOTING POLICIES AND INFORMATION
A general description of the MFS funds’ proxy voting policies and procedures is available without charge, upon request, by calling
1-800-225-2606, by visiting the Proxy Voting section of mfs.com or by visiting the SEC’s Web site at http://www.sec.gov.
Information regarding how the fund voted proxies relating to portfolio securities during the most recent twelve-month period ended June 30 is available without charge by visiting the Proxy Voting section of mfs.com or by visiting the SEC’s Web site at http://www.sec.gov.
QUARTERLY PORTFOLIO DISCLOSURE
The fund will file a complete schedule of portfolio holdings with the Securities and Exchange Commission (the Commission) for the first and third quarters of each fiscal year on Form N-Q. The fund’s Form N-Q may be reviewed and copied at the:
Public Reference Room
Securities and Exchange Commission
100 F Street, NE, Room 1580
Washington, D.C. 20549
Information on the operation of the Public Reference Room may be obtained by calling the Commission at 1-800-SEC-0330. The fund’s Form N-Q is available on the EDGAR database on the Commission’s Internet Web site at http://www.sec.gov, and copies of this information may be obtained, upon payment of a duplicating fee, by electronic request at the following e-mail address: publicinfo@sec.gov or by writing the Public Reference Section at the above address.
A shareholder can also obtain the quarterly portfolio holdings report at mfs.com.
FURTHER INFORMATION
From time to time, MFS may post important information about the fund or the MFS funds on the MFS web site (mfs.com). This information is available by visiting the “News & Commentary” section of mfs.com or by clicking on the fund’s name under “Mutual Funds” in the “Products and Performance” section of mfs.com.
FEDERAL TAX INFORMATION (unaudited)
The fund will notify shareholders of amounts for use in preparing 2009 income tax forms in January 2010. The following information is provided pursuant to provisions of the Internal Revenue Code.
The fund designates the maximum amount allowable as qualified dividend income eligible for the 15% tax rate.
The fund designates $3,099,000 as capital gain dividends paid during the fiscal year.
For corporate shareholders, 24.72% of the ordinary income dividends paid during the fiscal year qualify for the corporate dividends received deduction.
62
MFS® PRIVACY NOTICE
Privacy is a concern for every investor today. At MFS Investment Management® and the MFS funds, we take this concern very seriously. We want you to understand our policies about the investment products and services that we offer, and how we protect the nonpublic personal information of investors who have a direct relationship with us and our wholly owned subsidiaries.
Throughout our business relationship, you provide us with personal information. We maintain information and records about you, your investments, and the services you use. Examples of the nonpublic personal information we maintain include
| | Ÿ | | data from investment applications and other forms |
| | Ÿ | | share balances and transactional history with us, our affiliates, or others |
| | Ÿ | | facts from a consumer reporting agency |
We do not disclose any nonpublic personal information about our customers or former customers to anyone, except as permitted by law. We may share nonpublic personal information with third parties or certain of our affiliates in connection with servicing your account or processing your transactions. We may share information with companies or financial institutions that perform marketing services on our behalf or with other financial institutions with which we have joint marketing arrangements, subject to any legal requirements.
Authorization to access your nonpublic personal information is limited to appropriate personnel who provide products, services, or information to you. We maintain physical, electronic, and procedural safeguards to help protect the personal information we collect about you.
If you have any questions about the MFS privacy policy, please call 1-800-225-2606 any business day.
Note: If you own MFS products or receive MFS services in the name of a third party such as a bank or broker-dealer, their privacy policy may apply to you instead of ours.
63
CONTACT US
Web site
mfs.com
MFS TALK
1-800-637-8255
24 hours a day
Account service and literature
Shareholders
1-800-225-2606
Investment professionals
1-800-343-2829
Retirement plan services
1-800-637-1255
Mailing address
MFS Service Center, Inc.
P.O. Box 55824
Boston, MA 02205-5824
Overnight mail
MFS Service Center, Inc.
c/o Boston Financial Data Services
30 Dan Road
Canton, MA 02021-2809
Save paper with eDelivery. MFS® will send you prospectuses, reports, and proxies directly via e-mail so you will get information faster with less mailbox clutter. To sign up: 1. go to mfs.com. 2. log in via MFS® Access. 3. select eDelivery. If you own your MFS fund shares through a financial institution or a retirement plan, MFS® TALK, MFS Access, and eDelivery may not be available to you.

MFS® Utilities Fund
SIPC Contact Information:
You may obtain information about the Securities Investor Protection Corporation (“SIPC”), including the SIPC Brochure, by contacting SIPC either by telephone (202-371-8300) or by accessing SIPC’s website address (www.sipc.org).
The report is prepared for the general information of shareholders. It is authorized for distribution to prospective investors only when preceded or accompanied by a current prospectus.
NOT FDIC INSURED Ÿ MAY LOSE VALUE Ÿ
NO BANK GUARANTEE
10/31/09
MMU-ANN

LETTER FROM THE CEO
Dear Shareholders:
There remains some question as to when the global economy will achieve a sustainable recovery. While some economists and market watchers are optimistic that the worst is behind us, a number also agree with U.S. Federal Reserve Board Chairman Ben Bernanke who said in September that “even though from a technical perspective the recession is very likely over at this point, it’s still going to feel like a very weak economy for some time.”
Have we in fact turned the corner? We have seen tremendous rallies in the markets over the past six months. The Fed has cut interest rates aggressively toward zero to support credit markets, global deleveraging has helped diminish inflationary concerns, and stimulus measures have put more money in the hands of the government and individuals to keep the economy moving. Still, unemployment remains high, consumer confidence and spending continue to waiver, and the housing market, while improving, has a long way to go to recover.
Regardless of lingering market uncertainties, MFS® is confident that the fundamental principles of long-term investing will always apply. We encourage investors to speak with their advisors to identify and research long-term investment opportunities thoroughly. Global research continues to be one of the hallmarks of MFS, along with a unique collaboration between our portfolio managers and sector analysts, who regularly discuss potential investments before making both buy and sell decisions.
As we continue to dig out from the worst financial crisis in decades, keep in mind that while the road back to sustainable recovery will be slow, gradual, and even bumpy at times, conditions are significantly better than they were six months ago.
Respectfully,

Robert J. Manning
Chief Executive Officer and Chief Investment Officer
MFS Investment Management®
December 15, 2009
The opinions expressed in this letter are subject to change, may not be relied upon for investment advice, and no forecasts can be guaranteed.
1
PORTFOLIO COMPOSITION
Portfolio structure (i)

| | |
| Top ten holdings (i) | | |
| Questar Corp. | | 3.8% |
| EQT Corp. | | 3.7% |
| AES Corp. | | 3.4% |
| NRG Energy, Inc. | | 3.3% |
| Sempra Energy | | 3.3% |
| CMS Energy Corp. | | 3.0% |
| Cellcom Israel Ltd. | | 2.8% |
| PPL Corp. | | 2.8% |
| E.ON AG | | 2.7% |
| Vodafone Group PLC | | 2.6% |
| | |
| Top five industries (i) | | |
| Utilities — Electric Power | | 46.0% |
| Natural Gas — Distribution | | 14.1% |
| Telephone Services | | 13.4% |
| Telecommunications — Wireless | | 13.2% |
| Natural Gas — Pipeline | | 5.7% |
| |
| Country weightings (i)(w) | | |
| United States | | 72.8% |
| Brazil | | 5.4% |
| United Kingdom | | 4.0% |
| Spain | | 3.7% |
| Germany | | 3.2% |
| Israel | | 3.1% |
| Czech Republic | | 2.3% |
| Canada | | 1.7% |
| Netherlands | | 1.6% |
| Other Countries | | 2.2% |
| (i) | For purposes of this presentation, the bond component includes accrued interest amounts and may be positively or negatively impacted by the equivalent exposure from any derivative holdings, if applicable. |
| (w) | Country weightings are based on the valuation currency of each security. |
Percentages are based on net assets as of 10/31/09.
The portfolio is actively managed and current holdings may be different.
2
MANAGEMENT REVIEW
Summary of Results
For the twelve months ended October 31, 2009, Class A shares of the MFS Utilities Fund (the “fund”) provided a total return of 19.78%, at net asset value. This compares with a return of 9.80% for the fund’s benchmark, the Standard & Poor’s 500 Stock Index, and a return of 2.06% for the fund’s other benchmark, the Standard & Poor’s 500 Utilities Index (the “S&P Utilities Index”).
Market Environment
The global economy and financial markets experienced substantial deterioration and extraordinary volatility over most of the reporting period. Through the first quarter of 2009, the strong headwinds in the U.S. included accelerated deterioration in the housing market, anemic corporate investment, a rapidly declining job market, and a much tighter credit environment. During the very early stages of the period, a series of tumultuous financial events hammered markets. As a result of this turbulent news, global equity markets pushed significantly lower and credit markets witnessed the worst market decline since the beginning of the credit crisis. The synchronized global downturn in economic activity experienced in the fourth quarter of 2008 and the first quarter of 2009 was among the most intense in the post-World War II period. Not only did Europe and Japan fall into very deep recessions, but an increasingly powerful engine of global growth – emerging markets – also contracted almost across the board. The subsequent recovery in global activity has been similarly synchronized, led importantly by emerging Asian economies, but broadening to include most of the global economy to varying degrees. Primary drivers of the recovery include an unwinding of the inventory destocking that took place earlier, as well as massive fiscal and monetary stimulus. As a result, credit conditions and equity indices improved considerably during the second half of the period. Nevertheless, the degree of financial and macroeconomic dislocation remained significant.
During the first half of the reporting period, the Fed implemented its final interest rate cut, while making increasing use of its new lending facilities to alleviate ever-tightening credit markets. On the fiscal front, the U.S. Treasury designed and began implementing a massive fiscal stimulus package. As inflationary concerns diminished in the face of global deleveraging, and equity and credit markets deteriorated more sharply, central banks around the world also cut interest rates dramatically. Globally, policy makers increasingly sought to coordinate their rescue efforts, which resulted in a number of international actions, such as the establishment of swap lines between the Federal Reserve and a number of other central banks, as well as a substantial increase in the financial resources of the International Monetary Fund. By the middle of the
3
Management Review – continued
period, several central banks had approached their lower bound on policy rates and were examining the implementation and ramifications of quantitative easing as a means to further loosen monetary policy to offset the continuing fall in global economic activity. However, by the end of the period, there were broadening signs that the worst of the global macroeconomic deterioration had passed, which caused the subsequent rise in asset valuations. As most asset prices rebounded in the second half of the period and the demand for liquidity waned, the debate concerning monetary exit strategies had begun, creating added uncertainty regarding the forward path of policy rates.
Contributors to Performance
During the reporting period, strong stock selection in the electric power industry contributed to the fund’s performance relative to the S&P Utilities Index. Standout performers in this industry included electricity distributor Eletropaulo Metropolitana (Brazil) (aa), independent power producer AES Corp., electric power generator AES Tiete (Brazil) (aa), and electric utility companies CMS Energy and CEZ (Czech Republic) (aa). Shares of Eletropaulo Metropolitana appreciated as a result of its strong dividend yield, attractive valuation, and solid quality metrics. AES Corp. also performed well as it continued to improve its financial position, rationalize its investments, and generate good free-cash-flow. Elsewhere, the timing of our ownership in shares of power provider FirstEnergy Corp., and not holding poor-performing electric utility and gas company Exelon Corp., also had a positive impact on relative returns.
The fund’s holdings in the telephone services industry, which is not represented in the S&P Utilities Index, was another positive area for relative performance. Within this industry, telecommunications companies, Virgin Media (aa) and Telefonica (Spain) (aa), were among the fund’s top relative contributors. Virgin Media continued to add value for shareholders as the company remained focused on increasing its customer retention rate and customer satisfaction. Additionally, the company reported second quarter revenue growth driven by its consumer business.
Elsewhere, holdings of cable company Time Warner Cable (aa) aided relative returns as the stock significantly outperformed the S&P Utilities Index over the reporting period.
During the reporting period, the fund’s currency exposure was also a contributor to performance relative to the S&P Utilities Index. All of MFS’ investment decisions are driven by the fundamentals of each individual opportunity and as such, it is common for our funds to have different currency exposures than the benchmark.
4
Management Review – continued
Detractors from Performance
Overweighted positions in the natural gas pipeline industry held back results relative to the S&P Utilities Index. Natural gas pipelines operator Williams Cos. (aa) was a top relative detractor within this industry.
Elsewhere, wireless service provider Metro PCS Communications (aa) also hindered returns relative to the S&P Utilities Index. The share price of Metro PCS came under pressure due to increased competition for market share. The company also missed new customer and earnings targets as a result of heightened competition in the prepaid market. The timing of our ownership in shares of power generation company FPL Group and power distribution company PG&E Corp. also negatively impacted relative results.
The fund’s cash position was a detractor from returns relative to the S&P Utilities Index. The fund holds cash to buy new holdings and to provide liquidity. In a period when equity markets rose, as measured by the S&P Utilities Index, holding cash hurt performance versus this benchmark, which has no cash position.
Respectfully,
| | |
| Robert Persons | | Maura Shaughnessy |
| Portfolio Manager | | Portfolio Manager |
| (aa) | Security is not a benchmark constituent. |
The views expressed in this report are those of the portfolio managers only through the end of the period of the report as stated on the cover and do not necessarily reflect the views of MFS or any other person in the MFS organization. These views are subject to change at any time based on market or other conditions, and MFS disclaims any responsibility to update such views. These views may not be relied upon as investment advice or an indication of trading intent on behalf of any MFS portfolio. References to specific securities are not recommendations of such securities, and may not be representative of any MFS portfolio’s current or future investments.
5
PERFORMANCE SUMMARY THROUGH 10/31/09
The following chart illustrates a representative class of the fund's historical performance in comparison to its benchmark(s). Performance results include the deduction of the maximum applicable sales charge and reflect the percentage change in net asset value, including reinvestment of dividends and capital gains distributions. The performance of other share classes will be greater than or less than that of the class depicted below. Benchmarks are unmanaged and may not be invested in directly. Benchmark returns do not reflect sales charges, commissions or expenses. (See Notes to Performance Summary.)
Performance data shown represents past performance and is no guarantee of future results. Investment return and principal value fluctuate so your shares, when sold, may be worth more or less than the original cost; current performance may be lower or higher than quoted. The performance shown does not reflect the deduction of taxes, if any, that a shareholder would pay on fund distributions or the redemption of fund shares.
Growth of a Hypothetical $10,000 Investment
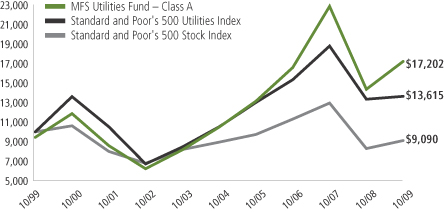
6
Performance Summary – continued
Total Returns through 10/31/09
Average annual without sales charge
| | | | | | | | | | | | | | |
| | | Share class | | Class inception date | | 1-yr | | 5-yr | | 10-yr | | Life (t) | | |
| | | A | | 2/14/92 | | 19.78% | | 10.43% | | 6.20% | | N/A | | |
| | | B | | 9/07/93 | | 18.94% | | 9.62% | | 5.42% | | N/A | | |
| | | C | | 1/03/94 | | 18.86% | | 9.61% | | 5.41% | | N/A | | |
| | | I | | 1/02/97 | | 20.03% | | 10.70% | | 6.46% | | N/A | | |
| | | R1 | | 4/01/05 | | 18.90% | | N/A | | N/A | | 7.93% | | |
| | | R2 | | 10/31/03 | | 19.52% | | 10.04% | | N/A | | 12.81% | | |
| | | R3 | | 4/01/05 | | 19.80% | | N/A | | N/A | | 8.69% | | |
| | | R4 | | 4/01/05 | | 20.06% | | N/A | | N/A | | 9.02% | | |
| Comparative benchmarks | | | | | | | | | | |
| | | Standard & Poor’s 500 Stock Index (f) | | 9.80% | | 0.33% | | (0.95)% | | N/A | | |
| | | Standard & Poor’s 500 Utilities Index (f) | | 2.06% | | 5.34% | | 3.13% | | N/A | | |
| Average annual with sales charge | | | | | | | | | | |
| | | A
With Initial Sales Charge (5.75%) | | 12.89% | | 9.13% | | 5.57% | | N/A | | |
| | | B
With CDSC (Declining over six years from 4% to 0%) (x) | | 14.94% | | 9.34% | | 5.42% | | N/A | | |
| | | C
With CDSC (1% for 12 months) (x) | | 17.86% | | 9.61% | | 5.41% | | N/A | | |
Class I, R1, R2, R3, and R4 shares do not have a sales charge.
CDSC – Contingent Deferred Sales Charge.
| (f) | Source: FactSet Research Systems Inc. |
| (t) | For the period from the class’ inception date through the stated period end (for those share classes with less than 10 years of performance history). No comparative benchmark information is provided for “life” periods. (See Notes to Performance summary). |
| (x) | Assuming redemption at the end of the applicable period. |
Benchmark Definitions
Standard & Poor’s 500 Stock Index – a market capitalization-weighted index of 500 widely held equity securities, designed to measure broad U.S. equity performance.
Standard & Poor’s 500 Utilities Index – a market capitalization-weighted index designed to measure the utilities sector, including those companies considered electric, gas or water utilities, or companies that operate as independent producers and/or distributors of power.
It is not possible to invest directly in an index.
Notes to Performance Summary
Average annual total return represents the average annual change in value for each share class for the periods presented. Life returns are presented where the
7
Performance Summary – continued
share class has less than 10 years of performance history and represent the average annual total return from the class inception date to the stated period end date. As the fund’s share classes may have different inception dates, the life returns may represent different time periods and may not be comparable.
Performance results reflect any applicable expense subsidies and waivers in effect during the periods shown. Without such subsidies and waivers the fund’s performance results would be less favorable. Please see the prospectus and financial statements for complete details.
From time to time the fund may receive proceeds from litigation settlements, without which performance would be lower.
8
EXPENSE TABLE
Fund expenses borne by the shareholders during the period,
May 1, 2009 through October 31, 2009
As a shareholder of the fund, you incur two types of costs: (1) transaction costs, including sales charges (loads) on certain purchase or redemption payments, and (2) ongoing costs, including management fees; distribution and service (12b-1) fees; and other fund expenses. This example is intended to help you understand your ongoing costs (in dollars) of investing in the fund and to compare these costs with the ongoing costs of investing in other mutual funds.
The example is based on an investment of $1,000 invested at the beginning of the period and held for the entire period May 1, 2009 through October 31, 2009.
Actual Expenses
The first line for each share class in the following table provides information about actual account values and actual expenses. You may use the information in this line, together with the amount you invested, to estimate the expenses that you paid over the period. Simply divide your account value by $1,000 (for example, an $8,600 account value divided by $1,000 = 8.6), then multiply the result by the number in the first line under the heading entitled “Expenses Paid During Period” to estimate the expenses you paid on your account during this period.
Hypothetical Example for Comparison Purposes
The second line for each share class in the following table provides information about hypothetical account values and hypothetical expenses based on the fund’s actual expense ratio and an assumed rate of return of 5% per year before expenses, which is not the fund’s actual return. The hypothetical account values and expenses may not be used to estimate the actual ending account balance or expenses you paid for the period. You may use this information to compare the ongoing costs of investing in the fund and other funds. To do so, compare this 5% hypothetical example with the 5% hypothetical examples that appear in the shareholder reports of the other funds.
Please note that the expenses shown in the table are meant to highlight your ongoing costs only and do not reflect any transactional costs, such as sales charges (loads). Therefore, the second line for each share class in the table is useful in comparing ongoing costs only, and will not help you determine the relative total costs of owning different funds. In addition, if these transactional costs were included, your costs would have been higher.
9
Expense Table – continued
| | | | | | | | | | |
Share
Class | | | | Annualized
Expense
Ratio | | Beginning
Account Value
5/01/09 | | Ending
Account Value
10/31/09 | | Expenses
Paid During
Period (p)
5/01/09-10/31/09 |
| A | | Actual | | 1.05% | | $1,000.00 | | $1,234.81 | | $5.91 |
| | Hypothetical (h) | | 1.05% | | $1,000.00 | | $1,019.91 | | $5.35 |
| B | | Actual | | 1.80% | | $1,000.00 | | $1,229.92 | | $10.12 |
| | Hypothetical (h) | | 1.80% | | $1,000.00 | | $1,016.13 | | $9.15 |
| C | | Actual | | 1.80% | | $1,000.00 | | $1,230.01 | | $10.12 |
| | Hypothetical (h) | | 1.80% | | $1,000.00 | | $1,016.13 | | $9.15 |
| I | | Actual | | 0.79% | | $1,000.00 | | $1,235.71 | | $4.45 |
| | Hypothetical (h) | | 0.79% | | $1,000.00 | | $1,021.22 | | $4.02 |
| R1 | | Actual | | 1.80% | | $1,000.00 | | $1,230.45 | | $10.12 |
| | Hypothetical (h) | | 1.80% | | $1,000.00 | | $1,016.13 | | $9.15 |
| R2 | | Actual | | 1.30% | | $1,000.00 | | $1,233.73 | | $7.32 |
| | Hypothetical (h) | | 1.30% | | $1,000.00 | | $1,018.65 | | $6.61 |
| R3 | | Actual | | 1.05% | | $1,000.00 | | $1,233.95 | | $5.91 |
| | Hypothetical (h) | | 1.05% | | $1,000.00 | | $1,019.91 | | $5.35 |
| R4 | | Actual | | 0.80% | | $1,000.00 | | $1,236.13 | | $4.51 |
| | Hypothetical (h) | | 0.80% | | $1,000.00 | | $1,021.17 | | $4.08 |
| (h) | 5% class return per year before expenses. |
| (p) | Expenses paid is equal to each class’ annualized expense ratio, as shown above, multiplied by the average account value over the period, multiplied by the number of days in the period, divided by the number of days in the year. Expenses paid do not include any applicable sales charges (loads). If these transaction costs had been included, your costs would have been higher. |
10
PORTFOLIO OF INVESTMENTS
10/31/09
The Portfolio of Investments is a complete list of all securities owned by your fund. It is categorized by broad-based asset classes.
| | | | | |
| Common Stocks - 92.0% | | | | | |
| Issuer | | Shares/Par | | Value ($) |
| | | | | |
| Cable TV - 3.2% | | | | | |
| Comcast Corp., “Special A” | | 2,103,900 | | $ | 29,496,678 |
| DIRECTV Group, Inc. (a)(l) | | 287,800 | | | 7,569,140 |
| Time Warner Cable, Inc. | | 1,022,469 | | | 40,326,177 |
| | | | | |
| | | | | $ | 77,391,995 |
| Energy - Independent - 0.4% | | | | | |
| Apache Corp. | | 54,000 | | $ | 5,082,480 |
| CONSOL Energy, Inc. | | 78,600 | | | 3,364,866 |
| Whiting Petroleum Corp. (a) | | 21,100 | | | 1,190,040 |
| | | | | |
| | | | | $ | 9,637,386 |
| Natural Gas - Distribution - 14.1% | | | | | |
| EQT Corp. | | 2,162,630 | | $ | 90,527,692 |
| GDF Suez | | 887,242 | | | 37,132,125 |
| NiSource, Inc. | | 1,599,200 | | | 20,661,664 |
| ONEOK, Inc. | | 358,900 | | | 12,995,769 |
| Questar Corp. | | 2,321,966 | | | 92,507,125 |
| Sempra Energy | | 1,563,890 | | | 80,462,141 |
| Spectra Energy Corp. | | 368,520 | | | 7,046,102 |
| | | | | |
| | | | | $ | 341,332,618 |
| Natural Gas - Pipeline - 4.9% | | | | | |
| El Paso Corp. | | 4,470,550 | | $ | 43,856,096 |
| Enagas S.A. | | 922,475 | | | 18,990,857 |
| Williams Cos., Inc. | | 2,969,760 | | | 55,979,976 |
| | | | | |
| | | | | $ | 118,826,929 |
| Oil Services - 0.5% | | | | | |
| Weatherford International Ltd. (a) | | 676,600 | | $ | 11,860,798 |
| | |
| Pollution Control - 0.1% | | | | | |
| Suez Environnement | | 111,400 | | $ | 2,481,259 |
| | |
| Telecommunications - Wireless - 13.2% | | | | | |
| America Movil S.A.B. de C.V., “L”, ADR | | 546,970 | | $ | 24,137,786 |
| Cellcom Israel Ltd. | | 2,294,752 | | | 69,049,088 |
| MetroPCS Communications, Inc. (a) | | 1,942,000 | | | 12,098,660 |
| Mobile TeleSystems OJSC, ADR | | 432,510 | | | 19,592,703 |
11
Portfolio of Investments – continued
| | | | | |
| Issuer | | Shares/Par | | Value ($) |
| | | | | |
| Common Stocks - continued | | | | | |
| Telecommunications - Wireless - continued | | | | | |
| MTN Group Ltd. | | 1,277,290 | | $ | 19,172,796 |
| NII Holdings, Inc. (a) | | 369,440 | | | 9,949,019 |
| Partner Communication Co. Ltd., ADR | | 320,600 | | | 6,043,310 |
| Philippine Long Distance Telephone Co. | | 89,800 | | | 4,844,030 |
| Philippine Long Distance Telephone Co., ADR | | 199,800 | | | 10,649,340 |
| Rogers Communications, Inc., “B” | | 1,402,610 | | | 41,156,016 |
| Vimpel-Communications, ADR | | 553,500 | | | 9,924,255 |
| Vivo Participacoes S.A., ADR | | 1,231,975 | | | 29,875,394 |
| Vodacom Group PLC (a) | | 168,758 | | | 1,172,291 |
| Vodafone Group PLC | | 28,829,540 | | | 63,785,079 |
| | | | | |
| | | | | $ | 321,449,767 |
| Telephone Services - 12.4% | | | | | |
| American Tower Corp., “A” (a) | | 512,500 | | $ | 18,870,250 |
| AT&T, Inc. | | 2,225,180 | | | 57,120,371 |
| CenturyTel, Inc. | | 1,143,941 | | | 37,132,325 |
| China Unicom Ltd., ADR | | 447,900 | | | 5,665,935 |
| Crown Castle International Corp. (a) | | 78,800 | | | 2,381,336 |
| Frontier Communications Corp. | | 1,858,500 | | | 13,325,445 |
| Royal KPN N.V. | | 2,197,270 | | | 39,836,233 |
| Tele Norte Leste Participacoes S.A., ADR | | 329,800 | | | 6,285,988 |
| Telefonica S.A. | | 809,190 | | | 22,586,035 |
| Virgin Media, Inc. | | 4,378,809 | | | 61,171,962 |
| Windstream Corp. | | 3,681,195 | | | 35,486,720 |
| | | | | |
| | | | | $ | 299,862,600 |
| Utilities - Electric Power - 43.2% | | | | | |
| AES Corp. (a) | | 6,383,460 | | $ | 83,431,822 |
| AES Tiete S.A., IPS | | 2,682,218 | | | 30,223,676 |
| Allegheny Energy, Inc. | | 1,694,300 | | | 38,663,926 |
| American Electric Power Co., Inc. | | 1,616,330 | | | 48,845,493 |
| Calpine Corp. (a) | | 114,000 | | | 1,281,360 |
| CenterPoint Energy, Inc. | | 620,410 | | | 7,817,166 |
| CEZ AS | | 1,134,130 | | | 56,494,488 |
| CMS Energy Corp. | | 5,447,290 | | | 72,448,957 |
| Companhia de Saneamento De Minas Gerais | | 205,400 | | | 3,667,024 |
| Companhia Paranaense De Energia, ADR | | 344,700 | | | 6,066,720 |
| Companhia Paranaense De Energia, IPS | | 271,800 | | | 4,729,036 |
| Constellation Energy Group, Inc. | | 1,267,693 | | | 39,197,068 |
| Covanta Holding Corp. (a) | | 261,400 | | | 4,490,852 |
| CPFL Energia S.A. | | 71,200 | | | 1,228,701 |
| Dominion Resources, Inc. | | 613,400 | | | 20,910,806 |
| DPL, Inc. | | 1,629,333 | | | 41,287,298 |
12
Portfolio of Investments – continued
| | | | | | |
| Issuer | | Shares/Par | | Value ($) |
| | | | | | |
| Common Stocks - continued | | | | | | |
| Utilities - Electric Power - continued | | | | | | |
| DTE Energy Co. | | | 246,700 | | $ | 9,122,966 |
| E.ON AG | | | 1,726,871 | | | 66,007,371 |
| Eletropaulo Metropolitana S.A., IPS | | | 2,316,460 | | | 43,328,427 |
| Entergy Corp. | | | 212,700 | | | 16,318,344 |
| FirstEnergy Corp. | | | 901,130 | | | 39,000,906 |
| National Grid PLC | | | 2,920,700 | | | 29,040,643 |
| Northeast Utilities | | | 1,352,560 | | | 31,176,508 |
| NRG Energy, Inc. (a) | | | 3,506,111 | | | 80,605,492 |
| OGE Energy Corp. | | | 713,227 | | | 23,693,401 |
| PG&E Corp. | | | 707,600 | | | 28,933,764 |
| PPL Corp. | | | 2,305,100 | | | 67,862,144 |
| Public Service Enterprise Group, Inc. | | | 1,896,852 | | | 56,526,190 |
| Red Electrica de Espana | | | 936,171 | | | 48,414,983 |
| RWE AG | | | 135,200 | | | 11,838,447 |
| Tractebel Energia S.A. | | | 399,900 | | | 4,744,499 |
| Wisconsin Energy Corp. | | | 698,000 | | | 30,481,660 |
| | | | | | |
| | | | | | $ | 1,047,880,138 |
| Total Common Stocks (Identified Cost, $2,108,078,427) | | | | | $ | 2,230,723,490 |
| | |
| Bonds - 1.1% | | | | | | |
| Asset Backed & Securitized - 0.0% | | | | | | |
| Falcon Franchise Loan LLC, FRN, 3.36%, 2021 (i)(z) | | $ | 2,152,110 | | $ | 105,884 |
| | |
| Cable TV - 0.4% | | | | | | |
| CSC Holdings, Inc., 8.625%, 2019 (z) | | $ | 5,115,000 | | $ | 5,460,263 |
| Virgin Media Finance PLC, 9.5%, 2016 | | | 4,420,000 | | | 4,674,150 |
| | | | | | |
| | | | | | $ | 10,134,413 |
| Metals & Mining - 0.1% | | | | | | |
| Arch Coal, Inc., 8.75%, 2016 (n) | | $ | 3,625,000 | | $ | 3,715,624 |
| | |
| Utilities - Electric Power - 0.6% | | | | | | |
| AES Corp., 9.75%, 2016 (n) | | $ | 12,317,000 | | $ | 13,425,530 |
| Total Bonds (Identified Cost, $24,394,267) | | | | | $ | 27,381,451 |
| | |
| Convertible Bonds - 1.7% | | | | | | |
| Telephone Services - 1.0% | | | | | | |
| Virgin Media, Inc., 6.5%, 2016 (z) | | $ | 23,172,000 | | $ | 24,504,390 |
13
Portfolio of Investments – continued
| | | | | | | |
| Issuer | | Shares/Par | | Value ($) | |
| | | | | | | |
| Convertible Bonds - continued | | | | | | | |
| Utilities - Electric Power - 0.7% | | | | | | | |
| Covanta Holding Corp., 3.25%, 2014 (z) | | $ | 14,874,820 | | $ | 16,659,798 | |
| Total Convertible Bonds (Identified Cost, $27,513,238) | | | | | $ | 41,164,188 | |
| | |
| Convertible Preferred Stocks - 2.3% | | | | | | | |
| Natural Gas - Pipeline - 0.8% | | | | | | | |
| El Paso Corp., 4.99% | | | 22,000 | | $ | 19,222,500 | |
| | |
| Utilities - Electric Power - 1.5% | | | | | | | |
| FPL Group, Inc., 8.375% | | | 448,000 | | $ | 21,504,000 | |
| Great Plains Energy, Inc., 12% | | | 216,890 | | | 13,403,802 | |
| | | | | | | |
| | | | | | $ | 34,907,802 | |
Total Convertible Preferred Stocks
(Identified Cost, $60,902,535) | | | | | $ | 54,130,302 | |
| | |
| Money Market Funds (v) - 3.3% | | | | | | | |
MFS Institutional Money Market Portfolio, 0.13%,
at Cost and Net Asset Value | | | 80,699,538 | | $ | 80,699,538 | |
| | |
| Collateral for Securities Loaned - 0.1% | | | | | | | |
| Morgan Stanley, Repurchase Agreement, 0.06%, dated 10/30/09, due 11/02/09, total to be received $3,196,641 (secured by U.S. Treasury and Federal Agency obligations and Mortgage Backed securities valued at $3,260,564 in an individually traded account), at Cost and Net Asset Value | | $ | 3,196,625 | | $ | 3,196,625 | |
| Total Investments (Identified Cost, $2,304,784,630) | | | | | $ | 2,437,295,594 | |
| | |
| Other Assets, Less Liabilities - (0.5)% | | | | | | (12,321,283 | ) |
| Net Assets - 100.0% | | | | | $ | 2,424,974,311 | |
| (a) | Non-income producing security. |
| (i) | Interest only security for which the fund receives interest on notional principal (Par amount). Par amount shown is the notional principal and does not reflect the cost of the security. |
| (l) | All or a portion of this security is on loan. |
| (n) | Securities exempt from registration under Rule 144A of the Securities Act of 1933. These securities may be sold in the ordinary course of business in transactions exempt from registration, normally to qualified institutional buyers. At period end, the aggregate value of these securities was $17,141,154, representing 0.7% of net assets. |
| (v) | Underlying fund that is available only to investment companies managed by MFS. The rate quoted is the annualized seven-day yield of the fund at period end. |
| (z) | Restricted securities are not registered under the Securities Act of 1933 and are subject to legal restrictions on resale. These securities generally may be resold in transactions exempt from registration or to the public if the securities are subsequently registered. Disposal of these securities may involve |
14
Portfolio of Investments – continued
| | time-consuming negotiations and prompt sale at an acceptable price may be difficult. The fund holds the following restricted securities: |
| | | | | | |
| Restricted Securities | | Acquisition
Date | | Cost | | Current
Market
Value |
| CSC Holdings, Inc., 8.625%, 2019 | | 2/09/09 | | $4,880,552 | | $5,460,263 |
| Covanta Holding Corp., 3.25%, 2014 | | 5/18/09 | | 14,874,820 | | 16,659,798 |
| Falcon Franchise Loan LLC, FRN, 3.36%, 2021 | | 1/08/02 | | 128,466 | | 105,884 |
| Virgin Media, Inc., 6.5%, 2016 | | 2/09/04-4/06/09 | | 12,638,418 | | 24,504,390 |
| Total Restricted Securities | | | | | | $46,730,335 |
| % of Net Assets | | | | | | 1.9% |
The following abbreviations are used in this report and are defined:
| ADR | | American Depository Receipt |
| FRN | | Floating Rate Note. Interest rate resets periodically and may not be the rate reported at period end. |
| IPS | | International Preference Stock |
| PLC | | Public Limited Company |
Abbreviations indicate amounts shown in currencies other than the U.S. dollar. All amounts are stated in U.S. dollars unless otherwise indicated. A list of abbreviations is shown below:
Derivative Contracts at 10/31/09
Forward Foreign Currency Exchange Contracts at 10/31/09
| | | | | | | | | | | | | | | |
| Type | | Currency | | Counterparty | | Contracts
to
Deliver/
Receive | | Settlement
Date Range | | In
Exchange
For | | Contracts
at Value | | Net
Unrealized
Appreciation
(Depreciation) | |
| Asset Derivatives | | | | | | | | | |
| BUY | | EUR | | JPMorgan Chase Bank | | 22,198,427 | | 1/13/10 | | $32,631,354 | | $32,662,247 | | $30,893 | |
| BUY | | EUR | | Merrill Lynch International | | 2,109,095 | | 12/16/09 | | 3,083,392 | | 3,103,547 | | 20,155 | |
| SELL | | EUR | | Merrill Lynch International | | 4,254,323 | | 12/16/09 | | 6,337,538 | | 6,260,265 | | 77,273 | |
| | | | | | | | | | | | | | | |
| | | | | | | | | | | | | | $128,321 | |
| | | | | | | | | | | | | | | |
| | | | |
| Liability Derivatives | | | | | | | | | |
| BUY | | EUR | | Barclays Bank | | 745,724 | | 1/13/10 | | $1,107,527 | | $1,097,241 | | $(10,286 | ) |
| BUY | | EUR | | HSBC Bank | | 4,011,171 | | 12/16/09-01/13/10 | | 5,996,416 | | 5,902,055 | | (94,361 | ) |
| SELL | | EUR | | UBS AG | | 114,182,900 | | 12/16/09 | | 166,972,510 | | 168,020,900 | | (1,048,390 | ) |
| SELL | | GBP | | Barclays Bank | | 15,386,238 | | 1/13/10 | | 24,438,233 | | 25,243,279 | | (805,046 | ) |
| SELL | | GBP | | Deutsche Bank | | 14,923,566 | | 1/13/10 | | 23,704,593 | | 24,484,200 | | (779,607 | ) |
| SELL | | GBP | | HSBC Bank | | 851,451 | | 12/16/09-1/13/10 | | 1,361,265 | | 1,396,949 | | (35,684 | ) |
| SELL | | GBP | | UBS AG | | 699,872 | | 1/13/10 | | 1,144,836 | | 1,148,237 | | (3,401 | ) |
| | | | | | | | | | | | | | | |
| | | | | | | | | | | | | | $(2,776,775 | ) |
| | | | | | | | | | | | | | | |
At October 31, 2009 the fund had sufficient cash and/or other liquid securities to cover any commitments under these derivative contracts.
See Notes to Financial Statements
15
Financial Statements
STATEMENT OF ASSETS AND LIABILITIES
At 10/31/09
This statement represents your fund’s balance sheet, which details the assets and liabilities comprising the total value of the fund.
| | | |
| Assets | | | |
Investments- | | | |
Non-affiliated issuers, at value (identified cost, $2,224,085,092) | | $2,356,596,056 | |
Underlying funds, at cost and value | | 80,699,538 | |
Total investments, at value, including $3,142,850 of securities on loan
(identified cost, $2,304,784,630) | | $2,437,295,594 | |
Cash | | 1,654,100 | |
Restricted cash | | 550,000 | |
Receivables for | | | |
Forward foreign currency exchange contracts | | 128,321 | |
Investments sold | | 21,091,279 | |
Fund shares sold | | 7,160,999 | |
Interest and dividends | | 9,065,636 | |
Total assets | | $2,476,945,929 | |
| Liabilities | | | |
Payables for | | | |
Distributions | | $1,311,198 | |
Forward foreign currency exchange contracts | | 2,776,775 | |
Investments purchased | | 39,481,033 | |
Fund shares reacquired | | 3,979,352 | |
Collateral for securities loaned, at value | | 3,196,625 | |
Payable to affiliates | | | |
Investment adviser | | 121,069 | |
Shareholder servicing costs | | 697,552 | |
Distribution and service fees | | 82,192 | |
Administrative services fee | | 3,148 | |
Payable for independent Trustees’ compensation | | 71,614 | |
Accrued expenses and other liabilities | | 251,060 | |
Total liabilities | | $51,971,618 | |
Net assets | | $2,424,974,311 | |
| Net assets consist of | | | |
Paid-in capital | | $2,934,382,745 | |
Unrealized appreciation (depreciation) on investments and translation of assets and liabilities in foreign currencies | | 130,363,956 | |
Accumulated net realized gain (loss) on investments and foreign currency transactions | | (648,179,064 | ) |
Undistributed net investment income | | 8,406,674 | |
Net assets | | $2,424,974,311 | |
Shares of beneficial interest outstanding | | 175,942,672 | |
| | | | | | |
| | | Net assets | | Shares
outstanding | | Net asset value
per share (a) |
Class A | | $1,766,611,149 | | 128,089,237 | | $13.79 |
Class B | | 196,483,233 | | 14,293,781 | | 13.75 |
Class C | | 299,350,779 | | 21,769,015 | | 13.75 |
Class I | | 39,174,658 | | 2,833,717 | | 13.82 |
Class R1 | | 9,673,864 | | 704,525 | | 13.73 |
Class R2 | | 61,470,247 | | 4,465,114 | | 13.77 |
Class R3 | | 39,450,154 | | 2,862,625 | | 13.78 |
Class R4 | | 12,760,227 | | 924,658 | | 13.80 |
| (a) | Maximum offering price per share was equal to the net asset value per share for all share classes, except for Class A, for which the maximum offering price per share was $14.63. On sales of $50,000 or more, the maximum offering price of Class A is reduced. A contingent deferred sales charge may be imposed on redemptions of Class A, Class B, and Class C shares. Redemption price per share was equal to the net asset value per share for Classes I, R1, R2, R3 and R4. |
See Notes to Financial Statements
16
Financial Statements
STATEMENT OF OPERATIONS
Year ended 10/31/09
This statement describes how much your fund earned in investment income and accrued in expenses. It also describes any gains and/or losses generated by fund operations.
| | | |
| Net investment income | | | |
Income | | | |
Dividends | | $117,245,435 | |
Dividends from underlying funds | | 157,165 | |
Interest | | 5,531,750 | |
Foreign taxes withheld | | (3,373,573 | ) |
Total investment income | | $119,560,777 | |
Expenses | | | |
Management fee | | $12,942,677 | |
Distribution and service fees | | 9,003,698 | |
Shareholder servicing costs | | 3,878,103 | |
Administrative services fee | | 423,573 | |
Independent Trustees’ compensation | | 70,997 | |
Custodian fee | | 358,372 | |
Shareholder communications | | 203,025 | |
Auditing fees | | 54,030 | |
Legal fees | | 75,839 | |
Miscellaneous | | 282,205 | |
Total expenses | | $27,292,519 | |
Fees paid indirectly | | (8,985 | ) |
Reduction of expenses by investment adviser | | (13,476 | ) |
Net expenses | | $27,270,058 | |
Net investment income | | $92,290,719 | |
| Realized and unrealized gain (loss) on investments and foreign currency transactions | | | |
Realized gain (loss) (identified cost basis) | | | |
Investment transactions (net of $561 country tax) (s) | | $(550,744,950 | ) |
Foreign currency transactions | | (9,007,159 | ) |
Net realized gain (loss) on investments
and foreign currency transactions | | $(559,752,109 | ) |
Change in unrealized appreciation (depreciation) | | | |
Investments | | $865,643,257 | |
Translation of assets and liabilities in foreign currencies | | (15,089,273 | ) |
Net unrealized gain (loss) on investments
and foreign currency translation | | $850,553,984 | |
Net realized and unrealized gain (loss) on investments
and foreign currency | | $290,801,875 | |
Change in net assets from operations | | $383,092,594 | |
| (s) | Includes proceeds received from a non-recurring cash settlement in the amount of $12,581,857 from a litigation settlement against Enron Corp. |
See Notes to Financial Statements
17
Financial Statements
STATEMENTS OF CHANGES IN NET ASSETS
These statements describe the increases and/or decreases in net assets resulting from operations, any distributions, and any shareholder transactions.
| | | | | | |
| | | Years ended 10/31 | |
| | | 2009 | | | 2008 | |
| Change in net assets | | | | | | |
| From operations | | | | | | |
Net investment income | | $92,290,719 | | | $60,079,022 | |
Net realized gain (loss) on investments and
foreign currency transactions | | (559,752,109 | ) | | (47,721,605 | ) |
Net unrealized gain (loss) on investments and
foreign currency translation | | 850,553,984 | | | (1,431,060,712 | ) |
Change in net assets from operations | | $383,092,594 | | | $(1,418,703,295 | ) |
| Distributions declared to shareholders | | | | | | |
From net investment income | | $(79,651,477 | ) | | $(71,361,167 | ) |
From net realized gain on investments | | (13,186,944 | ) | | (190,696,435 | ) |
Total distributions declared to shareholders | | $(92,838,421 | ) | | $(262,057,602 | ) |
Change in net assets from fund share transactions | | $(63,289,488 | ) | | $269,000,130 | |
Total change in net assets | | $226,964,685 | | | $(1,411,760,767 | ) |
| Net assets | | | | | | |
At beginning of period | | 2,198,009,626 | | | 3,609,770,393 | |
At end of period (including undistributed net investment
income of $8,406,674 and accumulated distributions in excess of net investment income of $6,447,892) | | $2,424,974,311 | | | $2,198,009,626 | |
See Notes to Financial Statements
18
Financial Statements
FINANCIAL HIGHLIGHTS
The financial highlights table is intended to help you understand the fund’s financial performance for the past 5 years (or life of a particular share class, if shorter). Certain information reflects financial results for a single fund share. The total returns in the table represent the rate by which an investor would have earned (or lost) on an investment in the fund share class (assuming reinvestment of all distributions) held for the entire period.
| | | | | | | | | | | | | | | |
| Class A | | Years ended 10/31 | |
| | | 2009 | | | 2008 | | | 2007 | | | 2006 | | | 2005 | |
Net asset value, beginning of
period | | $12.04 | | | $20.71 | | | $15.33 | | | $12.33 | | | $9.98 | |
Income (loss) from investment
operations | | | | | | | | | | | | | | | |
Net investment income (d) | | $0.54 | | | $0.34 | | | $0.35 | | | $0.30 | | | $0.18 | |
Net realized and unrealized gain
(loss) on investments and
foreign currency | | 1.75 | | | (7.53 | ) | | 5.38 | | | 2.94 | | | 2.34 | |
Total from investment operations | | $2.29 | | | $(7.19 | ) | | $5.73 | | | $3.24 | | | $2.52 | |
Less distributions declared to
shareholders | | | | | | | | | | | | | | | |
From net investment income | | $(0.47 | ) | | $(0.41 | ) | | $(0.35 | ) | | $(0.24 | ) | | $(0.17 | ) |
From net realized gain on
investments | | (0.07 | ) | | (1.07 | ) | | — | | | — | | | — | |
Total distributions declared to
shareholders | | $(0.54 | ) | | $(1.48 | ) | | $(0.35 | ) | | $(0.24 | ) | | $(0.17 | ) |
Net asset value, end of period | | $13.79 | | | $12.04 | | | $20.71 | | | $15.33 | | | $12.33 | |
Total return (%) (r)(s)(t) | | 19.78 | | | (37.21 | ) | | 37.77 | | | 26.48 | | | 25.33 | |
Ratios (%) (to average net
assets) and Supplemental data: | | | | | | | | | | | | | | | |
Expenses before expense
reductions (f) | | 1.10 | | | 1.05 | | | 1.05 | | | 1.11 | | | 1.13 | |
Expenses after expense
reductions (f) | | 1.10 | | | 1.04 | | | 1.05 | | | 1.11 | | | 1.13 | |
Net investment income | | 4.44 | | | 1.95 | | | 1.92 | | | 2.24 | | | 1.60 | |
Portfolio turnover | | 71 | | | 73 | | | 86 | | | 100 | | | 101 | |
Net assets at end of period
(000 omitted) | | $1,766,611 | | | $1,593,003 | | | $2,479,305 | | | $1,319,703 | | | $933,535 | |
See Notes to Financial Statements
19
Financial Highlights – continued
| | | | | | | | | | | | | | | |
| Class B | | Years ended 10/31 | |
| | | 2009 | | | 2008 | | | 2007 | | | 2006 | | | 2005 | |
Net asset value, beginning of
period | | $12.00 | | | $20.64 | | | $15.28 | | | $12.29 | | | $9.95 | |
Income (loss) from investment
operations | | | | | | | | | | | | | | | |
Net investment income (d) | | $0.47 | | | $0.21 | | | $0.20 | | | $0.20 | | | $0.10 | |
Net realized and unrealized gain
(loss) on investments and
foreign currency | | 1.73 | | | (7.51 | ) | | 5.38 | | | 2.93 | | | 2.32 | |
Total from investment operations | | $2.20 | | | $(7.30 | ) | | $5.58 | | | $3.13 | | | $2.42 | |
Less distributions declared to
shareholders | | | | | | | | | | | | | | | |
From net investment income | | $(0.38 | ) | | $(0.27 | ) | | $(0.22 | ) | | $(0.14 | ) | | $(0.08 | ) |
From net realized gain on
investments | | (0.07 | ) | | (1.07 | ) | | — | | | — | | | — | |
Total distributions declared to
shareholders | | $(0.45 | ) | | $(1.34 | ) | | $(0.22 | ) | | $(0.14 | ) | | $(0.08 | ) |
Net asset value, end of period | | $13.75 | | | $12.00 | | | $20.64 | | | $15.28 | | | $12.29 | |
Total return (%) (r)(s)(t) | | 18.94 | | | (37.68 | ) | | 36.73 | | | 25.55 | | | 24.39 | |
Ratios (%) (to average net
assets) and Supplemental data: | | | | | | | | | | | | | | | |
Expenses before expense
reductions (f) | | 1.85 | | | 1.79 | | | 1.80 | | | 1.86 | | | 1.89 | |
Expenses after expense
reductions (f) | | 1.85 | | | 1.78 | | | 1.80 | | | 1.86 | | | 1.89 | |
Net investment income | | 3.86 | | | 1.20 | | | 1.13 | | | 1.51 | | | 0.88 | |
Portfolio turnover | | 71 | | | 73 | | | 86 | | | 100 | | | 101 | |
Net assets at end of period
(000 omitted) | | $196,483 | | | $239,127 | | | $593,215 | | | $597,964 | | | $617,687 | |
See Notes to Financial Statements
20
Financial Highlights – continued
| | | | | | | | | | | | | | | |
| Class C | | Years ended 10/31 | |
| | | 2009 | | | 2008 | | | 2007 | | | 2006 | | | 2005 | |
Net asset value, beginning of
period | | $12.01 | | | $20.65 | | | $15.30 | | | $12.30 | | | $9.96 | |
Income (loss) from investment
operations | | | | | | | | | | | | | | | |
Net investment income (d) | | $0.45 | | | $0.21 | | | $0.21 | | | $0.20 | | | $0.10 | |
Net realized and unrealized gain
(loss) on investments and
foreign currency | | 1.74 | | | (7.51 | ) | | 5.36 | | | 2.94 | | | 2.32 | |
Total from investment operations | | $2.19 | | | $(7.30 | ) | | $5.57 | | | $3.14 | | | $2.42 | |
Less distributions declared to
shareholders | | | | | | | | | | | | | | | |
From net investment income | | $(0.38 | ) | | $(0.27 | ) | | $(0.22 | ) | | $(0.14 | ) | | $(0.08 | ) |
From net realized gain on
investments | | (0.07 | ) | | (1.07 | ) | | — | | | — | | | — | |
Total distributions declared to
shareholders | | $(0.45 | ) | | $(1.34 | ) | | $(0.22 | ) | | $(0.14 | ) | | $(0.08 | ) |
Net asset value, end of period | | $13.75 | | | $12.01 | | | $20.65 | | | $15.30 | | | $12.30 | |
Total return (%) (r)(s)(t) | | 18.86 | | | (37.64 | ) | | 36.64 | | | 25.61 | | | 24.37 | |
Ratios (%) (to average net
assets) and Supplemental data: | | | | | | | | | | | | | | | |
Expenses before expense
reductions (f) | | 1.85 | | | 1.80 | | | 1.80 | | | 1.86 | | | 1.88 | |
Expenses after expense
reductions (f) | | 1.85 | | | 1.79 | | | 1.80 | | | 1.86 | | | 1.88 | |
Net investment income | | 3.67 | | | 1.20 | | | 1.15 | | | 1.51 | | | 0.87 | |
Portfolio turnover | | 71 | | | 73 | | | 86 | | | 100 | | | 101 | |
Net assets at end of period
(000 omitted) | | $299,351 | | | $262,113 | | | $402,178 | | | $260,120 | | | $218,335 | |
See Notes to Financial Statements
21
Financial Highlights – continued
| | | | | | | | | | | | | | | |
| Class I | | Years ended 10/31 | |
| | | 2009 | | | 2008 | | | 2007 | | | 2006 | | | 2005 | |
Net asset value, beginning of
period | | $12.07 | | | $20.74 | | | $15.36 | | | $12.35 | | | $10.00 | |
Income (loss) from investment
operations | | | | | | | | | | | | | | | |
Net investment income (d) | | $0.46 | | | $0.39 | | | $0.40 | | | $0.33 | | | $0.21 | |
Net realized and unrealized gain
(loss) on investments and
foreign currency | | 1.86 | | | (7.54 | ) | | 5.38 | | | 2.95 | | | 2.34 | |
Total from investment operations | | $2.32 | | | $(7.15 | ) | | $5.78 | | | $3.28 | | | $2.55 | |
Less distributions declared to
shareholders | | | | | | | | | | | | | | | |
From net investment income | | $(0.50 | ) | | $(0.45 | ) | | $(0.40 | ) | | $(0.27 | ) | | $(0.20 | ) |
From net realized gain on
investments | | (0.07 | ) | | (1.07 | ) | | — | | | — | | | — | |
Total distributions declared to
shareholders | | $(0.57 | ) | | $(1.52 | ) | | $(0.40 | ) | | $(0.27 | ) | | $(0.20 | ) |
Net asset value, end of period | | $13.82 | | | $12.07 | | | $20.74 | | | $15.36 | | | $12.35 | |
Total return (%) (r)(s) | | 20.03 | | | (36.99 | ) | | 38.03 | | | 26.83 | | | 25.59 | |
Ratios (%) (to average net
assets) and Supplemental data: | | | | | | | | | | | | | | | |
Expenses before expense
reductions (f) | | 0.82 | | | 0.79 | | | 0.80 | | | 0.86 | | | 0.88 | |
Expenses after expense
reductions (f) | | 0.82 | | | 0.78 | | | 0.80 | | | 0.86 | | | 0.88 | |
Net investment income | | 3.60 | | | 2.17 | | | 2.17 | | | 2.45 | | | 1.81 | |
Portfolio turnover | | 71 | | | 73 | | | 86 | | | 100 | | | 101 | |
Net assets at end of period
(000 omitted) | | $39,175 | | | $10,141 | | | $19,230 | | | $9,830 | | | $6,630 | |
See Notes to Financial Statements
22
Financial Highlights – continued
| | | | | | | | | | | | | | | |
| Class R1 | | Years ended 10/31 | |
| | | 2009 | | | 2008 | | | 2007 | | | 2006 | | | 2005 (i) | |
Net asset value, beginning of
period | | $11.99 | | | $20.63 | | | $15.28 | | | $12.29 | | | $11.04 | |
Income (loss) from investment
operations | | | | | | | | | | | | | | | |
Net investment income (d) | | $0.44 | | | $0.20 | | | $0.17 | | | $0.19 | | | $0.01 | |
Net realized and unrealized gain
(loss) on investments and
foreign currency | | 1.75 | | | (7.50 | ) | | 5.39 | | | 2.92 | | | 1.29 | |
Total from investment operations | | $2.19 | | | $(7.30 | ) | | $5.56 | | | $3.11 | | | $1.30 | |
Less distributions declared to
shareholders | | | | | | | | | | | | | | | |
From net investment income | | $(0.38 | ) | | $(0.27 | ) | | $(0.21 | ) | | $(0.12 | ) | | $(0.05 | ) |
From net realized gain on
investments | | (0.07 | ) | | (1.07 | ) | | — | | | — | | | — | |
Total distributions declared to
shareholders | | $(0.45 | ) | | $(1.34 | ) | | $(0.21 | ) | | $(0.12 | ) | | $(0.05 | ) |
Net asset value, end of period | | $13.73 | | | $11.99 | | | $20.63 | | | $15.28 | | | $12.29 | |
Total return (%) (r)(s) | | 18.90 | | | (37.69 | ) | | 36.62 | | | 25.42 | | | 11.77 | (n) |
Ratios (%) (to average net
assets) and Supplemental data: | | | | | | | | | | | | | | | |
Expenses before expense
reductions (f) | | 1.84 | | | 1.83 | | | 1.92 | | | 2.06 | | | 2.08 | (a) |
Expenses after expense
reductions (f) | | 1.84 | | | 1.83 | | | 1.90 | | | 1.96 | | | 2.05 | (a) |
Net investment income | | 3.61 | | | 1.15 | | | 0.92 | | | 1.40 | | | 0.12 | (a) |
Portfolio turnover | | 71 | | | 73 | | | 86 | | | 100 | | | 101 | |
Net assets at end of period
(000 omitted) | | $9,674 | | | $7,689 | | | $9,017 | | | $1,902 | | | $879 | |
See Notes to Financial Statements
23
Financial Highlights – continued
| | | | | | | | | | | | | | | |
| Class R2 | | Years ended 10/31 | |
| | | 2009 | | | 2008 | | | 2007 | | | 2006 | | | 2005 | |
Net asset value, beginning of
period | | $12.02 | | | $20.67 | | | $15.31 | | | $12.31 | | | $9.97 | |
Income (loss) from investment
operations | | | | | | | | | | | | | | | |
Net investment income (d) | | $0.50 | | | $0.29 | | | $0.27 | | | $0.24 | | | $0.11 | |
Net realized and unrealized gain
(loss) on investments and
foreign currency | | 1.76 | | | (7.51 | ) | | 5.38 | | | 2.94 | | | 2.34 | |
Total from investment operations | | $2.26 | | | $(7.22 | ) | | $5.65 | | | $3.18 | | | $2.45 | |
Less distributions declared to
shareholders | | | | | | | | | | | | | | | |
From net investment income | | $(0.44 | ) | | $(0.36 | ) | | $(0.29 | ) | | $(0.18 | ) | | $(0.11 | ) |
From net realized gain on
investments | | (0.07 | ) | | (1.07 | ) | | — | | | — | | | — | |
Total distributions declared to
shareholders | | $(0.51 | ) | | $(1.43 | ) | | $(0.29 | ) | | $(0.18 | ) | | $(0.11 | ) |
Net asset value, end of period | | $13.77 | | | $12.02 | | | $20.67 | | | $15.31 | | | $12.31 | |
Total return (%) (r)(s) | | 19.52 | | | (37.35 | ) | | 37.17 | | | 26.02 | | | 24.66 | |
Ratios (%) (to average net
assets) and Supplemental data: | | | | | | | | | | | | | | | |
Expenses before expense
reductions (f) | | 1.34 | | | 1.33 | | | 1.47 | | | 1.62 | | | 1.62 | |
Expenses after expense
reductions (f) | | 1.34 | | | 1.32 | | | 1.44 | | | 1.52 | | | 1.60 | |
Net investment income | | 4.12 | | | 1.69 | | | 1.49 | | | 1.73 | | | 0.97 | |
Portfolio turnover | | 71 | | | 73 | | | 86 | | | 100 | | | 101 | |
Net assets at end of period
(000 omitted) | | $61,470 | | | $49,039 | | | $50,205 | | | $14,413 | | | $2,426 | |
See Notes to Financial Statements
24
Financial Highlights – continued
| | | | | | | | | | | | | | | |
| Class R3 | | Years ended 10/31 | |
| | | 2009 | | | 2008 | | | 2007 | | | 2006 | | | 2005��(i) | |
Net asset value, beginning of
period | | $12.03 | | | $20.69 | | | $15.32 | | | $12.33 | | | $11.08 | |
Income (loss) from investment
operations | | | | | | | | | | | | | | | |
Net investment income (d) | | $0.54 | | | $0.34 | | | $0.33 | | | $0.26 | | | $0.10 | |
Net realized and unrealized gain
(loss) on investments and
foreign currency | | 1.75 | | | (7.53 | ) | | 5.37 | | | 2.95 | | | 1.25 | |
Total from investment operations | | $2.29 | | | $(7.19 | ) | | $5.70 | | | $3.21 | | | $1.35 | |
Less distributions declared to
shareholders | | | | | | | | | | | | | | | |
From net investment income | | $(0.47 | ) | | $(0.40 | ) | | $(0.33 | ) | | $(0.22 | ) | | $(0.10 | ) |
From net realized gain on
investments | | (0.07 | ) | | (1.07 | ) | | — | | | — | | | — | |
Total distributions declared to
shareholders | | $(0.54 | ) | | $(1.47 | ) | | $(0.33 | ) | | $(0.22 | ) | | $(0.10 | ) |
Net asset value, end of period | | $13.78 | | | $12.03 | | | $20.69 | | | $15.32 | | | $12.33 | |
Total return (%) (r)(s) | | 19.80 | | | (37.21 | ) | | 37.55 | | | 26.21 | | | 12.22 | (n) |
Ratios (%) (to average net
assets) and Supplemental data: | | | | | | | | | | | | | | | |
Expenses before expense
reductions (f) | | 1.10 | | | 1.07 | | | 1.20 | | | 1.28 | | | 1.26 | (a) |
Expenses after expense
reductions (f) | | 1.09 | | | 1.07 | | | 1.20 | | | 1.28 | | | 1.26 | (a) |
Net investment income | | 4.40 | | | 1.91 | | | 1.77 | | | 1.93 | | | 1.50 | (a) |
Portfolio turnover | | 71 | | | 73 | | | 86 | | | 100 | | | 101 | |
Net assets at end of period
(000 omitted) | | $39,450 | | | $31,360 | | | $41,574 | | | $10,786 | | | $62 | |
See Notes to Financial Statements
25
Financial Highlights – continued
| | | | | | | | | | | | | | | |
| Class R4 | | Years ended 10/31 | |
| | | 2009 | | | 2008 | | | 2007 | | | 2006 | | | 2005 (i) | |
Net asset value, beginning of
period | | $12.05 | | | $20.71 | | | $15.34 | | | $12.33 | | | $11.08 | |
Income (loss) from investment
operations | | | | | | | | | | | | | | | |
Net investment income (d) | | $0.54 | | | $0.36 | | | $0.40 | | | $0.28 | | | $0.13 | |
Net realized and unrealized gain
(loss) on investments and
foreign currency | | 1.78 | | | (7.50 | ) | | 5.35 | | | 2.99 | | | 1.24 | |
Total from investment operations | | $2.32 | | | $(7.14 | ) | | $5.75 | | | $3.27 | | | $1.37 | |
Less distributions declared to
shareholders | | | | | | | | | | | | | | | |
From net investment income | | $(0.50 | ) | | $(0.45 | ) | | $(0.38 | ) | | $(0.26 | ) | | $(0.12 | ) |
From net realized gain on
investments | | (0.07 | ) | | (1.07 | ) | | — | | | — | | | — | |
Total distributions declared to
shareholders | | $(0.57 | ) | | $(1.52 | ) | | $(0.38 | ) | | $(0.26 | ) | | $(0.12 | ) |
Net asset value, end of period | | $13.80 | | | $12.05 | | | $20.71 | | | $15.34 | | | $12.33 | |
Total return (%) (r)(s) | | 20.06 | | | (37.01 | ) | | 37.89 | | | 26.75 | | | 12.41 | (n) |
Ratios (%) (to average net
assets) and Supplemental data: | | | | | | | | | | | | | | | |
Expenses before expense
reductions (f) | | 0.84 | | | 0.83 | | | 0.90 | | | 0.96 | | | 0.96 | (a) |
Expenses after expense
reductions (f) | | 0.84 | | | 0.82 | | | 0.90 | | | 0.96 | | | 0.96 | (a) |
Net investment income | | 4.38 | | | 2.12 | | | 2.12 | | | 1.98 | | | 1.83 | (a) |
Portfolio turnover | | 71 | | | 73 | | | 86 | | | 100 | | | 101 | |
Net assets at end of period
(000 omitted) | | $12,760 | | | $5,537 | | | $2,727 | | | $637 | | | $56 | |
Any redemption fees charged by the fund during the 2005 fiscal year resulted in a per share impact of less than $0.01.
| (d) | Per share data is based on average shares outstanding. |
| (f) | Ratios do not reflect reductions from fees paid indirectly, if applicable. |
| (i) | For the period from the class’ inception, April 1, 2005 (Classes R1, R3, and R4) through the stated period end. |
| (r) | Certain expenses have been reduced without which performance would have been lower. |
| (s) | From time to time the fund may receive proceeds from litigation settlements, without which performance would be lower. Excluding the effect of the proceeds received from a non-recurring litigation settlement against Enron Corp., the Class A, Class B, Class C, Class I, Class R1, Class R2, Class R3, and Class R4 total returns for the year ended October 31, 2009 would have each been lower by approximately 0.62%. |
| (t) | Total returns do not include any applicable sales charges. |
See Notes to Financial Statements
26
NOTES TO FINANCIAL STATEMENTS
| (1) | | Business and Organization |
MFS Utilities Fund (the fund) is a series of MFS Series Trust VI (the trust). The trust is organized as a Massachusetts business trust and is registered under the Investment Company Act of 1940, as amended, as an open-end management investment company.
| (2) | | Significant Accounting Policies |
General – The preparation of financial statements in conformity with U.S. generally accepted accounting principles requires management to make estimates and assumptions that affect the reported amounts of assets and liabilities, and disclosure of contingent assets and liabilities at the date of the financial statements and the reported amounts of revenues and expenses during the reporting period. In making these estimates and assumptions, management has considered the effects, if any, of events occurring after the date of the fund’s Statement of Assets and Liabilities through December 17, 2009 which is the date that the financial statements were issued. Actual results could differ from those estimates. The fund invests primarily in securities of issuers in the utility industry. Issuers in a single industry can react similarly to market, economic, political and regulatory conditions and developments. The fund can invest in foreign securities, including securities of emerging market issuers. Investments in foreign securities are vulnerable to the effects of changes in the relative values of the local currency and the U.S. dollar and to the effects of changes in each country’s legal, political, and economic environment. The markets of emerging markets countries are generally more volatile than the markets of developed countries with more mature economies. All of the risks of investing in foreign securities previously described are heightened when investing in emerging markets countries.
Investment Valuations – Equity securities, including restricted equity securities, are generally valued at the last sale or official closing price as provided by a third-party pricing service on the market or exchange on which they are primarily traded. Equity securities, for which there were no sales reported that day, are generally valued at the last quoted daily bid quotation as provided by a third-party pricing service on the market or exchange on which such securities are primarily traded. Equity securities held short, for which there were no sales reported for that day, are generally valued at the last quoted daily ask quotation as provided by a third-party pricing service on the market or exchange on which such securities are primarily traded. Debt instruments and floating rate loans (other than short-term instruments), including restricted debt instruments, are generally valued at an evaluated or composite bid as provided by a third-party pricing service. Short-term instruments with a maturity at issuance of 60 days or less generally are valued
27
Notes to Financial Statements – continued
at amortized cost, which approximates market value. Forward foreign currency contracts are generally valued at the mean of bid and asked prices for the time period interpolated from rates provided by a third-party pricing service for proximate time periods. Open-end investment companies are generally valued at net asset value per share. Securities and other assets generally valued on the basis of information from a third-party pricing service may also be valued at a broker/dealer bid quotation. Values obtained from third-party pricing services can utilize both transaction data and market information such as yield, quality, coupon rate, maturity, type of issue, trading characteristics, and other market data. The values of foreign securities and other assets and liabilities expressed in foreign currencies are converted to U.S. dollars using the mean of bid and asked prices for rates provided by a third-party pricing service.
The Board of Trustees has delegated primary responsibility for determining or causing to be determined the value of the fund’s investments (including any fair valuation) to the adviser pursuant to valuation policies and procedures approved by the Board. If the adviser determines that reliable market quotations are not readily available, investments are valued at fair value as determined in good faith by the adviser in accordance with such procedures under the oversight of the Board of Trustees. Under the fund’s valuation policies and procedures, market quotations are not considered to be readily available for most types of debt instruments and floating rate loans and many types of derivatives. These investments are generally valued at fair value based on information from third-party pricing services. In addition, investments may be valued at fair value if the adviser determines that an investment’s value has been materially affected by events occurring after the close of the exchange or market on which the investment is principally traded (such as foreign exchange or market) and prior to the determination of the fund’s net asset value, or after the halting of trading of a specific security where trading does not resume prior to the close of the exchange or market on which the security is principally traded. Events that occur on a frequent basis after foreign markets close (such as developments in foreign markets and significant movements in the U.S. markets) and prior to the determination of the fund’s net asset value may be deemed to have a material affect on the value of securities traded in foreign markets. Accordingly, the fund’s foreign equity securities may often be valued at fair value. The adviser generally relies on third-party pricing services or other information (such as the correlation with price movements of similar securities in the same or other markets; the type, cost and investment characteristics of the security; the business and financial condition of the issuer; and trading and other market data) to assist in determining whether to fair value and at what value to fair value an investment. The value of an investment for purposes of calculating the fund’s net asset value can differ depending on the source and method used to
28
Notes to Financial Statements – continued
determine value. When fair valuation is used, the value of an investment used to determine the fund’s net asset value may differ from quoted or published prices for the same investment. There can be no assurance that the fund could obtain the fair value assigned to an investment if it were to sell the investment at the same time at which the fund determines its net asset value per share.
The fund has adopted FASB Accounting Standard Codification 820, Fair Value Measurements and Disclosures (“ASC 820”), which provides a single definition of fair value, a hierarchy for measuring fair value and expanded disclosures about fair value measurements.
Various inputs are used in determining the value of the fund’s assets or liabilities carried at market value. These inputs are categorized into three broad levels. In certain cases, the inputs used to measure fair value may fall into different levels of the fair value hierarchy. In such cases, an investment’s level within the fair value hierarchy is based on the lowest level of input that is significant to the fair value measurement. The fund’s assessment of the significance of a particular input to the fair value measurement in its entirety requires judgment, and considers factors specific to the investment. Level 1 includes unadjusted quoted prices in active markets for identical assets or liabilities. Level 2 includes other significant observable market-based inputs (including quoted prices for similar securities, interest rates, prepayment speed, and credit risk). Level 3 includes unobservable inputs, which may include the adviser’s own assumptions in determining the fair value of investments. Other financial instruments are derivative instruments not reflected in total investments, such as futures, forwards, swap contracts, and written options.
29
Notes to Financial Statements – continued
The following is a summary of the levels used as of October 31, 2009 in valuing the fund’s assets or liabilities carried at market value:
| | | | | | | | | | |
| Investments at Value | | Level 1 | | Level 2 | | | Level 3 | | Total | |
| Equity Securities: | | | | | | | | | | |
United States | | $1,505,962,756 | | $40,726,500 | | | $— | | $1,546,689,256 | |
Brazil | | 130,149,465 | | — | | | — | | 130,149,465 | |
United Kingdom | | — | | 92,825,722 | | | — | | 92,825,722 | |
Spain | | — | | 89,991,875 | | | — | | 89,991,875 | |
Germany | | — | | 77,845,818 | | | — | | 77,845,818 | |
Israel | | 75,092,398 | | — | | | — | | 75,092,398 | |
Czech Republic | | 56,494,488 | | — | | | — | | 56,494,488 | |
Canada | | 41,156,016 | | — | | | — | | 41,156,016 | |
Netherlands | | — | | 39,836,233 | | | — | | 39,836,233 | |
Other Countries | | 72,451,279 | | 62,321,242 | | | — | | 134,772,521 | |
| Corporate Bonds | | — | | 63,765,605 | | | — | | 63,765,605 | |
| Commercial Mortgage-Backed Securities | | — | | 105,884 | | | — | | 105,884 | |
| Foreign Bonds | | — | | 4,674,150 | | | — | | 4,674,150 | |
| Short Term Securities | | — | | 3,196,625 | | | — | | 3,196,625 | |
| Mutual Funds | | 80,699,538 | | — | | | — | | 80,699,538 | |
| Total Investments | | $1,962,005,940 | | $475,289,654 | | | $— | | $2,437,295,594 | |
| | | | |
| Other Financial Instruments | | | | | | | | | | |
| Forward Currency Contracts | | $— | | $(2,648,454 | ) | | $— | | $(2,648,454 | ) |
Country disclosure is based on the country of domicile. For further information regarding security characteristics, see the Portfolio of Investments.
Repurchase Agreements – The fund may enter into repurchase agreements with approved counterparties. Each repurchase agreement is recorded at cost. The fund requires that the securities collateral in a repurchase transaction be transferred to a custodian. The fund monitors, on a daily basis, the value of the collateral to ensure that its value, including accrued interest, is greater than amounts owed to the fund under each such repurchase agreement.
Foreign Currency Translation – Purchases and sales of foreign investments, income, and expenses are converted into U.S. dollars based upon currency exchange rates prevailing on the respective dates of such transactions or on the reporting date for foreign denominated receivables and payables. Gains and losses attributable to foreign currency exchange rates on sales of securities are recorded for financial statement purposes as net realized gains and losses on investments. Gains and losses attributable to foreign exchange rate movements on receivables, payables, income and expenses are recorded for financial statement purposes as foreign currency transaction gains and losses. That portion of both realized and unrealized gains and losses on investments that results from fluctuations in foreign currency exchange rates is not separately disclosed.
30
Notes to Financial Statements – continued
Derivatives – The fund may use derivatives for different purposes, including to earn income and enhance returns, to increase or decrease exposure to a particular market, to manage or adjust the risk profile of the fund, or as alternatives to direct investments. Derivatives may be used for hedging or non-hedging purposes. While hedging can reduce or eliminate losses, it can also reduce or eliminate gains. When the fund uses derivatives as an investment to increase market exposure, or for hedging purposes, gains and losses from derivative instruments may be substantially greater than the derivative’s original cost.
In this reporting period the fund adopted the disclosure provisions of FASB Accounting Standard Codification 815, Derivatives and Hedging (“ASC 815”). ASC 815 requires enhanced disclosures about the fund’s use of and accounting for derivative instruments and the effect of derivative instruments on the fund’s results of operations and financial position. Tabular disclosure regarding derivative fair value and gain/loss by contract type (e.g., interest rate contracts, foreign exchange contracts, credit contracts, etc.) is required and derivatives accounted for as hedging instruments under ASC 815 must be disclosed separately from those that do not qualify for hedge accounting. Even though the fund may use derivatives in an attempt to achieve an economic hedge, the fund’s derivatives are not accounted for as hedging instruments under ASC 815 because investment companies account for their derivatives at fair value and record any changes in fair value in current period earnings.
Derivative instruments include written options, purchased options, futures contracts, forward foreign currency exchange contracts, and swap agreements. The fund’s period end derivatives, as presented in the Portfolio of Investments and the associated Derivative Contract Tables, generally are indicative of the volume of its derivative activity during the period.
The following table presents, by major type of derivative contract, the fair value, on a gross basis, of the asset and liability components of derivatives held by the fund at October 31, 2009:
| | | | | | | | | | | |
| | | | | Asset Derivatives | | Liability Derivatives | |
| | | | | Location on
Statement of
Assets and
Liabilities | | Fair Value | | Location on
Statement of
Assets and
Liabilities | | Fair Value | |
Foreign
Exchange
Contracts | | Forward
Foreign
Currency
Exchange
Contracts | | Receivable for forward foreign currency exchange contracts | | $128,321 | | Payable for forward foreign currency exchange contracts | | $(2,776,775 | ) |
31
Notes to Financial Statements – continued
The following table presents, by major type of derivative contract, the realized gain (loss) on derivatives held by the fund for the year ended October 31, 2009 as reported in the Statement of Operations:
| | | |
| | | Foreign Currency
Transactions | |
| Foreign Exchange Contracts | | $(10,129,191 | ) |
The following table presents, by major type of derivative contract, the change in unrealized appreciation (depreciation) on derivatives held by the fund for the year ended October 31, 2009 as reported in the Statement of Operations:
| | | |
| | | Translation
of Assets
and
Liabilities in
Foreign
Currencies | |
| Foreign Exchange Contracts | | $(15,573,560 | ) |
Derivative counterparty credit risk is managed through formal evaluation of the creditworthiness of all potential counterparties. On certain over-the-counter derivatives, the fund attempts to reduce its exposure to counterparty credit risk by entering into an International Swaps and Derivatives Association (ISDA) Master Agreement on a bilateral basis with each of the counterparties with whom it undertakes a significant volume of transactions. The ISDA Master Agreement gives each party to the agreement the right to terminate all transactions traded under such agreement if there is a certain deterioration in the credit quality of the other party. The ISDA Master Agreement gives the fund the right, upon an event of default by the applicable counterparty or a termination of the agreement, to close out all transactions traded under such agreement and to net amounts owed under each transaction to one net amount payable by one party to the other. This right to close out and net payments across all transactions traded under the ISDA Master Agreement could result in a reduction of the fund’s credit risk to such counterparty equal to any amounts payable by the fund under the applicable transactions, if any. However, absent an event of default by the counterparty or a termination of the agreement, the ISDA Master Agreement does not result in an offset of reported balance sheet assets and liabilities across transactions between the fund and the applicable counterparty.
Collateral requirements differ by type of derivative. Collateral or margin requirements are set by the broker or exchange clearing house for exchange traded derivatives (i.e., futures and exchange-traded options) while collateral terms are contract specific for over-the-counter traded derivatives (i.e., forwards, swaps and over-the-counter options). For derivatives traded under an ISDA Master Agreement, the collateral requirements are netted across all transactions traded under such agreement and one amount is posted from one
32
Notes to Financial Statements – continued
party to the other to collateralize such obligations. Cash collateral that has been pledged to cover obligations of the fund under derivative contracts will be reported separately on the Statement of Assets and Liabilities as restricted cash. Securities collateral pledged for the same purpose is noted in the Portfolio of Investments.
Forward Foreign Currency Exchange Contracts – The fund may enter into forward foreign currency exchange contracts for the purchase or sale of a specific foreign currency at a fixed price on a future date to hedge the fund’s currency risk or for non-hedging purposes. For hedging purposes, the fund may enter into contracts to deliver or receive foreign currency that the fund will receive from or use in its normal investment activities. The fund may also use contracts to hedge against declines in the value of foreign currency denominated securities due to unfavorable exchange rate movements. For non-hedging purposes, the fund may enter into contracts with the intent of changing the relative exposure of the fund’s portfolio of securities to different currencies to take advantage of anticipated exchange rate changes.
Forward foreign currency exchange contracts are adjusted by the daily exchange rate of the underlying currency and any unrealized gains or losses are recorded as a receivable or payable for forward foreign currency exchange contracts until the contract settlement date. On contract settlement date, any gain or loss on the contract is recorded as realized gains or losses on foreign currency transactions.
Risks may arise upon entering into these contracts from unanticipated movements in the value of the contract and from the potential inability of counterparties to meet the terms of their contracts. The fund’s maximum risk due to counterparty credit risk is the notional amount of the contract. This risk is mitigated in cases where there is an ISDA Master Agreement between the fund and the counterparty providing for netting as described above and for posting of collateral by the counterparty to the fund to cover the fund’s exposure to the counterparty under such ISDA Master Agreement.
Security Loans – JPMorgan Chase and Co. (“Chase”), as lending agent, may loan the securities of the fund to certain qualified institutions (the “Borrowers”) approved by the fund. The loans are collateralized by cash and/or U.S. Treasury and federal agency obligations in an amount typically at least equal to the market value of the securities loaned. The market value of the loaned securities is determined at the close of business of the fund and any additional required collateral is delivered to the fund on the next business day. Chase provides the fund with indemnification against Borrower default. The fund bears the risk of loss with respect to the investment of cash collateral. On loans collateralized by cash, the cash collateral is invested in short-term securities. A portion of the income generated upon investment of the collateral
33
Notes to Financial Statements – continued
is remitted to the Borrowers, and the remainder is allocated between the fund and the lending agent. On loans collateralized by U.S. Treasury and/or federal agency obligations, a fee is received from the Borrower, and is allocated between the fund and the lending agent. Income from securities lending is included in interest income on the Statement of Operations. The dividend and interest income earned on the securities loaned is accounted for in the same manner as other dividend and interest income.
Indemnifications – Under the fund’s organizational documents, its officers and Trustees may be indemnified against certain liabilities and expenses arising out of the performance of their duties to the fund. Additionally, in the normal course of business, the fund enters into agreements with service providers that may contain indemnification clauses. The fund’s maximum exposure under these agreements is unknown as this would involve future claims that may be made against the fund that have not yet occurred.
Investment Transactions and Income – Investment transactions are recorded on the trade date. Interest income is recorded on the accrual basis. All premium and discount is amortized or accreted for financial statement purposes in accordance with U.S. generally accepted accounting principles. Dividends received in cash are recorded on the ex-dividend date. Certain dividends from foreign securities will be recorded when the fund is informed of the dividend if such information is obtained subsequent to the ex-dividend date. Dividend and interest payments received in additional securities are recorded on the ex-dividend or ex-interest date in an amount equal to the value of the security on such date.
The fund may receive proceeds from litigation settlements. Any proceeds received from litigation involving portfolio holdings are reflected in the Statement of Operations in realized gain/loss if the security has been disposed of by the fund or in unrealized gain/loss if the security is still held by the fund. Any other proceeds from litigation not related to portfolio holdings are reflected as other income in the Statement of Operations. The fund was a participant in litigation against Enron Corp. On December 26, 2008, the fund received a cash settlement in the amount of $12,581,857.
Fees Paid Indirectly – The fund’s custody fee may be reduced according to an arrangement that measures the value of cash deposited with the custodian by the fund. This amount, for the year ended October 31, 2009, is shown as a reduction of total expenses on the Statement of Operations.
Tax Matters and Distributions – The fund intends to qualify as a regulated investment company, as defined under Subchapter M of the Internal Revenue Code, and to distribute all of its taxable income, including realized capital gains. As a result, no provision for federal income tax is required. The fund’s federal tax returns for the prior three fiscal years remain subject to
34
Notes to Financial Statements – continued
examination by the Internal Revenue Service. Foreign taxes, if any, have been accrued by the fund in the accompanying financial statements.
Distributions to shareholders are recorded on the ex-dividend date. Income and capital gain distributions are determined in accordance with income tax regulations, which may differ from U.S. generally accepted accounting principles. Certain capital accounts in the financial statements are periodically adjusted for permanent differences in order to reflect their tax character. These adjustments have no impact on net assets or net asset value per share. Temporary differences which arise from recognizing certain items of income, expense, gain or loss in different periods for financial statement and tax purposes will reverse at some time in the future. Distributions in excess of net investment income or net realized gains are temporary overdistributions for financial statement purposes resulting from differences in the recognition or classification of income or distributions for financial statement and tax purposes.
Book/tax differences primarily relate to wash sale loss deferrals and foreign currency transactions.
The tax character of distributions declared to shareholders for the last two fiscal years is as follows:
| | | | |
| | | 10/31/09 | | 10/31/08 |
| Ordinary income (including any short-term capital gains) | | $79,655,982 | | $71,124,263 |
| Long-term capital gain | | 13,182,439 | | 190,933,339 |
| Total distributions | | $92,838,421 | | $262,057,602 |
The federal tax cost and the tax basis components of distributable earnings were as follows:
| | | |
| As of 10/31/09 | | | |
| Cost of investments | | $2,399,867,159 | |
| Gross appreciation | | 183,133,745 | |
| Gross depreciation | | (145,705,310 | ) |
| Net unrealized appreciation (depreciation) | | $37,428,435 | |
| |
| Undistributed ordinary income | | 17,777,506 | |
| Capital loss carryforwards | | (555,766,497 | ) |
| Other temporary differences | | (8,847,878 | ) |
As of October 31, 2009, the fund had capital loss carryforwards available to offset future realized gains. Such losses expire as follows:
Multiple Classes of Shares of Beneficial Interest – The fund offers multiple classes of shares, which differ in their respective distribution and service fees.
35
Notes to Financial Statements – continued
The fund’s income, realized and unrealized gain (loss), and common expenses are allocated to shareholders based on the daily net assets of each class. Dividends are declared separately for each class. Differences in per share dividend rates are generally due to differences in separate class expenses. Class B shares will convert to Class A shares approximately eight years after purchase. The fund’s distributions declared to shareholders as reported on the Statements of Changes in Net Assets are presented by class as follows:
| | | | | | | | |
| | | From net investment
income | | From net realized gain on
investments |
| | | Year ended
10/31/09 | | Year ended
10/31/08 | | Year ended
10/31/09 | | Year ended
10/31/08 |
| Class A | | $60,695,291 | | $55,622,260 | | $9,540,135 | | $132,385,878 |
| Class B | | 6,234,055 | | 6,641,612 | | 1,417,392 | | 29,706,426 |
| Class C | | 8,231,176 | | 6,031,052 | | 1,601,487 | | 21,256,788 |
| Class I | | 715,721 | | 402,877 | | 61,589 | | 993,475 |
| Class R (b) | | — | | 41,823 | | — | | 313,426 |
| Class R1 | | 259,485 | | 159,278 | | 49,405 | | 511,858 |
| Former Class R2 (b) | | — | | 45,925 | | — | | 293,802 |
| Class R2 | | 1,864,849 | | 1,310,190 | | 299,297 | | 2,850,220 |
| Class R3 | | 1,237,946 | | 993,911 | | 183,121 | | 2,238,338 |
| Class R4 | | 412,954 | | 112,239 | | 34,518 | | 146,224 |
| Total | | $79,651,477 | | $71,361,167 | | $13,186,944 | | $190,696,435 |
| (b) | At the close of business on April 18, 2008, Class R and Class R2 shares converted into Class R3 shares. Following this conversion, Class R3, Class R4, and Class R5 shares were renamed Class R2, Class R3, and Class R4 shares, respectively. |
| (3) | | Transactions with Affiliates |
Investment Adviser – The fund has an investment advisory agreement with MFS to provide overall investment management and related administrative services and facilities to the fund.
The management fee is computed daily and paid monthly at the following annual rates:
| | | |
| First $3.0 billion of average daily net assets | | 0.60 | % |
| Average daily net assets in excess of $3.0 billion | | 0.55 | % |
Effective October 1, 2007, the investment adviser has agreed in writing to further reduce its management fee to 0.50% of average daily net assets in excess of $5.0 billion. This written agreement will continue until modified by the fund’s Board of Trustees, but such agreement will continue at least until September 30, 2012. For the year ended October 31, 2009, the fund’s average daily net assets did not exceed $5.0 billion and therefore, the management fee was not reduced. The management fee incurred for the year ended October 31, 2009 was equivalent to an annual effective rate of 0.60% of the fund’s average daily net assets.
36
Notes to Financial Statements – continued
Distributor – MFS Fund Distributors, Inc. (MFD), a wholly-owned subsidiary of MFS, as distributor, received $361,343 for the year ended October 31, 2009, as its portion of the initial sales charge on sales of Class A shares of the fund.
The Board of Trustees has adopted a distribution plan for certain class shares pursuant to Rule 12b-1 of the Investment Company Act of 1940.
The fund’s distribution plan provides that the fund will pay MFD for services provided by MFD and financial intermediaries in connection with the distribution and servicing of certain share classes. One component of the plan is a distribution fee paid to MFD and another component of the plan is a service fee paid to MFD. MFD may subsequently pay all, or a portion, of the distribution and/or service fees to financial intermediaries.
Distribution Plan Fee Table:
| | | | | | | | | | |
| | | Distribution
Fee Rate (d) | | Service
Fee Rate (d) | | Total
Distribution
Plan (d) | | Annual
Effective
Rate (e) | | Distribution
and Service
Fee |
| Class A | | — | | 0.25% | | 0.25% | | 0.25% | | $3,933,296 |
| Class B | | 0.75% | | 0.25% | | 1.00% | | 1.00% | | 2,016,175 |
| Class C | | 0.75% | | 0.25% | | 1.00% | | 1.00% | | 2,633,697 |
| Class R1 | | 0.75% | | 0.25% | | 1.00% | | 1.00% | | 82,785 |
| Class R2 | | 0.25% | | 0.25% | | 0.50% | | 0.50% | | 257,701 |
| Class R3 | | — | | 0.25% | | 0.25% | | 0.25% | | 80,044 |
| Total Distribution and Service Fees | | | | | | | | $9,003,698 |
| (d) | In accordance with the distribution plan for certain classes, the fund pays distribution and/or service fees equal to these annual percentage rates of each class’ average daily net assets. The distribution and service fee rates disclosed by class represent the current rates in effect at the end of the reporting period. Any rate changes, if applicable, are detailed below. |
| (e) | The annual effective rates represent actual fees incurred under the distribution plan for the year ended October 31, 2009 based on each class’ average daily net assets. Prior to March 1, 2009, payment of the 0.10% annual Class A distribution fee was not in effect. Effective March 1, 2009, the 0.10% Class A annual distribution fee was eliminated. |
Certain Class A shares purchased prior to September 1, 2008 are subject to a contingent deferred sales charge (CDSC) in the event of a shareholder redemption within 12 months of purchase. Certain Class A shares purchased on or subsequent to September 1, 2008 are subject to a CDSC in the event of a shareholder redemption within 24 months of purchase. Class C shares are subject to a CDSC in the event of a shareholder redemption within 12 months of purchase. Class B shares are subject to a CDSC in the event of a shareholder redemption within six years of purchase. All contingent deferred sales charges are paid to MFD and during the year ended October 31, 2009, were as follows:
| | |
| | | Amount |
| Class A | | $3,068 |
| Class B | | 322,280 |
| Class C | | 55,073 |
37
Notes to Financial Statements – continued
Shareholder Servicing Agent – MFS Service Center, Inc. (MFSC), a wholly-owned subsidiary of MFS, receives a fee from the fund for its services as shareholder servicing agent calculated as a percentage of the average daily net assets of the fund as determined periodically under the supervision of the fund’s Board of Trustees. For the year ended October 31, 2009, the fee was $1,261,421, which equated to 0.0584% annually of the fund’s average daily net assets. MFSC also receives payment from the fund for out-of-pocket expenses, sub-accounting and other shareholder servicing costs which may be paid to affiliated and unaffiliated service providers. For the year ended October 31, 2009, these out-of-pocket expenses, sub-accounting and other shareholder servicing costs amounted to $2,616,682.
Administrator – MFS provides certain financial, legal, shareholder communications, compliance, and other administrative services to the fund. Under an administrative services agreement, the fund partially reimburses MFS the costs incurred to provide these services. The fund is charged an annual fixed amount of $17,500 plus a fee based on average daily net assets. The administrative services fee incurred for the year ended October 31, 2009 was equivalent to an annual effective rate of 0.0196% of the fund’s average daily net assets.
Trustees’ and Officers’ Compensation – The fund pays compensation to independent Trustees in the form of a retainer, attendance fees, and additional compensation to Board and Committee chairpersons. The fund does not pay compensation directly to Trustees or officers of the fund who are also officers of the investment adviser, all of whom receive remuneration for their services to the fund from MFS. Certain officers and Trustees of the fund are officers or directors of MFS, MFD, and MFSC.
Prior to December 31, 2001, the fund had an unfunded defined benefit plan (“DB plan”) for independent Trustees. As of December 31, 2001, the Board took action to terminate the DB plan with respect to then-current and any future independent Trustees, such that the DB Plan covers only certain of those former independent Trustees who retired on or before December 31, 2001. Effective January 1, 2002, accrued benefits under the DB Plan for then-current independent Trustees who continued were credited to an unfunded retirement deferral plan (the “Retirement Deferral plan”), which was established for and exists solely with respect to these credited amounts, and is not available for other deferrals by these or other independent Trustees. Although the Retirement Deferral plan is unfunded, amounts deferred under the plan are periodically adjusted for investment experience as if they had been invested in shares of the fund. The DB Plan resulted in a pension expense of $1,694 and the Retirement Deferral plan resulted in an expense of $2,309. Both amounts are included in independent Trustees’ compensation for the year ended
38
Notes to Financial Statements – continued
October 31, 2009. The liability for deferred retirement benefits payable to certain independent Trustees under both Plans amounted to $63,401 at October 31, 2009, and is included in payable for independent Trustees’ compensation on the Statement of Assets and Liabilities.
Other – This fund and certain other funds managed by MFS (the funds) have entered into services agreements (the Agreements) which provide for payment of fees by the funds to Tarantino LLC and Griffin Compliance LLC in return for the provision of services of an Independent Chief Compliance Officer (ICCO) and Assistant ICCO, respectively, for the funds. The ICCO and Assistant ICCO are officers of the funds and the sole members of Tarantino LLC and Griffin Compliance LLC, respectively. The funds can terminate the Agreements with Tarantino LLC and Griffin Compliance LLC at any time under the terms of the Agreements. For the year ended October 31, 2009, the aggregate fees paid by the fund to Tarantino LLC and Griffin Compliance LLC were $25,981 and are included in miscellaneous expense on the Statement of Operations. MFS has agreed to reimburse the fund for a portion of the payments made by the fund in the amount of $13,476, which is shown as a reduction of total expenses in the Statement of Operations. Additionally, MFS has agreed to bear all expenses associated with office space, other administrative support, and supplies provided to the ICCO and Assistant ICCO.
The fund may invest in a money market fund managed by MFS which seeks a high level of current income consistent with preservation of capital and liquidity. Income earned on this investment is included in dividends from underlying funds on the Statement of Operations. This money market fund does not pay a management fee to MFS.
Purchases and sales of investments, other than U.S. Government securities, purchased option transactions, and short-term obligations, aggregated $1,509,396,611 and $1,584,439,878, respectively.
39
Notes to Financial Statements – continued
| (5) | | Shares of Beneficial Interest |
The fund’s Declaration of Trust permits the Trustees to issue an unlimited number of full and fractional shares of beneficial interest. Transactions in fund shares were as follows:
| | | | | | | | | | | | |
| | | Year ended
10/31/09 | | | Year ended
10/31/08 | |
| | | Shares | | | Amount | | | Shares | | | Amount | |
| Shares sold | | | | | | | | | | | | |
Class A | | 28,710,451 | | | $349,659,014 | | | 56,236,591 | | | $1,015,228,438 | |
Class B | | 3,759,474 | | | 44,766,933 | | | 3,998,900 | | | 70,270,001 | |
Class C | | 4,658,560 | | | 56,743,573 | | | 6,922,816 | | | 124,449,850 | |
Class I | | 2,298,091 | | | 30,803,996 | | | 317,220 | | | 5,713,767 | |
Class R (b) | | — | | | — | | | 179,034 | | | 3,394,811 | |
Class R1 | | 252,080 | | | 3,037,582 | | | 350,149 | | | 6,342,410 | |
Former Class R2 (b) | | — | | | — | | | 209,306 | | | 3,906,716 | |
Class R2 | | 1,672,441 | | | 20,467,833 | | | 2,852,777 | | | 51,689,815 | |
Class R3 | | 1,060,781 | | | 13,219,715 | | | 1,424,204 | | | 24,912,622 | |
Class R4 | | 661,736 | | | 7,764,191 | | | 427,961 | | | 6,713,150 | |
| | 43,073,614 | | | $526,462,837 | | | 72,918,958 | | | $1,312,621,580 | |
| | | | |
| Shares issued to shareholders in reinvestment of distributions | | | | | | | | | | | | |
Class A | | 5,127,121 | | | $61,977,467 | | | 8,965,810 | | | $167,763,980 | |
Class B | | 544,247 | | | 6,483,480 | | | 1,640,480 | | | 31,038,125 | |
Class C | | 614,254 | | | 7,382,867 | | | 1,098,555 | | | 20,634,291 | |
Class I | | 43,348 | | | 529,017 | | | 72,644 | | | 1,363,876 | |
Class R (b) | | — | | | — | | | 7,776 | | | 150,132 | |
Class R1 | | 25,676 | | | 308,835 | | | 35,962 | | | 671,126 | |
Former Class R2 (b) | | — | | | — | | | 17,697 | | | 339,727 | |
Class R2 | | 168,616 | | | 2,038,866 | | | 221,075 | | | 4,102,653 | |
Class R3 | | 117,158 | | | 1,419,713 | | | 173,683 | | | 3,232,249 | |
Class R4 | | 20,713 | | | 254,930 | | | 6,678 | | | 122,015 | |
| | 6,661,133 | | | $80,395,175 | | | 12,240,360 | | | $229,418,174 | |
| | | | |
| Shares reacquired | | | | | | | | | | | | |
Class A | | (38,036,443 | ) | | $(453,940,383 | ) | | (52,652,995 | ) | | $(859,714,560 | ) |
Class B | | (9,934,525 | ) | | (115,849,498 | ) | | (14,460,850 | ) | | (250,419,118 | ) |
Class C | | (5,331,483 | ) | | (62,204,187 | ) | | (5,667,599 | ) | | (91,242,202 | ) |
Class I | | (348,235 | ) | | (4,477,800 | ) | | (476,354 | ) | | (8,181,195 | ) |
Class R (b) | | — | | | — | | | (532,998 | ) | | (10,099,348 | ) |
Class R1 | | (214,452 | ) | | (2,574,317 | ) | | (181,997 | ) | | (3,029,072 | ) |
Former Class R2 (b) | | — | | | — | | | (477,118 | ) | | (8,879,029 | ) |
Class R2 | | (1,455,183 | ) | | (17,511,633 | ) | | (1,423,170 | ) | | (23,610,418 | ) |
Class R3 | | (921,442 | ) | | (10,964,705 | ) | | (1,000,949 | ) | | (16,181,386 | ) |
Class R4 | | (217,357 | ) | | (2,624,977 | ) | | (106,748 | ) | | (1,683,296 | ) |
| | (56,459,120 | ) | | $(670,147,500 | ) | | (76,980,778 | ) | | $(1,273,039,624 | |
40
Notes to Financial Statements – continued
| | | | | | | | | | | | |
| | | Year ended
10/31/09 | | | Year ended
10/31/08 | |
| | | Shares | | | Amount | | | Shares | | | Amount | |
| Net change | | | | | | | | | | | | |
Class A | | (4,198,871 | ) | | $(42,303,902 | ) | | 12,549,406 | | | $323,277,858 | |
Class B | | (5,630,804 | ) | | (64,599,085 | ) | | (8,821,470 | ) | | (149,110,992 | ) |
Class C | | (58,669 | ) | | 1,922,253 | | | 2,353,772 | | | 53,841,939 | |
Class I | | 1,993,204 | | | 26,855,213 | | | (86,490 | ) | | (1,103,552 | ) |
Class R (b) | | — | | | — | | | (346,188 | ) | | (6,554,405 | ) |
Class R1 | | 63,304 | | | 772,100 | | | 204,114 | | | 3,984,464 | |
Former Class R2 (b) | | — | | | — | | | (250,115 | ) | | (4,632,586 | ) |
Class R2 | | 385,874 | | | 4,995,066 | | | 1,650,682 | | | 32,182,050 | |
Class R3 | | 256,497 | | | 3,674,723 | | | 596,938 | | | 11,963,485 | |
Class R4 | | 465,092 | | | 5,394,144 | | | 327,891 | | | 5,151,869 | |
| | (6,724,373 | ) | | $(63,289,488 | ) | | 8,178,540 | | | $269,000,130 | |
| (b) | At the close of business on April 18, 2008, Class R and Class R2 shares converted into Class R3 shares. Following this conversion, Class R3, Class R4, and Class R5 shares were renamed Class R2, Class R3, and Class R4 shares, respectively. |
Class W shares were not available for sale during the period. Please see the fund’s Class W prospectus for details.
The fund and certain other funds managed by MFS participate in a $1.1 billion unsecured committed line of credit, subject to a $1 billion sublimit, provided by a syndication of banks under a credit agreement. Borrowings may be made for temporary financing needs. Interest is charged to each fund, based on its borrowings, generally at a rate equal to the higher of the Federal Reserve funds rate or one month LIBOR plus an agreed upon spread. A commitment fee, based on the average daily, unused portion of the committed line of credit, is allocated among the participating funds at the end of each calendar quarter. In addition, the fund and other funds managed by MFS have established unsecured uncommitted borrowing arrangements with certain banks for temporary financing needs. Interest is charged to each fund, based on its borrowings, at a rate equal to the Federal Reserve funds rate plus an agreed upon spread. For the year ended October 31, 2009, the fund’s commitment fee and interest expense were $30,032 and $33, respectively, and are included in miscellaneous expense on the Statement of Operations.
41
Notes to Financial Statements – continued
| (7) | | Transactions in Underlying Funds-Affiliated Issuers |
An affiliated issuer may be considered one in which the fund owns 5% or more of the outstanding voting securities, or a company which is under common control. For the purposes of this report, the fund assumes the following to be affiliated issuers:
| | | | | | | | | |
| Underlying Funds | | Beginning
Shares/Par
Amount | | Acquisitions
Shares/Par
Amount | | Dispositions
Shares/Par
Amount | | | Ending
Shares/Par
Amount |
MFS Institutional Money
Market Portfolio | | 45,394,299 | | 668,505,189 | | (633,199,950 | ) | | 80,699,538 |
| | | | |
| Underlying Funds | | Realized
Gain (Loss) | | Capital Gain
Distributions | | Dividend
Income | | | Ending
Value |
MFS Institutional Money
Market Portfolio | | $— | | $— | | $157,165 | | | $80,699,538 |
42
REPORT OF INDEPENDENT REGISTERED PUBLIC ACCOUNTING FIRM
To the Trustees of MFS Series Trust VI and Shareholders of MFS Utilities Fund:
We have audited the accompanying statement of assets and liabilities of MFS Utilities Fund (the Fund), (one of the portfolios comprising MFS Series Trust VI), including the portfolio of investments, as of October 31, 2009, and the related statement of operations for the year then ended, the statements of changes in net assets for each of the two years in the period then ended, and the financial highlights for each of the periods indicated therein. These financial statements and financial highlights are the responsibility of the Fund’s management. Our responsibility is to express an opinion on these financial statements and financial highlights based on our audits.
We conducted our audits in accordance with the standards of the Public Company Accounting Oversight Board (United States). Those standards require that we plan and perform the audit to obtain reasonable assurance about whether the financial statements and financial highlights are free of material misstatement. We were not engaged to perform an audit of the Fund’s internal control over financial reporting. Our audits included consideration of internal control over financial reporting as a basis for designing audit procedures that are appropriate in the circumstances, but not for the purpose of expressing an opinion on the effectiveness of the Fund’s internal control over financial reporting. Accordingly, we express no such opinion. An audit also includes examining, on a test basis, evidence supporting the amounts and disclosures in the financial statements and financial highlights, assessing the accounting principles used and significant estimates made by management, and evaluating the overall financial statement presentation. Our procedures included confirmation of securities owned as of October 31, 2009, by correspondence with the Fund’s custodian and brokers or by other appropriate auditing procedures where replies from brokers were not received. We believe that our audits provide a reasonable basis for our opinion.
In our opinion, the financial statements and financial highlights referred to above present fairly, in all material respects, the financial position of MFS Utilities Fund at October 31, 2009, the results of its operations for the year then ended, the changes in its net assets for each of the two years in the period then ended, and its financial highlights for each of the periods indicated therein, in conformity with U.S. generally accepted accounting principles.

Boston, Massachusetts
December 17, 2009
43
TRUSTEES AND OFFICERS — IDENTIFICATION AND BACKGROUND
The Trustees and officers of the Trust, as of December 1, 2009, are listed below, together with their principal occupations during the past five years. (Their titles may have varied during that period.) The address of each Trustee and officer is 500 Boylston Street, Boston, Massachusetts 02116.
| | | | | | |
Name, Date of Birth | | Position(s) Held
with Fund | | Trustee/Officer
Since (h) | | Principal Occupations During
the Past Five Years & Other
Directorships (j) |
| INTERESTED TRUSTEES | | | | |
Robert J. Manning (k)
(born 10/20/63) | | Trustee | | February 2004 | | Massachusetts Financial Services Company, Chief Executive Officer, President, Chief Investment Officer and Director |
Robert C. Pozen (k)
(born 8/08/46) | | Trustee | | February 2004 | | Massachusetts Financial Services Company, Chairman (since February 2004); Medtronic, Inc, (medical devices), Director (since 2004); Harvard Business School (education), Senior Lecturer (since 2008); Bell Canada Enterprises (telecommunications), Director (until February 2009); The Bank of New York, Director (finance), (March 2004 to May 2005); Telesat (satellite communications), Director (until November 2007) |
| INDEPENDENT TRUSTEES | | | | |
David H. Gunning
(born 5/30/42) | | Trustee and Chair of Trustees | | January 2004 | | Retired; Cleveland-Cliffs Inc. (mining products and service provider), Vice Chairman/Director (until May 2007); Lincoln Electric Holdings, Inc. (welding equipment manufacturer), Director; Development Alternatives, Inc. (consulting), Director/Non Executive Chairman; Southwest Gas Corp. (natural gas distribution), Director (until May 2004); Portman Limited (mining), Director (until 2008) |
44
Trustees and Officers – continued
| | | | | | |
Name, Date of Birth | | Position(s) Held
with Fund | | Trustee/Officer
Since (h) | | Principal Occupations During
the Past Five Years & Other
Directorships (j) |
Robert E. Butler (n) (born 11/29/41) | | Trustee | | January 2006 | | Consultant – investment company industry regulatory and compliance matters (since July 2002); PricewaterhouseCoopers LLP (professional services firm), Partner (until 2002) |
Lawrence H. Cohn, M.D.
(born 3/11/37) | | Trustee | | June 1989 | | Brigham and Women’s Hospital, Senior Cardiac Surgeon (since 2005); Harvard Medical School, Professor of Cardiac Surgery; Partners HealthCare, Physician Director of Medical Device Technology (since 2006); Brigham and Women’s Hospital, Chief of Cardiac Surgery (until 2005) |
Maureen R. Goldfarb
(born 4/6/55) | | Trustee | | January 2009 | | Private investor; John Hancock Financial Services, Inc., Executive Vice President (until 2004); John Hancock Mutual Funds, Trustee and Chief Executive Officer (until 2004) |
William R. Gutow
(born 9/27/41) | | Trustee | | December 1993 | | Private investor and real estate consultant; Capital Entertainment Management Company (video franchise), Vice Chairman; Atlantic Coast Tan (tanning salons), Vice Chairman (until 2007); Texas Donuts (donut franchise), Vice Chairman (until 2009) |
Michael Hegarty
(born 12/21/44) | | Trustee | | December 2004 | | Private investor; AXA Financial (financial services and insurance), Vice Chairman and Chief Operating Officer (until 2001); The Equitable Life Assurance Society (insurance), President and Chief Operating Officer (until 2001) |
J. Atwood Ives
(born 5/01/36) | | Trustee | | February 1992 | | Private investor; KeySpan Corporation (energy related services), Director (until 2004) |
45
Trustees and Officers – continued
| | | | | | |
Name, Date of Birth | | Position(s) Held
with Fund | | Trustee/Officer
Since (h) | | Principal Occupations During
the Past Five Years & Other
Directorships (j) |
John P. Kavanaugh
(born 11/4/54) | | Trustee | | January 2009 | | Private investor; The Hanover Insurance Group, Inc., Vice President and Chief Investment Officer (until 2006); Allmerica Investment Trust, Allmerica Securities Trust and Opus Investment Trust (investment companies), Chairman, President and Trustee (until 2006) |
J. Dale Sherratt
(born 9/23/38) | | Trustee | | June 1989 | | Insight Resources, Inc. (acquisition planning specialists), President; Wellfleet Investments (investor in health care companies), Managing General Partner |
Laurie J. Thomsen
(born 8/05/57) | | Trustee | | March 2005 | | New Profit, Inc. (venture philanthropy), Executive Partner (since 2006); Private investor; The Travelers Companies (commercial property liability insurance), Director; Prism Venture Partners (venture capital), Co-founder and General Partner (until June 2004) |
Robert W. Uek
(born 5/18/41) | | Trustee | | January 2006 | | Consultant to investment company industry; PricewaterhouseCoopers LLP (professional services firm), Partner (until 1999); TT International Funds (mutual fund complex), Trustee (until 2005); Hillview Investment Trust II Funds (mutual fund complex), Trustee (until 2005) |
| OFFICERS | | | | | | |
Maria F. Dwyer (k)
(born 12/01/58) | | President | | March 2004 | | Massachusetts Financial Services Company, Executive Vice President and Chief Regulatory Officer (since March 2004) Chief Compliance Officer (since December 2006); Fidelity Management & Research Company, Vice President (prior to March 2004); Fidelity Group of Funds, President and Treasurer (until March 2004) |
46
Trustees and Officers – continued
| | | | | | |
Name, Date of Birth | | Position(s) Held
with Fund | | Trustee/Officer
Since (h) | | Principal Occupations During
the Past Five Years & Other
Directorships (j) |
Christopher R. Bohane (k)
(born 1/18/74) | | Assistant Secretary and Assistant Clerk | | July 2005 | | Massachusetts Financial Services Company, Vice President and Senior Counsel |
John M. Corcoran (k)
(born 04/13/65) | | Treasurer | | October 2008 | | Massachusetts Financial Services Company, Senior Vice President (since October 2008); State Street Bank and Trust (financial services provider), Senior Vice President, (until September 2008) |
Ethan D. Corey (k)
(born 11/21/63) | | Assistant Secretary and Assistant Clerk | | July 2005 | | Massachusetts Financial Services Company, Senior Vice President and Associate General Counsel (since 2004); Dechert LLP (law firm), Counsel (prior to December 2004) |
David L. DiLorenzo (k)
(born 8/10/68) | | Assistant Treasurer | | July 2005 | | Massachusetts Financial Services Company, Vice President (since June 2005); JP Morgan Investor Services, Vice President (until June 2005) |
Timothy M. Fagan (k)
(born 7/10/68) | | Assistant Secretary and Assistant Clerk | | September 2005 | | Massachusetts Financial Services Company, Vice President and Senior Counsel (since September 2005); John Hancock Advisers, LLC, Vice President, Senior Attorney and Chief Compliance Officer (until August 2005) |
Mark D. Fischer (k)
(born 10/27/70) | | Assistant Treasurer | | July 2005 | | Massachusetts Financial Services Company, Vice President (since May 2005); JP Morgan Investment Management Company, Vice President (until May 2005) |
47
Trustees and Officers – continued
| | | | | | |
Name, Date of Birth | | Position(s) Held
with Fund | | Trustee/Officer
Since (h) | | Principal Occupations During
the Past Five Years & Other
Directorships (j) |
Robyn L. Griffin
(born 7/04/75) | | Assistant Independent Chief Compliance Officer | | August 2008 | | Griffin Compliance LLC (provider of compliance services), Principal (since August 2008); State Street Corporation (financial services provider), Mutual Fund Administration Assistant Vice President (October 2006 – July 2008); Liberty Mutual Group (insurance), Personal Market Assistant Controller (April 2006 – October 2006); Deloitte & Touche LLP (professional services firm), Senior Manager (prior to April 2006) |
Brian E. Langenfeld (k)
(born 3/07/73) | | Assistant Secretary and Assistant Clerk | | June 2006 | | Massachusetts Financial Services Company, Vice President and Senior Counsel (since May 2006); John Hancock Advisers, LLC, Assistant Vice President and Counsel (until April 2006) |
Ellen Moynihan (k)
(born 11/13/57) | | Assistant Treasurer | | April 1997 | | Massachusetts Financial Services Company, Senior Vice President |
Susan S. Newton (k)
(born 3/07/50) | | Assistant Secretary and Assistant Clerk | | May 2005 | | Massachusetts Financial Services Company, Senior Vice President and Associate General Counsel (since April 2005); John Hancock Advisers, LLC, Senior Vice President, Secretary and Chief Legal Officer (until April 2005) |
Susan A. Pereira (k)
(born 11/05/70) | | Assistant Secretary and Assistant Clerk | | July 2005 | | Massachusetts Financial Services Company, Vice President and Senior Counsel (since June 2004); Bingham McCutchen LLP (law firm), Associate (until June 2004) |
Mark N. Polebaum (k)
(born 5/01/52) | | Secretary and Clerk | | January 2006 | | Massachusetts Financial Services Company, Executive Vice President, General Counsel and Secretary (since January 2006); Wilmer Cutler Pickering Hale and Dorr LLP (law firm), Partner (until January 2006) |
48
Trustees and Officers – continued
| | | | | | |
Name, Date of Birth | | Position(s) Held
with Fund | | Trustee/Officer
Since (h) | | Principal Occupations During
the Past Five Years & Other
Directorships (j) |
Frank L. Tarantino
(born 3/07/44) | | Independent Chief Compliance Officer | | June 2004 | | Tarantino LLC (provider of compliance services), Principal (since June 2004); CRA Business Strategies Group (consulting services), Executive Vice President (until June 2004) |
Richard S. Weitzel (k)
(born 7/16/70) | | Assistant Secretary and Assistant Clerk | | October 2007 | | Massachusetts Financial Services Company, Vice President and Assistant General Counsel (since 2004); Massachusetts Department of Business and Technology, General Counsel (until April 2004) |
James O. Yost (k)
(born 6/12/60) | | Assistant Treasurer | | September 1990 | | Massachusetts Financial Services Company, Senior Vice President |
| (h) | Date first appointed to serve as Trustee/officer of an MFS fund. Each Trustee has served continuously since appointment unless indicated otherwise. For the period from December 15, 2004 until February 22, 2005, Messrs. Pozen and Manning served as Advisory Trustees. For the period March 2008 until October 2008, Ms. Dwyer served as Treasurer of the Funds. |
| (j) | Directorships or trusteeships of companies required to report to the Securities and Exchange Commission (i.e., “public companies”). |
| (k) | “Interested person” of the Trust within the meaning of the Investment Company Act of 1940 (referred to as the 1940 Act), which is the principal federal law governing investment companies like the fund, as a result of position with MFS. The address of MFS is 500 Boylston Street, Boston, Massachusetts 02116. |
| (n) | In 2004 and 2005, Mr. Butler provided consulting services to the independent compliance consultant retained by MFS pursuant to its settlement with the SEC concerning market timing and related matters. The terms of that settlement required that compensation and expenses related to the independent compliance consultant be borne exclusively by MFS and, therefore, MFS paid Mr. Butler for the services he rendered to the independent compliance consultant. In 2004 and 2005, MFS paid Mr. Butler a total of $351,119.29. |
Each Trustee (except Messrs. Butler, Kavanaugh and Uek and Ms. Goldfarb) has been elected by shareholders and each Trustee and officer holds office until his or her successor is chosen and qualified or until his or her earlier death, resignation, retirement or removal. The Trust held a shareholders’ meeting in 2005 to elect Trustees, and will hold a shareholders’ meeting at least once every five years thereafter, to elect Trustees. Messrs. Butler, Kavanaugh, Sherratt, Uek and Ms. Thomsen are members of the Trust’s Audit Committee.
Each of the Fund’s Trustees and officers holds comparable positions with certain other funds of which MFS or a subsidiary is the investment adviser or distributor, and, in the case of the officers, with certain affiliates of MFS. As of January 1, 2009, the Trustees served as board members of 104 funds within the MFS Family of Funds.
49
Trustees and Officers – continued
The Statement of Additional Information for the Fund and further information about the Trustees are available without charge upon request by calling 1-800-225-2606.
| | |
| Investment Adviser | | Custodian |
Massachusetts Financial Services Company
500 Boylston Street, Boston, MA 02116-3741 | | JPMorgan Chase Bank
One Chase Manhattan Plaza, New York, NY 10081 |
| Distributor | | Independent Registered Public Accounting Firm |
MFS Fund Distributors, Inc.
500 Boylston Street, Boston, MA 02116-3741 | | Ernst & Young LLP
200 Clarendon Street, Boston, MA 02116 |
| Portfolio Managers | | |
Robert Persons Maura Shaughnessy | | |
50
BOARD REVIEW OF INVESTMENT ADVISORY AGREEMENT
The Investment Company Act of 1940 requires that both the full Board of Trustees and a majority of the non-interested (“independent”) Trustees, voting separately, annually approve the continuation of the Fund’s investment advisory agreement with MFS. The Trustees consider matters bearing on the Fund and its advisory arrangements at their meetings throughout the year, including a review of performance data at each regular meeting. In addition, the independent Trustees met several times over the course of three months beginning in May and ending in July, 2009 (“contract review meetings”) for the specific purpose of considering whether to approve the continuation of the investment advisory agreement for the Fund and the other investment companies that the Board oversees (the “MFS Funds”). The independent Trustees were assisted in their evaluation of the Fund’s investment advisory agreement by independent legal counsel, from whom they received separate legal advice and with whom they met separately from MFS during various contract review meetings. The independent Trustees were also assisted in this process by the MFS Funds’ Independent Chief Compliance Officer, a full-time senior officer appointed by and reporting to the independent Trustees.
In connection with their deliberations regarding the continuation of the investment advisory agreement, the Trustees, including the independent Trustees, considered such information and factors as they believed, in light of the legal advice furnished to them and their own business judgment, to be relevant. The investment advisory agreement for the Fund was considered separately, although the Trustees also took into account the common interests of all MFS Funds in their review. As described below, the Trustees considered the nature, quality, and extent of the various investment advisory, administrative, and shareholder services performed by MFS under the existing investment advisory agreement and other arrangements with the Fund.
In connection with their contract review meetings, the Trustees received and relied upon materials that included, among other items: (i) information provided by Lipper Inc., an independent third party, on the investment performance of the Fund for various time periods ended December 31, 2008 and the investment performance of a group of funds with substantially similar investment classifications/objectives (the “Lipper performance universe”), (ii) information provided by Lipper Inc. on the Fund’s advisory fees and other expenses and the advisory fees and other expenses of comparable funds identified by Lipper Inc. (the “Lipper expense group”), (iii) information provided by MFS on the advisory fees of comparable portfolios of other clients of MFS, including institutional separate accounts and other clients, (iv) information as to whether and to what extent applicable expense waivers, reimbursements or fee “breakpoints” are observed for the Fund,
51
Board Review of Investment Advisory Agreement – continued
(v) information regarding MFS’ financial results and financial condition, including MFS’ and certain of its affiliates’ estimated profitability from services performed for the Fund and the MFS Funds as a whole, (vi) MFS’ views regarding the outlook for the mutual fund industry and the strategic business plans of MFS, (vii) descriptions of various functions performed by MFS for the Funds, such as compliance monitoring and portfolio trading practices, and (viii) information regarding the overall organization of MFS, including information about MFS’ senior management and other personnel providing investment advisory, administrative and other services to the Fund and the other MFS Funds. The comparative performance, fee and expense information prepared and provided by Lipper Inc. was not independently verified and the independent Trustees did not independently verify any information provided to them by MFS.
The Trustees’ conclusion as to the continuation of the investment advisory agreement was based on a comprehensive consideration of all information provided to the Trustees and not the result of any single factor. Some of the factors that figured particularly in the Trustees’ deliberations are described below, although individual Trustees may have evaluated the information presented differently from one another, giving different weights to various factors. It is also important to recognize that the fee arrangements for the Fund and other MFS Funds are the result of years of review and discussion between the independent Trustees and MFS, that certain aspects of such arrangements may receive greater scrutiny in some years than in others, and that the Trustees’ conclusions may be based, in part, on their consideration of these same arrangements during the course of the year and in prior years.
Based on information provided by Lipper Inc., the Trustees reviewed the Fund’s total return investment performance as well as the performance of peer groups of funds over various time periods. The Trustees placed particular emphasis on the total return performance of the Fund’s Class A shares in comparison to the performance of funds in its Lipper performance universe over the three-year period ended December 31, 2008, which the Trustees believed was a long enough period to reflect differing market conditions. The total return performance of the Fund’s Class A shares was in the 2nd quintile relative to the other funds in the universe for this three-year period (the 1st quintile being the best performers and the 5th quintile being the worst performers). The total return performance of the Fund’s Class A shares was in the 5th quintile for the one-year period and the 1st quintile for the five-year period ended December 31, 2008 relative to the Lipper performance universe. Because of the passage of time, these performance results are likely to differ from the performance results for more recent periods, including those shown elsewhere in this report.
52
Board Review of Investment Advisory Agreement – continued
In the course of their deliberations, the Trustees took into account information provided by MFS in connection with the contract review meetings, as well as during investment review meetings conducted with portfolio management personnel during the course of the year regarding the Fund’s performance. After reviewing these and related factors, the Trustees concluded, within the context of their overall conclusions regarding the investment advisory agreement, that they were satisfied with MFS’ responses and efforts relating to investment performance.
In assessing the reasonableness of the Fund’s advisory fee, the Trustees considered, among other information, the Fund’s advisory fee and the total expense ratio of the Fund’s Class A shares as a percentage of average daily net assets and the advisory fee and total expense ratios of peer groups of funds based on information provided by Lipper Inc. The Trustees considered that, according to the Lipper data (which takes into account any fee reductions or expense limitations that were in effect during the Fund’s last fiscal year), the Fund’s effective advisory fee rate and total expense ratio were each approximately at the Lipper expense group median.
The Trustees also considered the advisory fees charged by MFS to institutional accounts. In comparing these fees, the Trustees considered information provided by MFS as to the generally broader scope of services provided by MFS to the Fund in comparison to institutional accounts, the higher demands placed on MFS’ investment personnel and trading infrastructure as a result of the daily cash in-flows and out-flows of the Fund, and the impact on MFS and expenses associated with the more extensive regulatory regime to which the Fund is subject in comparison to institutional accounts.
The Trustees also considered whether the Fund is likely to benefit from any economies of scale in the management of the Fund in the event of growth in assets of the Fund. They noted that the Fund’s advisory fee rate schedule is currently subject to a contractual breakpoint that reduces the Fund’s advisory fee rate on average daily net assets over $3.0 billion, and that MFS has agreed in writing to reduce its advisory fee on average daily net assets over $5.0 billion, which may not be changed without the Trustees’ approval. The Trustees concluded that the existing breakpoints were sufficient to allow the Fund to benefit from economies of scale as its assets grow.
The Trustees also considered information prepared by MFS relating to MFS’ costs and profits with respect to the Fund, the MFS Funds considered as a group, and other investment companies and accounts advised by MFS, as well as MFS’ methodologies used to determine and allocate its costs to the MFS Funds, the Fund and other accounts and products for purposes of estimating profitability.
After reviewing these and other factors described herein, the Trustees concluded, within the context of their overall conclusions regarding the
53
Board Review of Investment Advisory Agreement – continued
investment advisory agreement, that the advisory fees charged to the Fund represent reasonable compensation in light of the services being provided by MFS to the Fund.
In addition, the Trustees considered MFS’ resources and related efforts to continue to retain, attract and motivate capable personnel to serve the Fund. The Trustees also considered current and developing conditions in the financial services industry, including the entry into the industry of large and well-capitalized companies which are spending, and appear to be prepared to continue to spend, substantial sums to engage personnel and to provide services to competing investment companies. In this regard, the Trustees also considered the financial resources of MFS and its ultimate parent, Sun Life Financial Inc. The Trustees also considered the advantages and possible disadvantages to the Fund of having an adviser that also serves other investment companies as well as other accounts.
The Trustees also considered the nature, quality, cost, and extent of administrative, transfer agency, and distribution services provided to the Fund by MFS and its affiliates under agreements and plans other than the investment advisory agreement, including any 12b-1 fees the Fund pays to MFS Fund Distributors, Inc., an affiliate of MFS. The Trustees also considered the nature, extent and quality of certain other services MFS performs or arranges for on the Fund’s behalf, which may include securities lending programs, directed expense payment programs, class action recovery programs, and MFS’ interaction with third-party service providers, principally custodians and sub-custodians. The Trustees concluded that the various non-advisory services provided by MFS and its affiliates on behalf of the Funds were satisfactory.
The Trustees also considered benefits to MFS from the use of the Fund’s portfolio brokerage commissions, if applicable, to pay for investment research, and various other factors. Additionally, the Trustees considered so-called “fall-out benefits” to MFS such as reputational value derived from serving as investment manager to the Fund.
Based on their evaluation of factors that they deemed to be material, including those factors described above, the Board of Trustees, including a majority of the independent Trustees, concluded that the Fund’s investment advisory agreement with MFS should be continued for an additional one-year period, commencing August 1, 2009.
A discussion regarding the Board’s most recent review and renewal of the fund’s Investment Advisory Agreement with MFS is available by clicking on the fund’s name under “Mutual Funds” in the “Products and Performance” section of the MFS Web site (mfs.com).
54
PROXY VOTING POLICIES AND INFORMATION
A general description of the MFS funds’ proxy voting policies and procedures is available without charge, upon request, by calling
1-800-225-2606, by visiting the Proxy Voting section of mfs.com or by visiting the SEC’s Web site at http://www.sec.gov.
Information regarding how the fund voted proxies relating to portfolio securities during the most recent twelve-month period ended June 30 is available without charge by visiting the Proxy Voting section of mfs.com or by visiting the SEC’s Web site at http://www.sec.gov.
QUARTERLY PORTFOLIO DISCLOSURE
The fund will file a complete schedule of portfolio holdings with the Securities and Exchange Commission (the Commission) for the first and third quarters of each fiscal year on Form N-Q. The fund’s Form N-Q may be reviewed and copied at the:
Public Reference Room
Securities and Exchange Commission
100 F Street, NE, Room 1580
Washington, D.C. 20549
Information on the operation of the Public Reference Room may be obtained by calling the Commission at 1-800-SEC-0330. The fund’s Form N-Q is available on the EDGAR database on the Commission’s Internet Web site at http://www.sec.gov, and copies of this information may be obtained, upon payment of a duplicating fee, by electronic request at the following e-mail address: publicinfo@sec.gov or by writing the Public Reference Section at the above address.
A shareholder can also obtain the quarterly portfolio holdings report at mfs.com.
FURTHER INFORMATION
From time to time, MFS may post important information about the fund or the MFS funds on the MFS web site (mfs.com). This information is available by visiting the “News & Commentary” section of mfs.com or by clicking on the fund’s name under “Mutual Funds” in the “Products and Performance” section of mfs.com.
FEDERAL TAX INFORMATION (unaudited)
The fund will notify shareholders of amounts for use in preparing 2009 income tax forms in January 2010. The following information is provided pursuant to provisions of the Internal Revenue Code.
The fund designates the maximum amount allowable as qualified dividend income eligible for the 15% tax rate.
The fund designates $14,501,000 as capital gain dividends paid during the fiscal year.
For corporate shareholders, 58.36% of the ordinary income dividends paid during the fiscal year qualify for the corporate dividends received deduction.
55
MFS® PRIVACY NOTICE
Privacy is a concern for every investor today. At MFS Investment Management® and the MFS funds, we take this concern very seriously. We want you to understand our policies about the investment products and services that we offer, and how we protect the nonpublic personal information of investors who have a direct relationship with us and our wholly owned subsidiaries.
Throughout our business relationship, you provide us with personal information. We maintain information and records about you, your investments, and the services you use. Examples of the nonpublic personal information we maintain include
| | Ÿ | | data from investment applications and other forms |
| | Ÿ | | share balances and transactional history with us, our affiliates, or others |
| | Ÿ | | facts from a consumer reporting agency |
We do not disclose any nonpublic personal information about our customers or former customers to anyone, except as permitted by law. We may share nonpublic personal information with third parties or certain of our affiliates in connection with servicing your account or processing your transactions. We may share information with companies or financial institutions that perform marketing services on our behalf or with other financial institutions with which we have joint marketing arrangements, subject to any legal requirements.
Authorization to access your nonpublic personal information is limited to appropriate personnel who provide products, services, or information to you. We maintain physical, electronic, and procedural safeguards to help protect the personal information we collect about you.
If you have any questions about the MFS privacy policy, please call 1-800-225-2606 any business day.
Note: If you own MFS products or receive MFS services in the name of a third party such as a bank or broker-dealer, their privacy policy may apply to you instead of ours.
56
CONTACT US
Web site
mfs.com
MFS TALK
1-800-637-8255
24 hours a day
Account service and literature
Shareholders
1-800-225-2606
Investment professionals
1-800-343-2829
Retirement plan services
1-800-637-1255
Mailing address
MFS Service Center, Inc.
P.O. Box 55824
Boston, MA 02205-5824
Overnight mail
MFS Service Center, Inc.
c/o Boston Financial Data Services
30 Dan Road
Canton, MA 02021-2809

Save paper with eDelivery. MFS® will send you prospectuses, reports, and proxies directly via e-mail so you will get information faster with less mailbox clutter. To sign up: 1. go to mfs.com. 2. log in via MFS® Access. 3. select eDelivery. If you own your MFS fund shares through a financial institution or a retirement plan, MFS® TALK, MFS Access, and eDelivery may not be available to you.

The Registrant has adopted a Code of Ethics pursuant to Section 406 of the Sarbanes-Oxley Act and as defined in Form N-CSR that applies to the Registrant’s principal executive officer and principal financial and accounting officer. The Registrant has not amended any provision in its Code of Ethics (the “Code”) that relates to an element of the Code’s definitions enumerated in paragraph (b) of Item 2 of this Form N-CSR.
A copy of the Code of Ethics is filed as an exhibit to this Form N-CSR.
| ITEM 3. | AUDIT COMMITTEE FINANCIAL EXPERT. |
Messrs. Robert E. Butler, John P. Kavanaugh and Robert W. Uek and Ms. Laurie J. Thomsen, members of the Audit Committee, have been determined by the Board of Trustees in their reasonable business judgment to meet the definition of “audit committee financial expert” as such term is defined in Form N-CSR. In addition, Messrs. Butler, Kavanaugh and Uek and Ms. Thomsen are “independent” members of the Audit Committee (as such term has been defined by the Securities and Exchange Commission in regulations implementing Section 407 of the Sarbanes-Oxley Act of 2002). The Securities and Exchange Commission has stated that the designation of a person as an audit committee financial expert pursuant to this Item 3 on the Form N-CSR does not impose on such a person any duties, obligations or liability that are greater than the duties, obligations or liability imposed on such person as a member of the Audit Committee and the Board of Trustees in the absence of such designation or identification.
| ITEM 4. | PRINCIPAL ACCOUNTANT FEES AND SERVICES. |
Items 4(a) through 4(d) and 4(g):
The Board of Trustees has appointed Ernst & Young LLP (“E&Y”) to serve as independent accountants to the series of the Registrant (the series referred to collectively as the “Funds” and singularly as a “Fund”). The tables below set forth the audit fees billed to the Funds as well as fees for non-audit services provided to the Funds and/or to the Fund’s investment adviser, Massachusetts Financial Services Company (“MFS”) and to various entities either controlling, controlled by, or under common control with MFS that provide ongoing services to the Fund (“MFS Related Entities”).
For the fiscal years ended October 31, 2009 and 2008, audit fees billed to the Funds by E&Y were as follows:
| | | | |
| | | Audit Fees |
| | | 2009 | | 2008 |
Fees billed by E&Y: | | | | |
MFS Global Equity Fund | | 42,877 | | 42,052 |
MFS Global Total Return Fund | | 48,937 | | 47,993 |
MFS Utilities Fund | | 39,188 | | 38,435 |
Total | | 131,002 | | 128,480 |
For the fiscal years ended October 31, 2009 and 2008, fees billed by E&Y for audit-related, tax and other services provided to the Funds and for audit-related, tax and other services provided to MFS and MFS Related Entities were as follows:
| | | | | | | | | | | | |
| | | Audit-Related Fees1 | | Tax Fees2 | | All Other Fees3 |
| | | 2009 | | 2008 | | 2009 | | 2008 | | 2009 | | 2008 |
Fees billed by E&Y: | | | | | | | | | | | | |
To MFS Global Equity Fund | | 0 | | 0 | | 8,281 | | 8,781 | | 0 | | 0 |
To MFS Global Total Return Fund | | 0 | | 0 | | 9,426 | | 9,926 | | 0 | | 0 |
To MFS Utilities Fund | | 0 | | 0 | | 7,631 | | 8,131 | | 0 | | 0 |
Total fees billed by E&Y To above Funds | | 0 | | 0 | | 25,338 | | 26,838 | | 0 | | 0 |
To MFS and MFS Related Entities of MFS Global Equity Fund* | | 0 | | 0 | | 0 | | 0 | | 0 | | 0 |
To MFS and MFS Related Entities of MFS Global Total Return Fund* | | 0 | | 0 | | 0 | | 0 | | 0 | | 0 |
To MFS and MFS Related Entities of MFS Utilities Fund* | | 0 | | 0 | | 0 | | 0 | | 0 | | 0 |
| | | | | | |
| | | 2009 | | | | 2008 | | | | | | |
Aggregate fees for non-audit services: | | | | | | | | | | | | |
To MFS Global Equity Fund, MFS and MFS Related Entities# | | 543,321 | | | | 220,034 | | | | | | |
To MFS Global Total Fund, MFS and MFS Related Entities# | | 544,466 | | | | 221,179 | | | | | | |
To MFS Utilities Fund, MFS and MFS Related Entities# | | 542,671 | | | | 219,384 | | | | | | |
| * | This amount reflects the fees billed to MFS and MFS Related Entities for non-audit services relating directly to the operations and financial reporting of the Fund (portions of which services also related to the operations and financial reporting of other funds within the MFS Funds complex). |
| # | This amount reflects the aggregate fees billed by E&Y for non-audit services rendered to the Fund and for non-audit services rendered to MFS and the MFS Related Entities. |
| 1 | The fees included under “Audit-Related Fees” are fees related to assurance and related services that are reasonably related to the performance of the audit or review of financial statements, but not reported under “Audit Fees,” including accounting consultations, agreed-upon procedure reports, attestation reports, comfort letters and internal control reviews. |
| 2 | The fees included under “Tax Fees” are fees associated with tax compliance, tax advice and tax planning, including services relating to the filing or amendment of federal, state or local income tax returns, regulated investment company qualification reviews and tax distribution and analysis. |
| 3 | The fees under “All Other Fees” are fees for products and services provided by E&Y other than those reported under “Audit Fees,” “Audit-Related Fees” and “Tax Fees”. |
Item 4(e)(1):
Set forth below are the policies and procedures established by the Audit Committee of the Board of Trustees relating to the pre-approval of audit and non-audit related services:
To the extent required by applicable law, pre-approval by the Audit Committee of the Board is needed for all audit and permissible non-audit services rendered to the Funds and all permissible non-audit services rendered to MFS or MFS Related Entities if the services relate directly to the operations and financial reporting of the Registrant. Pre-approval is currently on an engagement-by-engagement basis. In the event pre-approval of such services is necessary between regular meetings of the Audit Committee and it is not practical to wait to seek pre-approval at the next regular meeting of the Audit Committee, pre-approval of such services may be referred to the Chair of the Audit Committee for approval; provided that the Chair may not pre-approve any individual engagement for such services exceeding $50,000 or multiple engagements for such services in the aggregate exceeding $100,000 in each period between regular meetings of the Audit Committee. Any engagement pre-approved by the Chair between regular meetings of the Audit Committee shall be presented for ratification by the entire Audit Committee at its next regularly scheduled meeting.
Item 4(e)(2):
None, or 0%, of the services relating to the Audit-Related Fees, Tax Fees and All Other Fees paid by the Fund and MFS and MFS Related Entities relating directly to the operations and financial reporting of the Registrant disclosed above were approved by the audit committee pursuant to paragraphs (c)(7)(i)(C) of Rule 2-01 of Regulation S-X (which permits audit committee approval after the start of the engagement with respect to services other than audit, review or attest services, if certain conditions are satisfied).
Item 4(f): Not applicable.
Item 4(h): The Registrant’s Audit Committee has considered whether the provision by a Registrant’s independent registered public accounting firm of non-audit services to MFS and MFS Related Entities that were not pre-approved by the Committee (because such services did not relate directly to the operations and financial reporting of the Registrant) was compatible with maintaining the independence of the independent registered public accounting firm as the Registrant’s principal auditors.
| ITEM 5. | AUDIT COMMITTEE OF LISTED REGISTRANTS. |
Not applicable to the Registrant.
A schedule of investments of the Registrant is included as part of the report to shareholders of such series under Item 1 of this Form N-CSR.
| ITEM 7. | DISCLOSURE OF PROXY VOTING POLICIES AND PROCEDURES FOR CLOSED-END MANAGEMENT INVESTMENT COMPANIES. |
Not applicable to the Registrant.
| ITEM 8. | PORTFOLIO MANAGERS OF CLOSED-END MANAGEMENT INVESTMENT COMPANIES. |
Not applicable to the Registrant.
| ITEM 9. | PURCHASES OF EQUITY SECURITIES BY CLOSED-END MANAGEMENT INVESTMENT COMPANY AND AFFILIATED PURCHASERS. |
Not applicable to the Registrant.
| ITEM 10. | SUBMISSION OF MATTERS TO A VOTE OF SECURITY HOLDERS. |
There were no material changes to the procedures by which shareholders may send recommendations to the Board for nominees to the Registrant’s Board since the Registrant last provided disclosure as to such procedures in response to the requirements of Item 407 (c)(2)(iv) of Regulation S-K or this Item.
| ITEM 11. | CONTROLS AND PROCEDURES. |
| (a) | Based upon their evaluation of the effectiveness of the registrant’s disclosure controls and procedures (as defined in Rule 30a-3(c) under the Investment Company Act of 1940 (the “Act”)) as conducted within 90 days of the filing date of this report on Form N-CSR, the registrant’s principal financial officer and principal executive officer have concluded that those disclosure controls and procedures provide reasonable assurance that the material information required to be disclosed by the registrant on this report is recorded, processed, summarized and reported within the time periods specified in the Securities and Exchange Commission’s rules and forms. |
| (b) | There were no changes in the registrant’s internal controls over financial reporting (as defined in Rule 30a-3(d) under the Act) that occurred during the second fiscal quarter of the period covered by the report that have materially affected, or are reasonably likely to materially affect, the registrant’s internal control over financial reporting. |
| (a) | File the exhibits listed below as part of this form. Letter or number the exhibits in the sequence indicated. |
| | (1) | Any code of ethics, or amendment thereto, that is the subject of the disclosure required by Item 2, to the extent that the registrant intends to satisfy the Item 2 requirements through filing of an exhibit: Code of Ethics attached hereto. |
| | (2) | A separate certification for each principal executive officer and principal financial officer of the registrant as required by Rule 30a-2 under the Act (17 CFR 270.30a-2): Attached hereto. |
| (b) | If the report is filed under Section 13(a) or 15(d) of the Exchange Act, provide the certifications required by Rule 30a-2(b) under the Act (17 CFR 270.30a-2(b)), Rule 13a-14(b) or Rule 15d-14(b) under the Exchange Act (17 CFR 240.13a-14(b) or 240.15d-14(b)) and Section 1350 of Chapter 63 of Title 18 of the United States Code (18 U.S.C. 1350) as an exhibit. A certification furnished pursuant to this paragraph will not be deemed “filed” for the purposes of Section 18 of the Exchange Act (15 U.S.C. 78r), or otherwise subject to the liability of that section. Such certification will not be deemed to be incorporated by reference into any filing under the Securities Act of 1933 or the Exchange Act, except to the extent that the registrant specifically incorporates it by reference: Attached hereto. |
Notice
A copy of the Amended and Restated Declaration of Trust, as amended, of the Registrant is on file with the Secretary of State of The Commonwealth of Massachusetts and notice is hereby given that this instrument is executed on behalf of the Registrant by an officer of the Registrant as an officer and not individually and the obligations of or arising out of this instrument are not binding upon any of the Trustees or shareholders individually, but are binding only upon the assets and property of the respective constituent series of the Registrant.
SIGNATURES
Pursuant to the requirements of the Securities Exchange Act of 1934 and the Investment Company Act of 1940, the registrant has duly caused this report to be signed on its behalf by the undersigned, thereunto duly authorized.
(Registrant) MFS SERIES TRUST VI
| | |
| By (Signature and Title)* | | MARIA F. DWYER |
| | Maria F. Dwyer, President |
Date: December 17, 2009
Pursuant to the requirements of the Securities Exchange Act of 1934 and the Investment Company Act of 1940, this report has been signed below by the following persons on behalf of the registrant and in the capacities and on the dates indicated.
| | |
| By (Signature and Title)* | | MARIA F. DWYER |
| | Maria F. Dwyer, President (Principal Executive Officer) |
Date: December 17, 2009
| | |
| By (Signature and Title)* | | JOHN M. CORCORAN |
| | John M. Corcoran, Treasurer (Principal Financial Officer and Accounting Officer) |
Date: December 17, 2009
| * | Print name and title of each signing officer under his or her signature. |