UNITED STATES
SECURITIES AND EXCHANGE COMMISSION
Washington, D.C. 20549
FORM N-CSR
CERTIFIED SHAREHOLDER REPORT OF
REGISTERED MANAGEMENT INVESTMENT COMPANIES
Investment Company Act file number 811-6102
MFS SERIES TRUST VI
(Exact name of registrant as specified in charter)
500 Boylston Street, Boston, Massachusetts 02116
(Address of principal executive offices) (Zip code)
Susan S. Newton
Massachusetts Financial Services Company
500 Boylston Street
Boston, Massachusetts 02116
(Name and address of agents for service)
Registrant’s telephone number, including area code: (617) 954-5000
Date of fiscal year end: October 31
Date of reporting period: April 30, 2010
| ITEM 1. | REPORTS TO STOCKHOLDERS. |

MFS® Global Equity Fund
The report is prepared for the general information of shareholders. It is authorized for distribution to prospective investors only when preceded or accompanied by a current prospectus.
NOT FDIC INSURED Ÿ MAY LOSE VALUE Ÿ
NO BANK GUARANTEE
4/30/10
LGE-SEM

LETTER FROM THE CEO
Dear Shareholders:
After having suffered their biggest declines since the Great Depression, most global markets experienced an impressive resurgence during the latter months of 2009 and the first quarter of 2010. The global economy was able to reap the benefits of two major trends. The first of these was the massive efforts of governments and central banks to increase liquidity in the financial system as they sought to prevent the credit crisis from further affecting the banking system. The second was the move by companies around the world to cut costs and operations to prepare for rapidly changing market conditions. We believe that these moves not only shortened the length of the downturn but also set the stage for recovery.
Even with the significant market gains of 2009 and the early part of 2010, the recovery is unrolling at a moderate pace, with rebounds in the manufacturing sector and corporate America leading the way. Central bankers are proceeding with caution and have held benchmark interest rates unchanged as they debate the best way to withdraw stimulus measures without disrupting the fragile growth process.
While hurdles remain, we believe that the global economy is on the road to recovery. As always, we continue to be mindful of the many challenges faced at the individual, national, and international levels. It is at times such as these that we want to remind investors of the merits of maintaining a long-term view, adhering to basic investing principles such as asset allocation and diversification, and working closely with advisors to identify and research investment opportunities. At MFS®, we take particular pride in how well mutual funds can help investors by providing the diversification that is important in any type of market climate.
Respectfully,

Robert J. Manning
Chief Executive Officer and Chief Investment Officer
MFS Investment Management®
June 15, 2010
The opinions expressed in this letter are subject to change, may not be relied upon for investment advice, and no forecasts can be guaranteed.
1
PORTFOLIO COMPOSITION
Portfolio structure

| | |
| Top ten holdings | | |
| Nestle S.A. | | 3.0% |
| Linde AG | | 2.6% |
| Heineken N.V. | | 2.5% |
| Roche Holding AG | | 2.3% |
| Oracle Corp. | | 2.2% |
| Walt Disney Co. | | 2.2% |
| 3M Co. | | 2.1% |
| Bank of New York Mellon Corp. | | 2.1% |
| Reckitt Benckiser Group PLC | | 2.0% |
| Diageo PLC | | 1.9% |
| | |
| Equity sectors | | |
| Consumer Staples | | 18.8% |
| Health Care | | 15.2% |
| Financial Services | | 13.6% |
| Basic Materials | | 9.7% |
| Technology | | 9.0% |
| Retailing | | 8.7% |
| Leisure | | 6.3% |
| Energy | | 4.3% |
| Industrial Goods & Services | | 4.2% |
| Transportation | | 4.0% |
| Special Products & Services | | 2.5% |
| Utilities & Communications | | 1.5% |
| Autos & Housing | | 1.1% |
| |
| Issuer country weightings | | |
| United States | | 44.8% |
| Switzerland | | 11.2% |
| France | | 10.4% |
| United Kingdom | | 9.1% |
| Germany | | 6.5% |
| Japan | | 5.6% |
| Netherlands | | 5.6% |
| Canada | | 1.5% |
| South Korea | | 1.4% |
| Other Countries | | 3.9% |
Percentages are based on net assets as of 4/30/10.
The portfolio is actively managed and current holdings may be different.
2
MARKET ENVIRONMENT
After having suffered through one of the largest and most concentrated downturns since the 1930s, most asset markets staged a remarkable rebound during 2009 and early 2010. This recovery in global activity, which covers this reporting period, has been led importantly by emerging Asian economies, but broadening to include most of the global economy to varying degrees. Primary drivers of the recovery included an unwinding of the inventory destocking that took place earlier, the production of manufacturing and capital goods, as well as massive fiscal and monetary stimulus.
During the worst of the credit crisis, policy makers globally loosened monetary and fiscal policy on a massive scale. Having reached their lower bound on policy rates prior to the beginning of the reporting period, several central banks were implementing quantitative easing as a means to further loosen monetary policy to offset the continuing fall in global economic activity. However, by the beginning of the period, there were ever-broadening signs that the global macroeconomic deterioration had passed, which caused the subsequent rise in asset valuations. As most asset prices rebounded during the period and the demand for liquidity waned, the debate concerning the existence of asset bubbles and the need for monetary exit strategies had begun, creating added uncertainty regarding the forward path of policy rates. Nonetheless, risky-asset valuation generally hit secular highs by the end of the period.
3
EXPENSE TABLE
Fund expenses borne by the shareholders during the period, November 1, 2009 through April 30, 2010
As a shareholder of the fund, you incur two types of costs: (1) transaction costs, including sales charges (loads) on certain purchase or redemption payments, and (2) ongoing costs, including management fees; distribution and service (12b-1) fees; and other fund expenses. This example is intended to help you understand your ongoing costs (in dollars) of investing in the fund and to compare these costs with the ongoing costs of investing in other mutual funds.
The example is based on an investment of $1,000 invested at the beginning of the period and held for the entire period November 1, 2009 through April 30, 2010.
Actual Expenses
The first line for each share class in the following table provides information about actual account values and actual expenses. You may use the information in this line, together with the amount you invested, to estimate the expenses that you paid over the period. Simply divide your account value by $1,000 (for example, an $8,600 account value divided by $1,000 = 8.6), then multiply the result by the number in the first line under the heading entitled “Expenses Paid During Period” to estimate the expenses you paid on your account during this period.
Hypothetical Example for Comparison Purposes
The second line for each share class in the following table provides information about hypothetical account values and hypothetical expenses based on the fund’s actual expense ratio and an assumed rate of return of 5% per year before expenses, which is not the fund’s actual return. The hypothetical account values and expenses may not be used to estimate the actual ending account balance or expenses you paid for the period. You may use this information to compare the ongoing costs of investing in the fund and other funds. To do so, compare this 5% hypothetical example with the 5% hypothetical examples that appear in the shareholder reports of the other funds.
Please note that the expenses shown in the table are meant to highlight your ongoing costs only and do not reflect any transactional costs, such as sales charges (loads). Therefore, the second line for each share class in the table is useful in comparing ongoing costs only, and will not help you determine the relative total costs of owning different funds. In addition, if these transactional costs were included, your costs would have been higher.
4
Expense Table – continued
| | | | | | | | | | |
Share
Class | | | | Annualized
Expense
Ratio | | Beginning
Account Value
11/01/09 | | Ending
Account Value
4/30/10 | | Expenses
Paid During
Period (p)
11/01/09-4/30/10 |
| A | | Actual | | 1.44% | | $1,000.00 | | $1,104.99 | | $7.52 |
| | Hypothetical (h) | | 1.44% | | $1,000.00 | | $1,017.65 | | $7.20 |
| B | | Actual | | 2.19% | | $1,000.00 | | $1,100.32 | | $11.40 |
| | Hypothetical (h) | | 2.19% | | $1,000.00 | | $1,013.93 | | $10.94 |
| C | | Actual | | 2.19% | | $1,000.00 | | $1,100.70 | | $11.41 |
| | Hypothetical (h) | | 2.19% | | $1,000.00 | | $1,013.93 | | $10.94 |
| I | | Actual | | 1.18% | | $1,000.00 | | $1,105.88 | | $6.16 |
| | Hypothetical (h) | | 1.18% | | $1,000.00 | | $1,018.94 | | $5.91 |
| R1 | | Actual | | 2.19% | | $1,000.00 | | $1,100.86 | | $11.41 |
| | Hypothetical (h) | | 2.19% | | $1,000.00 | | $1,013.93 | | $10.94 |
| R2 | | Actual | | 1.69% | | $1,000.00 | | $1,104.17 | | $8.82 |
| | Hypothetical (h) | | 1.69% | | $1,000.00 | | $1,016.41 | | $8.45 |
| R3 | | Actual | | 1.44% | | $1,000.00 | | $1,104.73 | | $7.51 |
| | Hypothetical (h) | | 1.44% | | $1,000.00 | | $1,017.65 | | $7.20 |
| R4 | | Actual | | 1.19% | | $1,000.00 | | $1,105.95 | | $6.21 |
| | Hypothetical (h) | | 1.19% | | $1,000.00 | | $1,018.89 | | $5.96 |
| (h) | 5% class return per year before expenses. |
| (p) | Expenses paid is equal to each class’ annualized expense ratio, as shown above, multiplied by the average account value over the period, multiplied by the number of days in the period, divided by the number of days in the year. Expenses paid do not include any applicable sales charges (loads). If these transaction costs had been included, your costs would have been higher. |
5
PORTFOLIO OF INVESTMENTS
4/30/10 (unaudited)
The Portfolio of Investments is a complete list of all securities owned by your fund. It is categorized by broad-based asset classes.
| | | | | |
| Common Stocks - 98.9% | | | | | |
| Issuer | | Shares/Par | | Value ($) |
| | | | | |
| Aerospace - 1.3% | | | | | |
| Honeywell International, Inc. | | 142,100 | | $ | 6,745,486 |
| | |
| Alcoholic Beverages - 5.5% | | | | | |
| Diageo PLC | | 603,907 | | $ | 10,302,688 |
| Heineken N.V. (l) | | 286,940 | | | 13,319,263 |
| Pernod Ricard S.A. | | 63,027 | | | 5,361,901 |
| | | | | |
| | | | | $ | 28,983,852 |
| Apparel Manufacturers - 5.7% | | | | | |
| Burberry Group PLC | | 436,060 | | $ | 4,488,997 |
| Compagnie Financiere Richemont S.A. | | 160,390 | | | 5,929,217 |
| LVMH Moet Hennessy Louis Vuitton S.A. (l) | | 83,240 | | | 9,515,943 |
| NIKE, Inc., “B” | | 134,180 | | | 10,185,604 |
| | | | | |
| | | | | $ | 30,119,761 |
| Automotive - 0.5% | | | | | |
| Harley-Davidson, Inc. | | 72,840 | | $ | 2,464,177 |
| | |
| Biotechnology - 0.2% | | | | | |
| Actelion Ltd. (a) | | 24,725 | | $ | 994,973 |
| | |
| Broadcasting - 4.9% | | | | | |
| Omnicom Group, Inc. | | 190,930 | | $ | 8,145,074 |
| Walt Disney Co. | | 315,770 | | | 11,632,967 |
| WPP Group PLC | | 597,021 | | | 6,347,342 |
| | | | | |
| | | | | $ | 26,125,383 |
| Brokerage & Asset Managers - 1.0% | | | | | |
| Deutsche Boerse AG | | 67,820 | | $ | 5,286,100 |
| | |
| Business Services - 1.8% | | | | | |
| Accenture Ltd., “A” | | 183,770 | | $ | 8,019,723 |
| DST Systems, Inc. | | 32,780 | | | 1,391,511 |
| | | | | |
| | | | | $ | 9,411,234 |
| Chemicals - 3.6% | | | | | |
| 3M Co. | | 126,990 | | $ | 11,260,203 |
| Givaudan S.A. | | 6,114 | | | 5,322,148 |
6
Portfolio of Investments (unaudited) – continued
| | | | | |
| Issuer | | Shares/Par | | Value ($) |
| | | | | |
| Common Stocks - continued | | | | | |
| Chemicals - continued | | | | | |
| Monsanto Co. | | 43,040 | | $ | 2,714,102 |
| | | | | |
| | | | | $ | 19,296,453 |
| Computer Software - 2.2% | | | | | |
| Oracle Corp. | | 451,550 | | $ | 11,668,052 |
| | |
| Computer Software - Systems - 1.1% | | | | | |
| Canon, Inc. | | 124,700 | | $ | 5,693,174 |
| | |
| Conglomerates - 0.7% | | | | | |
| Smiths Group PLC | | 206,933 | | $ | 3,563,534 |
| | |
| Construction - 0.6% | | | | | |
| Sherwin-Williams Co. | | 39,950 | | $ | 3,118,897 |
| | |
| Consumer Products - 6.1% | | | | | |
| Beiersdorf AG (l) | | 41,430 | | $ | 2,333,090 |
| International Flavors & Fragrances, Inc. | | 37,440 | | | 1,875,370 |
| Kao Corp. | | 204,700 | | | 4,954,775 |
| Procter & Gamble Co. | | 105,515 | | | 6,558,812 |
| Reckitt Benckiser Group PLC | | 203,950 | | | 10,584,972 |
| Svenska Cellulosa Aktiebolaget (l) | | 440,000 | | | 5,763,618 |
| | | | | |
| | | | | $ | 32,070,637 |
| Electrical Equipment - 3.0% | | | | | |
| Legrand S.A. | | 179,600 | | $ | 5,826,231 |
| Rockwell Automation, Inc. | | 38,700 | | | 2,349,864 |
| Schneider Electric S.A. | | 65,657 | | | 7,500,137 |
| | | | | |
| | | | | $ | 15,676,232 |
| Electronics - 3.8% | | | | | |
| Hirose Electric Co. Ltd. | | 9,100 | | $ | 983,286 |
| Hoya Corp. | | 233,900 | | | 6,433,709 |
| Intel Corp. | | 243,610 | | | 5,561,616 |
| Samsung Electronics Co. Ltd. | | 9,724 | | | 7,354,423 |
| | | | | |
| | | | | $ | 20,333,034 |
| Energy - Independent - 0.8% | | | | | |
| INPEX Corp. | | 588 | | $ | 4,156,593 |
| | |
| Energy - Integrated - 2.3% | | | | | |
| Chevron Corp. | | 55,050 | | $ | 4,483,272 |
| Royal Dutch Shell PLC | | 100,520 | | | 3,150,569 |
7
Portfolio of Investments (unaudited) – continued
| | | | | |
| Issuer | | Shares/Par | | Value ($) |
| | | | | |
| Common Stocks - continued | | | | | |
| Energy - Integrated - continued | | | | | |
| TOTAL S.A. | | 85,750 | | $ | 4,646,533 |
| | | | | |
| | | | | $ | 12,280,374 |
| Food & Beverages - 7.2% | | | | | |
| General Mills, Inc. | | 92,340 | | $ | 6,572,761 |
| Groupe Danone (l) | | 89,728 | | | 5,296,093 |
| J.M. Smucker Co. | | 99,239 | | | 6,060,526 |
| Nestle S.A. | | 326,649 | | | 15,941,939 |
| PepsiCo, Inc. | | 66,940 | | | 4,365,827 |
| | | | | |
| | | | | $ | 38,237,146 |
| Food & Drug Stores - 2.3% | | | | | |
| Lawson, Inc. | | 28,000 | | $ | 1,240,006 |
| Tesco PLC | | 385,596 | | | 2,565,026 |
| Walgreen Co. | | 240,500 | | | 8,453,575 |
| | | | | |
| | | | | $ | 12,258,607 |
| Gaming & Lodging - 1.0% | | | | | |
| Ladbrokes PLC | | 781,160 | | $ | 1,863,338 |
| William Hill PLC | | 1,017,270 | | | 3,182,840 |
| | | | | |
| | | | | $ | 5,046,178 |
| Insurance - 1.4% | | | | | |
| AXA (l) | | 216,780 | | $ | 4,308,924 |
| Swiss Reinsurance Co. | | 75,068 | | | 3,272,445 |
| | | | | |
| | | | | $ | 7,581,369 |
| Major Banks - 8.3% | | | | | |
| Bank of New York Mellon Corp. | | 353,263 | | $ | 10,997,077 |
| Erste Group Bank AG (l) | | 99,915 | | | 4,462,397 |
| Goldman Sachs Group, Inc. | | 43,150 | | | 6,265,380 |
| Intesa Sanpaolo S.p.A | | 459,231 | | | 1,511,339 |
| Julius Baer Group Ltd. | | 154,132 | | | 5,323,120 |
| Standard Chartered PLC | | 192,865 | | | 5,140,943 |
| State Street Corp. | | 233,960 | | | 10,177,260 |
| | | | | |
| | | | | $ | 43,877,516 |
| Medical Equipment - 9.1% | | | | | |
| Alcon, Inc. | | 9,380 | | $ | 1,461,967 |
| DENTSPLY International, Inc. | | 119,220 | | | 4,368,221 |
| Essilor International S.A. | | 36,370 | | | 2,222,529 |
| Medtronic, Inc. | | 210,160 | | | 9,181,890 |
| Sonova Holding AG | | 9,929 | | | 1,239,107 |
8
Portfolio of Investments (unaudited) – continued
| | | | | |
| Issuer | | Shares/Par | | Value ($) |
| | | | | |
| Common Stocks - continued | | | | | |
| Medical Equipment - continued | | | | | |
| St. Jude Medical, Inc. (a) | | 162,150 | | $ | 6,618,963 |
| Synthes, Inc. | | 38,500 | | | 4,389,676 |
| Thermo Fisher Scientific, Inc. (a) | | 112,150 | | | 6,199,652 |
| Waters Corp. (a) | | 101,740 | | | 7,324,263 |
| Zimmer Holdings, Inc. (a) | | 88,810 | | | 5,409,417 |
| | | | | |
| | | | | $ | 48,415,685 |
| Natural Gas - Distribution - 0.9% | | | | | |
| GDF SUEZ (l) | | 139,629 | | $ | 4,975,201 |
| | |
| Network & Telecom - 1.9% | | | | | |
| Cisco Systems, Inc. (a) | | 363,970 | | $ | 9,798,072 |
| | |
| Oil Services - 1.1% | | | | | |
| National Oilwell Varco, Inc. | | 136,750 | | $ | 6,021,103 |
| | |
| Other Banks & Diversified Financials - 2.9% | | | | | |
| Aeon Credit Service Co. Ltd. | | 118,400 | | $ | 1,288,805 |
| American Express Co. | | 109,790 | | | 5,063,515 |
| ICICI Bank Ltd. | | 111,644 | | | 2,355,289 |
| Komercni Banka A.S. | | 9,244 | | | 1,916,472 |
| UBS AG (a) | | 298,222 | | | 4,607,384 |
| | | | | |
| | | | | $ | 15,231,465 |
| Pharmaceuticals - 5.9% | | | | | |
| Bayer AG (l) | | 115,783 | | $ | 7,411,207 |
| Johnson & Johnson | | 93,880 | | | 6,036,484 |
| Merck KGaA (l) | | 68,240 | | | 5,606,957 |
| Roche Holding AG | | 76,980 | | | 12,167,726 |
| | | | | |
| | | | | $ | 31,222,374 |
| Printing & Publishing - 0.4% | | | | | |
| Wolters Kluwer N.V. | | 112,630 | | $ | 2,309,780 |
| | |
| Railroad & Shipping - 1.5% | | | | | |
| Canadian National Railway Co. | | 136,016 | | $ | 8,132,397 |
| | |
| Specialty Chemicals - 6.1% | | | | | |
| Akzo Nobel N.V. (l) | | 77,140 | | $ | 4,534,297 |
| L’Air Liquide S.A. | | 48,613 | | | 5,625,464 |
| Linde AG (l) | | 115,660 | | | 13,830,288 |
| Praxair, Inc. | | 41,630 | | | 3,487,345 |
| Shin-Etsu Chemical Co. Ltd. | | 85,800 | | | 4,954,451 |
| | | | | |
| | | | | $ | 32,431,845 |
9
Portfolio of Investments (unaudited) – continued
| | | | | | | |
| Issuer | | Shares/Par | | Value ($) | |
| | | | | | | |
| Common Stocks - continued | | | | | | | |
| Specialty Stores - 0.7% | | | | | | | |
| Abercrombie & Fitch Co., “A” | | | 54,570 | | $ | 2,386,346 | |
| Sally Beauty Holdings, Inc. (a) | | | 123,110 | | | 1,175,701 | |
| | | | | | | |
| | | | | | $ | 3,562,047 | |
| Telephone Services - 0.6% | | | | | | | |
| Singapore Telecommunications Ltd. | | | 1,385,975 | | $ | 3,075,296 | |
| | |
| Trucking - 2.5% | | | | | | | |
| TNT N.V. | | | 208,159 | | $ | 6,396,698 | |
| United Parcel Service, Inc., “B” | | | 100,990 | | | 6,982,449 | |
| | | | | | | |
| | | | | | $ | 13,379,147 | |
| Total Common Stocks (Identified Cost, $459,128,454) | | | | | $ | 523,543,174 | |
| | |
| Money Market Funds (v) - 0.8% | | | | | | | |
MFS Institutional Money Market Portfolio, 0.19%,
at Cost and Net Asset Value | | | 3,866,816 | | $ | 3,866,816 | |
| | |
| Collateral for Securities Loaned - 11.4% | | | | | | | |
| Goldman Sachs Repurchase Agreement, 0.19%, dated 4/30/10, due 5/03/10, total to be received $40,299,865 (secured by U.S. Treasury and Federal Agency obligations valued at $41,105,242 in an individually traded account) | | $ | 40,299,227 | | $ | 40,299,227 | |
| Morgan Stanley Repurchase Agreement, 0.19%, dated 4/30/10, due 5/03/10, total to be received $20,000,317 (secured by U.S. Treasury and Federal Agency obligations valued at $20,400,388 in an individually traded account) | | | 20,000,000 | | | 20,000,000 | |
| Total Collateral for Securities Loaned, at Cost | | | | | $ | 60,299,227 | |
| Total Investments (Identified Cost, $523,294,497) | | | | | $ | 587,709,217 | |
| | |
| Other Assets, Less Liabilities - (11.1)% | | | | | | (58,482,353 | ) |
| Net Assets - 100.0% | | | | | $ | 529,226,864 | |
| (a) | Non-income producing security. |
| (l) | All or a portion of this security is on loan. |
| (v) | Underlying fund that is available only to investment companies managed by MFS. The rate quoted is the annualized seven-day yield of the fund at period end. |
The following abbreviations are used in this report and are defined:
| PLC | | Public Limited Company |
See Notes to Financial Statements
10
Financial Statements
STATEMENT OF ASSETS AND LIABILITIES
At 4/30/10 (unaudited)
This statement represents your fund’s balance sheet, which details the assets and liabilities comprising the total value of the fund.
| | | |
| Assets | | | |
Investments- | | | |
Non-affiliated issuers, at value (identified cost, $519,427,681) | | $583,842,401 | |
Underlying funds, at cost and value | | 3,866,816 | |
Total investments, at value, including $57,282,199 of securities on loan
(identified cost, $523,294,497) | | $587,709,217 | |
Foreign currency, at value (identified cost, $28,429) | | 28,429 | |
Receivables for | | | |
Investments sold | | 1,531,116 | |
Fund shares sold | | 1,781,443 | |
Interest and dividends | | 1,708,911 | |
Other assets | | 3,709 | |
Total assets | | $592,762,825 | |
| Liabilities | | | |
Payables for | | | |
Investments purchased | | $1,593,627 | |
Fund shares reacquired | | 1,386,295 | |
Collateral for securities loaned, at value | | 60,299,227 | |
Payable to affiliates | | | |
Investment adviser | | 26,135 | |
Shareholder servicing costs | | 94,683 | |
Distribution and service fees | | 8,342 | |
Administrative services fee | | 448 | |
Payable for independent Trustees’ compensation | | 46,433 | |
Accrued expenses and other liabilities | | 80,771 | |
Total liabilities | | $63,535,961 | |
Net assets | | $529,226,864 | |
| Net assets consist of | | | |
Paid-in capital | | $480,528,439 | |
Unrealized appreciation (depreciation) on investments and translation of assets and liabilities in foreign currencies (net of $39,062 deferred country tax) | | 64,378,390 | |
Accumulated net realized gain (loss) on investments and foreign currency transactions | | (17,023,979 | ) |
Undistributed net investment income | | 1,344,014 | |
Net assets | | $529,226,864 | |
Shares of beneficial interest outstanding | | 23,950,966 | |
| | | | | | |
| | | Net assets | | Shares
outstanding | | Net asset value
per share (a) |
Class A | | $301,780,719 | | 13,571,566 | | $22.24 |
Class B | | 28,609,829 | | 1,372,851 | | 20.84 |
Class C | | 29,909,611 | | 1,486,096 | | 20.13 |
Class I | | 123,847,220 | | 5,450,386 | | 22.72 |
Class R1 | | 4,265,866 | | 209,036 | | 20.41 |
Class R2 | | 20,074,155 | | 925,504 | | 21.69 |
Class R3 | | 14,621,032 | | 660,986 | | 22.12 |
Class R4 | | 6,118,432 | | 274,541 | | 22.29 |
| (a) | Maximum offering price per share was equal to the net asset value per share for all share classes, except for Class A, for which the maximum offering price per share was $23.60 [100 / 94.25 x $22.24]. On sales of $50,000 or more, the maximum offering price of Class A shares is reduced. A contingent deferred sales charge may be imposed on redemptions of Class A, Class B, and Class C shares. Redemption price per share was equal to the net asset value per share for Classes I, R1, R2, R3, and R4. |
See Notes to Financial Statements
11
Financial Statements
STATEMENT OF OPERATIONS
Six months ended 4/30/10 (unaudited)
This statement describes how much your fund earned in investment income and accrued in expenses. It also describes any gains and/or losses generated by fund operations.
| | | |
| Net investment income | | | |
Income | | | |
Dividends | | $5,294,050 | |
Interest | | 50,286 | |
Dividends from underlying funds | | 3,280 | |
Foreign taxes withheld | | (420,890 | ) |
Total investment income | | $4,926,726 | |
Expenses | | | |
Management fee | | $2,096,773 | |
Distribution and service fees | | 750,703 | |
Shareholder servicing costs | | 431,228 | |
Administrative services fee | | 38,436 | |
Independent Trustees’ compensation | | 10,086 | |
Custodian fee | | 68,383 | |
Shareholder communications | | 21,883 | |
Auditing fees | | 23,949 | |
Legal fees | | 5,564 | |
Miscellaneous | | 79,439 | |
Total expenses | | $3,526,444 | |
Fees paid indirectly | | (7 | ) |
Reduction of expenses by investment adviser | | (1,006 | ) |
Net expenses | | $3,525,431 | |
Net investment income | | $1,401,295 | |
Realized and unrealized gain (loss) on investments
and foreign currency transactions | | | |
Realized gain (loss) (identified cost basis) | | | |
Investment transactions (net of $2,233 country tax) | | $404,876 | |
Foreign currency transactions | | 8,136 | |
Net realized gain (loss) on investments
and foreign currency transactions | | $413,012 | |
Change in unrealized appreciation (depreciation) | | | |
Investments (net of $39,062 increase in deferred country tax) | | $44,940,826 | |
Translation of assets and liabilities in foreign currencies | | (29,323 | ) |
Net unrealized gain (loss) on investments
and foreign currency translation | | $44,911,503 | |
Net realized and unrealized gain (loss) on investments
and foreign currency | | $45,324,515 | |
Change in net assets from operations | | $46,725,810 | |
See Notes to Financial Statements
12
Financial Statements
STATEMENTS OF CHANGES IN NET ASSETS
These statements describe the increases and/or decreases in net assets resulting from operations, any distributions, and any shareholder transactions.
| | | | | | |
| Change in net assets | | Six months ended
4/30/10
(unaudited) | | | Year ended
10/31/09 | |
| From operations | | | | | | |
Net investment income | | $1,401,295 | | | $3,412,215 | |
Net realized gain (loss) on investments and foreign currency transactions | | 413,012 | | | (15,155,528 | ) |
Net unrealized gain (loss) on investments and foreign currency translation | | 44,911,503 | | | 78,556,800 | |
Change in net assets from operations | | $46,725,810 | | | $66,813,487 | |
| Distributions declared to shareholders | | | | | | |
From net investment income | | $(3,397,002 | ) | | $(5,518,224 | ) |
From net realized gain on investments | | — | | | (24,477,858 | ) |
Total distributions declared to shareholders | | $(3,397,002 | ) | | $(29,996,082 | ) |
Change in net assets from fund share transactions | | $76,918,824 | | | $(38,241,298 | ) |
Total change in net assets | | $120,247,632 | | | $(1,423,893 | ) |
| Net assets | | | | | | |
At beginning of period | | 408,979,232 | | | 410,403,125 | |
At end of period (including undistributed net investment income of $1,344,014 and $3,339,721, respectively) | | $529,226,864 | | | $408,979,232 | |
See Notes to Financial Statements
13
Financial Statements
FINANCIAL HIGHLIGHTS
The financial highlights table is intended to help you understand the fund’s financial performance for the semiannual period and the past 5 fiscal years (or life of a particular share class, if shorter). Certain information reflects financial results for a single fund share. The total returns in the table represent the rate by which an investor would have earned (or lost) on an investment in the fund share class (assuming reinvestment of all distributions) held for the entire period.
| | | | | | | | | | | | | | | | | |
| | | Six months
ended
4/30/10
(unaudited) | | | Years ended 10/31 |
| Class A | | | 2009 | | | 2008 | | | 2007 | | | 2006 | | | 2005 |
| | | | | | | | | | | | | | | | |
Net asset value, beginning of period | | $20.30 | | | $18.51 | | | $31.71 | | | $30.78 | | | $25.79 | | | $22.92 |
Income (loss) from investment
operations | | | | | | | | | | | | |
Net investment income (d) | | $0.07 | | | $0.17 | | | $0.27 | | | $0.33 | | | $0.48 | | | $0.06 |
Net realized and unrealized gain (loss) on investments and foreign currency | | 2.05 | | | 3.02 | | | (10.09 | ) | | 4.54 | | | 5.68 | | | 2.81 |
Total from investment operations | | $2.12 | | | $3.19 | | | $(9.82 | ) | | $4.87 | | | $6.16 | | | $2.87 |
Less distributions declared to
shareholders | | | | | | | | | |
From net investment income | | $(0.18 | ) | | $(0.29 | ) | | $(0.19 | ) | | $(0.63 | ) | | $— | | | $— |
From net realized gain on investments | | — | | | (1.11 | ) | | (3.19 | ) | | (3.31 | ) | | (1.17 | ) | | — |
Total distributions declared to shareholders | | $(0.18 | ) | | $(1.40 | ) | | $(3.38 | ) | | $(3.94 | ) | | $(1.17 | ) | | $— |
Net asset value, end of period | | $22.24 | | | $20.30 | | | $18.51 | | | $31.71 | | | $30.78 | | | $25.79 |
Total return (%) (r)(s)(t) | | 10.50 | (n) | | 18.90 | | | (34.51 | ) | | 17.41 | | | 24.73 | | | 12.52 |
Ratios (%) (to average net assets)
and Supplemental data: | | | | | | |
Expenses before expense reductions (f) | | 1.44 | (a) | | 1.53 | | | 1.44 | | | 1.46 | | | 1.45 | | | 1.55 |
Expenses after expense reductions (f) | | 1.44 | (a) | | 1.53 | | | 1.44 | | | 1.46 | | | 1.45 | | | 1.55 |
Net investment income | | 0.62 | (a) | | 0.99 | | | 1.05 | | | 1.10 | | | 1.72 | | | 0.22 |
Portfolio turnover | | 18 | | | 17 | | | 23 | | | 27 | | | 39 | | | 39 |
Net assets at end of period (000 omitted) | | $301,781 | | | $285,345 | | | $260,535 | | | $474,901 | | | $465,394 | | | $402,985 |
See Notes to Financial Statements
14
Financial Highlights – continued
| | | | | | | | | | | | | | | | | | |
| | | Six months
ended
4/30/10
(unaudited) | | | Years ended 10/31 | |
| Class B | | | 2009 | | | 2008 | | | 2007 | | | 2006 | | | 2005 | |
| | | | | | | | | | | | | | | | | |
Net asset value, beginning of period | | $18.97 | | | $17.25 | | | $29.79 | | | $29.12 | | | $24.64 | | | $22.06 | |
Income (loss) from investment
operations | | | | | | | | | | |
Net investment income (loss) (d) | | $(0.02 | ) | | $0.04 | | | $0.06 | | | $0.12 | | | $0.27 | | | $(0.13 | ) |
Net realized and unrealized gain (loss) on investments and foreign currency | | 1.92 | | | 2.83 | | | (9.41 | ) | | 4.25 | | | 5.38 | | | 2.71 | |
Total from investment operations | | $1.90 | | | $2.87 | | | $(9.35 | ) | | $4.37 | | | $5.65 | | | $2.58 | |
Less distributions declared to
shareholders | | | | | | | | | | |
From net investment income | | $(0.03 | ) | | $(0.04 | ) | | $— | | | $(0.39 | ) | | $— | | | $— | |
From net realized gain on investments | | — | | | (1.11 | ) | | (3.19 | ) | | (3.31 | ) | | (1.17 | ) | | — | |
Total distributions declared to shareholders | | $(0.03 | ) | | $(1.15 | ) | | $(3.19 | ) | | $(3.70 | ) | | $(1.17 | ) | | $— | |
Net asset value, end of period | | $20.84 | | | $18.97 | | | $17.25 | | | $29.79 | | | $29.12 | | | $24.64 | |
Total return (%) (r)(s)(t) | | 10.03 | (n) | | 18.04 | | | (34.99 | ) | | 16.51 | | | 23.77 | | | 11.70 | |
Ratios (%) (to average net assets)
and Supplemental data: | | | | | | | | | | |
Expenses before expense reductions (f) | | 2.19 | (a) | | 2.29 | | | 2.19 | | | 2.21 | | | 2.20 | | | 2.30 | |
Expenses after expense reductions (f) | | 2.19 | (a) | | 2.29 | | | 2.19 | | | 2.21 | | | 2.20 | | | 2.30 | |
Net investment income (loss) | | (0.16 | )(a) | | 0.25 | | | 0.25 | | | 0.41 | | | 1.02 | | | (0.53 | ) |
Portfolio turnover | | 18 | | | 17 | | | 23 | | | 27 | | | 39 | | | 39 | |
Net assets at end of period (000 omitted) | | $28,610 | | | $29,964 | | | $38,111 | | | $102,296 | | | $139,656 | | | $148,434 | |
See Notes to Financial Statements
15
Financial Highlights – continued
| | | | | | | | | | | | | | | | | | |
| | | Six months
ended
4/30/10
(unaudited) | | | Years ended 10/31 | |
| Class C | | | 2009 | | | 2008 | | | 2007 | | | 2006 | | | 2005 | |
| | | | | | | | | | | | | | | | | |
Net asset value, beginning of period | | $18.35 | | | $16.79 | | | $29.11 | | | $28.58 | | | $24.19 | | | $21.66 | |
Income (loss) from investment
operations | | | | | | | | | | |
Net investment income (loss) (d) | | $(0.01 | ) | | $0.04 | | | $0.07 | | | $0.08 | | | $0.25 | | | $(0.12 | ) |
Net realized and unrealized gain (loss) on investments and foreign currency | | 1.86 | | | 2.73 | | | (9.17 | ) | | 4.20 | | | 5.31 | | | 2.65 | |
Total from investment operations | | $1.85 | | | $2.77 | | | $(9.10 | ) | | $4.28 | | | $5.56 | | | $2.53 | |
Less distributions declared to
shareholders | | | | | | | | | | |
From net investment income | | $(0.07 | ) | | $(0.10 | ) | | $(0.03 | ) | | $(0.44 | ) | | $— | | | $— | |
From net realized gain on investments | | — | | | (1.11 | ) | | (3.19 | ) | | (3.31 | ) | | (1.17 | ) | | — | |
Total distributions declared to shareholders | | $(0.07 | ) | | $(1.21 | ) | | $(3.22 | ) | | $(3.75 | ) | | $(1.17 | ) | | $— | |
Net asset value, end of period | | $20.13 | | | $18.35 | | | $16.79 | | | $29.11 | | | $28.58 | | | $24.19 | |
Total return (%) (r)(s)(t) | | 10.07 | (n) | | 18.02 | | | (34.99 | ) | | 16.51 | | | 23.84 | | | 11.68 | |
Ratios (%) (to average net assets)
and Supplemental data: | | | | | | | | | | |
Expenses before expense reductions (f) | | 2.19 | (a) | | 2.28 | | | 2.19 | | | 2.21 | | | 2.20 | | | 2.30 | |
Expenses after expense reductions (f) | | 2.19 | (a) | | 2.28 | | | 2.19 | | | 2.21 | | | 2.20 | | | 2.30 | |
Net investment income (loss) | | (0.13 | )(a) | | 0.24 | | | 0.30 | | | 0.29 | | | 0.96 | | | (0.53 | ) |
Portfolio turnover | | 18 | | | 17 | | | 23 | | | 27 | | | 39 | | | 39 | |
Net assets at end of period (000 omitted) | | $29,910 | | | $27,990 | | | $26,139 | | | $50,903 | | | $41,351 | | | $33,975 | |
See Notes to Financial Statements
16
Financial Highlights – continued
| | | | | | | | | | | | | | | | | | |
| | | Six months
ended
4/30/10 (unaudited) | | | Years ended 10/31 | |
| Class I | | | 2009 | | | 2008 | | | 2007 | | | 2006 | | | 2005 | |
| | | | | | | | | | | | | | | | | |
Net asset value, beginning of period | | $20.76 | | | $18.92 | | | $32.33 | | | $31.32 | | | $26.15 | | | $23.23 | |
Income (loss) from investment
operations | | | | | | | | | | |
Net investment income (d) | | $0.14 | | | $0.23 | | | $0.34 | | | $0.40 | | | $0.56 | | | $0.12 | |
Net realized and unrealized gain (loss) on investments and foreign currency | | 2.05 | | | 3.08 | | | (10.30 | ) | | 4.62 | | | 5.78 | | | 2.85 | |
Total from investment operations | | $2.19 | | | $3.31 | | | $(9.96 | ) | | $5.02 | | | $6.34 | | | $2.97 | |
Less distributions declared to
shareholders | | | | | | | |
From net investment income | | $(0.23 | ) | | $(0.36 | ) | | $(0.26 | ) | | $(0.70 | ) | | $— | | | $(0.05 | ) |
From net realized gain on
investments | | — | | | (1.11 | ) | | (3.19 | ) | | (3.31 | ) | | (1.17 | ) | | — | |
Total distributions declared to shareholders | | $(0.23 | ) | | $(1.47 | ) | | $(3.45 | ) | | $(4.01 | ) | | $(1.17 | ) | | $(0.05 | ) |
Net asset value, end of period | | $22.72 | | | $20.76 | | | $18.92 | | | $32.33 | | | $31.32 | | | $26.15 | |
Total return (%) (r)(s) | | 10.59 | (n) | | 19.23 | | | (34.34 | ) | | 17.66 | | | 25.09 | | | 12.79 | |
Ratios (%) (to average net assets)
and Supplemental data: | | | | | | | | | | | | | |
Expenses before expense reductions (f) | | 1.18 | (a) | | 1.29 | | | 1.19 | | | 1.21 | | | 1.20 | | | 1.30 | |
Expenses after expense reductions (f) | | 1.18 | (a) | | 1.28 | | | 1.19 | | | 1.21 | | | 1.20 | | | 1.30 | |
Net investment income | | 1.24 | (a) | | 1.33 | | | 1.32 | | | 1.31 | | | 1.95 | | | 0.47 | |
Portfolio turnover | | 18 | | | 17 | | | 23 | | | 27 | | | 39 | | | 39 | |
Net assets at end of period
(000 omitted) | | $123,847 | | | $30,417 | | | $49,022 | | | $77,689 | | | $63,714 | | | $41,493 | |
See Notes to Financial Statements
17
Financial Highlights – continued
| | | | | | | | | | | | | | | | | | |
| | | Six months
ended
4/30/10
(unaudited) | | | Years ended 10/31 | |
| Class R1 | | | 2009 | | | 2008 | | | 2007 | | | 2006 | | | 2005 (i) | |
| | | | | | | | | | | | | | | | | |
Net asset value, beginning of period | | $18.61 | | | $17.02 | | | $29.60 | | | $29.06 | | | $24.61 | | | $23.89 | |
Income (loss) from investment
operations | | | | | | | | | | |
Net investment income (loss) (d) | | $(0.01 | ) | | $0.03 | | | $0.06 | | | $0.03 | | | $0.21 | | | $(0.15 | ) |
Net realized and unrealized gain (loss) on investments and foreign currency | | 1.88 | | | 2.78 | | | (9.31 | ) | | 4.29 | | | 5.41 | | | 0.87 | (g) |
Total from investment operations | | $1.87 | | | $2.81 | | | $(9.25 | ) | | $4.32 | | | $5.62 | | | $0.72 | |
Less distributions declared to
shareholders | | | | | | | | | | |
From net investment income | | $(0.07 | ) | | $(0.11 | ) | | $(0.14 | ) | | $(0.47 | ) | | $— | | | $— | |
From net realized gain on
investments | | — | | | (1.11 | ) | | (3.19 | ) | | (3.31 | ) | | (1.17 | ) | | — | |
Total distributions declared to shareholders | | $(0.07 | ) | | $(1.22 | ) | | $(3.33 | ) | | $(3.78 | ) | | $(1.17 | ) | | $— | |
Net asset value, end of period | | $20.41 | | | $18.61 | | | $17.02 | | | $29.60 | | | $29.06 | | | $24.61 | |
Total return (%) (r)(s) | | 10.09 | (n) | | 18.05 | | | (35.04 | ) | | 16.38 | | | 23.68 | | | 3.01 | (n) |
Ratios (%) (to average net assets)
and Supplemental data: | | | | | | | | | | |
Expenses before expense reductions (f) | | 2.19 | (a) | | 2.27 | | | 2.23 | | | 2.33 | | | 2.40 | | | 2.50 | (a) |
Expenses after expense reductions (f) | | 2.19 | (a) | | 2.27 | | | 2.23 | | | 2.30 | | | 2.30 | | | 2.47 | (a) |
Net investment income (loss) | | (0.14 | )(a) | | 0.22 | | | 0.26 | | | 0.12 | | | 0.78 | | | (1.06 | )(a) |
Portfolio turnover | | 18 | | | 17 | | | 23 | | | 27 | | | 39 | | | 39 | |
Net assets at end of period (000 omitted) | | $4,266 | | | $4,140 | | | $3,304 | | | $4,208 | | | $1,348 | | | $672 | |
See Notes to Financial Statements
18
Financial Highlights – continued
| | | | | | | | | | | | | | | | | | |
| | | Six months
ended
4/30/10
(unaudited) | | | Years ended 10/31 | |
| Class R2 | | | 2009 | | | 2008 | | | 2007 | | | 2006 | | | 2005 | |
| | | | | | | | | | | | | | | | | |
Net asset value, beginning of period | | $19.78 | | | $18.06 | | | $31.08 | | | $30.27 | | | $25.48 | | | $22.76 | |
Income (loss) from investment
operations | | | | | | | | | | |
Net investment income (loss) (d) | | $0.04 | | | $0.12 | | | $0.21 | | | $0.14 | | | $0.39 | | | $(0.06 | ) |
Net realized and unrealized gain (loss) on investments and foreign currency | | 2.01 | | | 2.94 | | | (9.88 | ) | | 4.52 | | | 5.57 | | | 2.78 | |
Total from investment operations | | $2.05 | | | $3.06 | | | $(9.67 | ) | | $4.66 | | | $5.96 | | | $2.72 | |
Less distributions declared to
shareholders | | | | | | | | | | |
From net investment income | | $(0.14 | ) | | $(0.23 | ) | | $(0.16 | ) | | $(0.54 | ) | | $— | | | $— | |
From net realized gain on investments | | — | | | (1.11 | ) | | (3.19 | ) | | (3.31 | ) | | (1.17 | ) | | — | |
Total distributions declared to shareholders | | $(0.14 | ) | | $(1.34 | ) | | $(3.35 | ) | | $(3.85 | ) | | $(1.17 | ) | | $— | |
Net asset value, end of period | | $21.69 | | | $19.78 | | | $18.06 | | | $31.08 | | | $30.27 | | | $25.48 | |
Total return (%) (r)(s) | | 10.42 | (n) | | 18.59 | | | (34.70 | ) | | 16.94 | | | 24.22 | | | 11.95 | |
Ratios (%) (to average net assets)
and Supplemental data: | | | | | | | | | | |
Expenses before expense reductions (f) | | 1.69 | (a) | | 1.78 | | | 1.71 | | | 1.88 | | | 1.94 | | | 2.06 | |
Expenses after expense reductions (f) | | 1.69 | (a) | | 1.78 | | | 1.71 | | | 1.85 | | | 1.84 | | | 2.05 | |
Net investment income (loss) | | 0.36 | (a) | | 0.74 | | | 0.83 | | | 0.48 | | | 1.42 | | | (0.25 | ) |
Portfolio turnover | | 18 | | | 17 | | | 23 | | | 27 | | | 39 | | | 39 | |
Net assets at end of period (000 omitted) | | $20,074 | | | $19,227 | | | $17,298 | | | $21,364 | | | $6,501 | | | $3,032 | |
See Notes to Financial Statements
19
Financial Highlights – continued
| | | | | | | | | | | | | | | | | | |
| | | Six months
ended
4/30/10
(unaudited) | | | Years ended 10/31 | |
| Class R3 | | | 2009 | | | 2008 | | | 2007 | | | 2006 | | | 2005 (i) | |
| | | | | | | | | | | | | | | | | |
Net asset value, beginning of period | | $20.20 | | | $18.41 | | | $31.56 | | | $30.71 | | | $25.77 | | | $24.90 | |
Income (loss) from investment
operations | | | | | | | | | | |
Net investment income (d) | | $0.07 | | | $0.16 | | | $0.26 | | | $0.24 | | | $0.04 | | | $0.02 | |
Net realized and unrealized gain (loss) on investments and foreign currency | | 2.04 | | | 3.02 | | | (10.05 | ) | | 4.56 | | | 6.07 | | | 0.85 | (g) |
Total from investment operations | | $2.11 | | | $3.18 | | | $(9.79 | ) | | $4.80 | | | $6.11 | | | $0.87 | |
Less distributions declared to
shareholders | | | | | | | | | | |
From net investment income | | $(0.19 | ) | | $(0.28 | ) | | $(0.17 | ) | | $(0.64 | ) | | $— | | | $— | |
From net realized gain on
investments | | — | | | (1.11 | ) | | (3.19 | ) | | (3.31 | ) | | (1.17 | ) | | — | |
Total distributions declared to shareholders | | $(0.19 | ) | | $(1.39 | ) | | $(3.36 | ) | | $(3.95 | ) | | $(1.17 | ) | | $— | |
Net asset value, end of period | | $22.12 | | | $20.20 | | | $18.41 | | | $31.56 | | | $30.71 | | | $25.77 | |
Total return (%) (r)(s) | | 10.47 | (n) | | 18.94 | | | (34.56 | ) | | 17.22 | | | 24.54 | | | 3.49 | (n) |
Ratios (%) (to average net assets)
and Supplemental data: | | | | | | | | | | |
Expenses before expense reductions (f) | | 1.44 | (a) | | 1.52 | | | 1.47 | | | 1.61 | | | 1.63 | | | 1.73 | (a) |
Expenses after expense reductions (f) | | 1.44 | (a) | | 1.52 | | | 1.47 | | | 1.61 | | | 1.63 | | | 1.73 | (a) |
Net investment income | | 0.66 | (a) | | 0.96 | | | 1.04 | | | 0.81 | | | 0.14 | | | 0.13 | (a) |
Portfolio turnover | | 18 | | | 17 | | | 23 | | | 27 | | | 39 | | | 39 | |
Net assets at end of period (000 omitted) | | $14,621 | | | $11,265 | | | $8,939 | | | $14,293 | | | $8,703 | | | $84 | |
See Notes to Financial Statements
20
Financial Highlights – continued
| | | | | | | | | | | | | | | | | | |
| | | Six months
ended
4/30/10
(unaudited) | | | Years ended 10/31 | |
| Class R4 | | | 2009 | | | 2008 | | | 2007 | | | 2006 | | | 2005 (i) | |
| | | | | | | | | | | | | | | | | |
Net asset value, beginning of period | | $20.37 | | | $18.56 | | | $31.80 | | | $30.86 | | | $25.81 | | | $24.90 | |
Income (loss) from investment
operations | | | | | | | | | | |
Net investment income (d) | | $0.10 | | | $0.22 | | | $0.37 | | | $0.05 | | | $0.53 | | | $0.08 | |
Net realized and unrealized gain
(loss) on investments and foreign
currency | | 2.05 | | | 3.03 | | | (10.17 | ) | | 4.87 | | | 5.69 | | | 0.83 | (g) |
Total from investment operations | | $2.15 | | | $3.25 | | | $(9.80 | ) | | $4.92 | | | $6.22 | | | $0.91 | |
Less distributions declared to
shareholders | | | | | | | | | | |
From net investment income | | $(0.23 | ) | | $(0.33 | ) | | $(0.25 | ) | | $(0.67 | ) | | $— | | | $— | |
From net realized gain on
investments | | — | | | (1.11 | ) | | (3.19 | ) | | (3.31 | ) | | (1.17 | ) | | — | |
Total distributions declared to
shareholders | | $(0.23 | ) | | $(1.44 | ) | | $(3.44 | ) | | $(3.98 | ) | | $(1.17 | ) | | $— | |
Net asset value, end of period | | $22.29 | | | $20.37 | | | $18.56 | | | $31.80 | | | $30.86 | | | $25.81 | |
Total return (%) (r)(s) | | 10.59 | (n) | | 19.25 | | | (34.40 | ) | | 17.58 | | | 24.95 | | | 3.65 | (n) |
Ratios (%) (to average net assets)
and Supplemental data: | | | | | | | | | | |
Expenses before expense reductions (f) | | 1.19 | (a) | | 1.28 | | | 1.23 | | | 1.31 | | | 1.29 | | | 1.44 | (a) |
Expenses after expense reductions (f) | | 1.19 | (a) | | 1.28 | | | 1.23 | | | 1.31 | | | 1.29 | | | 1.44 | (a) |
Net investment income | | 0.90 | (a) | | 1.25 | | | 1.39 | | | 0.23 | | | 1.88 | | | 0.54 | (a) |
Portfolio turnover | | 18 | | | 17 | | | 23 | | | 27 | | | 39 | | | 39 | |
Net assets at end of period
(000 omitted) | | $6,118 | | | $631 | | | $552 | | | $5,297 | | | $65 | | | $52 | |
Any redemption fees charged by the fund during the 2005 fiscal year resulted in a per share impact of less than $0.01.
| (d) | Per share data is based on average shares outstanding. |
| (f) | Ratios do not reflect reductions from fees paid indirectly, if applicable. |
| (g) | The per share amount varies from the net realized and unrealized gain/loss for the period because of the timing of sales of fund shares and the per share amount of realized and unrealized gains and losses at such time. |
| (i) | For the period from the class’ inception, April 1, 2005, through the stated period end. |
| (r) | Certain expenses have been reduced without which performance would have been lower. |
| (s) | From time to time the fund may receive proceeds from litigation settlements, without which performance would be lower. |
| (t) | Total returns do not include any applicable sales charges. |
See Notes to Financial Statements
21
NOTES TO FINANCIAL STATEMENTS
(unaudited)
| (1) | | Business and Organization |
MFS Global Equity Fund (the fund) is a series of MFS Series Trust VI (the trust). The trust is organized as a Massachusetts business trust and is registered under the Investment Company Act of 1940, as amended, as an open-end management investment company.
| (2) | | Significant Accounting Policies |
General – The preparation of financial statements in conformity with U.S. generally accepted accounting principles requires management to make estimates and assumptions that affect the reported amounts of assets and liabilities, and disclosure of contingent assets and liabilities at the date of the financial statements and the reported amounts of revenues and expenses during the reporting period. Actual results could differ from those estimates. In the preparation of these financial statements, management has evaluated subsequent events occurring after the date of the fund’s Statement of Assets and Liabilities through the date that the financial statements were issued. The fund can invest in foreign securities, including securities of emerging market issuers. Investments in foreign securities are vulnerable to the effects of changes in the relative values of the local currency and the U.S. dollar and to the effects of changes in each country’s legal, political, and economic environment. The markets of emerging markets countries are generally more volatile than the markets of developed countries with more mature economies. All of the risks of investing in foreign securities previously described are heightened when investing in emerging markets countries.
Investment Valuations – Equity securities, including restricted equity securities, are generally valued at the last sale or official closing price as provided by a third-party pricing service on the market or exchange on which they are primarily traded. Equity securities, for which there were no sales reported that day, are generally valued at the last quoted daily bid quotation as provided by a third-party pricing service on the market or exchange on which such securities are primarily traded. Equity securities held short, for which there were no sales reported for that day, are generally valued at the last quoted daily ask quotation as provided by a third-party pricing service on the market or exchange on which such securities are primarily traded. Short-term instruments with a maturity at issuance of 60 days or less generally are valued at amortized cost, which approximates market value. Open-end investment companies are generally valued at net asset value per share. Securities and other assets generally valued on the basis of information from a third-party pricing service may also be valued at a broker/dealer bid quotation. Values obtained from third-party pricing services can utilize both transaction data and
22
Notes to Financial Statements (unaudited) – continued
market information such as yield, quality, coupon rate, maturity, type of issue, trading characteristics, and other market data. The values of foreign securities and other assets and liabilities expressed in foreign currencies are converted to U.S. dollars using the mean of bid and asked prices for rates provided by a third-party pricing service.
The Board of Trustees has delegated primary responsibility for determining or causing to be determined the value of the fund’s investments (including any fair valuation) to the adviser pursuant to valuation policies and procedures approved by the Board. If the adviser determines that reliable market quotations are not readily available, investments are valued at fair value as determined in good faith by the adviser in accordance with such procedures under the oversight of the Board of Trustees. Under the fund’s valuation policies and procedures, market quotations are not considered to be readily available for most types of debt instruments and floating rate loans and many types of derivatives. These investments are generally valued at fair value based on information from third-party pricing services. In addition, investments may be valued at fair value if the adviser determines that an investment’s value has been materially affected by events occurring after the close of the exchange or market on which the investment is principally traded (such as foreign exchange or market) and prior to the determination of the fund’s net asset value, or after the halting of trading of a specific security where trading does not resume prior to the close of the exchange or market on which the security is principally traded. Events that occur on a frequent basis after foreign markets close (such as developments in foreign markets and significant movements in the U.S. markets) and prior to the determination of the fund’s net asset value may be deemed to have a material effect on the value of securities traded in foreign markets. Accordingly, the fund’s foreign equity securities may often be valued at fair value. The adviser generally relies on third-party pricing services or other information (such as the correlation with price movements of similar securities in the same or other markets; the type, cost and investment characteristics of the security; the business and financial condition of the issuer; and trading and other market data) to assist in determining whether to fair value and at what value to fair value an investment. The value of an investment for purposes of calculating the fund’s net asset value can differ depending on the source and method used to determine value. When fair valuation is used, the value of an investment used to determine the fund’s net asset value may differ from quoted or published prices for the same investment. There can be no assurance that the fund could obtain the fair value assigned to an investment if it were to sell the investment at the same time at which the fund determines its net asset value per share.
Various inputs are used in determining the value of the fund’s assets or liabilities. These inputs are categorized into three broad levels. In certain cases,
23
Notes to Financial Statements (unaudited) – continued
the inputs used to measure fair value may fall into different levels of the fair value hierarchy. In such cases, an investment’s level within the fair value hierarchy is based on the lowest level of input that is significant to the fair value measurement. The fund’s assessment of the significance of a particular input to the fair value measurement in its entirety requires judgment, and considers factors specific to the investment. Level 1 includes unadjusted quoted prices in active markets for identical assets or liabilities. Level 2 includes other significant observable market-based inputs (including quoted prices for similar securities, interest rates, prepayment speed, and credit risk). Level 3 includes unobservable inputs, which may include the adviser’s own assumptions in determining the fair value of investments. Other financial instruments are derivative instruments not reflected in total investments, such as futures, forwards, swap contracts, and written options. The following is a summary of the levels used as of April 30, 2010 in valuing the fund’s assets or liabilities:
| | | | | | | | |
| Investments at Value | | Level 1 | | Level 2 | | Level 3 | | Total |
| Equity Securities: | | | | | | | | |
United States | | $232,582,523 | | $ — | | $— | | $232,582,523 |
Switzerland | | 17,796,509 | | 41,391,226 | | — | | 59,187,735 |
France | | — | | 55,278,956 | | — | | 55,278,956 |
United Kingdom | | 12,166,027 | | 35,873,654 | | — | | 48,039,681 |
Germany | | 12,697,307 | | 21,770,335 | | — | | 34,467,642 |
Netherlands | | 6,396,698 | | 23,313,908 | | — | | 29,710,606 |
Japan | | 2,223,293 | | 27,481,507 | | — | | 29,704,800 |
Canada | | 8,132,397 | | — | | — | | 8,132,397 |
South Korea | | — | | 7,354,423 | | — | | 7,354,423 |
Other Countries | | 1,916,472 | | 17,167,939 | | — | | 19,084,411 |
| Short Term Securities | | — | | 60,299,227 | | — | | 60,299,227 |
| Mutual Funds | | 3,866,816 | | — | | — | | 3,866,816 |
| Total Investments | | $297,778,042 | | $289,931,175 | | $— | | $587,709,217 |
For further information regarding security characteristics, see the Portfolio of Investments.
Of the level 2 investments presented above, equity investments amounting to $33,025,372 were considered level 1 investments at the beginning of the period. Of the Level 1 investments presented above, equity investments amounting to $44,130,395 were considered level 2 investments at the beginning of the period. The primary reason for changes in the classifications between levels 1 and 2 occurs when foreign equity securities are fair valued using other observable market based inputs in place of the closing exchange price due to events occurring after the close of the exchange or market on which the investment is principally traded. The fund’s foreign equity securities may often be valued at fair value.
24
Notes to Financial Statements (unaudited) – continued
Repurchase Agreements – The fund may enter into repurchase agreements with approved counterparties. Each repurchase agreement is recorded at cost. The fund requires that the securities collateral in a repurchase transaction be transferred to a custodian. The fund monitors, on a daily basis, the value of the collateral to ensure that its value, including accrued interest, is greater than amounts owed to the fund under each such repurchase agreement.
Foreign Currency Translation – Purchases and sales of foreign investments, income, and expenses are converted into U.S. dollars based upon currency exchange rates prevailing on the respective dates of such transactions or on the reporting date for foreign denominated receivables and payables. Gains and losses attributable to foreign currency exchange rates on sales of securities are recorded for financial statement purposes as net realized gains and losses on investments. Gains and losses attributable to foreign exchange rate movements on receivables, payables, income and expenses are recorded for financial statement purposes as foreign currency transaction gains and losses. That portion of both realized and unrealized gains and losses on investments that results from fluctuations in foreign currency exchange rates is not separately disclosed.
Derivatives – The fund may use derivatives for different purposes, including to earn income and enhance returns, to increase or decrease exposure to a particular market, to manage or adjust the risk profile of the fund, or as alternatives to direct investments. Derivatives may be used for hedging or non-hedging purposes. While hedging can reduce or eliminate losses, it can also reduce or eliminate gains. When the fund uses derivatives as an investment to increase market exposure, or for hedging purposes, gains and losses from derivative instruments may be substantially greater than the derivative’s original cost.
Derivative instruments include written options, purchased options, futures contracts, forward foreign currency exchange contracts, and swap agreements. For the six months ended April 30, 2010, the fund did not invest in any derivative instruments.
Security Loans – JPMorgan Chase and Co. (“Chase”), as lending agent, may loan the securities of the fund to certain qualified institutions (the “Borrowers”) approved by the fund. The loans are collateralized by cash and/or U.S. Treasury and federal agency obligations in an amount typically at least equal to the market value of the securities loaned. The market value of the loaned securities is determined at the close of business of the fund and any additional required collateral is delivered to the fund on the next business day. Chase provides the fund with indemnification against Borrower default. The fund bears the risk of loss with respect to the investment of cash collateral. On loans collateralized by cash, the cash collateral is invested in short-term
25
Notes to Financial Statements (unaudited) – continued
securities. A portion of the income generated upon investment of the collateral is remitted to the Borrowers, and the remainder is allocated between the fund and the lending agent. On loans collateralized by U.S. Treasury and/or federal agency obligations, a fee is received from the Borrower, and is allocated between the fund and the lending agent. Income from securities lending is included in interest income on the Statement of Operations. The dividend and interest income earned on the securities loaned is accounted for in the same manner as other dividend and interest income.
Indemnifications – Under the fund’s organizational documents, its officers and Trustees may be indemnified against certain liabilities and expenses arising out of the performance of their duties to the fund. Additionally, in the normal course of business, the fund enters into agreements with service providers that may contain indemnification clauses. The fund’s maximum exposure under these agreements is unknown as this would involve future claims that may be made against the fund that have not yet occurred.
Investment Transactions and Income – Investment transactions are recorded on the trade date. Interest income is recorded on the accrual basis. All premium and discount is amortized or accreted for financial statement purposes in accordance with U.S. generally accepted accounting principles. Dividends received in cash are recorded on the ex-dividend date. Certain dividends from foreign securities will be recorded when the fund is informed of the dividend if such information is obtained subsequent to the ex-dividend date. Dividend and interest payments received in additional securities are recorded on the ex-dividend or ex-interest date in an amount equal to the value of the security on such date.
The fund may receive proceeds from litigation settlements. Any proceeds received from litigation involving portfolio holdings are reflected in the Statement of Operations in realized gain/loss if the security has been disposed of by the fund or in unrealized gain/loss if the security is still held by the fund. Any other proceeds from litigation not related to portfolio holdings are reflected as other income in the Statement of Operations.
Fees Paid Indirectly – The fund’s custody fee may be reduced according to an arrangement that measures the value of cash deposited with the custodian by the fund. This amount, for the six months ended April 30, 2010, is shown as a reduction of total expenses on the Statement of Operations.
Tax Matters and Distributions – The fund intends to qualify as a regulated investment company, as defined under Subchapter M of the Internal Revenue Code, and to distribute all of its taxable income, including realized capital gains. As a result, no provision for federal income tax is required. The fund’s federal tax returns for the prior three fiscal years remain subject to
26
Notes to Financial Statements (unaudited) – continued
examination by the Internal Revenue Service. Foreign taxes, if any, have been accrued by the fund in the accompanying financial statements.
Distributions to shareholders are recorded on the ex-dividend date. Income and capital gain distributions are determined in accordance with income tax regulations, which may differ from U.S. generally accepted accounting principles. Certain capital accounts in the financial statements are periodically adjusted for permanent differences in order to reflect their tax character. These adjustments have no impact on net assets or net asset value per share. Temporary differences which arise from recognizing certain items of income, expense, gain or loss in different periods for financial statement and tax purposes will reverse at some time in the future. Distributions in excess of net investment income or net realized gains are temporary overdistributions for financial statement purposes resulting from differences in the recognition or classification of income or distributions for financial statement and tax purposes.
Book/tax differences primarily relate to wash sale loss deferrals and foreign taxes.
The tax character of distributions made during the current period will be determined at fiscal year end. The tax character of distributions declared to shareholders for the last fiscal year is as follows:
| | |
| | | 10/31/09 |
Ordinary income (including any
short-term capital gains) | | $6,854,304 |
| Long-term capital gain | | 23,141,778 |
| Total distributions | | $29,996,082 |
The federal tax cost and the tax basis components of distributable earnings were as follows:
| | | |
| As of 4/30/10 | | | |
| Cost of investments | | $528,633,244 | |
| Gross appreciation | | 86,919,699 | |
| Gross depreciation | | (27,843,726 | ) |
| Net unrealized appreciation (depreciation) | | $59,075,973 | |
| |
| As of 10/31/09 | | | |
| Undistributed ordinary income | | 3,396,906 | |
| Capital loss carryforwards | | (12,098,244 | ) |
| Other temporary differences | | (25,130 | ) |
| Net unrealized appreciation (depreciation) | | 14,096,085 | |
The aggregate cost above includes prior fiscal year end tax adjustments, if applicable.
27
Notes to Financial Statements (unaudited) – continued
As of October 31, 2009, the fund had capital loss carryforwards available to offset future realized gains. Such losses expire as follows:
Multiple Classes of Shares of Beneficial Interest – The fund offers multiple classes of shares, which differ in their respective distribution and service fees. The fund’s income, realized and unrealized gain (loss), and common expenses are allocated to shareholders based on the daily net assets of each class. Dividends are declared separately for each class. Differences in per share dividend rates are generally due to differences in separate class expenses. Class B shares will convert to Class A shares approximately eight years after purchase. The fund’s distributions declared to shareholders as reported on the Statements of Changes in Net Assets are presented by class as follows:
| | | | | | | | |
| | | From net investment
income | | From net realized gain on
investments |
| | | Six months ended
4/30/10 | | Year ended
10/31/09 | | Six months ended
4/30/10 | | Year ended
10/31/09 |
| Class A | | $2,505,520 | | $3,942,190 | | $— | | $15,275,424 |
| Class B | | 49,134 | | 75,804 | | — | | 2,341,277 |
| Class C | | 97,806 | | 149,053 | | — | | 1,722,265 |
| Class I | | 419,862 | | 942,596 | | — | | 2,933,832 |
| Class J (f) | | N/A | | 28,315 | | N/A | | 384,108 |
| Class R1 | | 16,117 | | 21,512 | | — | | 216,806 |
| Class R2 | | 142,801 | | 219,417 | | — | | 1,052,907 |
| Class R3 | | 102,760 | | 129,672 | | — | | 518,575 |
| Class R4 | | 63,002 | | 9,665 | | — | | 32,664 |
| Total | | $3,397,002 | | $5,518,224 | | $— | | $24,477,858 |
| (f) | Class J shares closed on February 27, 2009. |
| (3) | | Transactions with Affiliates |
Investment Adviser – The fund has an investment advisory agreement with MFS to provide overall investment management and related administrative services and facilities to the fund.
The management fee is computed daily and paid monthly at the following annual rates:
| | | |
| First $1 billion of average daily net assets | | 0.90 | % |
| Next $1 billion of average daily net assets | | 0.75 | % |
| Average daily net assets in excess of $2 billion | | 0.65 | % |
The management fee incurred for the six months ended April 30, 2010 was equivalent to an annual effective rate of 0.90% of the fund’s average daily net assets.
28
Notes to Financial Statements (unaudited) – continued
Distributor – MFS Fund Distributors, Inc. (MFD), a wholly-owned subsidiary of MFS, as distributor, received $26,871 for the six months ended April 30, 2010, as its portion of the initial sales charge on sales of Class A shares of the fund.
The Board of Trustees has adopted a distribution plan for certain class shares pursuant to Rule 12b-1 of the Investment Company Act of 1940.
The fund’s distribution plan provides that the fund will pay MFD for services provided by MFD and financial intermediaries in connection with the distribution and servicing of certain share classes. One component of the plan is a distribution fee paid to MFD and another component of the plan is a service fee paid to MFD. MFD may subsequently pay all, or a portion, of the distribution and/or service fees to financial intermediaries.
Distribution Plan Fee Table:
| | | | | | | | | | | | | | |
| | | Distribution
Fee Rate (d) | | | Service
Fee Rate (d) | | | Total
Distribution
Plan (d) | | | Annual
Effective
Rate (e) | | | Distribution
and Service
Fee |
Class A | | — | | | 0.25 | % | | 0.25 | % | | 0.25 | % | | $367,392 |
Class B | | 0.75 | % | | 0.25 | % | | 1.00 | % | | 1.00 | % | | 149,281 |
Class C | | 0.75 | % | | 0.25 | % | | 1.00 | % | | 1.00 | % | | 145,365 |
Class R1 | | 0.75 | % | | 0.25 | % | | 1.00 | % | | 1.00 | % | | 21,318 |
Class R2 | | 0.25 | % | | 0.25 | % | | 0.50 | % | | 0.50 | % | | 51,400 |
Class R3 | | — | | | 0.25 | % | | 0.25 | % | | 0.25 | % | | 15,947 |
| Total Distribution and Service Fees | | | | | | | | | | | | $750,703 |
| (d) | In accordance with the distribution plan for certain classes, the fund pays distribution and/or service fees equal to these annual percentage rates of each class’ average daily net assets. The distribution and service fee rates disclosed by class represent the current rates in effect at the end of the reporting period. Any rate changes, if applicable, are detailed below. |
| (e) | The annual effective rates represent actual fees incurred under the distribution plan for the six months ended April 30, 2010 based on each class’ average daily net assets. |
Certain Class A shares are subject to a contingent deferred sales charge (CDSC) in the event of a shareholder redemption within 24 months of purchase. Class C shares are subject to a CDSC in the event of a shareholder redemption within 12 months of purchase. Class B shares are subject to a CDSC in the event of a shareholder redemption within six years of purchase. All contingent deferred sales charges are paid to MFD and during the six months ended April 30, 2010, were as follows:
| | |
| | | Amount |
| Class A | | $8 |
| Class B | | 17,227 |
| Class C | | 420 |
Shareholder Servicing Agent – MFS Service Center, Inc. (MFSC), a wholly-owned subsidiary of MFS, receives a fee from the fund for its services as shareholder servicing agent calculated as a percentage of the average daily net assets of the fund as determined periodically under the supervision of the
29
Notes to Financial Statements (unaudited) – continued
fund’s Board of Trustees. For the six months ended April 30, 2010, the fee was $170,765, which equated to 0.0733% annually of the fund’s average daily net assets. MFSC also receives payment from the fund for out-of-pocket expenses, sub-accounting and other shareholder servicing costs which may be paid to affiliated and unaffiliated service providers. For the six months ended April 30, 2010, these out-of-pocket expenses, sub-accounting and other shareholder servicing costs amounted to $260,463.
Administrator – MFS provides certain financial, legal, shareholder communications, compliance, and other administrative services to the fund. Under an administrative services agreement, the fund partially reimburses MFS the costs incurred to provide these services. The fund is charged an annual fixed amount of $17,500 plus a fee based on average daily net assets. The administrative services fee incurred for the six months ended April 30, 2010 was equivalent to an annual effective rate of 0.0165% of the fund’s average daily net assets.
Trustees’ and Officers’ Compensation – The fund pays compensation to independent Trustees in the form of a retainer, attendance fees, and additional compensation to Board and Committee chairpersons. The fund does not pay compensation directly to Trustees or officers of the fund who are also officers of the investment adviser, all of whom receive remuneration for their services to the fund from MFS. Certain officers and Trustees of the fund are officers or directors of MFS, MFD, and MFSC.
Prior to December 31, 2001, the fund had an unfunded defined benefit plan (“DB plan”) for independent Trustees. As of December 31, 2001, the Board took action to terminate the DB plan with respect to then-current and any future independent Trustees, such that the DB Plan covers only certain of those former independent Trustees who retired on or before December 31, 2001. Effective January 1, 2002, accrued benefits under the DB Plan for then-current independent Trustees who continued were credited to an unfunded retirement deferral plan (the “Retirement Deferral plan”), which was established for and exists solely with respect to these credited amounts, and is not available for other deferrals by these or other independent Trustees. Although the Retirement Deferral plan is unfunded, amounts deferred under the plan are periodically adjusted for investment experience as if they had been invested in shares of the fund. The DB Plan resulted in a pension expense of $1,209 and the Retirement Deferral plan resulted in an expense of $1,962. Both amounts are included in independent Trustees’ compensation for the six months ended April 30, 2010. The liability for deferred retirement benefits payable to certain independent Trustees under both plans amounted to $44,666 at April 30, 2010, and is included in payable for independent Trustees’ compensation on the Statement of Assets and Liabilities.
30
Notes to Financial Statements (unaudited) – continued
Other – This fund and certain other funds managed by MFS (the funds) have entered into services agreements (the Agreements) which provide for payment of fees by the funds to Tarantino LLC and Griffin Compliance LLC in return for the provision of services of an Independent Chief Compliance Officer (ICCO) and Assistant ICCO, respectively, for the funds. The ICCO and Assistant ICCO are officers of the funds and the sole members of Tarantino LLC and Griffin Compliance LLC, respectively. The funds can terminate the Agreements with Tarantino LLC and Griffin Compliance LLC at any time under the terms of the Agreements. For the six months ended April 30, 2010, the aggregate fees paid by the fund to Tarantino LLC and Griffin Compliance LLC were $2,717 and are included in miscellaneous expense on the Statement of Operations. MFS has agreed to reimburse the fund for a portion of the payments made by the fund in the amount of $1,006, which is shown as a reduction of total expenses in the Statement of Operations. Additionally, MFS has agreed to bear all expenses associated with office space, other administrative support, and supplies provided to the ICCO and Assistant ICCO.
The fund may invest in the MFS Institutional Money Market Portfolio which is managed by MFS and seeks a high level of current income consistent with preservation of capital and liquidity. Income earned on this investment is included in dividends from underlying funds on the Statement of Operations. This money market fund does not pay a management fee to MFS.
Purchases and sales of investments, other than U.S. Government securities, purchased option transactions, and short-term obligations, aggregated $155,083,544 and $81,819,738, respectively.
| (5) | | Shares of Beneficial Interest |
The fund’s Declaration of Trust permits the Trustees to issue an unlimited number of full and fractional shares of beneficial interest. Transactions in fund shares were as follows:
| | | | | | | | |
| | | Six months ended
4/30/10 | | Year ended
10/31/09 |
| | | Shares | | Amount | | Shares | | Amount |
| Shares sold | | | | | | | | |
Class A | | 1,042,530 | | $22,724,308 | | 2,510,880 | | $42,460,515 |
Class B | | 110,032 | | 2,236,775 | | 208,083 | | 3,359,888 |
Class C | | 128,476 | | 2,525,350 | | 223,886 | | 3,432,199 |
Class I | | 5,243,638 | | 115,122,422 | | 1,345,704 | | 25,170,599 |
Class J (f) | | N/A | | N/A | | 546 | | 8,423 |
Class R1 | | 15,396 | | 305,324 | | 49,237 | | 775,046 |
Class R2 | | 111,880 | | 2,360,628 | | 222,986 | | 3,694,023 |
Class R3 | | 209,270 | | 4,594,835 | | 176,420 | | 2,920,809 |
Class R4 | | 279,913 | | 6,012,024 | | 6,578 | | 114,499 |
| | 7,141,135 | | $155,881,666 | | 4,744,320 | | $81,936,001 |
31
Notes to Financial Statements (unaudited) – continued
| | | | | | | | | | | | |
| | | Six months ended
4/30/10 | | | Year ended
10/31/09 | |
| | | Shares | | | Amount | | | Shares | | | Amount | |
| Shares issued to shareholders in reinvestment of distributions | | | | | | | | | | | | |
Class A | | 109,239 | | | $2,326,782 | | | 1,076,556 | | | $17,946,135 | |
Class B | | 2,298 | | | 46,007 | | | 144,427 | | | 2,264,623 | |
Class C | | 4,368 | | | 84,433 | | | 102,679 | | | 1,556,612 | |
Class I | | 18,690 | | | 406,503 | | | 227,891 | | | 3,876,428 | |
Class J (f) | | N/A | | | N/A | | | 225 | | | 3,465 | |
Class R1 | | 814 | | | 15,963 | | | 15,495 | | | 238,318 | |
Class R2 | | 6,684 | | | 138,953 | | | 75,143 | | | 1,223,324 | |
Class R3 | | 4,849 | | | 102,760 | | | 39,075 | | | 648,247 | |
Class R4 | | 2,954 | | | 63,002 | | | 2,536 | | | 42,329 | |
| | 149,896 | | | $3,184,403 | | | 1,684,027 | | | $27,799,481 | |
| Shares reacquired | | | | | | | | | | | | |
Class A | | (1,633,912 | ) | | $(35,414,314 | ) | | (3,610,383 | ) | | $(60,136,121 | ) |
Class B | | (319,293 | ) | | (6,518,808 | ) | | (982,347 | ) | | (15,265,083 | ) |
Class C | | (172,105 | ) | | (3,342,272 | ) | | (358,451 | ) | | (5,364,955 | ) |
Class I | | (1,276,921 | ) | | (29,576,171 | ) | | (2,699,865 | ) | | (54,504,065 | ) |
Class J (f) | | N/A | | | N/A | | | (382,972 | ) | | (4,967,052 | ) |
Class R1 | | (29,630 | ) | | (589,911 | ) | | (36,348 | ) | | (542,946 | ) |
Class R2 | | (164,862 | ) | | (3,499,693 | ) | | (284,182 | ) | | (4,684,394 | ) |
Class R3 | | (110,733 | ) | | (2,355,188 | ) | | (143,339 | ) | | (2,375,596 | ) |
Class R4 | | (39,307 | ) | | (850,888 | ) | | (7,861 | ) | | (136,568 | ) |
| | (3,746,763 | ) | | $(82,147,245 | ) | | (8,505,748 | ) | | $(147,976,780 | ) |
| Net change | | | | | | | | | | | | |
Class A | | (482,143 | ) | | $(10,363,224 | ) | | (22,947 | ) | | $270,529 | |
Class B | | (206,963 | ) | | (4,236,026 | ) | | (629,837 | ) | | (9,640,572 | ) |
Class C | | (39,261 | ) | | (732,489 | ) | | (31,886 | ) | | (376,144 | ) |
Class I | | 3,985,407 | | | 85,952,754 | | | (1,126,270 | ) | | (25,457,038 | ) |
Class J (f) | | N/A | | | N/A | | | (382,201 | ) | | (4,955,164 | ) |
Class R1 | | (13,420 | ) | | (268,624 | ) | | 28,384 | | | 470,418 | |
Class R2 | | (46,298 | ) | | (1,000,112 | ) | | 13,947 | | | 232,953 | |
Class R3 | | 103,386 | | | 2,342,407 | | | 72,156 | | | 1,193,460 | |
Class R4 | | 243,560 | | | 5,224,138 | | | 1,253 | | | 20,260 | |
| | 3,544,268 | | | $76,918,824 | | | (2,077,401 | ) | | $(38,241,298 | ) |
| (f) | Class J shares closed on February 27, 2009. |
The fund and certain other funds managed by MFS participate in a $1.1 billion unsecured committed line of credit, subject to a $1 billion sublimit, provided by a syndication of banks under a credit agreement. Borrowings may be made for temporary financing needs. Interest is charged to each fund, based on its borrowings, generally at a rate equal to the higher of the Federal Reserve funds
32
Notes to Financial Statements (unaudited) – continued
rate or one month LIBOR plus an agreed upon spread. A commitment fee, based on the average daily, unused portion of the committed line of credit, is allocated among the participating funds at the end of each calendar quarter. In addition, the fund and other funds managed by MFS have established unsecured uncommitted borrowing arrangements with certain banks for temporary financing needs. Interest is charged to each fund, based on its borrowings, at a rate equal to the Federal Reserve funds rate plus an agreed upon spread. For the six months ended April 30, 2010, the fund’s commitment fee and interest expense were $3,490 and $0, respectively, and are included in miscellaneous expense on the Statement of Operations.
| (7) | | Transactions in Underlying Funds-Affiliated Issuers |
An affiliated issuer may be considered one in which the fund owns 5% or more of the outstanding voting securities, or a company which is under common control. For the purposes of this report, the fund assumes the following to be affiliated issuers:
| | | | | | | | | |
| Underlying Funds | | Beginning
Shares/Par
Amount | | Acquisitions
Shares/Par
Amount | | Dispositions
Shares/Par
Amount | | | Ending
Shares/Par
Amount |
| MFS Institutional Money Market Portfolio | | 2,272,358 | | 145,104,278 | | (143,509,820 | ) | | 3,866,816 |
| | | | |
| Underlying Funds | | Realized
Gain (Loss) | | Capital Gain
Distributions | | Dividend
Income | | | Ending
Value |
| MFS Institutional Money Market Portfolio | | $— | | $— | | $3,280 | | | $3,866,816 |
33
RESULTS OF SHAREHOLDER MEETING
(unaudited)
At a special meeting of shareholders of MFS Series Trust VI, which was held on January 28, 2010, the following actions were taken:
Item 1. To elect the following individuals as Trustees:
| | | | |
| | | Number of Dollars |
Nominee | | For | | Withheld Authority |
| Robert E. Butler | | 2,411,252,799.370 | | 47,579,338.071 |
| Lawrence H. Cohn, M.D. | | 2,410,483,391.074 | | 48,348,746.367 |
| Maureen R. Goldfarb | | 2,410,831,816.711 | | 48,000,320.729 |
| David H. Gunning | | 2,411,089,708.057 | | 47,742,429.383 |
| William R. Gutow | | 2,411,301,100.675 | | 47,531,036.765 |
| Michael Hegarty | | 2,411,246,863.087 | | 47,585,274.353 |
| John P. Kavanaugh | | 2,411,407,913.952 | | 47,424,223.489 |
| Robert J. Manning | | 2,411,252,528.550 | | 47,579,608.891 |
| Robert C. Pozen | | 2,411,438,532.476 | | 47,393,604.964 |
| J. Dale Sherratt | | 2,410,865,242.225 | | 47,966,895.216 |
| Laurie J. Thomsen | | 2,411,131,252.551 | | 47,700,884.890 |
| Robert W. Uek | | 2,411,143,493.112 | | 47,688,644.329 |
34
BOARD REVIEW OF INVESTMENT ADVISORY AGREEMENT
A discussion regarding the Board’s most recent review and renewal of the fund’s Investment Advisory Agreement with MFS is available by clicking on the fund’s name under “Mutual Funds” in the “Products and Performance” section of the MFS Web site (mfs.com).
PROXY VOTING POLICIES AND INFORMATION
A general description of the MFS funds’ proxy voting policies and procedures is available without charge, upon request, by calling
1-800-225-2606, by visiting the Proxy Voting section of mfs.com or by visiting the SEC’s Web site at http://www.sec.gov.
Information regarding how the fund voted proxies relating to portfolio securities during the most recent twelve-month period ended June 30 is available without charge by visiting the Proxy Voting section of mfs.com or by visiting the SEC’s Web site at http://www.sec.gov.
QUARTERLY PORTFOLIO DISCLOSURE
The fund will file a complete schedule of portfolio holdings with the Securities and Exchange Commission (the Commission) for the first and third quarters of each fiscal year on Form N-Q. The fund’s Form N-Q may be reviewed and copied at the:
Public Reference Room
Securities and Exchange Commission
100 F Street, NE, Room 1580
Washington, D.C. 20549
Information on the operation of the Public Reference Room may be obtained by calling the Commission at 1-800-SEC-0330. The fund’s Form N-Q is available on the EDGAR database on the Commission’s Internet Web site at http://www.sec.gov, and copies of this information may be obtained, upon payment of a duplicating fee, by electronic request at the following e-mail address: publicinfo@sec.gov or by writing the Public Reference Section at the above address.
A shareholder can also obtain the quarterly portfolio holdings report at mfs.com.
FURTHER INFORMATION
From time to time, MFS may post important information about the fund or the MFS funds on the MFS web site (mfs.com). This information is available by visiting the “News & Commentary” section of mfs.com or by clicking on the fund’s name under “Mutual Funds” in the “Products and Performance” section of mfs.com.
35
CONTACT US
Web site
mfs.com
MFS TALK
1-800-637-8255
24 hours a day
Account service and literature
Shareholders
1-800-225-2606
Investment professionals
1-800-343-2829
Retirement plan services
1-800-637-1255
Mailing address
MFS Service Center, Inc.
P.O. Box 55824
Boston, MA 02205-5824
Overnight mail
MFS Service Center, Inc.
c/o Boston Financial Data Services
30 Dan Road
Canton, MA 02021-2809

Save paper with eDelivery. MFS® will send you prospectuses, reports, and proxies directly via e-mail so you will get information faster with less mailbox clutter. To sign up: 1. go to mfs.com. 2. log in via MFS® Access. 3. select eDelivery. If you own your MFS fund shares through a financial institution or a retirement plan, MFS® TALK, MFS Access, and eDelivery may not be available to you.


MFS® Global Total Return Fund
The report is prepared for the general information of shareholders. It is authorized for distribution to prospective investors only when preceded or accompanied by a current prospectus.
NOT FDIC INSURED Ÿ MAY LOSE VALUE Ÿ
NO BANK GUARANTEE
4/30/10
MWT-SEM

LETTER FROM THE CEO
Dear Shareholders:
After having suffered their biggest declines since the Great Depression, most global markets experienced an impressive resurgence during the latter months of 2009 and the first quarter of 2010. The global economy was able to reap the benefits of two major trends. The first of these was the massive efforts of governments and central banks to increase liquidity in the financial system as they sought to prevent the credit crisis from further affecting the banking system. The second was the move by companies around the world to cut costs and operations to prepare for rapidly changing market conditions. We believe that these moves not only shortened the length of the downturn but also set the stage for recovery.
Even with the significant market gains of 2009 and the early part of 2010, the recovery is unrolling at a moderate pace, with rebounds in the manufacturing sector and corporate America leading the way. Central bankers are proceeding with caution and have held benchmark interest rates unchanged as they debate the best way to withdraw stimulus measures without disrupting the fragile growth process.
While hurdles remain, we believe that the global economy is on the road to recovery. As always, we continue to be mindful of the many challenges faced at the individual, national, and international levels. It is at times such as these that we want to remind investors of the merits of maintaining a long-term view, adhering to basic investing principles such as asset allocation and diversification, and working closely with advisors to identify and research investment opportunities. At MFS®, we take particular pride in how well mutual funds can help investors by providing the diversification that is important in any type of market climate.
Respectfully,

Robert J. Manning
Chief Executive Officer and Chief Investment Officer
MFS Investment Management®
June 15, 2010
The opinions expressed in this letter are subject to change, may not be relied upon for investment advice, and no forecasts can be guaranteed.
1
PORTFOLIO COMPOSITION
Portfolio structure (i)
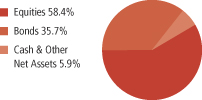
| | |
| Top ten holdings (i) | | |
| Government of Japan, 1.7%, 2017 | | 2.1% |
| Federal Republic of Germany, 4.25%, 2018 | | 1.8% |
| Lockheed Martin Corp. | | 1.5% |
| Vodafone Group PLC | | 1.5% |
| Government of Japan, 1.3%, 2014 | | 1.4% |
| Johnson & Johnson | | 1.3% |
| Sanofi-Aventis S.A. | | 1.3% |
| Republic of Italy, 4.75%, 2013 | | 1.2% |
| Roche Holding AG | | 1.2% |
| Nestle S.A. | | 1.2% |
| |
| Composition including fixed income credit quality (a)(i) | | |
| AAA | | 16.7% |
| AA | | 9.2% |
| A | | 3.3% |
| BBB | | 5.8% |
| BB | | 0.7% |
| Equity | | 58.4% |
| Other | | 5.9% |
| | |
| Equity sectors | | |
| Financial Services | | 11.0% |
| Consumer Staples | | 8.5% |
| Health Care | | 8.4% |
| Industrial Goods & Services | | 5.8% |
| Energy | | 5.5% |
| Utilities & Communications | | 5.4% |
| Technology | | 4.3% |
| Special Products & Services | | 2.4% |
| Leisure | | 2.3% |
| Transportation | | 1.6% |
| Retailing | | 1.2% |
| Basic Materials | | 1.1% |
| Autos & Housing | | 0.9% |
| |
| Fixed income sectors (i) | | |
| Non-U.S. Government Bonds | | 17.4% |
| High Grade Corporates | | 7.9% |
| Mortgage-Backed Securities | | 3.9% |
| Emerging Markets Bonds | | 2.1% |
| U.S. Treasury Securities | | 1.7% |
| Commercial Mortgage-Backed Securities | | 1.4% |
| U.S. Government Agencies | | 0.7% |
| High Yield Corporates | | 0.5% |
| Municipal Bonds | | 0.1% |
| |
| Country weightings (i) | | |
| United States | | 46.2% |
| Japan | | 12.1% |
| United Kingdom | | 8.9% |
| Germany | | 5.6% |
| France | | 5.0% |
| Switzerland | | 4.8% |
| Netherlands | | 4.1% |
| Italy | | 2.9% |
| Ireland | | 1.3% |
| Other Countries | | 9.1% |
2
Portfolio Composition – continued
| (a) | Included in the rating categories are: (1) debt securities and fixed income structured products which have long-term public ratings; (2) U.S. Government Securities (all of which are given AAA ratings); and (3) credit default swaps, if applicable, for which the underlying security has a long term public rating. U.S. Government Securities consist of U.S. Treasury securities, and certain securities issued by certain U.S. government agencies or U.S. government-sponsored entities. All rated securities are assigned a rating in accordance with the following ratings hierarchy: If a security is rated by Moody’s, then that rating is used; if not rated by Moody’s, then a Standard & Poor’s rating is used; if not rated by S&P, then a Fitch rating is used. Any equity securities are listed separately. The “Other” category includes cash, other assets, liabilities (including any derivative offsets), short-term and unrated debt securities. Ratings from Moody’s (e.g., Aaa) are shown in the S&P and Fitch scale (e.g. AAA). All ratings are subject to change. |
| (i) | For purposes of this presentation, the components include the market value of securities and reflect the impact of the equivalent exposure of derivative positions, if applicable. These amounts may be negative from time to time. The bond component will include any accrued interest amounts. Equivalent exposure is a calculated amount that translates the derivative position into a reasonable approximation of the amount of the underlying asset that the portfolio would have to hold at a given point in time to have the same price sensitivity that results from the portfolio’s ownership of the derivative contract. When dealing with derivatives, equivalent exposure is a more representative measure of the potential impact of a position on portfolio performance than market value. |
Percentages are based on net assets as of 4/30/10, unless otherwise noted.
The portfolio is actively managed and current holdings may be different.
3
MARKET ENVIRONMENT
After having suffered through one of the largest and most concentrated downturns since the 1930s, most asset markets staged a remarkable rebound during 2009 and early 2010. This recovery in global activity, which covers this reporting period, has been led importantly by emerging Asian economies, but broadening to include most of the global economy to varying degrees. Primary drivers of the recovery included an unwinding of the inventory destocking that took place earlier, the production of manufacturing and capital goods, as well as massive fiscal and monetary stimulus.
During the worst of the credit crisis, policy makers globally loosened monetary and fiscal policy on a massive scale. Having reached their lower bound on policy rates prior to the beginning of the reporting period, several central banks were implementing quantitative easing as a means to further loosen monetary policy to offset the continuing fall in global economic activity. However, by the beginning of the period, there were ever-broadening signs that the global macroeconomic deterioration had passed, which caused the subsequent rise in asset valuations. As most asset prices rebounded during the period and the demand for liquidity waned, the debate concerning the existence of asset bubbles and the need for monetary exit strategies had begun, creating added uncertainty regarding the forward path of policy rates. Nonetheless, risky-asset valuation generally hit secular highs by the end of the period.
4
EXPENSE TABLE
Fund expenses borne by the shareholders during the period,
November 1, 2009 through April 30, 2010
As a shareholder of the fund, you incur two types of costs: (1) transaction costs, including sales charges (loads) on certain purchase or redemption payments, and (2) ongoing costs, including management fees; distribution and service (12b-1) fees; and other fund expenses. This example is intended to help you understand your ongoing costs (in dollars) of investing in the fund and to compare these costs with the ongoing costs of investing in other mutual funds.
The example is based on an investment of $1,000 invested at the beginning of the period and held for the entire period November 1, 2009 through April 30, 2010.
Actual Expenses
The first line for each share class in the following table provides information about actual account values and actual expenses. You may use the information in this line, together with the amount you invested, to estimate the expenses that you paid over the period. Simply divide your account value by $1,000 (for example, an $8,600 account value divided by $1,000 = 8.6), then multiply the result by the number in the first line under the heading entitled “Expenses Paid During Period” to estimate the expenses you paid on your account during this period.
Hypothetical Example for Comparison Purposes
The second line for each share class in the following table provides information about hypothetical account values and hypothetical expenses based on the fund’s actual expense ratio and an assumed rate of return of 5% per year before expenses, which is not the fund’s actual return. The hypothetical account values and expenses may not be used to estimate the actual ending account balance or expenses you paid for the period. You may use this information to compare the ongoing costs of investing in the fund and other funds. To do so, compare this 5% hypothetical example with the 5% hypothetical examples that appear in the shareholder reports of the other funds.
Please note that the expenses shown in the table are meant to highlight your ongoing costs only and do not reflect any transactional costs, such as sales charges (loads). Therefore, the second line for each share class in the table is useful in comparing ongoing costs only, and will not help you determine the relative total costs of owning different funds. In addition, if these transactional costs were included, your costs would have been higher.
5
Expense Table – continued
| | | | | | | | | | |
Share
Class | | | | Annualized Expense Ratio | | Beginning Account Value 11/01/09 | | Ending Account Value 4/30/10 | | Expenses Paid During Period (p) 11/01/09-4/30/10 |
| A | | Actual | | 1.25% | | $1,000.00 | | $1,039.64 | | $6.32 |
| | Hypothetical (h) | | 1.25% | | $1,000.00 | | $1,018.60 | | $6.26 |
| B | | Actual | | 2.00% | | $1,000.00 | | $1,035.72 | | $10.09 |
| | Hypothetical (h) | | 2.00% | | $1,000.00 | | $1,014.88 | | $9.99 |
| C | | Actual | | 2.00% | | $1,000.00 | | $1,036.21 | | $10.10 |
| | Hypothetical (h) | | 2.00% | | $1,000.00 | | $1,014.88 | | $9.99 |
| I | | Actual | | 1.00% | | $1,000.00 | | $1,042.05 | | $5.06 |
| | Hypothetical (h) | | 1.00% | | $1,000.00 | | $1,019.84 | | $5.01 |
| R1 | | Actual | | 2.00% | | $1,000.00 | | $1,036.33 | | $10.10 |
| | Hypothetical (h) | | 2.00% | | $1,000.00 | | $1,014.88 | | $9.99 |
| R2 | | Actual | | 1.50% | | $1,000.00 | | $1,038.63 | | $7.58 |
| | Hypothetical (h) | | 1.50% | | $1,000.00 | | $1,017.36 | | $7.50 |
| R3 | | Actual | | 1.25% | | $1,000.00 | | $1,039.72 | | $6.32 |
| | Hypothetical (h) | | 1.25% | | $1,000.00 | | $1,018.60 | | $6.26 |
| R4 | | Actual | | 1.00% | | $1,000.00 | | $1,040.90 | | $5.06 |
| | Hypothetical (h) | | 1.00% | | $1,000.00 | | $1,019.84 | | $5.01 |
| (h) | 5% class return per year before expenses. |
| (p) | Expenses paid is equal to each class’ annualized expense ratio, as shown above, multiplied by the average account value over the period, multiplied by the number of days in the period, divided by the number of days in the year. Expenses paid do not include any applicable sales charges (loads). If these transaction costs had been included, your costs would have been higher. |
6
PORTFOLIO OF INVESTMENTS
4/30/10 (unaudited)
The Portfolio of Investments is a complete list of all securities owned by your fund. It is categorized by broad-based asset classes.
| | | | | |
| Common Stocks - 58.4% | | | | | |
| Issuer | | Shares/Par | | Value ($) |
| | | | | |
| Aerospace - 3.5% | | | | | |
| Cobham PLC | | 824,750 | | $ | 3,344,222 |
| Lockheed Martin Corp. | | 136,740 | | | 11,607,859 |
| Northrop Grumman Corp. | | 83,490 | | | 5,663,127 |
| United Technologies Corp. | | 72,870 | | | 5,461,607 |
| | | | | |
| | | | | $ | 26,076,815 |
| Alcoholic Beverages - 1.0% | | | | | |
| Heineken N.V. (l) | | 155,070 | | $ | 7,198,084 |
| | |
| Apparel Manufacturers - 0.5% | | | | | |
| NIKE, Inc., “B” | | 46,070 | | $ | 3,497,174 |
| | |
| Broadcasting - 2.1% | | | | | |
| Fuji Television Network, Inc. | | 1,098 | | $ | 1,779,056 |
| Nippon Television Network Corp. | | 12,790 | | | 1,917,104 |
| Omnicom Group, Inc. | | 70,470 | | | 3,006,250 |
| Vivendi S.A. (l) | | 176,098 | | | 4,634,835 |
| Walt Disney Co. | | 122,780 | | | 4,523,215 |
| | | | | |
| | | | | $ | 15,860,460 |
| Brokerage & Asset Managers - 0.4% | | | | | |
| Daiwa Securities Group, Inc. | | 622,000 | | $ | 3,221,116 |
| | |
| Business Services - 2.1% | | | | | |
| Accenture Ltd., “A” | | 116,100 | | $ | 5,066,604 |
| Bunzl PLC | | 207,260 | | | 2,420,018 |
| Dun & Bradstreet Corp. | | 30,040 | | | 2,312,179 |
| Nomura Research Institute Ltd. | | 101,800 | | | 2,612,868 |
| USS Co. Ltd. | | 47,330 | | | 3,232,045 |
| | | | | |
| | | | | $ | 15,643,714 |
| Chemicals - 1.1% | | | | | |
| 3M Co. | | 26,550 | | $ | 2,354,189 |
| Givaudan S.A. | | 3,610 | | | 3,142,452 |
| PPG Industries, Inc. | | 40,640 | | | 2,859,837 |
| | | | | |
| | | | | $ | 8,356,478 |
7
Portfolio of Investments (unaudited) – continued
| | | | | |
| Issuer | | Shares/Par | | Value ($) |
| | | | | |
| Common Stocks - continued | | | | | |
| Computer Software - 0.6% | | | | | |
| Oracle Corp. | | 175,620 | | $ | 4,538,021 |
| | |
| Computer Software - Systems - 1.1% | | | | | |
| International Business Machines Corp. | | 32,110 | | $ | 4,142,190 |
| Konica Minolta Holdings, Inc. | | 333,000 | | | 4,191,904 |
| | | | | |
| | | | | $ | 8,334,094 |
| Conglomerates - 0.3% | | | | | |
| Tomkins PLC | | 669,670 | | $ | 2,548,202 |
| | |
| Construction - 0.9% | | | | | |
| Geberit AG | | 21,934 | | $ | 3,901,333 |
| Sherwin-Williams Co. | | 38,500 | | | 3,005,695 |
| | | | | |
| | | | | $ | 6,907,028 |
| Consumer Products - 2.4% | | | | | |
| Henkel KGaA, IPS | | 82,990 | | $ | 4,440,921 |
| Kao Corp. | | 232,500 | | | 5,627,675 |
| Kose Corp. | | 103,800 | | | 2,416,499 |
| Procter & Gamble Co. | | 41,285 | | | 2,566,276 |
| Reckitt Benckiser Group PLC | | 50,330 | | | 2,612,119 |
| | | | | |
| | | | | $ | 17,663,490 |
| Electrical Equipment - 0.8% | | | | | |
| Legrand S.A. | | 94,370 | | $ | 3,061,367 |
| Spectris PLC | | 222,140 | | | 3,056,067 |
| | | | | |
| | | | | $ | 6,117,434 |
| Electronics - 1.7% | | | | | |
| Halma PLC | | 293,110 | | $ | 1,221,640 |
| Intel Corp. | | 169,220 | | | 3,863,293 |
| Samsung Electronics Co. Ltd. | | 6,092 | | | 4,607,481 |
| Taiwan Semiconductor Manufacturing Co. Ltd., ADR | | 317,374 | | | 3,360,991 |
| | | | | |
| | | | | $ | 13,053,405 |
| Energy - Independent - 1.4% | | | | | |
| Apache Corp. | | 33,680 | | $ | 3,427,277 |
| Devon Energy Corp. | | 40,030 | | | 2,695,220 |
| EOG Resources, Inc. | | 20,500 | | | 2,298,460 |
| INPEX Corp. | | 343 | | | 2,424,679 |
| | | | | |
| | | | | $ | 10,845,636 |
8
Portfolio of Investments (unaudited) – continued
| | | | | |
| Issuer | | Shares/Par | | Value ($) |
| | | | | |
| Common Stocks - continued | | | | | |
| Energy - Integrated - 3.9% | | | | | |
| Chevron Corp. | | 101,470 | | $ | 8,263,717 |
| Exxon Mobil Corp. | | 47,550 | | | 3,226,267 |
| Hess Corp. | | 43,930 | | | 2,791,751 |
| Royal Dutch Shell PLC, “A” | | 266,860 | | | 8,349,588 |
| TOTAL S.A. | | 125,390 | | | 6,794,504 |
| | | | | |
| | | | | $ | 29,425,827 |
| Food & Beverages - 3.2% | | | | | |
| General Mills, Inc. | | 36,360 | | $ | 2,588,105 |
| Groupe Danone (l) | | 47,880 | | | 2,826,063 |
| J.M. Smucker Co. | | 28,023 | | | 1,711,365 |
| Kellogg Co. | | 60,440 | | | 3,320,574 |
| Nestle S.A. | | 176,876 | | | 8,632,344 |
| Nong Shim Co. Ltd. | | 8,306 | | | 1,599,974 |
| PepsiCo, Inc. | | 49,000 | | | 3,195,780 |
| | | | | |
| | | | | $ | 23,874,205 |
| Food & Drug Stores - 0.7% | | | | | |
| CVS Caremark Corp. | | 72,730 | | $ | 2,685,919 |
| Lawson, Inc. | | 63,100 | | | 2,794,443 |
| | | | | |
| | | | | $ | 5,480,362 |
| Insurance - 4.0% | | | | | |
| Allstate Corp. | | 114,330 | | $ | 3,735,161 |
| Aon Corp. | | 51,100 | | | 2,169,706 |
| Hiscox Ltd. | | 418,519 | | | 2,136,865 |
| ING Groep N.V. (a) | | 266,740 | | | 2,387,688 |
| Jardine Lloyd Thompson Group PLC | | 267,480 | | | 2,261,900 |
| MetLife, Inc. | | 156,680 | | | 7,141,474 |
| Muenchener Ruckversicherungs-Gesellschaft AG (l) | | 17,030 | | | 2,408,042 |
| Prudential Financial, Inc. | | 48,050 | | | 3,054,058 |
| Travelers Cos., Inc. | | 36,180 | | | 1,835,773 |
| Zurich Financial Services AG | | 13,490 | | | 3,007,661 |
| | | | | |
| | | | | $ | 30,138,328 |
| Leisure & Toys - 0.2% | | | | | |
| Hasbro, Inc. | | 29,690 | | $ | 1,138,908 |
| | |
| Machinery & Tools - 1.5% | | | | | |
| ASSA ABLOY AB, “B” (l) | | 180,890 | | $ | 4,207,269 |
| GLORY Ltd. | | 94,100 | | | 2,412,230 |
| Neopost S.A. | | 30,860 | | | 2,453,155 |
| Schindler Holding AG | | 22,060 | | | 1,939,464 |
| | | | | |
| | | | | $ | 11,012,118 |
9
Portfolio of Investments (unaudited) – continued
| | | | | |
| Issuer | | Shares/Par | | Value ($) |
| | | | | |
| Common Stocks - continued | | | | | |
| Major Banks - 5.4% | | | | | |
| Bank of America Corp. | | 138,030 | | $ | 2,461,075 |
| Bank of New York Mellon Corp. | | 226,058 | | | 7,037,186 |
| Credit Agricole S.A. | | 156,845 | | | 2,237,460 |
| Goldman Sachs Group, Inc. | | 33,270 | | | 4,830,804 |
| HSBC Holdings PLC | | 433,250 | | | 4,413,689 |
| JPMorgan Chase & Co. | | 130,140 | | | 5,541,361 |
| PNC Financial Services Group, Inc. | | 37,420 | | | 2,514,998 |
| State Street Corp. | | 77,980 | | | 3,392,130 |
| Sumitomo Mitsui Financial Group, Inc. | | 55,100 | | | 1,817,827 |
| UniCredito Italiano S.p.A. | | 754,092 | | | 1,977,862 |
| Wells Fargo & Co. | | 126,230 | | | 4,179,475 |
| | | | | |
| | | | | $ | 40,403,867 |
| Medical & Health Technology & Services - 0.6% | | | | | |
| Kobayashi Pharmaceutical Co. Ltd. | | 43,800 | | $ | 1,767,201 |
| Miraca Holdings, Inc. | | 74,400 | | | 2,385,929 |
| | | | | |
| | | | | $ | 4,153,130 |
| Medical Equipment - 1.5% | | | | | |
| Becton, Dickinson & Co. | | 24,030 | | $ | 1,835,171 |
| Medtronic, Inc. | | 69,150 | | | 3,021,164 |
| Smith & Nephew PLC | | 240,907 | | | 2,500,835 |
| St. Jude Medical, Inc. (a) | | 55,660 | | | 2,272,041 |
| Synthes, Inc. | | 17,040 | | | 1,942,859 |
| | | | | |
| | | | | $ | 11,572,070 |
| Network & Telecom - 0.9% | | | | | |
| Ericsson, Inc., “B” | | 301,320 | | $ | 3,506,914 |
| Nokia Oyj (l) | | 291,530 | | | 3,547,983 |
| | | | | |
| | | | | $ | 7,054,897 |
| Oil Services - 0.2% | | | | | |
| National Oilwell Varco, Inc. | | 37,250 | | $ | 1,640,118 |
| | |
| Other Banks & Diversified Financials - 1.1% | | | | | |
| Bangkok Bank Public Co. Ltd. | | 455,900 | | $ | 1,684,592 |
| DnB NOR A.S.A. (l) | | 272,000 | | | 3,200,712 |
| Hachijuni Bank Ltd. | | 180,000 | | | 1,013,680 |
| Sapporo Hokuyo Holdings, Inc. | | 217,400 | | | 1,000,352 |
| Unione di Banche Italiane Scpa | | 91,038 | | | 1,126,005 |
| | | | | |
| | | | | $ | 8,025,341 |
10
Portfolio of Investments (unaudited) – continued
| | | | | |
| Issuer | | Shares/Par | | Value ($) |
| | | | | |
| Common Stocks - continued | | | | | |
| Pharmaceuticals - 6.3% | | | | | |
| Abbott Laboratories | | 127,720 | | $ | 6,534,155 |
| GlaxoSmithKline PLC | | 266,960 | | | 4,946,477 |
| Hisamitsu Pharmaceutical Co., Inc. | | 17,600 | | | 650,152 |
| Johnson & Johnson | | 151,190 | | | 9,721,517 |
| Merck KGaA | | 19,030 | | | 1,563,605 |
| Pfizer, Inc. | | 253,640 | | | 4,240,861 |
| Roche Holding AG | | 55,390 | | | 8,755,135 |
| Sanofi-Aventis S.A. | | 136,960 | | | 9,378,116 |
| Santen Pharmaceutical Co. Ltd. | | 55,200 | | | 1,762,921 |
| | | | | |
| | | | | $ | 47,552,939 |
| Railroad & Shipping - 0.3% | | | | | |
| Canadian National Railway Co. | | 36,300 | | $ | 2,170,377 |
| | |
| Real Estate - 0.1% | | | | | |
| Deutsche Wohnen AG (a) | | 119,110 | | $ | 1,078,405 |
| | |
| Telecommunications - Wireless - 2.3% | | | | | |
| KDDI Corp. | | 1,210 | | $ | 5,867,408 |
| Vodafone Group PLC | | 5,146,635 | | | 11,445,744 |
| | | | | |
| | | | | $ | 17,313,152 |
| Telephone Services - 1.8% | | | | | |
| AT&T, Inc. | | 251,100 | | $ | 6,543,666 |
| China Unicom Ltd. | | 1,046,000 | | | 1,304,612 |
| Royal KPN N.V. | | 395,190 | | | 5,908,632 |
| | | | | |
| | | | | $ | 13,756,910 |
| Tobacco - 1.9% | | | | | |
| British American Tobacco PLC | | 129,190 | | $ | 4,060,083 |
| Japan Tobacco, Inc. | | 892 | | | 3,084,115 |
| Philip Morris International, Inc. | | 142,700 | | | 7,003,716 |
| | | | | |
| | | | | $ | 14,147,914 |
| Trucking - 1.3% | | | | | |
| TNT N.V. | | 141,098 | | $ | 4,335,923 |
| Yamato Holdings Co. Ltd. | | 356,400 | | | 5,125,847 |
| | | | | |
| | | | | $ | 9,461,770 |
11
Portfolio of Investments (unaudited) – continued
| | | | | | |
| Issuer | | Shares/Par | | Value ($) |
| | | | | | |
| Common Stocks - continued | | | | | | |
| Utilities - Electric Power - 1.3% | | | | | | |
| Dominion Resources, Inc. | | | 77,314 | | $ | 3,231,725 |
| E.ON AG (l) | | | 103,690 | | | 3,832,491 |
| FPL Group, Inc. | | | 30,300 | | | 1,577,115 |
| PPL Corp. | | | 43,590 | | | 1,079,288 |
| | | | | | |
| | | | | | $ | 9,720,619 |
| Total Common Stocks (Identified Cost, $388,210,985) | | | | | $ | 438,982,408 |
| | |
| Bonds - 35.3% | | | | | | |
| Asset Backed & Securitized - 1.4% | | | | | | |
| Bayview Commercial Asset Trust, FRN, 0.974%, 2023 (z) | | CAD | 560,000 | | $ | 417,106 |
Citigroup/Deutsche Bank Commercial Mortgage Trust,
5.322%, 2049 | | $ | 2,070,000 | | | 2,010,534 |
| Commercial Mortgage Asset Trust, FRN, 1.092%, 2032 (i)(z) | | | 11,195,875 | | | 295,769 |
Commercial Mortgage Pass-Through Certificates, FRN,
0.444%, 2017 (n) | | | 1,400,000 | | | 1,299,436 |
| First Union National Bank Commercial Mortgage Trust, FRN, 1.156%, 2043 (i)(n) | | | 21,226,306 | | | 105,295 |
JPMorgan Chase Commercial Mortgage Securities Corp.,
5.42%, 2049 | | | 1,040,000 | | | 1,002,585 |
| JPMorgan Chase Commercial Mortgage Securities Corp., FRN, 6.006%, 2049 | | | 2,070,000 | | | 2,033,999 |
| Merrill Lynch Mortgage Trust, FRN, 6.02%, 2050 | | | 1,040,000 | | | 1,062,237 |
Wachovia Bank Commercial Mortgage Trust, “A3”, FRN,
6.099%, 2051 | | | 2,070,000 | | | 2,153,524 |
| | | | | | |
| | | | | | $ | 10,380,485 |
| Automotive - 0.1% | | | | | | |
| American Honda Finance Corp., 2.375%, 2013 (n) | | $ | 400,000 | | $ | 401,657 |
| | |
| Broadcasting - 0.0% | | | | | | |
| CBS Corp., 5.75%, 2020 | | $ | 190,000 | | $ | 197,423 |
| | |
| Cable TV - 0.8% | | | | | | |
| Comcast Corp., 5.15%, 2020 | | $ | 1,550,000 | | $ | 1,582,119 |
| Cox Communications, Inc., 9.375%, 2019 (z) | | | 1,060,000 | | | 1,367,117 |
| DIRECTV Holdings LLC, 5.2%, 2020 (n) | | | 1,180,000 | | | 1,189,799 |
| Time Warner Cable, Inc., 5%, 2020 | | | 1,540,000 | | | 1,538,588 |
| | | | | | |
| | | | | | $ | 5,677,623 |
| Chemicals - 0.2% | | | | | | |
| Dow Chemical Co., 9.4%, 2039 | | $ | 1,048,000 | | $ | 1,446,038 |
12
Portfolio of Investments (unaudited) – continued
| | | | | | |
| Issuer | | Shares/Par | | Value ($) |
| | | | | | |
| Bonds - continued | | | | | | |
| Consumer Products - 0.3% | | | | | | |
| Newell Rubbermaid, Inc., 10.6%, 2019 | | $ | 1,410,000 | | $ | 1,904,329 |
| | |
| Emerging Market Quasi-Sovereign - 1.1% | | | | | | |
| Banco do Brasil (Cayman Branch), 6%, 2020 (n) | | $ | 100,000 | | $ | 102,530 |
| BNDES Participacoes S.A., 6.5%, 2019 (n) | | | 192,000 | | | 204,000 |
| Gaz Capital S.A., 8.125%, 2014 (n) | | | 526,000 | | | 580,572 |
| KazMunaiGaz Finance B.V., 11.75%, 2015 (n) | | | 1,164,000 | | | 1,466,640 |
| KazMunaiGaz Finance B.V., 7%, 2020 (z) | | | 101,000 | | | 102,767 |
| Korea Development Bank, 4.375%, 2015 | | | 109,000 | | | 111,484 |
| Korea National Oil Corp., 5.375%, 2014 | | | 759,000 | | | 809,268 |
| Majapahit Holding B.V., 7.75%, 2020 (n) | | | 833,000 | | | 911,135 |
| Pemex Project Funding Master Trust, 5.75%, 2018 | | | 523,000 | | | 540,538 |
| Petrobras International Finance Co., 7.875%, 2019 | | | 679,000 | | | 793,389 |
| Petroleos Mexicanos, 6%, 2020 (n) | | | 408,000 | | | 419,628 |
| Petroleum Co. of Trinidad & Tobago Ltd., 6%, 2022 | | | 774,000 | | | 745,942 |
| Qtel International Finance Ltd., 7.875%, 2019 (n) | | | 363,000 | | | 419,222 |
| Ras Laffan Liquefied Natural Gas Co. Ltd., 6.75%, 2019 (n) | | | 1,200,000 | | | 1,344,362 |
| | | | | | |
| | | | | | $ | 8,551,477 |
| Emerging Market Sovereign - 0.3% | | | | | | |
| Federative Republic of Brazil, 5.625%, 2041 | | $ | 695,000 | | $ | 658,512 |
| Republic of Peru, 7.35%, 2025 | | | 700,000 | | | 815,500 |
| Republic of South Africa, 5.5%, 2020 | | | 399,000 | | | 404,985 |
| | | | | | |
| | | | | | $ | 1,878,997 |
| Energy - Independent - 0.0% | | | | | | |
| Anadarko Petroleum Corp., 6.2%, 2040 | | $ | 350,000 | | $ | 354,270 |
| | |
| Energy - Integrated - 0.2% | | | | | | |
| Hess Corp., 8.125%, 2019 | | $ | 1,230,000 | | $ | 1,529,013 |
| | |
| Food & Beverages - 0.8% | | | | | | |
| Anheuser-Busch InBev, 5.375%, 2020 | | $ | 1,480,000 | | $ | 1,547,396 |
| Diageo Finance B.V., 5.5%, 2013 | | | 1,405,000 | | | 1,542,594 |
| Kraft Foods, Inc., 6.5%, 2040 | | | 1,523,000 | | | 1,639,008 |
| Miller Brewing Co., 5.5%, 2013 (n) | | | 1,090,000 | | | 1,189,068 |
| | | | | | |
| | | | | | $ | 5,918,066 |
| Food & Drug Stores - 0.2% | | | | | | |
| CVS Caremark Corp., 5.75%, 2017 | | $ | 1,030,000 | | $ | 1,127,762 |
13
Portfolio of Investments (unaudited) – continued
| | | | | | |
| Issuer | | Shares/Par | | Value ($) |
| | | | | | |
| Bonds - continued | | | | | | |
| Forest & Paper Products - 0.1% | | | | | | |
| Fibria Overseas Finance Ltd., 7.5%, 2020 (z) | | $ | 187,000 | | $ | 187,561 |
| Votorantim Participacoes S.A., 6.75%, 2021 (n) | | | 368,000 | | | 370,760 |
| | | | | | |
| | | | | | $ | 558,321 |
| Insurance - 0.2% | | | | | | |
| UnumProvident Corp., 6.85%, 2015 (n) | | $ | 1,367,000 | | $ | 1,474,746 |
| | |
| Insurance - Property & Casualty - 0.7% | | | | | | |
| AXIS Capital Holdings Ltd., 5.75%, 2014 | | $ | 1,440,000 | | $ | 1,517,171 |
| Chubb Corp., 6.375% to 2017, FRN to 2067 | | | 1,410,000 | | | 1,411,762 |
| ZFS Finance USA Trust II, 6.45% to 2016, FRN to 2065 (n) | | | 2,565,000 | | | 2,475,225 |
| | | | | | |
| | | | | | $ | 5,404,158 |
| International Market Quasi-Sovereign - 0.6% | | | | | | |
| Canada Housing Trust, 4.6%, 2011 (n) | | CAD | 1,910,000 | | $ | 1,954,506 |
| Eksportfinans A.S.A., 1.875%, 2013 | | $ | 1,435,000 | | | 1,435,637 |
| Irish Life & Permanent PLC, 3.6%, 2013 (n) | | | 1,400,000 | | | 1,411,080 |
| | | | | | |
| | | | | | $ | 4,801,223 |
| International Market Sovereign - 16.5% | | | | | | |
| Dutch Government, 3.75%, 2014 | | EUR | 5,500,000 | | $ | 7,895,339 |
| Federal Republic of Germany, 5%, 2011 | | EUR | 1,599,000 | | | 2,237,482 |
| Federal Republic of Germany, 3.75%, 2013 | | EUR | 1,884,000 | | | 2,699,621 |
| Federal Republic of Germany, 3.75%, 2015 | | EUR | 3,993,000 | | | 5,749,241 |
| Federal Republic of Germany, 4.25%, 2018 | | EUR | 8,827,000 | | | 13,012,952 |
| Federal Republic of Germany, 6.25%, 2030 | | EUR | 2,502,000 | | | 4,538,513 |
| Government of Canada, 4.5%, 2015 | | CAD | 680,000 | | | 716,959 |
| Government of Japan, 1.3%, 2014 | | JPY | 921,000,000 | | | 10,180,219 |
| Government of Japan, 1.7%, 2017 | | JPY | 1,378,000,000 | | | 15,590,698 |
| Government of Japan, 2.1%, 2024 | | JPY | 459,000,000 | | | 5,121,567 |
| Government of Japan, 2.2%, 2027 | | JPY | 137,700,000 | | | 1,525,045 |
| Government of Japan, 2.4%, 2037 | | JPY | 129,350,000 | | | 1,447,698 |
| Kingdom of Belgium, 5.5%, 2017 | | EUR | 726,000 | | | 1,126,272 |
| Kingdom of Spain, 4.75%, 2014 | | EUR | 2,035,000 | | | 2,914,610 |
| Kingdom of the Netherlands, 5.5%, 2028 | | EUR | 656,000 | | | 1,079,998 |
| Republic of Austria, 4.65%, 2018 | | EUR | 4,064,000 | | | 6,007,956 |
| Republic of Finland, 3.875%, 2017 | | EUR | 2,404,000 | | | 3,425,310 |
| Republic of France, 6%, 2025 | | EUR | 1,522,000 | | | 2,570,411 |
| Republic of France, 4.75%, 2035 | | EUR | 1,774,000 | | | 2,686,766 |
| Republic of Ireland, 4.6%, 2016 | | EUR | 6,215,000 | | | 8,319,233 |
| Republic of Italy, 4.75%, 2013 | | EUR | 6,398,000 | | | 9,122,161 |
| Republic of Italy, 5.25%, 2017 | | EUR | 4,286,000 | | | 6,417,636 |
14
Portfolio of Investments (unaudited) – continued
| | | | | | |
| Issuer | | Shares/Par | | Value ($) |
| | | | | | |
| Bonds - continued | | | | | | |
| International Market Sovereign - continued | | | | | | |
| United Kingdom Treasury, 8%, 2015 | | GBP | 3,497,000 | | $ | 6,767,634 |
| United Kingdom Treasury, 8%, 2021 | | GBP | 635,000 | | | 1,318,096 |
| United Kingdom Treasury, 4.25%, 2036 | | GBP | 1,223,000 | | | 1,806,693 |
| | | | | | |
| | | | | | $ | 124,278,110 |
| Local Authorities - 0.4% | | | | | | |
| Metropolitan Transportation Authority, NY (Build America Bonds), 7.336%, 2039 | | $ | 610,000 | | $ | 713,493 |
| Nashville & Davidson County, TN, Metropolitan Government Convention Center Authority (Build America Bonds), 6.731%, 2043 | | | 890,000 | | | 948,242 |
| University of California Rev. (Build America Bonds), 5.77%, 2043 | | | 505,000 | | | 505,970 |
| Utah Transit Authority Sales Tax Rev. (Build America Bonds), “B”, 5.937%, 2039 | | | 790,000 | | | 845,821 |
| | | | | | |
| | | | | | $ | 3,013,526 |
| Major Banks - 2.0% | | | | | | |
| Bank of America Corp., 7.625%, 2019 | | $ | 1,870,000 | | $ | 2,134,639 |
| BB&T Corp., 3.95%, 2016 | | | 1,650,000 | | | 1,657,017 |
| BNP Paribas, 7.195% to 2037, FRN to 2049 (n) | | | 1,100,000 | | | 1,034,000 |
| Credit Suisse (USA), Inc., 6%, 2018 | | | 1,750,000 | | | 1,870,449 |
| Merrill Lynch & Co., Inc., 6.15%, 2013 | | | 1,113,000 | | | 1,204,393 |
| Morgan Stanley, 7.3%, 2019 | | | 3,010,000 | | | 3,305,215 |
| PNC Financial Services Group, Inc., 5.125%, 2020 | | | 2,250,000 | | | 2,290,862 |
| UniCredito Luxembourg Finance S.A., 6%, 2017 (n) | | | 1,450,000 | | | 1,494,793 |
| | | | | | |
| | | | | | $ | 14,991,368 |
| Metals & Mining - 0.7% | | | | | | |
| ArcelorMittal, 6.125%, 2018 | | $ | 1,090,000 | | $ | 1,175,007 |
| Freeport-McMoRan Copper & Gold, Inc., 8.25%, 2015 | | | 1,110,000 | | | 1,208,512 |
| Peabody Energy Corp., “B”, 6.875%, 2013 | | | 1,170,000 | | | 1,184,625 |
| Southern Copper Corp., 5.375%, 2020 | | | 101,000 | | | 101,802 |
| Southern Copper Corp., 6.75%, 2040 | | | 290,000 | | | 292,298 |
| Vale Overseas Ltd., 6.875%, 2039 | | | 1,410,000 | | | 1,479,393 |
| | | | | | |
| | | | | | $ | 5,441,637 |
| Mortgage Backed - 3.8% | | | | | | |
| Fannie Mae, 4.771%, 2012 | | $ | 1,149,805 | | $ | 1,214,646 |
| Fannie Mae, 4.518%, 2013 | | | 79,141 | | | 83,553 |
| Fannie Mae, 5.37%, 2013 | | | 262,844 | | | 280,164 |
| Fannie Mae, 4.78%, 2015 | | | 348,254 | | | 372,557 |
| Fannie Mae, 4.79%, 2015 | | | 364,801 | | | 390,234 |
| Fannie Mae, 4.856%, 2015 | | | 275,270 | | | 293,533 |
| Fannie Mae, 5.5%, 2015 | | | 262,435 | | | 290,142 |
15
Portfolio of Investments (unaudited) – continued
| | | | | | |
| Issuer | | Shares/Par | | Value ($) |
| | | | | | |
| Bonds - continued | | | | | | |
| Mortgage Backed - continued | | | | | | |
| Fannie Mae, 5.09%, 2016 | | $ | 362,000 | | $ | 391,851 |
| Fannie Mae, 5.424%, 2016 | | | 330,788 | | | 364,228 |
| Fannie Mae, 4.99%, 2017 | | | 242,813 | | | 261,476 |
| Fannie Mae, 5.05%, 2017 | | | 328,901 | | | 355,540 |
| Fannie Mae, 5.161%, 2018 | | | 777,634 | | | 847,505 |
| Fannie Mae, 5.1%, 2019 | | | 341,984 | | | 368,779 |
| Fannie Mae, 5.18%, 2019 | | | 342,052 | | | 370,612 |
| Fannie Mae, 6.16%, 2019 | | | 302,916 | | | 337,079 |
| Fannie Mae, 4.5%, 2025 | | | 1,385,000 | | | 1,441,468 |
| Fannie Mae, 5%, 2025 | | | 88,024 | | | 88,365 |
| Fannie Mae, TBA, 4.5%, 2033 | | | 2,184,000 | | | 2,201,745 |
| Fannie Mae, TBA, 5%, 2033 | | | 2,125,000 | | | 2,199,375 |
| Freddie Mac, 5.085%, 2019 | | | 589,000 | | | 628,644 |
| Freddie Mac, 4%, 2024 | | | 12,100 | | | 12,101 |
| Freddie Mac, 5%, 2024 - 2028 | | | 1,511,739 | | | 1,549,572 |
| Freddie Mac, 5.5%, 2026 - 2037 | | | 2,187,492 | | | 2,308,953 |
| Freddie Mac, TBA, 5%, 2018 - 2033 | | | 6,883,000 | | | 7,138,917 |
| Freddie Mac, TBA, 6%, 2033 | | | 2,043,000 | | | 2,186,647 |
| Ginnie Mae, TBA, 5%, 2040 | | | 2,803,000 | | | 2,922,565 |
| | | | | | |
| | | | | | $ | 28,900,251 |
| Municipals - 0.1% | | | | | | |
| California Educational Facilities Authority Rev. (Stanford University), 5.25%, 2040 | | $ | 805,000 | | $ | 939,008 |
| | |
| Natural Gas - Pipeline - 0.2% | | | | | | |
| Williams Partners LP, 5.25%, 2020 (z) | | $ | 1,821,000 | | $ | 1,872,990 |
| | |
| Network & Telecom - 0.4% | | | | | | |
| CenturyTel, Inc., 7.6%, 2039 | | $ | 910,000 | | $ | 886,042 |
| Telecom Italia Capital, 7.175%, 2019 | | | 1,400,000 | | | 1,526,337 |
| Telefonica Emisiones S.A.U., 2.582%, 2013 | | | 870,000 | | | 872,303 |
| | | | | | |
| | | | | | $ | 3,284,682 |
| Other Banks & Diversified Financials - 0.6% | | | | | | |
| Banco Santander (Brasil) S.A., 4.5%, 2015 (n) | | $ | 818,000 | | $ | 793,460 |
| Citigroup, Inc., 6.125%, 2018 | | | 2,050,000 | | | 2,125,780 |
| Grupo Financiero BBVA Bancomer S.A. de C.V., 7.25%, 2020 (z) | | | 711,000 | | | 721,484 |
| VTB Capital S.A., 6.465%, 2015 (n) | | | 623,000 | | | 630,788 |
| | | | | | |
| | | | | | $ | 4,271,512 |
| Precious Metals & Minerals - 0.2% | | | | | | |
| Teck Resources Ltd., 10.25%, 2016 | | $ | 1,020,000 | | $ | 1,229,100 |
16
Portfolio of Investments (unaudited) – continued
| | | | | | |
| Issuer | | Shares/Par | | Value ($) |
| | | | | | |
| Bonds - continued | | | | | | |
| Real Estate - 0.2% | | | | | | |
| Simon Property Group, Inc., REIT, 5.65%, 2020 | | $ | 1,400,000 | | $ | 1,442,129 |
| | |
| Specialty Stores - 0.1% | | | | | | |
| Best Buy Co., Inc., 6.75%, 2013 | | $ | 780,000 | | $ | 872,672 |
| | |
| Supranational - 0.1% | | | | | | |
| Eurasian Development Bank, 7.375%, 2014 (n) | | $ | 665,000 | | $ | 714,875 |
| | |
| Tobacco - 0.4% | | | | | | |
| Altria Group, Inc., 9.7%, 2018 | | $ | 1,440,000 | | $ | 1,810,931 |
| Lorillard Tobacco Co., 6.875%, 2020 | | | 860,000 | | | 883,955 |
| | | | | | |
| | | | | | $ | 2,694,886 |
| U.S. Government Agencies and Equivalents - 0.7% | | | | | | |
| Aid-Egypt, 4.45%, 2015 | | $ | 1,113,000 | | $ | 1,193,481 |
| FDIC Structured Sale Guarantee Note, 0%, 2012 (n) | | | 527,000 | | | 505,029 |
| Small Business Administration, 5.09%, 2025 | | | 150,709 | | | 160,958 |
| Small Business Administration, 5.21%, 2026 | | | 1,963,352 | | | 2,088,192 |
| Small Business Administration, 5.31%, 2027 | | | 1,057,611 | | | 1,143,996 |
| | | | | | |
| | | | | | $ | 5,091,656 |
| U.S. Treasury Obligations - 1.7% | | | | | | |
| U.S. Treasury Bonds, 4.75%, 2017 | | $ | 3,935,000 | | $ | 4,350,634 |
| U.S. Treasury Notes, 4.75%, 2012 | | | 7,732,000 | | | 8,261,464 |
| U.S. Treasury Notes, 4.125%, 2015 | | | 188,000 | | | 203,436 |
| | | | | | |
| | | | | | $ | 12,815,534 |
| Utilities - Electric Power - 0.2% | | | | | | |
| Enel Finance International S.A., 6%, 2039 (z) | | $ | 1,386,000 | | $ | 1,304,326 |
| Total Bonds (Identified Cost, $261,003,800) | | | | | $ | 264,763,850 |
| | |
| Money Market Funds (v) - 7.7% | | | | | | |
| MFS Institutional Money Market Portfolio, 0.19%, at Cost and Net Asset Value | | | 57,724,550 | | $ | 57,724,550 |
17
Portfolio of Investments (unaudited) – continued
| | | | | | |
| Collateral for Securities Loaned - 3.2% | | | | | | |
| Issuer | | Shares/Par | | Value ($) | |
| | | | | | |
| Goldman Sachs Repurchase Agreement, 0.19%, dated 4/30/10, due 5/03/10, total to be received $9,184,319 (secured by U.S. Treasury and Federal Agency obligations valued at $9,367,865 in an individually traded account) | | 9,184,174 | | $ | 9,184,174 | |
| Morgan Stanley Repurchase Agreement, 0.19%, dated 4/30/10, due 5/03/10, total to be received $15,000,237 (secured by U.S. Treasury and Federal Agency obligations valued at $15,300,291 in an individually traded account) | | 15,000,000 | | | 15,000,000 | |
| Total Collateral for Securities Loaned, at Cost and Value | | | | $ | 24,184,174 | |
| Total Investments (Identified Cost, $731,123,509) | | | | $ | 785,654,982 | |
| | |
| Other Assets, Less Liabilities - (4.6)% | | | | | (34,590,660 | ) |
| Net Assets - 100.0% | | | | $ | 751,064,322 | |
| (a) | Non-income producing security. |
| (i) | Interest only security for which the fund receives interest on notional principal (Par amount). Par amount shown is the notional principal and does not reflect the cost of the security. |
| (l) | All or a portion of this security is on loan. |
| (n) | Securities exempt from registration under Rule 144A of the Securities Act of 1933. These securities may be sold in the ordinary course of business in transactions exempt from registration, normally to qualified institutional buyers. At period end, the aggregate value of these securities was $22,492,606, representing 3.0% of net assets. |
| (v) | Underlying fund that is available only to investment companies managed by MFS. The rate quoted is the annualized seven-day yield of the fund at period end. |
| (z) | Restricted securities are not registered under the Securities Act of 1933 and are subject to legal restrictions on resale. These securities generally may be resold in transactions exempt from registration or to the public if the securities are subsequently registered. Disposal of these securities may involve time-consuming negotiations and prompt sale at an acceptable price may be difficult. The fund holds the following restricted securities: |
| | | | | | |
| Restricted Securities | | Acquisition
Date | | Cost | | Current
Market
Value |
| Bayview Commercial Asset Trust, FRN, 0.974%, 2023 | | 5/25/06 | | $506,329 | | $417,106 |
Commercial Mortgage Asset Trust, FRN,
1.092%, 2032 | | 8/25/03 | | 328,937 | | 295,769 |
| Cox Communications, Inc., 9.375%, 2019 | | 2/10/10 | | 1,338,876 | | 1,367,117 |
| Enel Finance International S.A., 6%, 2039 | | 3/26/10 | | 1,322,239 | | 1,304,326 |
| Fibria Overseas Finance Ltd., 7.5%, 2020 | | 4/29/10 | | 185,384 | | 187,561 |
| Grupo Financiero BBVA Bancomer S.A. de C.V., 7.25%, 2020 | | 4/15/10 | | 711,000 | | 721,484 |
| KazMunaiGaz Finance B.V., 7%, 2020 | | 4/28/10 | | 99,225 | | 102,767 |
| Williams Partners LP, 5.25%, 2020 | | 2/02/10 | | 1,820,015 | | 1,872,990 |
| Total Restricted Securities | | | | | | $6,269,120 |
| % of Net Assets | | | | | | 0.8% |
18
Portfolio of Investments (unaudited) – continued
The following abbreviations are used in this report and are defined:
| ADR | | American Depository Receipt |
| FRN | | Floating Rate Note. Interest rate resets periodically and may not be the rate reported at period end. |
| IPS | | International Preference Stock |
| PLC | | Public Limited Company |
| REIT | | Real Estate Investment Trust |
Abbreviations indicate amounts shown in currencies other than the U.S. dollar. All amounts are stated in U.S. dollars unless otherwise indicated. A list of abbreviations is shown below:
| CNY | | Chinese Yuan Renminbi |
19
Portfolio of Investments (unaudited) – continued
Derivative Contracts at 4/30/10
Forward Foreign Currency Exchange Contracts at 4/30/10
| | | | | | | | | | | | | | |
| Type | | Currency | | Counterparty | | Contracts to Deliver/ Receive | | Settlement
Date Range | | In Exchange
For | | Contracts
at Value | | Net
Unrealized
Appreciation
(Depreciation) |
| Asset Derivatives | | | | | | | | |
| BUY | | AUD | | Citibank N.A. | | 1,120,000 | | 5/24/10 | | $1,020,251 | | $1,033,947 | | $13,696 |
| BUY | | AUD | | Credit Suisse Group | | 59,000 | | 5/24/10 | | 52,207 | | 54,467 | | 2,260 |
| BUY | | AUD | | UBS AG | | 2,650,504 | | 5/24/10 | | 2,363,507 | | 2,446,857 | | 83,350 |
| BUY | | BRL | | Barclays Bank PLC | | 177,000 | | 6/15/10 | | 99,831 | | 100,892 | | 1,061 |
| BUY | | BRL | | Deutsche Bank AG | | 2,075,000 | | 5/04/10 | | 1,140,110 | | 1,193,729 | | 53,619 |
| SELL | | BRL | | Deutsche Bank AG | | 2,075,000 | | 5/04/10 | | 1,198,037 | | 1,193,729 | | 4,308 |
| BUY | | CAD | | HSBC Bank | | 4,474,855 | | 5/10/10 | | 4,357,210 | | 4,405,252 | | 48,042 |
| BUY | | CAD | | UBS AG | | 1,339,658 | | 5/05/10 | | 1,305,521 | | 1,318,820 | | 13,299 |
| SELL | | EUR | | Barclays Bank PLC | | 4,695,000 | | 6/14/10 | | 6,410,113 | | 6,251,799 | | 158,314 |
| SELL | | EUR | | Citibank N.A. | | 3,695,690 | | 6/14/10 | | 5,040,930 | | 4,921,132 | | 119,798 |
| SELL | | EUR | | Credit Suisse Group | | 324,000 | | 6/14/10 | | 438,512 | | 431,434 | | 7,078 |
| SELL | | EUR | | Goldman Sachs International | | 2,880,115 | | 6/14/10 | | 3,902,043 | | 3,835,123 | | 66,920 |
| SELL | | EUR | | JPMorgan Chase Bank N.A. | | 3,366,493 | | 6/14/10 | | 4,601,423 | | 4,482,777 | | 118,646 |
| SELL | | EUR | | UBS AG | | 14,021,233 | | 6/14/10 | | 19,042,423 | | 18,670,486 | | 371,937 |
| BUY | | GBP | | Barclays Bank PLC | | 1,414,050 | | 7/12/10 | | 2,157,429 | | 2,163,057 | | 5,628 |
| BUY | | GBP | | Deutsche Bank AG | | 1,414,050 | | 7/12/10 | | 2,157,444 | | 2,163,057 | | 5,613 |
| BUY | | GBP | | UBS AG | | 307,000 | | 6/14/10 | | 469,464 | | 469,653 | | 189 |
| BUY | | INR | | Merrill Lynch International Bank | | 52,706,000 | | 5/28/10 | | 1,183,075 | | 1,185,393 | | 2,318 |
| BUY | | JPY | | UBS AG | | 154,505,000 | | 6/14/10 | | 1,644,886 | | 1,645,465 | | 579 |
| SELL | | JPY | | Credit Suisse Group | | 93,198,330 | | 7/12/10 | | 998,964 | | 992,863 | | 6,101 |
| SELL | | JPY | | Goldman Sachs International | | 54,713,000 | | 7/12/10 | | 586,464 | | 582,870 | | 3,594 |
| SELL | | JPY | | HSBC Bank | | 111,200,293 | | 7/12/10 | | 1,195,188 | | 1,184,642 | | 10,546 |
| SELL | | JPY | | JPMorgan Chase Bank N.A. | | 10,593,000 | | 7/12/10 | | 113,452 | | 112,850 | | 602 |
| BUY | | KRW | | Barclays Bank PLC | | 5,881,917,000 | | 5/04/10-6/28/10 | | 5,245,468 | | 5,305,903 | | 60,435 |
| BUY | | MXN | | HSBC Bank | | 15,221,000 | | 5/04/10-7/06/10 | | 1,211,448 | | 1,230,903 | | 19,455 |
| BUY | | MXN | | JPMorgan Chase Bank N.A. | | 5,462,000 | | 7/06/10 | | 437,818 | | 440,610 | | 2,792 |
| SELL | | MXN | | Merrill Lynch International Bank | | 5,533,000 | | 5/04/10 | | 452,560 | | 449,390 | | 3,170 |
| BUY | | MYR | | Merrill Lynch International Bank | | 1,955,000 | | 5/10/10 | | 608,503 | | 613,703 | | 5,200 |
| BUY | | NOK | | Citibank N.A. | | 2,733,000 | | 6/08/10 | | 460,259 | | 462,511 | | 2,252 |
20
Portfolio of Investments (unaudited) – continued
| | | | | | | | | | | | | | | |
| Type | | Currency | | Counterparty | | Contracts to Deliver/ Receive | | Settlement
Date Range | | In Exchange
For | | Contracts
at Value | | Net
Unrealized
Appreciation
(Depreciation) | |
| Asset Derivatives - continued | | | | | | | | | |
| BUY | | NZD | | Credit Suisse Group | | 639,000 | | 7/26/10 | | $458,938 | | $461,805 | | $2,867 | |
| BUY | | PHP | | JPMorgan Chase Bank N.A. | | 41,817,000 | | 5/11/10 | | 932,513 | | 939,801 | | 7,288 | |
| BUY | | PLN | | HSBC Bank | | 4,443,000 | | 7/06/10 | | 1,498,250 | | 1,499,874 | | 1,624 | |
| BUY | | SGD | | Citibank N.A. | | 811,000 | | 6/14/10 | | 583,558 | | 591,841 | | 8,283 | |
| BUY | | TRY | | HSBC Bank | | 1,526,000 | | 5/11/10 | | 1,000,904 | | 1,023,989 | | 23,085 | |
| BUY | | TWD | | JPMorgan Chase Bank N.A. | | 32,599,000 | | 5/10/10 | | 1,035,546 | | 1,041,156 | | 5,610 | |
| | | | | | | | | | | | | | | |
| | | | | | | | | | | | | | $1,239,559 | |
| | | | | | | | | | | | | | | |
| | | | | |
| Liability Derivatives | | | | | | | | | | | |
| BUY | | AUD | | Citibank N.A. | | 187,000 | | 7/12/10 | | $173,044 | | $171,617 | | $(1,427 | ) |
| BUY | | AUD | | Credit Suisse Group | | 248,000 | | 7/12/10 | | 228,866 | | 227,600 | | (1,266 | ) |
| BUY | | AUD | | Westpac Banking Corp. | | 156,000 | | 7/12/10 | | 143,963 | | 143,167 | | (796 | ) |
| BUY | | BRL | | Deutsche Bank AG | | 2,075,000 | | 6/02/10 | | 1,190,681 | | 1,186,473 | | (4,208 | ) |
| BUY | | CAD | | Citibank N.A. | | 828,000 | | 5/10/10-6/14/10 | | 826,117 | | 815,121 | | (10,996 | ) |
| BUY | | CHF | | Barclays Bank PLC | | 134,000 | | 6/14/10 | | 125,848 | | 124,586 | | (1,262 | ) |
| BUY | | CHF | | UBS AG | | 1,236,000 | | 7/12/10 | | 1,152,883 | | 1,149,628 | | (3,255 | ) |
| BUY | | CNY | | JPMorgan Chase Bank N.A. | | 4,012,000 | | 4/18/11 | | 606,684 | | 599,719 | | (6,965 | ) |
| BUY | | CZK | | Citibank N.A. | | 5,493,000 | | 7/12/10 | | 293,356 | | 285,126 | | (8,230 | ) |
| BUY | | DKK | | Barclays Bank PLC | | 7,040,486 | | 6/25/10 | | 1,280,927 | | 1,259,139 | | (21,788 | ) |
| BUY | | DKK | | Citibank N.A. | | 260,000 | | 6/25/10 | | 47,010 | | 46,499 | | (511 | ) |
| BUY | | EUR | | Barclays Bank PLC | | 1,518,000 | | 6/14/10 | | 2,073,847 | | 2,021,349 | | (52,498 | ) |
| BUY | | EUR | | Credit Suisse Group | | 1,071,000 | | 6/14/10 | | 1,471,074 | | 1,426,129 | | (44,945 | ) |
| BUY | | EUR | | HSBC Bank | | 6,730,122 | | 6/10/10-6/14/10 | | 9,141,419 | | 8,961,736 | | (179,683 | ) |
| BUY | | EUR | | JPMorgan Chase Bank N.A. | | 17,814,029 | | 6/14/10 | | 23,777,454 | | 23,720,924 | | (56,530 | ) |
| BUY | | EUR | | UBS AG | | 2,973,000 | | 6/14/10 | | 4,036,137 | | 3,958,807 | | (77,330 | ) |
| BUY | | GBP | | Barclays Bank PLC | | 34,000 | | 6/14/10 | | 52,170 | | 52,014 | | (156 | ) |
| BUY | | GBP | | Citibank N.A. | | 343,000 | | 6/14/10 | | 531,619 | | 524,726 | | (6,893 | ) |
| BUY | | GBP | | Credit Suisse Group | | 198,000 | | 7/12/10 | | 303,866 | | 302,879 | | (987 | ) |
| BUY | | IDR | | HSBC Bank | | 11,764,482,000 | | 6/17/10 | | 1,304,080 | | 1,294,999 | | (9,081 | ) |
| BUY | | IDR | | JPMorgan Chase Bank N.A. | | 4,152,805,000 | | 6/17/10 | | 458,620 | | 457,128 | | (1,492 | ) |
| BUY | | IDR | | Merrill Lynch International Bank | | 663,490,000 | | 6/17/10 | | 73,639 | | 73,035 | | (604 | ) |
21
Portfolio of Investments (unaudited) – continued
| | | | | | | | | | | | | | | |
| Type | | Currency | | Counterparty | | Contracts to Deliver/ Receive | | Settlement
Date Range | | In Exchange
For | | Contracts
at Value | | Net
Unrealized
Appreciation
(Depreciation) | |
| Liability Derivatives - continued | | | | | | | | | |
| BUY | | JPY | | JPMorgan Chase Bank N.A. | | 1,228,587,613 | | 7/12/10 | | $13,171,953 | | $13,088,419 | | $ (83,534 | ) |
| BUY | | JPY | | Merrill Lynch International Bank | | 503,580,341 | | 6/14/10-7/12/10 | | 5,407,305 | | 5,364,035 | | (43,270 | ) |
| SELL | | JPY | | Citibank N.A. | | 82,695,889 | | 6/14/10 | | 876,000 | | 880,704 | | (4,704 | ) |
| SELL | | KRW | | Barclays Bank PLC | | 423,041,000 | | 5/04/10 | | 381,118 | | 381,685 | | (567 | ) |
| BUY | | MXN | | Merrill Lynch International Bank | | 5,533,000 | | 8/03/10 | | 448,161 | | 444,985 | | (3,176 | ) |
| BUY | | PLN | | HSBC Bank | | 4,443,000 | | 5/04/10 | | 1,547,191 | | 1,506,996 | | (40,195 | ) |
| SELL | | PLN | | HSBC Bank | | 4,443,000 | | 5/04/10 | | 1,504,877 | | 1,506,996 | | (2,119 | ) |
| BUY | | SEK | | Citibank N.A. | | 1,026,000 | | 6/14/10 | | 143,773 | | 141,674 | | (2,099 | ) |
| BUY | | SEK | | Credit Suisse Group | | 24,185,962 | | 7/12/10 | | 3,348,233 | | 3,340,063 | | (8,170 | ) |
| BUY | | SEK | | HSBC Bank | | 4,255,000 | | 7/12/10 | | 590,447 | | 587,612 | | (2,835 | ) |
| BUY | | ZAR | | Barclays Bank PLC | | 4,457,000 | | 5/24/10 | | 603,553 | | 601,264 | | (2,289 | ) |
| | | | | | | | | | | | | | | |
| | | | | | | | | | | | | | $(683,861 | ) |
| | | | | | | | | | | | | | | |
At April 30, 2010, the fund had sufficient cash and/or other liquid securities to cover any commitments under these derivative contracts.
See Notes to Financial Statements
22
Financial Statements
STATEMENT OF ASSETS AND LIABILITIES
At 4/30/10 (unaudited)
This statement represents your fund’s balance sheet, which details the assets and liabilities comprising the total value of the fund.
| | | |
| Assets | | | |
Investments- | | | |
Non-affiliated issuers, at value (identified cost, $673,398,959) | | $727,930,432 | |
Underlying funds, at cost and value | | 57,724,550 | |
Total investments, at value, including $23,110,189 of securities on loan
(identified cost, $731,123,509) | | $785,654,982 | |
Foreign currency, at value (identified cost, $76,673) | | 76,673 | |
Receivables for | | | |
Forward foreign currency exchange contracts | | 1,239,559 | |
Investments sold | | 2,717,656 | |
Fund shares sold | | 1,954,226 | |
Interest and dividends | | 5,040,925 | |
Receivable from investment adviser | | 21,301 | |
Other assets | | 6,203 | |
Total assets | | $796,711,525 | |
| Liabilities | | | |
Payable to custodian | | $1,466,736 | |
Payables for | | | |
Forward foreign currency exchange contracts | | 683,861 | |
Investments purchased | | 16,393,957 | |
Fund shares reacquired | | 2,594,219 | |
Collateral for securities loaned, at value | | 24,184,174 | |
Payable to affiliates | | | |
Investment adviser | | 33,276 | |
Shareholder servicing costs | | 132,902 | |
Distribution and service fees | | 19,116 | |
Administrative services fee | | 610 | |
Payable for independent Trustees’ compensation | | 60,446 | |
Accrued expenses and other liabilities | | 77,906 | |
Total liabilities | | $45,647,203 | |
Net assets | | $751,064,322 | |
| Net assets consist of | | | |
Paid-in capital | | $747,424,579 | |
Unrealized appreciation (depreciation) on investments and translation of assets and liabilities in foreign currencies (net of $45,468 deferred country tax) | | 54,985,775 | |
Accumulated net realized gain (loss) on investments and foreign currency transactions | | (49,907,203 | ) |
Accumulated distributions in excess of net investment income | | (1,438,829 | ) |
Net assets | | $751,064,322 | |
Shares of beneficial interest outstanding | | 58,297,829 | |
| | | | | | |
| | | Net assets | | Shares
outstanding | | Net asset value
per share (a) |
Class A | | $470,956,875 | | 36,693,376 | | $12.83 |
Class B | | 55,242,966 | | 4,213,036 | | 13.11 |
Class C | | 169,423,060 | | 13,059,664 | | 12.97 |
Class I | | 15,784,913 | | 1,239,469 | | 12.74 |
Class R1 | | 3,016,397 | | 233,343 | | 12.93 |
Class R2 | | 6,005,548 | | 471,064 | | 12.75 |
Class R3 | | 4,785,095 | | 373,740 | | 12.80 |
Class R4 | | 25,849,468 | | 2,014,137 | | 12.83 |
| (a) | Maximum offering price per share was equal to the net asset value per share for all share classes, except for Class A, for which the maximum offering price per share was $13.61 [100 / 94.25 x $12.83]. On sales of $50,000 or more, the maximum offering price of Class A shares is reduced. A contingent deferred sales charge may be imposed on redemptions of Class A, Class B, and Class C shares. Redemption price per share was equal to the net asset value per share for Classes I, R1, R2, R3, and R4. |
See Notes to Financial Statements
23
Financial Statements
STATEMENT OF OPERATIONS
Six months ended 4/30/10 (unaudited)
This statement describes how much your fund earned in investment income and accrued in expenses. It also describes any gains and/or losses generated by fund operations.
| | | |
| Net investment income | | | |
Income | | | |
Dividends | | $6,254,567 | |
Interest | | 4,295,116 | |
Dividends from underlying funds | | 33,292 | |
Foreign taxes withheld | | (386,468 | ) |
Total investment income | | $10,196,507 | |
Expenses | | | |
Management fee | | $3,034,556 | |
Distribution and service fees | | 1,680,881 | |
Shareholder servicing costs | | 461,453 | |
Administrative services fee | | 56,858 | |
Independent Trustees’ compensation | | 13,400 | |
Custodian fee | | 95,574 | |
Shareholder communications | | 32,576 | |
Auditing fees | | 30,820 | |
Legal fees | | 7,641 | |
Miscellaneous | | 88,543 | |
Total expenses | | $5,502,302 | |
Fees paid indirectly | | (59 | ) |
Reduction of expenses by investment adviser | | (202,406 | ) |
Net expenses | | $5,299,837 | |
Net investment income | | $4,896,670 | |
Realized and unrealized gain (loss) on investments
and foreign currency transactions | | | |
Realized gain (loss) (identified cost basis) | | | |
Investment transactions (net of $567 country tax) | | $7,558,771 | |
Foreign currency transactions | | 96,025 | |
Net realized gain (loss) on investments
and foreign currency transactions | | $7,654,796 | |
Change in unrealized appreciation (depreciation) | | | |
Investments (net of $12,782 increase in deferred country tax) | | $14,173,809 | |
Translation of assets and liabilities in foreign currencies | | 598,822 | |
Net unrealized gain (loss) on investments and foreign currency translation | | $14,772,631 | |
Net realized and unrealized gain (loss) on investments and foreign currency | | $22,427,427 | |
Change in net assets from operations | | $27,324,097 | |
See Notes to Financial Statements
24
Financial Statements
STATEMENTS OF CHANGES IN NET ASSETS
These statements describe the increases and/or decreases in net assets resulting from operations, any distributions, and any shareholder transactions.
| | | | | | |
| Change in net assets | | Six months ended
4/30/10
(unaudited) | | | Year ended
10/31/09 | |
| From operations | | | | | | |
Net investment income | | $4,896,670 | | | $9,295,240 | |
Net realized gain (loss) on investments and foreign currency transactions | | 7,654,796 | | | (52,520,091 | ) |
Net unrealized gain (loss) on investments and foreign currency translation | | 14,772,631 | | | 133,882,769 | |
Change in net assets from operations | | $27,324,097 | | | $90,657,918 | |
| Distributions declared to shareholders | | | | | | |
From net investment income | | $(7,889,037 | ) | | $(17,925,328 | ) |
From net realized gain on investments | | — | | | (5,137,989 | ) |
Total distributions declared to shareholders | | $(7,889,037 | ) | | $(23,063,317 | ) |
Change in net assets from fund share transactions | | $38,483,775 | | | $48,771,030 | |
Total change in net assets | | $57,918,835 | | | $116,365,631 | |
| Net assets | | | | | | |
At beginning of period | | 693,145,487 | | | 576,779,856 | |
At end of period (including accumulated distributions in excess of net investment income of $1,438,829 and undistributed net investment income of $1,553,538) | | $751,064,322 | | | $693,145,487 | |
See Notes to Financial Statements
25
Financial Statements
FINANCIAL HIGHLIGHTS
The financial highlights table is intended to help you understand the fund’s financial performance for the semiannual period and the past 5 fiscal years (or life of a particular share class, if shorter). Certain information reflects financial results for a single fund share. The total returns in the table represent the rate by which an investor would have earned (or lost) on an investment in the fund share class (assuming reinvestment of all distributions) held for the entire period.
| | | | | | | | | | | | | | | | | | |
| | | Six months
ended 4/30/10 (unaudited) | | | Years ended 10/31 | |
| Class A | | | 2009 | | | 2008 | | | 2007 | | | 2006 | | | 2005 | |
| | | | | | | | | | | | | | | | | |
Net asset value, beginning of period | | $12.49 | | | $11.23 | | | $15.66 | | | $15.05 | | | $14.30 | | | $14.73 | |
| Income (loss) from investment operations | | | | | | | | | | | | | | | | | | |
Net investment income (d) | | $0.10 | | | $0.20 | | | $0.27 | | | $0.29 | | | $0.28 | | | $0.24 | |
Net realized and unrealized gain (loss) on investments and foreign currency | | 0.39 | | | 1.53 | | | (3.10 | ) | | 1.67 | | | 1.80 | | | 0.94 | |
Total from investment operations | | $0.49 | | | $1.73 | | | $(2.83 | ) | | $1.96 | | | $2.08 | | | $1.18 | |
| Less distributions declared to shareholders | | | | | | | | | | | | | | | | | | |
From net investment income | | $(0.15 | ) | | $(0.37 | ) | | $(0.56 | ) | | $(0.30 | ) | | $(0.22 | ) | | $(0.56 | ) |
From net realized gain on investments | | — | | | (0.10 | ) | | (1.04 | ) | | (1.05 | ) | | (1.11 | ) | | (1.05 | ) |
Total distributions declared to shareholders | | $(0.15 | ) | | $(0.47 | ) | | $(1.60 | ) | | $(1.35 | ) | | $(1.33 | ) | | $(1.61 | ) |
Net asset value, end of period | | $12.83 | | | $12.49 | | | $11.23 | | | $15.66 | | | $15.05 | | | $14.30 | |
Total return (%) (r)(s)(t) | | 3.96 | (n) | | 16.10 | | | (19.92 | ) | | 13.89 | | | 15.62 | | | 8.26 | |
| Ratios (%) (to average net assets) and Supplemental data: | | | | | | | | | | | | | | | | | | |
Expenses before expense reductions (f) | | 1.31 | (a) | | 1.39 | | | 1.42 | | | 1.46 | | | 1.52 | | | 1.52 | |
Expenses after expense reductions (f) | | 1.25 | (a) | | 1.27 | | | 1.30 | | | 1.30 | | | 1.30 | | | 1.48 | |
Net investment income | | 1.57 | (a) | | 1.77 | | | 1.97 | | | 1.97 | | | 1.95 | | | 1.64 | |
Portfolio turnover | | 34 | | | 75 | | | 96 | | | 66 | | | 82 | | | 82 | |
Net assets at end of period (000 omitted) | | $470,957 | | | $434,536 | | | $368,117 | | | $450,366 | | | $403,848 | | | $353,745 | |
See Notes to Financial Statements
26
Financial Highlights – continued
| | | | | | | | | | | | | | | | | | |
| | | Six months
ended 4/30/10 (unaudited) | | | Years ended 10/31 | |
| Class B | | | 2009 | | | 2008 | | | 2007 | | | 2006 | | | 2005 | |
| | | | | | | | | | | | | | | | | |
Net asset value, beginning of period | | $12.76 | | | $11.46 | | | $15.93 | | | $15.28 | | | $14.47 | | | $14.82 | |
| Income (loss) from investment operations | | | | | | | | | | | | | | | | | | |
Net investment income (d) | | $0.05 | | | $0.12 | | | $0.18 | | | $0.20 | | | $0.19 | | | $0.14 | |
Net realized and unrealized gain (loss) on investments and foreign currency | | 0.41 | | | 1.57 | | | (3.15 | ) | | 1.70 | | | 1.82 | | | 0.95 | |
Total from investment operations | | $0.46 | | | $1.69 | | | $(2.97 | ) | | $1.90 | | | $2.01 | | | $1.09 | |
| Less distributions declared to shareholders | | | | | | | | | | | | | | | | | | |
From net investment income | | $(0.11 | ) | | $(0.29 | ) | | $(0.46 | ) | | $(0.20 | ) | | $(0.09 | ) | | $(0.39 | ) |
From net realized gain on investments | | — | | | (0.10 | ) | | (1.04 | ) | | (1.05 | ) | | (1.11 | ) | | (1.05 | ) |
Total distributions declared to shareholders | | $(0.11 | ) | | $(0.39 | ) | | $(1.50 | ) | | $(1.25 | ) | | $(1.20 | ) | | $(1.44 | ) |
Net asset value, end of period | | $13.11 | | | $12.76 | | | $11.46 | | | $15.93 | | | $15.28 | | | $14.47 | |
Total return (%) (r)(s)(t) | | 3.57 | (n) | | 15.27 | | | (20.39 | ) | | 13.16 | | | 14.84 | | | 7.56 | �� |
| Ratios (%) (to average net assets) and Supplemental data: | | | | | | | | | | | | | | | | | | |
Expenses before expense reductions (f) | | 2.06 | (a) | | 2.11 | | | 2.07 | | | 2.11 | | | 2.17 | | | 2.17 | |
Expenses after expense reductions (f) | | 2.00 | (a) | | 1.98 | | | 1.95 | | | 1.95 | | | 1.95 | | | 2.13 | |
Net investment income | | 0.82 | (a) | | 1.05 | | | 1.32 | | | 1.32 | | | 1.29 | | | 0.98 | |
Portfolio turnover | | 34 | | | 75 | | | 96 | | | 66 | | | 82 | | | 82 | |
Net assets at end of period (000 omitted) | | $55,243 | | | $53,054 | | | $59,239 | | | $95,689 | | | $115,336 | | | $124,013 | |
See Notes to Financial Statements
27
Financial Highlights – continued
| | | | | | | | | | | | | | | | | | |
| | | Six months
ended 4/30/10 (unaudited) | | | Years ended 10/31 | |
| Class C | | | 2009 | | | 2008 | | | 2007 | | | 2006 | | | 2005 | |
| | | | | | | | | | | | | | | | | |
Net asset value, beginning of period | | $12.62 | | | $11.35 | | | $15.80 | | | $15.18 | | | $14.39 | | | $14.76 | |
| Income (loss) from investment operations | | | | | | | | | | | | | | | | | | |
Net investment income (d) | | $0.05 | | | $0.12 | | | $0.18 | | | $0.20 | | | $0.19 | | | $0.15 | |
Net realized and unrealized gain (loss) on investments and foreign currency | | 0.41 | | | 1.54 | | | (3.12 | ) | | 1.68 | | | 1.81 | | | 0.94 | |
Total from investment operations | | $0.46 | | | $1.66 | | | $(2.94 | ) | | $1.88 | | | $2.00 | | | $1.09 | |
| Less distributions declared to shareholders | | | | | | | | | | | | | | | | | | |
From net investment income | | $(0.11 | ) | | $(0.29 | ) | | $(0.47 | ) | | $(0.21 | ) | | $(0.10 | ) | | $(0.41 | ) |
From net realized gain on investments | | — | | | (0.10 | ) | | (1.04 | ) | | (1.05 | ) | | (1.11 | ) | | (1.05 | ) |
Total distributions declared to shareholders | | $(0.11 | ) | | $(0.39 | ) | | $(1.51 | ) | | $(1.26 | ) | | $(1.21 | ) | | $(1.46 | ) |
Net asset value, end of period | | $12.97 | | | $12.62 | | | $11.35 | | | $15.80 | | | $15.18 | | | $14.39 | |
Total return (%) (r)(s)(t) | | 3.62 | (n) | | 15.22 | | | (20.39 | ) | | 13.12 | | | 14.87 | | | 7.59 | |
| Ratios (%) (to average net assets) and Supplemental data: | | | | | | | | | | | | | | | | | | |
Expenses before expense reductions (f) | | 2.06 | (a) | | 2.11 | | | 2.07 | | | 2.11 | | | 2.17 | | | 2.16 | |
Expenses after expense reductions (f) | | 2.00 | (a) | | 1.99 | | | 1.95 | | | 1.95 | | | 1.95 | | | 2.12 | |
Net investment income | | 0.82 | (a) | | 1.04 | | | 1.32 | | | 1.32 | | | 1.29 | | | 1.00 | |
Portfolio turnover | | 34 | | | 75 | | | 96 | | | 66 | | | 82 | | | 82 | |
Net assets at end of period (000 omitted) | | $169,423 | | | $155,007 | | | $123,754 | | | $132,343 | | | $99,019 | | | $75,974 | |
See Notes to Financial Statements
28
Financial Highlights – continued
| | | | | | | | | | | | | | | | | | |
| | | Six months
ended 4/30/10 (unaudited) | | | Years ended 10/31 | |
| Class I | | | 2009 | | | 2008 | | | 2007 | | | 2006 | | | 2005 | |
| | | | | | | | | | | | | | | | | |
Net asset value, beginning of
period | | $12.39 | | | $11.16 | | | $15.55 | | | $14.95 | | | $14.23 | | | $14.69 | |
Income (loss) from
investment operations | | | | | | | | | | | | | | | | | | |
Net investment income (d) | | $0.11 | | | $0.20 | | | $0.31 | | | $0.35 | | | $0.32 | | | $0.29 | |
Net realized and unrealized
gain (loss) on
investments and foreign currency | | 0.41 | | | 1.54 | | | (3.05 | ) | | 1.66 | | | 1.79 | | | 0.93 | |
Total from investment
operations | | $0.52 | | | $1.74 | | | $(2.74 | ) | | $2.01 | | | $2.11 | | | $1.22 | |
Less distributions declared
to shareholders | | | | | | | | | | | | | | | | | | |
From net investment
income | | $(0.17 | ) | | $(0.41 | ) | | $(0.61 | ) | | $(0.36 | ) | | $(0.28 | ) | | $(0.63 | ) |
From net realized gain on
investments | | — | | | (0.10 | ) | | (1.04 | ) | | (1.05 | ) | | (1.11 | ) | | (1.05 | ) |
Total distributions declared to shareholders | | $(0.17 | ) | | $(0.51 | ) | | $(1.65 | ) | | $(1.41 | ) | | $(1.39 | ) | | $(1.68 | ) |
Net asset value, end of period | | $12.74 | | | $12.39 | | | $11.16 | | | $15.55 | | | $14.95 | | | $14.23 | |
Total return (%) (r)(s) | | 4.21 | (n) | | 16.27 | | | (19.51 | ) | | 14.31 | | | 16.00 | | | 8.65 | |
Ratios (%) (to average net
assets) and Supplemental
data: | | | | | | | | | | | | | | | | | | |
Expenses before expense
reductions (f) | | 1.06 | (a) | | 1.09 | | | 1.07 | | | 1.11 | | | 1.12 | | | 1.16 | |
Expenses after expense
reductions (f) | | 1.00 | (a) | | 0.99 | | | 0.95 | | | 0.95 | | | 0.95 | | | 1.12 | |
Net investment income | | 1.81 | (a) | | 1.76 | | | 2.31 | | | 2.34 | | | 2.28 | | | 1.99 | |
Portfolio turnover | | 34 | | | 75 | | | 96 | | | 66 | | | 82 | | | 82 | |
Net assets at end of period
(000 omitted) | | $15,785 | | | $15,697 | | | $3,066 | | | $3,691 | | | $4,133 | | | $3,170 | |
See Notes to Financial Statements
29
Financial Highlights – continued
| | | | | | | | | | | | | | | | | | |
| | | Six months
ended 4/30/10 (unaudited) | | | Years ended 10/31 | |
| Class R1 | | | 2009 | | | 2008 | | | 2007 | | | 2006 | | | 2005 (i) | |
| | | | | | | | | | | | | | | | | |
Net asset value, beginning of
period | | $12.58 | | | $11.32 | | | $15.77 | | | $15.17 | | | $14.40 | | | $14.42 | |
Income (loss) from
investment operations | | | | | | | | | | | | | | | | | | |
Net investment income (d) | | $0.05 | | | $0.12 | | | $0.17 | | | $0.17 | | | $0.18 | | | $0.08 | |
Net realized and unrealized
gain (loss) on
investments and foreign
currency | | 0.41 | | | 1.54 | | | (3.11 | ) | | 1.69 | | | 1.81 | | | 0.06 | (g) |
Total from investment
operations | | $0.46 | | | $1.66 | | | $(2.94 | ) | | $1.86 | | | $1.99 | | | $0.14 | |
Less distributions declared
to shareholders | | | | | | | | | | | | | | | | | | |
From net investment
income | | $(0.11 | ) | | $(0.30 | ) | | $(0.47 | ) | | $(0.21 | ) | | $(0.11 | ) | | $(0.16 | ) |
From net realized gain on investments | | — | | | (0.10 | ) | | (1.04 | ) | | (1.05 | ) | | (1.11 | ) | | — | |
Total distributions declared to shareholders | | $(0.11 | ) | | $(0.40 | ) | | $(1.51 | ) | | $(1.26 | ) | | $(1.22 | ) | | $(0.16 | ) |
Net asset value, end of period | | $12.93 | | | $12.58 | | | $11.32 | | | $15.77 | | | $15.17 | | | $14.40 | |
Total return (%) (r)(s) | | 3.63 | (n) | | 15.20 | | | (20.42 | ) | | 13.00 | | | 14.78 | | | 0.99 | (n) |
Ratios (%) (to average net
assets) and Supplemental
data: | | | | | | | | | | | | | | | | | | |
Expenses before expense
reductions (f) | | 2.06 | (a) | | 2.10 | | | 2.11 | | | 2.24 | | | 2.39 | | | 2.34 | (a) |
Expenses after expense
reductions (f) | | 2.00 | (a) | | 1.99 | | | 1.98 | | | 2.05 | | | 2.05 | | | 2.28 | (a) |
Net investment income | | 0.83 | (a) | | 1.02 | | | 1.26 | | | 1.11 | | | 1.23 | | | 0.91 | (a) |
Portfolio turnover | | 34 | | | 75 | | | 96 | | | 66 | | | 82 | | | 82 | |
Net assets at end of period
(000 omitted) | | $3,016 | | | $2,460 | | | $1,161 | | | $1,044 | | | $363 | | | $52 | |
See Notes to Financial Statements
30
Financial Highlights – continued
| | | | | | | | | | | | | | | | | | |
| | | Six months
ended 4/30/10 (unaudited) | | | Years ended 10/31 | |
| Class R2 | | | 2009 | | | 2008 | | | 2007 | | | 2006 | | | 2005 | |
| | | | | | | | | | | | | | | | | |
Net asset value, beginning of
period | | $12.41 | | | $11.17 | | | $15.57 | | | $14.97 | | | $14.24 | | | $14.67 | |
Income (loss) from
investment operations | | | | | | | | | | | | | | | | | | |
Net investment income (d) | | $0.08 | | | $0.18 | | | $0.24 | | | $0.23 | | | $0.25 | | | $0.18 | |
Net realized and unrealized
gain (loss) on
investments and foreign
currency | | 0.40 | | | 1.51 | | | (3.06 | ) | | 1.68 | | | 1.77 | | | 0.94 | |
Total from investment
operations | | $0.48 | | | $1.69 | | | $(2.82 | ) | | $1.91 | | | $2.02 | | | $1.12 | |
Less distributions declared
to shareholders | | | | | | | | | | | | | | | | | | |
From net investment
income | | $(0.14 | ) | | $(0.35 | ) | | $(0.54 | ) | | $(0.26 | ) | | $(0.18 | ) | | $(0.50 | ) |
From net realized gain on investments | | — | | | (0.10 | ) | | (1.04 | ) | | (1.05 | ) | | (1.11 | ) | | (1.05 | ) |
Total distributions declared to shareholders | | $(0.14 | ) | | $(0.45 | ) | | $(1.58 | ) | | $(1.31 | ) | | $(1.29 | ) | | $(1.55 | ) |
Net asset value, end of period | | $12.75 | | | $12.41 | | | $11.17 | | | $15.57 | | | $14.97 | | | $14.24 | |
Total return (%) (r)(s) | | 3.86 | (n) | | 15.81 | | | (19.98 | ) | | 13.57 | | | 15.19 | | | 7.87 | |
Ratios (%) (to average net
assets) and Supplemental
data: | | | | | | | | | | | | | | | | | | |
Expenses before expense
reductions (f) | | 1.56 | (a) | | 1.61 | | | 1.59 | | | 1.80 | | | 1.94 | | | 1.92 | |
Expenses after expense
reductions (f) | | 1.50 | (a) | | 1.49 | | | 1.47 | | | 1.60 | | | 1.60 | | | 1.87 | |
Net investment income | | 1.31 | (a) | | 1.57 | | | 1.81 | | | 1.58 | | | 1.76 | | | 1.24 | |
Portfolio turnover | | 34 | | | 75 | | | 96 | | | 66 | | | 82 | | | 82 | |
Net assets at end of period
(000 omitted) | | $6,006 | | | $5,459 | | | $3,202 | | | $2,306 | | | $1,185 | | | $159 | |
See Notes to Financial Statements
31
Financial Highlights – continued
| | | | | | | | | | | | | | | | | | |
| | | Six months
ended
4/30/10 (unaudited) | | | Years ended 10/31 | |
| Class R3 | | | 2009 | | | 2008 | | | 2007 | | | 2006 | | | 2005 (i) | |
| | | | | | | | | | | | | | | | | |
Net asset value, beginning of
period | | $12.46 | | | $11.21 | | | $15.62 | | | $15.02 | | | $14.28 | | | $14.26 | |
Income (loss) from
investment operations | | | | | | | | | | | | | | | | | | |
Net investment income (d) | | $0.10 | | | $0.20 | | | $0.28 | | | $0.29 | | | $0.31 | | | $0.14 | |
Net realized and unrealized
gain (loss) on
investments and foreign
currency | | 0.39 | | | 1.53 | | | (3.08 | ) | | 1.66 | | | 1.75 | | | 0.07 | (g) |
Total from investment
operations | | $0.49 | | | $1.73 | | | $(2.80 | ) | | $1.95 | | | $2.06 | | | $0.21 | |
Less distributions declared
to shareholders | | | | | | | | | | | | | | | | | | |
From net investment
income | | $(0.15 | ) | | $(0.38 | ) | | $(0.57 | ) | | $(0.30 | ) | | $(0.21 | ) | | $(0.19 | ) |
From net realized gain on investments | | — | | | (0.10 | ) | | (1.04 | ) | | (1.05 | ) | | (1.11 | ) | | — | |
Total distributions declared to shareholders | | $(0.15 | ) | | $(0.48 | ) | | $(1.61 | ) | | $(1.35 | ) | | $(1.32 | ) | | $(0.19 | ) |
Net asset value, end of period | | $12.80 | | | $12.46 | | | $11.21 | | | $15.62 | | | $15.02 | | | $14.28 | |
Total return (%) (r)(s) | | 3.97 | (n) | | 16.10 | | | (19.80 | ) | | 13.84 | | | 15.53 | | | 1.48 | (n) |
Ratios (%) (to average net
assets) and Supplemental
data: | | | | | | | | | | | | | | | | | | |
Expenses before expense
reductions (f) | | 1.31 | (a) | | 1.36 | | | 1.35 | | | 1.50 | | | 1.57 | | | 1.54 | (a) |
Expenses after expense
reductions (f) | | 1.25 | (a) | | 1.24 | | | 1.23 | | | 1.35 | | | 1.35 | | | 1.50 | (a) |
Net investment income | | 1.55 | (a) | | 1.78 | | | 2.02 | | | 1.94 | | | 2.10 | | | 1.70 | (a) |
Portfolio turnover | | 34 | | | 75 | | | 96 | | | 66 | | | 82 | | | 82 | |
Net assets at end of period
(000 omitted) | | $4,785 | | | $4,593 | | | $3,431 | | | $3,951 | | | $1,303 | | | $51 | |
See Notes to Financial Statements
32
Financial Highlights – continued
| | | | | | | | | | | | | | | | | | |
| | | Six months
ended 4/30/10 (unaudited) | | | Years ended 10/31 | |
| Class R4 | | | 2009 | | | 2008 | | | 2007 | | | 2006 | | | 2005 (i) | |
| | | | | | | | | | | | | | | | | |
Net asset value, beginning of
period | | $12.49 | | | $11.24 | | | $15.65 | | | $15.03 | | | $14.29 | | | $14.26 | |
Income (loss) from
investment operations | | | | | | | | | | | | | | | | | | |
Net investment income (d) | | $0.12 | | | $0.23 | | | $0.29 | | | $0.28 | | | $0.25 | | | $0.17 | |
Net realized and unrealized
gain (loss) on
investments and foreign currency | | 0.39 | | | 1.53 | | | (3.05 | ) | | 1.71 | | | 1.87 | | | 0.06 | (g) |
Total from investment
operations | | $0.51 | | | $1.76 | | | $(2.76 | ) | | $1.99 | | | $2.12 | | | $0.23 | |
Less distributions declared
to shareholders | | | | | | | | | | | | | | | | | | |
From net investment
income | | $(0.17 | ) | | $(0.41 | ) | | $(0.61 | ) | | $(0.32 | ) | | $(0.27 | ) | | $(0.20 | ) |
From net realized gain on investments | | — | | | (0.10 | ) | | (1.04 | ) | | (1.05 | ) | | (1.11 | ) | | — | |
Total distributions declared to shareholders | | $(0.17 | ) | | $(0.51 | ) | | $(1.65 | ) | | $(1.37 | ) | | $(1.38 | ) | | $(0.20 | ) |
Net asset value, end of period | | $12.83 | | | $12.49 | | | $11.24 | | | $15.65 | | | $15.03 | | | $14.29 | |
Total return (%) (r)(s) | | 4.09 | (n) | | 16.33 | | | (19.53 | ) | | 14.13 | | | 15.95 | | | 1.62 | (n) |
Ratios (%) (to average net
assets) and Supplemental
data: | | | | | | | | | | | | | | | | | | |
Expenses before expense
reductions (f) | | 1.06 | (a) | | 1.11 | | | 1.05 | | | 1.21 | | | 1.30 | | | 1.24 | (a) |
Expenses after expense
reductions (f) | | 1.00 | (a) | | 0.99 | | | 0.95 | | | 1.05 | | | 1.05 | | | 1.20 | (a) |
Net investment income | | 1.85 | (a) | | 2.07 | | | 2.15 | | | 2.00 | | | 1.77 | | | 2.00 | (a) |
Portfolio turnover | | 34 | | | 75 | | | 96 | | | 66 | | | 82 | | | 82 | |
Net assets at end of period
(000 omitted) | | $25,849 | | | $22,340 | | | $14,809 | | | $428 | | | $661 | | | $51 | |
See Notes to Financial Statements
33
Financial Highlights (unaudited) – continued
Any redemption fees charged by the fund during the 2005 fiscal year resulted in a per share impact of less than $0.01.
| (d) | Per share data is based on average shares outstanding. |
| (f) | Ratios do not reflect reductions from fees paid indirectly, if applicable. |
| (g) | The per share amount varies from the net realized and unrealized gain/loss for the period because of the timing of sales of fund shares and the per share amount of realized and unrealized gains and losses at such time. |
| (i) | For the period from the class’ inception, April 1, 2005 (Classes R1, R3, and R4) through the stated period end. |
| (r) | Certain expenses have been reduced without which performance would have been lower. |
| (s) | From time to time the fund may receive proceeds from litigation settlements, without which performance would be lower. |
| (t) | Total returns do not include any applicable sales charges. |
See Notes to Financial Statements
34
NOTES TO FINANCIAL STATEMENTS
(unaudited)
| (1) | | Business and Organization |
MFS Global Total Return Fund (the fund) is a series of MFS Series Trust VI (the trust). The trust is organized as a Massachusetts business trust and is registered under the Investment Company Act of 1940, as amended, as an open-end management investment company.
| (2) | | Significant Accounting Policies |
General – The preparation of financial statements in conformity with U.S. generally accepted accounting principles requires management to make estimates and assumptions that affect the reported amounts of assets and liabilities, and disclosure of contingent assets and liabilities at the date of the financial statements and the reported amounts of revenues and expenses during the reporting period. Actual results could differ from those estimates. In the preparation of these financial statements, management has evaluated subsequent events occurring after the date of the fund’s Statement of Assets and Liabilities through the date that the financial statements were issued. The fund can invest in foreign securities, including securities of emerging market issuers. Investments in foreign securities are vulnerable to the effects of changes in the relative values of the local currency and the U.S. dollar and to the effects of changes in each country’s legal, political, and economic environment. The markets of emerging markets countries are generally more volatile than the markets of developed countries with more mature economies. All of the risks of investing in foreign securities previously described are heightened when investing in emerging markets countries.
Investment Valuations – Equity securities, including restricted equity securities, are generally valued at the last sale or official closing price as provided by a third-party pricing service on the market or exchange on which they are primarily traded. Equity securities, for which there were no sales reported that day, are generally valued at the last quoted daily bid quotation as provided by a third-party pricing service on the market or exchange on which such securities are primarily traded. Equity securities held short, for which there were no sales reported for that day, are generally valued at the last quoted daily ask quotation as provided by a third-party pricing service on the market or exchange on which such securities are primarily traded. Debt instruments and floating rate loans (other than short-term instruments), including restricted debt instruments, are generally valued at an evaluated or composite bid as provided by a third-party pricing service. Short-term instruments with a maturity at issuance of 60 days or less generally are valued at amortized cost, which approximates market value. Exchange-traded options are generally valued at the last sale or official closing price as provided by a
35
Notes to Financial Statements (unaudited) – continued
third-party pricing service on the exchange on which such options are primarily traded. Exchange-traded options for which there were no sales reported that day are generally valued at the last daily bid quotation as provided by a third-party pricing service on the exchange on which such options are primarily traded. Options not traded on an exchange are generally valued at a broker/dealer bid quotation. Foreign currency options are generally valued using an external pricing model that uses market data from a third-party source. Forward foreign currency contracts are generally valued at the mean of bid and asked prices for the time period interpolated from rates provided by a third-party pricing service for proximate time periods. Open-end investment companies are generally valued at net asset value per share. Securities and other assets generally valued on the basis of information from a third-party pricing service may also be valued at a broker/dealer bid quotation. Values obtained from third-party pricing services can utilize both transaction data and market information such as yield, quality, coupon rate, maturity, type of issue, trading characteristics, and other market data. The values of foreign securities and other assets and liabilities expressed in foreign currencies are converted to U.S. dollars using the mean of bid and asked prices for rates provided by a third-party pricing service.
The Board of Trustees has delegated primary responsibility for determining or causing to be determined the value of the fund’s investments (including any fair valuation) to the adviser pursuant to valuation policies and procedures approved by the Board. If the adviser determines that reliable market quotations are not readily available, investments are valued at fair value as determined in good faith by the adviser in accordance with such procedures under the oversight of the Board of Trustees. Under the fund’s valuation policies and procedures, market quotations are not considered to be readily available for most types of debt instruments and floating rate loans and many types of derivatives. These investments are generally valued at fair value based on information from third-party pricing services. In addition, investments may be valued at fair value if the adviser determines that an investment’s value has been materially affected by events occurring after the close of the exchange or market on which the investment is principally traded (such as foreign exchange or market) and prior to the determination of the fund’s net asset value, or after the halting of trading of a specific security where trading does not resume prior to the close of the exchange or market on which the security is principally traded. Events that occur on a frequent basis after foreign markets close (such as developments in foreign markets and significant movements in the U.S. markets) and prior to the determination of the fund’s net asset value may be deemed to have a material effect on the value of securities traded in foreign markets. Accordingly, the fund’s foreign equity securities may often be valued at fair value. The adviser generally relies on
36
Notes to Financial Statements (unaudited) – continued
third-party pricing services or other information (such as the correlation with price movements of similar securities in the same or other markets; the type, cost and investment characteristics of the security; the business and financial condition of the issuer; and trading and other market data) to assist in determining whether to fair value and at what value to fair value an investment. The value of an investment for purposes of calculating the fund’s net asset value can differ depending on the source and method used to determine value. When fair valuation is used, the value of an investment used to determine the fund’s net asset value may differ from quoted or published prices for the same investment. There can be no assurance that the fund could obtain the fair value assigned to an investment if it were to sell the investment at the same time at which the fund determines its net asset value per share.
Various inputs are used in determining the value of the fund’s assets or liabilities. These inputs are categorized into three broad levels. In certain cases, the inputs used to measure fair value may fall into different levels of the fair value hierarchy. In such cases, an investment’s level within the fair value hierarchy is based on the lowest level of input that is significant to the fair value measurement. The fund’s assessment of the significance of a particular input to the fair value measurement in its entirety requires judgment, and considers factors specific to the investment. Level 1 includes unadjusted quoted prices in active markets for identical assets or liabilities. Level 2 includes other significant observable market-based inputs (including quoted prices for similar securities, interest rates, prepayment speed, and credit risk). Level 3 includes unobservable inputs, which may include the adviser’s own assumptions in determining the fair value of investments. Other financial instruments are derivative instruments not reflected in total investments, such as futures, forwards, swap contracts, and written options. The following is a summary of the levels used as of April 30, 2010 in valuing the fund’s assets or liabilities:
| | | | | | | | |
| Investments at Value | | Level 1 | | Level 2 | | Level 3 | | Total |
| Equity Securities: | | | | | | | | |
United States | | $198,404,597 | | $— | | $— | | $198,404,597 |
Japan | | 27,702,910 | | 29,402,141 | | — | | 57,105,051 |
United Kingdom | | 23,810,809 | | 31,506,640 | | — | | 55,317,449 |
France | | — | | 31,385,500 | | — | | 31,385,500 |
Switzerland | | 10,697,994 | | 20,623,254 | | — | | 31,321,248 |
Netherlands | | 4,335,923 | | 15,494,404 | | — | | 19,830,327 |
Germany | | 7,318,938 | | 6,004,526 | | — | | 13,323,464 |
Sweden | | 3,506,914 | | 4,207,269 | | — | | 7,714,183 |
South Korea | | 1,599,974 | | 4,607,481 | | — | | 6,207,455 |
Other Countries | | 5,531,368 | | 12,841,766 | | — | | 18,373,134 |
| U.S. Treasury Bonds & U.S. Government Agency & Equivalents | | — | | 17,907,190 | | — | | 17,907,190 |
| Non-U.S. Sovereign Debt | | — | | 140,224,682 | | — | | 140,224,682 |
37
Notes to Financial Statements (unaudited) – continued
| | | | | | | | |
| Investments at Value | | Level 1 | | Level 2 | | Level 3 | | Total |
| Municipal Bonds | | $— | | $939,008 | | $— | | $939,008 |
| Corporate Bonds | | — | | 46,121,486 | | — | | 46,121,486 |
| Residential Mortgage-Backed Securities | | — | | 28,900,251 | | — | | 28,900,251 |
| Commercial Mortgage-Backed Securities | | — | | 10,380,485 | | — | | 10,380,485 |
| Foreign Bonds | | — | | 20,290,748 | | — | | 20,290,748 |
| Short Term Securities | | — | | 24,184,174 | | — | | 24,184,174 |
| Mutual Funds | | 57,724,550 | | — | | — | | 57,724,550 |
| Total Investments | | $340,633,977 | | $445,021,005 | | $— | | $785,654,982 |
| | | | |
| Other Financial Instruments | | | | | | | | |
| Forward Currency Contracts | | $— | | $555,698 | | $— | | $555,698 |
For further information regarding security characteristics, see the Portfolio of Investments.
Of the level 2 investments presented above, equity investments amounting to $25,732,234 were considered level 1 investments at the beginning of the period. Of the Level 1 investments presented above, equity investments amounting to $67,924,223 were considered level 2 investments at the beginning of the period. The primary reason for changes in the classifications between levels 1 and 2 occurs when foreign equity securities are fair valued using other observable market based inputs in place of the closing exchange price due to events occurring after the close of the exchange or market on which the investment is principally traded. The fund’s foreign equity securities may often be valued at fair value.
Repurchase Agreements – The fund may enter into repurchase agreements with approved counterparties. Each repurchase agreement is recorded at cost. The fund requires that the securities collateral in a repurchase transaction be transferred to a custodian. The fund monitors, on a daily basis, the value of the collateral to ensure that its value, including accrued interest, is greater than amounts owed to the fund under each such repurchase agreement.
Inflation-Adjusted Debt Securities – The fund invests in inflation-adjusted debt securities issued by the U.S. Treasury. The fund may also invest in inflation-adjusted debt securities issued by U.S. Government agencies and instrumentalities other than the U.S. Treasury and by other entities such as U.S. and foreign corporations and foreign governments. The principal value of these debt securities is adjusted through income according to changes in the Consumer Price Index or another general price or wage index. These debt securities typically pay a fixed rate of interest, but this fixed rate is applied to the inflation-adjusted principal amount. The principal paid at maturity of the debt security is typically equal to the inflation-adjusted principal amount, or
38
Notes to Financial Statements (unaudited) – continued
the security’s original par value, whichever is greater. Other types of inflation-adjusted securities may use other methods to adjust for other measures of inflation.
Foreign Currency Translation – Purchases and sales of foreign investments, income, and expenses are converted into U.S. dollars based upon currency exchange rates prevailing on the respective dates of such transactions or on the reporting date for foreign denominated receivables and payables. Gains and losses attributable to foreign currency exchange rates on sales of securities are recorded for financial statement purposes as net realized gains and losses on investments. Gains and losses attributable to foreign exchange rate movements on receivables, payables, income and expenses are recorded for financial statement purposes as foreign currency transaction gains and losses. That portion of both realized and unrealized gains and losses on investments that results from fluctuations in foreign currency exchange rates is not separately disclosed.
Derivatives – The fund may use derivatives for different purposes, including to earn income and enhance returns, to increase or decrease exposure to a particular market, to manage or adjust the risk profile of the fund, or as alternatives to direct investments. Derivatives may be used for hedging or non-hedging purposes. While hedging can reduce or eliminate losses, it can also reduce or eliminate gains. When the fund uses derivatives as an investment to increase market exposure, or for hedging purposes, gains and losses from derivative instruments may be substantially greater than the derivative’s original cost.
Derivative instruments include written options, purchased options, futures contracts, forward foreign currency exchange contracts, and swap agreements. The fund’s period end derivatives, as presented in the Portfolio of Investments and the associated Derivative Contract Tables, generally are indicative of the volume of its derivative activity during the period.
The following table presents, by major type of derivative contract, the fair value, on a gross basis, of the asset and liability components of derivatives held by the fund at April 30, 2010:
| | | | | | |
| | | | | Fair Value |
| Risk | | Derivative | | Asset Derivatives | | Liability Derivatives |
| Foreign Exchange Contracts | | Forward Foreign Currency Exchange Contracts | | $1,239,559 | | $(683,861) |
39
Notes to Financial Statements (unaudited) – continued
The following table presents, by major type of derivative contract, the realized gain (loss) on derivatives held by the fund for the six months ended April 30, 2010 as reported in the Statement of Operations:
| | | | | |
| | | Foreign
Currency
Transactions | | Purchased
Options | |
| Foreign Exchange Contracts | | $204,718 | | $(8,413 | ) |
The following table presents, by major type of derivative contract, the change in unrealized appreciation (depreciation) on derivatives held by the fund for the six months ended April 30, 2010 as reported in the Statement of Operations:
| | | | |
| | | Translation
of Assets
and
Liabilities in
Foreign
Currencies | | Purchased
Options |
| Foreign Exchange Contracts | | $712,970 | | $3,234 |
Derivative counterparty credit risk is managed through formal evaluation of the creditworthiness of all potential counterparties. On certain over-the-counter derivatives, the fund attempts to reduce its exposure to counterparty credit risk whenever possible by entering into an International Swaps and Derivatives Association (ISDA) Master Agreement on a bilateral basis with each of the counterparties with whom it undertakes a significant volume of transactions. The ISDA Master Agreement gives each party to the agreement the right to terminate all transactions traded under such agreement if there is a certain deterioration in the credit quality of the other party. The ISDA Master Agreement gives the fund the right, upon an event of default by the applicable counterparty or a termination of the agreement, to close out all transactions traded under such agreement and to net amounts owed under each transaction to one net amount payable by one party to the other. This right to close out and net payments across all transactions traded under the ISDA Master Agreement could result in a reduction of the fund’s credit risk to such counterparty equal to any amounts payable by the fund under the applicable transactions, if any. However, absent an event of default by the counterparty or a termination of the agreement, the ISDA Master Agreement does not result in an offset of reported balance sheet assets and liabilities across transactions between the fund and the applicable counterparty.
Collateral requirements differ by type of derivative. Collateral or margin requirements are set by the broker or exchange clearing house for exchange traded derivatives (i.e., futures and exchange-traded options) while collateral terms are contract specific for over-the-counter traded derivatives (i.e., forwards, swaps and over-the-counter options). For derivatives traded under an ISDA Master Agreement, the collateral requirements are netted across all
40
Notes to Financial Statements (unaudited) – continued
transactions traded under such agreement and one amount is posted from one party to the other to collateralize such obligations. Cash collateral that has been pledged to cover obligations of the fund under derivative contracts will be reported separately on the Statement of Assets and Liabilities as restricted cash. Securities collateral pledged for the same purpose is noted in the Portfolio of Investments.
Purchased Options – The fund may purchase call or put options for a premium. Purchased options entitle the holder to buy or sell a specified number of shares or units of a particular security, currency or index at a specified price at a specified date or within a specified period of time. Purchasing call options may be used to hedge against an anticipated increase in the dollar cost of securities or currency to be acquired or to increase the fund’s exposure to an underlying instrument. Purchasing put options may hedge against a decline in the value of portfolio securities or currency.
The premium paid is initially recorded as an investment in the Statement of Assets and Liabilities. That investment is subsequently marked-to-market daily with the difference between the premium paid and the market value of the purchased option being recorded as unrealized appreciation or depreciation. Premiums paid for purchased options which have expired are treated as realized losses on investments in the Statement of Operations. Upon the exercise or closing of a purchased option, the premium paid is either added to the cost of the security or financial instrument in the case of a call option, or offset against the proceeds on the sale of the underlying security or financial instrument in the case of a put option, in order to determine the realized gain or loss on investments.
The risk in purchasing an option is that the fund pays a premium whether or not the option is exercised. The fund’s maximum risk of loss due to counterparty credit risk is limited to the market value of the option. For over-the-counter options, this risk is mitigated in cases where there is an ISDA Master Agreement between the fund and the counterparty providing for netting as described above and for posting of collateral by the counterparty to the fund to cover the fund’s exposure to the counterparty under such ISDA Master Agreement.
Forward Foreign Currency Exchange Contracts – The fund may enter into forward foreign currency exchange contracts for the purchase or sale of a specific foreign currency at a fixed price on a future date to hedge the fund’s currency risk or for non-hedging purposes. For hedging purposes, the fund may enter into contracts to deliver or receive foreign currency that the fund will receive from or use in its normal investment activities. The fund may also use contracts to hedge against declines in the value of foreign currency denominated securities due to unfavorable exchange rate movements. For
41
Notes to Financial Statements (unaudited) – continued
non-hedging purposes, the fund may enter into contracts with the intent of changing the relative exposure of the fund’s portfolio of securities to different currencies to take advantage of anticipated exchange rate changes.
Forward foreign currency exchange contracts are adjusted by the daily exchange rate of the underlying currency and any unrealized gains or losses are recorded as a receivable or payable for forward foreign currency exchange contracts until the contract settlement date. On contract settlement date, any gain or loss on the contract is recorded as realized gains or losses on foreign currency transactions.
Risks may arise upon entering into these contracts from unanticipated movements in the value of the contract and from the potential inability of counterparties to meet the terms of their contracts. The fund’s maximum risk due to counterparty credit risk is the notional amount of the contract. This risk is mitigated in cases where there is an ISDA Master Agreement between the fund and the counterparty providing for netting as described above and for posting of collateral by the counterparty to the fund to cover the fund’s exposure to the counterparty under such ISDA Master Agreement.
Security Loans – JPMorgan Chase and Co. (“Chase”), as lending agent, may loan the securities of the fund to certain qualified institutions (the “Borrowers”) approved by the fund. The loans are collateralized by cash and/or U.S. Treasury and federal agency obligations in an amount typically at least equal to the market value of the securities loaned. The market value of the loaned securities is determined at the close of business of the fund and any additional required collateral is delivered to the fund on the next business day. Chase provides the fund with indemnification against Borrower default. The fund bears the risk of loss with respect to the investment of cash collateral. On loans collateralized by cash, the cash collateral is invested in short-term securities. A portion of the income generated upon investment of the collateral is remitted to the Borrowers, and the remainder is allocated between the fund and the lending agent. On loans collateralized by U.S. Treasury and/or federal agency obligations, a fee is received from the Borrower, and is allocated between the fund and the lending agent. Income from securities lending is included in interest income on the Statement of Operations. The dividend and interest income earned on the securities loaned is accounted for in the same manner as other dividend and interest income.
Indemnifications – Under the fund’s organizational documents, its officers and Trustees may be indemnified against certain liabilities and expenses arising out of the performance of their duties to the fund. Additionally, in the normal course of business, the fund enters into agreements with service providers that may contain indemnification clauses. The fund’s maximum
42
Notes to Financial Statements (unaudited) – continued
exposure under these agreements is unknown as this would involve future claims that may be made against the fund that have not yet occurred.
Investment Transactions and Income – Investment transactions are recorded on the trade date. Interest income is recorded on the accrual basis. All premium and discount is amortized or accreted for financial statement purposes in accordance with U.S. generally accepted accounting principles. Inflation-indexed bonds are fixed-income securities whose principal value is periodically adjusted upward or downward to the rate of inflation. Interest is accrued based on the principal value, which is adjusted for inflation. Any increase or decrease in the principal amount of an inflation-indexed bond is generally recorded as an increase or decrease in interest income, respectively, even though the adjusted principal is not received until maturity. Dividends received in cash are recorded on the ex-dividend date. Certain dividends from foreign securities will be recorded when the fund is informed of the dividend if such information is obtained subsequent to the ex-dividend date. Dividend and interest payments received in additional securities are recorded on the ex-dividend or ex-interest date in an amount equal to the value of the security on such date.
The fund may receive proceeds from litigation settlements. Any proceeds received from litigation involving portfolio holdings are reflected in the Statement of Operations in realized gain/loss if the security has been disposed of by the fund or in unrealized gain/loss if the security is still held by the fund. Any other proceeds from litigation not related to portfolio holdings are reflected as other income in the Statement of Operations.
The fund may enter into “TBA” (to be announced) purchase commitments to purchase securities for a fixed unit price at a future date. Although the unit price has been established, the principal value has not been finalized. However, the principal amount of the commitments will not fluctuate more than 0.01%. The fund holds, and maintains until settlement date, cash or high-grade debt obligations in an amount sufficient to meet the purchase price, or the fund may enter into offsetting contracts for the forward sale of other securities it owns. Income on the securities will not be earned until settlement date. TBA purchase commitments may be considered securities in themselves, and involve a risk of loss if the value of the security to be purchased declines prior to settlement date, which is in addition to the risk of decline in the value of the fund’s other assets. Unsettled TBA purchase commitments are valued at the current market value of the underlying securities.
Fees Paid Indirectly – The fund’s custody fee may be reduced according to an arrangement that measures the value of cash deposited with the custodian by the fund. This amount, for the six months ended April 30, 2010, is shown as a reduction of total expenses on the Statement of Operations.
43
Notes to Financial Statements (unaudited) – continued
Tax Matters and Distributions – The fund intends to qualify as a regulated investment company, as defined under Subchapter M of the Internal Revenue Code, and to distribute all of its taxable income, including realized capital gains. As a result, no provision for federal income tax is required. The fund’s federal tax returns for the prior three fiscal years remain subject to examination by the Internal Revenue Service. Foreign taxes, if any, have been accrued by the fund in the accompanying financial statements.
Distributions to shareholders are recorded on the ex-dividend date. Income and capital gain distributions are determined in accordance with income tax regulations, which may differ from U.S. generally accepted accounting principles. Certain capital accounts in the financial statements are periodically adjusted for permanent differences in order to reflect their tax character. These adjustments have no impact on net assets or net asset value per share. Temporary differences which arise from recognizing certain items of income, expense, gain or loss in different periods for financial statement and tax purposes will reverse at some time in the future. Distributions in excess of net investment income or net realized gains are temporary overdistributions for financial statement purposes resulting from differences in the recognition or classification of income or distributions for financial statement and tax purposes.
Book/tax differences primarily relate to amortization and accretion of debt securities, wash sale loss deferrals, straddle loss deferrals, foreign currency transactions, and derivative transactions.
The tax character of distributions made during the current period will be determined at fiscal year end. The tax character of distributions declared to shareholders for the last fiscal year is as follows:
| | |
| | | 10/31/09 |
Ordinary income (including any
short-term capital gains) | | $20,246,569 |
| Long-term capital gain | | 2,816,748 |
| Total distributions | | $23,063,317 |
44
Notes to Financial Statements (unaudited) – continued
The federal tax cost and the tax basis components of distributable earnings were as follows:
| | | |
| As of 4/30/10 | | | |
| Cost of investments | | $759,424,207 | |
| Gross appreciation | | 40,347,019 | |
| Gross depreciation | | (14,116,244 | ) |
| Net unrealized appreciation (depreciation) | | $26,230,775 | |
| |
| As of 10/31/09 | | | |
| Undistributed ordinary income | | 4,182,462 | |
| Capital loss carryforwards | | (29,528,346 | ) |
| Other temporary differences | | (2,024,945 | ) |
| Net unrealized appreciation (depreciation) | | 11,575,512 | |
The aggregate cost above includes prior fiscal year end tax adjustments, if applicable.
As of October 31, 2009, the fund had capital loss carryforwards available to offset future realized gains. Such losses expire as follows:
Multiple Classes of Shares of Beneficial Interest – The fund offers multiple classes of shares, which differ in their respective distribution and service fees. The fund’s income, realized and unrealized gain (loss), and common expenses are allocated to shareholders based on the daily net assets of each class. Dividends are declared separately for each class. Differences in per share dividend rates are generally due to differences in separate class expenses. Class B shares will convert to Class A shares approximately eight years after purchase. The fund’s distributions declared to shareholders as reported on the Statements of Changes in Net Assets are presented by class as follows:
| | | | | | | | |
| | | From net investment
income | | From net realized gain on
investments |
| | | Six months ended
4/30/10 | | Year ended
10/31/09 | | Six months ended
4/30/10 | | Year ended
10/31/09 |
| Class A | | $5,455,556 | | $12,338,579 | | $— | | $3,312,990 |
| Class B | | 438,782 | | 1,385,167 | | — | | 497,581 |
| Class C | | 1,324,701 | | 3,219,302 | | — | | 1,098,013 |
| Class I | | 218,794 | | 144,587 | | — | | 28,470 |
| Class R1 | | 21,250 | | 31,505 | | — | | 9,991 |
| Class R2 | | 61,289 | | 111,515 | | — | | 28,393 |
| Class R3 | | 57,338 | | 118,389 | | — | | 30,776 |
| Class R4 | | 311,327 | | 576,284 | | — | | 131,775 |
| Total | | $7,889,037 | | $17,925,328 | | $— | | $5,137,989 |
45
Notes to Financial Statements (unaudited) – continued
| (3) | | Transactions with Affiliates |
Investment Adviser – The fund has an investment advisory agreement with MFS to provide overall investment management and related administrative services and facilities to the fund.
The management fee is computed daily and paid monthly at an annual rate of 0.84% of the fund’s average daily net assets. The investment adviser has agreed in writing to reduce its management fee to 0.75% of average daily net assets in excess of $500 million and 0.70% of average daily net assets in excess of $1.0 billion. This written agreement will continue until modified by the fund’s Board of Trustees, but such agreement will continue at least until February 28, 2011. This management fee reduction amounted to $101,982, which is shown as a reduction of total expenses in the Statement of Operations. The management fee incurred for the six months ended April 30, 2010 was equivalent to an annual effective rate of 0.81% of the fund’s average daily net assets.
The investment adviser has agreed in writing to pay a portion of the fund’s total annual operating expenses, exclusive of interest, taxes, extraordinary expenses, brokerage and transaction costs, and investment-related expenses, such that total annual fund operating expenses do not exceed the following rates annually of the fund’s average daily net assets.
| | | | | | | | | | | | | | |
| Class A | | Class B | | Class C | | Class I | | Class R1 | | Class R2 | | Class R3 | | Class R4 |
| 1.25% | | 2.00% | | 2.00% | | 1.00% | | 2.00% | | 1.50% | | 1.25% | | 1.00% |
This written agreement will continue until modified by the fund’s Board of Trustees, but such agreement will continue at least until February 28, 2011. For the six months ended April 30, 2010, this reduction amounted to $98,835 and is reflected as a reduction of total expenses in the Statement of Operations.
Distributor – MFS Fund Distributors, Inc. (MFD), a wholly-owned subsidiary of MFS, as distributor, received $197,388 for the six months ended April 30, 2010, as its portion of the initial sales charge on sales of Class A shares of the fund.
The Board of Trustees has adopted a distribution plan for certain class shares pursuant to Rule 12b-1 of the Investment Company Act of 1940.
The fund’s distribution plan provides that the fund will pay MFD for services provided by MFD and financial intermediaries in connection with the distribution and servicing of certain share classes. One component of the plan is a distribution fee paid to MFD and another component of the plan is a service fee paid to MFD. MFD may subsequently pay all, or a portion, of the distribution and/or service fees to financial intermediaries.
46
Notes to Financial Statements (unaudited) – continued
Distribution Plan Fee Table:
| | | | | | | | | | |
| | | Distribution
Fee Rate (d) | | Service
Fee Rate (d) | | Total
Distribution
Plan (d) | | Annual
Effective
Rate (e) | | Distribution
and Service
Fee |
| Class A | | — | | 0.25% | | 0.25% | | 0.25% | | $566,984 |
| Class B | | 0.75% | | 0.25% | | 1.00% | | 1.00% | | 270,577 |
| Class C | | 0.75% | | 0.25% | | 1.00% | | 1.00% | | 809,862 |
| Class R1 | | 0.75% | | 0.25% | | 1.00% | | 1.00% | | 13,173 |
| Class R2 | | 0.25% | | 0.25% | | 0.50% | | 0.50% | | 14,307 |
| Class R3 | | — | | 0.25% | | 0.25% | | 0.25% | | 5,978 |
| Total Distribution and Service Fees | | $1,680,881 |
| (d) | In accordance with the distribution plan for certain classes, the fund pays distribution and/or service fees equal to these annual percentage rates of each class’ average daily net assets. The distribution and service fee rates disclosed by class represent the current rates in effect at the end of the reporting period. Any rate changes, if applicable, are detailed below. |
| (e) | The annual effective rates represent actual fees incurred under the distribution plan for the six months ended April 30, 2010 based on each class’ average daily net assets. |
Certain Class A shares are subject to a contingent deferred sales charge (CDSC) in the event of a shareholder redemption within 24 months of purchase. Class C shares are subject to a CDSC in the event of a shareholder redemption within 12 months of purchase. Class B shares are subject to a CDSC in the event of a shareholder redemption within six years of purchase. All contingent deferred sales charges are paid to MFD and during the six months ended April 30, 2010, were as follows:
| | |
| | | Amount |
| Class A | | $23 |
| Class B | | 37,535 |
| Class C | | 10,217 |
Shareholder Servicing Agent – MFS Service Center, Inc. (MFSC), a wholly-owned subsidiary of MFS, receives a fee from the fund for its services as shareholder servicing agent calculated as a percentage of the average daily net assets of the fund as determined periodically under the supervision of the fund’s Board of Trustees. For the six months ended April 30, 2010, the fee was $171,610, which equated to 0.0475% annually of the fund’s average daily net assets. MFSC also receives payment from the fund for out-of-pocket expenses, sub-accounting and other shareholder servicing costs which may be paid to affiliated and unaffiliated service providers. For the six months ended April 30, 2010, these out-of-pocket expenses, sub-accounting and other shareholder servicing costs amounted to $289,843.
Administrator – MFS provides certain financial, legal, shareholder communications, compliance, and other administrative services to the fund. Under an administrative services agreement, the fund partially reimburses MFS the costs incurred to provide these services. The fund is charged an
47
Notes to Financial Statements (unaudited) – continued
annual fixed amount of $17,500 plus a fee based on average daily net assets. The administrative services fee incurred for the six months ended April 30, 2010 was equivalent to an annual effective rate of 0.0157% of the fund’s average daily net assets.
Trustees’ and Officers’ Compensation – The fund pays compensation to independent Trustees in the form of a retainer, attendance fees, and additional compensation to Board and Committee chairpersons. The fund does not pay compensation directly to Trustees or officers of the fund who are also officers of the investment adviser, all of whom receive remuneration for their services to the fund from MFS. Certain officers and Trustees of the fund are officers or directors of MFS, MFD, and MFSC.
Prior to December 31, 2001, the fund had an unfunded defined benefit plan (“DB plan”) for independent Trustees. As of December 31, 2001, the Board took action to terminate the DB plan with respect to then-current and any future independent Trustees, such that the DB Plan covers only certain of those former independent Trustees who retired on or before December 31, 2001. Effective January 1, 2002, accrued benefits under the DB Plan for then-current independent Trustees who continued were credited to an unfunded retirement deferral plan (the “Retirement Deferral plan”), which was established for and exists solely with respect to these credited amounts, and is not available for other deferrals by these or other independent Trustees. Although the Retirement Deferral plan is unfunded, amounts deferred under the plan are periodically adjusted for investment experience as if they had been invested in shares of the fund. The DB Plan resulted in a pension expense of $762 and the Retirement Deferral plan resulted in an expense of $1,062. Both amounts are included in independent Trustees’ compensation for the six months ended April 30, 2010. The liability for deferred retirement benefits payable to certain independent Trustees under both Plans amounted to $57,487 at April 30, 2010, and is included in payable for independent Trustees’ compensation on the Statement of Assets and Liabilities.
Other – This fund and certain other funds managed by MFS (the funds) have entered into services agreements (the Agreements) which provide for payment of fees by the funds to Tarantino LLC and Griffin Compliance LLC in return for the provision of services of an Independent Chief Compliance Officer (ICCO) and Assistant ICCO, respectively, for the funds. The ICCO and Assistant ICCO are officers of the funds and the sole members of Tarantino LLC and Griffin Compliance LLC, respectively. The funds can terminate the Agreements with Tarantino LLC and Griffin Compliance LLC at any time under the terms of the Agreements. For the six months ended April 30, 2010, the aggregate fees paid by the fund to Tarantino LLC and Griffin Compliance LLC were $4,369 and are included in miscellaneous expense on the Statement of Operations. MFS has
48
Notes to Financial Statements (unaudited) – continued
agreed to reimburse the fund for a portion of the payments made by the fund in the amount of $1,589, which is shown as a reduction of total expenses in the Statement of Operations. Additionally, MFS has agreed to bear all expenses associated with office space, other administrative support, and supplies provided to the ICCO and Assistant ICCO.
The fund may invest in the MFS Institutional Money Market Portfolio which is managed by MFS and seeks a high level of current income consistent with preservation of capital and liquidity. Income earned on this investment is included in dividends from underlying funds on the Statement of Operations. This money market fund does not pay a management fee to MFS.
Purchases and sales of investments, other than purchased option transactions, and short-term obligations, were as follows:
| | | | |
| | | Purchases | | Sales |
| U.S. Government securities | | $88,367,063 | | $135,827,951 |
| Investments (non-U.S. Government securities) | | $164,329,662 | | $94,513,518 |
| (5) | | Shares of Beneficial Interest |
The fund’s Declaration of Trust permits the Trustees to issue an unlimited number of full and fractional shares of beneficial interest. Transactions in fund shares were as follows:
| | | | | | | | |
| | | Six months ended
4/30/10 | | Year ended
10/31/09 |
| | | Shares | | Amount | | Shares | | Amount |
| Shares sold | | | | | | | | |
Class A | | 5,883,782 | | $75,076,775 | | 11,682,288 | | $130,138,397 |
Class B | | 772,149 | | 10,069,995 | | 1,089,264 | | 12,719,454 |
Class C | | 1,993,108 | | 25,719,292 | | 4,456,234 | | 50,128,364 |
Class I | | 275,971 | | 3,492,103 | | 1,120,063 | | 13,323,923 |
Class R1 | | 67,392 | | 865,544 | | 171,874 | | 1,871,239 |
Class R2 | | 81,224 | | 1,033,173 | | 238,872 | | 2,493,088 |
Class R3 | | 50,145 | | 641,451 | | 90,904 | | 1,027,889 |
Class R4 | | 389,959 | | 4,920,117 | | 665,782 | | 6,952,110 |
| | 9,513,730 | | $121,818,450 | | 19,515,281 | | $218,654,464 |
49
Notes to Financial Statements (unaudited) – continued
| | | | | | | | | | | | |
| | | Six months ended
4/30/10 | | | Year ended
10/31/09 | |
| | | Shares | | | Amount | | | Shares | | | Amount | |
| Shares issued to shareholders in reinvestment of distributions | | | | | | | | | | | | |
Class A | | 379,233 | | | $4,836,397 | | | 1,251,939 | | | $13,653,006 | |
Class B | | 27,940 | | | 364,933 | | | 140,888 | | | 1,557,128 | |
Class C | | 72,538 | | | 937,206 | | | 286,981 | | | 3,141,823 | |
Class I | | 4,438 | | | 56,139 | | | 13,243 | | | 143,389 | |
Class R1 | | 1,651 | | | 21,250 | | | 3,789 | | | 41,481 | |
Class R2 | | 4,131 | | | 52,367 | | | 10,675 | | | 115,729 | |
Class R3 | | 4,507 | | | 57,338 | | | 13,703 | | | 149,165 | |
Class R4 | | 24,419 | | | 311,327 | | | 64,699 | | | 708,059 | |
| | 518,857 | | | $6,636,957 | | | 1,785,917 | | | $19,509,780 | |
| Shares reacquired | | | | | | | | | | | | |
Class A | | (4,359,818 | ) | | $(55,651,165 | ) | | (10,910,647 | ) | | $(119,973,085 | ) |
Class B | | (745,883 | ) | | (9,747,659 | ) | | (2,239,522 | ) | | (24,975,751 | ) |
Class C | | (1,285,137 | ) | | (16,552,488 | ) | | (3,365,091 | ) | | (37,519,549 | ) |
Class I | | (307,382 | ) | | (3,891,149 | ) | | (141,718 | ) | | (1,642,056 | ) |
Class R1 | | (31,249 | ) | | (399,119 | ) | | (82,701 | ) | | (913,644 | ) |
Class R2 | | (54,238 | ) | | (689,749 | ) | | (96,240 | ) | | (1,038,462 | ) |
Class R3 | | (49,545 | ) | | (629,648 | ) | | (42,033 | ) | | (464,719 | ) |
Class R4 | | (189,007 | ) | | (2,410,655 | ) | | (259,850 | ) | | (2,865,948 | ) |
| | (7,022,259 | ) | | $(89,971,632 | ) | | (17,137,802 | ) | | $(189,393,214 | ) |
| Net change | | | | | | | | | | | | |
Class A | | 1,903,197 | | | $24,262,007 | | | 2,023,580 | | | $23,818,318 | |
Class B | | 54,206 | | | 687,269 | | | (1,009,370 | ) | | (10,699,169 | ) |
Class C | | 780,509 | | | 10,104,010 | | | 1,378,124 | | | 15,750,638 | |
Class I | | (26,973 | ) | | (342,907 | ) | | 991,588 | | | 11,825,256 | |
Class R1 | | 37,794 | | | 487,675 | | | 92,962 | | | 999,076 | |
Class R2 | | 31,117 | | | 395,791 | | | 153,307 | | | 1,570,355 | |
Class R3 | | 5,107 | | | 69,141 | | | 62,574 | | | 712,335 | |
Class R4 | | 225,371 | | | 2,820,789 | | | 470,631 | | | 4,794,221 | |
| | 3,010,328 | | | $38,483,775 | | | 4,163,396 | | | $48,771,030 | |
The fund and certain other funds managed by MFS participate in a $1.1 billion unsecured committed line of credit, subject to a $1 billion sublimit, provided by a syndication of banks under a credit agreement. Borrowings may be made for temporary financing needs. Interest is charged to each fund, based on its borrowings, generally at a rate equal to the higher of the Federal Reserve funds rate or one month LIBOR plus an agreed upon spread. A commitment fee, based on the average daily, unused portion of the committed line of credit, is allocated among the participating funds at the end of each calendar quarter. In
50
Notes to Financial Statements (unaudited) – continued
addition, the fund and other funds managed by MFS have established unsecured uncommitted borrowing arrangements with certain banks for temporary financing needs. Interest is charged to each fund, based on its borrowings, at a rate equal to the Federal Reserve funds rate plus an agreed upon spread. For the six months ended April 30, 2010, the fund’s commitment fee and interest expense were $5,593 and $0, respectively, and are included in miscellaneous expense on the Statement of Operations.
| (7) | | Transactions in Underlying Funds-Affiliated Issuers |
An affiliated issuer may be considered one in which the fund owns 5% or more of the outstanding voting securities, or a company which is under common control. For the purposes of this report, the fund assumes the following to be affiliated issuers:
| | | | | | | | | |
| Underlying Funds | | Beginning
Shares/Par
Amount | | Acquisitions
Shares/Par
Amount | | Dispositions
Shares/Par
Amount | | | Ending
Shares/Par
Amount |
MFS Institutional Money
Market Portfolio | | 30,281,275 | | 153,241,945 | | (125,798,670 | ) | | 57,724,550 |
| | | | |
| Underlying Funds | | Realized
Gain (Loss) | | Capital Gain
Distributions | | Dividend
Income | | | Ending
Value |
MFS Institutional Money
Market Portfolio | | $— | | $— | | $33,292 | | | $57,724,550 |
51
RESULTS OF SHAREHOLDER MEETING
(unaudited)
At a special meeting of shareholders of MFS Series Trust VI, which was held on January 28, 2010, the following actions were taken:
Item 1: To elect the following individuals as Trustees:
| | | | |
| | | Number of Dollars |
Nominee | | For | | Withheld Authority |
| Robert E. Butler | | 2,411,252,799.370 | | 47,579,338.071 |
| Lawrence H. Cohn, M.D. | | 2,410,483,391.074 | | 48,348,746.367 |
| Maureen R. Goldfarb | | 2,410,831,816.711 | | 48,000,320.729 |
| David H. Gunning | | 2,411,089,708.057 | | 47,742,429.383 |
| William R. Gutow | | 2,411,301,100.675 | | 47,531,036.765 |
| Michael Hegarty | | 2,411,246,863.087 | | 47,585,274.353 |
| John P. Kavanaugh | | 2,411,407,913.952 | | 47,424,223.489 |
| Robert J. Manning | | 2,411,252,528.550 | | 47,579,608.891 |
| Robert C. Pozen | | 2,411,438,532.476 | | 47,393,604.964 |
| J. Dale Sherratt | | 2,410,865,242.225 | | 47,966,895.216 |
| Laurie J. Thomsen | | 2,411,131,252.551 | | 47,700,884.890 |
| Robert W. Uek | | 2,411,143,493.112 | | 47,688,644.329 |
52
BOARD REVIEW OF INVESTMENT ADVISORY AGREEMENT
A discussion regarding the Board’s most recent review and renewal of the fund’s Investment Advisory Agreement with MFS is available by clicking on the fund’s name under “Mutual Funds” in the “Products and Performance” section of the MFS Web site (mfs.com).
PROXY VOTING POLICIES AND INFORMATION
A general description of the MFS funds’ proxy voting policies and procedures is available without charge, upon request, by calling
1-800-225-2606, by visiting the Proxy Voting section of mfs.com or by visiting the SEC’s Web site at http://www.sec.gov.
Information regarding how the fund voted proxies relating to portfolio securities during the most recent twelve-month period ended June 30 is available without charge by visiting the Proxy Voting section of mfs.com or by visiting the SEC’s Web site at http://www.sec.gov.
QUARTERLY PORTFOLIO DISCLOSURE
The fund will file a complete schedule of portfolio holdings with the Securities and Exchange Commission (the Commission) for the first and third quarters of each fiscal year on Form N-Q. The fund’s Form N-Q may be reviewed and copied at the:
Public Reference Room
Securities and Exchange Commission
100 F Street, NE, Room 1580
Washington, D.C. 20549
Information on the operation of the Public Reference Room may be obtained by calling the Commission at 1-800-SEC-0330. The fund’s Form N-Q is available on the EDGAR database on the Commission’s Internet Web site at http://www.sec.gov, and copies of this information may be obtained, upon payment of a duplicating fee, by electronic request at the following e-mail address: publicinfo@sec.gov or by writing the Public Reference Section at the above address.
A shareholder can also obtain the quarterly portfolio holdings report at mfs.com.
FURTHER INFORMATION
From time to time, MFS may post important information about the fund or the MFS funds on the MFS web site (mfs.com). This information is available by visiting the “News & Commentary” section of mfs.com or by clicking on the fund’s name under “Mutual Funds” in the “Products and Performance” section of mfs.com.
53
CONTACT US
| | |
| Web site | | Mailing address |
| mfs.com | | MFS Service Center, Inc. |
| | P.O. Box 55824 |
| MFS TALK | | Boston, MA 02205-5824 |
| 1-800-637-8255 | | |
| 24 hours a day | | Overnight mail |
| | MFS Service Center, Inc. |
| Account service and | | c/o Boston Financial Data Services |
| literature | | 30 Dan Road |
Shareholders | | Canton, MA 02021-2809 |
| 1-800-225-2606 | | |
| |
| Investment professionals | | |
| 1-800-343-2829 | | |
| |
| Retirement plan services | | |
| 1-800-637-1255 | | |

Save paper with eDelivery. MFS® will send you prospectuses, reports, and proxies directly via e-mail so you will get information faster with less mailbox clutter. To sign up: 1. go to mfs.com. 2. log in via MFS® Access. 3. select eDelivery. If you own your MFS fund shares through a financial institution or a retirement plan, MFS® TALK, MFS Access, and eDelivery may not be available to you.


MFS® Utilities Fund
The report is prepared for the general information of shareholders. It is authorized for distribution to prospective investors only when preceded or accompanied by a current prospectus.
NOT FDIC INSURED Ÿ MAY LOSE VALUE Ÿ
NO BANK GUARANTEE
4/30/10
MMU-SEM

LETTER FROM THE CEO
Dear Shareholders:
After having suffered their biggest declines since the Great Depression, most global markets experienced an impressive resurgence during the latter months of 2009 and the first quarter of 2010. The global economy was able to reap the benefits of two major trends. The first of these was the massive efforts of governments and central banks to increase liquidity in the financial system as they sought to prevent the credit crisis from further affecting the banking system. The second was the move by companies around the world to cut costs and operations to prepare for rapidly changing market conditions. We believe that these moves not only shortened the length of the downturn but also set the stage for recovery.
Even with the significant market gains of 2009 and the early part of 2010, the recovery is unrolling at a moderate pace, with rebounds in the manufacturing sector and corporate America leading the way. Central bankers are proceeding with caution and have held benchmark interest rates unchanged as they debate the best way to withdraw stimulus measures without disrupting the fragile growth process.
While hurdles remain, we believe that the global economy is on the road to recovery. As always, we continue to be mindful of the many challenges faced at the individual, national, and international levels. It is at times such as these that we want to remind investors of the merits of maintaining a long-term view, adhering to basic investing principles such as asset allocation and diversification, and working closely with advisors to identify and research investment opportunities. At MFS®, we take particular pride in how well mutual funds can help investors by providing the diversification that is important in any type of market climate.
Respectfully,

Robert J. Manning
Chief Executive Officer and Chief Investment Officer
MFS Investment Management®
June 15, 2010
The opinions expressed in this letter are subject to change, may not be relied upon for investment advice, and no forecasts can be guaranteed.
1
PORTFOLIO COMPOSITION
Portfolio structure (i)
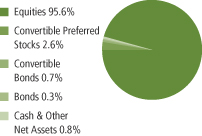
| | |
| Top ten holdings (i) | | |
| Williams Cos., Inc. | | 3.7% |
| CMS Energy Corp. | | 3.6% |
| Virgin Media, Inc. | | 3.3% |
| Questar Corp. | | 3.2% |
| EQT Corp. | | 2.8% |
| El Paso Corp. | | 2.7% |
| Entergy Corp. | | 2.6% |
| American Electric Power Co., Inc. | | 2.6% |
| Comcast Corp., “Special A” | | 2.5% |
| Cellcom Israel Ltd. | | 2.5% |
| | |
| Top five industries (i) | | |
| Utilities - Electric Power | | 48.9% |
| Telephone Services | | 15.1% |
| Telecommunications - Wireless | | 10.7% |
| Natural Gas - Distribution | | 9.7% |
| Natural Gas - Pipeline | | 7.9% |
| | |
| |
| Issuer country weightings (i) | | |
| United States | | 68.8% |
| Brazil | | 7.5% |
| Israel | | 3.8% |
| United Kingdom | | 3.6% |
| Spain | | 3.3% |
| Portugal | | 2.9% |
| Germany | | 2.0% |
| Czech Republic | | 1.4% |
| Russia | | 1.1% |
| Other Countries | | 5.6% |
| (i) | For purposes of this presentation, the components include the market value of securities and reflect the impact of the equivalent exposure of derivative positions, if applicable. These amounts may be negative from time to time. The bond component will include any accrued interest amounts. Equivalent exposure is a calculated amount that translates the derivative position into a reasonable approximation of the amount of the underlying asset that the portfolio would have to hold at a given point in time to have the same price sensitivity that results from the portfolio’s ownership of the derivative contract. When dealing with derivatives, equivalent exposure is a more representative measure of the potential impact of a position on portfolio performance than market value. |
Percentages are based on net assets as of 4/30/10.
The portfolio is actively managed and current holdings may be different.
2
MARKET ENVIRONMENT
After having suffered through one of the largest and most concentrated downturns since the 1930s, most asset markets staged a remarkable rebound during 2009 and early 2010. This recovery in global activity, which covers this reporting period, has been led importantly by emerging Asian economies, but broadening to include most of the global economy to varying degrees. Primary drivers of the recovery included an unwinding of the inventory destocking that took place earlier, the production of manufacturing and capital goods, as well as massive fiscal and monetary stimulus.
During the worst of the credit crisis, policy makers globally loosened monetary and fiscal policy on a massive scale. Having reached their lower bound on policy rates prior to the beginning of the reporting period, several central banks were implementing quantitative easing as a means to further loosen monetary policy to offset the continuing fall in global economic activity. However, by the beginning of the period, there were ever-broadening signs that the global macroeconomic deterioration had passed, which caused the subsequent rise in asset valuations. As most asset prices rebounded during the period and the demand for liquidity waned, the debate concerning the existence of asset bubbles and the need for monetary exit strategies had begun, creating added uncertainty regarding the forward path of policy rates. Nonetheless, risky-asset valuation generally hit secular highs by the end of the period.
3
EXPENSE TABLE
Fund expenses borne by the shareholders during the period, November 1, 2009 through April 30, 2010
As a shareholder of the fund, you incur two types of costs: (1) transaction costs, including sales charges (loads) on certain purchase or redemption payments, and (2) ongoing costs, including management fees; distribution and service (12b-1) fees; and other fund expenses. This example is intended to help you understand your ongoing costs (in dollars) of investing in the fund and to compare these costs with the ongoing costs of investing in other mutual funds.
The example is based on an investment of $1,000 invested at the beginning of the period and held for the entire period November 1, 2009 through April 30, 2010.
Actual Expenses
The first line for each share class in the following table provides information about actual account values and actual expenses. You may use the information in this line, together with the amount you invested, to estimate the expenses that you paid over the period. Simply divide your account value by $1,000 (for example, an $8,600 account value divided by $1,000 = 8.6), then multiply the result by the number in the first line under the heading entitled “Expenses Paid During Period” to estimate the expenses you paid on your account during this period.
Hypothetical Example for Comparison Purposes
The second line for each share class in the following table provides information about hypothetical account values and hypothetical expenses based on the fund’s actual expense ratio and an assumed rate of return of 5% per year before expenses, which is not the fund’s actual return. The hypothetical account values and expenses may not be used to estimate the actual ending account balance or expenses you paid for the period. You may use this information to compare the ongoing costs of investing in the fund and other funds. To do so, compare this 5% hypothetical example with the 5% hypothetical examples that appear in the shareholder reports of the other funds.
Please note that the expenses shown in the table are meant to highlight your ongoing costs only and do not reflect any transactional costs, such as sales charges (loads). Therefore, the second line for each share class in the table is useful in comparing ongoing costs only, and will not help you determine the relative total costs of owning different funds. In addition, if these transactional costs were included, your costs would have been higher.
4
Expense Table – continued
| | | | | | | | | | |
Share
Class | | | | Annualized
Expense
Ratio | | Beginning
Account Value
11/01/09 | | Ending
Account Value
4/30/10 | | Expenses
Paid During
Period (p) 11/01/09-4/30/10 |
| A | | Actual | | 1.05% | | $1,000.00 | | $1,105.57 | | $5.48 |
| | Hypothetical (h) | | 1.05% | | $1,000.00 | | $1,019.59 | | $5.26 |
| B | | Actual | | 1.80% | | $1,000.00 | | $1,100.98 | | $9.38 |
| | Hypothetical (h) | | 1.80% | | $1,000.00 | | $1,015.87 | | $9.00 |
| C | | Actual | | 1.80% | | $1,000.00 | | $1,101.86 | | $9.38 |
| | Hypothetical (h) | | 1.80% | | $1,000.00 | | $1,015.87 | | $9.00 |
| I | | Actual | | 0.80% | | $1,000.00 | | $1,107.45 | | $4.18 |
| | Hypothetical (h) | | 0.80% | | $1,000.00 | | $1,020.83 | | $4.01 |
| R1 | | Actual | | 1.80% | | $1,000.00 | | $1,101.90 | | $9.38 |
| | Hypothetical (h) | | 1.80% | | $1,000.00 | | $1,015.87 | | $9.00 |
| R2 | | Actual | | 1.30% | | $1,000.00 | | $1,104.37 | | $6.78 |
| | Hypothetical (h) | | 1.30% | | $1,000.00 | | $1,018.35 | | $6.51 |
| R3 | | Actual | | 1.05% | | $1,000.00 | | $1,105.73 | | $5.48 |
| | Hypothetical (h) | | 1.05% | | $1,000.00 | | $1,019.59 | | $5.26 |
| R4 | | Actual | | 0.80% | | $1,000.00 | | $1,106.88 | | $4.18 |
| | Hypothetical (h) | | 0.80% | | $1,000.00 | | $1,020.83 | | $4.01 |
| (h) | 5% class return per year before expenses. |
| (p) | Expenses paid is equal to each class’ annualized expense ratio, as shown above, multiplied by the average account value over the period, multiplied by the number of days in the period, divided by the number of days in the year. Expenses paid do not include any applicable sales charges (loads). If these transaction costs had been included, your costs would have been higher. |
5
PORTFOLIO OF INVESTMENTS
4/30/10 (unaudited)
The Portfolio of Investments is a complete list of all securities owned by your fund. It is categorized by broad-based asset classes.
| | | | | |
| Common Stocks - 95.6% | | | | | |
| Issuer | | Shares/Par | | Value ($) |
| | | | | |
| Cable TV - 5.4% | | | | | |
| Cablevision Systems Corp., “A” | | 181,100 | | $ | 4,969,384 |
| Comcast Corp., “Special A” | | 3,890,600 | | | 73,337,810 |
| DIRECTV Group, Inc., “A” (a) | | 387,800 | | | 14,049,994 |
| Net Servicos de Comunicacao S.A., IPS (a) | | 357,500 | | | 4,216,166 |
| Time Warner Cable, Inc. | | 1,129,269 | | | 63,521,381 |
| | | | | |
| | | | | $ | 160,094,735 |
| Energy - Independent - 1.3% | | | | | |
| Apache Corp. | | 73,900 | | $ | 7,520,064 |
| CONSOL Energy, Inc. | | 492,940 | | | 22,024,559 |
| Southwestern Energy Co. (a) | | 151,500 | | | 6,011,520 |
| Ultra Petroleum Corp. (a) | | 31,600 | | | 1,509,532 |
| | | | | |
| | | | | $ | 37,065,675 |
| Natural Gas - Distribution - 9.7% | | | | | |
| EQT Corp. | | 1,923,230 | | $ | 83,641,273 |
| NiSource, Inc. | | 1,423,000 | | | 23,194,900 |
| Questar Corp. | | 1,992,866 | | | 95,557,925 |
| Sempra Energy | | 1,362,590 | | | 67,012,176 |
| Southern Union Co. | | 367,700 | | | 9,608,001 |
| Spectra Energy Corp. | | 330,120 | | | 7,705,001 |
| | | | | |
| | | | | $ | 286,719,276 |
| Natural Gas - Pipeline - 7.0% | | | | | |
| El Paso Corp. | | 6,582,250 | | $ | 79,645,225 |
| Enagas S.A. | | 921,275 | | | 18,405,709 |
| Williams Cos., Inc. | | 4,662,060 | | | 110,071,237 |
| | | | | |
| | | | | $ | 208,122,171 |
| Telecommunications - Wireless - 10.7% | | | | | |
| America Movil S.A.B. de C.V., “L”, ADR | | 297,770 | | $ | 15,329,200 |
| Cellcom Israel Ltd. | | 2,398,152 | | | 72,664,006 |
| Mobile TeleSystems OJSC, ADR | | 362,510 | | | 20,028,678 |
| MTN Group Ltd. | | 1,462,290 | | | 21,527,194 |
| Partner Communication Co. Ltd., ADR | | 1,840,600 | | | 36,149,384 |
| Philippine Long Distance Telephone Co. | | 123,700 | | | 6,915,238 |
| Philippine Long Distance Telephone Co., ADR | | 252,000 | | | 14,172,480 |
| Tim Participacoes S.A., ADR | | 542,300 | | | 14,094,377 |
6
Portfolio of Investments (unaudited) – continued
| | | | | |
| Issuer | | Shares/Par | | Value ($) |
| | | | | |
| Common Stocks - continued | | | | | |
| Telecommunications - Wireless - continued | | | | | |
| VimpelCom Ltd. (a) | | 700,200 | | $ | 12,197,484 |
| Vivo Participacoes S.A., ADR | | 1,499,975 | | | 39,704,338 |
| Vodafone Group PLC | | 28,165,240 | | | 62,637,457 |
| | | | | |
| | | | | $ | 315,419,836 |
| Telephone Services - 14.3% | | | | | |
| American Tower Corp., “A” (a) | | 677,800 | | $ | 27,661,018 |
| AT&T, Inc. | | 1,355,080 | | | 35,313,385 |
| Bezeq - The Israel Telecommunication Corp. Ltd. | | 1,068,400 | | | 2,597,927 |
| CenturyTel, Inc. | | 1,473,241 | | | 50,252,251 |
| Crown Castle International Corp. (a) | | 283,500 | | | 10,730,475 |
| France Telecom | | 809,600 | | | 17,746,680 |
| Hellenic Telecommunications Organization S.A. | | 692,036 | | | 7,744,779 |
| Portugal Telecom, SGPS, S.A. | | 3,139,800 | | | 31,836,012 |
| PT XL Axiata Tbk (a) | | 26,350,000 | | | 10,852,349 |
| Qwest Communications International, Inc. | | 5,562,300 | | | 29,090,829 |
| Royal KPN N.V. | | 803,270 | | | 12,009,987 |
| Singapore Telecommunications Ltd. | | 6,666,000 | | | 14,790,975 |
| Telefonica S.A. | | 1,319,190 | | | 29,624,795 |
| Telenet Group Holding N.V. | | 388,141 | | | 11,704,116 |
| Virgin Media, Inc. | | 5,471,109 | | | 96,236,807 |
| Windstream Corp. | | 3,248,595 | | | 35,896,975 |
| | | | | |
| | | | | $ | 424,089,360 |
| Utilities - Electric Power - 47.2% | | | | | |
| AES Corp. (a) | | 5,734,460 | | $ | 66,175,668 |
| AES Tiete S.A., IPS | | 1,598,718 | | | 17,851,929 |
| Allegheny Energy, Inc. | | 679,500 | | | 14,799,510 |
| Alliant Energy Corp. | | 575,300 | | | 19,675,260 |
| American Electric Power Co., Inc. | | 2,225,730 | | | 76,342,539 |
| American Water Works Co., Inc. | | 838,600 | | | 18,264,708 |
| Calpine Corp. (a) | | 2,374,515 | | | 32,364,639 |
| CenterPoint Energy, Inc. | | 1,129,510 | | | 16,219,764 |
| CEZ AS | | 865,630 | | | 41,541,856 |
| China Hydroelectric Corp., ADR (a) | | 792,143 | | | 7,501,594 |
| China Longyuan Electric Power Group Corp. (a) | | 11,923,000 | | | 12,575,784 |
| CMS Energy Corp. | | 6,458,190 | | | 105,010,169 |
| Companhia de Saneamento de Minas Gerais | | 1,064,100 | | | 15,444,984 |
| Companhia Paranaense de Energia, ADR | | 498,000 | | | 10,298,640 |
| Companhia Paranaense de Energia, IPS | | 281,200 | | | 5,726,725 |
| Constellation Energy Group, Inc. | | 1,328,193 | | | 46,951,623 |
| Covanta Holding Corp. (a) | | 261,400 | | | 4,569,272 |
| CPFL Energia S.A. | | 436,700 | | | 8,943,777 |
7
Portfolio of Investments (unaudited) – continued
| | | | | | |
| Issuer | | Shares/Par | | Value ($) |
| | | | | | |
| Common Stocks - continued | | | | | | |
| Utilities - Electric Power - continued | | | | | | |
| CPFL Energia S.A., ADR | | | 48,200 | | $ | 2,997,558 |
| DPL, Inc. | | | 1,752,633 | | | 49,389,198 |
| E.ON AG (l) | | | 1,147,947 | | | 42,429,329 |
| EDP Renovaveis S.A. (a) | | | 441,415 | | | 3,135,608 |
| Electricite de France | | | 165,700 | | | 8,914,559 |
| Eletropaulo Metropolitana S.A., IPS | | | 2,142,260 | | | 47,325,059 |
| Enel S.p.A | | | 558,900 | | | 2,914,848 |
| Energias de Portugal S.A. | | | 14,145,400 | | | 50,282,539 |
| Energias do Brasil S.A. | | | 553,020 | | | 10,610,221 |
| Enersis S.A., ADR | | | 72,900 | | | 1,449,981 |
| Entergy Corp. | | | 953,800 | | | 77,534,402 |
| FirstEnergy Corp. | | | 730,730 | | | 27,672,740 |
| FPL Group, Inc. | | | 320,600 | | | 16,687,230 |
| ITC Holdings Corp. | | | 53,600 | | | 2,992,488 |
| National Grid PLC | | | 4,558,300 | | | 44,014,262 |
| Northeast Utilities | | | 1,452,860 | | | 40,374,979 |
| NRG Energy, Inc. (a) | | | 2,130,556 | | | 51,495,539 |
| NV Energy, Inc. | | | 366,600 | | | 4,578,834 |
| Oesterreichische Elektrizitaetswirtschafts AG (Verbund), “A” | | | 6,743 | | | 251,947 |
| OGE Energy Corp. | | | 1,045,827 | | | 43,276,321 |
| PG&E Corp. | | | 1,478,600 | | | 64,762,680 |
| PPL Corp. | | | 2,482,300 | | | 61,461,748 |
| Public Service Enterprise Group, Inc. | | | 2,181,052 | | | 70,077,201 |
| Red Electrica de Espana | | | 1,064,346 | | | 50,385,826 |
| RWE AG (l) | | | 212,000 | | | 17,347,460 |
| TECO Energy, Inc. | | | 90,200 | | | 1,527,086 |
| Tractebel Energia S.A. | | | 3,385,000 | | | 43,134,043 |
| Wisconsin Energy Corp. | | | 745,767 | | | 39,160,225 |
| | | | | | |
| | | | | | $ | 1,396,442,352 |
| Total Common Stocks (Identified Cost, $2,468,648,961) | | | | | $ | 2,827,953,405 |
| | |
| Bonds - 0.3% | | | | | | |
| Asset Backed & Securitized - 0.0% | | | | | | |
| Falcon Franchise Loan LLC, FRN, 3.068%, 2023 (i)(z) | | | 1,960,212 | | $ | 98,795 |
| | |
| Network & Telecom - 0.3% | | | | | | |
| New Communications Holdings, Inc., 8.5%, 2020 (z) | | $ | 5,145,000 | | $ | 5,299,350 |
| New Communications Holdings, Inc., 8.75%, 2022 (z) | | | 2,560,000 | | | 2,636,800 |
| | | | | | |
| | | | | | $ | 7,936,150 |
| Total Bonds (Identified Cost, $7,808,393) | | | | | $ | 8,034,945 |
8
Portfolio of Investments (unaudited) – continued
| | | | | | | |
| Issuer | | Shares/Par | | Value ($) | |
| | | | | | | |
| Convertible Bonds - 0.7% | | | | | | | |
| Telephone Services - 0.7% | | | | | | | |
| Virgin Media, Inc., 6.5%, 2016 (Identified Cost, $14,537,197) | | $ | 17,234,000 | | $ | 21,477,873 | |
| | |
| Convertible Preferred Stocks - 2.6% | | | | | | | |
| Natural Gas - Pipeline - 0.9% | | | | | | | |
| El Paso Corp., 4.99% | | | 25,600 | | $ | 26,880,000 | |
| | |
| Utilities - Electric Power - 1.7% | | | | | | | |
| FPL Group, Inc., 8.375% | | | 676,000 | | $ | 35,321,000 | |
| Great Plains Energy, Inc., 12% | | | 241,990 | | | 15,862,445 | |
| | | | | | | |
| | | | | | $ | 51,183,445 | |
Total Convertible Preferred Stocks
(Identified Cost, $77,204,481) | | | | | $ | 78,063,445 | |
| | |
| Money Market Funds (v) - 2.0% | | | | | | | |
MFS Institutional Money Market Portfolio, 0.19%,
at Cost and Net Asset Value | | | 58,519,561 | | $ | 58,519,561 | |
| | |
| Collateral for Securities Loaned - 1.2% | | | | | | | |
| Goldman Sachs, Repurchase Agreement, 0.19%, dated 4/30/10, due 5/03/10, total to be received $16,066,357 (secured by U.S. Treasury and Federal Agency obligations valued at $16,387,437 in an individually traded account) | | | 16,066,103 | | $ | 16,066,103 | |
| Morgan Stanley, Repurchase Agreement, 0.19%, dated 4/30/10, due 5/03/10, total to be received $20,000,317 (secured by U.S. Treasury and Federal Agency obligations valued at $20,400,388 in an individually traded account) | | | 20,000,000 | | | 20,000,000 | |
Total Collateral for Securities Loaned,
at Cost and Value | | | | | $ | 36,066,103 | |
| Total Investments (Identified Cost, $2,662,784,696) | | | | | $ | 3,030,115,332 | |
| | |
| Other Assets, Less Liabilities - (2.4)% | | | | | | (72,441,883 | ) |
| Net Assets - 100.0% | | | | | $ | 2,957,673,449 | |
| (a) | Non-income producing security. |
| (i) | Interest only security for which the fund receives interest on notional principal (Par amount). Par amount shown is the notional principal and does not reflect the cost of the security. |
| (l) | All or a portion of this security is on loan. |
| (v) | Underlying fund that is available only to investment companies managed by MFS. The rate quoted is the annualized seven-day yield of the fund at period end. |
9
Portfolio of Investments (unaudited) – continued
| (z) | Restricted securities are not registered under the Securities Act of 1933 and are subject to legal restrictions on resale. These securities generally may be resold in transactions exempt from registration or to the public if the securities are subsequently registered. Disposal of these securities may involve time-consuming negotiations and prompt sale at an acceptable price may be difficult. The fund holds the following restricted securities: |
| | | | | | | |
| Restricted Securities | | Acquisition
Date | | Cost | | Current
Market
Value | |
| Falcon Franchise Loan LLC, FRN, 3.068%, 2023 | | 1/18/02 | | $103,393 | | $98,795 | |
| New Communications Holdings, Inc., 8.5%, 2020 | | 3/26/10 | | 5,145,000 | | 5,299,350 | |
| New Communications Holdings, Inc., 8.75%, 2022 | | 3/26/10 | | 2,560,000 | | 2,636,800 | |
| Total Restricted Securities | | | | | | $8,034,945 | |
| % of Net Assets | | | | | | 0.3 | % |
The following abbreviations are used in this report and are defined:
| ADR | | American Depository Receipt |
| FRN | | Floating Rate Note. Interest rate resets periodically and may not be the rate reported at period end. |
| IPS | | International Preference Stock |
| PLC | | Public Limited Company |
Abbreviations indicate amounts shown in currencies other than the U.S. dollar. All amounts are stated in U.S. dollars unless otherwise indicated. A list of abbreviations is shown below:
Derivative Contracts at 4/30/10
Forward Foreign Currency Exchange Contracts at 4/30/10
| | | | | | | | | | | | | | |
| Type | | Currency | | Counterparty | | Contracts
to Deliver/
Receive | | Settlement Date Range | | In
Exchange
For | | Contracts
at Value | | Net
Unrealized
Appreciation
(Depreciation) |
| Asset Derivatives | | | | | | | | | | |
| SELL | | EUR | | Barclays Bank | | 8,644,563 | | 6/14/10-7/12/10 | | $11,687,213 | | $11,511,349 | | $175,864 |
| SELL | | EUR | | Credit Suisse | | 2,360,475 | | 6/14/10 | | 3,173,966 | | 3,143,178 | | 30,788 |
| SELL | | EUR | | Deutsche Bank | | 4,008,017 | | 6/14/10 | | 5,455,629 | | 5,337,022 | | 118,607 |
| SELL | | EUR | | Goldman Sachs | | 1,830,679 | | 6/14/10 | | 2,502,011 | | 2,437,708 | | 64,303 |
| SELL | | EUR | | HSBC Bank | | 14,360,986 | | 6/14/10 | | 19,450,331 | | 19,122,898 | | 327,433 |
| SELL | | EUR | | Merrill Lynch | | 14,596,228 | | 6/14/10 | | 19,943,337 | | 19,436,142 | | 507,195 |
| SELL | | EUR | | UBS AG | | 106,250,044 | | 6/14/10 | | 145,183,005 | | 141,481,142 | | 3,701,863 |
| BUY | | GBP | | HSBC Bank | | 1,562,893 | | 6/14/10 | | 2,342,212 | | 2,390,934 | | 48,722 |
| SELL | | GBP | | Citibank N.A | | 852,794 | | 6/14/10 | | 1,307,073 | | 1,304,616 | | 2,457 |
| SELL | | GBP | | Goldman Sachs | | 913,761 | | 6/14/10 | | 1,414,252 | | 1,397,884 | | 16,368 |
| | | | | | | | | | | | | | |
| | | | | | | | | | | | | | $4,993,600 |
| | | | | | | | | | | | | | |
10
Portfolio of Investments (unaudited) – continued
Forward Foreign Currency Exchange Contracts at 4/30/10 – continued
| | | | | | | | | | | | | | | |
| Type | | Currency | | Counterparty | | Contracts
to Deliver/
Receive | | Settlement Date Range | | In
Exchange
For | | Contracts
at Value | | Net
Unrealized
Appreciation
(Depreciation) | |
| Liability Derivatives | | | | | | | | | | | |
| BUY | | EUR | | Barclays Bank | | 229,366 | | 6/14/10 | | $307,660 | | $305,421 | | $(2,239 | ) |
| BUY | | EUR | | Deutsche Bank | | 62,927 | | 6/14/10 | | 85,176 | | 83,793 | | (1,383 | ) |
| BUY | | EUR | | Goldman Sachs | | 304,381 | | 6/14/10 | | 408,381 | | 405,309 | | (3,072 | ) |
| BUY | | EUR | | HSBC Bank | | 3,101,248 | | 6/14/10 | | 4,214,729 | | 4,129,581 | | (85,148 | ) |
| BUY | | EUR | | JPMorgan Bank | | 22,188,739 | | 6/14/10 | | 29,616,641 | | 29,546,229 | | (70,412 | ) |
| BUY | | EUR | | UBS AG | | 103,632 | | 6/14/10 | | 141,618 | | 137,995 | | (3,623 | ) |
| SELL | | EUR | | Credit Suisse | | 6,669,295 | | 6/14/10 | | 8,788,196 | | 8,880,744 | | (92,548 | ) |
| SELL | | EUR | | HSBC Bank | | 3,819,119 | | 6/14/10 | | 5,063,502 | | 5,085,487 | | (21,985 | ) |
| SELL | | EUR | | JPMorgan Bank | | 4,354,915 | | 6/14/10 | | 5,774,299 | | 5,798,946 | | (24,647 | ) |
| SELL | | GBP | | Barclays Bank | | 19,183,180 | | 7/12/10 | | 29,267,969 | | 29,344,318 | | (76,349 | ) |
| SELL | | GBP | | Citibank | | 512,168 | | 6/14/10 | | 780,406 | | 783,522 | | (3,116 | ) |
| SELL | | GBP | | Deutsche Bank | | 19,183,180 | | 7/12/10 | | 29,268,161 | | 29,344,318 | | (76,157 | ) |
| SELL | | GBP | | JPMorgan Bank | | 959,268 | | 6/14/10 | | 1,457,023 | | 1,467,503 | | (10,480 | ) |
| | | | | | | | | | | | | | | |
| | | | | | | | | | | | | | $(471,159 | ) |
| | | | | | | | | | | | | | | |
At April 30, 2010, the fund had sufficient cash and/or other liquid securities to cover any commitments under these derivative contracts.
See Notes to Financial Statements
11
Financial Statements
STATEMENT OF ASSETS AND LIABILITIES
At 4/30/10 (unaudited)
This statement represents your fund’s balance sheet, which details the assets and liabilities comprising the total value of the fund.
| | | |
| Assets | | | |
Investments- | | | |
Non-affiliated issuers, at value (identified cost, $2,604,265,135) | | $2,971,595,771 | |
Underlying funds, at cost and value | | 58,519,561 | |
Total investments, at value, including $35,696,406 of securities on loan
(identified cost, $2,662,784,696) | | $3,030,115,332 | |
Cash | | 1,989,134 | |
Restricted cash | | 341,000 | |
Foreign currency, at value (identified cost, $712,473) | | 709,732 | |
Receivables for | | | |
Forward foreign currency exchange contracts | | 4,993,600 | |
Investments sold | | 37,365,905 | |
Fund shares sold | | 8,993,233 | |
Interest and dividends | | 5,643,089 | |
Other assets | | 20,951 | |
Total assets | | $3,090,171,976 | |
| Liabilities | | | |
Payables for | | | |
Distributions | | $1,018,654 | |
Forward foreign currency exchange contracts | | 471,159 | |
Investments purchased | | 87,586,340 | |
Fund shares reacquired | | 6,150,175 | |
Collateral for securities loaned, at value | | 36,066,103 | |
Payable to affiliates | | | |
Investment adviser | | 97,001 | |
Shareholder servicing costs | | 878,093 | |
Distribution and service fees | | 65,135 | |
Administrative services fee | | 2,225 | |
Payable for independent Trustees’ compensation | | 72,962 | |
Accrued expenses and other liabilities | | 90,680 | |
Total liabilities | | $132,498,527 | |
Net assets | | $2,957,673,449 | |
| Net assets consist of | | | |
Paid-in capital | | $3,253,831,262 | |
Unrealized appreciation (depreciation) on investments and translation of assets and liabilities in foreign currencies | | 371,889,789 | |
Accumulated net realized gain (loss) on investments and foreign currency transactions | | (664,923,189 | ) |
Accumulated distributions in excess of net investment income | | (3,124,413 | ) |
Net assets | | $2,957,673,449 | |
Shares of beneficial interest outstanding | | 197,539,073 | |
| | | | | | |
| | | Net assets | | Shares
outstanding | | Net asset value
per share (a) |
Class A | | $1,858,456,652 | | 124,036,289 | | $14.98 |
Class B | | 204,310,895 | | 13,680,775 | | 14.93 |
Class C | | 410,428,504 | | 27,475,847 | | 14.94 |
Class I | | 113,027,022 | | 7,525,398 | | 15.02 |
Class R1 | | 10,292,465 | | 689,991 | | 14.92 |
Class R2 | | 71,363,277 | | 4,771,470 | | 14.96 |
Class R3 | | 267,191,164 | | 17,851,767 | | 14.97 |
Class R4 | | 22,603,470 | | 1,507,536 | | 14.99 |
| (a) | Maximum offering price per share was equal to the net asset value per share for all share classes, except for Class A, for which the maximum offering price per share was $15.89 [100 / 94.25 x $14.98]. On sales of $50,000 or more, the maximum offering price of Class A shares is reduced. A contingent deferred sales charge may be imposed on redemptions of Class A, Class B, and Class C shares. Redemption price per share was equal to the net asset value per share for Classes I, R1, R2, R3, and R4. |
See Notes to Financial Statements
12
Financial Statements
STATEMENT OF OPERATIONS
Six months ended 4/30/10 (unaudited)
This statement describes how much your fund earned in investment income and accrued in expenses. It also describes any gains and/or losses generated by fund operations.
| | | |
| Net investment income | | | |
Income | | | |
Dividends | | $50,708,977 | |
Interest | | 2,231,182 | |
Dividends from underlying funds | | 64,743 | |
Foreign taxes withheld | | (1,550,104 | ) |
Total investment income | | $51,454,798 | |
Expenses | | | |
Management fee | | $8,263,944 | |
Distribution and service fees | | 5,570,641 | |
Shareholder servicing costs | | 1,936,660 | |
Administrative services fee | | 202,291 | |
Independent Trustees’ compensation | | 35,642 | |
Custodian fee | | 242,631 | |
Shareholder communications | | 105,254 | |
Auditing fees | | 24,564 | |
Legal fees | | 28,975 | |
Miscellaneous | | 177,203 | |
Total expenses | | $16,587,805 | |
Fees paid indirectly | | (159 | ) |
Reduction of expenses by investment adviser | | (6,129 | ) |
Net expenses | | $16,581,517 | |
Net investment income | | $34,873,281 | |
Realized and unrealized gain (loss) on investments and foreign currency transactions | |
Realized gain (loss) (identified cost basis) | | | |
Investment transactions (net of $33 country tax) | | $(27,589,721 | ) |
Foreign currency transactions | | 10,845,596 | |
Net realized gain (loss) on investments
and foreign currency transactions | | $(16,744,125 | ) |
Change in unrealized appreciation (depreciation) | | | |
Investments | | $234,819,672 | |
Translation of assets and liabilities in foreign currencies | | 6,706,161 | |
Net unrealized gain (loss) on investments
and foreign currency translation | | $241,525,833 | |
Net realized and unrealized gain (loss) on investments
and foreign currency | | $224,781,708 | |
Change in net assets from operations | | $259,654,989 | |
See Notes to Financial Statements
13
Financial Statements
STATEMENTS OF CHANGES IN NET ASSETS
These statements describe the increases and/or decreases in net assets resulting from operations, any distributions, and any shareholder transactions.
| | | | | | |
| Change in net assets | | Six months ended
4/30/10
(unaudited) | | | Year ended
10/31/09 | |
| From operations | | | | | | |
Net investment income | | $34,873,281 | | | $92,290,719 | |
Net realized gain (loss) on investments and foreign
currency transactions | | (16,744,125 | ) | | (559,752,109 | ) |
Net unrealized gain (loss) on investments and foreign
currency translation | | 241,525,833 | | | 850,553,984 | |
Change in net assets from operations | | $259,654,989 | | | $383,092,594 | |
| Distributions declared to shareholders | | | | | | |
From net investment income | | $(46,404,368 | ) | | $(79,651,477 | ) |
From net realized gain on investments | | — | | | (13,186,944 | ) |
Total distributions declared to shareholders | | $(46,404,368 | ) | | $(92,838,421 | ) |
Change in net assets from fund share transactions | | $319,448,517 | | | $(63,289,488 | ) |
Total change in net assets | | $532,699,138 | | | $226,964,685 | |
| Net assets | | | | | | |
At beginning of period | | 2,424,974,311 | | | 2,198,009,626 | |
At end of period (including accumulated distributions in excess of net investment income of $3,124,413 and undistributed net investment income of $8,406,674, respectively) | | $2,957,673,449 | | | $2,424,974,311 | |
See Notes to Financial Statements
14
Financial Statements
FINANCIAL HIGHLIGHTS
The financial highlights table is intended to help you understand the fund’s financial performance for the semiannual period and the past 5 fiscal years (or life of a particular share class, if shorter). Certain information reflects financial results for a single fund share. The total returns in the table represent the rate by which an investor would have earned (or lost) on an investment in the fund share class (assuming reinvestment of all distributions) held for the entire period.
| | | | | | | | | | | | | | | | | | |
| | | Six months
ended
4/30/10
(unaudited) | | | Years ended 10/31 | |
| Class A | | | 2009 | | | 2008 | | | 2007 | | | 2006 | | | 2005 | |
| | | | | | | | | | | | | | | | | |
Net asset value, beginning of period | | $13.79 | | | $12.04 | | | $20.71 | | | $15.33 | | | $12.33 | | | $9.98 | |
| Income (loss) from investment operations | | | | | | | | | | | | | | | | | | |
Net investment income (d) | | $0.20 | | | $0.54 | | | $0.34 | | | $0.35 | �� | | $0.30 | | | $0.18 | |
Net realized and unrealized gain (loss) on investments and foreign currency | | 1.25 | | | 1.75 | | | (7.53 | ) | | 5.38 | | | 2.94 | | | 2.34 | |
Total from investment operations | | $1.45 | | | $2.29 | | | $(7.19 | ) | | $5.73 | | | $3.24 | | | $2.52 | |
| Less distributions declared to shareholders | | | | | | | | | | | | | | | | | | |
From net investment income | | $(0.26 | ) | | $(0.47 | ) | | $(0.41 | ) | | $(0.35 | ) | | $(0.24 | ) | | $(0.17 | ) |
From net realized gain on investments | | — | | | (0.07 | ) | | (1.07 | ) | | — | | | — | | | — | |
Total distributions declared to shareholders | | $(0.26 | ) | | $(0.54 | ) | | $(1.48 | ) | | $(0.35 | ) | | $(0.24 | ) | | $(0.17 | ) |
Net asset value, end of period | | $14.98 | | | $13.79 | | | $12.04 | | | $20.71 | | | $15.33 | | | $12.33 | |
Total return (%) (r)(s)(t) | | 10.56 | (n) | | 19.78 | | | (37.21 | ) | | 37.77 | | | 26.48 | | | 25.33 | |
Ratios (%) (to average net assets)
and Supplemental data: | | | | | | | | | | |
Expenses before expense reductions (f) | | 1.05 | (a) | | 1.10 | | | 1.05 | | | 1.05 | | | 1.11 | | | 1.13 | |
Expenses after expense reductions (f) | | 1.05 | (a) | | 1.10 | | | 1.04 | | | 1.05 | | | 1.11 | | | 1.13 | |
Net investment income | | 2.69 | (a) | | 4.44 | | | 1.95 | | | 1.92 | | | 2.24 | | | 1.60 | |
Portfolio turnover | | 29 | | | 71 | | | 73 | | | 86 | | | 100 | | | 101 | |
Net assets at end of period (000 omitted) | | $1,858,457 | | | $1,766,611 | | | $1,593,003 | | | $2,479,305 | | | $1,319,703 | | | $933,535 | |
See Notes to Financial Statements
15
Financial Highlights – continued
| | | | | | | | | | | | | | | | | | |
| | | Six months
ended
4/30/10
(unaudited) | | | Years ended 10/31 | |
| Class B | | | 2009 | | | 2008 | | | 2007 | | | 2006 | | | 2005 | |
| | | | | | | | | | | | | | | | | |
Net asset value, beginning of
period | | $13.75 | | | $12.00 | | | $20.64 | | | $15.28 | | | $12.29 | | | $9.95 | |
Income (loss) from
investment operations | | | | | | | | | | | | | | | | | | |
Net investment income (d) | | $0.14 | | | $0.47 | | | $0.21 | | | $0.20 | | | $0.20 | | | $0.10 | |
Net realized and unrealized
gain (loss) on investments
and foreign currency | | 1.24 | | | 1.73 | | | (7.51 | ) | | 5.38 | | | 2.93 | | | 2.32 | |
Total from investment
operations | | $1.38 | | | $2.20 | | | $(7.30 | ) | | $5.58 | | | $3.13 | | | $2.42 | |
Less distributions declared
to shareholders | | | | | | | | | | | | | | | | | | |
From net investment income | | $(0.20 | ) | | $(0.38 | ) | | $(0.27 | ) | | $(0.22 | ) | | $(0.14 | ) | | $(0.08 | ) |
From net realized gain on investments | | — | | | (0.07 | ) | | (1.07 | ) | | — | | | — | | | — | |
Total distributions declared to shareholders | | $(0.20 | ) | | $(0.45 | ) | | $(1.34 | ) | | $(0.22 | ) | | $(0.14 | ) | | $(0.08 | ) |
Net asset value, end of period | | $14.93 | | | $13.75 | | | $12.00 | | | $20.64 | | | $15.28 | | | $12.29 | |
Total return (%) (r)(s)(t) | | 10.10 | (n) | | 18.94 | | | (37.68 | ) | | 36.73 | | | 25.55 | | | 24.39 | |
Ratios (%) (to average net assets)
and Supplemental data: | | | | | | | | | | |
Expenses before expense
reductions (f) | | 1.80 | (a) | | 1.85 | | | 1.79 | | | 1.80 | | | 1.86 | | | 1.89 | |
Expenses after expense
reductions (f) | | 1.80 | (a) | | 1.85 | | | 1.78 | | | 1.80 | | | 1.86 | | | 1.89 | |
Net investment income | | 1.97 | (a) | | 3.86 | | | 1.20 | | | 1.13 | | | 1.51 | | | 0.88 | |
Portfolio turnover | | 29 | | | 71 | | | 73 | | | 86 | | | 100 | | | 101 | |
Net assets at end of period (000 omitted) | | $204,311 | | | $196,483 | | | $239,127 | | | $593,215 | | | $597,964 | | | $617,687 | |
See Notes to Financial Statements
16
Financial Highlights – continued
| | | | | | | | | | | | | | | | | | |
| | | Six months
ended
4/30/10 (unaudited) | | | Years ended 10/31 | |
| Class C | | | 2009 | | | 2008 | | | 2007 | | | 2006 | | | 2005 | |
| | | | | | | | | | | | | | | | | |
Net asset value, beginning of
period | | $13.75 | | | $12.01 | | | $20.65 | | | $15.30 | | | $12.30 | | | $9.96 | |
Income (loss) from
investment operations | | | | | | | | | | | | | | | | | | |
Net investment income (d) | | $0.14 | | | $0.45 | | | $0.21 | | | $0.21 | | | $0.20 | | | $0.10 | |
Net realized and unrealized
gain (loss) on investments
and foreign currency | | 1.25 | | | 1.74 | | | (7.51 | ) | | 5.36 | | | 2.94 | | | 2.32 | |
Total from investment
operations | | $1.39 | | | $2.19 | | | $(7.30 | ) | | $5.57 | | | $3.14 | | | $2.42 | |
Less distributions declared
to shareholders | | | | | | | | | | | | | | | | | | |
From net investment income | | $(0.20 | ) | | $(0.38 | ) | | $(0.27 | ) | | $(0.22 | ) | | $(0.14 | ) | | $(0.08 | ) |
From net realized gain on investments | | — | | | (0.07 | ) | | (1.07 | ) | | — | | | — | | | — | |
Total distributions declared to shareholders | | $(0.20 | ) | | $(0.45 | ) | | $(1.34 | ) | | $(0.22 | ) | | $(0.14 | ) | | $(0.08 | ) |
Net asset value, end of period | | $14.94 | | | $13.75 | | | $12.01 | | | $20.65 | | | $15.30 | | | $12.30 | |
Total return (%) (r)(s)(t) | | 10.19 | (n) | | 18.86 | | | (37.64 | ) | | 36.64 | | | 25.61 | | | 24.37 | |
Ratios (%) (to average net assets)
and Supplemental data: | | | | | | | | | | | | | | | | |
Expenses before expense
reductions (f) | | 1.80 | (a) | | 1.85 | | | 1.80 | | | 1.80 | | | 1.86 | | | 1.88 | |
Expenses after expense
reductions (f) | | 1.80 | (a) | | 1.85 | | | 1.79 | | | 1.80 | | | 1.86 | | | 1.88 | |
Net investment income | | 1.92 | (a) | | 3.67 | | | 1.20 | | | 1.15 | | | 1.51 | | | 0.87 | |
Portfolio turnover | | 29 | | | 71 | | | 73 | | | 86 | | | 100 | | | 101 | |
Net assets at end of period (000 omitted) | | $410,429 | | | $299,351 | | | $262,113 | | | $402,178 | | | $260,120 | | | $218,335 | |
See Notes to Financial Statements
17
Financial Highlights – continued
| | | | | | | | | | | | | | | | | | |
| | | Six months
ended
4/30/10 (unaudited) | | | Years ended 10/31 | |
| Class I | | | 2009 | | | 2008 | | | 2007 | | | 2006 | | | 2005 | |
| | | | | | | | | | | | | | | | | |
Net asset value, beginning of
period | | $13.82 | | | $12.07 | | | $20.74 | | | $15.36 | | | $12.35 | | | $10.00 | |
Income (loss) from
investment operations | | | | | | | | | | | | | | | | | | |
Net investment income (d) | | $0.21 | | | $0.46 | | | $0.39 | | | $0.40 | | | $0.33 | | | $0.21 | |
Net realized and unrealized
gain (loss) on investments
and foreign currency | | 1.27 | | | 1.86 | | | (7.54 | ) | | 5.38 | | | 2.95 | | | 2.34 | |
Total from investment
operations | | $1.48 | | | $2.32 | | | $(7.15 | ) | | $5.78 | | | $3.28 | | | $2.55 | |
Less distributions declared
to shareholders | | | | | | | | | | | | | | | | | | |
From net investment income | | $(0.28 | ) | | $(0.50 | ) | | $(0.45 | ) | | $(0.40 | ) | | $(0.27 | ) | | $(0.20 | ) |
From net realized gain on
investments | | — | | | (0.07 | ) | | (1.07 | ) | | — | | | — | | | — | |
Total distributions declared to
shareholders | | $(0.28 | ) | | $(0.57 | ) | | $(1.52 | ) | | $(0.40 | ) | | $(0.27 | ) | | $(0.20 | ) |
Net asset value, end of period | | $15.02 | | | $13.82 | | | $12.07 | | | $20.74 | | | $15.36 | | | $12.35 | |
Total return (%) (r)(s) | | 10.75 | (n) | | 20.03 | | | (36.99 | ) | | 38.03 | | | 26.83 | | | 25.59 | |
Ratios (%) (to average net assets)
and Supplemental data: | | | | | | | | | | | | | | | | | | |
Expenses before expense
reductions (f) | | 0.80 | (a) | | 0.82 | | | 0.79 | | | 0.80 | | | 0.86 | | | 0.88 | |
Expenses after expense
reductions (f) | | 0.80 | (a) | | 0.82 | | | 0.78 | | | 0.80 | | | 0.86 | | | 0.88 | |
Net investment income | | 2.80 | (a) | | 3.60 | | | 2.17 | | | 2.17 | | | 2.45 | | | 1.81 | |
Portfolio turnover | | 29 | | | 71 | | | 73 | | | 86 | | | 100 | | | 101 | |
Net assets at end of period
(000 omitted) | | $113,027 | | | $39,175 | | | $10,141 | | | $19,230 | | | $9,830 | | | $6,630 | |
See Notes to Financial Statements
18
Financial Highlights – continued
| | | | | | | | | | | | | | | | | | |
| | | Six months
ended
4/30/10 (unaudited) | | | Years ended 10/31 | |
| Class R1 | | | 2009 | | | 2008 | | | 2007 | | | 2006 | | | 2005 (i) | |
| | | | | | | | | | | | | | | | | |
Net asset value, beginning of
period | | $13.73 | | | $11.99 | | | $20.63 | | | $15.28 | | | $12.29 | | | $11.04 | |
Income (loss) from
investment operations | | | | | | | | | | | | | | | | | | |
Net investment income (d) | | $0.14 | | | $0.44 | | | $0.20 | | | $0.17 | | | $0.19 | | | $0.01 | |
Net realized and unrealized
gain (loss) on investments
and foreign currency | | 1.25 | | | 1.75 | | | (7.50 | ) | | 5.39 | | | 2.92 | | | 1.29 | |
Total from investment
operations | | $1.39 | | | $2.19 | | | $(7.30 | ) | | $5.56 | | | $3.11 | | | $1.30 | |
Less distributions declared
to shareholders | | | | | | | | | | | | | | | | | | |
From net investment income | | $(0.20 | ) | | $(0.38 | ) | | $(0.27 | ) | | $(0.21 | ) | | $(0.12 | ) | | $(0.05 | ) |
From net realized gain on
investments | | — | | | (0.07 | ) | | (1.07 | ) | | — | | | — | | | — | |
Total distributions declared to
shareholders | | $(0.20 | ) | | $(0.45 | ) | | $(1.34 | ) | | $(0.21 | ) | | $(0.12 | ) | | $(0.05 | ) |
Net asset value, end of period | | $14.92 | | | $13.73 | | | $11.99 | | | $20.63 | | | $15.28 | | | $12.29 | |
Total return (%) (r)(s) | | 10.19 | (n) | | 18.90 | | | (37.69 | ) | | 36.62 | | | 25.42 | | | 11.77 | (n) |
Ratios (%) (to average net assets)
and Supplemental data: | | | | | | | | | | | | | | | | | | |
Expenses before expense
reductions (f) | | 1.80 | (a) | | 1.84 | | | 1.83 | | | 1.92 | | | 2.06 | | | 2.08 | (a) |
Expenses after expense
reductions (f) | | 1.80 | (a) | | 1.84 | | | 1.83 | | | 1.90 | | | 1.96 | | | 2.05 | (a) |
Net investment income | | 1.96 | (a) | | 3.61 | | | 1.15 | | | 0.92 | | | 1.40 | | | 0.12 | (a) |
Portfolio turnover | | 29 | | | 71 | | | 73 | | | 86 | | | 100 | | | 101 | |
Net assets at end of period
(000 omitted) | | $10,292 | | | $9,674 | | | $7,689 | | | $9,017 | | | $1,902 | | | $879 | |
See Notes to Financial Statements
19
Financial Highlights – continued
| | | | | | | | | | | | | | | | | | |
| | | Six months
ended
4/30/10
(unaudited) | | | Years ended 10/31 | |
| Class R2 | | | 2009 | | | 2008 | | | 2007 | | | 2006 | | | 2005 | |
| | | | | | | | | | | | | | | | | |
Net asset value, beginning of
period | | $13.77 | | | $12.02 | | | $20.67 | | | $15.31 | | | $12.31 | | | $9.97 | |
Income (loss) from
investment operations | | | | | | | | | | |
Net investment income (d) | | $0.18 | | | $0.50 | | | $0.29 | | | $0.27 | | | $0.24 | | | $0.11 | |
Net realized and unrealized
gain (loss) on investments
and foreign currency | | 1.25 | | | 1.76 | | | (7.51 | ) | | 5.38 | | | 2.94 | | | 2.34 | |
Total from investment
operations | | $1.43 | | | $2.26 | | | $(7.22 | ) | | $5.65 | | | $3.18 | | | $2.45 | |
Less distributions declared
to shareholders | | | | | | | | | | | | | | | | | | |
From net investment income | | $(0.24 | ) | | $(0.44 | ) | | $(0.36 | ) | | $(0.29 | ) | | $(0.18 | ) | | $(0.11 | ) |
From net realized gain on
investments | | — | | | (0.07 | ) | | (1.07 | ) | | — | | | — | | | — | |
Total distributions declared to
shareholders | | $(0.24 | ) | | $(0.51 | ) | | $(1.43 | ) | | $(0.29 | ) | | $(0.18 | ) | | $(0.11 | ) |
Net asset value, end of period | | $14.96 | | | $13.77 | | | $12.02 | | | $20.67 | | | $15.31 | | | $12.31 | |
Total return (%) (r)(s) | | 10.44 | (n) | | 19.52 | | | (37.35 | ) | | 37.17 | | | 26.02 | | | 24.66 | |
Ratios (%) (to average net assets)
and Supplemental data: | | | | | | | | | | | | | | | | | | |
Expenses before expense
reductions (f) | | 1.30 | (a) | | 1.34 | | | 1.33 | | | 1.47 | | | 1.62 | | | 1.62 | |
Expenses after expense
reductions (f) | | 1.30 | (a) | | 1.34 | | | 1.32 | | | 1.44 | | | 1.52 | | | 1.60 | |
Net investment income | | 2.45 | (a) | | 4.12 | | | 1.69 | | | 1.49 | | | 1.73 | | | 0.97 | |
Portfolio turnover | | 29 | | | 71 | | | 73 | | | 86 | | | 100 | | | 101 | |
Net assets at end of period
(000 omitted) | | $71,363 | | | $61,470 | | | $49,039 | | | $50,205 | | | $14,413 | | | $2,426 | |
See Notes to Financial Statements
20
Financial Highlights – continued
| | | | | | | | | | | | | | | | | | |
| | | Six months
ended
4/30/10 (unaudited) | | | Years ended 10/31 | |
| Class R3 | | | 2009 | | | 2008 | | | 2007 | | | 2006 | | | 2005 (i) | |
| | | | | | | | | | | | | | | | | |
Net asset value, beginning of
period | | $13.78 | | | $12.03 | | | $20.69 | | | $15.32 | | | $12.33 | | | $11.08 | |
Income (loss) from
investment operations | | | | | | | | | | | | | | | | | | |
Net investment income (d) | | $0.20 | | | $0.54 | | | $0.34 | | | $0.33 | | | $0.26 | | | $0.10 | |
Net realized and unrealized
gain (loss) on investments
and foreign currency | | 1.25 | | | 1.75 | | | (7.53 | ) | | 5.37 | | | 2.95 | | | 1.25 | |
Total from investment
operations | | $1.45 | | | $2.29 | | | $(7.19 | ) | | $5.70 | | | $3.21 | | | $1.35 | |
Less distributions declared
to shareholders | | | | | | | | | | | | | | | | | | |
From net investment income | | $(0.26 | ) | | $(0.47 | ) | | $(0.40 | ) | | $(0.33 | ) | | $(0.22 | ) | | $(0.10 | ) |
From net realized gain on
investments | | — | | | (0.07 | ) | | (1.07 | ) | | — | | | — | | | — | |
Total distributions declared to
shareholders | | $(0.26 | ) | | $(0.54 | ) | | $(1.47 | ) | | $(0.33 | ) | | $(0.22 | ) | | $(0.10 | ) |
Net asset value, end of period | | $14.97 | | | $13.78 | | | $12.03 | | | $20.69 | | | $15.32 | | | $12.33 | |
Total return (%) (r)(s) | | 10.57 | (n) | | 19.80 | | | (37.21 | ) | | 37.55 | | | 26.21 | | | 12.22 | (n) |
Ratios (%) (to average net assets)
and Supplemental data: | | | | | | | | | | | | | | | | | | |
Expenses before expense
reductions (f) | | 1.05 | (a) | | 1.10 | | | 1.07 | | | 1.20 | | | 1.28 | | | 1.26 | (a) |
Expenses after expense
reductions (f) | | 1.05 | (a) | | 1.09 | | | 1.07 | | | 1.20 | | | 1.28 | | | 1.26 | (a) |
Net investment income | | 2.69 | (a) | | 4.40 | | | 1.91 | | | 1.77 | | | 1.93 | | | 1.50 | (a) |
Portfolio turnover | | 29 | | | 71 | | | 73 | | | 86 | | | 100 | | | 101 | |
Net assets at end of period
(000 omitted) | | $267,191 | | | $39,450 | | | $31,360 | | | $41,574 | | | $10,786 | | | $62 | |
See Notes to Financial Statements
21
Financial Highlights – continued
| | | | | | | | | | | | | | | | | | |
| | | Six months
ended
4/30/10 (unaudited) | | | Years ended 10/31 | |
| Class R4 | | | 2009 | | | 2008 | | | 2007 | | | 2006 | | | 2005 (i) | |
| | | | | | | | | | | | | | | | | |
Net asset value, beginning of
period | | $13.80 | | | $12.05 | | | $20.71 | | | $15.34 | | | $12.33 | | | $11.08 | |
Income (loss) from
investment operations | | | | | | | | | | | | | | | | | | |
Net investment income (d) | | $0.21 | | | $0.54 | | | $0.36 | | | $0.40 | | | $0.28 | | | $0.13 | |
Net realized and unrealized
gain (loss) on investments
and foreign currency | | 1.26 | | | 1.78 | | | (7.50 | ) | | 5.35 | | | 2.99 | | | 1.24 | |
Total from investment
operations | | $1.47 | | | $2.32 | | | $(7.14 | ) | | $5.75 | | | $3.27 | | | $1.37 | |
Less distributions declared
to shareholders | | | | | | | | | | | | | | | | | | |
From net investment income | | $(0.28 | ) | | $(0.50 | ) | | $(0.45 | ) | | $(0.38 | ) | | $(0.26 | ) | | $(0.12 | ) |
From net realized gain on
investments | | — | | | (0.07 | ) | | (1.07 | ) | | — | | | — | | | — | |
Total distributions declared to
shareholders | | $(0.28 | ) | | $(0.57 | ) | | $(1.52 | ) | | $(0.38 | ) | | $(0.26 | ) | | $(0.12 | ) |
Net asset value, end of period | | $14.99 | | | $13.80 | | | $12.05 | | | $20.71 | | | $15.34 | | | $12.33 | |
Total return (%) (r)(s) | | 10.69 | (n) | | 20.06 | | | (37.01 | ) | | 37.89 | | | 26.75 | | | 12.41 | (n) |
Ratios (%) (to average net assets)
and Supplemental data: | | | | | | | | | | | | | | | | | | |
Expenses before expense
reductions (f) | | 0.80 | (a) | | 0.84 | | | 0.83 | | | 0.90 | | | 0.96 | | | 0.96 | (a) |
Expenses after expense
reductions (f) | | 0.80 | (a) | | 0.84 | | | 0.82 | | | 0.90 | | | 0.96 | | | 0.96 | (a) |
Net investment income | | 2.92 | (a) | | 4.38 | | | 2.12 | | | 2.12 | | | 1.98 | | | 1.83 | (a) |
Portfolio turnover | | 29 | | | 71 | | | 73 | | | 86 | | | 100 | | | 101 | |
Net assets at end of period
(000 omitted) | | $22,603 | | | $12,760 | | | $5,537 | | | $2,727 | | | $637 | | | $56 | |
Any redemption fees charged by the fund during the 2005 fiscal year resulted in a per share impact of less than $0.01.
| (d) | Per share data is based on average shares outstanding. |
| (f) | Ratios do not reflect reductions from fees paid indirectly, if applicable. |
| (i) | For the period from the class’ inception, April 1, 2005 (Classes R1, R3, and R4) through the stated period end. |
| (r) | Certain expenses have been reduced without which performance would have been lower. |
| (s) | From time to time the fund may receive proceeds from litigation settlements, without which performance would be lower. Excluding the effect of the proceeds received from a non-recurring litigation settlement against Enron Corp., the Class A, Class B, Class C, Class I, Class R1, Class R2, Class R3, and Class R4 total returns for the year ended October 31, 2009 would have each been lower by approximately 0.62%. |
| (t) | Total returns do not include any applicable sales charges. |
See Notes to Financial Statements
22
NOTES TO FINANCIAL STATEMENTS
(unaudited)
| (1) | | Business and Organization |
MFS Utilities Fund (the fund) is a series of MFS Series Trust VI (the trust). The trust is organized as a Massachusetts business trust and is registered under the Investment Company Act of 1940, as amended, as an open-end management investment company.
| (2) | | Significant Accounting Policies |
General – The preparation of financial statements in conformity with U.S. generally accepted accounting principles requires management to make estimates and assumptions that affect the reported amounts of assets and liabilities, and disclosure of contingent assets and liabilities at the date of the financial statements and the reported amounts of revenues and expenses during the reporting period. Actual results could differ from those estimates. In the preparation of these financial statements, management has evaluated subsequent events occurring after the date of the fund’s Statement of Assets and Liabilities through the date that the financial statements were issued. The fund invests primarily in securities of issuers in the utility industry. Issuers in a single industry can react similarly to market, economic, political and regulatory conditions and developments. The fund can invest in foreign securities, including securities of emerging market issuers. Investments in foreign securities are vulnerable to the effects of changes in the relative values of the local currency and the U.S. dollar and to the effects of changes in each country’s legal, political, and economic environment. The markets of emerging markets countries are generally more volatile than the markets of developed countries with more mature economies. All of the risks of investing in foreign securities previously described are heightened when investing in emerging markets countries.
Investment Valuations – Equity securities, including restricted equity securities, are generally valued at the last sale or official closing price as provided by a third-party pricing service on the market or exchange on which they are primarily traded. Equity securities, for which there were no sales reported that day, are generally valued at the last quoted daily bid quotation as provided by a third-party pricing service on the market or exchange on which such securities are primarily traded. Equity securities held short, for which there were no sales reported for that day, are generally valued at the last quoted daily ask quotation as provided by a third-party pricing service on the market or exchange on which such securities are primarily traded. Debt instruments and floating rate loans (other than short-term instruments), including restricted debt instruments, are generally valued at an evaluated or composite bid as provided by a third-party pricing service. Short-term instruments with a maturity at issuance of 60 days or less generally are valued
23
Notes to Financial Statements (unaudited) – continued
at amortized cost, which approximates market value. Forward foreign currency contracts are generally valued at the mean of bid and asked prices for the time period interpolated from rates provided by a third-party pricing service for proximate time periods. Open-end investment companies are generally valued at net asset value per share. Securities and other assets generally valued on the basis of information from a third-party pricing service may also be valued at a broker/dealer bid quotation. Values obtained from third-party pricing services can utilize both transaction data and market information such as yield, quality, coupon rate, maturity, type of issue, trading characteristics, and other market data. The values of foreign securities and other assets and liabilities expressed in foreign currencies are converted to U.S. dollars using the mean of bid and asked prices for rates provided by a third-party pricing service.
The Board of Trustees has delegated primary responsibility for determining or causing to be determined the value of the fund’s investments (including any fair valuation) to the adviser pursuant to valuation policies and procedures approved by the Board. If the adviser determines that reliable market quotations are not readily available, investments are valued at fair value as determined in good faith by the adviser in accordance with such procedures under the oversight of the Board of Trustees. Under the fund’s valuation policies and procedures, market quotations are not considered to be readily available for most types of debt instruments and floating rate loans and many types of derivatives. These investments are generally valued at fair value based on information from third-party pricing services. In addition, investments may be valued at fair value if the adviser determines that an investment’s value has been materially affected by events occurring after the close of the exchange or market on which the investment is principally traded (such as foreign exchange or market) and prior to the determination of the fund’s net asset value, or after the halting of trading of a specific security where trading does not resume prior to the close of the exchange or market on which the security is principally traded. Events that occur on a frequent basis after foreign markets close (such as developments in foreign markets and significant movements in the U.S. markets) and prior to the determination of the fund’s net asset value may be deemed to have a material effect on the value of securities traded in foreign markets. Accordingly, the fund’s foreign equity securities may often be valued at fair value. The adviser generally relies on third-party pricing services or other information (such as the correlation with price movements of similar securities in the same or other markets; the type, cost and investment characteristics of the security; the business and financial condition of the issuer; and trading and other market data) to assist in determining whether to fair value and at what value to fair value an investment. The value of an investment for purposes of calculating the fund’s net asset value can differ depending on the source and method used to
24
Notes to Financial Statements (unaudited) – continued
determine value. When fair valuation is used, the value of an investment used to determine the fund’s net asset value may differ from quoted or published prices for the same investment. There can be no assurance that the fund could obtain the fair value assigned to an investment if it were to sell the investment at the same time at which the fund determines its net asset value per share.
Various inputs are used in determining the value of the fund’s assets or liabilities. These inputs are categorized into three broad levels. In certain cases, the inputs used to measure fair value may fall into different levels of the fair value hierarchy. In such cases, an investment’s level within the fair value hierarchy is based on the lowest level of input that is significant to the fair value measurement. The fund’s assessment of the significance of a particular input to the fair value measurement in its entirety requires judgment, and considers factors specific to the investment. Level 1 includes unadjusted quoted prices in active markets for identical assets or liabilities. Level 2 includes other significant observable market-based inputs (including quoted prices for similar securities, interest rates, prepayment speed, and credit risk). Level 3 includes unobservable inputs, which may include the adviser’s own assumptions in determining the fair value of investments. Other financial instruments are derivative instruments not reflected in total investments, such as futures, forwards, swap contracts, and written options. The following is a summary of the levels used as of April 30, 2010 in valuing the fund’s assets or liabilities:
| | | | | | | | |
| Investments at Value | | Level 1 | | Level 2 | | Level 3 | | Total |
| Equity Securities: | | | | | | | | |
United States | | $1,957,108,994 | | $26,880,000 | | $— | | $1,983,988,994 |
Brazil | | 220,347,817 | | — | | — | | 220,347,817 |
Israel | | 108,813,390 | | 2,597,927 | | — | | 111,411,317 |
United Kingdom | | 62,637,457 | | 44,014,262 | | — | | 106,651,719 |
Spain | | 50,385,826 | | 48,030,504 | | — | | 98,416,330 |
Portugal | | — | | 85,254,159 | | — | | 85,254,159 |
Germany | | 42,429,329 | | 17,347,460 | | — | | 59,776,789 |
Czech Republic | | 41,541,856 | | — | | — | | 41,541,856 |
Russia | | 32,226,162 | | — | | — | | 32,226,162 |
Other Countries | | 38,453,255 | | 127,948,452 | | — | | 166,401,707 |
| Corporate Bonds | | — | | 29,414,023 | | — | | 29,414,023 |
| Commercial Mortgage-Backed Securities | | — | | 98,795 | | — | | 98,795 |
| Short Term Securities | | — | | 36,066,103 | | — | | 36,066,103 |
| Mutual Funds | | 58,519,561 | | — | | — | | 58,519,561 |
| Total Investments | | $2,612,463,647 | | $417,651,685 | | $— | | $3,030,115,332 |
| | | | |
| Other Financial Instruments | | | | | | | | |
| Forward Currency Contracts | | $— | | $4,522,441 | | $— | | 4,522,441 |
25
Notes to Financial Statements (unaudited) – continued
For further information regarding security characteristics, see the Portfolio of Investments
Repurchase Agreements – The fund may enter into repurchase agreements with approved counterparties. Each repurchase agreement is recorded at cost. The fund requires that the securities collateral in a repurchase transaction be transferred to a custodian. The fund monitors, on a daily basis, the value of the collateral to ensure that its value, including accrued interest, is greater than amounts owed to the fund under each such repurchase agreement.
Foreign Currency Translation – Purchases and sales of foreign investments, income, and expenses are converted into U.S. dollars based upon currency exchange rates prevailing on the respective dates of such transactions or on the reporting date for foreign denominated receivables and payables. Gains and losses attributable to foreign currency exchange rates on sales of securities are recorded for financial statement purposes as net realized gains and losses on investments. Gains and losses attributable to foreign exchange rate movements on receivables, payables, income and expenses are recorded for financial statement purposes as foreign currency transaction gains and losses. That portion of both realized and unrealized gains and losses on investments that results from fluctuations in foreign currency exchange rates is not separately disclosed.
Derivatives – The fund may use derivatives for different purposes, including to earn income and enhance returns, to increase or decrease exposure to a particular market, to manage or adjust the risk profile of the fund, or as alternatives to direct investments. Derivatives may be used for hedging or non-hedging purposes. While hedging can reduce or eliminate losses, it can also reduce or eliminate gains. When the fund uses derivatives as an investment to increase market exposure, or for hedging purposes, gains and losses from derivative instruments may be substantially greater than the derivative’s original cost.
Derivative instruments include written options, purchased options, futures contracts, forward foreign currency exchange contracts, and swap agreements. The fund’s period end derivatives, as presented in the Portfolio of Investments and the associated Derivative Contract Tables, generally are indicative of the volume of its derivative activity during the period.
26
Notes to Financial Statements (unaudited) – continued
The following table presents, by major type of derivative contract, the fair value, on a gross basis, of the asset and liability components of derivatives held by the fund at April 30, 2010:
| | | | | | | |
| | | | | Fair Value | |
| Risk | | Derivative | | Asset Derivatives | | Liability Derivatives | |
| Foreign Exchange Contracts | | Forward Foreign Currency Exchange Contracts | | $4,993,600 | | $(471,159 | ) |
The following table presents, by major type of derivative contract, the realized gain (loss) on derivatives held by the fund for the six months ended April 30, 2010 as reported in the Statement of Operations:
| | |
| | | Foreign Currency
Transactions |
| Foreign Exchange Contracts | | $11,145,100 |
The following table presents, by major type of derivative contract, the change in unrealized appreciation (depreciation) on derivatives held by the fund for the six months ended April 30, 2010 as reported in the Statement of Operations:
| | |
| | | Translation
of Assets
and
Liabilities in
Foreign
Currencies |
| Foreign Exchange Contracts | �� | $7,170,894 |
Derivative counterparty credit risk is managed through formal evaluation of the creditworthiness of all potential counterparties. On certain over-the-counter derivatives, the fund attempts to reduce its exposure to counterparty credit risk whenever possible by entering into an International Swaps and Derivatives Association (ISDA) Master Agreement on a bilateral basis with each of the counterparties with whom it undertakes a significant volume of transactions. The ISDA Master Agreement gives each party to the agreement the right to terminate all transactions traded under such agreement if there is a certain deterioration in the credit quality of the other party. The ISDA Master Agreement gives the fund the right, upon an event of default by the applicable counterparty or a termination of the agreement, to close out all transactions traded under such agreement and to net amounts owed under each transaction to one net amount payable by one party to the other. This right to close out and net payments across all transactions traded under the ISDA Master Agreement could result in a reduction of the fund’s credit risk to such
27
Notes to Financial Statements (unaudited) – continued
counterparty equal to any amounts payable by the fund under the applicable transactions, if any. However, absent an event of default by the counterparty or a termination of the agreement, the ISDA Master Agreement does not result in an offset of reported balance sheet assets and liabilities across transactions between the fund and the applicable counterparty.
Collateral requirements differ by type of derivative. Collateral or margin requirements are set by the broker or exchange clearing house for exchange traded derivatives (i.e., futures and exchange-traded options) while collateral terms are contract specific for over-the-counter traded derivatives (i.e., forwards, swaps and over-the-counter options). For derivatives traded under an ISDA Master Agreement, the collateral requirements are netted across all transactions traded under such agreement and one amount is posted from one party to the other to collateralize such obligations. Cash collateral that has been pledged to cover obligations of the fund under derivative contracts will be reported separately on the Statement of Assets and Liabilities as restricted cash. Securities collateral pledged for the same purpose is noted in the Portfolio of Investments.
Forward Foreign Currency Exchange Contracts – The fund may enter into forward foreign currency exchange contracts for the purchase or sale of a specific foreign currency at a fixed price on a future date to hedge the fund’s currency risk or for non-hedging purposes. For hedging purposes, the fund may enter into contracts to deliver or receive foreign currency that the fund will receive from or use in its normal investment activities. The fund may also use contracts to hedge against declines in the value of foreign currency denominated securities due to unfavorable exchange rate movements. For non-hedging purposes, the fund may enter into contracts with the intent of changing the relative exposure of the fund’s portfolio of securities to different currencies to take advantage of anticipated exchange rate changes.
Forward foreign currency exchange contracts are adjusted by the daily exchange rate of the underlying currency and any unrealized gains or losses are recorded as a receivable or payable for forward foreign currency exchange contracts until the contract settlement date. On contract settlement date, any gain or loss on the contract is recorded as realized gains or losses on foreign currency transactions.
Risks may arise upon entering into these contracts from unanticipated movements in the value of the contract and from the potential inability of counterparties to meet the terms of their contracts. The fund’s maximum risk due to counterparty credit risk is the notional amount of the contract. This risk is mitigated in cases where there is an ISDA Master Agreement between the fund and the counterparty providing for netting as described above and for
28
Notes to Financial Statements (unaudited) – continued
posting of collateral by the counterparty to the fund to cover the fund’s exposure to the counterparty under such ISDA Master Agreement.
Security Loans – JPMorgan Chase and Co. (“Chase”), as lending agent, may loan the securities of the fund to certain qualified institutions (the “Borrowers”) approved by the fund. The loans are collateralized by cash and/or U.S. Treasury and federal agency obligations in an amount typically at least equal to the market value of the securities loaned. The market value of the loaned securities is determined at the close of business of the fund and any additional required collateral is delivered to the fund on the next business day. Chase provides the fund with indemnification against Borrower default. The fund bears the risk of loss with respect to the investment of cash collateral. On loans collateralized by cash, the cash collateral is invested in short-term securities. A portion of the income generated upon investment of the collateral is remitted to the Borrowers, and the remainder is allocated between the fund and the lending agent. On loans collateralized by U.S. Treasury and/or federal agency obligations, a fee is received from the Borrower, and is allocated between the fund and the lending agent. Income from securities lending is included in interest income on the Statement of Operations. The dividend and interest income earned on the securities loaned is accounted for in the same manner as other dividend and interest income.
Indemnifications – Under the fund’s organizational documents, its officers and Trustees may be indemnified against certain liabilities and expenses arising out of the performance of their duties to the fund. Additionally, in the normal course of business, the fund enters into agreements with service providers that may contain indemnification clauses. The fund’s maximum exposure under these agreements is unknown as this would involve future claims that may be made against the fund that have not yet occurred.
Investment Transactions and Income – Investment transactions are recorded on the trade date. Interest income is recorded on the accrual basis. All premium and discount is amortized or accreted for financial statement purposes in accordance with U.S. generally accepted accounting principles. Dividends received in cash are recorded on the ex-dividend date. Certain dividends from foreign securities will be recorded when the fund is informed of the dividend if such information is obtained subsequent to the ex-dividend date. Dividend and interest payments received in additional securities are recorded on the ex-dividend or ex-interest date in an amount equal to the value of the security on such date. The fund may receive proceeds from litigation settlements. Any proceeds received from litigation involving portfolio holdings are reflected in the Statement of Operations in realized gain/loss if the security has been disposed of by the fund or in unrealized gain/loss if the security is still held by the fund.
29
Notes to Financial Statements (unaudited) – continued
Any other proceeds from litigation not related to portfolio holdings are reflected as other income in the Statement of Operations.
Fees Paid Indirectly – The fund’s custody fee may be reduced according to an arrangement that measures the value of cash deposited with the custodian by the fund. This amount, for the six months ended April 30, 2010, is shown as a reduction of total expenses on the Statement of Operations.
Tax Matters and Distributions – The fund intends to qualify as a regulated investment company, as defined under Subchapter M of the Internal Revenue Code, and to distribute all of its taxable income, including realized capital gains. As a result, no provision for federal income tax is required. The fund’s federal tax returns for the prior three fiscal years remain subject to examination by the Internal Revenue Service. Foreign taxes, if any, have been accrued by the fund in the accompanying financial statements.
Distributions to shareholders are recorded on the ex-dividend date. Income and capital gain distributions are determined in accordance with income tax regulations, which may differ from U.S. generally accepted accounting principles. Certain capital accounts in the financial statements are periodically adjusted for permanent differences in order to reflect their tax character. These adjustments have no impact on net assets or net asset value per share. Temporary differences which arise from recognizing certain items of income, expense, gain or loss in different periods for financial statement and tax purposes will reverse at some time in the future. Distributions in excess of net investment income or net realized gains are temporary overdistributions for financial statement purposes resulting from differences in the recognition or classification of income or distributions for financial statement and tax purposes.
Book/tax differences primarily relate to wash sale loss deferrals and foreign currency transactions.
The tax character of distributions made during the current period will be determined at fiscal year end. The tax character of distributions declared to shareholders for the last fiscal year is as follows:
| | |
| | | 10/31/09 |
| Ordinary income (including any short-term capital gains) | | $79,655,982 |
| Long-term capital gain | | 13,182,439 |
| Total distributions | | $92,838,421 |
30
Notes to Financial Statements (unaudited) – continued
The federal tax cost and the tax basis components of distributable earnings were as follows:
| | | |
| As of 4/30/10 | | | |
| Cost of investments | | $2,757,605,491 | |
| Gross appreciation | | 339,703,017 | |
| Gross depreciation | | (67,193,176 | ) |
| Net unrealized appreciation (depreciation) | | $272,509,841 | |
| |
| As of 10/31/09 | | | |
| Undistributed ordinary income | | 17,777,506 | |
| Capital loss carryforwards | | (555,766,497 | ) |
| Other temporary differences | | (8,847,878 | ) |
| Net unrealized appreciation (depreciation) | | 37,428,435 | |
The aggregate cost above includes prior fiscal year end tax adjustments, if applicable.
As of October 31, 2009, the fund had capital loss carryforwards available to offset future realized gains. Such losses expire as follows:
Multiple Classes of Shares of Beneficial Interest – The fund offers multiple classes of shares, which differ in their respective distribution and service fees. The fund’s income, realized and unrealized gain (loss), and common expenses are allocated to shareholders based on the daily net assets of each class. Dividends are declared separately for each class. Differences in per share dividend rates are generally due to differences in separate class expenses. Class B shares will convert to Class A shares approximately eight years after purchase. The fund’s distributions declared to shareholders as reported on the Statements of Changes in Net Assets are presented by class as follows:
| | | | | | | | |
| | | From net investment
income | | From net realized gain on
investments |
| | | Six months ended
4/30/10 | | Year ended
10/31/09 | | Six months ended
4/30/10 | | Year ended
10/31/09 |
| Class A | | $30,959,579 | | $60,695,291 | | $— | | $9,540,135 |
| Class B | | 2,838,855 | | 6,234,055 | | — | | 1,417,392 |
| Class C | | 5,007,361 | | 8,231,176 | | — | | 1,601,487 |
| Class I | | 1,345,457 | | 715,721 | | — | | 61,589 |
| Class R1 | | 143,312 | | 259,485 | | — | | 49,405 |
| Class R2 | | 1,110,235 | | 1,864,849 | | — | | 299,297 |
| Class R3 | | 4,711,177 | | 1,237,946 | | — | | 183,121 |
| Class R4 | | 288,392 | | 412,954 | | — | | 34,518 |
| Total | | $46,404,368 | | $79,651,477 | | $— | | $13,186,944 |
31
Notes to Financial Statements (unaudited) – continued
| (3) | | Transactions with Affiliates |
Investment Adviser – The fund has an investment advisory agreement with MFS to provide overall investment management and related administrative services and facilities to the fund.
The management fee is computed daily and paid monthly at the following annual rates:
| | | |
| First $3.0 billion of average daily net assets | | 0.60 | % |
| Average daily net assets in excess of $3.0 billion | | 0.55 | % |
The investment adviser has agreed in writing to reduce its management fee to 0.50% of average daily net assets in excess of $5.0 billion. This written agreement will continue until modified by the fund’s Board of Trustees, but such agreement will continue at least until September 30, 2012. For the six months ended April 30, 2010, the fund’s average daily net assets did not exceed $5.0 billion and therefore, the management fee was not reduced. The management fee incurred for the six months ended April 30, 2010 was equivalent to an annual effective rate of 0.60% of the fund’s average daily net assets.
Distributor – MFS Fund Distributors, Inc. (MFD), a wholly-owned subsidiary of MFS, as distributor, received $574,386 for the six months ended April 30, 2010, as its portion of the initial sales charge on sales of Class A shares of the fund.
The Board of Trustees has adopted a distribution plan for certain class shares pursuant to Rule 12b-1 of the Investment Company Act of 1940.
The fund’s distribution plan provides that the fund will pay MFD for services provided by MFD and financial intermediaries in connection with the distribution and servicing of certain share classes. One component of the plan is a distribution fee paid to MFD and another component of the plan is a service fee paid to MFD. MFD may subsequently pay all, or a portion, of the distribution and/or service fees to financial intermediaries.
Distribution Plan Fee Table:
| | | | | | | | | | |
| | | Distribution
Fee Rate (d) | | Service
Fee Rate (d) | | Total
Distribution
Plan (d) | | Annual
Effective
Rate (e) | | Distribution
and Service
Fee |
| Class A | | — | | 0.25% | | 0.25% | | 0.25% | | $2,208,221 |
| Class B | | 0.75% | | 0.25% | | 1.00% | | 1.00% | | 1,020,561 |
| Class C | | 0.75% | | 0.25% | | 1.00% | | 1.00% | | 1,801,612 |
| Class R1 | | 0.75% | | 0.25% | | 1.00% | | 1.00% | | 51,021 |
| Class R2 | | 0.25% | | 0.25% | | 0.50% | | 0.50% | | 169,064 |
| Class R3 | | — | | 0.25% | | 0.25% | | 0.25% | | 320,162 |
| Total Distribution and Service Fees | | | | | | | | $5,570,641 |
32
Notes to Financial Statements (unaudited) – continued
| (d) | In accordance with the distribution plan for certain classes, the fund pays distribution and/or service fees equal to these annual percentage rates of each class’ average daily net assets. The distribution and service fee rates disclosed by class represent the current rates in effect at the end of the reporting period. Any rate changes, if applicable, are detailed below. |
| (e) | The annual effective rates represent actual fees incurred under the distribution plan for the six months ended April 30, 2010 based on each class’ average daily net assets. |
Certain Class A shares are subject to a contingent deferred sales charge (CDSC) in the event of a shareholder redemption within 24 months of purchase. Class C shares are subject to a CDSC in the event of a shareholder redemption within 12 months of purchase. Class B shares are subject to a CDSC in the event of a shareholder redemption within six years of purchase. All contingent deferred sales charges are paid to MFD and during the six months ended April 30, 2010, were as follows:
| | |
| | | Amount |
| Class A | | $8 |
| Class B | | 152,015 |
| Class C | | 23,430 |
Shareholder Servicing Agent – MFS Service Center, Inc. (MFSC), a wholly-owned subsidiary of MFS, receives a fee from the fund for its services as shareholder servicing agent calculated as a percentage of the average daily net assets of the fund as determined periodically under the supervision of the fund’s Board of Trustees. For the six months ended April 30, 2010, the fee was $610,969, which equated to 0.0443% annually of the fund’s average daily net assets. MFSC also receives payment from the fund for out-of-pocket expenses, sub-accounting and other shareholder servicing costs which may be paid to affiliated and unaffiliated service providers. For the six months ended April 30, 2010, these out-of-pocket expenses, sub-accounting and other shareholder servicing costs amounted to $1,325,691.
Administrator – MFS provides certain financial, legal, shareholder communications, compliance, and other administrative services to the fund. Under an administrative services agreement, the fund partially reimburses MFS the costs incurred to provide these services. The fund is charged an annual fixed amount of $17,500 plus a fee based on average daily net assets. The administrative services fee incurred for the six months ended April 30, 2010 was equivalent to an annual effective rate of 0.0147% of the fund’s average daily net assets.
Trustees’ and Officers’ Compensation – The fund pays compensation to independent Trustees in the form of a retainer, attendance fees, and additional compensation to Board and Committee chairpersons. The fund does not pay compensation directly to Trustees or officers of the fund who are also officers of the investment adviser, all of whom receive remuneration for their services to the fund from MFS. Certain officers and Trustees of the fund are officers or directors of MFS, MFD, and MFSC.
33
Notes to Financial Statements (unaudited) – continued
Prior to December 31, 2001, the fund had an unfunded defined benefit plan (“DB plan”) for independent Trustees. As of December 31, 2001, the Board took action to terminate the DB plan with respect to then-current and any future independent Trustees, such that the DB Plan covers only certain of those former independent Trustees who retired on or before December 31, 2001. Effective January 1, 2002, accrued benefits under the DB Plan for then-current independent Trustees who continued were credited to an unfunded retirement deferral plan (the “Retirement Deferral plan”), which was established for and exists solely with respect to these credited amounts, and is not available for other deferrals by these or other independent Trustees. Although the Retirement Deferral plan is unfunded, amounts deferred under the plan are periodically adjusted for investment experience as if they had been invested in shares of the fund. The DB Plan resulted in a pension expense of $852 and the Retirement Deferral plan resulted in an expense of $2,553. Both amounts are included in independent Trustees’ compensation for the six months ended April 30, 2010. The liability for deferred retirement benefits payable to certain independent Trustees under both Plans amounted to $65,043 at April 30, 2010, and is included in payable for independent Trustees’ compensation on the Statement of Assets and Liabilities.
Other – This fund and certain other funds managed by MFS (the funds) have entered into services agreements (the Agreements) which provide for payment of fees by the funds to Tarantino LLC and Griffin Compliance LLC in return for the provision of services of an Independent Chief Compliance Officer (ICCO) and Assistant ICCO, respectively, for the funds. The ICCO and Assistant ICCO are officers of the funds and the sole members of Tarantino LLC and Griffin Compliance LLC, respectively. The funds can terminate the Agreements with Tarantino LLC and Griffin Compliance LLC at any time under the terms of the Agreements. For the six months ended April 30, 2010, the aggregate fees paid by the fund to Tarantino LLC and Griffin Compliance LLC were $16,139 and are included in miscellaneous expense on the Statement of Operations. MFS has agreed to reimburse the fund for a portion of the payments made by the fund in the amount of $6,129, which is shown as a reduction of total expenses in the Statement of Operations. Additionally, MFS has agreed to bear all expenses associated with office space, other administrative support, and supplies provided to the ICCO and Assistant ICCO.
The fund may invest in the MFS Institutional Money Market Portfolio which is managed by MFS and seeks a high level of current income consistent with preservation of capital and liquidity. Income earned on this investment is included in dividends from underlying funds on the Statement of Operations. This money market fund does not pay a management fee to MFS.
34
Notes to Financial Statements (unaudited) – continued
Purchases and sales of investments, other than U.S. Government securities, purchased option transactions, and short-term obligations, aggregated $1,139,115,797 and $768,996,921, respectively.
| (5) | | Shares of Beneficial Interest |
The fund’s Declaration of Trust permits the Trustees to issue an unlimited number of full and fractional shares of beneficial interest. Transactions in fund shares were as follows:
| | | | | | | | | | | | |
| | | Six months ended
4/30/10
| | | Year ended
10/31/09 | |
| | | Shares | | | Amount | | | Shares | | | Amount | |
| Shares sold | | | | | | | | | | | | |
Class A | | 26,993,387 | | | $398,622,664 | | | 28,710,451 | | | $349,659,014 | |
Class B | | 1,632,971 | | | 23,987,460 | | | 3,759,474 | | | 44,766,933 | |
Class C | | 7,512,652 | | | 110,622,394 | | | 4,658,560 | | | 56,743,573 | |
Class I | | 5,177,289 | | | 76,702,122 | | | 2,298,091 | | | 30,803,996 | |
Class R1 | | 130,554 | | | 1,912,146 | | | 252,080 | | | 3,037,582 | |
Class R2 | | 983,352 | | | 14,446,745 | | | 1,672,441 | | | 20,467,833 | |
Class R3 | | 16,385,462 | | | 232,429,491 | | | 1,060,781 | | | 13,219,715 | |
Class R4 | | 791,496 | | | 11,807,110 | | | 661,736 | | | 7,764,191 | |
| | 59,607,163 | | | $870,530,132 | | | 43,073,614 | | | $526,462,837 | |
| Shares issued to shareholders in reinvestment of distributions | | | | | | | | | | | | |
Class A | | 1,824,082 | | | $26,709,799 | | | 5,127,121 | | | $61,977,467 | |
Class B | | 159,193 | | | 2,323,689 | | | 544,247 | | | 6,483,480 | |
Class C | | 248,093 | | | 3,625,169 | | | 614,254 | | | 7,382,867 | |
Class I | | 28,673 | | | 421,587 | | | 43,348 | | | 529,017 | |
Class R1 | | 9,826 | | | 143,305 | | | 25,676 | | | 308,835 | |
Class R2 | | 71,112 | | | 1,039,616 | | | 168,616 | | | 2,038,866 | |
Class R3 | | 322,040 | | | 4,709,497 | | | 117,158 | | | 1,419,713 | |
Class R4 | | 13,742 | | | 201,695 | | | 20,713 | | | 254,930 | |
| | 2,676,761 | | | $39,174,357 | | | 6,661,133 | | | $80,395,175 | |
| Shares reacquired | | | | | | | | | | | | |
Class A | | (32,870,417 | ) | | $(475,181,271 | ) | | (38,036,443 | ) | | $(453,940,383 | ) |
Class B | | (2,405,170 | ) | | (35,389,639 | ) | | (9,934,525 | ) | | (115,849,498 | ) |
Class C | | (2,053,913 | ) | | (30,107,287 | ) | | (5,331,483 | ) | | (62,204,187 | ) |
Class I | | (514,281 | ) | | (7,588,595 | ) | | (348,235 | ) | | (4,477,800 | ) |
Class R1 | | (154,914 | ) | | (2,257,113 | ) | | (214,452 | ) | | (2,574,317 | ) |
Class R2 | | (748,108 | ) | | (10,978,158 | ) | | (1,455,183 | ) | | (17,511,633 | ) |
Class R3 | | (1,718,360 | ) | | (25,455,747 | ) | | (921,442 | ) | | (10,964,705 | ) |
Class R4 | | (222,360 | ) | | (3,298,162 | ) | | (217,357 | ) | | (2,624,977 | ) |
| | (40,687,523 | ) | | $(590,255,972 | ) | | (56,459,120 | ) | | $(670,147,500 | ) |
35
Notes to Financial Statements (unaudited) – continued
| | | | | | | | | | | | |
| | | Six months ended
4/30/10
| | | Year ended
10/31/09 | |
| | | Shares | | | Amount | | | Shares | | | Amount | |
| Net change | | | | | | | | | | | | |
Class A | | (4,052,948 | ) | | $(49,848,808 | ) | | (4,198,871 | ) | | $(42,303,902 | ) |
Class B | | (613,006 | ) | | (9,078,490 | ) | | (5,630,804 | ) | | (64,599,085 | ) |
Class C | | 5,706,832 | | | 84,140,276 | | | (58,669 | ) | | 1,922,253 | |
Class I | | 4,691,681 | | | 69,535,114 | | | 1,993,204 | | | 26,855,213 | |
Class R1 | | (14,534 | ) | | (201,662 | ) | | 63,304 | | | 772,100 | |
Class R2 | | 306,356 | | | 4,508,203 | | | 385,874 | | | 4,995,066 | |
Class R3 | | 14,989,142 | | | 211,683,241 | | | 256,497 | | | 3,674,723 | |
Class R4 | | 582,878 | | | 8,710,643 | | | 465,092 | | | 5,394,144 | |
| | 21,596,401 | | | $319,448,517 | | | (6,724,373 | ) | | $(63,289,488 | ) |
Class W shares were not available for sale during the period. Please see the fund’s prospectus for details.
The fund and certain other funds managed by MFS participate in a $1.1 billion unsecured committed line of credit, subject to a $1 billion sublimit, provided by a syndication of banks under a credit agreement. Borrowings may be made for temporary financing needs. Interest is charged to each fund, based on its borrowings, generally at a rate equal to the higher of the Federal Reserve funds rate or one month LIBOR plus an agreed upon spread. A commitment fee, based on the average daily, unused portion of the committed line of credit, is allocated among the participating funds at the end of each calendar quarter. In addition, the fund and other funds managed by MFS have established unsecured uncommitted borrowing arrangements with certain banks for temporary financing needs. Interest is charged to each fund, based on its borrowings, at a rate equal to the Federal Reserve funds rate plus an agreed upon spread. For the six months ended April 30, 2010, the fund’s commitment fee and interest expense were $20,144 and $0, respectively, and are included in miscellaneous expense on the Statement of Operations.
36
Notes to Financial Statements (unaudited) – continued
| (7) | | Transactions in Underlying Funds-Affiliated Issuers |
An affiliated issuer may be considered one in which the fund owns 5% or more of the outstanding voting securities, or a company which is under common control. For the purposes of this report, the fund assumes the following to be affiliated issuers:
| | | | | | | | | |
| Underlying Funds | | Beginning
Shares/Par
Amount | | Acquisitions
Shares/Par
Amount | | Dispositions
Shares/Par
Amount | | | Ending
Shares/Par
Amount |
MFS Institutional Money
Market Portfolio | | 80,699,538 | | 381,679,456 | | (403,859,433 | ) | | 58,519,561 |
| | | | |
| Underlying Funds | | Realized
Gain (Loss) | | Capital Gain
Distributions | | Dividend
Income | | | Ending
Value |
MFS Institutional Money
Market Portfolio | | $— | | $— | | $64,743 | | | $58,519,561 |
37
RESULTS OF SHAREHOLDER MEETING
(unaudited)
At a special meeting of shareholders of MFS Series Trust VI, which was held on January 28, 2010, the following actions were taken:
Item 1. To elect the following individuals as Trustees:
| | | | |
| | | Number of Dollars |
Nominee | | For | | Withheld Authority |
| Robert E. Butler | | 2,411,252,799.370 | | 47,579,338.071 |
| Lawrence H. Cohn, M.D. | | 2,410,483,391.074 | | 48,348,746.367 |
| Maureen R. Goldfarb | | 2,410,831,816.711 | | 48,000,320.729 |
| David H. Gunning | | 2,411,089,708.057 | | 47,742,429.383 |
| William R. Gutow | | 2,411,301,100.675 | | 47,531,036.765 |
| Michael Hegarty | | 2,411,246,863.087 | | 47,585,274.353 |
| John P. Kavanaugh | | 2,411,407,913.952 | | 47,424,223.489 |
| Robert J. Manning | | 2,411,252,528.550 | | 47,579,608.891 |
| Robert C. Pozen | | 2,411,438,532.476 | | 47,393,604.964 |
| J. Dale Sherratt | | 2,410,865,242.225 | | 47,966,895.216 |
| Laurie J. Thomsen | | 2,411,131,252.551 | | 47,700,884.890 |
| Robert W. Uek | | 2,411,143,493.112 | | 47,688,644.329 |
38
BOARD REVIEW OF INVESTMENT ADVISORY AGREEMENT
A discussion regarding the Board’s most recent review and renewal of the fund’s Investment Advisory Agreement with MFS is available by clicking on the fund’s name under “Mutual Funds” in the “Products and Performance” section of the MFS Web site (mfs.com).
PROXY VOTING POLICIES AND INFORMATION
A general description of the MFS funds’ proxy voting policies and procedures is available without charge, upon request, by calling 1-800-225-2606, by visiting the Proxy Voting section of mfs.com or by visiting the SEC’s Web site at http://www.sec.gov.
Information regarding how the fund voted proxies relating to portfolio securities during the most recent twelve-month period ended June 30 is available without charge by visiting the Proxy Voting section of mfs.com or by visiting the SEC’s Web site at http://www.sec.gov.
QUARTERLY PORTFOLIO DISCLOSURE
The fund will file a complete schedule of portfolio holdings with the Securities and Exchange Commission (the Commission) for the first and third quarters of each fiscal year on Form N-Q. The fund’s Form N-Q may be reviewed and copied at the:
Public Reference Room
Securities and Exchange Commission
100 F Street, NE, Room 1580
Washington, D.C. 20549
Information on the operation of the Public Reference Room may be obtained by calling the Commission at 1-800-SEC-0330. The fund’s Form N-Q is available on the EDGAR database on the Commission’s Internet Web site at http://www.sec.gov, and copies of this information may be obtained, upon payment of a duplicating fee, by electronic request at the following e-mail address: publicinfo@sec.gov or by writing the Public Reference Section at the above address.
A shareholder can also obtain the quarterly portfolio holdings report at mfs.com.
FURTHER INFORMATION
From time to time, MFS may post important information about the fund or the MFS funds on the MFS web site (mfs.com). This information is available by visiting the “News & Commentary” section of mfs.com or by clicking on the fund’s name under “Mutual Funds” in the “Products and Performance” section of mfs.com.
39
CONTACT US
Web site
mfs.com
MFS TALK
1-800-637-8255
24 hours a day
Account service and literature
Shareholders
1-800-225-2606
Investment professionals
1-800-343-2829
Retirement plan services
1-800-637-1255
Mailing address
MFS Service Center, Inc.
P.O. Box 55824
Boston, MA 02205-5824
Overnight mail
MFS Service Center, Inc.
c/o Boston Financial Data Services
30 Dan Road
Canton, MA 02021-2809

Save paper with eDelivery. MFS® will send you prospectuses, reports, and proxies directly via e-mail so you will get information faster with less mailbox clutter. To sign up: 1. go to mfs.com. 2. log in via MFS® Access. 3. select eDelivery. If you own your MFS fund shares through a financial institution or a retirement plan, MFS® TALK, MFS Access, and eDelivery may not be available to you.

The Registrant has not amended any provision in its Code of Ethics (the “Code”) that relates to any element of the Code’s definition enumerated in paragraph (b) of Item 2 of this Form N-CSR.
| ITEM 3. | AUDIT COMMITTEE FINANCIAL EXPERT. |
Not applicable for semi-annual reports.
| ITEM 4. | PRINCIPAL ACCOUNTANT FEES AND SERVICES. |
Not applicable for semi-annual reports.
| ITEM 5. | AUDIT COMMITTEE OF LISTED REGISTRANTS. |
Not applicable to the Registrant.
A schedule of investments for each series of the Registrant is included as part of the report to shareholders of such series under Item 1 of this Form N-CSR.
| ITEM 7. | DISCLOSURE OF PROXY VOTING POLICIES AND PROCEDURES FOR CLOSED-END MANAGEMENT INVESTMENT COMPANIES. |
Not applicable to the Registrant.
| ITEM 8. | PORTFOLIO MANAGERS OF CLOSED-END MANAGEMENT INVESTMENT COMPANIES. |
Not applicable to the Registrant.
| ITEM 9. | PURCHASES OF EQUITY SECURITIES BY CLOSED-END MANAGEMENT INVESTMENT COMPANY AND AFFILIATED PURCHASERS. |
Not applicable to the Registrant.
| ITEM 10. | SUBMISSION OF MATTERS TO A VOTE OF SECURITY HOLDERS. |
There were no material changes to the procedures by which shareholders may send recommendations to the Board for nominees to the Registrant’s Board since the Registrant last provided disclosure as to such procedures in response to the requirements of Item 407 (c)(2)(iv) of Regulation S-K or this Item.
| ITEM 11. | CONTROLS AND PROCEDURES. |
| (a) | Based upon their evaluation of the effectiveness of the registrant’s disclosure controls and procedures (as defined in Rule 30a-3(c) under the Investment Company Act of 1940 (the “Act”)) as conducted within 90 days of the filing date of this report on Form N-CSR, the registrant’s principal financial officer and principal executive officer have concluded that those disclosure controls and procedures provide reasonable assurance that the material information required to be disclosed by the registrant on this report is recorded, processed, summarized and reported within the time periods specified in the Securities and Exchange Commission’s rules and forms. |
| (b) | There were no changes in the registrant���s internal controls over financial reporting (as defined in Rule 30a-3(d) under the Act) that occurred during the second fiscal quarter of the period covered by the report that have materially affected, or are reasonably likely to materially affect, the registrant’s internal control over financial reporting. |
| (a) | File the exhibits listed below as part of this form. Letter or number the exhibits in the sequence indicated. |
| | (1) | Any code of ethics, or amendment thereto, that is the subject of the disclosure required by Item 2, to the extent that the registrant intends to satisfy the Item 2 requirements through filing of an exhibit. |
| | (2) | A separate certification for each principal executive officer and principal financial officer of the registrant as required by Rule 30a-2 under the Act (17 CFR 270.30a-2): Attached hereto. |
| (b) | If the report is filed under Section 13(a) or 15(d) of the Exchange Act, provide the certifications required by Rule 30a-2(b) under the Act (17 CFR 270.30a-2(b)), Rule 13a-14(b) or Rule 15d-14(b) under the Exchange Act (17 CFR 240.13a-14(b) or 240.15d-14(b)) and Section 1350 of Chapter 63 of Title 18 of the United States Code (18 U.S.C. 1350) as an exhibit. A certification furnished pursuant to this paragraph will not be deemed “filed” for the purposes of Section 18 of the Exchange Act (15 U.S.C. 78r), or otherwise subject to the liability of that section. Such certification will not be deemed to be incorporated by reference into any filing under the Securities Act of 1933 or the Exchange Act, except to the extent that the registrant specifically incorporates it by reference: Attached hereto. |
Notice
A copy of the Amended and Restated Declaration of Trust, as amended, of the Registrant is on file with the Secretary of State of The Commonwealth of Massachusetts and notice is hereby given that this instrument is executed on behalf of the Registrant by an officer of the Registrant as an officer and not individually and the obligations of or arising out of this instrument are not binding upon any of the Trustees or shareholders individually, but are binding only upon the assets and property of the respective constituent series of the Registrant.
SIGNATURES
Pursuant to the requirements of the Securities Exchange Act of 1934 and the Investment Company Act of 1940, the registrant has duly caused this report to be signed on its behalf by the undersigned, thereunto duly authorized.
(Registrant) MFS SERIES TRUST VI
| | |
| By (Signature and Title)* | | MARIA F. DWYER |
| | Maria F. Dwyer, President |
Date: June 16, 2010
Pursuant to the requirements of the Securities Exchange Act of 1934 and the Investment Company Act of 1940, this report has been signed below by the following persons on behalf of the registrant and in the capacities and on the dates indicated.
| | |
| By (Signature and Title)* | | MARIA F. DWYER |
| | Maria F. Dwyer, President (Principal Executive Officer) |
Date: June 16, 2010
| | |
| By (Signature and Title)* | | JOHN M. CORCORAN |
| | John M. Corcoran, Treasurer (Principal Financial Officer and Accounting Officer) |
Date: June 16, 2010
| * | Print name and title of each signing officer under his or her signature. |