UNITED STATES
SECURITIES AND EXCHANGE COMMISSION
Washington, D.C. 20549
FORM N-CSR
CERTIFIED SHAREHOLDER REPORT OF
REGISTERED MANAGEMENT INVESTMENT COMPANIES
Investment Company Act file number 811-6102
MFS SERIES TRUST VI
(Exact name of registrant as specified in charter)
111 Huntington Avenue, Boston, Massachusetts 02199
(Address of principal executive offices) (Zip code)
Susan S. Newton
Massachusetts Financial Services Company
111 Huntington Avenue
Boston, Massachusetts 02199
(Name and address of agents for service)
Registrant’s telephone number, including area code: (617) 954-5000
Date of fiscal year end: October 31
Date of reporting period: April 30, 2014
| ITEM 1. | REPORTS TO STOCKHOLDERS. |
SEMIANNUAL REPORT
April 30, 2014

MFS® GLOBAL EQUITY FUND

LGE-SEM
MFS® GLOBAL EQUITY FUND
CONTENTS
The report is prepared for the general information of shareholders. It is authorized for distribution to prospective investors only when preceded or accompanied by a current prospectus.
NOT FDIC INSURED Ÿ MAY LOSE VALUE Ÿ NO BANK GUARANTEE

LETTER FROM THE CHAIRMAN AND CEO
Dear Shareholders:
After gaining momentum late last year, the U.S. economy slipped this winter, as severe weather curtailed activity. More recently, however, labor market data, consumer
confidence, retail sales and industrial output have indicated that the U.S. economy could be regaining traction.
Europe emerged from its recession midway through 2013. However, its pace of growth has been slow, high unemployment persists and the risk of deflation exists. Asia remains vulnerable. China’s economic growth has slowed, and Japan’s early progress toward an economic turnaround continues to face obstacles. Emerging markets have also displayed much higher volatility, affected by the early transition from aggressive central bank monetary easing.
With so much uncertainty, global financial markets began 2014 with much greater volatility than last year’s broad-based rally. For equity investors, attention to company fundamentals has taken on more importance. Bond investors have been attuned to heightened risks from possible interest rate increases.
As always at MFS®, active risk management is an integral part of how we manage your investments. We use a collaborative process, sharing insights across asset classes, regions and economic sectors. Our global team of investment professionals uses a multidisciplined, long-term, diversified investment approach.
We understand that these are challenging economic times. We believe that we can serve you best by applying proven principles, such as asset allocation and diversification, over the long term. We are confident that this approach can serve you well as you work with your financial advisors to reach your goals in the years ahead.
Respectfully,

Robert J. Manning
Chairman and Chief Executive Officer
MFS Investment Management
June 13, 2014
The opinions expressed in this letter are subject to change, may not be relied upon for investment advice, and no forecasts can be guaranteed.
1
PORTFOLIO COMPOSITION
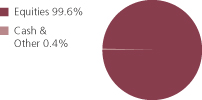
Portfolio structure
| | | | |
| Top ten holdings | | | | |
| Walt Disney Co. | | | 2.9% | |
| Linde AG | | | 2.8% | |
| Nestle S.A. | | | 2.8% | |
| Reckitt Benckiser Group PLC | | | 2.5% | |
| Honeywell International, Inc. | | | 2.5% | |
| Bayer AG | | | 2.3% | |
| Diageo PLC | | | 2.3% | |
| Thermo Fisher Scientific, Inc. | | | 2.2% | |
| United Technologies Corp. | | | 2.1% | |
| Accenture PLC, “A” | | | 2.1% | |
| |
| Equity sectors | | | | |
| Consumer Staples | | | 18.0% | |
| Financial Services | | | 15.7% | |
| Health Care | | | 12.8% | |
| Leisure | | | 10.5% | |
| Industrial Goods & Services | | | 9.3% | |
| Basic Materials | | | 7.7% | |
| Retailing | | | 6.9% | |
| Technology | | | 5.9% | |
| Special Products & Services | | | 4.5% | |
| Energy | | | 3.6% | |
| Transportation | | | 3.6% | |
| Autos & Housing | | | 1.1% | |
| | | | |
| Issuer country weightings (x) | | | | |
| United States | | | 51.7% | |
| United Kingdom | | | 10.1% | |
| France | | | 9.0% | |
| Switzerland | | | 8.5% | |
| Germany | | | 8.0% | |
| Netherlands | | | 2.9% | |
| Canada | | | 1.8% | |
| Japan | | | 1.7% | |
| Sweden | | | 0.9% | |
| Other Countries | | | 5.4% | |
|
| Currency exposure weightings (y) | |
| United States Dollar | | | 54.1% | |
| Euro | | | 20.9% | |
| British Pound Sterling | | | 10.1% | |
| Swiss Franc | | | 8.5% | |
| Japanese Yen | | | 1.7% | |
| Swedish Krona | | | 0.9% | |
| Danish Krone | | | 0.9% | |
| Brazilian Real | | | 0.8% | |
| South Korean Won | | | 0.7% | |
| Other Currencies | | | 1.4% | |
2
Portfolio Composition – continued
| (x) | Represents the portfolio’s exposure to issuer countries as a percentage of a portfolio’s net assets. For purposes of this presentation, United States includes Cash & Other. |
| (y) | Represents the portfolio’s exposure to a particular currency as a percentage of a portfolio’s net assets. For purposes of this presentation, United States Dollar includes Cash & Other. |
Percentages are based on net assets as of 4/30/14.
The portfolio is actively managed and current holdings may be different.
3
EXPENSE TABLE
Fund expenses borne by the shareholders during the period, November 1, 2013 through April 30, 2014
As a shareholder of the fund, you incur two types of costs: (1) transaction costs, including sales charges (loads) on certain purchase or redemption payments, and (2) ongoing costs, including management fees; distribution and service (12b-1) fees; and other fund expenses. This example is intended to help you understand your ongoing costs (in dollars) of investing in the fund and to compare these costs with the ongoing costs of investing in other mutual funds.
The example is based on an investment of $1,000 invested at the beginning of the period and held for the entire period November 1, 2013 through April 30, 2014.
Actual Expenses
The first line for each share class in the following table provides information about actual account values and actual expenses. You may use the information in this line, together with the amount you invested, to estimate the expenses that you paid over the period. Simply divide your account value by $1,000 (for example, an $8,600 account value divided by $1,000 = 8.6), then multiply the result by the number in the first line under the heading entitled “Expenses Paid During Period” to estimate the expenses you paid on your account during this period.
Hypothetical Example for Comparison Purposes
The second line for each share class in the following table provides information about hypothetical account values and hypothetical expenses based on the fund’s actual expense ratio and an assumed rate of return of 5% per year before expenses, which is not the fund’s actual return. The hypothetical account values and expenses may not be used to estimate the actual ending account balance or expenses you paid for the period. You may use this information to compare the ongoing costs of investing in the fund and other funds. To do so, compare this 5% hypothetical example with the 5% hypothetical examples that appear in the shareholder reports of the other funds.
Please note that the expenses shown in the table are meant to highlight your ongoing costs only and do not reflect any transactional costs, such as sales charges (loads). Therefore, the second line for each share class in the table is useful in comparing ongoing costs only, and will not help you determine the relative total costs of owning different funds. In addition, if these transactional costs were included, your costs would have been higher.
4
Expense Table – continued
| | | | | | | | | | | | | | | | | | |
Share
Class | | | | Annualized
Expense
Ratio | | | Beginning
Account Value
11/01/13 | | | Ending
Account Value
4/30/14 | | | Expenses
Paid During
Period (p)
11/01/13-4/30/14 | |
| A | | Actual | | | 1.21% | | | | $1,000.00 | | | | $1,058.42 | | | | $6.18 | |
| | Hypothetical (h) | | | 1.21% | | | | $1,000.00 | | | | $1,018.79 | | | | $6.06 | |
| B | | Actual | | | 1.97% | | | | $1,000.00 | | | | $1,054.18 | | | | $10.03 | |
| | Hypothetical (h) | | | 1.97% | | | | $1,000.00 | | | | $1,015.03 | | | | $9.84 | |
| C | | Actual | | | 1.97% | | | | $1,000.00 | | | | $1,054.31 | | | | $10.03 | |
| | Hypothetical (h) | | | 1.97% | | | | $1,000.00 | | | | $1,015.03 | | | | $9.84 | |
| I | | Actual | | | 0.97% | | | | $1,000.00 | | | | $1,059.47 | | | | $4.95 | |
| | Hypothetical (h) | | | 0.97% | | | | $1,000.00 | | | | $1,019.98 | | | | $4.86 | |
| R1 | | Actual | | | 1.97% | | | | $1,000.00 | | | | $1,054.33 | | | | $10.03 | |
| | Hypothetical (h) | | | 1.97% | | | | $1,000.00 | | | | $1,015.03 | | | | $9.84 | |
| R2 | | Actual | | | 1.47% | | | | $1,000.00 | | | | $1,056.88 | | | | $7.50 | |
| | Hypothetical (h) | | | 1.47% | | | | $1,000.00 | | | | $1,017.50 | | | | $7.35 | |
| R3 | | Actual | | | 1.22% | | | | $1,000.00 | | | | $1,058.30 | | | | $6.23 | |
| | Hypothetical (h) | | | 1.22% | | | | $1,000.00 | | | | $1,018.74 | | | | $6.11 | |
| R4 | | Actual | | | 0.97% | | | | $1,000.00 | | | | $1,059.56 | | | | $4.95 | |
| | Hypothetical (h) | | | 0.97% | | | | $1,000.00 | | | | $1,019.98 | | | | $4.86 | |
| R5 | | Actual | | | 0.90% | | | | $1,000.00 | | | | $1,059.86 | | | | $4.60 | |
| | Hypothetical (h) | | | 0.90% | | | | $1,000.00 | | | | $1,020.33 | | | | $4.51 | |
| (h) | 5% class return per year before expenses. |
| (p) | “Expenses Paid During Period” are equal to each class’s annualized expense ratio, as shown above, multiplied by the average account value over the period, multiplied by 181/365 (to reflect the one-half year period). Expenses paid do not include any applicable sales charges (loads). If these transaction costs had been included, your costs would have been higher. |
5
PORTFOLIO OF INVESTMENTS
4/30/14 (unaudited)
The Portfolio of Investments is a complete list of all securities owned by your fund. It is categorized by broad-based asset classes.
| | | | | | | | |
| Common Stocks - 99.6% | | | | | | | | |
| Issuer | | Shares/Par | | | Value ($) | |
| | | | | | | | |
| Aerospace - 5.2% | | | | | | | | |
| Honeywell International, Inc. | | | 517,038 | | | $ | 48,032,825 | |
| MTU Aero Engines AG | | | 146,794 | | | | 13,813,895 | |
| United Technologies Corp. | | | 342,408 | | | | 40,517,139 | |
| | | | | | | | |
| | | | | | | $ | 102,363,859 | |
| Alcoholic Beverages - 6.3% | | | | | | | | |
| Carlsberg Group | | | 171,998 | | | $ | 17,183,815 | |
| Diageo PLC | | | 1,456,043 | | | | 44,681,110 | |
| Heineken N.V. (l) | | | 459,543 | | | | 31,877,349 | |
| Pernod Ricard S.A. | | | 239,734 | | | | 28,772,790 | |
| | | | | | | | |
| | | | | | | $ | 122,515,064 | |
| Apparel Manufacturers - 4.2% | | | | | | | | |
| Burberry Group PLC | | | 483,921 | | | $ | 12,133,225 | |
| Compagnie Financiere Richemont S.A. | | | 238,736 | | | | 24,223,526 | |
| LVMH Moet Hennessy Louis Vuitton S.A. | | | 195,416 | | | | 38,429,897 | |
| NIKE, Inc., “B” | | | 91,450 | | | | 6,671,278 | |
| | | | | | | | |
| | | | | | | $ | 81,457,926 | |
| Automotive - 1.1% | | | | | | | | |
| Delphi Automotive PLC | | | 253,016 | | | $ | 16,911,589 | |
| Harley-Davidson, Inc. | | | 58,140 | | | | 4,298,872 | |
| | | | | | | | |
| | | | | | | $ | 21,210,461 | |
| Broadcasting - 7.5% | | | | | | | | |
| Omnicom Group, Inc. | | | 254,953 | | | $ | 17,255,219 | |
| Time Warner, Inc. | | | 571,780 | | | | 38,000,499 | |
| Viacom, Inc., “B” | | | 88,792 | | | | 7,545,544 | |
| Walt Disney Co. | | | 712,975 | | | | 56,567,437 | |
| WPP Group PLC | | | 1,217,398 | | | | 26,186,494 | |
| | | | | | | | |
| | | | | | | $ | 145,555,193 | |
| Brokerage & Asset Managers - 1.8% | | | | | | | | |
| Deutsche Boerse AG | | | 150,714 | | | $ | 11,038,023 | |
| Franklin Resources, Inc. | | | 472,991 | | | | 24,761,079 | |
| | | | | | | | |
| | | | | | | $ | 35,799,102 | |
| Business Services - 4.5% | | | | | | | | |
| Accenture PLC, “A” | | | 503,556 | | | $ | 40,395,262 | |
| Adecco S.A. | | | 156,603 | | | | 13,087,320 | |
6
Portfolio of Investments (unaudited) – continued
| | | | | | | | |
| Issuer | | Shares/Par | | | Value ($) | |
| | | | | | | | |
| Common Stocks - continued | | | | | | | | |
| Business Services - continued | | | | | | | | |
| Brenntag AG | | | 52,416 | | | $ | 9,478,966 | |
| Compass Group PLC | | | 1,560,585 | | | | 24,820,680 | |
| | | | | | | | |
| | | | | | | $ | 87,782,228 | |
| Cable TV - 1.4% | | | | | | | | |
| British Sky Broadcasting Group PLC | | | 720,623 | | | $ | 10,706,959 | |
| Time Warner Cable, Inc. | | | 111,030 | | | | 15,706,304 | |
| | | | | | | | |
| | | | | | | $ | 26,413,263 | |
| Chemicals - 1.9% | | | | | | | | |
| 3M Co. | | | 269,613 | | | $ | 37,500,472 | |
| | |
| Computer Software - 2.6% | | | | | | | | |
| Check Point Software Technologies Ltd. (a) | | | 121,840 | | | $ | 7,805,070 | |
| Dassault Systemes S.A. | | | 32,432 | | | | 3,987,866 | |
| Oracle Corp. | | | 936,913 | | | | 38,301,003 | |
| | | | | | | | |
| | | | | | | $ | 50,093,939 | |
| Computer Software - Systems - 0.1% | | | | | | | | |
| Canon, Inc. | | | 62,800 | | | $ | 1,963,988 | |
| | |
| Consumer Products - 6.1% | | | | | | | | |
| Colgate-Palmolive Co. | | | 412,218 | | | $ | 27,742,271 | |
| International Flavors & Fragrances, Inc. | | | 189,905 | | | | 18,709,441 | |
| Procter & Gamble Co. | | | 82,045 | | | | 6,772,815 | |
| Reckitt Benckiser Group PLC | | | 609,679 | | | | 49,152,991 | |
| Svenska Cellulosa Aktiebolaget | | | 615,025 | | | | 17,224,332 | |
| | | | | | | | |
| | | | | | | $ | 119,601,850 | |
| Electrical Equipment - 4.0% | | | | | | | | |
| Amphenol Corp., “A” | | | 170,738 | | | $ | 16,279,868 | |
| Legrand S.A. | | | 416,496 | | | | 26,868,896 | |
| Rockwell Automation, Inc. | | | 44,141 | | | | 5,260,724 | |
| Schneider Electric S.A. | | | 320,395 | | | | 30,025,975 | |
| | | | | | | | |
| | | | | | | $ | 78,435,463 | |
| Electronics - 2.6% | | | | | | | | |
| Altera Corp. | | | 261,310 | | | $ | 8,497,801 | |
| Hoya Corp. | | | 541,700 | | | | 15,969,911 | |
| Microchip Technology, Inc. | | | 295,325 | | | | 14,039,751 | |
| Samsung Electronics Co. Ltd. | | | 9,974 | | | | 12,999,789 | |
| | | | | | | | |
| | | | | | | $ | 51,507,252 | |
| Energy - Independent - 0.5% | | | | | | | | |
| INPEX Corp. | | | 697,700 | | | $ | 10,154,816 | |
7
Portfolio of Investments (unaudited) – continued
| | | | | | | | |
| Issuer | | Shares/Par | | | Value ($) | |
| | | | | | | | |
| Common Stocks - continued | | | | | | | | |
| Food & Beverages - 5.6% | | | | | | | | |
| Dr Pepper Snapple Group, Inc. | | | 111,659 | | | $ | 6,188,142 | |
| Groupe Danone | | | 486,186 | | | | 35,856,959 | |
| Kellogg Co. | | | 193,490 | | | | 12,930,937 | |
| Nestle S.A. | | | 702,012 | | | | 54,200,336 | |
| | | | | | | | |
| | | | | | | $ | 109,176,374 | |
| Food & Drug Stores - 0.2% | | | | | | | | |
| Lawson, Inc. | | | 62,000 | | | $ | 4,305,766 | |
| | |
| Gaming & Lodging - 0.3% | | | | | | | | |
| William Hill PLC | | | 1,096,049 | | | $ | 6,563,969 | |
| | |
| General Merchandise - 0.7% | | | | | | | | |
| Target Corp. | | | 203,486 | | | $ | 12,565,261 | |
| | |
| Insurance - 0.4% | | | | | | | | |
| Swiss Re Ltd. | | | 88,218 | | | $ | 7,703,162 | |
| | |
| Major Banks - 5.5% | | | | | | | | |
| Bank of New York Mellon Corp. | | | 912,648 | | | $ | 30,911,388 | |
| Goldman Sachs Group, Inc. | | | 123,332 | | | | 19,710,920 | |
| Standard Chartered PLC | | | 967,191 | | | | 20,926,962 | |
| State Street Corp. | | | 556,235 | | | | 35,910,532 | |
| | | | | | | | |
| | | | | | | $ | 107,459,802 | |
| Medical Equipment - 7.9% | | | | | | | | |
| DENTSPLY International, Inc. | | | 316,086 | | | $ | 14,106,918 | |
| Medtronic, Inc. | | | 403,829 | | | | 23,753,222 | |
| Sonova Holding AG | | | 95,486 | | | | 13,778,800 | |
| St. Jude Medical, Inc. | | | 392,085 | | | | 24,885,635 | |
| Stryker Corp. | | | 215,400 | | | | 16,747,350 | |
| Thermo Fisher Scientific, Inc. | | | 384,724 | | | | 43,858,536 | |
| Waters Corp. (a) | | | 169,268 | | | | 16,679,669 | |
| | | | | | | | |
| | | | | | | $ | 153,810,130 | |
| Network & Telecom - 0.6% | | | | | | | | |
| Cisco Systems, Inc. | | | 499,516 | | | $ | 11,543,815 | |
| | |
| Oil Services - 3.1% | | | | | | | | |
| National Oilwell Varco, Inc. | | | 234,026 | | | $ | 18,378,062 | |
| Saipem S.p.A. | | | 360,801 | | | | 9,660,755 | |
| Schlumberger Ltd. | | | 325,779 | | | | 33,082,857 | |
| | | | | | | | |
| | | | | | | $ | 61,121,674 | |
8
Portfolio of Investments (unaudited) – continued
| | | | | | | | |
| Issuer | | Shares/Par | | | Value ($) | |
| | | | | | | | |
| Common Stocks - continued | | | | | | | | |
| Other Banks & Diversified Financials - 8.0% | | | | | | | | |
| American Express Co. | | | 323,195 | | | $ | 28,256,939 | |
| Credicorp Ltd. | | | 30,563 | | | | 4,561,528 | |
| Erste Group Bank AG | | | 303,023 | | | | 10,169,451 | |
| Grupo Financiero Banorte S.A. de C.V. | | | 907,600 | | | | 6,016,789 | |
| ICICI Bank Ltd. | | | 336,380 | | | | 6,956,304 | |
| Itau Unibanco Holding S.A., ADR | | | 967,272 | | | | 15,824,570 | |
| Julius Baer Group Ltd. | | | 267,251 | | | | 12,495,601 | |
| Kasikornbank PLC | | | 1,088,980 | | | | 6,624,370 | |
| Komercni Banka A.S. | | | 17,232 | | | | 3,970,677 | |
| Sberbank of Russia, ADR (a) | | | 457,308 | | | | 3,833,156 | |
| UBS AG | | | 1,040,596 | | | | 21,755,444 | |
| Visa, Inc., “A” | | | 179,222 | | | | 36,312,169 | |
| | | | | | | | |
| | | | | | | $ | 156,776,998 | |
| Pharmaceuticals - 4.9% | | | | | | | | |
| Bayer AG (l) | | | 328,298 | | | $ | 45,546,423 | |
| Johnson & Johnson | | | 136,271 | | | | 13,802,890 | |
| Merck KGaA | | | 126,409 | | | | 21,316,652 | |
| Roche Holding AG | | | 50,684 | | | | 14,857,939 | |
| | | | | | | | |
| | | | | | | $ | 95,523,904 | |
| Railroad & Shipping - 2.0% | | | | | | | | |
| Canadian National Railway Co. | | | 601,794 | | | $ | 35,247,075 | |
| Kuehne & Nagel International AG | | | 29,270 | | | | 3,997,562 | |
| | | | | | | | |
| | | | | | | $ | 39,244,637 | |
| Restaurants - 1.3% | | | | | | | | |
| McDonald’s Corp. | | | 227,710 | | | $ | 23,085,240 | |
| Whitbread PLC | | | 39,262 | | | | 2,704,630 | |
| | | | | | | | |
| | | | | | | $ | 25,789,870 | |
| Specialty Chemicals - 5.8% | | | | | | | | |
| Akzo Nobel N.V. | | | 336,481 | | | $ | 25,903,670 | |
| L’Air Liquide S.A. | | | 80,205 | | | | 11,472,185 | |
| Linde AG | | | 265,108 | | | | 54,967,349 | |
| Praxair, Inc. | | | 164,632 | | | | 21,492,708 | |
| | | | | | | | |
| | | | | | | $ | 113,835,912 | |
| Specialty Stores - 1.9% | | | | | | | | |
| AutoZone, Inc. (a) | | | 33,119 | | | $ | 17,681,903 | |
| Sally Beauty Holdings, Inc. (a) | | | 501,751 | | | | 13,752,995 | |
| Urban Outfitters, Inc. (a) | | | 161,150 | | | | 5,745,803 | |
| | | | | | | | |
| | | | | | | $ | 37,180,701 | |
9
Portfolio of Investments (unaudited) – continued
| | | | | | | | |
| Issuer | | Shares/Par | | | Value ($) | |
| | | | | | | | |
| Common Stocks - continued | | | | | | | | |
| Trucking - 1.6% | | | | | | | | |
| United Parcel Service, Inc., “B” | | | 309,825 | | | $ | 30,517,763 | |
| Total Common Stocks (Identified Cost, $1,416,304,014) | | | | | | $ | 1,945,474,614 | |
| | |
| Money Market Funds - 1.0% | | | | | | | | |
MFS Institutional Money Market Portfolio, 0.09%,
at Cost and Net Asset Value (v) | | | 19,069,959 | | | $ | 19,069,959 | |
| | |
| Collateral for Securities Loaned - 2.9% | | | | | | | | |
JPMorgan Prime Money Market Fund, 0.06%,
at Cost and Net Asset Value (j) | | | 56,887,170 | | | $ | 56,887,170 | |
| Total Investments (Identified Cost, $1,492,261,143) | | | | | | $ | 2,021,431,743 | |
| | |
| Other Assets, Less Liabilities - (3.5)% | | | | | | | (68,451,556 | ) |
| Net Assets - 100.0% | | | | | | $ | 1,952,980,187 | |
| (a) | Non-income producing security. |
| (j) | The rate quoted is the annualized seven-day yield of the fund at period end. |
| (l) | A portion of this security is on loan. |
| (v) | Underlying affiliated fund that is available only to investment companies managed by MFS. The rate quoted for the MFS Institutional Money Market Portfolio is the annualized seven-day yield of the fund at period end. |
The following abbreviations are used in this report and are defined:
| ADR | | American Depositary Receipt |
| PLC | | Public Limited Company |
See Notes to Financial Statements
10
Financial Statements
STATEMENT OF ASSETS AND LIABILITIES
At 4/30/14 (unaudited)
This statement represents your fund’s balance sheet, which details the assets and liabilities comprising the total value of the fund.
| | | | |
| Assets | | | | |
Investments- | | | | |
Non-affiliated issuers, at value (identified cost, $1,473,191,184) | | | $2,002,361,784 | |
Underlying affiliated funds, at cost and value | | | 19,069,959 | |
Total investments, at value, including $54,526,909 of securities on loan (identified cost, $1,492,261,143) | | | $2,021,431,743 | |
Cash | | | 148,127 | |
Receivables for | | | | |
Investments sold | | | 958,424 | |
Fund shares sold | | | 5,735,406 | |
Interest and dividends | | | 4,979,283 | |
Other assets | | | 7,335 | |
Total assets | | | $2,033,260,318 | |
| Liabilities | | | | |
Payables for | | | | |
Investments purchased | | | $967,998 | |
Fund shares reacquired | | | 21,205,842 | |
Collateral for securities loaned, at value | | | 56,887,170 | |
Payable to affiliates | | | | |
Investment adviser | | | 81,882 | |
Shareholder servicing costs | | | 808,407 | |
Distribution and service fees | | | 17,859 | |
Payable for independent Trustees’ compensation | | | 12,509 | |
Deferred country tax expense payable | | | 223,718 | |
Accrued expenses and other liabilities | | | 74,746 | |
Total liabilities | | | $80,280,131 | |
Net assets | | | $1,952,980,187 | |
| Net assets consist of | | | | |
Paid-in capital | | | $1,419,332,070 | |
Unrealized appreciation (depreciation) on investments and translation of assets and liabilities in foreign currencies (net of $223,718 deferred country tax) | | | 528,980,980 | |
Accumulated distributions in excess of net realized gain on investments and foreign currency | | | (2,260,989 | ) |
Undistributed net investment income | | | 6,928,126 | |
Net assets | | | $1,952,980,187 | |
Shares of beneficial interest outstanding | | | 55,246,917 | |
11
Statement of Assets and Liabilities (unaudited) – continued
| | | | | | | | | | | | |
| | | Net assets | | | Shares
outstanding | | | Net asset value
per share (a) | |
Class A | | | $587,111,233 | | | | 16,665,455 | | | | $35.23 | |
Class B | | | 26,089,569 | | | | 796,325 | | | | 32.76 | |
Class C | | | 102,245,295 | | | | 3,243,941 | | | | 31.52 | |
Class I | | | 683,075,723 | | | | 18,941,460 | | | | 36.06 | |
Class R1 | | | 3,803,057 | | | | 118,518 | | | | 32.09 | |
Class R2 | | | 59,435,551 | | | | 1,734,193 | | | | 34.27 | |
Class R3 | | | 80,238,072 | | | | 2,292,104 | | | | 35.01 | |
Class R4 | | | 105,156,871 | | | | 2,976,663 | | | | 35.33 | |
Class R5 | | | 305,824,816 | | | | 8,478,258 | | | | 36.07 | |
| (a) | Maximum offering price per share was equal to the net asset value per share for all share classes, except for Class A, for which the maximum offering price per share was $37.38 [100 / 94.25 x $35.23]. On sales of $50,000 or more, the maximum offering price of Class A shares is reduced. A contingent deferred sales charge may be imposed on redemptions of Class A, Class B, and Class C shares. Redemption price per share was equal to the net asset value per share for Classes I, R1, R2, R3, R4, and R5. |
See Notes to Financial Statements
12
Financial Statements
STATEMENT OF OPERATIONS
Six months ended 4/30/14 (unaudited)
This statement describes how much your fund earned in investment income and accrued in expenses. It also describes any gains and/or losses generated by fund operations.
| | | | |
| Net investment income | |
Income | | | | |
Dividends | | | $18,365,016 | |
Interest | | | 50,861 | |
Dividends from underlying affiliated funds | | | 12,137 | |
Foreign taxes withheld | | | (950,467 | ) |
Total investment income | | | $17,477,547 | |
Expenses | | | | |
Management fee | | | $7,421,955 | |
Distribution and service fees | | | 1,491,075 | |
Shareholder servicing costs | | | 716,602 | |
Administrative services fee | | | 108,499 | |
Independent Trustees’ compensation | | | 13,101 | |
Custodian fee | | | 130,727 | |
Shareholder communications | | | 25,796 | |
Audit and tax fees | | | 31,384 | |
Legal fees | | | 6,282 | |
Miscellaneous | | | 110,572 | |
Total expenses | | | $10,055,993 | |
Fees paid indirectly | | | (6 | ) |
Reduction of expenses by investment adviser and distributor | | | (38,958 | ) |
Net expenses | | | $10,017,029 | |
Net investment income | | | $7,460,518 | |
| Realized and unrealized gain (loss) on investments and foreign currency | |
Realized gain (loss) (identified cost basis) | | | | |
Investments | | | $6,586,761 | |
Foreign currency | | | (29,922 | ) |
Net realized gain (loss) on investments and foreign currency | | | $6,556,839 | |
Change in unrealized appreciation (depreciation) | | | | |
Investments (net of $202,444 increase in deferred country tax) | | | $91,249,943 | |
Translation of assets and liabilities in foreign currencies | | | 22,847 | |
Net unrealized gain (loss) on investments and foreign currency translation | | | $91,272,790 | |
Net realized and unrealized gain (loss) on investments and foreign currency | | | $97,829,629 | |
Change in net assets from operations | | | $105,290,147 | |
See Notes to Financial Statements
13
Financial Statements
STATEMENTS OF CHANGES IN NET ASSETS
These statements describe the increases and/or decreases in net assets resulting from operations, any distributions, and any shareholder transactions.
| | | | | | | | |
| Change in net assets | | Six months ended
4/30/14
(unaudited) | | | Year ended
10/31/13 | |
| From operations | | | | | | | | |
Net investment income | | | $7,460,518 | | | | $9,569,524 | |
Net realized gain (loss) on investments and foreign currency | | | 6,556,839 | | | | 18,345,691 | |
Net unrealized gain (loss) on investments and foreign currency translation | | | 91,272,790 | | | | 273,914,639 | |
Change in net assets from operations | | | $105,290,147 | | | | $301,829,854 | |
| Distributions declared to shareholders | | | | | | | | |
From net investment income | | | $(7,871,999 | ) | | | $(9,500,116 | ) |
From net realized gain on investments | | | (15,876,402 | ) | | | (2,356,443 | ) |
Total distributions declared to shareholders | | | $(23,748,401 | ) | | | $(11,856,559 | ) |
Change in net assets from fund share transactions | | | $223,793,608 | | | | $513,286,536 | |
Total change in net assets | | | $305,335,354 | | | | $803,259,831 | |
| Net assets | | | | | | | | |
At beginning of period | | | 1,647,644,833 | | | | 844,385,002 | |
At end of period (including undistributed net investment income of $6,928,126 and $7,339,607, respectively) | | | $1,952,980,187 | | | | $1,647,644,833 | |
See Notes to Financial Statements
14
Financial Statements
FINANCIAL HIGHLIGHTS
The financial highlights table is intended to help you understand the fund’s financial performance for the semiannual period and the past 5 fiscal years (or life of a particular share class, if shorter). Certain information reflects financial results for a single fund share. The total returns in the table represent the rate by which an investor would have earned (or lost) on an investment in the fund share class (assuming reinvestment of all distributions) held for the entire period.
| | | | | | | | | | | | | | | | | | | | | | | | |
| | | Six months
ended
4/30/14 (unaudited) | | | Years ended 10/31 | |
| Class A | | | 2013 | | | 2012 | | | 2011 | | | 2010 | | | 2009 | |
| | | | | | | | | | | | | | | | | |
Net asset value, beginning of period | | | $33.74 | | | | $26.46 | | | | $23.79 | | | | $23.14 | | | | $20.30 | | | | $18.51 | |
| Income (loss) from investment operations | | | | | | | | | | | | | |
Net investment income (d) | | | $0.12 | | | | $0.22 | | | | $0.23 | | | | $0.20 | | | | $0.14 | | | | $0.17 | |
Net realized and unrealized gain
(loss) on investments and
foreign currency | | | 1.82 | | | | 7.40 | | | | 2.78 | | | | 0.55 | | | | 2.88 | | | | 3.02 | |
Total from investment operations | | | $1.94 | | | | $7.62 | | | | $3.01 | | | | $0.75 | | | | $3.02 | | | | $3.19 | |
| Less distributions declared to shareholders | | | | | | | | | | | | | |
From net investment income | | | $(0.13 | ) | | | $(0.27 | ) | | | $(0.19 | ) | | | $(0.10 | ) | | | $(0.18 | ) | | | $(0.29 | ) |
From net realized gain on
investments | | | (0.32 | ) | | | (0.07 | ) | | | (0.15 | ) | | | — | | | | — | | | | (1.11 | ) |
Total distributions declared to
shareholders | | | $(0.45 | ) | | | $(0.34 | ) | | | $(0.34 | ) | | | $(0.10 | ) | | | $(0.18 | ) | | | $(1.40 | ) |
Net asset value, end of period (x) | | | $35.23 | | | | $33.74 | | | | $26.46 | | | | $23.79 | | | | $23.14 | | | | $20.30 | |
Total return (%) (r)(s)(t)(x) | | | 5.84 | (n) | | | 29.12 | | | | 12.96 | | | | 3.23 | | | | 14.97 | | | | 18.90 | |
Ratios (%) (to average net assets)
and Supplemental data: | | | | | | | | | | | | | | | | | |
Expenses before expense
reductions (f) | | | 1.22 | (a) | | | 1.29 | | | | 1.34 | | | | 1.37 | | | | 1.43 | | | | 1.53 | |
Expenses after expense reductions (f) | | | 1.21 | (a) | | | 1.29 | | | | 1.34 | | | | 1.37 | | | | 1.43 | | | | 1.53 | |
Net investment income | | | 0.73 | (a)(l) | | | 0.71 | | | | 0.93 | | | | 0.82 | | | | 0.63 | | | | 0.99 | |
Portfolio turnover | | | 4 | (n) | | | 11 | | | | 13 | | | | 16 | | | | 26 | | | | 17 | |
Net assets at end of period
(000 omitted) | | | $587,111 | | | | $512,447 | | | | $344,016 | | | | $310,964 | | | | $305,179 | | | | $285,345 | |
See Notes to Financial Statements
15
Financial Highlights – continued
| | | | | | | | | | | | | | | | | | | | | | | | |
| | | Six months
ended
4/30/14 (unaudited) | | | Years ended 10/31 | |
| Class B | | | 2013 | | | 2012 | | | 2011 | | | 2010 | | | 2009 | |
| | | | | | | | | | | | | | | | | |
Net asset value, beginning of period | | | $31.40 | | | | $24.64 | | | | $22.13 | | | | $21.61 | | | | $18.97 | | | | $17.25 | |
| Income (loss) from investment operations | | | | | | | | | | | | | | | | | |
Net investment income (loss) (d) | | | $(0.01 | ) | | | $(0.01 | ) | | | $0.04 | | | | $0.01 | | | | $(0.02 | ) | | | $0.04 | |
Net realized and unrealized gain
(loss) on investments and
foreign currency | | | 1.69 | | | | 6.92 | | | | 2.62 | | | | 0.51 | | | | 2.69 | | | | 2.83 | |
Total from investment operations | | | $1.68 | | | | $6.91 | | | | $2.66 | | | | $0.52 | | | | $2.67 | | | | $2.87 | |
| Less distributions declared to shareholders | | | | | | | | | | | | | | | | | |
From net investment income | | | $— | | | | $(0.08 | ) | | | $— | | | | $— | | | | $(0.03 | ) | | | $(0.04 | ) |
From net realized gain on
investments | | | (0.32 | ) | | | (0.07 | ) | | | (0.15 | ) | | | — | | | | — | | | | (1.11 | ) |
Total distributions declared to
shareholders | | | $(0.32 | ) | | | $(0.15 | ) | | | $(0.15 | ) | | | $— | | | | $(0.03 | ) | | | $(1.15 | ) |
Net asset value, end of period (x) | | | $32.76 | | | | $31.40 | | | | $24.64 | | | | $22.13 | | | | $21.61 | | | | $18.97 | |
Total return (%) (r)(s)(t)(x) | | | 5.42 | (n) | | | 28.19 | | | | 12.13 | | | | 2.41 | | | | 14.10 | | | | 18.04 | |
Ratios (%) (to average net assets)
and Supplemental data: | | | | | | | | | | | | | | | | | |
Expenses before expense
reductions (f) | | | 1.97 | (a) | | | 2.04 | | | | 2.09 | | | | 2.12 | | | | 2.18 | | | | 2.29 | |
Expenses after expense reductions (f) | | | 1.97 | (a) | | | 2.04 | | | | 2.09 | | | | 2.12 | | | | 2.18 | | | | 2.29 | |
Net investment income (loss) | | | (0.05 | )(a)(l) | | | (0.02 | ) | | | 0.16 | | | | 0.06 | | | | (0.12 | ) | | | 0.25 | |
Portfolio turnover | | | 4 | (n) | | | 11 | | | | 13 | | | | 16 | | | | 26 | | | | 17 | |
Net assets at end of period
(000 omitted) | | | $26,090 | | | | $24,395 | | | | $18,799 | | | | $20,797 | | | | $25,796 | | | | $29,964 | |
See Notes to Financial Statements
16
Financial Highlights – continued
| | | | | | | | | | | | | | | | | | | | | | | | |
| | | Six months
ended
4/30/14 (unaudited) | | | Years ended 10/31 | |
| Class C | | | 2013 | | | 2012 | | | 2011 | | | 2010 | | | 2009 | |
| | | | | | | | | | | | | | | | | |
Net asset value, beginning of period | | | $30.22 | | | | $23.75 | | | | $21.37 | | | | $20.87 | | | | $18.35 | | | | $16.79 | |
| Income (loss) from investment operations | | | | | | | | | | | | | | | | | |
Net investment income (loss) (d) | | | $0.00 | (w) | | | $(0.02 | ) | | | $0.04 | | | | $0.01 | | | | $(0.02 | ) | | | $0.04 | |
Net realized and unrealized gain
(loss) on investments and
foreign currency | | | 1.62 | | | | 6.66 | | | | 2.53 | | | | 0.49 | | | | 2.60 | | | | 2.73 | |
Total from investment operations | | | $1.62 | | | | $6.64 | | | | $2.57 | | | | $0.50 | | | | $2.58 | | | | $2.77 | |
| Less distributions declared to shareholders | | | | | | | | | | | | | | | | | |
From net investment income | | | $— | | | | $(0.10 | ) | | | $(0.04 | ) | | | $— | | | | $(0.06 | ) | | | $(0.10 | ) |
From net realized gain on
investments | | | (0.32 | ) | | | (0.07 | ) | | | (0.15 | ) | | | — | | | | — | | | | (1.11 | ) |
Total distributions declared to
shareholders | | | $(0.32 | ) | | | $(0.17 | ) | | | $(0.19 | ) | | | $— | | | | $(0.06 | ) | | | $(1.21 | ) |
Net asset value, end of period (x) | | | $31.52 | | | | $30.22 | | | | $23.75 | | | | $21.37 | | | | $20.87 | | | | $18.35 | |
Total return (%) (r)(s)(t)(x) | | | 5.43 | (n) | | | 28.15 | | | | 12.17 | | | | 2.40 | | | | 14.12 | | | | 18.02 | |
Ratios (%) (to average net assets)
and Supplemental data: | | | | | | | | | | | | | | | | | |
Expenses before expense
reductions (f) | | | 1.97 | (a) | | | 2.04 | | | | 2.09 | | | | 2.12 | | | | 2.18 | | | | 2.28 | |
Expenses after expense reductions (f) | | | 1.97 | (a) | | | 2.04 | | | | 2.09 | | | | 2.12 | | | | 2.18 | | | | 2.28 | |
Net investment income (loss) | | | 0.01 | (a)(l) | | | (0.06 | ) | | | 0.17 | | | | 0.07 | | | | (0.11 | ) | | | 0.24 | |
Portfolio turnover | | | 4 | (n) | | | 11 | | | | 13 | | | | 16 | | | | 26 | | | | 17 | |
Net assets at end of period
(000 omitted) | | | $102,245 | | | | $74,448 | | | | $32,071 | | | | $28,756 | | | | $28,424 | | | | $27,990 | |
See Notes to Financial Statements
17
Financial Highlights – continued
| | | | | | | | | | | | | | | | | | | | | | | | |
| | | Six months
ended
4/30/14 (unaudited) | | | Years ended 10/31 | |
| Class I | | | 2013 | | | 2012 | | | 2011 | | | 2010 | | | 2009 | |
| | | | | | | | | | | | | | | | | |
Net asset value, beginning of period | | | $34.56 | | | | $27.09 | | | | $24.35 | | | | $23.68 | | | | $20.76 | | | | $18.92 | |
| Income (loss) from investment operations | | | | | | | | | | | | | | | | | |
Net investment income (d) | | | $0.17 | | | | $0.30 | | | | $0.30 | | | | $0.27 | | | | $0.21 | | | | $0.23 | |
Net realized and unrealized gain
(loss) on investments and
foreign currency | | | 1.85 | | | | 7.58 | | | | 2.85 | | | | 0.55 | | | | 2.94 | | | | 3.08 | |
Total from investment operations | | | $2.02 | | | | $7.88 | | | | $3.15 | | | | $0.82 | | | | $3.15 | | | | $3.31 | |
| Less distributions declared to shareholders | | | | | | | | | | | | | | | | | |
From net investment income | | | $(0.20 | ) | | | $(0.34 | ) | | | $(0.26 | ) | | | $(0.15 | ) | | | $(0.23 | ) | | | $(0.36 | ) |
From net realized gain on
investments | | | (0.32 | ) | | | (0.07 | ) | | | (0.15 | ) | | | — | | | | — | | | | (1.11 | ) |
Total distributions declared to
shareholders | | | $(0.52 | ) | | | $(0.41 | ) | | | $(0.41 | ) | | | $(0.15 | ) | | | $(0.23 | ) | | | $(1.47 | ) |
Net asset value, end of period (x) | | | $36.06 | | | | $34.56 | | | | $27.09 | | | | $24.35 | | | | $23.68 | | | | $20.76 | |
Total return (%) (r)(s)(x) | | | 5.95 | (n) | | | 29.44 | | | | 13.26 | | | | 3.47 | | | | 15.26 | | | | 19.23 | |
Ratios (%) (to average net assets)
and Supplemental data: | | | | | | | | | | | | | | | | | |
Expenses before expense
reductions (f) | | | 0.97 | (a) | | | 1.04 | | | | 1.09 | | | | 1.12 | | | | 1.17 | | | | 1.29 | |
Expenses after expense reductions (f) | | | 0.97 | (a) | | | 1.04 | | | | 1.09 | | | | 1.12 | | | | 1.17 | | | | 1.28 | |
Net investment income | | | 0.96 | (a)(l) | | | 0.98 | | | | 1.18 | | | | 1.08 | | | | 0.96 | | | | 1.33 | |
Portfolio turnover | | | 4 | (n) | | | 11 | | | | 13 | | | | 16 | | | | 26 | | | | 17 | |
Net assets at end of period
(000 omitted) | | | $683,076 | | | | $638,111 | | | | $356,027 | | | | $281,561 | | | | $159,723 | | | | $30,417 | |
See Notes to Financial Statements
18
Financial Highlights – continued
| | | | | | | | | | | | | | | | | | | | | | | | |
| | | Six months
ended
4/30/14 (unaudited) | | | Years ended 10/31 | |
| Class R1 | | | 2013 | | | 2012 | | | 2011 | | | 2010 | | | 2009 | |
| | | | | | | | | | | | | | | | | |
Net asset value, beginning of period | | | $30.76 | | | | $24.13 | | | | $21.67 | | | | $21.16 | | | | $18.61 | | | | $17.02 | |
| Income (loss) from investment operations | | | | | | | | | | | | | | | | | |
Net investment income (loss) (d) | | | $(0.01 | ) | | | $(0.00 | )(w) | | | $0.03 | | | | $0.01 | | | | $(0.02 | ) | | | $0.03 | |
Net realized and unrealized gain
(loss) on investments and
foreign currency | | | 1.66 | | | | 6.76 | | | | 2.59 | | | | 0.50 | | | | 2.64 | | | | 2.78 | |
Total from investment operations | | | $1.65 | | | | $6.76 | | | | $2.62 | | | | $0.51 | | | | $2.62 | | | | $2.81 | |
| Less distributions declared to shareholders | | | | | | | | | | | | | | | | | |
From net investment income | | | $— | | | | $(0.06 | ) | | | $(0.01 | ) | | | $— | | | | $(0.07 | ) | | | $(0.11 | ) |
From net realized gain on
investments | | | (0.32 | ) | | | (0.07 | ) | | | (0.15 | ) | | | — | | | | — | | | | (1.11 | ) |
Total distributions declared to
shareholders | | | $(0.32 | ) | | | $(0.13 | ) | | | $(0.16 | ) | | | $— | | | | $(0.07 | ) | | | $(1.22 | ) |
Net asset value, end of period (x) | | | $32.09 | | | | $30.76 | | | | $24.13 | | | | $21.67 | | | | $21.16 | | | | $18.61 | |
Total return (%) (r)(s)(x) | | | 5.43 | (n) | | | 28.17 | | | | 12.23 | | | | 2.41 | | | | 14.13 | | | | 18.05 | |
Ratios (%) (to average net assets)
and Supplemental data: | | | | | | | | | | | | | | | | | |
Expenses before expense
reductions (f) | | | 1.97 | (a) | | | 2.04 | | | | 2.09 | | | | 2.12 | | | | 2.18 | | | | 2.27 | |
Expenses after expense reductions (f) | | | 1.97 | (a) | | | 2.04 | | | | 2.09 | | | | 2.12 | | | | 2.18 | | | | 2.27 | |
Net investment income (loss) | | | (0.05 | )(a)(l) | | | (0.01 | ) | | | 0.15 | | | | 0.03 | | | | (0.12 | ) | | | 0.22 | |
Portfolio turnover | | | 4 | (n) | | | 11 | | | | 13 | | | | 16 | | | | 26 | | | | 17 | |
Net assets at end of period
(000 omitted) | | | $3,803 | | | | $3,718 | | | | $2,968 | | | | $3,581 | | | | $4,405 | | | | $4,140 | |
See Notes to Financial Statements
19
Financial Highlights – continued
| | | | | | | | | | | | | | | | | | | | | | | | |
| | | Six months
ended
4/30/14 (unaudited) | | | Years ended 10/31 | |
| Class R2 | | | 2013 | | | 2012 | | | 2011 | | | 2010 | | | 2009 | |
| | | | | | | | | | | | | | | | | |
Net asset value, beginning of period | | | $32.81 | | | | $25.76 | | | | $23.16 | | | | $22.55 | | | | $19.78 | | | | $18.06 | |
| Income (loss) from investment operations | | | | | | | | | | | | | | | | | |
Net investment income (d) | | | $0.08 | | | | $0.14 | | | | $0.16 | | | | $0.14 | | | | $0.08 | | | | $0.12 | |
Net realized and unrealized gain
(loss) on investments and
foreign currency | | | 1.76 | | | | 7.21 | | | | 2.73 | | | | 0.51 | | | | 2.83 | | | | 2.94 | |
Total from investment operations | | | $1.84 | | | | $7.35 | | | | $2.89 | | | | $0.65 | | | | $2.91 | | | | $3.06 | |
| Less distributions declared to shareholders | | | | | | | | | | | | | | | | | |
From net investment income | | | $(0.06 | ) | | | $(0.23 | ) | | | $(0.14 | ) | | | $(0.04 | ) | | | $(0.14 | ) | | | $(0.23 | ) |
From net realized gain on
investments | | | (0.32 | ) | | | (0.07 | ) | | | (0.15 | ) | | | — | | | | — | | | | (1.11 | ) |
Total distributions declared to
shareholders | | | $(0.38 | ) | | | $(0.30 | ) | | | $(0.29 | ) | | | $(0.04 | ) | | | $(0.14 | ) | | | $(1.34 | ) |
Net asset value, end of period (x) | | | $34.27 | | | | $32.81 | | | | $25.76 | | | | $23.16 | | | | $22.55 | | | | $19.78 | |
Total return (%) (r)(s)(x) | | | 5.69 | (n) | | | 28.82 | | | | 12.71 | | | | 2.90 | | | | 14.80 | | | | 18.59 | |
Ratios (%) (to average net assets)
and Supplemental data: | | | | | | | | | | | | | | | | | |
Expenses before expense
reductions (f) | | | 1.47 | (a) | | | 1.54 | | | | 1.59 | | | | 1.62 | | | | 1.68 | | | | 1.78 | |
Expenses after expense reductions (f) | | | 1.47 | (a) | | | 1.54 | | | | 1.59 | | | | 1.62 | | | | 1.68 | | | | 1.78 | |
Net investment income | | | 0.46 | (a)(l) | | | 0.48 | | | | 0.65 | | | | 0.58 | | | | 0.37 | | | | 0.74 | |
Portfolio turnover | | | 4 | (n) | | | 11 | | | | 13 | | | | 16 | | | | 26 | | | | 17 | |
Net assets at end of period
(000 omitted) | | | $59,436 | | | | $54,726 | | | | $30,799 | | | | $21,832 | | | | $21,201 | | | | $19,227 | |
See Notes to Financial Statements
20
Financial Highlights – continued
| | | | | | | | | | | | | | | | | | | | | | | | |
| | | Six months
ended
4/30/14 (unaudited) | | | Years ended 10/31 | |
| Class R3 | | | 2013 | | | 2012 | | | 2011 | | | 2010 | | | 2009 | |
| | | | | | | | | | | | | | | | | |
Net asset value, beginning of period | | | $33.55 | | | | $26.32 | | | | $23.66 | | | | $23.02 | | | | $20.20 | | | | $18.41 | |
| Income (loss) from investment operations | | | | | | | | | | | | | | | | | |
Net investment income (d) | | | $0.13 | | | | $0.21 | | | | $0.22 | | | | $0.20 | | | | $0.14 | | | | $0.16 | |
Net realized and unrealized gain
(loss) on investments and
foreign currency | | | 1.79 | | | | 7.37 | | | | 2.79 | | | | 0.54 | | | | 2.87 | | | | 3.02 | |
Total from investment operations | | | $1.92 | | | | $7.58 | | | | $3.01 | | | | $0.74 | | | | $3.01 | | | | $3.18 | |
| Less distributions declared to shareholders | | | | | | | | | | | | | | | | | |
From net investment income | | | $(0.14 | ) | | | $(0.28 | ) | | | $(0.20 | ) | | | $(0.10 | ) | | | $(0.19 | ) | | | $(0.28 | ) |
From net realized gain on
investments | | | (0.32 | ) | | | (0.07 | ) | | | (0.15 | ) | | | — | | | | — | | | | (1.11 | ) |
Total distributions declared to
shareholders | | | $(0.46 | ) | | | $(0.35 | ) | | | $(0.35 | ) | | | $(0.10 | ) | | | $(0.19 | ) | | | $(1.39 | ) |
Net asset value, end of period (x) | | | $35.01 | | | | $33.55 | | | | $26.32 | | | | $23.66 | | | | $23.02 | | | | $20.20 | |
Total return (%) (r)(s)(x) | | | 5.83 | (n) | | | 29.11 | | | | 12.99 | | | | 3.21 | | | | 14.97 | | | | 18.94 | |
Ratios (%) (to average net assets)
and Supplemental data: | | | | | | | | | | | | | | | | | |
Expenses before expense
reductions (f) | | | 1.22 | (a) | | | 1.29 | | | | 1.34 | | | | 1.37 | | | | 1.43 | | | | 1.52 | |
Expenses after expense reductions (f) | | | 1.22 | (a) | | | 1.29 | | | | 1.34 | | | | 1.37 | | | | 1.43 | | | | 1.52 | |
Net investment income | | | 0.76 | (a)(l) | | | 0.67 | | | | 0.91 | | | | 0.83 | | | | 0.65 | | | | 0.96 | |
Portfolio turnover | | | 4 | (n) | | | 11 | | | | 13 | | | | 16 | | | | 26 | | | | 17 | |
Net assets at end of period
(000 omitted) | | | $80,238 | | | | $62,218 | | | | $21,664 | | | | $13,294 | | | | $13,903 | | | | $11,265 | |
See Notes to Financial Statements
21
Financial Highlights – continued
| | | | | | | | | | | | | | | | | | | | | | | | |
| | | Six months
ended
4/30/14 (unaudited) | | | Years ended 10/31 | |
| Class R4 | | | 2013 | | | 2012 | | | 2011 | | | 2010 | | | 2009 | |
| | | | | | | | | | | | | | | | | |
Net asset value, beginning of period | | | $33.87 | | | | $26.55 | | | | $23.88 | | | | $23.22 | | | | $20.37 | | | | $18.56 | |
| Income (loss) from investment operations | | | | | | | | | | | | | | | | | |
Net investment income (d) | | | $0.17 | | | | $0.31 | | | | $0.31 | | | | $0.25 | | | | $0.18 | | | | $0.22 | |
Net realized and unrealized gain
(loss) on investments and
foreign currency | | | 1.81 | | | | 7.42 | | | | 2.77 | | | | 0.56 | | | | 2.90 | | | | 3.03 | |
Total from investment operations | | | $1.98 | | | | $7.73 | | | | $3.08 | | | | $0.81 | | | | $3.08 | | | | $3.25 | |
| Less distributions declared to shareholders | | | | | | | | | | | | | | | | | |
From net investment income | | | $(0.20 | ) | | | $(0.34 | ) | | | $(0.26 | ) | | | $(0.15 | ) | | | $(0.23 | ) | | | $(0.33 | ) |
From net realized gain on
investments | | | (0.32 | ) | | | (0.07 | ) | | | (0.15 | ) | | | — | | | | — | | | | (1.11 | ) |
Total distributions declared to
shareholders | | | $(0.52 | ) | | | $(0.41 | ) | | | $(0.41 | ) | | | $(0.15 | ) | | | $(0.23 | ) | | | $(1.44 | ) |
Net asset value, end of period (x) | | | $35.33 | | | | $33.87 | | | | $26.55 | | | | $23.88 | | | | $23.22 | | | | $20.37 | |
Total return (%) (r)(s)(x) | | | 5.96 | (n) | | | 29.47 | | | | 13.23 | | | | 3.50 | | | | 15.21 | | | | 19.25 | |
Ratios (%) (to average net assets)
and Supplemental data: | | | | | | | | | | | | | | | | | |
Expenses before expense
reductions (f) | | | 0.97 | (a) | | | 1.04 | | | | 1.09 | | | | 1.12 | | | | 1.18 | | | | 1.28 | |
Expenses after expense reductions (f) | | | 0.97 | (a) | | | 1.04 | | | | 1.09 | | | | 1.12 | | | | 1.18 | | | | 1.28 | |
Net investment income | | | 0.97 | (a)(l) | | | 1.02 | | | | 1.23 | | | | 1.04 | | | | 0.85 | | | | 1.25 | |
Portfolio turnover | | | 4 | (n) | | | 11 | | | | 13 | | | | 16 | | | | 26 | | | | 17 | |
Net assets at end of period
(000 omitted) | | | $105,157 | | | | $90,239 | | | | $37,929 | | | | $15,009 | | | | $9,364 | | | | $631 | |
See Notes to Financial Statements
22
Financial Highlights – continued
| | | | | | | | | | | | |
| | | Six months
ended
4/30/14 (unaudited) | | | Years ended 10/31 | |
| Class R5 | | | 2013 | | | 2012 (i) | |
| | | | | | | | |
Net asset value, beginning of period | | | $34.58 | | | | $27.10 | | | | $24.19 | |
| Income (loss) from investment operations | | | | | |
Net investment income (d) | | | $0.21 | | | | $0.08 | | | | $0.05 | |
Net realized and unrealized gain (loss) on investments
and foreign currency | | | 1.82 | | | | 7.81 | | | | 2.86 | |
Total from investment operations | | | $2.03 | | | | $7.89 | | | | $2.91 | |
| Less distributions declared to shareholders | | | | | |
From net investment income | | | $(0.22 | ) | | | $(0.34 | ) | | | $— | |
From net realized gain on investments | | | (0.32 | ) | | | (0.07 | ) | | | — | |
Total distributions declared to shareholders | | | $(0.54 | ) | | | $(0.41 | ) | | | $— | |
Net asset value, end of period (x) | | | $36.07 | | | | $34.58 | | | | $27.10 | |
Total return (%) (r)(s)(x) | | | 5.99 | (n) | | | 29.50 | | | | 12.03 | (n) |
Ratios (%) (to average net assets)
and Supplemental data: | | | | | |
Expenses before expense reductions (f) | | | 0.90 | (a) | | | 0.95 | | | | 1.04 | (a) |
Expenses after expense reductions (f) | | | 0.90 | (a) | | | 0.95 | | | | 1.04 | (a) |
Net investment income | | | 1.23 | (a)(l) | | | 0.24 | | | | 0.50 | (a) |
Portfolio turnover | | | 4 | (n) | | | 11 | | | | 13 | |
Net assets at end of period (000 omitted) | | | $305,825 | | | | $187,343 | | | | $112 | |
| (d) | Per share data is based on average shares outstanding. |
| (f) | Ratios do not reflect reductions from fees paid indirectly, if applicable. |
| (i) | For the period from the class inception, June 1, 2012, through the stated period end. |
| (l) | Recognition of net investment income by the fund may be affected by the timing of the declaration of dividends by companies in which the fund invests and the actual annual net investment income ratio may differ. |
| (r) | Certain expenses have been reduced without which performance would have been lower. |
| (s) | From time to time the fund may receive proceeds from litigation settlements, without which performance would be lower. |
| (t) | Total returns do not include any applicable sales charges. |
| (w) | Per share amount was less than $0.01. |
| (x) | The net asset values per share and total returns have been calculated on net assets which include adjustments made in accordance with U.S. generally accepted accounting principles required at period end for financial reporting purposes. |
See Notes to Financial Statements
23
NOTES TO FINANCIAL STATEMENTS
(unaudited)
(1) Business and Organization
MFS Global Equity Fund (the fund) is a diversified series of MFS Series Trust VI (the trust). The trust is organized as a Massachusetts business trust and is registered under the Investment Company Act of 1940, as amended, as an open-end management investment company.
The fund is an investment company and accordingly follows the investment company accounting and reporting guidance of the Financial Accounting Standards Board (FASB) Accounting Standard Codification Topic 946 Financial Services – Investment Companies.
(2) Significant Accounting Policies
General – The preparation of financial statements in conformity with U.S. generally accepted accounting principles requires management to make estimates and assumptions that affect the reported amounts of assets and liabilities, and disclosure of contingent assets and liabilities at the date of the financial statements and the reported amounts of increases and decreases in net assets from operations during the reporting period. Actual results could differ from those estimates. In the preparation of these financial statements, management has evaluated subsequent events occurring after the date of the fund’s Statement of Assets and Liabilities through the date that the financial statements were issued. The fund invests in foreign securities. Investments in foreign securities are vulnerable to the effects of changes in the relative values of the local currency and the U.S. dollar and to the effects of changes in each country’s legal, political, and economic environment.
In this reporting period, the fund adopted the disclosure provisions of FASB Accounting Standards Update 2011-11 (“ASU 2011-11”), Balance Sheet (Topic 210) – Disclosures about Offsetting Assets and Liabilities along with the related scope clarification provisions of FASB Accounting Standards Update 2013-01 (“ASU 2013-01”) entitled Balance Sheet (Topic 210) – Clarifying the Scope of Disclosures about Offsetting Assets and Liabilities. ASU 2011-11 is intended to enhance disclosures on the offsetting of financial assets and liabilities by requiring entities to disclose both gross and net information about financial instruments and transactions that are either offset in the statement of financial position or subject to an enforceable Master Netting Agreement or similar arrangement. ASU 2013-01 limits the scope of ASU 2011-11’s disclosure requirements on offsetting to financial assets and financial liabilities related to derivatives, repurchase and reverse repurchase agreements, and securities lending and securities borrowing transactions. The disclosures required by ASU 2011-11, to the extent applicable to the fund, have been included in the fund’s Significant Accounting Policies note under the captions for each of the fund’s in-scope financial instruments and transactions.
The fund’s accounting policy with respect to balance sheet offsetting is that, absent an event of default by the counterparty or a termination of the agreement, the ISDA Master Agreement does not result in an offset of reported amounts of financial assets and financial liabilities in the Statement of Assets and Liabilities across transactions between the fund and the applicable counterparty. The fund’s right to setoff may be restricted or prohibited by the bankruptcy or insolvency laws of the particular
24
Notes to Financial Statements (unaudited) – continued
jurisdiction to which a specific master netting agreement counterparty is subject. Balance sheet offsetting disclosures, to the extent applicable to the fund, have been included in the fund’s Significant Accounting Policies note under the captions for each of the fund’s in-scope financial instruments and transactions.
Investment Valuations – Equity securities, including restricted equity securities, are generally valued at the last sale or official closing price as provided by a third-party pricing service on the market or exchange on which they are primarily traded. Equity securities, for which there were no sales reported that day, are generally valued at the last quoted daily bid quotation as provided by a third-party pricing service on the market or exchange on which such securities are primarily traded. Short-term instruments with a maturity at issuance of 60 days or less generally are valued at amortized cost, which approximates market value. Open-end investment companies are generally valued at net asset value per share. Securities and other assets generally valued on the basis of information from a third-party pricing service may also be valued at a broker/dealer bid quotation. Values obtained from third-party pricing services can utilize both transaction data and market information such as yield, quality, coupon rate, maturity, type of issue, trading characteristics, and other market data. The values of foreign securities and other assets and liabilities expressed in foreign currencies are converted to U.S. dollars using the mean of bid and asked prices for rates provided by a third-party pricing service.
The Board of Trustees has delegated primary responsibility for determining or causing to be determined the value of the fund’s investments (including any fair valuation) to the adviser pursuant to valuation policies and procedures approved by the Board. If the adviser determines that reliable market quotations are not readily available, investments are valued at fair value as determined in good faith by the adviser in accordance with such procedures under the oversight of the Board of Trustees. Under the fund’s valuation policies and procedures, market quotations are not considered to be readily available for most types of debt instruments and floating rate loans and many types of derivatives. These investments are generally valued at fair value based on information from third-party pricing services. In addition, investments may be valued at fair value if the adviser determines that an investment’s value has been materially affected by events occurring after the close of the exchange or market on which the investment is principally traded (such as foreign exchange or market) and prior to the determination of the fund’s net asset value, or after the halting of trading of a specific security where trading does not resume prior to the close of the exchange or market on which the security is principally traded. Events that occur on a frequent basis after foreign markets close (such as developments in foreign markets and significant movements in the U.S. markets) and prior to the determination of the fund’s net asset value may be deemed to have a material effect on the value of securities traded in foreign markets. Accordingly, the fund’s foreign equity securities may often be valued at fair value. The adviser generally relies on third-party pricing services or other information (such as the correlation with price movements of similar securities in the same or other markets; the type, cost and investment characteristics of the security; the business and financial condition of the issuer; and trading and other market data) to assist in determining whether to fair value and at what value to fair value an investment. The value of an investment for purposes of calculating the fund’s net asset value can differ depending
25
Notes to Financial Statements (unaudited) – continued
on the source and method used to determine value. When fair valuation is used, the value of an investment used to determine the fund’s net asset value may differ from quoted or published prices for the same investment. There can be no assurance that the fund could obtain the fair value assigned to an investment if it were to sell the investment at the same time at which the fund determines its net asset value per share.
Various inputs are used in determining the value of the fund’s assets or liabilities. These inputs are categorized into three broad levels. In certain cases, the inputs used to measure fair value may fall into different levels of the fair value hierarchy. In such cases, an investment’s level within the fair value hierarchy is based on the lowest level of input that is significant to the fair value measurement. The fund’s assessment of the significance of a particular input to the fair value measurement in its entirety requires judgment, and considers factors specific to the investment. Level 1 includes unadjusted quoted prices in active markets for identical assets or liabilities. Level 2 includes other significant observable market-based inputs (including quoted prices for similar securities, interest rates, prepayment speed, and credit risk). Level 3 includes unobservable inputs, which may include the adviser’s own assumptions in determining the fair value of investments. The following is a summary of the levels used as of April 30, 2014 in valuing the fund’s assets or liabilities:
| | | | | | | | | | | | | | | | |
| Investments at Value | | Level 1 | | | Level 2 | | | Level 3 | | | Total | |
| Equity Securities: | | | | | | | | | | | | | | | | |
United States | | | $1,001,668,848 | | | | $— | | | | $— | | | | $1,001,668,848 | |
United Kingdom | | | 197,877,020 | | | | — | | | | — | | | | 197,877,020 | |
France | | | 175,414,568 | | | | — | | | | — | | | | 175,414,568 | |
Switzerland | | | 166,099,690 | | | | — | | | | — | | | | 166,099,690 | |
Germany | | | 156,161,307 | | | | — | | | | — | | | | 156,161,307 | |
Netherlands | | | 57,781,019 | | | | — | | | | — | | | | 57,781,019 | |
Canada | | | 35,247,075 | | | | — | | | | — | | | | 35,247,075 | |
Japan | | | 30,430,493 | | | | 1,963,988 | | | | — | | | | 32,394,481 | |
Sweden | | | 17,224,332 | | | | — | | | | — | | | | 17,224,332 | |
Other Countries | | | 79,025,811 | | | | 26,580,463 | | | | — | | | | 105,606,274 | |
| Mutual Funds | | | 75,957,129 | | | | — | | | | — | | | | 75,957,129 | |
| Total Investments | | | $1,992,887,292 | | | | $28,544,451 | | | | $— | | | | $2,021,431,743 | |
For further information regarding security characteristics, see the Portfolio of Investments.
Of the level 2 investments presented above, equity investments amounting to $21,920,081 would have been considered level 1 investments at the beginning of the period. The primary reason for changes in the classifications between levels 1 and 2 occurs when foreign equity securities are fair valued using other observable market-based inputs in place of the closing exchange price due to events occurring after the close of the exchange or market on which the investment is principally traded. The fund’s foreign equity securities may often be valued at fair value. The fund’s policy is to recognize transfers between the levels as of the end of the period.
Foreign Currency Translation – Purchases and sales of foreign investments, income, and expenses are converted into U.S. dollars based upon currency exchange rates prevailing on the respective dates of such transactions or on the reporting date for
26
Notes to Financial Statements (unaudited) – continued
foreign denominated receivables and payables. Gains and losses attributable to foreign currency exchange rates on sales of securities are recorded for financial statement purposes as net realized gains and losses on investments. Gains and losses attributable to foreign exchange rate movements on receivables, payables, income and expenses are recorded for financial statement purposes as foreign currency transaction gains and losses. That portion of both realized and unrealized gains and losses on investments that results from fluctuations in foreign currency exchange rates is not separately disclosed.
Security Loans – Under its Securities Lending Agency Agreement with the fund, JPMorgan Chase and Co. (“Chase”), as lending agent, loans the securities of the fund to certain qualified institutions (the “Borrowers”) approved by the fund. The loans are collateralized by cash and/or U.S. Treasury and federal agency obligations in an amount typically at least equal to the market value of the securities loaned. The market value of the loaned securities is determined at the close of business of the fund and any additional required collateral is delivered to the fund on the next business day. Chase provides the fund with indemnification against Borrower default. In the event of Borrower default, Chase will for the benefit of the fund either purchase securities identical to those loaned or, when such purchase is commercially impracticable, pay the fund the market value of the loaned securities. In return, Chase assumes the fund’s rights to the related collateral. If the collateral value is less than the cost to purchase identical securities, Chase is responsible for the shortfall, but only to the extent that such shortfall is not due to a decline in collateral value resulting from collateral reinvestment for which the fund bears the risk of loss. On loans collateralized by cash, the cash collateral is invested in a money market fund or short-term securities. At period end, the fund had investment securities on loan with a fair value of $54,526,909 and a related liability of $56,887,170 for collateral received on securities loaned, both of which are presented gross on the Statement of Assets and Liabilities. The liability for collateral for securities loaned is carried at fair value, which is categorized as level 2 within the fair value hierarchy. The collateral received on securities loaned exceeded the value of securities on loan at period end. A portion of the income generated upon investment of the collateral is remitted to the Borrowers, and the remainder is allocated between the fund and the lending agent. On loans collateralized by U.S. Treasury and/or federal agency obligations, a fee is received from the Borrower, and is allocated between the fund and the lending agent. Income from securities lending is included in “Interest” income in the Statement of Operations. The dividend and interest income earned on the securities loaned is accounted for in the same manner as other dividend and interest income.
Indemnifications – Under the fund’s organizational documents, its officers and Trustees may be indemnified against certain liabilities and expenses arising out of the performance of their duties to the fund. Additionally, in the normal course of business, the fund enters into agreements with service providers that may contain indemnification clauses. The fund’s maximum exposure under these agreements is unknown as this would involve future claims that may be made against the fund that have not yet occurred.
Investment Transactions and Income – Investment transactions are recorded on the trade date. Interest income is recorded on the accrual basis. Dividends received in cash
27
Notes to Financial Statements (unaudited) – continued
are recorded on the ex-dividend date. Certain dividends from foreign securities will be recorded when the fund is informed of the dividend if such information is obtained subsequent to the ex-dividend date. Dividend and interest payments received in additional securities are recorded on the ex-dividend or ex-interest date in an amount equal to the value of the security on such date.
The fund may receive proceeds from litigation settlements. Any proceeds received from litigation involving portfolio holdings are reflected in the Statement of Operations in realized gain/loss if the security has been disposed of by the fund or in unrealized gain/loss if the security is still held by the fund. Any other proceeds from litigation not related to portfolio holdings are reflected as other income in the Statement of Operations.
Fees Paid Indirectly – The fund’s custody fee may be reduced according to an arrangement that measures the value of cash deposited with the custodian by the fund. This amount, for the six months ended April 30, 2014, is shown as a reduction of total expenses in the Statement of Operations.
Tax Matters and Distributions – The fund intends to qualify as a regulated investment company, as defined under Subchapter M of the Internal Revenue Code, and to distribute all of its taxable income, including realized capital gains. As a result, no provision for federal income tax is required. The fund’s federal tax returns, when filed, will remain subject to examination by the Internal Revenue Service for a three year period. Management has analyzed the fund’s tax positions taken on federal and state tax returns for all open tax years and does not believe that there are any uncertain tax positions that require recognition of a tax liability. Foreign taxes, if any, have been accrued by the fund in the accompanying financial statements in accordance with the applicable foreign tax law. Foreign income taxes may be withheld by certain countries in which the fund invests. Additionally, capital gains realized by the fund on securities issued in or by certain foreign countries may be subject to capital gains tax imposed by those countries.
Distributions to shareholders are recorded on the ex-dividend date. Income and capital gain distributions are determined in accordance with income tax regulations, which may differ from U.S. generally accepted accounting principles. Certain capital accounts in the financial statements are periodically adjusted for permanent differences in order to reflect their tax character. These adjustments have no impact on net assets or net asset value per share. Temporary differences which arise from recognizing certain items of income, expense, gain or loss in different periods for financial statement and tax purposes will reverse at some time in the future. Distributions in excess of net investment income or net realized gains are temporary overdistributions for financial statement purposes resulting from differences in the recognition or classification of income or distributions for financial statement and tax purposes.
Book/tax differences primarily relate to wash sale loss deferrals and treating a portion of the proceeds from redemptions as a distribution for tax purposes.
28
Notes to Financial Statements (unaudited) – continued
The tax character of distributions made during the current period will be determined at fiscal year end. The tax character of distributions declared to shareholders for the last fiscal year is as follows:
| | | | |
| | | 10/31/13 | |
Ordinary income (including any
short-term capital gains) | | | $10,338,577 | |
| Long-term capital gain | | | 1,517,982 | |
| Total distributions | | | $11,856,559 | |
The federal tax cost and the tax basis components of distributable earnings were as follows:
| | | | |
| As of 4/30/14 | | | |
| Cost of investments | | | $1,501,078,548 | |
| Gross appreciation | | | 529,956,010 | |
| Gross depreciation | | | (9,602,815 | ) |
| Net unrealized appreciation (depreciation) | | | $520,353,195 | |
| |
| As of 10/31/13 | | | |
| Undistributed ordinary income | | | 10,657,387 | |
| Undistributed long-term capital gain | | | 12,588,989 | |
| Other temporary differences | | | (40,813 | ) |
| Net unrealized appreciation (depreciation) | | | 428,900,808 | |
The aggregate cost above includes prior fiscal year end tax adjustments, if applicable.
Multiple Classes of Shares of Beneficial Interest – The fund offers multiple classes of shares, which differ in their respective distribution and service fees. The fund’s income, realized and unrealized gain (loss), and common expenses are allocated to shareholders based on the daily net assets of each class. Dividends are declared separately for each class. Differences in per share dividend rates are generally due to differences in separate class expenses. Class B shares will convert to Class A shares approximately eight years after purchase. The fund’s distributions declared to shareholders as reported in the Statements of Changes in Net Assets are presented by class as follows:
| | | | | | | | | | | | | | | | |
| | | From net investment
income | | | From net realized gain on
investments | |
| | | Six months
ended
4/30/14 | | | Year
ended
10/31/13 | | | Six months
ended
4/30/14 | | | Year
ended
10/31/13 | |
| Class A | | | $2,004,335 | | | | $3,594,377 | | | | $4,940,234 | | | | $944,700 | |
| Class B | | | — | | | | 59,127 | | | | 254,927 | | | | 53,481 | |
| Class C | | | — | | | | 140,166 | | | | 855,561 | | | | 95,739 | |
| Class I | | | 3,750,145 | | | | 4,676,953 | | | | 6,042,276 | | | | 997,993 | |
| Class R1 | | | — | | | | 7,441 | | | | 38,715 | | | | 8,269 | |
| Class R2 | | | 100,419 | | | | 295,466 | | | | 534,211 | | | | 91,145 | |
| Class R3 | | | 274,464 | | | | 230,880 | | | | 611,539 | | | | 59,378 | |
| Class R4 | | | 548,426 | | | | 494,284 | | | | 874,936 | | | | 105,442 | |
| Class R5 | | | 1,194,210 | | | | 1,422 | | | | 1,724,003 | | | | 296 | |
| Total | | | $7,871,999 | | | | $9,500,116 | | | | $15,876,402 | | | | $2,356,443 | |
29
Notes to Financial Statements (unaudited) – continued
(3) Transactions with Affiliates
Investment Adviser – The fund has an investment advisory agreement with MFS to provide overall investment management and related administrative services and facilities to the fund. The management fee is computed daily and paid monthly at the following annual rates:
| | | | |
| First $1 billion of average daily net assets | | | 0.90 | % |
| Next $1 billion of average daily net assets | | | 0.75 | % |
| Average daily net assets in excess of $2 billion | | | 0.65 | % |
MFS has agreed in writing to reduce its management fee by a specified amount if certain MFS mutual fund assets exceed thresholds agreed to by MFS and the fund’s Board of Trustees. For the six months ended April 30, 2014, this management fee reduction amounted to $26,465, which is included in the reduction of total expenses in the Statement of Operations. The management fee incurred for the six months ended April 30, 2014 was equivalent to an annual effective rate of 0.83% of the fund’s average daily net assets.
Distributor – MFS Fund Distributors, Inc. (MFD), a wholly-owned subsidiary of MFS, as distributor, received $202,391 for the six months ended April 30, 2014, as its portion of the initial sales charge on sales of Class A shares of the fund.
The Board of Trustees has adopted a distribution plan for certain share classes pursuant to Rule 12b-1 of the Investment Company Act of 1940.
The fund’s distribution plan provides that the fund will pay MFD for services provided by MFD and financial intermediaries in connection with the distribution and servicing of certain share classes. One component of the plan is a distribution fee paid to MFD and another component of the plan is a service fee paid to MFD. MFD may subsequently pay all, or a portion, of the distribution and/or service fees to financial intermediaries.
Distribution Plan Fee Table:
| | | | | | | | | | | | | | | | | | | | |
| | | Distribution
Fee Rate (d) | | | Service
Fee Rate (d) | | | Total
Distribution
Plan (d) | | | Annual
Effective
Rate (e) | | | Distribution
and Service
Fee | |
| Class A | | | — | | | | 0.25% | | | | 0.25% | | | | 0.25% | | | | $677,993 | |
| Class B | | | 0.75% | | | | 0.25% | | | | 1.00% | | | | 1.00% | | | | 126,855 | |
| Class C | | | 0.75% | | | | 0.25% | | | | 1.00% | | | | 1.00% | | | | 439,961 | |
| Class R1 | | | 0.75% | | | | 0.25% | | | | 1.00% | | | | 1.00% | | | | 18,465 | |
| Class R2 | | | 0.25% | | | | 0.25% | | | | 0.50% | | | | 0.50% | | | | 140,340 | |
| Class R3 | | | — | | | | 0.25% | | | | 0.25% | | | | 0.25% | | | | 87,461 | |
| Total Distribution and Service Fees | | | | $1,491,075 | |
| (d) | In accordance with the distribution plan for certain classes, the fund pays distribution and/or service fees equal to these annual percentage rates of each class’s average daily net assets. The distribution and service fee rates disclosed by class represent the current rates in effect at the end of the reporting period. Any rate changes, if applicable, are detailed below. |
| (e) | The annual effective rates represent actual fees incurred under the distribution plan for the six months ended April 30, 2014 based on each class’s average daily net assets. MFD has voluntarily agreed to rebate a portion of each class’s 0.25% service fee attributable to accounts for which MFD retains the 0.25% service fee except for accounts attributable to MFS or its affiliates’ seed money. For the six months ended April 30, 2014, this rebate amounted to $10,636, $225, $157, and $169 for Class A, Class B, Class C, and Class R3, respectively, and is included in the reduction of total expenses in the Statement of Operations. |
30
Notes to Financial Statements (unaudited) – continued
Certain Class A shares are subject to a contingent deferred sales charge (CDSC) in the event of a shareholder redemption within 18 months of purchase for shares purchased on or after August 1, 2012, and within 24 months of purchase for shares purchased prior to August 1, 2012. Class C shares are subject to a CDSC in the event of a shareholder redemption within 12 months of purchase. Class B shares are subject to a CDSC in the event of a shareholder redemption within six years of purchase. All contingent deferred sales charges are paid to MFD and during the six months ended April 30, 2014, were as follows:
| | | | |
| | | Amount | |
| Class A | | | $5,086 | |
| Class B | | | 9,151 | |
| Class C | | | 11,305 | |
Shareholder Servicing Agent – MFS Service Center, Inc. (MFSC), a wholly-owned subsidiary of MFS, receives a fee from the fund for its services as shareholder servicing agent calculated as a percentage of the average daily net assets of the fund as determined periodically under the supervision of the fund’s Board of Trustees. For the six months ended April 30, 2014, the fee was $130,948, which equated to 0.0147% annually of the fund’s average daily net assets. MFSC also receives payment from the fund for out-of-pocket expenses, sub-accounting and other shareholder servicing costs which may be paid to affiliated and unaffiliated service providers. Class R5 shares do not incur sub-accounting fees. For the six months ended April 30, 2014, these out-of-pocket expenses, sub-accounting and other shareholder servicing costs amounted to $585,654.
Administrator – MFS provides certain financial, legal, shareholder communications, compliance, and other administrative services to the fund. Under an administrative services agreement, the fund partially reimburses MFS the costs incurred to provide these services. The fund is charged an annual fixed amount of $17,500 plus a fee based on average daily net assets. The administrative services fee incurred for the six months ended April 30, 2014 was equivalent to an annual effective rate of 0.0122% of the fund’s average daily net assets.
Trustees’ and Officers’ Compensation – The fund pays compensation to independent Trustees in the form of a retainer, attendance fees, and additional compensation to Board and Committee chairpersons. The fund does not pay compensation directly to Trustees or officers of the fund who are also officers of the investment adviser, all of whom receive remuneration for their services to the fund from MFS. Certain officers and Trustees of the fund are officers or directors of MFS, MFD, and MFSC.
Prior to December 31, 2001, the fund had an unfunded defined benefit plan (“DB plan”) for independent Trustees. As of December 31, 2001, the Board took action to terminate the DB plan with respect to then-current and any future independent Trustees, such that the DB plan covers only certain of those former independent Trustees who retired on or before December 31, 2001. Effective January 1, 2002, accrued benefits under the DB plan for then-current independent Trustees who continued were credited to an unfunded retirement deferral plan (the “Retirement Deferral plan”), which was established for and exists solely with respect to these
31
Notes to Financial Statements (unaudited) – continued
credited amounts, and is not available for other deferrals by these or other independent Trustees. Although the Retirement Deferral plan is unfunded, amounts deferred under the plan are periodically adjusted for investment experience as if they had been invested in shares of the fund. The DB plan resulted in a pension expense of $494 and the Retirement Deferral plan resulted in an expense of $1,409. Both amounts are included in independent Trustees’ compensation for the six months ended April 30, 2014. The liability for deferred retirement benefits payable to certain independent Trustees under both plans amounted to $11,480 at April 30, 2014, and is included in “Payable for independent Trustees’ compensation” in the Statement of Assets and Liabilities.
Other – This fund and certain other funds managed by MFS (the funds) have entered into services agreements (the Agreements) which provide for payment of fees by the funds to Tarantino LLC and Griffin Compliance LLC in return for the provision of services of an Independent Chief Compliance Officer (ICCO) and Assistant ICCO, respectively, for the funds. The ICCO and Assistant ICCO are officers of the funds and the sole members of Tarantino LLC and Griffin Compliance LLC, respectively. The funds can terminate the Agreements with Tarantino LLC and Griffin Compliance LLC at any time under the terms of the Agreements. For the six months ended April 30, 2014, the aggregate fees paid by the fund to Tarantino LLC and Griffin Compliance LLC were $5,684 and are included in “Miscellaneous” expense in the Statement of Operations. MFS has agreed to reimburse the fund for a portion of the payments made by the fund in the amount of $1,306, which is included in the reduction of total expenses in the Statement of Operations. Additionally, MFS has agreed to bear all expenses associated with office space, other administrative support, and supplies provided to the ICCO and Assistant ICCO.
The fund invests in the MFS Institutional Money Market Portfolio which is managed by MFS and seeks current income consistent with preservation of capital and liquidity. Income earned on this investment is included in “Dividends from underlying affiliated funds” in the Statement of Operations. This money market fund does not pay a management fee to MFS.
(4) Portfolio Securities
Purchases and sales of investments, other than short-term obligations, aggregated $189,934,820 and $78,924,562, respectively.
32
Notes to Financial Statements (unaudited) – continued
(5) Shares of Beneficial Interest
The fund’s Declaration of Trust permits the Trustees to issue an unlimited number of full and fractional shares of beneficial interest. Transactions in fund shares were as follows:
| | | | | | | | | | | | | | | | |
| | | Six months ended
4/30/14 | | | Year ended
10/31/13 | |
| | | Shares | | | Amount | | | Shares | | | Amount | |
| Shares sold | | | | | | | | | | | | | | | | |
Class A | | | 2,750,183 | | | | $94,351,345 | | | | 5,417,195 | | | | $164,047,168 | |
Class B | | | 107,366 | | | | 3,423,483 | | | | 219,395 | | | | 6,285,361 | |
Class C | | | 941,137 | | | | 28,886,593 | | | | 1,403,229 | | | | 39,165,752 | |
Class I | | | 3,105,059 | | | | 108,995,824 | | | | 12,235,113 | | | | 380,190,522 | |
Class R1 | | | 9,924 | | | | 311,636 | | | | 33,283 | | | | 916,330 | |
Class R2 | | | 245,187 | | | | 8,206,752 | | | | 809,948 | | | | 23,603,271 | |
Class R3 | | | 761,877 | | | | 25,852,695 | | | | 1,444,356 | | | | 44,047,519 | |
Class R4 | | | 588,493 | | | | 20,288,079 | | | | 2,036,371 | | | | 61,711,437 | |
Class R5 | | | 3,454,504 | | | | 119,382,242 | | | | 5,514,585 | | | | 183,266,071 | |
| | | 11,963,730 | | | | $409,698,649 | | | | 29,113,475 | | | | $903,233,431 | |
| | | | |
| Shares issued to shareholders in reinvestment of distributions | | | | | | | | | | | | | | | | |
Class A | | | 189,505 | | | | $6,263,145 | | | | 151,060 | | | | $4,123,932 | |
Class B | | | 7,859 | | | | 242,225 | | | | 4,184 | | | | 106,995 | |
Class C | | | 22,188 | | | | 657,882 | | | | 7,988 | | | | 196,595 | |
Class I | | | 257,058 | | | | 8,688,558 | | | | 182,329 | | | | 5,085,164 | |
Class R1 | | | 1,282 | | | | 38,715 | | | | 627 | | | | 15,710 | |
Class R2 | | | 18,364 | | | | 590,957 | | | | 14,036 | | | | 373,346 | |
Class R3 | | | 26,979 | | | | 886,003 | | | | 10,695 | | | | 290,258 | |
Class R4 | | | 42,989 | | | | 1,423,362 | | | | 21,936 | | | | 599,726 | |
Class R5 | | | 86,338 | | | | 2,918,213 | | | | 62 | | | | 1,718 | |
| | | 652,562 | | | | $21,709,060 | | | | 392,917 | | | | $10,793,444 | |
| | | | |
| Shares reacquired | | | | | | | | | | | | | | | | |
Class A | | | (1,460,550 | ) | | | $(50,150,140 | ) | | | (3,382,547 | ) | | | $(100,243,459 | ) |
Class B | | | (95,849 | ) | | | (3,072,817 | ) | | | (209,463 | ) | | | (5,847,864 | ) |
Class C | | | (183,048 | ) | | | (5,605,958 | ) | | | (298,063 | ) | | | (8,086,384 | ) |
Class I | | | (2,884,924 | ) | | | (102,122,675 | ) | | | (7,096,963 | ) | | | (233,248,932 | ) |
Class R1 | | | (13,551 | ) | | | (421,606 | ) | | | (36,062 | ) | | | (987,166 | ) |
Class R2 | | | (197,274 | ) | | | (6,561,572 | ) | | | (351,451 | ) | | | (10,213,477 | ) |
Class R3 | | | (351,358 | ) | | | (11,968,834 | ) | | | (423,628 | ) | | | (12,878,899 | ) |
Class R4 | | | (319,325 | ) | | | (11,007,536 | ) | | | (822,218 | ) | | | (25,950,034 | ) |
Class R5 | | | (480,079 | ) | | | (16,702,963 | ) | | | (101,286 | ) | | | (3,284,124 | ) |
| | | (5,985,958 | ) | | | $(207,614,101 | ) | | | (12,721,681 | ) | | | $(400,740,339 | ) |
33
Notes to Financial Statements (unaudited) – continued
| | | | | | | | | | | | | | | | |
| | | Six months ended
4/30/14 | | | Year ended
10/31/13 | |
| | | Shares | | | Amount | | | Shares | | | Amount | |
| Net change | | | | | | | | | | | | | | | | |
Class A | | | 1,479,138 | | | | $50,464,350 | | | | 2,185,708 | | | | $67,927,641 | |
Class B | | | 19,376 | | | | 592,891 | | | | 14,116 | | | | 544,492 | |
Class C | | | 780,277 | | | | 23,938,517 | | | | 1,113,154 | | | | 31,275,963 | |
Class I | | | 477,193 | | | | 15,561,707 | | | | 5,320,479 | | | | 152,026,754 | |
Class R1 | | | (2,345 | ) | | | (71,255 | ) | | | (2,152 | ) | | | (55,126 | ) |
Class R2 | | | 66,277 | | | | 2,236,137 | | | | 472,533 | | | | 13,763,140 | |
Class R3 | | | 437,498 | | | | 14,769,864 | | | | 1,031,423 | | | | 31,458,878 | |
Class R4 | | | 312,157 | | | | 10,703,905 | | | | 1,236,089 | | | | 36,361,129 | |
Class R5 | | | 3,060,763 | | | | 105,597,492 | | | | 5,413,361 | | | | 179,983,665 | |
| | | 6,630,334 | | | | $223,793,608 | | | | 16,784,711 | | | | $513,286,536 | |
(6) Line of Credit
The fund and certain other funds managed by MFS participate in a $1.1 billion unsecured committed line of credit, subject to a $1 billion sublimit, provided by a syndication of banks under a credit agreement. Borrowings may be made for temporary financing needs. Interest is charged to each fund, based on its borrowings, generally at a rate equal to the higher of the Federal Reserve funds rate or one month LIBOR plus an agreed upon spread. A commitment fee, based on the average daily, unused portion of the committed line of credit, is allocated among the participating funds at the end of each calendar quarter. In addition, the fund and other funds managed by MFS have established unsecured uncommitted borrowing arrangements with certain banks for temporary financing needs. Interest is charged to each fund, based on its borrowings, at a rate equal to the Federal Reserve funds rate plus an agreed upon spread. For the six months ended April 30, 2014, the fund’s commitment fee and interest expense were $3,289 and $0, respectively, and are included in “Miscellaneous” expense in the Statement of Operations.
(7) Transactions in Underlying Affiliated Funds-Affiliated Issuers
An affiliated issuer may be considered one in which the fund owns 5% or more of the outstanding voting securities, or a company which is under common control. For the purposes of this report, the fund assumes the following to be an affiliated issuer:
| | | | | | | | | | | | | | | | |
| Underlying Affiliated Fund | | Beginning
Shares/Par
Amount | | | Acquisitions
Shares/Par
Amount | | | Dispositions
Shares/Par
Amount | | | Ending
Shares/Par
Amount | |
MFS Institutional Money
Market Portfolio | | | 20,403,361 | | | | 158,197,605 | | | | (159,531,007 | ) | | | 19,069,959 | |
| | | | |
| Underlying Affiliated Fund | | Realized
Gain (Loss) | | | Capital Gain
Distributions | | | Dividend
Income | | | Ending
Value | |
MFS Institutional Money
Market Portfolio | | | $— | | | | $— | | | | $12,137 | | | | $19,069,959 | |
34
BOARD REVIEW OF INVESTMENT ADVISORY AGREEMENT
A discussion regarding the Board’s most recent review and renewal of the fund’s Investment Advisory Agreement with MFS is available by clicking on the fund’s name under “Mutual Funds” in the “Products” section of the MFS Web site (mfs.com).
PROXY VOTING POLICIES AND INFORMATION
MFS votes proxies on behalf of the fund pursuant to proxy voting policies and procedures that are available without charge, upon request, by calling 1-800-225-2606, by visiting the Proxy Voting section of mfs.com or by visiting the SEC’s Web site at http://www.sec.gov.
Information regarding how the fund voted proxies relating to portfolio securities during the twelve-month period ended June 30, 2013 is available without charge by visiting the Proxy Voting section of mfs.com or by visiting the SEC’s Web site at http://www.sec.gov.
QUARTERLY PORTFOLIO DISCLOSURE
The fund will file a complete schedule of portfolio holdings with the Securities and Exchange Commission (the Commission) for the first and third quarters of each fiscal year on Form N-Q. A shareholder can obtain the quarterly portfolio holdings report at mfs.com. The fund’s Form N-Q is also available on the EDGAR database on the Commission’s Internet Web site at http://www.sec.gov, and may be reviewed and copied at the:
Public Reference Room
Securities and Exchange Commission
100 F Street, NE, Room 1580
Washington, D.C. 20549
Information on the operation of the Public Reference Room may be obtained by calling the Commission at 1-800-SEC-0330. Copies of the fund’s Form N-Q also may be obtained, upon payment of a duplicating fee, by electronic request at the following e-mail address: publicinfo@sec.gov, or by writing the Public Reference Section at the above address.
FURTHER INFORMATION
From time to time, MFS may post important information about the fund or the MFS funds on the MFS web site (mfs.com). This information is available by visiting the “Commentary & Announcements” and “Market Outlooks” sections of mfs.com or by clicking on the fund’s name under “Mutual Funds” in the “Products” section of mfs.com.
PROVISION OF FINANCIAL REPORTS AND SUMMARY PROSPECTUSES
The fund produces financial reports every six months and updates its summary prospectus and prospectus annually. To avoid sending duplicate copies of materials to households, only one copy of the fund’s annual and semiannual report and summary prospectus may be mailed to shareholders having the same last name and residential address on the fund’s records. However, any shareholder may contact MFSC (please see back cover for address and telephone number) to request that copies of these reports and summary prospectuses be sent personally to that shareholder.
35
Save paper with eDelivery.

| MFS® will send you prospectuses, |
reports, and proxies directly via e-mail so you will get information faster with less mailbox clutter.
To sign up:
1. Go to mfs.com.
2. Log in via MFS® Access.
3. Select eDelivery.
If you own your MFS fund shares through a financial institution or a retirement plan, MFS® TALK, MFS® Access, or eDelivery may not be available to you.
CONTACT
WEB SITE
mfs.com
MFS TALK
1-800-637-8255
24 hours a day
ACCOUNT SERVICE AND LITERATURE
Shareholders
1-800-225-2606
Financial advisors
1-800-343-2829
Retirement plan services
1-800-637-1255
MAILING ADDRESS
MFS Service Center, Inc.
P.O. Box 55824
Boston, MA 02205-5824
OVERNIGHT MAIL
MFS Service Center, Inc.
c/o Boston Financial Data Services
30 Dan Road
Canton, MA 02021-2809
SEMIANNUAL REPORT
April 30, 2014

MFS® UTILITIES FUND

MMU-SEM
MFS® UTILITIES FUND
CONTENTS
The report is prepared for the general information of shareholders. It is authorized for distribution to prospective investors only when preceded or accompanied by a current prospectus.
NOT FDIC INSURED Ÿ MAY LOSE VALUE Ÿ NO BANK GUARANTEE

LETTER FROM THE CHAIRMAN AND CEO
Dear Shareholders:
After gaining momentum late last year, the U.S. economy slipped this winter, as severe weather curtailed activity. More recently, however, labor market data, consumer
confidence, retail sales and industrial output have indicated that the U.S. economy could be regaining traction.
Europe emerged from its recession midway through 2013. However, its pace of growth has been slow, high unemployment persists and the risk of deflation exists. Asia remains vulnerable. China’s economic growth has slowed, and Japan’s early progress toward an economic turnaround continues to face obstacles. Emerging markets have also displayed much higher volatility, affected by the early transition from aggressive central bank monetary easing.
With so much uncertainty, global financial markets began 2014 with much greater volatility than last year’s broad-based rally. For equity investors, attention to company fundamentals has taken on more importance. Bond investors have been attuned to heightened risks from possible interest rate increases.
As always at MFS®, active risk management is an integral part of how we manage your investments. We use a collaborative process, sharing insights across asset classes, regions and economic sectors. Our global team of investment professionals uses a multidisciplined, long-term, diversified investment approach.
We understand that these are challenging economic times. We believe that we can serve you best by applying proven principles, such as asset allocation and diversification, over the long term. We are confident that this approach can serve you well as you work with your financial advisors to reach your goals in the years ahead.
Respectfully,

Robert J. Manning
Chairman and Chief Executive Officer
MFS Investment Management
June 13, 2014
The opinions expressed in this letter are subject to change, may not be relied upon for investment advice, and no forecasts can be guaranteed.
1
PORTFOLIO COMPOSITION
Portfolio structure (i)
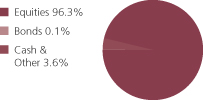
| | | | |
| Top ten holdings (i) | | | | |
| Comcast Corp., “Special A” | | | 3.6% | |
| Energias de Portugal S.A. | | | 3.1% | |
| NRG Energy, Inc. | | | 3.0% | |
| Calpine Corp. | | | 2.8% | |
| NextEra Energy, Inc. | | | 2.8% | |
| CMS Energy Corp. | | | 2.6% | |
| Kinder Morgan, Inc. | | | 2.3% | |
| Northeast Utilities | | | 1.9% | |
| EDP Renovaveis S.A. | | | 1.9% | |
| Public Service Enterprise Group, Inc. | | | 1.8% | |
| | | | |
| Top five industries (i) | | | | |
| Utilities-Electric Power | | | 48.2% | |
| Natural Gas-Pipeline | | | 11.4% | |
| Cable TV | | | 8.7% | |
Telephone Services | | | 7.8% | |
| Natural Gas-Distribution | | | 7.2% | |
|
| Issuer country weightings (i)(x) | |
| United States | | | 68.9% | |
| Portugal | | | 4.9% | |
| Brazil | | | 4.6% | |
| United Kingdom | | | 3.5% | |
| Spain | | | 3.0% | |
| Canada | | | 2.4% | |
| Italy | | | 1.8% | |
| Russia | | | 1.5% | |
| Israel | | | 1.4% | |
| Other Countries | | | 8.0% | |
| (i) | For purposes of this presentation, the components include the market value of securities, and reflect the impact of the equivalent exposure of derivative positions, if any. These amounts may be negative from time to time. Equivalent exposure is a calculated amount that translates the derivative position into a reasonable approximation of the amount of the underlying asset that the portfolio would have to hold at a given point in time to have the same price sensitivity that results from the portfolio’s ownership of the derivative contract. When dealing with derivatives, equivalent exposure is a more representative measure of the potential impact of a position on portfolio performance than market value. The bond component will include any accrued interest amounts. |
| (x) | Represents the portfolio’s exposure to issuer countries as a percentage of a portfolio’s net assets. For purposes of this presentation, United States includes Cash & Other. |
Where the fund holds convertible bonds, these are treated as part of the equity portion of the portfolio.
Percentages are based on net assets as of 4/30/14.
The portfolio is actively managed and current holdings may be different.
2
EXPENSE TABLE
Fund expenses borne by the shareholders during the period, November 1, 2013 through April 30, 2014
As a shareholder of the fund, you incur two types of costs: (1) transaction costs, including sales charges (loads) on certain purchase or redemption payments, and (2) ongoing costs, including management fees; distribution and service (12b-1) fees; and other fund expenses. This example is intended to help you understand your ongoing costs (in dollars) of investing in the fund and to compare these costs with the ongoing costs of investing in other mutual funds.
The example is based on an investment of $1,000 invested at the beginning of the period and held for the entire period November 1, 2013 through April 30, 2014.
Actual Expenses
The first line for each share class in the following table provides information about actual account values and actual expenses. You may use the information in this line, together with the amount you invested, to estimate the expenses that you paid over the period. Simply divide your account value by $1,000 (for example, an $8,600 account value divided by $1,000 = 8.6), then multiply the result by the number in the first line under the heading entitled “Expenses Paid During Period” to estimate the expenses you paid on your account during this period.
Hypothetical Example for Comparison Purposes
The second line for each share class in the following table provides information about hypothetical account values and hypothetical expenses based on the fund’s actual expense ratio and an assumed rate of return of 5% per year before expenses, which is not the fund’s actual return. The hypothetical account values and expenses may not be used to estimate the actual ending account balance or expenses you paid for the period. You may use this information to compare the ongoing costs of investing in the fund and other funds. To do so, compare this 5% hypothetical example with the 5% hypothetical examples that appear in the shareholder reports of the other funds.
Please note that the expenses shown in the table are meant to highlight your ongoing costs only and do not reflect any transactional costs, such as sales charges (loads). Therefore, the second line for each share class in the table is useful in comparing ongoing costs only, and will not help you determine the relative total costs of owning different funds. In addition, if these transactional costs were included, your costs would have been higher.
3
Expense Table – continued
| | | | | | | | | | | | | | | | | | |
Share
Class | | | | Annualized
Expense Ratio | | | Beginning
Account Value
11/01/13 | | | Ending Account Value
4/30/14 | | | Expenses
Paid During
Period (p)
11/01/13-4/30/14 | |
| A | | Actual | | | 0.97% | | | | $1,000.00 | | | | $1,102.91 | | | | $5.06 | |
| | Hypothetical (h) | | | 0.97% | | | | $1,000.00 | | | | $1,019.98 | | | | $4.86 | |
| B | | Actual | | | 1.72% | | | | $1,000.00 | | | | $1,099.12 | | | | $8.95 | |
| | Hypothetical (h) | | | 1.72% | | | | $1,000.00 | | | | $1,016.27 | | | | $8.60 | |
| C | | Actual | | | 1.72% | | | | $1,000.00 | | | | $1,099.17 | | | | $8.95 | |
| | Hypothetical (h) | | | 1.72% | | | | $1,000.00 | | | | $1,016.27 | | | | $8.60 | |
| I | | Actual | | | 0.72% | | | | $1,000.00 | | | | $1,104.50 | | | | $3.76 | |
| | Hypothetical (h) | | | 0.72% | | | | $1,000.00 | | | | $1,021.22 | | | | $3.61 | |
| R1 | | Actual | | | 1.72% | | | | $1,000.00 | | | | $1,099.32 | | | | $8.95 | |
| | Hypothetical (h) | | | 1.72% | | | | $1,000.00 | | | | $1,016.27 | | | | $8.60 | |
| R2 | | Actual | | | 1.22% | | | | $1,000.00 | | | | $1,101.73 | | | | $6.36 | |
| | Hypothetical (h) | | | 1.22% | | | | $1,000.00 | | | | $1,018.74 | | | | $6.11 | |
| R3 | | Actual | | | 0.97% | | | | $1,000.00 | | | | $1,102.97 | | | | $5.06 | |
| | Hypothetical (h) | | | 0.97% | | | | $1,000.00 | | | | $1,019.98 | | | | $4.86 | |
| R4 | | Actual | | | 0.72% | | | | $1,000.00 | | | | $1,104.72 | | | | $3.76 | |
| | Hypothetical (h) | | | 0.72% | | | | $1,000.00 | | | | $1,021.22 | | | | $3.61 | |
| R5 | | Actual | | | 0.64% | | | | $1,000.00 | | | | $1,105.41 | | | | $3.34 | |
| | Hypothetical (h) | | | 0.64% | | | | $1,000.00 | | | | $1,021.62 | | | | $3.21 | |
| (h) | 5% class return per year before expenses. |
| (p) | “Expenses Paid During Period” are equal to each class’s annualized expense ratio, as shown above, multiplied by the average account value over the period, multiplied by 181/365 (to reflect the one-half year period). Expenses paid do not include any applicable sales charges (loads). If these transaction costs had been included, your costs would have been higher. |
4
PORTFOLIO OF INVESTMENTS
4/30/14 (unaudited)
The Portfolio of Investments is a complete list of all securities owned by your fund. It is categorized by broad-based asset classes.
| | | | | | | | |
| Common Stocks - 92.2% | | | | | | | | |
| Issuer | | Shares/Par | | | Value ($) | |
| | | | | | | | |
| Broadcasting - 1.1% | | | | | | | | |
| Twenty-First Century Fox, Inc. | | | 2,017,080 | | | $ | 64,586,902 | |
| | |
| Cable TV - 8.7% | | | | | | | | |
| Astro Malaysia Holdings Berhad | | | 30,485,100 | | | $ | 31,087,240 | |
| Charter Communications, Inc., “A” (a) | | | 309,741 | | | | 41,979,198 | |
| Comcast Corp., “Special A” | | | 4,156,297 | | | | 212,095,836 | |
| Liberty Global PLC, “A” (a) | | | 626,401 | | | | 24,943,288 | |
| Liberty Global PLC, “C” (a) | | | 1,891,403 | | | | 72,686,617 | |
| Time Warner Cable, Inc. | | | 603,730 | | | | 85,403,646 | |
| Ziggo N.V. | | | 1,077,185 | | | | 46,745,852 | |
| | | | | | | | |
| | | | $ | 514,941,677 | |
| Energy - Independent - 4.4% | | | | | | | | |
| Anadarko Petroleum Corp. | | | 475,893 | | | $ | 47,122,925 | |
| Antero Resources Corp. (a) | | | 354,990 | | | | 23,312,193 | |
| Enable Midstream Partners LP (a) | | | 298,390 | | | | 7,382,169 | |
| Energen Corp. | | | 603,059 | | | | 46,984,327 | |
| EQT Corp. | | | 693,104 | | | | 75,541,405 | |
| Markwest Energy Partners LP | | | 249,550 | | | | 15,806,497 | |
| Noble Energy, Inc. | | | 268,148 | | | | 19,247,663 | |
| Targa Resources Corp. | | | 29,697 | | | | 3,206,979 | |
| Western Gas Equity Partners LP | | | 382,741 | | | | 18,727,517 | |
| | | | | | | | |
| | | | $ | 257,331,675 | |
| Internet - 0.2% | | | | | | | | |
| Iliad S.A. | | | 33,526 | | | $ | 9,046,642 | |
| | |
| Natural Gas - Distribution - 7.2% | | | | | | | | |
| AGL Energy Ltd. | | | 1,146,880 | | | $ | 16,836,295 | |
| AGL Resources, Inc. | | | 114,330 | | | | 6,173,820 | |
| China Resources Gas Group Ltd. | | | 11,038,000 | | | | 32,674,285 | |
| Gas Natural SDG S.A. | | | 1,330,050 | | | | 38,131,985 | |
| GDF Suez (l) | | | 2,734,766 | | | | 68,957,360 | |
| Infraestructura Energetica Nova S.A.B. de C.V. | | | 2,288,500 | | | | 11,915,891 | |
| NiSource, Inc. | | | 547,001 | | | | 19,867,076 | |
| Questar Corp. | | | 535,890 | | | | 13,011,409 | |
| Sempra Energy | | | 980,204 | | | | 96,657,916 | |
| Snam S.p.A. | | | 8,305,710 | | | | 49,917,318 | |
| Spectra Energy Corp. | | | 1,837,587 | | | | 72,970,580 | |
| | | | | | | | |
| | | | $ | 427,113,935 | |
5
Portfolio of Investments (unaudited) – continued
| | | | | | | | |
| Issuer | | Shares/Par | | | Value ($) | |
| | | | | | | | |
| Common Stocks - continued | | | | | | | | |
| Natural Gas - Pipeline - 11.3% | | | | | | | | |
| APA Group (l) | | | 3,267,426 | | | $ | 20,216,021 | |
| Cheniere Energy, Inc. (a) | | | 551,543 | | | | 31,134,602 | |
| DCP Midstream Partners LP | | | 106,060 | | | | 5,674,210 | |
| Enagas S.A. | | | 2,579,303 | | | | 79,440,391 | |
| Enbridge, Inc. | | | 1,269,959 | | | | 61,281,996 | |
| Energy Transfer Equity LP | | | 47,900 | | | | 2,231,661 | |
| Enterprise Products Partners LP | | | 40,180 | | | | 2,938,363 | |
| Kinder Morgan, Inc. | | | 4,159,438 | | | | 135,847,245 | |
| ONEOK Partners LP | | | 565,340 | | | | 32,218,727 | |
| ONEOK, Inc. | | | 1,462,208 | | | | 92,440,790 | |
| Plains All American Pipeline LP | | | 154,450 | | | | 8,618,310 | |
| Plains GP Holdings LP | | | 200,820 | | | | 5,536,607 | |
| SemGroup Corp., “A” | | | 216,520 | | | | 13,831,298 | |
| TransCanada Corp. | | | 742,100 | | | | 34,584,616 | |
| Williams Cos., Inc. | | | 2,329,969 | | | | 98,254,793 | |
| Williams Partners LP | | | 821,922 | | | | 42,394,737 | |
| | | | | | | | |
| | | | $ | 666,644,367 | |
| Oil Services - 0.3% | | | | | | | | |
| Ensco PLC, “A” | | | 157,508 | | | $ | 7,946,279 | |
| Noble Corp. PLC | | | 262,900 | | | | 8,099,949 | |
| | | | | | | | |
| | | | $ | 16,046,228 | |
| Telecommunications - Wireless - 6.6% | | | | | | | | |
| American Tower Corp., REIT | | | 1,212,843 | | | $ | 101,296,647 | |
| Cellcom Israel Ltd. | | | 1,839,432 | | | | 23,323,998 | |
| KDDI Corp. | | | 93,700 | | | | 4,987,679 | |
| MegaFon OJSC (a) | | | 969,483 | | | | 25,206,558 | |
| Mobile TeleSystems OJSC | | | 708,390 | | | | 5,140,177 | |
| Mobile TeleSystems OJSC, ADR | | | 3,394,383 | | | | 56,889,859 | |
| SBA Communications Corp. (a) | | | 485,475 | | | | 43,576,236 | |
| TIM Participacoes S.A., ADR | | | 1,040,290 | | | | 27,994,204 | |
| Turkcell Iletisim Hizmetleri AS (a) | | | 6,561,315 | | | | 38,220,347 | |
| Vodafone Group PLC | | | 16,144,134 | | | | 61,043,743 | |
| | | | | | | | |
| | | | $ | 387,679,448 | |
| Telephone Services - 7.8% | | | | | | | | |
| Altice S.A. (a) | | | 662,240 | | | $ | 37,843,669 | |
| Bezeq - The Israel Telecommunication Corp. Ltd. | | | 32,641,534 | | | | 59,221,637 | |
| CenturyLink, Inc. | | | 1,075,589 | | | | 37,548,812 | |
| Oi S.A. (a) | | | 40,426 | | | | 39,442,976 | |
| PT Telekomunikasi Indonesia Tbk | | | 31,491,500 | | | | 6,202,766 | |
| PT XL Axiata Tbk | | | 38,960,500 | | | | 17,438,964 | |
| Quebecor, Inc., “B” | | | 1,344,680 | | | | 31,713,862 | |
| TDC A.S. | | | 5,889,893 | | | | 55,286,170 | |
6
Portfolio of Investments (unaudited) – continued
| | | | | | | | |
| Issuer | | Shares/Par | | | Value ($) | |
| | | | | | | | |
| Common Stocks - continued | | | | | | | | |
| Telephone Services - continued | | | | | | | | |
| Telecom Italia S.p.A. | | | 44,193,259 | | | $ | 43,868,391 | |
| Telecom Italia S.p.A. (a) | | | 2,456,268 | | | | 3,147,014 | |
| Verizon Communications, Inc. | | | 2,035,144 | | | | 95,102,279 | |
| Windstream Holdings, Inc. (l) | | | 3,892,587 | | | | 35,305,764 | |
| | | | | | | | |
| | | | $ | 462,122,304 | |
| Utilities - Electric Power - 44.6% | | | | | | | | |
| AES Corp. | | | 6,870,993 | | | $ | 99,285,849 | |
| Aksa Enerji Uretim A.S. (a) | | | 15,403,849 | | | | 20,499,072 | |
| ALLETE, Inc. | | | 842,742 | | | | 43,620,326 | |
| Alliant Energy Corp. | | | 694,130 | | | | 40,592,722 | |
| Ameren Corp. | | | 212,550 | | | | 8,780,441 | |
| American Electric Power Co., Inc. | | | 1,961,942 | | | | 105,572,099 | |
| Calpine Corp. (a) | | | 7,202,716 | | | | 165,158,278 | |
| Canadian Utilities Ltd., “A” | | | 402,730 | | | | 14,877,549 | |
| CenterPoint Energy, Inc. | | | 820,196 | | | | 20,308,053 | |
| Cheung Kong Infrastructure Holdings Ltd. | | | 5,531,000 | | | | 36,098,337 | |
| China Longyuan Electric Power Group Corp. | | | 16,210,000 | | | | 16,684,720 | |
| CMS Energy Corp. | | | 5,080,438 | | | | 153,988,076 | |
| Companhia Energetica de Minas Gerais, IPS | | | 3,687,301 | | | | 28,096,084 | |
| Companhia Paranaense de Energia, ADR (l) | | | 1,295,458 | | | | 18,589,822 | |
| Companhia Paranaense de Energia, IPS | | | 3,864,100 | | | | 55,368,537 | |
| Covanta Holding Corp. | | | 898,480 | | | | 16,576,956 | |
| CPFL Energia S.A. | | | 2,778,700 | | | | 23,565,519 | |
| Dominion Resources, Inc. | | | 1,044,760 | | | | 75,786,890 | |
| Drax Group PLC | | | 3,159,644 | | | | 35,315,998 | |
| DTE Energy Co. | | | 1,133,000 | | | | 88,532,620 | |
| Duke Energy Corp. | | | 902,757 | | | | 67,246,369 | |
| Dynegy, Inc. (a) | | | 110,450 | | | | 3,142,303 | |
| Edison International | | | 1,867,975 | | | | 105,652,666 | |
| EDP Renovaveis S.A. | | | 15,990,044 | | | | 109,521,358 | |
| Enel Green Power S.p.A. | | | 2,268,409 | | | | 6,482,979 | |
| Enel S.p.A | | | 547,240 | | | | 3,093,035 | |
| Energias de Portugal S.A. | | | 37,447,141 | | | | 181,833,017 | |
| Energias do Brasil S.A. | | | 11,494,100 | | | | 49,950,815 | |
| Exelon Corp. | | | 83,820 | | | | 2,936,215 | |
| Iberdrola S.A. | | | 1,281,431 | | | | 8,951,189 | |
| Infinis Energy PLC (a) | | | 3,805,204 | | | | 13,973,736 | |
| ITC Holdings Corp. | | | 979,856 | | | | 36,225,276 | |
| Light S.A. | | | 2,475,370 | | | | 19,760,774 | |
| National Grid PLC | | | 1,032,339 | | | | 14,649,925 | |
| NextEra Energy, Inc. | | | 1,628,406 | | | | 162,596,339 | |
| Northeast Utilities | | | 2,411,485 | | | | 113,966,781 | |
| NRG Energy, Inc. | | | 5,446,215 | | | | 178,200,155 | |
7
Portfolio of Investments (unaudited) – continued
| | | | | | | | |
| Issuer | | Shares/Par | | | Value ($) | |
| | | | | | | | |
| Common Stocks - continued | | | | | | | | |
| Utilities - Electric Power - continued | | | | | | | | |
| NRG Yield, Inc. | | | 215,110 | | | $ | 9,215,312 | |
| OGE Energy Corp. | | | 2,046,210 | | | | 76,385,019 | |
| Pinnacle West Capital Corp. | | | 1,017,270 | | | | 56,916,257 | |
| Portland General Electric Co. | | | 1,701,184 | | | | 56,938,628 | |
| PPL Corp. | | | 1,409,412 | | | | 46,989,796 | |
| Public Service Enterprise Group, Inc. | | | 2,662,315 | | | | 109,075,046 | |
| Red Electrica de Espana | | | 617,176 | | | | 50,757,855 | |
| SSE PLC | | | 2,855,992 | | | | 73,536,367 | |
| Tractebel Energia S.A. | | | 382,500 | | | | 5,688,396 | |
| | | | | | | | |
| | | | $ | 2,630,983,556 | |
| Total Common Stocks (Identified Cost, $4,159,814,806) | | | $ | 5,436,496,734 | |
| | |
| Bonds - 0.1% | | | | | | | | |
| Asset-Backed & Securitized - 0.0% | | | | | | | | |
| Falcon Franchise Loan LLC, FRN, 11.062%, 1/05/23 (i)(z) | | $ | 349,584 | | | $ | 29,435 | |
| | |
| Utilities - Electric Power - 0.1% | | | | | | | | |
| Viridian Group FundCo II, Ltd., 11.125%, 4/01/17 (n) | | $ | 5,999,000 | | | $ | 6,658,891 | |
| Total Bonds (Identified Cost, $5,880,938) | | | $ | 6,688,326 | |
| | |
| Convertible Preferred Stocks - 3.5% | | | | | | | | |
| Utilities - Electric Power - 3.5% | | | | | | | | |
| Dominion Resources, Inc., “A”, 6.125% | | | 570,160 | | | $ | 33,422,779 | |
| Dominion Resources, Inc., “B”, 6% | | | 694,580 | | | | 40,834,358 | |
| NextEra Energy, Inc., 5.889% | | | 766,880 | | | | 48,995,963 | |
| PPL Corp., 8.75% | | | 1,506,126 | | | | 81,330,804 | |
Total Convertible Preferred Stocks
(Identified Cost, $183,082,083) | | | $ | 204,583,904 | |
|
| Convertible Bonds - 0.6% | |
| Telecommunications - Wireless - 0.6% | | | | | | | | |
SBA Communications Corp., 4%, 10/01/14
(Identified Cost, $18,504,149) | | $ | 12,891,000 | | | $ | 37,915,654 | |
| | | | | | | | | | | | |
| | |
| Warrants - 0.0% | | | | | | | | |
| Issuer | | Strike Price | | First Exercise | | Shares/Par | | | Value ($) | |
| | | | | | | | | | | | |
| Natural Gas - Pipeline - 0.0% | | | | | | | | | | |
Kinder Morgan, Inc.
(1 share for 1 warrant)
(Identified Cost, $1,402,059) (a) | | $40 | | 2/15/12 | | | 277,917 | | | $ | 539,159 | |
8
Portfolio of Investments (unaudited) – continued
| | | | | | | | | | | | |
| Money Market Funds - 4.0% | | | | | | | | |
| Issuer | | Strike Price | | First Exercise | | Shares/Par | | | Value ($) | |
| | | | | | | | | | | | |
MFS Institutional Money Market Portfolio, 0.09%,
at Cost and Net Asset Value (v) | | | 234,294,481 | | | $ | 234,294,481 | |
| | |
| Collateral for Securities Loaned - 1.2% | | | | | | | | |
JPMorgan Prime Money Market Fund, 0.06%,
at Cost and Net Asset Value (j) | | | 73,701,673 | | | $ | 73,701,673 | |
| Total Investments (Identified Cost, $4,676,680,189) | | | $ | 5,994,219,931 | |
| |
| Other Assets, Less Liabilities - (1.6)% | | | | (95,072,358 | ) |
| Net Assets - 100.0% | | | $ | 5,899,147,573 | |
| (a) | Non-income producing security. |
| (i) | Interest only security for which the fund receives interest on notional principal (Par amount). Par amount shown is the notional principal and does not reflect the cost of the security. |
| (j) | The rate quoted is the annualized seven-day yield of the fund at period end. |
| (l) | A portion of this security is on loan. |
| (n) | Securities exempt from registration under Rule 144A of the Securities Act of 1933. These securities may be sold in the ordinary course of business in transactions exempt from registration, normally to qualified institutional buyers. At period end, the aggregate value of these securities was $6,658,891, representing 0.1% of net assets. |
| (v) | Underlying affiliated fund that is available only to investment companies managed by MFS. The rate quoted for the MFS Institutional Money Market Portfolio is the annualized seven-day yield of the fund at period end. |
| (z) | Restricted securities are not registered under the Securities Act of 1933 and are subject to legal restrictions on resale. These securities generally may be resold in transactions exempt from registration or to the public if the securities are subsequently registered. Disposal of these securities may involve time-consuming negotiations and prompt sale at an acceptable price may be difficult. The fund holds the following restricted securities: |
| | | | | | | | | | |
| Restricted Securities | | Acquisition
Date | | Cost | | | Value | |
| Falcon Franchise Loan LLC, FRN, 11.062%, 1/05/23 | | 1/18/02 | | | $8,950 | | | | $29,435 | |
| % of Net assets | | | | 0.0% | |
The following abbreviations are used in this report and are defined:
| ADR | | American Depositary Receipt |
| FRN | | Floating Rate Note. Interest rate resets periodically and may not be the rate reported at period end. |
| IPS | | International Preference Stock |
| PLC | | Public Limited Company |
| REIT | | Real Estate Investment Trust |
Abbreviations indicate amounts shown in currencies other than the U.S. dollar. All amounts are stated in U.S. dollars unless otherwise indicated. A list of abbreviations is shown below:
9
Portfolio of Investments (unaudited) – continued
Derivative Contracts at 4/30/14
Forward Foreign Currency Exchange Contracts at 4/30/14
| | | | | | | | | | | | | | | | | | | | | | | | |
| Type | | Currency | | Counter- party | | Contracts
to
Deliver/
Receive | | | Settlement
Date Range | | | In
Exchange
for | | | Contracts
at Value | | | Net
Unrealized
Appreciation
(Depreciation) | |
| Asset Derivatives | | | | | | | | | | | | | |
| BUY | | EUR | | Citibank N.A. | | | 3,237,833 | | | | 7/11/14 | | | | $4,470,239 | | | | $4,491,268 | | | | $21,029 | |
| BUY | | EUR | | Credit Suisse Group | | | 16,438,980 | | | | 7/11/14 | | | | 22,682,955 | | | | 22,802,865 | | | | 119,910 | |
| BUY | | EUR | | Deutsche Bank AG | | | 1,683,689 | | | | 7/11/14 | | | | 2,322,697 | | | | 2,335,481 | | | | 12,784 | |
| BUY | | EUR | | JPMorgan Chase Bank N.A. | | | 2,788,447 | | | | 7/11/14 | | | | 3,851,726 | | | | 3,867,915 | | | | 16,189 | |
| BUY | | EUR | | UBG AG | | | 233,785 | | | | 7/11/14 | | | | 323,303 | | | | 324,288 | | | | 985 | |
| SELL | | EUR | | Barclays Bank PLC | | | 75,326,407 | | | | 6/18/14 | | | | 104,893,679 | | | | 104,491,649 | | | | 402,030 | |
| BUY | | GBP | | Barclays Bank PLC | | | 2,994,170 | | | | 7/11/14 | | | | 4,960,472 | | | | 5,052,542 | | | | 92,070 | |
| BUY | | GBP | | Deutsche Bank AG | | | 523,197 | | | | 7/11/14 | | | | 878,321 | | | | 882,872 | | | | 4,551 | |
| | | | | | | | | | | | | | | | | | | | | | | | |
| | | | | | | | | | | | | | | | | | | | | | | $669,548 | |
| | | | | | | | | | | | | | | | | | | | | | | | |
| | | | |
| Liability Derivatives | | | | | | | | | | | | | |
| BUY | | EUR | | Credit Suisse Group | | | 768,514 | | | | 7/11/14 | | | | $1,067,019 | | | | $1,066,022 | | | | $(997 | ) |
| SELL | | EUR | | Credit Suisse Group | | | 72,543,360 | | | | 7/11/14 | | | | 99,653,975 | | | | 100,626,466 | | | | (972,491 | ) |
| SELL | | EUR | | Deutsche Bank AG | | | 50,494,915 | | | | 7/11/14 | | | | 69,393,301 | | | | 70,042,590 | | | | (649,289 | ) |
| SELL | | EUR | | JPMorgan Chase Bank N.A. | | | 73,438,278 | | | | 7/11/14 | | | | 100,881,134 | | | | 101,867,826 | | | | (986,692 | ) |
| SELL | | EUR | | UBG AG | | | 65,460,340 | | | | 7/11/14 | | | | 89,948,457 | | | | 90,801,455 | | | | (852,998 | ) |
| SELL | | GBP | | Barclays Bank PLC | | | 2,462,611 | | | | 7/11/14 | | | | 4,141,595 | | | | 4,155,558 | | | | (13,963 | ) |
| SELL | | GBP | | Credit Suisse Group | | | 36,660,791 | | | | 7/11/14 | | | | 61,323,604 | | | | 61,863,617 | | | | (540,013 | ) |
| SELL | | GBP | | Deutsche Bank AG | | | 516,956 | | | | 7/11/14 | | | | 861,108 | | | | 872,343 | | | | (11,235 | ) |
| SELL | | GBP | | Goldman Sachs International | | | 2,141,419 | | | | 7/11/14 | | | | 3,574,045 | | | | 3,613,559 | | | | (39,514 | ) |
10
Portfolio of Investments (unaudited) – continued
Forward Foreign Currency Exchange Contracts at 4/30/14 – continued
| | | | | | | | | | | | | | | | | | | | | | | | |
| Type | | Currency | | Counter- party | | Contracts
to
Deliver/
Receive | | | Settlement
Date Range | | | In
Exchange
for | | | Contracts
at Value | | | Net
Unrealized
Appreciation
(Depreciation) | |
| Liability Derivatives - continued | | | | | | | | | | | | | |
| SELL | | GBP | | JPMorgan Chase Bank N.A. | | | 281,003 | | | | 7/11/14 | | | | $471,714 | | | | $474,181 | | | | $(2,467 | ) |
| SELL | | GBP | | Merrill Lynch International Bank | | | 36,660,791 | | | | 7/11/14 | | | | 61,328,370 | | | | 61,863,617 | | | | (535,247 | ) |
| SELL | | GBP | | UBG AG | | | 3,327,669 | | | | 7/11/14 | | | | 5,583,033 | | | | 5,615,308 | | | | (32,275 | ) |
| | | | | | | | | | | | | | | | | | | | | | | | |
| | | | | | | | | | | | | | | | | | | | | | | $(4,637,181 | ) |
| | | | | | | | | | | | | | | | | | | | | | | | |
At April 30, 2014, the fund had cash collateral of $1,620,000 to cover any commitments for certain derivative contracts. Cash collateral is comprised of “Restricted cash” in the Statement of Assets and Liabilities.
See Notes to Financial Statements
11
Financial Statements
STATEMENT OF ASSETS AND LIABILITIES
At 4/30/14 (unaudited)
This statement represents your fund’s balance sheet, which details the assets and liabilities comprising the total value of the fund.
| | | | |
| Assets | | | | |
Investments- | | | | |
Non-affiliated issuers, at value (identified cost, $4,442,385,708) | | | $5,759,925,450 | |
Underlying affiliated funds, at cost and value | | | 234,294,481 | |
Total investments, at value, including $69,224,391 of securities on loan
(identified cost, $4,676,680,189) | | | $5,994,219,931 | |
Restricted cash | | | 1,620,000 | |
Receivables for | | | | |
Forward foreign currency exchange contracts | | | 669,548 | |
Investments sold | | | 29,101,767 | |
Fund shares sold | | | 21,875,053 | |
Interest and dividends | | | 23,328,711 | |
Other assets | | | 20,855 | |
Total assets | | | $6,070,835,865 | |
| Liabilities | | | | |
Payable to custodian | | | $1,253,722 | |
Payables for | | | | |
Distributions | | | 1,285,971 | |
Forward foreign currency exchange contracts | | | 4,637,181 | |
Investments purchased | | | 71,617,663 | |
Fund shares reacquired | | | 14,504,624 | |
Collateral for securities loaned, at value | | | 73,701,673 | |
Payable to affiliates | | | | |
Investment adviser | | | 187,642 | |
Shareholder servicing costs | | | 4,064,631 | |
Distribution and service fees | | | 127,023 | |
Payable for independent Trustees’ compensation | | | 12,008 | |
Accrued expenses and other liabilities | | | 296,154 | |
Total liabilities | | | $171,688,292 | |
Net assets | | | $5,899,147,573 | |
| Net assets consist of | | | | |
Paid-in capital | | | $4,470,405,352 | |
Unrealized appreciation (depreciation) on investments and translation of assets and liabilities in foreign currencies | | | 1,313,646,881 | |
Accumulated net realized gain (loss) on investments and foreign currency | | | 83,022,928 | |
Undistributed net investment income | | | 32,072,412 | |
Net assets | | | $5,899,147,573 | |
Shares of beneficial interest outstanding | | | 260,110,185 | |
12
Statement of Assets and Liabilities (unaudited) – continued
| | | | | | | | | | | | |
| | | Net assets | | | Shares outstanding | | | Net asset value per share (a) | |
Class A | | | $3,422,796,385 | | | | 150,827,995 | | | | $22.69 | |
Class B | | | 325,545,188 | | | | 14,402,134 | | | | 22.60 | |
Class C | | | 1,035,954,947 | | | | 45,830,410 | | | | 22.60 | |
Class I | | | 687,589,485 | | | | 30,209,337 | | | | 22.76 | |
Class R1 | | | 13,273,081 | | | | 588,066 | | | | 22.57 | |
Class R2 | | | 124,506,402 | | | | 5,498,279 | | | | 22.64 | |
Class R3 | | | 151,197,149 | | | | 6,665,400 | | | | 22.68 | |
Class R4 | | | 126,118,002 | | | | 5,554,142 | | | | 22.71 | |
Class R5 | | | 12,166,934 | | | | 534,422 | | | | 22.77 | |
| (a) | Maximum offering price per share was equal to the net asset value per share for all share classes, except for Class A, for which the maximum offering price per share was $24.07 [100 / 94.25 x $22.69]. On sales of $50,000 or more, the maximum offering price of Class A shares is reduced. A contingent deferred sales charge may be imposed on redemptions of Class A, Class B, and Class C shares. Redemption price per share was equal to the net asset value per share for Classes I, R1, R2, R3, R4, and R5. |
See Notes to Financial Statements
13
Financial Statements
STATEMENT OF OPERATIONS
Six months ended 4/30/14 (unaudited)
This statement describes how much your fund earned in investment income and accrued in expenses. It also describes any gains and/or losses generated by fund operations.
| | | | |
| Net investment income | | | | |
Income | | | | |
Dividends | | | $135,468,044 | |
Interest | | | 1,066,987 | |
Dividends from underlying affiliated funds | | | 54,003 | |
Foreign taxes withheld | | | (3,122,154 | ) |
Total investment income | | | $133,466,880 | |
Expenses | | | | |
Management fee | | | $15,573,751 | |
Distribution and service fees | | | 10,702,577 | |
Shareholder servicing costs | | | 2,939,555 | |
Administrative services fee | | | 234,518 | |
Independent Trustees’ compensation | | | 33,592 | |
Custodian fee | | | 373,086 | |
Shareholder communications | | | 138,694 | |
Audit and tax fees | | | 33,271 | |
Legal fees | | | 24,137 | |
Miscellaneous | | | 201,779 | |
Total expenses | | | $30,254,960 | |
Fees paid indirectly | | | (1,296 | ) |
Reduction of expenses by investment adviser and distributor | | | (33,295 | ) |
Net expenses | | | $30,220,369 | |
Net investment income | | | $103,246,511 | |
| Realized and unrealized gain (loss) on investments and foreign currency | |
Realized gain (loss) (identified cost basis) | | | | |
Investments | | | $121,106,557 | |
Foreign currency | | | (16,433,644 | ) |
Net realized gain (loss) on investments and foreign currency | | | $104,672,913 | |
Change in unrealized appreciation (depreciation) | | | | |
Investments | | | $330,645,285 | |
Translation of assets and liabilities in foreign currencies | | | 663,724 | |
Net unrealized gain (loss) on investments and foreign currency translation | | | $331,309,009 | |
Net realized and unrealized gain (loss) on investments and foreign currency | | | $435,981,922 | |
Change in net assets from operations | | | $539,228,433 | |
See Notes to Financial Statements
14
Financial Statements
STATEMENTS OF CHANGES IN NET ASSETS
These statements describe the increases and/or decreases in net assets resulting from operations, any distributions, and any shareholder transactions.
| | | | | | | | |
| Change in net assets | | Six months ended 4/30/14 (unaudited) | | | Year ended 10/31/13 | |
| From operations | | | | | | | | |
Net investment income | | | $103,246,511 | | | | $140,407,201 | |
Net realized gain (loss) on investments and foreign currency | | | 104,672,913 | | | | 316,670,821 | |
Net unrealized gain (loss) on investments and foreign currency translation | | | 331,309,009 | | | | 473,848,983 | |
Change in net assets from operations | | | $539,228,433 | | | | $930,927,005 | |
| Distributions declared to shareholders | | | | | | | | |
From net investment income | | | $(78,768,967 | ) | | | $(133,999,706 | ) |
From net realized gain on investments | | | (223,100,887 | ) | | | (3,193,095 | ) |
Total distributions declared to shareholders | | | $(301,869,854 | ) | | | $(137,192,801 | ) |
Change in net assets from fund share transactions | | | $253,394,608 | | | | $(119,907,834 | ) |
Total change in net assets | | | $490,753,187 | | | | $673,826,370 | |
| Net assets | | | | | | | | |
At beginning of period | | | 5,408,394,386 | | | | 4,734,568,016 | |
At end of period (including undistributed net investment income of $32,072,412 and $7,594,868, respectively) | | | $5,899,147,573 | | | | $5,408,394,386 | |
See Notes to Financial Statements
15
Financial Statements
FINANCIAL HIGHLIGHTS
The financial highlights table is intended to help you understand the fund’s financial performance for the semiannual period and the past 5 fiscal years (or life of a particular share class, if shorter). Certain information reflects financial results for a single fund share. The total returns in the table represent the rate by which an investor would have earned (or lost) on an investment in the fund share class (assuming reinvestment of all distributions) held for the entire period.
| | | | | | | | | | | | | | | | | | | | | | | | |
| | | Six months ended 4/30/14 | | | Years ended 10/31 | |
| Class A | | | 2013 | | | 2012 | | | 2011 | | | 2010 | | | 2009 | |
| | | (unaudited) | | | | | | | | | | | | | | | | |
Net asset value, beginning of
period | | | $21.80 | | | | $18.61 | | | | $17.11 | | | | $16.01 | | | | $13.79 | | | | $12.04 | |
| Income (loss) from investment operations | | | | | | | | | | | | | |
Net investment income (d) | | | $0.42 | | | | $0.60 | | | | $0.51 | | | | $0.61 | | | | $0.47 | | | | $0.54 | |
Net realized and unrealized
gain (loss) on investments
and foreign currency | | | 1.69 | | | | 3.17 | | | | 1.53 | | | | 1.02 | | | | 2.26 | | | | 1.75 | |
Total from investment operations | | | $2.11 | | | | $3.77 | | | | $2.04 | | | | $1.63 | | | | $2.73 | | | | $2.29 | |
| Less distributions declared to shareholders | | | | | | | | | | | | | |
From net investment income | | | $(0.32 | ) | | | $(0.57 | ) | | | $(0.54 | ) | | | $(0.53 | ) | | | $(0.51 | ) | | | $(0.47 | ) |
From net realized gain on
investments | | | (0.90 | ) | | | (0.01 | ) | | | — | | | | — | | | | — | | | | (0.07 | ) |
Total distributions declared to
shareholders | | | $(1.22 | ) | | | $(0.58 | ) | | | $(0.54 | ) | | | $(0.53 | ) | | | $(0.51 | ) | | | $(0.54 | ) |
Net asset value, end of period (x) | | | $22.69 | | | | $21.80 | | | | $18.61 | | | | $17.11 | | | | $16.01 | | | | $13.79 | |
Total return (%) (r)(s)(t)(x) | | | 10.29 | (n) | | | 20.59 | | | | 12.17 | | | | 10.26 | | | | 20.17 | | | | 19.78 | |
Ratios (%) (to average net assets)
and Supplemental data: | | | | | | | | | | | | | | | | | |
Expenses before expense
reductions (f) | | | 0.98 | (a) | | | 1.01 | | | | 1.02 | | | | 1.04 | | | | 1.07 | | | | 1.10 | |
Expenses after expense
reductions (f) | | | 0.97 | (a) | | | 1.01 | | | | 1.02 | | | | 1.04 | | | | 1.07 | | | | 1.10 | |
Net investment income | | | 3.95 | (a) | | | 2.97 | | | | 2.90 | | | | 3.62 | | | | 3.20 | | | | 4.44 | |
Portfolio turnover | | | 20 | (n) | | | 54 | | | | 46 | | | | 51 | | | | 54 | | | | 71 | |
Net assets at end of period
(000 omitted) | | | $3,422,796 | | | | $3,242,884 | | | | $2,699,649 | | | | $2,343,368 | | | | $1,947,269 | | | | $1,766,611 | |
See Notes to Financial Statements
16
Financial Highlights – continued
| | | | | | | | | | | | | | | | | | | | | | | | |
| | | Six months ended 4/30/14 | | | Years ended 10/31 | |
| Class B | | | 2013 | | | 2012 | | | 2011 | | | 2010 | | | 2009 | |
| | | (unaudited) | | | | | | | | | | | | | | | | |
Net asset value, beginning of
period | | | $21.71 | | | | $18.55 | | | | $17.05 | | | | $15.95 | | | | $13.75 | | | | $12.00 | |
| Income (loss) from investment operations | | | | | | | | | | | | | |
Net investment income (d) | | | $0.34 | | | | $0.44 | | | | $0.37 | | | | $0.49 | | | | $0.36 | | | | $0.47 | |
Net realized and unrealized
gain (loss) on investments
and foreign currency | | | 1.69 | | | | 3.15 | | | | 1.54 | | | | 1.01 | | | | 2.24 | | | | 1.73 | |
Total from investment operations | | | $2.03 | | | | $3.59 | | | | $1.91 | | | | $1.50 | | | | $2.60 | | | | $2.20 | |
| Less distributions declared to shareholders | | | | | | | | | | | | | |
From net investment income | | | $(0.24 | ) | | | $(0.42 | ) | | | $(0.41 | ) | | | $(0.40 | ) | | | $(0.40 | ) | | | $(0.38 | ) |
From net realized gain on
investments | | | (0.90 | ) | | | (0.01 | ) | | | — | | | | — | | | | — | | | | (0.07 | ) |
Total distributions declared to
shareholders | | | $(1.14 | ) | | | $(0.43 | ) | | | $(0.41 | ) | | | $(0.40 | ) | | | $(0.40 | ) | | | $(0.45 | ) |
Net asset value, end of period (x) | | | $22.60 | | | | $21.71 | | | | $18.55 | | | | $17.05 | | | | $15.95 | | | | $13.75 | |
Total return (%) (r)(s)(t)(x) | | | 9.91 | (n) | | | 19.60 | | | | 11.39 | | | | 9.47 | | | | 19.18 | | | | 18.94 | |
Ratios (%) (to average net assets)
and Supplemental data: | | | | | | | | | | | | | | | | | |
Expenses before expense
reductions (f) | | | 1.72 | (a) | | | 1.76 | | | | 1.77 | | | | 1.79 | | | | 1.82 | | | | 1.85 | |
Expenses after expense
reductions (f) | | | 1.72 | (a) | | | 1.76 | | | | 1.77 | | | | 1.79 | | | | 1.82 | | | | 1.85 | |
Net investment income | | | 3.21 | (a) | | | 2.21 | | | | 2.14 | | | | 2.88 | | | | 2.45 | | | | 3.86 | |
Portfolio turnover | | | 20 | (n) | | | 54 | | | | 46 | | | | 51 | | | | 54 | | | | 71 | |
Net assets at end of period
(000 omitted) | | | $325,545 | | | | $305,988 | | | | $265,748 | | | | $233,107 | | | | $209,277 | | | | $196,483 | |
See Notes to Financial Statements
17
Financial Highlights – continued
| | | | | | | | | | | | | | | | | | | | | | | | |
| | | Six months ended 4/30/14 | | | Years ended 10/31 | |
| Class C | | | 2013 | | | 2012 | | | 2011 | | | 2010 | | | 2009 | |
| | | (unaudited) | | | | | | | | | | | | | | | | |
Net asset value, beginning of
period | | | $21.71 | | | | $18.55 | | | | $17.05 | | | | $15.96 | | | | $13.75 | | | | $12.01 | |
| Income (loss) from investment operations | | | | | | | | | | | | | |
Net investment income (d) | | | $0.34 | | | | $0.44 | | | | $0.38 | | | | $0.48 | | | | $0.36 | | | | $0.45 | |
Net realized and unrealized
gain (loss) on investments
and foreign currency | | | 1.69 | | | | 3.15 | | | | 1.53 | | | | 1.01 | | | | 2.25 | | | | 1.74 | |
Total from investment operations | | | $2.03 | | | | $3.59 | | | | $1.91 | | | | $1.49 | | | | $2.61 | | | | $2.19 | |
| Less distributions declared to shareholders | | | | | | | | | | | | | |
From net investment income | | | $(0.24 | ) | | | $(0.42 | ) | | | $(0.41 | ) | | | $(0.40 | ) | | | $(0.40 | ) | | | $(0.38 | ) |
From net realized gain on
investments | | | (0.90 | ) | | | (0.01 | ) | | | — | | | | — | | | | — | | | | (0.07 | ) |
Total distributions declared to
shareholders | | | $(1.14 | ) | | | $(0.43 | ) | | | $(0.41 | ) | | | $(0.40 | ) | | | $(0.40 | ) | | | $(0.45 | ) |
Net asset value, end of period (x) | | | $22.60 | | | | $21.71 | | | | $18.55 | | | | $17.05 | | | | $15.96 | | | | $13.75 | |
Total return (%) (r)(s)(t)(x) | | | 9.92 | (n) | | | 19.61 | | | | 11.40 | | | | 9.41 | | | | 19.27 | | | | 18.86 | |
Ratios (%) (to average net assets)
and Supplemental data: | | | | | | | | | | | | | | | | | |
Expenses before expense
reductions (f) | | | 1.72 | (a) | | | 1.76 | | | | 1.77 | | | | 1.79 | | | | 1.82 | | | | 1.85 | |
Expenses after expense
reductions (f) | | | 1.72 | (a) | | | 1.76 | | | | 1.77 | | | | 1.79 | | | | 1.82 | | | | 1.85 | |
Net investment income | | | 3.25 | (a) | | | 2.21 | | | | 2.15 | | | | 2.86 | | | | 2.44 | | | | 3.67 | |
Portfolio turnover | | | 20 | (n) | | | 54 | | | | 46 | | | | 51 | | | | 54 | | | | 71 | |
Net assets at end of period
(000 omitted) | | | $1,035,955 | | | | $917,978 | | | | $739,959 | | | | $608,042 | | | | $459,807 | | | | $299,351 | |
See Notes to Financial Statements
18
Financial Highlights – continued
| | | | | | | | | | | | | | | | | | | | | | | | |
| | | Six months ended 4/30/14 | | | Years ended 10/31 | |
| Class I | | | 2013 | | | 2012 | | | 2011 | | | 2010 | | | 2009 | |
| | | (unaudited) | | | | | | | | | | | | | | | | |
Net asset value, beginning of
period | | | $21.86 | | | | $18.67 | | | | $17.15 | | | | $16.05 | | | | $13.82 | | | | $12.07 | |
| Income (loss) from investment operations | | | | | | | | | | | | | |
Net investment income (d) | | | $0.46 | | | | $0.65 | | | | $0.57 | | | | $0.66 | | | | $0.50 | | | | $0.46 | |
Net realized and unrealized
gain (loss) on investments
and foreign currency | | | 1.69 | | | | 3.17 | | | | 1.53 | | | | 1.01 | | | | 2.27 | | | | 1.86 | |
Total from investment operations | | | $2.15 | | | | $3.82 | | | | $2.10 | | | | $1.67 | | | | $2.77 | | | | $2.32 | |
| Less distributions declared to shareholders | | | | | | | | | | | | | |
From net investment income | | | $(0.35 | ) | | | $(0.62 | ) | | | $(0.58 | ) | | | $(0.57 | ) | | | $(0.54 | ) | | | $(0.50 | ) |
From net realized gain on
investments | | | (0.90 | ) | | | (0.01 | ) | | | — | | | | — | | | | — | | | | (0.07 | ) |
Total distributions declared to
shareholders | | | $(1.25 | ) | | | $(0.63 | ) | | | $(0.58 | ) | | | $(0.57 | ) | | | $(0.54 | ) | | | $(0.57 | ) |
Net asset value, end of period (x) | | | $22.76 | | | | $21.86 | | | | $18.67 | | | | $17.15 | | | | $16.05 | | | | $13.82 | |
Total return (%) (r)(s)(x) | | | 10.45 | (n) | | | 20.82 | | | | 12.54 | | | | 10.50 | | | | 20.50 | | | | 20.03 | |
Ratios (%) (to average net assets)
and Supplemental data: | | | | | | | | | | | | | | | | | |
Expenses before expense
reductions (f) | | | 0.72 | (a) | | | 0.76 | | | | 0.77 | | | | 0.79 | | | | 0.82 | | | | 0.82 | |
Expenses after expense
reductions (f) | | | 0.72 | (a) | | | 0.76 | | | | 0.77 | | | | 0.79 | | | | 0.82 | | | | 0.82 | |
Net investment income | | | 4.30 | (a) | | | 3.21 | | | | 3.22 | | | | 3.88 | | | | 3.37 | | | | 3.60 | |
Portfolio turnover | | | 20 | (n) | | | 54 | | | | 46 | | | | 51 | | | | 54 | | | | 71 | |
Net assets at end of period
(000 omitted) | | | $687,589 | | | | $566,374 | | | | $462,849 | | | | $286,562 | | | | $155,487 | | | | $39,175 | |
See Notes to Financial Statements
19
Financial Highlights – continued
| | | | | | | | | | | | | | | | | | | | | | | | |
| | | Six months ended 4/30/14 | | | Years ended 10/31 | |
| Class R1 | | | 2013 | | | 2012 | | | 2011 | | | 2010 | | | 2009 | |
| | | (unaudited) | | | | | | | | | | | | | | | | |
Net asset value, beginning of
period | | | $21.68 | | | | $18.52 | | | | $17.03 | | | | $15.94 | | | | $13.73 | | | | $11.99 | |
| Income (loss) from investment operations | | | | | | | | | | | | | |
Net investment income (d) | | | $0.34 | | | | $0.44 | | | | $0.37 | | | | $0.48 | | | | $0.36 | | | | $0.44 | |
Net realized and unrealized
gain (loss) on investments
and foreign currency | | | 1.69 | | | | 3.15 | | | | 1.53 | | | | 1.01 | | | | 2.25 | | | | 1.75 | |
Total from investment operations | | | $2.03 | | | | $3.59 | | | | $1.90 | | | | $1.49 | | | | $2.61 | | | | $2.19 | |
| Less distributions declared to shareholders | | | | | | | | | | | | | |
From net investment income | | | $(0.24 | ) | | | $(0.42 | ) | | | $(0.41 | ) | | | $(0.40 | ) | | | $(0.40 | ) | | | $(0.38 | ) |
From net realized gain on
investments | | | (0.90 | ) | | | (0.01 | ) | | | — | | | | — | | | | — | | | | (0.07 | ) |
Total distributions declared to
shareholders | | | $(1.14 | ) | | | $(0.43 | ) | | | $(0.41 | ) | | | $(0.40 | ) | | | $(0.40 | ) | | | $(0.45 | ) |
Net asset value, end of period (x) | | | $22.57 | | | | $21.68 | | | | $18.52 | | | | $17.03 | | | | $15.94 | | | | $13.73 | |
Total return (%) (r)(s)(x) | | | 9.93 | (n) | | | 19.63 | | | | 11.35 | | | | 9.42 | | | | 19.28 | | | | 18.90 | |
Ratios (%) (to average net assets)
and Supplemental data: | | | | | | | | | | | | | | | | | |
Expenses before expense
reductions (f) | | | 1.72 | (a) | | | 1.76 | | | | 1.77 | | | | 1.79 | | | | 1.82 | | | | 1.84 | |
Expenses after expense
reductions (f) | | | 1.72 | (a) | | | 1.76 | | | | 1.77 | | | | 1.79 | | | | 1.82 | | | | 1.84 | |
Net investment income | | | 3.23 | (a) | | | 2.22 | | | | 2.15 | | | | 2.83 | | | | 2.46 | | | | 3.61 | |
Portfolio turnover | | | 20 | (n) | | | 54 | | | | 46 | | | | 51 | | | | 54 | | | | 71 | |
Net assets at end of period
(000 omitted) | | | $13,273 | | | | $12,041 | | | | $12,092 | | | | $11,686 | | | | $10,157 | | | | $9,674 | |
See Notes to Financial Statements
20
Financial Highlights – continued
| | | | | | | | | | | | | | | | | | | | | | | | |
| | | Six months ended 4/30/14 | | | Years ended 10/31 | |
| Class R2 | | | 2013 | | | 2012 | | | 2011 | | | 2010 | | | 2009 | |
| | | (unaudited) | | | | | | | | | | | | | | | | |
Net asset value, beginning of
period | | | $21.75 | | | | $18.58 | | | | $17.07 | | | | $15.98 | | | | $13.77 | | | | $12.02 | |
| Income (loss) from investment operations | | | | | | | | | | | | | |
Net investment income (d) | | | $0.39 | | | | $0.54 | | | | $0.46 | | | | $0.57 | | | | $0.43 | | | | $0.50 | |
Net realized and unrealized
gain (loss) on investments
and foreign currency | | | 1.70 | | | | 3.16 | | | | 1.55 | | | | 1.01 | | | | 2.25 | | | | 1.76 | |
Total from investment operations | | | $2.09 | | | | $3.70 | | | | $2.01 | | | | $1.58 | | | | $2.68 | | | | $2.26 | |
| Less distributions declared to shareholders | | | | | | | | | | | | | |
From net investment income | | | $(0.30 | ) | | | $(0.52 | ) | | | $(0.50 | ) | | | $(0.49 | ) | | | $(0.47 | ) | | | $(0.44 | ) |
From net realized gain on
investments | | | (0.90 | ) | | | (0.01 | ) | | | — | | | | — | | | | — | | | | (0.07 | ) |
Total distributions declared to
shareholders | | | $(1.20 | ) | | | $(0.53 | ) | | | $(0.50 | ) | | | $(0.49 | ) | | | $(0.47 | ) | | | $(0.51 | ) |
Net asset value, end of period (x) | | | $22.64 | | | | $21.75 | | | | $18.58 | | | | $17.07 | | | | $15.98 | | | | $13.77 | |
Total return (%) (r)(s)(x) | | | 10.17 | (n) | | | 20.22 | | | | 11.99 | | | | 9.94 | | | | 19.83 | | | | 19.52 | |
Ratios (%) (to average net assets)
and Supplemental data: | | | | | | | | | | | | | | | | | |
Expenses before expense
reductions (f) | | | 1.23 | (a) | | | 1.26 | | | | 1.27 | | | | 1.29 | | | | 1.32 | | | | 1.34 | |
Expenses after expense
reductions (f) | | | 1.22 | (a) | | | 1.26 | | | | 1.27 | | | | 1.29 | | | | 1.32 | | | | 1.34 | |
Net investment income | | | 3.71 | (a) | | | 2.71 | | | | 2.65 | | | | 3.37 | | | | 2.93 | | | | 4.12 | |
Portfolio turnover | | | 20 | (n) | | | 54 | | | | 46 | | | | 51 | | | | 54 | | | | 71 | |
Net assets at end of period
(000 omitted) | | | $124,506 | | | | $116,355 | | | | $116,173 | | | | $101,994 | | | | $79,748 | | | | $61,470 | |
See Notes to Financial Statements
21
Financial Highlights – continued
| | | | | | | | | | | | | | | | | | | | | | | | |
| | | Six months ended 4/30/14 | | | Years ended 10/31 | |
| Class R3 | | | 2013 | | | 2012 | | | 2011 | | | 2010 | | | 2009 | |
| | | (unaudited) | | | | | | | | | | | | | | | | |
Net asset value, beginning of
period | | | $21.79 | | | | $18.59 | | | | $17.09 | | | | $15.99 | | | | $13.78 | | | | $12.03 | |
| Income (loss) from investment operations | | | | | | | | | | | | | |
Net investment income (d) | | | $0.42 | | | | $0.52 | | | | $0.51 | | | | $0.61 | | | | $0.47 | | | | $0.54 | |
Net realized and unrealized
gain (loss) on investments
and foreign currency | | | 1.69 | | | | 3.25 | | | | 1.53 | | | | 1.02 | | | | 2.25 | | | | 1.75 | |
Total from investment operations | | | $2.11 | | | | $3.77 | | | | $2.04 | | | | $1.63 | | | | $2.72 | | | | $2.29 | |
| Less distributions declared to shareholders | | | | | | | | | | | | | |
From net investment income | | | $(0.32 | ) | | | $(0.56 | ) | | | $(0.54 | ) | | | $(0.53 | ) | | | $(0.51 | ) | | | $(0.47 | ) |
From net realized gain on
investments | | | (0.90 | ) | | | (0.01 | ) | | | — | | | | — | | | | — | | | | (0.07 | ) |
Total distributions declared to
shareholders | | | $(1.22 | ) | | | $(0.57 | ) | | | $(0.54 | ) | | | $(0.53 | ) | | | $(0.51 | ) | | | $(0.54 | ) |
Net asset value, end of period (x) | | | $22.68 | | | | $21.79 | | | | $18.59 | | | | $17.09 | | | | $15.99 | | | | $13.78 | |
Total return (%) (r)(s)(x) | | | 10.30 | (n) | | | 20.61 | | | | 12.19 | | | | 10.27 | | | | 20.12 | | | | 19.80 | |
Ratios (%) (to average net assets)
and Supplemental data: | | | | | | | | | | | | | | | | | |
Expenses before expense
reductions (f) | | | 0.98 | (a) | | | 1.00 | | | | 1.02 | | | | 1.04 | | | | 1.07 | | | | 1.10 | |
Expenses after expense
reductions (f) | | | 0.97 | (a) | | | 1.00 | | | | 1.02 | | | | 1.04 | | | | 1.07 | | | | 1.09 | |
Net investment income | | | 4.00 | (a) | | | 2.67 | | | | 2.90 | | | | 3.62 | | | | 3.19 | | | | 4.40 | |
Portfolio turnover | | | 20 | (n) | | | 54 | | | | 46 | | | | 51 | | | | 54 | | | | 71 | |
Net assets at end of period
(000 omitted) | | | $151,197 | | | | $135,710 | | | | $364,245 | | | | $324,613 | | | | $277,390 | | | | $39,450 | |
See Notes to Financial Statements
22
Financial Highlights – continued
| | | | | | | | | | | | | | | | | | | | | | | | |
| | | Six months ended 4/30/14 | | | Years ended 10/31 | |
| Class R4 | | | 2013 | | | 2012 | | | 2011 | | | 2010 | | | 2009 | |
| | | (unaudited) | | | | | | | | | | | | | | | | |
Net asset value, beginning of
period | | | $21.81 | | | | $18.63 | | | | $17.12 | | | | $16.02 | | | | $13.80 | | | | $12.05 | |
| Income (loss) from investment operations | | | | | | | | | | | | | |
Net investment income (d) | | | $0.45 | | | | $0.65 | | | | $0.56 | | | | $0.64 | | | | $0.52 | | | | $0.54 | |
Net realized and unrealized
gain (loss) on investments
and foreign currency | | | 1.70 | | | | 3.16 | | | | 1.53 | | | | 1.03 | | | | 2.24 | | | | 1.78 | |
Total from investment operations | | | $2.15 | | | | $3.81 | | | | $2.09 | | | | $1.67 | | | | $2.76 | | | | $2.32 | |
| Less distributions declared to shareholders | | | | | | | | | | | | | |
From net investment income | | | $(0.35 | ) | | | $(0.62 | ) | | | $(0.58 | ) | | | $(0.57 | ) | | | $(0.54 | ) | | | $(0.50 | ) |
From net realized gain on
investments | | | (0.90 | ) | | | (0.01 | ) | | | — | | | | — | | | | — | | | | (0.07 | ) |
Total distributions declared to
shareholders | | | $(1.25 | ) | | | $(0.63 | ) | | | $(0.58 | ) | | | $(0.57 | ) | | | $(0.54 | ) | | | $(0.57 | ) |
Net asset value, end of period (x) | | | $22.71 | | | | $21.81 | | | | $18.63 | | | | $17.12 | | | | $16.02 | | | | $13.80 | |
Total return (%) (r)(s)(x) | | | 10.47 | (n) | | | 20.82 | | | | 12.50 | | | | 10.52 | | | | 20.45 | | | | 20.06 | |
Ratios (%) (to average net assets)
and Supplemental data: | | | | | | | | | | | | | | | | | |
Expenses before expense
reductions (f) | | | 0.73 | (a) | | | 0.76 | | | | 0.77 | | | | 0.79 | | | | 0.82 | | | | 0.84 | |
Expenses after expense
reductions (f) | | | 0.72 | (a) | | | 0.76 | | | | 0.77 | | | | 0.79 | | | | 0.82 | | | | 0.84 | |
Net investment income | | | 4.23 | (a) | | | 3.22 | | | | 3.17 | | | | 3.78 | | | | 3.51 | | | | 4.38 | |
Portfolio turnover | | | 20 | (n) | | | 54 | | | | 46 | | | | 51 | | | | 54 | | | | 71 | |
Net assets at end of period
(000 omitted) | | | $126,118 | | | | $108,572 | | | | $73,570 | | | | $45,233 | | | | $24,422 | | | | $12,760 | |
See Notes to Financial Statements
23
Financial Highlights – continued
| | | | | | | | | | | | |
| | | Six months ended 4/30/14 | | | Years ended 10/31 | |
| Class R5 | | | 2013 | | | 2012 (i) | |
| | | (unaudited) | | | | | | | |
Net asset value, beginning of period | | | $21.86 | | | | $18.67 | | | | $16.71 | |
| Income (loss) from investment operations | | | | | |
Net investment income (d) | | | $0.46 | | | | $0.72 | | | | $0.22 | |
Net realized and unrealized gain (loss) on investments
and foreign currency | | | 1.71 | | | | 3.12 | | | | 1.96 | (g) |
Total from investment operations | | | $2.17 | | | | $3.84 | | | | $2.18 | |
| Less distributions declared to shareholders | | | | | |
From net investment income | | | $(0.36 | ) | | | $(0.64 | ) | | | $(0.22 | ) |
From net realized gain on investments | | | (0.90 | ) | | | (0.01 | ) | | | — | |
Total distributions declared to shareholders | | | $(1.26 | ) | | | $(0.65 | ) | | | $(0.22 | ) |
Net asset value, end of period (x) | | | $22.77 | | | | $21.86 | | | | $18.67 | |
Total return (%) (r)(s)(x) | | | 10.54 | (n) | | | 20.95 | | | | 13.11 | (n) |
Ratios (%) (to average net assets)
and Supplemental data: | | | | | |
Expenses before expense reductions (f) | | | 0.64 | (a) | | | 0.65 | | | | 0.71 | (a) |
Expenses after expense reductions (f) | | | 0.64 | (a) | | | 0.65 | | | | 0.71 | (a) |
Net investment income | | | 4.38 | (a) | | | 3.48 | | | | 2.93 | (a) |
Portfolio turnover | | | 20 | (n) | | | 54 | | | | 46 | |
Net assets at end of period (000 omitted) | | | $12,167 | | | | $2,492 | | | | $283 | |
| (d) | Per share data is based on average shares outstanding. |
| (f) | Ratios do not reflect reductions from fees paid indirectly, if applicable. |
| (g) | The per share amount varies from the net realized and unrealized gain/loss for the period because of the timing of sales of fund shares and the per share amount of realized and unrealized gains and losses at such time. |
| (i) | For the period from the class inception, June 1, 2012, through the stated period end. |
| (r) | Certain expenses have been reduced without which performance would have been lower. |
| (s) | From time to time the fund may receive proceeds from litigation settlements, without which performance would be lower. Excluding the effect of the proceeds received from a non-recurring litigation settlement against Enron Corp., the Class A, Class B, Class C, Class I, Class R1, Class R2, Class R3, and Class R4 total returns for the year ended October 31, 2009 would have each been lower by approximately 0.62%. |
| (t) | Total returns do not include any applicable sales charges. |
| (x) | The net asset values per share and total returns have been calculated on net assets which include adjustments made in accordance with U.S. generally accepted accounting principles required at period end for financial reporting purposes. |
See Notes to Financial Statements
24
NOTES TO FINANCIAL STATEMENTS
(unaudited)
(1) Business and Organization
MFS Utilities Fund (the fund) is a diversified series of MFS Series Trust VI (the trust). The trust is organized as a Massachusetts business trust and is registered under the Investment Company Act of 1940, as amended, as an open-end management investment company.
The fund is an investment company and accordingly follows the investment company accounting and reporting guidance of the Financial Accounting Standards Board (FASB) Accounting Standard Codification Topic 946 Financial Services – Investment Companies.
(2) Significant Accounting Policies
General – The preparation of financial statements in conformity with U.S. generally accepted accounting principles requires management to make estimates and assumptions that affect the reported amounts of assets and liabilities, and disclosure of contingent assets and liabilities at the date of the financial statements and the reported amounts of increases and decreases in net assets from operations during the reporting period. Actual results could differ from those estimates. In the preparation of these financial statements, management has evaluated subsequent events occurring after the date of the fund’s Statement of Assets and Liabilities through the date that the financial statements were issued. The fund invests primarily in securities of issuers in the utility industry. Issuers in a single industry can react similarly to market, economic, political and regulatory conditions and developments. The fund invests in foreign securities. Investments in foreign securities are vulnerable to the effects of changes in the relative values of the local currency and the U.S. dollar and to the effects of changes in each country’s legal, political, and economic environment.
In this reporting period, the fund adopted the disclosure provisions of FASB Accounting Standards Update 2011-11 (“ASU 2011-11”), Balance Sheet (Topic 210) – Disclosures about Offsetting Assets and Liabilities along with the related scope clarification provisions of FASB Accounting Standards Update 2013-01 (“ASU 2013-01”) entitled Balance Sheet (Topic 210) – Clarifying the Scope of Disclosures about Offsetting Assets and Liabilities. ASU 2011-11 is intended to enhance disclosures on the offsetting of financial assets and liabilities by requiring entities to disclose both gross and net information about financial instruments and transactions that are either offset in the statement of financial position or subject to an enforceable Master Netting Agreement or similar arrangement. ASU 2013-01 limits the scope of ASU 2011-11’s disclosure requirements on offsetting to financial assets and financial liabilities related to derivatives, repurchase and reverse repurchase agreements, and securities lending and securities borrowing transactions. The disclosures required by ASU 2011-11, to the extent applicable to the fund, have been included in the fund’s Significant Accounting Policies note under the captions for each of the fund’s in-scope financial instruments and transactions.
The fund’s accounting policy with respect to balance sheet offsetting is that, absent an event of default by the counterparty or a termination of the agreement, the ISDA Master Agreement does not result in an offset of reported amounts of financial assets and financial liabilities in the Statement of Assets and Liabilities across transactions
25
Notes to Financial Statements (unaudited) – continued
between the fund and the applicable counterparty. The fund’s right to setoff may be restricted or prohibited by the bankruptcy or insolvency laws of the particular jurisdiction to which a specific master netting agreement counterparty is subject. Balance sheet offsetting disclosures, to the extent applicable to the fund, have been included in the fund’s Significant Accounting Policies note under the captions for each of the fund’s in-scope financial instruments and transactions.
Investment Valuations – Equity securities, including restricted equity securities, are generally valued at the last sale or official closing price as provided by a third-party pricing service on the market or exchange on which they are primarily traded. Equity securities, for which there were no sales reported that day, are generally valued at the last quoted daily bid quotation as provided by a third-party pricing service on the market or exchange on which such securities are primarily traded. Debt instruments and floating rate loans (other than short-term instruments), including restricted debt instruments, are generally valued at an evaluated or composite bid as provided by a third-party pricing service. Short-term instruments with a maturity at issuance of 60 days or less generally are valued at amortized cost, which approximates market value. Forward foreign currency exchange contracts are generally valued at the mean of bid and asked prices for the time period interpolated from rates provided by a third-party pricing service for proximate time periods. Open-end investment companies are generally valued at net asset value per share. Securities and other assets generally valued on the basis of information from a third-party pricing service may also be valued at a broker/dealer bid quotation. Values obtained from third-party pricing services can utilize both transaction data and market information such as yield, quality, coupon rate, maturity, type of issue, trading characteristics, and other market data. The values of foreign securities and other assets and liabilities expressed in foreign currencies are converted to U.S. dollars using the mean of bid and asked prices for rates provided by a third-party pricing service.
The Board of Trustees has delegated primary responsibility for determining or causing to be determined the value of the fund’s investments (including any fair valuation) to the adviser pursuant to valuation policies and procedures approved by the Board. If the adviser determines that reliable market quotations are not readily available, investments are valued at fair value as determined in good faith by the adviser in accordance with such procedures under the oversight of the Board of Trustees. Under the fund’s valuation policies and procedures, market quotations are not considered to be readily available for most types of debt instruments and floating rate loans and many types of derivatives. These investments are generally valued at fair value based on information from third-party pricing services. In addition, investments may be valued at fair value if the adviser determines that an investment’s value has been materially affected by events occurring after the close of the exchange or market on which the investment is principally traded (such as foreign exchange or market) and prior to the determination of the fund’s net asset value, or after the halting of trading of a specific security where trading does not resume prior to the close of the exchange or market on which the security is principally traded. Events that occur on a frequent basis after foreign markets close (such as developments in foreign markets and significant movements in the U.S. markets) and prior to the determination of the fund’s net asset value may be deemed to have a material effect on the value of securities traded in foreign markets.
26
Notes to Financial Statements (unaudited) – continued
Accordingly, the fund’s foreign equity securities may often be valued at fair value. The adviser generally relies on third-party pricing services or other information (such as the correlation with price movements of similar securities in the same or other markets; the type, cost and investment characteristics of the security; the business and financial condition of the issuer; and trading and other market data) to assist in determining whether to fair value and at what value to fair value an investment. The value of an investment for purposes of calculating the fund’s net asset value can differ depending on the source and method used to determine value. When fair valuation is used, the value of an investment used to determine the fund’s net asset value may differ from quoted or published prices for the same investment. There can be no assurance that the fund could obtain the fair value assigned to an investment if it were to sell the investment at the same time at which the fund determines its net asset value per share.
Various inputs are used in determining the value of the fund’s assets or liabilities. These inputs are categorized into three broad levels. In certain cases, the inputs used to measure fair value may fall into different levels of the fair value hierarchy. In such cases, an investment’s level within the fair value hierarchy is based on the lowest level of input that is significant to the fair value measurement. The fund’s assessment of the significance of a particular input to the fair value measurement in its entirety requires judgment, and considers factors specific to the investment. Level 1 includes unadjusted quoted prices in active markets for identical assets or liabilities. Level 2 includes other significant observable market-based inputs (including quoted prices for similar securities, interest rates, prepayment speed, and credit risk). Level 3 includes unobservable inputs, which may include the adviser’s own assumptions in determining the fair value of investments. Other financial instruments are derivative instruments not reflected in total investments, such as forward foreign currency exchange contracts.
27
Notes to Financial Statements (unaudited) – continued
The following is a summary of the levels used as of April 30, 2014 in valuing the fund’s assets or liabilities:
| | | | | | | | | | | | | | | | |
| Investments at Value | | Level 1 | | | Level 2 | | | Level 3 | | | Total | |
| Equity Securities: | | | | | | | | | | | | | | | | |
United States | | | $3,816,516,807 | | | | $— | | | | $— | | | | $3,816,516,807 | |
Portugal | | | 291,354,375 | | | | — | | | | — | | | | 291,354,375 | |
Brazil | | | 229,014,151 | | | | 39,442,976 | | | | — | | | | 268,457,127 | |
United Kingdom | | | 198,519,769 | | | | — | | | | — | | | | 198,519,769 | |
Spain | | | 177,281,420 | | | | — | | | | — | | | | 177,281,420 | |
Canada | | | 142,458,022 | | | | — | | | | — | | | | 142,458,022 | |
Italy | | | 106,508,738 | | | | — | | | | — | | | | 106,508,738 | |
Russia | | | 82,096,417 | | | | 5,140,177 | | | | — | | | | 87,236,594 | |
Israel | | | 23,323,998 | | | | 59,221,637 | | | | — | | | | 82,545,635 | |
Other Countries | | | 447,702,250 | | | | 23,039,061 | | | | — | | | | 470,741,311 | |
| U.S. Corportate Bonds | | | — | | | | 37,915,654 | | | | — | | | | 37,915,654 | |
| Commercial Mortgage-Backed Securities | | | — | | | | 29,435 | | | | — | | | | 29,435 | |
| Foreign Bonds | | | — | | | | 6,658,890 | | | | — | | | | 6,658,890 | |
| Mutual Funds | | | 307,996,154 | | | | — | | | | — | | | | 307,996,154 | |
| Total Investments | | | $5,822,772,101 | | | | $171,447,830 | | | | $— | | | | $5,994,219,931 | |
| | | |
| Other Financial Instruments | | | | | | | | | | |
| Forward Foreign Currency Exchange Contracts | | | $— | | | | $(3,967,633 | ) | | | $— | | | | $(3,967,633 | ) |
For further information regarding security characteristics, see the Portfolio of Investments.
Of the level 2 investments presented above, equity investments amounting to $76,057,933 would have been considered level 1 investments at the beginning of the period. Of the level 1 investments presented above, equity investments amounting to $61,043,743 would have been considered level 2 investments at the beginning of the period. The primary reason for changes in the classifications between levels 1 and 2 occurs when foreign equity securities are fair valued using other observable market-based inputs in place of the closing exchange price due to events occurring after the close of the exchange or market on which the investment is principally traded. The fund’s foreign equity securities may often be valued at fair value. The fund’s policy is to recognize transfers between the levels as of the end of the period.
Foreign Currency Translation – Purchases and sales of foreign investments, income, and expenses are converted into U.S. dollars based upon currency exchange rates prevailing on the respective dates of such transactions or on the reporting date for foreign denominated receivables and payables. Gains and losses attributable to foreign currency exchange rates on sales of securities are recorded for financial statement purposes as net realized gains and losses on investments. Gains and losses attributable to foreign exchange rate movements on receivables, payables, income and expenses are recorded for financial statement purposes as foreign currency transaction gains and
28
Notes to Financial Statements (unaudited) – continued
losses. That portion of both realized and unrealized gains and losses on investments that results from fluctuations in foreign currency exchange rates is not separately disclosed.
Derivatives – The fund uses derivatives for different purposes, primarily to increase or decrease exposure to a particular market or segment of the market, or security, to increase or decrease interest rate or currency exposure, or as alternatives to direct investments. Derivatives are used for hedging or non-hedging purposes. While hedging can reduce or eliminate losses, it can also reduce or eliminate gains. When the fund uses derivatives as an investment to increase market exposure, or for hedging purposes, gains and losses from derivative instruments may be substantially greater than the derivative’s original cost.
The derivative instruments used by the fund were forward foreign currency exchange contracts. The fund’s period end derivatives, as presented in the Portfolio of Investments and the associated Derivative Contract tables, generally are indicative of the volume of its derivative activity during the period.
The following table presents, by major type of derivative contract, the fair value, on a gross basis, of the asset and liability components of derivatives held by the fund at April 30, 2014 as reported in the Statement of Assets and Liabilities:
| | | | | | | | | | |
| | | | | Fair Value | |
| Risk | | Derivative Contracts | | Asset Derivatives | | | Liability Derivatives | |
| Foreign Exchange | | Forward Foreign Currency Exchange | | | $669,548 | | | $ | (4,637,181 | ) |
The following table presents, by major type of derivative contract, the realized gain (loss) on derivatives held by the fund for the six months ended April 30, 2014 as reported in the Statement of Operations:
| | | | |
| Risk | | Foreign Currency | |
| Foreign Exchange | | | $(15,453,983 | ) |
The following table presents, by major type of derivative contract, the change in unrealized appreciation (depreciation) on derivatives held by the fund for the six months ended April 30, 2014 as reported in the Statement of Operations:
| | | | |
| Risk | | Translation
of Assets
and
Liabilities in
Foreign
Currencies | |
| Foreign Exchange | | | $330,809 | |
Derivative counterparty credit risk is managed through formal evaluation of the creditworthiness of all potential counterparties. On certain, but not all, over-the-counter derivatives, the fund attempts to reduce its exposure to counterparty credit risk whenever possible by entering into an International Swaps and Derivatives Association (ISDA) Master Agreement on a bilateral basis with each of the counterparties with whom it undertakes a significant volume of transactions. The ISDA Master Agreement gives each party to the agreement the right to terminate all
29
Notes to Financial Statements (unaudited) – continued
transactions traded under such agreement if there is a certain deterioration in the credit quality of the other party. Upon an event of default or a termination of the ISDA Master Agreement, the non-defaulting party has the right to close out all transactions traded under such agreement and to net amounts owed under each transaction to one net amount payable by one party to the other. This right to close out and net payments across all transactions traded under the ISDA Master Agreement could result in a reduction of the fund’s credit risk to such counterparty equal to any amounts payable by the fund under the applicable transactions, if any. The fund’s right to setoff may be restricted or prohibited by the bankruptcy or insolvency laws of the particular jurisdiction to which a specific ISDA counterparty is subject.
Collateral and margin requirements differ by type of derivative. Margin requirements are set by the broker or clearing house for cleared derivatives (i.e., futures contracts, cleared swaps, and exchange-traded options) while collateral terms are contract specific for over-the-counter traded derivatives (i.e., forward foreign currency exchange contracts, uncleared swap agreements, and over-the-counter options). For derivatives traded under an ISDA Master Agreement, the collateral requirements are netted across all transactions traded under such agreement and one amount is posted from one party to the other to collateralize such obligations. Cash that has been segregated to cover the fund’s collateral or margin obligations under derivative contracts, if any, will be reported separately in the Statement of Assets and Liabilities as “Restricted cash” or “Deposits with brokers.” Securities pledged as collateral or margin for the same purpose, if any, are noted in the Portfolio of Investments.
Forward Foreign Currency Exchange Contracts – The fund entered into forward foreign currency exchange contracts for the purchase or sale of a specific foreign currency at a fixed price on a future date. These contracts may be used to hedge the fund’s currency risk or for non-hedging purposes. For hedging purposes, the fund may enter into contracts to deliver or receive foreign currency that the fund will receive from or use in its normal investment activities. The fund may also use contracts to hedge against declines in the value of foreign currency denominated securities due to unfavorable exchange rate movements. For non-hedging purposes, the fund may enter into contracts with the intent of changing the relative exposure of the fund’s portfolio of securities to different currencies to take advantage of anticipated exchange rate changes.
Forward foreign currency exchange contracts are adjusted by the daily exchange rate of the underlying currency and any unrealized gains or losses are recorded as a receivable or payable for forward foreign currency exchange contracts until the contract settlement date. On contract settlement date, any gain or loss on the contract is recorded as realized gains or losses on foreign currency.
Risks may arise upon entering into these contracts from unanticipated movements in the value of the contract and from the potential inability of counterparties to meet the terms of their contracts. Generally, the fund’s maximum risk due to counterparty credit risk is the unrealized gain on the contract due to the use of Continuous Linked Settlement, an industry accepted settlement system. This risk is mitigated in cases where there is an ISDA Master Agreement between the fund and the counterparty providing for netting as described above and for posting of collateral by the counterparty to the fund to cover the fund’s exposure to the counterparty under such ISDA Master Agreement.
30
Notes to Financial Statements (unaudited) – continued
Security Loans – Under its Securities Lending Agency Agreement with the fund, JPMorgan Chase and Co. (“Chase”), as lending agent, loans the securities of the fund to certain qualified institutions (the “Borrowers”) approved by the fund. The loans are collateralized by cash and/or U.S. Treasury and federal agency obligations in an amount typically at least equal to the market value of the securities loaned. The market value of the loaned securities is determined at the close of business of the fund and any additional required collateral is delivered to the fund on the next business day. Chase provides the fund with indemnification against Borrower default. In the event of Borrower default, Chase will for the benefit of the fund either purchase securities identical to those loaned or, when such purchase is commercially impracticable, pay the fund the market value of the loaned securities. In return, Chase assumes the fund’s rights to the related collateral. If the collateral value is less than the cost to purchase identical securities, Chase is responsible for the shortfall, but only to the extent that such shortfall is not due to a decline in collateral value resulting from collateral reinvestment for which the fund bears the risk of loss. On loans collateralized by cash, the cash collateral is invested in a money market fund or short-term securities. At period end, the fund had investment securities on loan with a fair value of $69,224,391 and a related liability of $73,701,673 for collateral received on securities loaned, both of which are presented gross on the Statement of Assets and Liabilities. The liability for collateral for securities loaned is carried at fair value, which is categorized as level 2 within the fair value hierarchy. The collateral received on securities loaned exceeded the value of securities on loan at period end. A portion of the income generated upon investment of the collateral is remitted to the Borrowers, and the remainder is allocated between the fund and the lending agent. On loans collateralized by U.S. Treasury and/or federal agency obligations, a fee is received from the Borrower, and is allocated between the fund and the lending agent. Income from securities lending is included in “Interest” income in the Statement of Operations. The dividend and interest income earned on the securities loaned is accounted for in the same manner as other dividend and interest income.
Indemnifications – Under the fund’s organizational documents, its officers and Trustees may be indemnified against certain liabilities and expenses arising out of the performance of their duties to the fund. Additionally, in the normal course of business, the fund enters into agreements with service providers that may contain indemnification clauses. The fund’s maximum exposure under these agreements is unknown as this would involve future claims that may be made against the fund that have not yet occurred.
Investment Transactions and Income – Investment transactions are recorded on the trade date. Interest income is recorded on the accrual basis. All premium and discount is amortized or accreted for financial statement purposes in accordance with U.S. generally accepted accounting principles. Dividends received in cash are recorded on the ex-dividend date. Certain dividends from foreign securities will be recorded when the fund is informed of the dividend if such information is obtained subsequent to the ex-dividend date. Dividend and interest payments received in additional securities are recorded on the ex-dividend or ex-interest date in an amount equal to the value of the security on such date.
31
Notes to Financial Statements (unaudited) – continued
The fund may receive proceeds from litigation settlements. Any proceeds received from litigation involving portfolio holdings are reflected in the Statement of Operations in realized gain/loss if the security has been disposed of by the fund or in unrealized gain/loss if the security is still held by the fund. Any other proceeds from litigation not related to portfolio holdings are reflected as other income in the Statement of Operations.
Fees Paid Indirectly – The fund’s custody fee may be reduced according to an arrangement that measures the value of cash deposited with the custodian by the fund. This amount, for the six months ended April 30, 2014, is shown as a reduction of total expenses in the Statement of Operations.
Tax Matters and Distributions – The fund intends to qualify as a regulated investment company, as defined under Subchapter M of the Internal Revenue Code, and to distribute all of its taxable income, including realized capital gains. As a result, no provision for federal income tax is required. The fund’s federal tax returns, when filed, will remain subject to examination by the Internal Revenue Service for a three year period. Management has analyzed the fund’s tax positions taken on federal and state tax returns for all open tax years and does not believe that there are any uncertain tax positions that require recognition of a tax liability. Foreign taxes, if any, have been accrued by the fund in the accompanying financial statements in accordance with the applicable foreign tax law. Foreign income taxes may be withheld by certain countries in which the fund invests. Additionally, capital gains realized by the fund on securities issued in or by certain foreign countries may be subject to capital gains tax imposed by those countries.
Distributions to shareholders are recorded on the ex-dividend date. Income and capital gain distributions are determined in accordance with income tax regulations, which may differ from U.S. generally accepted accounting principles. Certain capital accounts in the financial statements are periodically adjusted for permanent differences in order to reflect their tax character. These adjustments have no impact on net assets or net asset value per share. Temporary differences which arise from recognizing certain items of income, expense, gain or loss in different periods for financial statement and tax purposes will reverse at some time in the future. Distributions in excess of net investment income or net realized gains are temporary overdistributions for financial statement purposes resulting from differences in the recognition or classification of income or distributions for financial statement and tax purposes.
Book/tax differences primarily relate to wash sale loss deferrals, derivative transactions, treating a portion of the proceeds from redemptions as a distribution for tax purposes, redemptions in-kind and partnership adjustments.
The tax character of distributions made during the current period will be determined at fiscal year end. The tax character of distributions declared to shareholders for the last fiscal year is as follows:
| | | | |
| | | 10/31/13 | |
| Ordinary income (including any short-term capital gains) | | | $133,999,706 | |
| Long-term capital gains | | | 3,193,095 | |
| Total distributions | | | $137,192,801 | |
32
Notes to Financial Statements (unaudited) – continued
The federal tax cost and the tax basis components of distributable earnings were as follows:
| | | | |
| As of 4/30/14 | | | |
| Cost of investments | | | $4,710,737,931 | |
| Gross appreciation | | | 1,400,218,825 | |
| Gross depreciation | | | (116,736,825 | ) |
| Net unrealized appreciation (depreciation) | | | $1,283,482,000 | |
| |
| As of 10/31/13 | | | |
| Undistributed ordinary income | | | 138,612,864 | |
| Undistributed long-term capital gains | | | 109,040,918 | |
| Other temporary differences | | | (9,106,927 | ) |
| Net unrealized appreciation (depreciation) | | | 952,836,787 | |
The aggregate cost above includes prior fiscal year end tax adjustments, if applicable.
Multiple Classes of Shares of Beneficial Interest – The fund offers multiple classes of shares, which differ in their respective distribution and service fees. The fund’s income, realized and unrealized gain (loss), and common expenses are allocated to shareholders based on the daily net assets of each class. Dividends are declared separately for each class. Differences in per share dividend rates are generally due to differences in separate class expenses. Class B shares will convert to Class A shares approximately eight years after purchase. The fund’s distributions declared to shareholders as reported in the Statements of Changes in Net Assets are presented by class as follows:
| | | | | | | | | | | | | | | | |
| | | From net investment
income | | | From net realized gain on
investments | |
| | | Six months
ended
4/30/14 | | | Year
ended
10/31/13 | | | Six months
ended
4/30/14 | | | Year
ended
10/31/13 | |
| Class A | | | $48,958,511 | | | | $82,927,278 | | | | $133,161,909 | | | | $1,865,224 | |
| Class B | | | 3,491,585 | | | | 5,893,682 | | | | 12,632,156 | | | | 181,966 | |
| Class C | | | 10,763,960 | | | | 17,048,487 | | | | 38,095,498 | | | | 516,948 | |
| Class I | | | 9,583,297 | | | | 15,358,585 | | | | 23,289,939 | | | | 312,936 | |
| Class R1 | | | 140,301 | | | | 243,523 | | | | 502,602 | | | | 7,728 | |
| Class R2 | | | 1,623,591 | | | | 2,911,152 | | | | 4,808,744 | | | | 74,515 | |
| Class R3 | | | 2,123,190 | | | | 6,791,640 | | | | 5,570,819 | | | | 178,234 | |
| Class R4 | | | 1,898,293 | | | | 2,780,051 | | | | 4,594,337 | | | | 54,856 | |
| Class R5 | | | 186,239 | | | | 45,308 | | | | 444,883 | | | | 688 | |
| Total | | | $78,768,967 | | | | $133,999,706 | | | | $223,100,887 | | | | $3,193,095 | |
33
Notes to Financial Statements (unaudited) – continued
(3) Transactions with Affiliates
Investment Adviser – The fund has an investment advisory agreement with MFS to provide overall investment management and related administrative services and facilities to the fund. The management fee is computed daily and paid monthly at the following annual rates:
| | | | |
| First $3 billion of average daily net assets | | | 0.60 | % |
| Average daily net assets in excess of $3 billion | | | 0.55 | % |
The management fee incurred for the six months ended April 30, 2014 was equivalent to an annual effective rate of 0.58% of the fund’s average daily net assets.
Distributor – MFS Fund Distributors, Inc. (MFD), a wholly-owned subsidiary of MFS, as distributor, received $863,029 for the six months ended April 30, 2014, as its portion of the initial sales charge on sales of Class A shares of the fund.
The Board of Trustees has adopted a distribution plan for certain share classes pursuant to Rule 12b-1 of the Investment Company Act of 1940.
The fund’s distribution plan provides that the fund will pay MFD for services provided by MFD and financial intermediaries in connection with the distribution and servicing of certain share classes. One component of the plan is a distribution fee paid to MFD and another component of the plan is a service fee paid to MFD. MFD may subsequently pay all, or a portion, of the distribution and/or service fees to financial intermediaries.
Distribution Plan Fee Table:
| | | | | | | | | | | | | | | | | | | | |
| | | Distribution
Fee Rate (d) | | | Service
Fee Rate (d) | | | Total
Distribution
Plan (d) | | | Annual
Effective
Rate (e) | | | Distribution
and Service
Fee | |
| Class A | | | — | | | | 0.25% | | | | 0.25% | | | | 0.25% | | | | $3,989,341 | |
| Class B | | | 0.75% | | | | 0.25% | | | | 1.00% | | | | 1.00% | | | | 1,521,951 | |
| Class C | | | 0.75% | | | | 0.25% | | | | 1.00% | | | | 1.00% | | | | 4,671,109 | |
| Class R1 | | | 0.75% | | | | 0.25% | | | | 1.00% | | | | 1.00% | | | | 60,419 | |
| Class R2 | | | 0.25% | | | | 0.25% | | | | 0.50% | | | | 0.50% | | | | 287,460 | |
| Class R3 | | | — | | | | 0.25% | | | | 0.25% | | | | 0.25% | | | | 172,297 | |
| Total Distribution and Service Fees | | | | | | | | | | | | $10,702,577 | |
| (d) | In accordance with the distribution plan for certain classes, the fund pays distribution and/or service fees equal to these annual percentage rates of each class’s average daily net assets. The distribution and service fee rates disclosed by class represent the current rates in effect at the end of the reporting period. Any rate changes, if applicable, are detailed below. |
| (e) | The annual effective rates represent actual fees incurred under the distribution plan for the six months ended April 30, 2014 based on each class’s average daily net assets. MFD has voluntarily agreed to rebate a portion of each class’s 0.25% service fee attributable to accounts for which MFD retains the 0.25% service fee except for accounts attributable to MFS or its affiliates’ seed money. For the six months ended April 30, 2014, this rebate amounted to $27,024, $924, and $1,459 for Class A, Class B, and Class C, respectively, and is included in the reduction of total expenses in the Statement of Operations. |
Certain Class A shares are subject to a contingent deferred sales charge (CDSC) in the event of a shareholder redemption within 18 months of purchase for shares purchased on or after August 1, 2012, and within 24 months of purchase for shares purchased prior to August 1, 2012. Class C shares are subject to a CDSC in the event of a
34
Notes to Financial Statements (unaudited) – continued
shareholder redemption within 12 months of purchase. Class B shares are subject to a CDSC in the event of a shareholder redemption within six years of purchase. All contingent deferred sales charges are paid to MFD and during the six months ended April 30, 2014, were as follows:
| | | | |
| | | Amount | |
| Class A | | | $24,808 | |
| Class B | | | 124,973 | |
| Class C | | | 39,071 | |
Shareholder Servicing Agent – MFS Service Center, Inc. (MFSC), a wholly-owned subsidiary of MFS, receives a fee from the fund for its services as shareholder servicing agent calculated as a percentage of the average daily net assets of the fund as determined periodically under the supervision of the fund’s Board of Trustees. For the six months ended April 30, 2014, the fee was $392,446, which equated to 0.0146% annually of the fund’s average daily net assets. MFSC also receives payment from the fund for out-of-pocket expenses, sub-accounting and other shareholder servicing costs which may be paid to affiliated and unaffiliated service providers. Class R5 shares do not incur sub-accounting fees. For the six months ended April 30, 2014, these out-of-pocket expenses, sub-accounting and other shareholder servicing costs amounted to $2,547,109.
Administrator – MFS provides certain financial, legal, shareholder communications, compliance, and other administrative services to the fund. Under an administrative services agreement, the fund partially reimburses MFS the costs incurred to provide these services. The fund is charged an annual fixed amount of $17,500 plus a fee based on average daily net assets. The administrative services fee incurred for the six months ended April 30, 2014 was equivalent to an annual effective rate of 0.0087% of the fund’s average daily net assets.
Trustees’ and Officers’ Compensation – The fund pays compensation to independent Trustees in the form of a retainer, attendance fees, and additional compensation to Board and Committee chairpersons. The fund does not pay compensation directly to Trustees or officers of the fund who are also officers of the investment adviser, all of whom receive remuneration for their services to the fund from MFS. Certain officers and Trustees of the fund are officers or directors of MFS, MFD, and MFSC.
Prior to December 31, 2001, the fund had an unfunded defined benefit plan (“DB plan”) for independent Trustees. As of December 31, 2001, the Board took action to terminate the DB plan with respect to then-current and any future independent Trustees, such that the DB plan covers only certain of those former independent Trustees who retired on or before December 31, 2001. Effective January 1, 2002, accrued benefits under the DB plan for then-current independent Trustees who continued were credited to an unfunded retirement deferral plan (the “Retirement Deferral plan”), which was established for and exists solely with respect to these credited amounts, and is not available for other deferrals by these or other independent Trustees. Although the Retirement Deferral plan is unfunded, amounts deferred under the plan are periodically adjusted for investment experience as if they had been invested in shares of the fund. The DB plan resulted in a pension expense of $203 and the Retirement Deferral plan resulted in an expense of $1,762. Both amounts
35
Notes to Financial Statements (unaudited) – continued
are included in independent Trustees’ compensation for the six months ended April 30, 2014. The liability for deferred retirement benefits payable to certain independent Trustees under both plans amounted to $7,176 at April 30, 2014, and is included in “Payable for independent Trustees’ compensation” in the Statement of Assets and Liabilities.
Other – This fund and certain other funds managed by MFS (the funds) have entered into services agreements (the Agreements) which provide for payment of fees by the funds to Tarantino LLC and Griffin Compliance LLC in return for the provision of services of an Independent Chief Compliance Officer (ICCO) and Assistant ICCO, respectively, for the funds. The ICCO and Assistant ICCO are officers of the funds and the sole members of Tarantino LLC and Griffin Compliance LLC, respectively. The funds can terminate the Agreements with Tarantino LLC and Griffin Compliance LLC at any time under the terms of the Agreements. For the six months ended April 30, 2014, the aggregate fees paid by the fund to Tarantino LLC and Griffin Compliance LLC were $17,025 and are included in “Miscellaneous” expense in the Statement of Operations. MFS has agreed to reimburse the fund for a portion of the payments made by the fund in the amount of $3,888, which is included in the reduction of total expenses in the Statement of Operations. Additionally, MFS has agreed to bear all expenses associated with office space, other administrative support, and supplies provided to the ICCO and Assistant ICCO.
The fund invests in the MFS Institutional Money Market Portfolio which is managed by MFS and seeks current income consistent with preservation of capital and liquidity. Income earned on this investment is included in “Dividends from underlying affiliated funds” in the Statement of Operations. This money market fund does not pay a management fee to MFS.
(4) Portfolio Securities
Purchases and sales of investments, other than short-term obligations, aggregated $1,094,040,778 and $1,158,170,271 respectively.
(5) Shares of Beneficial Interest
The fund’s Declaration of Trust permits the Trustees to issue an unlimited number of full and fractional shares of beneficial interest. Transactions in fund shares were as follows:
| | | | | | | | | | | | | | | | |
| | | Six months ended
4/30/14 | | | Year ended
10/31/13 | |
| | | Shares | | | Amount | | | Shares | | | Amount | |
| Shares sold | | | | | | | | | | | | | | | | |
Class A | | | 18,095,628 | | | | $388,175,575 | | | | 34,888,637 | | | | $701,129,477 | |
Class B | | | 866,194 | | | | 18,404,875 | | | | 2,101,282 | | | | 42,182,911 | |
Class C | | | 4,886,542 | | | | 103,963,085 | | | | 9,368,672 | | | | 188,198,160 | |
Class I | | | 7,269,662 | | | | 157,633,561 | | | | 11,481,949 | | | | 231,275,883 | |
Class R1 | | | 92,757 | | | | 1,982,143 | | | | 194,537 | | | | 3,919,092 | |
Class R2 | | | 756,282 | | | | 16,161,389 | | | | 1,259,943 | | | | 25,254,398 | |
Class R3 | | | 1,058,544 | | | | 22,581,751 | | | | 2,364,238 | | | | 47,243,408 | |
Class R4 | | | 1,367,563 | | | | 29,073,672 | | | | 2,084,641 | | | | 41,999,518 | |
Class R5 | | | 755,180 | | | | 16,259,466 | | | | 126,256 | | | | 2,576,702 | |
| | | 35,148,352 | | | | $754,235,517 | | | | 63,870,155 | | | | $1,283,779,549 | |
36
Notes to Financial Statements (unaudited) – continued
| | | | | | | | | | | | | | | | |
| | | Six months ended
4/30/14 | | | Year ended
10/31/13 | |
| | | Shares | | | Amount | | | Shares | | | Amount | |
| Shares issued to shareholders in reinvestment of distributions | | | | | | | | | | | | | | | | |
Class A | | | 8,265,819 | | | | $171,459,267 | | | | 3,866,407 | | | | $77,197,519 | |
Class B | | | 681,471 | | | | 14,040,604 | | | | 264,317 | | | | 5,231,975 | |
Class C | | | 1,888,502 | | | | 38,922,133 | | | | 678,497 | | | | 13,458,907 | |
Class I | | | 1,127,919 | | | | 23,510,284 | | | | 521,104 | | | | 10,454,484 | |
Class R1 | | | 31,236 | | | | 642,739 | | | | 12,723 | | | | 251,152 | |
Class R2 | | | 293,370 | | | | 6,068,299 | | | | 141,807 | | | | 2,812,537 | |
Class R3 | | | 370,877 | | | | 7,693,366 | | | | 358,909 | | | | 6,969,013 | |
Class R4 | | | 298,306 | | | | 6,201,914 | | | | 133,934 | | | | 2,687,393 | |
Class R5 | | | 30,284 | | | | 631,108 | | | | 2,234 | | | | 45,993 | |
| | | 12,987,784 | | | | $269,169,714 | | | | 5,979,932 | | | | $119,108,973 | |
| | | | |
| Shares reacquired | | | | | | | | | | | | | | | | |
Class A | | | (24,312,625 | ) | | | $(515,354,597 | ) | | | (35,002,327 | ) | | | $(697,958,184 | ) |
Class B | | | (1,237,705 | ) | | | (26,337,793 | ) | | | (2,602,174 | ) | | | (51,881,772 | ) |
Class C | | | (3,219,794 | ) | | | (68,305,443 | ) | | | (7,665,645 | ) | | | (152,500,511 | ) |
Class I | | | (4,098,727 | ) | | | (86,908,017 | ) | | | (10,888,155 | ) | | | (215,750,645 | ) |
Class R1 | | | (91,200 | ) | | | (1,930,000 | ) | | | (304,874 | ) | | | (6,011,656 | ) |
Class R2 | | | (900,607 | ) | | | (19,057,945 | ) | | | (2,306,102 | ) | | | (45,313,765 | ) |
Class R3 | | | (992,522 | ) | | | (21,195,781 | ) | | | (16,084,320 | ) | | | (328,784,721 | ) |
Class R4 | | | (1,089,973 | ) | | | (23,279,852 | ) | | | (1,190,207 | ) | | | (23,987,292 | ) |
Class R5 | | | (365,062 | ) | | | (7,641,195 | ) | | | (29,628 | ) | | | (607,810 | ) |
| | | (36,308,215 | ) | | | $(770,010,623 | ) | | | (76,073,432 | ) | | | $(1,522,796,356 | ) |
| | | | |
| Net change | | | | | | | | | | | | | | | | |
Class A | | | 2,048,822 | | | | $44,280,245 | | | | 3,752,717 | | | | $80,368,812 | |
Class B | | | 309,960 | | | | 6,107,686 | | | | (236,575 | ) | | | (4,466,886 | ) |
Class C | | | 3,555,250 | | | | 74,579,775 | | | | 2,381,524 | | | | 49,156,556 | |
Class I | | | 4,298,854 | | | | 94,235,828 | | | | 1,114,898 | | | | 25,979,722 | |
Class R1 | | | 32,793 | | | | 694,882 | | | | (97,614 | ) | | | (1,841,412 | ) |
Class R2 | | | 149,045 | | | | 3,171,743 | | | | (904,352 | ) | | | (17,246,830 | ) |
Class R3 | | | 436,899 | | | | 9,079,336 | | | | (13,361,173 | ) | | | (274,572,300 | ) |
Class R4 | | | 575,896 | | | | 11,995,734 | | | | 1,028,368 | | | | 20,699,619 | |
Class R5 | | | 420,402 | | | | 9,249,379 | | | | 98,862 | | | | 2,014,885 | |
| | | 11,827,921 | | | | $253,394,608 | | | | (6,223,345 | ) | | | $(119,907,834 | ) |
(6) Line of Credit
The fund and certain other funds managed by MFS participate in a $1.1 billion unsecured committed line of credit, subject to a $1 billion sublimit, provided by a syndication of banks under a credit agreement. Borrowings may be made for temporary financing needs. Interest is charged to each fund, based on its borrowings, generally at a rate equal to the higher of the Federal Reserve funds rate or one month LIBOR plus an agreed upon spread. A commitment fee, based on the average daily, unused portion of the committed line of credit, is allocated among the participating
37
Notes to Financial Statements (unaudited) – continued
funds at the end of each calendar quarter. In addition, the fund and other funds managed by MFS have established unsecured uncommitted borrowing arrangements with certain banks for temporary financing needs. Interest is charged to each fund, based on its borrowings, at a rate equal to the Federal Reserve funds rate plus an agreed upon spread. For the six months ended April 30, 2014, the fund’s commitment fee and interest expense were $11,371 and $0, respectively, and are included in “Miscellaneous” expense in the Statement of Operations.
(7) Transactions in Underlying Affiliated Funds-Affiliated Issuers
An affiliated issuer may be considered one in which the fund owns 5% or more of the outstanding voting securities, or a company which is under common control. For the purposes of this report, the fund assumes the following to be an affiliated issuer:
| | | | | | | | | | | | | | | | |
| Underlying Affiliated Fund | | Beginning
Shares/Par
Amount | | | Acquisitions
Shares/Par
Amount | | | Dispositions
Shares/Par
Amount | | | Ending
Shares/Par
Amount | |
| MFS Institutional Money Market Portfolio | | | 115,909,948 | | | | 576,971,484 | | | | (458,586,951 | ) | | | 234,294,481 | |
| | | | |
| Underlying Affiliated Fund | | Realized
Gain (Loss) | | | Capital Gain
Distributions | | | Dividend
Income | | | Ending
Value | |
| MFS Institutional Money Market Portfolio | | | $— | | | | $— | | | | $54,003 | | | | $234,294,481 | |
38
BOARD REVIEW OF INVESTMENT ADVISORY AGREEMENT
A discussion regarding the Board’s most recent review and renewal of the fund’s Investment Advisory Agreement with MFS is available by clicking on the fund’s name under “Mutual Funds” in the “Products” section of the MFS Web site (mfs.com).
PROXY VOTING POLICIES AND INFORMATION
MFS votes proxies on behalf of the fund pursuant to proxy voting policies and procedures that are available without charge, upon request, by calling 1-800-225-2606, by visiting the Proxy Voting section of mfs.com or by visiting the SEC’s Web site at http://www.sec.gov.
Information regarding how the fund voted proxies relating to portfolio securities during the twelve-month period ended June 30, 2013 is available without charge by visiting the Proxy Voting section of mfs.com or by visiting the SEC’s Web site at http://www.sec.gov.
QUARTERLY PORTFOLIO DISCLOSURE
The fund will file a complete schedule of portfolio holdings with the Securities and Exchange Commission (the Commission) for the first and third quarters of each fiscal year on Form N-Q. A shareholder can obtain the quarterly portfolio holdings report at mfs.com. The fund’s Form N-Q is also available on the EDGAR database on the Commission’s Internet Web site at http://www.sec.gov, and may be reviewed and copied at the:
Public Reference Room
Securities and Exchange Commission
100 F Street, NE, Room 1580
Washington, D.C. 20549
Information on the operation of the Public Reference Room may be obtained by calling the Commission at 1-800-SEC-0330. Copies of the fund’s Form N-Q also may be obtained, upon payment of a duplicating fee, by electronic request at the following e-mail address: publicinfo@sec.gov, or by writing the Public Reference Section at the above address.
FURTHER INFORMATION
From time to time, MFS may post important information about the fund or the MFS funds on the MFS web site (mfs.com). This information is available by visiting the “Commentary & Announcements” and “Market Outlooks” sections of mfs.com or by clicking on the fund’s name under “Mutual Funds” in the “Products” section of mfs.com.
PROVISION OF FINANCIAL REPORTS AND SUMMARY PROSPECTUSES
The fund produces financial reports every six months and updates its summary prospectus and prospectus annually. To avoid sending duplicate copies of materials to households, only one copy of the fund’s annual and semiannual report and summary prospectus may be mailed to shareholders having the same last name and residential address on the fund’s records. However, any shareholder may contact MFSC (please see back cover for address and telephone number) to request that copies of these reports and summary prospectuses be sent personally to that shareholder.
39
Save paper with eDelivery.

| MFS® will send you prospectuses, |
reports, and proxies directly via e-mail so you will get information faster with less mailbox clutter.
To sign up:
1. Go to mfs.com.
2. Log in via MFS® Access.
3. Select eDelivery.
If you own your MFS fund shares through a financial institution or a retirement plan, MFS® TALK, MFS® Access, or eDelivery may not be available to you.
CONTACT
WEB SITE
mfs.com
MFS TALK
1-800-637-8255
24 hours a day
ACCOUNT SERVICE AND LITERATURE
Shareholders
1-800-225-2606
Financial advisors
1-800-343-2829
Retirement plan services
1-800-637-1255
MAILING ADDRESS
MFS Service Center, Inc.
P.O. Box 55824
Boston, MA 02205-5824
OVERNIGHT MAIL
MFS Service Center, Inc.
c/o Boston Financial Data Services
30 Dan Road
Canton, MA 02021-2809
SEMIANNUAL REPORT
April 30, 2014

MFS® GLOBAL TOTAL RETURN FUND

MWT-SEM
MFS® GLOBAL TOTAL RETURN FUND
CONTENTS
The report is prepared for the general information of shareholders. It is authorized for distribution to prospective investors only when preceded or accompanied by a current prospectus.
NOT FDIC INSURED Ÿ MAY LOSE VALUE Ÿ NO BANK GUARANTEE

LETTER FROM THE CHAIRMAN AND CEO
Dear Shareholders:
After gaining momentum late last year, the U.S. economy slipped this winter, as severe weather curtailed activity. More recently, however, labor market data, consumer
confidence, retail sales and industrial output have indicated that the U.S. economy could be regaining traction.
Europe emerged from its recession midway through 2013. However, its pace of growth has been slow, high unemployment persists and the risk of deflation exists. Asia remains vulnerable. China’s economic growth has slowed, and Japan’s early progress toward an economic turnaround continues to face obstacles. Emerging markets have also displayed much higher volatility, affected by the early transition from aggressive central bank monetary easing.
With so much uncertainty, global financial markets began 2014 with much greater volatility than last year’s broad-based rally. For equity investors, attention to company fundamentals has taken on more importance. Bond investors have been attuned to heightened risks from possible interest rate increases.
As always at MFS®, active risk management is an integral part of how we manage your investments. We use a collaborative process, sharing insights across asset classes, regions and economic sectors. Our global team of investment professionals uses a multidisciplined, long-term, diversified investment approach.
We understand that these are challenging economic times. We believe that we can serve you best by applying proven principles, such as asset allocation and diversification, over the long term. We are confident that this approach can serve you well as you work with your financial advisors to reach your goals in the years ahead.
Respectfully,

Robert J. Manning
Chairman and Chief Executive Officer
MFS Investment Management
June 13, 2014
The opinions expressed in this letter are subject to change, may not be relied upon for investment advice, and no forecasts can be guaranteed.
1
PORTFOLIO COMPOSITION
Portfolio structure (i)
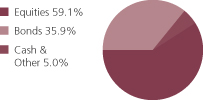
| | | | |
| Top ten holdings (i) | | | | |
| Government of Japan, 1.1%, 6/20/20 | | | 2.1% | |
| Government of Japan, 2.1%, 9/20/24 | | | 1.4% | |
| Johnson & Johnson | | | 1.4% | |
| KDDI Corp. | | | 1.4% | |
| Republic of Italy, 3.75%, 3/01/21 | | | 1.3% | |
| Nestle S.A. | | | 1.3% | |
| Wells Fargo & Co. | | | 1.2% | |
| GlaxoSmithKline PLC | | | 1.2% | |
| Kao Corp. | | | 1.2% | |
| Lockheed Martin Corp. | | | 1.2% | |
|
| Composition including fixed income credit quality (a)(i) | |
| AAA | | | 6.5% | |
| AA | | | 3.5% | |
| A | | | 8.1% | |
| BBB | | | 12.8% | |
| BB (o) | | | 0.0% | |
| U.S. Government | | | 1.9% | |
| Federal Agencies | | | 3.4% | |
| Not Rated | | | (0.3)% | |
| Non-Fixed Income | | | 59.1% | |
| Cash & Other | | | 5.0% | |
| | | | |
| Equity sectors | | | | |
| Financial Services | | | 10.9% | |
| Consumer Staples | | | 10.8% | |
| Health Care | | | 8.2% | |
| Industrial Goods & Services | | | 5.5% | |
| Technology | | | 3.8% | |
| Utilities & Communications | | | 3.5% | |
| Energy | | | 3.4% | |
| Leisure | | | 3.3% | |
| Special Products & Services | | | 3.3% | |
| Basic Materials | | | 2.2% | |
| Retailing | | | 1.9% | |
| Autos & Housing | | | 1.3% | |
| Transportation | | | 1.0% | |
|
| Fixed income sectors (i) | |
| Non-U.S. Government Bonds | | | 18.9% | |
| High Grade Corporates | | | 9.6% | |
| Mortgage-Backed Securities | | | 3.1% | |
| U.S. Treasury Securities | | | 1.6% | |
| Emerging Markets Bonds | | | 1.5% | |
| Commercial Mortgage-Backed Securities | | | 0.9% | |
| U.S. Government Agencies | | | 0.3% | |
| Collateralized Debt Obligations (o) | | | 0.0% | |
2
Portfolio Composition – continued
| | | | |
| Issuer country weightings (i)(x) | |
| United States | | | 45.9% | |
| Japan | | | 12.1% | |
| United Kingdom | | | 9.0% | |
| Germany | | | 4.2% | |
| France | | | 4.2% | |
| Switzerland | | | 4.2% | |
| Canada | | | 3.7% | |
| Spain | | | 2.7% | |
| Italy | | | 2.5% | |
| Other Countries | | | 11.5% | |
| | | | |
| Currency exposure weightings (i)(y) | |
| United States Dollar | | | 48.0% | |
| Euro | | | 17.6% | |
| Japanese Yen | | | 13.8% | |
| British Pound Sterling | | | 9.3% | |
| Swiss Franc | | | 3.9% | |
| Canadian Dollar | | | 1.9% | |
| Australian Dollar | | | 1.1% | |
| Swedish Krona | | | 1.0% | |
| Norwegian Krone | | | 0.8% | |
| Other Currencies | | | 2.6% | |
| (a) | For all securities other than those specifically described below, ratings are assigned to underlying securities utilizing ratings from Moody’s, Fitch, and Standard & Poor’s rating agencies and applying the following hierarchy: If all three agencies provide a rating, the middle rating (after dropping the highest and lowest ratings) is assigned; if two of the three agencies rate a security, the lower of the two is assigned. Ratings are shown in the S&P and Fitch scale (e.g., AAA). Securities rated BBB or higher are considered investment grade. All ratings are subject to change. U.S. Government includes securities issued by the U.S. Department of the Treasury. Federal Agencies includes rated and unrated U.S. Agency fixed-income securities, U.S. Agency mortgage-backed securities, and collateralized mortgage obligations of U.S. Agency mortgage-backed securities. Not Rated includes fixed income securities, including fixed income futures contracts, which have not been rated by any rating agency. Non-Fixed Income includes equity securities (including convertible bonds and equity derivatives) and commodities. The fund may not hold all of these instruments. The fund is not rated by these agencies. |
| (i) | For purposes of this presentation, the components include the market value of securities, and reflect the impact of the equivalent exposure of derivative positions, if any. These amounts may be negative from time to time. Equivalent exposure is a calculated amount that translates the derivative position into a reasonable approximation of the amount of the underlying asset that the portfolio would have to hold at a given point in time to have the same price sensitivity that results from the portfolio’s ownership of the derivative contract. When dealing with derivatives, equivalent exposure is a more representative measure of the potential impact of a position on portfolio performance than market value. The bond component will include any accrued interest amounts. |
| (x) | Represents the portfolio’s exposure to issuer countries as a percentage of a portfolio’s net assets. For purposes of this presentation, United States includes Cash & Other. |
| (y) | Represents the portfolio’s exposure to a particular currency as a percentage of a portfolio’s net assets. For purposes of this presentation, United States Dollar includes Cash & Other. |
Where the fund holds convertible bonds, these are treated as part of the equity portion of the portfolio.
Cash & Other includes cash, other assets less liabilities, offsets to derivative positions, and short-term securities.
Percentages are based on net assets as of 4/30/14.
The portfolio is actively managed and current holdings may be different.
3
EXPENSE TABLE
Fund expenses borne by the shareholders during the period, November 1, 2013 through April 30, 2014
As a shareholder of the fund, you incur two types of costs: (1) transaction costs, including sales charges (loads) on certain purchase or redemption payments, and (2) ongoing costs, including management fees; distribution and service (12b-1) fees; and other fund expenses. This example is intended to help you understand your ongoing costs (in dollars) of investing in the fund and to compare these costs with the ongoing costs of investing in other mutual funds.
The example is based on an investment of $1,000 invested at the beginning of the period and held for the entire period November 1, 2013 through April 30, 2014.
Actual Expenses
The first line for each share class in the following table provides information about actual account values and actual expenses. You may use the information in this line, together with the amount you invested, to estimate the expenses that you paid over the period. Simply divide your account value by $1,000 (for example, an $8,600 account value divided by $1,000 = 8.6), then multiply the result by the number in the first line under the heading entitled “Expenses Paid During Period” to estimate the expenses you paid on your account during this period.
Hypothetical Example for Comparison Purposes
The second line for each share class in the following table provides information about hypothetical account values and hypothetical expenses based on the fund’s actual expense ratio and an assumed rate of return of 5% per year before expenses, which is not the fund’s actual return. The hypothetical account values and expenses may not be used to estimate the actual ending account balance or expenses you paid for the period. You may use this information to compare the ongoing costs of investing in the fund and other funds. To do so, compare this 5% hypothetical example with the 5% hypothetical examples that appear in the shareholder reports of the other funds.
Please note that the expenses shown in the table are meant to highlight your ongoing costs only and do not reflect any transactional costs, such as sales charges (loads). Therefore, the second line for each share class in the table is useful in comparing ongoing costs only, and will not help you determine the relative total costs of owning different funds. In addition, if these transactional costs were included, your costs would have been higher.
4
Expense Table – continued
| | | | | | | | | | | | | | | | | | |
Share
Class | | | | Annualized
Expense Ratio | | | Beginning
Account Value
11/01/13 | | | Ending Account Value
4/30/14 | | | Expenses Paid During
Period (p) 11/01/13-4/30/14 | |
| A | | Actual | | | 1.19% | | | | $1,000.00 | | | | $1,045.67 | | | | $6.04 | |
| | Hypothetical (h) | | | 1.19% | | | | $1,000.00 | | | | $1,018.89 | | | | $5.96 | |
| B | | Actual | | | 1.94% | | | | $1,000.00 | | | | $1,041.25 | | | | $9.82 | |
| | Hypothetical (h) | | | 1.94% | | | | $1,000.00 | | | | $1,015.17 | | | | $9.69 | |
| C | | Actual | | | 1.94% | | | | $1,000.00 | | | | $1,041.32 | | | | $9.82 | |
| | Hypothetical (h) | | | 1.94% | | | | $1,000.00 | | | | $1,015.17 | | | | $9.69 | |
| I | | Actual | | | 0.94% | | | | $1,000.00 | | | | $1,046.74 | | | | $4.77 | |
| | Hypothetical (h) | | | 0.94% | | | | $1,000.00 | | | | $1,020.13 | | | | $4.71 | |
| R1 | | Actual | | | 1.94% | | | | $1,000.00 | | | | $1,041.32 | | | | $9.82 | |
| | Hypothetical (h) | | | 1.94% | | | | $1,000.00 | | | | $1,015.17 | | | | $9.69 | |
| R2 | | Actual | | | 1.44% | | | | $1,000.00 | | | | $1,043.40 | | | | $7.30 | |
| | Hypothetical (h) | | | 1.44% | | | | $1,000.00 | | | | $1,017.65 | | | | $7.20 | |
| R3 | | Actual | | | 1.19% | | | | $1,000.00 | | | | $1,044.51 | | | | $6.03 | |
| | Hypothetical (h) | | | 1.19% | | | | $1,000.00 | | | | $1,018.89 | | | | $5.96 | |
| R4 | | Actual | | | 0.94% | | | | $1,000.00 | | | | $1,046.26 | | | | $4.77 | |
| | Hypothetical (h) | | | 0.94% | | | | $1,000.00 | | | | $1,020.13 | | | | $4.71 | |
| R5 | | Actual | | | 0.86% | | | | $1,000.00 | | | | $1,047.04 | | | | $4.36 | |
| | Hypothetical (h) | | | 0.86% | | | | $1,000.00 | | | | $1,020.53 | | | | $4.31 | |
| (h) | 5% class return per year before expenses. |
| (p) | “Expenses Paid During Period” are equal to each class’s annualized expense ratio, as shown above, multiplied by the average account value over the period, multiplied by 181/365 (to reflect the one-half year period). Expenses paid do not include any applicable sales charges (loads). If these transaction costs had been included, your costs would have been higher. |
5
PORTFOLIO OF INVESTMENTS
4/30/14 (unaudited)
The Portfolio of Investments is a complete list of all securities owned by your fund. It is categorized by broad-based asset classes.
| | | | | | | | |
| Common Stocks - 59.1% | | | | | | | | |
| Issuer | | Shares/Par | | | Value ($) | |
| | | | | | | | |
| Aerospace - 3.4% | | | | | | | | |
| Cobham PLC | | | 868,661 | | | $ | 4,527,540 | |
| Honeywell International, Inc. | | | 108,650 | | | | 10,093,585 | |
| Lockheed Martin Corp. | | | 94,310 | | | | 15,480,043 | |
| Northrop Grumman Corp. | | | 40,320 | | | | 4,899,283 | |
| United Technologies Corp. | | | 89,000 | | | | 10,531,370 | |
| | | | | | | | |
| | | | | | | $ | 45,531,821 | |
| Alcoholic Beverages - 1.5% | | | | | | | | |
| Heineken N.V. (l) | | | 145,423 | | | $ | 10,087,630 | |
| Pernod Ricard S.A. | | | 83,353 | | | | 10,003,998 | |
| | | | | | | | |
| | | | | | | $ | 20,091,628 | |
| Automotive - 0.7% | | | | | | | | |
| Johnson Controls, Inc. | | | 105,180 | | | $ | 4,747,825 | |
| USS Co. Ltd. | | | 295,100 | | | | 4,297,979 | |
| | | | | | | | |
| | | | | | | $ | 9,045,804 | |
| Broadcasting - 1.9% | | | | | | | | |
| Fuji Television Network, Inc. | | | 156,200 | | | $ | 2,629,434 | |
| Nippon Television Holdings, Inc. | | | 167,500 | | | | 2,495,256 | |
| Omnicom Group, Inc. | | | 83,550 | | | | 5,654,664 | |
| Viacom, Inc., “B” | | | 48,710 | | | | 4,139,376 | |
| Walt Disney Co. | | | 123,310 | | | | 9,783,415 | |
| | | | | | | | |
| | | | | | | $ | 24,702,145 | |
| Brokerage & Asset Managers - 0.9% | | | | | | | | |
| BlackRock, Inc. | | | 19,280 | | | $ | 5,803,280 | |
| Computershare Ltd. | | | 198,061 | | | | 2,281,257 | |
| Daiwa Securities Group, Inc. | | | 368,000 | | | | 2,753,656 | |
| Franklin Resources, Inc. | | | 34,535 | | | | 1,807,907 | |
| | | | | | | | |
| | | | | | | $ | 12,646,100 | |
| Business Services - 3.3% | | | | | | | | |
| Accenture PLC, “A” | | | 152,820 | | | $ | 12,259,220 | |
| Amadeus Holdings AG | | | 213,589 | | | | 8,876,346 | |
| Bunzl PLC | | | 246,637 | | | | 7,000,052 | |
| Compass Group PLC | | | 643,610 | | | | 10,236,442 | |
| Nomura Research Institute Ltd. | | | 182,200 | | | | 5,266,308 | |
| | | | | | | | |
| | | | | | | $ | 43,638,368 | |
6
Portfolio of Investments (unaudited) – continued
| | | | | | | | |
| Issuer | | Shares/Par | | | Value ($) | |
| | | | | | | | |
| Common Stocks - continued | | | | | | | | |
| Cable TV - 0.5% | | | | | | | | |
| Comcast Corp., “Special A” | | | 118,370 | | | $ | 6,040,421 | |
| | |
| Chemicals - 1.8% | | | | | | | | |
| 3M Co. | | | 86,758 | | | $ | 12,067,170 | |
| Givaudan S.A. | | | 3,460 | | | | 5,452,812 | |
| PPG Industries, Inc. | | | 34,488 | | | | 6,677,567 | |
| | | | | | | | |
| | | | | | | $ | 24,197,549 | |
| Computer Software - 0.6% | | | | | | | | |
| Oracle Corp. | | | 184,830 | | | $ | 7,555,850 | |
| | |
| Computer Software - Systems - 1.1% | | | | | | | | |
| Canon, Inc. | | | 148,800 | | | $ | 4,653,526 | |
| International Business Machines Corp. | | | 53,404 | | | | 10,492,284 | |
| | | | | | | | |
| | | | | | | $ | 15,145,810 | |
| Construction - 0.7% | | | | | | | | |
| Geberit AG | | | 12,820 | | | $ | 4,272,362 | |
| Stanley Black & Decker, Inc. | | | 53,620 | | | | 4,605,422 | |
| | | | | | | | |
| | | | | | | $ | 8,877,784 | |
| Consumer Products - 3.3% | | | | | | | | |
| Henkel KGaA, IPS | | | 102,372 | | | $ | 11,400,410 | |
| Kao Corp. | | | 411,700 | | | | 15,491,856 | |
| Kose Corp. | | | 73,700 | | | | 2,447,415 | |
| Procter & Gamble Co. | | | 85,490 | | | | 7,057,200 | |
| Reckitt Benckiser Group PLC | | | 98,108 | | | | 7,909,575 | |
| | | | | | | | |
| | | | | | | $ | 44,306,456 | |
| Containers - 0.4% | | | | | | | | |
| Brambles Ltd. | | | 635,442 | | | $ | 5,582,268 | |
| | |
| Electrical Equipment - 1.6% | | | | | | | | |
| Danaher Corp. | | | 70,240 | | | $ | 5,154,211 | |
| Legrand S.A. | | | 104,218 | | | | 6,723,288 | |
| Pentair Ltd. | | | 20,575 | | | | 1,528,517 | |
| Spectris PLC | | | 72,447 | | | | 2,721,609 | |
| Tyco International Ltd. | | | 128,430 | | | | 5,252,787 | |
| | | | | | | | |
| | | | | | | $ | 21,380,412 | |
| Electronics - 1.1% | | | | | | | | |
| Halma PLC | | | 311,120 | | | $ | 2,949,531 | |
| Hirose Electric Co. Ltd. | | | 23,600 | | | | 3,326,415 | |
| Taiwan Semiconductor Manufacturing Co. Ltd., ADR | | | 410,454 | | | | 8,250,125 | |
| | | | | | | | |
| | | | | | | $ | 14,526,071 | |
7
Portfolio of Investments (unaudited) – continued
| | | | | | | | |
| Issuer | | Shares/Par | | | Value ($) | |
| | | | | | | | |
| Common Stocks - continued | | | | | | | | |
| Energy - Independent - 0.7% | | | | | | | | |
| Cairn Energy PLC (a) | | | 543,848 | | | $ | 1,692,303 | |
| Occidental Petroleum Corp. | | | 80,590 | | | | 7,716,493 | |
| | | | | | | | |
| | | | | | | $ | 9,408,796 | |
| Energy - Integrated - 2.7% | | | | | | | | |
| Chevron Corp. | | | 45,818 | | | $ | 5,751,075 | |
| Exxon Mobil Corp. | | | 129,950 | | | | 13,308,180 | |
| Royal Dutch Shell PLC, “A” | | | 311,891 | | | | 12,359,226 | |
| Suncor Energy, Inc. | | | 122,382 | | | | 4,720,871 | |
| | | | | | | | |
| | | | | | | $ | 36,139,352 | |
| Food & Beverages - 2.9% | | | | | | | | |
| General Mills, Inc. | | | 138,970 | | | $ | 7,368,189 | |
| Groupe Danone (l) | | | 206,751 | | | | 15,248,202 | |
| Nestle S.A. | | | 216,892 | | | | 16,745,610 | |
| | | | | | | | |
| | | | | | | $ | 39,362,001 | |
| Food & Drug Stores - 1.2% | | | | | | | | |
| CVS Caremark Corp. | | | 164,790 | | | $ | 11,983,529 | |
| Lawson, Inc. | | | 56,900 | | | | 3,951,582 | |
| | | | | | | | |
| | | | | | | $ | 15,935,111 | |
| General Merchandise - 0.5% | | | | | | | | |
| Target Corp. | | | 118,350 | | | $ | 7,308,113 | |
| | |
| Insurance - 3.8% | | | | | | | | |
| ACE Ltd. | | | 40,770 | | | $ | 4,171,586 | |
| Aon PLC | | | 67,670 | | | | 5,743,830 | |
| Fairfax Financial Holdings Ltd. | | | 10,310 | | | | 4,495,369 | |
| Hiscox Ltd. | | | 255,220 | | | | 3,042,249 | |
| ING Groep N.V. (a) | | | 432,860 | | | | 6,146,407 | |
| MetLife, Inc. | | | 168,940 | | | | 8,844,009 | |
| Prudential Financial, Inc. | | | 60,800 | | | | 4,905,344 | |
| Travelers Cos., Inc. | | | 96,040 | | | | 8,699,303 | |
| Zurich Insurance Group AG | | | 14,451 | | | | 4,139,413 | |
| | | | | | | | |
| | | | | | | $ | 50,187,510 | |
| Leisure & Toys - 0.2% | | | | | | | | |
| Hasbro, Inc. | | | 54,810 | | | $ | 3,028,801 | |
| | |
| Machinery & Tools - 0.4% | | | | | | | | |
| GLORY Ltd. | | | 79,500 | | | $ | 2,054,716 | |
| Neopost S.A. | | | 46,764 | | | | 3,831,697 | |
| | | | | | | | |
| | | | | | | $ | 5,886,413 | |
8
Portfolio of Investments (unaudited) – continued
| | | | | | | | |
| Issuer | | Shares/Par | | | Value ($) | |
| | | | | | | | |
| Common Stocks - continued | | | | | | | | |
| Major Banks - 4.6% | | | | | | | | |
| Bank of New York Mellon Corp. | | | 211,038 | | | $ | 7,147,857 | |
| Goldman Sachs Group, Inc. | | | 35,781 | | | | 5,718,519 | |
| HSBC Holdings PLC | | | 768,456 | | | | 7,837,962 | |
| JPMorgan Chase & Co. | | | 258,730 | | | | 14,483,705 | |
| State Street Corp. | | | 95,170 | | | | 6,144,175 | |
| Sumitomo Mitsui Financial Group, Inc. | | | 59,800 | | | | 2,359,010 | |
| Toronto-Dominion Bank | | | 48,600 | | | | 2,338,103 | |
| Wells Fargo & Co. | | | 321,100 | | | | 15,939,404 | |
| | | | | | | | |
| | | | | | | $ | 61,968,735 | |
| Medical & Health Technology & Services - 0.4% | | | | | | | | |
| Kobayashi Pharmaceutical Co. Ltd. | | | 57,300 | | | $ | 3,474,935 | |
| Quest Diagnostics, Inc. | | | 39,180 | | | | 2,191,337 | |
| | | | | | | | |
| | | | | | | $ | 5,666,272 | |
| Medical Equipment - 1.3% | | | | | | | | |
| Abbott Laboratories | | | 181,800 | | | $ | 7,042,932 | |
| Medtronic, Inc. | | | 116,320 | | | | 6,841,942 | |
| St. Jude Medical, Inc. | | | 55,240 | | | | 3,506,083 | |
| | | | | | | | |
| | | | | | | $ | 17,390,957 | |
| Network & Telecom - 1.0% | | | | | | | | |
| Ericsson, Inc., “B” | | | 807,401 | | | $ | 9,747,621 | |
| Nokia Oyj | | | 513,771 | | | | 3,845,449 | |
| | | | | | | | |
| | | | | | | $ | 13,593,070 | |
| Other Banks & Diversified Financials - 0.8% | | | | | | | | |
| DNB A.S.A. (l) | | | 293,206 | | | $ | 5,184,118 | |
| Hachijuni Bank Ltd. | | | 193,000 | | | | 1,053,397 | |
| North Pacific Ltd. | | | 178,300 | | | | 722,025 | |
| U.S. Bancorp | | | 90,200 | | | | 3,678,356 | |
| | | | | | | | |
| | | | | | | $ | 10,637,896 | |
| Pharmaceuticals - 6.4% | | | | | | | | |
| Bayer AG (l) | | | 83,358 | | | $ | 11,564,672 | |
| GlaxoSmithKline PLC | | | 568,595 | | | | 15,667,458 | |
| Johnson & Johnson | | | 186,040 | | | | 18,843,992 | |
| Novartis AG | | | 122,730 | | | | 10,640,040 | |
| Pfizer, Inc. | | | 486,210 | | | | 15,208,649 | |
| Roche Holding AG | | | 39,068 | | | | 11,452,726 | |
| Santen Pharmaceutical Co. Ltd. | | | 60,000 | | | | 2,676,187 | |
| | | | | | | | |
| | | | | | | $ | 86,053,724 | |
| Printing & Publishing - 0.3% | | | | | | | | |
| Moody’s Corp. | | | 42,890 | | | $ | 3,366,865 | |
9
Portfolio of Investments (unaudited) – continued
| | | | | | | | |
| Issuer | | Shares/Par | | | Value ($) | |
| | | | | | | | |
| Common Stocks - continued | | | | | | | | |
| Railroad & Shipping - 0.2% | | | | | | | | |
| Canadian National Railway Co. | | | 38,290 | | | $ | 2,242,645 | |
| | |
| Real Estate - 0.8% | | | | | | | | |
| Deutsche Wohnen AG (a) | | | 194,042 | | | $ | 4,064,983 | |
| Deutsche Wohnen AG | | | 300,974 | | | | 6,449,157 | |
| | | | | | | | |
| | | | | | | $ | 10,514,140 | |
| Restaurants - 0.5% | | | | | | | | |
| McDonald’s Corp. | | | 71,461 | | | $ | 7,244,716 | |
| | |
| Specialty Stores - 0.2% | | | | | | | | |
| Esprit Holdings Ltd. | | | 1,414,950 | | | $ | 2,354,739 | |
| | |
| Telecommunications - Wireless - 2.1% | | | | | | | | |
| KDDI Corp. | | | 339,400 | | | $ | 18,066,365 | |
| NTT DoCoMo, Inc. | | | 165,800 | | | | 2,630,485 | |
| Vodafone Group PLC | | | 1,824,279 | | | | 6,897,912 | |
| | | | | | | | |
| | | | | | | $ | 27,594,762 | |
| Telephone Services - 1.4% | | | | | | | | |
| AT&T, Inc. | | | 113,610 | | | $ | 4,055,877 | |
| TDC A.S. | | | 365,055 | | | | 3,426,632 | |
| Verizon Communications, Inc. | | | 251,465 | | | | 11,750,959 | |
| | | | | | | | |
| | | | | | | $ | 19,233,468 | |
| Tobacco - 3.0% | | | | | | | | |
| British American Tobacco PLC | | | 169,350 | | | $ | 9,770,246 | |
| Japan Tobacco, Inc. | | | 286,700 | | | | 9,411,309 | |
| Lorillard, Inc. | | | 100,720 | | | | 5,984,782 | |
| Philip Morris International, Inc. | | | 178,080 | | | | 15,213,374 | |
| | | | | | | | |
| | | | | | | $ | 40,379,711 | |
| Trucking - 0.9% | | | | | | | | |
| United Parcel Service, Inc., “B” | | | 32,710 | | | $ | 3,221,935 | |
| Yamato Holdings Co. Ltd. | | | 399,200 | | | | 8,207,741 | |
| | | | | | | | |
| | | | | | | $ | 11,429,676 | |
| Total Common Stocks (Identified Cost, $542,510,484) | | | $ | 790,195,960 | |
| | |
| Bonds - 35.8% | | | | | | | | |
| Asset-Backed & Securitized - 0.9% | | | | | | | | |
| Citigroup/Deutsche Bank Commercial Mortgage Trust, 5.322%, 12/11/49 | | $ | 1,489,951 | | | $ | 1,628,954 | |
| Commercial Mortgage Pass-Through Certificates, “A3”, 5.293%, 12/11/49 | | | 866,766 | | | | 883,180 | |
10
Portfolio of Investments (unaudited) – continued
| | | | | | | | |
| Issuer | | Shares/Par | | | Value ($) | |
| | | | | | | | |
| Bonds - continued | | | | | | |
| Asset-Backed & Securitized - continued | | | | | | | | |
| Commercial Mortgage Pass-Through Certificates, “A4”, 5.306%, 12/10/46 | | $ | 995,797 | | | $ | 1,078,047 | |
| G-Force LLC, CDO, “A2”, 4.83%, 8/22/36 (z) | | | 15,012 | | | | 15,363 | |
| Goldman Sachs Mortgage Securities Corp., FRN, 5.997%, 8/10/45 | | | 3,206,543 | | | | 3,560,747 | |
| JPMorgan Chase Commercial Mortgage Securities Corp., “A3”, FRN, 5.989%, 6/15/49 | | | 1,058,797 | | | | 1,081,823 | |
| JPMorgan Chase Commercial Mortgage Securities Corp., “A3”, FRN, 6.135%, 2/15/51 | | | 970,446 | | | | 973,338 | |
| JPMorgan Chase Commercial Mortgage Securities Corp., “A4”, FRN, 5.989%, 6/15/49 | | | 1,040,000 | | | | 1,148,798 | |
| Merrill Lynch Mortgage Trust, “A3”, FRN, 6.032%, 6/12/50 | | | 153,942 | | | | 157,963 | |
| Merrill Lynch Mortgage Trust, FRN, 6.032%, 6/12/50 | | | 1,040,000 | | | | 1,156,249 | |
| Wachovia Bank Commercial Mortgage Trust, “A4”, FRN, 6.132%, 2/15/51 | | | 510,000 | | | | 560,048 | |
| | | | | | | | |
| | | | | | | $ | 12,244,510 | |
| Automotive - 0.6% | | | | | | | | |
| Daimler Finance North America LLC, 1.875%, 1/11/18 (n) | | $ | 492,000 | | | $ | 493,994 | |
| Delphi Automotive PLC, 4.15%, 3/15/24 | | | 430,000 | | | | 440,003 | |
| Delphi Corp., 5%, 2/15/23 | | | 47,000 | | | | 49,820 | |
| FCE Bank, 1.875%, 5/12/16 | | EUR | 350,000 | | | | 493,850 | |
| Ford Motor Credit Co. LLC, 1.7%, 5/09/16 | | $ | 853,000 | | | | 863,352 | |
| RCI Banque S.A., 4.25%, 4/27/17 | | EUR | 550,000 | | | | 829,952 | |
| Toyota Motor Credit Corp., 0.875%, 7/17/15 | | $ | 1,163,000 | | | | 1,167,956 | |
| TRW Automotive, Inc., 4.5%, 3/01/21 (n) | | | 227,000 | | | | 236,080 | |
| TRW Automotive, Inc., 4.45%, 12/01/23 (n) | | | 520,000 | | | | 530,400 | |
| Volkswagen International Finance N.V., 1.15%, 11/20/15 (n) | | | 1,810,000 | | | | 1,820,938 | |
| Volkswagen International Finance N.V., 2.375%, 3/22/17 (n) | | | 534,000 | | | | 550,488 | |
| Volkswagen International Finance N.V., 3.875%, 9/29/49 | | EUR | 450,000 | | | | 653,153 | |
| | | | | | | | |
| | | | | | | $ | 8,129,986 | |
| Biotechnology - 0.1% | | | | | | | | |
| Life Technologies Corp., 6%, 3/01/20 | | $ | 790,000 | | | $ | 916,593 | |
| | |
| Broadcasting - 0.1% | | | | | | | | |
| Discovery Communications, Inc., 4.875%, 4/01/43 | | $ | 610,000 | | | $ | 613,212 | |
| Myriad International Holdings B.V., 6%, 7/18/20 (n) | | | 650,000 | | | | 710,125 | |
| Vivendi S.A., 4%, 3/31/17 | | EUR | 400,000 | | | | 604,312 | |
| | | | | | | | |
| | | | | | | $ | 1,927,649 | |
| Building - 0.2% | | | | | | | | |
| CRH Finance Ltd., 3.125%, 4/03/23 | | EUR | 350,000 | | | $ | 513,541 | |
| Holcim Finance Luxembourg S.A., 3%, 1/22/24 | | EUR | 450,000 | | | | 645,600 | |
11
Portfolio of Investments (unaudited) – continued
| | | | | | | | |
| Issuer | | Shares/Par | | | Value ($) | |
| | | | | | | | |
| Bonds - continued | | | | | | |
| Building - continued | | | | | | | | |
| Holcim GB Finance Ltd., 8.75%, 4/24/17 | | GBP | 200,000 | | | $ | 399,968 | |
| Mohawk Industries, Inc., 6.125%, 1/15/16 | | $ | 483,000 | | | | 521,640 | |
| Owens Corning, Inc., 6.5%, 12/01/16 | | | 157,000 | | | | 172,885 | |
| Owens Corning, Inc., 4.2%, 12/15/22 | | | 376,000 | | | | 374,971 | |
| | | | | | | | |
| | | | | | | $ | 2,628,605 | |
| Business Services - 0.1% | | | | | | | | |
| Fidelity National Information Services, Inc., 5%, 3/15/22 | | $ | 483,000 | | | $ | 505,645 | |
| Tencent Holdings Ltd., 3.375%, 5/02/19 (z) | | | 281,000 | | | | 282,467 | |
| | | | | | | | |
| | | | | | | $ | 788,112 | |
| Cable TV - 0.2% | | | | | | | | |
| Comcast Corp., 4.65%, 7/15/42 | | $ | 614,000 | | | $ | 629,518 | |
| Cox Communications, Inc., 3.25%, 12/15/22 (n) | | | 595,000 | | | | 576,775 | |
| NBCUniversal Media LLC, 5.15%, 4/30/20 | | | 728,000 | | | | 831,133 | |
| Shaw Communications, 5.65%, 10/01/19 | | CAD | 510,000 | | | | 525,853 | |
| Time Warner Cable, Inc., 5.75%, 6/02/31 | | GBP | 250,000 | | | | 472,638 | |
| | | | | | | | |
| | | | | | | $ | 3,035,917 | |
| Chemicals - 0.2% | | | | | | | | |
| CF Industries, Inc., 5.15%, 3/15/34 | | $ | 424,000 | | | $ | 443,909 | |
| Dow Chemical Co., 8.55%, 5/15/19 | | | 580,000 | | | | 743,529 | |
| FMC Corp., 4.1%, 2/01/24 | | | 436,000 | | | | 450,276 | |
| LYB International Finance B.V., 4%, 7/15/23 | | | 336,000 | | | | 348,087 | |
| LyondellBasell Industries N.V., 5%, 4/15/19 | | | 597,000 | | | | 669,231 | |
| | | | | | | | |
| | | | | | | $ | 2,655,032 | |
| Conglomerates - 0.1% | | | | | | | | |
| Roper Industries, Inc., 1.85%, 11/15/17 | | $ | 251,000 | | | $ | 252,253 | |
| Siemens Financieringsmaat N.V., 5.25%, 9/14/66 | | EUR | 300,000 | | | | 449,327 | |
| Siemens Financieringsmaat N.V., 6.125%, 9/14/66 | | GBP | 150,000 | | | | 272,888 | |
| | | | | | | | |
| | | | | | | $ | 974,468 | |
| Consumer Products - 0.2% | | | | | | | | |
| Henkel AG & Co. KgaA, 5.375%, 11/25/04 | | EUR | 300,000 | | | $ | 440,775 | |
| Newell Rubbermaid, Inc., 4.7%, 8/15/20 | | $ | 730,000 | | | | 779,774 | |
| Prosegur Cia de Seguridad S.A., 2.75%, 4/02/18 | | EUR | 400,000 | | | | 579,030 | |
| Reckitt Benckiser Treasury Services PLC, 3.625%, 9/21/23 (n) | | $ | 731,000 | | | | 733,711 | |
| | | | | | | | |
| | | | | | | $ | 2,533,290 | |
| Defense Electronics - 0.0% | | | | | | | | |
| BAE Systems, 4.125%, 6/08/22 | | GBP | 350,000 | | | $ | 607,621 | |
| | |
| Electronics - 0.0% | | | | | | | | |
| Tyco Electronics Group S.A., 2.375%, 12/17/18 | | $ | 522,000 | | | $ | 519,255 | |
12
Portfolio of Investments (unaudited) – continued
| | | | | | | | |
| Issuer | | Shares/Par | | | Value ($) | |
| | | | | | | | |
| Bonds - continued | | | | | | |
| Emerging Market Quasi-Sovereign - 0.2% | | | | | | | | |
| Comision Federal de Electricidad, 5.75%, 2/14/42 (n) | | $ | 677,000 | | | $ | 672,769 | |
Corporacion Nacional del Cobre de Chile,
3.75%, 11/04/20 (n) | | | 271,000 | | | | 277,590 | |
| Empresa Nacional del Petroleo, 6.25%, 7/08/19 | | | 265,000 | | | | 297,464 | |
| Pemex Project Funding Master Trust, 5.75%, 3/01/18 | | | 523,000 | | | | 581,184 | |
| Petroleos Mexicanos, 5.5%, 1/21/21 | | | 232,000 | | | | 254,040 | |
| | | | | | | | |
| | | | | | | $ | 2,083,047 | |
| Emerging Market Sovereign - 0.8% | | | | | | | | |
| Brazil Notas do Tesouro Nacional, 10%, 1/01/23 | | BRL | 16,192,000 | | | $ | 6,359,903 | |
| Republic of Colombia, 6.125%, 1/18/41 | | $ | 613,000 | | | | 698,820 | |
| Republic of Peru, 7.35%, 7/21/25 | | | 700,000 | | | | 917,000 | |
| United Mexican States, 8.5%, 5/31/29 | | MXN | 27,890,000 | | | | 2,474,472 | |
| | | | | | | | |
| | | | | | | $ | 10,450,195 | |
| Energy - Independent - 0.1% | | | | | | | | |
| Canadian Natural Resources Ltd., 3.8%, 4/15/24 | | $ | 528,000 | | | $ | 538,171 | |
| EOG Resources, Inc., 2.625%, 3/15/23 | | | 269,000 | | | | 256,586 | |
| | | | | | | | |
| | | | | | | $ | 794,757 | |
| Energy - Integrated - 0.1% | | | | | | | | |
| BG Energy Capital PLC, 6.5%, 11/30/72 | | EUR | 350,000 | | | $ | 545,055 | |
| Eni S.p.A., 4%, 6/29/20 | | EUR | 300,000 | | | | 471,868 | |
| Repsol International Finance B.V., 3.625%, 10/07/21 | | EUR | 400,000 | | | | 608,077 | |
| | | | | | | | |
| | | | | | | $ | 1,625,000 | |
| Financial Institutions - 0.1% | | | | | | | | |
| General Electric Capital Corp., 3.1%, 1/09/23 | | $ | 989,000 | | | $ | 978,739 | |
| International Lease Finance Corp., 7.125%, 9/01/18 (n) | | | 569,000 | | | | 660,040 | |
| | | | | | | | |
| | | | | | | $ | 1,638,779 | |
| Food & Beverages - 0.3% | | | | | | | | |
| Anheuser-Busch InBev S.A., 5.375%, 1/15/20 | | $ | 1,008,000 | | | $ | 1,160,852 | |
| Coca-Cola Co., 4.25%, 11/16/16 | | EUR | 350,000 | | | | 523,958 | |
| Conagra Foods, Inc., 3.2%, 1/25/23 | | $ | 729,000 | | | | 703,189 | |
| Grupo Bimbo S.A.B. de C.V., 4.5%, 1/25/22 (n) | | | 629,000 | | | | 651,896 | |
| Tyson Foods, Inc., 6.6%, 4/01/16 | | | 1,200,000 | | | | 1,320,064 | |
| Wm. Wrigley Jr. Co., 2.9%, 10/21/19 (n) | | | 277,000 | | | | 281,417 | |
| | | | | | | | |
| | | | | | | $ | 4,641,376 | |
| Food & Drug Stores - 0.0% | | | | | | | | |
| CVS Caremark Corp., 5.75%, 6/01/17 | | $ | 305,000 | | | $ | 345,215 | |
13
Portfolio of Investments (unaudited) – continued
| | | | | | | | |
| Issuer | | Shares/Par | | | Value ($) | |
| | | | | | | | |
| Bonds - continued | | | | | | |
| Forest & Paper Products - 0.1% | | | | | | | | |
| Georgia-Pacific LLC, 5.4%, 11/01/20 (n) | | $ | 793,000 | | | $ | 902,925 | |
| Packaging Corp. of America, 3.9%, 6/15/22 | | | 483,000 | | | | 489,284 | |
| | | | | | | | |
| | | | | | | $ | 1,392,209 | |
| Gaming & Lodging - 0.1% | | | | | | | | |
| Wyndham Worldwide Corp., 2.5%, 3/01/18 | | $ | 500,000 | | | $ | 504,443 | |
| Wyndham Worldwide Corp., 5.625%, 3/01/21 | | | 350,000 | | | | 383,693 | |
| | | | | | | | |
| | | | | | | $ | 888,136 | |
| Insurance - 0.4% | | | | | | | | |
| American International Group, Inc., 4.875%, 6/01/22 | | $ | 226,000 | | | $ | 251,416 | |
| American International Group, Inc., 4.875%, 3/15/67 | | EUR | 600,000 | | | | 855,301 | |
| Assicurazioni Generali S.p.A., 7.75%, 12/12/42 | | EUR | 200,000 | | | | 347,184 | |
| Aviva PLC, FRN, 5.7%, 9/29/49 | | EUR | 930,000 | | | | 1,339,432 | |
| CNP Assurances S.A., 6% to 2020, FRN to 9/14/40 | | EUR | 450,000 | | | | 706,955 | |
| Delta Lloyd Levensverzek, FRN, 9%, 8/29/42 | | EUR | 450,000 | | | | 830,893 | |
| UnumProvident Corp., 6.85%, 11/15/15 (n) | | $ | 1,367,000 | | | | 1,481,646 | |
| | | | | | | | |
| | | | | | | $ | 5,812,827 | |
| Insurance - Property & Casualty - 0.5% | | | | | | | | |
| Amlin PLC, 6.5%, 12/19/26 | | GBP | 200,000 | | | $ | 354,564 | |
| AXIS Capital Holdings Ltd., 5.75%, 12/01/14 | | $ | 1,440,000 | | | | 1,483,226 | |
| AXIS Specialty Finance LLC, 2.65%, 4/01/19 | | | 86,000 | | | | 86,389 | |
| Berkshire Hathaway, Inc., 4.5%, 2/11/43 | | | 490,000 | | | | 493,075 | |
| Chubb Corp., 6.375% to 4/15/17, FRN to 3/29/67 | | | 730,000 | | | | 810,300 | |
| Clerical Medical Finance PLC, 4.25%, 6/24/49 | | EUR | 500,000 | | | | 701,694 | |
| CNA Financial Corp., 3.95%, 5/15/24 | | $ | 306,000 | | | | 312,297 | |
| Marsh & McLennan Cos., Inc., 2.55%, 10/15/18 | | | 293,000 | | | | 297,724 | |
| QBE Capital Funding IV LP, 7.5% to 2021, FRN to 5/24/41 | | GBP | 300,000 | | | | 562,523 | |
| ZFS Finance USA Trust II, 6.45% to 6/15/16, FRN to 12/15/65 (n) | | $ | 1,259,000 | | | | 1,353,425 | |
| | | | | | | | |
| | | | | | | $ | 6,455,217 | |
| International Market Quasi-Sovereign - 0.4% | | | | | | | | |
| Caisse D’amortissement de la Dette Sociale, 1%, 5/25/18 | | EUR | 400,000 | | | $ | 560,948 | |
| Electricite de France, 5.25% to 1/29/13, FRN to 12/29/49 (n) | | $ | 810,000 | | | | 826,605 | |
| Electricite de France, 6% to 2026, FRN to 12/29/49 | | GBP | 300,000 | | | | 529,617 | |
| ESB Finance Ltd., 4.375%, 11/21/19 | | EUR | 400,000 | | | | 632,127 | |
| Statoil A.S.A., 4.25%, 11/23/41 | | $ | 660,000 | | | | 657,788 | |
| Statoil A.S.A., FRN, 0.514%, 5/15/18 | | | 477,000 | | | | 477,197 | |
| Temasek Financial I Ltd., 2.375%, 1/23/23 (n) | | | 1,450,000 | | | | 1,346,183 | |
| | | | | | | | |
| | | | | | | $ | 5,030,465 | |
14
Portfolio of Investments (unaudited) – continued
| | | | | | | | |
| Issuer | | Shares/Par | | | Value ($) | |
| | | | | | | | |
| Bonds - continued | | | | | | |
| International Market Sovereign - 18.2% | | | | | | | | |
| Federal Republic of Germany, 2.5%, 7/04/44 | | EUR | 1,941,000 | | | $ | 2,786,881 | |
| Federal Republic of Germany, 3.25%, 7/04/21 | | EUR | 3,231,000 | | | | 5,184,716 | |
| Federal Republic of Germany, 6.25%, 1/04/30 | | EUR | 4,191,000 | | | | 9,056,484 | |
| Government of Australia, 5.75%, 5/15/21 | | AUD | 11,186,000 | | | | 11,747,091 | |
| Government of Canada, 4.5%, 6/01/15 | | CAD | 4,984,000 | | | | 4,718,396 | |
| Government of Canada, 4.25%, 6/01/18 | | CAD | 13,092,000 | | | | 13,260,301 | |
| Government of Canada, 3.25%, 6/01/21 | | CAD | 8,191,000 | | | | 8,087,496 | |
| Government of Canada, 5.75%, 6/01/33 | | CAD | 2,272,000 | | | | 2,961,695 | |
| Government of Japan, 1.1%, 6/20/20 | | JPY | 2,782,400,000 | | | | 28,576,406 | |
| Government of Japan, 2.1%, 9/20/24 | | JPY | 1,723,350,000 | | | | 19,283,365 | |
| Government of Japan, 2.2%, 9/20/27 | | JPY | 850,700,000 | | | | 9,673,957 | |
| Government of Japan, 2.4%, 3/20/37 | | JPY | 325,150,000 | | | | 3,658,412 | |
| Government of Japan, 2%, 3/20/52 | | JPY | 127,000,000 | | | | 1,317,046 | |
| Kingdom of Belgium, 4%, 3/28/32 | | EUR | 578,000 | | | | 945,651 | |
| Kingdom of Belgium, 4.25%, 9/28/21 | | EUR | 5,416,000 | | | | 8,973,152 | |
| Kingdom of Norway, 3.75%, 5/25/21 | | NOK | 7,983,000 | | | | 1,454,052 | |
| Kingdom of Spain, 5.4%, 1/31/23 | | EUR | 4,179,000 | | | | 6,949,804 | |
| Kingdom of Spain, 5.5%, 7/30/17 | | EUR | 3,857,000 | | | | 6,086,131 | |
| Kingdom of Spain, 4.6%, 7/30/19 | | EUR | 4,313,000 | | | | 6,839,110 | |
| Kingdom of Sweden, 5%, 12/01/20 | | SEK | 19,340,000 | | | | 3,606,522 | |
| Kingdom of the Netherlands, 3.5%, 7/15/20 | | EUR | 4,059,000 | | | | 6,462,494 | |
| Kingdom of the Netherlands, 5.5%, 1/15/28 | | EUR | 1,035,000 | | | | 2,017,384 | |
| Republic of Austria, 4.65%, 1/15/18 | | EUR | 2,195,000 | | | | 3,506,282 | |
| Republic of Austria, 1.75%, 10/20/23 | | EUR | 2,026,000 | | | | 2,817,708 | |
| Republic of France, 2.5%, 10/25/20 | | EUR | 2,381,000 | | | | 3,574,757 | |
| Republic of France, 6%, 10/25/25 | | EUR | 2,350,000 | | | | 4,547,963 | |
| Republic of France, 4.75%, 4/25/35 | | EUR | 2,910,000 | | | | 5,327,191 | |
| Republic of Iceland, 4.875%, 6/16/16 (n) | | $ | 2,826,000 | | | | 2,967,300 | |
| Republic of Ireland, 4.5%, 4/18/20 | | EUR | 4,879,000 | | | | 7,826,315 | |
| Republic of Ireland, 5.4%, 3/13/25 | | EUR | 3,141,000 | | | | 5,313,869 | |
| Republic of Italy, 5.25%, 8/01/17 | | EUR | 7,852,000 | | | | 12,269,296 | |
| Republic of Italy, 3.75%, 3/01/21 | | EUR | 11,534,000 | | | | 17,401,651 | |
| United Kingdom Treasury, 5%, 3/07/18 | | GBP | 3,229,000 | | | | 6,166,199 | |
| United Kingdom Treasury, 8%, 6/07/21 | | GBP | 2,024,000 | | | | 4,705,925 | |
| United Kingdom Treasury, 4.25%, 12/07/27 | | GBP | 189,000 | | | | 362,468 | |
| United Kingdom Treasury, 4.25%, 3/07/36 | | GBP | 1,761,000 | | | | 3,378,268 | |
| | | | | | | | |
| | | | | | | $ | 243,811,738 | |
| Major Banks - 1.9% | | | | | | | | |
| ABN AMRO Bank N.V., 4.25%, 2/02/17 (n) | | $ | 865,000 | | | $ | 928,967 | |
| ABN AMRO Bank N.V., 7.125%, 7/06/22 | | EUR | 300,000 | | | | 523,677 | |
| Banco Santander U.S. Debt S.A.U., 3.781%, 10/07/15 (n) | | $ | 1,000,000 | | | | 1,038,063 | |
| Bank of America Corp., 4.125%, 1/22/24 | | | 1,184,000 | | | | 1,200,741 | |
15
Portfolio of Investments (unaudited) – continued
| | | | | | | | |
| Issuer | | Shares/Par | | | Value ($) | |
| | | | | | | | |
| Bonds - continued | | | | | | |
| Major Banks - continued | | | | | | | | |
| Bank of America Corp., 4.875%, 4/01/44 | | $ | 449,000 | | | $ | 456,401 | |
| Barclays Bank PLC, 6%, 1/14/21 | | EUR | 617,000 | | | | 1,015,304 | |
| Barclays Bank PLC, 6.75%, 1/16/23 | | GBP | 250,000 | | | | 465,438 | |
| BBVA Senior Finance S.A., 3.25%, 3/21/16 | | EUR | 300,000 | | | | 433,407 | |
| Credit Agricole S.A., 7.375%, 12/18/23 | | GBP | 200,000 | | | | 411,281 | |
| Credit Agricole S.A., 7.875%, 10/29/49 | | EUR | 400,000 | | | | 656,217 | |
| Credit Suisse Group AG, 6.5%, 8/08/23 (n) | | $ | 820,000 | | | | 915,358 | |
| Goldman Sachs Group, Inc., 5.75%, 1/24/22 | | | 1,181,000 | | | | 1,347,510 | |
| HSBC Bank PLC, FRN, 0.864%, 5/15/18 (n) | | | 1,116,000 | | | | 1,124,433 | |
| HSBC USA, Inc., 4.875%, 8/24/20 | | | 1,000,000 | | | | 1,099,031 | |
| ING Bank N.V., 4.875%, 1/18/21 | | EUR | 250,000 | | | | 415,808 | |
| ING Bank N.V., 5.8%, 9/25/23 (n) | | $ | 630,000 | | | | 690,719 | |
| ING Bank N.V., FRN, 1.635%, 6/09/14 (n) | | | 1,260,000 | | | | 1,261,835 | |
| JPMorgan Chase & Co., 4.25%, 10/15/20 | | | 1,190,000 | | | | 1,279,401 | |
| JPMorgan Chase & Co., 6.75% to 2/01/24, FRN to 8/29/49 | | | 515,000 | | | | 545,900 | |
| Morgan Stanley, 7.3%, 5/13/19 | | | 980,000 | | | | 1,188,125 | |
| Morgan Stanley, 5.5%, 7/28/21 | | | 490,000 | | | | 554,515 | |
| Nordea Bank AB, FRN, 0.684%, 5/13/16 (n) | | | 2,050,000 | | | | 2,061,173 | |
| PNC Bank N.A., 3.8%, 7/25/23 | | | 600,000 | | | | 610,304 | |
| PNC Financial Services Group, Inc., FRN, 6.75%, 12/31/49 | | | 640,000 | | | | 705,600 | |
| Regions Financial Corp., 2%, 5/15/18 | | | 602,000 | | | | 595,074 | |
| Royal Bank of Scotland PLC, 5.5%, 3/23/20 | | EUR | 300,000 | | | | 497,938 | |
| Royal Bank of Scotland PLC, 6.934%, 4/09/18 | | EUR | 400,000 | | | | 636,270 | |
| Societe Generale S.A., 4.25%, 7/13/22 | | EUR | 300,000 | | | | 488,737 | |
| Wells Fargo & Co., 2.1%, 5/08/17 | | $ | 1,290,000 | | | | 1,322,523 | |
| Wells Fargo & Co., 5.375%, 11/02/43 | | | 201,000 | | | | 216,446 | |
| Wells Fargo & Co., 5.90% to 6/15/24, FRN to 12/29/49 | | | 650,000 | | | | 665,665 | |
| | | | | | | | |
| | | | | | | $ | 25,351,861 | |
| Medical & Health Technology & Services - 0.1% | | | | | | | | |
| Express Scripts Holding Co., 2.65%, 2/15/17 | | $ | 1,390,000 | | | $ | 1,442,042 | |
| | |
| Metals & Mining - 0.4% | | | | | | | | |
| Barrick Gold Corp., 4.1%, 5/01/23 | | $ | 499,000 | | | $ | 485,896 | |
| Barrick International (Barbados) Corp., 5.75%, 10/15/16 (n) | | | 705,000 | | | | 775,549 | |
| Cameco Corp., 5.67%, 9/02/19 | | CAD | 520,000 | | | | 534,276 | |
| Glencore Finance Europe, 6.5%, 2/27/19 | | GBP | 200,000 | | | | 385,387 | |
| Kinross Gold Corp., 5.95%, 3/15/24 (n) | | $ | 278,000 | | | | 281,479 | |
| Plains Exploration & Production Co., 6.875%, 2/15/23 | | | 1,050,000 | | | | 1,176,000 | |
| Rio Tinto Finance (USA) PLC, 3.5%, 3/22/22 | | | 500,000 | | | | 504,877 | |
| Rio Tinto Finance PLC, 2%, 5/11/20 | | EUR | 300,000 | | | | 425,810 | |
| Southern Copper Corp., 6.75%, 4/16/40 | | $ | 559,000 | | | | 594,585 | |
| Xstrata Finance Canada Ltd., 5.25%, 6/13/17 | | EUR | 300,000 | | | | 464,751 | |
| | | | | | | | |
| | | | | | | $ | 5,628,610 | |
16
Portfolio of Investments (unaudited) – continued
| | | | | | | | |
| Issuer | | Shares/Par | | | Value ($) | |
| | | | | | | | |
| Bonds - continued | | | | | | |
| Mortgage-Backed - 3.1% | | | | | | | | |
| Fannie Mae, 5.5%, 2/01/15 - 1/01/37 | | $ | 354,190 | | | $ | 368,825 | |
| Fannie Mae, 4.78%, 8/01/15 | | | 319,688 | | | | 329,418 | |
| Fannie Mae, 4.856%, 8/01/15 | | | 253,033 | | | | 260,611 | |
| Fannie Mae, 5.432%, 2/01/16 | | | 265,466 | | | | 282,833 | |
| Fannie Mae, 5.09%, 12/01/16 | | | 355,704 | | | | 388,036 | |
| Fannie Mae, 5.012%, 1/01/17 | | | 124,673 | | | | 127,100 | |
| Fannie Mae, 5.05%, 1/01/17 | | | 310,270 | | | | 333,305 | |
| Fannie Mae, 5.204%, 1/01/18 | | | 527,686 | | | | 561,823 | |
| Fannie Mae, 3.849%, 7/01/18 | | | 385,570 | | | | 415,843 | |
| Fannie Mae, 2.578%, 9/25/18 | | | 900,000 | | | | 930,143 | |
| Fannie Mae, 5.1%, 3/01/19 | | | 323,333 | | | | 352,364 | |
| Fannie Mae, 5.18%, 3/01/19 | | | 323,680 | | | | 353,440 | |
| Fannie Mae, 5%, 12/01/20 - 8/01/40 | | | 4,225,886 | | | | 4,661,736 | |
| Fannie Mae, 4.5%, 3/01/25 - 3/01/34 | | | 1,524,750 | | | | 1,639,856 | |
| Fannie Mae, 6%, 9/01/37 - 6/01/38 | | | 738,869 | | | | 826,941 | |
| Fannie Mae, 4%, 2/01/41 | | | 1,378,171 | | | | 1,444,654 | |
| Fannie Mae, 3.5%, 5/01/43 | | | 3,638,375 | | | | 3,701,930 | |
| Fannie Mae, TBA, 4.5%, 8/01/44 | | | 1,200,000 | | | | 1,288,313 | |
| Freddie Mac, 1.426%, 8/25/17 | | | 927,000 | | | | 933,990 | |
| Freddie Mac, 3.882%, 11/25/17 | | | 733,000 | | | | 789,332 | |
| Freddie Mac, 2.412%, 8/25/18 | | | 802,000 | | | | 823,463 | |
| Freddie Mac, 5.085%, 3/25/19 | | | 589,000 | | | | 665,533 | |
| Freddie Mac, 1.883%, 5/25/19 | | | 1,250,000 | | | | 1,243,535 | |
| Freddie Mac, 3.32%, 7/25/20 | | | 434,356 | | | | 458,086 | |
| Freddie Mac, 5.5%, 7/01/37 | | | 281,125 | | | | 311,259 | |
| Freddie Mac, 4.5%, 5/01/40 | | | 3,636,066 | | | | 3,907,600 | |
| Freddie Mac, TBA, 4%, 5/01/44 | | | 5,180,000 | | | | 5,419,778 | |
| Ginnie Mae, 5%, 5/15/40 | | | 1,169,911 | | | | 1,289,208 | |
| Ginnie Mae, 3.5%, 6/20/43 | | | 3,380,172 | | | | 3,483,315 | |
| Ginnie Mae, TBA, 4%, 5/01/44 | | | 3,338,000 | | | | 3,532,543 | |
| | | | | | | | |
| | | | | | | $ | 41,124,813 | |
| Natural Gas - Distribution - 0.1% | | | | | | | | |
| Gas Natural Fenosa, 3.875%, 1/17/23 | | EUR | 400,000 | | | $ | 622,447 | |
| GDF SUEZ, 5%, 10/01/60 | | GBP | 250,000 | | | | 454,737 | |
| | | | | | | | |
| | | | | | | $ | 1,077,184 | |
| Natural Gas - Pipeline - 0.4% | | | | | | | | |
| Enbridge, Inc., 3.19%, 12/05/22 | | CAD | 600,000 | | | $ | 538,744 | |
| Energy Transfer Partners LP, 4.65%, 6/01/21 | | $ | 482,000 | | | | 514,031 | |
| Energy Transfer Partners LP, 3.6%, 2/01/23 | | | 399,000 | | | | 387,949 | |
| Enterprise Products Operating LLC, 3.9%, 2/15/24 | | | 346,000 | | | | 349,906 | |
| Spectra Energy Partners LP, 4.75%, 3/15/24 | | | 1,158,000 | | | | 1,239,355 | |
17
Portfolio of Investments (unaudited) – continued
| | | | | | | | |
| Issuer | | Shares/Par | | | Value ($) | |
| | | | | | | | |
| Bonds - continued | | | | | | |
| Natural Gas - Pipeline - continued | | | | | | | | |
| Sunoco Logistics Partners LP, 5.3%, 4/01/44 | | $ | 571,000 | | | $ | 592,659 | |
| Trans-Canada Pipelines Ltd., 5.1%, 1/11/17 | | CAD | 520,000 | | | | 515,545 | |
| Williams Cos., Inc., 3.7%, 1/15/23 | | $ | 861,000 | | | | 794,985 | |
| Williams Partners LP, 5.4%, 3/04/44 | | | 408,000 | | | | 429,815 | |
| | | | | | | | |
| | | | | | | $ | 5,362,989 | |
| Network & Telecom - 0.4% | | | | | | | | |
| AT&T, Inc., 1.4%, 12/01/17 | | $ | 672,000 | | | $ | 669,355 | |
| British Telecommunications PLC, 5.75%, 12/07/28 | | GBP | 330,000 | | | | 639,122 | |
| Deutsche Telekom I, 4.875%, 4/22/25 | | EUR | 300,000 | | | | 504,037 | |
| Telefonica Emisiones S.A.U., 3.987%, 1/23/23 | | EUR | 500,000 | | | | 772,841 | |
| Verizon Communications, Inc., 5.15%, 9/15/23 | | $ | 478,000 | | | | 526,917 | |
| Verizon Communications, Inc., 6.4%, 9/15/33 | | | 725,000 | | | | 874,198 | |
| Verizon Communications, Inc., 5.05%, 3/15/34 | | | 395,000 | | | | 414,235 | |
| Verizon Communications, Inc., 6.55%, 9/15/43 | | | 525,000 | | | | 647,584 | |
| | | | | | | | |
| | | | | | | $ | 5,048,289 | |
| Other Banks & Diversified Financials - 0.9% | | | | | | | | |
| Banco de Credito del Peru, 6.125% to 4/24/22, FRN to 4/24/27 (n) | | $ | 840,000 | | | $ | 879,480 | |
| Banque Federative du Credit Mutuel, 2%, 9/19/19 | | EUR | 300,000 | | | | 426,974 | |
| BB&T Corp., 3.95%, 4/29/16 | | $ | 1,290,000 | | | | 1,370,106 | |
| BBVA Bancomer S.A. de C.V., 6.75%, 9/30/22 (n) | | | 901,000 | | | | 1,004,615 | |
| Caixabank S.A., 3.25%, 1/22/16 | | EUR | 400,000 | | | | 575,665 | |
| Capital One Bank (USA) N.A., 3.375%, 2/15/23 | | $ | 900,000 | | | | 888,999 | |
| Citigroup, Inc., 6.125%, 5/15/18 | | | 386,000 | | | | 444,562 | |
| Discover Bank, 7%, 4/15/20 | | | 1,065,000 | | | | 1,274,149 | |
| Intesa Sanpaolo S.p.A., 4.125%, 9/19/16 | | EUR | 300,000 | | | | 444,436 | |
| Intesa Sanpaolo S.p.A., 5.25%, 1/28/22 | | GBP | 300,000 | | | | 539,758 | |
| KBC Ifima N.V., 4.5%, 3/27/17 | | EUR | 300,000 | | | | 457,742 | |
| Lloyds TSB Bank PLC, 6.5%, 3/24/20 | | EUR | 350,000 | | | | 585,466 | |
| Macquarie Group Ltd., 3%, 12/03/18 (n) | | $ | 418,000 | | | | 424,312 | |
| Rabobank Nederland N.V., 4%, 9/19/22 | | GBP | 250,000 | | | | 442,188 | |
| Santander Financial Issuances Ltd., 4.5%, 9/30/19 | | EUR | 300,000 | | | | 409,962 | |
| Svenska Handelsbanken AB, FRN, 0.684%, 3/21/16 | | $ | 1,210,000 | | | | 1,215,739 | |
| Swedbank AB, 2.125%, 9/29/17 (n) | | | 204,000 | | | | 207,302 | |
| Swedbank AB, 1.75%, 3/12/18 (n) | | | 728,000 | | | | 722,693 | |
| U.S. Bancorp, 2.95%, 7/15/22 | | | 196,000 | | | | 189,763 | |
| | | | | | | | |
| | | | | | | $ | 12,503,911 | |
| Personal Computers & Peripherals - 0.0% | | | | | | | | |
| Equifax, Inc., 3.3%, 12/15/22 | | $ | 483,000 | | | $ | 468,236 | |
18
Portfolio of Investments (unaudited) – continued
| | | | | | | | |
| Issuer | | Shares/Par | | | Value ($) | |
| | | | | | | | |
| Bonds - continued | | | | | | |
| Pharmaceuticals - 0.3% | | | | | | | | |
| AbbVie, Inc., 1.2%, 11/06/15 | | $ | 1,670,000 | | | $ | 1,683,757 | |
| Celgene Corp., 1.9%, 8/15/17 | | | 483,000 | | | | 489,875 | |
| Gilead Sciences, Inc., 3.7%, 4/01/24 | | | 988,000 | | | | 1,002,606 | |
| Mylan, Inc., 2.55%, 3/28/19 | | | 216,000 | | | | 216,684 | |
| Teva Pharmaceutical Finance B.V., 2.95%, 12/18/22 | | | 602,000 | | | | 573,307 | |
| Watson Pharmaceuticals, Inc., 1.875%, 10/01/17 | | | 531,000 | | | | 535,580 | |
| | | | | | | | |
| | | | | | | $ | 4,501,809 | |
| Printing & Publishing - 0.1% | | | | | | | | |
| Moody’s Corp., 4.875%, 2/15/24 | | $ | 670,000 | | | $ | 712,680 | |
| Wolters Kluwer N.V., 6.375%, 4/10/18 | | EUR | 300,000 | | | | 495,942 | |
| | | | | | | | |
| | | | | | | $ | 1,208,622 | |
| Railroad & Shipping - 0.1% | | | | | | | | |
| CSX Corp., 4.1%, 3/15/44 | | $ | 969,000 | | | $ | 907,037 | |
| | |
| Real Estate - 0.2% | | | | | | | | |
| AvalonBay Communities, Inc., REIT, 3.625%, 10/01/20 | | $ | 102,000 | | | $ | 105,905 | |
| Boston Properties, Inc., REIT, 3.125%, 9/01/23 | | | 669,000 | | | | 642,578 | |
| ERP Operating LP, REIT, 3%, 4/15/23 | | | 77,000 | | | | 73,620 | |
| Hammerson PLC, 2.75%, 9/26/19 | | EUR | 300,000 | | | | 437,411 | |
| Hammerson PLC, 6%, 2/23/26 | | GBP | 220,000 | | | | 435,578 | |
| Simon Property Group, Inc., REIT, 5.65%, 2/01/20 | | $ | 640,000 | | | | 745,273 | |
| WEA Finance LLC/WT Finance Australia, 3.375%, 10/03/22 (n) | | | 309,000 | | | | 312,043 | |
| | | | | | | | |
| | | | | | | $ | 2,752,408 | |
| Retailers - 0.3% | | | | | | | | |
| Cencosud S.A., 5.5%, 1/20/21 | | $ | 586,000 | | | $ | 609,322 | |
| Dollar General Corp., 4.125%, 7/15/17 | | | 500,000 | | | | 534,255 | |
| Gap, Inc., 5.95%, 4/12/21 | | | 738,000 | | | | 839,823 | |
| Home Depot, Inc., 5.95%, 4/01/41 | | | 678,000 | | | | 834,035 | |
| Marks & Spencer PLC, 4.75%, 6/12/25 | | GBP | 300,000 | | | | 515,465 | |
| Wal-Mart Stores, Inc., 4.3%, 4/22/44 | | $ | 459,000 | | | | 456,642 | |
| | | | | | | | |
| | | | | | | $ | 3,789,542 | |
| Specialty Chemicals - 0.1% | | | | | | | | |
| Ecolab, Inc., 3%, 12/08/16 | | $ | 500,000 | | | $ | 525,673 | |
| Mexichem S.A.B. de C.V., 6.75%, 9/19/42 (n) | | | 384,000 | | | | 389,280 | |
| | | | | | | | |
| | | | | | | $ | 914,953 | |
| Specialty Stores - 0.1% | | | | | | | | |
| Advance Auto Parts, Inc., 4.5%, 12/01/23 | | $ | 394,000 | | | $ | 412,719 | |
| Canadian Tire Corp. Ltd., 4.95%, 6/01/15 | | CAD | 535,000 | | | | 505,313 | |
| | | | | | | | |
| | | | | | | $ | 918,032 | |
19
Portfolio of Investments (unaudited) – continued
| | | | | | | | |
| Issuer | | Shares/Par | | | Value ($) | |
| | | | | | | | |
| Bonds - continued | | | | | | |
| Supermarkets - 0.1% | | | | | | | | |
| Delhaize Group, 3.125%, 2/27/20 | | EUR | 300,000 | | | $ | 444,648 | |
| Morrison (WM) Supermarkets, 3.5%, 7/27/26 | | GBP | 200,000 | | | | 311,291 | |
| | | | | | | | |
| | | | | | | $ | 755,939 | |
| Supranational - 0.1% | | | | | | | | |
| European Investment Bank, 4.25%, 4/15/19 | | EUR | 450,000 | | | $ | 726,463 | |
| | |
| Telecommunications - Wireless - 0.2% | | | | | | | | |
| America Movil S.A.B. de C.V., 4.75%, 6/28/22 | | EUR | 500,000 | | | $ | 823,115 | |
| American Tower Corp., REIT, 4.7%, 3/15/22 | | $ | 167,000 | | | | 175,297 | |
| American Tower Corp., REIT, 3.5%, 1/31/23 | | | 502,000 | | | | 482,630 | |
| Crown Castle Towers LLC, 6.113%, 1/15/20 (n) | | | 615,000 | | | | 711,811 | |
| Rogers Communications, Inc., 5%, 3/15/44 | | | 344,000 | | | | 352,033 | |
| | | | | | | | |
| | | | | | | $ | 2,544,886 | |
| Telephone Services - 0.0% | | | | | | | | |
| TELUS Corp., 5.05%, 7/23/20 | | CAD | 520,000 | | | $ | 527,506 | |
| | |
| Tobacco - 0.2% | | | | | | | | |
| Altria Group, Inc., 2.85%, 8/09/22 | | $ | 960,000 | | | $ | 913,696 | |
| Imperial Tobacco Group PLC, 5.5%, 9/28/26 | | GBP | 350,000 | | | | 657,495 | |
| Lorillard Tobacco Co., 8.125%, 6/23/19 | | $ | 592,000 | | | | 735,936 | |
| Philip Morris International, Inc., 2.875%, 3/03/26 | | EUR | 400,000 | | | | 564,163 | |
| | | | | | | | |
| | | | | | | $ | 2,871,290 | |
| Transportation - Services - 0.1% | | | | | | | | |
| ERAC USA Finance Co., 2.75%, 3/15/17 (n) | | $ | 192,000 | | | $ | 198,021 | |
| ERAC USA Finance Co., 7%, 10/15/37 (n) | | | 627,000 | | | | 811,330 | |
| Hit Finance B.V., 4.875%, 10/27/21 | | EUR | 300,000 | | | | 495,165 | |
| | | | | | | | |
| | | | | | | $ | 1,504,516 | |
| U.S. Government Agencies and Equivalents - 0.3% | | | | | |
| Aid-Egypt, 4.45%, 9/15/15 | | $ | 1,113,000 | | | $ | 1,175,241 | |
| Small Business Administration, 5.09%, 10/01/25 | | | 67,938 | | | | 73,394 | |
| Small Business Administration, 5.21%, 1/01/26 | | | 952,193 | | | | 1,027,897 | |
| Small Business Administration, 5.31%, 5/01/27 | | | 567,666 | | | | 625,728 | |
| Small Business Administration, 2.22%, 3/01/33 | | | 1,225,884 | | | | 1,157,330 | |
| | | | | | | | |
| | | | | | | $ | 4,059,590 | |
| U.S. Treasury Obligations - 1.9% | | | | | | | | |
| U.S. Treasury Bonds, 4.5%, 8/15/39 | | $ | 5,454,600 | | | $ | 6,519,949 | |
| U.S. Treasury Notes, 4.75%, 8/15/17 (f) | | | 3,896,000 | | | | 4,367,174 | |
| U.S. Treasury Notes, 3.5%, 5/15/20 | | | 220,000 | | | | 239,250 | |
| U.S. Treasury Notes, 2.75%, 2/15/24 | | | 14,120,000 | | | | 14,243,550 | |
| | | | | | | | |
| | | | | | | $ | 25,369,923 | |
20
Portfolio of Investments (unaudited) – continued
| | | | | | | | |
| Issuer | | Shares/Par | | | Value ($) | |
| | | | | | | | |
| Bonds - continued | | | | | | |
| Utilities - Electric Power - 0.4% | | | | | | | | |
| CMS Energy Corp., 5.05%, 3/15/22 | | $ | 631,000 | | | $ | 710,249 | |
| E.On International Finance, 6.375%, 6/07/32 | | GBP | 250,000 | | | | 514,617 | |
| Empresa Nacional de Electricidad S.A., 4.25%, 4/15/24 | | $ | 462,000 | | | | 462,819 | |
| Enel Finance International N.V., 4.875%, 3/11/20 | | EUR | 350,000 | | | | 565,352 | |
| Enel S.p.A., 6.25%, 6/20/19 | | GBP | 300,000 | | | | 581,149 | |
| NGG Finance PLC, 5.625%, 6/18/73 | | GBP | 300,000 | | | | 522,779 | |
| PPL Capital Funding, Inc., 5%, 3/15/44 | | $ | 331,000 | | | | 346,790 | |
| PPL WEM Holdings PLC, 5.375%, 5/01/21 (n) | | | 189,000 | | | | 208,366 | |
| Progress Energy, Inc., 7.05%, 3/15/19 | | | 460,000 | | | | 556,852 | |
| Red Electrica Finance S.A., 3.5%, 10/07/16 | | EUR | 300,000 | | | | 442,078 | |
| Red Electrica Finance S.A., 4.75%, 2/16/18 | | EUR | 300,000 | | | | 470,532 | |
| | | | | | | | |
| | | | | | | $ | 5,381,583 | |
| Total Bonds (Identified Cost, $463,235,772) | | | | | | $ | 478,672,033 | |
| | |
| Money Market Funds - 5.1% | | | | | | | | |
MFS Institutional Money Market Portfolio, 0.09%,
at Cost and Net Asset Value (v) | | | 68,761,778 | | | $ | 68,761,778 | |
| | |
| Collateral for Securities Loaned - 2.4% | | | | | | | | |
JPMorgan Prime Money Market Fund, 0.06%,
at Cost and Net Asset Value (j) | | | 31,912,385 | | | $ | 31,912,385 | |
| Total Investments (Identified Cost, $1,106,420,419) | | | $ | 1,369,542,156 | |
| | |
| Other Assets, Less Liabilities - (2.4)% | | | | | | | (32,465,910 | ) |
| Net Assets - 100.0% | | | | | | $ | 1,337,076,246 | |
| (a) | Non-income producing security. |
| (f) | All or a portion of the security has been segregated as collateral for open futures contracts. |
| (j) | The rate quoted is the annualized seven-day yield of the fund at period end. |
| (l) | A portion of this security is on loan. |
| (n) | Securities exempt from registration under Rule 144A of the Securities Act of 1933. These securities may be sold in the ordinary course of business in transactions exempt from registration, normally to qualified institutional buyers. At period end, the aggregate value of these securities was $32,021,136 representing 2.4% of net assets. |
| (v) | Underlying affiliated fund that is available only to investment companies managed by MFS. The rate quoted for the MFS Institutional Money Market Portfolio is the annualized seven-day yield of the fund at period end. |
| (z) | Restricted securities are not registered under the Securities Act of 1933 and are subject to legal restrictions on resale. These securities generally may be resold in transactions exempt from registration or to the public if the securities are subsequently registered. Disposal of these securities may involve time-consuming negotiations and prompt sale at an acceptable price may be difficult. |
21
Portfolio of Investments (unaudited) – continued
The fund holds the following restricted securities:
| | | | | | | | | | |
| Restricted Securities | | Acquisition
Date | | Cost | | | Value | |
| G-Force LLC, CDO, “A2”, 4.83%, 8/22/36 | | 1/20/11 | | | $14,592 | | | | $15,363 | |
| Tencent Holdings Ltd., 3.375%, 5/02/19 | | 4/22/14 | | | 280,705 | | | | 282,467 | |
| Total Restricted Securities | | | | | | | | | $297,830 | |
| % of Net assets | | | | | | | | | 0.0% | |
The following abbreviations are used in this report and are defined:
| ADR | | American Depositary Receipt |
| CDO | | Collateralized Debt Obligation |
| FRN | | Floating Rate Note. Interest rate resets periodically and may not be the rate reported at period end. |
| IPS | | International Preference Stock |
| PLC | | Public Limited Company |
| REIT | | Real Estate Investment Trust |
Abbreviations indicate amounts shown in currencies other than the U.S. dollar. All amounts are stated in U.S. dollars unless otherwise indicated. A list of abbreviations is shown below:
22
Portfolio of Investments (unaudited) – continued
Derivative Contracts at 4/30/14
Forward Foreign Currency Exchange Contracts at 4/30/14
| | | | | | | | | | | | | | | | | | | | | | |
| Type | | Currency | | Counter- party | | Contracts
to
Deliver/
Receive | | | Settlement
Date Range | | In
Exchange
for | | | Contracts
at Value | | | Net
Unrealized
Appreciation
(Depreciation) | |
| Asset Derivatives | | | | | | | | | | | | | | |
| BUY | | AUD | | Barclays Bank PLC | | | 48,000 | | | 7/11/14 | | | $44,259 | | | | $44,372 | | | | $113 | |
| SELL | | BRL | | Deutsche Bank AG | | | 614,000 | | | 6/03/14 | | | 272,949 | | | | 272,542 | | | | 407 | |
| BUY | | CAD | | Deutsche Bank AG | | | 146,000 | | | 7/11/14 | | | 132,309 | | | | 132,980 | | | | 671 | |
| BUY | | CZK | | Citibank N.A. | | | 12,895,000 | | | 7/11/14 | | | 648,329 | | | | 651,867 | | | | 3,538 | |
| BUY | | DKK | | Barclays Bank PLC | | | 4,385,074 | | | 7/11/14 | | | 810,901 | | | | 815,330 | | | | 4,429 | |
| BUY | | DKK | | UBS AG | | | 4,385,074 | | | 7/11/14 | | | 810,983 | | | | 815,330 | | | | 4,347 | |
| BUY | | EUR | | Credit Suisse Group | | | 415,780 | | | 7/11/14 | | | 574,979 | | | | 576,737 | | | | 1,758 | |
| BUY | | EUR | | Deutsche Bank AG | | | 748,000 | | | 7/11/14 | | | 1,033,337 | | | | 1,037,567 | | | | 4,230 | |
| BUY | | EUR | | Goldman Sachs International | | | 843,607 | | | 7/11/14 | | | 1,165,676 | | | | 1,170,185 | | | | 4,509 | |
| BUY | | GBP | | Credit Suisse Group | | | 1,777,809 | | | 7/11/14 | | | 2,973,794 | | | | 2,999,981 | | | | 26,187 | |
| BUY | | GBP | | Goldman Sachs International | | | 460,000 | | | 7/11/14 | | | 770,077 | | | | 776,232 | | | | 6,155 | |
| BUY | | GBP | | Merrill Lynch International Bank | | | 1,777,809 | | | 7/11/14 | | | 2,974,025 | | | | 2,999,981 | | | | 25,956 | |
| BUY | | ILS | | JPMorgan Chase Bank | | | 1,848,000 | | | 5/12/14 | | | 521,715 | | | | 533,962 | | | | 12,247 | |
| BUY | | INR | | Barclays Bank PLC | | | 606,947,000 | | | 5/07/14-5/12/14 | | | 10,001,323 | | | | 10,049,355 | | | | 48,032 | |
| BUY | | JPY | | Barclays Bank PLC | | | 158,080,000 | | | 7/11/14 | | | 1,524,584 | | | | 1,546,897 | | | | 22,313 | |
| BUY | | JPY | | Credit Suisse Group | | | 105,368,000 | | | 7/11/14 | | | 1,027,571 | | | | 1,031,082 | | | | 3,511 | |
| SELL | | JPY | | Goldman Sachs International | | | 133,161,901 | | | 7/11/14 | | | 1,305,113 | | | | 1,303,060 | | | | 2,053 | |
| BUY | | KRW | | JPMorgan Chase Bank | | | 5,428,815,000 | | | 5/21/14 | | | 5,052,646 | | | | 5,248,014 | | | | 195,368 | |
| BUY | | MYR | | Deutsche Bank AG | | | 3,199,863 | | | 5/20/14 | | | 965,909 | | | | 978,599 | | | | 12,690 | |
23
Portfolio of Investments (unaudited) – continued
Forward Foreign Currency Exchange Contracts at 4/30/14 – continued
| | | | | | | | | | | | | | | | | | | | | | |
| Type | | Currency | | Counter- party | | Contracts
to
Deliver/
Receive | | | Settlement
Date Range | | In
Exchange
for | | | Contracts
at Value | | | Net
Unrealized
Appreciation
(Depreciation) | |
| Asset Derivatives - continued | | | | | | | | | |
| BUY | | NOK | | Deutsche Bank AG | | | 30,391,000 | | | 7/11/14 | | | $5,051,947 | | | | $5,097,681 | | | | $45,734 | |
| SELL | | PHP | | Barclays Bank PLC | | | 227,693,000 | | | 6/02/14 | | | 5,117,272 | | | | 5,104,993 | | | | 12,279 | |
| BUY | | THB | | JPMorgan Chase Bank | | | 37,630,750 | | | 5/06/14 | | | 1,156,801 | | | | 1,162,694 | | | | 5,893 | |
| | | | | | | | | | | | | | | | | | | | | | |
| | | | | | | | | | | | | | | | | | | | | $442,420 | |
| | | | | | | | | | | | | | | | | | | | | | |
| | | | |
| Liability Derivatives | | | | | | | | | | | | |
| SELL | | AUD | | Westpac Banking Corp. | | | 5,314,347 | | | 7/11/14 | | | $4,891,590 | | | | $4,912,626 | | | | $(21,036 | ) |
| SELL | | BRL | | UBS AG | | | 14,082,812 | | | 6/03/14 | | | 6,113,658 | | | | 6,251,072 | | | | (137,414 | ) |
| SELL | | CAD | | Goldman Sachs International | | | 2,678,000 | | | 7/11/14 | | | 2,433,924 | | | | 2,439,173 | | | | (5,249 | ) |
| SELL | | CAD | | Merrill Lynch International Bank | | | 11,889,707 | | | 7/11/14 | | | 10,793,713 | | | | 10,829,368 | | | | (35,655 | ) |
| SELL | | CAD | | UBS AG | | | 6,061,104 | | | 7/11/14 | | | 5,509,744 | | | | 5,520,568 | | | | (10,824 | ) |
| BUY | | CHF | | Credit Suisse Group | | | 58,000 | | | 7/11/14 | | | 65,957 | | | | 65,940 | | | | (17 | ) |
| SELL | | CHF | | Credit Suisse Group | | | 374,000 | | | 7/11/14 | | | 423,386 | | | | 425,199 | | | | (1,813 | ) |
| SELL | | CHF | | Deutsche Bank AG | | | 374,000 | | | 7/11/14 | | | 423,424 | | | | 425,199 | | | | (1,775 | ) |
| BUY | | EUR | | Barclays Bank PLC | | | 8,500,114 | | | 6/18/14 | | | 11,836,596 | | | | 11,791,229 | | | | (45,367 | ) |
| SELL | | EUR | | Citibank N.A. | | | 933,668 | | | 7/11/14 | | | 1,294,794 | | | | 1,295,111 | | | | (317 | ) |
| SELL | | EUR | | Credit Suisse Group | | | 10,047,525 | | | 7/11/14 | | | 13,869,453 | | | | 13,937,140 | | | | (67,687 | ) |
| SELL | | EUR | | Deutsche Bank AG | | | 7,392,165 | | | 7/11/14 | | | 10,144,421 | | | | 10,253,832 | | | | (109,411 | ) |
| SELL | | EUR | | Goldman Sachs International | | | 1,059,540 | | | 7/11/14 | | | 1,463,417 | | | | 1,469,711 | | | | (6,294 | ) |
| BUY | | JPY | | Deutsche Bank AG | | | 1,152,974,425 | | | 7/11/14 | | | 11,317,052 | | | | 11,282,469 | | | | (34,583 | ) |
| BUY | | JPY | | Goldman Sachs International | | | 1,152,974,425 | | | 7/11/14 | | | 11,318,207 | | | | 11,282,468 | | | | (35,739 | ) |
| BUY | | MXN | | Deutsche Bank AG | | | 27,686,000 | | | 5/21/14 | | | 2,116,327 | | | | 2,112,872 | | | | (3,455 | ) |
24
Portfolio of Investments (unaudited) – continued
Forward Foreign Currency Exchange Contracts at 4/30/14 – continued
| | | | | | | | | | | | | | | | | | | | | | |
| Type | | Currency | | Counter- party | | Contracts
to
Deliver/
Receive | | | Settlement
Date Range | | In
Exchange
for | | | Contracts
at Value | | | Net
Unrealized
Appreciation
(Depreciation) | |
| Liability Derivatives - continued | | | | | | | | | | | | |
| SELL | | MXN | | Barclays Bank PLC | | | 38,657,258 | | | 5/21/14 | | | $2,888,535 | | | | $2,950,150 | | | | $(61,615 | ) |
| SELL | | NOK | | Goldman Sachs International | | | 4,160,754 | | | 7/11/14 | | | 694,252 | | | | 697,910 | | | | (3,658 | ) |
| BUY | | NZD | | Barclays Bank PLC | | | 1,023,432 | | | 7/11/14 | | | 878,363 | | | | 877,121 | | | | (1,242 | ) |
| BUY | | PHP | | Barclays Bank PLC | | | 227,693,000 | | | 5/05/14 | | | 5,120,148 | | | | 5,107,318 | | | | (12,830 | ) |
| SELL | | PHP | | Barclays Bank PLC | | | 227,693,000 | | | 5/05/14 | | | 5,041,918 | | | | 5,107,319 | | | | (65,401 | ) |
| BUY | | PLN | | JPMorgan Chase Bank | | | 3,747,803 | | | 5/12/14 | | | 1,239,804 | | | | 1,237,060 | | | | (2,744 | ) |
| SELL | | SEK | | Goldman Sachs International | | | 3,642,077 | | | 7/11/14 | | | 556,229 | | | | 559,447 | | | | (3,218 | ) |
| BUY | | SGD | | Citibank N.A. | | | 906,000 | | | 7/11/14 | | | 723,239 | | | | 722,670 | | | | (569 | ) |
| BUY | | ZAR | | JPMorgan Chase Bank | | | 11,998,933 | | | 6/10/14 | | | 1,139,989 | | | | 1,133,196 | | | | (6,793 | ) |
| | | | | | | | | | | | | | | | | | | | | | |
| | | | | | | | | | | | | | | | | | | | | $(674,706 | ) |
| | | | | | | | | | | | | | | | | | | | | | |
Futures Contracts Outstanding at 4/30/14
| | | | | | | | | | | | | | | | | | |
| Description | | Currency | | | Contracts | | | Value | | Expiration
Date | | | Unrealized
Appreciation
(Depreciation) | |
| Liability Derivatives | | | | | | | | | | | | | | | | | | |
| Interest Rate Futures | | | | | | | | | | | | | | | | | | |
| US Treasury Note 10 yr (Short) | | | USD | | | | 36 | | | $4,479,188 | | | June - 2014 | | | | $(739 | ) |
| | | | | | | | | | | | | | | | | | |
At April 30, 2014, the fund had liquid securities with an aggregate value of $54,926 to cover any commitments for certain derivative contracts.
See Notes to Financial Statements
25
Financial Statements
STATEMENT OF ASSETS AND LIABILITIES
At 4/30/14 (unaudited)
This statement represents your fund’s balance sheet, which details the assets and liabilities comprising the total value of the fund.
| | | | |
| Assets | | | | |
Investments- | | | | |
Non-affiliated issuers, at value (identified cost, $1,037,658,641) | | | $1,300,780,378 | |
Underlying affiliated funds, at cost and value | | | 68,761,778 | |
Total investments, at value, including $30,595,731 of securities on loan
(identified cost, $1,106,420,419) | | | $1,369,542,156 | |
Cash | | | 280,706 | |
Receivables for | | | | |
Forward foreign currency exchange contracts | | | 442,420 | |
Investments sold | | | 3,598,915 | |
Fund shares sold | | | 3,869,695 | |
Interest and dividends | | | 8,149,437 | |
Other assets | | | 5,056 | |
Total assets | | | $1,385,888,385 | |
| Liabilities | | | | |
Payables for | | | | |
Forward foreign currency exchange contracts | | | $674,706 | |
Daily variation margin on open futures contracts | | | 15,187 | |
Investments purchased | | | 4,365,827 | |
TBA purchase commitments | | | 10,135,301 | |
Fund shares reacquired | | | 923,815 | |
Collateral for securities loaned, at value | | | 31,912,385 | |
Payable to affiliates | | | | |
Investment adviser | | | 51,616 | |
Shareholder servicing costs | | | 610,389 | |
Distribution and service fees | | | 29,768 | |
Payable for independent Trustees’ compensation | | | 9,137 | |
Accrued expenses and other liabilities | | | 84,008 | |
Total liabilities | | | $48,812,139 | |
Net assets | | | $1,337,076,246 | |
| Net assets consist of | | | | |
Paid-in capital | | | $1,076,261,453 | |
Unrealized appreciation (depreciation) on investments and translation of assets and liabilities in foreign currencies | | | 262,964,825 | |
Accumulated distributions in excess of net realized gain on investments and foreign currency | | | (8,745,350 | ) |
Undistributed net investment income | | | 6,595,318 | |
Net assets | | | $1,337,076,246 | |
Shares of beneficial interest outstanding | | | 79,439,442 | |
26
Statement of Assets and Liabilities (unaudited) – continued
| | | | | | | | | | | | |
| | | Net assets | | | Shares outstanding | | | Net asset value per share (a) | |
Class A | | | $740,890,421 | | | | 44,113,063 | | | | $16.80 | |
Class B | | | 67,718,048 | | | | 3,937,541 | | | | 17.20 | |
Class C | | | 281,432,523 | | | | 16,564,417 | | | | 16.99 | |
Class I | | | 143,139,035 | | | | 8,598,207 | | | | 16.65 | |
Class R1 | | | 3,631,380 | | | | 214,552 | | | | 16.93 | |
Class R2 | | | 10,760,657 | | | | 645,326 | | | | 16.67 | |
Class R3 | | | 13,331,408 | | | | 796,182 | | | | 16.74 | |
Class R4 | | | 9,009,353 | | | | 535,835 | | | | 16.81 | |
Class R5 | | | 67,163,421 | | | | 4,034,319 | | | | 16.65 | |
| (a) | Maximum offering price per share was equal to the net asset value per share for all share classes, except for Class A, for which the maximum offering price per share was $17.82 [100 / 94.25 x $16.80]. On sales of $50,000 or more, the maximum offering price of Class A shares is reduced. A contingent deferred sales charge may be imposed on redemptions of Class A, Class B, and Class C shares. Redemption price per share was equal to the net asset value per share for Classes I, R1, R2, R3, R4, and R5. |
See Notes to Financial Statements
27
Financial Statements
STATEMENT OF OPERATIONS
Six months ended 4/30/14 (unaudited)
This statement describes how much your fund earned in investment income and accrued in expenses. It also describes any gains and/or losses generated by fund operations.
| | | | |
| Net investment income | | | | |
Income | | | | |
Dividends | | | $16,969,644 | |
Interest | | | 6,804,046 | |
Dividends from underlying affiliated funds | | | 25,304 | |
Foreign taxes withheld | | | (606,533 | ) |
Total investment income | | | $23,192,461 | |
Expenses | | | | |
Management fee | | | $5,176,405 | |
Distribution and service fees | | | 2,543,092 | |
Shareholder servicing costs | | | 617,260 | |
Administrative services fee | | | 76,867 | |
Independent Trustees’ compensation | | | 10,961 | |
Custodian fee | | | 111,433 | |
Shareholder communications | | | 36,958 | |
Audit and tax fees | | | 35,796 | |
Legal fees | | | 5,111 | |
Miscellaneous | | | 103,871 | |
Total expenses | | | $8,717,754 | |
Fees paid indirectly | | | (74 | ) |
Reduction of expenses by investment adviser and distributor | | | (421,803 | ) |
Net expenses | | | $8,295,877 | |
Net investment income | | | $14,896,584 | |
| Realized and unrealized gain (loss) on investments and foreign currency | |
Realized gain (loss) (identified cost basis) | | | | |
Investments | | | $7,438,959 | |
Futures contracts | | | (111,820 | ) |
Foreign currency | | | 911,036 | |
Net realized gain (loss) on investments and foreign currency | | | $8,238,175 | |
Change in unrealized appreciation (depreciation) | | | | |
Investments | | | $31,861,938 | |
Futures contracts | | | 115,262 | |
Translation of assets and liabilities in foreign currencies | | | (434,821 | ) |
Net unrealized gain (loss) on investments and foreign currency translation | | | $31,542,379 | |
Net realized and unrealized gain (loss) on investments and foreign currency | | | $39,780,554 | |
Change in net assets from operations | | | $54,677,138 | |
See Notes to Financial Statements
28
Financial Statements
STATEMENTS OF CHANGES IN NET ASSETS
These statements describe the increases and/or decreases in net assets resulting from operations, any distributions, and any shareholder transactions.
| | | | | | | | |
| Change in net assets | | Six months ended 4/30/14 (unaudited) | | | Year ended 10/31/13 | |
| From operations | | | | | | | | |
Net investment income | | | $14,896,584 | | | | $14,466,285 | |
Net realized gain (loss) on investments and foreign currency | | | 8,238,175 | | | | 9,109,431 | |
Net unrealized gain (loss) on investments and foreign currency translation | | | 31,542,379 | | | | 117,662,145 | |
Change in net assets from operations | | | $54,677,138 | | | | $141,237,861 | |
| Distributions declared to shareholders | | | | | | | | |
From net investment income | | | $(12,100,914 | ) | | | $(12,740,259 | ) |
From net realized gain on investments | | | (5,029,471 | ) | | | — | |
Total distributions declared to shareholders | | | $(17,130,385 | ) | | | $(12,740,259 | ) |
Change in net assets from fund share transactions | | | $127,756,769 | | | | $151,346,862 | |
Total change in net assets | | | $165,303,522 | | | | $279,844,464 | |
| Net assets | | | | | | | | |
At beginning of period | | | 1,171,772,724 | | | | 891,928,260 | |
At end of period (including undistributed net investment income of $6,595,318 and $3,799,648, respectively) | | | $1,337,076,246 | | | | $1,171,772,724 | |
See Notes to Financial Statements
29
Financial Statements
FINANCIAL HIGHLIGHTS
The financial highlights table is intended to help you understand the fund’s financial performance for the semiannual period and the past 5 fiscal years (or life of a particular share class, if shorter). Certain information reflects financial results for a single fund share. The total returns in the table represent the rate by which an investor would have earned (or lost) on an investment in the fund share class (assuming reinvestment of all distributions) held for the entire period.
| | | | | | | | | | | | | | | | | | | | | | | | |
| | | Six months ended 4/30/14 (unaudited) | | | Years ended 10/31 | |
| Class A | | | 2013 | | | 2012 | | | 2011 | | | 2010 | | | 2009 | |
| | | | | | | | | | | | | | | | | |
Net asset value, beginning of period | | | $16.32 | | | | $14.39 | | | | $13.52 | | | | $13.31 | | | | $12.49 | | | | $11.23 | |
| Income (loss) from investment operations | | | | | | | | | | | | | |
Net investment income (d) | | | $0.21 | | | | $0.24 | | | | $0.25 | | | | $0.26 | | | | $0.22 | | | | $0.20 | |
Net realized and unrealized gain (loss)
on investments and foreign currency | | | 0.52 | | | | 1.91 | | | | 0.92 | | | | 0.35 | | | | 0.85 | | | | 1.53 | |
Total from investment operations | | | $0.73 | | | | $2.15 | | | | $1.17 | | | | $0.61 | | | | $1.07 | | | | $1.73 | |
| Less distributions declared to shareholders | | | | | | | | | | | | | |
From net investment income | | | $(0.18 | ) | | | $(0.22 | ) | | | $(0.30 | ) | | | $(0.40 | ) | | | $(0.25 | ) | | | $(0.37 | ) |
From net realized gain on investments | | | (0.07 | ) | | | — | | | | — | | | | — | | | | — | | | | (0.10 | ) |
Total distributions declared to
shareholders | | | $(0.25 | ) | | | $(0.22 | ) | | | $(0.30 | ) | | | $(0.40 | ) | | | $(0.25 | ) | | | $(0.47 | ) |
Net asset value, end of period (x) | | | $16.80 | | | | $16.32 | | | | $14.39 | | | | $13.52 | | | | $13.31 | | | | $12.49 | |
Total return (%) (r)(s)(t)(x) | | | 4.50 | (n) | | | 15.13 | | | | 8.81 | | | | 4.69 | | | | 8.71 | | | | 16.10 | |
Ratios (%) (to average net assets)
and Supplemental data: | | | | | | | | | | | | | | | | | |
Expenses before expense reductions (f) | | | 1.26 | (a) | | | 1.28 | | | | 1.30 | | | | 1.30 | | | | 1.33 | | | | 1.39 | |
Expenses after expense reductions (f) | | | 1.19 | (a) | | | 1.22 | | | | 1.25 | | | | 1.25 | | | | 1.25 | | | | 1.27 | |
Net investment income | | | 2.57 | (a) | | | 1.60 | | | | 1.80 | | | | 1.89 | | | | 1.71 | | | | 1.77 | |
Portfolio turnover | | | 11 | (n) | | | 40 | | | | 30 | | | | 46 | | | | 66 | | | | 75 | |
Net assets at end of period (000 omitted) | | | $740,890 | | | | $657,312 | | | | $509,475 | | | | $477,216 | | | | $466,793 | | | | $434,536 | |
See Notes to Financial Statements
30
Financial Highlights – continued
| | | | | | | | | | | | | | | | | | | | | | | | |
| | | Six months ended 4/30/14 (unaudited) | | | Years ended 10/31 | |
| Class B | | | 2013 | | | 2012 | | | 2011 | | | 2010 | | | 2009 | |
| | | | | | | | | | | | | | | | | |
Net asset value, beginning of period | | | $16.70 | | | | $14.73 | | | | $13.83 | | | | $13.60 | | | | $12.76 | | | | $11.46 | |
| Income (loss) from investment operations | | | | | | | | | | | | | | | | | |
Net investment income (d) | | | $0.15 | | | | $0.13 | | | | $0.15 | | | | $0.16 | | | | $0.12 | | | | $0.12 | |
Net realized and unrealized gain (loss)
on investments and foreign currency | | | 0.53 | | | | 1.95 | | | | 0.94 | | | | 0.36 | | | | 0.88 | | | | 1.57 | |
Total from investment operations | | | $0.68 | | | | $2.08 | | | | $1.09 | | | | $0.52 | | | | $1.00 | | | | $1.69 | |
| Less distributions declared to shareholders | | | | | | | | | | | | | | | | | |
From net investment income | | | $(0.11 | ) | | | $(0.11 | ) | | | $(0.19 | ) | | | $(0.29 | ) | | | $(0.16 | ) | | | $(0.29 | ) |
From net realized gain on investments | | | (0.07 | ) | | | — | | | | — | | | | — | | | | — | | | | (0.10 | ) |
Total distributions declared to
shareholders | | | $(0.18 | ) | | | $(0.11 | ) | | | $(0.19 | ) | | | $(0.29 | ) | | | $(0.16 | ) | | | $(0.39 | ) |
Net asset value, end of period (x) | | | $17.20 | | | | $16.70 | | | | $14.73 | | | | $13.83 | | | | $13.60 | | | | $12.76 | |
Total return (%) (r)(s)(t)(x) | | | 4.12 | (n) | | | 14.20 | | | | 8.01 | | | | 3.94 | | | | 7.86 | | | | 15.27 | |
Ratios (%) (to average net assets)
and Supplemental data: | | | | | | | | | | | | | | | | | |
Expenses before expense reductions (f) | | | 2.01 | (a) | | | 2.03 | | | | 2.05 | | | | 2.05 | | | | 2.08 | | | | 2.11 | |
Expenses after expense reductions (f) | | | 1.94 | (a) | | | 1.97 | | | | 2.00 | | | | 2.00 | | | | 2.00 | | | | 1.98 | |
Net investment income | | | 1.79 | (a) | | | 0.86 | | | | 1.05 | | | | 1.14 | | | | 0.96 | | | | 1.05 | |
Portfolio turnover | | | 11 | (n) | | | 40 | | | | 30 | | | | 46 | | | | 66 | | | | 75 | |
Net assets at end of period (000 omitted) | | | $67,718 | | | | $64,457 | | | | $59,468 | | | | $56,479 | | | | $54,548 | | | | $53,054 | |
See Notes to Financial Statements
31
Financial Highlights – continued
| | | | | | | | | | | | | | | | | | | | | | | | |
| | | Six months ended 4/30/14 (unaudited) | | | Years ended 10/31 | |
| Class C | | | 2013 | | | 2012 | | | 2011 | | | 2010 | | | 2009 | |
| | | | | | | | | | | | | | | | | |
Net asset value, beginning of period | | | $16.50 | | | | $14.56 | | | | $13.67 | | | | $13.45 | | | | $12.62 | | | | $11.35 | |
| Income (loss) from investment operations | | | | | | | | | | | | | | | | | |
Net investment income (d) | | | $0.15 | | | | $0.13 | | | | $0.15 | | | | $0.16 | | | | $0.12 | | | | $0.12 | |
Net realized and unrealized gain (loss)
on investments and foreign currency | | | 0.53 | | | | 1.92 | | | | 0.93 | | | | 0.36 | | | | 0.87 | | | | 1.54 | |
Total from investment operations | | | $0.68 | | | | $2.05 | | | | $1.08 | | | | $0.52 | | | | $0.99 | | | | $1.66 | |
| Less distributions declared to shareholders | | | | | | | | | | | | | | | | | |
From net investment income | | | $(0.12 | ) | | | $(0.11 | ) | | | $(0.19 | ) | | | $(0.30 | ) | | | $(0.16 | ) | | | $(0.29 | ) |
From net realized gain on investments | | | (0.07 | ) | | | — | | | | — | | | | — | | | | — | | | | (0.10 | ) |
Total distributions declared to
shareholders | | | $(0.19 | ) | | | $(0.11 | ) | | | $(0.19 | ) | | | $(0.30 | ) | | | $(0.16 | ) | | | $(0.39 | ) |
Net asset value, end of period (x) | | | $16.99 | | | | $16.50 | | | | $14.56 | | | | $13.67 | | | | $13.45 | | | | $12.62 | |
Total return (%) (r)(s)(t)(x) | | | 4.13 | (n) | | | 14.19 | | | | 8.05 | | | | 3.92 | | | | 7.88 | | | | 15.22 | |
Ratios (%) (to average net assets)
and Supplemental data: | | | | | | | | | | | | | | | | | |
Expenses before expense reductions (f) | | | 2.01 | (a) | | | 2.03 | | | | 2.05 | | | | 2.05 | | | | 2.08 | | | | 2.11 | |
Expenses after expense reductions (f) | | | 1.94 | (a) | | | 1.97 | | | | 2.00 | | | | 2.00 | | | | 2.00 | | | | 1.99 | |
Net investment income | | | 1.83 | (a) | | | 0.85 | | | | 1.05 | | | | 1.14 | | | | 0.96 | | | | 1.04 | |
Portfolio turnover | | | 11 | (n) | | | 40 | | | | 30 | | | | 46 | | | | 66 | | | | 75 | |
Net assets at end of period (000 omitted) | | | $281,433 | | | | $245,944 | | | | $186,974 | | | | $171,596 | | | | $170,189 | | | | $155,007 | |
See Notes to Financial Statements
32
Financial Highlights – continued
| | | | | | | | | | | | | | | | | | | | | | | | |
| | | Six months ended 4/30/14 (unaudited) | | | Years ended 10/31 | |
| Class I | | | 2013 | | | 2012 | | | 2011 | | | 2010 | | | 2009 | |
| | | | | | | | | | | | | | | | | |
Net asset value, beginning of period | | | $16.17 | | | | $14.27 | | | | $13.41 | | | | $13.20 | | | | $12.39 | | | | $11.16 | |
| Income (loss) from investment operations | | | | | | | | | | | | | | | | | |
Net investment income (d) | | | $0.23 | | | | $0.28 | | | | $0.27 | | | | $0.29 | | | | $0.25 | | | | $0.20 | |
Net realized and unrealized gain (loss)
on investments and foreign currency | | | 0.52 | | | | 1.88 | | | | 0.92 | | | | 0.35 | | | | 0.85 | | | | 1.54 | |
Total from investment operations | | | $0.75 | | | | $2.16 | | | | $1.19 | | | | $0.64 | | | | $1.10 | | | | $1.74 | |
| Less distributions declared to shareholders | | | | | | | | | | | | | | | | | |
From net investment income | | | $(0.20 | ) | | | $(0.26 | ) | | | $(0.33 | ) | | | $(0.43 | ) | | | $(0.29 | ) | | | $(0.41 | ) |
From net realized gain on investments | | | (0.07 | ) | | | — | | | | — | | | | — | | | | — | | | | (0.10 | ) |
Total distributions declared to
shareholders | | | $(0.27 | ) | | | $(0.26 | ) | | | $(0.33 | ) | | | $(0.43 | ) | | | $(0.29 | ) | | | $(0.51 | ) |
Net asset value, end of period (x) | | | $16.65 | | | | $16.17 | | | | $14.27 | | | | $13.41 | | | | $13.20 | | | | $12.39 | |
Total return (%) (r)(s)(x) | | | 4.67 | (n) | | | 15.33 | | | | 9.08 | | | | 5.00 | | | | 8.97 | | | | 16.27 | |
Ratios (%) (to average net assets)
and Supplemental data: | | | | | | | | | | | | | | | | | |
Expenses before expense reductions (f) | | | 1.01 | (a) | | | 1.03 | | | | 1.06 | | | | 1.05 | | | | 1.08 | | | | 1.09 | |
Expenses after expense reductions (f) | | | 0.94 | (a) | | | 0.97 | | | | 1.00 | | | | 1.00 | | | | 1.00 | | | | 0.99 | |
Net investment income | | | 2.90 | (a) | | | 1.84 | | | | 2.00 | | | | 2.17 | | | | 1.97 | | | | 1.76 | |
Portfolio turnover | | | 11 | (n) | | | 40 | | | | 30 | | | | 46 | | | | 66 | | | | 75 | |
Net assets at end of period (000 omitted) | | | $143,139 | | | | $108,175 | | | | $67,970 | | | | $26,765 | | | | $13,801 | | | | $15,697 | |
See Notes to Financial Statements
33
Financial Highlights – continued
| | | | | | | | | | | | | | | | | | | | | | | | |
| | | Six months ended 4/30/14 (unaudited) | | | Years ended 10/31 | |
| Class R1 | | | 2013 | | | 2012 | | | 2011 | | | 2010 | | | 2009 | |
| | | | | | | | | | | | | | | | | |
Net asset value, beginning of period | | | $16.44 | | | | $14.50 | | | | $13.62 | | | | $13.40 | | | | $12.58 | | | | $11.32 | |
| Income (loss) from investment operations | | | | | | | | | | | | | | | | | |
Net investment income (d) | | | $0.15 | | | | $0.13 | | | | $0.15 | | | | $0.15 | | | | $0.12 | | | | $0.12 | |
Net realized and unrealized gain (loss)
on investments and foreign currency | | | 0.52 | | | | 1.92 | | | | 0.92 | | | | 0.37 | | | | 0.86 | | | | 1.54 | |
Total from investment operations | | | $0.67 | | | | $2.05 | | | | $1.07 | | | | $0.52 | | | | $0.98 | | | | $1.66 | |
| Less distributions declared to shareholders | | | | | | | | | | | | | | | | | |
From net investment income | | | $(0.11 | ) | | | $(0.11 | ) | | | $(0.19 | ) | | | $(0.30 | ) | | | $(0.16 | ) | | | $(0.30 | ) |
From net realized gain on investments | | | (0.07 | ) | | | — | | | | — | | | | — | | | | — | | | | (0.10 | ) |
Total distributions declared to
shareholders | | | $(0.18 | ) | | | $(0.11 | ) | | | $(0.19 | ) | | | $(0.30 | ) | | | $(0.16 | ) | | | $(0.40 | ) |
Net asset value, end of period (x) | | | $16.93 | | | | $16.44 | | | | $14.50 | | | | $13.62 | | | | $13.40 | | | | $12.58 | |
Total return (%) (r)(s)(x) | | | 4.13 | (n) | | | 14.26 | | | | 8.01 | | | | 3.95 | | | | 7.83 | | | | 15.20 | |
Ratios (%) (to average net assets)
and Supplemental data: | | | | | | | | | | | | | | | | | |
Expenses before expense reductions (f) | | | 2.01 | (a) | | | 2.03 | | | | 2.05 | | | | 2.05 | | | | 2.08 | | | | 2.10 | |
Expenses after expense reductions (f) | | | 1.94 | (a) | | | 1.97 | | | | 2.00 | | | | 2.00 | | | | 2.00 | | | | 1.99 | |
Net investment income | | | 1.80 | (a) | | | 0.87 | | | | 1.05 | | | | 1.13 | | | | 0.97 | | | | 1.02 | |
Portfolio turnover | | | 11 | (n) | | | 40 | | | | 30 | | | | 46 | | | | 66 | | | | 75 | |
Net assets at end of period (000 omitted) | | | $3,631 | | | | $3,613 | | | | $3,124 | | | | $3,126 | | | | $3,042 | | | | $2,460 | |
See Notes to Financial Statements
34
Financial Highlights – continued
| | | | | | | | | | | | | | | | | | | | | | | | |
| | | Six months ended 4/30/14 | | | Years ended 10/31 | |
| Class R2 | | | 2013 | | | 2012 | | | 2011 | | | 2010 | | | 2009 | |
| | | (unaudited) | | | | | | | | | | | | | | | | |
Net asset value, beginning of period | | | $16.20 | | | | $14.29 | | | | $13.43 | | | | $13.22 | | | | $12.41 | | | | $11.17 | |
| Income (loss) from investment operations | | | | | | | | | | | | | | | | | |
Net investment income (d) | | | $0.18 | | | | $0.21 | | | | $0.21 | | | | $0.22 | | | | $0.19 | | | | $0.18 | |
Net realized and unrealized gain (loss)
on investments and foreign currency | | | 0.52 | | | | 1.88 | | | | 0.92 | | | | 0.36 | | | | 0.84 | | | | 1.51 | |
Total from investment operations | | | $0.70 | | | | $2.09 | | | | $1.13 | | | | $0.58 | | | | $1.03 | | | | $1.69 | |
| Less distributions declared to shareholders | | | | | | | | | | | | | | | | | |
From net investment income | | | $(0.16 | ) | | | $(0.18 | ) | | | $(0.27 | ) | | | $(0.37 | ) | | | $(0.22 | ) | | | $(0.35 | ) |
From net realized gain on investments | | | (0.07 | ) | | | — | | | | — | | | | — | | | | — | | | | (0.10 | ) |
Total distributions declared to
shareholders | | | $(0.23 | ) | | | $(0.18 | ) | | | $(0.27 | ) | | | $(0.37 | ) | | | $(0.22 | ) | | | $(0.45 | ) |
Net asset value, end of period (x) | | | $16.67 | | | | $16.20 | | | | $14.29 | | | | $13.43 | | | | $13.22 | | | | $12.41 | |
Total return (%) (r)(s)(x) | | | 4.34 | (n) | | | 14.79 | | | | 8.55 | | | | 4.46 | | | | 8.39 | | | | 15.81 | |
Ratios (%) (to average net assets)
and Supplemental data: | | | | | | | | | | | | | | | | | |
Expenses before expense reductions (f) | | | 1.51 | (a) | | | 1.53 | | | | 1.56 | | | | 1.55 | | | | 1.58 | | | | 1.61 | |
Expenses after expense reductions (f) | | | 1.44 | (a) | | | 1.47 | | | | 1.50 | | | | 1.50 | | | | 1.50 | | | | 1.49 | |
Net investment income | | | 2.26 | (a) | | | 1.38 | | | | 1.54 | | | | 1.64 | | | | 1.48 | | | | 1.57 | |
Portfolio turnover | | | 11 | (n) | | | 40 | | | | 30 | | | | 46 | | | | 66 | | | | 75 | |
Net assets at end of period (000 omitted) | | | $10,761 | | | | $10,528 | | | | $8,438 | | | | $5,687 | | | | $4,738 | | | | $5,459 | |
See Notes to Financial Statements
35
Financial Highlights – continued
| | | | | | | | | | | | | | | | | | | | | | | | |
| | | Six months ended 4/30/14 (unaudited) | | | Years ended 10/31 | |
| Class R3 | | | 2013 | | | 2012 | | | 2011 | | | 2010 | | | 2009 | |
| | | | | | | | | | | | | | | | | |
Net asset value, beginning of period | | | $16.27 | | | | $14.35 | | | | $13.48 | | | | $13.27 | | | | $12.46 | | | | $11.21 | |
| Income (loss) from investment operations | | | | | | | | | | | | | | | | | |
Net investment income (d) | | | $0.21 | | | | $0.24 | | | | $0.24 | | | | $0.25 | | | | $0.21 | | | | $0.20 | |
Net realized and unrealized gain (loss)
on investments and foreign currency | | | 0.51 | | | | 1.90 | | | | 0.93 | | | | 0.36 | | | | 0.85 | | | | 1.53 | |
Total from investment operations | | | $0.72 | | | | $2.14 | | | | $1.17 | | | | $0.61 | | | | $1.06 | | | | $1.73 | |
| Less distributions declared to shareholders | | | | | | | | | | | | | | | | | |
From net investment income | | | $(0.18 | ) | | | $(0.22 | ) | | | $(0.30 | ) | | | $(0.40 | ) | | | $(0.25 | ) | | | $(0.38 | ) |
From net realized gain on investments | | | (0.07 | ) | | | — | | | | — | | | | — | | | | — | | | | (0.10 | ) |
Total distributions declared to
shareholders | | | $(0.25 | ) | | | $(0.22 | ) | | | $(0.30 | ) | | | $(0.40 | ) | | | $(0.25 | ) | | | $(0.48 | ) |
Net asset value, end of period (x) | | | $16.74 | | | | $16.27 | | | | $14.35 | | | | $13.48 | | | | $13.27 | | | | $12.46 | |
Total return (%) (r)(s)(x) | | | 4.45 | (n) | | | 15.10 | | | | 8.84 | | | | 4.72 | | | | 8.65 | | | | 16.10 | |
Ratios (%) (to average net assets)
and Supplemental data: | | | | | | | | | | | | | | | | | |
Expenses before expense reductions (f) | | | 1.26 | (a) | | | 1.28 | | | | 1.31 | | | | 1.30 | | | | 1.33 | | | | 1.36 | |
Expenses after expense reductions (f) | | | 1.19 | (a) | | | 1.22 | | | | 1.25 | | | | 1.25 | | | | 1.25 | | | | 1.24 | |
Net investment income | | | 2.54 | (a) | | | 1.59 | | | | 1.77 | | | | 1.87 | | | | 1.70 | | | | 1.78 | |
Portfolio turnover | | | 11 | (n) | | | 40 | | | | 30 | | | | 46 | | | | 66 | | | | 75 | |
Net assets at end of period (000 omitted) | | | $13,331 | | | | $12,423 | | | | $9,575 | | | | $6,308 | | | | $5,223 | | | | $4,593 | |
See Notes to Financial Statements
36
Financial Highlights – continued
| | | | | | | | | | | | | | | | | | | | | | | | |
| | | Six months ended 4/30/14 (unaudited) | | | Years ended 10/31 | |
| Class R4 | | | 2013 | | | 2012 | | | 2011 | | | 2010 | | | 2009 | |
| | | | | | | | | | | | | | | | | |
Net asset value, beginning of period | | | $16.33 | | | | $14.41 | | | | $13.52 | | | | $13.30 | | | | $12.49 | | | | $11.24 | |
| Income (loss) from investment operations | | | | | | | | | | | | | | | | | |
Net investment income (d) | | | $0.23 | | | | $0.27 | | | | $0.30 | | | | $0.29 | | | | $0.25 | | | | $0.23 | |
Net realized and unrealized gain (loss)
on investments and foreign currency | | | 0.52 | | | | 1.91 | | | | 0.90 | | | | 0.36 | | | | 0.85 | | | | 1.53 | |
Total from investment operations | | | $0.75 | | | | $2.18 | | | | $1.20 | | | | $0.65 | | | | $1.10 | | | | $1.76 | |
| Less distributions declared to shareholders | | | | | | | | | | | | | | | | | |
From net investment income | | | $(0.20 | ) | | | $(0.26 | ) | | | $(0.31 | ) | | | $(0.43 | ) | | | $(0.29 | ) | | | $(0.41 | ) |
From net realized gain on investments | | | (0.07 | ) | | | — | | | | — | | | | — | | | | — | | | | (0.10 | ) |
Total distributions declared to
shareholders | | | $(0.27 | ) | | | $(0.26 | ) | | | $(0.31 | ) | | | $(0.43 | ) | | | $(0.29 | ) | | | $(0.51 | ) |
Net asset value, end of period (x) | | | $16.81 | | | | $16.33 | | | | $14.41 | | | | $13.52 | | | | $13.30 | | | | $12.49 | |
Total return (%) (r)(s)(x) | | | 4.63 | (n) | | | 15.32 | | | | 9.06 | | | | 5.04 | | | | 8.90 | | | | 16.33 | |
Ratios (%) (to average net assets)
and Supplemental data: | | | | | | | | | | | | | | | | | |
Expenses before expense reductions (f) | | | 1.01 | (a) | | | 1.04 | | | | 1.05 | | | | 1.05 | | | | 1.08 | | | | 1.11 | |
Expenses after expense reductions (f) | | | 0.94 | (a) | | | 0.97 | | | | 1.00 | | | | 1.00 | | | | 1.00 | | | | 0.99 | |
Net investment income | | | 2.81 | (a) | | | 1.77 | | | | 2.19 | | | | 2.16 | | | | 1.98 | | | | 2.07 | |
Portfolio turnover | | | 11 | (n) | | | 40 | | | | 30 | | | | 46 | | | | 66 | | | | 75 | |
Net assets at end of period (000 omitted) | | | $9,009 | | | | $7,938 | | | | $2,642 | | | | $32,383 | | | | $26,752 | | | | $22,340 | |
See Notes to Financial Statements
37
Financial Highlights – continued
| | | | | | | | | | | | |
| | | Six months ended 4/30/14 (unaudited) | | | Years ended 10/31 | |
| Class R5 | | | 2013 | | | 2012 (i) | |
| | | | | | | | |
Net asset value, beginning of period | | | $16.18 | | | | $14.27 | | | | $13.29 | |
| Income (loss) from investment operations | | | | | |
Net investment income (d) | | | $0.23 | | | | $0.29 | | | | $0.07 | |
Net realized and unrealized gain (loss) on investments and foreign currency | | | 0.51 | | | | 1.89 | | | | 1.01 | |
Total from investment operations | | | $0.74 | | | | $2.18 | | | | $1.08 | |
| Less distributions declared to shareholders | | | | | |
From net investment income | | | $(0.20 | ) | | | $(0.27 | ) | | | $(0.10 | ) |
From net realized gain on investments | | | (0.07 | ) | | | — | | | | — | |
Total distributions declared to shareholders | | | $(0.27 | ) | | | $(0.27 | ) | | | $(0.10 | ) |
Net asset value, end of period (x) | | | $16.65 | | | | $16.18 | | | | $14.27 | |
Total return (%) (r)(s)(x) | | | 4.64 | (n) | | | 15.49 | | | | 8.16 | (n) |
Ratios (%) (to average net assets)
and Supplemental data: | | | | | |
Expenses before expense reductions (f) | | | 0.93 | (a) | | | 0.94 | | | | 1.00 | (a) |
Expenses after expense reductions (f) | | | 0.86 | (a) | | | 0.88 | | | | 0.94 | (a) |
Net investment income | | | 2.90 | (a) | | | 1.95 | | | | 1.24 | (a) |
Portfolio turnover | | | 11 | (n) | | | 40 | | | | 30 | |
Net assets at end of period (000 omitted) | | | $67,163 | | | | $61,383 | | | | $44,263 | |
| (d) | Per share data is based on average shares outstanding. |
| (f) | Ratios do not reflect reductions from fees paid indirectly, if applicable. |
| (i) | For the period from the class inception, June 1, 2012, through the stated period end. |
| (r) | Certain expenses have been reduced without which performance would have been lower. |
| (s) | From time to time the fund may receive proceeds from litigation settlements, without which performance would be lower. |
| (t) | Total returns do not include any applicable sales charges. |
| (x) | The net asset values per share and total returns have been calculated on net assets which include adjustments made in accordance with U.S. generally accepted accounting principles required at period end for financial reporting purposes. |
See Notes to Financial Statements
38
NOTES TO FINANCIAL STATEMENTS
(unaudited)
(1) Business and Organization
MFS Global Total Return Fund (the fund) is a diversified series of MFS Series Trust VI (the trust). The trust is organized as a Massachusetts business trust and is registered under the Investment Company Act of 1940, as amended, as an open-end management investment company.
The fund is an investment company and accordingly follows the investment company accounting and reporting guidance of the Financial Accounting Standards Board (FASB) Accounting Standard Codification Topic 946 Financial Services – Investment Companies.
(2) Significant Accounting Policies
General – The preparation of financial statements in conformity with U.S. generally accepted accounting principles requires management to make estimates and assumptions that affect the reported amounts of assets and liabilities, and disclosure of contingent assets and liabilities at the date of the financial statements and the reported amounts of increases and decreases in net assets from operations during the reporting period. Actual results could differ from those estimates. In the preparation of these financial statements, management has evaluated subsequent events occurring after the date of the fund’s Statement of Assets and Liabilities through the date that the financial statements were issued. The fund invests in foreign securities. Investments in foreign securities are vulnerable to the effects of changes in the relative values of the local currency and the U.S. dollar and to the effects of changes in each country’s legal, political, and economic environment.
In this reporting period, the fund adopted the disclosure provisions of FASB Accounting Standards Update 2011-11 (“ASU 2011-11”), Balance Sheet (Topic 210) – Disclosures about Offsetting Assets and Liabilities along with the related scope clarification provisions of FASB Accounting Standards Update 2013-01 (“ASU 2013-01”) entitled Balance Sheet (Topic 210) – Clarifying the Scope of Disclosures about Offsetting Assets and Liabilities. ASU 2011-11 is intended to enhance disclosures on the offsetting of financial assets and liabilities by requiring entities to disclose both gross and net information about financial instruments and transactions that are either offset in the statement of financial position or subject to an enforceable Master Netting Agreement or similar arrangement. ASU 2013-01 limits the scope of ASU 2011-11’s disclosure requirements on offsetting to financial assets and financial liabilities related to derivatives, repurchase and reverse repurchase agreements, and securities lending and securities borrowing transactions. The disclosures required by ASU 2011-11, to the extent applicable to the fund, have been included in the fund’s Significant Accounting Policies note under the captions for each of the fund’s in-scope financial instruments and transactions.
The fund’s accounting policy with respect to balance sheet offsetting is that, absent an event of default by the counterparty or a termination of the agreement, the ISDA Master Agreement does not result in an offset of reported amounts of financial assets and financial liabilities in the Statement of Assets and Liabilities across transactions between the fund and the applicable counterparty. The fund’s right to setoff may be restricted or prohibited by the bankruptcy or insolvency laws of the particular
39
Notes to Financial Statements (unaudited) – continued
jurisdiction to which a specific master netting agreement counterparty is subject. Balance sheet offsetting disclosures, to the extent applicable to the fund, have been included in the fund’s Significant Accounting Policies note under the captions for each of the fund’s in-scope financial instruments and transactions.
Investment Valuations – Equity securities, including restricted equity securities, are generally valued at the last sale or official closing price as provided by a third-party pricing service on the market or exchange on which they are primarily traded. Equity securities, for which there were no sales reported that day, are generally valued at the last quoted daily bid quotation as provided by a third-party pricing service on the market or exchange on which such securities are primarily traded. Debt instruments and floating rate loans (other than short-term instruments), including restricted debt instruments, are generally valued at an evaluated or composite bid as provided by a third-party pricing service. Short-term instruments with a maturity at issuance of 60 days or less generally are valued at amortized cost, which approximates market value. Futures contracts are generally valued at last posted settlement price as provided by a third-party pricing service on the market on which they are primarily traded. Futures contracts for which there were no trades that day for a particular position are generally valued at the closing bid quotation as provided by a third-party pricing service on the market on which such futures contracts are primarily traded. Forward foreign currency exchange contracts are generally valued at the mean of bid and asked prices for the time period interpolated from rates provided by a third-party pricing service for proximate time periods. Open-end investment companies are generally valued at net asset value per share. Securities and other assets generally valued on the basis of information from a third-party pricing service may also be valued at a broker/dealer bid quotation. Values obtained from third-party pricing services can utilize both transaction data and market information such as yield, quality, coupon rate, maturity, type of issue, trading characteristics, and other market data. The values of foreign securities and other assets and liabilities expressed in foreign currencies are converted to U.S. dollars using the mean of bid and asked prices for rates provided by a third-party pricing service.
The Board of Trustees has delegated primary responsibility for determining or causing to be determined the value of the fund’s investments (including any fair valuation) to the adviser pursuant to valuation policies and procedures approved by the Board. If the adviser determines that reliable market quotations are not readily available, investments are valued at fair value as determined in good faith by the adviser in accordance with such procedures under the oversight of the Board of Trustees. Under the fund’s valuation policies and procedures, market quotations are not considered to be readily available for most types of debt instruments and floating rate loans and many types of derivatives. These investments are generally valued at fair value based on information from third-party pricing services. In addition, investments may be valued at fair value if the adviser determines that an investment’s value has been materially affected by events occurring after the close of the exchange or market on which the investment is principally traded (such as foreign exchange or market) and prior to the determination of the fund’s net asset value, or after the halting of trading of a specific security where trading does not resume prior to the close of the exchange or market on which the security is principally traded. Events that occur on a frequent basis after foreign markets
40
Notes to Financial Statements (unaudited) – continued
close (such as developments in foreign markets and significant movements in the U.S. markets) and prior to the determination of the fund’s net asset value may be deemed to have a material effect on the value of securities traded in foreign markets. Accordingly, the fund’s foreign equity securities may often be valued at fair value. The adviser generally relies on third-party pricing services or other information (such as the correlation with price movements of similar securities in the same or other markets; the type, cost and investment characteristics of the security; the business and financial condition of the issuer; and trading and other market data) to assist in determining whether to fair value and at what value to fair value an investment. The value of an investment for purposes of calculating the fund’s net asset value can differ depending on the source and method used to determine value. When fair valuation is used, the value of an investment used to determine the fund’s net asset value may differ from quoted or published prices for the same investment. There can be no assurance that the fund could obtain the fair value assigned to an investment if it were to sell the investment at the same time at which the fund determines its net asset value per share.
Various inputs are used in determining the value of the fund’s assets or liabilities. These inputs are categorized into three broad levels. In certain cases, the inputs used to measure fair value may fall into different levels of the fair value hierarchy. In such cases, an investment’s level within the fair value hierarchy is based on the lowest level of input that is significant to the fair value measurement. The fund’s assessment of the significance of a particular input to the fair value measurement in its entirety requires judgment, and considers factors specific to the investment. Level 1 includes unadjusted quoted prices in active markets for identical assets or liabilities. Level 2 includes other significant observable market-based inputs (including quoted prices for similar securities, interest rates, prepayment speed, and credit risk). Level 3 includes unobservable inputs, which may include the adviser’s own assumptions in determining the fair value of investments. Other financial instruments are derivative instruments not reflected in total investments, such as futures contracts and forward foreign currency exchange contracts.
41
Notes to Financial Statements (unaudited) – continued
The following is a summary of the levels used as of April 30, 2014 in valuing the fund’s assets or liabilities:
| | | | | | | | | | | | | | | | |
| Investments at Value | | Level 1 | | | Level 2 | | | Level 3 | | | Total | |
| Equity Securities: | | | | | | | | | | | | | | | | |
United States | | | $398,045,310 | | | | $— | | | | $— | | | | $398,045,310 | |
Japan | | | 91,261,355 | | | | 6,708,242 | | | | — | | | | 97,969,597 | |
United Kingdom | | | 92,612,106 | | | | — | | | | — | | | | 92,612,106 | |
Switzerland | | | 52,702,963 | | | | — | | | | — | | | | 52,702,963 | |
France | | | 35,807,184 | | | | — | | | | — | | | | 35,807,184 | |
Germany | | | 33,479,222 | | | | — | | | | — | | | | 33,479,222 | |
Netherlands | | | 16,234,037 | | | | — | | | | — | | | | 16,234,037 | |
Canada | | | 13,796,989 | | | | — | | | | — | | | | 13,796,989 | |
Sweden | | | 9,747,621 | | | | — | | | | — | | | | 9,747,621 | |
Other Countries | | | 29,582,670 | | | | 10,218,264 | | | | — | | | | 39,800,934 | |
| U.S. Treasury Bonds & U.S. Government Agency & Equivalents | | | — | | | | 29,429,513 | | | | — | | | | 29,429,513 | |
| Non-U.S. Sovereign Debt | | | — | | | | 262,101,907 | | | | — | | | | 262,101,907 | |
| U.S. Corporate Bonds | | | — | | | | 69,266,681 | | | | — | | | | 69,266,681 | |
| Residential Mortgage-Backed Securities | | | — | | | | 41,124,812 | | | | — | | | | 41,124,812 | |
| Commercial Mortgage-Backed Securities | | | — | | | | 12,229,146 | | | | — | | | | 12,229,146 | |
| Asset-Backed Securities (including CDOs) | | | — | | | | 15,363 | | | | — | | | | 15,363 | |
| Foreign Bonds | | | — | | | | 64,504,608 | | | | — | | | | 64,504,608 | |
| Mutual Funds | | | 100,674,163 | | | | — | | | | — | | | | 100,674,163 | |
| Total Investments | | | $873,943,620 | | | | $495,598,536 | | | | $— | | | | $1,369,542,156 | |
| | | | |
| Other Financial Instruments | | | | | | | | | | | | |
| Futures Contracts | | | $(739 | ) | | | $— | | | | $— | | | | $(739 | ) |
| Forward Foreign Currency Exchange Contracts | | | — | | | | (232,286 | ) | | | — | | | | (232,286 | ) |
For further information regarding security characteristics, see the Portfolio of Investments.
Of the level 2 investments presented above, equity investments amounting to $16,926,506 would have been considered level 1 investments at the beginning of the period. Of the level 1 investments presented above, equity investments amounting to $6,897,912 would have been considered level 2 investments at the beginning of the period. The primary reason for changes in the classifications between levels 1 and 2 occurs when foreign equity securities are fair valued using other observable market-based inputs in place of the closing exchange price due to events occurring after the close of the exchange or market on which the investment is principally traded. The fund’s foreign equity securities may often be valued at fair value. The fund’s policy is to recognize transfers between the levels as of the end of the period.
42
Notes to Financial Statements (unaudited) – continued
Foreign Currency Translation – Purchases and sales of foreign investments, income, and expenses are converted into U.S. dollars based upon currency exchange rates prevailing on the respective dates of such transactions or on the reporting date for foreign denominated receivables and payables. Gains and losses attributable to foreign currency exchange rates on sales of securities are recorded for financial statement purposes as net realized gains and losses on investments. Gains and losses attributable to foreign exchange rate movements on receivables, payables, income and expenses are recorded for financial statement purposes as foreign currency transaction gains and losses. That portion of both realized and unrealized gains and losses on investments that results from fluctuations in foreign currency exchange rates is not separately disclosed.
Derivatives – The fund uses derivatives for different purposes, primarily to increase or decrease exposure to a particular market or segment of the market, or security, to increase or decrease interest rate or currency exposure, or as alternatives to direct investments. Derivatives are used for hedging or non-hedging purposes. While hedging can reduce or eliminate losses, it can also reduce or eliminate gains. When the fund uses derivatives as an investment to increase market exposure, or for hedging purposes, gains and losses from derivative instruments may be substantially greater than the derivative’s original cost.
The derivative instruments used by the fund were futures contracts and forward foreign currency exchange contracts. The fund’s period end derivatives, as presented in the Portfolio of Investments and the associated Derivative Contract tables, generally are indicative of the volume of its derivative activity during the period.
The following table presents, by major type of derivative contract, the fair value, on a gross basis, of the asset and liability components of derivatives held by the fund at April 30, 2014 as reported in the Statement of Assets and Liabilities:
| | | | | | | | | | |
| | | | | Fair Value (a) | |
| Risk | | Derivative Contracts | | Asset Derivatives | | | Liability Derivatives | |
| Interest Rate | | Interest Rate Futures | | | $— | | | | $(739 | ) |
| Foreign Exchange | | Forward Foreign Currency Exchange | | | 442,420 | | | | (674,706 | ) |
| Total | | | | | $442,420 | | | | $(674,706 | ) |
| (a) | The value of futures contracts outstanding includes cumulative appreciation (depreciation) as reported in the fund’s Portfolio of Investments. Only the current day variation margin for futures contracts is separately reported within the fund’s Statement of Assets and Liabilities. |
The following table presents, by major type of derivative contract, the realized gain (loss) on derivatives held by the fund for the six months ended April 30, 2014 as reported in the Statement of Operations:
| | | | | | | | |
| Risk | | Futures
Contracts | | | Foreign
Currency | |
| Interest Rate | | | $(111,820 | ) | | | $— | |
| Foreign Exchange | | | — | | | | 969,327 | |
| Total | | | $(111,820 | ) | | | $969,327 | |
43
Notes to Financial Statements (unaudited) – continued
The following table presents, by major type of derivative contract, the change in unrealized appreciation (depreciation) on derivatives held by the fund for the six months ended April 30, 2014 as reported in the Statement of Operations:
| | | | | | | | |
| Risk | | Futures
Contracts | | | Translation of Assets
and Liabilities in Foreign
Currencies | |
| Interest Rate | | | $115,262 | | | | $— | |
| Foreign Exchange | | | — | | | | (474,003 | ) |
| Total | | | $115,262 | | | | $(474,003 | ) |
Derivative counterparty credit risk is managed through formal evaluation of the creditworthiness of all potential counterparties. On certain, but not all, over-the-counter derivatives, the fund attempts to reduce its exposure to counterparty credit risk whenever possible by entering into an International Swaps and Derivatives Association (ISDA) Master Agreement on a bilateral basis with each of the counterparties with whom it undertakes a significant volume of transactions. The ISDA Master Agreement gives each party to the agreement the right to terminate all transactions traded under such agreement if there is a certain deterioration in the credit quality of the other party. Upon an event of default or a termination of the ISDA Master Agreement, the non-defaulting party has the right to close out all transactions traded under such agreement and to net amounts owed under each transaction to one net amount payable by one party to the other. This right to close out and net payments across all transactions traded under the ISDA Master Agreement could result in a reduction of the fund’s credit risk to such counterparty equal to any amounts payable by the fund under the applicable transactions, if any. The fund’s right to setoff may be restricted or prohibited by the bankruptcy or insolvency laws of the particular jurisdiction to which a specific ISDA counterparty is subject.
Collateral and margin requirements differ by type of derivative. Margin requirements are set by the broker or clearing house for cleared derivatives (i.e., futures contracts, cleared swaps, and exchange-traded options) while collateral terms are contract specific for over-the-counter traded derivatives (i.e., forward foreign currency exchange contracts, uncleared swap agreements, and over-the-counter options). For derivatives traded under an ISDA Master Agreement, the collateral requirements are netted across all transactions traded under such agreement and one amount is posted from one party to the other to collateralize such obligations. Cash that has been segregated to cover the fund’s collateral or margin obligations under derivative contracts, if any, will be reported separately in the Statement of Assets and Liabilities as “Restricted cash”. Securities pledged as collateral or margin for the same purpose, if any, are noted in the Portfolio of Investments.
Futures Contracts – The fund entered into futures contracts which may be used to hedge against or obtain broad market exposure, interest rate exposure, currency exposure, or to manage duration. A futures contract represents a commitment for the future purchase or sale of an asset at a specified price on a specified date.
44
Notes to Financial Statements (unaudited) – continued
Upon entering into a futures contract, the fund is required to deposit with the broker, either in cash or securities, an initial margin in an amount equal to a certain percentage of the notional amount of the contract. Subsequent payments (variation margin) are made or received by the fund each day, depending on the daily fluctuations in the value of the contract, and are recorded for financial statement purposes as unrealized gain or loss by the fund until the contract is closed or expires at which point the gain or loss on futures contracts is realized.
The fund bears the risk of interest rates, exchange rates or securities prices moving unexpectedly, in which case, the fund may not achieve the anticipated benefits of the futures contracts and may realize a loss. While futures contracts may present less counterparty risk to the fund since the contracts are exchange traded and the exchange’s clearinghouse guarantees payments to the broker, there is still counterparty credit risk due to the insolvency of the broker. The fund’s maximum risk of loss due to counterparty credit risk is equal to the margin posted by the fund to the broker plus any gains or minus any losses on the outstanding futures contracts.
Forward Foreign Currency Exchange Contracts – The fund entered into forward foreign currency exchange contracts for the purchase or sale of a specific foreign currency at a fixed price on a future date. These contracts may be used to hedge the fund’s currency risk or for non-hedging purposes. For hedging purposes, the fund may enter into contracts to deliver or receive foreign currency that the fund will receive from or use in its normal investment activities. The fund may also use contracts to hedge against declines in the value of foreign currency denominated securities due to unfavorable exchange rate movements. For non-hedging purposes, the fund may enter into contracts with the intent of changing the relative exposure of the fund’s portfolio of securities to different currencies to take advantage of anticipated exchange rate changes.
Forward foreign currency exchange contracts are adjusted by the daily exchange rate of the underlying currency and any unrealized gains or losses are recorded as a receivable or payable for forward foreign currency exchange contracts until the contract settlement date. On contract settlement date, any gain or loss on the contract is recorded as realized gains or losses on foreign currency.
Risks may arise upon entering into these contracts from unanticipated movements in the value of the contract and from the potential inability of counterparties to meet the terms of their contracts. Generally, the fund’s maximum risk due to counterparty credit risk is the unrealized gain on the contract due to the use of Continuous Linked Settlement, an industry accepted settlement system. This risk is mitigated in cases where there is an ISDA Master Agreement between the fund and the counterparty providing for netting as described above and for posting of collateral by the counterparty to the fund to cover the fund’s exposure to the counterparty under such ISDA Master Agreement.
Security Loans – Under its Securities Lending Agency Agreement with the fund, JPMorgan Chase and Co. (“Chase”), as lending agent, loans the securities of the fund to certain qualified institutions (the “Borrowers”) approved by the fund. The loans are collateralized by cash and/or U.S. Treasury and federal agency obligations in an amount typically at least equal to the market value of the securities loaned. The market value of
45
Notes to Financial Statements (unaudited) – continued
the loaned securities is determined at the close of business of the fund and any additional required collateral is delivered to the fund on the next business day. Chase provides the fund with indemnification against Borrower default. In the event of Borrower default, Chase will for the benefit of the fund either purchase securities identical to those loaned or, when such purchase is commercially impracticable, pay the fund the market value of the loaned securities. In return, Chase assumes the fund’s rights to the related collateral. If the collateral value is less than the cost to purchase identical securities, Chase is responsible for the shortfall, but only to the extent that such shortfall is not due to a decline in collateral value resulting from collateral reinvestment for which the fund bears the risk of loss. On loans collateralized by cash, the cash collateral is invested in a money market fund or short-term securities. At period end, the fund had investment securities on loan with a fair value of $30,595,731 and a related liability of $31,912,385 for collateral received on securities loaned, both of which are presented gross on the Statement of Assets and Liabilities. The liability for collateral for securities loaned is carried at fair value, which is categorized as level 2 within the fair value hierarchy. The collateral received on securities loaned exceeded the value of securities on loan at period end. A portion of the income generated upon investment of the collateral is remitted to the Borrowers, and the remainder is allocated between the fund and the lending agent. On loans collateralized by U.S. Treasury and/or federal agency obligations, a fee is received from the Borrower, and is allocated between the fund and the lending agent. Income from securities lending is included in “Interest” income in the Statement of Operations. The dividend and interest income earned on the securities loaned is accounted for in the same manner as other dividend and interest income.
Dollar Roll Transactions – The fund enters into dollar roll transactions, with respect to mortgage backed securities issued by Ginnie Mae, Fannie Mae, and Freddie Mac, in which the fund sells mortgage backed securities to financial institutions and simultaneously agrees to purchase similar (same issuer, type and coupon) securities at a later date at an agreed-upon price. During the period between the sale and repurchase in a dollar roll transaction the fund will not be entitled to receive interest and principal payments on the securities sold but is compensated by interest earned on the proceeds of the initial sale and by a lower purchase price on the securities to be repurchased which enhances the fund’s total return. The fund accounts for dollar roll transactions as purchases and sales and realizes gains and losses on these transactions.
Indemnifications – Under the fund’s organizational documents, its officers and Trustees may be indemnified against certain liabilities and expenses arising out of the performance of their duties to the fund. Additionally, in the normal course of business, the fund enters into agreements with service providers that may contain indemnification clauses. The fund’s maximum exposure under these agreements is unknown as this would involve future claims that may be made against the fund that have not yet occurred.
Investment Transactions and Income – Investment transactions are recorded on the trade date. Interest income is recorded on the accrual basis. All premium and discount is amortized or accreted for financial statement purposes in accordance with U.S. generally accepted accounting principles. Dividends received in cash are recorded on the ex-dividend date. Certain dividends from foreign securities will be recorded when
46
Notes to Financial Statements (unaudited) – continued
the fund is informed of the dividend if such information is obtained subsequent to the ex-dividend date. Dividend and interest payments received in additional securities are recorded on the ex-dividend or ex-interest date in an amount equal to the value of the security on such date.
The fund may receive proceeds from litigation settlements. Any proceeds received from litigation involving portfolio holdings are reflected in the Statement of Operations in realized gain/loss if the security has been disposed of by the fund or in unrealized gain/loss if the security is still held by the fund. Any other proceeds from litigation not related to portfolio holdings are reflected as other income in the Statement of Operations.
The fund purchased or sold debt securities on a when-issued or delayed delivery basis, or in a “To Be Announced” (TBA) or “forward commitment” transaction with delivery or payment to occur at a later date beyond the normal settlement period. TBA securities resulting from these transactions are included in the Portfolio of Investments. At the time a fund enters into a commitment to purchase or sell a security, the transaction is recorded and the value of the security acquired is reflected in the fund’s net asset value. The price of such security and the date that the security will be delivered and paid for are fixed at the time the transaction is negotiated. The value of the security may vary with market fluctuations. TBA securities resulting from these transactions are included in the Portfolio of Investments. TBA purchase commitments are held at carrying amount, which approximates fair value and are categorized as level 2 within the fair value hierarchy. No interest accrues to the fund until payment takes place. At the time that a fund enters into this type of transaction, the fund is required to have sufficient cash and/or liquid securities to cover its commitments. Losses may arise due to changes in the value of the underlying securities or if the counterparty does not perform under the contract’s terms, or if the issuer does not issue the securities due to political, economic or other factors. Additionally, losses may arise due to declines in the value of the securities prior to settlement date.
To mitigate this risk of loss on TBA securities and other types of forward settling mortgage-backed securities, the fund whenever possible enters into a Master Securities Forward Transaction Agreement (“MSFTA”) on a bilateral basis with each of the counterparties with whom it undertakes a significant volume of transactions. The MSFTA gives each party to the agreement the right to terminate all transactions traded under such agreement if there is a certain deterioration in the credit quality of the other party. Upon an event of default or a termination of the MSFTA, the non-defaulting party has the right to close out all transactions traded under such agreement and to net amounts owed under each transaction to one net amount payable by one party to the other. This right to close out and net payments across all transactions traded under the MSFTA could result in a reduction of the fund’s credit risk to such counterparty equal to any amounts payable by the fund under the applicable transactions, if any.
For mortgage backed securities traded under a MSFTA, the collateral and margining requirements are contract specific. Collateral amounts across all transactions traded under such agreement are netted and one amount is posted from one party to the other to collateralize such obligations. Cash that has been pledged to cover the fund’s collateral or margin obligations under a MSFTA, if any, will be reported separately on
47
Notes to Financial Statements (unaudited) – continued
the Statement of Assets and Liabilities as restricted cash. Securities pledged as collateral or margin for the same purpose, if any, are noted in the Portfolio of Investments.
Fees Paid Indirectly – The fund’s custody fee may be reduced according to an arrangement that measures the value of cash deposited with the custodian by the fund. This amount, for the six months ended April 30, 2014, is shown as a reduction of total expenses in the Statement of Operations.
Tax Matters and Distributions – The fund intends to qualify as a regulated investment company, as defined under Subchapter M of the Internal Revenue Code, and to distribute all of its taxable income, including realized capital gains. As a result, no provision for federal income tax is required. The fund’s federal tax returns, when filed, will remain subject to examination by the Internal Revenue Service for a three year period. Management has analyzed the fund’s tax positions taken on federal and state tax returns for all open tax years and does not believe that there are any uncertain tax positions that require recognition of a tax liability. Foreign taxes, if any, have been accrued by the fund in the accompanying financial statements in accordance with the applicable foreign tax law. Foreign income taxes may be withheld by certain countries in which the fund invests. Additionally, capital gains realized by the fund on securities issued in or by certain foreign countries may be subject to capital gains tax imposed by those countries.
Distributions to shareholders are recorded on the ex-dividend date. Income and capital gain distributions are determined in accordance with income tax regulations, which may differ from U.S. generally accepted accounting principles. Certain capital accounts in the financial statements are periodically adjusted for permanent differences in order to reflect their tax character. These adjustments have no impact on net assets or net asset value per share. Temporary differences which arise from recognizing certain items of income, expense, gain or loss in different periods for financial statement and tax purposes will reverse at some time in the future. Distributions in excess of net investment income or net realized gains are temporary overdistributions for financial statement purposes resulting from differences in the recognition or classification of income or distributions for financial statement and tax purposes.
Book/tax differences primarily relate to amortization and accretion of debt securities, passive foreign investment companies and wash sale loss deferrals.
The tax character of distributions made during the current period will be determined at fiscal year end. The tax character of distributions declared to shareholders for the last fiscal year is as follows:
| | | | |
| | | 10/31/13 | |
Ordinary income (including any
short-term capital gains) | | | $12,740,259 | |
48
Notes to Financial Statements (unaudited) – continued
The federal tax cost and the tax basis components of distributable earnings were as follows:
| | | | |
| As of 4/30/14 | | | |
| Cost of investments | | | $1,117,571,408 | |
| Gross appreciation | | | 264,054,535 | |
| Gross depreciation | | | (12,083,787 | ) |
| Net unrealized appreciation (depreciation) | | | $251,970,748 | |
| |
| As of 10/31/13 | | | |
| Undistributed ordinary income | | | 6,304,995 | |
| Undistributed long-term capital gain | | | 5,028,275 | |
| Other temporary differences | | | (4,756,137 | ) |
The aggregate cost above includes prior fiscal year end tax adjustments, if applicable.
Multiple Classes of Shares of Beneficial Interest – The fund offers multiple classes of shares, which differ in their respective distribution and service fees. The fund’s income, realized and unrealized gain (loss), and common expenses are allocated to shareholders based on the daily net assets of each class. Dividends are declared separately for each class. Differences in per share dividend rates are generally due to differences in separate class expenses. Class B shares will convert to Class A shares approximately eight years after purchase. The fund’s distributions declared to shareholders as reported in the Statements of Changes in Net Assets are presented by class as follows:
| | | | | | | | | | | | | | | | |
| | | From net investment
income | | | From net realized gain on
investments | |
| | | Six months
ended
4/30/14 | | | Year
ended
10/31/13 | | | Six months
ended
4/30/14 | | | Year
ended
10/31/13 | |
| Class A | | | $7,343,059 | | | | $8,126,701 | | | | $2,833,860 | | | | $— | |
| Class B | | | 438,147 | | | | 428,412 | | | | 267,205 | | | | — | |
| Class C | | | 1,776,444 | | | | 1,428,041 | | | | 1,049,903 | | | | — | |
| Class I | | | 1,399,192 | | | | 1,368,635 | | | | 469,212 | | | | — | |
| Class R1 | | | 23,483 | | | | 25,757 | | | | 14,227 | | | | — | |
| Class R2 | | | 100,940 | | | | 109,187 | | | | 44,914 | | | | — | |
| Class R3 | | | 136,168 | | | | 149,861 | | | | 53,083 | | | | — | |
| Class R4 | | | 96,880 | | | | 72,033 | | | | 33,990 | | | | — | |
| Class R5 | | | 786,601 | | | | 1,031,632 | | | | 263,077 | | | | — | |
| Total | | | $12,100,914 | | | | $12,740,259 | | | | $5,029,471 | | | | $— | |
(3) Transactions with Affiliates
Investment Adviser – The fund has an investment advisory agreement with MFS to provide overall investment management and related administrative services and facilities to the fund. The management fee is computed daily and paid monthly at an annual rate of 0.84% of the fund’s average daily net assets.
The investment adviser has agreed in writing to reduce its management fee to 0.75% of average daily net assets in excess of $500 million and 0.70% of average daily net
49
Notes to Financial Statements (unaudited) – continued
assets in excess of $1.0 billion. This written agreement will continue until modified by the fund’s Board of Trustees, but such agreement will continue at least until February 28, 2015. For the six months ended April 30, 2014, this management fee reduction amounted to $391,642, which is included in the reduction of total expenses in the Statement of Operations. MFS has also agreed in writing to reduce its management fee by a specified amount if certain MFS mutual fund assets exceed thresholds agreed to by MFS and the fund’s Board of Trustees. For the six months ended April 30, 2014 , this management fee reduction amounted to $18,263, which is included in the reduction of total expenses in the Statement of Operations. The management fee incurred for the six months ended April 30, 2014 was equivalent to an annual effective rate of 0.77% of the fund’s average daily net assets.
The investment adviser has agreed in writing to pay a portion of the fund’s total annual operating expenses, exclusive of interest, taxes, extraordinary expenses, brokerage and transaction costs, and investment-related expenses such that total fund operating expenses do not exceed the following rates annually of each class’s average daily net assets:
| | | | | | | | | | | | | | | | | | | | | | | | | | | | | | | | |
| Classes | |
| A | | B | | | C | | | I | | | R1 | | | R2 | | | R3 | | | R4 | | | R5 | |
| 1.20% | | | 1.95% | | | | 1.95% | | | | 0.95% | | | | 1.95% | | | | 1.45% | | | | 1.20% | | | | 0.95% | | | | 0.89% | |
This written agreement will continue until modified by the fund’s Board of Trustees, but such agreement will continue at least until February 28, 2015. For the six months ended April 30, 2014, the fund’s actual operating expenses did not exceed the limit and therefore, the investment adviser did not pay any portion of the fund’s expenses related to this agreement.
Distributor – MFS Fund Distributors, Inc. (MFD), a wholly-owned subsidiary of MFS, as distributor, received $355,211 for the six months ended April 30, 2014, as its portion of the initial sales charge on sales of Class A shares of the fund.
The Board of Trustees has adopted a distribution plan for certain share classes pursuant to Rule 12b-1 of the Investment Company Act of 1940.
The fund’s distribution plan provides that the fund will pay MFD for services provided by MFD and financial intermediaries in connection with the distribution and servicing of certain share classes. One component of the plan is a distribution fee paid to MFD and another component of the plan is a service fee paid to MFD. MFD may subsequently pay all, or a portion, of the distribution and/or service fees to financial intermediaries.
Distribution Plan Fee Table:
| | | | | | | | | | | | | | | | | | | | |
| | | Distribution
Fee Rate (d) | | | Service
Fee Rate (d) | | | Total
Distribution
Plan (d) | | | Annual
Effective
Rate (e) | | | Distribution
and Service
Fee | |
| Class A | | | — | | | | 0.25% | | | | 0.25% | | | | 0.25% | | | | $862,129 | |
| Class B | | | 0.75% | | | | 0.25% | | | | 1.00% | | | | 1.00% | | | | 325,083 | |
| Class C | | | 0.75% | | | | 0.25% | | | | 1.00% | | | | 1.00% | | | | 1,296,464 | |
| Class R1 | | | 0.75% | | | | 0.25% | | | | 1.00% | | | | 1.00% | | | | 17,289 | |
| Class R2 | | | 0.25% | | | | 0.25% | | | | 0.50% | | | | 0.50% | | | | 26,202 | |
| Class R3 | | | — | | | | 0.25% | | | | 0.25% | | | | 0.25% | | | | 15,925 | |
| Total Distribution and Service Fees | | | | | | | | | | | | $2,543,092 | |
50
Notes to Financial Statements (unaudited) – continued
| (d) | In accordance with the distribution plan for certain classes, the fund pays distribution and/or service fees equal to these annual percentage rates of each class’s average daily net assets. The distribution and service fee rates disclosed by class represent the current rates in effect at the end of the reporting period. Any rate changes, if applicable, are detailed below. |
| (e) | The annual effective rates represent actual fees incurred under the distribution plan for the six months ended April 30, 2014 based on each class’s average daily net assets. MFD has voluntarily agreed to rebate a portion of each class’s 0.25% service fee attributable to accounts for which MFD retains the 0.25% service fee except for accounts attributable to MFS or its affiliates’ seed money. For the six months ended April 30, 2014, this rebate amounted to $10,788, $47, $160, and $1 for Class A, Class B, Class C, and Class R1, respectively, and is included in the reduction of total expenses in the Statement of Operations. |
Certain Class A shares are subject to a contingent deferred sales charge (CDSC) in the event of a shareholder redemption within 18 months of purchase for shares purchased on or after August 1, 2012, and within 24 months of purchase for shares purchased prior to August 1, 2012. Class C shares are subject to a CDSC in the event of a shareholder redemption within 12 months of purchase. Class B shares are subject to a CDSC in the event of a shareholder redemption within six years of purchase. All contingent deferred sales charges are paid to MFD and during the six months ended April 30, 2014, were as follows:
| | | | |
| | | Amount | |
| Class A | | | $4,600 | |
| Class B | | | 43,006 | |
| Class C | | | — | |
Shareholder Servicing Agent – MFS Service Center, Inc. (MFSC), a wholly-owned subsidiary of MFS, receives a fee from the fund for its services as shareholder servicing agent calculated as a percentage of the average daily net assets of the fund as determined periodically under the supervision of the fund’s Board of Trustees. For the six months ended April 30, 2014, the fee was $106,551, which equated to 0.0173% annually of the fund’s average daily net assets. MFSC also receives payment from the fund for out-of-pocket expenses, sub-accounting and other shareholder servicing costs which may be paid to affiliated and unaffiliated service providers. Class R5 shares do not incur sub-accounting fees. For the six months ended April 30, 2014, these out-of-pocket expenses, sub-accounting and other shareholder servicing costs amounted to $510,709.
Administrator – MFS provides certain financial, legal, shareholder communications, compliance, and other administrative services to the fund. Under an administrative services agreement, the fund partially reimburses MFS the costs incurred to provide these services. The fund is charged an annual fixed amount of $17,500 plus a fee based on average daily net assets. The administrative services fee incurred for the six months ended April 30, 2014 was equivalent to an annual effective rate of 0.0125% of the fund’s average daily net assets.
Trustees’ and Officers’ Compensation – The fund pays compensation to independent Trustees in the form of a retainer, attendance fees, and additional compensation to Board and Committee chairpersons. The fund does not pay compensation directly to Trustees or officers of the fund who are also officers of the
51
Notes to Financial Statements (unaudited) – continued
investment adviser, all of whom receive remuneration for their services to the fund from MFS. Certain officers and Trustees of the fund are officers or directors of MFS, MFD, and MFSC.
Prior to December 31, 2001, the fund had an unfunded defined benefit plan (“DB plan”) for independent Trustees. As of December 31, 2001, the Board took action to terminate the DB plan with respect to then-current and any future independent Trustees, such that the DB plan covers only certain of those former independent Trustees who retired on or before December 31, 2001. Effective January 1, 2002, accrued benefits under the DB plan for then-current independent Trustees who continued were credited to an unfunded retirement deferral plan (the “Retirement Deferral plan”), which was established for and exists solely with respect to these credited amounts, and is not available for other deferrals by these or other independent Trustees. Although the Retirement Deferral plan is unfunded, amounts deferred under the plan are periodically adjusted for investment experience as if they had been invested in shares of the fund. The DB plan resulted in a pension expense of $122 and the Retirement Deferral plan resulted in an expense of $1,244. Both amounts are included in independent Trustees’ compensation for the six months ended April 30, 2014. The liability for deferred retirement benefits payable to certain independent Trustees under both plans amounted to $7,329 at April 30, 2014, and is included in “Payable for independent Trustees’ compensation” in the Statement of Assets and Liabilities.
Other – This fund and certain other funds managed by MFS (the funds) have entered into services agreements (the Agreements) which provide for payment of fees by the funds to Tarantino LLC and Griffin Compliance LLC in return for the provision of services of an Independent Chief Compliance Officer (ICCO) and Assistant ICCO, respectively, for the funds. The ICCO and Assistant ICCO are officers of the funds and the sole members of Tarantino LLC and Griffin Compliance LLC, respectively. The funds can terminate the Agreements with Tarantino LLC and Griffin Compliance LLC at any time under the terms of the Agreements. For the six months ended April 30, 2014, the aggregate fees paid by the fund to Tarantino LLC and Griffin Compliance LLC were $3,865 and are included in “Miscellaneous” expense in the Statement of Operations. MFS has agreed to reimburse the fund for a portion of the payments made by the fund in the amount of $902, which is included in the reduction of total expenses in the Statement of Operations. Additionally, MFS has agreed to bear all expenses associated with office space, other administrative support, and supplies provided to the ICCO and Assistant ICCO.
The fund invests in the MFS Institutional Money Market Portfolio which is managed by MFS and seeks current income consistent with preservation of capital and liquidity. Income earned on this investment is included in “Dividends from underlying affiliated funds” in the Statement of Operations. This money market fund does not pay a management fee to MFS.
52
Notes to Financial Statements (unaudited) – continued
(4) Portfolio Securities
Purchases and sales of investments, other than short-term obligations, were as follows:
| | | | | | | | |
| | | Purchases | | | Sales | |
| U.S. Government securities | | | $40,293,629 | | | | $29,578,846 | |
| Investments (non-U.S. Government securities) | | | $174,587,732 | | | | $95,236,543 | |
(5) Shares of Beneficial Interest
The fund’s Declaration of Trust permits the Trustees to issue an unlimited number of full and fractional shares of beneficial interest. Transactions in fund shares were as follows:
| | | | | | | | | | | | | | | | |
| | | Six months ended
4/30/14 | | | Year ended
10/31/13 | |
| | | Shares | | | Amount | | | Shares | | | Amount | |
| Shares sold | | | | | | | | | | | | | | | | |
Class A | | | 6,208,761 | | | | $101,801,922 | | | | 11,377,278 | | | | $174,246,232 | |
Class B | | | 409,172 | | | | 6,883,420 | | | | 592,789 | | | | 9,310,563 | |
Class C | | | 2,631,593 | | | | 43,690,533 | | | | 3,791,698 | | | | 59,141,255 | |
Class I | | | 2,762,844 | | | | 44,970,532 | | | | 3,102,545 | | | | 47,101,357 | |
Class R1 | | | 17,912 | | | | 297,249 | | | | 67,568 | | | | 1,018,489 | |
Class R2 | | | 107,655 | | | | 1,750,025 | | | | 359,477 | | | | 5,386,621 | |
Class R3 | | | 90,922 | | | | 1,486,133 | | | | 186,936 | | | | 2,854,769 | |
Class R4 | | | 122,436 | | | | 2,015,156 | | | | 380,396 | | | | 5,850,910 | |
Class R5 | | | 469,358 | | | | 7,648,535 | | | | 1,567,146 | | | | 23,023,585 | |
| | | 12,820,653 | | | | $210,543,505 | | | | 21,425,833 | | | | $327,933,781 | |
| | | | |
| Shares issued to shareholders in reinvestment of distributions | | | | | | | | | | | | | | | | |
Class A | | | 582,602 | | | | $9,484,368 | | | | 501,766 | | | | $7,424,684 | |
Class B | | | 35,906 | | | | 598,085 | | | | 24,152 | | | | 357,818 | |
Class C | | | 127,582 | | | | 2,099,938 | | | | 69,254 | | | | 1,014,909 | |
Class I | | | 81,788 | | | | 1,320,347 | | | | 65,855 | | | | 970,730 | |
Class R1 | | | 2,295 | | | | 37,614 | | | | 1,764 | | | | 25,757 | |
Class R2 | | | 4,465 | | | | 72,134 | | | | 4,000 | | | | 58,589 | |
Class R3 | | | 11,663 | | | | 189,251 | | | | 10,155 | | | | 149,861 | |
Class R4 | | | 6,701 | | | | 109,172 | | | | 4,397 | | | | 65,745 | |
Class R5 | | | 65,045 | | | | 1,049,677 | | | | 70,153 | | | | 1,031,632 | |
| | | 918,047 | | | | $14,960,586 | | | | 751,496 | | | | $11,099,725 | |
53
Notes to Financial Statements (unaudited) – continued
| | | | | | | | | | | | | | | | |
| | | Six months ended
4/30/14 | | | Year ended
10/31/13 | |
| | | Shares | | | Amount | | | Shares | | | Amount | |
| Shares reacquired | | | | | | | | | | | | | | | | |
Class A | | | (2,965,519 | ) | | | $(48,622,109 | ) | | | (6,992,791 | ) | | | $(106,295,273 | ) |
Class B | | | (367,206 | ) | | | (6,181,880 | ) | | | (795,396 | ) | | | (12,377,878 | ) |
Class C | | | (1,097,389 | ) | | | (18,215,297 | ) | | | (1,801,269 | ) | | | (27,650,238 | ) |
Class I | | | (934,466 | ) | | | (15,165,337 | ) | | | (1,243,985 | ) | | | (18,888,682 | ) |
Class R1 | | | (25,428 | ) | | | (421,405 | ) | | | (64,991 | ) | | | (987,619 | ) |
Class R2 | | | (116,637 | ) | | | (1,895,227 | ) | | | (304,092 | ) | | | (4,575,695 | ) |
Class R3 | | | (70,135 | ) | | | (1,148,711 | ) | | | (100,605 | ) | | | (1,504,359 | ) |
Class R4 | | | (79,342 | ) | | | (1,300,531 | ) | | | (82,092 | ) | | | (1,259,260 | ) |
Class R5 | | | (294,824 | ) | | | (4,796,825 | ) | | | (944,730 | ) | | | (14,147,640 | ) |
| | | (5,950,946 | ) | | | $(97,747,322 | ) | | | (12,329,951 | ) | | | $(187,686,644 | ) |
| | | | |
| Net change | | | | | | | | | | | | | | | | |
Class A | | | 3,825,844 | | | | $62,664,181 | | | | 4,886,253 | | | | $75,375,643 | |
Class B | | | 77,872 | | | | 1,299,625 | | | | (178,455 | ) | | | (2,709,497 | ) |
Class C | | | 1,661,786 | | | | 27,575,174 | | | | 2,059,683 | | | | 32,505,926 | |
Class I | | | 1,910,166 | | | | 31,125,542 | | | | 1,924,415 | | | | 29,183,405 | |
Class R1 | | | (5,221 | ) | | | (86,542 | ) | | | 4,341 | | | | 56,627 | |
Class R2 | | | (4,517 | ) | | | (73,068 | ) | | | 59,385 | | | | 869,515 | |
Class R3 | | | 32,450 | | | | 526,673 | | | | 96,486 | | | | 1,500,271 | |
Class R4 | | | 49,795 | | | | 823,797 | | | | 302,701 | | | | 4,657,395 | |
Class R5 | | | 239,579 | | | | 3,901,387 | | | | 692,569 | | | | 9,907,577 | |
| | | 7,787,754 | | | | $127,756,769 | | | | 9,847,378 | | | | $151,346,862 | |
(6) Line of Credit
The fund and certain other funds managed by MFS participate in a $1.1 billion unsecured committed line of credit, subject to a $1 billion sublimit, provided by a syndication of banks under a credit agreement. Borrowings may be made for temporary financing needs. Interest is charged to each fund, based on its borrowings, generally at a rate equal to the higher of the Federal Reserve funds rate or one month LIBOR plus an agreed upon spread. A commitment fee, based on the average daily, unused portion of the committed line of credit, is allocated among the participating funds at the end of each calendar quarter. In addition, the fund and other funds managed by MFS have established unsecured uncommitted borrowing arrangements with certain banks for temporary financing needs. Interest is charged to each fund, based on its borrowings, at a rate equal to the Federal Reserve funds rate plus an agreed upon spread. For the six months ended April 30, 2014, the fund’s commitment fee and interest expense were $2,414 and $0, respectively, and are included in “Miscellaneous” expense in the Statement of Operations.
54
Notes to Financial Statements (unaudited) – continued
(7) Transactions in Underlying Affiliated Funds-Affiliated Issuers
An affiliated issuer may be considered one in which the fund owns 5% or more of the outstanding voting securities, or a company which is under common control. For the purposes of this report, the fund assumes the following to be an affiliated issuer:
| | | | | | | | | | | | | | | | |
| Underlying Affiliated Fund | | Beginning
Shares/Par
Amount | | | Acquisitions
Shares/Par
Amount | | | Dispositions
Shares/Par
Amount | | | Ending
Shares/Par
Amount | |
MFS Institutional Money
Market Portfolio | | | 28,296,047 | | | | 147,547,710 | | | | (107,081,979 | ) | | | 68,761,778 | |
| | | | |
| Underlying Affiliated Fund | | Realized
Gain (Loss) | | | Capital Gain
Distributions | | | Dividend
Income | | | Ending
Value | |
MFS Institutional Money
Market Portfolio | | | $— | | | | $— | | | | $25,304 | | | | $68,761,778 | |
55
BOARD REVIEW OF INVESTMENT ADVISORY AGREEMENT
A discussion regarding the Board’s most recent review and renewal of the fund’s Investment Advisory Agreement with MFS is available by clicking on the fund’s name under “Mutual Funds” in the “Products” section of the MFS Web site (mfs.com).
PROXY VOTING POLICIES AND INFORMATION
MFS votes proxies on behalf of the fund pursuant to proxy voting policies and procedures that are available without charge, upon request, by calling 1-800-225-2606, by visiting the Proxy Voting section of mfs.com or by visiting the SEC’s Web site at http://www.sec.gov.
Information regarding how the fund voted proxies relating to portfolio securities during the twelve-month period ended June 30, 2013 is available without charge by visiting the Proxy Voting section of mfs.com or by visiting the SEC’s Web site at http://www.sec.gov.
QUARTERLY PORTFOLIO DISCLOSURE
The fund will file a complete schedule of portfolio holdings with the Securities and Exchange Commission (the Commission) for the first and third quarters of each fiscal year on Form N-Q. A shareholder can obtain the quarterly portfolio holdings report at mfs.com. The fund’s Form N-Q is also available on the EDGAR database on the Commission’s Internet Web site at http://www.sec.gov, and may be reviewed and copied at the:
Public Reference Room
Securities and Exchange Commission
100 F Street, NE, Room 1580
Washington, D.C. 20549
Information on the operation of the Public Reference Room may be obtained by calling the Commission at 1-800-SEC-0330. Copies of the fund’s Form N-Q also may be obtained, upon payment of a duplicating fee, by electronic request at the following e-mail address: publicinfo@sec.gov, or by writing the Public Reference Section at the above address.
FURTHER INFORMATION
From time to time, MFS may post important information about the fund or the MFS funds on the MFS web site (mfs.com). This information is available by visiting the “Commentary & Announcements” and “Market Outlooks” sections of mfs.com or by clicking on the fund’s name under “Mutual Funds” in the “Products” section of mfs.com.
PROVISION OF FINANCIAL REPORTS AND SUMMARY PROSPECTUSES
The fund produces financial reports every six months and updates its summary prospectus and prospectus annually. To avoid sending duplicate copies of materials to households, only one copy of the fund’s annual and semiannual report and summary prospectus may be mailed to shareholders having the same last name and residential address on the fund’s records. However, any shareholder may contact MFSC (please see back cover for address and telephone number) to request that copies of these reports and summary prospectuses be sent personally to that shareholder.
56
Save paper with eDelivery.

| MFS® will send you prospectuses, |
reports, and proxies directly via e-mail so you will get information faster with less mailbox clutter.
To sign up:
1. Go to mfs.com.
2. Log in via MFS® Access.
3. Select eDelivery.
If you own your MFS fund shares through a financial institution or a retirement plan, MFS® TALK, MFS® Access, or eDelivery may not be available to you.
CONTACT
WEB SITE
mfs.com
MFS TALK
1-800-637-8255
24 hours a day
ACCOUNT SERVICE AND LITERATURE
Shareholders
1-800-225-2606
Financial advisors
1-800-343-2829
Retirement plan services
1-800-637-1255
MAILING ADDRESS
MFS Service Center, Inc.
P.O. Box 55824
Boston, MA 02205-5824
OVERNIGHT MAIL
MFS Service Center, Inc.
c/o Boston Financial Data Services
30 Dan Road
Canton, MA 02021-2809
During the period covered by this report, the Registrant has not amended any provision in its Code of Ethics (the “Code”) that relates to an element of the Code’s definitions enumerated in paragraph (b) of Item 2 of this Form N-CSR. During the period covered by this report, the Registrant did not grant a waiver, including an implicit waiver, from any provision of the Code.
| ITEM 3. | AUDIT COMMITTEE FINANCIAL EXPERT. |
Not applicable for semi-annual reports.
| ITEM 4. | PRINCIPAL ACCOUNTANT FEES AND SERVICES. |
Not applicable for semi-annual reports.
| ITEM 5. | AUDIT COMMITTEE OF LISTED REGISTRANTS. |
Not applicable to the Registrant.
A schedule of investments for each series of the Registrant is included as part of the report to shareholders of such series under Item 1 of this Form N-CSR.
| ITEM 7. | DISCLOSURE OF PROXY VOTING POLICIES AND PROCEDURES FOR CLOSED-END MANAGEMENT INVESTMENT COMPANIES. |
Not applicable to the Registrant.
| ITEM 8. | PORTFOLIO MANAGERS OF CLOSED-END MANAGEMENT INVESTMENT COMPANIES. |
Not applicable to the Registrant.
| ITEM 9. | PURCHASES OF EQUITY SECURITIES BY CLOSED-END MANAGEMENT INVESTMENT COMPANY AND AFFILIATED PURCHASERS. |
Not applicable to the Registrant.
| ITEM 10. | SUBMISSION OF MATTERS TO A VOTE OF SECURITY HOLDERS. |
There were no material changes to the procedures by which shareholders may send recommendations to the Board for nominees to the Registrant’s Board since the Registrant last provided disclosure as to such procedures in response to the requirements of Item 407 (c)(2)(iv) of Regulation S-K or this Item.
| ITEM 11. | CONTROLS AND PROCEDURES. |
| (a) | Based upon their evaluation of the effectiveness of the registrant’s disclosure controls and procedures (as defined in Rule 30a-3(c) under the Investment Company Act of 1940 (the “Act”)) as conducted within 90 days of the filing date of this report on Form N-CSR, the registrant’s principal financial officer and principal executive officer have concluded that those disclosure controls and procedures provide reasonable assurance that the material information required to be disclosed by the registrant on this report is recorded, processed, summarized and reported within the time periods specified in the Securities and Exchange Commission’s rules and forms. |
| (b) | There were no changes in the registrant’s internal controls over financial reporting (as defined in Rule 30a-3(d) under the Act) that occurred during the second fiscal quarter of the period covered by the report that have materially affected, or are reasonably likely to materially affect, the registrant’s internal control over financial reporting. |
| (a) | File the exhibits listed below as part of this form. Letter or number the exhibits in the sequence indicated. |
| | (1) | Any code of ethics, or amendment thereto, that is the subject of the disclosure required by Item 2, to the extent that the registrant intends to satisfy the Item 2 requirements through filing of an exhibit. |
| | (2) | A separate certification for each principal executive officer and principal financial officer of the registrant as required by Rule 30a-2(a) under the Act (17 CFR 270.30a-2): Attached hereto. |
| (b) | If the report is filed under Section 13(a) or 15(d) of the Exchange Act, provide the certifications required by Rule 30a-2(b) under the Act (17 CFR 270.30a-2(b)), Rule 13a-14(b) or Rule 15d-14(b) under the Exchange Act (17 CFR 240.13a-14(b) or 240.15d-14(b)) and Section 1350 of Chapter 63 of Title 18 of the United States Code (18 U.S.C. 1350) as an exhibit. A certification furnished pursuant to this paragraph will not be deemed “filed” for the purposes of Section 18 of the Exchange Act (15 U.S.C. 78r), or otherwise subject to the liability of that section. Such certification will not be deemed to be incorporated by reference into any filing under the Securities Act of 1933 or the Exchange Act, except to the extent that the registrant specifically incorporates it by reference: Attached hereto. |
Notice
A copy of the Amended and Restated Declaration of Trust, as amended, of the Registrant is on file with the Secretary of State of The Commonwealth of Massachusetts and notice is hereby given that this instrument is executed on behalf of the Registrant by an officer of the Registrant as an officer and not individually and the obligations of or arising out of this instrument are not binding upon any of the Trustees or shareholders individually, but are binding only upon the assets and property of the respective constituent series of the Registrant.
SIGNATURES
Pursuant to the requirements of the Securities Exchange Act of 1934 and the Investment Company Act of 1940, the registrant has duly caused this report to be signed on its behalf by the undersigned, thereunto duly authorized.
(Registrant) MFS SERIES TRUST VI
| | |
| By (Signature and Title)* | | JOHN M. CORCORAN |
| | John M. Corcoran, President |
Date: June 17, 2014
Pursuant to the requirements of the Securities Exchange Act of 1934 and the Investment Company Act of 1940, this report has been signed below by the following persons on behalf of the registrant and in the capacities and on the dates indicated.
| | |
| By (Signature and Title)* | | JOHN M. CORCORAN |
| | John M. Corcoran, President (Principal Executive Officer) |
Date: June 17, 2014
| | |
| By (Signature and Title)* | | DAVID L. DILORENZO |
| | David L. DiLorenzo, Treasurer (Principal Financial Officer and Accounting Officer) |
Date: June 17, 2014
| * | Print name and title of each signing officer under his or her signature. |