UNITED STATES
SECURITIES AND EXCHANGE COMMISSION
Washington, D.C. 20549
FORMN-CSR
CERTIFIED SHAREHOLDER REPORT OF
REGISTERED MANAGEMENT INVESTMENT COMPANIES
Investment Company Act file number811-6102
MFS SERIES TRUST VI
(Exact name of registrant as specified in charter)
111 Huntington Avenue, Boston, Massachusetts 02199
(Address of principal executive offices) (Zip code)
Christopher R. Bohane
Massachusetts Financial Services Company
111 Huntington Avenue
Boston, Massachusetts 02199
(Name and address of agents for service)
Registrant’s telephone number, including area code: (617)954-5000
Date of fiscal year end: October 31
Date of reporting period: April 30, 2019
| ITEM 1. | REPORTS TO STOCKHOLDERS. |
Semiannual Report
April 30, 2019

MFS® Global Equity Fund

Beginning on January 1, 2021, as permitted by regulations adopted by the U.S. Securities and Exchange Commission, paper copies of the fund’s annual and semiannual shareholder reports will no longer be sent by mail, unless you specifically request paper copies of the reports. Instead, the complete reports will be made available on the fund’s Web site (funds.mfs.com), and you will be notified by mail each time a report is posted and provided with a Web site link to access the report.
If you are already signed up to receive shareholder reports by email, you will not be affected by this change and you need not take any action. You may sign up to receive shareholder reports and other communications from the fund by email by contacting your financial intermediary (such as a broker-dealer or bank) or, if you hold your shares directly with the fund, by calling 1-800-225-2606 or by logging on to MFS Access at mfs.com.
Beginning on January 1, 2019, you may elect to receive all future reports in paper free of charge. Contact your financial intermediary to request that you continue to receive paper copies of your shareholder reports. If you invest directly with the fund, you can call 1-800-225-2606 or send an email request to orderliterature@mfs.com to let the fund know that you wish to continue receiving paper copies of your shareholder reports. Your election to receive reports in paper will apply to all funds held in your account if you invest through your financial intermediary or all funds held with the MFS fund complex if you invest directly.
LGE-SEM
MFS® Global Equity Fund
CONTENTS
The report is prepared for the general information of shareholders.
It is authorized for distribution to prospective investors only when preceded or accompanied by a current prospectus.
NOT FDIC INSURED• MAY LOSE VALUE• NO BANK GUARANTEE

LETTER FROM THE EXECUTIVE CHAIRMAN
Dear Shareholders:
Markets experienced a bout of volatility in late 2018 as a result of higher interest rates, international trade friction, and geopolitical uncertainty surrounding issues such as
Brexit. Those concerns dissipated in the early months of 2019 due to the more dovish posture of the U.S. Federal Reserve and other global central banks, reported progress toward a trade pact between the United States and China, and action against ano-deal Brexit by the British Parliament. However, a last-minute breakdown in negotiations between the U.S. and China derailed the market’s momentum and increased concerns over the future pace of global growth. Compounding Brexit uncertainty was the resignation of British Prime Minister Theresa May, potentially ushering in a harder form of Brexit than she had advocated. U.S. equities have continued to outperform their global peers due in
part to fiscal stimulus undertaken in late 2017 and early 2018, which contributed to the continuation of relatively healthy levels of U.S. economic output against a backdrop of slower global growth. Inflation remains largely subdued globally, which is encouraging for asset markets. Rising incomes in many developed and emerging markets are supportive of gains in consumption, though a challenging environment for global trade has hindered manufacturing in most regions.
Since launching the first U.S.open-end mutual fund in 1924, MFS® has been committed to a single purpose: to create value by allocating capital responsibly for clients. Through our powerful global investment platform, we combine collective expertise, thoughtful risk management, and long-term discipline to uncover what we believe are the best investment opportunities in the market.
Respectfully,

Robert J. Manning
Executive Chairman
MFS Investment Management
June 17, 2019
The opinions expressed in this letter are subject to change and may not be relied upon for investment advice. No forecasts can be guaranteed.
1
PORTFOLIO COMPOSITION
Portfolio structure

| | | | |
| Top ten holdings | |
| Visa, Inc., “A” | | | 3.2% | |
| Thermo Fisher Scientific, Inc. | | | 3.1% | |
| Comcast Corp., “A” | | | 3.1% | |
| Medtronic PLC | | | 2.7% | |
| Nestle S.A. | | | 2.7% | |
| Accenture PLC, “A” | | | 2.6% | |
| Honeywell International, Inc. | | | 2.6% | |
| LVMH Moet Hennessy Louis Vuitton SE | | | 2.5% | |
| Essity AB | | | 2.3% | |
| Diageo PLC | | | 2.3% | |
|
| GICS equity sectors | |
| Health Care | | | 19.3% | |
| Industrials | | | 18.7% | |
| Consumer Staples | | | 17.1% | |
| Information Technology | | | 13.2% | |
| Financials | | | 9.0% | |
| Consumer Discretionary | | | 8.7% | |
| Communication Services | | | 6.9% | |
| Materials | | | 5.4% | |
| Energy | | | 0.6% | |
| | | | |
| Issuer country weightings (x) | |
| United States | | | 56.0% | |
| France | | | 10.5% | |
| United Kingdom | | | 7.6% | |
| Switzerland | | | 7.4% | |
| Germany | | | 4.0% | |
| Japan | | | 2.8% | |
| Sweden | | | 2.3% | |
| Netherlands | | | 2.2% | |
| Canada | | | 1.9% | |
| Other Countries | | | 5.3% | |
|
| Currency exposure weightings (y) | |
| United States Dollar | | | 57.6% | |
| Euro | | | 19.8% | |
| British Pound Sterling | | | 7.6% | |
| Swiss Franc | | | 7.4% | |
| Japanese Yen | | | 2.8% | |
| Swedish Krona | | | 2.3% | |
| South Korean Won | | | 0.8% | |
| Danish Krone | | | 0.7% | |
| Brazilian Real | | | 0.3% | |
| Other Currencies | | | 0.7% | |
| (x) | Represents the portfolio’s exposure to issuer countries as a percentage of a portfolio’s net assets. For purposes of this presentation, United States includes Cash & Cash Equivalents. |
| (y) | Represents the portfolio’s exposure to a particular currency as a percentage of a portfolio’s net assets. For purposes of this presentation, United States Dollar includes Cash & Cash Equivalents. |
2
Portfolio Composition – continued
Cash & Cash Equivalents includes any cash, investments in money market funds, short-term securities, and other assets less liabilities. Please see the Statement of Assets and Liabilities for additional information related to the fund’s cash position and other assets and liabilities.
The Global Industry Classification Standard (GICS®) was developed by and/or is the exclusive property of MSCI, Inc. and S&P Global Market Intelligence Inc. (“S&P Global Market Intelligence”). GICS is a service mark of MSCI and S&P Global Market Intelligence and has been licensed for use by MFS.
Percentages are based on net assets as of April 30, 2019.
The portfolio is actively managed and current holdings may be different.
3
EXPENSE TABLE
Fund expenses borne by the shareholders during the period, November 1, 2018 through April 30, 2019
As a shareholder of the fund, you incur two types of costs: (1) transaction costs, including sales charges (loads) on certain purchase or redemption payments, and (2) ongoing costs, including management fees; distribution and service(12b-1) fees; and other fund expenses. This example is intended to help you understand your ongoing costs (in dollars) of investing in the fund and to compare these costs with the ongoing costs of investing in other mutual funds.
The example is based on an investment of $1,000 invested at the beginning of the period and held for the entire period November 1, 2018 through April 30, 2019.
Actual Expenses
The first line for each share class in the following table provides information about actual account values and actual expenses. You may use the information in this line, together with the amount you invested, to estimate the expenses that you paid over the period. Simply divide your account value by $1,000 (for example, an $8,600 account value divided by $1,000 = 8.6), then multiply the result by the number in the first line under the heading entitled “Expenses Paid During Period” to estimate the expenses you paid on your account during this period.
Hypothetical Example for Comparison Purposes
The second line for each share class in the following table provides information about hypothetical account values and hypothetical expenses based on the fund’s actual expense ratio and an assumed rate of return of 5% per year before expenses, which is not the fund’s actual return. The hypothetical account values and expenses may not be used to estimate the actual ending account balance or expenses you paid for the period. You may use this information to compare the ongoing costs of investing in the fund and other funds. To do so, compare this 5% hypothetical example with the 5% hypothetical examples that appear in the shareholder reports of the other funds.
Please note that the expenses shown in the table are meant to highlight your ongoing costs only and do not reflect any transactional costs, such as sales charges (loads). Therefore, the second line for each share class in the table is useful in comparing ongoing costs only, and will not help you determine the relative total costs of owning different funds. In addition, if these transactional costs were included, your costs would have been higher.
4
Expense Table – continued
| | | | | | | | | | | | | | | | | | |
Share
Class | | | | Annualized
Expense
Ratio | | | Beginning
Account Value
11/01/18 | | | Ending Account Value
4/30/19 | | | Expenses Paid During
Period (p) 11/01/18-4/30/19 | |
| A | | Actual | | | 1.17% | | | | $1,000.00 | | | | $1,122.66 | | | | $6.16 | |
| | Hypothetical (h) | | | 1.17% | | | | $1,000.00 | | | | $1,018.99 | | | | $5.86 | |
| B | | Actual | | | 1.92% | | | | $1,000.00 | | | | $1,118.43 | | | | $10.08 | |
| | Hypothetical (h) | | | 1.92% | | | | $1,000.00 | | | | $1,015.27 | | | | $9.59 | |
| C | | Actual | | | 1.92% | | | | $1,000.00 | | | | $1,118.17 | | | | $10.08 | |
| | Hypothetical (h) | | | 1.92% | | | | $1,000.00 | | | | $1,015.27 | | | | $9.59 | |
| I | | Actual | | | 0.93% | | | | $1,000.00 | | | | $1,123.71 | | | | $4.90 | |
| | Hypothetical (h) | | | 0.93% | | | | $1,000.00 | | | | $1,020.18 | | | | $4.66 | |
| R1 | | Actual | | | 1.92% | | | | $1,000.00 | | | | $1,118.15 | | | | $10.08 | |
| | Hypothetical (h) | | | 1.92% | | | | $1,000.00 | | | | $1,015.27 | | | | $9.59 | |
| R2 | | Actual | | | 1.42% | | | | $1,000.00 | | | | $1,121.14 | | | | $7.47 | |
| | Hypothetical (h) | | | 1.42% | | | | $1,000.00 | | | | $1,017.75 | | | | $7.10 | |
| R3 | | Actual | | | 1.17% | | | | $1,000.00 | | | | $1,122.63 | | | | $6.16 | |
| | Hypothetical (h) | | | 1.17% | | | | $1,000.00 | | | | $1,018.99 | | | | $5.86 | |
| R4 | | Actual | | | 0.92% | | | | $1,000.00 | | | | $1,123.74 | | | | $4.84 | |
| | Hypothetical (h) | | | 0.92% | | | | $1,000.00 | | | | $1,020.23 | | | | $4.61 | |
| R6 | | Actual | | | 0.82% | | | | $1,000.00 | | | | $1,124.48 | | | | $4.32 | |
| | Hypothetical (h) | | | 0.82% | | | | $1,000.00 | | | | $1,020.73 | | | | $4.11 | |
| (h) | 5% class return per year before expenses. |
| (p) | “Expenses Paid During Period” are equal to each class’s annualized expense ratio, as shown above, multiplied by the average account value over the period, multiplied by 181/365 (to reflect theone-half year period). Expenses paid do not include any applicable sales charges (loads). If these transaction costs had been included, your costs would have been higher. |
5
PORTFOLIO OF INVESTMENTS
4/30/19 (unaudited)
The Portfolio of Investments is a complete list of all securities owned by your fund. It is categorized by broad-based asset classes.
| | | | | | | | |
| Common Stocks - 98.9% | | | | | | | | |
| | |
| Issuer | | Shares/Par | | | Value ($) | |
| Aerospace - 4.4% | | | | | | | | |
| Honeywell International, Inc. | | | 444,253 | | | $ | 77,135,648 | |
| MTU Aero Engines AG | | | 89,880 | | | | 21,139,732 | |
| United Technologies Corp. | | | 232,122 | | | | 33,102,918 | |
| | | | | | | | |
| | | | | | | $ | 131,378,298 | |
| Airlines - 1.2% | | | | | | | | |
| Aena S.A. | | | 194,846 | | | $ | 36,135,467 | |
| | |
| Alcoholic Beverages - 6.1% | | | | | | | | |
| Ambev S.A. | | | 2,178,978 | | | $ | 10,263,886 | |
| Carlsberg Group | | | 162,633 | | | | 21,007,445 | |
| Diageo PLC | | | 1,617,352 | | | | 68,195,387 | |
| Heineken N.V. (l) | | | 265,345 | | | | 28,642,076 | |
| Pernod Ricard S.A. | | | 305,531 | | | | 53,235,889 | |
| | | | | | | | |
| | | | | | | $ | 181,344,683 | |
| Apparel Manufacturers - 4.0% | | | | | | | | |
| Burberry Group PLC | | | 623,916 | | | $ | 16,410,039 | |
| Compagnie Financiere Richemont S.A. | | | 369,881 | | | | 27,043,657 | |
| LVMH Moet Hennessy Louis Vuitton SE (l) | | | 192,700 | | | | 75,440,981 | |
| | | | | | | | |
| | | | | | | $ | 118,894,677 | |
| Automotive - 0.8% | | | | | | | | |
| Aptiv PLC | | | 179,561 | | | $ | 15,388,378 | |
| Harley-Davidson, Inc. | | | 241,084 | | | | 8,975,557 | |
| | | | | | | | |
| | | | | | | $ | 24,363,935 | |
| Broadcasting - 3.8% | | | | | | | | |
| Omnicom Group, Inc. | | | 195,394 | | | $ | 15,637,382 | |
| Walt Disney Co. | | | 493,274 | | | | 67,563,740 | |
| WPP Group PLC | | | 2,550,747 | | | | 31,811,528 | |
| | | | | | | | |
| | | | | | | $ | 115,012,650 | |
| Brokerage & Asset Managers - 0.4% | | | | | | | | |
| Deutsche Boerse AG | | | 90,540 | | | $ | 12,074,254 | |
| | |
| Business Services - 7.3% | | | | | | | | |
| Accenture PLC, “A” | | | 433,632 | | | $ | 79,211,557 | |
| Adecco S.A. | | | 257,118 | | | | 14,766,716 | |
| Brenntag AG | | | 284,296 | | | | 15,324,718 | |
6
Portfolio of Investments (unaudited) – continued
| | | | | | | | |
| | |
| Issuer | | Shares/Par | | | Value ($) | |
| Common Stocks - continued | | | | | | | | |
| Business Services - continued | | | | | | | | |
| Cognizant Technology Solutions Corp., “A” | | | 463,119 | | | $ | 33,789,162 | |
| Compass Group PLC | | | 1,360,044 | | | | 30,912,059 | |
| Equifax, Inc. | | | 183,588 | | | | 23,122,909 | |
| PayPal Holdings, Inc. (a) | | | 199,254 | | | | 22,469,874 | |
| | | | | | | | |
| | | | | | | $ | 219,596,995 | |
| Cable TV - 3.1% | | | | | | | | |
| Comcast Corp., “A” | | | 2,110,489 | | | $ | 91,869,586 | |
| | |
| Chemicals - 2.7% | | | | | | | | |
| 3M Co. | | | 225,403 | | | $ | 42,716,123 | |
| PPG Industries, Inc. | | | 315,025 | | | | 37,015,437 | |
| | | | | | | | |
| | | | | | | $ | 79,731,560 | |
| Computer Software - 2.8% | | | | | | | | |
| Check Point Software Technologies Ltd. (a) | | | 312,569 | | | $ | 37,745,832 | |
| Oracle Corp. | | | 827,132 | | | | 45,765,214 | |
| | | | | | | | |
| | | | | | | $ | 83,511,046 | |
| Computer Software - Systems - 0.9% | | | | | | | | |
| Olympus Corp. | | | 2,393,600 | | | $ | 26,872,441 | |
| | |
| Consumer Products - 5.8% | | | | | | | | |
| Colgate-Palmolive Co. | | | 482,137 | | | $ | 35,094,752 | |
| Coty, Inc., “A” | | | 819,456 | | | | 8,866,514 | |
| Essity AB | | | 2,331,981 | | | | 69,194,679 | |
| Reckitt Benckiser Group PLC | | | 762,602 | | | | 61,625,013 | |
| | | | | | | | |
| | | | | | | $ | 174,780,958 | |
| Electrical Equipment - 3.9% | | | | | | | | |
| Amphenol Corp., “A” | | | 171,827 | | | $ | 17,107,096 | |
| Legrand S.A. | | | 428,661 | | | | 31,501,108 | |
| Resideo Technologies, Inc. (a) | | | 75,485 | | | | 1,713,510 | |
| Schneider Electric S.A. (l) | | | 775,767 | | | | 65,657,762 | |
| | | | | | | | |
| | | | | | | $ | 115,979,476 | |
| Electronics - 1.9% | | | | | | | | |
| Hoya Corp. | | | 299,000 | | | $ | 21,065,804 | |
| Microchip Technology, Inc. | | | 141,872 | | | | 14,171,594 | |
| Samsung Electronics Co. Ltd. | | | 572,330 | | | | 22,464,008 | |
| | | | | | | | |
| | | | | | | $ | 57,701,406 | |
| Food & Beverages - 5.2% | | | | | | | | |
| Danone S.A. (l) | | | 643,804 | | | $ | 52,048,284 | |
| Kellogg Co. | | | 405,369 | | | | 24,443,751 | |
7
Portfolio of Investments (unaudited) – continued
| | | | | | | | |
| | |
| Issuer | | Shares/Par | | | Value ($) | |
| Common Stocks - continued | | | | | | | | |
| Food & Beverages - continued | | | | | | | | |
| Nestle S.A. | | | 829,433 | | | $ | 79,813,441 | |
| | | | | | | | |
| | | | | | | $ | 156,305,476 | |
| Gaming & Lodging - 0.7% | | | | | | | | |
| Marriott International, Inc., “A” | | | 70,458 | | | $ | 9,611,880 | |
| Sands China Ltd. | | | 1,087,200 | | | | 5,973,170 | |
| Wynn Resorts Ltd. | | | 43,884 | | | | 6,339,044 | |
| | | | | | | | |
| | | | | | | $ | 21,924,094 | |
| Insurance - 1.1% | | | | | | | | |
| Aon PLC | | | 190,489 | | | $ | 34,314,688 | |
| | |
| Internet - 0.9% | | | | | | | | |
| eBay, Inc. | | | 676,245 | | | $ | 26,204,494 | |
| | |
| Machinery & Tools - 1.2% | | | | | | | | |
| Kubota Corp. | | | 2,392,800 | | | $ | 36,010,927 | |
| | |
| Major Banks - 4.8% | | | | | | | | |
| Bank of New York Mellon Corp. | | | 876,163 | | | $ | 43,510,255 | |
| Goldman Sachs Group, Inc. | | | 136,760 | | | | 28,161,619 | |
| State Street Corp. | | | 620,708 | | | | 41,997,103 | |
| UBS Group AG | | | 2,168,859 | | | | 29,086,273 | |
| | | | | | | | |
| | | | | | | $ | 142,755,250 | |
| Medical Equipment - 13.3% | | | | | | | | |
| Abbott Laboratories | | | 573,229 | | | $ | 45,606,099 | |
| Cooper Cos., Inc. | | | 120,266 | | | | 34,867,519 | |
| Medtronic PLC | | | 919,800 | | | | 81,687,438 | |
| Sonova Holding AG | | | 51,540 | | | | 10,394,494 | |
| Stryker Corp. | | | 288,086 | | | | 54,422,326 | |
| Thermo Fisher Scientific, Inc. | | | 338,110 | | | | 93,808,620 | |
| Waters Corp. (a) | | | 122,070 | | | | 26,066,828 | |
| Zimmer Biomet Holdings, Inc. | | | 412,929 | | | | 50,856,336 | |
| | | | | | | | |
| | | | | | | $ | 397,709,660 | |
| Network & Telecom - 1.0% | | | | | | | | |
| Cisco Systems, Inc. | | | 519,707 | | | $ | 29,077,607 | |
| | |
| Oil Services - 0.7% | | | | | | | | |
| National Oilwell Varco, Inc. | | | 205,287 | | | $ | 5,366,202 | |
| NOW, Inc. (a) | | | 119,887 | | | | 1,752,748 | |
| Schlumberger Ltd. | | | 307,060 | | | | 13,105,321 | |
| | | | | | | | |
| | | | | | | $ | 20,224,271 | |
8
Portfolio of Investments (unaudited) – continued
| | | | | | | | |
| | |
| Issuer | | Shares/Par | | | Value ($) | |
| Common Stocks - continued | | | | | | | | |
| Other Banks & Diversified Financials - 5.8% | | | | | | | | |
| American Express Co. | | | 341,601 | | | $ | 40,045,885 | |
| Erste Group Bank AG | | | 280,673 | | | | 11,238,460 | |
| Grupo Financiero Banorte S.A. de C.V. | | | 1,415,307 | | | | 8,946,011 | |
| Julius Baer Group Ltd. | | | 268,918 | | | | 12,963,592 | |
| Kasikornbank PLC | | | 971,080 | | | | 5,794,542 | |
| Visa, Inc., “A” | | | 573,812 | | | | 94,351,907 | |
| | | | | | | | |
| | | | | | | $ | 173,340,397 | |
| Pharmaceuticals - 4.4% | | | | | | | | |
| Bayer AG | | | 751,091 | | | $ | 49,989,417 | |
| Johnson & Johnson | | | 82,873 | | | | 11,701,668 | |
| Merck KGaA | | | 203,167 | | | | 21,620,504 | |
| Roche Holding AG | | | 180,157 | | | | 47,490,230 | |
| | | | | | | | |
| | | | | | | $ | 130,801,819 | |
| Railroad & Shipping - 3.8% | | | | | | | | |
| Canadian National Railway Co. | | | 618,165 | | | $ | 57,353,349 | |
| Kansas City Southern Co. | | | 471,613 | | | | 58,074,425 | |
| | | | | | | | |
| | | | | | | $ | 115,427,774 | |
| Restaurants - 0.6% | | | | | | | | |
| Whitbread PLC | | | 295,527 | | | $ | 17,187,377 | |
| | |
| Specialty Chemicals - 4.2% | | | | | | | | |
| Akzo Nobel N.V. | | | 430,273 | | | $ | 36,532,378 | |
| L’Air Liquide S.A. | | | 224,166 | | | | 29,806,383 | |
| Linde PLC | | | 254,823 | | | | 45,843,837 | |
| Linde PLC | | | 75,303 | | | | 13,574,119 | |
| | | | | | | | |
| | | | | | | $ | 125,756,717 | |
| Specialty Stores - 0.6% | | | | | | | | |
| AutoZone, Inc. (a) | | | 5,471 | | | $ | 5,625,884 | |
| Hermes International | | | 9,729 | | | | 6,844,035 | |
| Sally Beauty Holdings, Inc. (a) | | | 385,649 | | | | 6,825,987 | |
| | | | | | | | |
| | | | | | | $ | 19,295,906 | |
| Trucking - 1.5% | | | | | | | | |
| United Parcel Service, Inc., “B” | | | 425,401 | | | $ | 45,186,094 | |
| Total Common Stocks (Identified Cost, $1,841,706,269) | | | $ | 2,960,769,983 | |
| | |
| Investment Companies (h) - 0.4% | | | | | | | | |
| Money Market Funds - 0.4% | | | | | | | | |
| MFS Institutional Money Market Portfolio, 2.48% (v) (Identified Cost, $11,888,454) | | | 11,889,495 | | | $ | 11,889,495 | |
9
Portfolio of Investments (unaudited) – continued
| | | | | | | | |
| Collateral for Securities Loaned - 2.2% | | | | | | | | |
| | |
| Issuer | | Shares/Par | | | Value ($) | |
| JPMorgan U.S. Government Money Market Fund, 2.36% (j) (Identified Cost, $65,399,555) | | | 65,399,555 | | | $ | 65,399,555 | |
| | |
| Other Assets, Less Liabilities - (1.5)% | | | | | | | (45,760,935 | ) |
| Net Assets - 100.0% | | | | | | $ | 2,992,298,098 | |
| (a) | Non-income producing security. |
| (h) | An affiliated issuer, which may be considered one in which the fund owns 5% or more of the outstanding voting securities, or a company which is under common control. At period end, the aggregate values of the fund’s investments in affiliated issuers and in unaffiliated issuers were $11,889,495 and $3,026,169,538, respectively. |
| (j) | The rate quoted is the annualizedseven-day yield of the fund at period end. |
| (l) | A portion of this security is on loan. See Note 2 for additional information. |
| (v) | Affiliated issuer that is available only to investment companies managed by MFS. The rate quoted for the MFS Institutional Money Market Portfolio is the annualizedseven-day yield of the fund at period end. |
See Notes to Financial Statements
10
Financial Statements
STATEMENT OF ASSETS AND LIABILITIES
At 4/30/19 (unaudited)
This statement represents your fund’s balance sheet, which details the assets and liabilities comprising the total value of the fund.
| | | | |
| Assets | | | | |
Investments in unaffiliated issuers, at value, including $133,286,925 of securities on loan (identified cost, $1,907,105,824) | | | $3,026,169,538 | |
Investments in affiliated issuers, at value (identified cost, $11,888,454) | | | 11,889,495 | |
Foreign currency, at value (identified cost, $95,815) | | | 95,815 | |
Receivables for | | | | |
Investments sold | | | 11,132,350 | |
Fund shares sold | | | 5,987,182 | |
Interest and dividends | | | 12,472,378 | |
Other assets | | | 7,473 | |
Total assets | | | $3,067,754,231 | |
| |
| Liabilities | | | | |
Payables for | | | | |
Investments purchased | | | $3,017,754 | |
Fund shares reacquired | | | 5,707,683 | |
Collateral for securities loaned, at value (c) | | | 65,399,555 | |
Payable to affiliates | | | | |
Investment adviser | | | 125,980 | |
Shareholder servicing costs | | | 953,005 | |
Distribution and service fees | | | 21,905 | |
Payable for independent Trustees’ compensation | | | 4,466 | |
Deferred country tax expense payable | | | 94,844 | |
Accrued expenses and other liabilities | | | 130,941 | |
Total liabilities | | | $75,456,133 | |
Net assets | | | $2,992,298,098 | |
| |
| Net assets consist of | | | | |
Paid-in capital | | | $1,855,909,147 | |
Total distributable earnings (loss) | | | 1,136,388,951 | |
Net assets | | | $2,992,298,098 | |
Shares of beneficial interest outstanding | | | 67,375,068 | |
| (c) | Non-cash collateral is not included. |
11
Statement of Assets and Liabilities (unaudited) – continued
| | | | | | | | | | | | |
| | | |
| | | Net assets | | | Shares
outstanding | | | Net asset value
per share (a) | |
Class A | | | $715,024,358 | | | | 16,225,810 | | | | $44.07 | |
Class B | | | 24,737,425 | | | | 610,696 | | | | 40.51 | |
Class C | | | 151,399,434 | | | | 3,917,903 | | | | 38.64 | |
Class I | | | 891,581,805 | | | | 19,696,677 | | | | 45.27 | |
Class R1 | | | 2,507,065 | | | | 63,336 | | | | 39.58 | |
Class R2 | | | 42,952,455 | | | | 1,004,378 | | | | 42.77 | |
Class R3 | | | 90,287,914 | | | | 2,063,441 | | | | 43.76 | |
Class R4 | | | 145,927,304 | | | | 3,301,414 | | | | 44.20 | |
Class R6 | | | 927,880,338 | | | | 20,491,413 | | | | 45.28 | |
| (a) | Maximum offering price per share was equal to the net asset value per share for all share classes, except for Class A, for which the maximum offering price per share was $46.76 [100 / 94.25 x $44.07]. On sales of $50,000 or more, the maximum offering price of Class A shares is reduced. A contingent deferred sales charge may be imposed on redemptions of Class A, Class B, and Class C shares. Redemption price per share was equal to the net asset value per share for Classes I, R1, R2, R3, R4, and R6. |
See Notes to Financial Statements
12
Financial Statements
STATEMENT OF OPERATIONS
Six months ended 4/30/19 (unaudited)
This statement describes how much your fund earned in investment income and accrued in expenses. It also describes any gains and/or losses generated by fund operations.
| | | | |
| Net investment income (loss) | | | | |
Income | | | | |
Dividends | | | $39,206,673 | |
Dividends from affiliated issuers | | | 142,339 | |
Income on securities loaned | | | 46,170 | |
Other | | | 1,116 | |
Foreign taxes withheld | | | (2,819,641 | ) |
Total investment income | | | $36,576,657 | |
Expenses | | | | |
Management fee | | | $10,820,432 | |
Distribution and service fees | | | 1,891,477 | |
Shareholder servicing costs | | | 1,171,632 | |
Administrative services fee | | | 195,408 | |
Independent Trustees’ compensation | | | 19,544 | |
Custodian fee | | | 160,076 | |
Shareholder communications | | | 81,108 | |
Audit and tax fees | | | 32,306 | |
Legal fees | | | 12,364 | |
Miscellaneous | | | 146,249 | |
Total expenses | | | $14,530,596 | |
Fees paid indirectly | | | (103 | ) |
Reduction of expenses by investment adviser and distributor | | | (152,772 | ) |
Net expenses | | | $14,377,721 | |
Net investment income (loss) | | | $22,198,936 | |
| |
| Realized and unrealized gain (loss) | | | | |
Realized gain (loss) (identified cost basis) | | | | |
Unaffiliated issuers (net of $8,970 country tax) | | | $18,065,157 | |
Affiliated issuers | | | 4,194 | |
Foreign currency | | | (45,067 | ) |
Net realized gain (loss) | | | $18,024,284 | |
Change in unrealized appreciation or depreciation | | | | |
Unaffiliated issuers (net of $33,520 decrease in deferred country tax) | | | $289,083,593 | |
Affiliated issuers | | | 1,040 | |
Translation of assets and liabilities in foreign currencies | | | (23,198 | ) |
Net unrealized gain (loss) | | | $289,061,435 | |
Net realized and unrealized gain (loss) | | | $307,085,719 | |
Change in net assets from operations | | | $329,284,655 | |
See Notes to Financial Statements
13
Financial Statements
STATEMENTS OF CHANGES IN NET ASSETS
These statements describe the increases and/or decreases in net assets resulting from operations, any distributions, and any shareholder transactions.
| | | | | | | | |
| Change in net assets | | Six months ended
4/30/19
(unaudited) | | | Year ended
10/31/18 | |
| | |
| From operations | | | | | | | | |
Net investment income (loss) | | | $22,198,936 | | | | $33,344,236 | |
Net realized gain (loss) | | | 18,024,284 | | | | 127,748,250 | |
Net unrealized gain (loss) | | | 289,061,435 | | | | (199,283,976 | ) |
Change in net assets from operations | | | $329,284,655 | | | | $(38,191,490 | ) |
Total distributions to shareholders | | | $(150,150,375 | ) | | | $(93,073,314 | ) |
Change in net assets from fund share transactions | | | $(46,431,489 | ) | | | $(333,694,745 | ) |
Total change in net assets | | | $132,702,791 | | | | $(464,959,549 | ) |
| | |
| Net assets | | | | | | | | |
At beginning of period | | | 2,859,595,307 | | | | 3,324,554,856 | |
At end of period | | | $2,992,298,098 | | | | $2,859,595,307 | |
See Notes to Financial Statements
14
Financial Statements
FINANCIAL HIGHLIGHTS
The financial highlights table is intended to help you understand the fund’s financial performance for the semiannual period and the past 5 fiscal years. Certain information reflects financial results for a single fund share. The total returns in the table represent the rate that an investor would have earned (or lost) on an investment in the fund share class (assuming reinvestment of all distributions) held for the entire period.
| | | | | | | | | | | | | | | | | | | | | | | | |
| | | Six months
ended 4/30/19 | | | Year ended | |
| Class A | | 10/31/18 | | | 10/31/17 | | | 10/31/16 | | | 10/31/15 | | | 10/31/14 | |
| | | (unaudited) | | | | | | | | | | | | | | | | |
Net asset value, beginning of
period | | | $41.44 | | | | $43.43 | | | | $36.00 | | | | $36.22 | | | | $35.45 | | | | $33.74 | |
| | | |
| Income (loss) from investment operations | | | | | | | | | | | | | |
Net investment income
(loss) (d) | | | $0.30 | | | | $0.40 | | | | $0.27 | (c) | | | $0.26 | | | | $0.30 | | | | $0.26 | |
Net realized and unrealized
gain (loss) | | | 4.50 | | | | (1.23 | ) | | | 7.66 | | | | 0.16 | | | | 1.07 | | | | 1.90 | |
Total from investment operations | | | $4.80 | | | | $(0.83 | ) | | | $7.93 | | | | $0.42 | | | | $1.37 | | | | $2.16 | |
| | | |
| Less distributions declared to shareholders | | | | | | | | | | | | | |
From net investment income | | | $(0.42 | ) | | | $(0.29 | ) | | | $(0.21 | ) | | | $(0.26 | ) | | | $(0.26 | ) | | | $(0.13 | ) |
From net realized gain | | | (1.75 | ) | | | (0.87 | ) | | | (0.29 | ) | | | (0.38 | ) | | | (0.34 | ) | | | (0.32 | ) |
Total distributions declared to
shareholders | | | $(2.17 | ) | | | $(1.16 | ) | | | $(0.50 | ) | | | $(0.64 | ) | | | $(0.60 | ) | | | $(0.45 | ) |
Net asset value, end of period (x) | | | $44.07 | | | | $41.44 | | | | $43.43 | | | | $36.00 | | | | $36.22 | | | | $35.45 | |
Total return (%) (r)(s)(t)(x) | | | 12.29 | (n) | | | (1.99 | ) | | | 22.28 | (c) | | | 1.26 | | | | 3.94 | | | | 6.50 | |
| | | |
Ratios (%) (to average net assets)
and Supplemental data: | | | | | | | | | | | | | |
Expenses before expense
reductions (f) | | | 1.18 | (a) | | | 1.16 | | | | 1.17 | (c) | | | 1.22 | | | | 1.23 | | | | 1.23 | |
Expenses after expense
reductions (f) | | | 1.17 | (a) | | | 1.15 | | | | 1.16 | (c) | | | 1.21 | | | | 1.22 | | | | 1.22 | |
Net investment income (loss) | | | 1.45 | (a)(l) | | | 0.91 | | | | 0.68 | (c) | | | 0.74 | | | | 0.84 | | | | 0.75 | |
Portfolio turnover | | | 3 | (n) | | | 12 | | | | 10 | | | | 8 | | | | 8 | | | | 11 | |
Net assets at end of period
(000 omitted) | | | $715,024 | | | | $671,000 | | | | $703,516 | | | | $655,756 | | | | $677,704 | | | | $592,610 | |
See Notes to Financial Statements
15
Financial Highlights – continued
| | | | | | | | | | | | | | | | | | | | | | | | |
| | | Six months ended
4/30/19 | | | Year ended | |
| Class B | | 10/31/18 | | | 10/31/17 | | | 10/31/16 | | | 10/31/15 | | | 10/31/14 | |
| | | (unaudited) | | | | | | | | | | | | | | | | |
Net asset value, beginning of
period | | | $38.09 | | | | $40.03 | | | | $33.26 | | | | $33.51 | | | | $32.84 | | | | $31.40 | |
| | | |
| Income (loss) from investment operations | | | | | | | | | | | | | |
Net investment income
(loss) (d) | | | $0.13 | | | | $0.06 | | | | $(0.02 | )(c) | | | $(0.01 | ) | | | $0.03 | | | | $(0.00 | )(w) |
Net realized and unrealized
gain (loss) | | | 4.15 | | | | (1.12 | ) | | | 7.08 | | | | 0.16 | | | | 1.00 | | | | 1.76 | |
Total from investment operations | | | $4.28 | | | | $(1.06 | ) | | | $7.06 | | | | $0.15 | | | | $1.03 | | | | $1.76 | |
| | | |
| Less distributions declared to shareholders | | | | | | | | | | | | | |
From net investment income | | | $(0.11 | ) | | | $(0.01 | ) | | | $— | | | | $(0.02 | ) | | | $(0.02 | ) | | | $— | |
From net realized gain | | | (1.75 | ) | | | (0.87 | ) | | | (0.29 | ) | | | (0.38 | ) | | | (0.34 | ) | | | (0.32 | ) |
Total distributions declared to
shareholders | | | $(1.86 | ) | | | $(0.88 | ) | | | $(0.29 | ) | | | $(0.40 | ) | | | $(0.36 | ) | | | $(0.32 | ) |
Net asset value, end of period (x) | | | $40.51 | | | | $38.09 | | | | $40.03 | | | | $33.26 | | | | $33.51 | | | | $32.84 | |
Total return (%) (r)(s)(t)(x) | | | 11.87 | (n) | | | (2.73 | ) | | | 21.37 | (c) | | | 0.50 | | | | 3.17 | | | | 5.68 | |
| | | |
Ratios (%) (to average net assets)
and Supplemental data: | | | | | | | | | | | | | |
Expenses before expense
reductions (f) | | | 1.93 | (a) | | | 1.91 | | | | 1.92 | (c) | | | 1.97 | | | | 1.98 | | | | 1.98 | |
Expenses after expense
reductions (f) | | | 1.92 | (a) | | | 1.90 | | | | 1.91 | (c) | | | 1.96 | | | | 1.97 | | | | 1.98 | |
Net investment income (loss) | | | 0.68 | (a)(l) | | | 0.15 | | | | (0.04 | )(c) | | | (0.03 | ) | | | 0.09 | | | | (0.01 | ) |
Portfolio turnover | | | 3 | (n) | | | 12 | | | | 10 | | | | 8 | | | | 8 | | | | 11 | |
Net assets at end of period
(000 omitted) | | | $24,737 | | | | $24,726 | | | | $29,043 | | | | $25,664 | | | | $27,384 | | | | $26,118 | |
See Notes to Financial Statements
16
Financial Highlights – continued
| | | | | | | | | | | | | | | | | | | | | | | | |
| | | Six months ended
4/30/19 | | | Year ended | |
| Class C | | 10/31/18 | | | 10/31/17 | | | 10/31/16 | | | 10/31/15 | | | 10/31/14 | |
| | | (unaudited) | | | | | | | | | | | | | | | | |
Net asset value, beginning of
period | | | $36.44 | | | | $38.35 | | | | $31.88 | | | | $32.19 | | | | $31.60 | | | | $30.22 | |
| | | |
| Income (loss) from investment operations | | | | | | | | | | | | | |
Net investment income
(loss) (d) | | | $0.12 | | | | $0.06 | | | | $(0.02 | )(c) | | | $(0.01 | ) | | | $0.03 | | | | $(0.00 | )(w) |
Net realized and unrealized
gain (loss) | | | 3.95 | | | | (1.07 | ) | | | 6.78 | | | | 0.15 | | | | 0.95 | | | | 1.70 | |
Total from investment operations | | | $4.07 | | | | $(1.01 | ) | | | $6.76 | | | | $0.14 | | | | $0.98 | | | | $1.70 | |
| | | |
| Less distributions declared to shareholders | | | | | | | | | | | | | |
From net investment income | | | $(0.12 | ) | | | $(0.03 | ) | | | $— | | | | $(0.07 | ) | | | $(0.05 | ) | | | $— | |
From net realized gain | | | (1.75 | ) | | | (0.87 | ) | | | (0.29 | ) | | | (0.38 | ) | | | (0.34 | ) | | | (0.32 | ) |
Total distributions declared to
shareholders | | | $(1.87 | ) | | | $(0.90 | ) | | | $(0.29 | ) | | | $(0.45 | ) | | | $(0.39 | ) | | | $(0.32 | ) |
Net asset value, end of period (x) | | | $38.64 | | | | $36.44 | | | | $38.35 | | | | $31.88 | | | | $32.19 | | | | $31.60 | |
Total return (%) (r)(s)(t)(x) | | | 11.85 | (n) | | | (2.72 | ) | | | 21.36 | (c) | | | 0.48 | | | | 3.17 | | | | 5.70 | |
| | | |
Ratios (%) (to average net assets)
and Supplemental data: | | | | | | | | | | | | | |
Expenses before expense
reductions (f) | | | 1.93 | (a) | | | 1.91 | | | | 1.92 | (c) | | | 1.97 | | | | 1.98 | | | | 1.98 | |
Expenses after expense
reductions (f) | | | 1.92 | (a) | | | 1.90 | | | | 1.91 | (c) | | | 1.96 | | | | 1.97 | | | | 1.98 | |
Net investment income (loss) | | | 0.68 | (a)(l) | | | 0.16 | | | | (0.05 | )(c) | | | (0.03 | ) | | | 0.08 | | | | (0.00 | ) |
Portfolio turnover | | | 3 | (n) | | | 12 | | | | 10 | | | | 8 | | | | 8 | | | | 11 | |
Net assets at end of period
(000 omitted) | | | $151,399 | | | | $149,669 | | | | $180,446 | | | | $156,837 | | | | $140,018 | | | | $111,902 | |
See Notes to Financial Statements
17
Financial Highlights – continued
| | | | | | | | | | | | | | | | | | | | | | | | |
| | | Six months ended
4/30/19 | | | Year ended | |
| Class I | | 10/31/18 | | | 10/31/17 | | | 10/31/16 | | | 10/31/15 | | | 10/31/14 | |
| | | (unaudited) | | | | | | | | | | | | | | | | |
Net asset value, beginning of
period | | | $42.57 | | | | $44.58 | | | | $36.94 | | | | $37.14 | | | | $36.34 | | | | $34.56 | |
| | | |
| Income (loss) from investment operations | | | | | | | | | | | | | |
Net investment income
(loss) (d) | | | $0.34 | | | | $0.52 | | | | $0.41 | (c) | | | $0.34 | | | | $0.41 | | | | $0.35 | |
Net realized and unrealized
gain (loss) | | | 4.64 | | | | (1.27 | ) | | | 7.83 | | | | 0.19 | | | | 1.07 | | | | 1.95 | |
Total from investment operations | | | $4.98 | | | | $(0.75 | ) | | | $8.24 | | | | $0.53 | | | | $1.48 | | | | $2.30 | |
| | | |
| Less distributions declared to shareholders | | | | | | | | | | | | | |
From net investment income | | | $(0.53 | ) | | | $(0.39 | ) | | | $(0.31 | ) | | | $(0.35 | ) | | | $(0.34 | ) | | | $(0.20 | ) |
From net realized gain | | | (1.75 | ) | | | (0.87 | ) | | | (0.29 | ) | | | (0.38 | ) | | | (0.34 | ) | | | (0.32 | ) |
Total distributions declared to
shareholders | | | $(2.28 | ) | | | $(1.26 | ) | | | $(0.60 | ) | | | $(0.73 | ) | | | $(0.68 | ) | | | $(0.52 | ) |
Net asset value, end of period (x) | | | $45.27 | | | | $42.57 | | | | $44.58 | | | | $36.94 | | | | $37.14 | | | | $36.34 | |
Total return (%) (r)(s)(t)(x) | | | 12.42 | (n) | | | (1.76 | ) | | | 22.60 | (c) | | | 1.52 | | | | 4.17 | | | | 6.77 | |
| | | |
Ratios (%) (to average net assets)
and Supplemental data: | | | | | | | | | | | | | |
Expenses before expense
reductions (f) | | | 0.93 | (a) | | | 0.91 | | | | 0.92 | (c) | | | 0.97 | | | | 0.98 | | | | 0.98 | |
Expenses after expense
reductions (f) | | | 0.93 | (a) | | | 0.90 | | | | 0.91 | (c) | | | 0.96 | | | | 0.97 | | | | 0.98 | |
Net investment income (loss) | | | 1.65 | (a)(l) | | | 1.17 | | | | 1.01 | (c) | | | 0.93 | | | | 1.11 | | | | 0.99 | |
Portfolio turnover | | | 3 | (n) | | | 12 | | | | 10 | | | | 8 | | | | 8 | | | | 11 | |
Net assets at end of period
(000 omitted) | | | $891,582 | | | | $935,292 | | | | $1,070,007 | | | | $793,470 | | | | $671,087 | | | | $681,259 | |
See Notes to Financial Statements
18
Financial Highlights – continued
| | | | | | | | | | | | | | | | | | | | | | | | |
| | | Six months
ended 4/30/19 | | | Year ended | |
| Class R1 | | 10/31/18 | | | 10/31/17 | | | 10/31/16 | | | 10/31/15 | | | 10/31/14 | |
| | | (unaudited) | | | | | | | | | | | | | | | | |
Net asset value, beginning of
period | | | $37.25 | | | | $39.18 | | | | $32.56 | | | | $32.80 | | | | $32.17 | | | | $30.76 | |
| | | |
| Income (loss) from investment operations | | | | | | | | | | | | | |
Net investment income
(loss) (d) | | | $0.12 | | | | $0.06 | | | | $(0.02 | )(c) | | | $(0.01 | ) | | | $0.03 | | | | $(0.00 | )(w) |
Net realized and unrealized
gain (loss) | | | 4.05 | | | | (1.09 | ) | | | 6.93 | | | | 0.16 | | | | 0.97 | | | | 1.73 | |
Total from investment operations | | | $4.17 | | | | $(1.03 | ) | | | $6.91 | | | | $0.15 | | | | $1.00 | | | | $1.73 | |
| | | |
| Less distributions declared to shareholders | | | | | | | | | | | | | |
From net investment income | | | $(0.09 | ) | | | $(0.03 | ) | | | $— | | | | $(0.01 | ) | | | $(0.03 | ) | | | $— | |
From net realized gain | | | (1.75 | ) | | | (0.87 | ) | | | (0.29 | ) | | | (0.38 | ) | | | (0.34 | ) | | | (0.32 | ) |
Total distributions declared to
shareholders | | | $(1.84 | ) | | | $(0.90 | ) | | | $(0.29 | ) | | | $(0.39 | ) | | | $(0.37 | ) | | | $(0.32 | ) |
Net asset value, end of period (x) | | | $39.58 | | | | $37.25 | | | | $39.18 | | | | $32.56 | | | | $32.80 | | | | $32.17 | |
Total return (%) (r)(s)(t)(x) | | | 11.84 | (n) | | | (2.73 | ) | | | 21.37 | (c) | | | 0.51 | | | | 3.14 | | | | 5.70 | |
| | | |
Ratios (%) (to average net assets)
and Supplemental data: | | | | | | | | | | | | | |
Expenses before expense
reductions (f) | | | 1.93 | (a) | | | 1.91 | | | | 1.92 | (c) | | | 1.97 | | | | 1.98 | | | | 1.98 | |
Expenses after expense
reductions (f) | | | 1.92 | (a) | | | 1.90 | | | | 1.91 | (c) | | | 1.96 | | | | 1.97 | | | | 1.98 | |
Net investment income (loss) | | | 0.66 | (a)(l) | | | 0.16 | | | | (0.05 | )(c) | | | (0.03 | ) | | | 0.10 | | | | (0.01 | ) |
Portfolio turnover | | | 3 | (n) | | | 12 | | | | 10 | | | | 8 | | | | 8 | | | | 11 | |
Net assets at end of period
(000 omitted) | | | $2,507 | | | | $2,538 | | | | $3,411 | | | | $3,442 | | | | $3,546 | | | | $3,776 | |
See Notes to Financial Statements
19
Financial Highlights – continued
| | | | | | | | | | | | | | | | | | | | | | | | |
| | | Six months ended
4/30/19 | | | Year ended | |
| Class R2 | | 10/31/18 | | | 10/31/17 | | | 10/31/16 | | | 10/31/15 | | | 10/31/14 | |
| | | (unaudited) | | | | | | | | | | | | | | | | |
Net asset value, beginning of
period | | | $40.21 | | | | $42.16 | | | | $34.96 | | | | $35.19 | | | | $34.45 | | | | $32.81 | |
| | | |
| Income (loss) from investment operations | | | | | | | | | | | | | |
Net investment income
(loss) (d) | | | $0.24 | | | | $0.28 | | | | $0.18 | (c) | | | $0.16 | | | | $0.21 | | | | $0.17 | |
Net realized and unrealized
gain (loss) | | | 4.37 | | | | (1.19 | ) | | | 7.43 | | | | 0.16 | | | | 1.03 | | | | 1.85 | |
Total from investment operations | | | $4.61 | | | | $(0.91 | ) | | | $7.61 | | | | $0.32 | | | | $1.24 | | | | $2.02 | |
| | | |
| Less distributions declared to shareholders | | | | | | | | | | | | | |
From net investment income | | | $(0.30 | ) | | | $(0.17 | ) | | | $(0.12 | ) | | | $(0.17 | ) | | | $(0.16 | ) | | | $(0.06 | ) |
From net realized gain | | | (1.75 | ) | | | (0.87 | ) | | | (0.29 | ) | | | (0.38 | ) | | | (0.34 | ) | | | (0.32 | ) |
Total distributions declared to
shareholders | | | $(2.05 | ) | | | $(1.04 | ) | | | $(0.41 | ) | | | $(0.55 | ) | | | $(0.50 | ) | | | $(0.38 | ) |
Net asset value, end of period (x) | | | $42.77 | | | | $40.21 | | | | $42.16 | | | | $34.96 | | | | $35.19 | | | | $34.45 | |
Total return (%) (r)(s)(t)(x) | | | 12.14 | (n) | | | (2.24 | ) | | | 21.97 | (c) | | | 0.99 | | | | 3.67 | | | | 6.24 | |
| | | |
Ratios (%) (to average net assets)
and Supplemental data: | | | | | | | | | | | | | |
Expenses before expense
reductions (f) | | | 1.43 | (a) | | | 1.41 | | | | 1.42 | (c) | | | 1.47 | | | | 1.48 | | | | 1.48 | |
Expenses after expense
reductions (f) | | | 1.42 | (a) | | | 1.40 | | | | 1.41 | (c) | | | 1.46 | | | | 1.47 | | | | 1.48 | |
Net investment income (loss) | | | 1.20 | (a)(l) | | | 0.66 | | | | 0.45 | (c) | | | 0.47 | | | | 0.59 | | | | 0.49 | |
Portfolio turnover | | | 3 | (n) | | | 12 | | | | 10 | | | | 8 | | | | 8 | | | | 11 | |
Net assets at end of period
(000 omitted) | | | $42,952 | | | | $40,944 | | | | $52,489 | | | | $49,546 | | | | $56,978 | | | | $57,258 | |
See Notes to Financial Statements
20
Financial Highlights – continued
| | | | | | | | | | | | | | | | | | | | | | | | |
| | | Six months ended
4/30/19 | | | Year ended | |
| Class R3 | | 10/31/18 | | | 10/31/17 | | | 10/31/16 | | | 10/31/15 | | | 10/31/14 | |
| | | (unaudited) | | | | | | | | | | | | | | | | |
Net asset value, beginning of
period | | | $41.16 | | | | $43.14 | | | | $35.76 | | | | $35.98 | | | | $35.23 | | | | $33.55 | |
| | | |
| Income (loss) from investment operations | | | | | | | | | | | | | |
Net investment income
(loss) (d) | | | $0.29 | | | | $0.39 | | | | $0.28 | (c) | | | $0.26 | | | | $0.30 | | | | $0.26 | |
Net realized and unrealized
gain (loss) | | | 4.48 | | | | (1.21 | ) | | | 7.60 | | | | 0.16 | | | | 1.05 | | | | 1.88 | |
Total from investment operations | | | $4.77 | | | | $(0.82 | ) | | | $7.88 | | | | $0.42 | | | | $1.35 | | | | $2.14 | |
| | | |
| Less distributions declared to shareholders | | | | | | | | | | | | | |
From net investment income | | | $(0.42 | ) | | | $(0.29 | ) | | | $(0.21 | ) | | | $(0.26 | ) | | | $(0.26 | ) | | | $(0.14 | ) |
From net realized gain | | | (1.75 | ) | | | (0.87 | ) | | | (0.29 | ) | | | (0.38 | ) | | | (0.34 | ) | | | (0.32 | ) |
Total distributions declared to
shareholders | | | $(2.17 | ) | | | $(1.16 | ) | | | $(0.50 | ) | | | $(0.64 | ) | | | $(0.60 | ) | | | $(0.46 | ) |
Net asset value, end of period (x) | | | $43.76 | | | | $41.16 | | | | $43.14 | | | | $35.76 | | | | $35.98 | | | | $35.23 | |
Total return (%) (r)(s)(t)(x) | | | 12.29 | (n) | | | (2.00 | ) | | | 22.29 | (c) | | | 1.25 | | | | 3.93 | | | | 6.49 | |
| | | |
Ratios (%) (to average net assets)
and Supplemental data: | | | | | | | | | | | | | |
Expenses before expense
reductions (f) | | | 1.18 | (a) | | | 1.16 | | | | 1.17 | (c) | | | 1.22 | | | | 1.23 | | | | 1.23 | |
Expenses after expense
reductions (f) | | | 1.17 | (a) | | | 1.15 | | | | 1.16 | (c) | | | 1.21 | | | | 1.22 | | | | 1.23 | |
Net investment income (loss) | | | 1.43 | (a)(l) | | | 0.90 | | | | 0.70 | (c) | | | 0.74 | | | | 0.84 | | | | 0.74 | |
Portfolio turnover | | | 3 | (n) | | | 12 | | | | 10 | | | | 8 | | | | 8 | | | | 11 | |
Net assets at end of period
(000 omitted) | | | $90,288 | | | | $90,003 | | | | $108,852 | | | | $98,106 | | | | $105,192 | | | | $90,864 | |
See Notes to Financial Statements
21
Financial Highlights – continued
| | | | | | | | | | | | | | | | | | | | | | | | |
| | | Six months ended
4/30/19 | | | Year ended | |
| Class R4 | | 10/31/18 | | | 10/31/17 | | | 10/31/16 | | | 10/31/15 | | | 10/31/14 | |
| | | (unaudited) | | | | | | | | | | | | | | | | |
Net asset value, beginning of
period | | | $41.63 | | | | $43.62 | | | | $36.15 | | | | $36.37 | | | | $35.59 | | | | $33.87 | |
| | | |
| Income (loss) from investment operations | | | | | | | | | | | | | |
Net investment income
(loss) (d) | | | $0.35 | | | | $0.51 | | | | $0.38 | (c) | | | $0.35 | | | | $0.40 | | | | $0.35 | |
Net realized and unrealized
gain (loss) | | | 4.50 | | | | (1.23 | ) | | | 7.68 | | | | 0.16 | | | | 1.06 | | | | 1.89 | |
Total from investment operations | | | $4.85 | | | | $(0.72 | ) | | | $8.06 | | | | $0.51 | | | | $1.46 | | | | $2.24 | |
| | | |
| Less distributions declared to shareholders | | | | | | | | | | | | | |
From net investment income | | | $(0.53 | ) | | | $(0.40 | ) | | | $(0.30 | ) | | | $(0.35 | ) | | | $(0.34 | ) | | | $(0.20 | ) |
From net realized gain | | | (1.75 | ) | | | (0.87 | ) | | | (0.29 | ) | | | (0.38 | ) | | | (0.34 | ) | | | (0.32 | ) |
Total distributions declared to
shareholders | | | $(2.28 | ) | | | $(1.27 | ) | | | $(0.59 | ) | | | $(0.73 | ) | | | $(0.68 | ) | | | $(0.52 | ) |
Net asset value, end of period (x) | | | $44.20 | | | | $41.63 | | | | $43.62 | | | | $36.15 | | | | $36.37 | | | | $35.59 | |
Total return (%) (r)(s)(t)(x) | | | 12.40 | (n) | | | (1.75 | ) | | | 22.61 | (c) | | | 1.50 | | | | 4.20 | | | | 6.74 | |
| | | |
Ratios (%) (to average net assets)
and Supplemental data: | | | | | | | | | | | | | |
Expenses before expense
reductions (f) | | | 0.93 | (a) | | | 0.91 | | | | 0.92 | (c) | | | 0.97 | | | | 0.98 | | | | 0.98 | |
Expenses after expense
reductions (f) | | | 0.92 | (a) | | | 0.90 | | | | 0.91 | (c) | | | 0.96 | | | | 0.97 | | | | 0.98 | |
Net investment income (loss) | | | 1.71 | (a)(l) | | | 1.16 | | | | 0.96 | (c) | | | 0.99 | | | | 1.11 | | | | 0.99 | |
Portfolio turnover | | | 3 | (n) | | | 12 | | | | 10 | | | | 8 | | | | 8 | | | | 11 | |
Net assets at end of period
(000 omitted) | | | $145,927 | | | | $136,066 | | | | $142,713 | | | | $116,248 | | | | $118,810 | | | | $109,067 | |
See Notes to Financial Statements
22
Financial Highlights – continued
| | | | | | | | | | | | | | | | | | | | | | | | |
| | | Six months ended
4/30/19 | | | Year ended | |
| Class R6 | | 10/31/18 | | | 10/31/17 | | | 10/31/16 | | | 10/31/15 | | | 10/31/14 | |
| | | (unaudited) | | | | | | | | | | | | | | | | |
Net asset value, beginning of
period | | | $42.61 | | | | $44.61 | | | | $36.96 | | | | $37.17 | | | | $36.36 | | | | $34.58 | |
| | | |
| Income (loss) from investment operations | | | | | | | | | | | | | |
Net investment income
(loss) (d) | | | $0.38 | | | | $0.54 | | | | $0.41 | (c) | | | $0.39 | | | | $0.44 | | | | $0.42 | |
Net realized and unrealized
gain (loss) | | | 4.62 | | | | (1.24 | ) | | | 7.86 | | | | 0.16 | | | | 1.08 | | | | 1.90 | |
Total from investment operations | | | $5.00 | | | | $(0.70 | ) | | | $8.27 | | | | $0.55 | | | | $1.52 | | | | $2.32 | |
| | | |
| Less distributions declared to shareholders | | | | | | | | | | | | | |
From net investment income | | | $(0.58 | ) | | | $(0.43 | ) | | | $(0.33 | ) | | | $(0.38 | ) | | | $(0.37 | ) | | | $(0.22 | ) |
From net realized gain | | | (1.75 | ) | | | (0.87 | ) | | | (0.29 | ) | | | (0.38 | ) | | | (0.34 | ) | | | (0.32 | ) |
Total distributions declared to
shareholders | | | $(2.33 | ) | | | $(1.30 | ) | | | $(0.62 | ) | | | $(0.76 | ) | | | $(0.71 | ) | | | $(0.54 | ) |
Net asset value, end of period (x) | | | $45.28 | | | | $42.61 | | | | $44.61 | | | | $36.96 | | | | $37.17 | | | | $36.36 | |
Total return (%) (r)(s)(t)(x) | | | 12.47 | (n) | | | (1.66 | ) | | | 22.71 | (c) | | | 1.60 | | | | 4.29 | | | | 6.84 | |
| | | |
Ratios (%) (to average net assets)
and Supplemental data: | | | | | | | | | | | | | |
Expenses before expense
reductions (f) | | | 0.83 | (a) | | | 0.81 | | | | 0.83 | (c) | | | 0.87 | | | | 0.88 | | | | 0.90 | |
Expenses after expense
reductions (f) | | | 0.82 | (a) | | | 0.80 | | | | 0.82 | (c) | | | 0.87 | | | | 0.88 | | | | 0.90 | |
Net investment income (loss) | | | 1.83 | (a)(l) | | | 1.20 | | | | 0.99 | (c) | | | 1.08 | | | | 1.19 | | | | 1.16 | |
Portfolio turnover | | | 3 | (n) | | | 12 | | | | 10 | | | | 8 | | | | 8 | | | | 11 | |
Net assets at end of period
(000 omitted) | | | $927,880 | | | | $809,357 | | | | $1,034,078 | | | | $494,203 | | | | $383,913 | | | | $306,861 | |
| (c) | Amount reflects aone-time reimbursement of expenses by the custodian (or former custodian) without which net investment income and performance would be lower and expenses would be higher. |
| (d) | Per share data is based on average shares outstanding. |
| (f) | Ratios do not reflect reductions from fees paid indirectly, if applicable. |
| (l) | Recognition of net investment income by the fund may be affected by the timing of the declaration of dividends by companies in which the fund invests and the actual annual net investment income ratio may differ. |
| (r) | Certain expenses have been reduced without which performance would have been lower. |
| (s) | From time to time the fund may receive proceeds from litigation settlements, without which performance would be lower. |
| (t) | Total returns do not include any applicable sales charges. |
| (w) | Per share amount was less than $0.01. |
| (x) | The net asset values and total returns have been calculated on net assets which include adjustments made in accordance with U.S. generally accepted accounting principles required at period end for financial reporting purposes. |
See Notes to Financial Statements
23
NOTES TO FINANCIAL STATEMENTS
(unaudited)
(1) Business and Organization
MFS Global Equity Fund (the fund) is a diversified series of MFS Series Trust VI (the trust). The trust is organized as a Massachusetts business trust and is registered under the Investment Company Act of 1940, as amended, as anopen-end management investment company.
The fund is an investment company and accordingly follows the investment company accounting and reporting guidance of the Financial Accounting Standards Board (FASB) Accounting Standards Codification Topic 946 Financial Services – Investment Companies.
(2) Significant Accounting Policies
General– The preparation of financial statements in conformity with U.S. generally accepted accounting principles requires management to make estimates and assumptions that affect the reported amounts of assets and liabilities, and disclosure of contingent assets and liabilities at the date of the financial statements and the reported amounts of increases and decreases in net assets from operations during the reporting period. Actual results could differ from those estimates. In the preparation of these financial statements, management has evaluated subsequent events occurring after the date of the fund’s Statement of Assets and Liabilities through the date that the financial statements were issued. The fund invests in foreign securities. Investments in foreign securities are vulnerable to the effects of changes in the relative values of the local currency and the U.S. dollar and to the effects of changes in each country’s market, economic, industrial, political, regulatory, geopolitical, and other conditions.
Balance Sheet Offsetting– The fund’s accounting policy with respect to balance sheet offsetting is that, absent an event of default by the counterparty or a termination of the agreement, the International Swaps and Derivatives Association (ISDA) Master Agreement, or similar agreement, does not result in an offset of reported amounts of financial assets and financial liabilities in the Statement of Assets and Liabilities across transactions between the fund and the applicable counterparty. The fund’s right to setoff may be restricted or prohibited by the bankruptcy or insolvency laws of the particular jurisdiction to which a specific master netting agreement counterparty is subject. Balance sheet offsetting disclosures, to the extent applicable to the fund, have been included in the fund’s Significant Accounting Policies note under the captions for each of the fund’sin-scope financial instruments and transactions.
Investment Valuations– Equity securities, including restricted equity securities, are generally valued at the last sale or official closing price on their primary market or exchange as provided by a third-party pricing service. Equity securities, for which there were no sales reported that day, are generally valued at the last quoted daily bid quotation on their primary market or exchange as provided by a third-party pricing service. Short-term instruments with a maturity at issuance of 60 days or less may be valued at amortized cost, which approximates market value.Open-end investment companies are generally valued at net asset value per share. Securities and other assets generally valued on the basis of information from a third-party pricing service may also be valued at a broker/dealer bid quotation. In determining values, third-party pricing services can utilize both transaction data and market information such as yield, quality,
24
Notes to Financial Statements (unaudited) – continued
coupon rate, maturity, type of issue, trading characteristics, and other market data. The values of foreign securities and other assets and liabilities expressed in foreign currencies are converted to U.S. dollars using the mean of bid and asked prices for rates provided by a third-party pricing service.
The Board of Trustees has delegated primary responsibility for determining or causing to be determined the value of the fund’s investments (including any fair valuation) to the adviser pursuant to valuation policies and procedures approved by the Board. If the adviser determines that reliable market quotations are not readily available, investments are valued at fair value as determined in good faith by the adviser in accordance with such procedures under the oversight of the Board of Trustees. Under the fund’s valuation policies and procedures, market quotations are not considered to be readily available for most types of debt instruments and floating rate loans and many types of derivatives. These investments are generally valued at fair value based on information from third-party pricing services. In addition, investments may be valued at fair value if the adviser determines that an investment’s value has been materially affected by events occurring after the close of the exchange or market on which the investment is principally traded (such as foreign exchange or market) and prior to the determination of the fund’s net asset value, or after the halting of trading of a specific security where trading does not resume prior to the close of the exchange or market on which the security is principally traded. Events that occur on a frequent basis after foreign markets close (such as developments in foreign markets and significant movements in the U.S. markets) and prior to the determination of the fund’s net asset value may be deemed to have a material effect on the value of securities traded in foreign markets. Accordingly, the fund’s foreign equity securities may often be valued at fair value. The adviser generally relies on third-party pricing services or other information (such as the correlation with price movements of similar securities in the same or other markets; the type, cost and investment characteristics of the security; the business and financial condition of the issuer; and trading and other market data) to assist in determining whether to fair value and at what value to fair value an investment. The value of an investment for purposes of calculating the fund’s net asset value can differ depending on the source and method used to determine value. When fair valuation is used, the value of an investment used to determine the fund’s net asset value may differ from quoted or published prices for the same investment. There can be no assurance that the fund could obtain the fair value assigned to an investment if it were to sell the investment at the same time at which the fund determines its net asset value per share.
Various inputs are used in determining the value of the fund’s assets or liabilities. These inputs are categorized into three broad levels. In certain cases, the inputs used to measure fair value may fall into different levels of the fair value hierarchy. In such cases, an investment’s level within the fair value hierarchy is based on the lowest level of input that is significant to the fair value measurement. The fund’s assessment of the significance of a particular input to the fair value measurement in its entirety requires judgment, and considers factors specific to the investment. Level 1 includes unadjusted quoted prices in active markets for identical assets or liabilities. Level 2 includes other significant observable market-based inputs (including quoted prices for similar securities, interest rates, prepayment speed, and credit risk). Level 3 includes
25
Notes to Financial Statements (unaudited) – continued
unobservable inputs, which may include the adviser’s own assumptions in determining the fair value of investments. The following is a summary of the levels used as of April 30, 2019 in valuing the fund’s assets or liabilities:
| | | | | | | | | | | | | | | | |
| | | | |
| Financial Instruments | | Level 1 | | | Level 2 | | | Level 3 | | | Total | |
| Equity Securities: | | | | | | | | | | | | | | | | |
United States | | | $1,643,146,634 | | | | $— | | | | $— | | | | $1,643,146,634 | |
France | | | 314,534,443 | | | | — | | | | — | | | | 314,534,443 | |
United Kingdom | | | 226,141,402 | | | | — | | | | — | | | | 226,141,402 | |
Switzerland | | | 221,558,404 | | | | — | | | | — | | | | 221,558,404 | |
Germany | | | 120,148,625 | | | | — | | | | — | | | | 120,148,625 | |
Japan | | | — | | | | 83,949,172 | | | | — | | | | 83,949,172 | |
Sweden | | | 69,194,679 | | | | — | | | | — | | | | 69,194,679 | |
Netherlands | | | 65,174,454 | | | | — | | | | — | | | | 65,174,454 | |
Canada | | | 57,353,349 | | | | — | | | | — | | | | 57,353,349 | |
Other Countries | | | 159,568,821 | | | | — | | | | — | | | | 159,568,821 | |
| Mutual Funds | | | 77,289,050 | | | | — | | | | — | | | | 77,289,050 | |
| Total | | | $2,954,109,861 | | | | $83,949,172 | | | | $— | | | | $3,038,059,033 | |
For further information regarding security characteristics, see the Portfolio of Investments.
Foreign Currency Translation– Purchases and sales of foreign investments, income, and expenses are converted into U.S. dollars based upon currency exchange rates prevailing on the respective dates of such transactions or on the reporting date for foreign denominated receivables and payables. Gains and losses attributable to foreign currency exchange rates on sales of securities are recorded for financial statement purposes as net realized gains and losses on investments. Gains and losses attributable to foreign exchange rate movements on receivables, payables, income and expenses are recorded for financial statement purposes as foreign currency transaction gains and losses. That portion of both realized and unrealized gains and losses on investments that results from fluctuations in foreign currency exchange rates is not separately disclosed.
Security Loans– Under its Securities Lending Agency Agreement with the fund, JPMorgan Chase and Co., as lending agent, loans the securities of the fund to certain qualified institutions (the “Borrowers”) approved by the fund. Security loans can be terminated at the discretion of either the lending agent or the fund and the related securities must be returned within the earlier of the standard trade settlement period for such securities or within three business days. The loans are collateralized by cash and/or U.S. Treasury and federal agency obligations in an amount typically at least equal to the market value of the securities loaned. On loans collateralized by cash, the cash collateral is invested in a money market fund. The market value of the loaned securities is determined at the close of business of the fund and any additional required collateral is delivered to the fund on the next business day. The lending agent provides the fund with indemnification against Borrower default. In the event of Borrower default, the lending agent will, for the benefit of the fund, either purchase securities identical to those loaned or, when such purchase is commercially impracticable, pay the fund the market value of the loaned securities. In return, the lending agent assumes the fund’s rights to the related collateral. If the collateral value is less than the cost to
26
Notes to Financial Statements (unaudited) – continued
purchase identical securities, the lending agent is responsible for the shortfall, but only to the extent that such shortfall is not due to a decline in collateral value resulting from collateral reinvestment for which the fund bears the risk of loss. At period end, the fund had investment securities on loan, all of which were classified as equity securities in the fund’s Portfolio of Investments, with a fair value of $133,286,925. The fair value of the fund’s investment securities on loan and a related liability of $65,399,555 for cash collateral received on securities loaned are both presented gross in the Statement of Assets and Liabilities. Additionally, these loans were collateralized by U.S. Treasury Obligations of $74,163,555 held by the lending agent. The collateral on securities loaned exceeded the value of securities on loan at period end. The liability for cash collateral for securities loaned is carried at fair value, which is categorized as level 2 within the fair value hierarchy. A portion of the income generated upon investment of the collateral is remitted to the Borrowers, and the remainder is allocated between the fund and the lending agent. On loans collateralized by U.S. Treasury and/or federal agency obligations, a fee is received from the Borrower, and is allocated between the fund and the lending agent. Income from securities lending is separately reported in the Statement of Operations. The dividend and interest income earned on the securities loaned is accounted for in the same manner as other dividend and interest income.
Indemnifications– Under the fund’s organizational documents, its officers and Trustees may be indemnified against certain liabilities and expenses arising out of the performance of their duties to the fund. Additionally, in the normal course of business, the fund enters into agreements with service providers that may contain indemnification clauses. The fund’s maximum exposure under these agreements is unknown as this would involve future claims that may be made against the fund that have not yet occurred.
Investment Transactions and Income– Investment transactions are recorded on the trade date. Interest income is recorded on the accrual basis. Dividends received in cash are recorded on theex-dividend date. Certain dividends from foreign securities will be recorded when the fund is informed of the dividend if such information is obtained subsequent to theex-dividend date. Dividend payments received in additional securities are recorded on theex-dividend date in an amount equal to the value of the security on such date.
The fund may receive proceeds from litigation settlements. Any proceeds received from litigation involving portfolio holdings are reflected in the Statement of Operations in realized gain/loss if the security has been disposed of by the fund or in unrealized gain/loss if the security is still held by the fund. Any other proceeds from litigation not related to portfolio holdings are reflected as other income in the Statement of Operations.
Fees Paid Indirectly– The fund’s custody fee may be reduced by a credit earned under an arrangement that measures the value of U.S. dollars deposited with the custodian by the fund. The amount of the credit, for the six months ended April 30, 2019, is shown as a reduction of total expenses in the Statement of Operations.
Tax Matters and Distributions– The fund intends to qualify as a regulated investment company, as defined under Subchapter M of the Internal Revenue Code, and to distribute all of its taxable income, including realized capital gains. As a result,
27
Notes to Financial Statements (unaudited) – continued
no provision for federal income tax is required. The fund’s federal tax returns, when filed, will remain subject to examination by the Internal Revenue Service for a three year period. Management has analyzed the fund’s tax positions taken on federal and state tax returns for all open tax years and does not believe that there are any uncertain tax positions that require recognition of a tax liability. Foreign taxes, if any, have been accrued by the fund in the accompanying financial statements in accordance with the applicable foreign tax law. Foreign income taxes may be withheld by certain countries in which the fund invests. Additionally, capital gains realized by the fund on securities issued in or by certain foreign countries may be subject to capital gains tax imposed by those countries.
Distributions to shareholders are recorded on theex-dividend date. Income and capital gain distributions are determined in accordance with income tax regulations, which may differ from U.S. generally accepted accounting principles. Certain capital accounts in the financial statements are periodically adjusted for permanent differences in order to reflect their tax character. These adjustments have no impact on net assets or net asset value per share. Temporary differences which arise from recognizing certain items of income, expense, gain or loss in different periods for financial statement and tax purposes will reverse at some time in the future. Distributions in excess of net investment income or net realized gains are temporary overdistributions for financial statement purposes resulting from differences in the recognition or classification of income or distributions for financial statement and tax purposes.
Book/tax differences primarily relate to wash sale loss deferrals and treating a portion of the proceeds from redemptions as a distribution for tax purposes.
The tax character of distributions made during the current period will be determined at fiscal year end. The tax character of distributions declared to shareholders for the last fiscal year is as follows:
| | | | |
| |
| | | Year ended
10/31/18 | |
Ordinary income (including any
short-term capital gains) | | | $32,405,740 | |
| Long-term capital gains | | | 60,667,574 | |
| |
| Total distributions | | | $93,073,314 | |
The federal tax cost and the tax basis components of distributable earnings were as follows:
| | | | |
| |
| As of 4/30/19 | | | |
| |
| Cost of investments | | | $1,912,126,667 | |
| Gross appreciation | | | 1,186,390,624 | |
| |
| Gross depreciation | | | (60,458,258 | ) |
| Net unrealized appreciation (depreciation) | | | $1,125,932,366 | |
| |
| As of 10/31/18 | | | |
| |
| Undistributed ordinary income | | | 33,165,756 | |
| Undistributed long-term capital gain | | | 109,115,801 | |
| Other temporary differences | | | (165,894 | ) |
| Net unrealized appreciation (depreciation) | | | 815,139,008 | |
The aggregate cost above includes prior fiscal year end tax adjustments, if applicable.
28
Notes to Financial Statements (unaudited) – continued
Multiple Classes of Shares of Beneficial Interest– The fund offers multiple classes of shares, which differ in their respective distribution and service fees. The fund’s income, realized and unrealized gain (loss), and common expenses are allocated to shareholders based on the daily net assets of each class. Dividends are declared separately for each class. Differences in per share dividend rates are generally due to differences in separate class expenses. Class B shares will convert to Class A shares approximately eight years after purchase. Class C shares will convert to Class A shares approximately ten years after purchase. The fund’s distributions declared to shareholders as reported in the Statements of Changes in Net Assets are presented by class as follows:
| | | | | | | | | | | | | | | | |
| | | From net investment
income | | | From net realized
gain | |
| | | | |
| | | Six months
ended
4/30/19 | | | Year
ended
10/31/18 | | | Six months
ended
4/30/19 | | | Year
ended
10/31/18 | |
| Class A | | | $6,725,755 | | | | $4,752,302 | | | | $27,807,305 | | | | $14,139,704 | |
| Class B | | | 69,040 | | | | 8,551 | | | | 1,111,525 | | | | 631,567 | |
| Class C | | | 492,380 | | | | 151,420 | | | | 7,038,609 | | | | 4,063,887 | |
| Class I | | | 11,206,689 | | | | 9,504,994 | | | | 36,983,979 | | | | 21,019,525 | |
| Class R1 | | | 6,593 | | | | 2,332 | | | | 126,563 | | | | 75,797 | |
| Class R2 | | | 298,729 | | | | 206,032 | | | | 1,743,577 | | | | 1,028,214 | |
| Class R3 | | | 875,559 | | | | 715,949 | | | | 3,665,661 | | | | 2,179,861 | |
| Class R4 | | | 1,716,785 | | | | 1,283,411 | | | | 5,621,964 | | | | 2,826,264 | |
| Class R6 | | | 11,108,499 | | | | 10,100,176 | | | | 33,551,163 | | | | 20,383,328 | |
| Total | | | $32,500,029 | | | | $26,725,167 | | | | $117,650,346 | | | | $66,348,147 | |
(3) Transactions with Affiliates
Investment Adviser– The fund has an investment advisory agreement with MFS to provide overall investment management and related administrative services and facilities to the fund. The management fee is computed daily and paid monthly at the following annual rates based on the fund’s average daily net assets:
| | | | |
| Up to $1 billion | | | 0.90 | % |
| In excess of $1 billion and up to $2 billion | | | 0.75 | % |
| In excess of $2 billion and up to $5 billion | | | 0.65 | % |
| In excess of $5 billion | | | 0.60 | % |
MFS has agreed in writing to reduce its management fee by a specified amount if certain MFS mutual fund assets exceed thresholds agreed to by MFS and the fund’s Board of Trustees. For the six months ended April 30, 2019, this management fee reduction amounted to $137,587, which is included in the reduction of total expenses in the Statement of Operations. The management fee incurred for the six months ended April 30, 2019 was equivalent to an annual effective rate of 0.76% of the fund’s average daily net assets.
Distributor– MFS Fund Distributors, Inc. (MFD), a wholly-owned subsidiary of MFS, as distributor, received $53,842 for the six months ended April 30, 2019, as its portion of the initial sales charge on sales of Class A shares of the fund.
29
Notes to Financial Statements (unaudited) – continued
The Board of Trustees has adopted a distribution plan for certain share classes pursuant to Rule12b-1 of the Investment Company Act of 1940.
The fund’s distribution plan provides that the fund will pay MFD for services provided by MFD and financial intermediaries in connection with the distribution and servicing of certain share classes. One component of the plan is a distribution fee paid to MFD and another component of the plan is a service fee paid to MFD. MFD may subsequently pay all, or a portion, of the distribution and/or service fees to financial intermediaries.
Distribution Plan Fee Table:
| | | | | | | | | | | | | | | | | | | | |
| | | | | |
| | | Distribution
Fee Rate (d) | | | Service
Fee Rate (d) | | | Total
Distribution
Plan (d) | | | Annual
Effective
Rate (e) | | | Distribution
and Service
Fee | |
| Class A | | | — | | | | 0.25% | | | | 0.25% | | | | 0.25% | | | | $827,632 | |
| Class B | | | 0.75% | | | | 0.25% | | | | 1.00% | | | | 1.00% | | | | 119,113 | |
| Class C | | | 0.75% | | | | 0.25% | | | | 1.00% | | | | 1.00% | | | | 723,425 | |
| Class R1 | | | 0.75% | | | | 0.25% | | | | 1.00% | | | | 1.00% | | | | 12,259 | |
| Class R2 | | | 0.25% | | | | 0.25% | | | | 0.50% | | | | 0.50% | | | | 100,853 | |
| Class R3 | | | — | | | | 0.25% | | | | 0.25% | | | | 0.25% | | | | 108,195 | |
| Total Distribution and Service Fees | | | | | | | | | | | | $1,891,477 | |
| (d) | In accordance with the distribution plan for certain classes, the fund pays distribution and/or service fees equal to these annual percentage rates of each class’s average daily net assets. The distribution and service fee rates disclosed by class represent the current rates in effect at the end of the reporting period. Any rate changes, if applicable, are detailed below. |
| (e) | The annual effective rates represent actual fees incurred under the distribution plan for the six months ended April 30, 2019 based on each class’s average daily net assets. MFD has voluntarily agreed to rebate a portion of each class’s 0.25% service fee attributable to accounts for which MFD retains the 0.25% service fee except for accounts attributable to MFS or its affiliates’ seed money. For the six months ended April 30, 2019, this rebate amounted to $14,485, $222, and $478 for Class A, Class B, and Class C, respectively, and is included in the reduction of total expenses in the Statement of Operations. |
Certain Class A shares are subject to a contingent deferred sales charge (CDSC) in the event of a shareholder redemption within 18 months of purchase. Class B shares are subject to a CDSC in the event of a shareholder redemption within six years of purchase. Class C shares are subject to a CDSC in the event of a shareholder redemption within 12 months of purchase. All contingent deferred sales charges are paid to MFD and during the six months ended April 30, 2019, were as follows:
| | | | |
| |
| | | Amount | |
| Class A | | | $3,745 | |
| Class B | | | 18,535 | |
| Class C | | | 9,129 | |
Shareholder Servicing Agent– MFS Service Center, Inc. (MFSC), a wholly-owned subsidiary of MFS, receives a fee from the fund for its services as shareholder servicing agent calculated as a percentage of the average daily net assets of the fund as determined periodically under the supervision of the fund’s Board of Trustees. For the six months ended April 30, 2019, the fee was $99,113, which equated to 0.0071% annually of the fund’s average daily net assets. MFSC also receives payment from the fund forout-of-pocket expenses,sub-accounting and other shareholder servicing costs
30
Notes to Financial Statements (unaudited) – continued
which may be paid to affiliated and unaffiliated service providers. Class R6 shares do not incursub-accounting fees. For the six months ended April 30, 2019, theseout-of-pocket expenses,sub-accounting and other shareholder servicing costs amounted to $1,072,519.
Administrator– MFS provides certain financial, legal, shareholder communications, compliance, and other administrative services to the fund. Under an administrative services agreement, the fund reimburses MFS the costs incurred to provide these services. The fund is charged an annual fixed amount of $17,500 plus a fee based on average daily net assets. The administrative services fee incurred for the six months ended April 30, 2019 was equivalent to an annual effective rate of 0.0140% of the fund’s average daily net assets.
Trustees’ and Officers’ Compensation– The fund pays compensation to independent Trustees in the form of a retainer, attendance fees, and additional compensation to Board and Committee chairpersons. The fund does not pay compensation directly to Trustees or officers of the fund who are also officers of the investment adviser, all of whom receive remuneration for their services to the fund from MFS. Certain officers and Trustees of the fund are officers or directors of MFS, MFD, and MFSC.
Prior to December 31, 2001, the fund had an unfunded defined benefit plan (“DB plan”) for independent Trustees. As of December 31, 2001, the Board took action to terminate the DB plan with respect to then-current and any future independent Trustees, such that the DB plan covers only certain of those former independent Trustees who retired on or before December 31, 2001. The DB plan resulted in a pension expense of $833 and is included in “Independent Trustees’ compensation” in the Statement of Operations for the six months ended April 30, 2019. The liability for deferred retirement benefits payable to those former independent Trustees under the DB plan amounted to $4,081 at April 30, 2019, and is included in “Payable for independent Trustees’ compensation” in the Statement of Assets and Liabilities.
Other– This fund and certain other funds managed by MFS (the funds) have entered into a service agreement (the ISO Agreement) which provides for payment of fees solely by the funds to Tarantino LLC in return for the provision of services of an Independent Senior Officer (ISO) for the funds. Frank L. Tarantino serves as the ISO and is an officer of the funds and the sole member of Tarantino LLC. The funds can terminate the ISO Agreement with Tarantino LLC at any time under the terms of the ISO Agreement. For the six months ended April 30, 2019, the fee paid by the fund under this agreement was $2,364 and is included in “Miscellaneous” expense in the Statement of Operations. MFS has agreed to bear all expenses associated with office space, other administrative support, and supplies provided to the ISO.
The fund invests in the MFS Institutional Money Market Portfolio which is managed by MFS and seeks current income consistent with preservation of capital and liquidity. This money market fund does not pay a management fee to MFS.
The fund is permitted to engage in purchase and sale transactions with funds and accounts for which MFS serves as investment adviser orsub-adviser (“cross-trades”) pursuant to a policy adopted by the Board of Trustees. This policy has been designed to ensure that cross-trades conducted by the fund comply with Rule17a-7 under the
31
Notes to Financial Statements (unaudited) – continued
Investment Company Act of 1940. During the six months ended April 30, 2019, the fund engaged in purchase and sale transactions pursuant to this policy, which amounted to $65,799 and $566,261, respectively. The sales transactions resulted in net realized gains (losses) of $(52,952).
(4) Portfolio Securities
For the six months ended April 30, 2019, purchases and sales of investments, other than short-term obligations, aggregated $78,998,222 and $275,928,521, respectively.
(5) Shares of Beneficial Interest
The fund’s Declaration of Trust permits the Trustees to issue an unlimited number of full and fractional shares of beneficial interest. Transactions in fund shares were as follows:
| | | | | | | | | | | | | | | | |
| | | Six months ended
4/30/19 | | | Year ended
10/31/18 | |
| | | | |
| | | Shares | | | Amount | | | Shares | | | Amount | |
| Shares sold | | | | | | | | | | | | | | | | |
Class A | | | 948,592 | | | | $38,319,785 | | | | 2,864,502 | | | | $124,994,713 | |
Class B | | | 14,955 | | | | 557,853 | | | | 65,490 | | | | 2,642,429 | |
Class C | | | 228,857 | | | | 8,066,238 | | | | 764,864 | | | | 29,511,781 | |
Class I | | | 3,178,710 | | | | 129,974,353 | | | | 5,933,741 | | | | 265,674,692 | |
Class R1 | | | 7,210 | | | | 265,329 | | | | 7,354 | | | | 290,220 | |
Class R2 | | | 93,005 | | | | 3,634,199 | | | | 210,731 | | | | 8,953,510 | |
Class R3 | | | 234,226 | | | | 9,502,067 | | | | 513,201 | | | | 22,256,413 | |
Class R4 | | | 280,491 | | | | 11,553,652 | | | | 663,792 | | | | 29,092,007 | |
Class R6 | | | 1,783,197 | | | | 75,252,278 | | | | 4,887,034 | | | | 217,932,872 | |
| | | 6,769,243 | | | | $277,125,754 | | | | 15,910,709 | | | | $701,348,637 | |
| | | | |
| Shares issued to shareholders in reinvestment of distributions | | | | | | | | | | | | | | | | |
Class A | | | 818,402 | | | | $31,786,782 | | | | 402,196 | | | | $17,286,370 | |
Class B | | | 32,088 | | | | 1,148,743 | | | | 15,640 | | | | 622,014 | |
Class C | | | 193,314 | | | | 6,601,665 | | | | 97,978 | | | | 3,727,079 | |
Class I | | | 1,110,657 | | | | 44,270,812 | | | | 639,357 | | | | 28,163,671 | |
Class R1 | | | 3,807 | | | | 133,156 | | | | 2,009 | | | | 78,129 | |
Class R2 | | | 47,826 | | | | 1,804,464 | | | | 26,170 | | | | 1,093,652 | |
Class R3 | | | 117,770 | | | | 4,541,220 | | | | 67,606 | | | | 2,886,104 | |
Class R4 | | | 184,471 | | | | 7,179,608 | | | | 94,740 | | | | 4,081,380 | |
Class R6 | | | 1,090,631 | | | | 43,461,647 | | | | 677,110 | | | | 29,833,465 | |
| | | 3,598,966 | | | | $140,928,097 | | | | 2,022,806 | | | | $87,771,864 | |
32
Notes to Financial Statements (unaudited) – continued
| | | | | | | | | | | | | | | | |
| | | Six months ended
4/30/19 | | | Year ended
10/31/18 | |
| | | | |
| | | Shares | | | Amount | | | Shares | | | Amount | |
| Shares reacquired | | | | | | | | | | | | | | | | |
Class A | | | (1,731,408 | ) | | | $(69,922,163 | ) | | | (3,273,753 | ) | | | $(143,127,341 | ) |
Class B | | | (85,453 | ) | | | (3,197,854 | ) | | | (157,520 | ) | | | (6,344,810 | ) |
Class C | | | (611,490 | ) | | | (21,727,280 | ) | | | (1,460,413 | ) | | | (56,092,959 | ) |
Class I | | | (6,563,224 | ) | | | (268,131,303 | ) | | | (8,606,925 | ) | | | (383,948,578 | ) |
Class R1 | | | (15,817 | ) | | | (557,458 | ) | | | (28,288 | ) | | | (1,078,932 | ) |
Class R2 | | | (154,714 | ) | | | (6,133,959 | ) | | | (463,573 | ) | | | (19,671,067 | ) |
Class R3 | | | (475,055 | ) | | | (19,377,873 | ) | | | (917,421 | ) | | | (39,811,959 | ) |
Class R4 | | | (432,151 | ) | | | (17,728,643 | ) | | | (761,792 | ) | | | (33,351,273 | ) |
Class R6 | | | (1,375,144 | ) | | | (57,708,807 | ) | | | (9,749,566 | ) | | | (439,388,327 | ) |
| | | (11,444,456 | ) | | | $(464,485,340 | ) | | | (25,419,251 | ) | | | $(1,122,815,246 | ) |
| | | | |
| Net change | | | | | | | | | | | | | | | | |
Class A | | | 35,586 | | | | $184,404 | | | | (7,055 | ) | | | $(846,258 | ) |
Class B | | | (38,410 | ) | | | (1,491,258 | ) | | | (76,390 | ) | | | (3,080,367 | ) |
Class C | | | (189,319 | ) | | | (7,059,377 | ) | | | (597,571 | ) | | | (22,854,099 | ) |
Class I | | | (2,273,857 | ) | | | (93,886,138 | ) | | | (2,033,827 | ) | | | (90,110,215 | ) |
Class R1 | | | (4,800 | ) | | | (158,973 | ) | | | (18,925 | ) | | | (710,583 | ) |
Class R2 | | | (13,883 | ) | | | (695,296 | ) | | | (226,672 | ) | | | (9,623,905 | ) |
Class R3 | | | (123,059 | ) | | | (5,334,586 | ) | | | (336,614 | ) | | | (14,669,442 | ) |
Class R4 | | | 32,811 | | | | 1,004,617 | | | | (3,260 | ) | | | (177,886 | ) |
Class R6 | | | 1,498,684 | | | | 61,005,118 | | | | (4,185,422 | ) | | | (191,621,990 | ) |
| | | (1,076,247 | ) | | | $(46,431,489 | ) | | | (7,485,736 | ) | | | $(333,694,745 | ) |
Class T shares were not publicly available for sale during the period. Please see the fund’s prospectus for details.
Effective June 1, 2019, purchases of the fund’s Class B shares are closed to new and existing investors subject to certain exceptions. Please see the fund’s prospectus for details.
(6) Line of Credit
The fund and certain other funds managed by MFS participate in a $1.25 billion unsecured committed line of credit, subject to a $1 billion sublimit, provided by a syndicate of banks under a credit agreement. Borrowings may be made for temporary financing needs. Interest is charged to each fund, based on its borrowings, generally at a rate equal to the highest of one month LIBOR, the Federal Funds Effective Rate and the Overnight Bank Funding Rate, plus an agreed upon spread. A commitment fee, based on the average daily, unused portion of the committed line of credit, is allocated among the participating funds. In addition, the fund and other funds managed by MFS have established unsecured uncommitted borrowing arrangements with certain banks for temporary financing needs. Interest is charged to each fund, based on its borrowings, at rates equal to customary reference rates plus an agreed upon spread. For the six months ended April 30, 2019, the fund’s commitment fee and interest expense were $8,758 and $0, respectively, and are included in “Miscellaneous” expense in the Statement of Operations.
33
Notes to Financial Statements (unaudited) – continued
(7) Investments in Affiliated Issuers
An affiliated issuer may be considered one in which the fund owns 5% or more of the outstanding voting securities, or a company which is under common control. For the purposes of this report, the fund assumes the following to be affiliated issuers:
| | | | | | | | | | | | | | | | | | | | | | | | |
| | | | | | |
| Affiliated Issuers | | Beginning
Value | | | Purchases | | | Sales
Proceeds | | | Realized
Gain
(Loss) | | | Change in
Unrealized
Appreciation or
Depreciation | | | Ending
Value | |
MFS Institutional Money
Market Portfolio | | | $4,015,260 | | | | $197,532,414 | | | | $189,663,413 | | | | $4,194 | | | | $1,040 | | | | $11,889,495 | |
| | | | | | |
| Affiliated Issuers | | | | | | | | | | | | | | Dividend
Income | | | Capital Gain
Distributions | |
| MFS Institutional Money Market Portfolio | | | | | | | | | | | | $142,339 | | | | $— | |
34
PROXY VOTING POLICIES AND INFORMATION
MFS votes proxies on behalf of the fund pursuant to proxy voting policies and procedures that are available without charge, upon request, by calling1-800-225-2606, by visitingmfs.com/proxyvoting, or by visiting the SEC’s Web site athttp://www.sec.gov.
Information regarding how the fund voted proxies relating to portfolio securities during the most recent twelve-month period ended June 30 is available by August 31 of each year without charge by visitingmfs.com/proxyvoting, or by visiting the SEC’s Web site athttp://www.sec.gov.
QUARTERLY PORTFOLIO DISCLOSURE
The fund files a complete schedule of portfolio holdings with the SEC for the first and third quarters of each fiscal year on Form N-Q or as an exhibit to its reports onForm N-PORT (for first and third fiscal quarters ending March 31, 2019 or after). The fund’s Form N-Q or Form N-PORT reports are available on the SEC’s website athttp://www.sec.gov.A shareholder can obtain the portfolio holdings report for the first and third quarters of the fund’s fiscal year atmfs.com/openendfunds by choosing the fund’s name and then selecting the “Resources” tab and clicking on “Prospectus and Reports”.
FURTHER INFORMATION
From time to time, MFS may post important information about the fund or the MFS funds on the MFS web site (mfs.com). This information is available athttps://www.mfs.com/en-us/what-we-do/announcements.html or atmfs.com/openendfunds by choosing the fund’s name.
INFORMATION ABOUT FUND CONTRACTS AND LEGAL CLAIMS
The fund has entered into contractual arrangements with an investment adviser, administrator, distributor, shareholder servicing agent, 529 program manager (if applicable), and custodian who each provide services to the fund. Unless expressly stated otherwise, shareholders are not parties to, or intended beneficiaries of these contractual arrangements, and these contractual arrangements are not intended to create any shareholder right to enforce them against the service providers or to seek any remedy under them against the service providers, either directly or on behalf of the fund.
Under the Trust’s By-Laws and Declaration of Trust, any claims asserted against or on behalf of the MFS Funds, including claims against Trustees and Officers, must be brought in state and federal courts located within the Commonwealth of Massachusetts.
PROVISION OF FINANCIAL REPORTS AND SUMMARY PROSPECTUSES
The fund produces financial reports every six months and updates its summary prospectus and prospectus annually. To avoid sending duplicate copies of materials to households, only one copy of the fund’s annual and semiannual report and summary prospectus may be mailed to shareholders having the same last name and residential address on the fund’s records. However, any shareholder may contact MFSC (please see back cover for address and telephone number) to request that copies of these reports and summary prospectuses be sent personally to that shareholder.
35
Save paper with eDelivery.

MFS® will send you prospectuses, |
reports, and proxies directly viae-mail so you will get information faster with less mailbox clutter.
To sign up:
1. Go to mfs.com.
2. Log in via MFS® Access.
3. Select eDelivery.
If you own your MFS fund shares through a financial institution or a retirement plan, MFS® TALK, MFS® Access, or eDelivery may not be available to you.
CONTACT
WEB SITE
mfs.com
MFS TALK
1-800-637-8255
24 hours a day
ACCOUNT SERVICE AND LITERATURE
Shareholders
1-800-225-2606
Financial advisors
1-800-343-2829
Retirement plan services
1-800-637-1255
MAILING ADDRESS
MFS Service Center, Inc.
P.O. Box 219341
Kansas City, MO 64121-9341
OVERNIGHT MAIL
MFS Service Center, Inc.
Suite 219341
430 W 7th Street
Kansas City, MO 64105-1407
Semiannual Report
April 30, 2019

MFS® Global Total Return Fund

Beginning on January 1, 2021, as permitted by regulations adopted by the U.S. Securities and Exchange Commission, paper copies of the fund’s annual and semiannual shareholder reports will no longer be sent by mail, unless you specifically request paper copies of the reports. Instead, the complete reports will be made available on the fund’s Web site (funds.mfs.com), and you will be notified by mail each time a report is posted and provided with a Web site link to access the report.
If you are already signed up to receive shareholder reports by email, you will not be affected by this change and you need not take any action. You may sign up to receive shareholder reports and other communications from the fund by email by contacting your financial intermediary (such as a broker-dealer or bank) or, if you hold your shares directly with the fund, by calling 1-800-225-2606 or by logging on to MFS Access at mfs.com.
Beginning on January 1, 2019, you may elect to receive all future reports in paper free of charge. Contact your financial intermediary to request that you continue to receive paper copies of your shareholder reports. If you invest directly with the fund, you can call 1-800-225-2606 or send an email request to orderliterature@mfs.com to let the fund know that you wish to continue receiving paper copies of your shareholder reports. Your election to receive reports in paper will apply to all funds held in your account if you invest through your financial intermediary or all funds held with the MFS fund complex if you invest directly.
MWT-SEM
MFS® Global Total Return Fund
CONTENTS
The report is prepared for the general information of shareholders.
It is authorized for distribution to prospective investors only when preceded or accompanied by a current prospectus.
NOT FDIC INSURED• MAY LOSE VALUE• NO BANK GUARANTEE

LETTER FROM THE EXECUTIVE CHAIRMAN
Dear Shareholders:
Markets experienced a bout of volatility in late 2018 as a result of higher interest rates, international trade friction, and geopolitical uncertainty surrounding issues such as
Brexit. Those concerns dissipated in the early months of 2019 due to the more dovish posture of the U.S. Federal Reserve and other global central banks, reported progress toward a trade pact between the United States and China, and action against ano-deal Brexit by the British Parliament. However, a last-minute breakdown in negotiations between the U.S. and China derailed the market’s momentum and increased concerns over the future pace of global growth. Compounding Brexit uncertainty was the resignation of British Prime Minister Theresa May, potentially ushering in a harder form of Brexit than she had advocated. U.S. equities have continued to outperform their global peers due in
part to fiscal stimulus undertaken in late 2017 and early 2018, which contributed to the continuation of relatively healthy levels of U.S. economic output against a backdrop of slower global growth. Inflation remains largely subdued globally, which is encouraging for asset markets. Rising incomes in many developed and emerging markets are supportive of gains in consumption, though a challenging environment for global trade has hindered manufacturing in most regions.
Since launching the first U.S.open-end mutual fund in 1924, MFS® has been committed to a single purpose: to create value by allocating capital responsibly for clients. Through our powerful global investment platform, we combine collective expertise, thoughtful risk management, and long-term discipline to uncover what we believe are the best investment opportunities in the market.
Respectfully,

Robert J. Manning
Executive Chairman
MFS Investment Management
June 17, 2019
The opinions expressed in this letter are subject to change and may not be relied upon for investment advice. No forecasts can be guaranteed.
1
PORTFOLIO COMPOSITION
Portfolio structure (i)
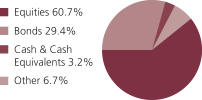
| | | | |
| Top ten holdings (i) | |
| U.S. Treasury Notes, 2%, 11/15/2026 | | | 1.8% | |
| U.S. Treasury Notes, 2.75%, 2/15/2028 | | | 1.7% | |
| Government of Japan, 0.5%, 6/20/2038 | | | 1.5% | |
| Taiwan Semiconductor Manufacturing Co. Ltd., ADR | | | 1.5% | |
| Nestle S.A. | | | 1.3% | |
| Roche Holding AG | | | 1.2% | |
| Government of Canada, 1.5%, 6/01/2026 | | | 1.2% | |
| U.S. Treasury Note 5 yr Future - JUN 2019 | | | (1.5)% | |
| German Euro-Bobl 5 yr Future - JUN 2019 | | | (2.0)% | |
| U.S. Treasury Ultra 10 yr Future - JUN 2019 | | | (2.5)% | |
|
| Composition including fixed income credit quality (a)(i) | |
| AAA | | | 5.7% | |
| AA | | | 2.0% | |
| A | | | 6.0% | |
| BBB | | | 12.3% | |
| D (o) | | | 0.0% | |
| U.S. Government | | | 6.8% | |
| Federal Agencies | | | 2.6% | |
| Not Rated | | | (6.0)% | |
| Non-Fixed Income | | | 60.7% | |
| Cash & Cash Equivalents | | | 3.2% | |
| Other | | | 6.7% | |
| | | | |
| GICS equity sectors | |
| Financials | | | 11.2% | |
| Industrials | | | 9.2% | |
| Health Care | | | 8.7% | |
| Consumer Staples | | | 8.4% | |
| Information Technology | | | 7.9% | |
| Communication Services | | | 3.6% | |
| Energy | | | 3.0% | |
| Consumer Discretionary | | | 2.7% | |
| Materials | | | 2.6% | |
| Utilities | | | 2.0% | |
| Real Estate | | | 1.4% | |
|
| Fixed income sectors (i) | |
| Investment Grade Corporates | | | 10.1% | |
| Non-U.S. Government Bonds | | | 8.9% | |
| U.S. Treasury Securities | | | 3.0% | |
| Emerging Markets Bonds | | | 2.8% | |
| Mortgage-Backed Securities | | | 2.6% | |
| Collateralized Debt Obligations | | | 1.0% | |
| Commercial Mortgage-Backed Securities | | | 0.6% | |
| High Yield Corporates | | | 0.2% | |
| Asset-Backed Securities | | | 0.1% | |
| Municipal Bonds | | | 0.1% | |
| U.S. Government Agencies (o) | | | 0.0% | |
2
Portfolio Composition – continued
| | | | |
| Issuer country weightings (i)(x) | |
| United States | | | 55.8% | |
| Japan | | | 7.5% | |
| Switzerland | | | 6.0% | |
| United Kingdom | | | 6.0% | |
| Canada | | | 3.8% | |
| France | | | 3.7% | |
| Spain | | | 2.5% | |
| Australia | | | 2.0% | |
| Taiwan | | | 1.5% | |
| Other Countries | | | 11.2% | |
| | | | |
| Currency exposure weightings (i)(y) | |
| United States Dollar | | | 51.6% | |
| Euro | | | 16.1% | |
| Japanese Yen | | | 11.2% | |
| Swiss Franc | | | 5.7% | |
| British Pound Sterling | | | 5.5% | |
| Canadian Dollar | | | 1.8% | |
| Taiwan Dollar | | | 1.5% | |
| Australian Dollar | | | 1.3% | |
| Norwegian Krone | | | 1.1% | |
| Other Currencies | | | 4.2% | |
| (a) | For all securities other than those specifically described below, ratings are assigned to underlying securities utilizing ratings from Moody’s, Fitch, and Standard & Poor’s rating agencies and applying the following hierarchy: If all three agencies provide a rating, the middle rating (after dropping the highest and lowest ratings) is assigned; if two of the three agencies rate a security, the lower of the two is assigned. Ratings are shown in the S&P and Fitch scale (e.g., AAA). Securities rated BBB or higher are considered investment grade. All ratings are subject to change. U.S. Government includes securities issued by the U.S. Department of the Treasury. Federal Agencies includes rated and unrated U.S. Agency fixed-income securities, U.S. Agency mortgage-backed securities, and collateralized mortgage obligations of U.S. Agency mortgage-backed securities. Not Rated includes fixed income securities and fixed income derivatives, which have not been rated by any rating agency.Non-Fixed Income includes equity securities (including convertible bonds and equity derivatives) and/or commodity-linked derivatives. The fund may or may not have held all of these instruments on this date. The fund is not rated by these agencies. |
| (i) | For purposes of this presentation, the components include the value of securities, and reflect the impact of the equivalent exposure of derivative positions, if any. These amounts may be negative from time to time. Equivalent exposure is a calculated amount that translates the derivative position into a reasonable approximation of the amount of the underlying asset that the portfolio would have to hold at a given point in time to have the same price sensitivity that results from the portfolio’s ownership of the derivative contract. When dealing with derivatives, equivalent exposure is a more representative measure of the potential impact of a position on portfolio performance than value. The bond component will include any accrued interest amounts. |
| (x) | Represents the portfolio’s exposure to issuer countries as a percentage of a portfolio’s net assets. For purposes of this presentation, United States includes Cash & Cash Equivalents and Other. |
| (y) | Represents the portfolio’s exposure to a particular currency as a percentage of a portfolio’s net assets. For purposes of this presentation, United States Dollar includes Cash & Cash Equivalents. |
Where the fund holds convertible bonds, they are treated as part of the equity portion of the portfolio.
3
Portfolio Composition – continued
Cash & Cash Equivalents includes any cash, investments in money market funds, short-term securities, and other assets less liabilities. Please see the Statement of Assets and Liabilities for additional information related to the fund’s cash position and other assets and liabilities.
Other includes equivalent exposure from currency derivatives and/or any offsets to derivative positions.
The Global Industry Classification Standard (GICS®) was developed by and/or is the exclusive property of MSCI, Inc. and S&P Global Market Intelligence Inc. (“S&P Global Market Intelligence”). GICS is a service mark of MSCI and S&P Global Market Intelligence and has been licensed for use by MFS.
Percentages are based on net assets as of April 30, 2019.
The portfolio is actively managed and current holdings may be different.
4
EXPENSE TABLE
Fund expenses borne by the shareholders during the period, November 1, 2018 through April 30, 2019
As a shareholder of the fund, you incur two types of costs: (1) transaction costs, including sales charges (loads) on certain purchase or redemption payments, and (2) ongoing costs, including management fees; distribution and service(12b-1) fees; and other fund expenses. This example is intended to help you understand your ongoing costs (in dollars) of investing in the fund and to compare these costs with the ongoing costs of investing in other mutual funds.
The example is based on an investment of $1,000 invested at the beginning of the period and held for the entire period November 1, 2018 through April 30, 2019.
Actual Expenses
The first line for each share class in the following table provides information about actual account values and actual expenses. You may use the information in this line, together with the amount you invested, to estimate the expenses that you paid over the period. Simply divide your account value by $1,000 (for example, an $8,600 account value divided by $1,000 = 8.6), then multiply the result by the number in the first line under the heading entitled “Expenses Paid During Period” to estimate the expenses you paid on your account during this period.
Hypothetical Example for Comparison Purposes
The second line for each share class in the following table provides information about hypothetical account values and hypothetical expenses based on the fund’s actual expense ratio and an assumed rate of return of 5% per year before expenses, which is not the fund’s actual return. The hypothetical account values and expenses may not be used to estimate the actual ending account balance or expenses you paid for the period. You may use this information to compare the ongoing costs of investing in the fund and other funds. To do so, compare this 5% hypothetical example with the 5% hypothetical examples that appear in the shareholder reports of the other funds.
Please note that the expenses shown in the table are meant to highlight your ongoing costs only and do not reflect any transactional costs, such as sales charges (loads). Therefore, the second line for each share class in the table is useful in comparing ongoing costs only, and will not help you determine the relative total costs of owning different funds. In addition, if these transactional costs were included, your costs would have been higher.
5
Expense Table – continued
| | | | | | | | | | | | | | | | | | |
Share
Class | | | | Annualized
Expense
Ratio | | | Beginning
Account Value
11/01/18 | | | Ending Account Value
4/30/19 | | | Expenses Paid During
Period (p)
11/01/18-4/30/19 | |
| A | | Actual | | | 1.09% | | | | $1,000.00 | | | | $1,070.45 | | | | $5.60 | |
| | Hypothetical (h) | | | 1.09% | | | | $1,000.00 | | | | $1,019.39 | | | | $5.46 | |
| B | | Actual | | | 1.84% | | | | $1,000.00 | | | | $1,066.54 | | | | $9.43 | |
| | Hypothetical (h) | | | 1.84% | | | | $1,000.00 | | | | $1,015.67 | | | | $9.20 | |
| C | | Actual | | | 1.84% | | | | $1,000.00 | | | | $1,065.77 | | | | $9.42 | |
| | Hypothetical (h) | | | 1.84% | | | | $1,000.00 | | | | $1,015.67 | | | | $9.20 | |
| I | | Actual | | | 0.84% | | | | $1,000.00 | | | | $1,071.36 | | | | $4.31 | |
| | Hypothetical (h) | | | 0.84% | | | | $1,000.00 | | | | $1,020.63 | | | | $4.21 | |
| R1 | | Actual | | | 1.84% | | | | $1,000.00 | | | | $1,066.16 | | | | $9.43 | |
| | Hypothetical (h) | | | 1.84% | | | | $1,000.00 | | | | $1,015.67 | | | | $9.20 | |
| R2 | | Actual | | | 1.34% | | | | $1,000.00 | | | | $1,069.08 | | | | $6.87 | |
| | Hypothetical (h) | | | 1.34% | | | | $1,000.00 | | | | $1,018.15 | | | | $6.71 | |
| R3 | | Actual | | | 1.09% | | | | $1,000.00 | | | | $1,070.09 | | | | $5.59 | |
| | Hypothetical (h) | | | 1.09% | | | | $1,000.00 | | | | $1,019.39 | | | | $5.46 | |
| R4 | | Actual | | | 0.84% | | | | $1,000.00 | | | | $1,071.14 | | | | $4.31 | |
| | Hypothetical (h) | | | 0.84% | | | | $1,000.00 | | | | $1,020.63 | | | | $4.21 | |
| R6 | | Actual | | | 0.74% | | | | $1,000.00 | | | | $1,071.96 | | | | $3.80 | |
| | Hypothetical (h) | | | 0.74% | | | | $1,000.00 | | | | $1,021.12 | | | | $3.71 | |
| (h) | 5% class return per year before expenses. |
| (p) | “Expenses Paid During Period” are equal to each class’s annualized expense ratio, as shown above, multiplied by the average account value over the period, multiplied by 181/365 (to reflect theone-half year period). Expenses paid do not include any applicable sales charges (loads). If these transaction costs had been included, your costs would have been higher. |
6
PORTFOLIO OF INVESTMENTS
4/30/19 (unaudited)
The Portfolio of Investments is a complete list of all securities owned by your fund. It is categorized by broad-based asset classes.
| | | | | | | | |
| Common Stocks - 60.1% | | | | | | | | |
| | |
| Issuer | | Shares/Par | | | Value ($) | |
| Aerospace - 2.0% | | | | | | | | |
| Honeywell International, Inc. | | | 93,038 | | | $ | 16,154,188 | |
| Lockheed Martin Corp. | | | 38,890 | | | | 12,963,204 | |
| Northrop Grumman Corp. | | | 10,274 | | | | 2,978,535 | |
| United Technologies Corp. | | | 37,115 | | | | 5,292,970 | |
| | | | | | | | |
| | | | | | | $ | 37,388,897 | |
| Airlines - 0.5% | | | | | | | | �� |
| Aena S.A. | | | 12,443 | | | $ | 2,307,636 | |
| Air Canada | | | 266,402 | | | | 6,395,080 | |
| | | | | | | | |
| | | | | | | $ | 8,702,716 | |
| Alcoholic Beverages - 1.4% | | | | | | | | |
| Diageo PLC | | | 47,908 | | | $ | 2,020,033 | |
| Heineken N.V. (l) | | | 99,450 | | | | 10,734,909 | |
| Molson Coors Brewing Co. | | | 41,700 | | | | 2,676,723 | |
| Pernod Ricard S.A. | | | 64,829 | | | | 11,295,841 | |
| | | | | | | | |
| | | | | | | $ | 26,727,506 | |
| Apparel Manufacturers - 0.3% | | | | | | | | |
| Compagnie Financiere Richemont S.A. | | | 77,884 | | | $ | 5,694,448 | |
| | |
| Automotive - 0.9% | | | | | | | | |
| Aptiv PLC | | | 57,425 | | | $ | 4,921,323 | |
| Magna International, Inc. | | | 140,833 | | | | 7,839,006 | |
| USS Co. Ltd. | | | 165,100 | | | | 3,161,799 | |
| | | | | | | | |
| | | | | | | $ | 15,922,128 | |
| Biotechnology - 0.2% | | | | | | | | |
| Biogen, Inc. (a) | | | 12,955 | | | $ | 2,969,804 | |
| | |
| Broadcasting - 0.7% | | | | | | | | |
| Omnicom Group, Inc. | | | 116,610 | | | $ | 9,332,298 | |
| Publicis Groupe | | | 59,246 | | | | 3,513,893 | |
| | | | | | | | |
| | | | | | | $ | 12,846,191 | |
| Brokerage & Asset Managers - 0.6% | | | | | | | | |
| ASX Ltd. | | | 20,574 | | | $ | 1,080,521 | |
| BlackRock, Inc. | | | 16,565 | | | | 8,038,001 | |
| TMX Group Ltd. | | | 44,832 | | | | 2,859,851 | |
| | | | | | | | |
| | | | | | | $ | 11,978,373 | |
7
Portfolio of Investments (unaudited) – continued
| | | | | | | | |
| | |
| Issuer | | Shares/Par | | | Value ($) | |
| Common Stocks - continued | | | | | | | | |
| Business Services - 5.2% | | | | | | | | |
| Accenture PLC, “A” | | | 106,861 | | | $ | 19,520,299 | |
| Bunzl PLC | | | 119,652 | | | | 3,602,645 | |
| CGI, Inc. | | | 51,655 | | | | 3,718,065 | |
| Cognizant Technology Solutions Corp., “A” | | | 74,296 | | | | 5,420,636 | |
| Compass Group PLC | | | 476,688 | | | | 10,834,508 | |
| DXC Technology Co. | | | 86,468 | | | | 5,684,406 | |
| Equifax, Inc. | | | 43,555 | | | | 5,485,752 | |
| Experian PLC | | | 195,073 | | | | 5,659,848 | |
| Fidelity National Information Services, Inc. | | | 43,212 | | | | 5,009,567 | |
| Fiserv, Inc. (a) | | | 87,560 | | | | 7,638,734 | |
| Nomura Research Institute Ltd. | | | 110,200 | | | | 5,391,082 | |
| Secom Co. Ltd. | | | 108,700 | | | | 9,141,799 | |
| SGS S.A. | | | 1,270 | | | | 3,351,519 | |
| Thomson Reuters Corp. | | | 94,256 | | | | 5,828,791 | |
| | | | | | | | |
| | | | | | | $ | 96,287,651 | |
| Cable TV - 1.0% | | | | | | | | |
| Comcast Corp., “A” | | | 425,813 | | | $ | 18,535,640 | |
| | |
| Chemicals - 1.7% | | | | | | | | |
| 3M Co. | | | 49,830 | | | $ | 9,443,283 | |
| Givaudan S.A. | | | 3,704 | | | | 9,593,068 | |
| PPG Industries, Inc. | | | 101,304 | | | | 11,903,220 | |
| | | | | | | | |
| | | | | | | $ | 30,939,571 | |
| Computer Software - 0.4% | | | | | | | | |
| Adobe Systems, Inc. (a) | | | 11,215 | | | $ | 3,243,939 | |
| Cadence Design Systems, Inc. (a) | | | 66,108 | | | | 4,586,573 | |
| | | | | | | | |
| | | | | | | $ | 7,830,512 | |
| Computer Software - Systems - 0.6% | | | | | | | | |
| Amadeus IT Group S.A. | | | 95,224 | | | $ | 7,574,485 | |
| Hitachi Ltd. | | | 105,400 | | | | 3,510,440 | |
| | | | | | | | |
| | | | | | | $ | 11,084,925 | |
| Construction - 1.0% | | | | | | | | |
| Daito Trust Construction Co. Ltd. | | | 14,300 | | | $ | 1,911,316 | |
| Persimmon PLC | | | 66,024 | | | | 1,925,091 | |
| Sherwin-Williams Co. | | | 15,250 | | | | 6,936,158 | |
| Stanley Black & Decker, Inc. | | | 50,828 | | | | 7,451,385 | |
| | | | | | | | |
| | | | | | | $ | 18,223,950 | |
| Consumer Products - 1.7% | | | | | | | | |
| Colgate-Palmolive Co. | | | 60,163 | | | $ | 4,379,265 | |
| Kao Corp. | | | 73,500 | | | | 5,666,593 | |
8
Portfolio of Investments (unaudited) – continued
| | | | | | | | |
| | |
| Issuer | | Shares/Par | | | Value ($) | |
| Common Stocks - continued | | | | | | | | |
| Consumer Products - continued | | | | | | | | |
| Kimberly-Clark Corp. | | | 92,618 | | | $ | 11,890,299 | |
| Reckitt Benckiser Group PLC | | | 120,214 | | | | 9,714,358 | |
| | | | | | | | |
| | | | | | | $ | 31,650,515 | |
| Containers - 0.2% | | | | | | | | |
| Amcor Ltd. | | | 411,152 | | | $ | 4,646,161 | |
| | |
| Electrical Equipment - 2.2% | | | | | | | | |
| Johnson Controls International PLC | | | 176,420 | | | $ | 6,615,750 | |
| Legrand S.A. | | | 72,112 | | | | 5,299,311 | |
| OMRON Corp. | | | 105,200 | | | | 5,652,447 | |
| Schneider Electric S.A. (l) | | | 251,851 | | | | 21,315,644 | |
| Spectris PLC | | | 57,908 | | | | 2,075,070 | |
| | | | | | | | |
| | | | | | | $ | 40,958,222 | |
| Electronics - 3.6% | | | | | | | | |
| Analog Devices, Inc. | | | 67,813 | | | $ | 7,882,583 | |
| Halma PLC | | | 94,537 | | | | 2,218,356 | |
| Hoya Corp. | | | 61,600 | | | | 4,339,978 | |
| Kyocera Corp. | | | 64,000 | | | | 4,116,064 | |
| Samsung Electronics Co. Ltd. | | | 135,659 | | | | 5,324,629 | |
| Taiwan Semiconductor Manufacturing Co. Ltd., ADR | | | 626,425 | | | | 27,449,944 | |
| Texas Instruments, Inc. | | | 131,047 | | | | 15,441,268 | |
| | | | | | | | |
| | | | | | | $ | 66,772,822 | |
| Energy - Independent - 0.6% | | | | | | | | |
| Marathon Petroleum Corp. | | | 73,518 | | | $ | 4,475,041 | |
| Occidental Petroleum Corp. | | | 24,496 | | | | 1,442,324 | |
| Phillips 66 | | | 50,864 | | | | 4,794,949 | |
| | | | | | | | |
| | | | | | | $ | 10,712,314 | |
| Energy - Integrated - 2.1% | | | | | | | | |
| BP PLC | | | 454,591 | | | $ | 3,313,677 | |
| Chevron Corp. | | | 32,590 | | | | 3,912,756 | |
| China Petroleum & Chemical Corp. | | | 6,466,000 | | | | 4,970,169 | |
| Eni S.p.A. | | | 386,863 | | | | 6,603,174 | |
| Exxon Mobil Corp. | | | 111,722 | | | | 8,969,042 | |
| Galp Energia SGPS S.A. | | | 223,367 | | | | 3,750,410 | |
| LUKOIL PJSC, ADR | | | 46,721 | | | | 3,961,006 | |
| Suncor Energy, Inc. | | | 121,776 | | | | 4,015,872 | |
| | | | | | | | |
| | | | | | | $ | 39,496,106 | |
| Food & Beverages - 2.7% | | | | | | | | |
| Danone S.A. (l) | | | 92,042 | | | $ | 7,441,128 | |
| General Mills, Inc. | | | 125,298 | | | | 6,449,088 | |
9
Portfolio of Investments (unaudited) – continued
| | | | | | | | |
| | |
| Issuer | | Shares/Par | | | Value ($) | |
| Common Stocks - continued | | | | | | | | |
| Food & Beverages - continued | | | | | | | | |
| J.M. Smucker Co. | | | 54,431 | | | $ | 6,674,874 | |
| Mowi A.S.A. | | | 94,572 | | | | 2,048,752 | |
| Nestle S.A. | | | 248,403 | | | | 23,902,953 | |
| Tyson Foods, Inc., “A” | | | 57,404 | | | | 4,305,874 | |
| | | | | | | | |
| | | | | | | $ | 50,822,669 | |
| Food & Drug Stores - 0.3% | | | | | | | | |
| Wesfarmers Ltd. | | | 208,024 | | | $ | 5,280,741 | |
| | |
| Health Maintenance Organizations - 0.4% | | | | | | | | |
| Cigna Corp. | | | 46,983 | | | $ | 7,462,780 | |
| | |
| Insurance - 3.6% | | | | | | | | |
| Aon PLC | | | 100,218 | | | $ | 18,053,271 | |
| AXA (l) | | | 146,390 | | | | 3,898,716 | |
| Chubb Ltd. | | | 66,003 | | | | 9,583,636 | |
| Hiscox Ltd. | | | 110,867 | | | | 2,420,111 | |
| MetLife, Inc. | | | 99,633 | | | | 4,596,070 | |
| Prudential Financial, Inc. | | | 37,771 | | | | 3,992,772 | |
| Samsung Fire & Marine Insurance Co. Ltd. | | | 5,236 | | | | 1,362,620 | |
| Travelers Cos., Inc. | | | 82,199 | | | | 11,816,106 | |
| Zurich Insurance Group AG | | | 35,810 | | | | 11,418,292 | |
| | | | | | | | |
| | | | | | | $ | 67,141,594 | |
| Machinery & Tools - 1.4% | | | | | | | | |
| Eaton Corp. PLC | | | 150,344 | | | $ | 12,451,490 | |
| Illinois Tool Works, Inc. | | | 60,850 | | | | 9,470,085 | |
| Kubota Corp. | | | 275,300 | | | | 4,143,183 | |
| | | | | | | | |
| | | | | | | $ | 26,064,758 | |
| Major Banks - 4.1% | | | | | | | | |
| ABSA Group Ltd. | | | 213,874 | | | $ | 2,455,851 | |
| Bank of New York Mellon Corp. | | | 136,306 | | | | 6,768,956 | |
| China Construction Bank | | | 8,029,000 | | | | 7,092,720 | |
| Goldman Sachs Group, Inc. | | | 24,048 | | | | 4,951,964 | |
| JPMorgan Chase & Co. | | | 174,326 | | | | 20,230,532 | |
| National Australia Bank Ltd. | | | 51,934 | | | | 928,085 | |
| PNC Financial Services Group, Inc. | | | 34,157 | | | | 4,677,118 | |
| Royal Bank of Canada | | | 40,872 | | | | 3,257,090 | |
| State Street Corp. | | | 100,412 | | | | 6,793,876 | |
| UBS Group AG | | | 741,611 | | | | 9,945,644 | |
| Wells Fargo & Co. | | | 178,970 | | | | 8,663,938 | |
| | | | | | | | |
| | | | | | | $ | 75,765,774 | |
10
Portfolio of Investments (unaudited) – continued
| | | | | | | | |
| | |
| Issuer | | Shares/Par | | | Value ($) | |
| Common Stocks - continued | | | | | | | | |
| Medical & Health Technology & Services - 0.6% | | | | | | | | |
| HCA Healthcare, Inc. | | | 57,921 | | | $ | 7,369,289 | |
| McKesson Corp. | | | 6,247 | | | | 744,955 | |
| Sonic Healthcare Ltd. | | | 177,739 | | | | 3,213,870 | |
| | | | | | | | |
| | | | | | | $ | 11,328,114 | |
| Medical Equipment - 1.8% | | | | | | | | |
| Abbott Laboratories | | | 111,956 | | | $ | 8,907,219 | |
| Danaher Corp. | | | 62,612 | | | | 8,292,333 | |
| Medtronic PLC | | | 122,058 | | | | 10,839,971 | |
| Thermo Fisher Scientific, Inc. | | | 17,022 | | | | 4,722,754 | |
| | | | | | | | |
| | | | | | | $ | 32,762,277 | |
| Metals & Mining - 0.2% | | | | | | | | |
| POSCO | | | 5,322 | | | $ | 1,161,760 | |
| Rio Tinto PLC | | | 34,357 | | | | 2,000,388 | |
| | | | | | | | |
| | | | | | | $ | 3,162,148 | |
| Natural Gas - Distribution - 0.2% | | | | | | | | |
| ENGIE | | | 219,680 | | | $ | 3,253,621 | |
| | |
| Network & Telecom - 0.3% | | | | | | | | |
| Cisco Systems, Inc. | | | 89,652 | | | $ | 5,016,029 | |
| | |
| Oil Services - 0.3% | | | | | | | | |
| Schlumberger Ltd. | | | 138,007 | | | $ | 5,890,139 | |
| | |
| Other Banks & Diversified Financials - 2.4% | | | | | | | | |
| American Express Co. | | | 33,041 | | | $ | 3,873,396 | |
| BB&T Corp. | | | 131,564 | | | | 6,736,077 | |
| Citigroup, Inc. | | | 224,665 | | | | 15,883,816 | |
| DBS Group Holdings Ltd. | | | 77,400 | | | | 1,607,639 | |
| KBC Group N.V. | | | 60,076 | | | | 4,448,509 | |
| Komercni Banka A.S. | | | 13,285 | | | | 503,386 | |
| ORIX Corp. | | | 92,400 | | | | 1,300,058 | |
| Sberbank of Russia, ADR | | | 64,688 | | | | 924,715 | |
| U.S. Bancorp | | | 178,647 | | | | 9,525,458 | |
| | | | | | | | |
| | | | | | | $ | 44,803,054 | |
| Pharmaceuticals - 5.5% | | | | | | | | |
| Bayer AG | | | 154,668 | | | $ | 10,294,043 | |
| Bristol-Myers Squibb Co. | | | 151,146 | | | | 7,017,709 | |
| Eli Lilly & Co. | | | 32,635 | | | | 3,819,600 | |
| Johnson & Johnson | | | 142,346 | | | | 20,099,255 | |
| Novartis AG | | | 160,756 | | | | 13,127,736 | |
11
Portfolio of Investments (unaudited) – continued
| | | | | | | | |
| | |
| Issuer | | Shares/Par | | | Value ($) | |
| Common Stocks - continued | | | | | | | | |
| Pharmaceuticals - continued | | | | | | | | |
| Novo Nordisk A.S., “B” | | | 63,040 | | | $ | 3,082,722 | |
| Pfizer, Inc. | | | 428,685 | | | | 17,408,898 | |
| Roche Holding AG | | | 87,605 | | | | 23,093,089 | |
| Santen Pharmaceutical Co. Ltd. | | | 305,400 | | | | 4,662,347 | |
| | | | | | | | |
| | | | | | | $ | 102,605,399 | |
| Printing & Publishing - 0.7% | | | | | | | | |
| Moody’s Corp. | | | 41,227 | | | $ | 8,106,053 | |
| RELX PLC | | | 254,939 | | | | 5,850,323 | |
| | | | | | | | |
| | | | | | | $ | 13,956,376 | |
| Railroad & Shipping - 0.3% | | | | | | | | |
| Canadian National Railway Co. | | | 28,010 | | | $ | 2,598,768 | |
| Union Pacific Corp. | | | 19,829 | | | | 3,510,526 | |
| | | | | | | | |
| | | | | | | $ | 6,109,294 | |
| Real Estate - 1.3% | | | | | | | | |
| CK Asset Holdings Ltd. | | | 233,000 | | | $ | 1,871,176 | |
| Daiwa House Industry Co. Ltd. | | | 30,000 | | | | 841,383 | |
| Deutsche Wohnen SE | | | 192,543 | | | | 8,653,365 | |
| Grand City Properties S.A. | | | 98,407 | | | | 2,313,424 | |
| Medical Properties Trust, Inc., REIT | | | 314,750 | | | | 5,495,535 | |
| Public Storage, Inc., REIT | | | 8,282 | | | | 1,831,813 | |
| STORE Capital Corp., REIT | | | 74,788 | | | | 2,491,936 | |
| | | | | | | | |
| | | | | | | $ | 23,498,632 | |
| Restaurants - 0.5% | | | | | | | | |
| Greggs PLC | | | 120,798 | | | $ | 2,830,645 | |
| Starbucks Corp. | | | 77,970 | | | | 6,056,710 | |
| | | | | | | | |
| | | | | | | $ | 8,887,355 | |
| Specialty Chemicals - 0.6% | | | | | | | | |
| Akzo Nobel N.V. | | | 67,514 | | | $ | 5,732,284 | |
| PTT Global Chemical PLC | | | 2,596,200 | | | | 5,590,877 | |
| | | | | | | | |
| | | | | | | $ | 11,323,161 | |
| Specialty Stores - 0.1% | | | | | | | | |
| Dufry AG | | | 23,082 | | | $ | 2,254,853 | |
| | |
| Telecommunications - Wireless - 1.4% | | | | | | | | |
| KDDI Corp. | | | 783,700 | | | $ | 17,914,601 | |
| SK Telecom Co. Ltd. | | | 10,377 | | | | 2,198,611 | |
| Vodafone Group PLC | | | 3,437,611 | | | | 6,365,356 | |
| | | | | | | | |
| | | | | | | $ | 26,478,568 | |
12
Portfolio of Investments (unaudited) – continued
| | | | | | | | |
| | |
| Issuer | | Shares/Par | | | Value ($) | |
| Common Stocks - continued | | | | | | | | |
| Telephone Services - 0.4% | | | | | | | | |
| TELUS Corp. | | | 99,502 | | | $ | 3,663,830 | |
| TELUS Corp. | | | 34,958 | | | | 1,287,853 | |
| Verizon Communications, Inc. | | | 52,325 | | | | 2,992,467 | |
| | | | | | | | |
| | | | | | | $ | 7,944,150 | |
| Tobacco - 2.1% | | | | | | | | |
| Altria Group, Inc. | | | 41,932 | | | $ | 2,278,165 | |
| Imperial Brands PLC | | | 136,049 | | | | 4,321,656 | |
| Japan Tobacco, Inc. | | | 463,500 | | | | 10,744,423 | |
| Philip Morris International, Inc. | | | 240,044 | | | | 20,778,209 | |
| | | | | | | | |
| | | | | | | $ | 38,122,453 | |
| Trucking - 0.2% | | | | | | | | |
| United Parcel Service, Inc., “B” | | | 33,432 | | | $ | 3,551,147 | |
| | |
| Utilities - Electric Power - 1.8% | | | | | | | | |
| Duke Energy Corp. | | | 98,515 | | | $ | 8,976,687 | |
| E.ON AG | | | 161,488 | | | | 1,733,003 | |
| Exelon Corp. | | | 202,582 | | | | 10,321,553 | |
| SSE PLC | | | 585,893 | | | | 8,744,031 | |
| Xcel Energy, Inc. | | | 59,068 | | | | 3,337,342 | |
| | | | | | | | |
| | | | | | | $ | 33,112,616 | |
| Total Common Stocks (Identified Cost, $772,950,844) | | | $ | 1,115,966,154 | |
| | |
| Bonds - 35.8% | | | | | | | | |
| Aerospace - 0.1% | | | | | | | | |
| Huntington Ingalls Industries, Inc., 3.483%, 12/01/2027 | | $ | 630,000 | | | $ | 616,020 | |
| L3 Technologies, Inc., 3.85%, 6/15/2023 | | | 1,094,000 | | | | 1,130,453 | |
| Lockheed Martin Corp., 3.55%, 1/15/2026 | | | 795,000 | | | | 816,397 | |
| | | | | | | | |
| | | | | | | $ | 2,562,870 | |
| Apparel Manufacturers - 0.0% | | | | | | | | |
| Tapestry, Inc., 4.125%, 7/15/2027 | | $ | 802,000 | | | $ | 777,156 | |
| | |
| Asset-Backed & Securitized - 1.6% | | | | | | | | |
| A Voce CLO Ltd.,2014-1A, “A1R”, FLR, 3.757% (LIBOR - 3mo. + 1.16%), 7/15/2026 (n) | | $ | 2,627,406 | | | $ | 2,627,275 | |
| Chesapeake Funding II LLC,2016-1A, “A2”, FLR, 3.622% (LIBOR - 1mo. + 1.15%), 3/15/2028 (n) | | | 249,715 | | | | 250,002 | |
| Chesapeake Funding II LLC,2016-2A, “A2”, FLR, 3.473% (LIBOR - 1mo. + 1%), 6/15/2028 (z) | | | 346,950 | | | | 347,489 | |
| Commercial Mortgage Trust, 2015-LC21, “A4”, 3.708%, 7/10/2048 | | | 1,995,691 | | | | 2,069,320 | |
| CPS Auto Trust,2016-D, “B”, 2.11%, 3/15/2021 (n) | | | 664,914 | | | | 664,166 | |
13
Portfolio of Investments (unaudited) – continued
| | | | | | | | |
| | |
| Issuer | | Shares/Par | | | Value ($) | |
| Bonds - continued | | | | | | | | |
| Asset-Backed & Securitized - continued | | | | | | | | |
| Dryden Senior Loan Fund,2013-26A, “AR”, CLO, FLR, 3.497% (LIBOR - 3mo. + 0.9%), 4/15/2029 (z) | | $ | 2,569,000 | | | $ | 2,544,207 | |
| Dryden Senior Loan Fund,2018-55A, “A1”, CLO, FLR, 3.616% (LIBOR - 3mo. + 1.02%), 4/15/2031 (n) | | | 2,966,973 | | | | 2,932,785 | |
| Flatiron CLO Ltd.,2013-1A, “A2R”, FLR, 4.238% (LIBOR - 3mo. + 1.65%), 1/17/2026 (n) | | | 3,092,916 | | | | 3,094,125 | |
| Fort Cre LLC,2018-1A, “A1”, FLR, 3.837% (LIBOR - 1mo. + 1.35%), 11/21/2035 (n) | | | 1,254,500 | | | | 1,254,497 | |
| JPMBB Commercial Mortgage Securities Trust,2014-C26, 3.494%, 1/15/2048 | | | 2,620,000 | | | | 2,686,942 | |
| KKR Real Estate Financial Trust, Inc. Ltd.,2018-FL1, “A”, FLR, 3.573% (LIBOR - 1mo. + 1.1%), 6/15/2036 (n) | | | 1,648,500 | | | | 1,648,945 | |
| Magnetite CLO Ltd.,2012-7A, “A1R2”, FLR, 3.397% (LIBOR - 3mo. + 0.8%), 1/15/2028 (n) | | | 2,978,000 | | | | 2,933,509 | |
| Octagon Investment Partners XVII Ltd.,2013-1A, “BR2”, FLR, 3.98% (LIBOR - 3mo. + 1.4%), 1/25/2031 (n) | | | 4,314,000 | | | | 4,207,496 | |
| Wells Fargo Commercial Mortgage Trust,2015-C28, “A4”, 3.54%, 5/15/2048 | | | 2,322,687 | | | | 2,385,429 | |
| Wells Fargo Commercial Mortgage Trust, 2015-NXS1, “A5”, 3.148%, 5/15/2048 | | | 1,013,505 | | | | 1,021,599 | |
| | | | | | | | |
| | | | | | | $ | 30,667,786 | |
| Automotive - 0.4% | | | | | | | | |
| FCA Bank S.p.A., 1%, 2/21/2022 | | EUR | 500,000 | | | $ | 569,325 | |
| Ferrari N.V., 1.5%, 3/16/2023 | | | 1,700,000 | | | | 1,948,859 | |
| General Motors Co., 6.75%, 4/01/2046 | | $ | 850,000 | | | | 941,012 | |
| General Motors Financial Co., Inc., 4.35%, 1/17/2027 | | | 704,000 | | | | 703,676 | |
| Lear Corp., 3.8%, 9/15/2027 | | | 695,000 | | | | 676,640 | |
| Lear Corp., 4.25%, 5/15/2029 | | | 817,000 | | | | 811,016 | |
| Volkswagen Financial Services A.G., 1.5%, 10/01/2024 | | EUR | 765,000 | | | | 877,628 | |
| Volkswagen International Finance N.V., 1.875%, 3/30/2027 | | | 500,000 | | | | 568,203 | |
| | | | | | | | |
| | | | | | | $ | 7,096,359 | |
| Broadcasting - 0.2% | | | | | | | | |
| Fox Corp., 4.709%, 1/25/2029 (n) | | $ | 217,000 | | | $ | 233,467 | |
| SES S.A., 1.625%, 3/22/2026 | | EUR | 1,100,000 | | | | 1,260,010 | |
| WPP Finance, 1.375%, 3/20/2025 | | | 700,000 | | | | 805,941 | |
| WPP Finance 2013, 2.875%, 9/14/2046 | | GBP | 1,000,000 | | | | 1,057,862 | |
| | | | | | | | |
| | | | | | | $ | 3,357,280 | |
| Brokerage & Asset Managers - 0.2% | | | | | | | | |
| E*TRADE Financial Corp., 2.95%, 8/24/2022 | | $ | 698,000 | | | $ | 697,379 | |
| Euroclear Investments S.A., 2.625% to 4/11/2028, FLR (EUR Swap Rate - 5yr. + 1.659%) to 4/11/2048 | | EUR | 700,000 | | | | 796,897 | |
14
Portfolio of Investments (unaudited) – continued
| | | | | | | | |
| | |
| Issuer | | Shares/Par | | | Value ($) | |
| Bonds - continued | | | | | | | | |
| Brokerage & Asset Managers - continued | | | | | | | | |
| Intercontinental Exchange, Inc., 2.75%, 12/01/2020 | | $ | 538,000 | | | $ | 538,344 | |
| Intercontinental Exchange, Inc., 3.75%, 12/01/2025 | | | 883,000 | | | | 919,456 | |
| TD Ameritrade Holding Corp., 2.95%, 4/01/2022 | | | 715,000 | | | | 720,222 | |
| | | | | | | | |
| | | | | | | $ | 3,672,298 | |
| Building - 0.2% | | | | | | | | |
| CRH America Finance, Inc., 4.5%, 4/04/2048 (n) | | $ | 1,033,000 | | | $ | 977,297 | |
| Imerys S.A., 1.5%, 1/15/2027 | | EUR | 600,000 | | | | 687,254 | |
| Martin Marietta Materials, Inc., 4.25%, 7/02/2024 | | $ | 400,000 | | | | 416,995 | |
| Martin Marietta Materials, Inc., 3.45%, 6/01/2027 | | | 544,000 | | | | 521,440 | |
| Martin Marietta Materials, Inc., 3.5%, 12/15/2027 | | | 764,000 | | | | 735,639 | |
| Sika Capital B.V., 0.875%, 4/29/2027 | | EUR | 200,000 | | | | 226,628 | |
| Sika Capital B.V., 1.5%, 4/29/2031 | | | 100,000 | | | | 114,723 | |
| | | | | | | | |
| | | | | | | $ | 3,679,976 | |
| Business Services - 0.1% | | | | | | | | |
| Fidelity National Information Services, Inc., 3.875%, 6/05/2024 | | $ | 320,000 | | | $ | 330,289 | |
| Fidelity National Information Services, Inc., 5%, 10/15/2025 | | | 114,000 | | | | 124,073 | |
| Fidelity National Information Services, Inc., 3%, 8/15/2026 | | | 1,032,000 | | | | 999,791 | |
| | | | | | | | |
| | | | | | | $ | 1,454,153 | |
| Cable TV - 0.1% | | | | | | | | |
| Charter Communications Operating LLC/Charter | | | | | | | | |
| Communications Operating Capital Corp., 6.384%, 10/23/2035 | | $ | 743,000 | | | $ | 839,474 | |
| Cox Communications, Inc., 3.25%, 12/15/2022 (n) | | | 595,000 | | | | 598,100 | |
| Sky PLC, 2.5%, 9/15/2026 | | EUR | 1,100,000 | | | | 1,386,512 | |
| | | | | | | | |
| | | | | | | $ | 2,824,086 | |
| Chemicals - 0.3% | | | | | | | | |
| Air Liquide Finance Co., 2.25%, 9/27/2023 (n) | | $ | 1,031,000 | | | $ | 997,063 | |
| Argentum Netherlands B.V. for Givaudan S.A., 2%, 9/17/2030 | | EUR | 600,000 | | | | 730,666 | |
| Arkema S.A., 1.5%, 4/20/2027 | | | 400,000 | | | | 468,220 | |
| Sasol Chemicals (USA) LLC, 5.875%, 3/27/2024 | | $ | 1,464,000 | | | | 1,553,559 | |
| Sasol Financing (USA) LLC, 6.5%, 9/27/2028 | | | 2,480,000 | | | | 2,719,537 | |
| | | | | | | | |
| | | | | | | $ | 6,469,045 | |
| Computer Software - 0.3% | | | | | | | | |
| Dell International LLC/EMC Corp., 4.9%, 10/01/2026 (n) | | $ | 1,422,000 | | | $ | 1,456,521 | |
| Microsoft Corp., 4.1%, 2/06/2037 | | | 2,140,000 | | | | 2,298,229 | |
| SAP S.E., 1.625%, 3/10/2031 | | EUR | 800,000 | | | | 949,511 | |
| Ubisoft Entertainment S.A., 1.289%, 1/30/2023 | | | 700,000 | | | | 790,032 | |
| | | | | | | | |
| | | | | | | $ | 5,494,293 | |
15
Portfolio of Investments (unaudited) – continued
| | | | | | | | |
| | |
| Issuer | | Shares/Par | | | Value ($) | |
| Bonds - continued | | | | | | | | |
| Computer Software - Systems - 0.2% | | | | | | | | |
| Apple, Inc., 2.7%, 5/13/2022 | | $ | 598,000 | | | $ | 600,075 | |
| Apple, Inc., 4.5%, 2/23/2036 | | | 1,752,000 | | | | 1,944,425 | |
| Apple, Inc., 4.25%, 2/09/2047 | | | 348,000 | | | | 367,149 | |
| | | | | | | | |
| | | | | | | $ | 2,911,649 | |
| Conglomerates - 0.2% | | | | | | | | |
| General Electric Co., 4.5%, 3/11/2044 | | $ | 359,000 | | | $ | 333,010 | |
| Roper Technologies, Inc., 4.2%, 9/15/2028 | | | 787,000 | | | | 810,039 | |
| Smiths Group PLC, 2%, 2/23/2027 | | EUR | 600,000 | | | | 696,032 | |
| United Technologies Corp., 4.125%, 11/16/2028 | | $ | 999,000 | | | | 1,042,140 | |
| Wabtec Corp., 4.95%, 9/15/2028 | | | 747,000 | | | | 769,710 | |
| | | | | | | | |
| | | | | | | $ | 3,650,931 | |
| Consumer Products - 0.2% | | | | | | | | |
| JAB Holdings B.V., 2%, 5/18/2028 | | EUR | 700,000 | | | $ | 808,546 | |
Reckitt Benckiser Treasury Services PLC,
3.625%, 9/21/2023 (n) | | $ | 731,000 | | | | 750,172 | |
| Reckitt Benckiser Treasury Services PLC, 3%, 6/26/2027 (n) | | | 1,016,000 | | | | 981,152 | |
| Whirlpool Corp., 4.75%, 2/26/2029 | | | 1,454,000 | | | | 1,510,967 | |
| | | | | | | | |
| | | | | | | $ | 4,050,837 | |
| Consumer Services - 0.4% | | | | | | | | |
| Experian Finance PLC, 4.25%, 2/01/2029 (n) | | $ | 1,333,000 | | | $ | 1,378,769 | |
| G4S International Finance PLC, 1.5%, 1/09/2023 | | EUR | 750,000 | | | | 841,732 | |
| IHS Markit Ltd., 3.625%, 5/01/2024 | | $ | 292,000 | | | | 292,934 | |
| IHS Markit Ltd., 4.25%, 5/01/2029 | | | 438,000 | | | | 437,269 | |
| ManpowerGroup, Inc., 1.75%, 6/22/2026 | | EUR | 900,000 | | | | 1,051,613 | |
| Priceline Group, Inc., 1.8%, 3/03/2027 | | | 751,000 | | | | 901,220 | |
| Priceline Group, Inc., 3.55%, 3/15/2028 | | $ | 587,000 | | | | 592,788 | |
| Visa, Inc., 4.15%, 12/14/2035 | | | 984,000 | | | | 1,053,866 | |
| Visa, Inc., 3.65%, 9/15/2047 | | | 658,000 | | | | 648,328 | |
| | | | | | | | |
| | | | | | | $ | 7,198,519 | |
| Electronics - 0.2% | | | | | | | | |
| Broadcom Corp./Broadcom Cayman Finance Ltd., 3.875%, 1/15/2027 | | $ | 1,771,000 | | | $ | 1,689,977 | |
| Broadcom, Inc., 4.25%, 4/15/2026 (n) | | | 1,194,000 | | | | 1,180,221 | |
| | | | | | | | |
| | | | | | | $ | 2,870,198 | |
| Emerging Market Quasi-Sovereign - 0.6% | | | | | | | | |
| Office Cherifien des Phosphates, 6.875%, 4/25/2044 (n) | | $ | 1,590,000 | | | $ | 1,730,158 | |
| Petroleos Mexicanos, 1.875%, 4/21/2022 | | EUR | 650,000 | | | | 725,395 | |
| Petroleos Mexicanos, 6.5%, 1/23/2029 | | $ | 2,739,000 | | | | 2,734,207 | |
| PT Pertamina Persero, 6%, 5/03/2042 (n) | | | 3,240,000 | | | | 3,526,934 | |
16
Portfolio of Investments (unaudited) – continued
| | | | | | | | |
| | |
| Issuer | | Shares/Par | | | Value ($) | |
| Bonds - continued | | | | | | | | |
| Emerging Market Quasi-Sovereign - continued | | | | | | | | |
| PT Perusahaan Listrik Negara, 2.875%, 10/25/2025 (n) | | EUR | 900,000 | | | $ | 1,071,878 | |
| State Grid Overseas Investment (2016) Ltd., 3.5%, 5/04/2027 | | $ | 1,939,000 | | | | 1,933,214 | |
| | | | | | | | |
| | | | | | | $ | 11,721,786 | |
| Emerging Market Sovereign - 1.1% | | | | | | | | |
| Oriental Republic of Uruguay, 4.375%, 1/23/2031 | | $ | 3,798,000 | | | $ | 3,953,756 | |
| Republic of Hungary, 5.375%, 2/21/2023 | | | 3,148,000 | | | | 3,400,671 | |
| Republic of Indonesia, 8.25%, 5/15/2029 | | IDR | 91,845,000,000 | | | | 6,638,621 | |
| Republic of Indonesia, 8.375%, 3/15/2034 | | | 75,690,000,000 | | | | 5,364,695 | |
| State of Qatar, 4%, 3/14/2029 (n) | | $ | 878,000 | | | | 914,082 | |
| United Mexican States, 4.6%, 2/10/2048 | | | 702,000 | | | | 678,834 | |
| | | | | | | | |
| | | | | | | $ | 20,950,659 | |
| Energy - Independent - 0.2% | | | | | | | | |
| Tengizchevroil Finance Co. International Ltd., 4%, 8/15/2026 (n) | | $ | 3,609,000 | | | $ | 3,594,809 | |
| | |
| Energy - Integrated - 0.2% | | | | | | | | |
| BP Capital Markets America, Inc., 3.41%, 2/11/2026 | | $ | 2,161,000 | | | $ | 2,200,891 | |
| Eni S.p.A., 4%, 9/12/2023 (n) | | | 680,000 | | | | 697,069 | |
| | | | | | | | |
| | | | | | | $ | 2,897,960 | |
| Engineering - Construction - 0.1% | | | | | | | | |
| Vinci S.A., 3.75%, 4/10/2029 (z) | | $ | 1,334,000 | | | $ | 1,354,765 | |
| | |
| Financial Institutions - 0.3% | | | | | | | | |
| AerCap Ireland Capital Ltd., 3.65%, 7/21/2027 | | $ | 1,592,000 | | | $ | 1,514,236 | |
| Avolon Holdings Funding Ltd., 4.375%, 5/01/2026 (z) | | | 587,000 | | | | 583,519 | |
| EXOR N.V., 1.75%, 1/18/2028 | | EUR | 900,000 | | | | 1,018,741 | |
| GE Capital International Funding Co., 3.373%, 11/15/2025 | | $ | 1,916,000 | | | | 1,883,774 | |
| | | | | | | | |
| | | | | | | $ | 5,000,270 | |
| Food & Beverages - 0.6% | | | | | | | | |
| Anheuser-Busch InBev N.V., 1.5%, 4/18/2030 | | EUR | 660,000 | | | $ | 748,110 | |
| Anheuser-Busch InBev S.A./N.V., 1.65%, 3/28/2031 | | | 530,000 | | | | 603,488 | |
| Anheuser-Busch InBev Worldwide, Inc., 3.3%, 2/01/2023 | | $ | 1,124,000 | | | | 1,139,155 | |
| Anheuser-Busch InBev Worldwide, Inc., 4.375%, 4/15/2038 | | | 426,000 | | | | 415,078 | |
| Anheuser-Busch InBev Worldwide, Inc., 5.55%, 1/23/2049 | | | 602,000 | | | | 668,628 | |
| Constellation Brands, Inc., 4.4%, 11/15/2025 | | | 1,243,000 | | | | 1,313,541 | |
| Danone S.A., 2.077%, 11/02/2021 (n) | | | 1,298,000 | | | | 1,275,284 | |
| Danone S.A., 2.589%, 11/02/2023 (n) | | | 3,035,000 | | | | 2,981,196 | |
| Kraft Heinz Foods Co., 4.375%, 6/01/2046 | | | 545,000 | | | | 482,157 | |
| PepsiCo, Inc., 3.1%, 7/17/2022 | | | 651,000 | | | | 661,812 | |
17
Portfolio of Investments (unaudited) – continued
| | | | | | | | |
| | |
| Issuer | | Shares/Par | | | Value ($) | |
| Bonds - continued | | | | | | | | |
| Food & Beverages - continued | | | | | | | | |
| Wm. Wrigley Jr. Co., 3.375%, 10/21/2020 (n) | | $ | 300,000 | | | $ | 302,945 | |
| | | | | | | | |
| | | | | | | $ | 10,591,394 | |
| Forest & Paper Products - 0.1% | | | | | | | | |
| Suzano Austria GmbH, 6%, 1/15/2029 (n) | | $ | 1,279,000 | | | $ | 1,368,530 | |
| | |
| Gaming & Lodging - 0.0% | | | | | | | | |
| InterContinental Hotels Group PLC, 3.75%, 8/14/2025 | | GBP | 510,000 | | | $ | 706,165 | |
| | |
| Health Maintenance Organizations - 0.1% | | | | | | | | |
| Halfmoon Parent, Inc., 4.125%, 11/15/2025 (n) | | $ | 1,074,000 | | | $ | 1,110,112 | |
| | |
| Industrial - 0.1% | | | | | | | | |
| Grainger PLC, 3.375%, 4/24/2028 | | GBP | 600,000 | | | $ | 788,549 | |
| Investor AB, 1.5%, 9/12/2030 | | EUR | 550,000 | | | | 645,527 | |
| | | | | | | | |
| | | | | | | $ | 1,434,076 | |
| Insurance - 0.1% | | | | | | | | |
| American International Group, Inc., 1.875%, 6/21/2027 | | EUR | 850,000 | | | $ | 978,396 | |
| Argentum Netherlands BV for Zurich Insurance Co. Ltd., 3.5% to 10/01/2026, FLR (EURIBOR - 3mo. + 3.95%) to 10/01/2046 | | | 700,000 | | | | 875,332 | |
| NN Group N.V., 4.625% to 4/08/2024, FLR (EURIBOR - 3mo. + 3.95%) to 4/08/2044 | | | 700,000 | | | | 876,590 | |
| | | | | | | | |
| | | | | | | $ | 2,730,318 | |
| Insurance - Property & Casualty - 0.3% | | | | | | | | |
| Berkshire Hathaway, Inc., 2.75%, 3/15/2023 | | $ | 694,000 | | | $ | 695,864 | |
| Berkshire Hathaway, Inc., 4.5%, 2/11/2043 | | | 475,000 | | | | 518,013 | |
| Chubb INA Holdings, Inc., 2.5%, 3/15/2038 | | EUR | 618,000 | | | | 744,237 | |
| Hiscox Ltd., 6.125% to 11/24/2025, FLR (GBP LIBOR - 3mo. + 5.076%) to 11/24/2045 | | GBP | 650,000 | | | | 939,776 | |
| Marsh & McLennan Cos., Inc., 1.349%, 9/21/2026 | | EUR | 100,000 | | | | 114,302 | |
| Marsh & McLennan Cos., Inc., 1.979%, 3/21/2030 | | | 120,000 | | | | 139,252 | |
| Marsh & McLennan Cos., Inc., 4.35%, 1/30/2047 | | $ | 532,000 | | | | 540,341 | |
| QBE Capital Funding IV LP, 7.5% to 5/24/2021, FLR (GBP | | | | | | | | |
| Swap Rate - 10yr. + 4.003%) to 5/24/2041 | | GBP | 300,000 | | | | 415,040 | |
| QBE Insurance Group Ltd., 6.115%, 5/24/2042 | | | 100,000 | | | | 141,196 | |
| XLIT Ltd., 3.25% to 6/29/2027, FLR (EURIBOR - 3mo. + 2.9%) to 6/29/2047 | | EUR | 1,120,000 | | | | 1,325,911 | |
| | | | | | | | |
| | | | | | | $ | 5,573,932 | |
| International Market Quasi-Sovereign - 0.6% | | | | | | | | |
| BNG Bank N.V., 0.75%, 1/11/2028 | | EUR | 4,109,000 | | | $ | 4,765,367 | |
| Electricite de France S.A., 5.875%, 1/22/2029 | | GBP | 600,000 | | | | 808,141 | |
18
Portfolio of Investments (unaudited) – continued
| | | | | | | | |
| | |
| Issuer | | Shares/Par | | | Value ($) | |
| Bonds - continued | | | | | | | | |
| International Market Quasi-Sovereign - continued | | | | | |
| Islandsbanki, 1.125%, 1/19/2024 | | EUR | 950,000 | | | $ | 1,054,042 | |
| KFW Government Development Banks, 4%, 2/27/2025 | | AUD | 300,000 | | | | 234,864 | |
| KFW Government Development Banks, 1.125%, 6/15/2037 | | EUR | 1,910,000 | | | | 2,240,080 | |
| Temasek Financial I Ltd., 2.375%, 1/23/2023 (n) | | $ | 1,450,000 | | | | 1,432,083 | |
| | | | | | | | |
| | | | | | | $ | 10,534,577 | |
| International Market Sovereign - 10.6% | | | | | | | | |
| Commonwealth of Australia, 2.75%, 11/21/2027 | | AUD | 3,605,000 | | | $ | 2,747,570 | |
| Commonwealth of Australia, 2.75%, 6/21/2035 | | | 20,040,000 | | | | 15,409,947 | |
| Federal Republic of Germany, 0.25%, 8/15/2028 | | EUR | 5,525,000 | | | | 6,362,345 | |
| Federal Republic of Germany, 2.5%, 7/04/2044 | | | 5,160,000 | | | | 8,381,393 | |
| Federal Republic of Germany, 2.5%, 8/15/2046 | | | 4,115,000 | | | | 6,792,423 | |
| Government of Canada, 1.5%, 6/01/2026 | | CAD | 30,343,000 | | | | 22,421,930 | |
| Government of Canada, 5%, 6/01/2037 | | | 1,890,000 | | | | 2,060,956 | |
| Government of Japan, 1.7%, 9/20/2032 | | JPY | 1,268,550,000 | | | | 13,797,410 | |
| Government of Japan, 2.4%, 3/20/2037 | | | 1,088,850,000 | | | | 13,352,305 | |
| Government of Japan, 0.5%, 6/20/2038 | | | 3,008,400,000 | | | | 27,763,053 | |
| Kingdom of Belgium, 1.6%, 6/22/2047 | | EUR | 2,980,000 | | | | 3,482,065 | |
| Kingdom of Spain, 2.15%, 10/31/2025 | | | 11,630,000 | | | | 14,501,089 | |
| Kingdom of Spain, 5.15%, 10/31/2028 | | | 10,489,000 | | | | 16,302,014 | |
| Kingdom of Spain, 5.15%, 10/31/2044 | | | 1,280,000 | | | | 2,331,957 | |
| Republic of Italy, 1.65%, 3/01/2032 | | | 2,444,000 | | | | 2,436,123 | |
| Republic of Italy, 4%, 2/01/2037 | | | 2,980,000 | | | | 3,765,278 | |
| Republic of Italy, 3.85%, 9/01/2049 | | | 2,260,000 | | | | 2,695,275 | |
| Republic of Portugal, 2.25%, 4/18/2034 | | | 12,648,000 | | | | 15,389,266 | |
| Republic of Portugal, 4.1%, 4/15/2037 | | | 1,510,000 | | | | 2,263,010 | |
| United Kingdom Treasury, 4.25%, 6/07/2032 | | GBP | 3,870,000 | | | | 6,774,385 | |
| United Kingdom Treasury, 3.25%, 1/22/2044 | | | 1,284,000 | | | | 2,197,455 | |
| United Kingdom Treasury, 3.75%, 7/22/2052 | | | 2,305,000 | | | | 4,633,498 | |
| United Kingdom Treasury, 4%, 1/22/2060 | | | 700,000 | | | | 1,569,687 | |
| | | | | | | | |
| | | | | | | $ | 197,430,434 | |
| Local Authorities - 0.1% | | | | | | | | |
| Province of Alberta, 4.5%, 12/01/2040 | | CAD | 710,000 | | | $ | 667,963 | |
| Province of British Columbia, 2.3%, 6/18/2026 | | | 1,895,000 | | | | 1,424,185 | |
| | | | | | | | |
| | | | | | | $ | 2,092,148 | |
| Machinery & Tools - 0.1% | | | | | | | | |
| CNH Industrial Finance Europe S.A., 1.75%, 3/25/2027 | | EUR | 150,000 | | | $ | 170,664 | |
| CNH Industrial Finance S.p.A., 1.875%, 1/19/2026 | | | 1,000,000 | | | | 1,164,544 | |
| | | | | | | | |
| | | | | | | $ | 1,335,208 | |
19
Portfolio of Investments (unaudited) – continued
| | | | | | | | |
| | |
| Issuer | | Shares/Par | | | Value ($) | |
| Bonds - continued | | | | | | | | |
| Major Banks - 1.6% | | | | | | | | |
| ABN AMRO Bank N.V., 2.875%, 1/18/2028 | | EUR | 500,000 | | | $ | 601,705 | |
| Bank of America Corp., 3.366% to 1/23/2025, FLR (LIBOR - 3mo. + 0.81%) to 1/23/2026 | | $ | 1,749,000 | | | | 1,750,481 | |
| Bank of America Corp., 3.5%, 4/19/2026 | | | 1,418,000 | | | | 1,430,851 | |
| Bank of America Corp., 3.248%, 10/21/2027 | | | 2,844,000 | | | | 2,789,269 | |
| Bank of New York Mellon Corp., 2.95%, 1/29/2023 | | | 2,800,000 | | | | 2,810,913 | |
| Barclays PLC, 3.125%, 1/17/2024 | | GBP | 750,000 | | | | 1,000,941 | |
| Credit Agricole S.A., 0.75%, 12/05/2023 | | EUR | 700,000 | | | | 802,870 | |
| Credit Suisse Group AG, 1.25% to 7/17/2024, FLR (EUR Swap Rate - 1yr. + 0.75%) to 7/17/2025 | | | 850,000 | | | | 975,859 | |
| Credit Suisse Group AG, 3.869%, 1/12/2029 (n) | | $ | 1,500,000 | | | | 1,487,165 | |
| HSBC Holdings PLC, 4.375%, 11/23/2026 | | | 1,075,000 | | | | 1,105,365 | |
| JPMorgan Chase & Co., 4.5%, 1/24/2022 | | | 1,532,000 | | | | 1,598,228 | |
| JPMorgan Chase & Co., 2.95%, 10/01/2026 | | | 1,811,000 | | | | 1,772,358 | |
| JPMorgan Chase & Co., 3.54%, 5/01/2028 | | | 1,187,000 | | | | 1,185,370 | |
| Morgan Stanley, 5.5%, 7/28/2021 | | | 490,000 | | | | 517,238 | |
| Morgan Stanley, 3.125%, 1/23/2023 | | | 1,982,000 | | | | 1,989,734 | |
| Morgan Stanley, 3.95%, 4/23/2027 | | | 1,588,000 | | | | 1,603,519 | |
| Nationwide Building Society, 1.5%, 3/08/2026 | | EUR | 400,000 | | | | 455,805 | |
| Royal Bank of Scotland Group PLC, 3.875%, 9/12/2023 | | $ | 920,000 | | | | 928,408 | |
| Royal Bank of Scotland Group PLC, 4.269% to 3/22/2024, FLR (LIBOR - 3mo. + 1.762%) to 3/22/2025 | | | 708,000 | | | | 721,803 | |
| Sumitomo Mitsui Financial Group, Inc., 3.544%, 1/17/2028 | | | 996,000 | | | | 1,012,067 | |
| Svenska Handelsbanken AB, 5.25%, 3/01/2021 | | | 1,291,000 | | | | 1,289,386 | |
| UBS Group Funding (Jersey) Ltd., 1.5%, 11/30/2024 | | EUR | 800,000 | | | | 934,365 | |
| Wells Fargo & Co., 4.15%, 1/24/2029 | | $ | 852,000 | | | | 885,999 | |
| | | | | | | | |
| | | | | | | $ | 29,649,699 | |
| Medical & Health Technology & Services - 0.3% | | | | | | | | |
| Becton, Dickinson and Co., 1.401%, 5/24/2023 | | EUR | 900,000 | | | $ | 1,042,154 | |
| Laboratory Corp. of America Holdings, 3.2%, 2/01/2022 | | $ | 1,034,000 | | | | 1,039,411 | |
| Laboratory Corp. of America Holdings, 4.7%, 2/01/2045 | | | 642,000 | | | | 625,005 | |
| Northwell Healthcare, Inc., 4.26%, 11/01/2047 | | | 667,000 | | | | 667,628 | |
| Thermo Fisher Scientific, Inc., 3%, 4/15/2023 | | | 1,872,000 | | | | 1,875,177 | |
| Thermo Fisher Scientific, Inc., 2.95%, 9/19/2026 | | | 617,000 | | | | 598,914 | |
| Thermo Fisher Scientific, Inc., 3.2%, 8/15/2027 | | | 395,000 | | | | 387,113 | |
| | | | | | | | |
| | | | | | | $ | 6,235,402 | |
| Medical Equipment - 0.1% | | | | | | | | |
| Abbott Laboratories, 4.9%, 11/30/2046 | | $ | 1,237,000 | | | $ | 1,410,120 | |
| Medtronic Global Holdings S.C.A., 1.125%, 3/07/2027 | | EUR | 190,000 | | | | 219,303 | |
| | | | | | | | |
| | | | | | | $ | 1,629,423 | |
20
Portfolio of Investments (unaudited) – continued
| | | | | | | | |
| | |
| Issuer | | Shares/Par | | | Value ($) | |
| Bonds - continued | | | | | | | | |
| Midstream - 0.3% | | | | | | | | |
| APT Pipelines Ltd., 5%, 3/23/2035 (n) | | $ | 685,000 | | | $ | 701,530 | |
| MPLX LP, 4.5%, 4/15/2038 | | | 833,000 | | | | 798,910 | |
| ONEOK, Inc., 4.95%, 7/13/2047 | | | 1,972,000 | | | | 1,968,308 | |
| Sabine Pass Liquefaction LLC, 4.2%, 3/15/2028 | | | 1,376,000 | | | | 1,393,766 | |
| | | | | | | | |
| | | | | | | $ | 4,862,514 | |
| Mortgage-Backed - 2.6% | | | | | | | | |
| Fannie Mae, 4.5%, 3/01/2025 - 2/01/2046 | | $ | 9,528,863 | | | $ | 10,092,339 | |
| Fannie Mae, 5.5%, 1/01/2037 | | | 30,214 | | | | 33,181 | |
| Fannie Mae, 6%, 9/01/2037 - 6/01/2038 | | | 303,288 | | | | 337,691 | |
| Fannie Mae, 5%, 4/01/2040 - 8/01/2040 | | | 2,161,275 | | | | 2,324,725 | |
| Fannie Mae, 4%, 11/01/2040 - 2/01/2041 | | | 4,594,204 | | | | 4,755,383 | |
| Fannie Mae, 3.5%, 5/01/2043 - 1/01/2047 | | | 3,774,962 | | | | 3,841,512 | |
| Freddie Mac, 3.224%, 3/25/2027 | | | 4,500,000 | | | | 4,599,465 | |
| Freddie Mac, 3.117%, 6/25/2027 | | | 1,483,189 | | | | 1,503,739 | |
| Freddie Mac, 3.194%, 7/25/2027 | | | 3,914,000 | | | | 3,989,346 | |
| Freddie Mac, 3.187%, 9/25/2027 | | | 1,792,000 | | | | 1,825,414 | |
| Freddie Mac, 3.286%, 11/25/2027 | | | 2,576,000 | | | | 2,640,924 | |
| Freddie Mac, 3.35%, 1/25/2028 | | | 2,733,000 | | | | 2,813,007 | |
| Freddie Mac, 5.5%, 7/01/2037 | | | 61,503 | | | | 67,490 | |
| Freddie Mac, 4.5%, 12/01/2039 - 5/01/2042 | | | 2,839,188 | | | | 3,019,407 | |
| Freddie Mac, 5%, 7/01/2041 | | | 1,405,087 | | | | 1,512,774 | |
| Freddie Mac, 3.5%, 1/01/2047 | | | 2,512,626 | | | | 2,543,961 | |
| Ginnie Mae, 5%, 5/15/2040 | | | 474,922 | | | | 508,996 | |
| Ginnie Mae, 3.5%, 6/20/2043 | | | 1,341,342 | | | | 1,368,392 | |
| | | | | | | | |
| | | | | | | $ | 47,777,746 | |
| Municipals - 0.1% | | | | | | | | |
| Commonwealth of Puerto Rico, Public Improvement,“C-7”, NATL, 6%, 7/01/2027 | | $ | 100,000 | | | $ | 102,313 | |
| Oklahoma Development Finance Authority, Health System Rev. (OU Medicine Project), “C”, AGM, 4.65%, 8/15/2030 | | | 992,000 | | | | 1,059,872 | |
| Puerto Rico Electric Power Authority Rev., “PP”, NATL, 5%, 7/01/2022 | | | 425,000 | | | | 430,232 | |
| | | | | | | | |
| | | | | | | $ | 1,592,417 | |
| Natural Gas - Distribution - 0.1% | | | | | | | | |
| Boston Gas Co., 3.15%, 8/01/2027 (n) | | $ | 1,037,000 | | | $ | 1,016,501 | |
| GNL Quintero S.A., 4.634%, 7/31/2029 (n) | | | 1,440,000 | | | | 1,486,800 | |
| | | | | | | | |
| | | | | | | $ | 2,503,301 | |
| Network & Telecom - 0.3% | | | | | | | | |
| AT&T, Inc., 4.75%, 5/15/2046 | | $ | 983,000 | | | $ | 976,009 | |
| British Telecommunications PLC, 3.125%, 11/21/2031 | | GBP | 400,000 | | | | 533,233 | |
21
Portfolio of Investments (unaudited) – continued
| | | | | | | | |
| | |
| Issuer | | Shares/Par | | | Value ($) | |
| Bonds - continued | | | | | | | | |
| Network & Telecom - continued | | | | | |
| Empresa Nacional de Telecomunicaciones S.A., 4.75%, 8/01/2026 (n) | | $ | 3,399,000 | | | $ | 3,424,794 | |
| | | | | | | | |
| | | | | | | $ | 4,934,036 | |
| Oils - 0.2% | | | | | | | | |
| Marathon Petroleum Corp., 3.4%, 12/15/2020 | | $ | 524,000 | | | $ | 528,192 | |
| Marathon Petroleum Corp., 3.625%, 9/15/2024 | | | 1,138,000 | | | | 1,150,879 | |
| Neste Oyj, 1.5%, 6/07/2024 | | EUR | 1,100,000 | | | | 1,268,647 | |
| Phillips 66, 4.875%, 11/15/2044 | | $ | 750,000 | | | | 805,507 | |
| | | | | | | | |
| | | | | | | $ | 3,753,225 | |
| Other Banks & Diversified Financials - 0.6% | | | | | | | | |
| Belfius Bank S.A., 3.125%, 5/11/2026 | | EUR | 600,000 | | | $ | 733,362 | |
| BPCE S.A., 0.625%, 9/26/2023 | | | 600,000 | | | | 683,016 | |
| BPCE S.A., 5.25%, 4/16/2029 | | GBP | 700,000 | | | | 1,070,973 | |
| Citizens Financial Group, Inc., 2.375%, 7/28/2021 | | $ | 1,005,000 | | | | 992,701 | |
| Cooperatieve Rabobank U.A., 1.125%, 5/07/2031 | | EUR | 300,000 | | | | 332,090 | |
| Deutsche Bank AG, 1.875%, 2/28/2020 | | GBP | 800,000 | | | | 1,040,592 | |
| Groupe BPCE S.A., 4.5%, 3/15/2025 (n) | | $ | 300,000 | | | | 306,441 | |
| Intesa Sanpaolo S.p.A., 5.25%, 1/28/2022 | | GBP | 550,000 | | | | 767,661 | |
| KBC Group N.V., 0.875%, 6/27/2023 | | EUR | 700,000 | | | | 805,229 | |
| Macquarie Group Ltd., 1.25%, 3/05/2025 | | | 700,000 | | | | 793,215 | |
| UBS AG, 5.125%, 5/15/2024 | | $ | 1,730,000 | | | | 1,810,109 | |
| UniCredit S.p.A., 1%, 1/18/2023 | | EUR | 1,200,000 | | | | 1,319,467 | |
| UniCredito Italiano S.p.A., 6.572%, 1/14/2022 (n) | | $ | 742,000 | | | | 781,926 | |
| United Overseas Bank Ltd., 3.75% to 4/15/2024, FLR(CMT - 5yr. + 1.5%) to 4/15/2029 (n) | | | 449,000 | | | | 455,516 | |
| | | | | | | | |
| | | | | | | $ | 11,892,298 | |
| Pharmaceuticals - 0.2% | | | | | | | | |
| Allergan Funding SCS, 2.625%, 11/15/2028 | | EUR | 710,000 | | | $ | 856,821 | |
| Bayer Capital Corp. B.V., 1.5%, 6/26/2026 | | | 800,000 | | | | 922,887 | |
| Takeda Pharmaceutical Co. Ltd., 2.25%, 11/21/2026 (z) | | | 900,000 | | | | 1,099,860 | |
| | | | | | | | |
| | | | | | | $ | 2,879,568 | |
| Pollution Control - 0.1% | | | | | | | | |
| Republic Services, Inc., 3.95%, 5/15/2028 | | $ | 1,249,000 | | | $ | 1,304,038 | |
| | |
| Real Estate - Apartment - 0.1% | | | | | | | | |
| Grand City Properties S.A., 1.375%, 8/03/2026 | | EUR | 1,100,000 | | | $ | 1,240,635 | |
| | |
| Real Estate - Office - 0.1% | | | | | | | | |
| Boston Properties, Inc., REIT, 3.125%, 9/01/2023 | | $ | 669,000 | | | $ | 674,708 | |
| Merlin Properties SOCIMI S.A., REIT, 1.875%, 11/02/2026 | | EUR | 1,256,000 | | | | 1,440,999 | |
| | | | | | | | |
| | | | | | | $ | 2,115,707 | |
22
Portfolio of Investments (unaudited) – continued
| | | | | | | | |
| | |
| Issuer | | Shares/Par | | | Value ($) | |
| Bonds - continued | | | | | | | | |
| Retailers - 0.2% | | | | | | | | |
| AA Bond Co. Ltd., 2.875%, 1/31/2022 | | GBP | 375,000 | | | $ | 475,049 | |
| AA Bond Co. Ltd., 2.75%, 7/31/2023 | | | 375,000 | | | | 455,922 | |
| Best Buy Co., Inc., 4.45%, 10/01/2028 | | $ | 1,000,000 | | | | 1,019,859 | |
| Home Depot, Inc., 2.625%, 6/01/2022 | | | 1,400,000 | | | | 1,403,129 | |
| Home Depot, Inc., 4.875%, 2/15/2044 | | | 500,000 | | | | 571,704 | |
| | | | | | | | |
| | | | | | | $ | 3,925,663 | |
| Specialty Stores - 0.1% | | | | | | | | |
| Richemont International S.A., 1.5%, 3/26/2030 | | EUR | 850,000 | | | $ | 1,010,276 | |
| | |
| Supermarkets - 0.0% | | | | | | | | |
| Loblaw Cos. Ltd., 4.86%, 9/12/2023 | | CAD | 725,000 | | | $ | 588,350 | |
| | |
| Supranational - 0.5% | | | | | | | | |
| European Stability Mechanism, 0.75%, 3/15/2027 | | EUR | 7,310,000 | | | $ | 8,578,832 | |
| International Bank for Reconstruction and Development, 2.8%, 1/13/2021 | | AUD | 600,000 | | | | 430,990 | |
| International Bank for Reconstruction and Development, 4.25%, 6/24/2025 | | | 440,000 | | | | 350,348 | |
| International Finance Corp., 3.25%, 7/22/2019 | | | 635,000 | | | | 449,207 | |
| | | | | | | | |
| | | | | | | $ | 9,809,377 | |
| Telecommunications - Wireless - 0.3% | | | | | | | | |
| American Tower Corp., REIT, 3.5%, 1/31/2023 | | $ | 502,000 | | | $ | 509,720 | |
| American Tower Corp., REIT, 4%, 6/01/2025 | | | 1,250,000 | | | | 1,291,561 | |
| Crown Castle International Corp., 2.25%, 9/01/2021 | | | 1,466,000 | | | | 1,445,991 | |
| Crown Castle International Corp., 3.7%, 6/15/2026 | | | 515,000 | | | | 516,345 | |
| SBA Tower Trust, 2.898%, 10/15/2044 (n) | | | 588,000 | | | | 587,412 | |
| Tele2 AB, 2.125%, 5/15/2028 | | EUR | 1,350,000 | | | | 1,583,848 | |
| | | | | | | | |
| | | | | | | $ | 5,934,877 | |
| Telephone Services - 0.0% | | | | | | | | |
| TELUS Corp., 5.05%, 7/23/2020 | | CAD | 734,000 | | | $ | 565,991 | |
| | |
| Tobacco - 0.1% | | | | | | | | |
| Altria Group, Inc., 1.7%, 6/15/2025 | | EUR | 430,000 | | | $ | 492,207 | |
| Altria Group, Inc., 3.125%, 6/15/2031 | | | 500,000 | | | | 587,880 | |
| Imperial Brands Finance PLC, 1.375%, 1/27/2025 | | | 550,000 | | | | 627,669 | |
| | | | | | | | |
| | | | | | | $ | 1,707,756 | |
| Transportation - Services - 0.2% | | | | | | | | |
| Autostrade per l’Italia S.p.A., 6.25%, 6/09/2022 | | GBP | 625,000 | | | $ | 896,244 | |
| ERAC USA Finance LLC, 7%, 10/15/2037 (n) | | $ | 627,000 | | | | 818,266 | |
| Heathrow Funding Ltd., 1.875%, 7/12/2032 | | EUR | 700,000 | | | | 829,216 | |
23
Portfolio of Investments (unaudited) – continued
| | | | | | | | |
| | |
| Issuer | | Shares/Par | | | Value ($) | |
| Bonds - continued | | | | | | | | |
| Transportation - Services - continued | | | | | |
| Heathrow Funding Ltd., 4.625%, 10/31/2046 | | GBP | 375,000 | | | $ | 637,436 | |
| Transurban Finance Co., 1.75%, 3/29/2028 | | EUR | 1,050,000 | | | | 1,228,676 | |
| | | | | | | | |
| | | | | | | $ | 4,409,838 | |
| U.S. Government Agencies and Equivalents - 0.0% | | | | | |
| Small Business Administration, 5.09%, 10/01/2025 | | $ | 13,902 | | | $ | 14,402 | |
| Small Business Administration, 5.21%, 1/01/2026 | | | 192,821 | | | | 200,373 | |
| Small Business Administration, 5.31%, 5/01/2027 | | | 120,741 | | | | 126,553 | |
| Small Business Administration, 2.22%, 3/01/2033 | | | 654,645 | | | | 631,920 | |
| | | | | | | | |
| | | | | | | $ | 973,248 | |
| U.S. Treasury Obligations - 6.7% | | | | | | | | |
| U.S. Treasury Bonds, 3.5%, 2/15/2039 | | $ | 17,940,000 | | | $ | 19,981,376 | |
| U.S. Treasury Bonds, 3.125%, 2/15/2043 | | | 10,730,000 | | | | 11,145,787 | |
| U.S. Treasury Bonds, 3%, 5/15/2047 | | | 5,379,000 | | | | 5,448,549 | |
| U.S. Treasury Bonds, TIPS, 0.25%, 1/15/2025 | | | 816 | | | | 807 | |
| U.S. Treasury Bonds, TIPS, 0.375%, 1/15/2027 | | | 756 | | | | 748 | |
| U.S. Treasury Notes, 2%, 11/15/2026 | | | 34,140,000 | | | | 33,138,471 | |
| U.S. Treasury Notes, 2.25%, 11/15/2027 | | | 11,050,000 | | | | 10,860,941 | |
| U.S. Treasury Notes, 2.75%, 2/15/2028 (f) | | | 29,993,000 | | | | 30,629,180 | |
| U.S. Treasury Notes, 2.875%, 5/15/2028 | | | 13,543,900 | | | | 13,964,502 | |
| | | | | | | | |
| | | | | | | $ | 125,170,361 | |
| Utilities - Electric Power - 1.1% | | | | | | | | |
| Consorcio Transmantaro S.A., 4.7%, 4/16/2034 (n) | | $ | 200,000 | | | $ | 204,250 | |
| Duke Energy Corp., 2.65%, 9/01/2026 | | | 1,361,000 | | | | 1,301,045 | |
| Duke Energy Florida LLC, 3.2%, 1/15/2027 | | | 1,500,000 | | | | 1,505,265 | |
| Emera U.S. Finance LP, 2.7%, 6/15/2021 | | | 339,000 | | | | 336,750 | |
| Emera U.S. Finance LP, 3.55%, 6/15/2026 | | | 387,000 | | | | 382,646 | |
| Enel Finance International N.V., 5.625%, 8/14/2024 | | GBP | 400,000 | | | | 603,884 | |
| Enel Finance International N.V., 1.125%, 9/16/2026 | | EUR | 1,200,000 | | | | 1,363,490 | |
| Enel Finance International N.V., 3.5%, 4/06/2028 (n) | | $ | 875,000 | | | | 824,809 | |
| Enel Finance International N.V., 4.75%, 5/25/2047 (n) | | | 456,000 | | | | 449,579 | |
| Enersis Americas S.A., 4%, 10/25/2026 | | | 3,133,000 | | | | 3,102,453 | |
| Exelon Corp., 3.497%, 6/01/2022 | | | 636,000 | | | | 644,930 | |
| Iberdrola International B.V., 3.25%, 11/12/2024 | | EUR | 900,000 | | | | 1,070,309 | |
| innogy Finance B.V., 1.625%, 5/30/2026 | | | 900,000 | | | | 1,073,197 | |
| innogy Finance B.V., 4.75%, 1/31/2034 | | GBP | 600,000 | | | | 943,424 | |
| LLPL Capital Pte. Ltd., 6.875%, 2/04/2039 (n) | | $ | 652,000 | | | | 703,477 | |
| NextEra Energy Capital Holdings, Inc., 3.55%, 5/01/2027 | | | 1,540,000 | | | | 1,559,211 | |
| PPL Capital Funding, Inc., 5%, 3/15/2044 | | | 331,000 | | | | 354,658 | |
| PPL WEM Holdings PLC, 5.375%, 5/01/2021 (n) | | | 189,000 | | | | 195,082 | |
| Public Service Enterprise Group, 2%, 11/15/2021 | | | 1,750,000 | | | | 1,713,682 | |
24
Portfolio of Investments (unaudited) – continued
| | | | | | | | |
| | |
| Issuer | | Shares/Par | | | Value ($) | |
| Bonds - continued | | | | | | | | |
| Utilities - Electric Power - continued | | | | | |
| Virginia Electric & Power Co., 3.5%, 3/15/2027 | | $ | 2,000,000 | | | $ | 2,043,901 | |
| | | | | | | | |
| | | | | | | $ | 20,376,042 | |
| Total Bonds (Identified Cost, $655,611,557) | | | | | | $ | 666,006,367 | |
| | |
| Preferred Stocks - 0.4% | | | | | | | | |
| Consumer Products - 0.4% | | | | | | | | |
| Henkel AG & Co. KGaA (Identified Cost, $3,745,210) | | | 81,092 | | | $ | 8,207,579 | |
| | |
| Convertible Preferred Stocks - 0.2% | | | | | | | | |
| Medical Equipment - 0.0% | | | | | | | | |
| Danaher Corp., 4.75% | | | 499 | | | $ | 525,697 | |
| | |
| Utilities - Electric Power - 0.2% | | | | | | | | |
| CenterPoint Energy, Inc., 7% | | | 39,539 | | | $ | 2,105,056 | |
| NextEra Energy, Inc., 6.123% | | | 15,054 | | | | 939,370 | |
| | | | | | | | |
| | | | | | | $ | 3,044,426 | |
Total Convertible Preferred Stocks
(Identified Cost, $3,369,096) | | | | | | $ | 3,570,123 | |
| | |
| Investment Companies (h) - 3.1% | | | | | | | | |
| Money Market Funds - 3.1% | | | | | | | | |
| MFS Institutional Money Market Portfolio, 2.48% (v) (Identified Cost, $56,871,051) | | | 56,877,329 | | | $ | 56,877,329 | |
| | |
| Collateral for Securities Loaned - 0.6% | | | | | | | | |
| JPMorgan U.S. Government Money Market Fund, 2.36% (j) (Identified Cost, $10,571,552) | | | 10,571,552 | | | $ | 10,571,552 | |
| | |
| Other Assets, Less Liabilities - (0.2)% | | | | | | | (3,285,078 | ) |
| Net Assets - 100.0% | | | | | | $ | 1,857,914,026 | |
| (a) | Non-income producing security. |
| (f) | All or a portion of the security has been segregated as collateral for open futures contracts. |
| (h) | An affiliated issuer, which may be considered one in which the fund owns 5% or more of the outstanding voting securities, or a company which is under common control. At period end, the aggregate values of the fund’s investments in affiliated issuers and in unaffiliated issuers were $56,877,329 and $1,804,321,775, respectively. |
| (j) | The rate quoted is the annualizedseven-day yield of the fund at period end. |
| (l) | A portion of this security is on loan. See Note 2 for additional information. |
| (n) | Securities exempt from registration under Rule 144A of the Securities Act of 1933. These securities may be sold in the ordinary course of business in transactions exempt from registration, normally to qualified institutional buyers. At period end, the aggregate value of these securities was $61,614,190, representing 3.3% of net assets. |
25
Portfolio of Investments (unaudited) – continued
| (v) | Affiliated issuer that is available only to investment companies managed by MFS. The rate quoted for the MFS Institutional Money Market Portfolio is the annualizedseven-day yield of the fund at period end. |
| (z) | Restricted securities are not registered under the Securities Act of 1933 and are subject to legal restrictions on resale. These securities generally may be resold in transactions exempt from registration or to the public if the securities are subsequently registered. Disposal of these securities may involve time-consuming negotiations and prompt sale at an acceptable price may be difficult. The fund holds the following restricted securities: |
| | | | | | | | | | |
| Restricted Securities | | Acquisition
Date | | Cost | | | Value | |
| Avolon Holdings Funding Ltd., 4.375%, 5/01/2026 | | 4/11/19 | | | $584,226 | | | | $583,519 | |
| Chesapeake Funding II LLC,2016-2A, “A2”, FLR, 3.473% (LIBOR - 1mo. + 1%), 6/15/2028 | | 6/14/16 | | | 346,950 | | | | 347,489 | |
| Dryden Senior Loan Fund,2013-26A, “AR”, CLO, FLR, 3.497% (LIBOR - 3mo. + 0.9%), 4/15/2029 | | 4/09/18 | | | 2,569,000 | | | | 2,544,207 | |
| Takeda Pharmaceutical Co. Ltd., 2.25%, 11/21/2026 | | 11/15/18 | | | 1,018,679 | | | | 1,099,860 | |
| Vinci S.A., 3.75%, 4/10/2029 | | 4/03/19 | | | 1,330,707 | | | | 1,354,765 | |
| Total Restricted Securities | | | | | | | | | $5,929,840 | |
| % of Net assets | | | | | | | | | 0.3% | |
The following abbreviations are used in this report and are defined:
| ADR | | American Depositary Receipt |
| AGM | | Assured Guaranty Municipal |
| CLO | | Collateralized Loan Obligation |
| CMT | | Constant Maturity Treasury |
| EURIBOR | | Euro Interbank Offered Rate |
| FLR | | Floating Rate. Interest rate resets periodically based on the parenthetically disclosed reference rate plus a spread (if any). Theperiod-end rate reported may not be the current rate. All reference rates are USD unless otherwise noted. |
| LIBOR | | London Interbank Offered Rate |
| NATL | | National Public Finance Guarantee Corp. |
| REIT | | Real Estate Investment Trust |
| TIPS | | Treasury Inflation Protected Security |
Abbreviations indicate amounts shown in currencies other than the U.S. dollar. All amounts are stated in U.S. dollars unless otherwise indicated. A list of abbreviations is shown below:
| CNH | | Chinese Yuan Renminbi (Offshore) |
26
Portfolio of Investments (unaudited) – continued
Derivative Contracts at 4/30/19
Forward Foreign Currency Exchange Contracts
| | | | | | | | | | | | | | | | | | |
Currency Purchased | | | Currency Sold | | Counterparty | | Settlement
Date | | | Unrealized
Appreciation
(Depreciation) | |
| Asset Derivatives | | | | | | | | | | | | |
| EUR | | | 100,382 | | | USD | | 112,614 | | Brown Brothers Harriman | | | 7/12/2019 | | | | $688 | |
| EUR | | | 770,387 | | | USD | | 866,048 | | NatWest Markets PLC | | | 7/12/2019 | | | | 3,486 | |
| EUR | | | 1,332,753 | | | USD | | 1,501,820 | | UBS AG | | | 7/12/2019 | | | | 2,457 | |
| GBP | | | 491,140 | | | USD | | 642,254 | | Citibank N.A. | | | 7/12/2019 | | | | 623 | |
| NZD | | | 5,421,000 | | | USD | | 3,615,855 | | JPMorgan Chase Bank N.A. | | | 7/12/2019 | | | | 9,731 | |
| PHP | | | 337,177,000 | | | USD | | 6,411,428 | | JPMorgan Chase Bank N.A. | | | 7/10/2019 | | | | 21,413 | |
| RUB | | | 73,875,000 | | | USD | | 1,115,212 | | JPMorgan Chase Bank N.A. | | | 5/06/2019 | | | | 26,693 | |
| USD | | | 17,945,478 | | | AUD | | 25,108,579 | | Deutsche Bank AG | | | 7/12/2019 | | | | 214,466 | |
| USD | | | 430,425 | | | AUD | | 609,000 | | NatWest Markets PLC | | | 7/12/2019 | | | | 365 | |
| USD | | | 911,612 | | | CAD | | 1,218,000 | | Citibank N.A. | | | 7/12/2019 | | | | 789 | |
| USD | | | 23,287,331 | | | CAD | | 30,933,959 | | Deutsche Bank AG | | | 7/12/2019 | | | | 154,843 | |
| USD | | | 211,548 | | | CHF | | 214,000 | | UBS AG | | | 7/12/2019 | | | | 33 | |
| USD | | | 736,729 | | | EUR | | 646,000 | | Deutsche Bank AG | | | 7/12/2019 | | | | 7,590 | |
| USD | | | 460,251 | | | EUR | | 405,028 | | Merrill Lynch International | | | 7/12/2019 | | | | 3,097 | |
| USD | | | 340,137 | | | EUR | | 299,214 | | NatWest Markets PLC | | | 7/12/2019 | | | | 2,414 | |
| USD | | | 944,624 | | | GBP | | 714,429 | | Citibank N.A. | | | 7/12/2019 | | | | 9,472 | |
| USD | | | 832,743 | | | GBP | | 635,861 | | Merrill Lynch International | | | 7/12/2019 | | | | 434 | |
| USD | | | 88,498 | | | NOK | | 761,000 | | Citibank N.A. | | | 7/12/2019 | | | | 42 | |
| USD | | | 6,590,219 | | | NZD | | 9,756,422 | | Deutsche Bank AG | | | 7/12/2019 | | | | 65,086 | |
| USD | | | 1,145,171 | | | RUB | | 73,875,000 | | JPMorgan Chase Bank N.A. | | | 5/06/2019 | | | | 3,266 | |
| USD | | | 13,254 | | | SEK | | 125,000 | | NatWest Markets PLC | | | 7/12/2019 | | | | 15 | |
| USD | | | 697,527 | | | THB | | 22,000,000 | | JPMorgan Chase Bank N.A. | | | 5/13/2019 | | | | 8,409 | |
| USD | | | 21,512 | | | ZAR | | 305,067 | | JPMorgan Chase Bank N.A. | | | 7/12/2019 | | | | 370 | |
| | | | | | | | | | | | | | | | | | |
| | | | | | | | | | | | | | | | | $535,782 | |
| | | | | | | | | | | | | | | | | | |
27
Portfolio of Investments (unaudited) – continued
Forward Foreign Currency Exchange Contracts - continued
| | | | | | | | | | | | | | | | | | |
Currency Purchased | | | Currency Sold | | Counterparty | | Settlement
Date | | | Unrealized
Appreciation
(Depreciation) | |
| Liability Derivatives | | | | | | | | | | |
| AUD | | | 15,319,000 | | | USD | | 11,013,874 | | JPMorgan Chase Bank N.A. | | | 7/12/2019 | | | | $(196,003 | ) |
| AUD | | | 6,594,054 | | | USD | | 4,740,156 | | UBS AG | | | 7/12/2019 | | | | (83,610 | ) |
| CHF | | | 4,480,000 | | | USD | | 4,510,504 | | BNP Paribas S.A. | | | 7/12/2019 | | | | (82,539 | ) |
| CNH | | | 31,886,000 | | | USD | | 4,741,624 | | JPMorgan Chase Bank N.A. | | | 10/15/2019 | | | | (10,851 | ) |
| CZK | | | 12,895,000 | | | USD | | 568,099 | | JPMorgan Chase Bank N.A. | | | 7/12/2019 | | | | (2,742 | ) |
| DKK | | | 13,065,598 | | | USD | | 1,987,910 | | UBS AG | | | 7/12/2019 | | | | (11,917 | ) |
| EUR | | | 1,532,093 | | | USD | | 1,735,705 | | Deutsche Bank AG | | | 7/12/2019 | | | | (6,434 | ) |
| EUR | | | 9,824,382 | | | USD | | 11,160,891 | | Merrill Lynch International | | | 7/12/2019 | | | | (72,126 | ) |
| EUR | | | 1,032,015 | | | USD | | 1,171,422 | | NatWest Markets PLC | | | 7/12/2019 | | | | (6,588 | ) |
| EUR | | | 1,325,188 | | | USD | | 1,508,030 | | UBS AG | | | 7/12/2019 | | | | (12,293 | ) |
| GBP | | | 5,490,020 | | | USD | | 7,204,746 | | Deutsche Bank AG | | | 7/12/2019 | | | | (18,588 | ) |
| ILS | | | 2,402,000 | | | USD | | 675,502 | | Goldman Sachs International | | | 7/12/2019 | | | | (4,668 | ) |
| JPY | | | 7,873,027,038 | | | USD | | 71,375,328 | | HSBC Bank | | | 7/12/2019 | | | | (282,351 | ) |
| KRW | | | 5,363,620,000 | | | USD | | 4,776,664 | | Barclays Bank PLC | | | 7/10/2019 | | | | (172,892 | ) |
| KRW | | | 5,268,980,000 | | | USD | | 4,692,715 | | JPMorgan Chase Bank N.A. | | | 7/10/2019 | | | | (170,175 | ) |
| MXN | | | 45,128,885 | | | USD | | 2,363,105 | | JPMorgan Chase Bank N.A. | | | 7/12/2019 | | | | (10,512 | ) |
| NOK | | | 132,847,495 | | | USD | | 15,614,458 | | Goldman Sachs International | | | 7/12/2019 | | | | (172,600 | ) |
| NOK | | | 31,049,000 | | | USD | | 3,668,977 | | JPMorgan Chase Bank N.A. | | | 7/12/2019 | | | | (59,919 | ) |
| PLN | | | 5,974,803 | | | USD | | 1,576,784 | | Merrill Lynch International | | | 7/12/2019 | | | | (9,846 | ) |
| RUB | | | 73,875,000 | | | USD | | 1,140,706 | | JPMorgan Chase Bank N.A. | | | 6/03/2019 | | | | (3,573 | ) |
| SEK | | | 30,713,844 | | | USD | | 3,345,895 | | JPMorgan Chase Bank N.A. | | | 7/12/2019 | | | | (92,941 | ) |
| SGD | | | 2,292,000 | | | USD | | 1,697,602 | | JPMorgan Chase Bank N.A. | | | 7/12/2019 | | | | (10,336 | ) |
| THB | | | 93,457,750 | | | USD | | 2,977,784 | | JPMorgan Chase Bank N.A. | | | 5/13/2019 | | | | (50,358 | ) |
| USD | | | 3,685,825 | | | AUD | | 5,228,000 | | Goldman Sachs International | | | 7/12/2019 | | | | (6,049 | ) |
| USD | | | 3,532,140 | | | AUD | | 5,010,000 | | JPMorgan Chase Bank N.A. | | | 7/12/2019 | | | | (5,789 | ) |
| USD | | | 1,085,810 | | | AUD | | 1,538,786 | | UBS AG | | | 7/12/2019 | | | | (839 | ) |
28
Portfolio of Investments (unaudited) – continued
Forward Foreign Currency Exchange Contracts - continued
| | | | | | | | | | | | | | | | | | |
Currency Purchased | | | Currency Sold | | Counterparty | | Settlement
Date | | | Unrealized
Appreciation
(Depreciation) | |
| Liability Derivatives – continued | | | | | | | | |
| USD | | | 4,710,850 | | | EUR | | 4,175,000 | | Citibank N.A. | | | 7/12/2019 | | | | $(1,466 | ) |
| USD | | | 1,445,597 | | | EUR | | 1,289,000 | | Deutsche Bank AG | | | 7/12/2019 | | | | (9,296 | ) |
| USD | | | 342,964 | | | EUR | | 304,813 | | NatWest Markets PLC | | | 7/12/2019 | | | | (1,078 | ) |
| USD | | | 1,088,945 | | | EUR | | 965,181 | | UBS AG | | | 7/12/2019 | | | | (453 | ) |
| USD | | | 283,518 | | | JPY | | 31,401,000 | | UBS AG | | | 7/12/2019 | | | | (32 | ) |
| USD | | | 6,314,176 | | | PHP | | 337,177,000 | | JPMorgan Chase Bank N.A. | | | 7/10/2019 | | | | (118,665 | ) |
| USD | | | 985,112 | | | SEK | | 9,305,000 | | Citibank N.A. | | | 7/12/2019 | | | | (396 | ) |
| USD | | | 2,641,267 | | | SEK | | 24,948,000 | | Goldman Sachs International | | | 7/12/2019 | | | | (1,018 | ) |
| | | | | | | | | | | | | | | | | | |
| | | | | | | | | | | | | | | | | $(1,688,943 | ) |
| | | | | | | | | | | | | | | | | | |
Futures Contracts
| | | | | | | | | | | | | | | | | | | | | | |
| Description | | Long/
Short | | | Currency | | | Contracts | | Notional
Amount | | | Expiration
Date | | | Value/
Unrealized
Appreciation
(Depreciation) | |
| Asset Derivatives | | | | | | | | | | | | | | | | | | | |
| | | | | |
| Interest Rate Futures | | | | | | | | | | | | | | | | | | | |
| U.S. Treasury Note 2 yr | | | Long | | | | USD | | | 100 | | | $21,300,781 | | | | June - 2019 | | | | $59,023 | |
| | | | | | | | | | | | | | | | | | | | | | |
| Liabilitiy Derivatives | | | | | | | | | | | | | | | | | | | |
| | | | | |
| Interest Rate Futures | | | | | | | | | | | | | | | | | | | |
| German Euro-Bobl 5 yr | | | Short | | | | EUR | | | 251 | | | $37,422,664 | | | | June - 2019 | | | | $(253,938 | ) |
| German Euro-Bund 10 yr | | | Short | | | | EUR | | | 73 | | | 13,535,053 | | | | June - 2019 | | | | (198,307 | ) |
| German Euro-Buxl 30 yr | | | Short | | | | EUR | | | 22 | | | 4,657,197 | | | | June - 2019 | | | | (160,932 | ) |
| U.S. Treasury Note 10 yr | | | Short | | | | USD | | | 142 | | | 17,561,406 | | | | June - 2019 | | | | (242,463 | ) |
| U.S. Treasury Note 5 yr | | | Short | | | | USD | | | 240 | | | 27,753,750 | | | | June - 2019 | | | | (178,638 | ) |
| U.S. Treasury Ultra 10 yr | | | Short | | | | USD | | | 354 | | | 46,650,562 | | | | June - 2019 | | | | (409,348 | ) |
| | | | | | | | | | | | | | | | | | | | | | |
| | | | | | | | | | | | | | | | | | | | | $(1,443,626 | ) |
| | | | | | | | | | | | | | | | | | | | | | |
Uncleared Swap Agreements
| | | | | | | | | | | | | | | | | | | | | | | | |
Maturity
Date | | Notional
Amount | | Counterparty | | Cash Flows to
Receive/
Frequency | | Cash Flows to Pay/ Frequency | | Unrealized
Appreciation (Depreciation) | | | Net
Unamortized
Upfront
Payments (Receipts) | | Value | |
| Asset Derivatives | | | | | | | | | | | | | | | | | | | |
| | | | | |
| Credit Default Swaps | | | | | | | | | | | | | | |
| | | | | | | | | |
| 11/22/22 | | EUR | | | 950,000 | | | | | Merrill Lynch International | | 1% | | (1) | | | $0 | | | $8,593 | | | $8,593 | |
| | | | | | | | | | | | | | | | | | | | | | | | |
| (1) | Fund, as protection seller, to pay notional amount upon a defined credit event by a reference obligation specified in LafargeHolcim Ltd., a BBB rated bond. The fund entered into the contract to gain issuer exposure. |
29
Portfolio of Investments (unaudited) – continued
The credit ratings presented here are an indicator of the current payment/performance risk of the related swap agreement, the reference obligation for which may be either a single security or, in the case of a credit default index, a basket of securities issued by corporate or sovereign issuers. Ratings are assigned to each reference security, including each individual security within a reference basket of securities, utilizing ratings from Moody’s, Fitch, and Standard & Poor’s rating agencies and applying the following hierarchy: If all three agencies provide a rating, the middle rating (after dropping the highest and lowest ratings) is assigned; if two of the three agencies rate a security, the lower of the two is assigned. Ratings are shown in the S&P and Fitch scale (e.g., AAA). The ratings for a credit default index are calculated by MFS as a weighted average of the external credit ratings of the individual securities that compose the index’s reference basket of securities.
At April 30, 2019, the fund had cash collateral of $915,000 and other liquid securities with an aggregate value of $1,553,260 to cover any collateral or margin obligations for certain derivative contracts. Restricted cash and/or deposits with brokers in the Statement of Assets and Liabilities are comprised of cash collateral.
See Notes to Financial Statements
30
Financial Statements
STATEMENT OF ASSETS AND LIABILITIES
At 4/30/19 (unaudited)
This statement represents your fund’s balance sheet, which details the assets and liabilities comprising the total value of the fund.
| | | | |
| Assets | | | | |
Investments in unaffiliated issuers, at value, including $39,126,614 of securities on loan (identified cost, $1,446,248,259) | | | $1,804,321,775 | |
Investments in affiliated issuers, at value (identified cost, $56,871,051) | | | 56,877,329 | |
Restricted cash for | | | | |
Forward foreign currency exchange contracts | | | 915,000 | |
Receivables for | | | | |
Forward foreign currency exchange contracts | | | 535,782 | |
Investments sold | | | 6,987,886 | |
Fund shares sold | | | 1,073,439 | |
Interest and dividends | | | 10,305,278 | |
Uncleared swaps, at value (net of unamortized premiums paid, $8,593) | | | 8,593 | |
Receivable from investment adviser | | | 44,091 | |
Other assets | | | 5,759 | |
Total assets | | | $1,881,074,932 | |
| |
| Liabilities | | | | |
Payable to custodian | | | $4,768 | |
Payables for | | | | |
Forward foreign currency exchange contracts | | | 1,688,943 | |
Net daily variation margin on open futures contracts | | | 119,492 | |
Investments purchased | | | 4,954,473 | |
Fund shares reacquired | | | 4,842,423 | |
Collateral for securities loaned, at value (c) | | | 10,571,552 | |
Payable to affiliates | | | | |
Shareholder servicing costs | | | 748,428 | |
Distribution and service fees | | | 25,621 | |
Payable for independent Trustees’ compensation | | | 4,136 | |
Deferred country tax expense payable | | | 84,917 | |
Accrued expenses and other liabilities | | | 116,153 | |
Total liabilities | | | $23,160,906 | |
Net assets | | | $1,857,914,026 | |
| |
| Net assets consist of | | | | |
Paid-in capital | | | $1,500,955,758 | |
Total distributable earnings (loss) | | | 356,958,268 | |
Net assets | | | $1,857,914,026 | |
Shares of beneficial interest outstanding | | | 104,610,259 | |
| (c) | Non-cash collateral is not included. |
31
Statement of Assets and Liabilities (unaudited) – continued
| | | | | | | | | | | | |
| | | |
| | | Net assets | | | Shares
outstanding | | | Net asset value
per share (a) | |
Class A | | | $744,018,525 | | | | 41,737,210 | | | | $17.83 | |
Class B | | | 32,770,302 | | | | 1,802,922 | | | | 18.18 | |
Class C | | | 237,096,400 | | | | 13,237,146 | | | | 17.91 | |
Class I | | | 576,117,022 | | | | 32,661,629 | | | | 17.64 | |
Class R1 | | | 2,454,294 | | | | 137,674 | | | | 17.83 | |
Class R2 | | | 12,159,997 | | | | 689,451 | | | | 17.64 | |
Class R3 | | | 19,201,391 | | | | 1,080,377 | | | | 17.77 | |
Class R4 | | | 7,977,592 | | | | 446,903 | | | | 17.85 | |
Class R6 | | | 226,118,503 | | | | 12,816,947 | | | | 17.64 | |
| (a) | Maximum offering price per share was equal to the net asset value per share for all share classes, except for Class A, for which the maximum offering price per share was $18.92 [100 / 94.25 x $17.83]. On sales of $50,000 or more, the maximum offering price of Class A shares is reduced. A contingent deferred sales charge may be imposed on redemptions of Class A, Class B, and Class C shares. Redemption price per share was equal to the net asset value per share for Classes I, R1, R2, R3, R4, and R6. |
See Notes to Financial Statements
32
Financial Statements
STATEMENT OF OPERATIONS
Six months ended 4/30/19 (unaudited)
This statement describes how much your fund earned in investment income and accrued in expenses. It also describes any gains and/or losses generated by fund operations.
| | | | |
| Net investment income (loss) | | | | |
Income | | | | |
Dividends | | | $19,000,854 | |
Interest | | | 9,593,224 | |
Dividends from affiliated issuers | | | 751,655 | |
Income on securities loaned | | | 62,615 | |
Other | | | 1,906 | |
Foreign taxes withheld | | | (1,137,896 | ) |
Total investment income | | | $28,272,358 | |
Expenses | | | | |
Management fee | | | $7,152,994 | |
Distribution and service fees | | | 2,347,256 | |
Shareholder servicing costs | | | 965,021 | |
Administrative services fee | | | 134,590 | |
Independent Trustees’ compensation | | | 17,503 | |
Custodian fee | | | 133,105 | |
Shareholder communications | | | 66,915 | |
Audit and tax fees | | | 38,240 | |
Legal fees | | | 8,886 | |
Miscellaneous | | | 128,723 | |
Total expenses | | | $10,993,233 | |
Fees paid indirectly | | | (30,168 | ) |
Reduction of expenses by investment adviser and distributor | | | (762,914 | ) |
Net expenses | | | $10,200,151 | |
Net investment income (loss) | | | $18,072,207 | |
| |
| Realized and unrealized gain (loss) | | | | |
Realized gain (loss) (identified cost basis) | | | | |
Unaffiliated issuers (net of $42,682 country tax) | | | $11,731,019 | |
Affiliated issuers | | | (2,065 | ) |
Futures contracts | | | (1,624,082 | ) |
Forward foreign currency exchange contracts | | | (956,096 | ) |
Foreign currency | | | 112,176 | |
Net realized gain (loss) | | | $9,260,952 | |
Change in unrealized appreciation or depreciation | | | | |
Unaffiliated issuers (net of $79,842 decrease in deferred country tax) | | | $95,945,711 | |
Affiliated issuers | | | 3,336 | |
Futures contracts | | | (2,108,608 | ) |
Forward foreign currency exchange contracts | | | 344,652 | |
Translation of assets and liabilities in foreign currencies | | | 11,858 | |
Net unrealized gain (loss) | | | $94,196,949 | |
Net realized and unrealized gain (loss) | | | $103,457,901 | |
Change in net assets from operations | | | $121,530,108 | |
See Notes to Financial Statements
33
Financial Statements
STATEMENTS OF CHANGES IN NET ASSETS
These statements describe the increases and/or decreases in net assets resulting from operations, any distributions, and any shareholder transactions.
| | | | | | | | |
| Change in net assets | | Six months ended
4/30/19
(unaudited) | | | Year ended
10/31/18 | |
| | |
| From operations | | | | | | | | |
Net investment income (loss) | | | $18,072,207 | | | | $33,506,605 | |
Net realized gain (loss) | | | 9,260,952 | | | | 41,808,378 | |
Net unrealized gain (loss) | | | 94,196,949 | | | | (144,950,913 | ) |
Change in net assets from operations | | | $121,530,108 | | | | $(69,635,930 | ) |
Total distributions to shareholders | | | $(42,540,844 | ) | | | $(63,697,258 | ) |
Change in net assets from fund share transactions | | | $(318,033,866 | ) | | | $79,167,312 | |
Total change in net assets | | | $(239,044,602 | ) | | | $(54,165,876 | ) |
| | |
| Net assets | | | | | | | | |
At beginning of period | | | 2,096,958,628 | | | | 2,151,124,504 | |
At end of period | | | $1,857,914,026 | | | | $2,096,958,628 | |
See Notes to Financial Statements
34
Financial Statements
FINANCIAL HIGHLIGHTS
The financial highlights table is intended to help you understand the fund’s financial performance for the semiannual period and the past 5 fiscal years. Certain information reflects financial results for a single fund share. The total returns in the table represent the rate that an investor would have earned (or lost) on an investment in the fund share class (assuming reinvestment of all distributions) held for the entire period.
| | | | | | | | | | | | | | | | | | | | | | | | |
| | | Six months
ended
4/30/19 | | | Year ended | |
| Class A | | 10/31/18 | | | 10/31/17 | | | 10/31/16 | | | 10/31/15 | | | 10/31/14 | |
| | | (unaudited) | | | | | | | | | | | | | | | | |
Net asset value, beginning of period | | | $17.02 | | | | $18.08 | | | | $16.42 | | | | $16.49 | | | | $16.80 | | | | $16.32 | |
| | | |
| Income (loss) from investment operations | | | | | | | | | | | | | |
Net investment income (loss) (d) | | | $0.16 | | | | $0.27 | | | | $0.23 | (c) | | | $0.26 | | | | $0.25 | | | | $0.32 | |
Net realized and unrealized
gain (loss) | | | 1.01 | | | | (0.81 | ) | | | 1.70 | | | | 0.40 | | | | (0.22 | ) | | | 0.55 | |
Total from investment operations | | | $1.17 | | | | $(0.54 | ) | | | $1.93 | | | | $0.66 | | | | $0.03 | | | | $0.87 | |
| | | |
| Less distributions declared to shareholders | | | | | | | | | | | | | |
From net investment income | | | $(0.08 | ) | | | $(0.28 | ) | | | $(0.27 | ) | | | $(0.11 | ) | | | $(0.16 | ) | | | $(0.32 | ) |
From net realized gain | | | (0.28 | ) | | | (0.24 | ) | | | — | | | | (0.62 | ) | | | (0.18 | ) | | | (0.07 | ) |
Total distributions declared to
shareholders | | | $(0.36 | ) | | | $(0.52 | ) | | | $(0.27 | ) | | | $(0.73 | ) | | | $(0.34 | ) | | | $(0.39 | ) |
Net asset value, end of period (x) | | | $17.83 | | | | $17.02 | | | | $18.08 | | | | $16.42 | | | | $16.49 | | | | $16.80 | |
Total return (%) (r)(s)(t)(x) | | | 7.04 | (n) | | | (3.12 | ) | | | 11.88 | (c) | | | 4.21 | | | | 0.20 | | | | 5.41 | |
| | | |
Ratios (%) (to average net assets)
and Supplemental data: | | | | | | | | | | | | | |
Expenses before expense
reductions (f) | | | 1.17 | (a) | | | 1.15 | | | | 1.20 | (c) | | | 1.27 | | | | 1.28 | | | | 1.27 | |
Expenses after expense
reductions (f) | | | 1.09 | (a) | | | 1.09 | | | | 1.08 | (c) | | | 1.12 | | | | 1.13 | | | | 1.17 | |
Net investment income (loss) | | | 1.89 | (a) | | | 1.48 | | | | 1.35 | (c) | | | 1.59 | | | | 1.51 | | | | 1.93 | |
Portfolio turnover | | | 36 | (n) | | | 52 | | | | 41 | | | | 36 | | | | 54 | | | | 23 | |
Net assets at end of period
(000 omitted) | | | $744,019 | | | | $731,699 | | | | $781,298 | | | | $823,267 | | | | $802,412 | | | | $772,769 | |
See Notes to Financial Statements
35
Financial Highlights – continued
| | | | | | | | | | | | | | | | | | | | | | | | |
| | | Six months
ended
4/30/19 | | | Year ended | |
| Class B | | 10/31/18 | | | 10/31/17 | | | 10/31/16 | | | 10/31/15 | | | 10/31/14 | |
| | | (unaudited) | | | | | | | | | | | | | | | | |
Net asset value, beginning of period | | | $17.34 | | | | $18.41 | | | | $16.73 | | | | $16.82 | | | | $17.21 | | | | $16.70 | |
| | | |
| Income (loss) from investment operations | | | | | | | | | | | | | |
Net investment income (loss) (d) | | | $0.10 | | | | $0.13 | | | | $0.11 | (c) | | | $0.14 | | | | $0.13 | | | | $0.20 | |
Net realized and unrealized
gain (loss) | | | 1.03 | | | | (0.83 | ) | | | 1.74 | | | | 0.40 | | | | (0.22 | ) | | | 0.57 | |
Total from investment operations | | | $1.13 | | | | $(0.70 | ) | | | $1.85 | | | | $0.54 | | | | $(0.09 | ) | | | $0.77 | |
| | | |
| Less distributions declared to shareholders | | | | | | | | | | | | | |
From net investment income | | | $(0.01 | ) | | | $(0.13 | ) | | | $(0.17 | ) | | | $(0.01 | ) | | | $(0.12 | ) | | | $(0.19 | ) |
From net realized gain | | | (0.28 | ) | | | (0.24 | ) | | | — | | | | (0.62 | ) | | | (0.18 | ) | | | (0.07 | ) |
Total distributions declared to
shareholders | | | $(0.29 | ) | | | $(0.37 | ) | | | $(0.17 | ) | | | $(0.63 | ) | | | $(0.30 | ) | | | $(0.26 | ) |
Net asset value, end of period (x) | | | $18.18 | | | | $17.34 | | | | $18.41 | | | | $16.73 | | | | $16.82 | | | | $17.21 | |
Total return (%) (r)(s)(t)(x) | | | 6.65 | (n) | | | (3.90 | ) | | | 11.11 | (c) | | | 3.37 | | | | (0.53 | ) | | | 4.66 | |
| | | |
Ratios (%) (to average net assets)
and Supplemental data: | | | | | | | | | | | | | |
Expenses before expense
reductions (f) | | | 1.92 | (a) | | | 1.90 | | | | 1.95 | (c) | | | 2.02 | | | | 2.03 | | | | 2.01 | |
Expenses after expense
reductions (f) | | | 1.84 | (a) | | | 1.84 | | | | 1.84 | (c) | | | 1.87 | | | | 1.88 | | | | 1.92 | |
Net investment income (loss) | | | 1.13 | (a) | | | 0.72 | | | | 0.61 | (c) | | | 0.83 | | | | 0.75 | | | | 1.19 | |
Portfolio turnover | | | 36 | (n) | | | 52 | | | | 41 | | | | 36 | | | | 54 | | | | 23 | |
Net assets at end of period
(000 omitted) | | | $32,770 | | | | $36,088 | | | | $48,598 | | | | $55,070 | | | | $60,197 | | | | $66,528 | |
See Notes to Financial Statements
36
Financial Highlights – continued
| | | | | | | | | | | | | | | | | | | | | | | | |
| | | Six months
ended
4/30/19 | | | Year ended | |
| Class C | | 10/31/18 | | | 10/31/17 | | | 10/31/16 | | | 10/31/15 | | | 10/31/14 | |
| | | (unaudited) | | | | | | | | | | | | | | | | |
Net asset value, beginning of period | | | $17.10 | | | | $18.15 | | | | $16.51 | | | | $16.60 | | | | $17.00 | | | | $16.50 | |
| | | |
| Income (loss) from investment operations | | | | | | | | | | | | | |
Net investment income (loss) (d) | | | $0.10 | | | | $0.13 | | | | $0.10 | (c) | | | $0.14 | | | | $0.13 | | | | $0.20 | |
Net realized and unrealized
gain (loss) | | | 1.00 | | | | (0.80 | ) | | | 1.71 | | | | 0.40 | | | | (0.23 | ) | | | 0.57 | |
Total from investment operations | | | $1.10 | | | | $(0.67 | ) | | | $1.81 | | | | $0.54 | | | | $(0.10 | ) | | | $0.77 | |
| | | |
| Less distributions declared to shareholders | | | | | | | | | | | | | |
From net investment income | | | $(0.01 | ) | | | $(0.14 | ) | | | $(0.17 | ) | | | $(0.01 | ) | | | $(0.12 | ) | | | $(0.20 | ) |
From net realized gain | | | (0.28 | ) | | | (0.24 | ) | | | — | | | | (0.62 | ) | | | (0.18 | ) | | | (0.07 | ) |
Total distributions declared to
shareholders | | | $(0.29 | ) | | | $(0.38 | ) | | | $(0.17 | ) | | | $(0.63 | ) | | | $(0.30 | ) | | | $(0.27 | ) |
Net asset value, end of period (x) | | | $17.91 | | | | $17.10 | | | | $18.15 | | | | $16.51 | | | | $16.60 | | | | $17.00 | |
Total return (%) (r)(s)(t)(x) | | | 6.58 | (n) | | | (3.81 | ) | | | 11.03 | (c) | | | 3.44 | | | | (0.59 | ) | | | 4.70 | |
| | | |
Ratios (%) (to average net assets)
and Supplemental data: | | | | | | | | | | | | | |
Expenses before expense
reductions (f) | | | 1.92 | (a) | | | 1.90 | | | | 1.95 | (c) | | | 2.02 | | | | 2.03 | | | | 2.02 | |
Expenses after expense
reductions (f) | | | 1.84 | (a) | | | 1.84 | | | | 1.84 | (c) | | | 1.87 | | | | 1.88 | | | | 1.92 | |
Net investment income (loss) | | | 1.13 | (a) | | | 0.72 | | | | 0.60 | (c) | | | 0.84 | | | | 0.75 | | | | 1.17 | |
Portfolio turnover | | | 36 | (n) | | | 52 | | | | 41 | | | | 36 | | | | 54 | | | | 23 | |
Net assets at end of period
(000 omitted) | | | $237,096 | | | | $255,464 | | | | $337,099 | | | | $359,421 | | | | $323,241 | | | | $308,269 | |
See Notes to Financial Statements
37
Financial Highlights – continued
| | | | | | | | | | | | | | | | | | | | | | | | |
| | | Six months
ended
4/30/19 | | | Year ended | |
| Class I | | 10/31/18 | | | 10/31/17 | | | 10/31/16 | | | 10/31/15 | | | 10/31/14 | |
| | | (unaudited) | | | | | | | | | | | | | | | | |
Net asset value, beginning of period | | | $16.85 | | | | $17.91 | | | | $16.26 | | | | $16.34 | | | | $16.65 | | | | $16.17 | |
| | | |
| Income (loss) from investment operations | | | | | | | | | | | | | |
Net investment income (loss) (d) | | | $0.18 | | | | $0.31 | | | | $0.28 | (c) | | | $0.31 | | | | $0.29 | | | | $0.35 | |
Net realized and unrealized
gain (loss) | | | 0.99 | | | | (0.81 | ) | | | 1.69 | | | | 0.38 | | | | (0.22 | ) | | | 0.56 | |
Total from investment operations | | | $1.17 | | | | $(0.50 | ) | | | $1.97 | | | | $0.69 | | | | $0.07 | | | | $0.91 | |
| | | |
| Less distributions declared to shareholders | | | | | | | | | | | | | |
From net investment income | | | $(0.10 | ) | | | $(0.32 | ) | | | $(0.32 | ) | | | $(0.15 | ) | | | $(0.20 | ) | | | $(0.36 | ) |
From net realized gain | | | (0.28 | ) | | | (0.24 | ) | | | — | | | | (0.62 | ) | | | (0.18 | ) | | | (0.07 | ) |
Total distributions declared to
shareholders | | | $(0.38 | ) | | | $(0.56 | ) | | | $(0.32 | ) | | | $(0.77 | ) | | | $(0.38 | ) | | | $(0.43 | ) |
Net asset value, end of period (x) | | | $17.64 | | | | $16.85 | | | | $17.91 | | | | $16.26 | | | | $16.34 | | | | $16.65 | |
Total return (%) (r)(s)(t)(x) | | | 7.14 | (n) | | | (2.90 | ) | | | 12.22 | (c) | | | 4.45 | | | | 0.45 | | | | 5.72 | |
| | | |
Ratios (%) (to average net assets)
and Supplemental data: | | | | | | | | | | | | | |
Expenses before expense
reductions (f) | | | 0.92 | (a) | | | 0.90 | | | | 0.95 | (c) | | | 1.01 | | | | 1.03 | | | | 1.02 | |
Expenses after expense
reductions (f) | | | 0.84 | (a) | | | 0.84 | | | | 0.84 | (c) | | | 0.87 | | | | 0.88 | | | | 0.92 | |
Net investment income (loss) | | | 2.12 | (a) | | | 1.75 | | | | 1.64 | (c) | | | 1.92 | | | | 1.75 | | | | 2.14 | |
Portfolio turnover | | | 36 | (n) | | | 52 | | | | 41 | | | | 36 | | | | 54 | | | | 23 | |
Net assets at end of period
(000 omitted) | | | $576,117 | | | | $667,895 | | | | $585,360 | | | | $494,880 | | | | $212,571 | | | | $193,307 | |
See Notes to Financial Statements
38
Financial Highlights – continued
| | | | | | | | | | | | | | | | | | | | | | | | |
| | | Six months
ended
4/30/19 | | | Year ended | |
| Class R1 | | 10/31/18 | | | 10/31/17 | | | 10/31/16 | | | 10/31/15 | | | 10/31/14 | |
| | | (unaudited) | | | | | | | | | | | | | | | | |
Net asset value, beginning of period | | | $17.02 | | | | $18.08 | | | | $16.44 | | | | $16.54 | | | | $16.93 | | | | $16.44 | |
| | | |
| Income (loss) from investment operations | | | | | | | | | | | | | |
Net investment income (loss) (d) | | | $0.10 | | | | $0.12 | | | | $0.10 | (c) | | | $0.13 | | | | $0.13 | | | | $0.20 | |
Net realized and unrealized
gain (loss) | | | 1.00 | | | | (0.80 | ) | | | 1.71 | | | | 0.40 | | | | (0.23 | ) | | | 0.56 | |
Total from investment operations | | | $1.10 | | | | $(0.68 | ) | | | $1.81 | | | | $0.53 | | | | $(0.10 | ) | | | $0.76 | |
| | | |
| Less distributions declared to shareholders | | | | | | | | | | | | | |
From net investment income | | | $(0.01 | ) | | | $(0.14 | ) | | | $(0.17 | ) | | | $(0.01 | ) | | | $(0.11 | ) | | | $(0.20 | ) |
From net realized gain | | | (0.28 | ) | | | (0.24 | ) | | | — | | | | (0.62 | ) | | | (0.18 | ) | | | (0.07 | ) |
Total distributions declared to
shareholders | | | $(0.29 | ) | | | $(0.38 | ) | | | $(0.17 | ) | | | $(0.63 | ) | | | $(0.29 | ) | | | $(0.27 | ) |
Net asset value, end of period (x) | | | $17.83 | | | | $17.02 | | | | $18.08 | | | | $16.44 | | | | $16.54 | | | | $16.93 | |
Total return (%) (r)(s)(t)(x) | | | 6.62 | (n) | | | (3.84 | ) | | | 11.09 | (c) | | | 3.39 | | | | (0.55 | ) | | | 4.63 | |
| | | |
Ratios (%) (to average net assets)
and Supplemental data: | | | | | | | | | | | | | |
Expenses before expense
reductions (f) | | | 1.92 | (a) | | | 1.90 | | | | 1.95 | (c) | | | 2.02 | | | | 2.03 | | | | 2.01 | |
Expenses after expense
reductions (f) | | | 1.84 | (a) | | | 1.84 | | | | 1.84 | (c) | | | 1.87 | | | | 1.88 | | | | 1.92 | |
Net investment income (loss) | | | 1.15 | (a) | | | 0.65 | | | | 0.59 | (c) | | | 0.81 | | | | 0.75 | | | | 1.18 | |
Portfolio turnover | | | 36 | (n) | | | 52 | | | | 41 | | | | 36 | | | | 54 | | | | 23 | |
Net assets at end of period
(000 omitted) | | | $2,454 | | | | $2,352 | | | | $2,578 | | | | $2,875 | | | | $3,195 | | | | $3,518 | |
See Notes to Financial Statements
39
Financial Highlights – continued
| | | | | | | | | | | | | | | | | | | | | | | | |
| | | Six months
ended
4/30/19 | | | Year ended | |
| Class R2 | | 10/31/18 | | | 10/31/17 | | | 10/31/16 | | | 10/31/15 | | | 10/31/14 | |
| | | (unaudited) | | | | | | | | | | | | | | | | |
Net asset value, beginning of period | | | $16.84 | | | | $17.89 | | | | $16.26 | | | | $16.35 | | | | $16.68 | | | | $16.20 | |
| | | |
| Income (loss) from investment operations | | | | | | | | | | | | | |
Net investment income (loss) (d) | | | $0.14 | | | | $0.22 | | | | $0.19 | (c) | | | $0.23 | | | | $0.21 | | | | $0.28 | |
Net realized and unrealized
gain (loss) | | | 1.00 | | | | (0.80 | ) | | | 1.68 | | | | 0.38 | | | | (0.22 | ) | | | 0.55 | |
Total from investment operations | | | $1.14 | | | | $(0.58 | ) | | | $1.87 | | | | $0.61 | | | | $(0.01 | ) | | | $0.83 | |
| | | |
| Less distributions declared to shareholders | | | | | | | | | | | | | |
From net investment income | | | $(0.06 | ) | | | $(0.23 | ) | | | $(0.24 | ) | | | $(0.08 | ) | | | $(0.14 | ) | | | $(0.28 | ) |
From net realized gain | | | (0.28 | ) | | | (0.24 | ) | | | — | | | | (0.62 | ) | | | (0.18 | ) | | | (0.07 | ) |
Total distributions declared to
shareholders | | | $(0.34 | ) | | | $(0.47 | ) | | | $(0.24 | ) | | | $(0.70 | ) | | | $(0.32 | ) | | | $(0.35 | ) |
Net asset value, end of period (x) | | | $17.64 | | | | $16.84 | | | | $17.89 | | | | $16.26 | | | | $16.35 | | | | $16.68 | |
Total return (%) (r)(s)(t)(x) | | | 6.91 | (n) | | | (3.37 | ) | | | 11.59 | (c) | | | 3.93 | | | | (0.03 | ) | | | 5.16 | |
| | | |
Ratios (%) (to average net assets)
and Supplemental data: | | | | | | | | | | | | | |
Expenses before expense
reductions (f) | | | 1.42 | (a) | | | 1.40 | | | | 1.45 | (c) | | | 1.52 | | | | 1.53 | | | | 1.51 | |
Expenses after expense
reductions (f) | | | 1.34 | (a) | | | 1.34 | | | | 1.34 | (c) | | | 1.37 | | | | 1.38 | | | | 1.42 | |
Net investment income (loss) | | | 1.61 | (a) | | | 1.21 | | | | 1.11 | (c) | | | 1.40 | | | | 1.25 | | | | 1.69 | |
Portfolio turnover | | | 36 | (n) | | | 52 | | | | 41 | | | | 36 | | | | 54 | | | | 23 | |
Net assets at end of period
(000 omitted) | | | $12,160 | | | | $13,788 | | | | $21,141 | | | | $20,926 | | | | $11,577 | | | | $9,812 | |
See Notes to Financial Statements
40
Financial Highlights – continued
| | | | | | | | | | | | | | | | | | | | | | | | |
| | | Six months
ended
4/30/19 | | | Year ended | |
| Class R3 | | 10/31/18 | | | 10/31/17 | | | 10/31/16 | | | 10/31/15 | | | 10/31/14 | |
| | | (unaudited) | | | | | | | | | | | | | | | | |
Net asset value, beginning of period | | | $16.97 | | | | $18.03 | | | | $16.37 | | | | $16.44 | | | | $16.75 | | | | $16.27 | |
| | | |
| Income (loss) from investment operations | | | | | | | | | | | | | |
Net investment income (loss) (d) | | | $0.16 | | | | $0.26 | | | | $0.23 | (c) | | | $0.26 | | | | $0.25 | | | | $0.32 | |
Net realized and unrealized
gain (loss) | | | 1.00 | | | | (0.80 | ) | | | 1.71 | | | | 0.40 | | | | (0.22 | ) | | | 0.55 | |
Total from investment operations | | | $1.16 | | | | $(0.54 | ) | | | $1.94 | | | | $0.66 | | | | $0.03 | | | | $0.87 | |
| | | |
| Less distributions declared to shareholders | | | | | | | | | | | | | |
From net investment income | | | $(0.08 | ) | | | $(0.28 | ) | | | $(0.28 | ) | | | $(0.11 | ) | | | $(0.16 | ) | | | $(0.32 | ) |
From net realized gain | | | (0.28 | ) | | | (0.24 | ) | | | — | | | | (0.62 | ) | | | (0.18 | ) | | | (0.07 | ) |
Total distributions declared to
shareholders | | | $(0.36 | ) | | | $(0.52 | ) | | | $(0.28 | ) | | | $(0.73 | ) | | | $(0.34 | ) | | | $(0.39 | ) |
Net asset value, end of period (x) | | | $17.77 | | | | $16.97 | | | | $18.03 | | | | $16.37 | | | | $16.44 | | | | $16.75 | |
Total return (%) (r)(s)(t)(x) | | | 7.01 | (n) | | | (3.14 | ) | | | 11.94 | (c) | | | 4.23 | | | | 0.19 | | | | 5.42 | |
| | | |
Ratios (%) (to average net assets)
and Supplemental data: | | | | | | | | | | | | | |
Expenses before expense
reductions (f) | | | 1.17 | (a) | | | 1.15 | | | | 1.20 | (c) | | | 1.27 | | | | 1.27 | | | | 1.27 | |
Expenses after expense
reductions (f) | | | 1.09 | (a) | | | 1.09 | | | | 1.09 | (c) | | | 1.12 | | | | 1.13 | | | | 1.17 | |
Net investment income (loss) | | | 1.89 | (a) | | | 1.47 | | | | 1.35 | (c) | | | 1.62 | | | | 1.50 | | | | 1.93 | |
Portfolio turnover | | | 36 | (n) | | | 52 | | | | 41 | | | | 36 | | | | 54 | | | | 23 | |
Net assets at end of period
(000 omitted) | | | $19,201 | | | | $18,795 | | | | $21,193 | | | | $15,157 | | | | $11,368 | | | | $13,576 | |
See Notes to Financial Statements
41
Financial Highlights – continued
| | | | | | | | | | | | | | | | | | | | | | | | |
| | | Six months
ended
4/30/19 | | | Year ended | |
| Class R4 | | 10/31/18 | | | 10/31/17 | | | 10/31/16 | | | 10/31/15 | | | 10/31/14 | |
| | | (unaudited) | | | | | | | | | | | | | | | | |
Net asset value, beginning of period | | | $17.05 | | | | $18.11 | | | | $16.44 | | | | $16.51 | | | | $16.82 | | | | $16.33 | |
| | | |
| Income (loss) from investment operations | | | | | | | | | | | | | |
Net investment income (loss) (d) | | | $0.18 | | | | $0.31 | | | | $0.27 | (c) | | | $0.29 | | | | $0.29 | | | | $0.36 | |
Net realized and unrealized
gain (loss) | | | 1.00 | | | | (0.81 | ) | | | 1.72 | | | | 0.41 | | | | (0.22 | ) | | | 0.56 | |
Total from investment operations | | | $1.18 | | | | $(0.50 | ) | | | $1.99 | | | | $0.70 | | | | $0.07 | | | | $0.92 | |
| | | |
| Less distributions declared to shareholders | | | | | | | | | | | | | |
From net investment income | | | $(0.10 | ) | | | $(0.32 | ) | | | $(0.32 | ) | | | $(0.15 | ) | | | $(0.20 | ) | | | $(0.36 | ) |
From net realized gain | | | (0.28 | ) | | | (0.24 | ) | | | — | | | | (0.62 | ) | | | (0.18 | ) | | | (0.07 | ) |
Total distributions declared to
shareholders | | | $(0.38 | ) | | | $(0.56 | ) | | | $(0.32 | ) | | | $(0.77 | ) | | | $(0.38 | ) | | | $(0.43 | ) |
Net asset value, end of period (x) | | | $17.85 | | | | $17.05 | | | | $18.11 | | | | $16.44 | | | | $16.51 | | | | $16.82 | |
Total return (%) (r)(s)(t)(x) | | | 7.11 | (n) | | | (2.87 | ) | | | 12.20 | (c) | | | 4.45 | | | | 0.45 | | | | 5.72 | |
| | | |
Ratios (%) (to average net assets)
and Supplemental data: | | | | | | | | | | | | | |
Expenses before expense
reductions (f) | | | 0.92 | (a) | | | 0.90 | | | | 0.95 | (c) | | | 1.02 | | | | 1.03 | | | | 1.02 | |
Expenses after expense
reductions (f) | | | 0.84 | (a) | | | 0.84 | | | | 0.84 | (c) | | | 0.87 | | | | 0.88 | | | | 0.92 | |
Net investment income (loss) | | | 2.14 | (a) | | | 1.71 | | | | 1.59 | (c) | | | 1.79 | | | | 1.73 | | | | 2.14 | |
Portfolio turnover | | | 36 | (n) | | | 52 | | | | 41 | | | | 36 | | | | 54 | | | | 23 | |
Net assets at end of period
(000 omitted) | | | $7,978 | | | | $7,514 | | | | $6,063 | | | | $7,629 | | | | $10,758 | | | | $10,042 | |
See Notes to Financial Statements
42
Financial Highlights – continued
| | | | | | | | | | | | | | | | | | | | | | | | |
| | | Six months
ended
4/30/19 | | | Year ended | |
| Class R6 | | 10/31/18 | | | 10/31/17 | | | 10/31/16 | | | 10/31/15 | | | 10/31/14 | |
| | | (unaudited) | | | | | | | | | | | | | | | | |
Net asset value, beginning of period | | | $16.85 | | | | $17.91 | | | | $16.26 | | | | $16.34 | | | | $16.65 | | | | $16.18 | |
| | | |
| Income (loss) from investment operations | | | | | | | | | | | | | |
Net investment income (loss) (d) | | | $0.18 | | | | $0.33 | | | | $0.28 | (c) | | | $0.31 | | | | $0.30 | | | | $0.37 | |
Net realized and unrealized
gain (loss) | | | 1.00 | | | | (0.81 | ) | | | 1.70 | | | | 0.40 | | | | (0.21 | ) | | | 0.55 | |
Total from investment operations | | | $1.18 | | | | $(0.48 | ) | | | $1.98 | | | | $0.71 | | | | $0.09 | | | | $0.92 | |
| | | |
| Less distributions declared to shareholders | | | | | | | | | | | | | |
From net investment income | | | $(0.11 | ) | | | $(0.34 | ) | | | $(0.33 | ) | | | $(0.17 | ) | | | $(0.22 | ) | | | $(0.38 | ) |
From net realized gain | | | (0.28 | ) | | | (0.24 | ) | | | — | | | | (0.62 | ) | | | (0.18 | ) | | | (0.07 | ) |
Total distributions declared to
shareholders | | | $(0.39 | ) | | | $(0.58 | ) | | | $(0.33 | ) | | | $(0.79 | ) | | | $(0.40 | ) | | | $(0.45 | ) |
Net asset value, end of period (x) | | | $17.64 | | | | $16.85 | | | | $17.91 | | | | $16.26 | | | | $16.34 | | | | $16.65 | |
Total return (%) (r)(s)(t)(x) | | | 7.20 | (n) | | | (2.82 | ) | | | 12.33 | (c) | | | 4.54 | | | | 0.56 | | | | 5.73 | |
| | | |
Ratios (%) (to average net assets)
and Supplemental data: | | | | | | | | | | | | | |
Expenses before expense
reductions (f) | | | 0.82 | (a) | | | 0.81 | | | | 0.84 | (c) | | | 0.92 | | | | 0.93 | | | | 0.93 | |
Expenses after expense
reductions (f) | | | 0.74 | (a) | | | 0.75 | | | | 0.74 | (c) | | | 0.77 | | | | 0.78 | | | | 0.83 | |
Net investment income (loss) | | | 2.19 | (a) | | | 1.83 | | | | 1.63 | (c) | | | 1.96 | | | | 1.85 | | | | 2.25 | |
Portfolio turnover | | | 36 | (n) | | | 52 | | | | 41 | | | | 36 | | | | 54 | | | | 23 | |
Net assets at end of period
(000 omitted) | | | $226,119 | | | | $363,364 | | | | $347,795 | | | | $110,608 | | | | $85,585 | | | | $74,972 | |
| (c) | Amount reflects aone-time reimbursement of expenses by the custodian (or former custodian) without which net investment income and performance would be lower and expenses would be higher. |
| (d) | Per share data is based on average shares outstanding. |
| (f) | Ratios do not reflect reductions from fees paid indirectly, if applicable. |
| (r) | Certain expenses have been reduced without which performance would have been lower. |
| (s) | From time to time the fund may receive proceeds from litigation settlements, without which performance would be lower. |
| (t) | Total returns do not include any applicable sales charges. |
| (x) | The net asset values and total returns have been calculated on net assets which include adjustments made in accordance with U.S. generally accepted accounting principles required at period end for financial reporting purposes. |
See Notes to Financial Statements
43
NOTES TO FINANCIAL STATEMENTS
(unaudited)
(1) Business and Organization
MFS Global Total Return Fund (the fund) is a diversified series of MFS Series Trust VI (the trust). The trust is organized as a Massachusetts business trust and is registered under the Investment Company Act of 1940, as amended, as anopen-end management investment company.
The fund is an investment company and accordingly follows the investment company accounting and reporting guidance of the Financial Accounting Standards Board (FASB) Accounting Standards Codification Topic 946 Financial Services – Investment Companies.
(2) Significant Accounting Policies
General– The preparation of financial statements in conformity with U.S. generally accepted accounting principles requires management to make estimates and assumptions that affect the reported amounts of assets and liabilities, and disclosure of contingent assets and liabilities at the date of the financial statements and the reported amounts of increases and decreases in net assets from operations during the reporting period. Actual results could differ from those estimates. In the preparation of these financial statements, management has evaluated subsequent events occurring after the date of the fund’s Statement of Assets and Liabilities through the date that the financial statements were issued. The fund invests in foreign securities. Investments in foreign securities are vulnerable to the effects of changes in the relative values of the local currency and the U.S. dollar and to the effects of changes in each country’s market, economic, industrial, political, regulatory, geopolitical, and other conditions.
In March 2017, the FASB issued Accounting Standards Update2017-08, Receivables – Nonrefundable Fees and Other Costs (Subtopic310-20) – Premium Amortization on Purchased Callable Debt Securities (“ASU2017-08”). For entities that hold callable debt securities at a premium, ASU2017-08 requires that the premium be amortized to the earliest call date. ASU2017-08 will be effective for fiscal years beginning after December 15, 2018, and interim periods within those fiscal years. Management has evaluated the potential impacts of ASU2017-08 and believes that adoption ofASU 2017-08 will not have a material effect on the fund’s overall financial position or its overall results of operations.
Balance Sheet Offsetting– The fund’s accounting policy with respect to balance sheet offsetting is that, absent an event of default by the counterparty or a termination of the agreement, the International Swaps and Derivatives Association (ISDA) Master Agreement, or similar agreement, does not result in an offset of reported amounts of financial assets and financial liabilities in the Statement of Assets and Liabilities across transactions between the fund and the applicable counterparty. The fund’s right to setoff may be restricted or prohibited by the bankruptcy or insolvency laws of the particular jurisdiction to which a specific master netting agreement counterparty is subject. Balance sheet offsetting disclosures, to the extent applicable to the fund, have been included in the fund’s Significant Accounting Policies note under the captions for each of the fund’sin-scope financial instruments and transactions.
44
Notes to Financial Statements (unaudited) – continued
Investment Valuations– Equity securities, including restricted equity securities, are generally valued at the last sale or official closing price on their primary market or exchange as provided by a third-party pricing service. Equity securities, for which there were no sales reported that day, are generally valued at the last quoted daily bid quotation on their primary market or exchange as provided by a third-party pricing service. Debt instruments and floating rate loans, including restricted debt instruments, are generally valued at an evaluated or composite bid as provided by a third-party pricing service. Short-term instruments with a maturity at issuance of 60 days or less may be valued at amortized cost, which approximates market value. Exchange-traded options are generally valued at the last sale or official closing price on their primary exchange as provided by a third-party pricing service. Exchange-traded options for which there were no sales reported that day are generally valued at the last daily bid quotation on their primary exchange as provided by a third-party pricing service. Options not traded on an exchange are generally valued at a broker/dealer bid quotation. Foreign currency options are generally valued at valuations provided by a third-party pricing service. Futures contracts are generally valued at last posted settlement price on their primary exchange as provided by a third-party pricing service. Futures contracts for which there were no trades that day for a particular position are generally valued at the closing bid quotation on their primary exchange as provided by a third-party pricing service. Forward foreign currency exchange contracts are generally valued at the mean of bid and asked prices for the time period interpolated from rates provided by a third-party pricing service for proximate time periods. Swap agreements are generally valued at valuations provided by a third-party pricing service, which for cleared swaps includes an evaluation of any trading activity at the clearinghouses.Open-end investment companies are generally valued at net asset value per share. Securities and other assets generally valued on the basis of information from athird-party pricing service may also be valued at a broker/dealer bid quotation. In determining values, third-party pricing services can utilize both transaction data and market information such as yield, quality, coupon rate, maturity, type of issue, trading characteristics, and other market data. The values of foreign securities and other assets and liabilities expressed in foreign currencies are converted to U.S. dollars using the mean of bid and asked prices for rates provided by a third-party pricing service.
The Board of Trustees has delegated primary responsibility for determining or causing to be determined the value of the fund’s investments (including any fair valuation) to the adviser pursuant to valuation policies and procedures approved by the Board. If the adviser determines that reliable market quotations are not readily available, investments are valued at fair value as determined in good faith by the adviser in accordance with such procedures under the oversight of the Board of Trustees. Under the fund’s valuation policies and procedures, market quotations are not considered to be readily available for most types of debt instruments and floating rate loans and many types of derivatives. These investments are generally valued at fair value based on information from third-party pricing services. In addition, investments may be valued at fair value if the adviser determines that an investment’s value has been materially affected by events occurring after the close of the exchange or market on which the investment is principally traded (such as foreign exchange or market) and prior to the determination of the fund’s net asset value, or after the halting of trading of a specific security where
45
Notes to Financial Statements (unaudited) – continued
trading does not resume prior to the close of the exchange or market on which the security is principally traded. Events that occur on a frequent basis after foreign markets close (such as developments in foreign markets and significant movements in the U.S. markets) and prior to the determination of the fund’s net asset value may be deemed to have a material effect on the value of securities traded in foreign markets. Accordingly, the fund’s foreign equity securities may often be valued at fair value. The adviser generally relies on third-party pricing services or other information (such as the correlation with price movements of similar securities in the same or other markets; the type, cost and investment characteristics of the security; the business and financial condition of the issuer; and trading and other market data) to assist in determining whether to fair value and at what value to fair value an investment. The value of an investment for purposes of calculating the fund’s net asset value can differ depending on the source and method used to determine value. When fair valuation is used, the value of an investment used to determine the fund’s net asset value may differ from quoted or published prices for the same investment. There can be no assurance that the fund could obtain the fair value assigned to an investment if it were to sell the investment at the same time at which the fund determines its net asset value per share.
Various inputs are used in determining the value of the fund’s assets or liabilities. These inputs are categorized into three broad levels. In certain cases, the inputs used to measure fair value may fall into different levels of the fair value hierarchy. In such cases, an investment’s level within the fair value hierarchy is based on the lowest level of input that is significant to the fair value measurement. The fund’s assessment of the significance of a particular input to the fair value measurement in its entirety requires judgment, and considers factors specific to the investment. Level 1 includes unadjusted quoted prices in active markets for identical assets or liabilities. Level 2 includes other significant observable market-based inputs (including quoted prices for similar securities, interest rates, prepayment speed, and credit risk). Level 3 includes unobservable inputs, which may include the adviser’s own assumptions in determining the fair value of investments. Other financial instruments are derivative instruments,
46
Notes to Financial Statements (unaudited) – continued
such as futures contracts, forward foreign currency exchange contracts, and swap agreements. The following is a summary of the levels used as of April 30, 2019 in valuing the fund’s assets or liabilities:
| | | | | | | | | | | | | | | | |
| | | | |
| Financial Instruments | | Level 1 | | | Level 2 | | | Level 3 | | | Total | |
| Equity Securities: | | | | | | | | | | | | | | | | |
United States | | | $612,377,508 | | | | $— | | | | $— | | | | $612,377,508 | |
Switzerland | | | 102,381,602 | | | | — | | | | — | | | | 102,381,602 | |
Japan | | | — | | | | 82,497,512 | | | | — | | | | 82,497,512 | |
United Kingdom | | | 73,896,098 | | | | — | | | | — | | | | 73,896,098 | |
France | | | 56,018,152 | | | | — | | | | — | | | | 56,018,152 | |
Canada | | | 41,464,206 | | | | — | | | | — | | | | 41,464,206 | |
Germany | | | 31,201,415 | | | | — | | | | — | | | | 31,201,415 | |
Taiwan | | | 27,449,943 | | | | — | | | | — | | | | 27,449,943 | |
Netherlands | | | 16,467,193 | | | | — | | | | — | | | | 16,467,193 | |
Other Countries | | | 78,399,349 | | | | 5,590,878 | | | | — | | | | 83,990,227 | |
| U.S. Treasury Bonds & U.S. Government Agency & Equivalents | | | — | | | | 126,143,610 | | | | — | | | | 126,143,610 | |
| Non-U.S. Sovereign Debt | | | — | | | | 250,446,833 | | | | — | | | | 250,446,833 | |
| Municipal Bonds | | | — | | | | 1,592,417 | | | | — | | | | 1,592,417 | |
| U.S. Corporate Bonds | | | — | | | | 103,388,014 | | | | — | | | | 103,388,014 | |
| Residential Mortgage-Backed Securities | | | — | | | | 47,777,746 | | | | — | | | | 47,777,746 | |
| Commercial Mortgage-Backed Securities | | | — | | | | 11,066,732 | | | | — | | | | 11,066,732 | |
| Asset-Backed Securities (including CDOs) | | | — | | | | 19,601,054 | | | | — | | | | 19,601,054 | |
| Foreign Bonds | | | — | | | | 105,989,961 | | | | — | | | | 105,989,961 | |
| Mutual Funds | | | 67,448,881 | | | | — | | | | — | | | | 67,448,881 | |
| Total | | | $1,107,104,347 | | | | $754,094,757 | | | | $— | | | | $1,861,199,104 | |
| | | | |
| Other Financial Instruments | | | | | | | | | | | | |
| Futures Contracts – Assets | | | $59,023 | | | | $— | | | | $— | | | | $59,023 | |
| Futures Contracts – Liabilities | | | (1,443,626 | ) | | | — | | | | — | | | | (1,443,626 | ) |
| Forward Foreign Currency Exchange Contracts – Assets | | | — | | | | 535,782 | | | | — | | | | 535,782 | |
| Forward Foreign Currency Exchange Contracts – Liabilities | | | — | | | | (1,688,943 | ) | | | — | | | | (1,688,943 | ) |
| Swap Agreements – Assets | | | — | | | | 8,593 | | | | — | | | | 8,593 | |
For further information regarding security characteristics, see the Portfolio of Investments.
Inflation-Adjusted Debt Securities– The fund invests in inflation-adjusted debt securities issued by the U.S. Treasury. The fund also invests in inflation-adjusted debt securities issued by U.S. Government agencies and instrumentalities other than the U.S. Treasury and by other entities such as U.S. and foreign corporations and foreign governments. The principal value of these debt securities is adjusted through income according to changes in the Consumer Price Index or another general price or wage index. These debt securities typically pay a fixed rate of interest, but this fixed rate is applied to the inflation-adjusted principal amount. The principal paid at maturity of the debt security is typically equal to the inflation-adjusted principal amount, or the
47
Notes to Financial Statements (unaudited) – continued
security’s original par value, whichever is greater. Other types of inflation-adjusted securities may use other methods to adjust for other measures of inflation.
Foreign Currency Translation– Purchases and sales of foreign investments, income, and expenses are converted into U.S. dollars based upon currency exchange rates prevailing on the respective dates of such transactions or on the reporting date for foreign denominated receivables and payables. Gains and losses attributable to foreign currency exchange rates on sales of securities are recorded for financial statement purposes as net realized gains and losses on investments. Gains and losses attributable to foreign exchange rate movements on receivables, payables, income and expenses are recorded for financial statement purposes as foreign currency transaction gains and losses. That portion of both realized and unrealized gains and losses on investments that results from fluctuations in foreign currency exchange rates is not separately disclosed.
Derivatives– The fund uses derivatives primarily to increase or decrease exposure to a particular market or segment of the market, or security, to increase or decrease interest rate or currency exposure, or as alternatives to direct investments. Derivatives are used for hedging ornon-hedging purposes. While hedging can reduce or eliminate losses, it can also reduce or eliminate gains. When the fund uses derivatives as an investment to increase market exposure, or for hedging purposes, gains and losses from derivative instruments may be substantially greater than the derivative’s original cost.
The derivative instruments used by the fund during the period were purchased options, futures contracts, forward foreign currency exchange contracts, and swap agreements. Depending on the type of derivative, the fund may exit a derivative position by entering into an offsetting transaction with a counterparty or exchange, negotiating an agreement with the derivative counterparty, or novating the position to a third party. The fund may be unable to promptly close out a futures position in instances where the daily fluctuation in the price for that type of future exceeds the daily limit set by the exchange. The fund’s period end derivatives, as presented in the Portfolio of Investments and the associated Derivative Contract tables, generally are indicative of the volume of its derivative activity during the period.
The following table presents, by major type of derivative contract, the fair value, on a gross basis, of the asset and liability components of derivatives held by the fund at April 30, 2019 as reported in the Statement of Assets and Liabilities:
| | | | | | | | | | |
| | | | | Fair Value (a) | |
| | | |
| Risk | | Derivative Contracts | | Asset Derivatives | | | Liability Derivatives | |
| Interest Rate | | Interest Rate Futures | | | $59,023 | | | | $(1,443,626 | ) |
| Credit | | Credit Default Swaps | | | 8,593 | | | | — | |
| Foreign Exchange | | Forward Foreign Currency Exchange Contracts | | | 535,782 | | | | (1,688,943 | ) |
| Total | | | | | $603,398 | | | | $3,132,569 | |
| (a) | Values presented in this table for futures contracts correspond to the values reported in the fund’s Portfolio of Investments. Only the current day net variation margin for futures contracts is separately reported within the fund’s Statement of Assets and Liabilities. |
48
Notes to Financial Statements (unaudited) – continued
The following table presents, by major type of derivative contract, the realized gain (loss) on derivatives held by the fund for the six months ended April 30, 2019 as reported in the Statement of Operations:
| | | | | | | | | | | | |
| | | |
| Risk | | Futures
Contracts | | | Forward Foreign
Currency
Exchange
Contracts | | | Unaffiliated
Issuers
(Purchased
Options) | |
| Interest Rate | | | $(1,624,082 | ) | | | $— | | | | $(43,938 | ) |
| Foreign Exchange | | | — | | | | (956,096 | ) | | | — | |
| Total | | | $(1,624,082 | ) | | | $(956,096 | ) | | | $(43,938 | ) |
The following table presents, by major type of derivative contract, the change in unrealized appreciation or depreciation on derivatives held by the fund for the six months ended April 30, 2019 as reported in the Statement of Operations:
| | | | | | | | |
| | |
| Risk | | Futures
Contracts | | | Forward
Foreign
Currency
Exchange
Contracts | |
| Interest Rate | | | $(2,108,608 | ) | | | $— | |
| Foreign Exchange | | | — | | | | 344,652 | |
| Total | | | $(2,108,608 | ) | | | $344,652 | |
Derivative counterparty credit risk is managed through formal evaluation of the creditworthiness of all potential counterparties. On certain, but not all, uncleared derivatives, the fund attempts to reduce its exposure to counterparty credit risk whenever possible by entering into an ISDA Master Agreement on a bilateral basis. The ISDA Master Agreement gives each party to the agreement the right to terminate all transactions traded under such agreement if there is a specified deterioration in the credit quality of the other party. Upon an event of default or a termination of the ISDA Master Agreement, thenon-defaulting party has the right to close out all transactions traded under such agreement and to net amounts owed under each agreement to one net amount payable by one party to the other. This right to close out and net payments across all transactions traded under the ISDA Master Agreement could result in a reduction of the fund’s credit risk to such counterparty equal to any amounts payable by the fund under the applicable transactions, if any.
Collateral and margin requirements differ by type of derivative. For cleared derivatives (e.g., futures contracts, cleared swaps, and exchange-traded options), margin requirements are set by the clearing broker and the clearing house and collateral, in the form of cash or securities, is posted by the fund directly with the clearing broker. Collateral terms are counterparty agreement specific for uncleared derivatives (e.g., forward foreign currency exchange contracts, uncleared swap agreements, and uncleared options) and collateral, in the form of cash and securities, is held in segregated accounts with the fund’s custodian in connection with these agreements. For derivatives traded under an ISDA Master Agreement, which contains a collateral support annex, the collateral requirements are netted across all transactions traded under such counterparty-specific agreement and an amount is posted from one party
49
Notes to Financial Statements (unaudited) – continued
to the other to collateralize such obligations. Cash that has been segregated or delivered to cover the fund’s collateral or margin obligations under derivative contracts, if any, will be reported separately in the Statement of Assets and Liabilities as restricted cash for uncleared derivatives and/or deposits with brokers for cleared derivatives. Securities pledged as collateral or margin for the same purpose, if any, are noted in the Portfolio of Investments. The fund may be required to make payments of interest on uncovered collateral or margin obligations with the broker. Any such payments are included in “Miscellaneous” expense in the Statement of Operations.
Purchased Options– The fund purchased put options for a premium. Purchased put options entitle the holder to sell a specified number of shares or units of a particular security, currency or index at a specified price at a specified date or within a specified period of time. Purchasing put options may hedge against an anticipated decline in the value of portfolio securities or currency or decrease the fund’s exposure to an underlying instrument.
The premium paid is initially recorded as an investment in the Statement of Assets and Liabilities. That investment is subsequentlymarked-to-market daily with the difference between the premium paid and the market value of the purchased option being recorded as unrealized appreciation or depreciation. Premiums paid for purchased put options which have expired are treated as realized losses on investments in the Statement of Operations. Upon the exercise or closing of a purchased put option, the premium paid is offset against the proceeds on the sale of the underlying security or financial instrument in order to determine the realized gain or loss on investments.
Whether or not the option is exercised, the fund’s maximum risk of loss from purchasing an option is the amount of premium paid. All option contracts involve credit risk if the counterparty to the option contract fails to perform. For uncleared options, this risk is mitigated in cases where there is an ISDA Master Agreement between the fund and the counterparty providing for netting as described above and, where applicable, by the posting of collateral by the counterparty to the fund to cover the fund’s exposure to the counterparty under such ISDA Master Agreement.
Futures Contracts– The fund entered into futures contracts which may be used to hedge against or obtain broad market exposure, interest rate exposure, currency exposure, or to manage duration. A futures contract represents a commitment for the future purchase or sale of an asset at a specified price on a specified date.
Upon entering into a futures contract, the fund is required to deposit with the broker, either in cash or securities, an initial margin in an amount equal to a specified percentage of the notional amount of the contract. Subsequent payments (variation margin) are made or received by the fund each day, depending on the daily fluctuations in the value of the contract, and are recorded for financial statement purposes as unrealized gain or loss by the fund until the contract is closed or expires at which point the gain or loss on futures contracts is realized.
The fund bears the risk of interest rates, exchange rates or securities prices moving unexpectedly, in which case, the fund may not achieve the anticipated benefits of the futures contracts and may realize a loss. While futures contracts may present less counterparty risk to the fund since the contracts are exchange traded and the exchange’s clearinghouse guarantees payments to the broker, there is still counterparty
50
Notes to Financial Statements (unaudited) – continued
credit risk due to the insolvency of the broker. The fund’s maximum risk of loss due to counterparty credit risk is equal to the margin posted by the fund to the broker plus any gains or minus any losses on the outstanding futures contracts.
Forward Foreign Currency Exchange Contracts– The fund entered into forward foreign currency exchange contracts for the purchase or sale of a specific foreign currency at a fixed price on a future date. These contracts may be used to hedge the fund’s currency risk or fornon-hedging purposes. For hedging purposes, the fund may enter into contracts to deliver or receive foreign currency that the fund will receive from or use in its normal investment activities. The fund may also use contracts to hedge against declines in the value of foreign currency denominated securities due to unfavorable exchange rate movements. Fornon-hedging purposes, the fund may enter into contracts with the intent of changing the relative exposure of the fund’s portfolio of securities to different currencies to take advantage of anticipated exchange rate changes.
Forward foreign currency exchange contracts are adjusted by the daily exchange rate of the underlying currency and any unrealized gains or losses are recorded as a receivable or payable for forward foreign currency exchange contracts until the contract settlement date. On contract settlement date, any gain or loss on the contract is recorded as realized gains or losses on forward foreign currency exchange contracts.
Risks may arise upon entering into these contracts from unanticipated movements in the value of the contract and from the potential inability of counterparties to meet the terms of their contracts. Generally, the fund’s maximum risk due to counterparty credit risk is the unrealized gain on the contract due to the use of Continuous Linked Settlement, a multicurrency cash settlement system for the centralized settlement of foreign transactions. This risk is mitigated in cases where there is an ISDA Master Agreement between the fund and the counterparty providing for netting as described above and, where applicable, by the posting of collateral by the counterparty to the fund to cover the fund’s exposure to the counterparty under such ISDA Master Agreement.
Swap Agreements– During the period the fund entered into swap agreements. Swap agreements generally involve a periodic exchange of cash payments on a net basis, at specified intervals or upon the occurrence of specified events, between the fund and a counterparty. Certain swap agreements may be entered into as a bilateral contract (“uncleared swaps”) while others are required to be centrally cleared (“cleared swaps”). In a cleared swap transaction, the ultimate counterparty to the transaction is a clearinghouse (the “clearinghouse”). The contract is transferred and accepted by the clearinghouse immediately following execution of the swap contract with an executing broker. Thereafter, throughout the term of the cleared swap, the fund interfaces indirectly with the clearinghouse through a clearing broker and has counterparty risk to the clearing broker as well.
Both cleared and uncleared swap agreements are marked to market daily. The value of uncleared swap agreements is reported in the Statement of Assets and Liabilities as “Uncleared swaps, at value” which includes any related interest accruals to be paid or received by the fund. For cleared swaps, payments (variation margin) are made or received by the fund each day, depending on the daily fluctuations in the value of the
51
Notes to Financial Statements (unaudited) – continued
cleared swap, such that only the current day net receivable or payable for variation margin is reported in the Statement of Assets and Liabilities.
For both cleared and uncleared swaps, the periodic exchange of net cash payments, at specified intervals or upon the occurrence of specified events as stipulated by the agreement, is recorded as realized gain or loss on swap agreements in the Statement of Operations. Premiums paid or received at the inception of the agreements are amortized using the effective interest method over the term of the agreement as realized gain or loss on swap agreements in the Statement of Operations. A liquidation payment received or made upon early termination is recorded as a realized gain or loss on swap agreements in the Statement of Operations. The change in unrealized appreciation or depreciation on swap agreements in the Statement of Operations reflects the aggregate change over the reporting period in the value of swaps net of any unamortized premiums paid or received.
Risks related to swap agreements include the possible lack of a liquid market, unfavorable market and interest rate movements of the underlying instrument and the failure of the counterparty to perform under the terms of the agreements. The fund’s maximum risk of loss from counterparty credit risk is the discounted net value of the cash flows to be received from/paid to the counterparty over the contract’s remaining life, to the extent that the amount is positive. To address counterparty risk, uncleared swap agreements are limited to only highly-rated counterparties. Risk is further reduced by having an ISDA Master Agreement between the fund and the counterparty providing for netting as described above and, where applicable, by the posting of collateral by the counterparty to the fund to cover the fund’s exposure to the counterparty under such ISDA Master Agreement. The fund’s counterparty risk due to cleared swaps is mitigated by the fact that the clearinghouse is the true counterparty to the transaction and the regulatory requirement safeguards in the event of a clearing broker bankruptcy.
The fund entered into credit default swap agreements in order to manage its exposure to the market or certain sectors of the market, to reduce its credit risk exposure to defaults of corporate and sovereign issuers or to create exposure to corporate or sovereign issuers to which it is not otherwise exposed. In a credit default swap agreement, the protection buyer can make an upfront payment and will make a stream of payments to the protection seller based on a fixed percentage applied to the agreement notional amount in exchange for the right to receive a specified return upon the occurrence of a defined credit event on the reference obligation (which may be either a single security or a basket of securities issued by corporate or sovereign issuers) and, with respect to the cases where physical settlement applies, the delivery by the buyer to the seller of a defined deliverable obligation. Although agreement-specific, credit events generally consist of a combination of the following: bankruptcy, failure to pay, restructuring, obligation acceleration, obligation default, or repudiation/moratorium, each as defined in the 2003 ISDA Credit Derivatives Definitions as amended by the relevant agreement. Restructuring is generally not applicable when the reference obligation is issued by a North American corporation and obligation acceleration, obligation default, or repudiation/moratorium are generally only
applicable when the reference obligation is issued by a sovereign entity or an entity in an emerging country. Upon determination of the final price for the deliverable
52
Notes to Financial Statements (unaudited) – continued
obligation (or upon delivery of the deliverable obligation in the case of physical settlement), the difference between the value of the deliverable obligation and the swap agreement’s notional amount is recorded as realized gain or loss on swap agreements in the Statement of Operations.
Credit default swap agreements are considered to have credit-risk-related contingent features since they trigger payment by the protection seller to the protection buyer upon the occurrence of a defined credit event. The maximum amount of future, undiscounted payments that the fund, as protection seller, could be required to make is equal to the swap agreement’s notional amount. The protection seller’s payment obligation would be offset to the extent of the value of the agreement’s deliverable obligation. At April 30, 2019, the fund did not hold any credit default swap agreements at an unrealized loss where it is the protection seller. The fund’s maximum risk of loss from counterparty risk, either as the protection seller or as the protection buyer, is the fair value of the agreement.
Security Loans– Under its Securities Lending Agency Agreement with the fund, JPMorgan Chase and Co., as lending agent, loans the securities of the fund to certain qualified institutions (the “Borrowers”) approved by the fund. Security loans can be terminated at the discretion of either the lending agent or the fund and the related securities must be returned within the earlier of the standard trade settlement period for such securities or within three business days. The loans are collateralized by cash and/or U.S. Treasury and federal agency obligations in an amount typically at least equal to the market value of the securities loaned. On loans collateralized by cash, the cash collateral is invested in a money market fund. The market value of the loaned securities is determined at the close of business of the fund and any additional required collateral is delivered to the fund on the next business day. The lending agent provides the fund with indemnification against Borrower default. In the event of Borrower default, the lending agent will, for the benefit of the fund, either purchase securities identical to those loaned or, when such purchase is commercially impracticable, pay the fund the market value of the loaned securities. In return, the lending agent assumes the fund’s rights to the related collateral. If the collateral value is less than the cost to purchase identical securities, the lending agent is responsible for the shortfall, but only to the extent that such shortfall is not due to a decline in collateral value resulting from collateral reinvestment for which the fund bears the risk of loss. At period end, the fund had investment securities on loan, all of which were classified as equity securities in the fund’s Portfolio of Investments, with a fair value of $39,126,614. The fair value of the fund’s investment securities on loan and a related liability of $10,571,552 for cash collateral received on securities loaned are both presented gross in the Statement of Assets and Liabilities. Additionally, these loans were collateralized by U.S. Treasury Obligations of $30,646,025 held by the lending agent. The collateral on securities loaned exceeded the value of securities on loan at period end. The liability for cash collateral for securities loaned is carried at fair value, which is categorized as level 2 within the fair value hierarchy. A portion of the income generated upon investment of the collateral is remitted to the Borrowers, and the remainder is allocated between the fund and the lending agent. On loans collateralized by U.S. Treasury and/or federal agency obligations, a fee is received from the Borrower, and is allocated between the fund and the lending agent. Income from securities lending is separately reported in
53
Notes to Financial Statements (unaudited) – continued
the Statement of Operations. The dividend and interest income earned on the securities loaned is accounted for in the same manner as other dividend and interest income.
Indemnifications– Under the fund’s organizational documents, its officers and Trustees may be indemnified against certain liabilities and expenses arising out of the performance of their duties to the fund. Additionally, in the normal course of business, the fund enters into agreements with service providers that may contain indemnification clauses. The fund’s maximum exposure under these agreements is unknown as this would involve future claims that may be made against the fund that have not yet occurred.
Investment Transactions and Income– Investment transactions are recorded on the trade date. Interest income is recorded on the accrual basis. All premium and discount is amortized or accreted for financial statement purposes in accordance with U.S. generally accepted accounting principles. Dividends received in cash are recorded on theex-dividend date. Certain dividends from foreign securities will be recorded when the fund is informed of the dividend if such information is obtained subsequent to theex-dividend date. Dividend and interest payments received in additional securities are recorded on theex-dividend orex-interest date in an amount equal to the value of the security on such date.
The fund may receive proceeds from litigation settlements. Any proceeds received from litigation involving portfolio holdings are reflected in the Statement of Operations in realized gain/loss if the security has been disposed of by the fund or in unrealized gain/loss if the security is still held by the fund. Any other proceeds from litigation not related to portfolio holdings are reflected as other income in the Statement of Operations.
Fees Paid Indirectly– The fund’s custody fee may be reduced by a credit earned under an arrangement that measures the value of U.S. dollars deposited with the custodian by the fund. The amount of the credit, for the six months ended April 30, 2019, is shown as a reduction of total expenses in the Statement of Operations.
Tax Matters and Distributions– The fund intends to qualify as a regulated investment company, as defined under Subchapter M of the Internal Revenue Code, and to distribute all of its taxable income, including realized capital gains. As a result, no provision for federal income tax is required. The fund’s federal tax returns, when filed, will remain subject to examination by the Internal Revenue Service for a three year period. Management has analyzed the fund’s tax positions taken on federal and state tax returns for all open tax years and does not believe that there are any uncertain tax positions that require recognition of a tax liability. Foreign taxes, if any, have been accrued by the fund in the accompanying financial statements in accordance with the applicable foreign tax law. Foreign income taxes may be withheld by certain countries in which the fund invests. Additionally, capital gains realized by the fund on securities issued in or by certain foreign countries may be subject to capital gains tax imposed by those countries.
Distributions to shareholders are recorded on theex-dividend date. Income and capital gain distributions are determined in accordance with income tax regulations, which may differ from U.S. generally accepted accounting principles. Certain capital accounts
54
Notes to Financial Statements (unaudited) – continued
in the financial statements are periodically adjusted for permanent differences in order to reflect their tax character. These adjustments have no impact on net assets or net asset value per share. Temporary differences which arise from recognizing certain items of income, expense, gain or loss in different periods for financial statement and tax purposes will reverse at some time in the future. Distributions in excess of net investment income or net realized gains are temporary overdistributions for financial statement purposes resulting from differences in the recognition or classification of income or distributions for financial statement and tax purposes.
Book/tax differences primarily relate to amortization and accretion of debt securities, wash sale loss deferrals, straddle loss deferrals, derivative transactions, and treating a portion of the proceeds from redemptions as a distribution for tax purposes.
The tax character of distributions made during the current period will be determined at fiscal year end. The tax character of distributions declared to shareholders for the last fiscal year is as follows:
| | | | |
| |
| | | Year ended
10/31/18 | |
Ordinary income (including any
short-term capital gains) | | | $32,594,612 | |
| Long-term capital gains | | | 31,102,646 | |
| |
| Total distributions | | | $63,697,258 | |
The federal tax cost and the tax basis components of distributable earnings were as follows:
| | | | |
| |
| As of 4/30/19 | | | |
| |
| Cost of investments | | | $1,518,369,240 | |
| Gross appreciation | | | 369,509,092 | |
| |
| Gross depreciation | | | (26,679,228 | ) |
| Net unrealized appreciation (depreciation) | | | $342,829,864 | |
| |
| As of 10/31/18 | | | |
| |
| Undistributed long-term capital gain | | | 33,180,323 | |
| Other temporary differences | | | 411,657 | |
| Net unrealized appreciation (depreciation) | | | 244,377,024 | |
The aggregate cost above includes prior fiscal year end tax adjustments, if applicable.
Multiple Classes of Shares of Beneficial Interest– The fund offers multiple classes of shares, which differ in their respective distribution and service fees. The fund’s income, realized and unrealized gain (loss), and common expenses are allocated to shareholders based on the daily net assets of each class. Dividends are declared separately for each class. Differences in per share dividend rates are generally due to differences in separate class expenses. Class B shares will convert to Class A shares approximately eight years after purchase. Class C shares will convert to Class A shares
55
Notes to Financial Statements (unaudited) – continued
approximately ten years after purchase. The fund’s distributions declared to shareholders as reported in the Statements of Changes in Net Assets are presented by class as follows:
| | | | | | | | | | | | | | | | |
| | | From net investment
income | | | From net realized
gain | |
| | | | |
| | | Six months
ended
4/30/19 | | | Year
ended
10/31/18 | | | Six months
ended
4/30/19 | | | Year
ended
10/31/18 | |
| Class A | | | $3,366,416 | | | | $12,063,238 | | | | $11,667,026 | | | | $10,187,177 | |
| Class B | | | 19,466 | | | | 303,531 | | | | 554,501 | | | | 608,436 | |
| Class C | | | 153,792 | | | | 2,291,285 | | | | 3,999,069 | | | | 4,409,043 | |
| Class I | | | 3,631,482 | | | | 12,502,684 | | | | 10,381,703 | | | | 8,175,407 | |
| Class R1 | | | 1,681 | | | | 15,115 | | | | 37,461 | | | | 31,776 | |
| Class R2 | | | 43,273 | | | | 213,633 | | | | 226,811 | | | | 253,835 | |
| Class R3 | | | 87,198 | | | | 291,146 | | | | 302,085 | | | | 272,032 | |
| Class R4 | | | 46,172 | | | | 120,926 | | | | 126,378 | | | | 66,180 | |
| Class R6 | | | 1,985,899 | | | | 7,180,536 | | | | 5,910,431 | | | | 4,711,278 | |
| Total | | | $9,335,379 | | | | $34,982,094 | | | | $33,205,465 | | | | $28,715,164 | |
(3) Transactions with Affiliates
Investment Adviser– The fund has an investment advisory agreement with MFS to provide overall investment management and related administrative services and facilities to the fund. The management fee is computed daily and paid monthly at the following annual rates based on the fund’s average daily net assets:
| | | | |
| Up to $500 million | | | 0.84 | % |
| In excess of $500 million and up to $1 billion | | | 0.75 | % |
| In excess of $1 billion and up to $2.5 billion | | | 0.70 | % |
| In excess of $2.5 billion | | | 0.65 | % |
MFS has agreed in writing to reduce its management fee by a specified amount if certain MFS mutual fund assets exceed thresholds agreed to by MFS and the fund’s Board of Trustees. For the six months ended April 30, 2019, this management fee reduction amounted to $94,037, which is included in the reduction of total expenses in the Statement of Operations. The management fee incurred for the six months ended April 30, 2019 was equivalent to an annual effective rate of 0.74% of the fund’s average daily net assets.
The investment adviser has agreed in writing to pay a portion of the fund’s total annual operating expenses, excluding interest, taxes, extraordinary expenses, brokerage and transaction costs, and investment-related expenses, such that total fund operating expenses do not exceed the following rates annually of each class’s average daily net assets:
| | | | | | | | | | | | | | | | | | | | | | | | | | | | | | | | |
| Classes | |
| | | | | | | | |
| A | | B | | | C | | | I | | | R1 | | | R2 | | | R3 | | | R4 | | | R6 | |
| 1.09% | | | 1.84% | | | | 1.84% | | | | 0.84% | | | | 1.84% | | | | 1.34% | | | | 1.09% | | | | 0.84% | | | | 0.78% | |
This written agreement will continue until modified by the fund’s Board of Trustees, but such agreement will continue at least until February 29, 2020. For the six months
56
Notes to Financial Statements (unaudited) – continued
ended April 30, 2019, this reduction amounted to $660,607, which is included in the reduction of total expenses in the Statement of Operations.
Distributor– MFS Fund Distributors, Inc. (MFD), a wholly-owned subsidiary of MFS, as distributor, received $58,465 for the six months ended April 30, 2019, as its portion of the initial sales charge on sales of Class A shares of the fund.
The Board of Trustees has adopted a distribution plan for certain share classes pursuant to Rule12b-1 of the Investment Company Act of 1940.
The fund’s distribution plan provides that the fund will pay MFD for services provided by MFD and financial intermediaries in connection with the distribution and servicing of certain share classes. One component of the plan is a distribution fee paid to MFD and another component of the plan is a service fee paid to MFD. MFD may subsequently pay all, or a portion, of the distribution and/or service fees to financial intermediaries.
Distribution Plan Fee Table:
| | | | | | | | | | | | | | | | | | | | |
| | | | | |
| | | Distribution
Fee Rate (d) | | | Service
Fee Rate (d) | | | Total
Distribution
Plan (d) | | | Annual
Effective
Rate (e) | | | Distribution
and Service
Fee | |
| Class A | | | — | | | | 0.25% | | | | 0.25% | | | | 0.25% | | | | $902,283 | |
| Class B | | | 0.75% | | | | 0.25% | | | | 1.00% | | | | 1.00% | | | | 169,093 | |
| Class C | | | 0.75% | | | | 0.25% | | | | 1.00% | | | | 1.00% | | | | 1,208,548 | |
| Class R1 | | | 0.75% | | | | 0.25% | | | | 1.00% | | | | 1.00% | | | | 11,808 | |
| Class R2 | | | 0.25% | | | | 0.25% | | | | 0.50% | | | | 0.50% | | | | 32,539 | |
| Class R3 | | | — | | | | 0.25% | | | | 0.25% | | | | 0.25% | | | | 22,985 | |
| Total Distribution and Service Fees | | | | | | | | | | | | $2,347,256 | |
| (d) | In accordance with the distribution plan for certain classes, the fund pays distribution and/or service fees equal to these annual percentage rates of each class’s average daily net assets. The distribution and service fee rates disclosed by class represent the current rates in effect at the end of the reporting period. Any rate changes, if applicable, are detailed below. |
| (e) | The annual effective rates represent actual fees incurred under the distribution plan for the six months ended April 30, 2019 based on each class’s average daily net assets. MFD has voluntarily agreed to rebate a portion of each class’s 0.25% service fee attributable to accounts for which MFD retains the 0.25% service fee except for accounts attributable to MFS or its affiliates’ seed money. For the six months ended April 30, 2019, this rebate amounted to $7,714, $114, $437, and $5 for Class A, Class B, Class C, and Class R1, respectively, and is included in the reduction of total expenses in the Statement of Operations. |
Certain Class A shares are subject to a contingent deferred sales charge (CDSC) in the event of a shareholder redemption within 18 months of purchase. Class B shares are subject to a CDSC in the event of a shareholder redemption within six years of purchase. Class C shares are subject to a CDSC in the event of a shareholder redemption within 12 months of purchase. All contingent deferred sales charges are paid to MFD and during the six months ended April 30, 2019, were as follows:
| | | | |
| |
| | | Amount | |
| Class A | | | $9,550 | |
| Class B | | | 21,005 | |
| Class C | | | 10,672 | |
57
Notes to Financial Statements (unaudited) – continued
Shareholder Servicing Agent– MFS Service Center, Inc. (MFSC), a wholly-owned subsidiary of MFS, receives a fee from the fund for its services as shareholder servicing agent calculated as a percentage of the average daily net assets of the fund as determined periodically under the supervision of the fund’s Board of Trustees. For the six months ended April 30, 2019, the fee was $68,419, which equated to 0.0072% annually of the fund’s average daily net assets. MFSC also receives payment from the fund forout-of-pocket expenses,sub-accounting and other shareholder servicing costs which may be paid to affiliated and unaffiliated service providers. Class R6 shares do not incursub-accounting fees. For the six months ended April 30, 2019, theseout-of-pocket expenses,sub-accounting and other shareholder servicing costs amounted to $896,602.
Administrator– MFS provides certain financial, legal, shareholder communications, compliance, and other administrative services to the fund. Under an administrative services agreement, the fund reimburses MFS the costs incurred to provide these services. The fund is charged an annual fixed amount of $17,500 plus a fee based on average daily net assets. The administrative services fee incurred for the six months ended April 30, 2019 was equivalent to an annual effective rate of 0.0141% of the fund’s average daily net assets.
Trustees’ and Officers’ Compensation– The fund pays compensation to independent Trustees in the form of a retainer, attendance fees, and additional compensation to Board and Committee chairpersons. The fund does not pay compensation directly to Trustees or officers of the fund who are also officers of the investment adviser, all of whom receive remuneration for their services to the fund from MFS. Certain officers and Trustees of the fund are officers or directors of MFS, MFD, and MFSC.
Prior to December 31, 2001, the fund had an unfunded defined benefit plan (“DB plan”) for independent Trustees. As of December 31, 2001, the Board took action to terminate the DB plan with respect to then-current and any future independent Trustees, such that the DB plan covers only certain of those former independent Trustees who retired on or before December 31, 2001. The DB plan resulted in a pension expense of $551 and is included in “Independent Trustees’ compensation” in the Statement of Operations for the six months ended April 30, 2019. The liability for deferred retirement benefits payable to those former independent Trustees under the DB plan amounted to $2,437 at April 30, 2019, and is included in “Payable for independent Trustees’ compensation” in the Statement of Assets and Liabilities.
Other– This fund and certain other funds managed by MFS (the funds) have entered into a service agreement (the ISO Agreement) which provides for payment of fees solely by the funds to Tarantino LLC in return for the provision of services of an Independent Senior Officer (ISO) for the funds. Frank L. Tarantino serves as the ISO and is an officer of the funds and the sole member of Tarantino LLC. The funds can terminate the ISO Agreement with Tarantino LLC at any time under the terms of the ISO Agreement. For the six months ended April 30, 2019, the fee paid by the fund under this agreement was $1,816 and is included in “Miscellaneous” expense in the Statement of Operations. MFS has agreed to bear all expenses associated with office space, other administrative support, and supplies provided to the ISO.
58
Notes to Financial Statements (unaudited) – continued
The fund invests in the MFS Institutional Money Market Portfolio which is managed by MFS and seeks current income consistent with preservation of capital and liquidity. This money market fund does not pay a management fee to MFS.
The fund is permitted to engage in purchase and sale transactions with funds and accounts for which MFS serves as investment adviser orsub-adviser (“cross-trades”) pursuant to a policy adopted by the Board of Trustees. This policy has been designed to ensure that cross-trades conducted by the fund comply with Rule17a-7 under the Investment Company Act of 1940. During the six months ended April 30, 2019, the fund engaged in purchase and sale transactions pursuant to this policy, which amounted to $74,417 and $2,207,681, respectively. The sales transactions resulted in net realized gains (losses) of $178,045.
(4) Portfolio Securities
For the six months ended April 30, 2019, purchases and sales of investments, other than purchased option transactions and short-term obligations, were as follows:
| | | | | | | | |
| | |
| | | Purchases | | | Sales | |
| U.S. Government securities | | | $206,023,868 | | | | $319,201,985 | |
| Non-U.S. Government securities | | | $465,136,993 | | | | $705,801,013 | |
(5) Shares of Beneficial Interest
The fund’s Declaration of Trust permits the Trustees to issue an unlimited number of full and fractional shares of beneficial interest. Transactions in fund shares were as follows:
| | | | | | | | | | | | | | | | |
| | | Six months ended
4/30/19 | | | Year ended
10/31/18 | |
| | | | |
| | | Shares | | | Amount | | | Shares | | | Amount | |
| Shares sold | | | | | | | | | | | | | | | | |
Class A | | | 2,257,441 | | | | $38,499,973 | | | | 7,655,177 | | | | $137,643,105 | |
Class B | | | 47,276 | | | | 824,629 | | | | 172,706 | | | | 3,178,519 | |
Class C | | | 528,253 | | | | 8,978,710 | | | | 2,462,634 | | | | 44,793,638 | |
Class I | | | 3,599,342 | | | | 60,596,698 | | | | 14,331,061 | | | | 256,048,617 | |
Class R1 | | | 10,488 | | | | 181,144 | | | | 93,172 | | | | 1,651,598 | |
Class R2 | | | 124,024 | | | | 2,088,418 | | | | 275,535 | | | | 4,924,415 | |
Class R3 | | | 83,775 | | | | 1,433,037 | | | | 342,806 | | | | 6,080,609 | |
Class R4 | | | 63,375 | | | | 1,091,486 | | | | 273,422 | | | | 4,894,903 | |
Class R6 | | | 1,565,856 | | | | 26,451,868 | | | | 5,283,105 | | | | 94,303,397 | |
| | | 8,279,830 | | | | $140,145,963 | | | | 30,889,618 | | | | $553,518,801 | |
59
Notes to Financial Statements (unaudited) – continued
| | | | | | | | | | | | | | | | |
| | | Six months ended
4/30/19 | | | Year ended
10/31/18 | |
| | | | |
| | | Shares | | | Amount | | | Shares | | | Amount | |
| Shares issued to shareholders in reinvestment of distributions | | | | | | | | | | | | | | | | |
Class A | | | 862,242 | | | | $14,084,139 | | | | 1,157,923 | | | | $20,709,343 | |
Class B | | | 30,902 | | | | 511,765 | | | | 44,425 | | | | 812,206 | |
Class C | | | 212,731 | | | | 3,472,069 | | | | 314,403 | | | | 5,668,272 | |
Class I | | | 733,914 | | | | 11,862,129 | | | | 985,503 | | | | 17,423,658 | |
Class R1 | | | 2,407 | | | | 39,142 | | | | 2,607 | | | | 46,891 | |
Class R2 | | | 7,303 | | | | 117,751 | | | | 9,199 | | | | 163,102 | |
Class R3 | | | 23,908 | | | | 389,283 | | | | 31,535 | | | | 563,178 | |
Class R4 | | | 10,484 | | | | 171,603 | | | | 10,476 | | | | 186,946 | |
Class R6 | | | 461,736 | | | | 7,448,754 | | | | 639,171 | | | | 11,307,672 | |
| | | 2,345,627 | | | | $38,096,635 | | | | 3,195,242 | | | | $56,881,268 | |
| | | | |
| Shares reacquired | | | | | | | | | | | | | | | | |
Class A | | | (4,363,903 | ) | | | $(74,540,167 | ) | | | (9,037,037 | ) | | | $(162,259,764 | ) |
Class B | | | (355,842 | ) | | | (6,219,343 | ) | | | (776,912 | ) | | | (14,236,975 | ) |
Class C | | | (2,445,580 | ) | | | (41,948,038 | ) | | | (6,404,461 | ) | | | (115,151,235 | ) |
Class I | | | (11,310,826 | ) | | | (190,315,565 | ) | | | (8,369,881 | ) | | | (147,934,160 | ) |
Class R1 | | | (13,404 | ) | | | (231,728 | ) | | | (100,172 | ) | | | (1,790,775 | ) |
Class R2 | | | (260,435 | ) | | | (4,403,245 | ) | | | (647,660 | ) | | | (11,598,807 | ) |
Class R3 | | | (134,542 | ) | | | (2,272,166 | ) | | | (442,425 | ) | | | (7,918,900 | ) |
Class R4 | | | (67,687 | ) | | | (1,149,809 | ) | | | (177,994 | ) | | | (3,236,446 | ) |
Class R6 | | | (10,769,181 | ) | | | (175,196,403 | ) | | | (3,782,655 | ) | | | (67,105,695 | ) |
| | | (29,721,400 | ) | | | $(496,276,464 | ) | | | (29,739,197 | ) | | | $(531,232,757 | ) |
| | | | |
| Net change | | | | | | | | | | | | | | | | |
Class A | | | (1,244,220 | ) | | | $(21,956,055 | ) | | | (223,937 | ) | | | $(3,907,316 | ) |
Class B | | | (277,664 | ) | | | (4,882,949 | ) | | | (559,781 | ) | | | (10,246,250 | ) |
Class C | | | (1,704,596 | ) | | | (29,497,259 | ) | | | (3,627,424 | ) | | | (64,689,325 | ) |
Class I | | | (6,977,570 | ) | | | (117,856,738 | ) | | | 6,946,683 | | | | 125,538,115 | |
Class R1 | | | (509 | ) | | | (11,442 | ) | | | (4,393 | ) | | | (92,286 | ) |
Class R2 | | | (129,108 | ) | | | (2,197,076 | ) | | | (362,926 | ) | | | (6,511,290 | ) |
Class R3 | | | (26,859 | ) | | | (449,846 | ) | | | (68,084 | ) | | | (1,275,113 | ) |
Class R4 | | | 6,172 | | | | 113,280 | | | | 105,904 | | | | 1,845,403 | |
Class R6 | | | (8,741,589 | ) | | | (141,295,781 | ) | | | 2,139,621 | | | | 38,505,374 | |
| | | (19,095,943 | ) | | | $(318,033,866 | ) | | | 4,345,663 | | | | $79,167,312 | |
Class T shares were not publicly available for sale during the period. Please see the fund’s prospectus for details.
Effective June 1, 2019, purchases of the fund’s Class B shares are closed to new and existing investors subject to certain exceptions. Please see the fund’s prospectus for details.
60
Notes to Financial Statements (unaudited) – continued
(6) Line of Credit
The fund and certain other funds managed by MFS participate in a $1.25 billion unsecured committed line of credit, subject to a $1 billion sublimit, provided by a syndicate of banks under a credit agreement. Borrowings may be made for temporary financing needs. Interest is charged to each fund, based on its borrowings, generally at a rate equal to the highest of one month LIBOR, the Federal Funds Effective Rate and the Overnight Bank Funding Rate, plus an agreed upon spread. A commitment fee, based on the average daily, unused portion of the committed line of credit, is allocated among the participating funds. In addition, the fund and other funds managed by MFS have established unsecured uncommitted borrowing arrangements with certain banks for temporary financing needs. Interest is charged to each fund, based on its borrowings, at rates equal to customary reference rates plus an agreed upon spread. For the six months ended April 30, 2019, the fund’s commitment fee and interest expense were $6,643 and $0, respectively, and are included in “Miscellaneous” expense in the Statement of Operations.
(7) Investments in Affiliated Issuers
An affiliated issuer may be considered one in which the fund owns 5% or more of the outstanding voting securities, or a company which is under common control. For the purposes of this report, the fund assumes the following to be affiliated issuers:
| | | | | | | | | | | | | | | | | | | | | | | | |
| | | | | | |
| Affiliated Issuers | | Beginning
Value | | | Purchases | | | Sales
Proceeds | | | Realized
Gain
(Loss) | | | Change in
Unrealized
Appreciation or
Depreciation | | | Ending
Value | |
| MFS Institutional Money Market Portfolio | | | $45,719,572 | | | | $403,510,735 | | | | $392,354,249 | | | | $(2,065 | ) | | | $3,336 | | | | $56,877,329 | |
| | | | | | |
| Affiliated Issuers | | | | | | | | | | | | | | Dividend
Income | | | Capital Gain
Distributions | |
| MFS Institutional Money Market Portfolio | | | | | | | | | | | | $751,655 | | | | $— | |
61
PROXY VOTING POLICIES AND INFORMATION
MFS votes proxies on behalf of the fund pursuant to proxy voting policies and procedures that are available without charge, upon request, by calling1-800-225-2606, by visitingmfs.com/proxyvoting, or by visiting the SEC’s Web site athttp://www.sec.gov.
Information regarding how the fund voted proxies relating to portfolio securities during the most recent twelve-month period ended June 30 is available by August 31 of each year without charge by visitingmfs.com/proxyvoting, or by visiting the SEC’s Web site athttp://www.sec.gov.
QUARTERLY PORTFOLIO DISCLOSURE
The fund files a complete schedule of portfolio holdings with the SEC for the first and third quarters of each fiscal year on Form N-Q or as an exhibit to its reports onForm N-PORT (for first and third fiscal quarters ending March 31, 2019 or after). The fund’s Form N-Q or Form N-PORT reports are available on the SEC’s website athttp://www.sec.gov.A shareholder can obtain the portfolio holdings report for the first and third quarters of the fund’s fiscal year atmfs.com/openendfunds by choosing the fund’s name and then selecting the “Resources” tab and clicking on “Prospectus and Reports”.
FURTHER INFORMATION
From time to time, MFS may post important information about the fund or the MFS funds on the MFS web site (mfs.com). This information is available athttps://www.mfs.com/en-us/what-we-do/announcements.html or atmfs.com/openendfunds by choosing the fund’s name.
INFORMATION ABOUT FUND CONTRACTS AND LEGAL CLAIMS
The fund has entered into contractual arrangements with an investment adviser, administrator, distributor, shareholder servicing agent, 529 program manager (if applicable), and custodian who each provide services to the fund. Unless expressly stated otherwise, shareholders are not parties to, or intended beneficiaries of these contractual arrangements, and these contractual arrangements are not intended to create any shareholder right to enforce them against the service providers or to seek any remedy under them against the service providers, either directly or on behalf of the fund.
Under the Trust’s By-Laws and Declaration of Trust, any claims asserted against or on behalf of the MFS Funds, including claims against Trustees and Officers, must be brought in state and federal courts located within the Commonwealth of Massachusetts.
PROVISION OF FINANCIAL REPORTS AND SUMMARY PROSPECTUSES
The fund produces financial reports every six months and updates its summary prospectus and prospectus annually. To avoid sending duplicate copies of materials to households, only one copy of the fund’s annual and semiannual report and summary prospectus may be mailed to shareholders having the same last name and residential address on the fund’s records. However, any shareholder may contact MFSC (please see back cover for address and telephone number) to request that copies of these reports and summary prospectuses be sent personally to that shareholder.
62
Save paper with eDelivery.

MFS® will send you prospectuses, |
reports, and proxies directly viae-mail so you will get information faster with less mailbox clutter.
To sign up:
1. Go to mfs.com.
2. Log in via MFS® Access.
3. Select eDelivery.
If you own your MFS fund shares through a financial institution or a retirement plan, MFS® TALK, MFS® Access, or eDelivery may not be available to you.
CONTACT
WEB SITE
mfs.com
MFS TALK
1-800-637-8255
24 hours a day
ACCOUNT SERVICE AND LITERATURE
Shareholders
1-800-225-2606
Financial advisors
1-800-343-2829
Retirement plan services
1-800-637-1255
MAILING ADDRESS
MFS Service Center, Inc.
P.O. Box 219341
Kansas City, MO 64121-9341
OVERNIGHT MAIL
MFS Service Center, Inc.
Suite 219341
430 W 7th Street
Kansas City, MO 64105-1407
Semiannual Report
April 30, 2019

MFS® Utilities Fund

Beginning on January 1, 2021, as permitted by regulations adopted by the U.S. Securities and Exchange Commission, paper copies of the fund’s annual and semiannual shareholder reports will no longer be sent by mail, unless you specifically request paper copies of the reports. Instead, the complete reports will be made available on the fund’s Web site (funds.mfs.com), and you will be notified by mail each time a report is posted and provided with a Web site link to access the report.
If you are already signed up to receive shareholder reports by email, you will not be affected by this change and you need not take any action. You may sign up to receive shareholder reports and other communications from the fund by email by contacting your financial intermediary (such as a broker-dealer or bank) or, if you hold your shares directly with the fund, by calling 1-800-225-2606 or by logging on to MFS Access at mfs.com.
Beginning on January 1, 2019, you may elect to receive all future reports in paper free of charge. Contact your financial intermediary to request that you continue to receive paper copies of your shareholder reports. If you invest directly with the fund, you can call 1-800-225-2606 or send an email request to orderliterature@mfs.com to let the fund know that you wish to continue receiving paper copies of your shareholder reports. Your election to receive reports in paper will apply to all funds held in your account if you invest through your financial intermediary or all funds held with the MFS fund complex if you invest directly.
MMU-SEM
MFS® Utilities Fund
CONTENTS
The report is prepared for the general information of shareholders.
It is authorized for distribution to prospective investors only when preceded or accompanied by a current prospectus.
NOT FDIC INSURED• MAY LOSE VALUE• NO BANK GUARANTEE

LETTER FROM THE EXECUTIVE CHAIRMAN
Dear Shareholders:
Markets experienced a bout of volatility in late 2018 as a result of higher interest rates, international trade friction, and geopolitical uncertainty surrounding issues such as
Brexit. Those concerns dissipated in the early months of 2019 due to the more dovish posture of the U.S. Federal Reserve and other global central banks, reported progress toward a trade pact between the United States and China, and action against ano-deal Brexit by the British Parliament. However, a last-minute breakdown in negotiations between the U.S. and China derailed the market’s momentum and increased concerns over the future pace of global growth. Compounding Brexit uncertainty was the resignation of British Prime Minister Theresa May, potentially ushering in a harder form of Brexit than she had advocated. U.S. equities have continued to outperform their global peers due in
part to fiscal stimulus undertaken in late 2017 and early 2018, which contributed to the continuation of relatively healthy levels of U.S. economic output against a backdrop of slower global growth. Inflation remains largely subdued globally, which is encouraging for asset markets. Rising incomes in many developed and emerging markets are supportive of gains in consumption, though a challenging environment for global trade has hindered manufacturing in most regions.
Since launching the first U.S.open-end mutual fund in 1924, MFS® has been committed to a single purpose: to create value by allocating capital responsibly for clients. Through our powerful global investment platform, we combine collective expertise, thoughtful risk management, and long-term discipline to uncover what we believe are the best investment opportunities in the market.
Respectfully,

Robert J. Manning
Executive Chairman
MFS Investment Management
June 17, 2019
The opinions expressed in this letter are subject to change and may not be relied upon for investment advice. No forecasts can be guaranteed.
1
PORTFOLIO COMPOSITION
Portfolio structure
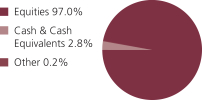
| | | | |
| Top ten holdings | |
| EDP Renovaveis S.A. | | | 5.1% | |
| Exelon Corp. | | | 5.1% | |
| NextEra Energy, Inc. | | | 3.8% | |
| FirstEnergy Corp. | | | 3.5% | |
| Public Service Enterprise Group, Inc. | | | 3.0% | |
| American Electric Power Co., Inc. | | | 2.9% | |
| Entergy Corp. | | | 2.7% | |
| Enel S.p.A | | | 2.5% | |
| Sempra Energy | | | 2.5% | |
| Iberdrola S.A. | | | 2.4% | |
| | | | |
| Top five industries | |
| Utilities – Electric Power | | | 56.9% | |
| Natural Gas – Pipeline | | | 13.1% | |
| Telecommunications – Wireless | | | 7.9% | |
| Natural Gas – Distribution | | | 6.4% | |
| Cable TV | | | 6.2% | |
|
| Issuer country weightings (x) | |
| United States | | | 65.7% | |
| Canada | | | 7.4% | |
| Portugal | | | 6.9% | |
| Spain | | | 3.8% | |
| Sweden | | | 2.7% | |
| Italy | | | 2.5% | |
| United Kingdom | | | 1.7% | |
| China | | | 1.3% | |
| Germany | | | 1.2% | |
| Other Countries | | | 6.8% | |
| (x) | Represents the portfolio’s exposure to issuer countries as a percentage of a portfolio’s net assets. For purposes of this presentation, United States includes Cash & Cash Equivalents and Other. |
Where the fund holds convertible bonds, they are treated as part of the equity portion of the portfolio.
Cash & Cash Equivalents includes any cash, investments in money market funds, short-term securities, and other assets less liabilities. Please see the Statement of Assets and Liabilities for additional information related to the fund’s cash position and other assets and liabilities.
Other includes equivalent exposure from currency derivatives and/or any offsets to derivative positions.
Percentages are based on net assets as of April 30, 2019.
The portfolio is actively managed and current holdings may be different.
2
EXPENSE TABLE
Fund expenses borne by the shareholders during the period, November 1, 2018 through April 30, 2019
As a shareholder of the fund, you incur two types of costs: (1) transaction costs, including sales charges (loads) on certain purchase or redemption payments, and (2) ongoing costs, including management fees; distribution and service(12b-1) fees; and other fund expenses. This example is intended to help you understand your ongoing costs (in dollars) of investing in the fund and to compare these costs with the ongoing costs of investing in other mutual funds.
The example is based on an investment of $1,000 invested at the beginning of the period and held for the entire period November 1, 2018 through April 30, 2019.
Actual Expenses
The first line for each share class in the following table provides information about actual account values and actual expenses. You may use the information in this line, together with the amount you invested, to estimate the expenses that you paid over the period. Simply divide your account value by $1,000 (for example, an $8,600 account value divided by $1,000 = 8.6), then multiply the result by the number in the first line under the heading entitled “Expenses Paid During Period” to estimate the expenses you paid on your account during this period.
Hypothetical Example for Comparison Purposes
The second line for each share class in the following table provides information about hypothetical account values and hypothetical expenses based on the fund’s actual expense ratio and an assumed rate of return of 5% per year before expenses, which is not the fund’s actual return. The hypothetical account values and expenses may not be used to estimate the actual ending account balance or expenses you paid for the period. You may use this information to compare the ongoing costs of investing in the fund and other funds. To do so, compare this 5% hypothetical example with the 5% hypothetical examples that appear in the shareholder reports of the other funds.
Please note that the expenses shown in the table are meant to highlight your ongoing costs only and do not reflect any transactional costs, such as sales charges (loads). Therefore, the second line for each share class in the table is useful in comparing ongoing costs only, and will not help you determine the relative total costs of owning different funds. In addition, if these transactional costs were included, your costs would have been higher.
3
Expense Table – continued
| | | | | | | | | | | | | | | | | | |
Share
Class | | | | Annualized
Expense
Ratio | | | Beginning
Account Value
11/01/18 | | | Ending
Account Value
4/30/19 | | | Expenses
Paid During
Period (p)
11/01/18-4/30/19 | |
| A | | Actual | | | 0.99% | | | | $1,000.00 | | | | $1,126.91 | | | | $5.22 | |
| | Hypothetical (h) | | | 0.99% | | | | $1,000.00 | | | | $1,019.89 | | | | $4.96 | |
| B | | Actual | | | 1.75% | | | | $1,000.00 | | | | $1,122.80 | | | | $9.21 | |
| | Hypothetical (h) | | | 1.75% | | | | $1,000.00 | | | | $1,016.12 | | | | $8.75 | |
| C | | Actual | | | 1.75% | | | | $1,000.00 | | | | $1,122.31 | | | | $9.21 | |
| | Hypothetical (h) | | | 1.75% | | | | $1,000.00 | | | | $1,016.12 | | | | $8.75 | |
| I | | Actual | | | 0.75% | | | | $1,000.00 | | | | $1,128.27 | | | | $3.96 | |
| | Hypothetical (h) | | | 0.75% | | | | $1,000.00 | | | | $1,021.08 | | | | $3.76 | |
| R1 | | Actual | | | 1.75% | | | | $1,000.00 | | | | $1,122.63 | | | | $9.21 | |
| | Hypothetical (h) | | | 1.75% | | | | $1,000.00 | | | | $1,016.12 | | | | $8.75 | |
| R2 | | Actual | | | 1.25% | | | | $1,000.00 | | | | $1,124.81 | | | | $6.59 | |
| | Hypothetical (h) | | | 1.25% | | | | $1,000.00 | | | | $1,018.60 | | | | $6.26 | |
| R3 | | Actual | | | 1.00% | | | | $1,000.00 | | | | $1,126.96 | | | | $5.27 | |
| | Hypothetical (h) | | | 1.00% | | | | $1,000.00 | | | | $1,019.84 | | | | $5.01 | |
| R4 | | Actual | | | 0.75% | | | | $1,000.00 | | | | $1,128.16 | | | | $3.96 | |
| | Hypothetical (h) | | | 0.75% | | | | $1,000.00 | | | | $1,021.08 | | | | $3.76 | |
| R6 | | Actual | | | 0.66% | | | | $1,000.00 | | | | $1,128.19 | | | | $3.48 | |
| | Hypothetical (h) | | | 0.66% | | | | $1,000.00 | | | | $1,021.52 | | | | $3.31 | |
| (h) | 5% class return per year before expenses. |
| (p) | “Expenses Paid During Period” are equal to each class’s annualized expense ratio, as shown above, multiplied by the average account value over the period, multiplied by 181/365 (to reflect theone-half year period). Expenses paid do not include any applicable sales charges (loads). If these transaction costs had been included, your costs would have been higher. |
4
PORTFOLIO OF INVESTMENTS
4/30/19 (unaudited)
The Portfolio of Investments is a complete list of all securities owned by your fund. It is categorized by broad-based asset classes.
| | | | | | | | |
| Common Stocks - 91.8% | | | | | | | | |
| | |
| Issuer | | Shares/Par | | | Value ($) | |
| Cable TV - 6.2% | | | | | | | | |
| Altice USA, Inc. | | | 2,910,849 | | | $ | 68,579,602 | |
| Charter Communications, Inc., “A” (a) | | | 86,653 | | | | 32,164,727 | |
| Comcast Corp., “A” | | | 1,690,994 | | | | 73,608,969 | |
| NOS, SGPS, S.A. | | | 4,720,975 | | | | 31,690,846 | |
| | | | | | | | |
| | | | | | | $ | 206,044,144 | |
| Energy - Independent - 2.0% | | | | | | | | |
| AltaGas Ltd. (l) | | | 2,011,079 | | | $ | 26,735,327 | |
| Enable Midstream Partners LP | | | 678,999 | | | | 9,451,666 | |
| Western Midstream Partners LP | | | 960,643 | | | | 30,337,106 | |
| | | | | | | | |
| | | | | | | $ | 66,524,099 | |
| Natural Gas - Distribution - 4.8% | | | | | | | | |
| China Resources Gas Group Ltd. | | | 9,076,000 | | | $ | 41,997,094 | |
| Italgas S.p.A | | | 260,752 | | | | 1,626,074 | |
| NiSource, Inc. | | | 1,219,518 | | | | 33,878,210 | |
| Sempra Energy | | | 635,957 | | | | 81,370,698 | |
| | | | | | | | |
| | | | | | | $ | 158,872,076 | |
| Natural Gas - Pipeline - 13.1% | | | | | | | | |
| APA Group | | | 2,017,845 | | | $ | 13,684,255 | |
| Cheniere Energy, Inc. (a) | | | 813,717 | | | | 52,362,689 | |
| Enbridge, Inc. | | | 1,622,153 | | | | 59,924,126 | |
| Energy Transfer LP | | | 1,313,786 | | | | 19,864,444 | |
| Enterprise Products Partners LP | | | 2,622,796 | | | | 75,090,650 | |
| EQM Midstream Partners LP | | | 965,925 | | | | 44,432,550 | |
| Equitrans Midstream Corp. | | | 919,264 | | | | 19,148,269 | |
| Plains All American Pipeline LP | | | 1,067,817 | | | | 24,719,964 | |
| TransCanada Corp. | | | 1,623,984 | | | | 77,508,052 | |
| Williams Cos., Inc. | | | 1,670,695 | | | | 47,330,789 | |
| | | | | | | | |
| | | | | | | $ | 434,065,788 | |
| Telecommunications - Wireless - 7.9% | | | | | | | | |
| Advanced Info Service Public Co. Ltd. | | | 4,176,200 | | | $ | 24,854,440 | |
| American Tower Corp., REIT | | | 302,685 | | | | 59,114,381 | |
| Cellnex Telecom S.A.U. | | | 1,487,056 | | | | 45,733,322 | |
| KDDI Corp. | | | 1,097,700 | | | | 25,092,328 | |
| Millicom International Cellular S.A. | | | 59,996 | | | | 3,548,763 | |
| Millicom International Cellular S.A., SDR | | | 679,023 | | | | 39,716,892 | |
5
Portfolio of Investments (unaudited) – continued
| | | | | | | | |
| | |
| Issuer | | Shares/Par | | | Value ($) | |
| Common Stocks - continued | | | | | | | | |
| Telecommunications - Wireless - continued | | | | | | | | |
| Mobile TeleSystems PJSC, ADR | | | 2,165,746 | | | $ | 17,066,078 | |
| Tele2 AB, “B” | | | 3,485,558 | | | | 46,500,287 | |
| | | | | | | | |
| | | | | | | $ | 261,626,491 | |
| Telephone Services - 4.5% | | | | | | | | |
| France Telecom | | | 1,802,502 | | | $ | 28,232,847 | |
| Hellenic Telecommunications Organization S.A. | | | 1,972,468 | | | | 27,388,521 | |
| PT XL Axiata Tbk | | | 74,208,225 | | | | 15,206,177 | |
| Royal KPN N.V. | | | 7,884,930 | | | | 24,196,464 | |
| Telesites S.A.B. de C.V. | | | 11,816,800 | | | | 8,028,399 | |
| TELUS Corp. | | | 1,225,091 | | | | 45,109,904 | |
| | | | | | | | |
| | | | | | | $ | 148,162,312 | |
| Utilities - Electric Power - 53.3% | | | | | | | | |
| AES Corp. | | | 2,286,932 | | | $ | 39,152,276 | |
| Algonquin Power & Utilities Corp. | | | 147,247 | | | | 1,680,530 | |
| American Electric Power Co., Inc. | | | 1,106,367 | | | | 94,649,697 | |
| Avangrid, Inc. | | | 128,811 | | | | 6,596,411 | |
| CenterPoint Energy, Inc. | | | 2,374,836 | | | | 73,619,916 | |
| Clearway Energy, Inc. | | | 783,359 | | | | 12,040,228 | |
| Dominion Energy, Inc. | | | 544,799 | | | | 42,423,498 | |
| Duke Energy Corp. | | | 457,601 | | | | 41,696,603 | |
| Edison International | | | 572,802 | | | | 36,527,584 | |
| EDP Renovaveis S.A. | | | 17,064,188 | | | | 169,381,849 | |
| Emera, Inc. (l) | | | 962,530 | | | | 36,146,066 | |
| Enel S.p.A | | | 13,015,996 | | | | 82,322,296 | |
| Energias de Portugal S.A. | | | 6,979,244 | | | | 26,450,540 | |
| Enersis Americas S.A., ADR | | | 951,561 | | | | 8,316,643 | |
| Entergy Corp. | | | 933,903 | | | | 90,495,201 | |
| Equatorial Energia S.A. | | | 798,700 | | | | 16,723,182 | |
| Evergy, Inc. | | | 1,033,196 | | | | 59,739,393 | |
| Eversource Energy | | | 141,757 | | | | 10,158,307 | |
| Exelon Corp. | | | 3,300,232 | | | | 168,146,820 | |
| FirstEnergy Corp. | | | 2,789,692 | | | | 117,250,755 | |
| Iberdrola S.A. | | | 8,820,811 | | | | 80,116,923 | |
| NextEra Energy Partners LP | | | 782,929 | | | | 36,038,222 | |
| NextEra Energy, Inc. | | | 653,864 | | | | 127,137,316 | |
| NRG Energy, Inc. | | | 1,691,261 | | | | 69,629,215 | |
| NTPC Ltd. | | | 8,477,178 | | | | 16,337,950 | |
| Orsted A/S | | | 22,229 | | | | 1,701,831 | |
| PPL Corp. | | | 1,052,146 | | | | 32,837,477 | |
| Public Service Enterprise Group, Inc. | | | 1,666,497 | | | | 99,406,546 | |
| RWE AG | | | 1,546,794 | | | | 39,503,310 | |
6
Portfolio of Investments (unaudited) – continued
| | | | | | | | |
| | |
| Issuer | | Shares/Par | | | Value ($) | |
| Common Stocks - continued | | | | | | | | |
| Utilities - Electric Power - continued | | | | | | | | |
| SSE PLC | | | 3,738,536 | | | $ | 55,794,957 | |
| Vistra Energy Corp. | | | 2,837,674 | | | | 77,326,617 | |
| | | | | | | | |
| | | | | | | $ | 1,769,348,159 | |
| Total Common Stocks (Identified Cost, $2,342,213,401) | | | $ | 3,044,643,069 | |
| | |
| Convertible Preferred Stocks - 5.2% | | | | | | | | |
| Natural Gas - Distribution - 1.6% | | | | | | | | |
| Sempra Energy, 6% | | | 172,694 | | | $ | 18,459,262 | |
| Sempra Energy, 6.75% | | | 173,133 | | | | 18,616,991 | |
| South Jersey Industries, Inc., 7.25% | | | 306,488 | | | | 15,823,975 | |
| | | | | | | | |
| | | | | | | $ | 52,900,228 | |
| Utilities - Electric Power - 3.6% | | | | | | | | |
| American Electric Power Co., Inc., 6.125% | | | 56,750 | | | $ | 2,949,865 | |
| CenterPoint Energy, Inc., 7% | | | 166,747 | | | | 8,877,610 | |
| Dominion Energy, Inc., 6.75% | | | 711,067 | | | | 35,716,896 | |
| NextEra Energy, Inc., 6.123% | | | 768,116 | | | | 47,930,438 | |
| Vistra Energy Corp., 7% | | | 247,993 | | | | 24,958,016 | |
| | | | | | | | |
| | | | | | | $ | 120,432,825 | |
Total Convertible Preferred Stocks
(Identified Cost, $156,738,569) | | | $ | 173,333,053 | |
| | |
| Investment Companies (h) - 2.7% | | | | | | | | |
| Money Market Funds - 2.7% | | | | | | | | |
MFS Institutional Money Market Portfolio, 2.48% (v)
(Identified Cost, $90,050,988) | | | 90,058,479 | | | $ | 90,058,479 | |
| | |
| Collateral for Securities Loaned - 1.2% | | | | | | | | |
JPMorgan U.S. Government Money Market Fund, 2.36% (j)
(Identified Cost, $39,417,974) | | | 39,417,974 | | | $ | 39,417,974 | |
| | |
| Other Assets, Less Liabilities - (0.9)% | | | | | | | (31,368,906 | ) |
| Net Assets - 100.0% | | | | | | $ | 3,316,083,669 | |
| (a) | Non-income producing security. |
| (h) | An affiliated issuer, which may be considered one in which the fund owns 5% or more of the outstanding voting securities, or a company which is under common control. At period end, the aggregate values of the fund’s investments in affiliated issuers and in unaffiliated issuers were $90,058,479 and $3,257,394,096, respectively. |
| (j) | The rate quoted is the annualizedseven-day yield of the fund at period end. |
| (l) | A portion of this security is on loan. See Note 2 for additional information. |
| (v) | Affiliated issuer that is available only to investment companies managed by MFS. The rate quoted for the MFS Institutional Money Market Portfolio is the annualizedseven-day yield of the fund at period end. |
7
Portfolio of Investments (unaudited) – continued
The following abbreviations are used in this report and are defined:
| ADR | | American Depositary Receipt |
| REIT | | Real Estate Investment Trust |
| SDR | | Swedish Depository Receipt |
Abbreviations indicate amounts shown in currencies other than the U.S. dollar. All amounts are stated in U.S. dollars unless otherwise indicated. A list of abbreviations is shown below:
Derivative Contracts at 4/30/19
Forward Foreign Currency Exchange Contracts
| | | | | | | | | | | | | | | | | | |
Currency
Purchased | | | Currency Sold | | Counterparty | | Settlement
Date | | | Unrealized
Appreciation
(Depreciation) | |
| Asset Derivatives | | | | | | | | |
| CAD | | | 2,675,591 | | | USD | | 1,986,860 | | Citibank N.A. | | | 7/12/2019 | | | | $13,954 | |
| USD | | | 161,556,016 | | | CAD | | 214,676,347 | | Merrill Lynch International | | | 7/12/2019 | | | | 1,020,533 | |
| USD | | | 10,975,507 | | | EUR | | 9,678,637 | | Citibank N.A. | | | 7/12/2019 | | | | 51,243 | |
| USD | | | 101,071,000 | | | EUR | | 88,540,407 | | JPMorgan Chase Bank N.A. | | | 6/17/2019 | | | | 1,358,276 | |
| USD | | | 236,495,325 | | | EUR | | 208,010,383 | | JPMorgan Chase Bank N.A. | | | 7/12/2019 | | | | 1,714,335 | |
| USD | | | 36,428,300 | | | GBP | | 27,758,385 | | Deutsche Bank AG | | | 7/12/2019 | | | | 93,986 | |
| USD | | | 54,421,134 | | | SEK | | 499,562,068 | | JPMorgan Chase Bank N.A. | | | 7/12/2019 | | | | 1,511,687 | |
| USD | | | 101,968 | | | SEK | | 938,270 | | Merrill Lynch International | | | 7/12/2019 | | | | 2,595 | |
| | | | | | | | | | | | | | | | | | |
| | | | | | | | | | | | | | | | | $5,766,609 | |
| | | | | | | | | | | | | | | | | | |
| Liability Derivatives | | | | | | | | |
| CAD | | | 2,831,630 | | | USD | | 2,120,245 | | Citibank N.A. | | | 7/12/2019 | | | | $(2,745 | ) |
| CAD | | | 2,318,420 | | | USD | | 1,739,913 | | Merrill Lynch International | | | 7/12/2019 | | | | (6,193 | ) |
| CAD | | | 3,240,379 | | | USD | | 2,426,679 | | Morgan Stanley Capital Services, Inc. | | | 7/12/2019 | | | | (3,516 | ) |
| EUR | | | 3,626,833 | | | USD | | 4,129,345 | | BNP Paribas S.A. | | | 7/12/2019 | | | | (35,744 | ) |
| EUR | | | 1,710,984 | | | USD | | 1,939,316 | | Merrill Lynch International | | | 7/12/2019 | | | | (8,132 | ) |
| EUR | | | 2,509,885 | | | USD | | 2,833,936 | | Morgan Stanley Capital Services, Inc. | | | 7/12/2019 | | | | (1,032 | ) |
| SEK | | | 7,260,006 | | | USD | | 786,453 | | State Street Bank Corp. | | | 7/12/2019 | | | | (17,534 | ) |
| USD | | | 1,351,735 | | | EUR | | 1,206,717 | | Citibank N.A. | | | 7/12/2019 | | | | (10,284 | ) |
| USD | | | 1,605,541 | | | SEK | | 15,209,306 | | Citibank N.A. | | | 7/12/2019 | | | | (5,302 | ) |
| | | | | | | | | | | | | | | | | | |
| | | | | | | | | | | | | | | | | $(90,482 | ) |
| | | | | | | | | | | | | | | | | | |
See Notes to Financial Statements
8
Financial Statements
STATEMENT OF ASSETS AND LIABILITIES
At 4/30/19 (unaudited)
This statement represents your fund’s balance sheet, which details the assets and liabilities comprising the total value of the fund.
| | | | |
| Assets | | | | |
Investments in unaffiliated issuers, at value, including $56,111,794 of securities on loan (identified cost, $2,538,369,944) | | | $3,257,394,096 | |
Investments in affiliated issuers, at value (identified cost, $90,050,988) | | | 90,058,479 | |
Receivables for | | | | |
Forward foreign currency exchange contracts | | | 5,766,609 | |
Investments sold | | | 6,222,099 | |
Fund shares sold | | | 1,862,231 | |
Interest and dividends | | | 6,176,277 | |
Other assets | | | 8,123 | |
Total assets | | | $3,367,487,914 | |
| |
| Liabilities | | | | |
Payables for | | | | |
Distributions | | | $441,396 | |
Forward foreign currency exchange contracts | | | 90,482 | |
Investments purchased | | | 5,774,470 | |
Fund shares reacquired | | | 3,518,531 | |
Collateral for securities loaned, at value (c) | | | 39,417,974 | |
Payable to affiliates | | | | |
Investment adviser | | | 108,600 | |
Shareholder servicing costs | | | 1,398,516 | |
Distribution and service fees | | | 57,408 | |
Payable for independent Trustees’ compensation | | | 2,793 | |
Deferred country tax expense payable | | | 422,870 | |
Accrued expenses and other liabilities | | | 171,205 | |
Total liabilities | | | $51,404,245 | |
Net assets | | | $3,316,083,669 | |
| |
| Net assets consist of | | | | |
Paid-in capital | | | $2,527,368,065 | |
Total distributable earnings (loss) | | | 788,715,604 | |
Net assets | | | $3,316,083,669 | |
Shares of beneficial interest outstanding | | | 150,813,867 | |
| (c) | Non-cash collateral is not included. |
9
Statement of Assets and Liabilities (unaudited) – continued
| | | | | | | | | | | | |
| | | |
| | | Net assets | | | Shares
outstanding | | | Net asset value
per share (a) | |
Class A | | | $1,838,390,438 | | | | 83,609,970 | | | | $21.99 | |
Class B | | | 110,867,011 | | | | 5,067,822 | | | | 21.88 | |
Class C | | | 426,259,742 | | | | 19,487,262 | | | | 21.87 | |
Class I | | | 662,130,925 | | | | 29,992,297 | | | | 22.08 | |
Class R1 | | | 6,948,234 | | | | 318,352 | | | | 21.83 | |
Class R2 | | | 58,360,999 | | | | 2,662,064 | | | | 21.92 | |
Class R3 | | | 76,609,667 | | | | 3,486,049 | | | | 21.98 | |
Class R4 | | | 49,747,728 | | | | 2,260,551 | | | | 22.01 | |
Class R6 | | | 86,768,925 | | | | 3,929,500 | | | | 22.08 | |
| (a) | Maximum offering price per share was equal to the net asset value per share for all share classes, except for Class A, for which the maximum offering price per share was $23.33 [100 / 94.25 x $21.99]. On sales of $50,000 or more, the maximum offering price of Class A shares is reduced. A contingent deferred sales charge may be imposed on redemptions of Class A, Class B, and Class C shares. Redemption price per share was equal to the net asset value per share for Classes I, R1, R2, R3, R4, and R6. |
See Notes to Financial Statements
10
Financial Statements
STATEMENT OF OPERATIONS
Six months ended 4/30/19 (unaudited)
This statement describes how much your fund earned in investment income and accrued in expenses. It also describes any gains and/or losses generated by fund operations.
| | | | |
| Net investment income (loss) | | | | |
Income | | | | |
Dividends | | | $52,364,844 | |
Dividends from affiliated issuers | | | 1,113,502 | |
Income on securities loaned | | | 192,586 | |
Other | | | 107,338 | |
Foreign taxes withheld | | | (4,433,186 | ) |
Total investment income | | | $49,345,084 | |
Expenses | | | | |
Management fee | | | $9,467,180 | |
Distribution and service fees | | | 5,089,650 | |
Shareholder servicing costs | | | 1,801,607 | |
Administrative services fee | | | 221,054 | |
Independent Trustees’ compensation | | | 19,590 | |
Custodian fee | | | 202,930 | |
Shareholder communications | | | 95,838 | |
Audit and tax fees | | | 33,123 | |
Legal fees | | | 13,452 | |
Miscellaneous | | | 121,813 | |
Total expenses | | | $17,066,237 | |
Fees paid indirectly | | | (50,820 | ) |
Reduction of expenses by investment adviser and distributor | | | (185,408 | ) |
Net expenses | | | $16,830,009 | |
Net investment income (loss) | | | $32,515,075 | |
| |
| Realized and unrealized gain (loss) | | | | |
Realized gain (loss) (identified cost basis) | | | | |
Unaffiliated issuers (net of $544 country tax) | | | $44,660,053 | |
Affiliated issuers | | | 687 | |
Forward foreign currency exchange contracts | | | 17,676,499 | |
Foreign currency | | | 7,199,333 | |
Net realized gain (loss) | | | $69,536,572 | |
Change in unrealized appreciation or depreciation | | | | |
Unaffiliated issuers (net of $21,396 decrease in deferred country tax) | | | $285,870,231 | |
Affiliated issuers | | | 7,278 | |
Forward foreign currency exchange contracts | | | (5,354,567 | ) |
Translation of assets and liabilities in foreign currencies | | | (55,683 | ) |
Net unrealized gain (loss) | | | $280,467,259 | |
Net realized and unrealized gain (loss) | | | $350,003,831 | |
Change in net assets from operations | | | $382,518,906 | |
See Notes to Financial Statements
11
Financial Statements
STATEMENTS OF CHANGES IN NET ASSETS
These statements describe the increases and/or decreases in net assets resulting from operations, any distributions, and any shareholder transactions.
| | | | | | | | |
| Change in net assets | | Six months ended
4/30/19
(unaudited) | | | Year ended
10/31/18 | |
| | |
| From operations | | | | | | | | |
Net investment income (loss) | | | $32,515,075 | | | | $89,738,553 | |
Net realized gain (loss) | | | 69,536,572 | | | | 45,936,011 | |
Net unrealized gain (loss) | | | 280,467,259 | | | | (109,056,961 | ) |
Change in net assets from operations | | | $382,518,906 | | | | $26,617,603 | |
Total distributions to shareholders | | | $(87,957,649 | ) | | | $(95,278,043 | ) |
Change in net assets from fund share transactions | | | $(115,739,362 | ) | | | $(627,026,866 | ) |
Total change in net assets | | | $178,821,895 | | | | $(695,687,306 | ) |
| | |
| Net assets | | | | | | | | |
At beginning of period | | | 3,137,261,774 | | | | 3,832,949,080 | |
At end of period | | | $3,316,083,669 | | | | $3,137,261,774 | |
See Notes to Financial Statements
12
Financial Statements
FINANCIAL HIGHLIGHTS
The financial highlights table is intended to help you understand the fund’s financial performance for the semiannual period and the past 5 fiscal years. Certain information reflects financial results for a single fund share. The total returns in the table represent the rate that an investor would have earned (or lost) on an investment in the fund share class (assuming reinvestment of all distributions) held for the entire period.
| | | | | | | | | | | | | | | | | | | | | | | | |
| | | Six months
ended 4/30/19 | | | Year ended | |
| Class A | | 10/31/18 | | | 10/31/17 | | | 10/31/16 | | | 10/31/15 | | | 10/31/14 | |
| | | (unaudited) | | | | | | | | | | | | | | | | |
Net asset value, beginning of
period | | | $20.08 | | | | $20.46 | | | | $18.49 | | | | $19.25 | | | | $23.34 | | | | $21.80 | |
| | | |
| Income (loss) from investment operations | | | | | | | | | | | | | |
Net investment income
(loss) (d) | | | $0.22 | | | | $0.55 | | | | $0.51 | (c) | | | $0.70 | | | | $0.45 | | | | $0.66 | |
Net realized and unrealized
gain (loss) | | | 2.27 | | | | (0.35 | ) | | | 2.15 | | | | 0.07 | | | | (2.73 | ) | | | 2.42 | |
Total from investment operations | | | $2.49 | | | | $0.20 | | | | $2.66 | | | | $0.77 | | | | $(2.28 | ) | | | $3.08 | |
| | | |
| Less distributions declared to shareholders | | | | | | | | | | | | | |
From net investment income | | | $(0.25 | ) | | | $(0.50 | ) | | | $(0.69 | ) | | | $(0.46 | ) | | | $(0.47 | ) | | | $(0.64 | ) |
From net realized gain | | | (0.33 | ) | | | (0.08 | ) | | | — | | | | (1.07 | ) | | | (1.34 | ) | | | (0.90 | ) |
Total distributions declared to
shareholders | | | $(0.58 | ) | | | $(0.58 | ) | | | $(0.69 | ) | | | $(1.53 | ) | | | $(1.81 | ) | | | $(1.54 | ) |
Net asset value, end of period (x) | | | $21.99 | | | | $20.08 | | | | $20.46 | | | | $18.49 | | | | $19.25 | | | | $23.34 | |
Total return (%) (r)(s)(t)(x) | | | 12.69 | (n) | | | 0.98 | | | | 14.73 | (c) | | | 4.91 | | | | (10.42 | ) | | | 14.99 | |
| | | |
Ratios (%) (to average net assets)
and Supplemental data: | | | | | | | | | | | | | |
Expenses before expense
reductions (f) | | | 1.01 | (a) | | | 1.00 | | | | 1.01 | (c) | | | 1.00 | | | | 0.99 | | | | 0.97 | |
Expenses after expense
reductions (f) | | | 0.99 | (a) | | | 0.99 | | | | 1.01 | (c) | | | 0.99 | | | | 0.99 | | | | 0.97 | |
Net investment income (loss) | | | 2.11 | (a) | | | 2.70 | | | | 2.64 | (c) | | | 3.85 | | | | 2.10 | | | | 2.97 | |
Portfolio turnover | | | 15 | (n) | | | 23 | | | | 24 | | | | 27 | | | | 45 | | | | 46 | |
Net assets at end of period
(000 omitted) | | | $1,838,390 | | | | $1,706,956 | | | | $1,951,500 | | | | $2,431,147 | | | | $2,926,491 | | | | $3,597,063 | |
See Notes to Financial Statements
13
Financial Highlights – continued
| | | | | | | | | | | | | | | | | | | | | | | | |
| | | Six months
ended 4/30/19 | | | Year ended | |
| Class B | | 10/31/18 | | | 10/31/17 | | | 10/31/16 | | | 10/31/15 | | | 10/31/14 | |
| | | (unaudited) | | | | | | | | | | | | | | | | |
Net asset value, beginning of
period | | | $19.98 | | | | $20.36 | | | | $18.40 | | | | $19.16 | | | | $23.24 | | | | $21.71 | |
| | | |
| Income (loss) from investment operations | | | | | | | | | | | | | |
Net investment income
(loss) (d) | | | $0.14 | | | | $0.39 | | | | $0.36 | (c) | | | $0.55 | | | | $0.28 | | | | $0.49 | |
Net realized and unrealized
gain (loss) | | | 2.26 | | | | (0.35 | ) | | | 2.14 | | | | 0.08 | | | | (2.71 | ) | | | 2.41 | |
Total from investment operations | | | $2.40 | | | | $0.04 | | | | $2.50 | | | | $0.63 | | | | $(2.43 | ) | | | $2.90 | |
| | | |
| Less distributions declared to shareholders | | | | | | | | | | | | | |
From net investment income | | | $(0.17 | ) | | | $(0.34 | ) | | | $(0.54 | ) | | | $(0.32 | ) | | | $(0.31 | ) | | | $(0.47 | ) |
From net realized gain | | | (0.33 | ) | | | (0.08 | ) | | | — | | | | (1.07 | ) | | | (1.34 | ) | | | (0.90 | ) |
Total distributions declared to
shareholders | | | $(0.50 | ) | | | $(0.42 | ) | | | $(0.54 | ) | | | $(1.39 | ) | | | $(1.65 | ) | | | $(1.37 | ) |
Net asset value, end of period (x) | | | $21.88 | | | | $19.98 | | | | $20.36 | | | | $18.40 | | | | $19.16 | | | | $23.24 | |
Total return (%) (r)(s)(t)(x) | | | 12.28 | (n) | | | 0.22 | | | | 13.87 | (c) | | | 4.15 | | | | (11.09 | ) | | | 14.15 | |
| | | |
Ratios (%) (to average net assets)
and Supplemental data: | | | | | | | | | | | | | |
Expenses before expense
reductions (f) | | | 1.76 | (a) | | | 1.75 | | | | 1.76 | (c) | | | 1.75 | | | | 1.74 | | | | 1.72 | |
Expenses after expense
reductions (f) | | | 1.75 | (a) | | | 1.74 | | | | 1.76 | (c) | | | 1.75 | | | | 1.74 | | | | 1.72 | |
Net investment income (loss) | | | 1.37 | (a) | | | 1.94 | | | | 1.89 | (c) | | | 3.05 | | | | 1.34 | | | | 2.23 | |
Portfolio turnover | | | 15 | (n) | | | 23 | | | | 24 | | | | 27 | | | | 45 | | | | 46 | |
Net assets at end of period
(000 omitted) | | | $110,867 | | | | $113,779 | | | | $156,814 | | | | $198,512 | | | | $260,079 | | | | $332,141 | |
See Notes to Financial Statements
14
Financial Highlights – continued
| | | | | | | | | | | | | | | | | | | | | | | | |
| | | Six months
ended 4/30/19 | | | Year ended | |
| Class C | | 10/31/18 | | | 10/31/17 | | | 10/31/16 | | | 10/31/15 | | | 10/31/14 | |
| | | (unaudited) | | | | | | | | | | | | | | | | |
Net asset value, beginning of
period | | | $19.98 | | | | $20.36 | | | | $18.40 | | | | $19.16 | | | | $23.24 | | | | $21.71 | |
| | | |
| Income (loss) from investment operations | | | | | | | | | | | | | |
Net investment income
(loss) (d) | | | $0.14 | | | | $0.38 | | | | $0.36 | (c) | | | $0.56 | | | | $0.29 | | | | $0.49 | |
Net realized and unrealized
gain (loss) | | | 2.25 | | | | (0.34 | ) | | | 2.14 | | | | 0.07 | | | | (2.72 | ) | | | 2.41 | |
Total from investment operations | | | $2.39 | | | | $0.04 | | | | $2.50 | | | | $0.63 | | | | $(2.43 | ) | | | $2.90 | |
| | | |
| Less distributions declared to shareholders | | | | | | | | | | | | | |
From net investment income | | | $(0.17 | ) | | | $(0.34 | ) | | | $(0.54 | ) | | | $(0.32 | ) | | | $(0.31 | ) | | | $(0.47 | ) |
From net realized gain | | | (0.33 | ) | | | (0.08 | ) | | | — | | | | (1.07 | ) | | | (1.34 | ) | | | (0.90 | ) |
Total distributions declared to
shareholders | | | $(0.50 | ) | | | $(0.42 | ) | | | $(0.54 | ) | | | $(1.39 | ) | | | $(1.65 | ) | | | $(1.37 | ) |
Net asset value, end of period (x) | | | $21.87 | | | | $19.98 | | | | $20.36 | | | | $18.40 | | | | $19.16 | | | | $23.24 | |
Total return (%) (r)(s)(t)(x) | | | 12.23 | (n) | | | 0.21 | | | | 13.87 | (c) | | | 4.15 | | | | (11.09 | ) | | | 14.16 | |
| | | |
Ratios (%) (to average net assets)
and Supplemental data: | | | | | | | | | | | | | |
Expenses before expense
reductions (f) | | | 1.76 | (a) | | | 1.75 | | | | 1.76 | (c) | | | 1.75 | | | | 1.74 | | | | 1.72 | |
Expenses after expense
reductions (f) | | | 1.75 | (a) | | | 1.74 | | | | 1.76 | (c) | | | 1.75 | | | | 1.74 | | | | 1.72 | |
Net investment income (loss) | | | 1.37 | (a) | | | 1.91 | | | | 1.90 | (c) | | | 3.09 | | | | 1.35 | | | | 2.21 | |
Portfolio turnover | | | 15 | (n) | | | 23 | | | | 24 | | | | 27 | | | | 45 | | | | 46 | |
Net assets at end of period
(000 omitted) | | | $426,260 | | | | $424,769 | | | | $640,795 | | | | $757,086 | | | | $945,033 | | | | $1,145,572 | |
See Notes to Financial Statements
15
Financial Highlights – continued
| | | | | | | | | | | | | | | | | | | | | | | | |
| | | Six months
ended 4/30/19 | | | Year ended | |
| Class I | | 10/31/18 | | | 10/31/17 | | | 10/31/16 | | | 10/31/15 | | | 10/31/14 | |
| | | (unaudited) | | | | | | | | | | | | | | | | |
Net asset value, beginning of
period | | | $20.16 | | | | $20.54 | | | | $18.56 | | | | $19.31 | | | | $23.41 | | | | $21.86 | |
| | | |
| Income (loss) from investment operations | | | | | | | | | | | | | |
Net investment income
(loss) (d) | | | $0.24 | | | | $0.60 | | | | $0.56 | (c) | | | $0.76 | | | | $0.50 | | | | $0.71 | |
Net realized and unrealized
gain (loss) | | | 2.28 | | | | (0.35 | ) | | | 2.16 | | | | 0.06 | | | | (2.73 | ) | | | 2.44 | |
Total from investment operations | | | $2.52 | | | | $0.25 | | | | $2.72 | | | | $0.82 | | | | $(2.23 | ) | | | $3.15 | |
| | | |
| Less distributions declared to shareholders | | | | | | | | | | | | | |
From net investment income | | | $(0.27 | ) | | | $(0.55 | ) | | | $(0.74 | ) | | | $(0.50 | ) | | | $(0.53 | ) | | | $(0.70 | ) |
From net realized gain | | | (0.33 | ) | | | (0.08 | ) | | | — | | | | (1.07 | ) | | | (1.34 | ) | | | (0.90 | ) |
Total distributions declared to
shareholders | | | $(0.60 | ) | | | $(0.63 | ) | | | $(0.74 | ) | | | $(1.57 | ) | | | $(1.87 | ) | | | $(1.60 | ) |
Net asset value, end of period (x) | | | $22.08 | | | | $20.16 | | | | $20.54 | | | | $18.56 | | | | $19.31 | | | | $23.41 | |
Total return (%) (r)(s)(t)(x) | | | 12.83 | (n) | | | 1.22 | | | | 15.02 | (c) | | | 5.20 | | | | (10.20 | ) | | | 15.28 | |
| | | |
Ratios (%) (to average net assets)
and Supplemental data: | | | | | | | | | | | | | |
Expenses before expense
reductions (f) | | | 0.76 | (a) | | | 0.75 | | | | 0.76 | (c) | | | 0.75 | | | | 0.74 | | | | 0.72 | |
Expenses after expense
reductions (f) | | | 0.75 | (a) | | | 0.74 | | | | 0.76 | (c) | | | 0.75 | | | | 0.74 | | | | 0.72 | |
Net investment income (loss) | | | 2.36 | (a) | | | 2.93 | | | | 2.86 | (c) | | | 4.18 | | | | 2.33 | | | | 3.14 | |
Portfolio turnover | | | 15 | (n) | | | 23 | | | | 24 | | | | 27 | | | | 45 | | | | 46 | |
Net assets at end of period
(000 omitted) | | | $662,131 | | | | $587,221 | | | | $682,272 | | | | $508,566 | | | | $636,784 | | | | $864,695 | |
See Notes to Financial Statements
16
Financial Highlights – continued
| | | | | | | | | | | | | | | | | | | | | | | | |
| | | Six months
ended 4/30/19 | | | Year ended | |
| Class R1 | | 10/31/18 | | | 10/31/17 | | | 10/31/16 | | | 10/31/15 | | | 10/31/14 | |
| | | (unaudited) | | | | | | | | | | | | | | | | |
Net asset value, beginning of
period | | | $19.94 | | | | $20.32 | | | | $18.37 | | | | $19.13 | | | | $23.21 | | | | $21.68 | |
| | | |
| Income (loss) from investment operations | | | | | | | | | | | | | |
Net investment income
(loss) (d) | | | $0.14 | | | | $0.39 | | | | $0.36 | (c) | | | $0.56 | | | | $0.29 | | | | $0.49 | |
Net realized and unrealized
gain (loss) | | | 2.25 | | | | (0.34 | ) | | | 2.13 | | | | 0.08 | | | | (2.72 | ) | | | 2.41 | |
Total from investment operations | | | $2.39 | | | | $0.05 | | | | $2.49 | | | | $0.64 | | | | $(2.43 | ) | | | $2.90 | |
| | | |
| Less distributions declared to shareholders | | | | | | | | | | | | | |
From net investment income | | | $(0.17 | ) | | | $(0.35 | ) | | | $(0.54 | ) | | | $(0.33 | ) | | | $(0.31 | ) | | | $(0.47 | ) |
From net realized gain | | | (0.33 | ) | | | (0.08 | ) | | | — | | | | (1.07 | ) | | | (1.34 | ) | | | (0.90 | ) |
Total distributions declared to
shareholders | | | $(0.50 | ) | | | $(0.43 | ) | | | $(0.54 | ) | | | $(1.40 | ) | | | $(1.65 | ) | | | $(1.37 | ) |
Net asset value, end of period (x) | | | $21.83 | | | | $19.94 | | | | $20.32 | | | | $18.37 | | | | $19.13 | | | | $23.21 | |
Total return (%) (r)(s)(t)(x) | | | 12.26 | (n) | | | 0.23 | | | | 13.84 | (c) | | | 4.17 | | | | (11.11 | ) | | | 14.18 | |
| | | |
Ratios (%) (to average net assets)
and Supplemental data: | | | | | | | | | | | | | |
Expenses before expense
reductions (f) | | | 1.76 | (a) | | | 1.75 | | | | 1.76 | (c) | | | 1.75 | | | | 1.74 | | | | 1.72 | |
Expenses after expense
reductions (f) | | | 1.75 | (a) | | | 1.74 | | | | 1.76 | (c) | | | 1.75 | | | | 1.74 | | | | 1.72 | |
Net investment income (loss) | | | 1.35 | (a) | | | 1.93 | | | | 1.90 | (c) | | | 3.14 | | | | 1.34 | | | | 2.21 | |
Portfolio turnover | | | 15 | (n) | | | 23 | | | | 24 | | | | 27 | | | | 45 | | | | 46 | |
Net assets at end of period
(000 omitted) | | | $6,948 | | | | $6,453 | | | | $7,623 | | | | $10,305 | | | | $10,865 | | | | $14,177 | |
See Notes to Financial Statements
17
Financial Highlights – continued
| | | | | | | | | | | | | | | | | | | | | | | | |
| | | Six months
ended 4/30/19 | | | Year ended | |
| Class R2 | | 10/31/18 | | | 10/31/17 | | | 10/31/16 | | | 10/31/15 | | | 10/31/14 | |
| | | (unaudited) | | | | | | | | | | | | | | | | |
Net asset value, beginning of
period | | | $20.03 | | | | $20.40 | | | | $18.44 | | | | $19.20 | | | | $23.29 | | | | $21.75 | |
| | | |
| Income (loss) from investment operations | | | | | | | | | | | | | |
Net investment income
(loss) (d) | | | $0.19 | | | | $0.50 | | | | $0.46 | (c) | | | $0.65 | | | | $0.39 | | | | $0.60 | |
Net realized and unrealized
gain (loss) | | | 2.25 | | | | (0.35 | ) | | | 2.14 | | | | 0.07 | | | | (2.72 | ) | | | 2.42 | |
Total from investment operations | | | $2.44 | | | | $0.15 | | | | $2.60 | | | | $0.72 | | | | $(2.33 | ) | | | $3.02 | |
| | | |
| Less distributions declared to shareholders | | | | | | | | | | | | | |
From net investment income | | | $(0.22 | ) | | | $(0.44 | ) | | | $(0.64 | ) | | | $(0.41 | ) | | | $(0.42 | ) | | | $(0.58 | ) |
From net realized gain | | | (0.33 | ) | | | (0.08 | ) | | | — | | | | (1.07 | ) | | | (1.34 | ) | | | (0.90 | ) |
Total distributions declared to
shareholders | | | $(0.55 | ) | | | $(0.52 | ) | | | $(0.64 | ) | | | $(1.48 | ) | | | $(1.76 | ) | | | $(1.48 | ) |
Net asset value, end of period (x) | | | $21.92 | | | | $20.03 | | | | $20.40 | | | | $18.44 | | | | $19.20 | | | | $23.29 | |
Total return (%) (r)(s)(t)(x) | | | 12.48 | (n) | | | 0.77 | | | | 14.42 | (c) | | | 4.66 | | | | (10.66 | ) | | | 14.74 | |
| | | |
Ratios (%) (to average net assets)
and Supplemental data: | | | | | | | | | | | | | |
Expenses before expense
reductions (f) | | | 1.26 | (a) | | | 1.25 | | | | 1.26 | (c) | | | 1.25 | | | | 1.24 | | | | 1.22 | |
Expenses after expense
reductions (f) | | | 1.25 | (a) | | | 1.24 | | | | 1.26 | (c) | | | 1.25 | | | | 1.24 | | | | 1.22 | |
Net investment income (loss) | | | 1.86 | (a) | | | 2.46 | | | | 2.39 | (c) | | | 3.61 | | | | 1.84 | | | | 2.69 | |
Portfolio turnover | | | 15 | (n) | | | 23 | | | | 24 | | | | 27 | | | | 45 | | | | 46 | |
Net assets at end of period
(000 omitted) | | | $58,361 | | | | $57,733 | | | | $78,248 | | | | $92,123 | | | | $104,858 | | | | $137,813 | |
See Notes to Financial Statements
18
Financial Highlights – continued
| | | | | | | | | | | | | | | | | | | | | | | | |
| | | Six months
ended 4/30/19 | | | Year ended | |
| Class R3 | | 10/31/18 | | | 10/31/17 | | | 10/31/16 | | | 10/31/15 | | | 10/31/14 | |
| | | (unaudited) | | | | | | | | | | | | | | | | |
Net asset value, beginning of
period | | | $20.07 | | | | $20.45 | | | | $18.48 | | | | $19.24 | | | | $23.33 | | | | $21.79 | |
| | | |
| Income (loss) from investment operations | | | | | | | | | | | | | |
Net investment income
(loss) (d) | | | $0.22 | | | | $0.55 | | | | $0.51 | (c) | | | $0.71 | | | | $0.45 | | | | $0.65 | |
Net realized and unrealized
gain (loss) | | | 2.27 | | | | (0.35 | ) | | | 2.15 | | | | 0.06 | | | | (2.73 | ) | | | 2.43 | |
Total from investment operations | | | $2.49 | | | | $0.20 | | | | $2.66 | | | | $0.77 | | | | $(2.28 | ) | | | $3.08 | |
| | | |
| Less distributions declared to shareholders | | | | | | | | | | | | | |
From net investment income | | | $(0.25 | ) | | | $(0.50 | ) | | | $(0.69 | ) | | | $(0.46 | ) | | | $(0.47 | ) | | | $(0.64 | ) |
From net realized gain | | | (0.33 | ) | | | (0.08 | ) | | | — | | | | (1.07 | ) | | | (1.34 | ) | | | (0.90 | ) |
Total distributions declared to
shareholders | | | $(0.58 | ) | | | $(0.58 | ) | | | $(0.69 | ) | | | $(1.53 | ) | | | $(1.81 | ) | | | $(1.54 | ) |
Net asset value, end of period (x) | | | $21.98 | | | | $20.07 | | | | $20.45 | | | | $18.48 | | | | $19.24 | | | | $23.33 | |
Total return (%) (r)(s)(t)(x) | | | 12.70 | (n) | | | 0.97 | | | | 14.74 | (c) | | | 4.91 | | | | (10.42 | ) | | | 15.00 | |
| | | |
Ratios (%) (to average net assets)
and Supplemental data: | | | | | | | | | | | | | |
Expenses before expense
reductions (f) | | | 1.01 | (a) | | | 1.00 | | | | 1.01 | (c) | | | 0.99 | | | | 0.99 | | | | 0.97 | |
Expenses after expense
reductions (f) | | | 1.00 | (a) | | | 0.99 | | | | 1.01 | (c) | | | 0.99 | | | | 0.99 | | | | 0.97 | |
Net investment income (loss) | | | 2.11 | (a) | | | 2.71 | | | | 2.64 | (c) | | | 3.91 | | | | 2.09 | | | | 2.93 | |
Portfolio turnover | | | 15 | (n) | | | 23 | | | | 24 | | | | 27 | | | | 45 | | | | 46 | |
Net assets at end of period
(000 omitted) | | | $76,610 | | | | $72,490 | | | | $99,454 | | | | $128,051 | | | | $134,801 | | | | $177,562 | |
See Notes to Financial Statements
19
Financial Highlights – continued
| | | | | | | | | | | | | | | | | | | | | | | | |
| | | Six months
ended 4/30/19 | | | Year ended | |
| Class R4 | | 10/31/18 | | | 10/31/17 | | | 10/31/16 | | | 10/31/15 | | | 10/31/14 | |
| | | (unaudited) | | | | | | | | | | | | | | | | |
Net asset value, beginning of
period | | | $20.10 | | | | $20.48 | | | | $18.51 | | | | $19.26 | | | | $23.35 | | | | $21.81 | |
| | | |
| Income (loss) from investment operations | | | | | | | | | | | | | |
Net investment income
(loss) (d) | | | $0.24 | | | | $0.61 | | | | $0.56 | (c) | | | $0.74 | | | | $0.50 | | | | $0.71 | |
Net realized and unrealized
gain (loss) | | | 2.27 | | | | (0.36 | ) | | | 2.15 | | | | 0.08 | | | | (2.72 | ) | | | 2.43 | |
Total from investment operations | | | $2.51 | | | | $0.25 | | | | $2.71 | | | | $0.82 | | | | $(2.22 | ) | | | $3.14 | |
| | | |
| Less distributions declared to shareholders | | | | | | | | | | | | | |
From net investment income | | | $(0.27 | ) | | | $(0.55 | ) | | | $(0.74 | ) | | | $(0.50 | ) | | | $(0.53 | ) | | | $(0.70 | ) |
From net realized gain | | | (0.33 | ) | | | (0.08 | ) | | | — | | | | (1.07 | ) | | | (1.34 | ) | | | (0.90 | ) |
Total distributions declared to
shareholders | | | $(0.60 | ) | | | $(0.63 | ) | | | $(0.74 | ) | | | $(1.57 | ) | | | $(1.87 | ) | | | $(1.60 | ) |
Net asset value, end of period (x) | | | $22.01 | | | | $20.10 | | | | $20.48 | | | | $18.51 | | | | $19.26 | | | | $23.35 | |
Total return (%) (r)(s)(t)(x) | | | 12.82 | (n) | | | 1.22 | | | | 15.01 | (c) | | | 5.21 | | | | (10.19 | ) | | | 15.26 | |
| | | |
Ratios (%) (to average net assets)
and Supplemental data: | | | | | | | | | | | | | |
Expenses before expense
reductions (f) | | | 0.76 | (a) | | | 0.75 | | | | 0.76 | (c) | | | 0.74 | | | | 0.74 | | | | 0.72 | |
Expenses after expense
reductions (f) | | | 0.75 | (a) | | | 0.74 | | | | 0.76 | (c) | | | 0.74 | | | | 0.74 | | | | 0.72 | |
Net investment income (loss) | | | 2.37 | (a) | | | 3.01 | | | | 2.89 | (c) | | | 4.11 | | | | 2.33 | | | | 3.19 | |
Portfolio turnover | | | 15 | (n) | | | 23 | | | | 24 | | | | 27 | | | | 45 | | | | 46 | |
Net assets at end of period
(000 omitted) | | | $49,748 | | | | $48,109 | | | | $79,612 | | | | $89,124 | | | | $100,251 | | | | $144,910 | |
See Notes to Financial Statements
20
Financial Highlights – continued
| | | | | | | | | | | | | | | | | | | | | | | | |
| | | Six months
ended 4/30/19 | | | Year ended | |
| Class R6 | | 10/31/18 | | | 10/31/17 | | | 10/31/16 | | | 10/31/15 | | | 10/31/14 | |
| | | (unaudited) | | | | | | | | | | | | | | | | |
Net asset value, beginning of
period | | | $20.17 | | | | $20.54 | | | | $18.56 | | | | $19.31 | | | | $23.42 | | | | $21.86 | |
| | | |
| Income (loss) from investment operations | | | | | | | | | | | | | |
Net investment income
(loss) (d) | | | $0.26 | | | | $0.61 | | | | $0.57 | (c) | | | $0.78 | | | | $0.53 | | | | $0.62 | |
Net realized and unrealized
gain (loss) | | | 2.26 | | | | (0.34 | ) | | | 2.17 | | | | 0.06 | | | | (2.75 | ) | | | 2.55 | |
Total from investment operations | | | $2.52 | | | | $0.27 | | | | $2.74 | | | | $0.84 | | | | $(2.22 | ) | | | $3.17 | |
| | | |
| Less distributions declared to shareholders | | | | | | | | | | | | | |
From net investment income | | | $(0.28 | ) | | | $(0.56 | ) | | | $(0.76 | ) | | | $(0.52 | ) | | | $(0.55 | ) | | | $(0.71 | ) |
From net realized gain | | | (0.33 | ) | | | (0.08 | ) | | | — | | | | (1.07 | ) | | | (1.34 | ) | | | (0.90 | ) |
Total distributions declared to
shareholders | | | $(0.61 | ) | | | $(0.64 | ) | | | $(0.76 | ) | | | $(1.59 | ) | | | $(1.89 | ) | | | $(1.61 | ) |
Net asset value, end of period (x) | | | $22.08 | | | | $20.17 | | | | $20.54 | | | | $18.56 | | | | $19.31 | | | | $23.42 | |
Total return (%) (r)(s)(t)(x) | | | 12.82 | (n) | | | 1.36 | | | | 15.13 | (c) | | | 5.30 | | | | (10.15 | ) | | | 15.42 | |
| | | |
Ratios (%) (to average net assets)
and Supplemental data: | | | | | | | | | | | | | |
Expenses before expense
reductions (f) | | | 0.67 | (a) | | | 0.66 | | | | 0.66 | (c) | | | 0.65 | | | | 0.63 | | | | 0.63 | |
Expenses after expense
reductions (f) | | | 0.66 | (a) | | | 0.65 | | | | 0.66 | (c) | | | 0.65 | | | | 0.63 | | | | 0.63 | |
Net investment income (loss) | | | 2.56 | (a) | | | 3.02 | | | | 2.93 | (c) | | | 4.31 | | | | 2.48 | | | | 2.71 | |
Portfolio turnover | | | 15 | (n) | | | 23 | | | | 24 | | | | 27 | | | | 45 | | | | 46 | |
Net assets at end of period
(000 omitted) | | | $86,769 | | | | $119,752 | | | | $136,631 | | | | $92,898 | | | | $75,962 | | | | $50,344 | |
| (c) | Amount reflects aone-time reimbursement of expenses by the custodian (or former custodian) without which net investment income and performance would be lower and expenses would be higher. |
| (d) | Per share data is based on average shares outstanding. |
| (f) | Ratios do not reflect reductions from fees paid indirectly, if applicable. |
| (r) | Certain expenses have been reduced without which performance would have been lower. |
| (s) | From time to time the fund may receive proceeds from litigation settlements, without which performance would be lower. |
| (t) | Total returns do not include any applicable sales charges. |
| (x) | The net asset values and total returns have been calculated on net assets which include adjustments made in accordance with U.S. generally accepted accounting principles required at period end for financial reporting purposes. |
See Notes to Financial Statements
21
NOTES TO FINANCIAL STATEMENTS
(unaudited)
(1) Business and Organization
MFS Utilities Fund (the fund) is a diversified series of MFS Series Trust VI (the trust). The trust is organized as a Massachusetts business trust and is registered under the Investment Company Act of 1940, as amended, as anopen-end management investment company.
The fund is an investment company and accordingly follows the investment company accounting and reporting guidance of the Financial Accounting Standards Board (FASB) Accounting Standards Codification Topic 946 Financial Services – Investment Companies.
(2) Significant Accounting Policies
General– The preparation of financial statements in conformity with U.S. generally accepted accounting principles requires management to make estimates and assumptions that affect the reported amounts of assets and liabilities, and disclosure of contingent assets and liabilities at the date of the financial statements and the reported amounts of increases and decreases in net assets from operations during the reporting period. Actual results could differ from those estimates. In the preparation of these financial statements, management has evaluated subsequent events occurring after the date of the fund’s Statement of Assets and Liabilities through the date that the financial statements were issued. The fund invests primarily in securities of issuers in the utility industry. Issuers in a single industry can react similarly to market, currency, political, economic, regulatory, geopolitical, and other conditions. The value of stocks in the utilities sector can be very volatile due to supply and/or demand for services or fuel, financing costs, conservation efforts, the negative impact of regulation, and other factors. The fund invests in foreign securities. Investments in foreign securities are vulnerable to the effects of changes in the relative values of the local currency and the U.S. dollar and to the effects of changes in each country’s market, economic, industrial, political, regulatory, geopolitical, and other conditions.
Balance Sheet Offsetting– The fund’s accounting policy with respect to balance sheet offsetting is that, absent an event of default by the counterparty or a termination of the agreement, the International Swaps and Derivatives Association (ISDA) Master Agreement, or similar agreement, does not result in an offset of reported amounts of financial assets and financial liabilities in the Statement of Assets and Liabilities across transactions between the fund and the applicable counterparty. The fund’s right to setoff may be restricted or prohibited by the bankruptcy or insolvency laws of the particular jurisdiction to which a specific master netting agreement counterparty is subject. Balance sheet offsetting disclosures, to the extent applicable to the fund, have been included in the fund’s Significant Accounting Policies note under the captions for each of the fund’sin-scope financial instruments and transactions.
Investment Valuations– Equity securities, including restricted equity securities, are generally valued at the last sale or official closing price on their primary market or exchange as provided by a third-party pricing service. Equity securities, for which there were no sales reported that day, are generally valued at the last quoted daily bid quotation on their primary market or exchange as provided by a third-party pricing
22
Notes to Financial Statements (unaudited) – continued
service. Short-term instruments with a maturity at issuance of 60 days or less may be valued at amortized cost, which approximates market value. Exchange-traded options are generally valued at the last sale or official closing price on their primary exchange as provided by a third-party pricing service. Exchange-traded options for which there were no sales reported that day are generally valued at the last daily bid quotation on their primary exchange as provided by a third-party pricing service. Options not traded on an exchange are generally valued at a broker/dealer bid quotation. Foreign currency options are generally valued at valuations provided by a third-party pricing service. Forward foreign currency exchange contracts are generally valued at the mean of bid and asked prices for the time period interpolated from rates provided by a third-party pricing service for proximate time periods.Open-end investment companies are generally valued at net asset value per share. Securities and other assets generally valued on the basis of information from a third-party pricing service may also be valued at a broker/dealer bid quotation. In determining values, third-party pricing services can utilize both transaction data and market information such as yield, quality, coupon rate, maturity, type of issue, trading characteristics, and other market data. The values of foreign securities and other assets and liabilities expressed in foreign currencies are converted to U.S. dollars using the mean of bid and asked prices for rates provided by a third-party pricing service.
The Board of Trustees has delegated primary responsibility for determining or causing to be determined the value of the fund’s investments (including any fair valuation) to the adviser pursuant to valuation policies and procedures approved by the Board. If the adviser determines that reliable market quotations are not readily available, investments are valued at fair value as determined in good faith by the adviser in accordance with such procedures under the oversight of the Board of Trustees. Under the fund’s valuation policies and procedures, market quotations are not considered to be readily available for most types of debt instruments and floating rate loans and many types of derivatives. These investments are generally valued at fair value based on information from third-party pricing services. In addition, investments may be valued at fair value if the adviser determines that an investment’s value has been materially affected by events occurring after the close of the exchange or market on which the investment is principally traded (such as foreign exchange or market) and prior to the determination of the fund’s net asset value, or after the halting of trading of a specific security where trading does not resume prior to the close of the exchange or market on which the security is principally traded. Events that occur on a frequent basis after foreign markets close (such as developments in foreign markets and significant movements in the U.S. markets) and prior to the determination of the fund’s net asset value may be deemed to have a material effect on the value of securities traded in foreign markets. Accordingly, the fund’s foreign equity securities may often be valued at fair value. The adviser generally relies on third-party pricing services or other information (such as the correlation with price movements of similar securities in the same or other markets; the type, cost and investment characteristics of the security; the business and financial condition of the issuer; and trading and other market data) to assist in determining whether to fair value and at what value to fair value an investment. The value of an investment for purposes of calculating the fund’s net asset value can differ depending on the source and method used to determine value. When fair valuation is used, the
23
Notes to Financial Statements (unaudited) – continued
value of an investment used to determine the fund’s net asset value may differ from quoted or published prices for the same investment. There can be no assurance that the fund could obtain the fair value assigned to an investment if it were to sell the investment at the same time at which the fund determines its net asset value per share.
Various inputs are used in determining the value of the fund’s assets or liabilities. These inputs are categorized into three broad levels. In certain cases, the inputs used to measure fair value may fall into different levels of the fair value hierarchy. In such cases, an investment’s level within the fair value hierarchy is based on the lowest level of input that is significant to the fair value measurement. The fund’s assessment of the significance of a particular input to the fair value measurement in its entirety requires judgment, and considers factors specific to the investment. Level 1 includes unadjusted quoted prices in active markets for identical assets or liabilities. Level 2 includes other significant observable market-based inputs (including quoted prices for similar securities, interest rates, prepayment speed, and credit risk). Level 3 includes unobservable inputs, which may include the adviser’s own assumptions in determining the fair value of investments. Other financial instruments are derivative instruments, such as forward foreign currency exchange contracts. The following is a summary of the levels used as of April 30, 2019 in valuing the fund’s assets or liabilities:
| | | | | | | | | | | | | | | | |
| | | | |
| Financial Instruments | | Level 1 | | | Level 2 | | | Level 3 | | | Total | |
| Equity Securities: | | | | | | | | | | | | | | | | |
United States | | | $2,079,659,848 | | | | $— | | | | $— | | | | $2,079,659,848 | |
Canada | | | 247,104,005 | | | | — | | | | — | | | | 247,104,005 | |
Portugal | | | 227,523,235 | | | | — | | | | — | | | | 227,523,235 | |
Spain | | | 125,850,245 | | | | — | | | | — | | | | 125,850,245 | |
Sweden | | | 89,765,942 | | | | — | | | | — | | | | 89,765,942 | |
Italy | | | 83,948,370 | | | | — | | | | — | | | | 83,948,370 | |
United Kingdom | | | 55,794,957 | | | | — | | | | — | | | | 55,794,957 | |
China | | | 41,997,094 | | | | — | | | | — | | | | 41,997,094 | |
Germany | | | 39,503,310 | | | | — | | | | — | | | | 39,503,310 | |
Other Countries | | | 176,882,348 | | | | 49,946,768 | | | | — | | | | 226,829,116 | |
| Mutual Funds | | | 129,476,453 | | | | — | | | | — | | | | 129,476,453 | |
| Total | | | $3,297,505,807 | | | | $49,946,768 | | | | $— | | | | $3,347,452,575 | |
| | | |
| Other Financial Instruments | | | | | | | | | | |
| Forward Foreign Currency Exchange Contracts – Assets | | | $— | | | | $5,766,609 | | | | $— | | | | $5,766,609 | |
| Forward Foreign Currency Exchange Contracts – Liabilities | | | — | | | | (90,482 | ) | | | — | | | | (90,482 | ) |
For further information regarding security characteristics, see the Portfolio of Investments.
Foreign Currency Translation– Purchases and sales of foreign investments, income, and expenses are converted into U.S. dollars based upon currency exchange rates prevailing on the respective dates of such transactions or on the reporting date for foreign denominated receivables and payables. Gains and losses attributable to foreign currency exchange rates on sales of securities are recorded for financial statement purposes as net realized gains and losses on investments. Gains and losses attributable
24
Notes to Financial Statements (unaudited) – continued
to foreign exchange rate movements on receivables, payables, income and expenses are recorded for financial statement purposes as foreign currency transaction gains and losses. That portion of both realized and unrealized gains and losses on investments that results from fluctuations in foreign currency exchange rates is not separately disclosed.
Derivatives– The fund uses derivatives primarily to increase or decrease exposure to a particular market or segment of the market, or security, to increase or decrease interest rate or currency exposure, or as alternatives to direct investments. Derivatives are used for hedging ornon-hedging purposes. While hedging can reduce or eliminate losses, it can also reduce or eliminate gains. When the fund uses derivatives as an investment to increase market exposure, or for hedging purposes, gains and losses from derivative instruments may be substantially greater than the derivative’s original cost.
The derivative instruments used by the fund during the period were purchased options and forward foreign currency exchange contracts. Depending on the type of derivative, the fund may exit a derivative position by entering into an offsetting transaction with a counterparty or exchange, negotiating an agreement with the derivative counterparty, or novating the position to a third party. The fund’s period end derivatives, as presented in the Portfolio of Investments and the associated Derivative Contract tables, generally are indicative of the volume of its derivative activity during the period.
The following table presents, by major type of derivative contract, the fair value, on a gross basis, of the asset and liability components of derivatives held by the fund at April 30, 2019 as reported in the Statement of Assets and Liabilities:
| | | | | | | | | | |
| | | | | Fair Value | |
| | | |
| Risk | | Derivative Contracts | | Asset Derivatives | | | Liability Derivatives | |
| Foreign Exchange | | Forward Foreign Currency Exchange Contracts | | | $5,766,609 | | | | $(90,482) | |
The following table presents, by major type of derivative contract, the realized gain (loss) on derivatives held by the fund for the six months ended April 30, 2019 as reported in the Statement of Operations:
| | | | | | | | |
| | |
| Risk | | Forward Foreign
Currency
Exchange
Contracts | | | Unaffiliated Issuers
(Purchased
Options) | |
| Foreign Exchange | | | $17,676,499 | | | | $— | |
| Equity | | | — | | | | (4,364,890 | ) |
| Total | | | $17,676,499 | | | | $(4,364,890 | ) |
25
Notes to Financial Statements (unaudited) – continued
The following table presents, by major type of derivative contract, the change in unrealized appreciation or depreciation on derivatives held by the fund for the six months ended April 30, 2019 as reported in the Statement of Operations:
| | | | | | | | |
| | |
| Risk | | Forward Foreign
Currency
Exchange
Contracts | | | Unaffiliated Issuers
(Purchased
Options) | |
| Foreign Exchange | | | $(5,354,567 | ) | | | $— | |
| Equity | | | — | | | | 1,120,715 | |
| Total | | | $(5,354,567 | ) | | | $1,120,715 | |
Derivative counterparty credit risk is managed through formal evaluation of the creditworthiness of all potential counterparties. On certain, but not all, uncleared derivatives, the fund attempts to reduce its exposure to counterparty credit risk whenever possible by entering into an ISDA Master Agreement on a bilateral basis. The ISDA Master Agreement gives each party to the agreement the right to terminate all transactions traded under such agreement if there is a specified deterioration in the credit quality of the other party. Upon an event of default or a termination of the ISDA Master Agreement, thenon-defaulting party has the right to close out all transactions traded under such agreement and to net amounts owed under each agreement to one net amount payable by one party to the other. This right to close out and net payments across all transactions traded under the ISDA Master Agreement could result in a reduction of the fund’s credit risk to such counterparty equal to any amounts payable by the fund under the applicable transactions, if any.
Collateral and margin requirements differ by type of derivative. For cleared derivatives (e.g., futures contracts, cleared swaps, and exchange-traded options), margin requirements are set by the clearing broker and the clearing house and collateral, in the form of cash or securities, is posted by the fund directly with the clearing broker. Collateral terms are counterparty agreement specific for uncleared derivatives (e.g., forward foreign currency exchange contracts, uncleared swap agreements, and uncleared options) and collateral, in the form of cash and securities, is held in segregated accounts with the fund’s custodian in connection with these agreements. For derivatives traded under an ISDA Master Agreement, which contains a collateral support annex, the collateral requirements are netted across all transactions traded under such counterparty-specific agreement and an amount is posted from one party to the other to collateralize such obligations. Cash that has been segregated or delivered to cover the fund’s collateral or margin obligations under derivative contracts, if any, will be reported separately in the Statement of Assets and Liabilities as restricted cash for uncleared derivatives and/or deposits with brokers for cleared derivatives. Securities pledged as collateral or margin for the same purpose, if any, are noted in the Portfolio of Investments. The fund may be required to make payments of interest on uncovered collateral or margin obligations with the broker. Any such payments are included in “Miscellaneous” expense in the Statement of Operations.
Purchased Options– The fund purchased call options for a premium. Purchased call options entitle the holder to buy a specified number of shares or units of a particular security, currency or index at a specified price at a specified date or within a specified
26
Notes to Financial Statements (unaudited) – continued
period of time. Purchasing call options may hedge against an anticipated increase in the dollar cost of securities or currency to be acquired or increase the fund’s exposure to an underlying instrument.
The premium paid is initially recorded as an investment in the Statement of Assets and Liabilities. That investment is subsequentlymarked-to-market daily with the difference between the premium paid and the market value of the purchased option being recorded as unrealized appreciation or depreciation. Premiums paid for purchased call options which have expired are treated as realized losses on investments in the Statement of Operations. Upon the exercise or closing of a purchased call option, the premium paid is added to the cost of the security or financial instrument purchased.
Whether or not the option is exercised, the fund’s maximum risk of loss from purchasing an option is the amount of premium paid. All option contracts involve credit risk if the counterparty to the option contract fails to perform. For uncleared options, this risk is mitigated in cases where there is an ISDA Master Agreement between the fund and the counterparty providing for netting as described above and, where applicable, by the posting of collateral by the counterparty to the fund to cover the fund’s exposure to the counterparty under such ISDA Master Agreement.
Forward Foreign Currency Exchange Contracts– The fund entered into forward foreign currency exchange contracts for the purchase or sale of a specific foreign currency at a fixed price on a future date. These contracts may be used to hedge the fund’s currency risk or fornon-hedging purposes. For hedging purposes, the fund may enter into contracts to deliver or receive foreign currency that the fund will receive from or use in its normal investment activities. The fund may also use contracts to hedge against declines in the value of foreign currency denominated securities due to unfavorable exchange rate movements. Fornon-hedging purposes, the fund may enter into contracts with the intent of changing the relative exposure of the fund’s portfolio of securities to different currencies to take advantage of anticipated exchange rate changes.
Forward foreign currency exchange contracts are adjusted by the daily exchange rate of the underlying currency and any unrealized gains or losses are recorded as a receivable or payable for forward foreign currency exchange contracts until the contract settlement date. On contract settlement date, any gain or loss on the contract is recorded as realized gains or losses on forward foreign currency exchange contracts.
Risks may arise upon entering into these contracts from unanticipated movements in the value of the contract and from the potential inability of counterparties to meet the terms of their contracts. Generally, the fund’s maximum risk due to counterparty credit risk is the unrealized gain on the contract due to the use of Continuous Linked Settlement, a multicurrency cash settlement system for the centralized settlement of foreign transactions. This risk is mitigated in cases where there is an ISDA Master Agreement between the fund and the counterparty providing for netting as described above and, where applicable, by the posting of collateral by the counterparty to the fund to cover the fund’s exposure to the counterparty under such ISDA Master Agreement.
Security Loans– Under its Securities Lending Agency Agreement with the fund, JPMorgan Chase and Co., as lending agent, loans the securities of the fund to certain
27
Notes to Financial Statements (unaudited) – continued
qualified institutions (the “Borrowers”) approved by the fund. Security loans can be terminated at the discretion of either the lending agent or the fund and the related securities must be returned within the earlier of the standard trade settlement period for such securities or within three business days. The loans are collateralized by cash and/or U.S. Treasury and federal agency obligations in an amount typically at least equal to the market value of the securities loaned. On loans collateralized by cash, the cash collateral is invested in a money market fund. The market value of the loaned securities is determined at the close of business of the fund and any additional required collateral is delivered to the fund on the next business day. The lending agent provides the fund with indemnification against Borrower default. In the event of Borrower default, the lending agent will, for the benefit of the fund, either purchase securities identical to those loaned or, when such purchase is commercially impracticable, pay the fund the market value of the loaned securities. In return, the lending agent assumes the fund’s rights to the related collateral. If the collateral value is less than the cost to purchase identical securities, the lending agent is responsible for the shortfall, but only to the extent that such shortfall is not due to a decline in collateral value resulting from collateral reinvestment for which the fund bears the risk of loss. At period end, the fund had investment securities on loan, all of which were classified as equity securities in the fund’s Portfolio of Investments, with a fair value of $56,111,794. The fair value of the fund’s investment securities on loan and a related liability of $39,417,974 for cash collateral received on securities loaned are both presented gross in the Statement of Assets and Liabilities. Additionally, these loans were collateralized by U.S. Treasury Obligations of $19,713,768 held by the lending agent. The collateral on securities loaned exceeded the value of securities on loan at period end. The liability for cash collateral for securities loaned is carried at fair value, which is categorized as level 2 within the fair value hierarchy. A portion of the income generated upon investment of the collateral is remitted to the Borrowers, and the remainder is allocated between the fund and the lending agent. On loans collateralized by U.S. Treasury and/or federal agency obligations, a fee is received from the Borrower, and is allocated between the fund and the lending agent. Income from securities lending is separately reported in the Statement of Operations. The dividend and interest income earned on the securities loaned is accounted for in the same manner as other dividend and interest income.
Indemnifications– Under the fund’s organizational documents, its officers and Trustees may be indemnified against certain liabilities and expenses arising out of the performance of their duties to the fund. Additionally, in the normal course of business, the fund enters into agreements with service providers that may contain indemnification clauses. The fund’s maximum exposure under these agreements is unknown as this would involve future claims that may be made against the fund that have not yet occurred.
Investment Transactions and Income– Investment transactions are recorded on the trade date. Interest income is recorded on the accrual basis. All premium and discount is amortized or accreted for financial statement purposes in accordance with U.S. generally accepted accounting principles. Dividends received in cash are recorded on theex-dividend date. Certain dividends from foreign securities will be recorded when the fund is informed of the dividend if such information is obtained subsequent to the
28
Notes to Financial Statements (unaudited) – continued
ex-dividend date. Dividend payments received in additional securities are recorded on theex-dividend date in an amount equal to the value of the security on such date.
The fund may receive proceeds from litigation settlements. Any proceeds received from litigation involving portfolio holdings are reflected in the Statement of Operations in realized gain/loss if the security has been disposed of by the fund or in unrealized gain/loss if the security is still held by the fund. Any other proceeds from litigation not related to portfolio holdings are reflected as other income in the Statement of Operations.
Fees Paid Indirectly– The fund’s custody fee may be reduced by a credit earned under an arrangement that measures the value of U.S. dollars deposited with the custodian by the fund. The amount of the credit, for the six months ended April 30, 2019, is shown as a reduction of total expenses in the Statement of Operations.
Tax Matters and Distributions– The fund intends to qualify as a regulated investment company, as defined under Subchapter M of the Internal Revenue Code, and to distribute all of its taxable income, including realized capital gains. As a result, no provision for federal income tax is required. The fund’s federal tax returns, when filed, will remain subject to examination by the Internal Revenue Service for a three year period. Management has analyzed the fund’s tax positions taken on federal and state tax returns for all open tax years and does not believe that there are any uncertain tax positions that require recognition of a tax liability. Foreign taxes, if any, have been accrued by the fund in the accompanying financial statements in accordance with the applicable foreign tax law. Foreign income taxes may be withheld by certain countries in which the fund invests. Additionally, capital gains realized by the fund on securities issued in or by certain foreign countries may be subject to capital gains tax imposed by those countries.
Distributions to shareholders are recorded on theex-dividend date. Income and capital gain distributions are determined in accordance with income tax regulations, which may differ from U.S. generally accepted accounting principles. Certain capital accounts in the financial statements are periodically adjusted for permanent differences in order to reflect their tax character. These adjustments have no impact on net assets or net asset value per share. Temporary differences which arise from recognizing certain items of income, expense, gain or loss in different periods for financial statement and tax purposes will reverse at some time in the future. Distributions in excess of net investment income or net realized gains are temporary overdistributions for financial statement purposes resulting from differences in the recognition or classification of income or distributions for financial statement and tax purposes.
Book/tax differences primarily relate to wash sale loss deferrals, derivative transactions, treating a portion of the proceeds from redemptions as a distribution for tax purposes, partnership adjustments, and certain preferred stock treated as debt for tax purposes.
29
Notes to Financial Statements (unaudited) – continued
The tax character of distributions made during the current period will be determined at fiscal year end. The tax character of distributions declared to shareholders for the last fiscal year is as follows:
| | | | |
| |
| | | Year ended
10/31/18 | |
Ordinary income (including any
short-term capital gains) | | | $80,663,527 | |
| Long-term capital gains | | | 14,614,516 | |
| |
| Total distributions | | | $95,278,043 | |
The federal tax cost and the tax basis components of distributable earnings were as follows:
| | | | |
| |
| As of 4/30/19 | | | |
| |
| Cost of investments | | | $2,722,079,098 | |
| Gross appreciation | | | 739,557,681 | |
| |
| Gross depreciation | | | (114,184,204 | ) |
| Net unrealized appreciation (depreciation) | | | $625,373,477 | |
| |
| As of 10/31/18 | | | |
| |
| Undistributed ordinary income | | | 5,112,090 | |
| Undistributed long-term capital gain | | | 48,454,379 | |
| Other temporary differences | | | 101,070,514 | |
| Net unrealized appreciation (depreciation) | | | 339,517,364 | |
The aggregate cost above includes prior fiscal year end tax adjustments, if applicable.
Multiple Classes of Shares of Beneficial Interest– The fund offers multiple classes of shares, which differ in their respective distribution and service fees. The fund’s income, realized and unrealized gain (loss), and common expenses are allocated to shareholders based on the daily net assets of each class. Dividends are declared separately for each class. Differences in per share dividend rates are generally due to differences in separate class expenses. Class B shares will convert to Class A shares approximately eight years after purchase. Class C shares will convert to Class A shares
30
Notes to Financial Statements (unaudited) – continued
approximately ten years after purchase. The fund’s distributions declared to shareholders as reported in the Statements of Changes in Net Assets are presented by class as follows:
| | | | | | | | | | | | | | | | |
| | | From net investment
income | | | From net realized
gain | |
| | | | |
| | | Six months
ended
4/30/19 | | | Year
ended
10/31/18 | | | Six months
ended
4/30/19 | | | Year
ended
10/31/18 | |
| Class A | | | $20,897,546 | | | | $44,202,727 | | | | $27,764,796 | | | | $7,417,599 | |
| Class B | | | 911,335 | | | | 2,222,978 | | | | 1,841,017 | | | | 587,465 | |
| Class C | | | 3,450,090 | | | | 8,693,300 | | | | 6,881,738 | | | | 2,452,902 | |
| Class I | | | 8,025,999 | | | | 16,760,233 | | | | 9,579,816 | | | | 2,646,963 | |
| Class R1 | | | 54,729 | | | | 118,807 | | | | 106,861 | | | | 29,705 | |
| Class R2 | | | 610,946 | | | | 1,466,357 | | | | 925,403 | | | | 292,809 | |
| Class R3 | | | 870,567 | | | | 2,028,682 | | | | 1,166,290 | | | | 368,744 | |
| Class R4 | | | 640,482 | | | | 1,717,269 | | | | 783,474 | | | | 291,042 | |
| Class R6 | | | 1,557,270 | | | | 3,453,175 | | | | 1,889,290 | | | | 527,286 | |
| Total | | | $37,018,964 | | | | $80,663,528 | | | | $50,938,685 | | | | $14,614,515 | |
(3) Transactions with Affiliates
Investment Adviser– The fund has an investment advisory agreement with MFS to provide overall investment management and related administrative services and facilities to the fund. The management fee is computed daily and paid monthly at the following annual rates based on the fund’s average daily net assets:
| | | | |
| Up to $3 billion | | | 0.60 | % |
| In excess of $3 billion and up to $10 billion | | | 0.55 | % |
| In excess of $10 billion | | | 0.50 | % |
MFS has agreed in writing to reduce its management fee by a specified amount if certain MFS mutual fund assets exceed thresholds agreed to by MFS and the fund’s Board of Trustees. For the six months ended April 30, 2019, this management fee reduction amounted to $156,163, which is included in the reduction of total expenses in the Statement of Operations. The management fee incurred for the six months ended April 30, 2019 was equivalent to an annual effective rate of 0.59% of the fund’s average daily net assets.
Distributor– MFS Fund Distributors, Inc. (MFD), a wholly-owned subsidiary of MFS, as distributor, received $104,051 for the six months ended April 30, 2019, as its portion of the initial sales charge on sales of Class A shares of the fund.
The Board of Trustees has adopted a distribution plan for certain share classes pursuant to Rule12b-1 of the Investment Company Act of 1940.
The fund’s distribution plan provides that the fund will pay MFD for services provided by MFD and financial intermediaries in connection with the distribution and servicing of certain share classes. One component of the plan is a distribution fee paid to MFD and another component of the plan is a service fee paid to MFD. MFD may subsequently pay all, or a portion, of the distribution and/or service fees to financial intermediaries.
31
Notes to Financial Statements (unaudited) – continued
Distribution Plan Fee Table:
| | | | | | | | | | | | | | | | | | | | |
| | | | | |
| | | Distribution
Fee Rate (d) | | | Service
Fee Rate (d) | | | Total
Distribution
Plan (d) | | | Annual
Effective
Rate (e) | | | Distribution
and Service
Fee | |
| Class A | | | — | | | | 0.25% | | | | 0.25% | | | | 0.25% | | | | $2,173,479 | |
| Class B | | | 0.75% | | | | 0.25% | | | | 1.00% | | | | 1.00% | | | | 555,995 | |
| Class C | | | 0.75% | | | | 0.25% | | | | 1.00% | | | | 1.00% | | | | 2,095,152 | |
| Class R1 | | | 0.75% | | | | 0.25% | | | | 1.00% | | | | 1.00% | | | | 32,760 | |
| Class R2 | | | 0.25% | | | | 0.25% | | | | 0.50% | | | | 0.50% | | | | 141,655 | |
| Class R3 | | | — | | | | 0.25% | | | | 0.25% | | | | 0.25% | | | | 90,609 | |
| Total Distribution and Service Fees | | | | | | | | | | | | $5,089,650 | |
| (d) | In accordance with the distribution plan for certain classes, the fund pays distribution and/or service fees equal to these annual percentage rates of each class’s average daily net assets. The distribution and service fee rates disclosed by class represent the current rates in effect at the end of the reporting period. Any rate changes, if applicable, are detailed below. |
| (e) | The annual effective rates represent actual fees incurred under the distribution plan for the six months ended April 30, 2019 based on each class’s average daily net assets. MFD has voluntarily agreed to rebate a portion of each class’s 0.25% service fee attributable to accounts for which MFD retains the 0.25% service fee except for accounts attributable to MFS or its affiliates’ seed money. For the six months ended April 30, 2019, this rebate amounted to $28,463, $435, $189, $4, $114, and $40 for Class A, Class B, Class C, Class R1, Class R2, and Class R3, respectively, and is included in the reduction of total expenses in the Statement of Operations. |
Certain Class A shares are subject to a contingent deferred sales charge (CDSC) in the event of a shareholder redemption within 18 months of purchase. Class B shares are subject to a CDSC in the event of a shareholder redemption within six years of purchase. Class C shares are subject to a CDSC in the event of a shareholder redemption within 12 months of purchase. All contingent deferred sales charges are paid to MFD and during the six months ended April 30, 2019, were as follows:
| | | | |
| |
| | | Amount | |
| Class A | | | $4,008 | |
| Class B | | | 52,058 | |
| Class C | | | 3,749 | |
Shareholder Servicing Agent– MFS Service Center, Inc. (MFSC), a wholly-owned subsidiary of MFS, receives a fee from the fund for its services as shareholder servicing agent calculated as a percentage of the average daily net assets of the fund as determined periodically under the supervision of the fund’s Board of Trustees. For the six months ended April 30, 2019, the fee was $224,751, which equated to 0.0142% annually of the fund’s average daily net assets. MFSC also receives payment from the fund forout-of-pocket expenses,sub-accounting and other shareholder servicing costs which may be paid to affiliated and unaffiliated service providers. Class R6 shares do not incursub-accounting fees. For the six months ended April 30, 2019, theseout-of-pocket expenses,sub-accounting and other shareholder servicing costs amounted to $1,576,856.
32
Notes to Financial Statements (unaudited) – continued
Administrator– MFS provides certain financial, legal, shareholder communications, compliance, and other administrative services to the fund. Under an administrative services agreement, the fund reimburses MFS the costs incurred to provide these services. The fund is charged an annual fixed amount of $17,500 plus a fee based on average daily net assets. The administrative services fee incurred for the six months ended April 30, 2019 was equivalent to an annual effective rate of 0.0139% of the fund’s average daily net assets.
Trustees’ and Officers’ Compensation– The fund pays compensation to independent Trustees in the form of a retainer, attendance fees, and additional compensation to Board and Committee chairpersons. The fund does not pay compensation directly to Trustees or officers of the fund who are also officers of the investment adviser, all of whom receive remuneration for their services to the fund from MFS. Certain officers and Trustees of the fund are officers or directors of MFS, MFD, and MFSC.
Prior to December 31, 2001, the fund had an unfunded defined benefit plan (“DB plan”) for independent Trustees. As of December 31, 2001, the Board took action to terminate the DB plan with respect to then-current and any future independent Trustees, such that the DB plan covers only certain of those former independent Trustees who retired on or before December 31, 2001. The DB plan resulted in a pension expense of $635 and is included in “Independent Trustees’ compensation” in the Statement of Operations for the six months ended April 30, 2019. The liability for deferred retirement benefits payable to those former independent Trustees under the DB plan amounted to $2,449 at April 30, 2019, and is included in “Payable for independent Trustees’ compensation” in the Statement of Assets and Liabilities.
Other– This fund and certain other funds managed by MFS (the funds) have entered into a service agreement (the ISO Agreement) which provides for payment of fees solely by the funds to Tarantino LLC in return for the provision of services of an Independent Senior Officer (ISO) for the funds. Frank L. Tarantino serves as the ISO and is an officer of the funds and the sole member of Tarantino LLC. The funds can terminate the ISO Agreement with Tarantino LLC at any time under the terms of the ISO Agreement. For the six months ended April 30, 2019, the fee paid by the fund under this agreement was $2,740 and is included in “Miscellaneous” expense in the Statement of Operations. MFS has agreed to bear all expenses associated with office space, other administrative support, and supplies provided to the ISO.
The fund invests in the MFS Institutional Money Market Portfolio which is managed by MFS and seeks current income consistent with preservation of capital and liquidity. This money market fund does not pay a management fee to MFS.
The fund is permitted to engage in purchase and sale transactions with funds and accounts for which MFS serves as investment adviser orsub-adviser (“cross-trades”) pursuant to a policy adopted by the Board of Trustees. This policy has been designed to ensure that cross-trades conducted by the fund comply with Rule17a-7 under the Investment Company Act of 1940. During the six months ended April 30, 2019, the fund engaged in purchase and sale transactions pursuant to this policy, which amounted to $1,470,679 and $4,021,451, respectively. The sales transactions resulted in net realized gains (losses) of $1,930,408.
33
Notes to Financial Statements (unaudited) – continued
The adviser has voluntarily undertaken to reimburse the fund from its own resources on a quarterly basis for the cost of investment research embedded in the cost of the fund’s securities trades. This agreement may be rescinded at any time. For the six months ended April 30, 2019, this reimbursement amounted to $106,834, which is included in “Other” income in the Statement of Operations.
(4) Portfolio Securities
For the six months ended April 30, 2019, purchases and sales of investments, other than purchased option transactions and short-term obligations, aggregated $469,447,827 and $684,771,290, respectively.
(5) Shares of Beneficial Interest
The fund’s Declaration of Trust permits the Trustees to issue an unlimited number of full and fractional shares of beneficial interest. Transactions in fund shares were as follows:
| | | | | | | | | | | | | | | | |
| | | Six months ended
4/30/19 | | | Year ended
10/31/18 | |
| | | | |
| | | Shares | | | Amount | | | Shares | | | Amount | |
| Shares sold | | | | | | | | | | | | | | | | |
Class A | | | 3,412,950 | | | | $70,674,442 | | | | 9,483,688 | | | | $190,923,340 | |
Class B | | | 117,437 | | | | 2,420,431 | | | | 208,958 | | | | 4,197,865 | |
Class C | | | 504,879 | | | | 10,416,760 | | | | 856,362 | | | | 17,238,952 | |
Class I | | | 3,726,771 | | | | 78,270,016 | | | | 6,668,871 | | | | 135,754,618 | |
Class R1 | | | 24,520 | | | | 505,858 | | | | 59,022 | | | | 1,188,822 | |
Class R2 | | | 257,473 | | | | 5,339,108 | | | | 502,059 | | | | 10,114,933 | |
Class R3 | | | 426,470 | | | | 8,904,393 | | | | 611,162 | | | | 12,401,462 | |
Class R4 | | | 214,639 | | | | 4,411,131 | | | | 527,917 | | | | 10,705,921 | |
Class R6 | | | 996,968 | | | | 21,142,232 | | | | 1,154,462 | | | | 23,517,533 | |
| | | 9,682,107 | | | | $202,084,371 | | | | 20,072,501 | | | | $406,043,446 | |
| | | | |
| Shares issued to shareholders in reinvestment of distributions | | | | | | | | | | | | | | | | |
Class A | | | 2,298,321 | | | | $46,245,096 | | | | 2,421,915 | | | | $48,943,953 | |
Class B | | | 120,700 | | | | 2,399,818 | | | | 121,582 | | | | 2,442,900 | |
Class C | | | 465,474 | | | | 9,256,066 | | | | 501,289 | | | | 10,062,344 | |
Class I | | | 749,422 | | | | 15,171,374 | | | | 826,466 | | | | 16,764,866 | |
Class R1 | | | 8,139 | | | | 161,590 | | | | 7,404 | | | | 148,492 | |
Class R2 | | | 73,585 | | | | 1,472,953 | | | | 83,253 | | | | 1,677,013 | |
Class R3 | | | 101,271 | | | | 2,036,409 | | | | 118,753 | | | | 2,397,337 | |
Class R4 | | | 67,705 | | | | 1,364,983 | | | | 94,765 | | | | 1,915,500 | |
Class R6 | | | 134,522 | | | | 2,718,757 | | | | 156,898 | | | | 3,184,085 | |
| | | 4,019,139 | | | | $80,827,046 | | | | 4,332,325 | | | | $87,536,490 | |
34
Notes to Financial Statements (unaudited) – continued
| | | | | | | | | | | | | | | | |
| | | Six months ended
4/30/19 | | | Year ended
10/31/18 | |
| | | | |
| | | Shares | | | Amount | | | Shares | | | Amount | |
| Shares reacquired | | | | | | | | | | | | | | | | |
Class A | | | (7,095,670 | ) | | | $(147,233,477 | ) | | | (22,290,248 | ) | | | $(450,202,107 | ) |
Class B | | | (863,863 | ) | | | (17,831,255 | ) | | | (2,338,687 | ) | | | (46,950,692 | ) |
Class C | | | (2,741,191 | ) | | | (56,539,244 | ) | | | (11,577,794 | ) | | | (231,532,275 | ) |
Class I | | | (3,608,977 | ) | | | (75,122,416 | ) | | | (11,591,715 | ) | | | (234,318,774 | ) |
Class R1 | | | (37,923 | ) | | | (773,038 | ) | | | (117,933 | ) | | | (2,367,556 | ) |
Class R2 | | | (551,888 | ) | | | (11,337,508 | ) | | | (1,537,444 | ) | | | (31,016,403 | ) |
Class R3 | | | (653,030 | ) | | | (13,447,479 | ) | | | (1,981,885 | ) | | | (40,147,444 | ) |
Class R4 | | | (415,254 | ) | | | (8,591,106 | ) | | | (2,117,215 | ) | | | (42,896,914 | ) |
Class R6 | | | (3,140,011 | ) | | | (67,775,256 | ) | | | (2,024,550 | ) | | | (41,174,637 | ) |
| | | (19,107,807 | ) | | | $(398,650,779 | ) | | | (55,577,471 | ) | | | $(1,120,606,802 | ) |
| | | | |
| Net change | | | | | | | | | | | | | | | | |
Class A | | | (1,384,399 | ) | | | $(30,313,939 | ) | | | (10,384,645 | ) | | | $(210,334,814 | ) |
Class B | | | (625,726 | ) | | | (13,011,006 | ) | | | (2,008,147 | ) | | | (40,309,927 | ) |
Class C | | | (1,770,838 | ) | | | (36,866,418 | ) | | | (10,220,143 | ) | | | (204,230,979 | ) |
Class I | | | 867,216 | | | | 18,318,974 | | | | (4,096,378 | ) | | | (81,799,290 | ) |
Class R1 | | | (5,264 | ) | | | (105,590 | ) | | | (51,507 | ) | | | (1,030,242 | ) |
Class R2 | | | (220,830 | ) | | | (4,525,447 | ) | | | (952,132 | ) | | | (19,224,457 | ) |
Class R3 | | | (125,289 | ) | | | (2,506,677 | ) | | | (1,251,970 | ) | | | (25,348,645 | ) |
Class R4 | | | (132,910 | ) | | | (2,814,992 | ) | | | (1,494,533 | ) | | | (30,275,493 | ) |
Class R6 | | | (2,008,521 | ) | | | (43,914,267 | ) | | | (713,190 | ) | | | (14,473,019 | ) |
| | | (5,406,561 | ) | | | $(115,739,362 | ) | | | (31,172,645 | ) | | | $(627,026,866 | ) |
Class T shares were not publicly available for sale during the period. Please see the fund’s prospectus for details.
Effective June 1, 2019, purchases of the fund’s Class B shares are closed to new and existing investors subject to certain exceptions. Please see the fund’s prospectus for details.
(6) Line of Credit
The fund and certain other funds managed by MFS participate in a $1.25 billion unsecured committed line of credit, subject to a $1 billion sublimit, provided by a syndicate of banks under a credit agreement. Borrowings may be made for temporary financing needs. Interest is charged to each fund, based on its borrowings, generally at a rate equal to the highest of one month LIBOR, the Federal Funds Effective Rate and the Overnight Bank Funding Rate, plus an agreed upon spread. A commitment fee, based on the average daily, unused portion of the committed line of credit, is allocated among the participating funds. In addition, the fund and other funds managed by MFS have established unsecured uncommitted borrowing arrangements with certain banks for temporary financing needs. Interest is charged to each fund, based on its borrowings, at rates equal to customary reference rates plus an agreed upon spread. For the six months ended April 30, 2019, the fund’s commitment fee and interest expense were $9,803 and $0, respectively, and are included in “Miscellaneous” expense in the Statement of Operations.
35
Notes to Financial Statements (unaudited) – continued
(7) Investments in Affiliated Issuers
An affiliated issuer may be considered one in which the fund owns 5% or more of the outstanding voting securities, or a company which is under common control. For the purposes of this report, the fund assumes the following to be affiliated issuers:
| | | | | | | | | | | | | | | | | | | | | | | | |
| | | | | | |
| Affiliated Issuers | | Beginning
Value | | | Purchases | | | Sales
Proceeds | | | Realized
Gain
(Loss) | | | Change in
Unrealized
Appreciation or
Depreciation | | | Ending
Value | |
MFS Institutional Money
Market Portfolio | | | $63,836,853 | | | | $341,551,274 | | | | $315,337,613 | | | | $687 | | | | $7,278 | | | | $90,058,479 | |
| | | | | | |
| Affiliated Issuers | | | | | | | | | | | | | | Dividend
Income | | | Capital Gain
Distributions | |
| MFS Institutional Money Market Portfolio | | | | | | | | | | | | | | | | $1,113,502 | | | | $— | |
36
PROXY VOTING POLICIES AND INFORMATION
MFS votes proxies on behalf of the fund pursuant to proxy voting policies and procedures that are available without charge, upon request, by calling1-800-225-2606, by visitingmfs.com/proxyvoting, or by visiting the SEC’s Web site athttp://www.sec.gov.
Information regarding how the fund voted proxies relating to portfolio securities during the most recent twelve-month period ended June 30 is available by August 31 of each year without charge by visitingmfs.com/proxyvoting, or by visiting the SEC’s Web site athttp://www.sec.gov.
QUARTERLY PORTFOLIO DISCLOSURE
The fund files a complete schedule of portfolio holdings with the SEC for the first and third quarters of each fiscal year on Form N-Q or as an exhibit to its reports onForm N-PORT (for first and third fiscal quarters ending March 31, 2019 or after). The fund’s Form N-Q or Form N-PORT reports are available on the SEC’s website athttp://www.sec.gov.A shareholder can obtain the portfolio holdings report for the first and third quarters of the fund’s fiscal year atmfs.com/openendfunds by choosing the fund’s name and then selecting the “Resources” tab and clicking on “Prospectus and Reports”.
FURTHER INFORMATION
From time to time, MFS may post important information about the fund or the MFS funds on the MFS web site (mfs.com). This information is available athttps://www.mfs.com/en-us/what-we-do/announcements.html or atmfs.com/openendfunds by choosing the fund’s name.
INFORMATION ABOUT FUND CONTRACTS AND LEGAL CLAIMS
The fund has entered into contractual arrangements with an investment adviser, administrator, distributor, shareholder servicing agent, 529 program manager (if applicable), and custodian who each provide services to the fund. Unless expressly stated otherwise, shareholders are not parties to, or intended beneficiaries of these contractual arrangements, and these contractual arrangements are not intended to create any shareholder right to enforce them against the service providers or to seek any remedy under them against the service providers, either directly or on behalf of the fund.
Under the Trust’s By-Laws and Declaration of Trust, any claims asserted against or on behalf of the MFS Funds, including claims against Trustees and Officers, must be brought in state and federal courts located within the Commonwealth of Massachusetts.
PROVISION OF FINANCIAL REPORTS AND SUMMARY PROSPECTUSES
The fund produces financial reports every six months and updates its summary prospectus and prospectus annually. To avoid sending duplicate copies of materials to households, only one copy of the fund’s annual and semiannual report and summary prospectus may be mailed to shareholders having the same last name and residential address on the fund’s records. However, any shareholder may contact MFSC (please see back cover for address and telephone number) to request that copies of these reports and summary prospectuses be sent personally to that shareholder.
37
Save paper with eDelivery.

MFS® will send you prospectuses, |
reports, and proxies directly viae-mail so you will get information faster with less mailbox clutter.
To sign up:
1. Go to mfs.com.
2. Log in via MFS® Access.
3. Select eDelivery.
If you own your MFS fund shares through a financial institution or a retirement plan, MFS® TALK, MFS® Access, or eDelivery may not be available to you.
CONTACT
WEB SITE
mfs.com
MFS TALK
1-800-637-8255
24 hours a day
ACCOUNT SERVICE AND LITERATURE
Shareholders
1-800-225-2606
Financial advisors
1-800-343-2829
Retirement plan services
1-800-637-1255
MAILING ADDRESS
MFS Service Center, Inc.
P.O. Box 219341
Kansas City, MO 64121-9341
OVERNIGHT MAIL
MFS Service Center, Inc.
Suite 219341
430 W 7th Street
Kansas City, MO 64105-1407
During the period covered by this report, the Registrant has not amended any provision in its Code of Ethics (the “Code”) that relates to an element of the Code’s definitions enumerated in paragraph (b) of Item 2 of this FormN-CSR. During the period covered by this report, the Registrant did not grant a waiver, including an implicit waiver, from any provision of the Code.
| ITEM 3. | AUDIT COMMITTEE FINANCIAL EXPERT. |
Not applicable for semi-annual reports.
| ITEM 4. | PRINCIPAL ACCOUNTANT FEES AND SERVICES. |
Not applicable for semi-annual reports.
| ITEM 5. | AUDIT COMMITTEE OF LISTED REGISTRANTS. |
Not applicable to the Registrant.
A schedule of investments for each series of the Registrant is included as part of the report to shareholders of such series under Item 1 of this FormN-CSR.
| ITEM 7. | DISCLOSURE OF PROXY VOTING POLICIES AND PROCEDURES FORCLOSED-END MANAGEMENT INVESTMENT COMPANIES. |
Not applicable to the Registrant.
| ITEM 8. | PORTFOLIO MANAGERS OFCLOSED-END MANAGEMENT INVESTMENT COMPANIES. |
Not applicable to the Registrant.
| ITEM 9. | PURCHASES OF EQUITY SECURITIES BYCLOSED-END MANAGEMENT INVESTMENT COMPANY AND AFFILIATED PURCHASERS. |
Not applicable to the Registrant.
| ITEM 10. | SUBMISSION OF MATTERS TO A VOTE OF SECURITY HOLDERS. |
There were no material changes to the procedures by which shareholders may send recommendations to the Board for nominees to the Registrant’s Board since the Registrant last provided disclosure as to such procedures in response to the requirements of Item 407 (c)(2)(iv) of RegulationS-K or this Item.
| ITEM 11. | CONTROLS AND PROCEDURES. |
| (a) | Based upon their evaluation of the effectiveness of the registrant’s disclosure controls and procedures (as defined in Rule30a-3(c) under the Investment Company Act of 1940 (the “Act”)) as conducted within 90 days of the filing date of this report on FormN-CSR, the registrant’s principal financial officer and principal executive officer have concluded that those disclosure controls and procedures provide reasonable assurance that the material information required to be disclosed by the registrant on this report is recorded, processed, summarized and reported within the time periods specified in the Securities and Exchange Commission’s rules and forms. |
| (b) | There were no changes in the registrant’s internal controls over financial reporting (as defined in Rule30a-3(d) under the Act) that occurred during the second fiscal quarter of the period covered by the report that have materially affected, or are reasonably likely to materially affect, the registrant’s internal control over financial reporting. |
| ITEM 12. | DISCLOSURE OF SECURITIES LENDING ACTIVITIES FORCLOSED-END MANAGEMENT INVESTMENT COMPANIES. |
Not applicable to the Registrant.
| (a) | File the exhibits listed below as part of this form. Letter or number the exhibits in the sequence indicated. |
| | (1) | Any code of ethics, or amendment thereto, that is the subject of the disclosure required by Item 2, to the extent that the registrant intends to satisfy the Item 2 requirements through filing of an exhibit. Not applicable. |
| | (2) | A separate certification for each principal executive officer and principal financial officer of the registrant as required by Rule30a-2(a) under the Act (17 CFR270.30a-2): Attached hereto asEX-99.302CERT. |
| | (3) | Any written solicitation to purchase securities under Rule23c-1 under the Act (17 CFR270.23c-1) sent or given during the period covered by the report by or on behalf of the registrant to 10 or more persons. Not applicable. |
| | (4) | Change in the registrant’s independent public accountant. Not applicable. |
| (b) | If the report is filed under Section 13(a) or 15(d) of the Exchange Act, provide the certifications required by Rule30a-2(b) under the Act (17 CFR270.30a-2(b)), Rule13a-14(b) or Rule15d-14(b) under the Exchange Act (17 CFR240.13a-14(b) or240.15d-14(b)) and Section 1350 of Chapter 63 of Title 18 of the United States Code (18 U.S.C. 1350) as an exhibit. A certification furnished pursuant to this paragraph will not be deemed “filed” for the purposes of Section 18 of the Exchange Act (15 U.S.C. 78r), or otherwise subject to the liability of that section. Such certification will not be deemed to be incorporated by reference into any filing under the Securities Act of 1933 or the Exchange Act, except to the extent that the registrant specifically incorporates it by reference: Attached hereto asEX-99.906CERT. |
Notice
A copy of the Amended and Restated Declaration of Trust, as amended, of the Registrant is on file with the Secretary of State of The Commonwealth of Massachusetts and notice is hereby given that this instrument is executed on behalf of the Registrant by an officer of the Registrant as an officer and not individually and the obligations of or arising out of this instrument are not binding upon any of the Trustees or shareholders individually, but are binding only upon the assets and property of the respective constituent series of the Registrant.
SIGNATURES
Pursuant to the requirements of the Securities Exchange Act of 1934 and the Investment Company Act of 1940, the registrant has duly caused this report to be signed on its behalf by the undersigned, thereunto duly authorized.
(Registrant) MFS SERIES TRUST VI
| | |
| By (Signature and Title)* | | DAVID L. DILORENZO |
| | David L. DiLorenzo, President |
Date: June 17, 2019
Pursuant to the requirements of the Securities Exchange Act of 1934 and the Investment Company Act of 1940, this report has been signed below by the following persons on behalf of the registrant and in the capacities and on the dates indicated.
| | |
| By (Signature and Title)* | | DAVID L. DILORENZO |
| | David L. DiLorenzo, President (Principal Executive Officer) |
Date: June 17, 2019
| | |
| By (Signature and Title)* | | JAMES O. YOST |
| | James O. Yost, Treasurer (Principal Financial Officer and Accounting Officer) |
Date: June 17, 2019
| * | Print name and title of each signing officer under his or her signature. |