UNITED STATES
SECURITIES AND EXCHANGE COMMISSION
WASHINGTON, DC 20549
FORM 20-F
(Mark One)
| ¨ | REGISTRATION STATEMENT PURSUANT TO SECTION 12(b) OR 12(g) OF THE SECURITIES EXCHANGE ACT OF 1934 |
or
| x | ANNUAL REPORT PURSUANT TO SECTION 13 OR 15(d) OF THE SECURITIES EXCHANGE ACT OF 1934 |
For the fiscal year ended: 31 December 2013
or
| ¨ | TRANSITION REPORT PURSUANT TO SECTION 13 OR 15(d) OF THE SECURITIES EXCHANGE ACT OF 1934 |
For the transition period from: to
or
| ¨ | SHELL COMPANY REPORT PURSUANT TO SECTION 13 OR 15(d) OF THE SECURITIES EXCHANGE ACT OF 1934 |
Date of event requiring this shell company report
| | |
| Commission file number: 1-10533 | | Commission file number: 001-34121 |
| |
Rio Tinto plc | | Rio Tinto Limited |
| | ABN 96 004 458 404 |
| (Exact Name of Registrant as Specified in Its Charter) | | (Exact Name of Registrant as Specified in Its Charter) |
| |
England and Wales | | Victoria, Australia |
| (Jurisdiction of Incorporation or Organisation) | | (Jurisdiction of Incorporation or Organisation) |
| |
2 Eastbourne Terrace | | Level 33, 120 Collins Street |
London, W2 6LG, United Kingdom | | Melbourne, Victoria 3000, Australia |
| (Address of Principal Executive Offices) | | (Address of Principal Executive Offices) |
Julie Parent, T: 514-848-8519, E: julie.parent@riotinto.com
(Name, Telephone, E-mail and/or Facsimile number and Address of Company Contact Person)
Securities registered or to be registered pursuant to Section 12(b) of the Act:
| | | | | | |
Title of Each Class | | Name of Each Exchange On Which Registered | | Title of Each Class | | Name of Each Exchange
On Which Registered |
| American Depositary Shares* | | New York Stock Exchange | | | | |
| Ordinary Shares of 10p each** | | New York Stock Exchange | | | | |
| 6.500% Notes due 2018 | | New York Stock Exchange | | 6.500% Notes due 2018 | | New York Stock Exchange |
| 7.125% Notes due 2028 | | New York Stock Exchange | | 7.125% Notes due 2028 | | New York Stock Exchange |
| 1.875% Notes due 2015 | | New York Stock Exchange | | 1.875% Notes due 2015 | | New York Stock Exchange |
| 3.500% Notes due 2020 | | New York Stock Exchange | | 3.500% Notes due 2020 | | New York Stock Exchange |
| 5.200% Notes due 2040 | | New York Stock Exchange | | 5.200% Notes due 2040 | | New York Stock Exchange |
| 8.950% Notes due 2014 | | New York Stock Exchange | | 8.950% Notes due 2014 | | New York Stock Exchange |
| 9.000% Notes due 2019 | | New York Stock Exchange | | 9.000% Notes due 2019 | | New York Stock Exchange |
| 2.500% Notes due 2016 | | New York Stock Exchange | | 2.500% Notes due 2016 | | New York Stock Exchange |
| 4.125% Notes due 2021 | | New York Stock Exchange | | 4.125% Notes due 2021 | | New York Stock Exchange |
| 1.125% Notes due 2015 | | New York Stock Exchange | | 1.125% Notes due 2015 | | New York Stock Exchange |
| 2.000% Notes due 2017 | | New York Stock Exchange | | 2.000% Notes due 2017 | | New York Stock Exchange |
| 3.500% Notes due 2022 | | New York Stock Exchange | | 3.500% Notes due 2022 | | New York Stock Exchange |
| 4.750% Notes due 2042 | | New York Stock Exchange | | 4.750% Notes due 2042 | | New York Stock Exchange |
| 1.625% Notes due 2017 | | New York Stock Exchange | | 1.625% Notes due 2017 | | New York Stock Exchange |
| 2.875% Notes due 2022 | | New York Stock Exchange | | 2.875% Notes due 2022 | | New York Stock Exchange |
| 4.125% Notes due 2042 | | New York Stock Exchange | | 4.125% Notes due 2042 | | New York Stock Exchange |
| 1.375% Notes due 2016 | | New York Stock Exchange | | 1.375% Notes due 2016 | | New York Stock Exchange |
| 2.250% Notes due 2018 | | New York Stock Exchange | | 2.250% Notes due 2018 | | New York Stock Exchange |
| 3.750% Notes due 2021 | | New York Stock Exchange | | 3.750% Notes due 2021 | | New York Stock Exchange |
| 2.250% Notes due 2016 | | New York Stock Exchange | | 2.250% Notes due 2016 | | New York Stock Exchange |
| Floating Rate Notes due 2015 | | New York Stock Exchange | | Floating Rate Notes due 2015 | | New York Stock Exchange |
| Floating Rate Notes due 2016 | | New York Stock Exchange | | Floating Rate Notes due 2016 | | New York Stock Exchange |
| * | Evidenced by American Depositary Receipts. Each American Depositary Share Represents one Rio Tinto plc Ordinary Shares of 10p each. |
| ** | Not for trading, but only in connection with the listing of American Depositary Shares, pursuant to the requirements of the Securities and Exchange Commission |
Securities registered or to be registered pursuant to Section 12(g) of the Act:
| | |
Title of Class | | Title of Class Shares |
| None | | |
Securities for which there is a reporting obligation pursuant to Section 15(d) of the Act:
Indicate the number of outstanding shares of each of the issuer’s classes of capital or common stock as of the close of the period covered by the annual report:
| | | | | | | | | | |
Title of each class | | Number | | | Number | | | Title of each class |
Ordinary Shares of 10p each | | | 1,425,376,417 | | | | 435,758,720 | | | Shares |
DLC Dividend Share of 10p | | | 1 | | | | 1 | | | DLC Dividend Share |
Special Voting Share of 10p | | | 1 | | | | 1 | | | Special Voting Share |
Indicate by check mark if the registrants are well-known seasoned issuers, as defined in rule 405 of the Securities Act. Yes x No ¨
If this report is an annual or transition report, indicate by check mark if the registrants are not required to file reports pursuant to Section 13 or 15(d) of the Securities Exchange Act of 1934. Yes ¨ No x
Note – Checking the box above will not relieve any registrant required to file reports pursuant to Section 13 or 15(d) of the Securities Exchange Act of 1934 from their obligations under those Sections.
Indicate by check mark whether the registrants: (1) have filed all reports required to be filed by Section 13 or 15(d) of the Securities Exchange Act of 1934 during the preceding 12 months (or for such shorter period that the registrants were required to file such reports), and (2) have been subject to such filing requirements for the past 90 days: Yes x No ¨
Indicate by check mark whether the registrant has submitted electronically and posted on its corporate Web site, if any, every Interactive Data File required to be submitted and posted pursuant to Rule 405 of Regulation S-T (§ 232.405 of this chapter) during the preceding 12 months (or for such shorter period that the registrant was required to submit and post such files).* Yes x No ¨
| * | This requirement does not apply to the registrant until its fiscal year ending December 31, 2013. |
Indicate by check mark whether the registrants are large accelerated filers, accelerated filers, or non-accelerated filers. See definition of “accelerated filer and large accelerated filer” in Rule 12b-2 of the Exchange Act. (Check one):
| | | | |
| Large Accelerated Filer x | | Accelerated Filer ¨ | | Non-Accelerated Filer ¨ |
Indicate by check mark which basis of accounting the registrants have used to prepare the financial statements included in this filing:
| | | | |
US GAAP ¨ | | International Financial Reporting Standards as issued by the International Accounting Standards Board x | | Other ¨ |
If “Other” has been checked in response to the previous question, indicate by check mark which financial statement item the registrants have elected to follow: Item 17 ¨ Item 18 ¨
If this is an annual report, indicate by check mark whether the registrant is a shell company (as defined in Rule 12b-2 of the Exchange Act). Yes ¨ No x
This document comprises the annual report on Form 20-F and the annual report to shareholders for the year ended December 31, 2013 of Rio Tinto plc and Rio Tinto Limited (the 2013 Form 20-F). Reference is made to the cross reference to Form 20-F table on pages i to iii hereof (the Form 20-F Cross reference table). Only (i) the information in this document that is referenced in the Form 20-F Cross reference table, (ii) the cautionary statement concerning forward-looking statements on page v and (iii) the Exhibits, shall be deemed to be filed with the Securities and Exchange Commission for any purpose, including incorporation by reference into the Registration Statement on Form F-3 File No. 333-175037, and Registration Statements on Form S-8 File Nos. 333-184397, 33-46865, 333-8270, 333-7328, 333-13988, 333-147914 and 333-156093 and any other documents, including documents filed by Rio Tinto plc and Rio Tinto Limited pursuant to the Securities Act of 1933, as amended, which purport to incorporate by reference the 2013 Form 20-F. Any information herein which is not referenced in the Form 20-F Cross reference table, or the Exhibits themselves, shall not be deemed to be so incorporated by reference.
Form 20-F Cross Reference Table
| | | | | | | | |
| Item Number | | Number Description | | Report section reference | |
| 1. | | Identity of directors, senior management and advisors | | Not applicable | | | | |
| | | |
| 2. | | Offer statistics and expected timetable | | Not applicable | | | | |
| | | |
| 3. | | Key Information | | | | | | |
| A | | Selected financial information | | Performance highlights | | | v | |
| | | | Five Year review | | | 39 | |
| | | | Dual listed companies structure | | | 234 | |
| | | | Dividend rights | | | 234 | |
| | | | Exchange rates | | | 239-240 | |
| B | | Capitalisation and indebtedness | | Not applicable | | | | |
| C | | Reasons for the offer and use of proceeds | | Not applicable | | | | |
| D | | Risk factors | | Risk factors | | | 14-17 | |
| | | |
| 4. | | Information on the company | | | | | | |
| A | | History and development of the company | | Shareholder information | | | | |
| | | | Organisational structure | | | 234 | |
| | | | Nomenclature and financial data | | | 234 | |
| | | | History | | | 234 | |
| | | | Registered offices | | | 245 | |
| | | | Directors’ report
Operating and financial review | | | 42 | |
| | | | Divestments and acquisitions | | | 13 | |
| | | | Major capital projects | | | 12 | |
| | | | Key performance indicators | | | 10-11 | |
| | | | Rio Tinto financial information by business unit | | | 197-199 | |
| | | | Financial statements
Note 2-Operating segments | | | 133-135 | |
| B | | Business overview | | Strategic context | | | 6 | |
| | | | Group strategy and business model | | | 7-8 | |
| | | | Group overview | | | 1-2 | |
| | | | Key performance indicators | | | 10-11 | |
| | | | Additional financial information | | | | |
| | | | Iron Ore | | | 50 | |
| | | | Aluminium | | | 50 | |
| | | | Copper | | | 50 | |
| | | | Energy | | | 50 | |
| | | | Diamonds & Minerals | | | 50 | |
| | | | Financial statements Note 3-Operating segments - Additional
information | | | 136-137 | �� |
| | | | Directors’ report | | | | |
| | | | Governmental regulations | | | 45 | |
| C | | Organisational structure | | Financial statements | | | | |
| | | | Notes 33-36 | | | 170-178 | |
| D | | Property, plant and equipment | | Metals and minerals production | | | 211-214 | |
| | | | Ore reserves | | | 215-224 | |
| | | | Mines and production facilities | | | 226-233 | |
| | | | Financial statements | | | | |
| | | | Note 14-property, plant and equipment | | | 145 | |
| | | |
| 4A. | | Unresolved staff comments | | None | | | | |
| | | |
| 5. | | Operating and financial review and prospects | | | | | | |
| A | | Operating results | | Aluminium | | | 26-27 | |
| | | | Copper | | | 28-29 | |
| | | | Diamond & Minerals | | | 30-31 | |
| | | | Energy | | | 32-33 | |
| | | | Iron Ore | | | 34-35 | |
| | | | Sustainable development | | | 18 | |
| B | | Liquidity and capital resources | | Additional financial information | | | | |
| | | | Cash Flow | | | 51 | |
| | | | Statement of financial position | | | 51 | |
| | | | Financial instruments and risk
management | | | 51 | |
| | | | Capital and liquidity risk management | | | 51-52 | |
| | | | Treasury management and financial instruments | | | 52 | |
| | | | Major capital projects | | | 12 | |
| | | | Financial statements | | | | |
| | | | Note 30-Financial instruments and risk management | | | 158-167 | |
i
| | | | | | | | |
| Item Number | | Number Description | | Report section reference | |
| C | | Research and development, patents and licenses | | | | | | |
| | | | Exploration | | | 36 | |
| | | | Technology & Innovation | | | 37 | |
| D | | Trend information | | Group overview | | | 1-2 | |
| | | | Chairman’s letter | | | 3-4 | |
| | | | Chief executive’s statement | | | 5 | |
| E | | Off-balance sheet arrangements | | See item 5.A | | | | |
| | | | Additional financial information
Off balance sheet arrangements and
contractual commitments | | | 52 | |
| | | | Financial statements
Note 31-contingent liabilities and
commitments | | | 168-169 | |
| F | | Tabular disclosure of contractual obligations | | Additional financial information
Off balance sheet arrangements
and contractual commitments | | | 52 | |
| | | |
| 6. | | Directors, senior management and employees | | | | | | |
| A | | Directors and senior management | | Board of directors | | | 53-55 | |
| | | | Executive committee | | | 56 | |
| B | | Compensation | | Remuneration report | | | 68-108 | |
| | | | Remuneration report tables | | | 98-107 | |
| C | | Board practices | | Board of directors | | | 53-55 | |
| | | | Executive committee | | | 56 | |
| | | | Corporate governance | | | 57-67 | |
| | | | Executives’ service contracts and termination | | | 76 | |
| | | | Position held and date of appointment to
position | | | 76 | |
| | | | Treatment of STIP and LTIP on termination | | | 76-77 | |
| D | | Employees | | Financial statements
Note 5-employment costs | | | 137 | |
| | | | Note 32-average number of employees | | | 169 | |
| | | | Director’s report
Employment policies and communication | | | 45 | |
| E | | Share ownership | | Remuneration report tables
Table 2 | | | 101 | |
| | | |
| 7. | | Major shareholders and related party transactions | | | | | | |
| A | | Major shareholders | | Shareholder information
Substantial shareholders | | | 237 | |
| | | | Analysis of ordinary shareholders | | | 237 | |
| | | | Twenty largest registered shareholders | | | 238 | |
| B | | Related party transactions | | Financial statements
Note 40- related party transactions | | | 180-181 | |
| C | | Interests of experts and counsel | | Not applicable | | | | |
| | | |
| 8. | | Financial Information | | | | | | |
| A | | Consolidated statements and other
financial information | | See Item 18 below | | | | |
| | | | Financial statements
Note 31- contingencies and commitments | | | 168 | |
| | | | Shareholder information
Dividends | | | 239 | |
| B | | Significant changes | | Financial statements
Note 43-events after the statement
of financial position date | | | 181 | |
| | | |
| 9. | | The offer and listing | | | | | | |
| A | | Offer and listing details | | Shareholder information
Markets | | | 236 | |
| | | | Share price information | | | 238 | |
| B | | Plan of distribution | | Not applicable | | | | |
| C | | Markets | | Shareholder information
Markets | | | 236 | |
| D | | Selling shareholders | | Not applicable | | | | |
| E | | Dilution | | Not applicable | | | | |
| F | | Expenses of the issue | | Not applicable | | | | |
ii
| | | | | | | | |
| Item Number | | Number Description | | Report section reference | |
| 10. | | Additional Information | | | | | | |
| A | | Share capital | | Not applicable | | | | |
| B | | Memorandum and articles of association | | Shareholder information
Material contracts | | | 240-241 | |
| | | | Dual listed companies structure | | | 234-236 | |
| C | | Material contracts | | Shareholder information
Material contracts | | | 240-241 | |
| | | | Financial statements
Note 30 - Financial instruments and risk management | | | 158-167 | |
| D | | Exchange controls | | Shareholder information
Exchange controls and foreign investment | | | 241 | |
| E | | Taxation | | Shareholder information
Taxation | | | 241-243 | |
| F | | Dividends and paying agents | | Not applicable | | | | |
| G | | Statement by experts | | Not applicable | | | | |
| H | | Documents on display | | Shareholder information | | | | |
| | | | Document on display | | | 243 | |
| I | | Subsidiary information | | Not applicable | | | | |
| | | |
| 11. | | Quantitative and qualitative disclosures about market risk | | Financial review | | | 38 | |
| | | | Additional financial information | | | 47-52 | |
| | | | Financial statements
Note 30 - Financial instruments and risk management | | | 158-167 | |
| | | | Cautionary statement about forward looking statements | | | v | |
| | | |
| 12. | | Description of securities other than equity securities | | Shareholder information
Markets | | | 236-237 | |
| | | |
| 13. | | Defaults, dividend arrearages and delinquencies | | Not applicable | | | | |
| | | |
| 14. | | Material modifications to the rights of security holders and use of proceeds | | Not applicable | | | | |
| | | |
| 15. | | Controls and procedures | | Corporate governance
Financial reporting | | | 67 | |
| | | | Report of independent registered public accounting firms | | | 204 | |
| | | |
| 16. | | | | | | | | |
| A | | Audit committee financial expert | | Corporate governance
Audit committee | | | 61-62 | |
| B | | Code of ethics | | Corporate governance
Other disclosures | | | 65 | |
| C | | Principal Accountant fees and services | | Director’s report
Fees for audit and non-audit services | | | 46 | |
| | | | Corporate governance
Governance process | | | 61-62 | |
| | | | Auditors | | | 46 | |
| | | | Financial statements
Note 39-Auditors’ remuneration | | | 180 | |
| D | | Exemptions from the listing standards for audit committees | | Not applicable | | | | |
| E | | Purchases of equity securities by the issuer and affiliated purchasers | | Directors’ report
Share capital | | | 43 | |
| | | | Purchases | | | 44 | |
| F | | Change in Registrant’s Certifying Accountant | | Not applicable | | | | |
| G | | Corporate Governance | | Corporate governance
Statement of compliance with governance codes and standards in 2013 | | | 57 | |
| H | | Mine safety disclosure | | Exhibit 99.1 | | | 18 | |
| | | |
| 17. | | Financial statements | | Not applicable | | | | |
| 18. | | Financial statements | | Report of independent registered public accounting firms | | | 204 | |
| | | | Consolidated financial statements | | | 110-201 | |
| | | |
| 19. | | Exhibits | | | | | | |
For this Annual report on Form 20-F, certain pages of the Annual report have been omitted. The Form 20-F is consistent with the page numbering of the Annual report.
iii
| | |
| | | |
riotinto.com/reportingcentre2013 | | |

2013 Annual report
Delivering greater
value for shareholders
iv
Performance highlights
2013 financial results focus on greater value for shareholders
Rio Tinto’s strong results reflect the progress the Group is making to transform the business and demonstrate how it is fulfilling its commitments to improve performance, strengthen the balance sheet and deliver results. The Group achieved underlying earnings of US$10.2 billion, exceeded cost reduction targets and set production records. In turn, this has enhanced cash flow generation and lowered net debt. The 15 per cent increase in the dividend reflects Rio Tinto’s confidence in the business and its attractive prospects.
| – | Underlying earnings of US$10.2 billion were up ten per cent on 2012. |
| – | Operating cash cost improvements of US$2.3 billion(a) exceeded the 2013 target of US$2.0 billion. |
| – | Exploration and evaluation savings delivered US$1 billion(a), against the 2013 target of US$750 million. |
| – | Production records set for iron ore, bauxite and thermal coal and a strong recovery in copper volumes. Iron ore volumes were bolstered by the completion in August of the Pilbara phase one infrastructure expansion in Western Australia to 290 Mt/a, with ramp-up on track to reach nameplate capacity before the end of the first half of 2014. |
| – | Net earnings of US$3.7 billion reflect non-cash exchange losses of US$2.9 billion and impairments of US$3.4 billion, notably the impairment of a previous non-cash accounting uplift on first consolidation of Oyu Tolgoi, a significant project cost overrun at Kitimat and the previously announced curtailment of the Gove alumina refinery. |
| – | Cash flows from operations of US$20.1 billion were up 22 per cent and capital expenditure was down 26 per cent to US$12.9 billion. |
| – | Net debt reduced to US$18.1 billion at 31 December 2013, US$4.0 billion down on the half year and US$1.1 billion down on the previous year end. |
| – | 15 per cent increase in full year dividend to 192 US cents per share reflects the sustainable growth of the business. |
| (a) | Refer to cash costs, exploration and evaluation commentary on page 48, and corresponding reconciliation to profit for the year on page 47. |
| | | | | | | | | | | | |
Year to 31 December 2013 (All amounts are US$ millions unless otherwise stated) | | 2013 | | | 2012 | | | Change | |
| Underlying earnings(b) | | | 10,217 | | | | 9,269 | | | | +10% | |
| | | |
| Net earnings/loss(b) | | | 3,665 | | | | (3,028 | ) | | | | |
| | | |
| Cash flows from operations | | | 20,131 | | | | 16,521 | | | | +22% | |
| | | |
| Capital expenditure | | | 12,944 | | | | 17,575 | | | | -26% | |
| | | |
| Underlying earnings per share – US cents | | | 553.1 | | | | 501.3 | | | | +10% | |
| | | |
Basic earnings/(loss) per share from continuing operations – US cents | | | 198.4 | | | | (163.4 | ) | | | | |
| | | |
| Ordinary dividends per share – US cents | | | 192.0 | | | | 167.0 | | | | +15% | |
The financial results are prepared in accordance with International Financial Reporting Standards as issued by the International Accounting Standards Board (IFRS) and conform to IFRS as adopted by the European Union (EU IFRS).
| (b) | Underlying earnings is the key financial performance indicator which management uses internally to assess performance. It is presented here to provide greater understanding of the underlying business performance of the Group’s operations attributable to the owners of Rio Tinto. Net earnings and underlying earnings relate to profit attributable to owners of Rio Tinto. Underlying earnings is defined and reconciled to net earnings on pages 134 and 135. Comparative information has been restated to reflect a number of new accounting standards. Please see note 46 on page 191. |
Rio Tinto is reducing the print run of this document to be more environmentally friendly.
We encourage you to visit:riotinto.com/reportingcentre2013
Navigating through Rio Tinto’s
Annual and Strategic report
As of 2013, the UK’s regulatory reporting framework requires companies to produce a strategic report. The intention is to provide investors with the option of receiving a document which is more concise than the full annual report, and which is strategic in its focus.
The first 40 pages of Rio Tinto’s 2013 Annual report constitute its 2013 Strategic report. References to page numbers beyond 40 are references to pages in the full 2013 Annual report. This is available online atriotinto.com/reportingcentre2013 or shareholders may obtain a hard copy free of charge by contacting Rio Tinto’s registrars, whose details are set out on the inside back cover of this document.
In light of the new regulatory requirement to produce a strategic report in lieu of summary financial statements, and the Group’s focus on delivering greater value for shareholders, Rio Tinto is no longer producing an Annual review. Please visit Rio Tinto’s website to learn more about the Group’s performance in 2013.
This Annual report, which includes the Group’s 2013 Strategic report, complies with Australian and UK reporting requirements.
Copies of Rio Tinto’s shareholder documents – the 2013 Annual report and 2013 Strategic report, along with the 2014 Notices of annual general meeting – are available to view on the Group’s website:riotinto.com
Cautionary statement about forward-looking statements
This document contains certain forward-looking statements with respect to the financial condition, results of operations and business of the Rio Tinto Group. These statements are forward-looking statements within the meaning of Section 27A of the US Securities Act of 1933, and Section 21E of the US Securities Exchange Act of 1934. The words “intend”, “aim”, “project”, “anticipate”, “estimate”, “plan”, “believes”, “expects”, “may”, “should”, “will”, “target”, “set to” or similar expressions, commonly identify such forward-looking statements.
Examples of forward-looking statements in this Annual report include those regarding estimated ore reserves, anticipated production or construction dates, costs, outputs and productive lives of assets or similar factors. Forward-looking statements involve known and unknown risks, uncertainties, assumptions and other factors set forth in this document that are beyond the Group’s control. For example, future ore reserves will be based in part on market prices that may vary significantly from current levels. These may materially affect the timing and feasibility of particular developments. Other factors include the ability to produce and transport products profitably, demand for our products, changes to the assumptions regarding the recoverable value of our tangible and intangible assets, the effect of foreign currency exchange rates on market prices and operating costs, and activities by governmental authorities, such as changes in taxation or regulation, and political uncertainty.
In light of these risks, uncertainties and assumptions, actual results could be materially different from projected future results expressed or implied by these forward-looking statements which speak only as to the date of this Annual report. Except as required by applicable regulations or by law, the Group does not undertake any obligation to publicly update or revise any forward-looking statements, whether as a result of new information or future events. The Group cannot guarantee that its forward-looking statements will not differ materially from actual results.
v
Group overview
Introduction to Rio Tinto
Rio Tinto is a leading global mining group that focuses on finding, mining and processing the Earth’s mineral resources. Our vision is to be a company that is admired and respected for delivering superior value, as the industry’s most trusted partner.
With a view to sustaining returns to shareholders over time, we take a long-term approach to our activities. This means concentrating on developing Tier 1 orebodies into long-life, low-cost, expandable operations that are capable of providing competitive returns throughout business cycles.
We have a diverse portfolio and a global presence: our 66,000 people work in more than 40 countries. Our five product groups summarised below are supported by our Exploration and Technology & Innovation groups (also see pages 26 to 37). We are committed to creating a culture of high performance – providing challenging work and opportunities to grow, and rewarding those who help deliver superior value.
Sustainable development is integrated into everything we do. Our operations give us the opportunity to bring long-lasting positive change to the communities, regions and countries in which we work, and our metals and minerals are transformed into end products that contribute to higher living standards.
The safety of our people, and our values – accountability, respect, teamwork and integrity – are at the core of our way of working. Our responsible approach to mineral development ensures we gain and maintain our licence to operate. It means we provide confidence to our stakeholders, and improve our access to the mineral resources, people and capital we need.
Aluminium product group
Building on more than a century of experience and expertise, Rio Tinto Alcan is a global leader in the aluminium industry. Our fully-integrated facilities include high-quality bauxite mines, large-scale alumina refineries, and some of the world’s lowest-cost, most technologically-advanced primary aluminium smelters.
Products
Bauxite
Bauxite is the natural ore used to make aluminium. It is refined into alumina which is smelted into aluminium metal. Our wholly-owned and joint venture bauxite mines are located in Australia, Brazil and Guinea.
Alumina
Alumina (aluminium oxide) is extracted from bauxite via a refining process. Approximately four tonnes of bauxite are required to produce two tonnes of alumina, which in turn makes one tonne of aluminium metal. Our wholly-owned and joint venture alumina refineries are located in Australia, Brazil and Canada.
Aluminium
Aluminium is a unique and versatile modern metal. Light, strong, flexible, non-corrosive and infinitely recyclable, aluminium is one of the most widely-used metals in the world. Its largest markets are transportation, machinery and construction. Our smelters are mainly concentrated in Canada. We also have plants in France, Australia, New Zealand, Cameroon, Iceland, Norway, the UK and Oman.
Strategic advantages
| – | Access to the largest and best-quality bauxite ore reserves in the industry. |
| – | Strong hydropower position, which delivers significant cost and other advantages in today’s carbon-constrained world. |
| – | Rio Tinto Alcan has a first-quartile cost position for aluminium smelting, with industry-leading smelting technology, and a solid second-quartile cost position for alumina refining. |
| – | One of the lowest-cost quartile bauxite producers. |
| | |
| Key production locations | | Key sales destinations |
| – Canada | | – Asia |
| |
| – Europe | | – Americas |
| |
| – Australia | | – Europe |
| | |
Full operating review on page 26. | | |
Copper product group
Rio Tinto’s Copper product group is made up of four operating assets and two key development projects. Our operating assets are world-class and our project pipeline of longer-term opportunities will help ensure we will continue to be well positioned to meet demand for one of the world’s most sought-after resources.
Products
Copper
The world uses more than 26 million tonnes of copper every year. It is malleable, durable, resistant to corrosion, hygienic and an excellent conductor of heat and electricity, making it useful in a broad range of building, construction and electrical applications. Copper is a metal at the forefront of green innovation. Hybrid and electric cars rely on it, as do renewable energy sources such as solar power, wind farms, thermal and hydroelectricity. Copper is known for its antibacterial properties and is increasingly used in hospitals and other medical facilities.
Gold
Gold’s conductivity and non-corrosive properties make it a vital fabrication material in technology, electronics, jewellery, space exploration and dentistry. We are one of the world’s top 15 gold producers, and the largest among the diversified miners. We have interests in two copper-gold mines that rank among the world’s largest gold resources, at Oyu Tolgoi and Grasberg.
Silver
Silver has very good electrical and thermal properties. It is used in many electrical and electronic applications, such as photovoltaic cells, and is the principal ingredient of x-ray film. Silver is also regarded as a precious metal used for investment and in jewellery.
Molybdenum
Molybdenum is a metallic element frequently used to produce stainless steel and other metal alloys. It enhances the metal’s toughness, high-temperature strength and corrosion resistance.
Strategic advantages
| – | A phased and structured approach to development investment, while maintaining optionality. |
| – | Participation in, and ownership of, large, long-life, low-cost and expandable assets, with the potential to generate substantial and sustainable value. |
| – | Industry-leading technology and innovation. |
| | |
| Key production locations | | Key sales destinations |
| – US | | – US |
| |
| – Chile | | – China |
| |
| – Mongolia | | – Japan |
| |
| – Indonesia | | |
| | |
Full operating review on page 28. | | |

| | | | |
| | 1 riotinto.com/reportingcentre2013 | | |
Group overview continued
Diamonds & Minerals product group
The Diamonds & Minerals product group comprises a suite of industry-leading, demand-led businesses, which include mining, refining and marketing operations across four sectors. Rio Tinto Diamonds is one of the world’s leading diamond producers, active in mining, manufacturing, selling, and marketing diamonds. Rio Tinto Minerals is a world leader in borates, with mines, processing plants, and commercial and research facilities. Dampier Salt is one of the world’s largest producers of seaborne salt. Rio Tinto Iron & Titanium is an industry leader in high-grade titanium dioxide feedstocks. The Diamonds & Minerals group also includes the Simandou iron ore project in Guinea, one of the largest known undeveloped high-grade iron ore resources in the world.
Products
Diamonds
Diamonds are an important component in both affordable and higher-end jewellery. We are able to service both established and emerging markets as we produce the full range of diamonds in terms of size, quality and colour distribution.
Titanium dioxide
The minerals ilmenite and rutile, together with titanium dioxide slag, can be transformed into a white titanium dioxide pigment or titanium metal. The white pigment is a key component in paints, plastics, paper, inks, textiles, food, sunscreen and cosmetics. Titanium metal’s key properties of light weight, chemical inertness and high strength make it ideal for use in medical applications and in the aerospace industry.
Borates
Refined borates are used in hundreds of products and processes. They are a vital ingredient of many home and automotive applications, and are essential nutrients for crops. They are commonly used in glass and ceramic applications including fibreglass, television screens, floor and wall tiles, and heat-resistant glass.
Salt
Salt is one of the basic raw materials for the chemicals industry and is indispensable to a wide array of automotive, construction and electronic products, as well as for water treatment, food and healthcare.
Other products include high purity iron, metal powders and zircon.
Strategic advantages
| – | Portfolio of industry-leading businesses, operating in attractive markets. |
| – | Demand-led, integrated operations that are responsive to the changing external environment. |
| – | Poised to benefit from mid to late-cycle demand growth as consumption increases in emerging markets. |
| | |
| Key production locations | | Key sales destinations |
| – North America | | – North America |
| |
| – Australia | | – South East Asia |
| |
| – South Africa | | – India |
| | |
Full operating review on page 30. | | |
Energy product group
Rio Tinto’s Energy product group is a leading seaborne supplier of thermal and coking coal to Asian customers and the uranium we produce is used by electricity providers worldwide. We have operations, exploration and development projects in Australia, Namibia, Mozambique and Canada.
Products
Coal
Coal is abundant, relatively inexpensive, and safe and easy to transport. We are a large supplier to the seaborne thermal coal market. Thermal coal is used for electricity generation in power stations. We also produce higher-value coking or metallurgical coal which, when mixed in furnaces with iron ore, produces steel.
Uranium
Uranium is one of the most powerful known natural energy sources, and is used in the production of clean, stable, base-load electricity. After uranium ore is mined, it is milled into uranium oxide – the mine product that is sold for processing into fuel rods for use in nuclear power stations.
Strategic advantages
| – | Strong customer relationships and high-quality assets located in close proximity to growing Asian markets. |
| – | Successfully transforming the business by reducing costs, increasing productivity and improving our position on the cost curve. |
| – | A large and unique resource base of premium quality thermal and coking coal in Australia, located close to existing infrastructure, which would be difficult to replicate. |
| – | Strong product stewardship strategy including investment in technologies to reduce emissions from our products. |
| | |
| Key production locations | | Key sales destinations |
| – Australia | | – Japan |
| |
| – Namibia | | – South Korea |
| |
| | | – Europe |
| | |
Full operating review on page 32. | | |
Iron Ore product group
Rio Tinto’s Iron Ore product group is the second-largest producer supplying the global seaborne iron ore trade. After a decade of rapid expansion in Australia, and more recent growth in Canada, we are well positioned to benefit from the continuing strong demand in China and other Asian markets. We are driving performance through effective project management and value-adding operational efficiencies.
Products
Iron ore
Iron is the key ingredient in the production of steel, one of the most fundamental and durable products for modern-day living, with uses from railways to paperclips. Our iron ore mines are located in Australia and Canada.
Strategic advantages
| – | Proximity of the expanded Pilbara operations in Australia to the world’s largest and fastest-growing customer base. |
| – | Success in increasing operational efficiency and controlling costs. |
| – | Vast potential for brownfield developments near existing infrastructure. |
| – | Proven success in implementing large-scale and complex, value-generating major projects on time and budget without significant impact on operational efficiency. |
| | |
| Key production locations | | Key sales destinations |
| – Australia | | – China |
| |
| – Canada | | – Japan |
| |
| | | – South Korea |
| | |
Full operating review on page 34. | | |
| | | | |
| | 2 riotinto.com/reportingcentre2013 | | |
Chairman’s letter
Dear shareholders,
In 2013 your company was focused on improving the performance of the business, strengthening capital allocation processes and reducing our level of indebtedness – all with a view to ensuring a greater commitment to creating real value for shareholders.
I am pleased to report that substantial progress had been made on meeting these priorities. We achieved underlying earnings of US$10.2 billion and significantly improved cash flow by 22 per cent over 2012. We exceeded our cost reduction targets and set production records. Our net earnings performance of US$3.7 billion takes account of non-cash exchange rate losses and impairments.
We are deeply saddened by the deaths of three of our employees at our managed sites last year and improving safety at all of our operations during the year ahead is of paramount importance.
Our overall performance gave the board the confidence to raise the 2013 full year dividend by 15 per cent. This increased dividend represents an important milestone on the road to improved shareholder value.
Stronger business, creating options
During 2013 greater discipline and accountability was restored throughout the business, particularly in the allocation and management of capital. We simplified and strengthened our systems in this area and improved decision-making capability across the organisation.
Your board regularly evaluates opportunities put forward by the business against all competing uses for cash, striving to achieve the right balance between disciplined investment, strengthening our balance sheet and returning cash to investors.
The reduction in our net debt during 2013 is an indication of our commitment to a stronger balance sheet and provides flexibility in terms of returns and investment. We are building more resilience in our business, which gives your board greater flexibility to respond to macroeconomic developments as they arise.
Strategy development and disciplined delivery
During the year your board supported Sam Walsh on the implementation of his plan to improve performance, strengthen the balance sheet and deliver results. We worked with him on reviewing the company’s strategy and reaffirmed our commitment to invest in and operate long-life, low-cost, expandable mines and businesses. The board also took the time to visit our world-class iron ore operations in the Pilbara in Western Australia to get a deeper understanding of the strategic and operational issues at play.
Sam, his executive team, and all of our 66,000 employees across the world have worked hard during a challenging year and made a large contribution to restore the company to a position of strength. I thank all of our people for their efforts and commend Sam for this leadership during a tough time. But there is more we must do.
Amidst continued market uncertainty, impacts of quantitative easing and austerity programmes still washing through markets around the world, your board has tasked the executive team with ensuring they successfully execute our strategy and make sure the gains delivered are sustained. The discipline of 2013 must be carried forward into the year ahead and beyond, with a specific focus on delivering our growth projects and producing further productivity improvements at all of our sites.
As geopolitical and social risk increase, we remain convinced that businesses which form effective relationships and partnerships around the world will prosper over the longer term. Rio Tinto has always taken its role as a responsible business very seriously and throughout the year ahead we will continue to build our capabilities in stakeholder engagement and sustainable development. We believe earning the trust of our host communities and governments is vital in creating sustainable shareholder value.
Maintaining good governance
Good governance is essential for the long-term success of the Group. In 2013, we have seen a greater level of focus, discipline and accountability throughout the organisation. This continues to be underpinned by your board’s oversight of a robust corporate governance framework to support our business and strategic delivery.
My role as chairman is to lead the board and to ensure it is focused on its oversight of management and the delivery of our strategy. Sam Walsh’s role as chief executive is to focus on sustained operational excellence and growth of the business – and to do so with safety top of mind. Our roles are complementary but distinct. The separation of executive and non-executive accountabilities is essential to good governance: the executives have an operational role, whereas the non-executives have an oversight role, ensuring accountability and exercising strong and deliberate challenge through the board decision-making process to ensure appropriate control mechanisms are in place to safely implement our strategy and plans.
Your board devotes much of its time to reviewing, debating and challenging proposals for investment from management, as well as dealing with a wide range of other issues including safety and the Group’s strategic direction, monitoring business performance, optimising capital allocation and expenditure whilst carefully evaluating the wide range of risks facing the business.
Leadership
Leadership is critical at all levels – at board level, at executive level, and throughout the business. We are committed to effective succession planning at both the board and executive level. My goal is to make sure your board combines the diverse blend of skills and international experience that is available to it now and to enhance it further for the future. Rio Tinto’s board should have the best blend of appropriately skilled and experienced people from our industry, but also outside of it.
2013 saw a number of changes to the executive team, starting with the appointment of Sam Walsh as chief executive. Following Guy Elliott’s decision to retire at the end of 2013, your board appointed Chris Lynch as chief financial officer with effect from April 2013. The board announced the promotion of Jean-Sébastien Jacques as chief executive, Copper, following Andrew Harding’s move to become chief executive, Iron Ore and appointed Greg Lilleyman as Group executive, Technology & Innovation with effect from 1 January 2014, following the retirement of Preston Chiaro from the Executive Committee at the end of 2013.
Preston retires as an executive on 1 April 2014. I would like to thank Guy and Preston for their significant contributions to Rio Tinto over their many years with the Group and we wish them well in their retirement as executives.
Moving forward, I am very pleased to announce today the appointment of two new non-executive directors. Anne Lauvergeon and Simon Thompson will bring a wealth of experience to your board given their combined experience in a number of leading international businesses. We also announced today that Vivienne Cox will stand down at the end of the annual general meeting in London in April, after nine years on the board. I would like to thank Vivienne for her significant contribution to Rio Tinto over this time and wish her well for the future.
We are a balanced and diverse board, comprising myself as chairman, two executive directors and eight (soon to be nine after the new appointments and Vivienne Cox’s retirement) independent non-executive directors, all of whom are rigorously assessed to ensure they continue to meet strict independence criteria. The directors bring with them truly international experience from a wide range of professional, business and public office backgrounds.
| | | | |
| | 3 riotinto.com/reportingcentre2013 | | |
Chairman’s letter continued
The board committees have always played an important oversight role, freeing your board to focus on strategic matters. The board committees, under the effective leadership of their respective chairs, carry out important and demanding roles on your board’s behalf and facilitate the embedding of effective governance across the organisation. You can read more about the work that they do on pages 61 to 63.
The 2013 board and committee performance is described on page 58. I remain comfortable with the effectiveness of your board and the contribution each member of your board is making.
Looking ahead
I feel very privileged to be the chairman of this wonderful organisation. Rio Tinto had to make some significant changes over the last year. Through our transformation we are a simpler and stronger company. Through our improved earnings and reduced costs we are financially stronger. Through our actions we are reducing risk and increasing discipline. Our strategy and priorities are clear. I see great opportunities ahead as we build a long-term future for our business. The work we do is important, we provide the raw materials used in everyday life and as hundreds of millions of people move from rural to urban areas over the coming decades, there will be increased demand for the metals and minerals we produce.
I look forward to reporting on the further progress of your company in a year’s time.
|

Jan du Plessis |
| Chairman |
| 5 March 2014 |
| | | | |
| | 4 riotinto.com/reportingcentre2013 | | |
Chief executive’s statement
Rio Tinto’s turnaround on track
Rio Tinto is a truly great business with renewed vigour and purpose, focused on delivering greater shareholder value.
Dear shareholders,
2013 was a challenging and very rewarding year for Rio Tinto. I was proud to be appointed chief executive of your company a year ago at a time when shareholders had lost some confidence in the business. Change was needed. Trust and confidence in management had to be rebuilt. While I was determined that Rio Tinto would not repeat the mistakes of the past, I also recognised the solid foundations of an outstanding company with extremely good people and assets.
Transforming our business to focus on greater value for shareholders
So, while Rio Tinto was in many ways an outstanding business, we needed to refocus on meeting the expectations of the owners of our company. I defined our 2013 goal as delivering greater value for our shareholders and during the year, I personally met with and listened to hundreds of investors and analysts, as well as our employees, customers and suppliers across the world.
They all told me, we want to see Rio Tinto return to a position of strength. Similarly, I too want Rio Tinto to be a company admired and recognised not just for superior performance but for embodying our values in all that we do. In February 2013, I set out my plan to improve and build upon the strong foundations of the company. This included creating a tightly-run, and more disciplined and accountable business. In 2013, we have done just this and forged ahead with a single-minded emphasis on delivering our priorities to improve performance, strengthen the balance sheet and deliver results in every market in which we operate, everywhere around the world.
Our performance in 2013 reflects the efforts of all of our 66,000 employees to turn this business around. I am humbled by the enthusiasm, passion and talent I have seen, and the willingness of all our people to embrace the change required and improve performance. Against a backdrop of continuing market uncertainty, we have improved earnings and cash flows. We have reduced costs, net debt and capital expenditure. We have delivered greater value for you, our shareholders, which is reflected in the 15 per cent increase in our 2013 full year dividend.
In short, last year, we did what we said we would do. But we are restless to improve further. Our 2013 net earnings reflected impairments on some of our assets and we are absolutely focused on making sure we improve project execution and deliver further business improvements. This, together with improving our safety performance, will be our continuing focus in 2014.
Building a safer business
While we can look back with pride at the many successes we delivered in 2013, we failed to meet our critical goal of no fatalities in our business. Three of our colleagues died working at Rio Tinto managed operations last year. Thirty seven people died at non-managed operations, including 33 at the Grasberg mine in Papua, Indonesia. These are terrible tragedies. With regard to Grasberg, we are continuing to work with our joint venture partner to share our safety capabilities and learnings so we can both improve our safety performance, and this process is ongoing.
All of these deaths weigh heavily on me personally and I, and my management team, feel enormous sorrow for the families and friends of these colleagues. I was also deeply saddened by a further fatality at Grasberg and another at the Gove refinery this year. I am determined that we will turn our safety performance around. We have made significant gains over the course of our safety journey but we have more to do. Strong safety leadership, improved management of critical risks, and learning from all significant incidents are of paramount importance.
Delivering our strategy
We are still operating in a volatile macroeconomic environment. Despite more optimistic signs coming through from OECD economies, and growth remaining
relatively strong in developing economies, the underlying structural fragilities remain. With volatility expected to continue over the short term, we will stand by the priorities we set for ourselves a year ago: to improve performance, strengthen the balance sheet and deliver results. These priorities have already proved effective in making us a more robust organisation, and with continuing focus, we will grow stronger still.
1. Improving performance
We exceeded our targets for reducing operating cash costs and exploration and evaluation expenditure in 2013. These results demonstrate the exceptional work being done across the business to address our cost base. These efforts will continue in 2014, in order to reach a US$3 billion improvement in operating cash costs versus 2012. Our aim is to sustain exploration and evaluation spend at around 2013 levels in 2014 and beyond.
Our 2013 performance was further bolstered by increased production. We set new production records in bauxite, thermal coal and iron ore, and across the Group, our total production grew by nine per cent in 2013 on a copper equivalent basis. Our focus on productivity will persist in 2014, in tandem with our keen eye on costs. Our efforts to reduce costs and increase performance, resulted in improved underlying earnings of US$10.2 billion, up ten per cent on 2012.
2. Strengthening our balance sheet
The excellent performance achieved in reducing costs, together with volume growth, is leading to stronger cash flows. Combined with cash inflows from divestments and lower capital expenditure, we were more than able to reverse the increase in net debt we saw in the first half of the year.
In November, we announced our breakthrough pathway for expanding our Pilbara operations towards 360 million tonnes per annum at a US$3 billion lower capital cost than previously planned. This is a clear example of our disciplined approach to capital allocation. I am confident we have stronger, stricter processes in place for how we allocate capital. As we move forward with reinforced systems embedded at the core of our investment approach, you have my absolute commitment that each and every dollar we are investing on your behalf is being rigorously scrutinised.
Our focus for the year ahead will be to continue to pay down debt and further strengthen the balance sheet. Our aim is to provide the board with options for how best to deliver value to you, whether this is through value-accretive growth, or returning cash, or a combination of both.
3. Delivering results
In keeping with our strategy, 2013 saw the completion of five major capital projects that have already started delivering results: the Oyu Tolgoi copper-gold mine; the first phase of our Pilbara iron ore expansion; the Argyle underground diamond mine; the Kestrel coal mine extension; and the AP60 aluminium smelter. We expect to deliver strong returns from these key assets in our portfolio over the coming years.
Ongoing commitment
In 2013 we rose to the challenge and navigated difficult times to emerge as a leaner and much stronger company. 2014 will be about locking in the gains achieved last year and continuing to strengthen the business.
I would like to close by paying tribute to all of our employees across the world. Without their efforts we would not have been able to turn around the performance of the business and I am energised by the effort, enthusiasm and passion for improvement which I have seen first-hand in every part of our organisation. Over the next 12 months and beyond we will remain focused on safety and upholding our values wherever we operate in the world. Above all, we will continue our single-minded focus on delivering greater value for you, our shareholders.

|
Sam Walsh AO |
| Chief executive |
| 5 March 2014 |
| | | | |
| | 5 riotinto.com/reportingcentre2013 | | |
Strategic context
Global economy
The global economy grew by just three per cent in 2013. Yet, there is a strong sense that developed economies are finally on the path to a more robust recovery. Significant growth headwinds remain in the form of continued fiscal contraction and high debt levels, but construction and manufacturing activity is improving and supporting labour markets. This renewed momentum appears strongest in the US with growth in parts of Europe still proving more hesitant. The improved US outlook led the Federal Reserve to start tapering its accommodative Quantitative Easing (QE) programme towards the end of 2013, with indirect implications for emerging markets. Loose monetary policies in the Organisation for Economic Co-operation and Development (OECD) countries are believed to have supported investment and growth in developing economies, putting the short-term growth outlook in these countries at risk from changing money flows. Asian economies risk seeing this effect compounded by a structural, although very gradual, slowdown in China’s economic expansion.
Having firmly established itself over the past year, China’s new leadership set the agenda for a gradual reform process at the Third Plenum meetings in November 2013. After several years of growth dominated by investment, the country’s economic growth model is beginning to rebalance towards consumption. This process poses significant challenges for the new government, with scope for a volatile transition period. While planned reforms should gradually deliver a more sustainable growth model, the pace of growth is expected to continue to slow. More importantly, slowing growth is now acknowledged by the leadership as inevitable and necessary. As demonstrated in 2013, China’s central government is likely to be more considered and cautious in future policy responses to cyclical growth weakness. Fiscal support for investment and associated short-term spikes in commodity demand are expected to be less frequent and smaller in scale.
Financial markets were less volatile in 2013, and the risk of shocks in Europe much less pronounced than the previous year. Nevertheless, several macro risks still simmer under the surface, with the potential to derail the more positive short-term global outlook at any time. The US government shutdown in late 2013 and protracted negotiations over the debt ceiling are a further reflection of the challenges to bringing US sovereign debt back onto a more sustainable path. Similar tensions extend to Europe where, although intervention from the European Central Bank returned bond yields to more manageable levels, the pace of reforms and structural readjustments necessary for a sustainable monetary union remains slow. Meanwhile, the unwinding of QE policies represents uncharted territory with many potential pitfalls including inflation, significant bond market sell-offs and the formation of new asset bubbles. Added to the uncertainty around China’s reform process and geopolitical tensions in the Middle East, the impact of these key US and European macro risks on future market volatility should not be discounted.
Short-term consensus expectations about India’s growth prospects have been revised downward over the past year, reflecting concerns over the pace of reforms, monetary and fiscal policies and lagging infrastructure development. However, looking further into the future, the rising prosperity in Asia and other emerging markets remains the main global economic trend of relevance to the mining industry. We continue to believe that this will ultimately help to support and sustain an elevated level of global economic growth and commodity demand over the next couple of decades.
Drivers of commodity prices
Long-term structural economic trends are important drivers of future commodity prices through their effects on commodity demand. The economic development and urbanisation of emerging countries goes through an initial investment-led growth phase, which is particularly commodity-intensive. This benefits commodities such as steel and copper used in construction and infrastructure applications. The structure of economies evolves through time and, as the capital stock matures, other commodities such as aluminium, energy products and industrial minerals tend to take over as the main enablers of consumption-led growth models.
While the macroeconomic environment provides a common demand context, supply-side factors can result in stark structural differences across commodity sectors. In principle, commodity prices will tend to have a relationship with the cost of developing and extracting metal and mineral resources. However, the exact nature of that relationship will depend on barriers to entry and exit, which are specific to each sector.
Across many commodity sectors, the general supply trends in recent years have pointed towards fewer discoveries, falling ore grades and maturing existing operations as well as greater complexity of projects and of non-developed orebodies. Technology trends are likely to offer some long-term solutions to these supply challenges, but it is also likely that prices above historical levels will be required for markets to balance the structural demand and supply trends.
Commodity markets
After several years of elevated prices and record investment by mining companies, supply for several commodities has finally started to catch up with demand, at least temporarily. Better-supplied commodity markets have resulted in downward pressures on some prices during 2013, for example on thermal and coking coal. Despite strong Chinese imports, prices for both commodities were down 12 per cent and 22 per cent respectively from 2012 levels. Similar trends have been seen for base metals, although price declines in 2013 were more moderate. Mined copper supply is starting to expand at a faster pace than demand after a long period of constrained and disrupted output growth. In the case of aluminium, there are still no signs of inventories falling, as capacity expansions in western China and the Middle East have outweighed the curtailment of higher-cost smelters. In 2013, prices of exchange-traded metals were also influenced by shifting market expectations on QE tapering. This effect was particularly pronounced in the gold market, where some large daily price corrections resulted in an overall 27 per cent decline between the start and end of the year.
Contrary to consensus expectations at the start of 2013, the iron ore market has so far been one of the most resilient to the commissioning of new supply. Major iron ore producers added about 100 million tonnes per annum of new seaborne capacity last year without the market experiencing a significant price correction. In fact, not only did iron ore prices average four per cent above 2012 levels at US$135/t delivered to China, they also displayed much less volatility throughout 2013 compared to the cycles that this market had become accustomed to since the global financial crisis. The steady iron ore price performance reflected sustained elevated steel output levels in China during most of 2013. Chinese steel demand growth of about seven to eight per cent last year highlighted the continued gap in construction and infrastructure needs in second and third tier cities and in western provinces.
The generally softer price environment and stronger supply growth have refocused the mining industry on dealing with margin compression in 2013. Across the industry, mining companies are reprioritising cost improvements and productivity initiatives, and cutting back on capital expenditure plans.
Outlook
On balance, the short-term economic outlook points to a further consolidation of the global recovery as we start 2014. However, macro risks abound and the potential for continued volatility remains significant. In the mining industry this is likely to drive further prudent investment behaviours while new supply gets absorbed by the market. Looking to the future, our view remains that there will be a high average demand growth setting for our markets and that the complexity of future mining projects will continue to increase.
| | | | |
| | 6 riotinto.com/reportingcentre2013 | | |
Group strategy
External pressures
The mining industry is cyclical and, following a decade-long growth phase, it is now experiencing a period of lower prices and compressed margins. Meanwhile, volatility – a characteristic of the macroeconomic environment since the global financial crisis – has been ongoing and is expected to continue, bringing with it further short-term risk.
Our response to this has been to focus on costs, cash flow and capital discipline. Others in the sector have embarked upon similar paths. Inefficiencies are also being exposed, and so reductions in costs and capital expenditure, productivity improvements, and project deferrals and cancellations have become a prominent part of mining industry strategy.
Despite the uncertain conditions that we currently face, the long-term outlook for our sector remains positive.
The world’s population is forecast to increase by 30 per cent in the next 40 years. Seventy million people enter the middle classes every year. In China alone, around 170 million people are expected to move to an urban environment by 2025. These factors are driving demand for the minerals and metals we produce, as essential ingredients of modern life. They make our business a good and valuable one to be in.
Consistent strategy, sharper focus
Rio Tinto’s vision is to be a company that is admired and respected for delivering superior value as the industry’s most trusted partner.
The world we operate in today, and the future we are preparing for, require us to have a clear and consistent strategy. In 2013, we reaffirmed our direction of
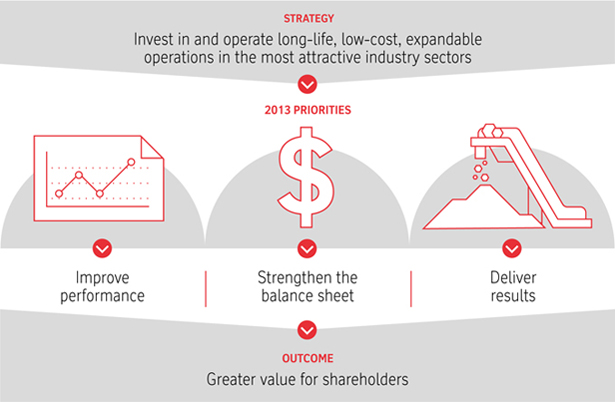
travel and recommitted to the strategy that has worked for us for many years: to invest in and operate long-life, low-cost, expandable operations in the most attractive industry sectors. This strategy will allow us to take advantage of the opportunities ahead, and we are confident that it is the right one for Rio Tinto.
In 2013 we reset our focus on executing the strategy by becoming a leaner, more cash-oriented and tightly-run business. We refocused our Group on improving performance, strengthening our balance sheet, and delivering results – to deliver greater value for shareholders.
We are doing what we said we would: reliably and relentlessly executing our strategy. We are making every dollar count, looking for ways to do things safer, smarter and better, and ensuring that we only invest in activities that add value.
2013 marked our 140th year in business. We have been around this long by being very good at what we do. Looking to the future, disciplined execution of our strategy is vital to building on our recent successes, and our industry-leading capabilities will equip us to do this.
We have world-class people and assets, and have developed pioneering and industry-leading systems and technologies. We pride ourselves on being innovative – finding solutions that help us operate more efficiently, sustainably and responsibly. We are recognised and respected for our exploration and operations expertise, for our values and our commitment to safety, and for creating benefits for our diverse stakeholders.
While these things will not change, our sharpened focus aims to transform us into the highest performer in our sector and will make sure we are fighting fit for the next 140 years and beyond.
| | | | |
| | 7 riotinto.com/reportingcentre2013 | | |
Group strategy continued
Progress against strategy
In 2013, we refocused our business on three clear priorities to deliver greater value for shareholders: to improve performance, strengthen the balance sheet and deliver results.
| | | | |
| What we said we would do in 2013 | | What we did | | What we plan to do in 2014 and beyond |
Improve performance | | | | |
Improve our safety performance | | – Regrettably, our Group had three fatalities at managed operations during 2013 | | – Target, above all, the elimination of workplace fatalities – Achieve a year-on-year improvement in AIFR and lost time injuries – Improve how we manage critical risks and learn from serious potential incidents |
| | – Our all injury frequency rate (AIFR) improved from 0.67 to 0.65 | |
| | | See pages 18 and 10 | |
Deliver US$2 billion in operating unit cash cost reductions | | – Achieved US$2.3 billion of operating unit cash cost improvements – Exceeded our cost savings target while realising productivity gains across the portfolio and setting new production records See page 38 | | – Target further savings to reach US$3 billion full-year improvement in 2014 versus 2012 in operating unit cash costs |
Reduce exploration and evaluation spending by US$750 million pre-tax | | – Reduced exploration and evaluation spending by US$1 billion See page 36 | | – Sustain the reduced exploration and evaluation spend – Continue to progress key evaluation projects at a pace that matches our overall view of investment priorities |
Achieve targeted reductions of US$1 billion in sustaining capital expenditure | | – Reduced sustaining capital expenditure by US$1.9 billion See page 11 | | – Keep sustaining capital expenditure at around this reduced level |
Strengthen the balance sheet | | | | |
Simplify and strengthen our process for allocating capital | | – Set up “cash generation offices” to strengthen the focus on cash and improve visibility for senior managers in this area – Elevated the role of subject matter experts in the economic and technical evaluation phase – Reinforced our Investment Committee approvals process See page 12 | | – Continue to apply our enhanced capital allocation systems and controls, to maintain discipline – Allocate capital in the following order of priority – Essential sustaining capital expenditure – Progressive dividends – Iterative cycle of compelling growth, debt reduction, and further cash returns to shareholders – Pay down debt to a more sustainable level |
Review capital expenditure plans across all of our businesses | | – Reduced capital expenditure from US$17.6 billion in 2012 to US$12.9 billion, completing five major capital projects, which enabled us to bring on significant new volumes | | – Reduce capital expenditure further, to less than US$11 billion in 2014, and to around US$8 billion in 2015, while delivering steady growth |
| | – Completed a ranking process for all our capital projects | | |
| | | See page 12 | | |
Invest only in new projects that provide attractive returns, well above cost of capital, and which compare favourably to other uses of capital | | – Outlined a breakthrough pathway to increase Pilbara mine production capacity towards 360 million tonnes per annum (Mt/a), at a US$3 billion lower capital cost than previously planned – Funding and development of the phase 2 Oyu Tolgoi underground expansion delayed until discussions with Government of Mongolia are concluded See page 12 | | – Increase Pilbara mine production capacity by 60Mt/a between 2014 and 2017, by focusing predominantly on brownfield expansions and low-cost productivity gains – Continue to discuss the pathway forward for Oyu Tolgoi underground expansion |
Deliver results | | | | |
Streamline our portfolio through divestments, targeting significant cash proceeds | | – Announced or completed asset sales of US$3.5 billion – Having been unable to divest Pacific Aluminium for sufficient value, the four smelters and Gove bauxite mine have been reintegrated into the Aluminium group – After exploring options for the Diamonds business, including potential divestment, it has also been retained – this being the best path to generate maximum value See page 13 | | – Continue our long-standing approach of reshaping our portfolio – Curtail the Gove alumina refinery during the first half of 2014 |
Deliver the first phase expansion of the Pilbara operations to 290Mt/a | | – Completed the first phase expansion four months ahead of schedule and US$400 million under budget, delivering first tonnes on the ship in August See page 34 | | – Ramp up to reach an annual production rate of 290Mt/a before the end of the first half of 2014 |
Deliver first production of copper concentrate from Oyu Tolgoi | | – First copper-gold concentrate produced in January; first shipment took place in July; and operating at full capacity by the end of 2013 See page 28 | | – Increase sales volumes at Oyu Tolgoi |
| | | | |
| | 8 riotinto.com/reportingcentre2013 | | |
Business model

How we create value
We create and preserve value by investing in and operating long-life, low-cost, expandable operations in the most attractive industry sectors. From the earliest stages of exploration, during our assets’ productive lives, and throughout the closure and restoration phase beyond, we commit to high standards of sustainable development. Read more on pages 18 to 25.
Explore and evaluate
Our experienced in-house exploration team has a proven track record of discovering Tier 1 orebodies: the highest-value deposits that are profitable throughout the commodity cycle.
We maximise opportunities by exploring for and evaluating deposits in new geographies (such as the La Granja copper project in Peru). We also explore the orbits of our current operations (like the Caliwingina iron ore deposit in the Pilbara), which sustains the value of our existing businesses. We operate the majority of exploration programmes ourselves rather than outsourcing, so we can keep focus on targets that are important to Rio Tinto. We will, however, partner with others if it gives us access to attractive opportunities, or skills, that we do not possess in-house.
Our orebody knowledge allows us to find value-enhancing ways of developing our resources and positioning our products in the market. Our geological expertise gives us the confidence to keep hunting for the most elusive discoveries. And we have a strong tradition of developing and applying innovative technologies to resolve specific exploration challenges.
Develop
We develop orebodies for long-term value delivery. We aim to deliver projects on time and on budget – such as commissioning the first major expansion phase of our Pilbara iron ore operations and the Oyu Tolgoi concentrator in 2013. Through our reinforced capital allocation process, we approve investment only in assets that, after prudent assessment, offer attractive returns that are well above our cost of capital.
During this phase, we plan the most efficient configuration for developing the orebody and for getting the products to market. We work closely and strategically with our customers, to create demand for the optimal suite of products, thus maximising value over the deposit’s lifetime. Once the value of the orebody is confirmed, and internal and external approvals are received, the project moves into implementation and construction.
Mine and process
We create value by safely and efficiently operating assets that fit with our Group strategy. Our global operating model allows us to implement standard processes and systems across the Group, for instance in procurement, operations and maintenance. This globally-consistent approach reduces our use of consumables, increases the life of our equipment and optimises the extraction of ore. In turn, we enjoy higher production and reduced costs, and we maximise value.
We use world-class technologies during mining and processing to increase our efficiency and productivity, and to produce material that is tailored to our customers’ needs. Through networked partnering with academia, technology suppliers and other experts, we gain access to knowledge and technical prowess that augment our own capabilities.
Market and deliver
Our diverse portfolio of metals and minerals allows us to respond to demand across the development cycle: we supply basic raw materials and refined products that are the building blocks of added-value goods. Most of our
customers are industrial companies that process our products further and supply numerous sectors – including construction and infrastructure, automotive, machinery, energy and consumer goods.
We innovate and improve our products and services to maximise value to customers. We are constantly adding to our market knowledge, allowing us to improve our investment decision-making process. In many cases, we are responsible for delivering product to our customers, and do so efficiently, reliably and cost-effectively. We have significant in-house logistical capability, including through our own networks of rail, ports and ships.
Close down and rehabilitate
We integrate closure planning throughout an asset’s life cycle, from the earliest stages of project development. When a resource reaches the end of its life, we seek sustainable and beneficial future land uses, to minimise financial, social and environmental risks. By partnering with external conservation organisations, we access expertise that helps us improve our rehabilitation performance. Our approach helps us to maintain a positive reputation for sustainable development and ensures we meet the expectations of our current and future stakeholders.
Delivering value for our stakeholders
Rio Tinto’s primary focus is on the delivery of value for our shareholders. We balance disciplined investment with prudent management of our balance sheet and cash returns to shareholders. We offer a long-term investment opportunity, and commit to sustainable growth in cash returns to shareholders through our progressive dividend policy. As we work, fixed on this core aim, our activities also give us the opportunity to create value for our other stakeholders, in a variety of ways.
Customers
We supply our customers with the right products at the right time. They then add further value, by turning them into the end products that society needs to make modern life work.
Communities
Our operations create employment and career development opportunities for our local communities, as well as business opportunities for local suppliers. Communities often benefit from the infrastructure we put in place to serve our facilities and, once our operations are closed, we restore the sites – often for community use, new industry, or back to native vegetation.
Our people
We invest in our people throughout their careers, offering diverse employment prospects, opportunities for development, and competitive rewards and benefits that have a clear link to performance. As employees spend their wages, the value we share with them is spread more widely.
Governments
We are often a major economic contributor to the local, state and national jurisdictions in which we operate. Our tax and sovereign equity contributions enable governments to develop and maintain public works, services and institutions. We work together to facilitate growth of diverse and sustainable economies that endure far beyond the active life of our operations.
Suppliers
By seeking a balance of global, national and local supply capability we drive value for our shareholders and deliver economic benefits for the communities in which we operate.
| | | | |
| | 9 riotinto.com/reportingcentre2013 | | |
Key performance indicators
Our key performance indicators (KPIs) enable us to measure our financial and sustainable development performance.
Their relevance to our strategy, and our performance against these measures in 2013, are explained below.
Some KPIs are used as a measure in the long-term incentive arrangements for remuneration of executives. These are identified with this symbol:
| | | | | | |
Indicator | | All injury frequency rate (AIFR) | | Underlying earnings(a) (b) | | Operating cash flow(a) |
| | Per 200,000 hours worked | | US$ millions | | US$ millions |
| | | | | | ¢ Dividends from equity accounted units |
| | | | | | | ¢ Cash flow from consolidated operations |
Relevance to strategy | | The safety of our people is core to everything we do. Our goal is zero harm, including, above all, the elimination of workplace fatalities. We are committed to reinforcing our strong safety culture, and improving safety leadership. | | This is the key financial performance indicator used across the Group. It gives insight to cost management, production growth and performance efficiency. We are focused on reducing our costs and increasing productivity to improve earnings and deliver greater value for shareholders. | | Operating cash flow is a complementary measure to underlying earnings. It also provides insight to how we are managing costs and increasing efficiency and productivity across the business. |
Performance | | | | | | |
| | 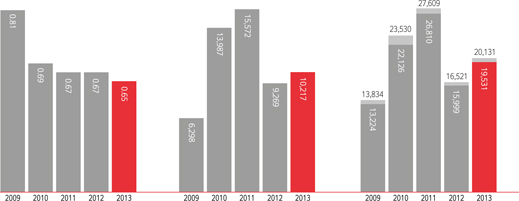 |
| | | Our AIFR has improved by 20 per cent over the last five years. We reduced our AIFR by three per cent in 2013. | | Underlying earnings have increased by US$948 million compared with 2012. This reflects operating cash cost improvements, favourable exchange rates and strong volumes offsetting the impact of lower average market prices for the Group’s commodities (other than Iron Ore) and industry-wide cost inflation pressures. | | Operating cash flows of US$20,131 million, which include US$600 million of dividends from equity accounted units, are 22 per cent higher than in 2012, primarily as the result of higher volumes and cost reduction initiatives. |
Definition | | AIFR is calculated based on the number of injuries per 200,000 hours worked. This includes medical treatment cases, and restricted work-day and lost-day injuries for employees and contractors. | | Items excluded from net earnings to arrive at underlying earnings are explained in note 2 to the 2013 financial statements. | | Operating cash flow represents the cash generated by the Group’s consolidated operations, before payment of interest, taxes, capital expenditure and cash flows relating to financing activities. |
More information | | page 20 | | page 197 | | page 113 |
Notes
| (a) | The accounting information in these charts is drawn up in accordance with IFRS. |
| (b) | Underlying earnings is the key financial performance indicator which management uses internally to assess performance. It is presented here as a measure of earnings to provide greater understanding of the underlying business performance of the Group’s operations. Items excluded from net earnings to arrive at underlying earnings are |
| | explained in note 2 to the 2013 financial statements. Both net earnings and underlying earnings deal with amounts attributable to the owners of Rio Tinto. However, IFRS requires that the profit for the year reported in the income statement should also include earnings attributable to non-controlling interests in subsidiaries. |
| | | | |
| | 10 riotinto.com/reportingcentre2013 | | |
KPI trend data
The Group’s performance against each KPI is covered in more detail in later sections of this Annual report. Explanations of the actions taken by management to maintain and improve performance against each KPI support the data.
| | |
See the Remuneration Report on page 68 | | |
| | | | | | |
Total shareholder return (TSR) % | | Net debt(a) US$ millions | | Capital expenditure(a)(c) US$ millions | | Greenhouse gas (GHG) emissions intensity Indexed relative to 2008 (2008 being equivalent to 100) |
| The aim of our strategy is to maximise total shareholder return. This KPI measures performance in terms of shareholder wealth generation. We also monitor our relative TSR performance against peers. | | Net debt is a measure of how we are managing our balance sheet and capital structure. We constantly evaluate and balance the alternative uses for our cash between disciplined investment, strengthening our balance sheet, and returning cash to investors. | | We are prioritising investment in the highest-returning projects in the most attractive sectors. We are committed to a disciplined and rigorous investment process – investing capital only in assets that, after prudent assessment, offer attractive returns that are well above our cost of capital. | | Our GHG performance is important in upholding and extending our licence to operate. We are focusing on reducing the energy intensity of our operations as well as the carbon intensity of our energy, including through the development and implementation of innovative technologies. |
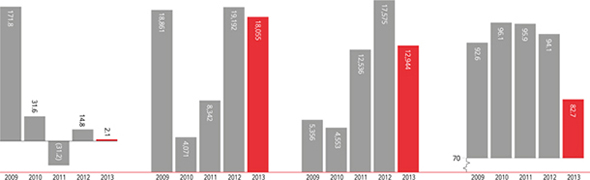 |
| | | |
Rio Tinto’s TSR performance over the five-year period from 2009 to 2013 was characterised by continued volatility in global equity markets and commodity prices. Total dividends paid in calendar year 2013 were 178 US cents per share, a nine per cent increase on 2012. Global investor sentiment improved in the last quarter of the year and both the Rio Tinto plc and Rio Tinto Limited share prices ended the year close to their opening levels. These factors resulted in Rio Tinto registering a TSR of 2.1 per cent in 2013. | | Net debt decreased from US$19,192 million at 31 December 2012 to US$18,055 million at 31 December 2013 as operating cash inflows and divestment proceeds fully offset the outflows relating to capital expenditure and the increase in the dividend payment. | | Capital expenditure of US$12,944 million was US$4,631 million lower than in 2012. This was mainly due to the completion of five major capital projects during the year: the Pilbara iron ore infrastructure expansion to 290Mt/a; Oyu Tolgoi copper-gold mine and concentrator; Kestrel coking coal underground mine; the Argyle underground diamond mine; and the AP60 aluminium smelter in Quebec. | | We have reduced our total GHG emission intensity by 17.3 per cent between 2008 and 2013. This is largely a result of the Ningxia aluminium smelter divestment in 2009, the closure of the Lynemouth smelter in 2012, divestment of the Sebree smelter in 2013 and improved measurement methodology for coal seam gas at our Australian coal mines. |
| TSR combines share price appreciation and dividends paid to show the total return to the shareholder. | | Net debt is calculated as: the net borrowings after adjusting for amounts due to equity accounted units originally funded by Rio Tinto, cash and cash equivalents, other liquid resources and derivatives related to net debt. This is further explained in note 24 “Consolidated net debt” to the 2013 financial statements. | | Capital expenditure comprises the net cash outflow on purchases less disposals of property, plant and equipment, capitalised evaluation costs and purchases less disposals of other intangible assets. | | Our GHG emissions intensity measure is the change in total GHG emissions per unit of commodity production relative to a base year. Total GHG emissions are direct emissions, plus emissions from imports of electricity and steam, minus electricity and steam exports and net carbon credits purchased from, or sold to, recognised sources. |
Page 96 | | page 153 | | page 199 | | page 22 |
| (c) | Amounts include 100 per cent of subsidiaries’ capital expenditures. |
| | | | |
| | 11 riotinto.com/reportingcentre2013 | | |
Capital allocation
The aim of Rio Tinto’s capital allocation process is to invest in a sustainable way through the cycle, having consideration of shareholders’ expectations of returns, and the robustness of our balance sheet. This is achieved through an evaluation and prioritisation of the Group’s portfolio of investment opportunities over a number of years to determine what will be the best use of capital.
In 2013, Rio Tinto enhanced the systems and controls in place to ensure that capital expenditure is kept at a suitable level, while continuing to invest in the best projects. Key considerations in determining the best use of capital include the progressive dividend policy, and the strength of the balance sheet. This, together with financial policies, existing capital commitments and operating cash flow forecasts set the boundaries for how much capital is available for investment.
In today’s capital-constrained environment, only the highest-returning investments will be approved. The Group analyses each investment based on net present value but also considers a number of further factors, including internal rate of return, payback period and risk profile. This suite of ranking criteria, together with the application of strategic judgment, ensures that capital is deployed to the best opportunities.
Rio Tinto’s capital expenditure reduced by 26 per cent to US$12.9 billion in 2013, compared to the peak level in 2012 of US$17.6 billion. It is expected to be reduced further to around US$11 billion in 2014.
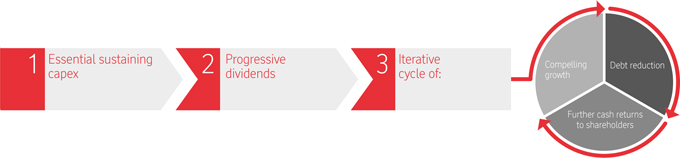
Major capital projects (>US$1bn)
| | | | |
| (Rio Tinto 100% owned unless otherwise stated) | | Total approved capital cost (100%) US$ | | Status/milestones |
| First production in 2013 | | | | |
| Copper– construction of phase one of Oyu Tolgoi copper and gold mine in Mongolia. | | $6.2bn | | First copper-gold concentrate was produced in January 2013 with first shipment on 9 July 2013. |
| Iron ore– expansion of the Pilbara mines, ports and railways from 237Mt/a to 290Mt/a. (Rio Tinto share US$8.4bn). | | $9.8bn | | The expansion was delivered in August 2013. The elements related to fuel, accommodation, and the Nammuldi mine expansion are not yet fully complete. Ramp-up to nameplate capacity is scheduled to take place before the end of the first half of 2014. |
| Iron ore– development of the Hope Downs 4 mine in the Pilbara (Rio Tinto 50%, US$1.3bn) to sustain production at 237Mt/a. | | $2.1bn | | First production occurred in the first half of 2013. The new mine is anticipated to have a capacity of 15Mt/a. |
| Iron ore– Marandoo mine expansion in the Pilbara to sustain production at 237Mt/a. | | $1.1bn | | The expansion is expected to sustain Marandoo at 15Mt/a for 16 further years to 2030. |
| Coking coal– 20 year extension and expansion at Kestrel (Rio Tinto 80%), Queensland, Australia. | | $2.0bn | | Production came on stream in July 2013. It is expected to expand production from 4.3Mt/a to 5.7Mt/a. |
| Diamonds– Argyle underground mine, extending the mine life to at least 2020. | | $2.2bn | | Production commenced in the first half of 2013 and is ramping up to full capacity. |
| Aluminium– AP60 plant (60kt per annum (ktpa)) in Quebec, Canada. | | $1.1bn | | First hot metal was produced in September 2013 and full capacity was reached at the end of the year. |
| Ongoing and approved | | | | |
| Iron ore– expansion of the Pilbara port, rail and power supply capacity to 360Mt/a. (Rio Tinto share, US$3.5bn). | | $5.9bn | | The port, rail and power supply elements include investment in autonomous trains. |
| Iron ore– investment to extend the life of the Yandicoogina mine in the Pilbara to 2021. | | $1.7bn | | The investment includes a wet processing plant to maintain product specification levels. |
| Aluminium– modernisation and expansion of Kitimat smelter in British Columbia, Canada to increase capacity from 280ktpa to 420ktpa. | | $3.3bn | | First production is now expected in the first half of 2015, subject to any additional capital required to complete the project receiving board approval. |
| Copper– development of Organic Growth Project 1 (OGP1) and the Oxide Leach Area Project (OLAP) at Escondida (Rio Tinto 30%), Chile. | | $1.4bn (Rio Tinto share) | | Replacement of the Los Colorados concentrator with a 152kt per day plant, accessing higher-grade ore. Initial production is expected in the first half of 2015. OLAP maintains oxide leaching capacity. |
| Copper– construction of a desalination facility to ensure continued water supply and sustain operations at Escondida (Rio Tinto 30%), Chile. | | $1.0bn (Rio Tinto share) | | The project will provide a sustainable supply of water for the new OGP1 copper concentrator. Commissioning is scheduled for 2017. |
| | | | |
| | 12 riotinto.com/reportingcentre2013 | | |
Cash returns to shareholders
The aim of Rio Tinto’s progressive dividend policy is to increase the US dollar value of ordinary dividends per share over time. The rate of the total dividend, in US dollars per share, is determined annually, taking into account the results for the past year and the outlook for the Group. Under our progressive dividend policy, the total dividend for each year should be equal to or greater than the total dividend for the previous year. The interim dividend is set at one half of the total dividend for the previous year.
The full year dividend in respect of 2013 was increased by 15 per cent, to 192 US cents per share, reflecting the board’s confidence in the business and its attractive prospects. This follows a 15 per cent increase in the 2012 full year dividend, and a 34 per cent increase for 2011.
In 2011 and 2012, Rio Tinto bought back US$7 billion of shares. US$5.5 billion of shares were repurchased in 2011 and the remaining US$1.5 billion were repurchased in 2012.
Divestments and acquisitions
During 2013, Rio Tinto announced or completed US$3.5 billion of divestments, including a binding agreement for the sale of the Clermont thermal coal mine in Queensland for just over US$1 billion, due to complete in the first half of 2014.
| | | | | | |
| Asset | | Consideration US$m | | | Status |
| Divested in 2013 | | | | | | |
| Northparkes mine | | | 820 | | | Sold to China Molybdenum Co. Ltd. |
| Constellium | | | 671 | | | Shares sold to general public. |
| Palabora Mining Company Limited | | | 373 | | | Sold to a consortium led by Industrial Development Corporation of South Africa and Hebei Iron & Steel Group. |
| Eagle nickel-copper project | | | 315 | | | Sold to Lundin Mining Corporation. |
| Altynalmas Gold | | | 235 | | | Sold to Sumeru Gold B.V. |
| Inova Resources Limited | | | 81 | | | Sold to Shanxi Donghui Coal Coking & Chemicals Group Co. |
| Sebree | | | 48 | | | Sold to Century Aluminum Co. |
| Divested in 2012 | | | | | | |
| Alcan Cable | | | 229 | | | Sold to General Cable Corporation. |
| Specialty Alumina businesses | | | Undisclosed | | | Sold to H.I.G. |
| Lynemouth Power Station | | | Undisclosed | | | Sold to RWE. |
| Energy– Extract Resources Ltd/Kalahari Minerals plc | | | 429 | | | Equity investment sold to Taurus Mineral Limited. |
| Divested in 2011 | | | | | | |
| Alcan Engineered Products | | | Undisclosed | | | Sold 61 per cent to investment funds affiliated with Apollo Global Management, LLC (Apollo) and the Fonds Stratégique d’Investissement (FSI). |
| Minerals– talc | | | 340 | (a) | | Sold to Imerys SA. |
| Energy– Colowyo | | | Undisclosed | | | Sold to Western Fuels-Colorado LLC. |
| Exploration– sundry assets | | | 52 | | | Sale of projects including Altai Nuurs coking coal deposit and Sari Gunay gold deposit. |
| Acquired in 2012 | | | | | | |
| Copper– Turquoise Hill Resources Ltd. (formerly Ivanhoe Mines Limited) | | | 307 | | | Purchase of additional shares increasing the Group’s holdings to 51 per cent. |
| Minerals– Richards Bay Mining Proprietary Limited | | | 1,700 | | | Acquisition of BHP Billiton Group’s entire interests in Richards Bay Minerals, doubling the Group’s holding to 74 per cent. |
| Acquired in 2011 | | | | | | |
| Copper– Ivanhoe Mines Limited | | | 1,860 | | | Participation in the strategic rights offering, exercise of outstanding share warrants, exercise of subscription rights granted in 2010 and purchase of additional shares, in aggregate increasing the Group’s holding to 49 per cent. |
| Energy– Riversdale Mining Limited | | | 4,168 | | | Staged acquisition of shares in Riversdale Mining Limited; acquisition of a controlling interest of 52.6 per cent on 8 April 2011, increasing to 100 per cent by 1 August 2011, and renamed as Rio Tinto Coal Mozambique. |
| Energy– Hathor Exploration Limited | | | 550 | | | Purchase of shares in Hathor Exploration Limited resulting in an aggregate of a 70.2 per cent controlling interest being reached on 30 November 2011, increasing to 88 per cent by 31 December 2011 and completed on 12 January 2012. |
There were no material acquisitions during 2013.
| | | | |
| | 13 riotinto.com/reportingcentre2013 | | |
Risk factors
Overview of Rio Tinto’s risk management framework
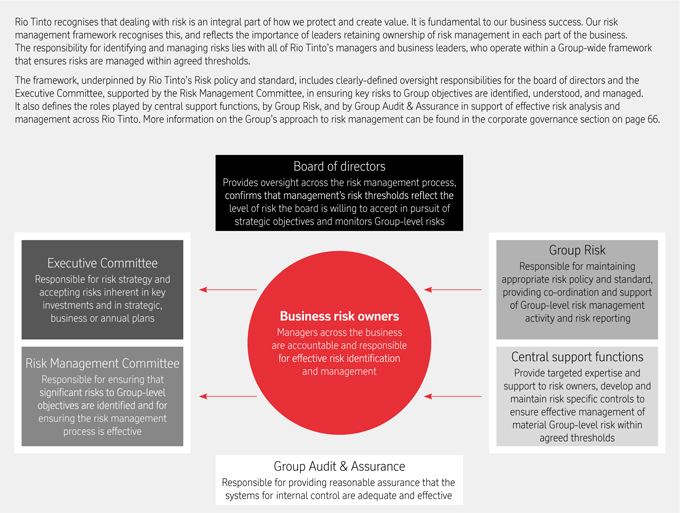
Principal risks and uncertainties
Rio Tinto’s business units and functions assess the potential economic and non-economic consequences of their respective risks using the framework defined by the Group’s Risk policy and standard. Principal risks and uncertainties are identified when the Risk Management Committee, business unit or function determines that the potential consequences are material at a Group level or where the risk is connected and may trigger a succession of events that, in aggregate, become material to the Group. Once identified, each principal risk or uncertainty is reviewed by the relevant internal experts and by the Risk Management Committee.
The following describes all currently-known principal risks and uncertainties that could materially affect Rio Tinto. There may be additional risks unknown to Rio Tinto and other risks, currently believed to be immaterial, which could turn out to be material. The risk factors outlined do not include the management detail on how each is managed and mitigated, which is discussed in more detail on page 66.
Risks may materialise individually, simultaneously or in combination and could significantly affect the Group’s:
| – | short, medium and long-term business and prospects; |
| – | earnings, cash flow and financial position; |
| – | overall financial results and product demand; |
| – | future asset values and growth potential; |
| – | safety record and the long, medium and short-term health of its employees; |
| – | environmental effects; or |
| – | Group or business unit reputation. |
The principal risks and uncertainties should be considered in connection with any forward-looking statements in this document and the cautionary statement on the inside front cover.
| | | | |
| | 14 riotinto.com/reportingcentre2013 | | |
External risks
| | |
| Factor | | Nature |
| Commodity prices and global demand for the Group’s products are expected to remain uncertain | | Commodity prices and demand are volatile and strongly influenced by world economic conditions. The Group’s normal policy is to sell its products at prices that reflect the value of our products in the market and not to enter into price hedging arrangements. Recent volatility in commodity prices and demand may continue, which could adversely affect the Group’s earnings, cash flow and ore reserves. The basis on which the Group prices iron ore in Asia is evolving and to the extent this results in prices or pricing mechanisms that are less favourable to the Group, its earnings and cash flow could be adversely affected. Furthermore, iron ore prices are typically determined on a landed in China basis, and increases in the freight market would adversely impact Group earnings. |
Past strong demand for the Group’s products in China could be affected by future developments in that country | | The Group is heavily reliant on the Chinese market. A micro-economic slowdown, sudden economic disruption (whether caused by sharp curtailment of bank credit or otherwise) or the significant shift from infrastructure-led to consumer spending-focused growth could substantially decrease China’s demands for the Group’s commodities, adversely affecting the Group’s profitability and cash position. |
| Rio Tinto is exposed to fluctuations in exchange rates | | The great majority of the Group’s sales are denominated in US dollars, which is also the currency used for holding surplus cash, financing operations, and presenting external and internal results. Although many costs are incurred in US dollars, a significant portion are incurred in or influenced by the local currencies of the countries where the Group operates, principally the Australian dollar and Canadian dollar. The Group’s normal policy is to avoid hedging of foreign exchange rates and so the Group may be adversely affected by appreciation in the value of other currencies against the US dollar, or to prolonged periods of exchange rate volatility. Currency fluctuations may negatively impact the Group’s profitability and dividend payments as well as rating agency metrics and asset carrying values. |
| Political, legal and commercial changes in the places where the Group operates | | The Group has operations in jurisdictions where governments and communities are seeking a greater share of mineral wealth. Some operations are conducted under specific agreements with respective governments and associated acts of relevant legislative bodies. In several countries, land title and rights to land and resources (including Indigenous title) may be unclear. Political and administrative change, policy reform, and changes in law or government regulation can result in expropriation or nationalisation of the Group’s rights or assets. In some jurisdictions, commercial instability can arise from a culture of bribery and corruption. In its operations and development projects, Rio Tinto is exposed to: – difficulty in obtaining agreements, leases or permits for new activities; – renegotiation, unilateral variation or nullification of existing agreements, leases and permits; – changes in government ownership of operations; – significant restoration and environmental clean-up costs; – currency and foreign investment restrictions; – changes in taxation rates, regimes or international tax agreements; – limitations to power, water, energy and infrastructure access; and – general increases in regulation, including compliance costs. Political instability and uncertainty or government changes to terms applicable to the Group’s operations may result in increased costs for the Group, may curtail or negatively impact existing operations and prevent the Group from making future investments. |
| Community disputes in the countries and territories in which the Group operates | | Some of the Group’s current and potential operations are located in or near communities that may regard these operations as being detrimental to them. Community expectations are typically complex with the potential for multiple inconsistent stakeholder views that may be difficult to resolve. Stakeholder opinion and community acceptance can be subject to many influences, for example, related industries, operations of other groups, or local, regional or national events in other places where we operate. These disputes can disrupt our operations and may increase our costs, thereby potentially impacting our revenue and profitability. In the extreme, our operations may be a focus for civil unrest or criminal activity, which can impact our operational and financial performance, as well as our reputation. |
| Increased regulation of greenhouse gas emissions could adversely affect the Group’s cost of operations | | Rio Tinto’s operations are energy-intensive and depend on fossil fuels. Worldwide, there is increasing regulation of greenhouse gas emissions, tighter emission reduction targets and progressive introduction of carbon pricing mechanisms. These are likely to raise significantly worldwide energy, production and transport costs over the medium to long term, which will increase the Group’s cost base and potentially negatively impact the Group’s profitability. |
| Regulations, standards and stakeholder expectations regarding health, safety, environment and community evolve over time and unforeseen changes could have an adverse effect on the Group’s business and reputation | | The resources sector is subject to extensive health, safety and environmental laws, regulations and standards alongside community and stakeholder expectations. Evolving regulation, standards and stakeholder expectations could result in increased costs, regulatory action, litigation or, in extreme cases, threaten the viability of an operation. |
| | | | |
| | 15 riotinto.com/reportingcentre2013 | | |
Risk factors continued
Strategic risks
| | |
| Factor | | Nature |
| The Group’s exploration and development of new projects might be unsuccessful | | Rio Tinto identifies new orebodies and mining properties through its exploration programme, and develops or expands other operations as a means of generating shareholder value. Exploration is not always successful and there is a high degree of competition to develop world-class orebodies. The Group may also not be able to source or maintain adequate project financing, or may be unable to find willing and suitable joint venture partners to share the cost of developing large projects. Furthermore, project execution may not proceed as planned and project budgets and schedules may prove inaccurate, all of which may negatively impact the Group’s profitability. |
| Rio Tinto may fail to successfully execute divestments and acquisitions | | The Group may not be able to successfully divest non-core assets resulting in unforeseen pressure on its cash position. In addition, potential acquisitions may not succeed, reducing the Group’s ability to expand operations as a means of generating shareholder value. All business combinations or acquisitions entail a number of risks including the cost of effectively integrating acquisitions to realise synergies, significant write-offs or restructuring charges, and unanticipated costs and liabilities. The Group may also be liable for the past acts, omissions or liabilities it has acquired that are unforeseen or greater than anticipated. The Group may also face liabilities for divested entities if the buyer fails to honour all commitments or the Group agrees to retain certain liabilities. |
| |
Financial risks | | |
| Factor | | Nature |
The Group’s reported results could be adversely affected by the impairment of assets and goodwill | | The Group may be required to record impairment charges as a result of adverse developments in the recoverable values of its assets (including goodwill). Significant assumptions in the determination of recoverable value include, but are not limited to: pricing of the Group’s commodities and products, ore reserves, infrastructure availability, discount and exchange rates, operating and development cost projections, and timing of expenditure and revenues related to major projects. In addition, the occurrence of unexpected events, or events beyond the Group’s control that adversely impact its business, may have an impact on the assumptions underlying the recoverable value of its assets. The foregoing items are not exhaustive and impairments may be caused by factors currently unknown to the Group. To the extent that the recoverable value of an asset is impaired, such impairment may negatively impact the Group’s profitability during the relevant period. |
| The Group’s liquidity and cash flow expectations may not be realised, inhibiting planned expenditure | | The Group’s ability to fund planned expenditure such as capital growth, mergers and acquisitions, innovation and other obligations may be hindered if its cash position proves inadequate. Our ability to weather a major economic shock could be compromised by insufficient cash reserves, a reduction in the value of existing cash reserves, or restricted access to these and other sources of cash, including bank financing or international capital markets. |
Failure to reduce costs both in operations and projects may result in reduced margins and threaten the viability of our capital projects | | Input costs in the resources sector can increase at a disproportionate rate, adversely affecting the economics of current operations and increasing the cost of our capital expansion projects. Many of these input costs are linked to commodity prices and, in the case of capital expansion projects, the time lag between incurring project costs and receiving revenue can result in additional exposure to commodity markets. Failure to reduce these costs may have an adverse impact on our operating margins and the viability of our capital expansion projects. |
| |
Operational risks | | |
| Factor | | Nature |
| Estimates of ore reserves are based on uncertain assumptions that, if changed, could result in the need to restate ore reserves | | There are numerous uncertainties inherent in estimating ore reserves, including subjective judgments and determinations that are based on available geological, technical, contract and economic information. Previously valid assumptions may change significantly with new information, which may result in changes to the economic viability of some ore reserves and the need for them to be restated. |
| Labour disputes could lead to lost production and/or increased costs | | Some of the Group’s employees, including employees in non-managed operations, are represented by labour unions under various collective labour agreements. The Group may not be able to renegotiate agreements satisfactorily when they expire and may face difficult negotiations, higher wage demands or industrial action. In addition, labour agreements may not prevent a strike or work stoppage. |
| Some of the Group’s technologies are unproven and failures could adversely impact costs and/or productivity | | The Group has invested in and implemented new technologies both in information systems and in operational initiatives, some of which are unproven and their eventual viability cannot be assessed with certainty. The actual benefits of these technologies may differ materially from expectations. |
The Group may be exposed to major failures in the supply chain for specialist equipment and materials | | Rio Tinto operates within a complex supply chain depending on suppliers of materials, services, equipment, and infrastructure, and on providers of logistics. Supply chain failures, or significantly increased costs within the supply chain, for whatever reason, could have an adverse effect on the Group’s business. |
| | | | |
| | 16 riotinto.com/reportingcentre2013 | | |
| | |
| Factor | | Nature |
| Joint ventures, strategic partnerships or non-managed operations may not be successful and may not comply with the Group’s standards | | The Group participates in several joint venture and partnership arrangements, and it may enter into others, all of which necessarily involve risk. Whether or not the Group holds majority interests or maintains operational control in its joint ventures, its partners may: – have economic or business interests or goals that are inconsistent with, or opposed to, those of the Group; – exercise veto rights to block actions that the Group believes are in its or the joint venture’s best interests; or – be unable or unwilling to fulfil their obligations under the joint venture or other agreements, such as contributing capital to expansion or maintenance projects. Where these joint ventures are controlled and managed by others, the Group may provide expertise and advice but has limited control over compliance with its standards and objectives, such that partners may take action contrary to the Group’s interests or policies with respect to its investment. |
| The Group’s operations are vulnerable to a range of interruptions, not all of which are covered fully by insurance | | 1. Natural disasters and events Mining, smelting, refining and infrastructure installations are vulnerable to natural events including earthquakes, subsidence, drought, flood, fire, storm and the possible effects of climate change. 2. Sustained operational difficulties Operating difficulties are many and various, ranging from geological variations that could result in significant ground or containment failure to breakdown of key capital equipment. Reliable roads, rail networks, ports, power generation and transmission, and water supplies are required to access and conduct our operations. Limitations, or interruptions in transport infrastructure, including as a result of third parties gaining access to our integrated facilities, could impede our ability to deliver products. 3. Information technology and cyber security The Group relies heavily on information technology and process control systems to support our business. In common with most large global companies, the Group has experienced cyber attacks and is faced with ongoing threats to the confidentiality, integrity and availability of such systems. Whilst no material losses related to cyber security breaches have been discovered, given the increasing sophistication and evolving nature of this threat, we cannot rule out the possibility of them occurring in the future. An extended failure of critical system components, caused by accidental or malicious actions, including those resulting from a cyber security attack, could result in a significant environmental, health or safety incident, commercial loss or interruption to operations. 4. Major operational failure The Group’s operations involve chemicals and other substances stored under high temperature and pressure, with the potential for fire, explosion or other loss of control of the process, leading to a release of hazardous materials. This could occur by accident or a breach of operating standards, and could result in a significant environmental, health or safety incident. The Group’s insurance does not cover every potential loss associated with its operations and adequate coverage at reasonable rates is not always obtainable. In addition, insurance provision may not fully cover its liability or the consequences of any business interruption. Any occurrence not fully covered by insurance could have an adverse effect on the Group’s business. |
| The Group depends on the continued services of key personnel | | The Group’s ability to maintain its competitive position is dependent on the services of a wide range of highly-skilled and experienced personnel available in the locations where they are needed. Failure to recruit and retain key staff, and the inability to deploy staff worldwide, where they are most needed, could affect the Group’s business. Similar constraints may be felt by the Group’s key consultants, contractors and suppliers, thereby impacting the Group’s operations, expansion plans or business more generally. |
The Group’s costs of
close-down, reclamation, and rehabilitation could be higher than expected | | Close-down and reclamation works to return operating sites to the community can be extensive and costly. Estimated costs are provided for, and updated annually, over the life of each operation but the provisions might prove to be inadequate due to changes in legislation, standards and the emergence of new reclamation techniques. In addition, the expected timing of expenditure could change significantly due to changes in the business environment that might vary the life of an operation. |
| | | | |
| | 17 riotinto.com/reportingcentre2013 | | |
Sustainable development
Performance data
Our sustainable development performance data are reported for calendar years and, unless stated otherwise, represent 100 per cent basis at each managed operation, even though Rio Tinto may have only partial ownership.
Data reported in previous years may be modified if verification processes detect material errors, or if changes are required to ensure comparability over time.
Wherever possible, data for operations acquired prior to 1 October of the reporting period are included. Divested operations are included in data collection processes up until the transfer of management control.
We have incorporated the requirements of the ten sustainable development principles of the International Council on Mining and Metals (ICMM) and the mandatory requirements set out in ICMM Position statements into our own policies, strategies and standards, and report in line with the Global Reporting Initiative (GRI) G3 guidelines at Application level A+.
Greenhouse gas emissions
We recognise the need to understand and adapt to the physical impacts of climate change, which will affect our operations, particularly through the availability of water and the occurrence of extreme weather events. We believe the global energy and climate challenges are best met by companies, governments and society working together. Our strategy is to maximise shareholder returns by making our assets more resilient against uncertain carbon and energy market risks.
Rio Tinto both produces and consumes energy. Our smelting and mineral processing operations are energy intensive and depend on electricity, coal, oil, diesel and gas to keep them running. The majority of our electricity use is from greenhouse gas-friendly hydro and nuclear power.
We met our five-year target for a six per cent reduction in total greenhouse gas emissions intensity and are on track to achieve our 2015 target of a ten per cent reduction. We had reduced our total greenhouse gas (GHG) emissions intensity by 17.3 per cent at the end of 2013 compared with 2008. Our total GHG emissions were 37.2 million tonnes of carbon dioxide equivalent (CO2-e) in 2013, 3.4 million tonnes lower than in 2012.
There are also significant GHG emissions associated with the transportation, processing and use of our products. In 2013, the three most significant sources of indirect emissions associated with our products were:
| – | Approximately 5.3 million tonnes of CO2-e associated with third party transport of our products and raw materials. |
| – | An estimated 139.4 million tonnes of CO2-e associated with customers using our coal in electricity generation and steel production. |
| – | Approximately 395 million tonnes of CO2-e associated with customers using our iron ore to produce steel (these emissions are not all in addition to the coal-use emissions above, as some customers use both our iron ore and our coal to produce steel). |
Despite the lack of progress towards a global agreement on climate change, legislation that puts a price on greenhouse gas emissions is in place in Europe, Australia, New Zealand, various US states and Canadian provinces. As a result, over two-thirds of our emissions from our operations are covered by market-based carbon regulation.
Safety
Our goal is zero harm, including, above all, the elimination of workplace fatalities. We strive to create a positive safety culture in all parts of our organisation, where everyone is committed to their own safety and the safety of their workmates. Our safety performance is underpinned by a set of global standards that is fully integrated with Rio Tinto’s Health, Safety, Environment and Quality management system.
Our integrated safety approach combines a focus on injury reduction, elimination of fatalities and catastrophic risk management. Central to our approach is that passionate and effective safety leaders engage with their teams to build a zero harm culture. During 2013, all product groups have continued to strengthen safety leadership.
We continued to reduce injury rates across the Group in 2013. Our performance is measured by the all injury frequency rate (AIFR), which includes data for employees and contractors. At the end of 2013 our AIFR was 0.65. Over the last five years we have reduced our AIFR by 20 per cent. This improvement is being driven by the successful zero harm programmes within each of our businesses.
Our lost time injury frequency rate (LTIFR), was 0.42 per 200,000 hours worked in 2013. While our LTIFR compares favourably within the industry and across sectors, we are committed to making further improvements as we strive for our zero harm goal.
Regrettably, we did not meet our goal of zero fatalities in 2013. Three people lost their lives while working at Rio Tinto managed operations. The fatalities were caused by a mobile equipment incident during road maintenance at the La Granja project in Peru, a crush incident at Rio Tinto Alcan’s Alma smelter in Canada, and a crush incident at Richards Bay Minerals in South Africa.
We provided support and counselling to the families and workmates affected by these tragic events and we have shared the lessons from these incidents across the Group. It is essential that we learn from these events if we are to achieve our target of zero fatalities. We are also placing significant focus on the effective investigation of incidents that have the potential to cause fatalities, so that we learn from them.
This focus on investigation and sharing lessons learned extends to our non-managed operations.
During 2013, we continued with our rigorous risk assessment processes and the deployment of critical control monitoring plans to drive effective risk management at an operational level. We also continued to improve specific risk management processes for catastrophic risks such as process and aviation safety.
Non-managed operations and joint ventures
Rio Tinto holds interests in companies and joint ventures that it does not manage, including the Escondida copper mine in Chile and the Grasberg copper-gold mine in Indonesia. We actively engage with our partners around sustainable development through formal governance structures and technical exchanges. In this way we endeavour to ensure that the principles inThe way we workare respected at all times.
Escondida
Rio Tinto has a 30 per cent interest in Escondida, which is managed by BHP Billiton. Our seats on the Owners’ Council allow us regular input on strategic and policy matters. In 2013, Escondida successfully negotiated a four-year contract with their union employees, which allows Escondida to continue to be focused on safety and the environment. Also during the year, the Escondida Water Supply project to construct a new 2,500 litre per second seawater desalination facility was approved. This project will ensure a continued water supply to sustain operations while minimising Escondida’s need to use groundwater.
Grasberg
PT Freeport Indonesia (PTFI), a subsidiary of Freeport-McMoRan Copper & Gold, Inc., owns and operates the Grasberg mine in Papua, Indonesia. We have a joint venture interest attributable to the 1995 mine expansion, which entitles us to a 40 per cent share of production above specified levels until the end of 2021 and 40 per cent of all production after 2021. We have the ability to engage and influence through our representation on the Operating, Technical & Sustainable Development Committees.
Tragically, there were 33 industrial fatalities at PTFI in 2013; 31 underground and two at the surface involving light vehicles. Twenty-eight people lost their lives in the catastrophic underground tunnel collapse incident in May. We have worked closely with, and continue to support, the PTFI leadership team both in the investigation and in the post-investigation lesson implementation to develop practices to avoid catastrophic failures in the future. PTFI manages complex social, community and environmental issues. There have also been instances of violence in areas near the operation, including a series of shooting incidents that resulted in one injury in 2013. PTFI continues to implement prudent measures of security for personnel and material transport. Both Rio Tinto and Freeport-McMoRan support the Voluntary Principles on Security and Human Rights (VPSHR) and work together to ensure practice is consistent with these principles. Rio Tinto continues to monitor the situation.
Rio Tinto is required to disclose mine safety violations or other regulatory matters in accordance with Section 1503(a) of the Dodd-Frank Wall Street Reform and Consumer Protection Act that are included in Exhibit 99.1 to this filing.
| | | | |
| | 18 riotinto.com/reportingcentre2013 | | |
Aluminium
Financial performance
| | | | | | | | |
| | | 2013
US$ million | | | 2012
US$ million | |
Revenue | | | 12,463 | | | | 12,170 | |
Operating cash flow | | | 1,364 | | | | 571 | |
Underlying earnings | | | 557 | | | | 54 | |
Capital expenditure | | | 2,226 | | | | 2,755 | |
Net operating assets | | | 18,814 | | | | 20,461 | |
Following the conclusion of a comprehensive review in August 2013, the Group determined that the divestment of Pacific Aluminium for value was not possible in the current economic conditions. On 29 November 2013, Rio Tinto announced that it intended to suspend alumina production at Gove, Australia and focus on its bauxite operations after determining the refinery was no longer a viable business in the current market conditions. The four Pacific Aluminium smelters and the Gove bauxite mine were therefore reintegrated into Rio Tinto Alcan during the second half of 2013. The Gove alumina refinery continues to be reported in Other Operations. Comparative numbers have been reclassified accordingly.
Strategy and strategic priorities
The Aluminium product group’s ultimate objective is to be the most profitable primary aluminium producer in the world. In today’s challenging environment, this is only achievable by continuing to drive the transformation of the business, focusing on top-tier assets and continuing to improve cost structure in a sustainable way.
The second wave of a comprehensive transformation strategy launched in 2011 is committed to continuing improvement by:
| – | Improving performance through significant, widespread cost reductions and productivity gains. |
| – | Focusing on top-tier assets by curtailing high-cost capacity and divesting non-core assets. |
| – | Delivering key brownfield and modernisation projects that will enable Rio Tinto Alcan to leverage its leading bauxite and unrivalled renewable power positions, as well as its industry-leading proprietary AP technology. |
Safety
In 2013, the Aluminium group’s all injury frequency rate showed incremental improvement to 0.66 versus its target of 0.68(1). Sadly, however, there was one fatality in April, which resulted from an accident at the Alma smelter in Quebec, Canada.
Rio Tinto Alcan’s ongoing priority is to press ahead with implementing the Zero Harm by Choice leadership development programme, while continuing to learn from significant potential incidents and improving the effectiveness of critical control monitoring plans, in order to reach the ultimate goal of zero injuries. Vehicle and pedestrian safety, working at height and lifting loads remain the most important personal safety risks to manage.
Greenhouse gas emissions
Rio Tinto Alcan reduced its greenhouse gas intensity by 29 per cent since 2008, making a substantial contribution to Rio Tinto’s overall GHG intensity improvements(2). This significant reduction came from the divestment or closure of outdated or higher-carbon energy plants, as well as ongoing operational improvements that have combined to give Rio Tinto Alcan one of the lowest carbon footprints in the aluminium industry.
Following the recent reintegration of Pacific Aluminium into Rio Tinto Alcan, 78 per cent of Rio Tinto Alcan’s power supply is carbon-free. Seventy two per cent comes from hydroelectricity, one of the cleanest forms of electricity production, and the remaining six per cent comes from nuclear power sources.
Rio Tinto Alcan works closely with stakeholders to address sustainability concerns and help identify ways to foster greater transparency and sustainability throughout the aluminium industry. In 2013 the results of the Quebec Government-led assessment of the carbon footprint of Rio Tinto Alcan ingot made in Quebec, relative to the industry average, showed a 50 per cent lower global warming potential than the industry average (excluding China).
Review of operations
Rio Tinto Alcan’s ongoing transformation is strengthening its position as the world’s leading aluminium business in terms of quality of assets, productivity and profitability.
The Aluminium group delivered underlying earnings of US$557 million – US$503 million higher than 2012, including increased EBITDA margins, despite a nine per cent decline in average London Metal Exchange (LME) prices period-over-period and the negative impact of severe weather in Australia in the first half of 2013.
The average aluminium market price in 2013 was US$1,845 per tonne, which compares to an average of US$2,018 per tonne in 2012. Rio Tinto Alcan’s average realised price, which includes market and product premiums, for primary metal products in 2013 was US$2,268 per tonne, compared with US$2,383 per tonne in 2012. The growing momentum from the cost reduction initiatives combined with increased volumes and a rise in market premia were the main drivers of the positive change in earnings.
Rio Tinto Alcan pursued more than 500 cost reduction initiatives and in 2013 these improvements lifted underlying earnings by US$392 million (US$574 million pre-tax). The savings included greater production efficiencies and lower prices of raw materials, lower functional costs and increased production from Yarwun and Alma. The impact of the heavy rainfalls in Queensland impacted cost reduction efforts by US$58 million pre-tax.
Higher volumes were boosted by record operational performances at the bauxite operations, notably at the Weipa and Gove mines in Australia, taking advantage of higher demand and the steady ramp-up of production at the expanded Yarwun alumina refinery. Aluminium volumes realised a return to full production at the Alma, Quebec smelter, and completion of the leading-edge AP60 smelter which were in part offset by the curtailment of the Shawinigan smelter and the divestment of the Saint-Jean-de-Maurienne smelter and Castelsarrasin casting facility in France.
The Aluminium group continued to strengthen its portfolio during 2013, building on the momentum of the past five years. To date, it has curtailed or closed 600,000 tonnes of high-cost aluminium smelting capacity, including 100,000 tonnes curtailed at the Shawinigan smelter in Quebec in December 2013. The group is in the process of curtailing 2.6 million tonnes of alumina capacity at Gove. Major divestments during 2013 included the sale of Rio Tinto Alcan’s 50 per cent stake in the Vigelands Metal Refinery and associated power station in Norway, the sale of the St. Jean-de-Maurienne smelter and Castelsarrasin business in France, and the sale of the Sebree smelter in the US.
The group is continuing to review appropriate future pathways for other non-Tier 1 assets.
An impairment charge of US$1,293 million was recognised relating to the Group’s aluminium business, primarily for Gove alumina refinery (US$555 million)(3), following the 29 November announcement to curtail production, and for the Kitimat assets (US$696 million) where a significant project cost overrun has been identified which diminished the value of the associated intangible assets.
| (1) | The figure excludes Pacific Aluminium and Gove. Pacific Aluminium had an all injury frequency rate of 0.88 in 2013. Gove had an all injury frequency rate of 0.93. |
| (2) | The figure excludes Pacific Aluminium and Gove. Pacific Aluminium accounted for 26 per cent of Rio Tinto’s total GHG emissions in 2013, and Gove accounted for five per cent of total GHG emissions. |
| (3) | The Gove refinery is reported as part of Other Operations. |
| | | | |
| | 26 riotinto.com/reportingcentre2013 | | |
Development projects
Rio Tinto Alcan’s primary focus is on delivering key existing brownfield and modernisation projects – investments that will enable it to leverage the group’s strong bauxite and low-cost hydropower positions.
The new Arvida Smelter and AP60 Technology Centre in Quebec’s Saguenay–Lac-Saint-Jean region is complete and has ramped up successfully. With an initial capacity of 60,000 tonnes per year, the smelter provides an industrial-scale research and development platform for commercialising Rio Tinto Alcan’s latest-generation AP Technology™. AP60 is designed to deliver significantly lower full economic costs of production once at full capacity, including 40 per cent higher metal output per pot and 15 per cent higher labour productivity. This new facility, which will eventually replace the existing Arvida smelter, has the potential for two additional phases that would boost annual capacity of the new facility from 60,000 to 450,000 tonnes.
In British Columbia, the modernisation of the Kitimat smelter will enable the Aluminium group to fully leverage its wholly-owned Kemano hydropower resource. A project cost overrun has been identified, and a process to validate the extent of the overrun is currently under way. Any additional capital required to complete the project will be subject to board approval. Subject to that approval, the Kitimat Modernisation Project is now expected to be commissioned and produce first metal during the first half of 2015. This project will increase Kitimat’s annual capacity by some 48 per cent to approximately 420,000 tonnes, while moving production into the first decile of the cost curve and achieving a reduction of more than 50 per cent in the smelter’s emissions intensity.
Ramp-up at the expanded Yarwun alumina refinery in Australia, a project known as Yarwun 2, is now complete and contributing to reduced alumina operating costs. Production capacity at Yarwun has more than doubled, to 3.4 million tonnes per year: an initiative that strengthens Rio Tinto Alcan’s second-quartile position on the industry cost curve for alumina production.
Bauxite growth projects include the South of the Embley expansion project in Queensland, which, subject to approval, will extend the life of the Weipa bauxite mine by about 40 years (depending on production rates). This will ensure continuity of supply for Rio Tinto Alcan’s Gladstone refineries, while also facilitating exports to meet rapidly increasing demand from China and the developing Middle East market. This project can be developed at the appropriate time.
Due to current market conditions, it is unlikely that Rio Tinto Alcan will make further significant investments in aluminium and alumina growth projects for the foreseeable future.
Outlook
Looking to the near term, bauxite should continue to be the healthiest segment of the industry, driven largely by strong demand in China. Rio Tinto Alcan is well positioned to take advantage of this strong demand through its industry-leading bauxite assets, especially against the backdrop of the supply uncertainty created by Indonesia’s export ban, which was implemented in January 2014. Global demand for alumina and aluminium is also strong, however these segments face continued challenges going forward.
At the end of 2013, the aluminium market was nearly balanced following recent curtailments and production disruptions. Aluminium inventories are likely to remain high as warehouse deals are driven by the attractiveness of low interest rates and a strong contango (ie indicative of expected higher prices).
The market for alumina, currently trading at or around the marginal cost of production, is expected to remain near balanced for the near term.
Metal prices remain under pressure – as do many marginal producers. Nonetheless, market premiums have reached unprecedented levels. Despite markedly-increasing premiums, a good portion of the industry remains in a loss-making position. This could intensify pressure for more curtailments, which over the longer term could put upward pressure on the LME base price.
Recent proposals by the LME regarding warehousing rules could soften regional premiums from their recent record levels to a more historic range, but this will take time to unfold.
Despite the short-term challenges, the longer-term outlook for aluminium remains robust and Rio Tinto Alcan believes that strong margins will be available for the well-positioned, low-cost operator. Medium to long-term compound annual demand growth rates (from a 2013 base) are forecast to average five per cent until 2020 and to be near four per cent until 2030. Transportation will be the stand-out growth end-use sector supported by substitution of other materials by aluminium.
| | | | |
| | 27 riotinto.com/reportingcentre2013 | | |
Copper
Financial performance
| | | | | | | | |
| | | 2013
US$ million | | | 2012
US$ million | |
Revenue | | | 5,916 | | | | 6,661 | |
Operating cash flow | | | 672 | | | | 469 | |
Underlying earnings | | | 821 | | | | 1,059 | |
Capital expenditure | | | 2,813 | | | | 4,455 | |
Net operating assets | | | 12,070 | | | | 12,321 | |
Strategy and strategic priorities
The Copper product group’s 4+2 strategy aims to create substantial and sustainable value for shareholders. It is focused on building a core portfolio of four operating assets (Kennecott Utah Copper, Oyu Tolgoi, Escondida and Grasberg) and two world-class greenfield projects (La Granja and Resolution Copper) that are or are expected to be large, long-life, low-cost and expandable operations. The Copper group will deliver this strategy through:
| – | Relentlessly focusing on health, safety, environmental responsibility and community engagement, and sustainable partnerships with governments and communities. |
| – | Improving productivity via safer, better and smarter practices and selected investments in technologies that generate long-term value. |
| – | Driving maximum value out of the products the group mines and optimising the entire supply chain. |
| – | Developing strong leadership, matching the group’s employees and skills to its current and future requirements, and creating a culture that establishes accountability for delivery of business objectives. |
Safety
In 2013, the Copper group’s all injury frequency rate was 0.49, compared to 0.50 in 2012. The group regrettably had a fatality at La Granja, one of its managed projects, in 2013. Tragically, there were 33 fatalities at the non-managed Grasberg mine, of which 28 were related to a devastating underground accident. There was also a fatality at the SouthGobi Resources non-managed infrastructure project.
Rio Tinto Copper’s safety programmes are focused on four facets:
| – | Eliminating fatality risks and catastrophic events, and developing sound mitigation plans. |
| – | Helping employees at all levels understand safety risks and how to manage them. The group’s new Underground performance safety standards are believed to be the most thorough and inclusive in the mining industry. |
| – | Strong focus on reducing injuries. |
| – | Safe design and engineering standards. |
Greenhouse gas emissions
The Copper group’s 2013 greenhouse gas emissions were 8.34 tonnes of carbon dioxide equivalent per tonne of copper cathode produced, compared with 10.66 tonnes in 2012. The increase in efficiency resulted from an incremental improvement at Kennecott Utah Copper and from the divestment of the Palabora smelter in mid-2013.
Review of operations
The Copper portfolio is made up of large, long-life, low-cost and expandable operations that are capable of creating substantial and sustainable value for shareholders. In 2013, the group produced 631 thousand tonnes of mined copper (Rio Tinto share), making Rio Tinto the world’s sixth largest supplier. The group also produced 340 thousand ounces of mined gold, 4,765 thousand ounces of mined silver and 5.7 thousand tonnes of molybdenum as by-products of its copper operations.
The group’s underlying earnings of US$821 million were 22 per cent lower than 2012. Excluding the impact of the US$131 million write-down of the investment in Northern Dynasty Minerals, which owns 100 per cent of the Pebble Project in the Bristol Bay region of western Alaska, underlying earnings were ten per cent lower than 2012. This reflected lower prices, the impact of the pit wall slide at Bingham Canyon and decreased gold and molybdenum volumes at Kennecott Utah Copper from lower grades. These were partly offset by US$352 million of cash cost savings (US$514 million pre-tax) achieved across the Copper group, notably at Kennecott Utah Copper. A post-tax and non-controlling interest impairment charge of US$1,655 million has been recognised as an exclusion from underlying earnings. This includes US$1,565 million related to the impairment of previous non-cash accounting uplifts on first consolidation of certain assets of Turquoise Hill (including Oyu Tolgoi). In addition, charges of US$283 million have been excluded from underlying earnings related to the Kennecott Utah Copper slide.
In 2013, the group repositioned its portfolio and delivered significant improvements in productivity and costs, with a 15 per cent increase in mined copper despite challenges at Kennecott and Oyu Tolgoi, a 12 per cent reduction in costs at managed operations – including a 23 per cent reduction in service and support costs. It also completed US$1.8 billion of divestments.
Core operating assets
Kennecott Utah Copper (Rio Tinto: 100 per cent)
As the second largest copper producer in the US, Kennecott accounts for nearly 25 per cent of the country’s copper production. In 2013, Kennecott produced 194 thousand tonnes of refined copper, 192 thousand ounces of refined gold, and 5.7 thousand tonnes of molybdenum. On 10 April 2013, the Bingham Canyon Mine experienced a 135 million tonne landslide on the north-east wall. As a result of Kennecott’s sophisticated monitoring systems and advanced planning, no one was injured. Recovery work will continue until the end of 2015, with production in the near and medium term constrained by the slide. In 2013, Kennecott’s underground project was paused until further value-engineering work is completed to assess the most profitable path forward for the project.
Oyu Tolgoi (Rio Tinto: 51 per cent interest in Turquoise Hill Resources)
Located in Mongolia’s South Gobi Desert, Oyu Tolgoi is the largest new copper-gold operation in the world. Commercial operations began in mid-2013 and Oyu Tolgoi’s open pit is now operating at full capacity. In 2013, Oyu Tolgoi produced 77 thousand tonnes of copper and 157 thousand ounces of gold. Customers began collecting concentrate from the Chinese warehouse during the fourth quarter of 2013, and had withdrawn approximately 26,400 tonnes of concentrate by year end.
Escondida (Rio Tinto: 30 per cent)
Located in Chile’s Atacama Desert, Escondida is the world’s largest copper mine in terms of copper production. In 2013, Escondida produced 1.1 million tonnes of copper (100 per cent basis).
Grasberg (a joint venture that gives Rio Tinto a 40 per cent share of production above specified levels until the end of 2021 and 40 per cent of all production after 2021)
Grasberg is owned and operated by PT Freeport Indonesia, a subsidiary of US-based Freeport-McMoRan Copper & Gold Inc. Located in the province of Papua in Indonesia, it is one of the world’s largest copper mines. Rio Tinto’s share of mined copper production at Grasberg was six thousand tonnes in 2013.
Divested operations
In 2013, Rio Tinto Copper made solid progress in repositioning its portfolio to focus on a core portfolio of Tier 1 assets, with US$1.8 billion of divestments completed, including Northparkes, Palabora, Eagle, Altynalmas Gold and Inova. The group has also committed to reviewing the strategic fit of its minority interest in Northern Dynasty Minerals, which owns 100 per cent of the Pebble Project in Alaska.
| | | | |
| | 28 riotinto.com/reportingcentre2013 | | |
Northparkes (formerly Rio Tinto: 80 per cent)
Located in New South Wales, Australia, Northparkes was a joint venture with the Sumitomo Group. Northparkes produced 51 thousand tonnes of copper and 62 thousand ounces of gold up to December 2013 (100 per cent basis). In July 2013, Rio Tinto announced an agreement to sell its 80 per cent interest in Northparkes to China Molybdenum Co., Ltd. (CMOC) for US$820 million. The transaction closed on 1 December 2013.
Palabora (formerly Rio Tinto: 57.7 per cent)
Palabora Mining Company is a South African company formerly listed on the Johannesburg Stock Exchange. The mine produced 26 thousand tonnes of refined copper up to July 2013 (100 per cent basis). In December 2012, Rio Tinto announced an agreement to sell its interest in Palabora for consideration totalling US$373 million. The transaction closed on 31 July 2013.
Development projects
The Copper group’s investment focus is on improving productivity and mine life at key operating assets and retaining development optionality on high quality projects, with production to come online when the market dictates. It employs a phased approach to development to maximise the value of a project to shareholders and to manage project risks and capital exposure.
Productivity and mine life extension
Kennecott
Rio Tinto is investing US$660 million to extend the life of Kennecott’s Bingham Canyon Mine from 2018 to 2030. The project, known as Cornerstone, involves pushing back the south wall of Bingham Canyon to gain access to 515 million tonnes of 0.79 per cent copper equivalent ore, with first ore expected to be accessed in 2017.
Escondida
At Escondida, production was approximately seven per cent higher in 2013, primarily as a result of higher ore grades and improved throughout rates. In addition, Escondida will construct a new dynamic leach pad to maintain current levels of oxide leaching. The project should be complete in mid-2014, when the existing heap leach is exhausted.
Grasberg
PT Freeport Indonesia continues to develop the large-scale, high-grade underground orebodies located beneath and nearby the Grasberg open pit. In aggregate, these underground orebodies are expected to ramp up over several years to approximately 240,000 tonnes of ore per day following the anticipated transition from the Grasberg open pit in 2017.
Oyu Tolgoi
On 29 July 2013, Rio Tinto announced that all funding and work on underground development of Oyu Tolgoi would be delayed. Since then, Rio Tinto has continued to engage with the Government of Mongolia with the aim of resolving a number of outstanding shareholder issues and to progress project finance. An option to restart underground development, subject to certain conditions being met, has been proposed, but further delays may occur if these conditions are not met before lender commitments on existing project finance arrangements expire. Such delays could lead to further impairments.
Greenfield projects
La Granja (Rio Tinto: 100 per cent)
The La Granja project, located in northern Peru, has the potential to be a Tier 1 asset and one of Rio Tinto’s highest-value opportunities.
The project strategy is focused on delivering a risk-managed and staged entry to a world-class mining district. The mine development strategy is designed to manage social, environmental and technical challenges by starting at a small scale and preserving options to grow the project over time.
Resolution Copper (Rio Tinto: 55 per cent)
The Resolution Copper project, located in Arizona, US, is among the top ten largest undeveloped copper assets in the world, and could eventually become the largest copper producer in North America.
In November 2013, the company submitted a Mine Plan of Operations to initiate Federal permitting on the project. Approval of the plan would allow mining to occur on lands where the company currently holds mineral title. Resolution is also seeking approval in the US Congress to acquire full legal title to 671 hectares of public land held under its mineral claim and to revoke a mineral withdrawal on 307 hectares of adjacent land. In exchange, the project would give the public more than 2,400 hectares of high-quality Arizona conservation lands. While exchange legislation faces opposition from special-interest groups, it is moving through the US Congress with bi-partisan support.
Technology and innovation
The Copper group recently established a Growth and Innovation organisation responsible for developing a focused, attractive portfolio of value-producing growth and innovation opportunities. The group invests in value-creating, leading-edge technology to drive the efficiency and safety of its mining processes and reduce environmental impact, above and below ground.
Taking in real-time data, the new Excellence Centre uses the latest in modelling and simulation tools to significantly improve copper processing performance across the globe.
Rio Tinto is evaluating a range of incremental and step-change technologies to improve the safety and productivity of current mines and expansions, with a particular focus on mineral processing and block cave mining. This has included large-scale copper sulphide leach testwork on the La Granja mineralisation and a successful pilot sulphide leach facility using ore at Kennecott.
Outlook
While Rio Tinto expects volatility in the near term, long-term fundamentals for the copper industry remain positive. The continued urbanisation, industrialisation and electrification of China and other large markets such as India and South East Asia, combined with greater energy-efficiency requirements and the move toward more renewable energy sources, will continue to drive long-term copper demand. Against those demand dynamics, the supply picture will remain constrained, with continued cost escalation in some jurisdictions, falling grades, technical challenges from increasing depth at existing operations and new discoveries, water and power constraints, and continued political and social risks, especially for new projects.
Rio Tinto Copper is well positioned to benefit from of these strong market dynamics. It is currently the industry’s sixth largest copper producer, with existing Tier 1 assets. In addition, the group is pursuing high-value growth opportunities, using a phased and structured approach to development investment while maintaining optionality. The group is carefully managing costs and capital exposure, and its leadership in technological innovations allows it to safely and efficiently access lower grade ores and deposits, at greater depths. This strategy will generate significant and sustainable value for shareholders and all partners, as it is expected to reposition the group from the third quartile of the copper cost curve into a low-cost, first quartile producer.
| | | | |
| | 29 riotinto.com/reportingcentre2013 | | |
Diamonds & Minerals
Financial performance
| | | | | | | | |
| | | 2013
US$ million | | | 2012
US$ million | |
Revenue | | | 4,193 | | | | 4,056 | |
Operating cash flow | | | 909 | | | | 267 | |
Underlying earnings | | | 350 | | | | 149 | |
Underlying earnings excluding Simandou | | | 393 | �� | | | 411 | |
Capital expenditure | | | 1,009 | | | | 1,814 | |
Net operating assets | | | 7,900 | | | | 8,061 | |
Strategy and strategic priorities
The Diamonds & Minerals product group has an attractive portfolio of businesses that connect customers and consumers all around the world with products that enhance the quality of life. Demand growth for diamonds and industrial minerals typically follows peak requirements for commodities such as iron ore and copper as mid-to-late economic development cycle minerals. The group’s strategy is focused on operating safe, low-cost, demand-led businesses. Through its integrated marketing strategies, the group can create and grow global markets for its products that produce value for Rio Tinto and its shareholders.
The product group’s strategy is focused on:
| – | Creating demand-led, integrated operations that can respond quickly to the changing external environment. |
| – | Generating and exploiting proprietary market insights. |
| – | Growing global markets through business-focused research and market development. |
| – | Strengthening its position in traditional segments and entering attractive new markets. |
| – | Improving operating performance by cutting costs, driving productivity and delayering the organisation. |
Safety
Diamonds & Minerals continues to focus on fostering a culture of accountability and awareness among employees and improving contractor safety in our pursuit of zero harm. The product group’s all injury frequency rate (AIFR) increased to 0.75 in 2013 from 0.57 in 2012. Regrettably, there was one fatality in November 2013 at Richards Bay Minerals in South Africa.
The product group faces some unique challenges in health and safety. The workforce spans multiple nationalities, ethnicities, languages and cultures in developing countries. In response, management is employing innovative strategies and visible safety leadership to train the workforce.
Diamonds & Minerals is focused on eliminating fatality risks by placing an emphasis on critical controls and robust process safety.
Greenhouse gas emissions
Overall greenhouse gas (GHG) emissions intensity increased slightly in 2013. This was largely due to lower production at Rio Tinto Iron & Titanium (RTIT); the reduction in capacity utilisation of its smelters led to an increase in GHG emissions per tonne of product – reflected in a four per cent increase in emissions intensity for RTIT compared to 2012. GHG emissions per tonne of product were marginally higher at Rio Tinto Minerals, but improved across Rio Tinto Diamonds operations. The product group continues to invest in the implementation of more efficient equipment and technology, such as the wind farm at Diavik.
Review of operations
The group’s underlying earnings of US$350 million include evaluation costs in respect of Simandou of US$43 million. Excluding Simandou expenditure, underlying earnings of US$393 million were four per cent lower than in 2012. Prices were lower for titanium dioxide feedstocks, zircon, metallics and borates,
while titanium dioxide sales volumes were also lower. This was offset by higher diamond prices, favourable exchange rate movements and lower evaluation study costs. The acquisition of BHP Billiton’s interests in Richards Bay Minerals in September 2012 also contributed an increase in earnings.
On a like-for-like basis, cash operating costs of production in 2013 were US$358 million lower than in 2012, reflecting the impact of targeted cost reduction initiatives and favourable exchange rate movements. A large number of initiatives were launched to remove significant structural costs from the business, including delayering the organisation, driving productivity initiatives and removing costs. In parallel, temporary plant closures in response to market conditions generated significant savings in variable costs during the year.
Rio Tinto Diamonds (RTD)
RTD is a leading producer of rough diamonds with a product portfolio that provides a presence in all major markets. Rio Tinto’s diamonds assets comprise the Argyle Diamond Mine in Australia (Rio Tinto: 100 per cent), the Diavik Diamond Mine in Canada (60 per cent), Murowa Diamonds in Zimbabwe (78 per cent) and the Bunder diamond project in India (100 per cent). RTD sells its share of production through its centralised marketing office in Belgium and has a niche cutting and polishing factory in Australia for its high-end pink diamonds from the Argyle mine, and sells them to an international customer base.
In June 2013, Rio Tinto announced its intention to retain its diamonds businesses after concluding a strategic review which considered a range of options, including potential divestment. The medium to long-term market fundamentals for diamonds remain robust, and the high quality diamonds business is well positioned to capitalise on the positive market outlook.
RTD produced 16.0 million carats in 2013, a 22 per cent increase from 2012 that reflected higher tonnes processed and higher grades at Argyle following the commissioning of the underground mine in April 2013. Revenue in 2013 was 15 per cent higher than in 2012, reflecting higher volumes and increased prices. RTD reported earnings of US$53 million in 2013, compared to a loss of US$25 million in 2012, reflecting higher revenues and cost savings.
The ramp-up of the Argyle underground mine to full operation is on schedule to be completed by 2015, extending the life of mine until at least 2020.
Production from Diavik’s underground mine commenced in early 2010 in parallel with open pit operations. Diavik has now completed the transition to a fully underground mine, with all three pipes now at full production.
Rio Tinto Iron & Titanium (RTIT)
RTIT is the largest producer of high-grade titanium dioxide feedstocks. It mines ilmenite at its wholly-owned Rio Tinto Fer et Titane (RTFT) operation in Canada; its managed operation Richards Bay Minerals (RBM) in South Africa (Rio Tinto: 74 per cent); and its QIT Madagascar Minerals (QMM) operation (80 per cent). RTIT produces high-grade titanium dioxide feedstocks at its world-class metallurgical complexes at RTFT and RBM as well as valuable co-products including high purity iron, steel, metal powders, zircon and rutile.
In 2013, titanium dioxide feedstock production increased by two per cent year-on-year to 1.6 million tonnes (Rio Tinto share). This includes an increase in attributable volumes at RBM resulting from Rio Tinto doubling its stake in September 2012. Due to challenging market conditions for high grade titanium dioxide feedstock, RTFT brought forward a planned shutdown of one of nine furnaces in Canada and deferred the rebuild until market conditions improve. The RTFT upgraded slag (UGS) production was also taken offline for part of the year, together with zircon and rutile production at RBM.
RTIT’s revenues increased by one per cent as the impact of the RBM transaction was largely offset by lower prices for titanium dioxide feedstocks, zircon and metallics and lower sales volumes of titanium dioxide feedstocks. Earnings fell by 35 per cent to US$264 million, despite the benefit of the RBM transaction, which increased Rio Tinto’s share of earnings with effect from September 2012.
| | | | |
| | 30 riotinto.com/reportingcentre2013 | | |
Rio Tinto Minerals (RTM)
RTM (Rio Tinto: 100 per cent) supplies over 30 per cent of the world’s refined borates from its world-class deposit in Boron, California. RTM also has borates refineries and shipping facilities in China, France, Malaysia, the Netherlands, Spain and the US.
Borates production of 495,000 tonnes boric oxide equivalent was seven per cent higher than in 2012, following cuts to production in 2012 in response to market conditions. Global demand for RTM refined borates improved slightly with revenue remaining flat on lower prices. Earnings of US$131 million were six per cent lower than 2012 due to the decrease in product prices.
Rio Tinto Minerals is delivering the modified direct dissolving of kernite (MDDK) project, which allows for more efficient orebody utilisation. The project is on track for completion in 2014.
Dampier Salt (DSL)
Dampier Salt Limited, the world’s largest solar salt exporter, produces industrial salt by solar evaporation of seawater at Dampier and Port Hedland, and from underground brine at Lake MacLeod, all in Western Australia. Salt is sold principally to the base chemical industry markets in Asia. Salt production of 6.7 million tonnes (Rio Tinto share) was two per cent lower than 2012. During 2013, gypsum mining operations and sales were resumed.
Development projects
In 2011, Diamonds & Minerals re-entered the potash business through an exploration joint venture with North Atlantic Potash Inc., a subsidiary of JSC Acron. Acron is a world leader in fertiliser production and holds multiple potash exploration permits in Saskatchewan, Canada. Drilling results indicate encouraging potash grade and thickness. Higher nutritional standards, population growth and limited arable land make potash a critical factor in maintaining global food security, and a natural complement to RTM’s existing borate fertiliser business.
Progress continued at the group’s Jadar lithium-borate deposit in Serbia. A pilot plant for processing Jadar material was commissioned at Boron and core samples processed at the plant yielded encouraging and positive results. If developed, the deposit has the potential to supply a significant proportion of global lithium demand. Lithium carbonate’s fastest-growing application is in batteries that provide clean power to industrial systems and electric and hybrid vehicles.
In January 2013, against a backdrop of weaker market conditions for its products and the need to manage and reduce its costs, RTIT reviewed the economic viability of the TiO4 project and cancelled prefeasibility studies for the project in Canada and Madagascar. The Zulti South mine expansion at RBM, the mineral sands exploration programme in Mozambique and other brownfield studies at the group’s operations continue.
The Bunder diamond project is progressing its prefeasibility study, which began in July 2010. These studies have confirmed the economic potential of the orebody and work is under way to define the best development option. Mine plan approval was received during the year and environmental approvals are under way.
The Simandou iron ore project in Guinea is one of the largest-known undeveloped high-grade iron ore resources in the world. The concession will enable the development of the largest mine and infrastructure project ever undertaken in Africa. This will include the progressive development of a 100 million tonne per annum mine, a 650-kilometre trans-Guinean railway and a new deep-water port.
The project is adopting a “stage gate” approach for investment to be made in line with Government of Guinea approvals and funding processes.
In February 2013, the Government of Guinea approved the Social and Environmental Impact Assessment (SEIA) conducted on the Simandou project. The SEIA is the result of a consultation programme involving more than 10,000 members of the local communities and ensures the project is developed in a way that maximises long-term benefits for the people of Guinea and minimises impact on the communities and the environment. Also during the year, the project sponsors – the Government of Guinea, Rio Tinto, Chinalco and the International Finance Corporation signed a letter of mutual intent setting out the key principles that will serve as the basis of the Investment Framework that the partners intend to finalise in the first half of 2014. The Investment Framework is instrumental in governing the Simandou project successfully, and in setting a stable and durable operating model and environment for all partners and investors.
In parallel, the partners are seeking funding for the project infrastructure. This may include outsourcing to a third-party consortium in a strategy to embed a broad partnership approach to developing the multi-user infrastructure, and to reduce the risk and capital commitments of the Simandou project sponsors.
Outlook
The group serves a range of different industries, but are linked through their track record of creating and defining new and profitable markets for their products. Demand softened in these markets in 2013 in response to broader economic trends, and the outlook for 2014 remains uncertain, although there is some sense that developed economies are on the path to a more robust recovery, which is a driver for industrial mineral demand. However, the medium to long-term outlook continues to be positive across all products as urbanisation and rising standards of living drive higher levels of demand.
RTM will continue to seek to capture profitable growth in emerging economies and maintain its position in its established markets. Ongoing supply chain improvements will facilitate speed and flexibility in shifting supply to promising sectors and regions. Demand for borates is expected to remain stable in the near term, and the long-term industry fundamentals remain attractive. RTM will focus on increasing refined borates capacity to meet higher-than-GDP demand growth while achieving world-class safety performance and improving its cost position.
Demand for titanium dioxide feedstock is expected to continue to grow in the medium to long term, in line with improving global economic conditions, urbanisation and demand growth in emerging markets supported by rising per capita incomes. In response to weak demand and excess inventory in the feedstock supply chain, and in order to reduce operating costs and inventory, RTIT has taken action at a number of its operations, including temporary closures of the UGS plant and deferral of a planned furnace rebuild at RTFT.
Pigment inventory has returned to historical levels and it is expected that feedstock inventories within the supply chain will return to historical levels over the course of 2014.
The medium to long-term fundamentals for the diamond industry are positive and expected to support sustainable future price growth. The global resource base is steadily declining, compounded by limited exploration investment and success, and expected reductions in supply over the medium to longer term. Demand in India and China is expected to continue to grow, and to represent nearly 50 per cent of global diamond consumption by 2020. Demand in mature markets is expected to continue to grow in line with GDP.
| | | | |
| | 31 riotinto.com/reportingcentre2013 | | |
Energy
Financial performance
| | | | | | | | |
| | | 2013
US$ million | | | 2012
US$ million | |
Revenue | | | 5,454 | | | | 6,062 | |
Operating cash flow | | | 999 | | | | 641 | |
Underlying earnings | | | 33 | | | | 309 | |
Capital expenditure | | | 732 | | | | 1,877 | |
Net operating assets | | | 4,872 | | | | 7,169 | |
Strategy and strategic priorities
The Energy product group aims to sustainably extract full value from its assets to serve growing global energy demand. It will achieve this by transforming the business to deliver sector-leading performance in all of its large, option-rich orebodies.
The group is focused on:
| – | Maximising productivity and significantly reducing cost. |
| – | Optimising the portfolio and deriving maximum value from mine to market. |
| – | Embedding innovative and value-adding technology. |
| – | Building trust and partnering to earn the right to operate. |
Safety
In 2013, the Energy product group’s all injury frequency rate was 0.67 compared to 0.66 in the previous year. In a challenging year of transformation there were no fatalities recorded at any operations.
In 2013, Kestrel Mine’s strong commitment to health and safety was recognised with the mine winning the Chief Executive Safety Award for most improved operation. The Kestrel team has consistently improved its safety performance over recent years through increasing employee engagement on safety, and embedding the leadership commitment to ensure everyone returns home safely after every work shift.
The Energy product group’s safety efforts are focused on:
| – | Understanding and eliminating critical safety risks. |
| – | Fostering a culture of shared and personal accountability for safety. |
| – | Reducing injuries as well as achieving zero fatalities. |
Greenhouse gas emissions
Over the past 15 years, Rio Tinto has spent more than US$100 million on research and development into technologies that will reduce emissions from coal-fired power plants. This investment has been targeted at ensuring coal retains a significant role in the global energy mix in an increasingly carbon-constrained environment. In 2013, the Energy product group continued its A$6 million sponsorship of The Otway Project, Australia’s first industrial-scale demonstration of geological carbon dioxide capture and storage.
The Energy product group’s greenhouse gas emissions decreased to approximately 3.5 million tonnes of carbon dioxide equivalent in 2013, compared with 4.0 million tonnes in 2012. This reduction was mainly due to the implementation of a new industry methodology applicable only at the Energy product group’s New South Wales sites, which more accurately estimates fugitive emissions of carbon dioxide and methane. These gases naturally occur in coal seams and are released during the mining process.
In 2013, Energy’s Australian coal and uranium operations completed energy-use assessments in accordance with requirements under the Energy Efficiency Opportunities Act. More than 40 opportunities were identified relating to fuel usage, coal handling and processing, and process control. The opportunities identified will now undergo detailed evaluation.
Review of operations
The profitability of the uranium and Australian coal industries continues to be significantly impacted by lower commodity prices and high input costs. However, the long-term fundamentals for the Energy product group remain strong. The group has large option-rich assets and a programme of more than 1,500 cost saving initiatives aimed at transforming the business to ensure it remains competitive throughout the cycle.
In 2013 the Energy product group delivered underlying earnings of US$33 million compared with 2012 earnings of US$309 million. The decline in earnings was primarily due to significantly lower prices and the absence of gains on divestment of exploration properties, which amounted to US$258 million in 2012. This was partly offset by a weaker Australian dollar, lower operating costs and record production across a number of sites. A transformation programme of aggressive cost and productivity improvements continued to deliver results during the year, boosting earnings by US$442 million (US$646 million pre-tax) compared with 2012. An impairment charge of US$470 million post-tax was also recognised relating to Rio Tinto Coal Mozambique.
Rio Tinto Coal Australia (Rio Tinto: 100 per cent)
In Queensland, Rio Tinto Coal Australia (RTCA) manages the Hail Creek (Rio Tinto: 82 per cent), Kestrel (80 per cent) and Clermont (50.1 per cent) coal mines.
In New South Wales, RTCA manages Coal & Allied’s coal mines which include the Hunter Valley Operations (80 per cent), Bengalla (32 per cent), Mount Thorley (64 per cent) and Warkworth (44.5 per cent).
RTCA is taking action across a wide front to improve the competitiveness of its operations during challenging conditions for the Australian coal industry. A transformation programme of business improvement initiatives has reduced operating costs significantly and increased productivity. Reduced expenditure on capital projects and improved management of working capital has further contributed to reducing costs.
Australian coal production increased by eight per cent (Rio Tinto share) in 2013 compared to 2012, with four mines (Hunter Valley Operations, Mount Thorley Warkworth, Bengalla and Clermont) achieving annual records. This substantial production increase was delivered through operational improvements, the completion of brownfield mine developments and the ramp-up of Clermont Mine. Net earnings of US$367 million represent a nine per cent decrease from 2012, due to significantly lower prices for all types of coal.
On 15 October 2013, the US$2 billion Kestrel Mine Extension in central Queensland was officially opened. The extension is expected to add 20 years to the life of the mine. Also in October, a binding agreement was signed to sell Clermont Mine for just over US$1 billion and a conditional sale and purchase agreement for Blair Athol Mine was reached.
RTCA is working to secure a long-term future for the Mount Thorley Warkworth mine, following the NSW Land and Environment Court’s decision to overturn government planning approvals. Rio Tinto has also appealed against the Court’s decision, with support from the NSW Government. In early 2014, a short-term planning approval was granted that will enable the mine to resume normal operations for around two years.
Energy Resources of Australia (Rio Tinto: 68.39 per cent)
Energy Resources of Australia (ERA) is a publicly-listed company. Following the completion of open pit mining at its Ranger mine in December 2012, ERA continued production in 2013 by processing stockpiled ore. The majority of high-grade stockpiled ore was processed during the first half of 2013. In the second half of 2013, the mill was primarily fed with lower-grade stockpiled material and as a result uranium oxide production was reduced.
On 7 December 2013, ERA voluntarily suspended ore processing operations following the failure of a leach tank in its processing plant. No one was injured in the incident which was fully contained by the mine’s containment system,
| | | | |
| | 32 riotinto.com/reportingcentre2013 | | |
and there was no impact to the surrounding environment or to Kakadu National Park. The incident is being fully investigated.
In September 2013, ERA’s A$220 million brine concentrator was officially opened. Managing water is central to ERA’s operations and the brine concentrator will help improve its ability to treat water and progressively rehabilitate the site.
Since 2011 ERA has achieved total cumulative cash savings of A$127 million of its A$150 million in targeted reductions. This has been delivered through a number of initiatives, including merging management roles, reducing the use of contractors, reducing support and services roles, improvement in procurement and maintenance practices, and rationalisation of corporate costs.
Rio Tinto Coal Mozambique (Rio Tinto: 100 per cent)
Rio Tinto Coal Mozambique (RTCM) manages the Zambeze Project (100 per cent), Tete East Project (100 per cent), and Benga Mine (65 per cent) in Mozambique, and the Zululand Anthracite Colliery (74 per cent) in South Africa.
The Energy product group is working to secure a new pathway for its coal business in Mozambique. Its Benga mine has established itself as a hard coking coal producer and has been working to improve performance by reducing operating costs and increasing productivity.
A post-tax impairment charge of US$470 million relating to RTCM was recognised. This impairment follows a review of RTCM’s development plan, discount rate and associated country risk premium and brings the total impairments relating to RTCM to US$3.3 billion.
In 2013, RTCM delivered an operating cost reduction of US$20 per tonne, a 129 per cent increase in total coal production to 1.6 million tonnes (100 per cent basis) compared with 2012, a hard coking coal yield increase of five per cent and a reduction in overall headcount in excess of 25 per cent.
Notwithstanding these improvements, challenges remain due to infrastructure constraints and difficult market conditions combined with instances of civil unrest and ongoing political tensions. While the families of expatriate workers were temporarily moved home in November, business operations were not impacted. Separate to this, from mid-December 2013 to mid-January 2014, RTCM suspended mining operations at the Benga mine to reduce stockpiled coal. Customer commitments continued to be met during the suspension.
Rössing Uranium (Rio Tinto: 68.58 per cent)
Rössing Uranium Mine is located near Arandis in Namibia’s Erongo region. Like the rest of the Energy product group, in 2013 Rössing focused on business improvement strategies to reduce unit costs and achieved its target of US$30 million in savings for 2013. Rössing’s overall strip ratios dropped from almost 4:1 in 2011 to 2:1 during 2013. Uranium production in 2013 was 5,312 thousand pounds (100 per cent basis) compared with 5,950 thousand pounds in 2012. Production was impacted by lower-than-planned throughput and a leach tank failure in December which halted production. Some processing operations were restarted on 11 January 2014 and operations will continue to be progressively restored during the first quarter.
Rio Tinto acquired its interest in Namibia-based Rössing Uranium Limited (Rössing) in 1970. The Iranian Foreign Investments Company (IFIC) acquired its original minority shareholding in Rössing in 1975. IFIC’s interest predates the establishment of the Islamic Republic of Iran and the U.S. economic sanctions targeting Iran’s nuclear, energy and ballistic missile programs. IFIC acquired and continues to own a minority shareholding in Rössing in accordance with Namibian law.
Rössing is neither a business partnership nor joint venture between Rio Tinto and IFIC. Rössing is a Namibian limited liability company with a large number of shareholders, including Rio Tinto with 68.7 per cent, IFIC with 15.3 per cent, the Industrial Development Corporation of South Africa with 10 per cent, local individual shareholders with a combined interest of 3 per cent and the Government of the Republic of Namibia with 3 per cent but with an additional 51 per cent vote at a general meeting of Rössing on matters of national interest.
As a shareholder in Rössing, Rio Tinto has no power or authority to divest IFIC’s holding in Rössing. However, Rössing and the Namibian Government have taken several recent steps to limit IFIC’s future involvement in Rössing.
On 1 October 2010, Namibia reported to the United Nations, pursuant to Article 31 of the United Nations Security Council Resolution 1929 (UN SCR 1929), that it had reached an agreement with the Islamic Republic of Iran that IFIC will not participate in any future investments nor will it acquire any further shares in Rössing. It was also agreed that the Government of Iran will not acquire interests in any commercial activity in Namibia involving uranium mining, production, or use of nuclear materials and technology, as required under UN SCR1929, until such time as the United Nations Security Council determines that the objectives of the Resolution have been met.
The Rössing board also took steps in 2012 to terminate IFIC’s involvement in the governance of Rössing. As a shareholder in Rössing, IFIC was entitled under Namibian law to attend general meetings of Rössing. IFIC was previously represented on the board of Rössing by two directors. While this level of board representation did not provide IFIC with the ability to influence the conduct of Rössing’s business on its own, the Rössing board nonetheless determined that, in light of international economic sanctions, it would be in the best interest of Rössing to terminate IFIC’s involvement in board activity. Therefore, on 4 June 2012, at the annual general meeting of Rössing, the shareholders of the company, including Rio Tinto, voted not to re-elect the two IFIC board members. This ended IFIC’s participation in Rössing board activities. IFIC accordingly is not represented on the Rössing board, nor does it have the right to attend board meetings or receive any board information
Dividends:
While IFIC is entitled to its pro rata share of any dividend that the majority of the board may declare for all shareholders in Rössing, IFIC has not received such monies since early 2008. Simply by
maintaining its own shareholding in Rössing, Rio Tinto is not engaging in any activity intended or designed to confer any direct or indirect financial support for IFIC. Further, the Rössing board determined no dividends will be paid for the year 2013.
Uranium off-take and technology:
Rössing is the world’s third largest uranium mine. It sells approximately 40 percent of its uranium to U.S. power companies and most of the remainder to Canada and other key U.S. trading partners in Europe and Asia. As a minority shareholder, IFIC has no uranium product off-take rights. Neither IFIC nor other Government of Iran entities have any supply contracts in place with Rössing and receive no uranium from Rössing. IFIC also does not have access to any technology through its investment in Rössing or rights to such technology.
While Rio Tinto does not view itself as actively transacting or entering into business dealings with an instrumentality of the Government of Iran, this information has been provided to ensure transparency regarding the passive, minority shareholding in Rössing currently held by the IFIC. Rio Tinto has disclosed the IFIC shareholding matter to the United States Government and has periodically updated the U.S. Department of State as to the same.
Rio Tinto Canada Uranium (Rio Tinto: 100 per cent)
Rio Tinto Canada Uranium’s Roughrider project is an exploration site located in North-Eastern Saskatchewan’s Athabasca Basin, which supplies approximately 20 per cent of the world’s uranium. An exploration programme is under way that is focused on obtaining orebody knowledge and a better appreciation of geotechnical, hydrological and hydrogeological conditions. Roughrider is near competitor deposits and existing uranium mills in the same geological terrain as all of Canada’s currently-producing uranium mines.
In 2013, the Canadian Government agreed to enter into an Agreement in Principle with the European Union on the Comprehensive Economic Trade Agreement. The Agreement provides an exemption to eligible companies from the Non-Resident Ownership Policy as it applies to foreign ownership of uranium mines. Once enacted, this change means Rio Tinto could, if economical to do so, develop a uranium operation without the requirement of first finding a Canadian majority partner.
Development projects
The Energy product group continues to review the optimal growth profile for all business units in light of market conditions for coal and uranium, the high-cost operating environment in Queensland and New South Wales, and infrastructure constraints in Mozambique. The Energy product group’s resource base in Australia’s Hunter Valley is unique due to its premium quality coal, and proximity to existing infrastructure. The resources based in this region are large, adjacent and option-rich orebodies that have the potential to support substantial open cut or underground mines for many decades to come and are difficult to replicate. With Energy’s ability to operate its New South Wales operations as a network, and a range of development options not yet realised, there is further potential for these assets to deliver material, long-term value to shareholders.
Work continues to determine the optimum pathway for the potential development of the Mount Pleasant project, a greenfield coal site in the Hunter Valley. In Queensland, the Energy product group is progressing a pre-feasibility study and government approvals to provide options for ongoing open-cut operations as well as underground development at Hail Creek Mine.
Evaluation and exploration of the Ranger 3 Deeps uranium deposit in ERA, which is estimated to contain over 33,000 tonnes of uranium oxide, progressed in 2013. Construction of an exploration decline, to conduct underground close-spaced drilling to further define and evaluate the deposit, began in May 2012 and underground drilling commenced a year later. In addition, ERA began a pre-feasibility study on the proposed Ranger 3 Deeps underground mine in July 2012. The study is on schedule and a decision on the viability and design of an operational mine is expected by 2015. ERA has also formally commenced the statutory approval process for the proposed underground mine with the Northern Territory and Commonwealth Governments.
Outlook
In the short term, the coal and uranium mining industries are expected to continue to suffer from increased costs, and weak commodity prices. The medium and long-term outlook, though, is positive. Energy demand continues to rise steadily driven by economic growth in emerging markets and further urbanisation and industrialisation in China and India. Much of this new demand is expected to be met by coal as it is the most secure, affordable, and readily-available source of energy, particularly in the Asia Pacific region.
After two decades of remarkable development and transformation, China is only now reaching world average levels of electricity and energy consumption. Previously a major net exporter of coal, China is now the world’s largest net importer of both thermal and coking coal. It is estimated that China will have imported over 300 million tonnes of coal in 2013. China will also need to import uranium to meet the requirements of its fourth-generation nuclear power programme. India, with low per capita electricity consumption and 300 million people still without access to electricity, requires substantial investment in energy infrastructure to sustain the country’s growth and development.
Asia remains the dominant market for Australian seaborne coal. Japan, South Korea and Taiwan remain important customers for Rio Tinto and growth from other South East Asian countries is expected. Coking coal is experiencing downward pricing pressure in the current market. However, fundamentals for this product remain strong over the long term, due to continued steel demand growth in China, India and other emerging Asian economies, as well as underlying global resource scarcity of premium coking coal. Rio Tinto’s Australian coal, due to its quality, supply reliability and location, is well positioned to supply the growth in demand in these Asian countries. Uranium production will need to grow in the long term to meet China’s large future requirements, but in the medium term the market remains under considerable price pressure.
| | | | |
| | 33 riotinto.com/reportingcentre2013 | | |
Iron Ore
Financial performance
| | | | | | | | |
| | | 2013
US$ million | | | 2012
US$ million | |
Revenue | | | 25,994 | | | | 24,279 | |
Operating cash flow | | | 17,880 | | | | 15,830 | |
Underlying earnings | | | 9,858 | | | | 9,247 | |
Capital expenditure | | | 6,814 | | | | 7,152 | |
Net operating assets | | | 21,062 | | | | 21,057 | |
Strategy and strategic priorities
The Iron Ore product group’s strategy is based around three strategic pillars:
| – | Producing at the right cost, through the utilisation of unrivalled technology and high-performing teams. |
| – | Focusing on value-driven growth through disciplined phasing and low-cost growth options. |
| – | Maximising portfolio value by leveraging growth options, product strategy, and sales and supply chain capabilities. |
Safety
Iron Ore’s safety performance improved in 2013, attaining an all injury frequency rate of 0.70, compared to 0.74 in 2012. The group achieved this improved level of performance despite facing the safety challenges of commissioning the 290 million tonne per annum (Mt/a) expansion in the Pilbara, and preparation for, and recovery from, four tropical cyclones. All of these challenges were accomplished without a fatality or serious injury.
The group did experience an increase in significant potential incidents in 2013, particularly those involving light vehicles. There was also a trend of more severe injuries leading to an increase in lost time at work. This led to the introduction of programmes to address the root causes of such incidents, covering management systems, procedures and training.
Throughout 2013, Iron Ore continued to embed a number of safety improvement programmes and initiatives with a particular emphasis on critical risk management, safety leadership, training and hazard awareness, and on simplifying the way safety is managed and achieved within the organisation.
Initiatives designed to recognise and reward a positive safety culture were also a feature of the group’s safety commitment for 2013, with more than 1,500 employee-led safety improvements recognised and shared through the Make a Difference programme. New safety interaction training and a pre-start safety pilot project were also introduced. The Lifesaving Commitments hazard awareness programme, which began in 2012, continued roll-out in 2013.
Iron Ore maintained a major focus on health issues, particularly emerging issues impacting on the mental health of employees. A number of programmes providing support for mental health and depression, rail safety education, and fly-in fly-out (FIFO) support networks for workers and their families were implemented and developed further throughout the year.
Greenhouse gas emissions
Iron Ore implemented a number of measures during the year to ensure full compliance with its environmental performance obligations. In accordance with the Australian Energy Efficiency Opportunities Act 2006, the group conducted energy assessments across 15 operations in the Pilbara region of Western Australia.
More than 80 efficiency opportunities were identified, which have the potential to reduce energy consumption of the entire Pilbara operations by ten per cent. This includes energy-intensive areas such as rail and utilities and at larger mining operations in the east Pilbara.
The decommissioning of the existing Cape Lambert power station – to make way for a new combined-cycle power station – led to improvement in the efficiency of Rio Tinto’s power generation network. Energy efficiency continued
to be a focus for future mine expansions, with energy reviews being conducted at the project design stage. Modifications to mine planning and fixed plant will deliver significant savings when these projects move into the operational phase. For instance, the electric motor replacement programme that began in 2012 is now replacing failed motors with more energy-efficient alternatives.
Iron Ore Company of Canada (IOC) operations delivered and contributed significantly to the group’s reduction in greenhouse gas emissions (GHG) intensity in 2013, primarily due to an increase in the proportion of saleable product produced as concentrate versus pellets. Concentrate is the less GHG-intensive form of IOC’s product.
Iron Ore met all Australian Federal Government requirements for the National Greenhouse and Energy Reporting Scheme, Clean Energy Act and Energy Efficiency Opportunities Act in 2013. Since 2008, the group’s total greenhouse gas emissions intensity has improved by 7.4 per cent.
Review of operations
Rio Tinto is the second largest supplier to the world’s seaborne iron ore trade. Operations in the Pilbara region of Western Australia comprise 15 mines, four ports, the largest privately-owned heavy freight railway in Australia, and supporting infrastructure including the Operations Centre in Perth. IOC operates a mine, concentrator and pelletising plant in the province of Newfoundland and Labrador, together with port facilities in Sept-Îles, Quebec. Rio Tinto Marine delivers shipping services to the Group, including Iron Ore.
In 2013 the Iron Ore business achieved underlying earnings of US$9,858 million, seven per cent higher than 2012, attributable to record sales volumes in the Pilbara, a weaker Australian dollar, marginally higher prices, and cost savings initiatives which enhanced earnings by US$240 million (US$351 million pre-tax). This was partly offset by a royalty claim and higher taxes following the introduction of Mineral Resources Rent Tax in July 2012. The five per cent decline in capital expenditure reflects the early completion of the port and rail element of the 290Mt/a Pilbara expansion in August 2013.
The Iron Ore group’s production levels exceeded previous records in 2013, despite volatile weather and a fast-tracked expansion schedule, to produce 266 million tonnes of iron ore globally. Rio Tinto’s share of production was 209 million tonnes, an increase of five per cent on 2012.
Iron ore prices were marginally higher in 2013, predominantly due to strong demand in China. According to China’s National Bureau of Statistics, the country’s apparent consumption of finished steel rose by 7.2 per cent in 2013 to 692 million tonnes. This reflected strong construction activity supported by favourable credit conditions in the first half of the year. Iron Ore’s total global shipments in 2013 were 259 million tonnes.
Quarter-on-quarter production records were achieved, despite interruptions caused by conveyor belt breakage, cyclone activity and significant flooding in the Pilbara following unseasonal weather in the second quarter of 2013. Heavy tropical cyclone activity closed the ports in January and December 2013, the latter impacting the first weeks of January 2014 and causing the closure of all coastal operations and all inland mine sites. Throughout these events, the Operations Centre in Perth was fundamental to ensuring optimal supply chain performance, including minimising any impacts to production.
The challenge of operating in remote locations remained in 2013 and Iron Ore will continue to manage this closely in 2014. During the year, the group ran improvement initiatives that focused heavily on reducing costs and driving productivity gains. This included reducing the use of contractors, reviewing the supplier base, challenging the tactics used for equipment maintenance, and optimising support functions.
The integration of next-generation technology via the Mine of the Future™ programme improved efficiencies further in 2013, across production, health, safety and environmental performance. For example, the autonomous haulage system (AHS) has delivered significant improvements in truck cycle times and real-time data generation, has extended tyre life, and reduced fuel usage and maintenance costs. This has been reported through the fleet of
| | | | |
| | 34 riotinto.com/reportingcentre2013 | | |
30 operational AHS trucks driving 2.4 million kilometres and moving more than 130 million tonnes of material at three mine sites – West Angelas, Yandicoogina and Nammuldi.
Hope Downs 4, Iron Ore’s newest mine site, successfully and safely delivered its one millionth tonne of ore in the third quarter – an important milestone leading to the ramp-up of mining operations in 2014.
Iron Ore’s automated train programme, AutoHaul™, made progress during the year with the upgrade of numerous level crossings, hardware and software development of the system. The Iron Ore group purchased 1,100 ore cars and commissioned ten new fully-fitted locomotives in 2013. Ore cars and existing locomotives were also fitted with Electronically Controlled Pneumatic (ECP) brakes, which has resulted in a decrease in train cycle times.
Iron Ore progressed key participation agreements with Traditional Owners in the Pilbara, allowing the group to secure land access for the life of mining operations. New agreements with the Yinhawangka and Yindjibarndi people were finalised during the year. Aligned with previous agreements, these recognise a strong commitment to regional standards, and incorporate mutual obligations to deliver outcomes relating to employment, financial compensation, education and training, heritage surveys and practices, environmental care and land use.
In 2013, the group continued to be one of the largest private employers of Indigenous people in Western Australia employing over 1,700 employees and contractors. Over A$1.8 billion in contracts for Pilbara expansion were awarded to Aboriginal businesses both individually and through joint ventures between January 2010 and end of 2013. Rio Tinto Iron Ore continues to be an industry leader in regional FIFO programmes across Australia, with eight regional FIFO centres in Western Australia alone. A three-year memorandum of understanding was signed with the Shire of Broome in 2013 and a new regional office was opened in Busselton. Community initiatives stemming from the programme focused on education, skills development and support for regional families, including workshops and online support resources.
The Wickham town expansion continued to support the growing Cape Lambert rail and port operations workforce. Developments in 2013 included the opening of Cajuput Village, a 155 room FIFO accommodation and community facility, and the completion of phase one of the Wickham South sub-division, comprising of 212 new residential homes. The Wickham project also delivered upgrades to town services and local park redevelopments to accompany the recreational precinct finalised in 2012.
In 2013, Rio Tinto Marine shipped 191 million tonnes of dry bulk cargo, an increase of 7.7 per cent on 2012. The final vessel in the current new build programme was delivered during December and completed the suite of eight new vessels for the year. Average freight rates rose year-on-year in 2013 and forward markets suggest stronger freight market conditions in the future, given slower growth in the industry’s fleet and increased cargo tonnages of bulk commodities entering the market from mine expansions.
IOC (Rio Tinto share 58.7 per cent) made good progress in 2013. The company capitalised on the benefits derived from commissioning the first stage of the Concentrate Expansion Project (CEP1), and produced 8.6 million tonnes of pellets and 6.8 million tonnes of concentrate for sale, which is an annual production record for concentrate. Despite severe weather disruptions, the final commissioning of CEP1 during the first half of the year provided the capacity to deliver a step change in production performance, efficiency gains and overall operational improvement.
Development projects
The Iron Ore group reached a major milestone in the second half of 2013, with the commissioning of the 290Mt/a port and rail capacity expansion. With this achievement, Iron Ore has delivered the first phase of the major expansion of its integrated iron ore operations in the Pilbara.
The successful commissioning of this expansion at a capital intensity of less than US$140 per tonne (100 per cent) added an extra annual capacity of
70 million tonnes to the 220Mt/a Pilbara nameplate capacity. The port and rail project was constructed four months ahead of the original schedule, and delivered US$400 million below the approved budget. In addition to the new port, all major coastal and rail infrastructure for the 290Mt/a capacity is now constructed and includes:
| – | installation of a new 55Mt/a ship loader at Cape Lambert; |
| – | commissioning of the new car dumper 5 at Cape Lambert and associated stockyards; and |
| – | construction of new fuel distribution facilities at Cape Lambert (tug fuel facility), the 10KP rail yard and the West Angelas fuel hub. |
Development of mining operations at Hope Downs 4, Marandoo and Western Turner Syncline (stage 1), which includes an overland conveyor to the Tom Price processing plant, are currently in the commissioning and ramp-up phase. Construction of the Nammuldi Below Water Table Project continues on schedule for commissioning later this year, and the West Angelas Power Station is currently in commissioning.
While completing the 290Mt/a port and rail expansion, the group made significant progress with the infrastructure to support further expansion towards 360Mt/a capacity. All marine piling activity for 360Mt/a was completed at the start of the third quarter. Two major structural, mechanical and piping packages, valued at approximately US$390 million, were awarded for the same project during August.
In December 2013, the US$310 million Bungaroo water facility and associated 87 kilometre pipeline was commissioned, providing water for Pilbara coastal operations and domestic requirements in the towns of Dampier and Wickham.
In November, the business unveiled a breakthrough pathway to match the upgraded port and rail capacity, which will see mine production capacity increase towards 360Mt/a through a series of low-cost brownfield expansions at a targeted all-in capital intensity of US$120-130 per tonne. Combined with low-cost productivity gains, the expansion is now forecast to be delivered at US$3 billion below previous expectations.
In conjunction with the announcement, US$400 million of capital expenditure was approved for plant equipment and modification, and additional heavy machinery for use at various mine sites in the Pilbara. This will enable a targeted production of more than 330Mt/a in 2015 and support the expected delivery of over 350Mt/a in 2017. Iron Ore’s Pilbara expansion programme remains the largest integrated mining project in Australian history and has a proven record of delivering project stages on time and budget.
The ramp-up of CEP stage two at IOC in the second half of the year delivered an additional 700,000 tonnes of spiral capacity, allowing the operation to increase volumes of Concentrate For Sinter (CFS) processed by gravity separation. The project remains on track to commission an additional ball mill and mining equipment, and to make upgrades to power distribution infrastructure during the second quarter of 2014.
Outlook
In line with the overall global economic outlook, the long-term fundamentals for iron ore remain sound, with demand growth tightly linked to rapid urbanisation and rising incomes in China and the developing world. However, iron ore prices are expected to moderate over the coming years as growth in low-cost seaborne supply outpaces growth in demand. Seaborne suppliers are estimated to have added more than 100Mt/a of iron ore supply capacity in 2013, and exports are expected to continue gaining momentum in the short to medium term. The majority of seaborne supply growth is expected to go into China, and supply-side exits from Chinese domestic suppliers and some high-cost seaborne suppliers are likely. With its low-cost position and proximity to China, Rio Tinto is well placed to take advantage of demand growth for seaborne iron ore through its expansions.
| | | | |
| | 35 riotinto.com/reportingcentre2013 | | |
Exploration
Rio Tinto has had a sustained commitment to exploration since 1946 and an exceptional track record in mineral discovery success. Mature operations, such as Weipa, the Pilbara and Rössing, were Tier 1 greenfield discoveries by Rio Tinto where value is still being realised after more than 40 years of production. In March 2013, restructuring resulted in the Exploration group reporting to the chief financial officer.
Strategy
The goal of Exploration is to create value for Rio Tinto through discovery or acquisition of Tier 1 resources that are well located and high grade, to supplement the Group’s existing high-quality resource base. The Exploration group performs both greenfield and brownfield exploration programmes and undertakes focused research and development to aid the exploration effort. Greenfield exploration aims to establish completely new operating business units, involving, among other objectives, geographic or commodity diversification. Brownfield exploration is directed at sustaining or growing existing Group businesses in the orbit of existing operations and provides significant value to the product groups.
Additionally, Exploration supports the product groups with orebody knowledge expertise, and supports the business development groups in evaluating merger and acquisition opportunities. It also supports the Economics team with supply forecasts. To pass community, sustainability and investment hurdles, the exploration process can take ten to 20 years to progress from target generation to development decisions. Enhancing and reaffirming the core exploration strategy, linked to the application of a rigorous global prioritisation process, has accelerated in Tier 1 discoveries since 2000. Tier 1 discoveries over the past decade are:
| | | | | | |
| Year | | Discovery | | Commodity | | Location |
| 2004 | | Simandou | | Iron ore | | Guinea |
| 2005 | | La Granja | | Copper | | Peru |
| 2005 | | Caliwingina | | Iron ore | | Australia |
| 2008 | | Sulawesi | | Nickel | | Indonesia |
| 2008 | | Mutamba | | Titanium | | Mozambique |
| 2009 | | Jadar | | Lithium/borates | | Serbia |
| 2011 | | Amargosa | | Bauxite | | Brazil |
2013 | | KP405 | | Potash | | Canada |
At the end of 2013, the Exploration group was active in 20 countries, and assessing opportunities in others, for a range of commodities including iron ore, copper, bauxite, coking coal, nickel, potash, uranium, diamonds and mineral sands. Exploration activities in China were conducted through CRTX, the joint venture between Chinalco (51 per cent) and Rio Tinto (49 per cent). Diamond exploration was transitioned from the Diamonds & Minerals group back to Exploration during 2013, and features an active project in India.
The Exploration group is organised into regional multi-commodity teams, headquartered in Singapore, London, Salt Lake City, Brisbane and Beijing, and supported by a team of technical and commodity professionals. This structure provides a global reach and a local presence that allows for effective community engagement and development of the Group’s social licence to operate.
Safety
The Exploration group’s all injury frequency rate improved significantly from 1.41 at the end of 2012 to 0.49 at the end of 2013. The improvement, across all regions, coincided with the Exploration group implementing the Improving Project Performance initiative. This also produced results in operational performance.
Performance
The Order of Magnitude study was completed on the Saskatchewan potash project in Canada (a joint venture with North Atlantic Potash Inc., a subsidiary of JS Acron) in early 2013, and the project handed over to Rio Tinto Minerals.
A drilling programme at the Tamarack project in Minnesota, US has continued to further extend the nickel-copper-precious metal deposit. Additional drilling is planned in 2014 to follow up extensions to the known mineralisation. Drilling at the Roughrider uranium project in Saskatchewan has increased the understanding of the mineralisation and indicated further extensions to the known mineralisation. Regional exploration across Rio Tinto’s Saskatchewan tenure has generated numerous targets for follow-up drilling in 2014. In Laos, orebody knowledge at the Sanxai bauxite project advanced through auger drilling across the prospective areas. The Amargosa bauxite project in Brazil has also progressed through an Order of Magnitude study with drilling and mapping advancing a number of brownfield areas in the Amargosa orbit.
Brownfield projects generated good drilling results at the Yandi Braid and Munjina iron ore projects in the Pilbara and coking coal projects at Winchester South, Mt Robert, Hillalong and Valeria in the Bowen Basin, Australia. Drilling out of the Z20 uranium deposit on the Rössing mine lease in Namibia was completed and the project handed over to the Energy product group.
Effective data and information management lies at the heart of the Exploration group. Significant efficiency improvements have been achieved by organising data in structured, managed systems accessible via intuitive user interfaces. Progress continued on the development of the VK1 airborne gravity gradiometer, with further test flying undertaken in 2013. In addition to Exploration’s projects, the Group’s major evaluation projects in 2013 were:
| | | | |
| Project | | Commodity | | Country |
| La Granja | | Copper | | Peru |
| Resolution | | Copper | | US |
| Pilbara | | Iron ore | | Australia |
| Bowen Basin | | Coking coal | | Australia |
Simandou | | Iron ore | | Guinea |
In 2013, the Group reduced its exploration and evaluation expenditure to US$948 million, exceeding the reduction target of US$750 million by more than a third. This represented a 52 per cent decrease compared to 2012 expenditure of US$1,971 million. In addition to gross expenditure, the Group wrote down US$159 million of exploration assets. Of the 2013 spend, US$178 million relates to global Exploration group activity. In total, Rio Tinto’s exploration and evaluation activity covered ten commodities in 2013, across a range of greenfield and brownfield environments.
Outlook
The Exploration group will continue to work on a prioritised portfolio of greenfield and brownfield projects in 2014. Maintaining a robust exploration pipeline by identifying and securing access to the best quality opportunities will be a key enabler of long-term success. Continuing challenges are expected to include the decreasing grade and quality for most commodities and exploring in more difficult jurisdictions and at depth. The Exploration group will focus on project generation in a number of key environments, as well as testing of targets within the portfolio. For 2014, the projects at a more advanced stage include:
| | | | | | | | |
| Project | | Commodity | | Country | | Type | | Stage |
| Tamarack | | Nickel | | US | | GF | | Project of Merit |
| Roughrider | | Uranium | | Canada | | GF | | Order of Magnitude |
| Sanxai | | Bauxite | | Laos | | GF | | Project of Merit |
| Amargosa orbit | | Bauxite | | Brazil | | GF | | Order of Magnitude |
| Bowen Basin | | Coking coal | | Australia | | BF | | Project of Merit |
Pilbara | | Iron ore | | Australia | | BF | | Project of Merit |
GF: Greenfield project
BF: Brownfield project
| | | | |
| | 36 riotinto.com/reportingcentre2013 | | |
Technology & Innovation
Rio Tinto’s Technology & Innovation group (T&I) collectively seeks to maximise total shareholder returns by partnering with, supporting, and constructively challenging product groups and functions in productivity improvement, technical assurance, project delivery, and innovation. T&I focuses on creating sustainable value and competitive advantage by making improvements to the way Rio Tinto operates. T&I also provides technical insights and support to review and mitigate critical risk factors across Rio Tinto.
T&I’s gross costs in 2013 were US$370 million, compared with US$415 million in 2012 and US$343 million in 2011. 2013 costs decreased compared with 2012 due to reductions in headcount, innovation spend and travel.
The total number of employees in T&I decreased from 1,031 at year-end 2012 to 730 at year-end 2013.
Strategy and strategic priorities
T&I is focused on four strategic pillars of work to support the broader Rio Tinto Group: Productivity Improvement, Innovation, Technical Assurance and Project Development and Implementation. Each of these four pillars is underpinned by a centralised team of industry experts and professionals, leveraging their collective technical capability across Rio Tinto’s businesses to deliver enhanced value for shareholders.
Safety
T&I is committed to the safe operation of its facilities and to the safe deployment of its personnel. The all injury frequency rate for T&I in 2013 was 0.63 compared to 1.57 in 2012. The improvement of this measure was primarily attributed to a tighter focus on existing safety efforts, particularly across Rio Tinto’s capital projects.
Performance
Innovation
Innovation is the research and development group within T&I. Its focus is on developing step-change technologies, including the Mine of the FutureTM programme, which addresses the significant challenges facing the mining industry. In 2013, Innovation continued to support the Iron Ore product group in its drive to capture safety and productivity benefits, by way of ongoing deployment of what will be amongst the world’s largest fleet of autonomous haulage vehicles, in its Pilbara mining operations. The Rio Tinto Mine Automation System and advanced visualisation technology were deployed to selected Group operations with further deployments scheduled.
Encouraging progress continues in the area of advanced mineral recovery. Innovation’s copper recovery technology, Peak Air Recovery, progressed through initial trials and is now undergoing final trials prior to commercial deployment. Building upon experience gained from the Iron Ore Operations Centre in Perth, Australia, a new range of systems for remote production process monitoring and optimisation have been commissioned. This next generation “Excellence Centre” (EC) technology platform allows for near real-time monitoring and optimisation of remote operating facilities. It utilises advanced data management, integrated with human systems. The EC provides Rio Tinto with the capability for continuous global coverage of managed business unit production facilities. The first processing EC was successfully operated throughout 2013, delivering technical support and measurable value to operating business units. Connections to remote copper concentrators and, most recently, coal washing facilities have been successfully established. The EC platform will be further deployed across the Group and will encompass the next generation of advanced remote technical support to operations.
Innovation uses a network of partnerships with organisations and institutions around the world, which provides a vast and interconnected group of world-class experts to generate solutions. The University of Nottingham, UK was added to this network in 2013, with the Rio Tinto Centre for Emergent Technologies inaugurated on 3 December. Also in 2013, Rio Tinto and Chinalco agreed to explore a partnership to bring forward the next era of mining technology aimed at delivering significant value and re-shaping industry best practice.
Productivity Improvement
With the organisational focus on improving productivity across Rio Tinto, the Mineral Technology Services and the Mining and Asset Management Centre were combined to form Productivity Improvement. The focus of this team is to help the business identify and implement significant productivity improvements by aligning performance with clear productivity metrics; improving productivity diagnostics; establishing internal and external benchmarking; and by constructively challenging and testing proposed plans for productivity improvements. This team also provides technical insights into risk mitigation, with expertise in the areas of geology, geotechnics, mining, mineral processing, dams and tailings, process control and hydrogeology.
T&I also includes a Strategic Production Planning (SPP) team that works with business units to develop comprehensive plans and valuations of strategic development options. Results from SPP provide a logical resource development framework for detailed studies and investment decision-making.
Project Development & Implementation
During 2013, Project Development & Implementation (PDI) reshaped its operating structure to align with the completion of existing capital projects, the general streamlining of organisational hierarchies, and the reduction in capital spending across Rio Tinto over the next few years. Under the revised structure, Rio Tinto is committed to an independent project management office (PMO) and two regionally-based Project Delivery Hubs, one for Australasia and the other for the Americas & Africa.
In line with Rio Tinto’s commitment to pursue greater value for shareholders, PDI is now delivering capital projects within a recently-developed Capital Projects framework. The framework provides Rio Tinto with a disciplined approach to managing its projects, and provides processes and tools, governance, reporting, and assurance to those who are responsible for capital.
Throughout this past year of change, PDI remained focused on the safe transition and handover of US$7 billion of capital projects, including: Kestrel Mine Extension, Argyle Underground Project, Energy Resources of Australia’s brine concentrator, Port Waratah Kooragang, Kemano Power Stage 1, and the AP60 aluminium smelter.
Technical Assurance
Technical Assurance is a team of internal professionals responsible for rigorously reviewing all major project proposals. Their role is to ensure that Rio Tinto’s Investment Committee and board are provided with independent technical assessments to support their decision-making. Throughout 2013, Technical Assurance focused its attention on strengthening the Group’s due diligence and Investment Committee processes. Technical Assurance also provides support to the business for a range of other technical compliance and governance activities such as post-investment reviews, due diligence, management of the Group’s reserves and mineralised material, and general technical reviews.
Outlook
T&I will continue to add value to the Group by working with the business units on productivity improvements. In addition, T&I will look for alternative approaches for funding of Innovation projects to react to changes in the Group’s cash position and capital spend constraints. Despite these changes and challenges, T&I will continue to maintain a culture that places a high priority on safety and safety improvement. In 2014, T&I will focus on four main areas: partnering with product groups and functions on productivity improvement; the safe and efficient development and implementation of capital projects; the pursuit of the Mine of the Future™ programme as well as the development of innovative alliances and relationships; and technical assurance. All of these will create competitive advantage for the Group. This will position T&I to support the business where commercial and technical expertise and external networks will have the largest benefit to Rio Tinto and its shareholders.
| | | | |
| | 37 riotinto.com/reportingcentre2013 | | |
Financial review
Group Finance
Overview of the Group Finance functions
The chief financial officer leads a multidisciplinary team tasked with delivering and implementing Group financial strategy, in addition to providing decision-making support and guidance to the Group’s key management and its operating business units. Separate specialist functions are established with responsibility for: financial reporting, management reporting, economic analysis, investor relations, taxation, treasury, assurance, business development, and project evaluation. Specialists in tax, financial reporting and treasury monitor regulatory compliance and financial developments, frequently engaging with industry-wide discussion groups and regulatory bodies. These specialists work across the disciplines to evaluate the impact of changes in regulatory, fiscal, economic, and other business conditions on planning and forecasting, financial reporting, key decision-making within the organisation, and on external stakeholders. The Exploration group also reports to the chief financial officer.
The Group’s operating model also includes the use of shared services for supporting the business in process delivery. Shared services are focused on efficient and effective delivery of transactional, professional or specialised services to our entire business. Shared services work relates to business processes which are not unique to Rio Tinto, allowing value improvements through outsourcing. These support services report to the Group executive, Organisational Resources and have responsibility for transactional aspects of financial management and reporting, human resources, information systems and technology, procurement and group property.
Role of the Group Finance function in 2013
With market conditions remaining volatile, the Finance function has played a key role in helping the business to reduce costs, improve capital allocation, and strengthen the balance sheet. During 2013, the Group raised a total of US$3 billion of fixed and floating rate bonds.
The Finance function was closely involved with supporting the implementation and monitoring of cost reduction initiatives. The Group achieved a US$2.3 billion improvement in operating cash costs for 2013, exceeding the target of US$2 billion. This, in conjunction with a US$1,023 million reduction in exploration and evaluation costs (exceeding the reduction target of US$750 million), demonstrates that the Group has made strong progress to sustainably reduce its operating cost base and realise productivity gains across its portfolio. These initiatives were supported by the expanded use of the shared services operating model to streamline process delivery.
Furthermore, the function has been instrumental in enhancing the Group’s capital allocation process. It has provided strategic support and guidance to senior management, with evaluation and analysis that allows decision makers to prioritise only the highest-returning projects. Capital expenditure is expected to almost halve from a peak of US$17.6 billion in 2012 to around US$8.0 billion in 2015, in the pursuit of maximising returns to shareholders whilst strengthening the balance sheet.
In further support of the Group’s 2013 priorities, the Finance team worked on reshaping the portfolio by selling non-core assets. Divestments totalling US$3.5 billion were announced or completed in 2013, with proceeds of US$2.5 billion received during the year.
In addition, in 2013 the Group published its third comprehensive Taxes Paid report, which covered the year ended 31 December 2012. The report provided detailed analysis of Rio Tinto’s US$11.6 billion contribution in global tax payments.
During 2014, Rio Tinto’s Finance function will continue its focus on supporting senior management and product groups to achieve the target of US$3 billion in operating cash cost improvements compared with 2012, and leveraging opportunities to re-shape the portfolio. The Finance function will remain focused on providing high-quality financial strategy and decision-making support, together with compliant and informative reporting, whilst pursuing
capital management and development opportunities that are consistent with the Group’s strategy.
2013 performance highlights
The key metrics for Group financial management and planning are summarised below. More detailed information, including reconciliation to the appropriate statutory financial statement measures, is included in the additional financial information section of the Directors’ report on pages 47 to 52.
| | | | | | | | | | | | |
| | | 2013
US$ million | | | 2012
US$ million | | | 2011
US$ million | |
Underlying earnings (a) | | | 10,217 | | | | 9,269 | | | | 15,572 | |
Net earnings/(loss) (a) | | | 3,665 | | | | (3,028 | ) | | | 5,835 | |
Cash flows from operations | | | 20,131 | | | | 16,521 | | | | 27,609 | |
Net debt | | | 18,055 | | | | 19,192 | | | | 8,342 | |
Total capital | | | 71,557 | | | | 76,932 | | | | 67,226 | |
| (a) | Underlying earnings is the key financial performance indicator which management uses internally to assess performance. It is presented here as a measure of earnings to provide greater understanding of the underlying business performance of the Group. Items excluded from net earnings to arrive at underlying earnings are explained in note 2 to the financial statements. Both net earnings and underlying earnings deal with amounts attributable to the owners of Rio Tinto. However, IFRS requires that the profit for the year reported in the income statement should also include earnings attributable to non-controlling interests in subsidiaries. Comparative information has been restated to reflect a number of new accounting standards; see note 2 to the financial statements. |
Increased underlying earnings reflect the favourable impact of operating cash cost improvements (including exploration and evaluation savings), improved sales volumes and overall strengthening of the US dollar against local currencies. This was offset by lower prices in all of the Group’s main commodities other than iron ore, inflation, and increased tax charges (primarily attributable to utilisation of Minerals Resource Rent Tax (MRRT) deferred tax assets).
Net earnings of US$3.7 billion reflect non-cash exchange losses of US$2.9 billion and impairments of US$3.4 billion, including impairment of previous years’ non-cash accounting uplifts on initial consolidation of certain Turquoise Hill assets (including Oyu Tolgoi), a significant project cost overrun at Kitimat and of the Gove alumina refinery following an announcement to curtail production.
Cash flows from operations, which include dividends from equity accounted units, at 22 per cent above 2012, reflect the positive impact of higher volumes and cost reduction initiatives.
Net debt decreased from US$19.2 billion at 31 December 2012 to US$18.1 billion at 31 December 2013 as operating cash inflows and divestment proceeds fully offset the outflows relating to capital expenditure and the increased dividend payment. Net debt to total capital was 25 per cent at 31 December 2013 and interest cover was 13 times, both unchanged from the prior year. The board’s objective when managing capital is to safeguard the business as a going concern whilst maximising returns for the Group’s shareholders. In practice, this involves regular reviews by the board and senior management. These reviews take into account the Group’s strategic priorities, economic and business conditions, and opportunities that are identified to invest across all points of the commodities cycle. The resulting capital structure provides the Group with a high degree of financial flexibility at a low cost of capital.
| | | | |
| | 38 riotinto.com/reportingcentre2013 | | |
Five year review
Selected financial data
The selected consolidated financial information below has been derived from the historical audited consolidated financial statements of the Rio Tinto Group. The selected consolidated financial data should be read in conjunction with, and qualified in their entirety by reference to, the 2013 financial statements and notes thereto. The financial statements as included on pages 111 to 193 have been prepared in accordance with International Financial Reporting Standards as issued by the International Accounting Standards Board (IFRS) and conform to IFRS as adopted by the European Union (EU IFRS).
Rio Tinto Group
Income statement data
| | | | | | | | | | | | | | | | | | | | |
For the years ending 31 December Amounts in accordance with IFRS | |
| 2013
US$m |
| |
| Restated
2012 US$m | (c)
| |
| Restated
2011 US$m | (c)
| |
| 2010
US$m | (c)
| |
| 2009
US$m | (c)
|
Consolidated sales revenue | | | 51,171 | | | | 50,942 | | | | 60,529 | | | | 55,171 | | | | 40,262 | |
Group operating (loss)/profit(a) | | | 7,430 | | | | (1,925 | ) | | | 14,037 | | | | 19,608 | | | | 7,506 | |
| | | | | |
Profit/(loss) for the year from continuing operations | | | 1,079 | | | | (3,020 | ) | | | 6,800 | | | | 15,195 | | | | 5,784 | |
Loss after tax from discontinued operations | | | – | | | | (7 | ) | | | (10 | ) | | | (97 | ) | | | (449 | ) |
Profit/(loss) for the year | | | 1,079 | | | | (3,027 | ) | | | 6,790 | | | | 15,098 | | | | 5,335 | |
| | | | | |
Basic (losses)/earnings per share | | | | | | | | | | | | | | | | | | | | |
(Loss)/profit from continuing operations (US cents) | | | 198.4 | | | | (163.4 | ) | | | 303.9 | | | | 731.0 | | | | 301.7 | |
Loss after tax from discontinued operations (US cents) | | | – | | | | (0.4 | ) | | | (0.5 | ) | | | (4.9 | ) | | | (25.5 | ) |
(Loss)/profit for the year per share (US cents) | | | 198.4 | | | | (163.8 | ) | | | 303.4 | | | | 726.1 | | | | 276.2 | |
| | | | | |
Diluted (losses)/earnings per share | | | | | | | | | | | | | | | | | | | | |
(Loss)/profit from continuing operations
(US cents) | | | 197.3 | | | | (163.4 | ) | | | 302.0 | | | | 726.7 | | | | 300.7 | |
Loss after tax from discontinued operations (US cents) | | | – | | | | (0.4 | ) | | | (0.5 | ) | | | (4.9 | ) | | | (25.4 | ) |
(Loss)/profit for the year per share (US cents) | | | 197.3 | | | | (163.8 | ) | | | 301.5 | | | | 721.8 | | | | 275.3 | |
| | | | | | | | | | | | | | | | | | | | |
| Dividends per share | | 2013 | | | 2012 | | | 2011 | | | 2010 | | | 2009 | |
Dividends declared during the year | | | | | | | | | | | | | | | | | | | | |
US cents | | | | | | | | | | | | | | | | | | | | |
– interim | | | 83.5 | | | | 72.5 | | | | 54.0 | | | | 45.0 | | | | – | |
– final | | | 108.5 | | | | 94.5 | | | | 91.0 | | | | 63.0 | | | | 45.0 | |
UK pence | | | | | | | | | | | | | | | | | | | | |
– interim | | | 54.3 | | | | 46.4 | | | | 33.1 | | | | 28.2 | | | | – | |
– final | | | 65.8 | | | | 60.3 | | | | 57.3 | | | | 39.1 | | | | 28.8 | |
Australian cents | | | | | | | | | | | | | | | | | | | | |
– interim | | | 93.0 | | | | 68.5 | | | | 49.8 | | | | 49.3 | | | | – | |
– final | | | 120.14 | | | | 91. 7 | | | | 84.2 | | | | 61.9 | | | | 51.6 | |
| | | | | |
Dividends paid during the year (US cents)(b) | | | | | | | | | | | | | | | | | | | | |
– ordinary | | | 178.0 | | | | 163.5 | | | | 117.0 | | | | 90.0 | | | | 55.6 | |
| | | | | |
Weighted average number of shares – basic (millions)(b) | | | 1,847.3 | | | | 1,849.1 | | | | 1,923.1 | | | | 1,961.0 | | | | 1,763.6 | |
Weighted average number of shares – diluted (millions)(b) | | | 1,857.7 | | | | 1,849.1 | | | | 1,935.5 | | | | 1,972.6 | | | | 1,769.6 | |
| | | | | |
| Statement of financial position data | | | | | | | | | | | | | | | | | | | | |
at 31 December Amounts in accordance with IFRS | |
| 2013
US$m |
| |
| Restated
2012 US$m | (c)
| |
| Restated
2011 US$m | (c)
| |
| 2010
US$m | (c)
| |
| 2009
US$m | (c)
|
Total assets | | | 111,025 | | | | 118,437 | | | | 120,152 | | | | 112,773 | | | | 97,236 | |
Share capital/premium | | | 9,410 | | | | 10,189 | | | | 10,024 | | | | 10,105 | | | | 9,344 | |
Total equity/Net assets | | | 53,502 | | | | 57,740 | | | | 58,884 | | | | 64,512 | | | | 45,925 | |
Equity attributable to owners of Rio Tinto | | | 45,886 | | | | 46,553 | | | | 52,199 | | | | 58,247 | | | | 43,831 | |
| (a) | Group operating loss or profit under IFRS includes the effects of charges and reversals resulting from impairments (other than impairments of equity accounted units) and profit and loss on disposals of interests in businesses. Group operating loss or profit amounts shown above exclude equity accounted operations, finance items, tax and discontinued operations. |
| (b) | In accordance with IAS 33 “Earnings per share”, the effects of anti-dilutive potential have not been included when calculating diluted loss per share for the year ended 31 December 2012. |
| (c) | The financial statements for the years ended 31 December 2012 and 31 December 2011 have been restated for the impact of IFRS 11 Joint Arrangements, IAS 19R (revised 2011) Employee benefits and IFRIC 20 Stripping Costs in the Production Phase of a Surface Mine. Additional detail on the restatements is given in note 46 to the financial statements on page 191. IAS 19R is the only standard for which restatement is required for earlier years. The impact of IAS 19R on the Income statement and Other comprehensive income for 2010 and 2009 is immaterial, being less than US$0.1 billion in both years, and therefore the Income statement for 2010 and 2009 and the Statement of financial position for those years have not been restated. |
| | | | |
| | 39 riotinto.com/reportingcentre2013 | | |
Directors’ approval statement
This Strategic report is delivered in accordance with a resolution of the board, and has been signed on behalf of the board by:
|

|
| Jan du Plessis |
| Chairman |
| 5 March 2014 |
| | | | |
| | 40 riotinto.com/reportingcentre2013 | | |
| | | | |
| | 41 riotinto.com/reportingcentre2013 | | |
Directors’ report
The directors present their report and audited consolidated financial statements for the year ended 31 December 2013.
Dual listed structure and constitutional documents
An explanation of the dual listed companies structure (DLC) of Rio Tinto plc and Rio Tinto Limited, and of the Companies’ constitutional documents can be found on pages 234 to 243. This section also provides a description of voting rights under the DLC arrangements, including restrictions which may apply in respect of the shares of either Company under specified circumstances.
Operating and financial review
The Strategic report set out on pages 1 to 40 provides a comprehensive review of Rio Tinto’s operations, its financial position and its business strategies and prospects, and is incorporated by reference into, and forms part of, this directors’ report.
Rio Tinto’s principal activities during 2013 were minerals and metals exploration, development, production and processing.
Pages 1 to 37 of the Strategic report provides a comprehensive review of the development and performance of Rio Tinto’s operations for the year ended 31 December 2013 and the potential future developments and expected results of those operations.
The subsidiary and associated undertakings principally affecting the profits or net assets of the Group in the year are listed in notes 33 to 36 to the financial statements.
Significant changes and events affecting the Group during 2013 and until the date of this report have been:
| – | On 14 January 2013, Rio Tinto entered into an agreement with Chinalco Mining Corporation International Limited (CMCI), a subsidiary of Chinalco, to participate as a cornerstone investor in CMCI’s initial public offering (IPO) in Hong Kong on 31 January 2013. Pursuant to the agreement, Rio Tinto acquired approximately one per cent of CMCI’s issued share capital post IPO for a total consideration of US$30 million. Under the UK Listing Authority listing rules, CMCI is considered a related party of Rio Tinto plc. |
| – | On 17 January 2013, the Group announced that it expected to recognise a non-cash impairment charge of approximately US$14 billion (post tax) in its 2012 full year results. The Group also announced that Tom Albanese had stepped down as chief executive and that Iron Ore chief executive Sam Walsh had been appointed chief executive. Doug Ritchie, who led the acquisition and integration of the Mozambique coal assets in his previous role as Energy chief executive, also stepped down. |
| – | On 11 February 2013, the Group announced that the Australian Competition Tribunal had ruled that its Hamersley and Robe rail lines should not be opened up to other users. |
| – | On 14 February 2013, the Group announced the appointment of Andrew Harding and Jean-Sébastien Jacques as chief executive, Iron Ore, and chief executive, Copper, respectively. |
| – | On 28 February 2013, the Group announced the appointment of non-executive director, Chris Lynch as chief financial officer to succeed Guy Elliott, with effect from 18 April 2013. The Group also announced that Bret Clayton’s role of Group executive, Business Support & Operations, would be restructured and its responsibilities will be transferred to other Executive Committee members. |
| – | On 10 April 2013, Kennecott Utah Copper’s Bingham Canyon Mine experienced a slide along a geotechnical fault line of its north-eastern wall which suspended operations. The slide has subsequently been estimated at 135 million tonnes of material. |
| – | On 13 June 2013, the Group announced it had reached a binding agreement to sell its Eagle project to Lundin Mining Corporation. The transaction closed on 17 July 2013 for US$315 million in cash. |
| – | On 17 June 2013, the Group announced that it had priced US$3.0 billion of fixed and floating rate bonds, comprising US$1.0 billion of three-year and US$1.25 billion of five and a half-year fixed rate, and US$250 million two-year and US$500 million three-year floating rate, SEC-registered debt securities. |
| – | On 24 June 2013, the Group announced that it had decided to retain its diamonds businesses after concluding a strategic review. |
| – | On 28 June 2013, Rio Tinto entered into a bridge funding agreement with Turquoise Hill Resources Ltd. (Turquoise Hill) under which it agreed to make available to Turquoise Hill a short-term convertible credit facility of US$225 million to enable it to meet its short-term funding obligations with respect to the Oyu Tolgoi copper-gold mine in Mongolia. |
| – | On 9 July 2013, the Group announced that Oyu Tolgoi had started shipping copper concentrate to customers from its copper and gold mine in Mongolia. |
| – | On 26 July 2013, the Group announced that it had approved US$1.03 billion (Rio Tinto share) for the construction of a new 2,500 litre per second seawater desalination facility to ensure continued water supply and sustain operations at the Escondida mine in Chile. |
| – | On 29 July 2013, the Group announced that following an auction process, it had reached a binding agreement for the sale of its 80 per cent interest in Northparkes to China Molybdenum Co., Ltd. (CMOC) for US$820 million. Under the UK Listing Authority listing rules, CMOC is considered to be a related party of Rio Tinto plc. The sale was completed on 1 December 2013. |
| – | On 29 July 2013, the Group announced that all funding and work on underground development of Oyu Tolgoi would be delayed. |
| – | On 8 August 2013, the Group announced that it had signed an agreement with Turquoise Hill under which Rio Tinto would provide Turquoise Hill with a financing package to refinance existing short-term funding (see above) to enable it to continue development of the Oyu Tolgoi open pit mine in Mongolia and to commit to providing support, if necessary, to enable Turquoise Hill to repay its accumulated indebtedness to the Group. |
| – | On 8 August 2013, the Group announced that following a comprehensive review, it had concluded that the divestment of Pacific Aluminium for value was not possible in the current environment and that it would be reintegrated into the Rio Tinto Alcan group. |
| – | On 2 September 2013, the Group announced that it had achieved the significant milestone of loading the first shipment of iron ore from its expanded port, rail and mine operations in Australia. |
| – | On 25 October 2013, the Group announced that it had reached a binding agreement for the sale of its 50.1 per cent interest in the Clermont joint venture to GS Coal Pty Ltd, a company jointly owned by Glencore Xstrata plc and Sumitomo Corporation, for US$1.015 billion. |
| – | On 28 November 2013, the Group announced that it had set out a plan to optimise the growth of its world-class iron ore business in Western Australia. Mine production capacity is now expected to rapidly increase towards 360 million tonnes a year at a significantly lower capital cost per tonne than originally planned. |
| – | On 29 November 2013, the Group announced that it would move to suspend alumina production at Gove and focus on its bauxite operations after determining the refinery was no longer a viable business in the current market environment. |
| – | On 23 December 2013, the Group announced that it had advised the management of Northern Dynasty Minerals Ltd (Northern Dynasty), which owns 100 per cent of the Pebble Project, that it intended to undertake a strategic review of its shareholding in Northern Dynasty of approximately 19.1 per cent. |
| – | On 13 January 2014, the Group announced that it had acquired 510,983,220 common shares of Turquoise Hill under Turquoise Hill’s rights offering at a total cost of C$1,292,787,546.60 or C$2.53 per share thereby maintaining its existing shareholding in Turquoise Hill of approximately 50.8 per cent. Following the completion of the rights offering, the Group owned 1,021,966,440 common shares. The Group also acquired 74,247,460 Anti-Dilution Series D Warrants of Turquoise Hill in connection with the |
| | | | |
| | 42 riotinto.com/reportingcentre2013 | | |
| | rights offering. A portion of the funds received by Turquoise Hill under the rights offering were used to repay amounts outstanding under a US$1.8 billion interim funding facility and a US$600 million bridge funding facility, each previously provided by the Group to Turquoise Hill. |
| – | On 28 January 2014, Rio Tinto announced that Rio Tinto Mining and Exploration Limited (Rio Tinto) has received 44,126,780 common shares of Minera IRL Limited (IRL), representing approximately 19.44% of the issued and outstanding common shares of IRL. The shares form part of the consideration agreed to in a 2006 option agreement on the Ollachea Gold Project between the Group and IRL. |
| – | On 12 February 2014, the Group announced that it had entered into an option agreement for LNG Canada to acquire or lease a wharf and associated land at the Group’s port facility at Kitimat, British Columbia, Canada. |
| – | On 18 February 2014, Rio Tinto entered into an agreement with China Beijing Equity Exchange Co., Ltd (CBEX), China Iron and Steel Association (CISA) and other founder investors to take an equity position in a new joint venture to be incorporated (subject to Chinese regulatory approvals), the Beijing Iron Ore Trading Centre Corporation (JVCO), which proposes to purchase an iron ore trading platform and other associated assets of China Beijing International Mining Exchange. It is envisaged that the Group will continue to make some of its iron ore spot market sales through the JVCO trading platform. Pursuant to the agreement, Rio Tinto will subscribe for 6.25 per cent of JVCO’s issued share capital for a total consideration of the equivalent of approximately US$0.825 million. Under the UK Listing Authority listing rules, CBEX, CISA and some other founder investors including Chinese state-owned steel mills and iron ore traders are considered related parties of Rio Tinto plc. |
Details of events after the statement of financial position date are further described in note 43 to the financial statements.
Risk identification, assessment and management
The Group’s risk factors are set out on pages 14 to 17.
Share capital
Details of the Group’s share capital as at 31 December 2013 can be found at notes 27 and 28 to the financial statements. Details of the rights and obligations
attached to each class of shares can be found on pages 234 and 235 under the heading “Voting rights”.
Where under an employee share plan operated by the Company, participants are the beneficial owners of the shares, but not the registered owners, the voting rights are normally exercised by the registered owner at the direction of the participant.
Details of certain consequences triggered on a change of control can be found on page 234 under the heading “Dual listed companies structure”.
Details of certain restrictions on holding shares in Rio Tinto are described on page 235 under the heading “Limitations on ownership of shares and merger obligations”. There are no other restrictions on the transfer of ordinary Rio Tinto shares save for:
| – | restrictions that may from time-to-time be imposed by laws, regulations or Rio Tinto policy (for example, those relating to market abuse or insider dealing or share trading and, in Australia, including these relating to foreign investment); |
| – | restrictions on the transfer of shares that may be imposed following a failure to supply information required to be disclosed, or in relation to unmarketable parcels of shares; |
| – | restrictions on the transfer of shares held under certain employee share plans while they remain subject to the plan. |
At the annual general meetings held in 2013, shareholders authorised:
| – | the purchase by Rio Tinto Limited and its subsidiaries, and the on-market repurchase by Rio Tinto plc of up to 141,200,784 Rio Tinto plc shares (representing approximately ten per cent of Rio Tinto plc’s issued share capital at that time); |
| – | the off-market purchase by Rio Tinto plc of up to 141,200,784 Rio Tinto plc shares acquired by Rio Tinto Limited or its subsidiaries under the above authority; and |
| – | the off-market or on-market buy-back by Rio Tinto Limited of up to 43.5 million Rio Tinto Limited shares (representing approximately ten per cent of Rio Tinto Limited’s issued share capital at the time). |

| | | | |
| | 43 riotinto.com/reportingcentre2013 | | |
Directors’ report continued
Purchases
| | | | | | | | | | | | | | | | | | | | | | | | | | | | |
| | | Rio Tinto plc | | | Rio Tinto Limited | | | | |
| | |
| Total number
of shares purchased | (a)
| |
| Average price
paid per share US$ | (b)
| |
| Total number of
shares purchased as part of publicly announced plans or programmes | (c)
| |
| Total number
of shares purchased | (a)
| |
| Average price
paid per share US$ | (b)
| |
| Total number of
shares purchased as part of publicly announced plans or programmes | (c)
| |
| Rio Tinto Group
Approximate dollar value of shares that may yet be purchased under the plans or programmes US$ |
|
2013 | | | | | | | | | | | | | | | | | | | | | | | | | | | | |
1 Jan to 31 Jan | | | – | | | | – | | | | – | | | | 506,239 | | | | 70.29 | | | | – | | | | – | |
1 Feb to 28 Feb | | | – | | | | – | | | | – | | | | 376,786 | | | | 70.19 | | | | – | | | | – | |
1 Mar to 31 Mar | | | – | | | | – | | | | – | | | | 69,546 | | | | 64.77 | | | | – | | | | – | |
1 Apr to 30 Apr | | | 527,591 | | | | 48.25 | | | | – | | | | 926,251 | | | | 60.39 | | | | – | | | | – | |
1 May to 31 May | | | – | | | | – | | | | – | | | | 75,132 | | | | 53.94 | | | | – | | | | – | |
1 Jun to 30 Jun | | | 75,000 | | | | 43.03 | | | | – | | | | 304,121 | | | | 49.42 | | | | – | | | | – | |
1 Jul to 31 Jul | | | – | | | | – | | | | – | | | | 5,059 | | | | 47.91 | | | | – | | | | – | |
1 Aug to 31 Aug | | | – | | | | – | | | | – | | | | – | | | | – | | | | – | | | | – | |
1 Sep to 30 Sep | | | 1,336,598 | | | | 50.73 | | | | – | | | | 1,180,372 | | | | 60.13 | | | | – | | | | – | |
1 Oct to 31 Oct | | | – | | | | – | | | | – | | | | – | | | | – | | | | – | | | | – | |
1 Nov to 30 Nov | | | – | | | | – | | | | – | | | | – | | | | – | | | | – | | | | – | |
1 Dec to 31 Dec | | | – | | | | – | | | | – | | | | – | | | | – | | | | – | | | | – | |
Total | | | 1,939,189 | (d) | | | 49.76 | | | | – | | | | 3,443,506 | | | | 61.79 | | | | – | | | | – | |
2014 | | | | | | | | | | | | | | | | | | | | | | | | | | | | |
1 Jan to 31 Jan | | | – | | | | – | | | | – | | | | 10,436 | | | | 60.62 | | | | – | | | | – | |
1 Feb to 17 Feb | | | – | | | | – | | | | – | | | | 579,000 | | | | 62.46 | | | | – | | | | – | |
Notes
| (a) | Rio Tinto plc ordinary shares of 10p each; Rio Tinto plc ADRs; Rio Tinto Limited shares. |
| (b) | The average prices paid have been translated into US dollars at the exchange rate on the day of settlement. |
| (c) | Shares purchased by the Companies’ registrars in connection with the dividend reinvestment plans and employee share plans are not deemed to form part of any publicly announced plan or programme. |
| (d) | This figure represents 0.136 per cent of Rio Tinto plc issued share capital at 31 December 2013. |
During 2013, in order to satisfy obligations under employee share plans, Rio Tinto plc issued 1,436,542 shares from treasury and allotted 951 newly issued shares. The trustees of Rio Tinto plc’s employee share trusts purchased on-market 842,000 shares and 8,000 ADRs. Rio Tinto Limited’s registrar purchased 1,082,393 shares on-market and the trustee of Rio Tinto Limited’s employee share trusts purchased 562,000 shares on-market. In total, 2,395,966 Rio Tinto plc shares, 3,816 ADRs, and 1,279,136 Rio Tinto Limited shares were delivered to plan participants.
Also during the year, the Companies’ registrar purchased 1,089,189 Rio Tinto plc shares and 1,799,113 Rio Tinto Limited shares on-market to satisfy obligations to shareholders under the dividend reinvestment plans.
For the period 1 January 2014 to 17 February 2014, Rio Tinto plc issued 171,940 shares from treasury in connection with employee share plans and allotted 258 newly issued shares, and the trustee of Rio Tinto Limited’s employee share trusts purchased 589,436 shares on-market. During this period, 696,664 Rio Tinto plc shares, 361 ADRs, and 445,695 Rio Tinto Limited shares were delivered to plan participants.
Awards over 1,945,779 Rio Tinto plc shares and 1,571,246 Rio Tinto Limited shares were granted under employee share plans during 2013. As at 17 February 2014, awards were outstanding over 7,247,153 Rio Tinto plc shares, 66,207 ADRs and 5,139,108 Rio Tinto Limited shares. Upon vesting, awards may be satisfied by the issue of new shares, the purchase of shares on-market, or, in the case of Rio Tinto plc, by issuing treasury shares.
Substantial shareholders
Details of substantial shareholders can be found on page 237.
Dividends
Details of dividends paid and the dividend policy can be found on page 239.
Directors
The names of the directors who served during the year, together with their biographical details and other information, are shown on pages 53 to 55.
All directors will stand for re-election at the 2014 annual general meetings with the exception of Vivienne Cox who will retire at the conclusion of the Rio Tinto plc annual general meeting to be held on 15 April 2014.
A table of directors’ attendance at board and committee meetings during 2013 is on page 59.
Secretaries
Details of the company secretary of Rio Tinto plc and the joint company secretaries of Rio Tinto Limited together with their qualifications and experience are set out on page 55.
Corporate governance
A full report on corporate governance can be found on pages 57 to 67 and forms part of this Directors’ report.
| | | | |
| | 44 riotinto.com/reportingcentre2013 | | |
Indemnities and insurance
The Articles of Association and Constitution of the Companies provide for them to indemnify, to the extent permitted by law, officers of the Companies, including officers of wholly owned subsidiaries, against liabilities arising from the conduct of the Group’s business. The directors and the company secretary of Rio Tinto plc and the joint company secretaries of the Companies, and certain employees serving as directors of subsidiaries at the Group’s request have been indemnified in accordance with these provisions. No amount has been paid under any of these indemnities during the year.
The Group has purchased directors’ and officers’ insurance during the year. In broad terms, the insurance cover indemnifies individual directors’ and officers’ personal legal liability and legal defence costs for claims arising out of actions taken in connection with Group business. It is a condition of the insurance policy that detailed terms and premiums paid cannot be disclosed.
Employment policies and communication
Information about the Group’s employment policies and our employees is available on page 21.
Rio Tinto focuses on working with our employees and their unions in good faith, seeking fair solutions while maintaining the competitiveness of each of our operations. At present we do not anticipate any union activity which would have a material adverse effect on the Group’s operations as a whole.
Political donations
No donations were made during 2013 for political purposes in the EU, Australia or elsewhere, as defined by the UK Companies Act 2006.
Government regulations
Rio Tinto is subject to extensive government regulations affecting all aspects of its operations. Our product diversity and geographical spread reduces the likelihood of any single government regulation having a material effect on the Group’s business. Rio Tinto consistently seeks to apply best practice in all of its activities, which also mitigates against the impact of regulation.
In each of the countries in which we operate, Rio Tinto is subject to local, state, provincial and federal regulations governing mining and processing, land tenure and use, environmental requirements, workplace health and safety, data privacy, trade and export, corporations, competition, intellectual property, access to infrastructure, foreign investment, securities and taxation. Some operations are conducted under specific agreements with the respective governments and associated acts of parliament.
In Canada, our hydroelectric power generation assets are regulated by the Quebec and British Columbia provincial agencies covering issues of water rights, power sales and purchases.
In Australia and Namibia, Rio Tinto’s uranium operations are subject to specific regulations covering the mining and export of uranium.
In South Africa, our operations are subject to black economic empowerment legislation which includes the requirement to transfer (for fair value) 26 per cent of the Group’s South African mining assets to historically disadvantaged South Africans by 2014. In 2009, Rio Tinto successfully concluded a 26 per cent empowerment transaction. Rio Tinto also complies with the mining legislation’s transformation imperatives which includes empowerment of South Africa’s Historically Disadvantaged Employees and Communities.
Environmental regulation
Rio Tinto measures its performance against environmental regulation to which its operations are subject, by rating incidents according to their environmental impact potential. Issues of Group-level importance are reported to the Executive Committee and the Sustainability Committee. Prosecutions and other breaches are also used to gauge Rio Tinto’s performance.
Rio Tinto is subject to various environmental regulations including regulations that cover air, land, water and noise pollution in the countries where it has operations. In 2013, there were 15 environmental incidents reported to the Executive Committee with the potential to impact the environment or to concern local communities, several of which were minor. Five resulted from
air discharges, four from water discharges, five were spills and one related to exceeding noise limits.
The incidents were:
| – | Air emissions exceeded limits due to scrubber maintenance issues at an aluminium smelter in the Quebec, Canada. |
| – | Dust was emitted on a number of occasions from a carbon cathode production facility in France. |
| – | Air emissions exceeded criteria at a coal mine in New South Wales, Australia. |
| – | Air emissions exceeded limits on a number of occasions at an aluminium smelter in France. |
| – | Para aromatic hydrocarbon emissions exceeded limits at an aluminium smelter in British Columbia, Canada. |
| – | Noise levels exceeded limits on a number of occasions at a coal mine in New South Wales, Australia. |
| – | Various water quality discharge parameters were exceeded during heavy rain at an alumina refinery in Queensland, Australia. |
| – | Mine-affected water was discharged to the environment at a coal mine in Queensland, Australia. |
| – | Water quality discharges exceeded seawater discharge limits at an alumina refinery in Queensland, Australia. |
| – | Sediment in run-off entered a fish habitat at an aluminium smelter site in British Columbia, Canada. |
| – | Two leach tanks ruptured at uranium processing plants: one in the Northern Territory, Australia and the other in Namibia. |
| – | Tailings overflowed from a pipe into a neighbouring property at a copper facility in Utah, US. |
| – | Diesel spilled from an open pump at a coal mine in Queensland, Australia. |
| – | Water run-off occurred at a hazardous substances storage area at an aluminium smelter site in Canada. |
During 2013, 16 operations incurred fines amounting to US$190,279 (2012: US$47,102).
In addition, Australian corporations that exceed specific greenhouse gas emissions or energy use thresholds have obligations under the Australian National Greenhouse and Energy Reporting Act 2007, the Australian Energy Efficiency Opportunities Act 2006 (EEO), and the Australian Clean Energy Act 2011 which establishes the carbon pricing mechanism.
Three main Rio Tinto entities, Rio Tinto Limited, Alcan Gove Pty Limited and Pechiney Consolidated Australia Limited, are covered under each of these Acts. Each submitted their National Greenhouse and Energy reports by the required 31 October 2013 deadline and completed the required EEO public reporting. Twenty-eight EEO assessments for the second five-year assessment cycle have now been completed. One remaining assessment is scheduled in 2014. All compliance obligations under the carbon pricing mechanism, including reporting and surrender of carbon units by liable entities, were completed in the required timeframes. Liability information is publicly available on the Clean Energy Regulator’s website (as per legislative requirements).
Further information on the Group’s environmental performance is included in the sustainable development section of this Annual report, on pages 18 to 24, and on the website.
Exploration, research and development
The Group carries out exploration as well as research and development in support of its activities as described more fully under Exploration and Technology & Innovation on pages 36 to 37. Amounts charged for the year, net of any gains on disposal, generated a net loss before tax for exploration and evaluation of US$1,109 million (2012 restated: US$1,477 million). Research and development costs were US$231 million (2012 restated: US$246 million).

| | | | |
| | 45 riotinto.com/reportingcentre2013 | | |
Directors’ report continued
Auditors
PricewaterhouseCoopers LLP and PricewaterhouseCoopers (together, PwC) are the auditors of Rio Tinto plc and Rio Tinto Limited respectively. PricewaterhouseCoopers LLP have indicated their willingness to continue in office as auditors of Rio Tinto plc and a resolution to reappoint them as auditors of Rio Tinto plc will be proposed at the 2014 annual general meetings. A separate resolution will seek authority for the Audit Committee to determine their remuneration. PricewaterhouseCoopers will continue in office as auditors of Rio Tinto Limited.
A copy of the declaration given by PricewaterhouseCoopers as the Group’s external auditors to the directors in relation to the auditors’ compliance with the independence requirements of the Australian Corporations Act 2001 and the professional code of conduct for external auditors is set out on page 203 in the financial statements.
No person who was an officer of Rio Tinto during 2013 was a director or partner of the auditors at a time when they conducted an audit of the Group.
Each person who held the office of director at the date the board resolved to approve this report makes the following statements:
| – | so far as the directors are aware, there is no relevant audit information of which the auditors are unaware; and |
| – | each director has taken all steps that he or she ought to have taken as a director to make him or herself aware of any relevant audit information and to establish that the auditors are aware of that information. |
Fees for audit and non-audit services
The amounts payable to the Group’s auditors, PwC, were:
| | | | | | | | |
| | | 2013 US$m | | | 2012 US$m | |
Audit fees(a) | | | 15.3 | | | | 17.2 | |
Assurance services(b) | | | 4.2 | | | | 5.3 | |
Taxation services | | | 0.9 | | | | 0.7 | |
All other fees(c) | | | 1.3 | | | | 1.4 | |
| | | | 21.7 | | | | 24.6 | |
| (a) | Audit fees relating to statutory audits. |
| (b) | Assurance services are mainly related to half year review procedures, carve-out financial statements, sustainability assurance and limited assurance over the 2013 Taxes Paid report. |
| (c) | All other fees include services in connection with the divestment programme and similar corporate projects. |
Further information on auditor’s remuneration see note 39 to the financial statements.
During the year, the Audit Committee reviewed the effectiveness of PwC for Group audit and local, statutory audit work. The evaluation took the form of a survey comprising a range of questions covering objectivity, quality and efficiency and was completed by individual Rio Tinto business units. In addition, in the current year a further review was completed in October 2013 of the overall relationship with the auditors. The results of this survey and review were presented to the Audit Committee which concluded that PwC continued to provide a high-quality audit and an effective and independent challenge to management. The Audit Committee was satisfied with the external audit process and the independence of the external auditors.
PwC have been the external auditors since before the formation of the dual listed companies structure in 1995. For the reasons noted on page 62 the Audit Committee does not consider it necessary at the present time to undertake a tender process for the Group’s external audit. Since 2002, PwC have followed the requirements of the Sarbanes-Oxley Act 2002 and APB Ethical Standards and rotated both the lead UK and Australian audit partners at least every five years. In the UK, the audit engagement partner was appointed in 2011, and in Australia the audit engagement partner was appointed in 2012. They are due to transition after 2015 and 2016 respectively. This continued refreshing of the
team brings new perspectives to the audit and promotes healthy debate between auditors and management as well as the Committee.
Based on advice provided by the Audit Committee as set out in the report of the Audit Committee on pages 61 and 62, the directors are satisfied that the provision of non-audit services by PwC is compatible with the general standard of independence for auditors and the standards imposed by Australian, UK and US legislation.
Financial instruments
Details of the Group’s financial risk management objectives and policies and exposure to risk are described in note 30 to the 2013 financial statements.
Greenhouse gas emissions
Greenhouse gas emissions (in million tCO2e)(a) (b)
| | | | | | | | |
| | | 2013 | | | 2012 | |
Scope 1(c) | | | 23.4 | | | | 26.5 | |
Scope 2(d) | | | 14.4 | | | | 16.4 | |
Total emissions(e) | | | 37.2 | | | | 40.7 | |
Ratios | | | | | | | | |
GH intensity index(f) | | | 82.7 | | | | 94.1 | |
GH intensity (tCO2e/t of product) | | | 0.095 | | | | 0.111 | |
| (a) | Rio Tinto’s greenhouse gas emissions for managed operations are reported in accordance with requirements under Part 7 of The UK Companies Act 2006 (Strategic Report and Directors’ Report) Regulations 2013. Our approach and methodology used for the determination of these emissions are available at: riotinto.com/sustainabledevelopment2013/environment/climate_change.html and riotinto.com/sustainabledevelopment2013/glossary.html. |
| (b) | Rio Tinto’s greenhouse gas emission inventory is based on definitions provided by The World Resource Institute / World Business Council for Sustainable Development Greenhouse Gas Protocol: A Carbon Reporting and Accounting Standard, March 2004. |
| (c) | Scope 1 emissions include “emissions from combustion of fuel and operation of managed facilities”. It includes emissions from land management and livestock management at those facilities. |
| (d) | Scope 2 emissions include “emissions from the purchase of electricity, heat, steam or cooling”. |
| (e) | Total emissions is the sum of scope 1 and scope 2 emissions minus emissions that are associated with the generation of electricity, heat, steam or cooling supplied to others. These emissions exclude indirect emissions associated with transportation and use of our products reported on page 22. |
| (f) | Rio Tinto greenhouse gas intensity index is the weighted emissions intensity for each of Rio Tinto’s main commodities relative to the commodity intensities in the 2008 base year (set to 100). This index incorporates approximately 95 per cent of Rio Tinto’s emissions from managed operations. |
| | | | |
| | 46 riotinto.com/reportingcentre2013 | | |
Additional financial information
Underlying earnings
Financial performance compared with previous years
In order to provide additional insight into the performance of our business, Rio Tinto presents underlying earnings, which is defined in note 2 to the financial statements on pages 134 to 135.
2013 underlying earnings of US$10,217 million (2012: US$9,269 million) and net earnings of US$3,665 million (2012: losses of US$3,028 million) were US$948 million above (2012: US$6,303 million below) and US$6,693 million above (2012: US$8,863 million below) the comparable measures for the previous year. Both net earnings and underlying earnings represent amounts attributable to the owners of Rio Tinto. IFRS requires that the profit for the period reported in the income statement should also include earnings attributable to non-controlling interests in subsidiaries. Underlying earnings is reconciled to net earnings in the table below, which also lists the principal factors driving the movement in underlying earnings between periods.
| | | | | | | | | | | | | | | | | | |
| | | 2013 vs 2012 | | | | | Restated(a) 2012 vs 2011 | |
| | | US$m | | | US$m | | | | | US$m | | | US$m | |
2012/2011
net earnings (restated) | | | | | | | (3,028 | ) | | | | | | | | | 5,835 | |
| Items excluded from underlying earnings (b) | | | | | | | 12,297 | | | | | | | | | | 9,737 | |
2012/2011
underlying earnings | | | | | | | 9,269 | | | | | | | | | | 15,572 | |
| Prices | | | (1,289 | ) | | | | | | | | | (5,315 | ) | | | | |
| Exchange rates | | | 1,008 | | | | | | | | | | 154 | | | | | |
| Volumes | | | 538 | | | | | | | | | | (309 | ) | | | | |
| General inflation and energy | | | (368 | ) | | | | | | | | | (270 | ) | | | | |
| Operating cash costs | | | 1,559 | | | | | | | | | | (304 | ) | | | | |
| Exploration and evaluation costs | | | 557 | | | | | | | | | | (262 | ) | | | | |
| Disposal/write-down of exploration properties | | | (477 | ) | | | | | | | | | 342 | | | | | |
| Non cash/interest/tax/other | | | (580 | ) | | | | | | | | | (339 | ) | | | | |
| Total changes in underlying earnings (b) | | | | | | | 948 | | | | | | | | | | (6,303 | ) |
| 2013/2012 underlying earnings | | | | | | | 10,217 | | | | | | | | | | 9,269 | |
| Impairment charges net of reversal | | | | | | | (3,428 | ) | | | | | | | | | (14,360 | ) |
| Net gains and losses on consolidation and disposal of interests in businesses | | | | | | | 847 | | | | | | | | | | 827 | |
| Exchange differences and movements on derivatives | | | | | | | (2,731 | ) | | | | | | | | | 550 | |
| Restructuring costs from global headcount reductions | | | | | | | (367 | ) | | | | | | | | | (77 | ) |
| Impact of pit wall slide at Kennecott Utah Copper | | | | | | | (283 | ) | | | | | | | | | – | |
| Adjustments to Clermont/Blair Athol on reclassification to disposal groups held for sale | | | | | | | (173 | ) | | | | | | | | | – | |
| Deferred tax asset write-off | | | | | | | (114 | ) | | | | | | | | | (134 | ) |
| Recognition of deferred tax asset following introduction of MRRT in 2012 | | | | | | | – | | | | | | | | | | 1,130 | |
| Other exclusions | | | | | | | (303 | ) | | | | | | | | | (233 | ) |
| Total excluded in arriving at underlying earnings | | | | | | | (6,552 | ) | | | | | | | | | (12,297 | ) |
| 2013/2012 net earnings/(loss) | | | | | | | 3,665 | | | | | | | | | | (3,028 | ) |
– attributable to non-controlling interests | | | | | | | (2,586 | ) | | | | | | | | | 1 | |
| Profit/(loss) for the year | | | | | | | 1,079 | | | | | | | | | | (3,027 | ) |
| (a) | Comparative information has been restated to reflect a number of new accounting standards, as described in note 1 to the financial statements on pages 118 to 119. |
| (b) | Earnings contributions from Group businesses and business segments are based on underlying earnings. Amounts excluded from net earnings in arriving at underlying earnings are described in notes 2(c) and (d) to the financial statements on pages 134 to 135. |
Prices
2013 vs 2012
The effect of price movements on all major commodities was to decrease underlying earnings by US$1,289 million compared with 2012. The average Platts price for 62 per cent iron Pilbara fines was three per cent higher on average compared with 2012, while hard coking coal benchmark prices were 24 per cent lower, and thermal coal spot prices averaged 14 per cent lower. Copper prices were down eight per cent and LME prices for gold and aluminium averaged 16 and nine per cent lower respectively.
2012 vs 2011
The effect of price movements on all major commodities in 2012 was to decrease underlying earnings by US$5,315 million compared with 2011. Average prices declined from record highs experienced in 2011 for nearly all of Rio Tinto’s major commodities, with the exception of gold which was up six per cent on 2011, and minerals (mainly borates and titanium dioxide feedstocks). The average Platts price for 62 per cent Pilbara fines declined by 24 per cent compared with 2011. Copper prices were down ten per cent, aluminium prices averaged 16 per cent lower and molybdenum was 17 per cent lower.
Commodity prices and other drivers of sales revenue are discussed further on pages 49 to 50.
Exchange rates
2013 vs 2012
The US dollar strengthened significantly during 2013, in particular in the second half of the year. Compared with 2012, the US dollar, on average, rose by six per cent against the Australian dollar, by three per cent against the Canadian dollar, and by 15 per cent against the South African Rand. The effect of all currency movements was to increase underlying earnings relative to 2012 by US$1,008 million.
2012 vs 2011
Compared with 2011, on average, the US dollar depreciated by one per cent against the Australian dollar but strengthened by one per cent against the Canadian dollar, by seven per cent against the Euro and by 14 per cent against the South African Rand. The effect of all currency movements was to increase underlying earnings relative to 2011 by US$154 million.
Volumes
2013 vs 2012
Volume increases enhanced earnings by US$538 million compared with 2012. These were achieved primarily in Iron Ore, where a new annual sales volume record was achieved, due to increased capacity at the Pilbara ports, and productivity improvements. Volumes also rose in copper, from Escondida in line with higher ore grades and increased throughput, in bauxite from record production volumes, and in aluminium following the return of the Alma smelter to full production. These additional tonnes more than offset the impact of lower gold production at Kennecott Utah Copper and lower demand for titanium dioxide feedstocks.
2012 vs 2011
Volume increases enhanced earnings by US$634 million compared with 2011. These were achieved primarily in iron ore, where sales volumes rose three per cent due to increased capacity at the Pilbara ports, and at Escondida in line with higher ore grades. Volume declines lowered earnings by US$943 million compared with 2011, reflecting lower mill throughput and gold grades at Kennecott Utah Copper and no metal share from Grasberg.

| | | | |
| | 47 riotinto.com/reportingcentre2013 | | |
Additional financial information continued
Cash costs, exploration and evaluation
2013 vs 2012
Rio Tinto made strong progress on its cost reduction programme and exceeded its 2013 targets. In 2013, the Group realised US$2,279 million pre-tax (US$1,559 million post-tax) in operating cash cost savings which exceeded the target of US$2 billion. Operating cash costs savings is a financial performance indicator used by management to assess the progress the Group is making on cost efficiency. Operating cash cost savings represent improvements in unit cost of goods sold for operating assets and improvements in operating costs for central functions.
Exploration and evaluation spend was reduced by US$1,023 million (on a consolidated, pre-tax basis) which exceeded the target reduction of US$750 million. Evaluation spend has been prioritised on those projects with the greatest potential to deliver value in the medium term, with spend on certain longer-dated options reduced. On a net earnings basis this resulted in an improvement of US$557 million. These are offset by the absence of a gain on disposal, and write-down of exploration properties in 2013. The Group wrote down its investment in Northern Dynasty Minerals, which owns 100 per cent of the Pebble Project in Alaska, by US$131 million following the announcement of a strategic review. In 2012, Rio Tinto reported net gains of US$346 million on divestment of various exploration properties, including its interests in Extract Resources and Kalahari Minerals.
In 2013, the Group reduced headcount by 4,000, net of new roles in the Iron Ore group to support the Pilbara 290 expansion. A further 3,300 roles left the Group through divested assets.
2012 vs 2011
Industry-wide cost pressures continued during 2012, in particular at some of the key mining regions where Rio Tinto has significant operations, such as New South Wales, Queensland and the Pilbara region of Western Australia.
Higher energy costs across the Group lowered underlying earnings by US$23 million compared with 2011. In 2012, many operations were impacted by higher fuel, diesel and power rates.
Higher operating cash costs during 2012 decreased underlying earnings by US$304 million compared with 2011 due to a combination of fixed production cost inefficiencies associated with lower volumes due to grade, higher maintenance costs, and costs associated with operational readiness for the Pilbara expansion of iron ore production.
During 2012, Rio Tinto divested various exploration properties, including interests in Extract Resources and Kalahari Minerals. The impact from movements in exploration and evaluation expenditure net of gains realised from divestments was to increase underlying earnings by US$80 million compared with 2011.
Non-cash/interest/tax, other
The effective corporate income tax rate on underlying earnings, excluding equity accounted units was 35 per cent compared with 30 per cent in 2012 (2012: 30 per cent, unchanged from 2011). The increased charge was primarily attributable to utilisation of the MRRT deferred tax asset. As in 2012 and 2011, the effective corporate tax on net earnings, excluding equity accounted units, is significantly impacted by the impairment of goodwill, which is non-deductible for tax purposes.
The Group net interest charge was US$130 million higher than in 2012 (2012: US$128 million lower than in 2011), mainly reflecting higher average net debt in 2013 (2012: mainly reflecting an increase in capitalised interest).
Exclusions from underlying earnings 2011-2013
Earnings contributions from Group businesses and business segments are based on underlying earnings. Amounts excluded from net earnings in arriving at underlying earnings are summarised in the discussion of year-on-year results below.
| | | | | | | | | | | | | | |
| | | | | 2013
US$m | | | Restated
2012
US$m | | | Restated
2011
US$m | |
| Impairment charges net of reversal | | | | | (3,428 | ) | | | (14,360 | ) | | | (9,290 | ) |
| Gains and losses on consolidation and disposal of interests in businesses | | | | | 847 | | | | 827 | | | | 167 | |
| Exchange differences and derivative movements | | | | | (2,731 | ) | | | 550 | | | | (68 | ) |
| Restructuring costs including global headcount reductions | | | | | (367 | ) | | | (77 | ) | | | – | |
| Impact of pit wall slide at Kennecott Utah Copper | | | | | (283 | ) | | | – | | | | – | |
| Adjustments to Clermont/Blair Athol on reclassification to disposal groups held for sale | | | | | (173 | ) | | | – | | | | – | |
| Deferred tax asset write-off | | | | | (114 | ) | | | (134 | ) | | | (342 | ) |
| Recognition of deferred tax asset following introduction of MRRT in 2012 | | | | | – | | | | 1,130 | | | | – | |
| Other exclusions | | | | | (303 | ) | | | (233 | ) | | | (204 | ) |
| Total excluded in arriving at underlying earnings | | | | | (6,552 | ) | | | (12,297 | ) | | | (9,737 | ) |
2013
Total impairment charges of US$3,428 million (net of tax and non-controlling interests) were recognised in 2013, of which US$1,655 million related to the Group’s copper businesses. This includes a charge of US$1,565 million related to the impairment of previous years’ fair value adjustments on consolidation of certain assets of Turquoise Hill (including Oyu Tolgoi). On 29 July 2013, Rio Tinto announced that funding and work on the underground development would be delayed pending resolution of outstanding shareholder issues, including finalising project finance. The consequent impact of updates to timing of revenues and expenditure resulted in the carrying value being higher than fair value less costs of disposal (FVLCD).
Impairments to the Group’s copper businesses also include adjustments to reduce the carrying value of the Eagle nickel-copper project to FVLCD prior to divestment on 17 July 2013, the impact of medium and long-term coking and thermal coal prices on non-cash fair value acquisition adjustments to undeveloped projects at SouthGobi Resources, and adjustment to the carrying value of Inova Resources, which was sold on 1 November 2013.
In addition, there was a post-tax impairment of US$1,293 million relating to the Group’s aluminium businesses. This includes US$555 million for the Gove refinery, following an announcement on 29 November 2013 to suspend alumina production and focus on the bauxite operation. As a result of this decision, the timing and scope of site restoration and environmental rehabilitation cash flows have been revised, together with the write-off of operating assets not fully depreciated. The remaining post-tax charge of US$738 million related to the Group’s Canadian aluminium operations, primarily at Kitimat in British Columbia, resulting from a change in assumptions about future capital required to complete the modernisation project, which diminished the value of the associated intangible assets, and another site closure within the Aluminium portfolio.
A post-tax impairment charge of US$470 million relating to Rio Tinto Coal Mozambique (RTCM) has been recognised. An assessment of FVLCD derived from future cash flows, which included a reassessment of the development plan and review of the discount rate and associated country risk premium, resulted in the recoverable value being below carrying value.
| | | | |
| | 48 riotinto.com/reportingcentre2013 | | |
Net gains on disposal of interests in businesses during 2013 mainly relate to the Group’s divestment of its remaining interest in Constellium (formerly Alcan Engineered Products) and the Northparkes mine.
Non-cash exchange and derivative losses of US$2,731 million arose primarily on US dollar debt in non-US dollar functional currency companies, and on intragroup balances. These losses are largely offset by currency translation gains recognised in equity.
Kennecott Utah Copper’s Bingham Canyon mine experienced a slide along a geological fault line of its north-eastern wall in April 2013. Charges relating to the slide, which have been excluded from underlying earnings, primarily comprise the write-off of certain deferred stripping assets and damaged equipment. Adjustments for settlement of insurance claims have been made to the amount excluded from underlying earnings, and will continue as insurance claims are settled.
Adjustments in relation to Clermont and Blair Athol arose following reclassification to disposal groups held for sale, and reflect contractual obligations for product sales and funding of closure activities, which will remain with the Group following completion of the divestments. Further adjustments in respect of these obligations will be combined with the net gain/loss on disposal expected to be recognised in 2014.
2012
A post-tax impairment charge of US$14,360 million was recognised in 2012, of which US$11,000 million related to the Group’s aluminium businesses. During 2012, aluminium prices deteriorated further with strong Australian and Canadian currencies, high energy and raw material costs, and high volumes of LME inventory continuing to exert pressure on current market values in the industry. As in 2011, given the prevailing conditions in the aluminium market, FVLCD did not include the full value of the Group’s planned improvements in cash margins from its value-enhancement programmes.
A post-tax impairment charge of US$2,860 million was also recognised relating to Rio Tinto Coal Mozambique (RTCM). The development of infrastructure in Mozambique to support the undeveloped coal asset was found to be more challenging than initially anticipated which, combined with a downward revision to estimates of recoverable coking coal volumes, led to a reassessment of the overall scale and ramp-up schedule of RTCM and consequently to the assessment of its FVLCD.
In addition, there were net post-tax impairments of US$460 million relating to the Group’s Argyle diamond mine and US$40 million in other net impairments. An impairment review of Argyle was triggered by the announcement during 2012 of the Diamonds strategic review, as well as changes to the forecast ramp-up date for the underground mine.
Gains and losses on consolidation and disposal of interests in businesses relate primarily to a gain of US$965 million arising on consolidation of Richards Bay Minerals (RBM) in September 2012 and a US$167 million loss on consolidation of Turquoise Hill Resources.
A deferred tax asset was recognised in 2012 following introduction of the MRRT on 1 July 2012. The legislation, which applies to companies with iron ore and coal operations in Australia, allows a deduction against future MRRT liability based on the market value of past investments in these mining assets as at 1 May 2010. Accordingly, a deferred tax asset was recognised to reflect the deductibility for MRRT purposes of the market value of these mining assets to the extent recovery is probable.
2011
A post-tax impairment charge of US$9,290 million was recognised in 2011, of which US$8,855 million related to the Group’s aluminium businesses. Valuation of Rio Tinto’s aluminium businesses for impairment testing was based on an assessment of FVLCD derived from discounted future cash flows. The impairment was largely a result of the economic environment, and related market volatility in aluminium prices in the second half of 2011, leading to declines in market values for aluminium assets.
In addition, there were net post-tax impairments of US$344 million relating to the Group’s diamond business and US$91 million in other net impairments.
Profits on the disposal of businesses in 2011 related principally to the sale of the Group’s talc business and Colowyo mine.
The deferred tax asset write-off in 2011 of US$342 million followed a change in French legislation which restricted the utilisation of tax losses.
Group financial results by product group 2011-2013
| | | | | | | | | | | | |
| | |
| 2013
US$m |
| |
| Restated
2012 US$m | (a)
| |
| Restated
2011 US$m | (a)
|
Iron Ore | | | 9,858 | | | | 9,247 | | | | 13,268 | |
Aluminium | | | 557 | | | | 54 | | | | 610 | |
Copper | | | 821 | | | | 1,059 | | | | 2,013 | |
Energy | | | 33 | | | | 309 | | | | 1,114 | |
Diamonds & Minerals(b) | | | 350 | | | | 149 | | | | (159 | ) |
Other operations | | | (281 | ) | | | (582 | ) | | | (288 | ) |
Inter-segment transactions | | | (4 | ) | | | (8 | ) | | | 40 | |
Other items | | | (730 | ) | | | (750 | ) | | | (684 | ) |
Exploration and evaluation | | | (145 | ) | | | (97 | ) | | | (102 | ) |
Net interest | | | (242 | ) | | | (112 | ) | | | (240 | ) |
Group underlying earnings | | | 10,217 | | | | 9,269 | | | | 15,572 | |
Exclusions from underlying earnings | | | (6,552 | ) | | | (12,297 | ) | | | (9,737 | ) |
Net earnings/(loss) | | | 3,665 | | | | (3,028 | ) | | | 5,835 | |
| (a) | Comparative information for 2012 and 2011 has been restated to reflect a number of new accounting standards; refer to note 46 in the financial statements. |
| (b) | Includes the Simandou iron ore project in Guinea, which is the responsibility of the Diamonds & Minerals product group chief executive. |
Sales revenue
Prices
| | | | | | | | | | | | | | | | | | |
| Commodity | | Source | | Unit | | | 2013
US$ | | | 2012
US$ | | | 2011
US$ | |
| Average prices | | | | | | | | | | | | | | | | | | |
| Iron ore 62% Fe | | Platts Index less | | | | | | | | | | | | | | | | |
| Fines FOB | | Baltic Exchange | | | | | | | | | | | | | | | | |
| | Freight Rate | | | dmt | (a) | | | 126 | | | | 122 | | | | 160 | |
| Aluminium | | LME(b) | | | Tonne | | | | 1,845 | | | | 2,018 | | | | 2,395 | |
| Copper | | LME | | | Pound | | | | 3.33 | | | | 3.61 | | | | 4.00 | |
| Gold | | LBMA | | | Ounce | | | | 1,410 | | | | 1,669 | | | | 1,571 | |
| | | |
| Closing prices (quoted commodities only) | | | | | | | | | | | | | |
| Aluminium | | | | | Tonne | | | | 1,755 | | | | 2,041 | | | | 1,970 | |
| Copper | | | | | Pound | | | | 3.35 | | | | 3.65 | | | | 3.43 | |
| Gold | | | | | Ounce | | | | 1,208 | | | | 1,675 | | | | 1,575 | |
The above table shows published prices for Rio Tinto’s commodities for the last three years where these are publicly available, and where there is a reasonable degree of correlation between the published prices and Rio Tinto’s realised prices.
Group sales revenue will not necessarily move in line with these published prices for a number of reasons which are discussed below.
The discussion of revenues below relates to the Group’s gross revenue from sales of commodities, as included in the financial information by business unit.
| | | | |
| | 49 riotinto.com/reportingcentre2013 | | |
Additional financial information continued
Aluminium
2013 sales revenue compared with 2012
The Aluminium group’s sales revenues are from aluminium and related products such as alumina and bauxite.
Sales revenue increased by two per cent, reflecting increasing volumes across all products, and a rise in regional market premia more than offsetting a nine per cent decline in LME prices over the period. Market premia on aluminium shipments continued to perform strongly in 2013, supported by balanced physical supply/demand, despite significant LME inventories, much of which remains tied up in financing deals due to higher forward prices and low interest rates.
2012 sales revenue compared with 2011
Gross sales revenue for Rio Tinto Alcan decreased by 17 per cent compared with 2011, due to the combined effects of lower market prices and reduced production at Alma, offset by the Yarwun refinery expansion.
The impact of lower prices on Group sales revenue in 2012 was partially offset by higher market premia as significant amounts of aluminium inventories remained locked in financing deals and therefore unavailable for physical delivery.
Copper
2013 sales revenue compared with 2012
Gross sales revenue for the Copper group decreased by 11 per cent in 2013 compared with 2012. This reflected an eight per cent decline in the copper price during the period, and a 16 per cent decline in the gold price, together with divestment of the Palabora and Northparkes operations during 2013.
At 31 December 2013, the Group had an estimated 254 million pounds of copper sales (2012: 249 million pounds) that were provisionally priced at 333 US cents per pound (2012: 360 US cents per pound). The final price of these sales will be determined during the first half of 2014.
2012 sales revenue compared with 2011
Gross sales revenue for the Copper group decreased by 13 per cent in 2012 compared with 2011. This reflected the impact of lower prices and decreased volumes following lower mill throughput and an anticipated period of lower gold grades at Kennecott Utah Copper and no metal share from Grasberg. This was partly offset by increasing volumes from Escondida due to higher grades and improvements to the crushing and conveying circuit and from Northparkes in line with a recovery in ore grades.
Diamonds & Minerals
2013 sales revenue compared with 2012
Gross sales revenue increased by three per cent, largely as the result of consolidating a full year of sales at Richards Bay Minerals (RBM), which offset the impact of lower prices for zircon, titanium dioxide feedstocks, borates and metallics and lower sales volumes of titanium dioxide feedstocks due to challenging market conditions. Markets for titanium dioxide and zircon have softened further over the course of the year as the industry continues to work through high levels of inventories.
Diamonds revenue was 15 per cent above 2012 due to higher volumes and increased prices; polished diamond prices were relatively stable throughout 2013 whilst slightly greater volatility was experienced in prices for rough diamonds. Diamond prices realised by Rio Tinto depend on the size and quality of diamonds in the product mix.
2012 sales revenue compared with 2011
Revenues for Rio Tinto Iron & Titanium (RTIT) increased 41 per cent year-on-year due to higher prices for titanium dioxide feedstocks and the RBM transaction in September 2012, partially offset by the divestment of the talc business on 1 August 2011. The market for both titanium dioxide and zircon started the year strongly, although demand subsequently softened in the second half. RTIT continued to replace its multi-year sales contracts with alternative pricing mechanisms in 2012, increasing the exposure to market prices.
Diamonds revenue was two per cent higher than 2011, as the effect of higher volumes was largely offset by lower prices.
Energy
2013 sales revenue compared with 2012
Gross sales revenue in 2013 for the Energy group decreased by ten per cent compared with 2012 as a result of significantly lower prices. Global thermal coal prices continued the weaker trend of the past two years, and excess supply continues to impact the coking coal market with nearly all major exporting countries increasing output in 2013. Excess supply and enduring closure of Japan’s nuclear industry continued to adversely impact the uranium market in 2013. The uranium spot price index ended the year 20 per cent below 2012 at US$34.50 per pound, while the long-term price indicator lost 12 per cent to end the year at US$50 per pound U3O8.
A significant proportion of Rio Tinto’s coal production is sold under long-term contracts. In Australia, the prices applying to sales under the long-term contracts are generally renegotiated annually for thermal coal, but prices are fixed at different times of the year and on a variety of bases. Coking coal prices for 2013 have been negotiated on a quarterly basis. For these reasons, average realised prices will not necessarily reflect the movements in any of the publicly-quoted prices. Rio Tinto Uranium also sells predominantly on a longer-term contract basis. Moreover, there are significant product specification differences between mines. Sales volumes of all products will vary during the year and the timing of shipments will also result in differences between average realised prices and published prices.
2012 sales revenue compared with 2011
Gross sales revenue in 2012 for the Energy group decreased by 17 per cent compared with 2011 as a result of lower prices.
2012 was a difficult year in coal and uranium markets as supply and demand fundamentals struggled to balance in the face of global economic uncertainty, with prices declining across most of the year. Coking coal spot prices reached a low of US$140 per tonne in the third quarter of 2012 after peaking at US$366 per tonne in early 2011. Thermal coal spot prices reached a low of US$80 per tonne in the third quarter of 2012 after peaking at US$130 per tonne in early 2011. The uranium spot price reached a low of US$42 per pound in October 2012, down US$10 from the same time in 2011.
Iron Ore
2013 sales revenue compared with 2012
Gross sales revenue for the Iron Ore group increased by seven per cent compared with 2012, attributable to record sales volumes in the Pilbara and marginally higher prices; and sales volumes increased by five per cent across the product group. In 2013, approximately 30 per cent of sales were priced with reference to a quarterly average index set at the prior quarter’s average lagged by one month. The remainder was sold via pricing mechanisms priced closer to the index price at the time of shipment, such as current quarter average, current month average or spot index prices. Index prices are adjusted for product characteristics and iron and moisture content.
2012 sales revenue compared with 2011
Gross sales revenue for the Iron Ore group decreased by 18 per cent in 2012 compared with 2011, reflecting lower iron ore prices partly offset by higher volumes. Sales increased quarter-on-quarter throughout 2012, resulting in record annual sales volumes despite significant volatility in the marketplace.
| | | | |
| | 50 riotinto.com/reportingcentre2013 | | |
Cash flow
2013 compared with 2012
A full consolidated statement of cash flows is contained in the financial statements.
Cash flows from operations, including dividends from equity accounted units, were US$20.1 billion, 22 per cent higher than 2012, reflecting the positive impact of higher volumes and the cost reduction initiatives. Tax payments in 2013 of US$3.7 billion were US$2.1 billion lower than in 2012. The stronger cash flows from operations and lower taxes drove net cash generated from operating activities 60 per cent higher to US$15.1 billion.
Purchase of property, plant and equipment and intangible assets (net of proceeds of sales of fixed assets) declined by US$4.6 billion or 26 per cent to US$12.9 billion in 2013. Five major capital projects were completed during the year: the Pilbara iron ore mines and infrastructure expansion to 290Mt/a in Western Australia, the Oyu Tolgoi copper-gold mine and concentrator in Mongolia, the Kestrel coking coal mine extension and expansion in Queensland, the Argyle diamond underground mine in Western Australia and the AP60 aluminium smelter in Quebec. Ongoing capital projects include the second phase expansion of the Pilbara iron ore infrastructure to 360Mt/a, due to come on stream at the end of the first half of 2015, and the modernisation of the Kitimat aluminium smelter in British Columbia, which is due to be complete in the first half of 2015 (subject to any additional capital required to complete the project receiving board approval).
Net proceeds from disposals of subsidiaries, joint ventures and associates totalled US$1.9 billion in 2013, primarily reflecting the sale of the Group’s interests in Northparkes, Constellium, Eagle and Altynalmas Gold. Additional cash inflows from disposals were reflected within Sales of financial assets and Dividends from equity accounted units. Total disposal proceeds in 2013 of US$2.5 billion are presented after adjusting for working capital and other items.
Dividends paid in 2013 of US$3.3 billion reflected the 15 per cent increase in the 2012 final dividend.
2012 compared with 2011
Cash flows from operations, including dividends from equity accounted units, were US$16.5 billion, 40 per cent lower than 2011, primarily as a consequence of lower prices.
Purchase of property, plant and equipment and intangible assets rose to US$17.6 billion, an increase of US$5.1 billion from 2011. This included the continued expansion of the Pilbara iron ore mines and infrastructure to 290Mt/a in Western Australia, the construction of the Oyu Tolgoi copper-gold mine and concentrator in Mongolia, the modernisation of the Kitimat aluminium smelter in British Columbia, the extension and expansion of the Kestrel coking coal mine in Queensland and the continued underground development of the Argyle diamond mine in Western Australia.
During 2012, the Group doubled its holding in RBM to 74 per cent through the acquisition of BHP Billiton’s entire interests for US$1.7 billion.
The Group received US$1.35 billion following completion of the agreement with Chalco to develop and operate the Simandou iron ore project in Guinea and US$0.9 billion from the Turquoise Hill Resources rights offering. These amounts have been recognised as proceeds from issue of equity to non-controlling interests in the cash flow statement.
Cash returns to shareholders totalled US$4.5 billion in 2012, comprising US$1.5 billion in share buy-backs with the completion of the Group’s US$7 billion share buy-back programme in March 2012, and dividends of US$3.0 billion.
Dividend payments were US$0.8 billion higher than in 2011, reflecting a 34 per cent increase in the 2011 total dividend.
Statement of financial position
Net debt decreased from US$19.2 billion to US$18.1 billion at 31 December 2013 as operating cash inflows and divestment proceeds fully offset the outflows relating to capital expenditure and the increase in the dividend. Net debt at
31 December 2013 was made up principally from adjusted total borrowings (as defined in note 24 to the financial statements) of US$28.3 billion, offset by US$10.2 billion in cash and cash equivalents. The proportion of net debt to total capital stood at 25 per cent at 31 December 2013, unchanged from the prior year.
Total borrowings at 31 December 2013 were US$28.5 billion. The weighted average cost of total borrowings was approximately four per cent and the weighted average maturity of total borrowings was around eight years with the maximum nominal amount maturing in any one calendar year currently US$3.2 billion. At 31 December 2013, approximately two-thirds of Rio Tinto’s adjusted total borrowings were at fixed interest rates. In 2013, Rio Tinto issued US$3.0 billion of fixed and floating rate bonds in US dollars. The offering comprised US$1.0 billion of three year and US$1.25 billion of 5.5 year fixed rate bonds at coupons of 1.375 per cent and 2.25 per cent respectively, and US$250 million two year and US$500 million three year floating rate bonds at coupons of three month US$ LIBOR plus 55 and 84 basis points respectively.
Total provisions have decreased by US$2.9 billion; this is primarily related to the impact of the strengthening US dollar, actuarial gains on pensions and other post-retirement obligations due to the impact of higher bond yields and significant positive returns on equities held in pension plans.
Financial instruments and risk management
The Group’s policies with regard to financial instruments and risk management are clearly defined and consistently applied. They are a fundamental part of the Group’s long-term strategy covering areas such as foreign exchange risk, interest rate risk, commodity price risk, credit risk, and liquidity risk and capital management. Further details of our Financial instruments and risk management are disclosed in note 30 “Financial instruments and risk management” to the financial statements.
The Group’s 2013 Annual report and financial statements show the full extent of its financial commitments, including debt. The risk factors to which the Group is subject are summarised on page 14 to 17. The effectiveness of internal control procedures continues to be a high priority in the Rio Tinto Group. The board’s statement on internal control is set out in the Risk management section.
Dividend
The 2013 interim dividend was 83.5 US cents (2012: 72.5 US cents) and the final dividend is determined as 108.5 US cents (2012: 94.5 US cents). Dividends paid on Rio Tinto plc and Rio Tinto Limited shares are equalised on a net cash basis; that is, without taking into account any associated tax credits. Dividends are determined in US dollars. Rio Tinto plc dividends are paid and declared in pounds sterling and Rio Tinto Limited dividends are declared and paid in Australian dollars, converted at exchange rates on 13 February 2014. Details relating to the dividend policy, determination and payment of dividends in sterling, Australian dollars and other currencies and on the payment of dividends to holders of American Depositary Receipts (ADRs) are included in the Shareholder information section.
Capital and liquidity risk management
The Group’s total capital is defined as equity attributable to owners of Rio Tinto plus equity attributable to non-controlling interests and net debt, as shown below:
Total capital
| | | | | | | | |
| | | 2013
US$m | | | Restated
2012
US$m | |
Equity attributable to owners of Rio Tinto | | | 45,886 | | | | 46,553 | |
Equity attributable to non-controlling interests | | | 7,616 | | | | 11,187 | |
Net debt (note 24) | | | 18,055 | | | | 19,192 | |
Total capital | | | 71,557 | | | | 76,932 | |
The Group’s major capital and evaluation projects are listed in the Capital allocation section on page 12.
| | | | |
| | 51 riotinto.com/reportingcentre2013 | | |
Additional financial information continued
We expect that contractual commitments for expenditure, together with other expenditure and liquidity requirements will be met from internal cash flow and, to the extent necessary, from the existing facilities described in note 30 “Financial instruments and risk management”, part (v) to the financial statements. This note also provides further details of our liquidity and capital risk management.
Treasury management and financial instruments
Details of our Treasury management and financial instruments are contained within the introductory paragraphs of note 30.
Foreign exchange
The following sensitivities give the estimated effect on underlying earnings assuming that each exchange rate moved in isolation. The relationship between currencies and commodity prices is a complex one and movements in exchange rates can cause movements in commodity prices and vice versa. Where the functional currency of an operation is that of a country for which production of commodities is an important feature of the economy, such as the Australian dollar, there is a certain degree of natural protection against cyclical fluctuations, in that the currency tends to be weak, reducing costs in US dollar terms when commodity prices are low, and vice versa.
Earnings sensitivities – exchange rates
| | | | | | | | |
| | | Average exchange rate for 2013 US cents | | | Effect on underlying earnings of 10% change in full year average +/- US$m | |
Australian dollar | | | 97 | | | | 563 | |
Canadian dollar | | | 97 | | | | 289 | |
Euro | | | 133 | | | | 22 | |
Chilean peso | | | US$1= 495 pesos | | | | 29 | |
New Zealand dollar | | | 82 | | | | 38 | |
South African rand | | | 10 | | | | 40 | |
UK sterling | | | 156 | | | | – | |
The exchange rate sensitivities quoted above include the effect on net operating costs of movements in exchange rates but exclude the effect of the revaluation of foreign currency financial assets and liabilities. They should therefore be used with caution. Further details of our exposure to foreign currency fluctuations and currency derivatives, and our approach to currency hedging, are contained within note 30 “Financial instruments and risk management”, part A(b)(i), to the financial statements.
Interest rates
Details of our exposure to interest rate fluctuations are contained within note 30 “Financial instruments and risk management” to the financial statements.
Commodity prices
The approximate effect on the Group’s underlying and net earnings of a ten per cent change from the full year average market price in 2013 for the following products would be:
Earnings sensitivities – commodity prices
| | | | | | | | | | | | |
| | | Unit | | | Average market price for 2013 US$ | | | Effect on underlying and net earnings of 10% change in full year average +/- US$m | |
Iron ore | | | | | | | | | | | | |
62% Fe fines FOB | | | dmt | | | | 126 | | | | 1,214 | |
Aluminium(a) | | | Tonne | | | | 1,845 | | | | 553 | |
Copper(a) | | | Pound | | | | 3.33 | | | | 221 | |
Gold | | | Ounce | | | | 1,410 | | | | 29 | |
| (a) | Excludes the impact of commodity derivatives. |
The sensitivities give the estimated impact on net earnings of changes in prices assuming that all other variables remain constant. These should be used with caution. As noted previously, the relationship between currencies and commodity prices is a complex one and changes in exchange rates can influence commodity prices and vice versa.
Further details of our exposure to commodity price fluctuations are contained within note 30 “Financial instruments and risk management” to the financial statements.
Credit risks
Details of our exposure to credit risks relating to receivables, financial instruments and cash deposits, are contained within note 30 “Financial instruments and risk management” to the financial statements.
Disposals and acquisitions
Information regarding disposals and acquisitions is provided in note 37 “Purchases and sales of subsidiaries, joint ventures, associates and other interests in businesses” to the financial statements.
Critical accounting policies and estimates
Many of the amounts included in the financial statements involve the use of judgment and/or estimates. These judgments and estimates are based on management’s best knowledge of the relevant facts and circumstances, having regard to previous experience, but actual results may differ from the amounts included in the financial statements.
Information about such judgments and estimation is contained under “Judgements in applying accounting policies and key sources of estimation uncertainty” in note 1 “Principal accounting policies” on page 119 of the financial statements.
Off balance sheet arrangements and contractual commitments
The table below presents information in relation to our material off balance sheet arrangements, and contractual commitments. Information regarding the Group’s pension commitments and funding arrangements is provided in note 45 “Post retirement benefits” to the financial statements. Information regarding the Group’s close-down and restoration obligations is provided in note 26 “Provisions including post retirement benefits” to the financial statements.
We expect that these contractual commitments for expenditure, together with other expenditure and liquidity requirements will be met from internal cash flow and, to the extent necessary, from the existing facilities.
| | | | | | | | | | | | | | | | | | | | |
| At 31 December 2013 | | < 1 yr
US$m | | | 1-3 yrs US$m | | | 3-5 yrs US$m | | | > 5 yrs US$m | | | Total US$m | |
| Expenditure commitments in relation to: | | | | | | | | | | | | | | | | | | | | |
| Operating leases | | | 439 | | | | 667 | | | | 540 | | | | 832 | | | | 2,478 | |
| Other (capital commitments) | | | 5,929 | | | | 1,153 | | | | 133 | | | | 31 | | | | 7,246 | |
| | | | 6,368 | | | | 1,820 | | | | 673 | | | | 863 | | | | 9,724 | |
| Long-term debt and other financial obligations: | | | | | | | | | | | | | | | | | | | | |
| Debt | | | 4,011 | | | | 4,770 | | | | 5,006 | | | | 14,684 | | | | 28,471 | |
| Interest payments | | | 1,007 | | | | 1,817 | | | | 1,661 | | | | 6,164 | | | | 10,649 | |
| Purchase obligations | | | 3,178 | | | | 4,636 | | | | 3,608 | | | | 14,359 | | | | 25,781 | |
| Other | | | 33 | | | | 69 | | | | (15 | ) | | | (76 | ) | | | 11 | |
| | | | 8,229 | | | | 11,292 | | | | 10,260 | | | | 35,131 | | | | 64,912 | |
| Total | | | 14,597 | | | | 13,112 | | | | 10,933 | | | | 35,994 | | | | 74,636 | |
| | | | |
| | 52 riotinto.com/reportingcentre2013 | | |
Board of directors
Key for committee memberships:
(A) Audit Committee
(R) Remuneration Committee
(N) Nominations Committee
(S) Sustainability Committee
(C) Chairman’s Committee
(I) Independent
Jan du Plessis (R, N and C)
Chairman, BCom, LLB, CA(SA), age 60
Appointment:Director of Rio Tinto since 2008. Jan was appointed chairman in 2009. He is the chairman of the Nominations Committee.
Skills and experience: Jan, a South African and British citizen, became group finance director of Compagnie Financière Richemont, the Swiss luxury goods group, in 1988. In 2004, he was appointed chairman of British American Tobacco plc, a position which he held until 2009.
External appointments (current and recent): Non-executive director and senior independent non-executive director of Marks and Spencer Group plc since 2008 and 2012 respectively, non-executive director of British American Tobacco plc from 1999 until 2009 and chairman of the board from 2004 until 2009, non-executive director and chairman of the audit committee of Lloyds Banking Group plc from 2005 and 2008 respectively, until 2009.
Sam Walsh AO (C)
Chief executive, BCom (Melbourne), age 64
Appointment: Director of Rio Tinto since 2009. He was appointed chief executive in January 2013.
Skills and experience: Sam, an Australian citizen, joined Rio Tinto in 1991, following 20 years in the automotive industry at General Motors and Nissan Australia. He has held a number of management positions during his career at Rio Tinto including chief executive of the Aluminium group from 2001 to 2004, chief executive of the Iron Ore group from 2004 to 2009 and chief executive, Iron Ore and Australia from 2009 to January 2013. Sam is a Fellow of the Australian Institute of Management, the Australasian Institute of Mining and Metallurgy, the Chartered Institute of Purchasing and Supply Management, the Australian Institute of Company Directors and the Australian Academy of Technical Science and Engineering. In 2010, he was appointed an Officer in the General Division of the Order of Australia.
External appointments (current and recent): Member of the Council of the International Council on Mining & Metals and a director of The International Council on Mining and Metals (UK) Limited since January 2013. Non-executive director of Seven West Media Limited from 2008 until January 2013.
Chris Lynch (C)
Chief financial officer, BCom, MBA, age 60
Appointment: Director of Rio Tinto since 2011 (non-executive) and chief financial officer since April 2013.
Skills and experience: Chris, an Australian citizen, has nearly 30 years’ experience in the mining and metals industry. He was chief executive officer of the Transurban Group, an international toll road developer and manager with interests in Australia and North America, until 2012. His career has included seven years at BHP Billiton, where he was chief financial officer and then executive director and group president – Carbon Steel Materials. Prior to this, Chris spent 20 years with Alcoa Inc. where he was vice-president and chief information officer based in Pittsburgh, and chief financial officer Alcoa Europe in Switzerland. He was also managing director of KAAL Australia Limited, a joint venture company formed by Alcoa and Kobe Steel.
External appointments (current and recent): Chief executive officer of the Transurban Group Limited from 2008 until 2012, commissioner of the Australian Football League from 2008 until March 2014.
Robert Brown (N, S and I)
Non-executive director, BSc, age 69
Appointment: Director of Rio Tinto since 2010.
Skills and experience: Bob is a Canadian citizen and contributes his considerable experience in large, high-profile Canadian companies. He is chairman of Aimia Inc., a customer loyalty management provider, and serves on the board of BCE Inc. (Bell Canada Enterprises), Canada’s largest communications company. He was previously president and chief executive officer of CAE Inc., a world leader in flight simulation and training. Before that he spent 16 years at Bombardier Inc., the aerospace and transportation company, where he was firstly head of the Aerospace Group and then president and chief executive officer. He has also served as chairman of Air Canada and of the Aerospace Industries Association of Canada. Bob was inducted to the Order of Canada as well as l’Ordre National du Québec. He has been awarded honorary doctorates from five Canadian universities.
External appointments (current and recent): Non-executive director and chairman of Aimia Inc. since 2005 and 2008 respectively, non-executive director of BCE Inc. and Bell Canada since 2009, non-executive director of Fier CPVC-Montreal L.P. since 2005, president and chief executive officer of CAE Inc. from 2004 until 2009, non-executive director of Ace Aviation Holdings Inc. from 2004 until 2009.
Vivienne Cox (N, S and I)
Non-executive director, MA (Oxon), MBA (INSEAD), age 54
Appointment: Director of Rio Tinto since 2005. Vivienne will retire at the conclusion of the Rio Tinto plc annual general meeting in 2014.
Skills and experience: Vivienne is a British citizen. She was executive vice president of Gas, Power and Renewables at BP and former chief executive of BP Alternative Energy. During her career at BP she served in a variety of positions ranging from supply and trading, to commercial, finance and exploration and renewable energy. Vivienne holds degrees in chemistry from Oxford University and in business administration from INSEAD.
External appointments (current and recent): Member of Kingfisher plc Net Positive Advisory Council since October 2013, non-executive director of BG Group plc since 2012, non-executive director and senior independent non-executive director of Pearson plc since 2012 and January 2013 respectively, non-executive director of the UK Department for International Development since 2010, non-executive director of The Climate Change Organisation since 2010, non-executive director and non-executive chairman of Climate Change Capital Limited from 2008 and 2009 respectively until 2012, member and chairman of the supervisory board of Vallourec, since 2010 and May 2013 respectively, member of the offshore advisory committee of Mainstream Renewable Power from 2010 until 2012, a member of the board of INSEAD business school from 2009 until December 2013.
| | | | |
| | 53 riotinto.com/reportingcentre2013 | | |
Board of directors continued
Michael Fitzpatrick (A, R, N and I)
Non-executive director, BEng, BA (Oxon), age 61
Appointment: Director of Rio Tinto since 2006.
Skills and experience: Michael, an Australian citizen, contributes wide-ranging investment and local knowledge of Australian business. He is chairman of Treasury Group Limited, a Sydney-based incubator of fund management companies, chairman of the Australian Football League and a former chairman of the Australian Sports Commission. After leaving professional football in 1983 and working for the Treasury of the State of Victoria and with investment banks in New York, Michael founded the pioneering infrastructure asset management company Hastings Funds Management Limited in 1994. He was a Rhodes Scholar in 1975.
External appointments (current and recent): Non-executive director of Carnegie Wave Energy Limited since 2012, chairman of Infrastructure Capital Group Limited since 2009, chairman of the Treasury Group Limited since 2005, commissioner and chairman of the Australian Football League since 2003 and 2007 respectively, director of the Walter & Eliza Hall Institute of Medical Research since 2001.
Ann Godbehere (A, N and I)
Non-executive director, FCGA, age 58
Appointment: Director of Rio Tinto and chairman of the Audit Committee since 2010.
Skills and experience: Ann, a Canadian and British citizen, has more than 25 years’ experience in the financial services industry. She spent ten years at Swiss Re, a global reinsurer, latterly as chief financial officer from 2003 until 2007. She was interim chief financial officer and executive director of Northern Rock bank after its nationalisation. Ann is a qualified accountant.
External appointments (current and recent): Non-executive director of British American Tobacco plc since 2011, non-executive director of UBS AG since 2009, non-executive director of Atrium Underwriting Group Limited and Arden Holdings Ltd since 2007, non-executive director and chairman of the audit committee of Prudential Public Limited Company since 2007 and 2009 respectively, chief financial officer and executive director of Northern Rock (Asset Management) plc from 2008 until 2009.
Richard Goodmanson (R, N, S and I)
Non-executive director, MBA, BEc and BCom, BEng (Civil), age 66
Appointment:Director of Rio Tinto since 2004 and chairman of the Sustainability Committee.
Skills and experience: Richard, a US citizen, was executive vice president and chief operating officer of DuPont until 2009. Prior to this he was president and chief executive officer of America West Airlines and senior vice president of operations for Frito-Lay, Inc., a North American division of PepsiCo. Richard has worked at senior levels for McKinsey & Co, where he led client service teams on major programmes of strategy development. He spent ten years in heavy civil engineering project management, principally in South East Asia, including the construction of the Hong Kong Subway System.
External appointments (current and recent): Non-executive director of Qantas Airways Limited since 2008, economic adviser to the governor of Guangdong Province, China from 2003 until 2009, executive vice president and chief operating officer of E.I. du Pont de Nemours and Company Limited from 1999 until 2009, director of the United Way of Delaware from 2002 until 2009.
Lord Kerr of Kinlochard (N, S and I)
Non-executive director, GCMG, MA (Oxon), age 72
Appointment: Director of Rio Tinto since 2003.
Skills and experience: John, a British citizen, was a member of the UK Diplomatic Service for 36 years and headed it from 1997 to 2002 as permanent under secretary at the Foreign Office. He previously served in HM Treasury and in the former Soviet Union and Pakistan, and was ambassador to the European Union and the US. He has been an Independent member of the House of Lords since 2004.
External appointments (current and recent): Advisory board member of Edinburgh Partners Limited since 2012, director and vice chairman of Scottish Power Limited since 2009 and 2012 respectively, chairman of the Centre for European Reform (London) since 2008, vice president of the European Policy Centre (Brussels) since 2007, trustee of the Carnegie Trust for the Universities of Scotland since 2005, director of The Scottish American Investment Company plc since 2002, deputy chairman of Royal Dutch Shell plc from 2005 until 2012, chairman of the Court and Council of Imperial College London from 2005 until 2011, advisory board member of BAE Systems from 2008 until 2011, advisory board member of Scottish Power (Iberdrola) from 2007 until 2009, trustee of the National Gallery in London from 2002 until 2010, trustee of the Rhodes Trust from 1997 until 2010, a Fulbright Commissioner from 2004 until 2009.
Hon. Paul Tellier (A, R, N and I)
Non-executive director, LLL, BLitt (Oxon), LL.D, C.C. age 74
Appointment: Director of Rio Tinto since 2007.
Skills and experience: Paul, a Canadian citizen, entered the civil service in the 1970s. He was clerk of the Privy Council Office and secretary to the Cabinet of the Government of Canada from 1985 to 1992. He became president and chief executive officer of the Canadian National Railway Company from 1992 to 2002. Until 2004, he was president and chief executive officer of Bombardier Inc., the aerospace and transportation company.
External appointments (current and recent): Chairman of Global Container Terminals Inc. since 2007, director of McCain Foods Limited since 1996, trustee of the International Accounting Standards Foundation from 2007 until 2012, co-chair of the Prime Minister of Canada’s Advisory Committee on the Renewal of the Public Service from 2006 until February 2014, strategic adviser to Société Générale (Canada) from 2005 until May 2013, member of the advisory board of General Motors of Canada since 2005, director of Bell Canada from 1996 until 2010, director of BCE Inc. (Bell Canada Enterprises) from 1999 until 2010.
John Varley (A, R, N and I)
Non-executive director, BA, MA (Oxon), age 57
Appointment: Director of Rio Tinto and chairman of the Remuneration Committee since 2011 and senior independent director since 2012.
Skills and experience: John, a British citizen, joined Barclays PLC in 1982 after working as a solicitor. He was chief executive of Barclays from 2004 until 2010. During a 28-year career with the bank he held several senior positions, including chairman of the Asset Management division, group finance director and deputy chief executive.
External appointments (current and recent): Director of Barclays PLC and Barclays Bank PLC from 1998 until 2010, non-executive director of BlackRock Inc. since 2009, non-executive director of AstraZeneca plc since 2006, chairman of Marie Curie Cancer Care since 2011 and chairman of Business Action on Homelessness since 2006.
| | | | |
| | 54 riotinto.com/reportingcentre2013 | | |
Directors who left the board
Tom Albanese
Chief executive, BS (Mineral Economics), MS (Mining Engineering), age 56
Appointment: Director of Rio Tinto from 2006 and chief executive from 2007 until January 2013.
Skills and experience: Tom, a US citizen, joined Rio Tinto in 1993 on Rio Tinto’s acquisition of Nerco Minerals, a US energy company, where he was chief operating officer. His first position with Rio Tinto was general manager of the Greens Creek mine in Alaska. He then held a series of management positions, including overseeing the integration of North Limited into Rio Tinto operations on North’s acquisition in 2000. He was appointed chief executive of the Industrial Minerals group in 2000, and chief executive of the Copper group and head of Exploration in 2004.
External appointments (current and recent): Director of the International Council on Mining and Metals from 2007 until 2013, member of the board of visitors, Duke University, Fuqua School of Business from 2009.
Guy Elliott
Senior executive director, MA (Oxon), MBA (INSEAD), age 58
Appointment: Director of Rio Tinto since 2002 and senior executive director since 2012. Guy retired from Rio Tinto at the end of 2013.
Skills and experience: Guy, a British citizen, was with Rio Tinto for more than 30 years. He joined the Group in 1980 in the uranium marketing division, having previously been in investment banking. He subsequently held a variety of commercial and management positions, including head of Business Evaluation and president of Rio Tinto Brasil. He was chief financial officer from 2002 to April 2013.
External appointments (current and recent): Non-executive director and senior independent director of SAB Miller plc since July 2013 and December 2013 respectively, non-executive director and chairman of the audit committee of Royal Dutch Shell plc since 2010 and 2011 respectively, a member of the Takeover Panel since 2012, non-executive director and senior independent director of Cadbury plc from 2007 and 2008 respectively until 2010.
Company secretaries
Eleanor Evans
LLB (Lond), age 47
Skills and experience: Eleanor joined the Group as company secretary of Rio Tinto plc and joint company secretary of Rio Tinto Limited in June 2013. Prior to joining Rio Tinto, Eleanor was general counsel and company secretary at AMEC plc and chief legal officer and company secretary at Cobham plc. In both roles Eleanor was responsible for legal, compliance and secretariat matters globally, was a member of the executive committee and the risk committee, and was secretary to the board of directors and their principal committees. Eleanor commenced her career as a solicitor specialising in corporate and financial law with Norton Rose Fulbright and in her earlier career held senior legal roles at The BOC Group plc and Corus Group plc.
External appointments (current and recent): Eleanor is a member of the executive committee of GC100, the Association of General Counsel and Company Secretaries of the FTSE 100, and is a trustee of the StepChange Foundation UK, a charity.
Tim Paine
BEc, LLB, age 50
Skills and experience: Tim joined the Group as joint company secretary of Rio Tinto Limited in December 2012. He has over 20 years’ experience in corporate counsel and company secretary roles, including at ANZ Bank, Mayne Group, Symbion Health and Skilled Group. Tim commenced his career as a solicitor in private practice and has also managed his own consulting company.
External appointments (current and recent): He has no external appointments.
| | | | |
| | 55 riotinto.com/reportingcentre2013 | | |
Executive committee
Hugo Bague
MA (Linguistics), age 53
Hugo Bague was appointed Group executive, Organisational Resources in 2013 after joining Rio Tinto as global head of Human Resources in 2007. Previously he worked for Hewlett-Packard where he was the global vice president, Human Resources for the Technology Solutions Group, based in the US. Prior to this he worked for Compaq Computers, Nortel Networks and Abbott Laboratories based in Switzerland, France and Germany.
He has been a non-executive director and member of the nominating and governance committee, and the compensation committee of Jones Lang LaSalle Incorporated, a global real estate services firm, since 2011.
Jacynthe Côté
BChem, age 55
Jacynthe became chief executive, Rio Tinto Alcan in 2009. She joined Alcan in 1988 and has significant operational and international experience in the aluminium industry. She was president and chief executive officer, Primary Metal, Rio Tinto Alcan, where she was responsible for all primary metal facilities and power generation installations worldwide. Her previous roles in Alcan include president and chief executive officer, Bauxite & Alumina business unit and senior management roles in business planning, human resources and environment, health and safety. Jacynthe has a degree in chemistry from Laval University in Québec and was awarded an honorary doctorate from Université du Québec à Chicoutimi in 2011.
Jacynthe has been a member of the Advisory Board of the Montreal Neurological Institute since 2010, member of the Hautes Études Commerciales Board since 2009, member of the Canadian Council of Chief Executives since 2009, and a member of the International Aluminium Institute since 2009.
Alan Davies
BBus (Acctcy) LLB, LLM, FCA, age 43
Alan was appointed chief executive, Diamonds & Minerals in 2012. He joined the Group in 1997 and has held management positions in Australia, London and the US for the Iron Ore and Energy businesses. Prior to his current role, Alan was president, international operations for Rio Tinto’s Iron Ore business with global accountability for operations and projects in Canada, India and Guinea. Alan is a Fellow of the Institute of Chartered Accountants in Australia.
He was a director of the Art Gallery of Western Australia from 2010 to 2011.
Andrew Harding
BEng (Mining Engineering), MBA, age 47
Andrew Harding was appointed chief executive, Iron Ore in February 2013. Prior to his current role, Andrew spent three years as chief executive, Copper, where he was responsible for a range of mines and projects including the development of the world-class Oyu Tolgoi copper-gold mine in Mongolia. Andrew joined Rio Tinto in 1992 and spent seven years in Rio Tinto Iron Ore. He has also held a range of positions in Technology & Innovation, Energy and Aluminium and was president and chief executive officer of Kennecott Utah Copper.
He was a director of Turquoise Hill Resources Ltd between 2009 and 2010 and between 2011 and February 2013.
Jean-Sébastien Jacques
MSc, age 42
Jean-Sébastien was appointed chief executive, Copper in February 2013. He joined Rio Tinto in 2011 as president, International Operations – Copper, where he led a senior team and oversaw Rio Tinto’s interests in the Palabora Mining Company in South Africa, Northparkes Mines in Australia, Kennecott Eagle Minerals, the Pebble Mine in the US and Sulawesi in Indonesia. Prior to joining Rio Tinto, Jean-Sébastien spent more than 15 years working across Europe, South East Asia, India and the US in operational and strategy roles in the aluminium, bauxite and steel industries. He served as group director, Strategy and was on the executive committee at Tata Steel Group from 2007 to 2011.
Jean-Sébastien was appointed vice chairman of the International Copper Association in October 2013. He was a director of Turquoise Hill Resources Ltd from February to September 2013, a director of Bougainville Copper Limited from 2012 until April 2013, and a director of Palabora Mining Company Limited from 2011 until July 2013.
Harry Kenyon-Slaney
BSc (Hons) (Geology), age 53
Harry was appointed chief executive, Energy in 2012. He joined the Group in 1990 from Anglo American Corporation and has held management positions in South Africa, Australia and the UK. Harry spent his early career at Rio Tinto in marketing and operational roles in the uranium, copper and industrial minerals businesses. In 2004, he was appointed chief executive of Energy Resources of Australia and in 2007, managing director of Rio Tinto Iron & Titanium. Prior to his current role, he was chief executive of Rio Tinto’s Diamonds & Minerals product group.
Harry has been a director of the World Coal Association since 2012 and became a director of the Coal industry Advisory Board to the IEA in March 2013.
Greg Lilleyman
BEng (Construction), age 47
Greg was appointed Group executive, Technology & Innovation in January 2014. He joined the Group in 1990 and held a number of operational roles across the Pilbara, Hunter Valley and Canada with both the Iron Ore and Energy businesses. In 2011 Greg was appointed president, Pilbara Operations for Rio Tinto Iron Ore and in August 2013 assumed the role of head of productivity improvement with Technology & Innovation.
Greg was a board member of the Australian Institute of Management of Western Australia between 2012 and May 2013, a board member of the Energy & Minerals Institute between 2011 and May 2013, and a director of the Chamber of Minerals and Energy of Western Australia between 2008 and May 2013, holding the position of president between 2011 and May 2013. Since 2012 he has been a board member of the Curtin University Foundation.
Debra Valentine
BA (History), JD, age 60
Debra was appointed Group executive, Legal, External & Regulatory Affairs in 2009 having joined Rio Tinto as global head of Legal in 2008. She previously worked at United Technologies Corporation in the US where she was vice president, deputy general counsel and corporate secretary. Before then, she was a partner with the law firm O’Melveny & Myers, in Washington D.C. Debra served as general counsel at the US Federal Trade Commission from 1997 to 2001.
She has been a member of the US-based Council on Foreign Relations since 1993, and the American Law Institute since 1991. She is on the board of the Extractive Industries Transparency Initiative and the North America Advisory Council at Chatham House.
Executive director members
Sam Walsh and Chris Lynch were also members of the Executive Committee in 2013 through their positions as chief executive and chief financial officer respectively. Guy Elliott was a member through his position as chief financial officer until April 2013. Tom Albanese was a member through his position as chief executive until January 2013. Their biographies are shown on pages 53 and 55.
| | | | |
| | 56 riotinto.com/reportingcentre2013 | | |
Corporate governance
Rio Tinto takes a unified approach to corporate governance to comply with the regulatory obligations associated with its three principal stock exchange listings in the UK, Australia and the US.
Statement of compliance with governance codes and standards in 2013
In compiling this report, the directors have referred to the September 2012 edition of the UK Corporate Governance Code (the Code), the ASX Corporate Governance Council’s Corporate Governance Principles and Recommendations (2nd edition with 2010 amendments) (the ASX Principles), and the New York Stock Exchange (NYSE) Corporate Governance Standards (the NYSE Standards).
Throughout 2013, and at the date of this report, the Group applied the principles of, and was compliant with the provisions of, the ASX Principles and with the Code.
Rio Tinto plc, as a foreign issuer with American Depositary Shares listed on the NYSE, is obliged by the NYSE Standards to disclose any significant ways in which its practices of corporate governance differ from the NYSE Standards.
The Company has reviewed the NYSE Standards and believes that its practices are broadly consistent with them, with the following exceptions where the strict requirements of the NYSE Standards are not met.
The NYSE Standards state that companies must have a nominating/corporate governance committee composed entirely of independent directors which, in addition to identifying individuals qualified to become board members, develops and recommends to the board a set of corporate governance principles applicable to the company. Rio Tinto has a Nominations Committee, information about which is set out on page 63. This committee does not develop corporate governance principles for the board’s approval. The board itself performs this task.
Under US securities law and the NYSE Standards, the company is required to have an audit committee that is directly responsible for the appointment, compensation, retention and oversight of the work of external auditors. While the Rio Tinto Audit Committee makes recommendations to the board on these matters, the ultimate responsibility for the appointment of the external auditors rests with the shareholders.
A discussion of the Group’s position on audit tenders is set out on page 62 of this report.
Further information about the corporate governance framework is available in the “Corporate governance” section of Rio Tinto’s website.
The board
Rio Tinto plc and Rio Tinto Limited have a common board of directors. The directors are responsible for the success of the Group and, through the independent oversight of management, are accountable to shareholders for the performance of the business.
Role and responsibilities
The principal role of the board is to set the Group’s strategy and to review regularly its strategic direction. In doing this, the board also has responsibility for corporate governance.
A formal schedule of matters reserved by the board has been established by the directors. This covers areas such as the Group’s strategy, major investments, acquisitions and divestments and oversight of risk. It is available on the website.
Responsibility for day-to-day management of the business is delegated to the chief executive and the Executive Committee. In turn, authorities are also delegated to individual members of the Executive Committee.
As part of the annual financial planning process, the board sets annual performance targets, which include personal and business performance measures, under the Group’s short-term incentive plan (detailed on page 81) for the chief executive. These performance targets are determined by the Remuneration Committee on behalf of the board. The chief executive establishes targets for the Executive Committee. Those objectives are cascaded throughout management teams.
Further details of the performance evaluation of the executive directors and other senior executives are discussed in the Implementation Report section of the Remuneration Report on page 80.
Board balance and independence
Board composition
The names, skills and experience of each director together with their terms in office are shown in the biographical details on pages 53 to 54. Details of changes to the board during 2013 and in the year to date are set out in the Directors’ report on page 44.
Director independence
The tests of independence of a non-executive director vary between the jurisdictions where Rio Tinto has listings. The board has adopted a formal policy for the determination of the independence of its non-executive directors which is available on the Group’s website.
Among the key criteria of the independence policy are independence from management and the absence of any business relationship which could materially interfere with the director’s independence of judgment and ability to provide a strong, valuable contribution to the board’s deliberations, or which could interfere with the director’s ability to act in the best interests of the Group. Where contracts in the ordinary course of business exist between Rio Tinto and a company in which a director has declared an interest, these are reviewed for materiality both to the Group, and the other party to the contract. “Material” is defined in the policy as being where the relationship accounts for more than two per cent of either party’s consolidated gross revenue per annum, although the test also takes other circumstances into account. The Code includes criteria to assess independence where a director has served on the board for more than nine years from the date of their first election.
The chairman was considered independent upon his appointment under the Code, and in the board’s view he continues to satisfy the tests for independence under the ASX Principles and the NYSE Standards.
Applying the criteria of the independence policy, the board is satisfied that all of its non-executive directors are and remain independent.

| | | | |
| | 57 riotinto.com/reportingcentre2013 | | |
Corporate governance continued
Lord Kerr, Richard Goodmanson and Vivienne Cox have been non-executive directors since 2003, 2004 and 2005 respectively. Lord Kerr and Richard Goodmanson have both agreed to stand for re-election to the boards at the annual general meetings in 2014. The board considers that Lord Kerr and Richard Goodmanson will provide continuity to the board, given their significant knowledge of the business and has confirmed that they both continue to satisfy the tests for independence in carrying out their respective roles. Vivienne Cox is not seeking re-election at the annual general meetings.
Executive directors’ other directorships
Executive directors may be invited to become non-executive directors of other companies. The Nominations Committee, on behalf of the board, operates a procedure under which approval may be given to accept such invitations, recognising the benefit to be derived to the individual and to Rio Tinto from such appointments.
Election and re-election
The directors may appoint additional members to join the board during the year. Directors appointed in this way will be subject to election by shareholders at the first annual general meetings after their appointment. In subsequent years, the directors are expected to submit themselves for re-election at the annual general meetings each year.
Non-executive directors are normally expected to serve at least six years and would not normally serve more than nine years.
Lord Kerr and Richard Goodmanson have been non-executive directors since 2003 and 2004 respectively, and have therefore already served for ten and nine years respectively. For the reasons noted above, both offer themselves for re-election in 2014.
On 5 March 2014, Rio Tinto announced the appointments of Anne Lauvergeon and Simon Thompson effective 15 March and 1 April respectively. Both will offer themselves for election at the annual general meetings in 2014 and further details about them are set out in the notices of annual general meetings.
Governance processes
In 2013, there were nine scheduled board meetings and two board meetings convened and held at short notice. Details of the directors’ attendance at all of the board and committee meetings held in 2013 are set out on the following page.
The board has regular discussions with senior management on the Group’s strategy. These discussions typically include presentations given by senior management during the year. The board attends an annual two-day strategy meeting with the Executive Committee, which includes broader, detailed review sessions on the Group’s strategic direction. The outputs from this event help underpin the board’s annual financial planning exercise and provide strategic direction and focus to the Executive Committee.
Directors receive timely, regular and appropriate information to enable them to fulfil their duties. They also have direct access to the advice and services of the company secretary
of Rio Tinto plc and the joint company secretaries of Rio Tinto Limited. The directors are also able to obtain independent professional advice at the Group’s expense.
The chairman and non-executive directors meet, at the start of each board meeting, without the executive directors, to create an opportunity for non-executive directors to raise any issues in private session.
In addition, the directors are in regular informal communication with members of the Executive Committee and other members of senior management. This helps to foster an open and regular exchange of knowledge and experience.
All new non-executive directors undertake a full, formal and tailored induction on joining the board. The board is provided with training and development opportunities during the year. The directors are also encouraged to participate in site visits to the Group’s operations around the world and to meet with employees and, from time to time, shareholders and other key stakeholders. In 2013, the board visited our copper mine in Utah, US and our iron ore operations in the Pilbara, Western Australia. These events are arranged by the company secretary on behalf of the chairman, and seek to ensure directors have appropriate knowledge of the company and access to its operations and staff.
Progress against our priorities
The progress made towards achieving the priorities set by the board during 2013 are set out on page 8.
Annual performance evaluation
An annual exercise is undertaken to evaluate the effectiveness of the board, board committees and individual directors.
For 2013, the board and committee (audit, nominations, remuneration and sustainability) evaluation process was conducted by the company secretary of Rio Tinto plc.
The process involved a review of the findings of the externally-facilitated 2012 evaluations of the board and its committees and interviews conducted with directors seeking their views with regard to progress on the actions arising and generally upon the performance of the board and its committees in 2013.
The findings from the evaluation reports for the board and its committees were discussed with the chairman and the chairmen of the committees ahead of a full review at the February 2014 meetings of the board and its committees.
Actions for 2014 were agreed at those meetings.
The non-executive directors, led by the senior independent director, were responsible for the performance evaluation of the chairman. Non-executive directors met to give their views and the senior independent director also sought the views of the executive directors. The senior independent director gave feedback on the chairman’s performance to him in January.
The chairman continues to be responsible for the assessment of each individual director’s performance and contribution.
| | | | |
| | 58 riotinto.com/reportingcentre2013 | | |
Directors’ membership of, and attendance at, board and committee meetings during 2013
| | | | | | | | | | | | | | | | | | | | | | | | | | | | |
| | |
| Board
scheduled |
(e) | |
| Board
short notice |
(e) | |
| Audit
Committee |
(e) | |
| Remuneration
Committee |
(e) | |
| Sustainability
Committee |
(e) | |
| Nominations
Committee |
(e) | |
| Chairman’s
Committee |
(e) |
Jan du Plessis | | | 9/9 | | | | 2/2 | | | | – | | | | 8/8 | | | | – | | | | 8/8 | | | | 18/18 | |
Tom Albanese(a) | | | – | | | | 1/1 | | | | – | | | | – | | | | – | | | | – | | | | – | |
Guy Elliott(b) | | | 9/9 | | | | 2/2 | | | | – | | | | – | | | | – | | | | – | | | | 6/7 | |
Chris Lynch(c) | | | 9/9 | | | | 2/2 | | | | 2/2 | | | | – | | | | – | | | | 1/1 | | | | 13/14 | |
Sam Walsh(d) | | | 9/9 | | | | 2/2 | | | | – | | | | – | | | | – | | | | – | | | | 18/18 | |
Robert Brown | | | 8/9 | | | | 2/2 | | | | – | | | | – | | | | 5/5 | | | | 8/8 | | | | – | |
Vivienne Cox | | | 8/9 | | | | 2/2 | | | | – | | | | – | | | | 5/5 | | | | 7/8 | | | | – | |
Michael Fitzpatrick | | | 9/9 | | | | 2/2 | | | | 7/7 | | | | 7/8 | (f) | | | – | | | | 8/8 | | | | – | |
Ann Godbehere | | | 9/9 | | | | 2/2 | | | | 7/7 | | | | – | | | | – | | | | 8/8 | | | | – | |
Richard Goodmanson | | | 9/9 | | | | 2/2 | | | | – | | | | 8/8 | | | | 5/5 | | | | 8/8 | | | | – | |
Lord Kerr | | | 9/9 | | | | 2/2 | | | | 3/3 | | | | – | | | | 5/5 | | | | 8/8 | | | | – | |
Paul Tellier | | | 8/9 | | | | 2/2 | | | | 7/7 | | | | 8/8 | | | | – | | | | 8/8 | | | | – | |
John Varley | | | 9/9 | | | | 2/2 | | | | 4/4 | | | | 8/8 | | | | – | | | | 8/8 | | | | – | |
| (a) | Stood down from the board on 17 January 2013. |
| (b) | Resigned from Chairman’s Committee with effect from 18 April 2013 and retired from the board with effect from 31 December 2013. |
| (c) | Appointed chief financial officer-designate on 1 March 2013, at which time Chris Lynch resigned from the Audit Committee and joined the Chairman’s Committee. |
| (d) | Appointed chief executive on 17 January 2013. |
| (e) | Number of meetings attended/maximum the director could have attended. |
| (f) | The meeting missed was called on short notice for 15 January 2013. |
| | | | |
| | 59 riotinto.com/reportingcentre2013 | | |
Corporate governance continued
Governance structure
The board has established sub-committees which are responsible for audit, remuneration, sustainability and nominations issues. In addition, a Chairman’s Committee operates under delegated authority between scheduled board meetings. These committees support the board in ensuring that high standards of corporate governance are maintained across the Group.
The committees are governed by terms of reference, set and approved by the board, which are reviewed annually. The terms of reference of the audit, nominations, remuneration and sustainability committees (revised versions of which were issued in February 2014) can be viewed in the “Corporate governance” section of the website.
The chief executive is assisted by the key management committees noted below in monitoring performance and delivering Rio Tinto’s strategy.
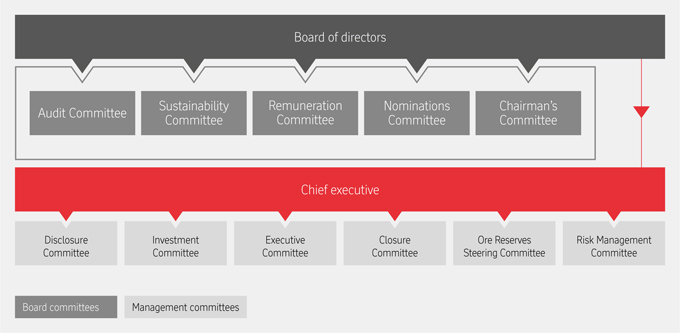
| | | | |
| | 60 riotinto.com/reportingcentre2013 | | |
Board committees
Audit Committee
Members of the Committee are Ann Godbehere (chairman), Michael Fitzpatrick, Paul Tellier and John Varley. Chris Lynch was appointed to the Committee on 1 June 2012 and stood down upon his appointment as chief financial officer-designate on 1 March 2013. Lord Kerr stood down from the Committee at the conclusion of its meeting on 4 March 2013. John Varley was appointed to the Committee on 19 March 2013.
Key responsibilities
The objective of the Audit Committee is to assist the board to monitor decisions and processes designed to ensure the integrity of financial reporting, sound systems of internal control and risk management.
The Committee’s terms of reference set out its main responsibilities. The Committee is responsible for:
| – | Internal control, including internal control over financial reporting; |
| – | Group Audit & Assurance (including internal audit); |
| – | Risk management system effectiveness; |
| – | The integrity and compliance programme including the Group’sSpeak–OUT whistleblowing programme. |
In carrying out its responsibilities, the Committee has full authority to investigate all matters that fall within its terms of reference. Accordingly, the Committee may:
| – | obtain independent professional advice in the satisfaction of its duties at the cost of the Group; and |
| – | have direct access to the resources of the Group as it may reasonably require including the external and internal auditors. |
Financial reporting
During 2013 the Committee considered, among others, the following matters which it considered to be significant in relation to the 2013 financial statements:
| – | Impairments in the 2012 accounts and continued monitoring of management’s determination of cash-generating units, review of impairment triggers and consideration of potential impairment charges and reversals over the course of the year. |
| – | Management’s key accounting judgments and policies, and the application of these in the accounts, including: |
| | – | the adoption of new and revised accounting standards (including IFRIC 20, IFRS 10, IFRS 11 and IAS 19R) that became effective in 2013 and required prior period restatements; and |
| | – | accounting for the slide at the Bingham Canyon copper mine. |
To date in 2014 the Committee has considered, among others, the following matters which it considered to be significant in relation to the 2013 financial statements:
| – | Impairments in the 2013 accounts. |
| – | Management’s key accounting judgments and policies, and the application of these in the accounts, including: |
| | – | reviewing the justifications for exclusion of certain items from underlying earnings; |
| | – | reviewing the impact of new standards (including IFRS 12 and IFRS 13) which have required additional disclosure in these financial statements; |
| | – | reviewing the Group’s tax exposure and the appropriateness of provisions for uncertain tax positions; and |
| | – | reviewing the accounting treatment of the significant divestments announced in 2013, including contractual obligations for product sales and funding of closure activities which remain with the Group following completion of the divestments. |
Key judgments considered
In preparing the financial statements, a number of subjective judgments and estimates are required involving assumptions and consideration of future events that are inherently uncertain. The Committee focused its work on assessing management’s ongoing judgments and estimates against available evidence, and evaluating the disclosures in the financial statements. The Committee also considered the external auditors’ views on these matters.
Of the judgments and key sources of estimation uncertainty listed as critical accounting policies and estimates in note 1 to the financial statements, the following areas received specific focus from the Committee over the year:
| – | Impairment review of asset carrying values |
| | – | The Committee focused on the assessment of the carrying value and annual impairment reviews of goodwill (Rio Tinto Alcan, Rio Tinto Coal Mozambique and Oyu Tolgoi), indefinite lived intangible assets (Rio Tinto Alcan) and property, plant & equipment (particularly Rio Tinto Alcan, Rio Tinto Coal Mozambique and Oyu Tolgoi) because they involve complex judgments about the expected future performance of the business. |
| | – | The assumptions on discount rate, long-term pricing, risk factors for future growth projects amongst others were considered and challenged. |
| | – | For Rio Tinto Alcan, and in addition to the testing of individual cash generating units the Committee considered the combined carrying value of the product group and how it had been assessed against external market data, including comparables and broker reports. |
| | – | Infrastructure assumptions were a key consideration for the Rio Tinto Coal Mozambique impairment testing and the Committee considered these closely. |
| | – | For Oyu Tolgoi, the timing of the underground development was an important factor in determining impairment, and the Committee reviewed and challenged the likely timing in light of the progress of discussions with the Government of Mongolia. |
| – | Close-down, restoration and environmental obligations |
| | – | The Committee focused on the estimates of risk free discount rates in light of the ongoing impact of fiscal interventions. It also focused on the probability weighting, where appropriate, of the different remediation or closure outcomes which could realistically arise when assessing the adequacy of the provisioning for these obligations. Both involve complex judgments. |
| – | Recoverability of potential deferred tax assets |
| | – | The Committee focused on the appropriateness of continued recognition of deferred tax assets, particularly those related the Mineral Resources Rent Tax starting base allowance in Australia and tax losses in France, recovery of which are restricted by legislation |
In addition, the Committee critically assessed the future projections of cash flow under different future scenarios and compared this to cash balances and committed facilities available so the Committee could recommend to the board that the adoption by the Group of the going concern basis of preparation was appropriate.
Governance processes
The Committee met seven times in 2013. The chairman of the board, chief financial officer, other senior management and external and internal auditors regularly attended its meetings. The Committee carries out its business following an agreed annual cycle of meetings and topics for consideration.
The members of the Committee are independent and free of any relationship that would affect their impartiality in carrying out their responsibilities. The members meet the independence requirements of the Code, the ASX Principles and the NYSE Standards. The Committee meets the composition, operation and responsibility requirements of the ASX Principles.
The Committee is also bound by SEC requirements for audit committees’ financial experts and the Code and ASX Principles requirement that at least one committee member should have recent and relevant financial qualifications and
| | | | |
| | 61 riotinto.com/reportingcentre2013 | | |
Corporate governance continued
experience. Ann Godbehere, chairman of the Committee, is considered by the board to have recent and relevant financial experience, and financial qualifications, and has been designated the Committee’s financial expert. All other members of the Committee are, in the opinion of the Committee, deemed to be financially literate by virtue of their business experience.
The Committee applies policies for the pre-approval of permitted services provided by the Group’s external auditors PwC. All of the engagements for services provided by PwC were either within the pre-approval policies or approved by the Committee. The Committee members are satisfied that the provision of non-audit services by PwC in accordance with this procedure is compatible with the general standard of independence for auditors imposed by relevant regulations, including Australian, UK and US legislation.
The Committee considered reports from PwC and Group Audit & Assurance on the activities undertaken in reviewing and auditing the control environment in order to assess the quality and effectiveness of the internal control system. This included an evaluation of the effectiveness of the Group’s internal controls over financial reporting and the Group’s disclosure controls and procedures in accordance with sections 404 and 302 of the Sarbanes-Oxley Act 2002.
The external auditors attended all seven Committee meetings during the year. In advance of the Committee meetings, the audit partners brief the chairman on key matters. Private sessions are routinely held between PwC and the Committee without management present to discuss the status of the audit and nature of interaction with management.
During the year, the Committee reviewed the effectiveness of PwC for Group audit and local statutory audit work. The evaluation, managed by the Group’s financial controllers, took the form of a survey comprising a range of questions covering objectivity, quality, and efficiency, and was completed by individual Rio Tinto business units and members of the Audit Committee. The results of this survey and review were assessed by the Committee which concluded that PwC continued to provide a high-quality audit and an effective and independent challenge to management. The Committee was satisfied with the external audit process and that the independence of the external auditors was in no way compromised.
PwC have been the external auditors since the formation of the dual listed companies (DLC) structure in 1995, and acted as external auditors to a number of the company’s legacy entities prior to the formation of the DLC. Since 2002, PwC have followed the requirements of the Sarbanes-Oxley Act 2002 and APB Ethical Standards and rotated both the lead UK and Australian audit partners at least every five years. This continued refreshing of the team brings new perspectives to the audit and promotes healthy debate between auditors and management as well as the Committee. The current UK audit engagement partner, Richard Hughes, was appointed for the 2011 year-end and therefore 2015 will be his last year of involvement before transition to a new engagement partner. The Australian audit engagement partner, Paul Bendall, was appointed for the 2012 year-end and therefore 2016 will be his last year of involvement before transition to a new engagement partner.
The Committee continues to be satisfied both with the quality and effectiveness of the external audit process and with PwC’s independence. The Committee also continues to monitor the recent developments on audit market reform, including proposed mandatory audit firm rotation in Europe and proposed audit tendering from the Competition Commission in the UK. The provisional agreement that was reached between the European institutions in December 2013 is likely (when the European legislative processes have been completed, and subject to agreement by the UK regulators) to require mandatory rotation of audit firms every ten years unless there is a tender process after ten years, in which case the audit firm must be replaced after 20 years at the latest.
The Committee intends to review the position once the transitional arrangements under the different regimes have been clarified (which is expected to occur later this year) and will determine when it expects to oversee an orderly tender process in due course. PwC will thus remain in office and a resolution to reappoint them for the 2014 audit will therefore be proposed at the annual general meetings in 2014.
Further information on fees paid to PwC in 2013 for audit and non-audit services are set out on page 46 of the Directors’ report.
The Committee meets privately with the Head of Group Audit & Assurance from time to time without management present and the chairman of the Committee has regular discussions with him.
Other
In 2013 the Committee also:
| – | Conducted an ongoing review and monitoring of the Group’s control environment and risk management processes and effectiveness, including: |
| | – | a review of Group Audit & Assurance findings and approval of Internal Audit Plan and associated resources for 2014 |
| | – | monitoring of Internal Control over Financial Reporting (SOx) testing results |
| | – | review of reports at the half year and towards the end of the year from the Head of Group Compliance |
| | – | monitoring of Risk Management activities and the effectiveness of the Group’s risk management system |
| | – | monitoring Legal and Tax disputes |
| | – | monitoring Closure provisioning and Ore Reserves reporting. |
| – | Underwent training and development on accounting and governance topics, with a dedicated session on IFRIC interpretation 20 – Stripping Costs in the Production Phase of a Surface Mine. |
| – | Considered the requirements for the Annual report and accounts, taken as a whole to be fair, balanced and understandable and put in place processes to seek to ensure they are. |
| – | Reviewed the controls and processes in place over reporting of cost savings achieved under the Group’s cost reduction programme. |
| – | Considered the findings from the 2012 external evaluation of the Committee’s performance and implemented the recommendations. |
| – | Conducted ongoing monitoring of non-statutory audit activities performed by the Group’s external auditors and approval of their audit engagement contracts and remuneration. |
| – | Considered proposals from various regulators (including the Financial Reporting Council and Competition Commission) on Auditor Independence and the Audit Committee’s responsibilities in this regard. |
In the first part of 2014, the Committee:
| – | Evaluated, at the request of the board, the Annual report and accounts 2013, to assess whether they are, taken as a whole, fair, balanced and understandable. |
| – | Considered findings from the 2013 evaluation of the Committee’s performance and agreed the actions arising. |
During the remainder of 2014 the Committee will follow its annual schedule of meetings and topics for discussion and will report on the same in 2015.
Sustainability Committee
Members of the Committee are Richard Goodmanson (chairman), Robert Brown, Vivienne Cox, and Lord Kerr.
Key responsibilities
The Committee assists the board with overseeing strategies designed to manage social and environmental risks, overseeing management processes and standards and achieving compliance with social and environmental responsibilities and commitments. The Committee reviews the effectiveness of management policies and procedures relating to safety, health, employment practices, relationships with neighbouring communities, environment, human rights, land access, political involvement and sustainable development.
| | | | |
| | 62 riotinto.com/reportingcentre2013 | | |
Governance processes
In 2013, the Committee met five times. The chairman of the board, chief executive, and other senior management regularly attend its meetings. The Committee carries out its business following an agreed annual cycle of meetings and topics for consideration.
The members of the Committee are all independent in accordance with the independence policy adopted by the board.
2013 activities
In 2012 we said that the Committee would:
| – | Review key risks associated with mine closures and legacy matters, communities and social performance and energy, environment and climate change and management’s plans for tackling them; |
| – | Review work plans formulated for health, safety, environment, communities and employment practices; |
| – | Undertake “deep dives” around major risk areas, including through site visits. |
The Committee did all of the above and in particular visited the site of the Manefay slide at Bingham Canyon Utah in September.
We draw to your attention the Sustainable development report on pages 18 to 24 of this report.
Remuneration Committee
Members of the Committee are John Varley (chairman), Jan du Plessis, Michael Fitzpatrick, Richard Goodmanson and Paul Tellier.
Key responsibilities
The Remuneration Committee assists the board with fulfilling its oversight responsibility to shareholders. In particular, the Committee seeks to spend compensation resource fairly and responsibly to ensure that remuneration policy and practices are properly linked to corporate and individual performance and to the delivery of the Group’s strategy on behalf of our owners.
The report of the Remuneration Committee on pages 68 to 108 has been recommended by the Committee for approval by the board, and was approved by the board on 5 March 2014. On page 79 we have included sections dealing with the responsibilities of the Remuneration Committee and how it spent its time in 2013.
Governance processes
The Committee met eight times in 2013. The Committee carries out its business following an agreed annual cycle of meetings and topics for consideration.
In addition to the matters noted on page 79, the Committee considered the findings from the 2012 external evaluation of the Committee’s performance and implemented the recommendations. In early 2014, the Committee considered the findings from the 2013 evaluation of the Committee’s performance and agreed the actions arising.
As set out in the Committee chairman’s annual statement on pages 68 to 69, we are committed to a continuing dialogue with our owners.
Chairman’s Committee
Members of the Committee are Jan du Plessis (chairman), Sam Walsh and Chris Lynch.
Key responsibilities
The Committee acts on behalf of the board between scheduled board meetings either in accordance with authority delegated by the board or as specifically set out within its terms of reference. It supports the functioning of the board and ensures that the business of the board and its committees is properly planned and aligned with management. When mandated by the board, the Chairman’s Committee will consider urgent matters between board meetings, and deals with the implementation of board decisions on transactions and other corporate matters. Other than for the chairman of the board, the Committee performs the annual review of non-executive directors’ fees and makes a recommendation to the board.
Nominations Committee
Members of the Committee comprise Jan du Plessis (chairman) and all non-executive directors.
Key responsibilities
The Committee is responsible, on behalf of the board, for regularly assessing the balance of executive and non-executive directors and the composition of the board in terms of the diversity and capacity required to oversee the delivery of Rio Tinto’s strategy.
The Committee develops and agrees in advance the desired profiles of potential candidates for board membership. It oversees the recruitment process and engages external search consultants to manage searches on its behalf, including constructing shortlists comprising candidates from diverse backgrounds. Following a final review of shortlisted candidates, the Committee makes recommendations for new board members to the board for approval.
On behalf of the board, the Committee also reviews proposals for appointments to the Executive Committee and monitors executive succession planning.
Governance processes
The Committee meets as required and in 2013, met eight times. The members of the Committee are independent in accordance with the independence policy adopted by the board.
The Committee in its proceedings takes account of the Group’s Diversity & Inclusion policy and progress in the diversity and inclusion arena, discussed further on page 64.
In 2013, the Committee:
| – | Continued regular executive and non-executive succession planning reviews. |
| – | Recommended to the board the appointments of Sam Walsh and Chris Lynch as chief executive and chief financial officer respectively. |
| – | Considered the findings from the 2012 external evaluation of the Committee’s performance and implemented the recommendations. |
| – | Reviewed the mix of skills required for non-executive directors and briefed the search firm accordingly. |
| – | Received a leadership assessment and development report on senior management talent from Egon Zehnder, whom the Committee consider to be independent of the Company, and discussed the same with them. |
| – | Focused on the addition of new, suitably qualified and diverse directors. |
| – | Recommended to the board the appointment of Greg Lilleyman as Group executive, Technology & Innovation with effect from 1 January 2014. |
| – | Reviewed the output from a diversity review in order to gauge progress against the aspiration for the right mix of skills and diversity on the board. |
In 2014, the Committee will continue its regular executive and non-executive succession planning reviews. In early 2014, the Committee considered the findings from the 2013 evaluation of the Committee’s performance and agreed the actions arising.
| | | | |
| | 63 riotinto.com/reportingcentre2013 | | |
Corporate governance continued
Board diversity
More information about the board’s process for the selection, appointment and election of directors is available in the “Corporate governance” section of the website.
The Nominations Committee regularly reviews the structure, size and composition of the board.
In leading a global mining and metals company, the board seeks to continually evolve its membership by seeking non-executive directors with diverse and complementary skills and perspectives, as well as experience which reflects the geographic spread of the Group’s operations. Core skills required for non-executive membership of the board are maintained. These skills may, depending upon the circumstances, comprise international business, financial or public policy experience, strategic acumen or mining or metals industry experience. The board aspires to increase other aspects of diversity, including gender and nationality, of directors in order to bring a diversity of skills, experience and perspective to the governance of the Group. The board recognises that the evolution of the mix of skills and diversity is a long-term process and weighs the various factors relevant to board balance and diversity when vacancies arise.
In 2012 the board established two objectives relating to diversity of the board:
| – | The Nominations Committee will undertake a review of board diversity. |
| – | For each director selection and appointment process, the external search firm supporting the Nominations Committee will put forward at least one credible and suitably experienced female candidate. |
An assessment of board diversity was completed by the Committee in 2012 and the output from that assessment was reviewed in the context of the Committee’s succession deliberations during 2013.
Diversity and inclusion
Our commitment to diversity and inclusion
We are a global company and, wherever we operate and across every part of our business, we strive to create an inclusive culture in which difference is recognised and valued. By bringing together men and women from diverse backgrounds and giving each person the opportunity to contribute their skills, experience and perspectives, we believe that we are able to develop the best solutions to challenges and deliver sustainable value for Rio Tinto and its stakeholders.
What diversity and inclusion means for Rio Tinto
| – | Embracing workforce diversity – age, gender, race, national or ethnic origin, religion, language, political beliefs, sexual orientation, and physical ability. |
| – | Valuing diversity of perspective – leveraging the diverse thinking, skills, experience and working styles of our employees and other stakeholders. |
| – | Building a flexible organisation – providing opportunities for work arrangements that accommodate the diverse needs of individuals at different career and life stages. |
| – | Respecting stakeholder diversity – developing strong and sustainable relationships with diverse shareholders, communities, employees, governments, customers and suppliers. |
How we support diversity and inclusion
We use the following to drive action and build awareness about diversity and inclusion:
| – | Policies, practices and targets |
| – | Leadership and cultural competence |
| – | Stakeholder relationships |
| – | Education and communication |
We prioritise long and short-term programmes based on need and impact.
Read a summary of our Diversity and inclusion policy in the “Corporate governance” section of our website.
Our current focus
Our goal is to have a workforce that is representative of the countries and communities in which we operate. Currently, our focus is to improve the representation of women and of people from nationalities which are under-represented in our workforce, and to continue to build an inclusive culture in which all talent can thrive.
Some of the activities and initiatives relating to diversity that we undertook during the year are:
| – | The development of executive-sponsored diversity and inclusion plans within the product groups and geographies which align with business goals and the Group Diversity and inclusion strategy, the aim being to increase the diversity in our workforce at all levels and build a more inclusive culture. Progress will be evaluated each year by the Executive Committee and Group Diversity Council and began in 2013. |
| – | Embed diversity and inclusion scorecards to accompany the above plans with metrics in three areas: |
| | 1. | Who we are (demographics) |
| | 2. | How we behave (performance and development) |
| | 3. | What we stand for (values) |
to be applied across Rio Tinto to help baseline, trend and track progress as well as to address areas where we may be underperforming.
| – | Active involvement with Women in Mining groups, professional women’s associations and other targeted recruiting efforts to raise awareness about Rio Tinto and to increase the attraction, development and retention of talented women wherever we operate. |
| – | Expansion of our diversity champions network group to include additional geographies and operations, and the establishment of several new business unit diversity councils and committees across Rio Tinto. These are increasing leadership engagement, cross-company collaboration, and the sharing and replication of best practices. |
| – | The expansion of training programmes aimed at countering unconscious bias. These have targeted senior leaders, hiring managers and recruiters to help minimise the impact of bias in recruitment and development practices, as well as to improve the cross-cultural interactions and relationship-building needed to globalise our business. |
| – | The continuation of a three-year commitment by the chairman to mentoring high-potential female board candidates through the FTSE100 Cross-company Mentoring Programme. |
| | | | |
| | 64 riotinto.com/reportingcentre2013 | | |
Proportion of women employees and board members
In 2013, the proportion of women on the board was 17 per cent, in senior management 14 per cent and in the overall workforce 19 per cent.
Measurable objectives and progress
We established the following five-year measurable objectives for workforce diversity at the start of 2011.
| | |
| Measurable objective | | Progress during 2013 |
| Women to represent 20 per cent of our senior management by 2015. | | Women represented 14 per cent of our senior management in 2013. |
| Women to represent 40 per cent of our 2015 graduate intake. | | Women represented 28 per cent of our 2013 graduate intake. |
| 15 per cent of our 2015 graduate intake to be nationals from regions where we are developing new businesses. | | 30 per cent of our 2013 graduate intake were nationals from regions where we are developing new businesses. |
Subsidiary board diversity
In addition to the measurable objectives described above, women also represented 12 per cent of the directors of our principal controlled subsidiary undertakings during 2013 (26 female; 194 male).
Other disclosures
Policies and standards
Rio Tinto’s commitment to integrity is set out in our global code of business conduct:The way we work. This contains principles and standards of conduct which reaffirm the Group’s commitment to integrity. It is inspired by our four core values: accountability, respect, teamwork and integrity. It is available on the website.
It is supported by Rio Tinto’s extensive framework of policies and standards. Core policies are adopted after wide consultation, externally and within the Group.
Once adopted, they are communicated to business units worldwide, together with related standards, guidance notes and resources to support implementation. Business unit management are required to devote the necessary effort to implement and report on these policies and standards.
Rio Tinto policies and standards include policies on a variety of important topics. They apply to all Rio Tinto managed businesses. Where the Group does not have operating responsibility for a business, Rio Tinto’s policies and standards are communicated to its business partners and they are encouraged to adopt similar policies of their own.
Rio Tinto employees are required to undertake training about the requirements ofThe way we work and other core policies.
“Whistleblowing” programme
The board has adopted a confidential and independently operated whistleblowing programme calledSpeak-OUT. This offers an avenue where employees, contractors, suppliers and customers of Rio Tinto managed sites can report concerns anonymously if they so choose, subject to local law. This can include any significant concerns about the business, or behaviour of individuals, including suspicion of violations of financial reporting, safety or environmental procedures or business integrity issues generally. The programme features web submission, a case management tool to better manage cases, and a reporting tool to allow for improved analysis of case statistics and reporting. Rio Tinto is also looking at ways to increase the positive awareness ofSpeak-OUT. The Audit Committee receives a report annually onSpeak-OUTactivity as does the Sustainability Committee with regard to calls toSpeak-OUT impacting sustainable development issues.
Dealing in Rio Tinto securities
Rio Tinto operates rules which restrict the dealing in Rio Tinto securities by directors and employees with access to “inside information”. These rules require those people to seek clearance before any proposed dealing and place restrictions on when some people can deal.
Communication with stakeholders
Rio Tinto recognises the importance of effective timely communication with shareholders and the wider investment community.
The Disclosure Committee is responsible for determining whether information relating to Rio Tinto may require disclosure to the markets.
Rio Tinto makes immediate disclosure (unless an exemption applies allowing a delay) to the relevant listing authorities in accordance with their rules of any information that a reasonable person would expect to have a material effect on its share price. All information released to the markets is posted on the Media section of the website.
In addition to statutory documents, Rio Tinto’s website features information on corporate governance, and general investor information. Annual and half year results, as well as any major presentations, are webcast and the materials are available on the website. Presentation material from investor seminars is also made available on the website.
The annual general meetings present an opportunity to provide a summary business presentation, to inform shareholders of recent developments and to give them the opportunity to ask questions. Generally, the chairs of all board committees will be available to answer questions raised by shareholders and all directors are expected to attend where possible. In 2013 all of the directors attended the annual general meetings, with the exception of Robert Brown who was unable to attend the annual general meeting of Rio Tinto Limited due to his attending the annual general meeting of another company. Rio Tinto’s external auditors, PwC, attend the annual general meetings and are available to answer questions about the conduct of the external audit and the preparation and content of the independent auditors’ report. Any questions received and answers provided ahead of the annual general meetings are made available to shareholders, who also have the opportunity to meet informally with directors after the meetings.
The main channels of communication with the investment community are through the chairman, chief executive and chief financial officer, who have regular meetings with the Companies’ major shareholders. The senior independent director has a specific responsibility to be available to shareholders who have concerns, and where contact with the chairman, chief executive or chief financial officer has failed to resolve their concerns, or for whom such contact is inappropriate. In his capacity as Remuneration Committee chairman, the senior independent director meets shareholders to discuss remuneration issues as described in his annual statement on pages 68 and 69.
During 2013, these meetings with the investment community focused on the issues of strategy, board succession, corporate governance, executive remuneration, and the operational and financial performance of the Group. Regular investor seminars provide a two-way communication opportunity with investors and analysts, and feedback from such engagement is routinely communicated to the board. Surveys of major shareholders’ opinions are presented to the board by the Group’s investor relations advisers on a regular basis.
| | | | |
| | 65 riotinto.com/reportingcentre2013 | | |
Corporate governance continued
Risk management
Rio Tinto’s overriding objective is to generate attractive, sustainable returns to shareholders through a strategy of investing in long-life, low-cost, expandable operations in the most attractive industry sectors. The directors recognise that creating shareholder return is the reward for taking and accepting risk. The risks shareholders face are, to some extent, managed by the Group’s diversified portfolio of assets spread across multiple geographies, currencies and commodities.
A description of the risk factors that could affect Rio Tinto is found on pages 14 to 17.
Risk policy and standard
The board recognises that risk is an integral component of the business and carefully considers the level of risk it is prepared to tolerate. The Group fosters a risk-aware corporate culture in all decision-making, and is committed to managing all risk in a proactive and effective manner through competent risk management that ensures that risks are managed within agreed thresholds. To support this commitment, risk is analysed in order to inform the management decisions taken at all levels within the organisation. The principles of the risk analysis and management process are set out in the Risk policy and standard which is on the website.
Risk approach
The Risk policy and standard is supported by an integrated framework of risk governance and reporting specifying how the Group organises the handling of risk. Together with the policy, the framework provides an ongoing process for identifying, evaluating and managing the significant risks faced by the Group. Clear accountability for risk management is defined throughout the Group and is a key performance area of line managers.
To support risk understanding and management at all levels, the Group Risk function provides the necessary infrastructure, information collation for the senior executive, and co-ordination between other risk-focused functions. Group Risk supports the Risk Management Committee in its review of risk.
Whilst the Audit Committee is responsible for oversight of the effectiveness of the Group’s risk management systems, the responsibility for identifying and managing risks rests with the chief executive and all of Rio Tinto’s managers and business leaders, who operate within a Group-wide framework that ensures that risks are managed within agreed thresholds.
Internal controls
The directors are responsible for the Group’s system of internal controls and for reviewing annually the effectiveness of the internal control system. This includes reviewing financial, operational and compliance controls and risk management procedures and their effectiveness. The directors have completed their annual review and assessment for 2013.
Internal control systems
Two of the Group’s management committees, the Executive Committee and the Disclosure Committee, regularly review reports related to the Group’s control framework in order to satisfy the internal control requirements of the Code, the ASX Principles, the NYSE Standards and section 404 of the Sarbanes-Oxley Act 2002. The Group Audit & Assurance function performs reviews of the integrity and effectiveness of control activities and provides regular reports to the Audit Committee, Sustainability Committee and other management committees.
Each year, the leaders of the Group’s businesses and functions complete a representation letter confirming that adequate internal controls are in place, are operating effectively and are designed to capture and evaluate failings and weaknesses, if any exist, and that action is taken promptly, as appropriate.
In 2013, information was reported by management to the Audit Committee to enable it to assess the effectiveness of the Company’s risk management and internal control systems. In addition, as part of their role, the board and its committees routinely monitor the Group’s material business risks.
Due to the limitations inherent in any risk management system, the process for identifying, evaluating and managing the material business risks is designed to manage, rather than eliminate, risk and to provide reasonable, but not absolute assurance, against material misstatement or loss. Certain risks, for example natural disasters, cannot be managed to an acceptable degree using internal controls. Such major risks are transferred to third parties in the international insurance markets, to the extent considered appropriate. The Group has material investments in a number of jointly controlled entities and associates. Where Rio Tinto does not have managerial control, it cannot guarantee that local management of mining and related assets will comply with Rio Tinto standards or objectives.
Auditors and internal assurance
External auditors
As indicated in the report of the Audit Committee on pages 61 and 62, Rio Tinto has adopted policies designed to uphold the independence of the Group’s external auditors by prohibiting their engagement to provide other accounting and other professional services that might compromise their appointment as independent auditors.
The engagement of the external auditors to provide statutory audit services, other services pursuant to legislation, taxation services, and certain other services is pre-approved. Any engagement of the external auditors to provide other permitted services is subject to the specific approval of the Audit Committee or its chairman. For other services, because of their knowledge, experience and/or for reasons of confidentiality, it can be more efficient or necessary to engage the external auditor rather than another party.
At half year and year end, the chief financial officer and the external auditors submit to the Audit Committee a schedule of the types of services that were performed during the period. The Audit Committee may impose a financial limit on the total value of other permitted services that can be provided. Any non-audit service provided by the external auditors, where the expected fee exceeds a pre-determined level, must be subject to the Group’s normal tender procedures.
In exceptional circumstances, the chief financial officer is authorised to engage the external auditors to provide such services without going to tender, but if the fees are expected to exceed certain pre-determined limits then the chairman of the Audit Committee must give prior approval of the engagement.
Further information on audit and non-audit fees of the Group’s external auditors is set out in note 39 to the financial statements and in the Directors’ report.
Group Audit & Assurance
Group Audit & Assurance is an internal function which provides independent and objective assurance on the adequacy and effectiveness of the Group’s systems for risk management, internal control and governance together with recommendations to improve the effectiveness of the relevant systems and processes. The function has adopted international auditing standards set by the Institute of Internal Auditors (IIA).
| | | | |
| | 66 riotinto.com/reportingcentre2013 | | |
The function operates independently of management, under a mandate approved by the Audit Committee, and has full access to all functions, records, property and personnel of the Group. The head of Group Audit & Assurance administratively reports to the chief financial officer and has direct communication lines with the chairs of both the Audit Committee and Sustainability Committee and regularly attends their meetings, providing each Committee with information relevant to their specific terms of reference.
A risk-based approach is used to focus assurance activities on high-risk areas and audit plans are presented annually to the Audit Committee and Sustainability Committee for approval.
In respect of its internal audit function, Rio Tinto utilises the services of external service providers. The Audit Committee has a policy which addresses conflicts of interest in relation to engagements of the service provider that are requested by management. The policy complies with the IIA’s standards on independence. Certain services are pre-approved under the policy as they would not be in conflict with the internal auditor’s role. There is a list of prohibited services which may not be undertaken without approval of the head of Group Audit & Assurance, and guidance on the consideration of services which may give rise to a conflict of interest.
Financial reporting
Financial statements
The directors are required to prepare financial statements for each financial period which give a true and fair view of the state of affairs of the Group as at the end of the financial period, and the profit or loss and cash flows for that period. This includes preparing financial statements in accordance with UK company law which give a true and fair view of the state of the Company’s affairs, and preparing a Remuneration report which includes the information required by Regulation 11, Schedule 8 of the Large and Medium Sized Companies and Groups (Accounts and Reports) Regulations 2008 and the Australian Corporations Act 2001.
In addition, the Code requires that the board provides a fair, balanced and understandable assessment of the company’s position and prospects in its external reporting. The directors were responsible for the preparation and approval of the Annual report for the year ended 31 December 2013. They consider the Annual report, taken as a whole, to be fair, balanced and understandable, and provides the information necessary for shareholders to assess the company’s performance, business model and strategy.
The directors are responsible for maintaining proper accounting records, in accordance with UK and Australian legislation. They have a general responsibility for taking such steps as are reasonably open to them to safeguard the assets of the Group, and to prevent and detect fraud and other irregularities. The directors are also responsible for ensuring that appropriate systems are in place to maintain and preserve the integrity of the Group’s website. Legislation in the UK governing the preparation and dissemination of financial statements may differ from current and future legislation in other jurisdictions. The work carried out by the auditors does not involve consideration of such developments and, accordingly, the external auditors accept no responsibility for any changes, should any be made, to the financial statements after they are made available on the website.
The directors, senior executives, senior financial managers and other members of staff who are required to exercise judgment in the course of the preparation of the financial statements are required to conduct themselves with integrity and honesty and in accordance with the ethical standards of their profession and the business.
The directors consider that the 2013 Annual report presents a true and fair view and has been prepared in accordance with applicable accounting standards, using the most appropriate accounting policies for Rio Tinto’s business, and supported by reasonable judgments and estimates. The accounting policies have been consistently applied. The directors have received a written statement from the chief executive and the chief financial officer to this effect. In accordance with the internal control requirements of the Code and the ASX Principles Recommendation 7.3, this written statement confirms that the declarations in the statement are founded on a sound system of risk management and internal controls, and that the system is operating effectively in all material respects in relation to financial reporting risks.
Disclosure controls and procedures
The Group maintains disclosure controls and procedures as such term is defined in US Exchange Act Rule 13a-15(e). Management, with the participation of the chief executive and chief financial officer, has evaluated the effectiveness of the design and operation of the Group’s disclosure controls and procedures pursuant to Exchange Act Rule 13a-15(b) as of the end of the period covered by this report and has concluded that these disclosure controls and procedures were effective at a reasonable assurance level.
Management’s report on internal control over financial reporting
The management of Rio Tinto plc and Rio Tinto Limited is responsible for establishing and maintaining adequate internal control over financial reporting. The Companies’ internal control over financial reporting is a process designed under the supervision of their common chief executive and chief financial officer to provide reasonable assurance regarding the reliability of financial reporting and the preparation and fair presentation of the Group’s published financial statements for external reporting purposes in accordance with International Financial Reporting Standards (IFRS).
Because of its inherent limitations, internal control over financial reporting cannot provide absolute assurance, and may not prevent or detect all misstatements whether caused by error or fraud, if any, within each of Rio Tinto plc and Rio Tinto Limited.
The Group’s internal control over financial reporting includes policies and procedures that pertain to the maintenance of records that, in reasonable detail, accurately and fairly reflect transactions and dispositions of assets; provide reasonable assurances that transactions are recorded as necessary to permit preparation of financial statements in accordance with IFRS, and that receipts and expenditures are being made only in accordance with authorisations of management and directors of each of the Companies; and provide reasonable assurance regarding prevention or timely detection of unauthorised acquisition, use or disposition of the Group’s assets that could have a material effect on our financial statements.
Management conducted an assessment of the effectiveness of internal control over financial reporting as of 31 December 2013, based on the Internal Control – Integrated Framework issued by the Committee of Sponsoring Organizations of the Treadway Commission (COSO) issued in 1992, and concluded that it was effective.
PricewaterhouseCoopers LLP and PricewaterhouseCoopers, the auditors of Rio Tinto plc and Rio Tinto Limited respectively, audited the Financial statements included in this Form 20-F and audited the effectiveness of internal controls over financial reporting as of 31 December 2013. Their audit report is included on page 204 of this Annual report on Form 20-F.
There were no changes in the internal controls over financial reporting that occurred during the period covered by this Annual report on Form 20-F that have materially affected, or are reasonably likely to materially affect, the internal controls over financial reporting of each of Rio Tinto plc and Rio Tinto Limited.
| | | | |
| | 67 riotinto.com/reportingcentre2013 | | |
Remuneration Report: Annual statement by the Remuneration Committee chairman
Dear Shareholder
On behalf of the board, I am pleased to introduce our 2013 directors’ remuneration report (the Remuneration Report), for which we seek your support at our annual general meetings (AGMs), in London in April, and in Melbourne in May.
The Remuneration Report is designed to provide you with the necessary information to demonstrate the link between our Group’s strategy, its performance, and the remuneration outcomes for our executives, particularly the executive directors.
With a view to sustaining returns to shareholders over time, Rio Tinto takes a long-term approach to its activities, and this means concentrating on developing long-life, low-cost, expandable operations that are capable of providing competitive returns throughout business cycles. Our executives’ performance objectives are set accordingly.
The Remuneration Report has been prepared in accordance with applicable legislation and corporate governance guidance in the UK and Australia. Australian legislation requires disclosures in respect of “key management personnel”, being those persons having authority and responsibility for planning, directing and controlling the activities of the Group. The key management personnel are, in addition to the directors, the non-director members of the Executive Committee. The Executive Committee comprises the executive directors, product group chief executive officers and Group executives. Throughout this Remuneration Report, the members of the Executive Committee are collectively referred to as “executives”. They are listed on pages 53 and 56, which also shows the positions held during the year and dates of appointment.
Shareholders will be aware that we have to comply with UK and Australian legislation in the remuneration arena and that the rules are different. We have structured the voting arrangements such that all shareholders vote on all four resolutions that we are putting to our AGMs.
This Remuneration Report is divided into two parts; the statement of remuneration policy which summarises our policies and practices in the compensation arena (the Remuneration Policy); and the annual report on remuneration which shows how the Remuneration Policy has been applied (the Implementation Report).
In October 2013, the UK government introduced new legislation that gives shareholders a binding vote on a company’s directors’ remuneration policy and requires companies to communicate ever more clearly on how their policies are being implemented. I have described below the structure of the voting arrangements. As you will see in the pages that follow, an increased degree of disclosure and transparency has resulted from our adoption of this new legislation. We hope that shareholders globally will benefit from our enhanced reporting under the new UK legislation.
The Remuneration Policy is subject to a binding vote at our 2014 AGMs for UK law purposes. The Implementation Report (including this statement) is subject to an advisory vote for UK law purposes. As in previous years, the Remuneration Report as a whole is subject to an advisory vote at the 2014 AGMs for Australian law purposes.
For the purposes of the new UK regulations on remuneration reporting, the Remuneration Policy will, if the resolution is passed, become effective in respect of payments to directors from the date of the second of our AGMs. In the absence of circumstances which may necessitate a change to the Remuneration Policy, it is our intention that it will next be put before shareholders at our AGMs in 2017.
Although, as a matter of UK law, the Remuneration Policy, once approved by shareholders, will only apply to the remuneration of our directors, it is the Committee’s intention that the broad policy principles will continue to inform the way in which our non-director key management personnel on the Executive Committee are remunerated.
The law in Australia governs the benefits which can be given to the holders of certain offices when they leave the employment of the Group. The law is complex. It affects our ability to apply the policies that are described in detail in this report, and it also constrains our ability to treat our employees consistently. So, as many other Australian companies have done, we are seeking approval of a termination benefits resolution. I emphasise that if the resolution is passed we intend no change to our remuneration policies or practices, and in particular we intend no increase in the amounts we pay on termination.
Last year our Remuneration Report received a vote in favour of 97 per cent at the AGMs. Whilst the narrative of the Remuneration Policy has been updated to reflect the new regulations introduced for UK incorporated and listed companies, the substance of the policy remains unchanged from the one which received endorsement last year and which was applied in 2012 and 2013.
The Remuneration Policy describes among other things: our executive remuneration structure; the details of the discretions available to the Committee; our approach to remuneration on recruitment; the details of executives’ service contracts and our treatment of leavers.
Remuneration for executives comprises fixed compensation in the form of base salary, participation in a pension plan, superannuation fund and/or a cash allowance to contribute to a fund, the receipt of certain benefits, and performance-related remuneration, all as described in the Remuneration Policy.
The majority of the remuneration will normally be performance-related, and is provided in the form of variable short and long-term incentives.
In relation to the short-term incentive plan (STIP), the Committee each year sets performance criteria relative to three benchmarks: threshold, target and outstanding. Target performance is intended to be stretching, and is typically equivalent to budget for the year.
Our new long-term incentive plan (LTIP) was approved by shareholders at the 2013 AGMs. The views expressed by our owners during our extensive consultations in 2012 were instrumental in the design of the LTIP. The Committee intends to keep the Group’s long-term incentive arrangements under review, taking into account, among other things, the views of our owners. This review will include the percentage of an award under the new Performance Share Plan (PSP) that vests for threshold performance, recognising that this is an important issue for some owners with whom we consulted.
I want to describe to you our policy relating to the disclosure of measures, weightings and targets. In relation to the LTIP, these will all be disclosed in advance, at the beginning of each five-year performance period. In relation to the STIP, we will, when it comes to disclosure, distinguish between safety, financial and individual goals. In the area of safety goals, we will disclose the measures, weightings and targets at the beginning of each year. In the area of financial and individual goals, we will, at the beginning of each year, disclose the measures and weightings only, because we regard the targets as commercially sensitive. However, we intend to disclose targets and outcomes retrospectively. In the rare instances where this may not be prudent on grounds of commercial sensitivity, I will seek to explain why and give an indication of when they will be disclosed. The measures, targets and performance against them for 2013 are disclosed in the Implementation Report.
The chart on page 91 demonstrates the usual timeframe for the delivery of the components of remuneration, using 2013 as an example. This emphasises the long-term nature of our remuneration arrangements.
You will see in the Remuneration Report several mechanisms that are intended to create alignment of interest between shareholders and executives. We have, for our executives, a mandatory conversion of 50 per cent of any annual short-term bonus payment into shares, with vesting deferred for three years. The performance measures under our long-term remuneration plans are structured to support and incentivise the creation of long-term shareholder value. In addition, we have reserved to the Committee such discretions as enable it, should circumstances warrant, to safeguard against the return
| | | | |
| | 68 riotinto.com/reportingcentre2013 | | |
experience of shareholders and the reward experience of executives being materially misaligned. We want the remuneration outcomes properly to reflect the Group’s overall performance. We have also increased share ownership requirements for executives and these are described in the Implementation Report.
There are many examples in the Remuneration Policy and practice of how our dialogue with shareholders has influenced the Committee’s decisions. We added, in 2013, a new performance measure to our PSP, the relative EBIT margin improvement measure, because many of our owners had expressed a wish that our PSP should incorporate some diversification beyond total shareholder return. We extended the performance period of the PSP from four to five years and have materially reduced the pay-out for threshold performance. We have ceased using share options as a mechanism for long-term reward. We adjusted our safety measures in our STIP targets to reflect lost time injuries and all injury frequency rates. As you will see below, our decisions relating to base pay changes for executive directors and executives are now broadly guided by pay changes for the wider employee population.
2013 performance and remuneration
In terms of STIP for 2013, the Committee determined that the Group’s earnings and cash flow targets set by the board had been met. This is reflected in the financial component of the STIP awards at Group and product group level.
However, disappointingly, the Group neither met the all injury frequency targets set for the year, nor the threshold level of performance set for lost time injury frequency rates. This has led to low levels of payment of the safety component of the award for most executives. Further reductions have also been applied as required for executives with portfolios where a fatality has occurred.
Discretionary downward adjustments of between ten per cent and 40 per cent of the STIP award have been applied to the chief executive, the current and former chief financial officers, the former Group executive Technology & Innovation and the chief executive Aluminium for the project cost overrun in relation to the Kitimat modernisation project.
The net effect of these outcomes, also taking into account the achievement of individual objectives, is that STIP awards for Executive Committee members have been made in a range from below target to above target levels.
The Committee considered the Group’s overall performance in the context of the LTIP awards that were due to vest at the end of 2013, namely the 2010 award under the PSP, which had an indicative vesting of 75 per cent of face value, and the 2011 grant under the Share Option Plan, which has an indicative vesting of 100 per cent of face value. The Committee concluded that the vesting of awards based upon the achievement of the TSR measures set by shareholders was justified.
Further details are provided in the Implementation Report.
2014 decisions
The Committee has reviewed the base salary levels for executives and, for the executive directors and the majority of the Executive Committee, made adjustments in line with the base salary budgets applying to the broader employee population.
In one case, namely the chief executive, Copper, a further adjustment was made, taking into account individual performance and a base salary significantly below internal and external peers.
The quantum of LTIP awards to be granted to executives in March 2014 is broadly similar to those awards made in 2013.
Safety, cost reduction, capital expenditure and cash flow management will continue to feature prominently in the individual objectives for executives in 2014.
Further details are provided in the Implementation Report.
Governance and owners’ views
We know that there will never be perfect consensus among our owners about remuneration policy, and therefore that ultimately the Committee must make judgments based on its best assessment of supporting value creation. However, it has been and will continue to be our intention to be alert to evolving best practice and to the views and guidance given to us in the conversations we have with you.
We continue to ensure that the Company meets regulatory and legislative remuneration requirements specified by Australian and UK regulation and, as part of this, we held extensive meetings with shareholders and proxy advisory bodies in Australia and the UK during 2012 to describe and explain our remuneration policies and practices in the context of the overall Group strategy.
In preparing the Remuneration Report we have been informed by the directors’ remuneration reporting guidance issued jointly by GC100, the Association of General Counsel and Company Secretaries of the FTSE 100 and Investor Group on 12 September 2013, as amended.
We are committed to a continuing dialogue with our owners.
I am very conscious of the fact that this Remuneration Report runs to 40 pages, 6 pages longer than last year given the impact of the new UK law requirements. We try to balance the need for a simple narrative of the year’s remuneration events with the appetite of many of our stakeholders for more detail. Please tell us how you think we might improve it.
Yours sincerely,

|
John Varley |
| Remuneration Committee chairman |

| | | | |
| | 69 riotinto.com/reportingcentre2013 | | |
Remuneration Report: Remuneration Policy
Remuneration Policy introduction
As foreshadowed in our Remuneration Report last year, the UK Parliament approved new legislation setting out the requirements for the reporting of, and voting on, directors’ remuneration by listed companies. The regulations apply from October 2013, and Rio Tinto is required to comply with them in this Remuneration Report.
The regulations require the board to present to shareholders a policy for the remuneration of its directors that is subject to a binding vote for the first time at the 2014 AGMs and at least every three years thereafter.
Subject to shareholder approval at the 2014 AGMs, the Remuneration Policy will, for the purposes of the new UK regulations, become effective in respect of payments to directors from the date of our Australian AGM.
This Remuneration Policy applies specifically to our executive and non-executive directors and the chairman. It also explains, in conformance with Australian law, the broad policy principles which generally apply to the non-director members of the Executive Committee. The policy applying to our chairman and non-executive directors is set out at the end of the Remuneration Policy on page 78.
This Remuneration Report has been prepared in accordance with applicable legislation and corporate governance guidance in the UK and Australia. Australian legislation requires disclosures in respect of “key management personnel”, being those persons having authority and responsibility for planning, directing and controlling the activities of the Group. The key management personnel are, in addition to the directors, the non-director members of the Executive Committee. The Executive Committee comprises the executive directors, product group chief executive officers and Group executives. Throughout this Remuneration Report, the members of the Executive Committee are collectively referred to as “executives”. They are listed on page 53 and 56, which also shows the positions held during the year and dates of appointment.
Shareholders should note that this Remuneration Policy is binding only in so far as it relates to directors.
Our remuneration policies, principles and practices
Our first objective is to spend remuneration resource wisely in pursuit of the implementation of the Group’s strategy. We want our pay policies to be regarded as fair by shareholders and employees alike. Although we have appropriate remuneration structures, the Committee retains considerable discretions, enabling it, if it thinks fit, to override inappropriate mechanistic outcomes, but always within the confines of the Remuneration Policy.
Rio Tinto operates in global and local markets where it competes for a limited pool of talented executives. High-quality people, who are capable of achieving stretching performance targets, are essential to generating superior returns for the Group. Our compensation strategies aim to provide this support by enabling the Group to attract and retain people whose contribution will increase shareholder value over time.
We aim to engage our people over the long term by fostering diversity, providing challenging work and development opportunities, and encouraging strong delivery by good performance. This people strategy is underpinned by our values of respect, integrity, accountability and teamwork and our commitment to provide sustainable growth and development for both Rio Tinto and our employees.
Our policy is based on the principle of aligning remuneration outcomes with the successful delivery of strategy. The remuneration strategy and the policies which support it, together with a description of how we believe they will help Rio Tinto achieve its vision, are set out below and in the executive remuneration structure table on pages 71 to 73. Complementary remuneration structures are designed for other employees, drawing on these strategies and policies.
Competitive, performance-related remuneration
We aim to provide competitive rewards that attract, retain and motivate executives of the high calibre required to lead the Group while ensuring rewards remain appropriate and proportionate, both when compared to market practice and to remuneration arrangements for other employees in the Group.
| – | The majority of remuneration is linked to demanding performance targets over both the short and long term to ensure that executive rewards are directed at delivering good performance for shareholders. |
| – | For the purposes of assessing the appropriate level of executive remuneration, the Committee refers to the FTSE30 (excluding financial services companies) as the initial comparator group. The FTSE30 is considered the most relevant comparator group as it comprises organisations broadly comparable to the Group in terms of global reach, revenue, market capitalisation and complexity. References are also made to other relevant supplementary comparator groups, including a cross-section of comparable international industrial organisations and other international mining companies. |
| – | Typically we aim to position base salaries at the median of these comparator groups, while our incentive plans are designed with the potential to deliver total remuneration outcomes across the full market range according to business and individual performance. |
| – | Benchmarking is undertaken periodically but not annually, and our intention is to apply judgment in evaluating market data. We will take salary increases in the broader employee population into account in determining any change to the base pay of executives. |
| – | We regularly consult with shareholders on the design of our policies and programmes, most recently on the subjects of the safety measure component of the STIP, the ceasing of the use of share options as a mechanism for long-term reward and in the performance conditions and the performance period for our new PSP. |
| – | Employee share plans provide the opportunity for employees to participate in the voting on executive remuneration. Employees who are shareholders – 20 per cent of the workforce – are able to vote on the Remuneration Report. Employees have not been consulted on the Remuneration Policy but are free to ask any questions they wish and to offer any opinions they have through our normal employee communications channels. |
Safety
We have a strong focus on safety in the STIP targets.
| – | As an organisation, we strive for superior long-term shareholder value creation in a healthy, safe and environmentally appropriate way. These are important elements of our licence to operate. |
| – | Safety key performance indicators determine a significant portion of the STIP for executives. |
| – | Any fatality will have a material impact on the STIP score for the relevant executives. Further details on the approach to fatalities are provided on page 91. |
Long term focus
Consistent with our strategy of investing in and operating long-life, low-cost, expandable mines and businesses, we seek to provide incentive plans that focus on longer-term performance.
| – | Our incentive plans are designed to promote and reward decision-making with a positive long-term impact while avoiding excessive risk. |
| – | Fifty per cent of the STIP for executives is deferred into shares which vest after three years, through the Bonus Deferral Plan (BDP). |
| – | The performance-based options and shares awarded prior to 2013 have a three and four-year time horizon, respectively. The time horizon for performance shares awarded under the PSP from 2013 has moved out to five years. As a transitional measure, awards granted in 2013 will potentially vest 50 per cent after four years and 50 per cent after five years. |
| | | | |
| | 70 riotinto.com/reportingcentre2013 | | |
| – | Options are no longer granted but existing options which vest may be exercised up to ten years after their grant. |
| – | The Committee intends to keep the Group’s long-term incentive arrangements under review. |
Shareholder alignment
Our share ownership policy requires executives to build up and maintain a meaningful shareholding (as described on page 80). We reward executives for delivering shareholder value by using relative TSR as one of the measures for our LTIP.
| – | For awards granted from 2013 under the PSP, a new relative EBIT margin improvement measure complements the relative TSR measures and incentivises executives to deliver long-term shareholder value while maximising operational performance in the medium term. This comprises one-third of the total value opportunity under the PSP awards. |
| – | The reward opportunity under the remaining portion of the PSP awards will be delivered based on relative TSR performance against both the HSBC Global Mining Index and the broader market of large global companies as measured through the Morgan Stanley Capital World Index (MSCI). |
| – | The choice of both the HSBC Global Mining Index and MSCI reflects the fact that Rio Tinto competes in a global market for investors as well as within the mining sector and is consistent with rewarding executives for providing stable returns over the long-term relative to the broader market and the mining sector. |
Risk management
The Committee has authority under the “malus” provisions of the PSP to reduce or cancel awards made from 2013 in the event of gross misconduct which may have a material effect on the value or reputation of the Group, a materially adverse error in the Group’s or a product group’s financial statements, exceptional events that have a materially detrimental impact on the value of any Group company, or for any other reason that the Committee decides in a particular case.
The Committee also has authority under the “claw back” provisions of the PSP to recover the value of any awards made from 2013 in the event of deliberate misconduct by a participant that may have a material impact on the value or reputation of a Rio Tinto Group company or for any other reason that the directors decide in a particular case.
The Committee reserves rights to exercise discretions more generally as described on page 75.
Executive remuneration structure – policy table
The Committee seeks to achieve a remuneration mix which best reflects the long-term nature of the business. The total remuneration package is therefore designed to provide an appropriate balance between fixed and variable components, with an emphasis on long-term variable pay. The remuneration structure for executives including the relationship between each element of remuneration and Group performance is summarised below. Further details on the key performance indicators used to assess Group performance are provided on pages 10 and 11. Shareholders should note that the following remuneration structure is binding only in so far as it relates to directors.
Any commitment made before this Remuneration Policy takes effect or before an executive became or becomes a director will be honoured even if it is not consistent with this Remuneration Policy or any subsequent policy.
| | | | | | |
| Remuneration arrangements – Fixed | | Link to Group performance and strategy |
| Base salary | | – | | Base salary provides the main fixed element of the remuneration package. | | – We pay competitive salaries to hire, motivate and retain highly competent people. |
| | – | | Base salaries are reviewed annually, with a maximum increase of nine per cent, or inflation if higher, per annum. An increase may be higher than this for executives who are not directors in the circumstances described below. | |
| | – | | Any increase is generally aligned with the average base salary increases applying to the broader employee population unless there were significant changes to an individual’s role and/or responsibilities during the year. Any increases are determined with reference to underlying Group and individual performance, global economic conditions, role responsibilities, an assessment against relevant comparator groups and internal relativities. | | |
| | – | | An increase above the maximum noted above for executives who are not directors may be made in the event of internal promotion or increase in responsibility or where the executive’s salary is significantly below market positioning. | | |
| | | – | | Benchmarking is undertaken periodically but not annually, and our intention is to apply judgment in evaluating market data. | | |
| Pension or superannuation | | – | | Employment benefits typically include participation in a pension plan, superannuation fund, or a cash allowance to contribute to a personal pension or superannuation fund. | | – We provide locally competitive post-employment benefits in a cost-efficient manner in order to hire and retain. |
| | | – | | The maximum level of Company contribution to an individual executive director’s schemes annually is 35 per cent of base salary. | |
| Other benefits | | – | | Include private healthcare cover for the executive and their dependants, company car or allowance, car parking, life insurance, accident insurance, provision of Company-provided transport/chauffeur, professional advice, participation in local flexible benefit programmes and certain other minor benefits (including modest retirement gifts in applicable circumstances, occasional spouse travel in support of the business and any Rio Tinto business expenses which are deemed to be taxable where the Company has paid the tax on their behalf). | | – We provide competitive other benefits in a cost-efficient manner to hire and retain. |
| | – | | Secondment and relocation payments (for example, housing, tax equalisation, the payment of school fees and periodic visits home for the executive and their family) may also be made to and on behalf of executives living outside their home country. Examples of these types of payments in 2013 are set out in the Implementation Report. | | |
| | | – | | Other benefits are paid at cost and, given the nature and variety of the items, there is no formal maximum level of Company contribution. | | |

| | | | |
| | 71 riotinto.com/reportingcentre2013 | | |
Remuneration Report: Remuneration Policy continued
| | | | |
| Remuneration arrangements – Performance-related (At risk) | | Link to Group performance and strategy |
Short Term
Incentive Plan
(STIP) | | – The threshold and maximum annual bonus opportunities for commensurate performance under the STIP for executives are 50 per cent and 200 per cent of base salary respectively. If target performance is achieved, the bonus opportunity is up to 120 per cent of base salary for executive directors and up to 100 per cent of base salary for other executives. These percentages, with the exception of the maximum percentage, are subject to the exercise of discretion by the Committee. – A scorecard of key performance indicators (KPIs) is established for each executive at the commencement of the financial year. The measures and the relative weightings are selected by the Committee in order to drive business performance for the current year, including the achievement of financial, safety and other individual business outcomes that are priorities for the financial year in question. – The measures, weightings and targets are reviewed annually and are included either prospectively or retrospectively each year in the Implementation Report. The Committee retains flexibility to determine the measures, weightings and targets as appropriate, based on the outcomes of its annual review. – We expect to disclose the measures, weightings and targets for safety goals at the beginning of each year. In the area of financial and individual goals, we will, at the beginning of each year, disclose the measures and weightings only, because we regard the targets as commercially sensitive. However, we intend to disclose targets and outcomes retrospectively. In the rare instances where this may not be prudent on grounds of commercial sensitivity, we will seek to explain why and give an indication of when they will be disclosed. – Threshold, target and outstanding performance levels are established for all STIP measures to help drive high levels of business and individual performance. – The central case or “base” plan delivers what the board considers to be target performance. Target performance is intended to be stretching. Probability factors are then applied, based upon a range of potential operating and cost scenarios, to establish the threshold and outstanding performance levels. These threshold (below target), target, and outstanding (above target) levels are determined by the Committee at the beginning of each performance year. – The Committee seeks to ensure, in making its year end determination of STIP awards, that actual performance is directly comparable to the targets set at the beginning of the year. This sometimes results in adjustments to the targets being made by the Committee, (in particular to take account of events outside management’s control) to ensure a like-for-like comparison. Both upward and downward adjustments can be made, with reference to principles agreed by the Committee, to ensure the outcomes fairly reflect the board’s objectives. – Safety KPIs comprise a significant portion of the STIP for executives, and any fatality will have a material impact on the STIP score for the relevant executives. | | – STIP focuses participants on achieving demanding annual performance goals, which are based on the Group’s KPIs, in pursuit of the creation of sustainable shareholder value. – We demand that sustainable business practices are adhered to, particularly in the context of safety. – When reviewing the outcome of the awards under the STIP the Committee will, when evaluating overall safety, financial, Group and individual performance consider the overall fairness against original expectations and shareholder experience. – Any discretionary adjustments for directors will be disclosed in the Implementation Report for the financial period. |
Bonus
Deferral Plan
(BDP) | | – Fifty per cent of the STIP is delivered in deferred shares under the BDP, with the remainder delivered in cash. – The BDP vests in the December of the third year after the end of performance year to which it relates. – The number of BDP shares which are awarded is increased by reference to the dividends paid in the deferral period before vesting. – BDP shares lapse if the participant resigns or is dismissed for misconduct before vesting but, unless the Committee decides otherwise, vest on leaving for any other reason. – BDP shares vest on a change of control. | | – The BDP ensures ongoing alignment between executives and shareholders through deferral of 50 per cent of STIP awards into Rio Tinto shares. |
| | | | |
| | 72 riotinto.com/reportingcentre2013 | | |
| | | | |
| Remuneration arrangements – Performance-related (At risk) | | Link to Group performance and strategy |
Performance
Share Plan (PSP) | | – A new plan was approved by shareholders at the 2013 AGMs. – Awards under the new PSP have a maximum face value of 438 per cent of base salary (ignoring dividend equivalents as described below). – The awards have been calculated independently by our consultants (Towers Watson since 1 August 2013 and Deloitte LLP previously) to have an expected value of approximately 50 per cent of face value. Expected value is face value adjusted for the probability of the performance target being met. – This means that the expected value that can be awarded under the PSP is a maximum of 219 per cent of base salary (ie 438 per cent x 50 per cent). The threshold value is a maximum of 98.6 per cent of base salary (ie 438 per cent x 22.5 per cent). – Actual award levels vary for each executive and are included in the Implementation Report. – Conditional share awards vest subject to the achievement of stretching performance conditions, comparing Rio Tinto’s performance against: – One-third: TSR relative to the HSBC Global Mining Index; – One-third: TSR relative to the Morgan Stanley Capital World Index (MSCI); and One-third: improvement in EBIT margin relative to the global mining comparators which will be listed in the Implementation Report each year. – Each component of the award will be assessed independently. Details of the TSR and EBIT margin measures (targets and vesting schedules) will be set out in the Implementation Report each year. Those for 2013 can be found on page 108. – With respect to the EBIT margin measure, in order to ensure that outcomes are fair and that business performance has been appropriately taken into account, the Committee will consider, on a discretionary basis, any specific, significant, unusual, “below the line” items (eg impairments) reported by Rio Tinto or its peers during the performance period to ensure genuine comparability when determining any level of vesting indicated by third-party data. The application of any such discretion will be disclosed. – The outperformance required for maximum vesting under all components of the award is considered by the Committee to be very stretching. – If, but only if, vesting is achieved, participants in the PSP shall be entitled to receive a number of additional shares whose market value reflects the aggregate cash amount of dividends that would have been received had the shares which have vested at the end of the performance period been held throughout the performance period. – Awards and performance conditions can be adjusted to take account of variations of capital and other transactions. Subject to this policy, performance conditions may be amended in other circumstances if the Committee considers that a changed performance condition would be a fairer measure of performance. – If there is a change of control, awards will vest to the extent performance conditions are then satisfied. If the change of control happens during the first 36 months from the date of grant of the award, the number of shares that can vest will be reduced pro rata over that 36 months period. The Committee may, alternatively, with agreement of an acquiring company, replace awards with equivalent new awards over shares in the acquiring company. – As described under the malus and claw back provisions on page 71, the Committee retains the discretion to reduce or cancel awards before they vest (malus) or to recover the value of awards after vesting (claw back). – The Committee will seek to ensure that outcomes are fair and that they take account of the overall performance of the Company during the performance period. | | – The PSP incorporates a simple structure to align executive reward with shareholder returns and operational performance over a long-term horizon. – Award levels are set to incentivise executives to meet the long-term strategic goals of the Group, to provide retention for the executive team and to contribute towards the competitiveness of the overall remuneration package. – TSR rewards the delivery of superior returns to shareholders over the long-term. – EBIT margin improvement rewards sustained operational performance of our business and the cost-competitive operation of our mining assets, a core part of our strategy. – How performance is generated is as important as what level of performance is delivered. Before vesting, the Committee must satisfy itself that relative TSR and EBIT margin performances are an appropriate reflection of the underlying performance of the business, and can adjust vesting accordingly. – Awards will normally have a
five-year performance period to provide long-term alignment with the interests of shareholders. – As a transitional measure, awards granted in 2013 will vest 50 per cent after four years and 50 per cent after five years. |
The long-term incentive awards made prior to 2013, and under which payments are still intended to be made should the relevant performance conditions be satisfied, can be paid out under this policy. The details of the awards granted prior to 2013 which have yet to vest, including the details of the performance conditions, are provided in the Implementation Report.
| | | | |
| | 73 riotinto.com/reportingcentre2013 | | |
Remuneration Report: Remuneration Policy continued
Total remuneration opportunity
The following charts provide an indication, based on 2014 remuneration and the upcoming 2014 PSP awards, of what can be achieved under the Remuneration Policy for the executive directors at below threshold (A), threshold (B), target (C) and outstanding (D) performance levels, together with the proportion of the package delivered through fixed and variable remuneration. The PSP, STIP deferred shares and STIP cash are all performance-related remuneration. UK legislation requires that these charts are given in relation to the first year in which the Remuneration Policy applies.
| | |
| Sam Walsh (chief executive) | | Chris Lynch (chief financial officer) |
| |
Potential value of 2014 remuneration package A$’000 | | Potential value of 2014 remuneration package £’000 |
| |
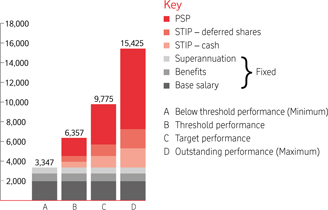 | | 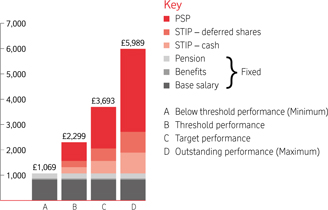 |
| |
Proportion of the 2014 remuneration package value
delivered through fixed and variable remuneration % | | Proportion of the 2014 remuneration package value
delivered through fixed and variable remuneration % |
| |
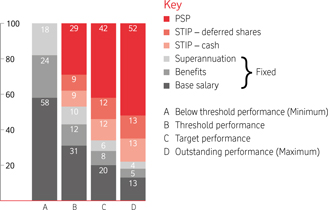 | | 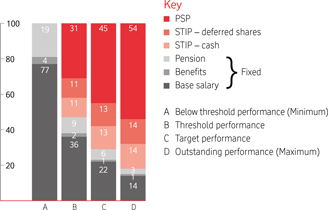 |
The following table provides the basis for the values included in the charts above:
| | | | | | | | | | | | | | | | |
Fixed (stated in ‘000) – shown as column A above | |
| Base
Salary |
(a) | |
| Superannuation
or pension |
(b) | | | Benefits | (c) | |
| Total
fixed |
|
Sam Walsh | | | A$1,948 | | | | A$608 | | | | A$791 | | | | A$3,347 | |
Chris Lynch | | | £820 | | | | £204 | | | | £45 | | | | £1,069 | |
| (a) | Base salary is the latest known salary. |
| (b) | Superannuation for Sam Walsh is measured on a basis consistent with the single figure superannuation figure as set out on page 82 but assumes that Sam’s accrued benefit at 31 December 2013 will receive investment earnings at the rate of six per cent. The final value for 2014 will depend on the actual investment earnings received and may therefore be significantly different. The pension value for Chris reflects an estimate for the full year. |
| (c) | Benefits are as measured at the benefits figure in the single figure tables on pages 82 and 85 excluding amounts considered to be one-off in nature. These one-off items, which related to Sam’s and Chris’s relocations from Australia to London during 2013, were A$206,000 and £896,000 respectively. Note that this number for Sam includes expatriate benefits which are not capped. |
| | | | |
| | 74 riotinto.com/reportingcentre2013 | | |
| | |
| Performance-related (At risk) |
| Threshold STIP and LTIP(a) performance – shown as column B above | | – A STIP award of 50% of the target STIP opportunity, ie 60% of base salary – Threshold vesting of the PSP award at 22.5% of face value, calculated as 94.5% and 90.0% of base salary for Sam Walsh and Chris Lynch respectively |
| Target STIP and LTIP performance shown as column C above | | – A STIP award of 100% of the target STIP opportunity, ie 120% of base salary Expected value of the PSP award of 50% of face value, calculated as 210% and 200% of base salary for Sam Walsh and Chris Lynch respectively |
| Outstanding STIP and LTIP performance (Maximum) – shown as column D above | | – A maximum STIP award of 200% of base salary – Full vesting of the PSP award, calculated as 420% and 400% of base salary for Sam Walsh and Chris Lynch respectively |
| (a) | Long-term incentives consist of share awards only, measured at 2014 (face) value as disclosed on pages 83 and 86 of this report. This does not constitute an estimate of the value of awards that may potentially vest with respect to year end 31 December 2014. No assumption has been made for increase in share price or payment of dividends. |
Context for outstanding performance
Demanding performance targets are designed to ensure that the level of remuneration is aligned with performance delivered for shareholders. Outstanding business and individual performance is required to achieve the maximum level of remuneration. This comprises:
| – | outstanding performance against all financial; health and safety and individual STIP measures; |
| – | TSR outperformance against both the HSBC and MSCI indices by six per cent per annum over five years; and |
| – | EBIT margin improvement equal to or greater than the second ranked company in the comparator group over five years. |
The intention of the Committee is that if these levels of reward are achieved by our executives then shareholders will benefit over time from superior share price performance.
Discretions
The Committee recognises the importance of ensuring that the outcomes of the Group’s executive pay arrangements described in this Remuneration Policy properly reflect the Group’s overall performance and the experience of its shareholders and other stakeholders over the performance period.
The Committee undertakes to owners that it will exercise discretion diligently and in a manner that is aligned with our strategy to create long-term shareholder value. Accordingly, when reviewing the operation of short and long-term incentive plans and the outcome of awards made under these plans, the Committee will, when evaluating safety, financial, Group and individual performance, consider the overall shareholder experience during the performance period in question.
It is the Committee’s intention that the mechanistic outcome of performance conditions relating to awards made under such plans will routinely be subject to review to avoid outcomes which could be seen as contrary to shareholders’ expectations. To the extent provided for in the terms of any performance condition or in accordance with any relevant amendment power under the plan rules, the Committee may adjust and/or set different performance measures if events occur (such as a change in strategy, a material acquisition or divestment, a change in control or unexpected event) which cause the Committee to determine that the measures are no longer appropriate or in the best interests of shareholders and that the amendment is required so that the measures achieve their original purpose. Committee discretion should not operate as an automatic override, and it must be exercised judiciously.
To the extent that discretion is applied in any year, the Committee undertakes that this will be clearly explained and disclosed to shareholders in the Implementation Report.
Recruitment remuneration
Our approach to recruitment remuneration for executives (both external and internal) is set out below. Shareholders are reminded that the following principles are binding only in so far as they relate to the recruitment of directors.
We aim to position base salary at an appropriate level, taking into consideration a range of factors including an executive’s current remuneration, experience, internal relativities, an assessment against relevant comparator groups and cost.
Other elements of remuneration will be established in line with the Remuneration Policy set out in the executive remuneration structure table on pages 71 to 73. As such, annual variable remuneration for new appointees will comprise a maximum award of 200 per cent of base salary under the STIP and a maximum award of 438 per cent of base salary under the PSP.
In the event that an internal appointment is made, existing commitments will be honoured.
If the Committee concludes that it is necessary and appropriate to secure an appointment, relocation-related support and international mobility benefits may also be provided depending on the circumstances. Examples of recent relocation arrangements are set out on page 86 of the Implementation Report.
Any compensation provided to an executive recruited from outside the Group for the forfeiture of any award under variable remuneration arrangements entered into with a previous employer is considered separately to the establishment of forward looking annual remuneration arrangements. Our policy with respect to such “buy-outs” is to determine a reasonable level of award, on a like-for-like basis, of primarily equity-based, but also potentially cash or restricted stock, taking into consideration the quantum of forfeited awards, their performance conditions and vesting schedules. The Committee will obtain an independent external assessment of the value of awards proposed to be bought out and retains discretion, subject to the above, to make such compensation as it deems necessary and appropriate to secure the relevant executive’s employment. The Committee’s intention is that buy-out compensation should include, where appropriate, performance-tested equity.
| | | | |
| | 75 riotinto.com/reportingcentre2013 | | |
Remuneration Report: Remuneration Policy continued
Executives’ service contracts and termination
The Committee will seek to honour any commitments made in respect of termination of employment in the executive directors’ service contracts predating this Remuneration Policy which are described in this section. This section also sets out Rio Tinto’s policy on termination payments and notice periods. Shareholders are reminded that such policy is binding only in so far as it relates to directors.
For new appointments where the Company terminates by making a payment in lieu of notice, the Committee will for executive directors (to the extent permitted by relevant law) have regard to the executive director’s ability to mitigate his loss in assessing the payment to be made.
The executive directors have service contracts that, save as noted below, can be terminated by either party with 12 months’ notice in writing, or immediately by paying the base salary only in lieu of any unexpired notice. An initial notice period of up to 24 months during the first two years of employment, reducing to 12 months thereafter, may sometimes be necessary to secure an external appointment.
Sam Walsh’s employment concludes, without the need for either party to give notice, on 31 December 2015. The Company may also terminate his employment for any reason on 31 December 2014, provided it gives notice of this decision by 31 October 2014. The Company or Sam may terminate this employment at any time by giving written notice of 12 months or such lesser period as may exist between the date on which the notice is given and 31 December 2014.
Chris Lynch’s employment concludes, without the need for either party to give notice, on 28 February 2017. The Company may terminate Chris Lynch’s employment for any reason on 29 February 2016, provided it gives notice of this decision by 31 December 2015. The Company or Chris may terminate this employment at any time by giving written notice of 12 months or such lesser period as may exist between the date on which the notice is given and 29 February 2016.
Other executives have service contracts which can be terminated by the Company with 12 months’ notice in writing, and by the employee with six months’ notice in writing, or immediately by the Company by paying the base salary only in lieu of any unexpired notice.
Jacynthe Côté is eligible to receive 24 months’ base salary and target STIP opportunity (which if taken as salary continuance, will include ongoing participation in benefit programmes during that period), inclusive of notice to the extent paid, in line with entitlements under her Alcan Inc. contract which the Company inherited on the acquisition of Alcan Inc.
Executives may be required to undertake garden leave during all or part of their notice period and may receive their contractual salary, STIP and benefits during the notice period (or the cash equivalent). Where applicable, tax equalisation and other expatriate benefits will continue in accordance with the executive’s prevailing terms and conditions.
In the case of dismissal for cause, the Company can terminate employment without notice and without payment of any salary or compensation in lieu of notice. Deferred bonus shares and outstanding awards under the LTIP may be forfeited in these circumstances.
Accrued but untaken annual leave and any long service leave will be paid out on termination, in accordance with the relevant country legislation and applicable practice applying to all employees. For eligible leavers (as defined below), in Australia the value of the leave is calculated on the basis of base salary, target STIP and car allowance. No STIP is included where the executive is not an eligible leaver.
If termination is a result of redundancy, the terms of the relevant local policy may apply in the same way as for other local employees.
On termination the Company will pay relocation or expatriation benefits as agreed on the original expatriation and/or in accordance with its applicable
policies on travel and relocation. For example, Sam Walsh is provided with expatriation benefits and allowances and on termination of his employment by the Company repatriation expenses would be paid.
On termination, other than for cause, the Company may make a payment in consideration for entry by the departing executive director into appropriate restrictive covenants to protect Rio Tinto and its shareholders. The amount of such payment will be determined by the Committee based on the content and duration of the covenant.
Following termination, executive directors may be eligible to exercise long-term incentives awards under the conditions described in the sections following. They and their dependants may also be eligible for post-retirement benefits such as medical and life insurance. The Company may also agree to continue certain other benefits for a period following termination where the arrangements are provided under term contracts or in accordance with the terms of the service contract, for example, payment for financial advice, tax advice and preparation of tax returns for a tax year. In some cases, they may receive a modest retirement gift.
The Company may pay such amount as it determines is reasonable to settle any claims which in the Committee’s view are legitimate which the executive director may have in connection with the termination of his employment. The Company may also pay reasonable legal and other professional fees (including outplacement support) to or in respect of a director in connection with the termination of his employment. These may include legal fees incurred by him in negotiating a settlement agreement with Rio Tinto. In assessing what is reasonable, the Company will take account of prevailing rates for such advice and support and determine appropriate level of contribution based on the complexity of the issues.
Positions held and date of appointment to position
| | | | |
| Name | | Position(s) held during 2013 | | Date of appointment to position |
| Executive directors | | |
| Sam Walsh(a) | | Chief executive | | 17 January 2013 |
| | Chief executive, Iron Ore and | | 5 June 2009 |
| | | Australia | | |
| Chris Lynch(b) | | Chief financial officer | | 18 April 2013 |
| | | Non-executive director | | 1 September 2011 |
| Tom Albanese(c) | | Chief executive | | 1 May 2007 |
| Guy Elliott(d) | | Senior executive director | | 18 April 2013 |
| | | Chief financial officer | | 19 June 2002 |
| (a) | Mr Walsh held the role of chief executive, Iron Ore and Australia until 16 January 2013. |
| (b) | Mr Lynch was appointed as an executive director on 1 March 2013 and assumed the role of chief financial officer on 18 April 2013. |
| (c) | Mr Albanese held the role of chief executive until 17 January 2013. He stepped down from the Executive Committee on this date and left the Group on 16 July 2013. |
| (d) | Mr Elliott held the role of chief financial officer until 18 April 2013. He stepped down from the Executive Committee on this date and retired from the Group on 31 December 2013. |
| (e) | The details for other executives are provided in the Implementation Report. |
Treatment of STIP and LTIP on termination
The STIP and share plan rules govern the entitlements that executive participants may have under those plans upon termination of employment. Usually there is a discretion for the Remuneration Committee to treat a person as an eligible leaver.
An eligible leaver is an executive who leaves the Group by reason of ill-health, injury, disability (as determined by the executive’s employer); retirement; redundancy; transfer of the undertaking in which the executive works; change of control of the executive’s employing company; or death.
| | | | |
| | 76 riotinto.com/reportingcentre2013 | | |
Short Term Incentive Plan (STIP)
If an eligible leaver leaves the Group during a performance year, the Committee may determine in its absolute discretion to award a pro rata portion of the STIP based on the amount of the year served and based on actual assessment of performance against targets. Any cash payment will be made at the normal STIP payment date and no portion of the award will be deferred into shares.
If an executive provides the Company notice of their resignation during the performance year, but will not leave the Group until after the end of the performance year, the Committee may determine in its absolute discretion to make an award under the STIP. In these circumstances, the executive will only be eligible to receive the cash portion of the award and will forfeit the deferred shares portion. Any cash payment will be made at the normal STIP payment date.
No STIP payment will be made where an executive resigns or is terminated for cause prior to the end of the performance year.
Bonus Deferral Plan (BDP) (2013 onwards)
For grants made to executives from and including 2013, awards will normally be retained and vest at the scheduled vesting date, save where the Committee determines otherwise. There will be no pro rata reduction of awards and any dividend equivalent shares will be calculated on the vested shares.
If the executive resigns or is dismissed for misconduct, or for any other reason that the Committee decides, the awards will lapse.
BDP (pre-2013)
For grants made to eligible leavers before 2013, awards will normally vest at the scheduled vesting date save where the Committee determines otherwise. There will be no pro rata reduction of awards and any dividend equivalent shares will be calculated on the vested shares.
If an executive leaves the Group for any other reason awards will lapse.
For any BDP award, where required by law or regulation, and the Remuneration Committee allows, cash may be provided in lieu of shares.
PSP (2013 onwards)
For grants made to executives from and including 2013, awards will normally be retained, and vest at the scheduled vesting date. Unvested awards remain subject to the satisfaction of the performance conditions. Any dividend equivalent shares will be calculated on the vested shares at vesting.
If the executive leaves the Group during the first 36 months from the date of grant of the award, the number of shares that can vest will be reduced pro rata over that 36-month period.
Awards will vest immediately on death, but if an executive dies during the first 36 months from the date of grant of the award, the number of shares that can vest will be reduced pro rata over that 36-month period.
If the executive resigns or is dismissed for misconduct, or for any other reason that the Committee decides, the awards will lapse.
PSP (pre-2013)
For grants made to eligible leavers before 2013, awards will normally be retained and vest at the scheduled vesting date, although the Committee may determine that awards should vest early. Unvested awards remain subject to the satisfaction of the performance conditions.
Awards vest immediately on death. The number of shares vesting is determined on the assumption that performance conditions are met at median level or at the level to which they are actually satisfied at the date of death, if higher. The number of shares is further reduced as described above.
If an executive leaves the Group for any other reason awards will lapse.
For any PSP award, where permitted, and the Remuneration Committee allows, awards may be made in cash in lieu of shares.
Share Option Plan (SOP) (pre-2013)
For grants made to eligible leavers before 2013, awards will normally be retained. If the executive is an eligible leaver, vested awards will lapse one year from the date the executive leaves the Group and unvested awards will lapse one year from the vesting date or such longer period as permitted by the Committee. Unvested awards remain subject to the satisfaction of the performance conditions.
Awards vest in full on death.
If an executive leaves the Group for any other reason, unvested awards and vested awards that have not been exercised will lapse.
Management Share Plan (MSP)
Awards under the MSP are only made to executives prior to their appointment as an Executive Committee member. All retained awards will be reduced pro rata to reflect the proportion of the period between the date of grant of the award and the normal vesting date which has not elapsed at the time employment ceased. Any dividend equivalent shares or cash equivalent will be calculated on the vested shares. Awards vest on death, subject to the pro rata reduction described above.
MSP (2013 onwards)
For grants made to executives from and including 2013, awards will normally be retained, and vest, at the Committee’s discretion, at the scheduled vesting date (although awards of US taxpayers may vest on leaving).
If the executive resigns or is dismissed for misconduct, or for any other reason that the Committee decides, the awards will lapse.
MSP (pre-2013)
For grants made to eligible leavers before 2013, awards will normally be retained by the executive, and vest, at the Committee’s discretion, at the scheduled vesting date (although awards of US taxpayers may vest on leaving).
If an executive leaves the Group for any other reason awards will lapse.
| | | | |
| | 77 riotinto.com/reportingcentre2013 | | |
Remuneration Report: Remuneration Policy continued
Chairman and non-executive directors’ remuneration
Chairman
It is Rio Tinto’s policy that the chairman should be remunerated on a competitive basis and at a level which reflects his contribution to the Group, as assessed by the board.
The Committee determines the terms of service, including remuneration, of the chairman. The chairman’s fees are set by the Committee. The chairman has no part in the setting of his fees and is not present at any discussion at the Committee about his fees.
The chairman receives a fixed annual fee and does not receive any additional fee or allowance either for committee membership or chairmanship, or for travel. The chairman does not participate in the Group’s incentive plans.
The chairman is provided with a car and driver. Any use for transport between home and the office and other personal travel is a taxable benefit to the chairman, and the Company pays any tax arising on the chairman’s behalf. The chairman pays a fixed annual fee to the Company for the personal travel element.
Other benefits provided include private healthcare cover, accident insurance (note this is neither contractual nor a taxable benefit), other minor benefits (including modest retirement gifts in applicable circumstances), occasional spouse travel in support of the business and any Rio Tinto business expenses which are deemed to be taxable where the Company has paid the tax on his behalf. Rio Tinto does not pay retirement or post-employment benefits to the chairman.
Non-executive directors
Fees paid to non-executive directors reflect their respective duties and responsibilities and the time required to be spent by them so as to make a meaningful and effective contribution to the affairs of Rio Tinto.
The non-executive directors’ fees and other terms are set by the board upon the recommendation of the Chairman’s Committee (which comprises the chairman, chief executive and chief financial officer).
Non-executive directors receive a fixed annual fee comprising a base fee, committee membership or committee chairmanship fee or senior independent director fee, as applicable, and allowances for attending meetings which involve medium or long-distance air travel. They do not participate in any of the Group’s incentive plans.
Where the payment of statutory minimum superannuation contributions for Australian non-executive directors is required by Australian superannuation law, these contributions are deducted from the director’s overall fee entitlements.
Non-executive directors may on occasion receive reimbursement for costs incurred in relation to professional advice. These payments, if made, are taxable benefits to the non-executive directors and the tax arising is paid by the Company on the director’s behalf.
Other benefits provided include accident insurance (note this is neither contractual nor a taxable benefit), other minor benefits (including modest retirement gifts in applicable circumstances), occasional spouse travel in support of the business and any Rio Tinto business expenses which are deemed to be taxable where the Company has paid the tax on their behalf. Rio Tinto does not pay retirement or post-employment benefits to non-executive directors.
Appointment
The appointment of non-executive directors (including the chairman) is handled through the Nominations Committee and board processes. The current fee levels are set out in the Implementation Report on page 88.
Details of each element of remuneration paid to the chairman and non-executive directors during 2013 are set out in the Implementation Report in table 1b on page 100.
The chairman’s letter of appointment from the Company stipulates his duties as chairman of the Group. His appointment may be terminated without liability on the part of Rio Tinto in accordance with the Group’s constitutional documents dealing with retirement, disqualification from office or other vacation from office. Otherwise, his appointment may be terminated by giving 12 months’ notice. There are no provisions for compensation payable on termination of his appointment, other than if his appointment as chairman is terminated by reason of his removal as a director pursuant to a resolution of shareholders in general meeting in which case the Company shall be liable to pay any fees accrued to the date of any such removal.
The non-executive directors’ letters of appointment from the Company stipulate their duties and responsibilities as directors. Each non-executive director is appointed subject to their election and annual re-election by shareholders. Non-executive directors’ appointments may be terminated by giving three months’ notice. There are no provisions for compensation payable on termination of their appointment. The letters of appointment are available for inspection at Rio Tinto plc’s registered office, and at its annual general meeting.
In accordance with the provisions of the Group’s constitutional documents, the maximum aggregate fees payable to the non-executive directors (including the chairman) in respect of any year, including fees received by the non-executive directors for serving on any committee of the boards, and any travel allowances received by the non-executive directors for attending meetings will not in any year exceed £3,000,000. Non-monetary benefits are not included in this limit.
| | | | |
| | 78 riotinto.com/reportingcentre2013 | | |
Remuneration Report: Implementation Report
Implementation Report introduction
This Implementation Report is presented to shareholders for approval at the AGMs and outlines how our Remuneration Policy was implemented in 2013 and how it is intended to be operated in 2014.
Remuneration for executives set out in the single total figure of remuneration tables is shown gross of tax and in the relevant currency of award or payment. The information reported for executives in table 1a on pages 98 and 99 is reported in accordance with Australian statutory disclosure requirements and is shown gross of tax and in US dollars. UK and Australian remuneration figures are generally not comparable due to the different methodologies required to calculate various parts of the remuneration packages, most notably LTIP arrangements and the value of pension or superannuation.
In addition to executive remuneration, this report covers the remuneration of the chairman and the non-executive directors in table 1b on page 100. All figures are shown gross of tax and in US dollars.
Remuneration Committee responsibilities
The Committee’s responsibilities are set out in its terms of reference which are available in the corporate governance section of the Rio Tinto website. The responsibilities of the Committee include:
| – | determining the remuneration structure and policies, and assessing their cost, including pension and superannuation arrangements for executives; |
| – | determining the use of short and long-term incentive plans for executives; |
| – | overseeing the operation of the Group’s short and long-term incentive plans as they relate to executives, including the approval of awards, setting of performance criteria, where applicable, and determination of any vesting; |
| – | determining contractual notice periods and termination commitments and setting any retention and termination arrangements for executives; |
| – | determining awards under the Group’s all-employee share plans; and |
| – | determining the terms of service upon appointment and any subsequent changes for the chairman and executives. |
The Committee considers the level of pay and conditions throughout the Group when determining executive remuneration and ensures that the same principles are used when designing the broader employee remuneration policies.
The members of the Committee are John Varley (chairman), Jan du Plessis, Michael Fitzpatrick, Richard Goodmanson and Paul Tellier.
The membership and meeting attendances are detailed in the corporate governance section on page 59. The Committee is supported by executives and members of senior management who regularly attend meetings to provide information as requested by the Committee. These included Sam Walsh (chief executive), Hugo Bague (Group executive, Organisational Resources), John Beadle (vice president, Executive Performance and Reward) and Eleanor Evans (company secretary). None of the attendees mentioned above was present when matters associated with their own remuneration were considered by the Committee.
How the Committee spent its time in 2013
During 2013, the Committee met eight times. It fulfilled its responsibilities as set out in its terms of reference.
In particular, its work in 2013 and the early part of 2014 have included:
| – | reviewing and determining any base salary adjustments for executives; |
| – | reviewing and determining threshold, target and outstanding performance targets used in the 2013 STIP, assessing any applicable adjustments and those to be used in the 2014 STIP; |
| – | reviewing actual performance against the targets in the 2013 STIP; |
| – | reviewing and determining the outcomes for LTIP awards vesting at the end of 2013; |
| – | reviewing and determining LTIP grants for the executives in 2014; |
| – | reviewing and determining the terms of promotion or appointment for Sam Walsh, Chris Lynch, Andrew Harding, Jean-Sébastien Jacques, and Hugo Bague; |
| – | determining the terms of departure for Tom Albanese and Doug Ritchie; and |
| – | reviewing the Group’s Remuneration Policy and preparing the Remuneration Report (including this Implementation Report) in the light of the new UK regulations and generally. |
The performance targets under the LTIP and the Company’s approach to establishing the performance targets under the STIP are detailed in the executive remuneration structure table on pages 71 to 73. The Committee’s approach to the commercial sensitivity of certain targets is discussed below.
Independent advisers
The independent advisers engaged by and reporting to the Committee from January to July 2013 were Deloitte LLP.
In June 2013 the Committee appointed Towers Watson as its independent advisers with effect from 1 August 2013. During 2013 the Committee formally reviewed and determined the scope of services which it required to be provided by an independent adviser, and issued an invitation to tender to a range of candidates, all of which were members of the Remuneration Consultants’ Group and had specific expertise in advising UK and Australian listed companies on a variety of remuneration matters. The decision to appoint Towers Watson was made following a detailed review of tender responses, and a formal interview process. Towers Watson, and Deloitte LLP before them, report to the Committee.
To ensure that “remuneration recommendations” (being advice relating to the elements of remuneration for key management personnel, as defined under the Australian Corporations Act) were made free from undue influence by key management personnel to whom they may relate, the Committee established a protocol for the engagement of and interaction with remuneration consultants and has monitored compliance with its requirements throughout 2013. Declarations were given by Deloitte LLP or Towers Watson to the effect that remuneration recommendations were made free from undue influence of key management personnel to whom they related. The board has received assurance from the Committee and is therefore satisfied that the remuneration recommendations received from Deloitte LLP and Towers Watson were made free from undue influence by key management personnel to whom any of the remuneration recommendations related.

| | | | |
| | 79 riotinto.com/reportingcentre2013 | | |
Remuneration Report: Implementation Report continued
Both Deloitte LLP and Towers Watson are members of the Remuneration Consultants’ Group and, as such, voluntarily operate under the Code of Conduct (the Code) in relation to executive remuneration consulting in the UK. The Code is based upon principles of transparency, integrity, objectivity, competence, due care and confidentiality by executive remuneration consultants. Deloitte LLP and Towers Watson have confirmed that they adhered to the Code throughout 2013 for all remuneration services provided to Rio Tinto. It is available at remunerationconsultantsgroup.com.
Deloitte LLP and Towers Watson are the only remuneration consultants which provided remuneration recommendations to the Committee during 2013. The Committee is content that Deloitte LLP and Towers Watson, in providing remuneration advice to the Committee, did not have any connections with Rio Tinto that impaired its independence.
During 2013, as part of their respective engagements, Deloitte LLP and Towers Watson provided remuneration recommendations to the Committee, including Committee meeting attendance and advice in relation to management proposals. Deloitte LLP was paid US$89,588 for these services. Towers Watson was paid US$101,854 for these services.
Deloitte LLP and Towers Watson respectively provided general and technical executive remuneration services. These services included benchmarking data and advice about remuneration of employees other than key management personnel across the Group, and advice from Towers Watson in relation to preparation of the 2013 Remuneration Report. Deloitte LLP was paid US$110,616 for these services. Towers Watson was paid US$150,575 for these services.
Deloitte LLP provided various non-audit services to the Group during 2013 (including advice in relation to taxation, project management and consulting and advisory services), and was paid a total of US$8.96 million for these services. Towers Watson provided non-audit services to the Group during 2013 (including consultancy and advisory services) and was paid a total of US$387,233 for these services. Towers Watson advises various Rio Tinto pension fund trustees.
Other services and publications were received from a range of advisers in relation to remuneration data.
Performance review process for executives
Rio Tinto conducts an annual performance review process for all of its executives. In the case of members of the Executive Committee, the chief executive conducts the review. In the case of the chief executive, his performance is assessed by the chairman of the board.
The key objectives of the performance review process are to:
| – | improve organisational effectiveness by creating alignment between the executive’s objectives and Rio Tinto’s strategy; and |
| – | provide a consistent, transparent and balanced approach to measure, recognise and reward executive performance. |
All such reviews took place in 2013 or early 2014.
Share ownership policy for executives
The Group recognises the importance of aligning executives’ interests with those of shareholders and they are therefore expected to build up and maintain a meaningful shareholding. The Committee intends that executives should aim to reach a share ownership (defined below) in Rio Tinto shares equivalent in value to:
| | | | |
| | | Share ownership requirement | |
Chief executive | | | 4 x base salary | |
Other executives | | | 3 x base salary | |
The shareholding requirement was increased from the previous level of two times’ base salary for the chief executive and other executives as part of the changes to the Group’s long-term incentive arrangements in 2013.
The Committee expects that this shareholding will be built up over a five-year period by holding shares and share options that vest under the LTIPs. For new hires, longer periods may be accepted to build up this shareholding, given the five-year vesting periods for our PSP. Details of executives’ beneficial interests in Rio Tinto shares are set out in table 2 on page 101 and the details of awards of shares and options under long-term incentive plans are set out in table 3 on pages 102 to 108.
Shares will be treated as “owned” if they are not subject to restriction, and as such include shares directly held by the executive and any shares where there is a beneficial interest. A beneficial interest includes any shares where the executive receives the benefit of ownership (such as a right to receive dividends) without actually directly owning the shares.
A value for vested, but unexercised share options, is included, with a 50 per cent discount for the likely effects of taxation, on the basis that executives with unexercised vested options have a strong financial alignment with the share price and therefore with shareholder interests.
Additional shareholding requirements were introduced for senior management below the Executive Committee in 2013.
The following table illustrates the executive share ownership level for current members of the Executive Committee in office at 31 December 2013 as a multiple of salary as at the same date.
| | | | |
| | | Share Ownership
level at 31 December 2013
as a multiple of base pay | |
Hugo Bague | | | 3.3 | |
Jacynthe Côté | | | 3.5 | |
Alan Davies | | | 1.4 | |
Andrew Harding | | | 2.1 | |
Jean-Sébastien Jacques | | | 0.4 | |
Harry Kenyon-Slaney | | | 2.4 | |
Debra Valentine | | | 3.3 | |
The recent vesting of the 2010 PSP has increased the multiples noted above for several executives.
| | | | |
| | 80 riotinto.com/reportingcentre2013 | | |
Executives’ external and other appointments
Executives may be invited to become non-executive directors of other companies. It is Rio Tinto’s policy that such appointments can broaden the experience and knowledge of executives, to the benefit of the Group. This policy limits each executive’s external appointment to one FTSE100 company directorship or equivalent. Consequently, where there is no likelihood that such an appointment will give rise to a conflict of interest, the board will normally provide consent to the appointment. The executive is typically permitted to retain any fees earned.
Details of all executives’ external appointments can be found on pages 53 and 56.
Performance and impact on 2013 STIP
Group financial and safety measures are included in the STIP for executive directors and Group executives. The STIP measures for the product group chief executive officers (PGCEOs) include product group financial and safety measures in addition to the Group financial measures.
Safety measures for all executives in 2013 were split equally between lost time injury frequency rate (LTIFR) and all injury frequency rate (AIFR). The safety of our people is core to everything we do. Our goal is zero harm, including, above all, the elimination of workplace fatalities. We are committed to reinforcing our strong safety culture, and improving safety leadership.
The Committee selected the current financial measures of underlying earnings and cash flow because they are KPIs used in managing the business. Underlying earnings is the key financial performance indicator used across the Group. It gives insight to cost management, production growth and performance efficiency. We are focused on aggressively reducing our costs and increasing productivity to improve earnings and deliver greater value for shareholders. Operating cash flow is a complementary measure to underlying earnings. It also provides insight to how we are managing costs and increasing efficiency and productivity across the business. In measuring financial performance against the annual plan, half is measured against the original plan, and half is “flexed” to exclude the impact of uncontrollable fluctuations in exchange rates, quoted metal and other prices. Earnings and cash flow results are therefore compared against equally weighted flexed and unflexed targets.
The financial and safety measures and outcomes for the executive directors with commentary on key highlights are provided on page 91. Additional details for other executives are provided on page 90.
| | | | | | | | | | | | |
| Group measures | | Weight
(%) | | | Score
(out of 200%) | | | Weighted
score | |
| Group safety | | | 20.0 | | | | 38 | | | | 7.6 | |
| Underlying earnings | | | 12.5 | | | | 118 | | | | 14.8 | |
| Underlying earnings – flexed | | | 12.5 | | | | 117 | | | | 14.6 | |
| Cash flow | | | 12.5 | | | | 190 | | | | 23.8 | |
| Cash flow – flexed | | | 12.5 | | | | 198 | | | | 24.8 | |
| Group financial | | | 50.0 | | | | 156 | | | | 78.0 | |
| Safety and financial measures (a) | | | 70.0 | | | | 122.3 | | | | 85.6 | |
| Individual measures (b) | | | 30.0 | | | | – | | | | – | |
| Total(a) | | | 100.0 | | | | – | | | | – | |
| (a) | The weighted score represents the total financial score (out of a maximum of 200 per cent) weighted based on the total STIP opportunity of 70 per cent allocated to the safety and financial measures. |
| (b) | The outcomes against individual measures and the total score (out of 200 per cent) for executives are included in the following pages. |
Safety performance
Regrettably, we did not meet our goal of zero fatalities in 2013. Three people lost their lives while working at Rio Tinto managed operations. The fatalities were caused by a mobile equipment incident during road maintenance at Rio Tinto La Granja project in Peru, a crush incident at Rio Tinto Alcan’s Alma smelter in Canada, and a crush incident at Richards Bay Minerals in South Africa. We remain committed to achieving our goal of zero harm, including, above all, the elimination of workplace fatalities. Safe operations that protect our people are a priority and we work systematically to mitigate risks that are critical to operating safely. This is supported by our management system which provides the framework for incorporating hazard identification, risk assessment and risk management into all aspects of the operations.
The Remuneration Committee sought guidance from the Sustainability Committee on safety performance for 2013, as per our normal procedures. Both Committees noted the continued improvement in AIFR, with the Group’s AIFR reducing from 0.67 in 2012 to 0.65 in 2013. This did not meet the Group target for 2013 of 0.62, but was better than the threshold level of 0.71.
The LTIFR has, however, increased from 0.37 in 2012 to 0.42 in 2013, which was less than both the target and threshold levels of 0.35 and 0.37 respectively.
The combined performance meant that the overall Group result for safety was below threshold, with differentiated levels of safety performance across the product groups. Further reductions have also been applied as required for executives with portfolios where a fatality has occurred. The total safety score for the Group was 38 per cent (out of a maximum of 200 per cent).
Group financial performance
Highlights of 2013 include:
| – | Delivering in excess of US$3 billion of operating cash cost and exploration and evaluation savings over 2012. |
| – | Setting new production records in iron ore, bauxite and thermal coal and realising productivity gains across the portfolio. |
| – | Increasing underlying earnings by ten per cent over 2012 and improving cash flows by 22 per cent. |
| – | Reducing capital spend by 26 per cent and strengthening capital discipline. |
| – | Reducing net debt and announcing or completing divestments of US$3.5 billion. |
Additional details on our progress against strategy are provided on page 8.
The Group exceeded its earnings and cash flow targets set by the board, and this is reflected in the financial component of the STIP awards at the Group and product group level.
The Group’s underlying earnings and cash flow generated from operating activities for 2013 were US$10.2 billion and US$15.1 billion respectively, against targets of US$9.9 billion and US$12.3 billion respectively. The flexed earnings and cash flow targets were similar to the unflexed targets at US$9.9 billion and US$12.1 billion respectively. The Committee seeks to ensure, in making its year end determination of STIP awards, that actual performance is directly comparable to the targets set at the beginning of the year. This resulted in adjustments to the targets by the Committee, to take account of events outside management’s control, to ensure a like-for-like like comparison. Both upward and downward adjustments were made to the targets by reference to principles agreed by the Committee, which have been consistently applied over several years, to ensure the outcomes fairly reflect the board’s objectives.
Accordingly, the Group exceeded its financial target, with differentiated levels of financial performance across the product groups. The Group’s performance against the financial targets was 156 per cent (out of a maximum of 200 per cent).
| | | | |
| | 81 riotinto.com/reportingcentre2013 | | |
Remuneration Report: Implementation Report continued
STIP individual measures for 2013
Individual measures were set by the chairman for the chief executive and by the chief executive for other executives based on the following categories:
1. Business transformation
2. Cost reduction
3. Performance delivery
4. Leadership and engagement
Details of the outcomes against the individual measures are provided in the following pages.
Discretionary adjustments for 2013
Discretionary downward adjustments of ten per cent of the overall 2013 STIP award have been applied to the chief executive and the current and former chief financial officer for the project cost overrun in relation to the Kitimat modernisation project. Downward adjustments of 40 per cent have been applied to the former Group executive, Technology & Innovation and 20 per cent to the chief executive, Aluminium.
Performance and impact on LTIP vesting outcome for the period ended 31 December 2013
The performance shares under the PSP awarded in 2010 had a four-year performance period that ended on 31 December 2013. This award has an indicative vesting of 75 per cent of face value (50 per cent of maximum).
Share options under the SOP granted in 2011 had a performance period that ended on 31 December 2013. This award had an indicative vesting of 100 per cent of face value. Options can be exercised from 6 May 2014 until 6 May 2021.
The Committee considered the Group’s overall performance in the context of the LTIP awards that were due to vest at the end of 2013 and concluded that the vesting of awards based upon the achievement of the TSR measures set by shareholders was justified.
Further details of the LTIP outcomes for the period ended 31 December 2013 and in prior years are provided on page 95.
Sam Walsh (chief executive)
Single total figure of remuneration
The table below provides a summary of actual remuneration in respect of 2013 and prior years in accordance with UK legislation, stated in Australian dollars, the currency of Sam’s arrangements. This is in addition to the Australian statutory disclosure requirements set out in US dollars in table 1a on pages 98 and 99. The remuneration details set out in table 1a include theoretical accounting values relating to various parts of the remuneration packages, most notably LTIP arrangements, and require a different methodology for calculating the superannuation value. Accordingly, the figures below are not directly comparable with those in table 1a.
| | | | | | | | | | | | |
| (stated in A$‘000) | | 2013 | | | 2012 | | | 2011 | |
Base salary paid(a) | | | 1,889 | | | | 1,643 | | | | 1,571 | |
STIP payment – cash | | | 1,371 | | | | 1,075 | | | | 1,196 | |
STIP payment – deferred shares(b) | | | 1,370 | | | | 1,075 | | | | 1,196 | |
Total short-term pay | | | 4,630 | | | | 3,793 | | | | 3,963 | |
Value of LTIP awards vesting(c) | | | 3,121 | | | | 2,225 | | | | 1,383 | |
Superannuation(d) | | | 1,322 | | | | 745 | | | | 657 | |
Other benefits(e) | | | 997 | | | | 232 | | | | 92 | |
Single total figure of remuneration | | | 10,070 | | | | 6,995 | | | | 6,095 | |
Percentage change in total remuneration (2013 versus 2012; 2012 versus 2011) | | | 44.0 | % | | | 14.8 | % | | | – | |
Percentage of total remuneration provided as performance-related pay (STIP and LTIP) | | | 58.2 | % | | | 62.5 | % | | | 61.9 | % |
Percentage of total remuneration provided as non-performance-related pay (base salary, pension and other benefits) | | | 41.8 | % | | | 37.5 | % | | | 38.1 | % |
Percentage of maximum STIP awarded (f) | | | 72.1 | % | | | 65.0 | % | | | 75.2 | % |
Percentage of maximum STIP forfeited | | | 27.9 | % | | | 35.0 | % | | | 24.8 | % |
Percentage of target STIP awarded | | | 120.2 | % | | | 108.3 | % | | | 125.4 | % |
Percentage of PSP award vesting | | | 75 | % | | | 92.5 | % | | | 0 | % |
Percentage SOP award vesting | | | – | | | | 100 | % | | | 100 | % |
| (a) | Salary paid in the financial year to 31 December. Salaries are reviewed with effect from 1 March. However, in 2013 Sam received a salary increase on appointment with effect from 17 January 2013 and no further increase in 2013. The salary and single figure of remuneration for 2012 and 2011 relates to his position as PGCEO, Iron Ore. |
| (b) | Value of STIP deferred under the BDP. |
| (c) | Based on the value of the LTIP awards which vested in respect of the performance period that ended 31 December. The Rio Tinto Ltd share price used to calculate the value of the award vesting on 17 February 2014 of A$69.54 was sourced from Investis Ltd. The performance conditions for awards vesting for the period ending 31 December 2013 are detailed in the notes to table 3 on pages 106 to 108. |
| (d) | Superannuation reflects the value of the superannuation accrued during the year assuming that it was to come into payment immediately. This differs from the value reported in table 1a which is calculated using an IAS19 methodology and assumptions on rates of investment return, inflation and salary increases. The figures disclosed for prior years have been restated in accordance with the new UK reporting requirements. The previous figures disclosed for 2012 and 2011 were A$410,000 and A$372,000 respectively. |
| (e) | Includes international assignment benefits of A$786,000 for 2013 of which A$206,000 are considered one-off costs associated with Sam’s relocation from Perth, Australia to London, allowance for professional tax services, car allowance, Company provided transport, other contractual payments and for 2012, activities in relation to Rio Tinto’s sponsorship of the medals for the 2012 London Olympics. |
| (f) | The maximum potential STIP award is 200 per cent of base salary. |
| | | | |
| | 82 riotinto.com/reportingcentre2013 | | |
Base salary
The Committee has increased Sam’s base salary by 2.5 per cent with effect from 1 March 2014, consistent with the salary budget for other Australian contracted employees in the Group.
| | | | | | | | | | | | |
| | | 2014 | | | 2013 | | | % change | |
Base salary (stated in A$‘000) | | | 1,948 | | | | 1,900 | | | | 2.5 | |
STIP individual objectives for 2013
Sam’s performance against his individual objectives is summarised below:
| | | | |
| Category | | Performance |
| Business transformation | | – | | Refocused the business on pursuing greater value for shareholders. |
| | – | | Reshaped the Executive Committee. |
| | – | | Initiated a review of the Group capital allocation processes. |
| | | – | | Set a clear framework for the organisation and asked every employee to act like an owner. |
| Cost reductions | | – | | Exceeded the publicly committed operating cash cost reductions of US$2 billion. |
| | – | | Reduced Exploration & Evaluation expenditure by US$1 billion, again exceeding the US$750 million target. |
| | – | | Exceeded reductions in support costs. |
| | | – | | Reduced net debt and capital expenditure. |
Performance delivery | | – | | Delivered five major projects during the year. |
| | – | | Oversaw the closure, sale or curtailment of six businesses. |
| | – | | Delivered first shipment of concentrate from Oyu Tolgoi in July. |
| | – | | Delivered the Pilbara 290 million tonnes per annum (Mt/a) US$400 million ahead of budget and four months ahead of schedule. |
| | | – | | Announced the breakthrough pathway for the Pilbara 360Mt/a expansion. |
| Leadership and engagement | | – | | Met with key stakeholders, including investors, employees, governments, international organisations, customers, suppliers, and civil society representatives. |
| | | – | | Actively promoted the values of the business. |
The Committee, with input from the chairman of the board, assessed Sam’s performance against his individual objectives as 160 per cent (out of 200 per cent) for his individual contribution to the business during the year.
STIP outcomes for 2013
The following table summarises the STIP outcomes for 2013.
| | | | | | | | | | | | |
| Measures | | Weight
(%) | | | Score
(out of
200%) | | | Weighted
score | |
Group safety and financial | | | 70 | | | | 122.3 | | | | 85.6 | |
Individual | | | 30 | | | | 160.0 | | | | 48.0 | |
Sub-total | | | 100 | | | | – | | | | 133.6 | |
Discretionary adjustment(a) | | | | | | | | | | | (13.4 | ) |
Total (% of target out
of 200%) | | | | | | | | | | | 120.2 | |
| (a) | The Committee decided that the overall STIP outcome would be reduced by ten per cent for the project cost overrun in relation to the Kitimat modernisation project. |
As a result, Sam received a STIP award of 120.2 per cent of target, equivalent to 144.3 per cent of base salary, 50 per cent to be delivered in cash in March 2014, and the remainder to be delivered in deferred shares, vesting in December 2016.
LTIP outcome for the period ended 31 December 2013
Sam received 41,881 shares in Rio Tinto Limited on 17 February 2014 from the vesting of the PSP awarded in 2010. He also received a cash payment of A$208,735 equal to the aggregate net dividends that would have been paid on the shares that vested had he owned them during that four-year period. No dividends were paid in respect of the shares that lapsed.
In 2011, Sam elected to receive his full LTIP award under the PSP and as a result he has no options under the SOP that were granted in 2011 and which had a performance period that ended on 31 December 2013.
Further details of the awards vesting in 2014 and in prior years are provided on page 95 and in table 3 on page 103.
LTIP award granted in 2013
The details of Sam’s 2013 LTIP award are summarised in the following table.
| | | | | | | | | | | | | | | | | | | | |
Type of award | | | Grant date | | |
| Face value
of award
(% of base
salary) |
| |
| Face value
of award (A$’000) |
(a) | |
| % vesting at
threshold
performance |
| |
| End of the
performance
period over
which the
performance
conditions
have to befulfilled |
(b)(c) |
PSP | | | 27 May 2013 | | | | 420% | | | | 7,980 | | | | 22.5% | | | | 31 Dec 2017 | |
| (a) | The face value represents the maximum value of the award and resulted in an award of 133,255 conditional shares based on the average share price over 2012 of A$59.885. The expected value of the award is 50 per cent of the face value or A$3,990,000. |
| (b) | As a transitional measure, for the 2013 PSP award, half of the award may vest after four years in 2017, and half the award may vest after five years in 2018. |
| (c) | The full performance conditions for the award are set out in detail on page 108. |
LTIP award for 2014
Sam’s PSP award in 2014 will have a face value of 420 per cent of base salary and an expected value of 210 per cent of base salary. The award may vest after five years in 2019, subject to the Group’s relative TSR and relative EBIT margin performance. The performance conditions for the award are unchanged from 2013 and the full performance conditions are set out in detail on pages 89 and 90. As with other participants, Sam’s award in 2014 may be subject to pro-rating depending on the date of his retirement from Rio Tinto.
Shareholding
Sam’s shareholding for the purposes of the share ownership policy, calculated using the market price of Rio Tinto shares on the latest practicable date each year before the date of publication of this report was:
| | | | | | | | | | | | |
| | | 31 December
2013 | | | 31 December
2012 | | | Increase in
shareholding/
value of
options | |
Holding of ordinary shares | | | 94,444 | | | | 46,950 | | | | 101.2% | |
Value of vested but unexercised
options (‘000) | | | A$1,073 | | | | A$1,115 | | | | (3.8%) | |
Multiple of base salary | | | 4.0 | | | | 2.3 | | | | 1.7 | |
The value of vested but unexercised options is calculated based on the share price as at the relevant date in February each year less the exercise price and with a 50 per cent discount for the effects of taxation.
| | | | |
| | 83 riotinto.com/reportingcentre2013 | | |
Remuneration Report: Implementation Report continued
Superannuation
Sam is provided with superannuation through an employer funded plan as provided to Australian-based employees.
In line with Australian-based employees with defined benefit provision who remain in service beyond age 62, Sam’s benefit is calculated as the greater of:
| (a) | 20 per cent of basic salary, averaged progressively over the three years from age 62 to age 65, for each year of service and proportionate month with the Company to date of retirement; or |
| (b) (i) | his accrued benefit at age 62 of 4.05 times final basic salary; plus |
| | (ii) | Company contributions at the Superannuation Guarantee rate, currently nine per cent of basic salary, less tax; plus |
| | (iii) | investment earnings at the rate the trustee of the superannuation fund may determine from time to time for the period from age 62 to the date of retirement. |
In line with typical market practice in Australia, Sam continues to receive an additional Company contribution on a defined contribution basis of 20 per cent of the lesser of:
| (i) | 50 per cent of the annual STIP award; or |
| (ii) | 20 per cent of base salary. |
This benefit can be taken without employer or trustee consent and without actuarial reduction on cessation of employment on or after age 62.
The accrued lump sum benefit as at 31 December 2013 was A$8,454,000 (31 December 2012: A$7,145,000). The 2012 figure has been restated to include the impact of the investment earnings on Sam’s accrued benefit under the superannuation fund for the period from age 62 as set out in (b)(iii) above. The figure disclosed previously for 2012 was A$6,836,000, being the accrued lump sum benefit calculated by reference to Sam’s base salary as set out in (a) above. As the increase to the benefit arose due to investment earnings, there was no additional cost to the Company resulting from this restate and the disclosure in table 1a is therefore unchanged. The 2013 figure also reflects the impact of the investment earnings under the superannuation fund; the accrued lump sum benefit as at 31 December 2013 calculated by reference to Sam’s base salary as set out in (a) above was A$7,811,427. The additional Company contribution on a defined contribution basis for 2013 was A$66,000 (2012: A$64,000).
Fees received from external appointments
In 2013 Sam received A$27,282 (2012: A$161,011) in respect of his position as a non-executive director of Seven West Media Limited from which he stood down in January 2013.
Service contract
Sam’s employment concludes, without the need for either party to give notice, on 31 December 2015. The Company may also terminate his employment for any reason on 31 December 2014, provided it gives notice of this decision by 31 October 2014. The Company or Sam may terminate this employment at any time by giving written notice of 12 months or such lesser period as may exist between the date on which the notice is given and 31 December 2014.
Other
The Company paid for various standard relocation costs associated with Sam’s move from Perth, Australia to London of approximately A$206,000. He also receives a housing allowance and other assignment benefits during his secondment to London. His remuneration is not subject to tax equalisation or cost of living adjustments, both of which are standard provisions for other international assignees in the Group. The amounts are included in note (e) under the table on page 82.
Sam will be eligible to receive the value of unused annual leave and long service leave at the conclusion of his employment in accordance with Australian legislation and applicable practice applying to all employees in Australia; the value of this leave as at 17 February 2014 was A$787,000 and A$1,592,000 respectively.
Chief executive’s pay and employee pay
The table below compares the changes from 2012 to 2013, in salary, benefits and annual incentives paid for the chief executive and the Australian workforce. We chose the comparison to the Australian workforce because it is the country where 40 per cent of the total workforce is based. This comparator group has been selected due to the availability of comparative data and to remove the impacts of year-on-year exchange rate fluctuations. The underlying elements of the chief executive’s pay are based on the values reported in the single total figure of remuneration table.
Sam’s base salary was increased by 14.9 per cent with effect from 17 January 2013 to reflect his promotion to chief executive. The increase in his benefits is primarily due to international assignment benefits and one-off costs associated with his relocation from Perth, Australia to London.
| | | | | | | | | | | | |
| | |
| Percentage
change in
salary paid |
| |
| Percentage
change in
other
benefits paid |
| |
| Percentage
change in
annual
incentivepaid |
(b) |
Chief executive | | | 14.9% | | | | 329.7% | | | | (10.1%) | |
Australian workforce(a) | | | 4.2% | | | | 2.7% | | | | (7.3%) | |
| (a) | The percentage change in each element of remuneration for the workforce is calculated on a per capita basis using average employee numbers. |
| (b) | The percentage change in annual incentive compares amounts paid in 2013 with respect to the 2012 performance year, to amounts paid in 2012 with respect to the 2011 performance year. Annual incentives for the workforce comprise a number of different short-term incentive arrangements. |
| | | | |
| | 84 riotinto.com/reportingcentre2013 | | |
Chris Lynch (chief financial officer)
Single total figure of remuneration
The table below provides a summary of actual remuneration in respect of 2013 and the prior year in accordance with UK legislation, stated in pounds sterling, the currency of Chris’s arrangements. This is in addition to the Australian statutory disclosure requirements set out in US dollars in tables 1a and 1b on pages 98 to 100. The remuneration details for 2013 set out in table 1a include theoretical accounting values relating to various parts of the remuneration packages, most notably LTIP arrangements, and require a different methodology for calculating the pension value. Accordingly, the figures below are not directly comparable with those in table 1a.
Remuneration for 2012 related to Chris’s role as a non-executive director. Remuneration for 2013 has been split for the period Chris was a non-executive director up until 28 February 2013 and for the period from 1 March 2013 (the day he became an executive director) to 31 December 2013.
| | | | | | | | | | | | | | |
| (stated in £‘000) | | | | 2013 (1 Mar to
31 Dec) | | | 2013
(1 Jan to
28 Feb) | | | 2012
1 Jan to
31 Dec | |
Base salary paid/fees(a) | | | | | 667 | | | | 35 | | | | 165 | |
STIP payment – cash(a) | | | | | 457 | | | | – | | | | – | |
STIP payment – deferred shares(b) | | | | | 456 | | | | – | | | | – | |
Total short-term pay | | | | | 1,580 | | | | 35 | | | | 165 | |
Value of LTIP awards vesting(c) | | | | | 0 | | | | – | | | | – | |
Pension(d) | | | | | 167 | | | | – | | | | – | |
Other benefits(e) | | | | | 941 | | | | – | | | | 91 | |
Single total figure of remuneration | | | | | 2,688 | | | | 35 | | | | 256 | |
Percentage of total remuneration provided as performance-related pay (STIP and LTIP) | | | | | 34.0% | | | | – | | | | – | |
Percentage of total remuneration provided as non-performance-related pay (base salary/fees, pension and other benefits) | | | | | 66.0% | | | | 100% | | | | 100% | |
Percentage of maximum STIP awarded(f) | | | | | 68.1% | | | | – | | | | – | |
Percentage of maximum STIP forfeited | | | | | 31.9% | | | | – | | | | – | |
Percentage of target STIP awarded | | | | | 113.5% | | | | – | | | | – | |
Percentage of PSP award vesting(c) | | | | | – | | | | – | | | | – | |
Percentage SOP award vesting(c) | | | | | – | | | | – | | | | – | |
| (a) | Salary/fees paid in the financial year to 31 December. Salaries are reviewed with effect from 1 March. |
| (b) | Value of STIP deferred for the period 1 March 2013 to 31 December 2013 under the BDP. |
| (c) | Chris had no LTIP awards vest in respect of the performance period that ended 31 December 2013 as he received no LTIP awards prior to the award made in 2013. |
| (d) | Pension reflects the value of the pension contribution and payment in lieu of pension paid during the year. |
| (e) | Includes one-off costs of £896,000 in 2013 associated with Chris’s relocation from Melbourne, Australia to London, healthcare, allowance for professional tax services, car allowance, and international relocation assistance. |
| (f) | The maximum potential STIP award is 200 per cent of base salary. |
Base salary
The Committee has increased Chris’s base salary by 2.5 per cent with effect from 1 March 2014, consistent with the salary budget for other UK contracted employees in the Group.
| | | | | | | | | | | | |
| | | 2014 | | | 2013 | | | % change | |
Base salary (stated in £‘000) | | | 820 | | | | 800 | | | | 2.5 | |
STIP individual objectives for 2013
Chris’s performance against his individual objectives is summarised below:
| | | | |
| Category | | Performance |
| Business transformation | | – | | Undertook a review of the Group strategy for consideration by the board. |
| | | – | | Reinvigorated capital allocation processes with the introduction of the Evaluation Committee. |
| Cost reductions | | – | | Exceeded the publicly committed operating cash cost reductions of US$2 billion. |
| | – | | Reduced Exploration & Evaluation expenditure by US$1 billion, again exceeding the US$750 million target. |
| | – | | Exceeded reductions in support costs. |
| | – | | Reduced net debt in 2013 to US$18.1 billion. |
| | | – | | Reduced 2013 capital expenditure to US$13.0 million. |
| Performance delivery | | – | | Reworked the capital profile of the Group. |
| | | – | | Made good progress with divestments with US$3.5 billion of sales announced or completed during the year. |
| Leadership and engagement | | – | | Engaged with shareholders and rating agencies. |
The Committee, with input from the chief executive, assessed Chris’s performance against his individual objectives as 135 per cent (out of 200 per cent) for his individual contribution to the business during the year.
STIP outcomes for 2013
The following table summarises the STIP outcomes for 2013.
| | | | | | | | | | | | |
| Measures | | Weight
(%) | | | Score
(out of
200%) | | | Weighted
score | |
Group safety and financial | | | 70 | | | | 122.3 | | | | 85.6 | |
Individual | | | 30 | | | | 135.0 | | | | 40.5 | |
Sub-total | | | 100 | | | | – | | | | 126.1 | |
Discretionary adjustment(a) | | | | | | | | | | | (12.6 | ) |
Total (% of target out
of 200%) | | | | | | | | | | | 113.5 | |
| (a) | The committee decided that the overall STIP outcome would be reduced by ten per cent for the project cost overrun in relation to the Kitimat modernisation project. |
As a result, Chris received a STIP award of 113.5 per cent of target. His STIP was calculated on a pro rata basis for the period 1 March 2013 (the day he became an executive director) to 31 December 2013 which resulted in a STIP award equivalent to 114.2 per cent of base salary. Fifty per cent of the award is to be delivered in cash in March 2014 and the remainder is to be delivered in deferred shares, vesting in December 2016.
LTIP outcome for the period ended 31 December 2013
Chris had no LTIP awards which had a performance period that ended on 31 December 2013, having become an executive director on 1 March 2013.
| | | | |
| | 85 riotinto.com/reportingcentre2013 | | |
Remuneration Report: Implementation Report continued
LTIP award granted in 2013
The details of Chris’s 2013 LTIP award are summarised in the following table.
| | | | | | | | | | | | | | | | | | | | |
Type of award | | | Grant date | | |
| Face value
of award
(% of base
salary) |
| |
| Face value
of award
(£’000) |
(a) | |
| % vesting at
threshold
performance |
| |
| End of the
performance
period over which
the performance
conditions have
to be fulfilled |
(b)(c) |
PSP | | | 27 May 2013 | | | | 420% | | | | 3,360 | | | | 22.5% | | | | 31 Dec 2017 | |
| (a) | The face value represents the maximum value of the award and resulted in an award of 104,169 conditional shares based on the average share price over 2012 of £32.255. The expected value of the award is 50 per cent of the face value or £1,680,000. |
| (b) | As a transitional measure, for the 2013 PSP award, half of the award may vest after four years in 2017, and half the award may vest after five years in 2018. |
| (c) | The full performance conditions for the award are set out in detail on page 108. |
LTIP award for 2014
Chris’s PSP award in 2014 will have a face value of 400 per cent of base salary and an expected value of 200 per cent of base salary. The award may vest after five years in 2019, subject to the Group’s relative TSR and the relative EBIT margin performance. The performance conditions for the award are unchanged from 2013 and the full performance conditions are set out in detail on pages 89 and 90.
Shareholding
Chris’s shareholding for the purposes of the share ownership policy, calculated using the market price of Rio Tinto shares on the latest practicable date each year before the date of publication of this report was:
| | | | | | | | | | | | |
| | | 31 December
2013 | | | 31 December
2012 | | | Increase in
shareholding | |
Holding of ordinary shares | | | 8,960 | | | | 8,960 | | | | 0% | |
Multiple of base salary/fees | | | 0.4 | | | | n/a | | | | – | |
Chris holds no options over Rio Tinto shares. Chris held a multiple of 3.7 times his base fee as a non-executive director in compliance with the Group’s share ownership policy for non-executive directors and has until 2018 to build up his ownership in shares to three times his salary as chief financial officer.
Pension
Chris is employed in the UK and is provided with pension benefits on a defined contribution basis.
The Company paid a pension contribution to a funded UK company pension arrangement of 25 per cent of £135,000, being the current maximum salary on which pension contributions are based under that arrangement, pro rata for the period from 1 March 2013. The pension contribution for 2013 was £28,000.
Chris also received a cash supplement equal to 25 per cent of the amount by which his base salary exceeded £135,000, less any applicable withholdings, and again pro rata for the period from 1 March 2013. The gross cash supplement for 2013 was £139,000.
Service contract
Chris Lynch’s employment concludes, without the need for either party to give notice, on 28 February 2017. The Company may terminate Chris Lynch’s employment for any reason on 29 February 2016, provided it gives notice of this decision by 31 December 2015. The Company or Chris may terminate this employment at any time by giving written notice of 12 months or such lesser period as may exist between the date on which the notice is given and 29 February 2016.
Other
The Company paid for various standard one-off relocation costs associated with Chris’s move from Melbourne to London and he received transitional housing support including house purchase assistance. As a UK contracted employee, he is not eligible for tax equalisation on his remuneration, cost of living or any other ongoing assignment benefits such as housing allowance. The amounts are included in note (e) under the table on page 85.
Tom Albanese (former chief executive)
Single total figure of remuneration
The table below provides a summary of actual remuneration in respect of 2013 and prior years in accordance with UK legislation, stated in pounds sterling, the currency of Tom’s arrangements. This is in addition to the Australian statutory disclosure requirements set out in US dollars in table 1a on pages 98 and 99. The remuneration details set out in table 1a include theoretical accounting values relating to various parts of the remuneration packages, most notably LTIP arrangements, and require a different methodology for calculating the pension value. Accordingly, the figures below are not directly comparable with those in table 1a.
Remuneration for 2013 is for the period as a director from 1 January 2013 until 17 January 2013. Amounts received from 18 January 2013 until 16 July 2013 are included under the section headed Past-director payments.
| | | | | | | | | | | | | | |
| (stated in £‘000) | | | | 2013 | | | 2012 | | | 2011 | |
Base salary paid(a) | | | | | 50 | | | | 1,052 | | | | 1,010 | |
STIP payment – cash | | | | | 0 | | | | 0 | | | | 0 | |
STIP payment – deferred shares | | | | | 0 | | | | 0 | | | | 0 | |
Total short-term pay | | | | | 50 | | | | 1,052 | | | | 1,010 | |
Value of LTIP awards vesting(b) | | | | | 0 | | | | 1,762 | | | | 1,478 | |
Pension(c) | | | | | 0 | | | | 1,031 | | | | 1,499 | |
Other benefits(d) | | | | | 3 | | | | 195 | | | | 269 | |
Single total figure of remuneration | | | | | 53 | | | | 4,040 | | | | 4,256 | |
Percentage change in total remuneration (2013 versus 2012; 2012 versus 2011) | | | | | (98.7% | ) | | | (5.1% | ) | | | – | |
Percentage of total remuneration provided as performance-related pay (STIP and LTIP) | | | | | 0% | | | | 43.6% | | | | 34.7% | |
Percentage of total remuneration provided as non-performance-related pay (base salary, pension and other benefits) | | | | | 100% | | | | 56.4% | | | | 65.3% | |
Percentage of maximum STIP awarded (e) | | | | | 0% | | | | 0% | | | | 0% | |
Percentage of maximum STIP forfeited | | | | | 100% | | | | 100% | | | | 100% | |
Percentage of target STIP awarded | | | | | 0% | | | | 0% | | | | 0% | |
Percentage of PSP award vesting(b) | | | | | – | | | | 92.5% | | | | 0% | |
Percentage SOP award vesting(b) | | | | | – | | | | 100% | | | | 100% | |
| (a) | Salary paid in the financial year to 31 December. |
| (b) | Tom had no LTIP awards vest in respect of the performance period that ended 31 December 2013. All outstanding LTIP awards lapsed and were forfeited on termination save as noted below in respect of the vested awards described. All deferred bonus awards lapsed at the same time. |
| (c) | Pension reflects the value of the pension accrued during the year assuming that it was to come into payment immediately. This differs from the value reported in table 1a which is calculated using an IAS19 methodology and assumptions on rates of investment return, inflation and salary increases. The figures disclosed for prior years have been restated in accordance with the new UK reporting requirements. The previous figures disclosed for 2012 and 2011 were £1,360,000 and £1,230,000 respectively. |
| (d) | Includes healthcare, allowance for professional tax services, company provided transport and other contractual payments and for 2012 activities in relation to Rio Tinto’s sponsorship of the medals for the 2012 London Olympics. |
| (e) | The maximum potential STIP award is 200 per cent of base salary. |
| | | | |
| | 86 riotinto.com/reportingcentre2013 | | |
Base salary
As reported last year, Tom’s base salary of £1,056,000 was not increased effective 1 March 2013 and his base salary remained at this level until he left the Group on 16 July 2013.
STIP outcomes for 2013
The Committee determined that Tom would receive no STIP award for 2013 and no STIP objectives were set.
LTIP outcome for the period ended 31 December 2013
All outstanding, but unvested LTIP awards earned in previous years lapsed and were forfeited by Tom when he left the Group.
LTIP award granted in 2013
The Committee determined that no LTIP award would be granted to Tom for 2013.
Pension
Tom’s target defined benefit pension was equal to two-thirds of basic salary at age 60, through funded and unfunded arrangements as provided to other UK-based employees. This was inclusive of benefits accrued in the US.
Normal retirement date is age 60 and the accrued pension is subject to actuarial reduction if taken before that age.
The accrued pension as at 16 July 2013 was £559,000 per annum, (31 December 2012: £522,000 per annum).
Past-director payments
Tom stepped down as a director on 17 January 2013 and left the Group on 16 July 2013. Until that date, he received his base salary, benefits and pension contributions.
The base salary paid, pension and other benefits for the period 18 January 2013 through to 16 July 2013 were £520,500, £555,000 and £570,000 respectively. Other benefits included a one-off payment of £482,000 relating to a contractual tax equalisation payment relating to his employment prior to his appointment as chief executive, on exercised share options.
Tom returned to the US prior to his termination date, and is eligible to receive post-retirement medical coverage in the US for himself and his spouse, in line with contractual commitments.
He received his 2009 performance share and the 2010 share option awards, both of which vested prior to 16 July 2013 in accordance with the plan rules, as reported last year. He was also able to exercise any vested, but unexercised, share options prior to 16 July 2013.
Tom’s accrued defined benefit pension as at 16 July 2013 was £559,000 per annum. Tom was required to join the US defined contribution pension plan on his return to the US prior to 16 July 2013. Tom’s target defined benefit pension was reduced by the actuarial value of the Company’s contributions to the defined contribution pension plan so that he received no additional benefit. The Company’s contribution to the US defined contribution pension plan was £11,000 (31 December 2012: £nil).
When he left the Group, all outstanding but unvested LTIP and BDP awards earned in previous years lapsed and were forfeited.
Tom did not receive a termination payment.
Guy Elliott (former chief financial officer)
Single total figure of remuneration
The table below provides a summary of actual remuneration in respect of 2013 and prior years in accordance with UK legislation, stated in pounds sterling, the currency of Guy’s arrangements. This is in addition to the Australian statutory disclosure requirements set out in US dollars in table 1a on pages 98 and 99. The remuneration details set out in table 1a include theoretical accounting values relating to various parts of the remuneration packages, most notably LTIP arrangements, and require a different methodology for calculating the pension value. Accordingly, the figures below are not directly comparable with those in table 1a.
| | | | | | | | | | | | | | |
| (stated in £‘000) | | | | 2013 | | | 2012 | | | 2011 | |
Base salary paid(a) | | | | | 738 | | | | 735 | | | | 713 | |
STIP payment – cash(b) | | | | | 826 | | | | 0 | | | | 0 | |
STIP payment – deferred shares | | | | | 0 | | | | 0 | | | | 0 | |
Total short-term pay | | | | | 1,564 | | | | 735 | | | | 713 | |
Value of LTIP awards
vesting(c) | | | | | 1,720 | | | | 1,311 | | | | 1,100 | |
Pension(d) | | | | | 0 | | | | 97 | | | | 457 | |
Other benefits(e) | | | | | 128 | | | | 150 | | | | 210 | |
Single total figure of remuneration | | | | | 3,412 | | | | 2,293 | | | | 2,480 | |
Percentage change in total remuneration (2013 versus 2012; 2012 versus 2011) | | | | | 48.8% | | | | (7.5% | ) | | | – | |
Percentage of total remuneration provided as performance-related pay (STIP and LTIP) | | | | | 74.6% | | | | 57.2% | | | | 44.4% | |
Percentage of total remuneration provided as non-performance-related pay (base salary, pension and other benefits) | | | | | 25.4% | | | | 42.8% | | | | 55.6% | |
Percentage of maximum STIP awarded(f) | | | | | 56.0% | | | | 0.0% | | | | 0.0% | |
Percentage of maximum STIP forfeited | | | | | 44.0% | | | | 100.0% | | | | 100.0% | |
Percentage of target STIP awarded | | | | | 93.2% | | | | 0.0% | | | | 0.0% | |
Percentage of PSP award vesting | | | | | 75% | | | | 92.5% | | | | 0% | |
Percentage SOP award vesting | | | | | 100% | | | | 100% | | | | 100% | |
| (a) | Salary paid in the financial year to 31 December. |
| (b) | No STIP awards were made to Guy in 2011 or 2012 in the light of impairments made to the Group. As reported last year, the full value of the 2013 STIP will be paid in March 2014. |
| (c) | Based on the value of the LTIP awards which vested in respect of the performance period that ended 31 December. The Rio Tinto plc share price used to calculate the value of the award vesting on 17 February 2014 of £35.59 was sourced from Investis Ltd. The performance conditions for awards vesting for the period ending 31 December 2013 are detailed in the notes to table 3 on pages 106 to 108. |
| (d) | Pension reflects the value of the pension accrued during the year assuming that it was to come into payment immediately. This differs from the value reported in table 1a which is calculated using an IAS19 methodology and assumptions on rates of investment return, inflation and salary increases. The pension was subject to an actuarial reduction to take its early payment into account and as a result the value at the end of the year is less than the value at the beginning of the year. The figures disclosed for prior years have been restated in accordance with the new UK reporting requirements. The previous figures disclosed for 2012 and 2011 were £382,000 and £351,000 respectively. |
| (e) | Includes healthcare, allowance for professional tax services, company provided transport and driver and other contractual payments and for 2012, activities in relation to Rio Tinto’s sponsorship of the medals for the 2012 London Olympics. |
| (f) | The maximum potential STIP award is 200 per cent of base salary. |
| | | | |
| | 87 riotinto.com/reportingcentre2013 | | |
Remuneration Report: Implementation Report continued
Base salary
As reported last year, Guy’s base salary of £738,000 was not increased effective 1 March 2013 and his base salary remained at this level until his retirement on 31 December 2013.
STIP individual objectives for 2013
Guy’s individual objectives were similar to Chris Lynch’s save that a key objective was to ensure an orderly succession for the next chief financial officer.
Guy ceased to be chief financial officer in April and left the Executive Committee at that time. Guy remained a director and attended all board meetings for the balance of the year.
The Committee, with input from the chief executive, assessed Guy’s performance against his individual objectives as 60 per cent (out of 200 per cent) for his individual contribution to the business during the year.
STIP outcomes for 2013
The following table summarises the STIP outcomes for 2013.
| | | | | | | | | | | | |
| Measures | | Weight
(%) | | | Score
(out of
200%) | | | Weighted
score | |
Group safety and financial | | | 70 | | | | 122.3 | | | | 85.6 | |
Individual | | | 30 | | | | 60.0 | | | | 18.0 | |
Sub total | | | 100 | | | | – | | | | 103.6 | |
Discretionary adjustment(a) | | | | | | | | | | | (10.4 | ) |
Total (% of target out of 200%) | | | | | | | | | | | 93.2 | |
| (a) | The committee decided that the overall STIP outcome would be reduced by ten per cent for the project cost overrun in relation to the Kitimat modernisation project. |
As a result, Guy received a STIP award of 93.2 per cent of target, equivalent to 111.9 per cent of base salary, 100 per cent to be delivered wholly in cash (due to him having retired at the end of December 2013) in March 2014.
LTIP outcomes for the period ended 31 December 2013
Guy received 44,374 shares in Rio Tinto plc on 17 February 2014 from the vesting of the PSP awarded in 2010. He also received a cash payment of £141,495 equal to the aggregate net dividends that would have been paid on the shares that vested had he owned them during that four year-period. No dividends were paid in respect of the shares that lapsed.
Guy has an option over 59,708 shares at a price of £42.45 per share from the vesting of the SOP granted in 2011. The market price of Rio Tinto plc shares at 17 February 2014 being the latest practicable date before the date of publication of this report was £35.59. These options can be exercised from 6 May 2014 and Guy will have until 6 May 2015 to exercise the options. Further details of the awards vesting in 2014 and in prior years are provided on page 95 in table 3 and on pages 102 to 108.
LTIP award granted in 2013
The Committee determined that no LTIP award would be granted to Guy for 2013.
Pension
Guy’s target defined benefit pension is equal to 2.3 per cent of basic salary for each year of service with the Company to age 60, through funded and unfunded arrangements as provided to other UK-based employees.
Normal retirement date is age 60 and the accrued pension is subject to actuarial reduction if taken before that age.
The accrued pension as at 31 December 2013 was £531,000 per annum, (31 December 2012: £547,000 per annum). The pension was subject to an actuarial reduction to take its early payment into account and as a result the value at the end of the year is less than the value at the beginning of the year.
Fees received from external appointments
In 2013 Guy Elliott received US$225,764 in respect of his position as a non-executive director of Royal Dutch Shell (2012: US$212,147). Fees of US$83,706 (2012: US$nil) received by Guy Elliott in respect of his position as a non-executive director of SABMiller were paid to Rio Tinto pursuant to an arrangement agreed with Guy.
Retirement
Guy retired on 31 December 2013. During 2013, he received his contractual remuneration, including base pay, eligibility for STIP, benefits and pension contributions, until his retirement date.
Upon his retirement, good leaver treatment and pro-rating, where applicable, was applied to outstanding LTIP awards in accordance with the plan rules. He will also receive a payment for 23.5 days outstanding unused annual leave of £66,704. In accordance with his contractual commitments, he is also eligible for post-retirement medical insurance under the Rio Tinto Medical Expenses Plan, subject to the rules of the plan.
What we paid our chairman and non-executive directors
Annual fees payable
The table below sets out the annual fees paid in 2013 and payable in 2014 to the chairman and the non-executive directors.
| | | | | | | | | | | | | | |
| | | | | 2014 | | | 2013 | | | 2012 | |
Director fees | | | | | | | | | | | | | | |
Chairman’s fee(a) | | | | | £730,000 | | | | £715,000 | | | | £700,000 | |
Non-executive director base fee (b) | | | | | £90,000 | | | | £85,000 | | | | £85,000 | |
Senior independent director | | | | | £40,000 | | | | £40,000 | | | | £40,000 | |
Committee fees | | | | | | | | | | | | | | |
Audit Committee chairman | | | | | £35,000 | | | | £35,000 | | | | £35,000 | |
Audit Committee member | | | | | £20,000 | | | | £20,000 | | | | £20,000 | |
Remuneration Committee chairman | | | | | £30,000 | | | | £30,000 | | | | £30,000 | |
Remuneration Committee member | | | | | £15,000 | | | | £15,000 | | | | £15,000 | |
Sustainability Committee chairman | | | | | £30,000 | | | | £30,000 | | | | £30,000 | |
Sustainability Committee member | | | | | £15,000 | | | | £15,000 | | | | £15,000 | |
Nominations Committee member | | | | | £7,500 | | | | £7,500 | | | | £7,500 | |
Meeting allowances | | | | | | | | | | | | | | |
Long distance
(flights over 10 hours per journey) | | | | | £10,000 | | | | £10,000 | | | | £10,000 | |
Medium distance
(flights of 5-10 hours per journey) | | | | | £5,000 | | | | £5,000 | | | | £5,000 | |
| (a) | The Chairman’s fee was increased with effect from 1 July 2013 to £730,000 per annum from £700,000, the level at which it was set when he was appointed to the role in March 2009. This adjustment reflected the increasing demands on the role, the performance in the role, and comparison with external peers. |
| (b) | The fees payable to non-executive directors are subject to review by the board on the recommendation of the Chairman’s Committee. Following a review, taking into account the demands on directors, market and related developments, the base fee for non-executive directors was increased to £90,000 with effect from 1 January 2014. There have been no changes to other fees or allowances since 1 January 2012, save that the travel allowances are now based on length of flights (unchanged) rather than whether the travel is overseas. |
Details of each element of remuneration and the single total figure of remuneration paid to the chairman and non-executive directors during 2013 and 2012 are set out in US dollars in table 1b on page 100. No post-employment, termination payments or share-based payments were made. Where the payment of statutory minimum superannuation contributions for non-executive directors is required by Australian superannuation law, these contributions are deducted from the director’s overall fee entitlements.
The total fee and allowances payments made to the chairman and non-executive directors in 2013 are within the maximum aggregate annual amount of £3 million set out in the Group’s constitutional documents approved by shareholders at the 2009 annual general meetings.
| | | | |
| | 88 riotinto.com/reportingcentre2013 | | |
Share ownership policy for non-executive directors
The board, in 2006, adopted a policy whereby non-executive directors are encouraged to build up a shareholding within three years of their appointment equal in value to one year’s base fee. Details of non-executive directors’ share interests in the Group, including total holdings, are set out in table 2 on page 101.
Non-executive directors’ share ownership
| | | | |
| Director | | Share ownership level
at 31 December 2013
as a multiple of base fee | |
Jan du Plessis | | | 1.4 | |
Robert Brown | | | 1.7 | |
Vivienne Cox | | | 1.2 | |
Michael Fitzpatrick | | | 2.7 | |
Ann Godbehere | | | 1.2 | |
Richard Goodmanson | | | 6.2 | |
John Kerr | | | 6.0 | |
Paul Tellier | | | 7.4 | |
John Varley | | | 1.2 | |
What we paid our other Executive Committee members and why
Base salary
The Committee has reviewed the base salary levels and, for the majority of the executives, made adjustments in line with the base salary budgets applying to the broader employee population.
In one case, namely Jean-Sébastien Jacques, the chief executive, Copper, a further adjustment was made, taking into account performance and a base salary significantly below internal and external peers.
| | | | | | | | | | | | |
| Stated in ‘000 | | 2014 | | | 2013 | | | % change | |
Hugo Bague | | | £484 | | | | £473 | | | | 2.5 | |
Preston Chiaro | | | US$789 | | | | US$789 | | | | 0.0 | |
Jacynthe Côté | | | C$946 | | | | C$930 | | | | 1.7 | |
Alan Davies | | | A$791 | | | | A$771 | | | | 2.5 | |
Andrew Harding | | | £560 | | | | £546 | | | | 2.5 | |
Jean-Sébastien Jacques | | | £512 | | | | £436 | | | | 17.5 | |
Harry Kenyon-Slaney | | | £525 | | | | £512 | | | | 2.5 | |
Greg Lilleyman(a) | | | A$760 | | | | – | | | | – | |
Debra Valentine | | | US$682 | | | | US$672 | | | | 1.6 | |
| (a) | Greg Lilleyman’s base salary upon his appointment as Group executive, Technology & Innovation effective 1 January 2014. |
STIP objectives and outcomes for 2013
Overview of STIP weightings and measures for 2013
The following table provides an overview of the measures and weightings used to determine STIP awards for members of the Executive Committee in 2013:
| | | | | | | | |
| | | Weighting for
executive
directors and
Group
executives | | | Weighting for
PGCEOs | |
| Safety – split equally between LTIFR and AIFR and adjusted for fatalities | | | 20% | | | | 20% | |
| Financial measures split equally between underlying earnings & cash flow for the Group | | | 50% | | | | 20% | |
| Financial measures split equally between underlying earnings and cash flow for the relevant product group | | | 0% | | | | 30% | |
| Individual measures based on key strategic initiatives of each role and contribution to overall company performance | | | 30% | | | | 30% | |
The average performance against individual safety goals for Executive Committee members was below target, and for individual financial goals, above target.
The individual performance of Executive Committee members who are not executive directors was reviewed by the Committee against these measures and, on average, was considered above target. This reflected, among other things, the outstanding performance against the cost reduction targets set for 2013.
Downward adjustments of 40 per cent and 20 per cent respectively were applied to the former Group executive, Technology & Innovation and the chief executive, Aluminium for the project cost overrun in relation to the Kitimat modernisation project.
| | | | | | | | |
| | | 2013 STIP Award (% of Salary)(a) | | | 2013 STIP Award
(000’s) | |
Jacynthe Côté | |
| 141.7%
(113.4% after application of discretion) |
| | | C$1,054 | |
Alan Davies | | | 107.3% | | | | A$828 | |
Andrew Harding | | | 136.1% | | | | £743 | |
Jean-Sébastien Jacques(c) | | | 119.5% | | | | £458 | |
Harry Kenyon-Slaney | | | 113.5% | | | | £581 | |
Hugo Bague | | | 129.1% | | | | £610 | |
Preston Chiaro(b) | |
| 150.0%
(90% after application of discretion) |
| | | US$710 | |
Debra Valentine | | | 127.6% | | | | US$857 | |
| (a) | Scores out of 200% have been rounded to one decimal place in the above table. As the actual STIP awards do not use rounding conventions, small rounding variances may occur. |
| (b) | The 2013 STIP awards for Jacynthe Côté and Preston Chiaro show the award as a percentage of salary before and after the impact of discretionary discounts to their STIP payments for the Kitimat project cost overrun. |
| (c) | STIP Award for the period 14 February 2013 – 31 December 2013. |
Detailed commentary on the performance of each product group is provided in the Annual report on pages 26 to 37 and 49. The average individual performance of Executive Committee members who are not executive directors was adjudged to be between target and outstanding.
LTIP outcomes for the period ended 31 December 2013
Details of the LTIP outcomes for the period ended 31 December 2013 are provided on page 95.
| | | | |
| | 89 riotinto.com/reportingcentre2013 | | |
Remuneration Report: Implementation Report continued
LTIP awards granted in 2013
The maximum potential value of PSP awards granted in 2013 was 438 per cent of base salary. The Committee decided that the PSP awards in 2013 would have a face value of awards as shown in the table below. The eventual value of the award will depend on the Group’s relative TSR and relative EBIT margin performance during the years 2013-2017. Half of the award may vest after four years in 2017, and half the award may vest after five years in 2018. The performance conditions for the awards granted in 2013 are consistent with the performance conditions for awards to be granted in 2014 as set out below.
LTIP awards for 2014
The Committee has decided that the PSP awards in 2014 will have a face value of awards as shown in the table below. The award levels have been set to incentivise executives to meet the long-term strategic goals of the Group, to provide retention and to contribute towards the competitiveness of the overall remuneration package. The average face value of awards to be made to Executive Committee members in 2014 is 405 per cent of base salary (2013: 380 per cent).
| | | | | | | | |
Maximum value (Percentage of 1 March base salary) | | 2014 | | | 2013 | |
Hugo Bague | | | 400 | | | | 400 | |
Preston Chiaro | | | – | | | | 300 | |
Jacynthe Côté | | | 400 | | | | 300 | |
Alan Davies | | | 400 | | | | 420 | |
Andrew Harding | | | 430 | | | | 420 | |
Jean-Sébastien Jacques | | | 430 | | | | 380 | |
Harry Kenyon-Slaney | | | 400 | | | | 420 | |
Greg Lilleyman(a) | | | 380 | | | | – | |
Debra Valentine | | | 400 | | | | 400 | |
Average | | | 405 | | | | 380 | |
| (a) | Appointed Group executive, Technology & Innovation effective 1 January 2014. |
The performance conditions for the awards made in 2014 and 2013 are the same. The expected value of the awards in both years is equal to 50 per cent of the face value. The percentage vesting at threshold performance in both years is 22.5 per cent. The 2014 award may vest after five years in 2019, subject to the Group’s relative TSR and relative EBIT margin performance.
For the TSR component (constituting two-thirds of the award), where TSR performance is measured against both the HSBC Global Mining Index and the broader market of large global companies as measured through the Morgan Stanley Capital World Index, the award will vest as follows:
| | |
Outperformance of the index by 6 per cent per annum | | 1.0 x award vests |
Performance between equal to the index and 6 per cent outperformance | | Proportionate vesting between 0.225 x and 1.0 x vesting |
Performance equal to the index | | 0.225 x award vests |
Performance less than the index | | Nil vesting |
For the EBIT margin measure, change in the EBIT margin of Rio Tinto and each of the comparator companies (measured on a “point-to-point” basis using the last financial year in the performance period and the financial year prior to the start of the performance period) will be calculated using independent third-party data. Vesting will be subject to Rio Tinto’s interpolated ranking position using the following schedule:
| | |
Equal to or greater than 2nd ranked company | | 1.0 x award vests |
Between the 5th and 2nd ranked companies | | Proportionate vesting between 0.225 x and 1.0 x vesting |
Above the 6th ranked company | | 0.225 x award vests |
Equal to the 6th ranked company or below | | Nil vesting |
The 2014 comparator group (unchanged from 2013) for the EBIT margin measure is: Alcoa, Antofagasta, Anglo American, Barrick Gold, BHP Billiton, Freeport McMoRan, Glencore-Xstrata, Peabody, Teck Resources and Vale.
Post-employment benefits
Executives may participate in pension, superannuation and post-employment medical and life insurance benefits, which are typically offered to the broader employee population in similar locations.
Positions held and date of appointment to position
| | | | |
| Name | | Position(s) held during 2013 | | Date of appointment to position |
| Other executives | | |
| Hugo Bague | | Group executive, Organisational Resources | | 1 March 2013 |
| | | Group executive, People & Organisation | | 1 August 2007 |
| Preston Chiaro(a) | | Group executive, Technology & Innovation | | 1 November 2009 |
| Bret Clayton(b) | | Group executive, Business Support & Operations | | 1 November 2009 |
| Jacynthe Côté | | Chief executive, Rio Tinto Alcan | | 1 February 2009 |
| Alan Davies | | Chief executive, Diamonds & Minerals | | 1 September 2012 |
| Andrew Harding | | Chief executive, Iron Ore | | 14 February 2013 |
| | | Chief executive, Copper | | 1 November 2009 |
| Jean-Sébastien Jacques | | Chief executive, Copper | | 14 February 2013 |
| Harry Kenyon-Slaney | | Chief executive, Energy | | 1 September 2012 |
| Doug Ritchie(c) | | Chief executive, Energy | | 1 November 2009 |
| Debra Valentine | | Group executive, Legal, External & Regulatory Affairs | | 15 January 2008 |
| (a) | Preston Chiaro stepped down from the Executive Committee on 31 December 2013 and retires from the Group on 1 April 2014. |
| (b) | Bret Clayton stepped down from the Executive Committee on 1 March 2013. He remains with the Group. |
| (c) | Doug Ritchie left the Group on 16 July 2013. |
Termination
Doug Ritchie stepped down from the Executive Committee on 17 January 2013 and left the Group on 16 July 2013. Until that date he received his base salary, benefits and superannuation contributions. He did not receive an increase on his base salary of A$967,000 for 2013, a STIP award either for 2012 or 2013, or an LTIP award for 2013.
He received his 2010 SOP award, which vested prior to his termination date in accordance with the SOP rules. He was also able to exercise any vested but unexercised SOP awards prior to 16 July 2013. When he left the Group, all outstanding unvested LTIP and BDP awards earned in previous years lapsed and were forfeited.
He was eligible for statutory payments of outstanding annual leave and long service leave totalling A$878,000 and A$192,000 respectively which were paid in July 2013 upon his departure from the Group.
Doug did not receive a termination payment.
| | | | |
| | 90 riotinto.com/reportingcentre2013 | | |
STIP measures, weightings and targets for 2014
As in 2013, the STIP measures and opportunities for executives will be weighted 50 per cent for financial, 30 per cent for individual and 20 per cent for safety measures. The financial and individual targets which have been set for 2014 are regarded by the Board to be commercially sensitive. As such, the specific targets for these measures, and the performance against them, will be described retrospectively in the 2014 Implementation Report. The Group financial targets relate to earnings and cash flow. The individual targets include objectives relating to business transformation, cost reduction, performance delivery and leadership and engagement.
The safety measures, weightings and targets for 2014 are outlined below.
2014 safety measures, weightings and targets
The safety measures for all executives in 2013 were split equally between LTIFR and AIFR. For 2014, the AIFR measure will continue to apply. However, as LTIFR is a subset of AIFR, we have decided that the equal weighting measure
to apply alongside AIFR will be the actual count of lost time injuries (LTIs). This is intended to bring a greater focus to the actual injuries resulting in lost time during the year.
Threshold will be set at the average of the prior three years performance for the Group and target at a four per cent improvement over threshold for LTIs and seven per cent improvement over threshold for AIFR. Outstanding performance will be set at twice the percentage improvement between threshold and target.
The adjustment for fatalities, which has been applied in prior years has been strengthened to align with the zero fatality target and simplified. The new fatality adjustment, in the event a fatality occurs, is:
| – | For the PGCEO of the product group in which the fatality occurs, the chief executive and the Group executive, Organisational Resources, the safety score is reduced by 50 per cent. |
| – | For the chief financial officer and the Group executive, Legal, External & Regulatory Affairs, the safety score is reduced by 25 per cent. |
When remuneration is delivered
The following chart demonstrates the usual timeframe for the delivery of the components of remuneration, using 2013 as an example.
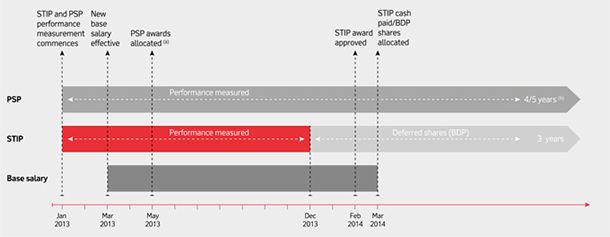
| (a) | PSP awards are typically allocated in March. The 2013 awards were allocated on 27 May 2013 after shareholders approved the new PSP. |
| (b) | PSP awards have a five-year performance period to provide long-term alignment with shareholders. As a transitional measure, awards granted in 2013 will vest 50 per cent after four years and 50 per cent after five years. |
| | | | |
| | 91 riotinto.com/reportingcentre2013 | | |
Remuneration Report: Implementation Report continued
Single total figure of remuneration
The table below provides a summary of actual remuneration in respect of 2013 and 2012, stated in the currency of payment. While not required under UK or Australian legislation, the information is presented for consistency with the disclosures for executive directors on pages 82 to 88. This is in addition to the Australian statutory disclosure requirements set out in US dollars in table 1a on pages 98 and 99. The remuneration details set out in table 1a include theoretical accounting values relating to various parts of the remuneration packages, most notably LTIP arrangements, and require a different methodology for calculating the pension and superannuation values. Accordingly, the figures below are not directly comparable with those in table 1a.
| | | | | | | | | | | | | | | | | | | | | | | | |
| | | Hugo Bague | | | Preston Chiaro | | | Bret Clayton(g) | |
| (stated in ‘000) | | 2013 | | | 2012 | | | 2013 | | | 2012 | | | 2013 | | | 2012 | |
Base salary paid(a) | | | £465 | | | | £427 | | | | US$789 | | | | US$786 | | | | US$126 | | | | US$760 | |
STIP payment – cash | | | £305 | | | | £219 | | | | US$710 | | | | US$196 | | | | US$75 | | | | US$0 | |
STIP payment – deferred shares(b) | | | £305 | | | | £219 | | | | US$0 | | | | US$196 | | | | US$75 | | | | US$0 | |
Total short-term pay | | | £1,075 | | | | £865 | | | | US$1,499 | | | | US$1,178 | | | | US$276 | | | | US$760 | |
Value of LTIP awards vesting(c) | | | £916 | | | | £4 | | | | US$1,846 | | | | US$1,217 | | | | US$293 | | | | US$1,174 | |
Pension or superannuation(d) | | | £110 | | | | £102 | | | | US$412 | | | | US$304 | | | | US$436 | | | | US$723 | |
Other benefits(e) | | | £45 | | | | £144 | | | | US$18 | | | | US$83 | | | | US$391 | | | | US$1,160 | |
Single total figure of remuneration | | | £2,146 | | | | £1,115 | | | | US$3,775 | | | | US$2,782 | | | | US$1,396 | | | | US$3,817 | |
Percentage change in total remuneration (2013 versus 2012) | | | 92.5% | | | | | | | | 35.7% | | | | | | | | (63.4%) | | | | | |
Percentage of total remuneration provided as performance-related pay (STIP and LTIP) | | | 71.1% | | | | 39.6% | | | | 67.7% | | | | 57.8% | | | | 31.7% | | | | 30.8% | |
Percentage of total remuneration provided as non-performance-related pay (base salary, pension and other benefits) | | | 28.9% | | | | 60.4% | | | | 32.3% | | | | 42.2% | | | | 68.3% | | | | 69.2% | |
Percentage of maximum STIP awarded(f) | | | 64.6% | | | | 51.0% | | | | 45.0% | | | | 24.8% | | | | 59.8% | | | | 0.0% | |
Percentage of maximum STIP forfeited | | | 35.4% | | | | 49.0% | | | | 55.0% | | | | 75.2% | | | | 40.2% | | | | 100.0% | |
Percentage of target STIP awarded | | | 129.1% | | | | 102.0% | | | | 90.0% | | | | 49.6% | | | | 118.9% | | | | 0.0% | |
| | | |
| | | Jacynthe Côté | | | Alan Davies(h) | | | Andrew Harding | |
| (stated in ‘000) | | 2013 | | | 2012 | | | 2013 | | | 2012 | | | 2013 | | | 2012 | |
Base salary paid(a) | | | C$930 | | | | C$921 | | | | A$768 | | | | A$250 | | | | £533 | | | | £433 | |
STIP payment – cash | | | C$527 | | | | C$100 | | | | A$414 | | | | A$118 | | | | £372 | | | | £248 | |
STIP payment – deferred shares(b) | | | C$527 | | | | C$101 | | | | A$414 | | | | A$119 | | | | £371 | | | | £249 | |
Total short-term pay | | | C$1,984 | | | | C$1,122 | | | | A$1,596 | | | | A$487 | | | | £1,276 | | | | £930 | |
Value of LTIP awards vesting(c) | | | C$2,154 | | | | C$1,380 | | | | A$764 | | | | A$378 | | | | £1,074 | | | | £0 | |
Pension or superannuation(d) | | | C$832 | | | | C$496 | | | | A$174 | | | | A$49 | | | | £133 | | | | £103 | |
Other benefits(e) | | | C$48 | | | | C$140 | | | | A$529 | | | | A$158 | | | | £416 | | | | £408 | |
Single total figure of remuneration | | | C$5,018 | | | | C$3,138 | | | | A$3,063 | | | | A$1,072 | | | | £2,899 | | | | £1,441 | |
Percentage change in total remuneration (2013 versus 2012) | | | 59.9% | | | | | | | | 185.7% | | | | | | | | 101.2% | | | | | |
Percentage of total remuneration provided as performance-related pay (STIP and LTIP) | | | 63.9% | | | | 50.4% | | | | 52.0% | | | | 57.4% | | | | 62.7% | | | | 34.5% | |
Percentage of total remuneration provided as non-performance-related pay (base salary, pension and other benefits) | | | 36.1% | | | | 49.6% | | | | 48.0% | | | | 42.6% | | | | 37.3% | | | | 65.5% | |
Percentage of maximum STIP awarded(f) | | | 56.7% | | | | 10.8% | | | | 53.7% | | | | 47.5% | | | | 68.0% | | | | 57.0% | |
Percentage of maximum STIP forfeited | | | 43.3% | | | | 89.2% | | | | 46.3% | | | | 52.5% | | | | 32.0% | | | | 43.0% | |
Percentage of target STIP awarded | | | 113.4% | | | | 21.6% | | | | 107.3% | | | | 94.9% | | | | 136.1% | | | | 113.9% | |
| | | | |
| | 92 riotinto.com/reportingcentre2013 | | |
| | | | | | | | | | | | | | | | | | | | | | | | |
| | | Jean-Sébastien Jacques(i) | | | Harry Kenyon-Slaney | | | Doug Ritchie(j) | |
| (stated in ‘000) | | 2013 | | | 2012 | | | 2013 | | | 2012 | | | 2013 | | | 2012 | |
Base salary paid(a) | | | £383 | | | | – | | | | £512 | | | | £459 | | | | A$54 | | | | A$961 | |
STIP payment – cash | | | £229 | | | | – | | | | £291 | | | | £256 | | | | A$0 | | | | A$0 | |
STIP payment – deferred shares(b) | | | £229 | | | | – | | | | £290 | | | | £257 | | | | A$0 | | | | A$0 | |
Total short-term pay | | | £841 | | | | – | | | | £1,093 | | | | £972 | | | | A$54 | | | | A$961 | |
Value of LTIP awards vesting(c) | | | £236 | | | | – | | | | £916 | | | | £4 | | | | A$0 | | | | A$0 | |
Pension or superannuation(d) | | | £77 | | | | – | | | | £126 | | | | £82 | | | | A$0 | | | | A$347 | |
Other benefits(e) | | | £23 | | | | – | | | | £298 | | | | £137 | | | | A$2 | | | | A$166 | |
Single total figure of remuneration | | | £1,177 | | | | – | | | | £2,433 | | | | £1,195 | | | | A$56 | | | | A$1,474 | |
Percentage change in total remuneration (2013 versus 2012) | | | – | | | | | | | | 103.6% | | | | | | | | (96.2% | ) | | | | |
Percentage of total remuneration provided as performance-related pay (STIP and LTIP) | | | 58.9% | | | | – | | | | 61.5% | | | | 43.3% | | | | 0.0% | | | | 0.0% | |
Percentage of total remuneration provided as non-performance related pay (base salary, pension and other benefits) | | | 41.1% | | | | – | | | | 38.5% | | | | 56.7% | | | | 100.0% | | | | 100.0% | |
Percentage of maximum STIP awarded(f) | | | 59.7% | | | | – | | | | 56.7% | | | | 50.1% | | | | 0.0% | | | | 0.0% | |
Percentage of maximum STIP forfeited | | | 40.3% | | | | – | | | | 43.3% | | | | 49.9% | | | | 100.0% | | | | 100.0% | |
Percentage of target STIP awarded | | | 119.5% | | | | – | | | | 113.5% | | | | 100.1% | | | | 0.0% | | | | 0.0% | |
| | | |
| | | Debra Valentine | | | | | | | |
| (stated in ‘000) | | 2013 | | | 2012 | | | | | | | | | | | | | |
Base salary paid(a) | | | US$668 | | | | US$648 | | | | | | | | | | | | | | | | | |
STIP payment – cash | | | US$429 | | | | US$342 | | | | | | | | | | | | | | | | | |
STIP payment – deferred shares(b) | | | US$428 | | | | US$342 | | | | | | | | | | | | | | | | | |
Total short-term pay | | | US$1,525 | | | | US$1,332 | | | | | | | | | | | | | | | | | |
Value of LTIP awards vesting(c) | | | US$1,451 | | | | US$381 | | | | | | | | | | | | | | | | | |
Pension or superannuation(d) | | | US$214 | | | | US$214 | | | | | | | | | | | | | | | | | |
Other benefits(e) | | | US$585 | | | | US$1,514 | | | | | | | | | | | | | | | | | |
Single total figure of remuneration | | | US$3,775 | | | | US$3,441 | | | | | | | | | | | | | | | | | |
Percentage change in total remuneration (2013 versus 2012) | | | 9.7% | | | | | | | | | | | | | | | | | | | | | |
Percentage of total remuneration provided as performance-related pay (STIP and LTIP) | | | 61.1% | | | | 31.0% | | | | | | | | | | | | | | | | | |
Percentage of total remuneration provided as non-performance-related pay (base salary, pension and other benefits) | | | 38.9% | | | | 69.0% | | | | | | | | | | | | | | | | | |
Percentage of maximum STIP awarded(f) | | | 63.8% | | | | 52.5% | | | | | | | | | | | | | | | | | |
Percentage of maximum STIP forfeited | | | 36.2% | | | | 47.5% | | | | | | | | | | | | | | | | | |
Percentage of target STIP awarded | | | 127.6% | | | | 104.9% | | | | | | | | | | | | | | | | | |
| (a) | Salary paid in the financial year to 31 December. Salaries are reviewed with effect from 1 March. |
| (b) | Value of STIP deferred under the BDP. |
| (c) | Based on the value of the LTIP awards which vested in respect of the performance period that ended 31 December. The Rio Tinto Ltd and Rio Tinto plc share prices used to calculate the value of the awards vesting on 17 February 2014 of A$69.54 and £35.59 respectively, were sourced from Investis Ltd. |
| (d) | For defined benefit plans, pension or superannuation reflects the value of the pension or superannuation accrued during the year assuming that it was to come into payment immediately. For defined contribution plans it is the amount contributed in the year by the Company. This differs from the value reported in table 1a which is calculated using an IAS19 methodology and assumptions on rates of investment return, inflation and salary increases. In line with changes to UK reporting requirements it includes cash paid in lieu of pension contributions for Hugo Bague, Alan Davies, Harry Kenyon-Slaney and Andrew Harding which were included in “Other Benefits” for 2012. The 2012 figures have been restated accordingly. The previous figures disclosed for 2012 were £27,000 for Hugo Bague, A$3,000 for Alan Davies, £27,000 for Andrew Harding and £94,000 for Harry Kenyon-Slaney. Similarly, “Other post-employment benefits” for Bret Clayton and Debra Valentine that were included in “Pension or superannuation” in 2012 have been reclassified as “Other benefits” to reflect the changes to UK reporting requirements. The 2012 figures have been restated accordingly. The previous figures disclosed for 2012 were US$342,000 for Bret Clayton and US$219,000 for Debra Valentine. |
| (e) | Includes healthcare, allowance for professional tax services, car allowance or car and for 2012, activities in relation to Rio Tinto’s sponsorship of the medals for the 2012 |
| | London Olympics. Will include active or legacy expatriate related benefits, as relevant. In line with changes to UK reporting requirements , cash paid in lieu of pension contributions for Hugo Bague, Alan Davies, Harry Kenyon-Slaney and Andrew Harding are included in “Pension or superannuation”. The 2012 figures have been restated accordingly. The previous figures disclosed for 2012 were £220,000 for Hugo Bague, A$204,000 for Alan Davies, £484,000 for Andrew Harding and £219,000 for Harry Kenyon-Slaney. Similarly, “Other post-employment benefits” for Bret Clayton and Debra Valentine that were included in “Pension or superannuation” in 2012 have been reclassified as “Other benefits” to reflect the changes to UK reporting requirements. The 2012 figures have been restated accordingly. The previous figures disclosed for 2012 were US$1,156,000 for Bret Clayton and US$1,510,000 for Debra Valentine. |
| (f) | The maximum potential STIP award is 200 per cent of base salary. |
| (g) | Remuneration details for 2013 reflect remuneration received for the period 1 January 2013 – 1 March 2013. |
| (h) | Remuneration details for 2012 reflect remuneration received for the period 1 September 2012 – 31 December 2012. |
| (i) | Remuneration details for 2013 reflect remuneration received for the period 14 February 2013 – 31 December 2013. |
| (j) | Remuneration details for 2013 reflect remuneration received for the period 1 January 2013 – 17 January 2013. Outstanding LTIP awards lapsed upon leaving the Group. Remuneration received for the period 18 January 2013 – 16 July 2013 was base salary of A$481,000, superannuation of A$79,000 and other benefits of A$35,000. Statutory accrued annual leave and long service leave totalling A$1,070,000 was also paid out on termination. |
| | | | |
| | 93 riotinto.com/reportingcentre2013 | | |
Remuneration Report: Implementation Report continued
Context to outcomes for the Executive Committee
The increase in total remuneration for most executives is primarily driven by the significant change in the value of LTIP awards vesting in 2013 compared to 2012 and relatively higher STIP awards for 2013.
Hugo Bague, Alan Davies, Andrew Harding, Harry Kenyon-Slaney and Debra Valentine did not participate in the 2009 PSP awards which vested with respect to the performance period that ended 31 December 2012 as their awards for 2009 comprised awards under the MSP and SOP. The 2009 awards under the 2009 MSP and 2009 SOP had performance periods that ended 31 December 2011. Awards under the 2010 SOP which vested with respect to the performance period ending 31 December 2012 had minimal value in terms of 2012 remuneration due to the share price at the time of vesting being close to or below the option exercise price. Alan Davies and Debra Valentine also had awards of MSP shares which vested with respect to the performance period ending 31 December 2012.
The increase in remuneration for Alan Davies reflects that his 2012 remuneration represents part year remuneration for the period 1 September 2012 to 31 December 2012. The increases for Preston Chiaro and Jacynthe Côté reflect higher STIP awards in 2013 compared to 2012 due to significantly higher discretionary downward adjustments being made to their 2012 STIP awards. The decreases in remuneration for Bret Clayton and Doug Ritchie reflects that their 2013 remuneration represents part year remuneration for the periods 1 January 2013 to 1 March 2013 and 1 January 2013 to 17 January 2013 respectively.
Potential value of 2014 remuneration package
The table below shows the potential minimum and maximum value of the 2014 remuneration package and the threshold, target and maximum value of the 2014 STIP and LTIP awards.
| | | | | | | | | | | | | | | | | | | | | | | | | | | | | | | | | | | | |
| Stated in ‘000 | | | Currency | | | | Base salary | | |
| Pension/
superannuation |
(a) | | | Benefits | (b) | |
| Minimum
potential remuneration |
(c) | |
| Threshold
value of STIP and LTIP awards |
(d) | |
| Target value
of STIP and LTIP awards |
(e) | |
| Maximum
value of STIP and LTIP awards |
(f) | |
| Maximum
potential remuneration |
|
Hugo Bague | | | £ | | | | £484 | | | | £110 | | | | £45 | | | | £639 | | | | £678 | | | | £1,452 | | | | £2,904 | | | | £3,543 | |
Jacynthe Côté | | | C$ | | | | C$946 | | | | C$832 | | | | C$48 | | | | C$1,826 | | | | C$1,324 | | | | C$2,838 | | | | C$5,676 | | | | C$7,502 | |
Alan Davies | | | A$ | | | | A$791 | | | | A$174 | | | | A$529 | | | | A$1,494 | | | | A$1,107 | | | | A$2,373 | | | | A$4,746 | | | | A$6,240 | |
Andrew Harding | | | £ | | | | £560 | | | | £133 | | | | £416 | | | | £1,109 | | | | £822 | | | | £1,764 | | | | £3,528 | | | | £4,637 | |
Jean-Sébastien Jacques | | | £ | | | | £512 | | | | £118 | | | | £26 | | | | £656 | | | | £751 | | | | £1,613 | | | | £3,226 | | | | £3,882 | |
Harry Kenyon-Slaney | | | £ | | | | £525 | | | | £126 | | | | £298 | | | | £949 | | | | £735 | | | | £1,575 | | | | £3,150 | | | | £4,099 | |
Greg Lilleyman | | | A$ | | | | A$760 | | | | A$587 | | | | A$174 | | | | A$1,521 | | | | A$1,030 | | | | A$2,204 | | | | A$4,408 | | | | A$5,929 | |
Debra Valentine | | | US$ | | | | US$682 | | | | US$214 | | | | US$585 | | | | US$1,481 | | | | US$955 | | | | US$2,046 | | | | US$4,092 | | | | US$5,573 | |
| (a) | Superannuation or pension is measured at the superannuation or pension figure in the single figure tables on pages 92 to 93, adjusted accordingly for Jean-Sébastien Jacques where the value for 2013 did not represent a full year. |
| (b) | Benefits are as measured at the benefits figure in the single figure tables on pages 92 to 93, excluding any significant one-off items where applicable and adjusted accordingly for Jean-Sébastien Jacques where the value for 2013 did not represent a full year. Note that this number includes expatriate benefits which are not capped. |
| (c) | The sum of base salary, pension/superannuation and benefits is the minimum potential remuneration (fixed remuneration). |
| (d) | Calculated based on threshold performance under the STIP (50 per cent of base salary) and threshold PSP vesting (22.5 per cent of the face value of the 2014 PSP award). |
| (e) | Calculated based on target performance under the STIP (100 per cent of base salary) and target PSP vesting (50 per cent of the face value of the 2014 PSP award). |
| (f) | Calculated based on outstanding performance under the STIP (200 per cent of base salary) and maximum PSP vesting (100 per cent of the face value of the 2014 PSP award). |
| | | | |
| | 94 riotinto.com/reportingcentre2013 | | |
Remuneration mix
The graphs below show the proportion of the package delivered through fixed and variable remuneration. The PSP, STIP deferred shares and STIP cash are all performance-related remuneration.
Proportion of the 2014 remuneration package value delivered through fixed and variable remuneration
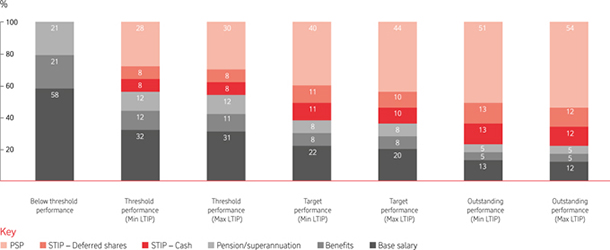
Long-term incentives – awards made prior to 2013
In 2012 and prior years, awards were made in the form of options under the Share Option Plan (SOP) and/or performance shares under the PSP.
From 2011, executives were able to express a preference regarding the mix of their long-term incentive opportunity.
| – | They could choose either a mix of performance shares and share options (with a maximum face value performance share award of 200 per cent of base salary, and a performance “kicker” leading to a vesting up to 1.5 times for exceptional performance), together with a maximum share option award of 300 per cent of base salary. |
| – | Or alternatively, they could choose to receive the full award in performance shares (with a maximum face value performance share award of 292 per cent of base salary, and a performance kicker leading to a vesting up to 1.5 times for exceptional performance). |
| – | The maximum value of award from selecting the full award in performance shares was therefore 438 per cent of base salary (292 per cent x 150 per cent). |
| – | The total expected value of awards made under either preference was the same, at 190 per cent of base salary. |
| – | Both awards were based solely on relative TSR performance to reward executives for increasing the share price and delivering superior TSR performance against other companies over a long-term timeframe. |
Before awards vest, the Committee must also satisfy itself that TSR performance is an appropriate reflection of the underlying performance of the business and/or the health of the Group. The Committee may therefore adjust vesting subject to the plan rules.
Long-term incentives – vesting outcomes for the period ended 31 December 2013
The awards with performance periods ending 31 December 2013 were the 2010 PSP awards and the 2011 SOP awards.
| | | | |
| 2010 PSP awards | | |
Performance period (4 years)
Rio Tinto TSR | | 1 January 2010 – 31 December 2013 50.1% |
| | |
| Comparator index | | HSBC | | MSCI |
| Index TSR | | 1.0% | | 66.2% |
| Outperformance per annum | | 10.5% | | (4.3%) |
| Vesting against index | | 150% | | 0% |
| % of shares vested | | 75% (50% of maximum) |
| % of shares forfeited | | 75% (50% of maximum) |
The performance conditions for the 2010, 2011 and 2012 PSP awards are included in the notes to table 3 on pages 106 to 108.
The methodology used to calculate the starting share prices for TSR comparison purposes, for Rio Tinto and the index, was the 12-month average prior to the commencement of the performance period.
The methodology used to calculate the ending share prices for TSR comparison purposes, for Rio Tinto and the index, was the last 12 months in the performance period. The usual conventions were also applied to set the number of options awarded, based upon the prior year average share price.
| | | | |
| | 95 riotinto.com/reportingcentre2013 | | |
Remuneration Report: Implementation Report continued
The table below summarises the average vesting of performance shares for executive directors over the five-year period 2010-2014.
| | | | | | | | | | | | |
| Performance period | | Vesting year | | | % of shares vested | | | % of maximum shares vested | |
2006-2009 | | | 2010 | | | | 39.6 | | | | 26.4 | |
2007-2010 | | | 2011 | | | | 36.4 | | | | 24.3 | |
2008-2011 | | | 2012 | | | | 0.0 | | | | 0.0 | |
2009-2012 | | | 2013 | | | | 92.5 | | | | 61.7 | |
2010-2013 | | | 2014 | | | | 75.0 | | | | 50.0 | |
Average vesting | | | – | | | | 48.7 | | | | 32.5 | |
| | |
| 2011 SOP awards | | |
| Performance period (3 years) | | 1 January 2011-31 December 2013 |
| Rio Tinto outperformance | | 23.1% |
Outperformance required for full vesting | | 15.8% |
| % of options vested | | 100% |
| % of options forfeited | | 0% |
Options awarded under the 2011 SOP can be exercised from 6 May 2014 until 6 May 2021.
The performance conditions for the 2011 and 2012 SOP awards are included in the notes to table 3 on page 108.
The methodology used to calculate the starting share prices for TSR comparison purposes, for Rio Tinto and the index, was the 12-month average prior to the commencement of the performance period.
The methodology used to calculate the ending share prices for TSR comparison purposes, for Rio Tinto and the index, was the last 12 months in the performance period. The usual conventions were also applied to set the number of options awarded, based upon the prior year average share price.
The table below summarises the average vesting of share options for executive directors over the five-year period 2010-2014.
| | | | | | | | |
| Performance period | | Vesting year | | | % of options vested | |
2007-2009 | | | 2010 | | | | 0.0 | |
2008-2010 | | | 2011 | | | | 0.0 | |
2009-2011 | | | 2012 | | | | 100.0 | |
2010-2012 | | | 2013 | | | | 100.0 | |
2011-2013 | | | 2014 | | | | 100.0 | |
Average vesting | | | – | | | | 60.0 | |
The SOP ceased operation from 2013. No awards of share options have been made since 2012.
MSP awards
Although executives are not eligible to receive awards under the MSP after their appointment as executives, Alan Davies and Jean-Sébastien Jacques received grants prior to their appointments as PGCEOs.
| | |
| Plan period | | Plan period that ended 31 December 2013 |
| Vesting period | | 21 March 2011-31 December 2013 |
| % of shares vested | | 100 |
| % of shares forfeited | | – |
TSR and relevant index TSR
Relative TSR is the single performance measure used to determine the vesting of awards made under the PSP and SOP prior to 2013. Rio Tinto’s TSR relative to the relevant index over the performance period has a direct impact on the levels of LTIP vesting.
The effect of this performance on shareholder wealth, as measured by TSR delivered during the relevant calendar year, is detailed in the table.
| | | | | | | | | | | | | | | | | | | | | | | | |
| | | Dividends paid during the year | | | Share price – Rio Tinto plc pence | | | Share price – Rio Tinto Limited A$ | | | Total shareholder return (TSR) | |
| Year | | US cents
per share | | | 1 Jan | | | 31 Dec | | | 1 Jan | | | 31 Dec | | | Group % | |
2013 | | | 178.0 | | | | 3,512 | | | | 3,409 | | | | 66.01 | | | | 68.18 | | | | 2.1 | |
2012 | | | 163.5 | | | | 3,125 | | | | 3,512 | | | | 60.30 | | | | 66.01 | | | | 14.8 | |
2011 | | | 117.0 | | | | 4,487 | | | | 3,125 | | | | 85.47 | | | | 60.30 | | | | (31.2 | ) |
2010 | | | 90.0 | | | | 3,390 | | | | 4,487 | | | | 74.89 | | | | 85.47 | | | | 31.6 | |
2009 | | | 68.0 | | | | 1,231 | | | | 3,390 | | | | 29.97 | | | | 74.89 | | | | 171.8 | |
The graph below illustrates the TSR performance of the Group against the HSBC Global Mining Index and the MSCI over the past five years to the end of 2013. These two indices are used to assess Rio Tinto’s relative TSR performance for awards made under the PSP from 2010 to 2012. The HSBC Global Mining Index alone is used to determine the vesting of awards made under the SOP.
The graph has been prepared in accordance with the requirements of Schedule 8 of the Large and Medium-sized Companies and Groups (Accounts and Reports) Regulations 2008 (as amended) and is not an indication of the likely vesting of awards granted under the PSP and SOP. The executive remuneration structure policy table on pages 71 to 73 provides further details of the performance conditions for the current PSP. The performance conditions for the previous PSP and the SOP are provided in the notes to table 3 on pages 107 to 108.
TSR (US$) – Rio Tinto Group vs. the HSBC Global Mining and MSCI World indices
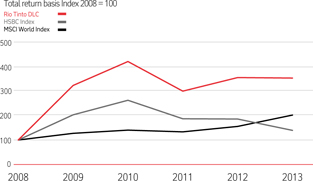
| | | | |
| | 96 riotinto.com/reportingcentre2013 | | |
Chief executive’s remuneration summary
| | | | | | | | | | | | | | | | | | |
| Year | | Chief executive(a) | |
| Single total
figure of remuneration (‘000) |
| |
| Annual
STIP award against maximum opportunity |
| |
| Long-term
incentive vesting against maximum opportunity (SOP) |
(b)(c) | |
| Long-term
incentive vesting against maximum opportunity (PSP) |
(c) |
2009 | | Tom Albanese | | | £3,516 | | | | 54.1% | | | | 0.0% | | | | 26.4% | |
2010 | | Tom Albanese | | | £4,512 | | | | 87.8% | | | | 0.0% | | | | 24.3% | |
2011 | | Tom Albanese | | | £4,256 | | | | 0.0% | | | | 100.0% | | | | 0.0% | |
2012 | | Tom Albanese | | | £4,040 | | | | 0.0% | | | | 100.0% | | | | 61.7% | |
2013 | | Tom Albanese | | | £53 | | | | 0.0% | | | | – | | | | – | |
| | | Sam Walsh | | | A$10,070 | | | | 72.1% | | | | – | | | | 50.0% | |
| (a) | Tom Albanese held the role of chief executive until 17 January 2013, and left the Group on 16 July 2013. The single total figure of remuneration for Tom Albanese for 2013 is for the period up until 17 January 2013. Sam Walsh took over as chief executive from 17 January 2013, having previously been the chief executive, Iron Ore and Australia. |
| (b) | In 2011, Sam Walsh elected to receive his full LTIP award under the PSP and as a result he has no options under the SOP that were granted in 2011 and which had a performance period that ended on 31 December 2013. |
| (c) | All outstanding but unvested LTIP awards earned in previous years lapsed and were forfeited when Tom Albanese left the Group. |
Employee share plans
Management Share Plan (MSP)
The primary focus of the MSP is to support the Group’s ability to attract and retain key staff below executive level in an increasingly tight and competitive labour market. Executives are not eligible to participate in the MSP.
Retention of key individuals is also important given the long-term nature of the delivery of the business strategy. MSP awards are conditional awards not subject to a performance condition as they vest subject to continued employment, at the end of three years, and thus act as an effective retention tool. Shares to satisfy the awards are purchased in the market and no new shares are issued.
All employee share plans
Executives may participate in broad-based share and share option plans which are available to Group employees generally and for which performance conditions do not apply. These plans form part of standard remuneration practice whereby employees are offered participation in plans to encourage alignment with the long-term performance of the Group.
Global employee share plan
The Committee believes that all employees should be given the opportunity to become shareholders in our business. A global employee share purchase plan is normally offered to all eligible employees across the world save for any local jurisdictional restrictions. Under the plan employees may acquire shares up to the value of US$5,000 (or equivalent in other currencies) per year, capped at ten per cent of base salary. Each share purchased will be matched by the Company providing the participant holds the shares, and remains employed, at the end of the three-year vesting period. The Committee believes this plan will serve to engage, retain and motivate employees over the long-term.
The current participation rate is now 20 per cent of employees, which means that over 12,000 of our employees are shareholders.
Dilution
Awards under the SOP, PSP and all employee plans may be satisfied by treasury shares, the issue of new shares or the purchase of shares in the market. Currently, Rio Tinto plc satisfies these awards by the issue of new shares or the transfer of shares from treasury. Rio Tinto Limited currently satisfies these awards by the market purchase and delivery of shares to plan participants. In the UK institutions have issued corporate governance guidelines in relation to the issue of new shares with which Rio Tinto plc complies (they do not apply to Rio Tinto Limited). All other share awards are satisfied by the use of shares which are purchased in the market. Further information in respect of the number of shares issued under plan arrangements can be found in note 44 to the financial statements.
Shareholder voting
The table below sets out the results of the remuneration-related resolutions approved at the Group’s 2013 AGMs.
| | | | | | | | | | | | | | | | |
| Resolution | |
| Total
votes cast |
| | | Votes for | | |
| Votes
against |
| |
| Votes
withheld |
(a) |
| Approval of the Remuneration Report | | | 1,230,689,523 | | | | 1,185,844,929 | | | | 40,800,291 | | | | 4,044,303 | |
| | | | | | | | 96.7% | | | | 3.3% | | | | | |
| Approval of the 2013 PSP | | | 1,230,035,676 | | | | 1,134,250,333 | | | | 83,492,776 | | | | 12,292,567 | |
| | | | | | | | 93.1% | | | | 6.9% | | | | | |
| (a) | A vote “withheld” is not a vote in law, and is not counted in the calculation of the proportion of votes for and against the resolution. |
Relative spend on remuneration
The table below sets out the details of total remuneration paid; distributions to shareholders; purchase of property, plant and equipment and intangible assets, and tax paid during the financial year.
| | | | | | | | |
| Stated in US$m | | 2013 | | | 2012 | |
Remuneration paid(a) | | | 7,568 | | | | 8,671 | |
Distributions to shareholders(b) | | | 3,322 | | | | 3,038 | |
Purchase of property, plant and equipment and intangible assets(c) | | | 13,001 | | | | 17,615 | |
Corporate income tax paid(c) | | | 3,698 | | | | 5,845 | |
| (a) | Total employment costs for the financial year as per note 5 to the financial statements. |
| (b) | Dividends paid during the financial year as per note 11 to the financial statements. |
| (c) | Purchase of property, plant and equipment and intangible assets, and Corporate income tax paid during the financial year are as per the Group cash flow statement and are calculated as per note 1 to the financial statements. These additional items were chosen by the directors as they represent other significant disbursements of the Company’s funds. |
| | | | |
| | 97 riotinto.com/reportingcentre2013 | | |
Remuneration Report: Implementation Report continued
Table 1a – Executives’ remuneration
| | | | | | | | | | | | | | | | | | | | | | | | | | | | | | | | | | | | | | |
| | | | | | Short-term benefits | | | | | | Long-term benefits Value of share-based awards(f) | | | |
| Stated in US$’000(a) | | | | | | | Base salary | | | | Cash bonus | (b) | |
| Other cash-
based benefits |
(c) | |
| Non
monetary benefits |
(d)(e) | |
| Total short-
term benefits |
| |
| Other long-
term benefits |
| | | BDP | (g) | | | PSP | | | |
Executive directors | | | | | | | | | | | | | | | | | | | | | | | | | | | | | | | | | | | |
Sam Walsh | | | 2013 | | | | 1,830 | | | | 1,223 | | | | 87 | | | | 871 | | | | 4,011 | | | | – | | | | 1,189 | | | | 3,386 | | | |
| | | | 2012 | | | | 1,702 | | | | 1,115 | | | | 93 | | | | 146 | | | | 3,056 | | | | – | | | | 964 | | | | 3,152 | | | |
Chris Lynch(l) | | | 2013 | | | | 1,043 | | | | 754 | | | | 236 | | | | 1,443 | | | | 3,476 | | | | – | | | | 176 | | | | 399 | | | |
Tom Albanese (m) | | | 2013 | | | | 78 | | | | – | | | | – | | | | 4 | | | | 82 | | | | – | | | | 16 | | | | 128 | | | |
| | | | 2012 | | | | 1,667 | | | | – | | | | 3 | | | | 306 | | | | 1,976 | | | | – | | | | 338 | | | | 2,675 | | | |
Guy Elliott | | | 2013 | | | | 1,155 | | | | 1,364 | | | | 130 | | | | 55 | | | | 2,704 | | | | – | | | | 256 | | | | 3,342 | | | |
| | | | 2012 | | | | 1,165 | | | | – | | | | 24 | | | | 213 | | | | 1,402 | | | | – | | | | 268 | | | | 1,924 | | | |
Other key management personnel | | | | | | | | | | | | | | | | | | | | | | | | | | | | | | | |
Hugo Bague | | | 2013 | | | | 728 | | | | 504 | | | | 151 | | | | 42 | | | | 1,425 | | | | – | | | | 402 | | | | 1,147 | | | |
| | | | 2012 | | | | 677 | | | | 354 | | | | 139 | | | | 208 | | | | 1,378 | | | | – | | | | 290 | | | | 852 | | | |
Preston Chiaro | | | 2013 | | | | 789 | | | | 710 | | | | – | | | | 17 | | | | 1,516 | | | | – | | | | 291 | | | | 1,339 | | | |
| | | | 2012 | | | | 786 | | | | 196 | | | | – | | | | 83 | | | | 1,065 | | | | – | | | | 294 | | | | 1,284 | | | |
Bret Clayton(n) | | | 2013 | | | | 126 | | | | 75 | | | | – | | | | 391 | | | | 592 | | | | – | | | | 58 | | | | 213 | | | |
| | | | 2012 | | | | 760 | | | | – | | | | 3 | | | | 1,153 | | | | 1,916 | | | | – | | | | 247 | | | | 1,241 | | | |
Jacynthe Côté | | | 2013 | | | | 903 | | | | 495 | | | | 1 | | | | 45 | | | | 1,444 | | | | – | | | | 433 | | | | 1,543 | | | |
| | | | 2012 | | | | 921 | | | | 101 | | | | 12 | | | | 128 | | | | 1,162 | | | | – | | | | 320 | | | | 1,467 | | | |
Alan Davies | | | 2013 | | | | 743 | | | | 369 | | | | 193 | | | | 470 | | | | 1,775 | | | | – | | | | 228 | | | | 563 | | | |
| | | | 2012 | | | | 258 | | | | 123 | | | | 59 | | | | 152 | | | | 592 | | | | – | | | | 265 | | | | 105 | | | |
Andrew Harding | | | 2013 | | | | 833 | | | | 614 | | | | 167 | | | | 614 | | | | 2,228 | | | | – | | | | 455 | | | | 1,390 | | | |
| | | | 2012 | | | | 687 | | | | 401 | | | | 125 | | | | 642 | | | | 1,855 | | | | – | | | | 319 | | | | 1,018 | | | |
Jean-Sébastien Jacques(o) | | | 2013 | | | | 600 | | | | 378 | | | | 101 | | | | 11 | | | | 1,090 | | | | – | | | | 115 | | | | 212 | | | |
Harry Kenyon-Slaney | | | 2013 | | | | 802 | | | | 480 | | | | 150 | | | | 462 | | | | 1,894 | | | | – | | | | 422 | | | | 1,336 | | | |
| | | | 2012 | | | | 727 | | | | 415 | | | | 144 | | | | 203 | | | | 1,489 | | | | – | | | | 318 | | | | 995 | | | |
Doug Ritchie(p) | | | 2013 | | | | 44 | | | | – | | | | – | | | | 2 | | | | 46 | | | | – | | | | 13 | | | | 57 | | | |
| | | | 2012 | | | | 995 | | | | – | | | | 8 | | | | 164 | | | | 1,167 | | | | – | | | | 289 | | | | 1,221 | | | |
Debra Valentine | | | 2013 | | | | 668 | | | | 428 | | | | 26 | | | | 550 | | | | 1,672 | | | | – | | | | 395 | | | | 1,115 | | | |
| | | | 2012 | | | | 648 | | | | 342 | | | | 26 | | | | 1,483 | | | | 2,499 | | | | – | | | | 376 | | | | 845 | | | |
Notes to table 1a – Executives’ remuneration
| (a) | The total remuneration is reported in US dollars. The amounts have been converted using the relevant 2013 average exchange rates of £1=US$1.5646, A$1=US$0.9685, and C$1=US$0.9714. The annual cash bonus payable under the STIP has been converted using the relevant 2013 year end exchange rates of £1=US$1.6521, A$1=US$0.8921 and 1C$=US$0.9398. |
| (b) | Cash bonus relates to the cash portion of the 2013 STIP to be paid in March 2014. |
| (c) | Other cash-based benefits include cash in lieu of a car and fuel. For Chris Lynch, Hugo Bague, Jean-Sébastien Jacques, Harry Kenyon-Slaney and Andrew Harding, it includes a cash supplement equal to 20 per cent (25 per cent for Chris Lynch) of the amount by which their “Contributory Salary” exceeds the “Earning Cap” as defined in the Rio Tinto Pension Fund. For Guy Elliott, it includes a payment for 23.5 days outstanding unused annual leave. For Alan Davies it includes the difference between the Company superannuation contributions and the minimum level allowed in Australia under the Superannuation Guarantee legislation or the concessional contributions limits, which can be paid as a taxable cash allowance. For Jacynthe Côté, it includes a residual amount to be paid out in 2014 for her 2013 flexible perquisites. |
| (d) | Non-monetary benefits for executives include healthcare coverage, provision of a car, professional tax advice and flexible perquisites. For executive directors, it includes the value of Company provided transport. For Sam Walsh, it also includes spouse travel to attend the annual general meeting. 2012 figures include the value of activities in relation to Rio Tinto’s sponsorship of the medals for the 2012 London Olympics. |
| (e) | For executives living outside their home country, international assignment benefits comprising housing, education, relocation expenses, tax equalisation and relocation payments made to and on their behalf are included. For Sam Walsh, it includes relocation costs between Perth and London and a housing allowance and other assignment benefits in relation to his secondment. His remuneration is not subject to tax equalisation or cost of living adjustments. For Chris Lynch, it includes one-off relocation costs associated with his move from Melbourne to London and transitional housing support including house purchase assistance. He is not eligible for tax equalisation on his remuneration, cost of living or any other ongoing assignment benefits. |
| (f) | The value of share based awards has been determined in accordance with the recognition and measurement requirements of IFRS2 “Share-based Payment”. The fair value of awards granted under the Share Option Plan (SOP), the Management Share Plan (MSP), the Bonus Deferral Plan (BDP), the Performance Share Plan (PSP) and the Share Savings Plan (SSP) have been calculated at their dates of grant using valuation models provided by external consultants, Lane Clark and Peacock LLP, including an independent lattice-based option valuation model and a Monte Carlo valuation model which take into account the constraints on vesting and exercise attached to these awards. Further details of the valuation methods and assumptions used for these awards are included in note 44 (Share-based payments) in the 2013 full financial statements. The fair value of other share-based awards is measured at the purchase cost of the shares from the market. The non-executive directors do not participate in the long-term incentive share schemes. |
| (g) | BDP (Bonus Deferral Plan) represents the deferral of the 2010-2013 bonus under STIP into Rio Tinto Shares. |
| | | | |
| | 98 riotinto.com/reportingcentre2013 | | |
| | | | | | | | | | | | | | | | | | | | | | | | | | | | | | | | | | | | | | |
| | | | | | | | Long-term benefits Value of share-based awards(f) | | | Post-employment benefits(i) | | | | | | | | | | |
| | | Stated in US$’000(a) | | | | | | | MSP | | | | SOP | | | | Others | (h) | |
| Pension and
superannuation |
| |
| Other post-
employment benefits |
| |
| Termination
benefits |
| |
| Total
remuneration |
(j) | |
| Currency of
actual payment |
(k) |
| | | Executive directors | | | | | | | | | �� | | | | | | | | | | | | | | | | | | | | | | | | | | | |
| | Sam Walsh | | | 2013 | | | | – | | | | 160 | | | | 2 | | | | 453 | | | | – | | | | – | | | | 9,201 | | | | A$ | |
| | | | | | 2012 | | | | – | | | | 817 | | | | 3 | | | | 424 | | | | – | | | | – | | | | 8,416 | | | | A$ | |
| | | Chris Lynch(l) | | | 2013 | | | | – | | | | – | | | | – | | | | 44 | | | | – | | | | – | | | | 4,095 | | | | £ | |
| | Tom Albanese(m) | | | 2013 | | | | – | | | | 92 | | | | – | | | | 109 | | | | – | | | | – | | | | 427 | | | | £ | |
| | | | | | 2012 | | | | – | | | | 1,951 | | | | 6 | | | | 2,156 | | | | – | | | | – | | | | 9,102 | | | | £ | |
| | Guy Elliott | | | 2013 | | | | – | | | | 1,499 | | | | 9 | | | | 647 | | | | – | | | | – | | | | 8,457 | | | | £ | |
| | | | | | 2012 | | | | – | | | | 1,407 | | | | 7 | | | | 605 | | | | – | | | | – | | | | 5,613 | | | | £ | |
| | | Other key management personnel | | | | | | | | | | | | | | | | | | | | | | | | | | | | | |
| | Hugo Bague | | | 2013 | | | | – | | | | 546 | | | | 6 | | | | 42 | | | | – | | | | – | | | | 3,568 | | | | £ | |
| | | | | | 2012 | | | | – | | | | 793 | | | | 6 | | | | 43 | | | | – | | | | – | | | | 3,362 | | | | £ | |
| | Preston Chiaro | | | 2013 | | | | – | | | | 650 | | | | 1 | | | | 382 | | | | – | | | | – | | | | 4,179 | | | | US$ | |
| | | | | | 2012 | | | | – | | | | 975 | | | | 2 | | | | 383 | | | | – | | | | – | | | | 4,003 | | | | US$ | |
| | Bret Clayton(n) | | | 2013 | | | | – | | | | 103 | | | | – | | | | 64 | | | | – | | | | – | | | | 1,030 | | | | US$ | |
| | | | | | 2012 | | | | – | | | | 944 | | | | – | | | | 339 | | | | 3 | | | | – | | | | 4,690 | | | | US$ | |
| | Jacynthe Côté | | | 2013 | | | | – | | | | 745 | | | | 1 | | | | 510 | | | | – | | | | – | | | | 4,676 | | | | C$ | |
| | | | | | 2012 | | | | – | | | | 1,114 | | | | – | | | | 474 | | | | – | | | | – | | | | 4,537 | | | | US$/C$ | |
| | Alan Davies | | | 2013 | | | | 195 | | | | – | | | | 3 | | | | 10 | | | | – | | | | – | | | | 2,774 | | | | A$ | |
| | | | | | 2012 | | | | 121 | | | | – | | | | 1 | | | | 3 | | | | – | | | | – | | | | 1,087 | | | | A$ | |
| | Andrew Harding | | | 2013 | | | | – | | | | 566 | | | | 10 | | | | 56 | | | | – | | | | – | | | | 4,705 | | | | £ | |
| | | | | | 2012 | | | | – | | | | 881 | | | | 8 | | | | 43 | | | | – | | | | – | | | | 4,124 | | | | £ | |
| | | Jean-Sébastien Jacques(o) | | | 2013 | | | | 310 | | | | – | | | | 4 | | | | 37 | | | | – | | | | – | | | | 1,768 | | | | £ | |
| | Harry Kenyon-Slaney | | | 2013 | | | | – | | | | 287 | | | | 1 | | | | 157 | | | | – | | | | – | | | | 4,097 | | | | £ | |
| | | | | | 2012 | | | | – | | | | 523 | | | | 8 | | | | 149 | | | | – | | | | – | | | | 3,482 | | | | £ | |
| | Doug Ritchie(p) | | | 2013 | | | | – | | | | 46 | | | | – | | | | 11 | | | | – | | | | – | | | | 173 | | | | A$ | |
| | | | | | 2012 | | | | – | | | | 1,009 | | | | 2 | | | | 280 | | | | – | | | | – | | | | 3,968 | | | | A$ | |
| | Debra Valentine | | | 2013 | | | | – | | | | 535 | | | | 1 | | | | 214 | | | | 5 | | | | – | | | | 3,937 | | | | US$ | |
| | | | | | 2012 | | | | 6 | | | | 785 | | | | 1 | | | | 214 | | | | 5 | | | | – | | | | 4,731 | | | | US$ | |
| (h) | Others include the Share Savings Plan, Share Ownership Plan and Global Employee Share Plan. |
| (i) | The costs shown for defined benefit pension plans and post-retirement medical benefits are the service costs attributable to the individual, calculated in accordance with IAS19. The cost for defined contribution plans is the amount contributed in the year by the Company. |
| (j) | Total remuneration represents the disclosure of total emoluments and compensation required under the Australian Corporations Act 2001 and applicable accounting standards. |
| (k) | Jacynthe Côté’s remuneration was stated in US dollars until 29 February 2012 using a fixed exchange rate of US$1=C$0.987167. Effective 1 March 2012, her salary and all other short-term benefits received are paid in Canadian dollars. |
| (l) | Chris Lynch was appointed as an executive director on 1 March 2013 and assumed the role of chief financial officer on 18 April 2013. His remuneration for the period from 1 January 2013 to 28 February 2013, when he served as a non-executive director, is reported in table 1b. |
| (m) | Tom Albanese stepped down as a director on 17 January 2013 and left the Group on 16 July 2013. The figures reported in table 1a relate to the period he was director. His total remuneration for the period from 17 January 2013-16 July 2013 was -US$3,555,420. On termination, all unvested awards were forfeited. A reversal of the IFRS2 “Share-based Payment” compensation recognised to date is included. |
| (n) | Bret Clayton stepped down from the Executive Committee on 1 March 2013. The figures reported in table 1a relate to the period 1 January 2013 to 1 March 2013. |
| (o) | Jean-Sébastien Jacques was appointed chief executive, Copper on 14 February 2013. The figures reported in table 1a relate to the period from 14 February 2013 to 31 December 2013. |
| (p) | Doug Ritchie stepped down from the Executive Committee on 17 January 2013 and left the Group on 16 July 2013. The figures reported in table 1a relate to the period when he was a member of the Executive Committee. His total remuneration for the period from 17 January 2013 to 16 July 2013 was -US$1,968,186. On termination, all unvested awards were forfeited. A reversal of the IFRS2 “Share-based Payment” compensation recognised to date is included. |
| | | | |
| | 99 riotinto.com/reportingcentre2013 | | |
Remuneration Report: Implementation Report continued
Table 1b – Non-executive directors’ remuneration
| | | | | | | | | | | | | | | | |
| Stated in US$’000(a) | | | | | |
| Fees and
allowances |
(b) | |
| Non-monetary
benefits |
(c)(d) | |
| Single total
figure of remuneration |
(e) |
Chairman | | | | | | | | | | | | | | | | |
| Jan du Plessis | | | 2013 | | | | 1,119 | | | | 121 | | | | 1,240 | |
| | | | 2012 | | | | 1,109 | | | | 225 | | | | 1,334 | |
Non-executive directors | | | | | | | | | | | | | | | | |
| Robert Brown | | | 2013 | | | | 246 | | | | 74 | | | | 320 | |
| | | | 2012 | | | | 257 | | | | 119 | | | | 376 | |
| Vivienne Cox | | | 2013 | | | | 184 | | | | 14 | | | | 198 | |
| | | | 2012 | | | | 218 | | | | 100 | | | | 318 | |
| Michael Fitzpatrick | | | 2012 | | | | 294 | | | | – | | | | 294 | |
| | | | 2013 | | | | 265 | | | | 122 | | | | 387 | |
| Ann Godbehere | | | 2013 | | | | 246 | | | | 22 | | | | 268 | |
| | | | 2012 | | | | 234 | | | | 100 | | | | 334 | |
| Richard Goodmanson | | | 2013 | | | | 340 | | | | 97 | | | | 437 | |
| | | | 2012 | | | | 313 | | | | 137 | | | | 450 | |
| Andrew Gould | | | 2012 | | | | 85 | | | | 8 | | | | 93 | |
| Lord Kerr | | | 2013 | | | | 222 | | | | 14 | | | | 236 | |
| | | | 2012 | | | | 250 | | | | 83 | | | | 333 | |
| Chris Lynch(f) | | | 2013 | | | | 55 | | | | – | | | | 55 | |
| | | | 2012 | | | | 262 | | | | 145 | | | | 407 | |
| Paul Tellier | | | 2013 | | | | 293 | | | | 71 | | | | 364 | |
| | | | 2012 | | | | 289 | | | | 115 | | | | 404 | |
| John Varley | | | 2013 | | | | 325 | | | | 18 | | | | 343 | |
| | | | 2012 | | | | 330 | | | | – | | | | 330 | |
Notes to table 1b – Non-executive directors’ remuneration
| (a) | The remuneration is reported in US dollars. The amounts have been converted, where applicable, using the relevant 2013 average exchange rates of £1=US$1.5646, A$1= US$0.9685 and C$1= US$0.9714. |
| (b) | Fees and allowances comprise the total fees for the chairman and all non-executive directors and travel allowances for the non-executive directors (other than the chairman). Where the payment of statutory minimum superannuation contributions for non-executive directors is required by Australian superannuation law, these contributions are deducted from the director’s overall fee entitlements. The amounts deducted in 2013 and 2012 for Michael Fitzpatrick were A$25,000 and A$22,000 respectively. The amounts deducted in 2013 and 2012 for Chris Lynch were A$5,000 and A$22,000 respectively. The fees reported for 2012 for Michael Fitzpatrick and Chris Lynch of A$186,000 and A$152,000 respectively have been restated as they were reported net of superannuation contributions. |
| (c) | Non-monetary benefits include, for the first time in 2013, amounts which are deemed by the UK tax authorities to be benefits in kind relating largely to the costs of non-executive directors’ expenses in attending board meetings held at the Company’s UK registered office (including associated hotel and subsistence expenses). Given these expenses are incurred by directors in the fulfilment of their duties, the Company pays the tax on them. |
| (d) | In 2013, the following additional amounts are included as noted for the relevant director. For Jan du Plessis, the value of Company provided transport and medical insurance premiums. For Robert Brown, accountancy fees. For Richard Goodmanson, accountancy fees and a tax payment made by Rio Tinto on his behalf for the activities in relation to Rio Tinto’s sponsorship of the medals for the 2012 London Olympics. For Jan du Plessis, Robert Brown, Vivienne Cox, Michael Fitzpatrick, Ann Godbehere, Richard Goodmanson, Lord Kerr, Chris Lynch and Paul Tellier, 2012 figures include the value of activities in relation to Rio Tinto’s sponsorship of the medals for the 2012 London Olympics. |
| (e) | Represents disclosure of the single total figure of remuneration under Schedule 8 of the Large and Medium-sized Companies and Groups (Accounts and Reports) Regulations 2008 (as amended) and total remuneration under the Australian Corporations Act 2001 and applicable accounting standards. |
| (f) | The figures reported in table 1b relate to the period from 1 January 2013 to 28 February 2013 when Chris Lynch served as a non-executive director. |
| | | | |
| | 100 riotinto.com/reportingcentre2013 | | |
Table 2 – Directors’ and executives’ beneficial interests in Rio Tinto shares
| | | | | | | | | | | | | | | | | | | | | | | | | | | | | | | | | | | | |
| | | Rio Tinto plc(a) | | | Rio Tinto Limited | | | Movements | |
| | |
| 1 Jan
2013 |
(b) | |
| 31 Dec
2013 |
(c) | |
| 17 Feb
2014 |
(c) | |
| 1 Jan
2013 |
(b) | |
| 31 Dec
2013 |
(c) | |
| 17 Feb
2014 |
(c) | |
| Exercise
of options |
(d) | | | Compensation | (e) | | | Other | (f) |
Directors | | | | | |
| Tom Albanese(g) | | | 253,042 | | | | 253,042 | | | | – | | | | – | | | | | | | | – | | | | – | | | | – | | | | – | |
| Robert Brown | | | 2,200 | | | | 4,200 | | | | 4,200 | | | | – | | | | | | | | – | | | | – | | | | – | | | | 2,000 | |
| Vivienne Cox | | | 2,912 | | | | 2,912 | | | | 2,912 | | | | – | | | | | | | | – | | | | – | | | | – | | | | – | |
| Jan du Plessis | | | 30,000 | | | | 30,000 | | | | 30,000 | | | | – | | | | | | | | – | | | | – | | | | – | | | | – | |
| Guy Elliott(g) | | | 103,272 | | | | 103,612 | | | | – | | | | – | | | | | | | | – | | | | 151,886 | | | | 50,548 | | | | (202,093 | ) |
| Michael Fitzpatrick | | | – | | | | – | | | | – | | | | 6,252 | | | | 6,252 | | | | 6,252 | | | | – | | | | – | | | | – | |
| Ann Godbehere | | | 2,111 | | | | 2,981 | | | | 2,981 | | | | – | | | | | | | | | | | | – | | | | – | | | | 870 | |
| Richard Goodmanson | | | 12,465 | | | | 15,443 | | | | 15,443 | | | | – | | | | | | | | | | | | – | | | | – | | | | 2,978 | |
| Lord Kerr | | | 15,000 | | | | 15,000 | | | | 15,000 | | | | – | | | | | | | | | | | | – | | | | – | | | | – | |
| Chris Lynch | | | 2,070 | | | | 2,070 | | | | 2,070 | | | | 6,890 | | | | 6,890 | | | | 6,890 | | | | – | | | | – | | | | – | |
| Paul Tellier | | | 16,039 | | | | 18,490 | | | | 18,490 | | | | – | | | | | | | | | | | | – | | | | – | | | | 2,451 | |
| John Varley | | | 2,985 | | | | 2,985 | | | | 2,985 | | | | – | | | | | | | | | | | | – | | | | – | | | | – | |
| Sam Walsh | | | – | | | | – | | | | – | | | | 46,950 | | | | 94,444 | | | | 94,444 | | | | – | | | | 48,866 | | | | (1,372 | ) |
Executives | | | | | |
| Hugo Bague | | | 34,910 | | | | 39,708 | | | | 39,741 | | | | – | | | | – | | | | – | | | | 84 | | | | 7,139 | | | | (2,391 | ) |
| Preston Chiaro(g) | | | 99,373 | | | | 99,684 | | | | – | | | | – | | | | – | | | | – | | | | 0 | | | | 28,946 | | | | (28,635 | ) |
| Bret Clayton(g) | | | 28,616 | | | | 28,621 | | | | – | | | | – | | | | – | | | | – | | | | 0 | | | | 18,668 | | | | (18,662 | ) |
| Jacynthe Côté | | | 22,636 | | | | 39,899 | | | | 39,921 | | | | – | | | | – | | | | – | | | | 0 | | | | 32,845 | | | | (15,560 | ) |
| Alan Davies | | | – | | | | – | | | | – | | | | 7,821 | | | | 15,920 | | | | 15,941 | | | | 3,538 | | | | 5,000 | | | | (418 | ) |
| Andrew Harding | | | 154 | | | | 4,466 | | | | 4,466 | | | | 24,684 | | | | 24,684 | | | | 24,684 | | | | 0 | | | | 8,154 | | | | (3,842 | ) |
| Jean-Sébastien Jacques(h) | | | 199 | | | | 4,528 | | | | 4,561 | | | | | | | | – | | | | – | | | | 0 | | | | 8,156 | | | | (3,793 | ) |
| Harry Kenyon-Slaney | | | 27,815 | | | | 32,506 | | | | 32,517 | | | | – | | | | – | | | | – | | | | 280 | | | | 8,158 | | | | (3,735 | ) |
| Greg Lilleyman (i) | | | – | | | | – | | | | – | | | | – | | | | – | | | | 23,154 | | | | – | | | | 20 | | | | – | |
| Doug Ritchie(g) | | | – | | | | – | | | | – | | | | 42,399 | | | | 42,399 | | | | – | | | | – | | | | – | | | | – | |
Debra Valentine | | | 29,852 | | | | 33,926 | | | | 33,948 | | | | – | | | | – | | | | – | | | | 180 | | | | 7,442 | | | | (3,525 | ) |
Notes to table 2
| (a) | Rio Tinto plc ordinary shares or American Depositary Shares. |
| (b) | Or date of appointment, if later. |
| (c) | Or date of retirement or at date no longer a member of the Executive Committee, if earlier. |
| (d) | Shares obtained through the exercise of options under the Rio Tinto Share Savings Plan or the SOP. The number of shares retained may differ from the number of options exercised. |
| (e) | Shares obtained through the Rio Tinto Share Ownership Plan and/or vesting of awards under the PSP, MSP and BDP. |
| (f) | Share movements due to sale or purchase of shares, shares received under the Dividend Reinvestment Plan, shares purchased/sold through the Rio Tinto America Savings Plan or non-executive directors’ Share Purchase Plan. |
| (g) | Tom Albanese resigned as a director on 17 January 2013. Guy Elliott retired as a director on 31 December 2013. Doug Ritchie, Bret Clayton and Preston Chiaro resigned from the Executive Committee on 17 January 2013, 1 March 2013 and 31 December 2013 respectively. |
| (h) | Appointed 14 February 2013. The balance at 19 February 2013 for Jean-Sébastien Jacques was understated in the 2012 Remuneration report by 199 shares. |
| (i) | Appointed 1 January 2014. |
| (j) | Interests in outstanding awards under LTIPs and option plans are set out in table 3. |
| | | | |
| | 101 riotinto.com/reportingcentre2013 | | |
Remuneration Report: Implementation Report continued
Table 3 – Plan interests (awards of shares and options under long-term incentive plans)
| | | | | | | | | | | | | | | | | | | | | | | | | | | | | | | | | | | | | | | | | | | | | | | | |
| | |
| Conditional
award
granted |
| |
| Market
price at
award |
| |
| 1 Jan
2013 |
(a) | | | Awarded | | |
| Lapsed/
cancelled |
| |
| Dividend
shares |
| | | Vested | | |
| 31 Dec
2013 |
(b) | |
| Performance
period
concludes |
| |
| Date of
election |
| |
| Market
price at election |
| |
| Monetary
value of
vested
award
US$‘000 |
|
|
Bonus Deferral Plan | |
| Tom Albanese | | | 21-Mar-11 | | | | £40.58 | | | | 20,127 | | | | – | | | | 20,127 | | | | – | | | | – | | | | – | | | | 01-Dec-13 | | | | – | | | | – | | | | – | |
| Hugo Bague | | | 21-Mar-11 | | | | £40.58 | | | | 6,380 | | | | – | | | | – | | | | 503 | | | | 6,883 | | | | – | | | | 01-Dec-13 | | | | 06-Dec-13 | | | | £33.05 | | | | 356 | |
| | | 19-Mar-12 | | | | £36.15 | | | | 7,069 | | | | – | | | | – | | | | – | | | | – | | | | 7,069 | | | | 01-Dec-14 | | | | – | | | | – | | | | – | |
| | | | 27-May-13 | | | | £28.67 | | | | – | | | | 6,945 | | | | – | | | | – | | | | – | | | | 6,945 | | | | 01-Dec-15 | | | | – | | | | – | | | | – | |
| Preston Chiaro | | | 21-Mar-11 | | | | £40.58 | | | | 8,837 | | | | – | | | | – | | | | 697 | | | | 9,534 | | | | – | | | | 01-Dec-13 | | | | 12-Dec-13 | | | | £31.92 | | | | 476 | |
| | | 19-Mar-12 | | | | £36.15 | | | | 7,062 | | | | – | | | | – | | | | – | | | | – | | | | 7,062 | | | | 01-Dec-14 | | | | – | | | | – | | | | – | |
| | | | 27-May-13 | | | | £28.67 | | | | – | | | | 4,105 | | | | – | | | | – | | | | – | | | | 4,105 | | | | 01-Dec-15 | | | | – | | | | – | | | | – | |
| Bret Clayton | | | 21-Mar-11 | | | | £40.58 | | | | 7,472 | | | | – | | | | – | | | | – | | | | – | | | | 7,472 | | | | 01-Dec-13 | | | | – | | | | – | | | | – | |
| | | | 19-Mar-12 | | | | £36.15 | | | | 8,636 | | | | – | | | | – | | | | – | | | | – | | | | 8,636 | | | | 01-Dec-14 | | | | – | | | | – | | | | – | |
| Jacynthe Côté | | | 21-Mar-11 | | | | £40.58 | | | | 9,979 | | | | – | | | | – | | | | 787 | | | | 10,766 | | | | – | | | | 01-Dec-13 | | | | 09-Dec-13 | | | | £32.91 | | | | 554 | |
| | | 19-Mar-12 | | | | £36.15 | | | | 9,096 | | | | – | | | | – | | | | – | | | | – | | | | 9,096 | | | | 01-Dec-14 | | | | – | | | | – | | | | – | |
| | | | 27-May-13 | | | | £28.67 | | | | – | | | | 2,050 | | | | – | | | | – | | | | – | | | | 2,050 | | | | 01-Dec-15 | | | | – | | | | – | | | | – | |
| Alan Davies | | | 21-Mar-11 | | | | A$81.00 | | | | 823 | | | | – | | | | – | | | | 48 | | | | 871 | | | | – | | | | 01-Dec-13 | | | | 04-Dec-13 | | | | A$66.29 | | | | 56 | |
| | | 19-Mar-12 | | | | A$65.85 | | | | 2,315 | | | | – | | | | – | | | | – | | | | – | | | | 2,315 | | | | 01-Dec-14 | | | | – | | | | – | | | | – | |
| | | | 27-May-13 | | | | A$53.11 | | | | – | | | | 6,702 | | | | – | | | | – | | | | – | | | | 6,702 | | | | 01-Dec-15 | | | | – | | | | – | | | | – | |
| Guy Elliott | | | 21-Mar-11 | | | | £40.58 | | | | 15,956 | | | | – | | | | – | | | | 1,259 | | | | 17,215 | | | | – | | | | 01-Dec-13 | | | | 13-Dec-13 | | | | £31.80 | | | | 857 | |
| Andrew Harding | | | 21-Mar-11 | | | | £40.58 | | | | 7,465 | | | | – | | | | – | | | | 589 | | | | 8,054 | | | | – | | | | 01-Dec-13 | | | | 05-Dec-13 | | | | £32.69 | | | | 412 | |
| | | 19-Mar-12 | | | | £36.15 | | | | 7,096 | | | | – | | | | – | | | | – | | | | – | | | | 7,096 | | | | 01-Dec-14 | | | | – | | | | – | | | | – | |
| | | | 27-May-13 | | | | £28.67 | | | | – | | | | 7,870 | | | | – | | | | – | | | | – | | | | 7,870 | | | | 01-Dec-15 | | | | – | | | | – | | | | – | |
| Jean-Sébastien Jacques | | | 19-Mar-12 | | | | £36.15 | | | | 518 | | | | – | | | | – | | | | – | | | | – | | | | 518 | | | | 01-Dec-14 | | | | – | | | | – | | | | – | |
| | | | 27-May-13 | | | | £28.67 | | | | – | | | | 2,113 | | | | – | | | | – | | | | – | | | | 2,113 | | | | 01-Dec-15 | | | | – | | | | – | | | | – | |
| Harry Kenyon-Slaney | | | 21-Mar-11 | | | | £40.58 | | | | 7,521 | | | | – | | | | – | | | | 593 | | | | 8,114 | | | | – | | | | 01-Dec-13 | | | | 11-Dec-13 | | | | £31.92 | | | | 405 | |
| | | 19-Mar-12 | | | | £36.15 | | | | 6,729 | | | | – | | | | – | | | | – | | | | – | | | | 6,729 | | | | 01-Dec-14 | | | | – | | | | – | | | | – | |
| | | | 27-May-13 | | | | £28.67 | | | | – | | | | 8,128 | | | | – | | | | – | | | | – | | | | 8,128 | | | | 01-Dec-15 | | | | – | | | | – | | | | – | |
| Doug Ritchie | | | 21-Mar-11 | | | | A$81.00 | | | | 7,639 | | | | – | | | | 7,639 | | | | – | | | | – | | | | – | | | | 01-Dec-13 | | | | – | | | | – | | | | – | |
| | | | 19-Mar-12 | | | | A$65.85 | | | | 7,221 | | | | – | | | | 7,221 | | | | – | | | | – | | | | – | | | | 01-Dec-14 | | | | – | | | | – | | | | – | |
| Debra Valentine | | | 21-Mar-11 | | | | £40.58 | | | | 6,802 | | | | – | | | | – | | | | 536 | | | | 7,338 | | | | – | | | | 01-Dec-13 | | | | 13-Dec-13 | | | | £31.80 | | | | 365 | |
| | | 19-Mar-12 | | | | £36.15 | | | | 7,244 | | | | – | | | | – | | | | – | | | | – | | | | 7,244 | | | | 01-Dec-14 | | | | – | | | | – | | | | – | |
| | | | 27-May-13 | | | | £28.67 | | | | – | | | | 7,173 | | | | – | | | | – | | | | – | | | | 7,173 | | | | 01-Dec-15 | | | | – | | | | – | | | | – | |
| Sam Walsh | | | 21-Mar-11 | | | | A$81.00 | | | | 17,914 | | | | – | | | | – | | | | 1,066 | | | | 18,980 | | | | – | | | | 01-Dec-13 | | | | 11-Dec-13 | | | | A$65.77 | | | | 1,209 | |
| | | 19-Mar-12 | | | | A$65.85 | | | | 18,490 | | | | – | | | | – | | | | – | | | | – | | | | 18,490 | | | | 01-Dec-14 | | | | – | | | | – | | | | – | |
| | | | 27-May-13 | | | | A$53.11 | | | | – | | | | 18,413 | | | | – | | | | – | | | | – | | | | 18,413 | | | | 01-Dec-15 | | | | – | | | | – | | | | – | |
|
Performance Share Plan | |
| Tom Albanese | | | 17-Mar-09 | | | | £19.82 | | | | 48,019 | | | | – | | | | 3,602 | | | | – | | | | 44,417 | | | | – | | | | 31-Dec-12 | | | | 19-Feb-13 | | | | £37.14 | | | | 2,581 | |
| | | 22-Mar-10 | | | | £37.30 | | | | 79,486 | | | | – | | | | 79,486 | | | | – | | | | – | | | | – | | | | 31-Dec-13 | | | | – | | | | – | | | | – | |
| | | 06-May-11 | | | | £41.51 | | | | 56,943 | | | | – | | | | 56,943 | | | | – | | | | – | | | | – | | | | 31-Dec-14 | | | | – | | | | – | | | | – | |
| | | | 19-Mar-12 | | | | £36.15 | | | | 54,230 | | | | – | | | | 54,230 | | | | – | | | | – | | | | – | | | | 31-Dec-15 | | | | – | | | | – | | | | – | |
| Hugo Bague | | | 22-Mar-10 | | | | £37.30 | | | | 31,531 | | | | – | | | | – | | | | – | | | | – | | | | 31,531 | | | | 31-Dec-13 | | | | – | | | | – | | | | – | |
| | | 06-May-11 | | | | £41.51 | | | | 22,943 | | | | – | | | | – | | | | – | | | | – | | | | 22,943 | | | | 31-Dec-14 | | | | – | | | | – | | | | – | |
| | | 19-Mar-12 | | | | £36.15 | | | | 22,056 | | | | – | | | | – | | | | – | | | | – | | | | 22,056 | | | | 31-Dec-15 | | | | – | | | | – | | | | – | |
| | | 27-May-13 | | | | £28.67 | | | | – | | | | 29,294 | | | | – | | | | – | | | | – | | | | 29,294 | | | | 31-Dec-16 | | | | – | | | | – | | | | – | |
| | | | 27-May-13 | | | | £28.67 | | | | – | | | | 29,295 | | | | – | | | | – | | | | – | | | | 29,295 | | | | 31-Dec-17 | | | | – | | | | – | | | | – | |
| Preston Chiaro | | | 17-Mar-09 | | | | £19.82 | | | | 20,904 | | | | – | | | | 1,568 | | | | – | | | | 19,336 | | | | – | | | | 31-Dec-12 | | | | 18-Mar-13 | | | | £32.77 | | | | 991 | |
| | | 22-Mar-10 | | | | £37.30 | | | | 40,559 | | | | – | | | | – | | | | – | | | | – | | | | 40,559 | | | | 31-Dec-13 | | | | – | | | | – | | | | – | |
| | | 06-May-11 | | | | £41.51 | | | | 27,565 | | | | – | | | | – | | | | – | | | | – | | | | 27,565 | | | | 31-Dec-14 | | | | – | | | | – | | | | – | |
| | | 19-Mar-12 | | | | £36.15 | | | | 25,724 | | | | – | | | | – | | | | – | | | | – | | | | 25,724 | | | | 31-Dec-15 | | | | – | | | | – | | | | – | |
| | | 27-May-13 | | | | £28.67 | | | | – | | | | 23,150 | | | | – | | | | – | | | | – | | | | 23,150 | | | | 31-Dec-16 | | | | – | | | | – | | | | – | |
| | | | 27-May-13 | | | | £28.67 | | | | – | | | | 23,151 | | | | – | | | | – | | | | – | | | | 23,151 | | | | 31-Dec-17 | | | | – | | | | – | | | | – | |
| Bret Clayton | | | 17-Mar-09 | | | | £19.82 | | | | 20,182 | | | | – | | | | 1,514 | | | | – | | | | 18,668 | | | | – | | | | 31-Dec-12 | | | | 19-Feb-13 | | | | £37.14 | | | | 1,085 | |
| | | 22-Mar-10 | | | | £37.30 | | | | 39,160 | | | | – | | | | – | | | | – | | | | – | | | | 39,160 | | | | 31-Dec-13 | | | | – | | | | – | | | | – | |
| | | 06-May-11 | | | | £41.51 | | | | 26,670 | | | | – | | | | – | | | | – | | | | – | | | | 26,670 | | | | 31-Dec-14 | | | | – | | | | – | | | | – | |
| | | | 19-Mar-12 | | | | £36.15 | | | | 24,893 | | | | – | | | | – | | | | – | | | | – | | | | 24,893 | | | | 31-Dec-15 | | | | – | | | | – | | | | – | |
| | | | |
| | 102 riotinto.com/reportingcentre2013 | | |
Table 3 – Plan interests (awards of shares and options under long-term incentive plans) continued
| | | | | | | | | | | | | | | | | | | | | | | | | | | | | | | | | | | | | | | | | | | | | | | | |
| | |
| Conditional
award
granted |
| |
| Market
price at
award |
| |
| 1 Jan
2013 |
(a) | | | Awarded | | |
| Lapsed/
cancelled |
| |
| Dividend
shares |
| | | Vested | | |
| 31 Dec
2013 |
(b) | |
| Performance
period
concludes |
| |
| Date of
election |
| |
| Market
price at election |
| |
| Monetary
value of
vested
award
US$‘000 |
|
|
Performance Share Plan continued | |
| Jacynthe Côté | | | 17-Mar-09 | | | | £19.82 | | | | 23,787 | | | | – | | | | 1,785 | | | | – | | | | 22,002 | | | | – | | | | 31-Dec-12 | | | | 20-Feb-13 | | | | £36.46 | | | | 1,255 | |
| | | 22-Mar-10 | | | | £37.30 | | | | 46,153 | | | | – | | | | – | | | | – | | | | – | | | | 46,153 | | | | 31-Dec-13 | | | | – | | | | – | | | | – | |
| | | 06-May-11 | | | | £41.51 | | | | 31,682 | | | | – | | | | – | | | | – | | | | – | | | | 31,682 | | | | 31-Dec-14 | | | | – | | | | – | | | | – | |
| | | 19-Mar-12 | | | | £36.15 | | | | 30,056 | | | | – | | | | – | | | | – | | | | – | | | | 30,056 | | | | 31-Dec-15 | | | | – | | | | – | | | | – | |
| | | 27-May-13 | | | | £28.67 | | | | – | | | | 27,296 | | | | – | | | | – | | | | – | | | | 27,296 | | | | 31-Dec-16 | | | | – | | | | – | | | | – | |
| | | | 27-May-13 | | | | £28.67 | | | | – | | | | 27,297 | | | | – | | | | – | | | | – | | | | 27,297 | | | | 31-Dec-17 | | | | – | | | | – | | | | – | |
| Alan Davies | | | 22-Mar-10 | | | | A$75.03 | | | | 9,750 | | | | – | | | | – | | | | – | | | | – | | | | 9,750 | | | | 31-Dec-13 | | | | – | | | | – | | | | – | |
| | | 21-Mar-11 | | | | A$81.00 | | | | 6,228 | | | | – | | | | – | | | | – | | | | – | | | | 6,228 | | | | 31-Dec-14 | | | | – | | | | – | | | | – | |
| | | 19-Mar-12 | | | | A$65.85 | | | | 6,663 | | | | – | | | | – | | | | – | | | | – | | | | 6,663 | | | | 31-Dec-15 | | | | – | | | | – | | | | – | |
| | | 27-May-13 | | | | A$53.11 | | | | – | | | | 27,047 | | | | – | | | | – | | | | – | | | | 27,047 | | | | 31-Dec-16 | | | | – | | | | – | | | | – | |
| | | | 27-May-13 | | | | A$53.11 | | | | – | | | | 27,047 | | | | – | | | | – | | | | – | | | | 27,047 | | | | 31-Dec-17 | | | | – | | | | – | | | | – | |
| Guy Elliott | | | 17-Mar-09 | | | | £19.82 | | | | 35,743 | | | | – | | | | 2,681 | | | | – | | | | 33,062 | | | | – | | | | 31-Dec-12 | | | | 15-Mar-13 | | | | £33.12 | | | | 1,713 | |
| | | 22-Mar-10 | | | | £37.30 | | | | 59,166 | | | | – | | | | – | | | | – | | | | – | | | | 59,166 | | | | 31-Dec-13 | | | | – | | | | – | | | | – | |
| | | 06-May-11 | | | | £41.51 | | | | 39,805 | | | | – | | | | – | | | | – | | | | – | | | | 39,805 | | | | 31-Dec-14 | | | | – | | | | – | | | | – | |
| | | | 19-Mar-12 | | | | £36.15 | | | | 37,899 | | | | – | | | | – | | | | – | | | | – | | | | 37,899 | | | | 31-Dec-15 | | | | – | | | | – | | | | – | |
| Andrew Harding | | | 22-Mar-10 | | | | A$75.03 | | | | 31,064 | | | | – | | | | – | | | | – | | | | – | | | | 31,064 | | | | 31-Dec-13 | | | | – | | | | – | | | | – | |
| | | 06-May-11 | | | | £41.51 | | | | 23,219 | | | | – | | | | – | | | | – | | | | – | | | | 23,219 | | | | 31-Dec-14 | | | | – | | | | – | | | | – | |
| | | 19-Mar-12 | | | | £36.15 | | | | 22,390 | | | | – | | | | – | | | | – | | | | – | | | | 22,390 | | | | 31-Dec-15 | | | | – | | | | – | | | | – | |
| | | 27-May-13 | | | | £28.67 | | | | – | | | | 35,547 | | | | – | | | | – | | | | – | | | | 35,547 | | | | 31-Dec-16 | | | | – | | | | – | | | | – | |
| | | | 27-May-13 | | | | £28.67 | | | | – | | | | 35,548 | | | | – | | | | – | | | | – | | | | 35,548 | | | | 31-Dec-17 | | | | – | | | | – | | | | – | |
| Jean-Sébastien Jacques | | | 19-Mar-12 | | | | £36.15 | | | | 4,793 | | | | – | | | | – | | | | – | | | | – | | | | 4,793 | | | | 31-Dec-15 | | | | – | | | | – | | | | – | |
| | | 27-May-13 | | | | £28.67 | | | | – | | | | 25,682 | | | | – | | | | – | | | | – | | | | 25,682 | | | | 31-Dec-16 | | | | – | | | | – | | | | – | |
| | | | 27-May-13 | | | | £28.67 | | | | – | | | | 25,683 | | | | – | | | | – | | | | – | | | | 25,683 | | | | 31-Dec-17 | | | | – | | | | – | | | | – | |
| Harry Kenyon-Slaney | | | 22-Mar-10 | | | | £37.30 | | | | 31,531 | | | | – | | | | – | | | | – | | | | – | | | | 31,531 | | | | 31-Dec-13 | | | | – | | | | – | | | | – | |
| | | 06-May-11 | | | | £41.51 | | | | 33,936 | | | | – | | | | – | | | | – | | | | – | | | | 33,936 | | | | 31-Dec-14 | | | | – | | | | – | | | | – | |
| | | 19-Mar-12 | | | | £36.15 | | | | 22,390 | | | | – | | | | – | | | | – | | | | – | | | | 22,390 | | | | 31-Dec-15 | | | | – | | | | – | | | | – | |
| | | 27-May-13 | | | | £28.67 | | | | – | | | | 33,353 | | | | – | | | | – | | | | – | | | | 33,353 | | | | 31-Dec-16 | | | | – | | | | – | | | | – | |
| | | | 27-May-13 | | | | £28.67 | | | | – | | | | 33,354 | | | | – | | | | – | | | | – | | | | 33,354 | | | | 31-Dec-17 | | | | – | | | | – | | | | – | |
| Christopher Lynch | | | 27-May-13 | | | | £28.67 | | | | – | | | | 52,084 | | | | – | | | | – | | | | – | | | | 52,084 | | | | 31-Dec-16 | | | | – | | | | – | | | | – | |
| | | | 27-May-13 | | | | £28.67 | | | | – | | | | 52,085 | | | | – | | | | – | | | | – | | | | 52,085 | | | | 31-Dec-17 | | | | – | | | | – | | | | – | |
| Doug Ritchie | | | 22-Mar-10 | | | | A$75.03 | | | | 32,180 | | | | – | | | | 32,180 | | | | – | | | | – | | | | – | | | | 31-Dec-13 | | | | – | | | | – | | | | – | |
| | | 06-May-11 | | | | A$79.57 | | | | 24,713 | | | | – | | | | 24,713 | | | | – | | | | – | | | | – | | | | 31-Dec-14 | | | | – | | | | – | | | | – | |
| | | | 19-Mar-12 | | | | A$65.85 | | | | 25,417 | | | | – | | | | 25,417 | | | | – | | | | – | | | | – | | | | 31-Dec-15 | | | | – | | | | – | | | | – | |
| Debra Valentine | | | 22-Mar-10 | | | | £37.30 | | | | 31,887 | | | | – | | | | – | | | | – | | | | – | | | | 31,887 | | | | 31-Dec-13 | | | | – | | | | – | | | | – | |
| | | 06-May-11 | | | | £41.51 | | | | 22,553 | | | | – | | | | – | | | | – | | | | – | | | | 22,553 | | | | 31-Dec-14 | | | | – | | | | – | | | | – | |
| | | 19-Mar-12 | | | | £36.15 | | | | 21,257 | | | | – | | | | – | | | | – | | | | – | | | | 21,257 | | | | 31-Dec-15 | | | | – | | | | – | | | | – | |
| | | 27-May-13 | | | | £28.67 | | | | – | | | | 26,274 | | | | – | | | | – | | | | – | | | | 26,274 | | | | 31-Dec-16 | | | | – | | | | – | | | | – | |
| | | | 27-May-13 | | | | £28.67 | | | | – | | | | 26,275 | | | | – | | | | – | | | | – | | | | 26,275 | | | | 31-Dec-17 | | | | – | | | | – | | | | – | |
| Sam Walsh | | | 17-Mar-09 | | | | A$52.01 | | | | 26,670 | | | | – | | | | 2,001 | | | | – | | | | 24,669 | | | | – | | | | 31-Dec-12 | | | | 20-Feb-13 | | | | A$69.68 | | | | 1,665 | |
| | | 09-Jul-09 | | | | A$47.60 | | | | 5,614 | | | | – | | | | 422 | | | | – | | | | 5,192 | | | | – | | | | 31-Dec-12 | | | | 21-Feb-13 | | | | A$67.88 | | | | 341 | |
| | | 22-Mar-10 | | | | A$75.03 | | | | 55,842 | | | | – | | | | – | | | | – | | | | – | | | | 55,842 | | | | 31-Dec-13 | | | | – | | | | – | | | | – | |
| | | 06-May-11 | | | | A$79.57 | | | | 61,752 | | | | – | | | | – | | | | – | | | | – | | | | 61,752 | | | | 31-Dec-14 | | | | – | | | | – | | | | – | |
| | | 19-Mar-12 | | | | A$65.85 | | | | 63,540 | | | | – | | | | – | | | | – | | | | – | | | | 63,540 | | | | 31-Dec-15 | | | | – | | | | – | | | | – | |
| | | 27-May-13 | | | | A$53.11 | | | | – | | | | 66,627 | | | | – | | | | – | | | | – | | | | 66,627 | | | | 31-Dec-16 | | | | – | | | | – | | | | – | |
| | | | 27-May-13 | | | | A$53.11 | | | | – | | | | 66,628 | | | | – | | | | – | | | | – | | | | 66,628 | | | | 31-Dec-17 | | | | – | | | | – | | | | – | |
|
Management Share Plan | |
| Alan Davies | | | 22-Mar-10 | | | | A$75.03 | | | | 5,118 | | | | – | | | | – | | | | 228 | | | | 5,346 | | | | – | | | | 31-Dec-12 | | | | 21-Feb-13 | | | | A$67.88 | | | | 351 | |
| | | 21-Mar-11 | | | | A$81.00 | | | | 3,487 | | | | – | | | | – | | | | – | | | | – | | | | 3,487 | | | | 31-Dec-13 | | | | – | | | | – | | | | – | |
| | | | 19-Mar-12 | | | | A$65.85 | | | | 3,997 | | | | – | | | | – | | | | – | | | | – | | | | 3,997 | | | | 31-Dec-14 | | | | – | | | | – | | | | – | |
| Jean-Sébastien Jacques | | | 12-Sep-11 | | | | £35.10 | | | | 7,500 | | | | – | | | | – | | | | 408 | | | | 7,908 | | | | – | | | | 01-Jul-13 | | | | 27-Aug-13 | | | | £29.93 | | | | 370 | |
| | | 12-Sep-11 | | | | £35.10 | | | | 7,500 | | | | – | | | | – | | | | – | | | | – | | | | 7,500 | | | | 01-Jul-14 | | | | – | | | | – | | | | – | |
| | | | 19-Mar-12 | | | £ | 36.15 | | | | 2,875 | | | | – | | | | – | | | | – | | | | – | | | | 2,875 | | | | 31-Dec-14 | | | | – | | | | – | | | | – | |
| | | | |
| | 103 riotinto.com/reportingcentre2013 | | |
Remuneration Report: Implementation Report continued
Table 3 – Plan interests (awards of shares and options under long-term incentive plans) continued
| | | | | | | | | | | | | | | | | | | | | | | | | | |
| | | | | | | |
| | | | Date of grant | | | | 1 Jan 13 | (a) | | | Granted | | |
| Vested
during 2013 |
| | | Exercised | | |
| Lapsed/
cancelled |
| | |
Share Savings Plan | | | | | | | | | | | | | | | | | | | | | | | | | | |
Tom Albanese | | | 04-Oct-11 | | | | 531 | | | | – | | | | – | | | | – | | | | 531 | | | |
Hugo Bague | | | 20-Oct-09 | | | | 84 | | | | – | | | | 84 | | | | 84 | | | | – | | | |
| | | | 04-Oct-11 | | | | 425 | | | | – | | | | – | | | | – | | | | – | | | |
Preston Chiaro | | | 05-Oct-10 | | | | 189 | | | | – | | | | 189 | | | | – | | | | 189 | | | |
| | | | 04-Oct-11 | | | | 243 | | | | – | | | | – | | | | – | | | | – | | | |
Alan Davies | | | 05-Oct-10 | | | | 323 | | | | – | | | | – | | | | – | | | | – | | | |
Guy Elliott | | | 17-Oct-08 | | | | 629 | | | | – | | | | – | | | | – | | | | – | | | |
Andrew Harding | | | 20-Oct-09 | | | | 723 | | | | – | | | | – | | | | – | | | | – | | | |
| | | | 05-Oct-10 | | | | 555 | | | | – | | | | – | | | | – | | | | – | | | |
Harry Kenyon-Slaney | | | 05-Oct-07 | | | | 280 | | | | – | | | | 280 | | | | 280 | | | | – | | | |
| | | | 20-Oct-09 | | | | 434 | | | | – | | | | – | | | | – | | | | – | | | |
Doug Ritchie | | | 20-Oct-09 | | | | 422 | | | | – | | | | – | | | | 422 | | | | – | | | |
Debra Valentine | | | 05-Oct-10 | | | | 189 | | | | – | | | | 189 | | | | 180 | | | | 9 | | | |
Sam Walsh | | | 20-Oct-09 | | | | 125 | | | | – | | | | – | | | | – | | | | – | | | |
| | | | 05-Oct-10 | | | | 457 | | | | – | | | | – | | | | – | | | | – | | | |
Share Option Plan | | | | | | | | | | | | | | | | | | | | | | | | | | |
Tom Albanese | | | 07-Mar-03 | | | | 168,459 | | | | – | | | | – | | | | 168,459 | | | | – | | | |
| | | 22-Apr-04 | | | | 101,706 | | | | – | | | | – | | | | 101,706 | | | | – | | | |
| | | 09-Mar-05 | | | | 101,592 | | | | – | | | | – | | | | 101,592 | | | | – | | | |
| | | 07-Mar-06 | | | | 81,722 | | | | – | | | | – | | | | 81,722 | | | | – | | | |
| | | 17-Mar-09 | | | | 72,029 | | | | – | | | | – | | | | 72,029 | | | | – | | | |
| | | 22-Mar-10 | | | | 119,230 | | | | – | | | | 119,230 | | | | – | | | | 119,230 | | | |
| | | 06-May-11 | | | | 85,415 | | | | – | | | | – | | | | – | | | | 85,415 | | | |
| | | | 19-Mar-12 | | | | 81,345 | | | | – | | | | – | | | | – | | | | 81,345 | | | |
Hugo Bague | | | 17-Mar-09 | | | | 15,714 | | | | – | | | | – | | | | – | | | | – | | | |
| | | 22-Mar-10 | | | | 47,297 | | | | – | | | | 47,297 | | | | – | | | | – | | | |
| | | 06-May-11 | | | | 34,415 | | | | – | | | | – | | | | – | | | | – | | | |
| | | | 19-Mar-12 | | | | 33,085 | | | | – | | | | – | | | | – | | | | – | | | |
Preston Chiaro | | | 07-Mar-06 | | | | 62,067 | | | | – | | | | – | | | | – | | | | – | | | |
| | | 17-Mar-09 | | | | 31,355 | | | | – | | | | – | | | | – | | | | – | | | |
| | | 22-Mar-10 | | | | 60,838 | | | | – | | | | 60,838 | | | | – | | | | – | | | |
| | | 06-May-11 | | | | 41,348 | | | | – | | | | – | | | | – | | | | – | | | |
| | | | 19-Mar-12 | | | | 38,586 | | | | – | | | | – | | | | – | | | | – | | | |
Bret Clayton | | | 07-Mar-06 | | | | 13,033 | | | | – | | | | – | | | | – | | | | – | | | |
| | | 17-Mar-09 | | | | 30,274 | | | | – | | | | – | | | | – | | | | – | | | |
| | | 22-Mar-10 | | | | 58,740 | | | | – | | | | – | | | | – | | | | – | | | |
| | | 06-May-11 | | | | 40,005 | | | | – | | | | – | | | | – | | | | – | | | |
| | | | 19-Mar-12 | | | | 37,339 | | | | – | | | | – | | | | – | | | | – | | | |
Jacynthe Côté | | | 17-Mar-09 | | | | 35,680 | | | | – | | | | – | | | | – | | | | – | | | |
| | | 22-Mar-10 | | | | 69,230 | | | | – | | | | 69,230 | | | | – | | | | – | | | |
| | | 06-May-11 | | | | 47,523 | | | | – | | | | – | | | | – | | | | – | | | |
| | | | 19-Mar-12 | | | | 45,084 | | | | – | | | | – | | | | – | | | | – | | | |
Alan Davies | | | 07-Mar-06 | | | | 3,151 | | | | – | | | | – | | | | 3,151 | | | | – | | | |
| | | | 17-Mar-09 | | | | 6,279 | | | | – | | | | – | | | | 6,279 | | | | – | | | |
| | | | |
| | 104 riotinto.com/reportingcentre2013 | | |
| | | | | | | | | | | | | | | | | | | | | | | | | | | | | | |
| | | | |
| Vested and
exercisable on
31 Dec 13 |
(b) | | | 31 Dec 13 | (b) | | | Exercise price | | |
| Value of options
exercised during 2013 |
| |
| Market price
on date of exercise |
| |
| Date from
which first exercisable |
| | | Expiry date | |
| | | Share Savings Plan | | | | | | | | | | | | | | | | | | | | | | | | | | | | |
| | | Tom Albanese | | | – | | | | – | | | | £28.630 | | | | – | | | | – | | | | N/A | | | | 01-Jul-17 | |
| | Hugo Bague | | | – | | | | – | | | | £21.480 | | | | £1,258.32 | | | | £36.46 | | | | 01-Jan-13 | | | | 01-Jul-13 | |
| | | | | | – | | | | 425 | | | | £28.630 | | | | – | | | | – | | | | 01-Jan-17 | | | | 01-Jul-17 | |
| | Preston Chiaro | | | – | | | | – | | | | £31.660 | | | | – | | | | – | | | | 01-Jan-13 | | | | 06-Jan-13 | |
| | | | | | – | | | | 243 | | | | £24.580 | | | | – | | | | – | | | | 01-Jan-14 | | | | 04-Jan-14 | |
| | | Alan Davies | | | – | | | | 323 | | | | A$59.26 | | | | – | | | | – | | | | 01-Jan-14 | | | | 01-Jul-14 | |
| | | Guy Elliott | | | – | | | | 629 | | | | £26.576 | | | | – | | | | – | | | | 01-Jan-14 | | | | 01-Jul-14 | |
| | Andrew Harding | | | – | | | | 723 | | | | A$48.73 | | | | – | | | | – | | | | 01-Jan-15 | | | | 01-Jul-15 | |
| | | | | | – | | | | 555 | | | | £27.810 | | | | – | | | | – | | | | 01-Jan-16 | | | | 01-Jul-16 | |
| | Harry Kenyon-Slaney | | | – | | | | – | | | | £23.850 | | | | £3,530.80 | | | | £36.46 | | | | 01-Jan-13 | | | | 01-Jul-13 | |
| | | | | | – | | | | 434 | | | | £21.480 | | | | – | | | | – | | | | 01-Jan-15 | | | | 01-Jul-15 | |
| | | Doug Ritchie | | | – | | | | – | | | | A$48.73 | | | | A$9,039.24 | | | | A$70.15 | | | | 01-Jan-13 | | | | 01-Jul-13 | |
| | | Debra Valentine | | | – | | | | – | | | | £31.660 | | | | £885.60 | | | | £36.58 | | | | 01-Jan-13 | | | | 06-Jan-13 | |
| | Sam Walsh | | | – | | | | 125 | | | | A$48.73 | | | | – | | | | – | | | | 01-Jan-15 | | | | 01-Jul-15 | |
| | | | | | – | | | | 457 | | | | A$59.26 | | | | – | | | | – | | | | 01-Jan-16 | | | | 01-Jul-16 | |
| | | Share Option Plan | | | | | | | | | | | | | | | | | | | | | | | | | | | | |
| | Tom Albanese | | | – | | | | – | | | | £10.434 | | | | £4,552,772.93 | | | | £37.46 | | | | 07-Mar-06 | | | | 17-Jul-13 | |
| | | | | – | | | | – | | | | £10.979 | | | | £1,666,554.52 | | | | £27.37 | | | | 22-Apr-09 | | | | 17-Jul-13 | |
| | | | | – | | | | – | | | | £15.086 | | | | £1,656,355.97 | | | | £31.39 | | | | 09-Mar-08 | | | | 17-Jul-13 | |
| | | | | – | | | | – | | | | £22.397 | | | | £703,871.59 | | | | £31.01 | | | | 07-Mar-09 | | | | 17-Jul-13 | |
| | | | | – | | | | – | | | | £16.530 | | | | £749,461.75 | | | | £26.94 | | | | 17-Mar-12 | | | | 17-Jul-13 | |
| | | | | – | | | | – | | | | £37.050 | | | | – | | | | – | | | | N/A | | | | 17-Jul-13 | |
| | | | | – | | | | – | | | | £42.450 | | | | – | | | | – | | | | N/A | | | | 17-Jul-13 | |
| | | | | | – | | | | – | | | | £35.179 | | | | – | | | | – | | | | N/A | | | | 17-Jul-13 | |
| | Hugo Bague | | | 15,714 | | | | 15,714 | | | | £16.530 | | | | – | | | | – | | | | 17-Mar-12 | | | | 17-Mar-19 | |
| | | | | 47,297 | | | | 47,297 | | | | £37.050 | | | | – | | | | – | | | | 22-Mar-13 | | | | 22-Mar-20 | |
| | | | | – | | | | 34,415 | | | | £42.450 | | | | – | | | | – | | | | 06-May-14 | | | | 06-May-21 | |
| | | | | | – | | | | 33,085 | | | | £35.179 | | | | – | | | | – | | | | 19-Mar-15 | | | | 19-Mar-22 | |
| | Preston Chiaro | | | 62,067 | | | | 62,067 | | | | £22.397 | | | | – | | | | – | | | | 07-Mar-09 | | | | 07-Mar-16 | |
| | | | | 31,355 | | | | 31,355 | | | | £16.530 | | | | – | | | | – | | | | 17-Mar-12 | | | | 17-Mar-19 | |
| | | | | 60,838 | | | | 60,838 | | | | £37.050 | | | | – | | | | – | | | | 22-Mar-13 | | | | 22-Mar-20 | |
| | | | | – | | | | 41,348 | | | | £42.450 | | | | – | | | | – | | | | 06-May-14 | | | | 06-May-21 | |
| | | | | | – | | | | 38,586 | | | | £35.179 | | | | – | | | | – | | | | 19-Mar-15 | | | | 19-Mar-22 | |
| | Bret Clayton | | | 13,033 | | | | 13,033 | | | | £22.397 | | | | – | | | | – | | | | 07-Mar-09 | | | | 07-Mar-16 | |
| | | | | 30,274 | | | | 30,274 | | | | £16.530 | | | | – | | | | – | | | | 17-Mar-12 | | | | 17-Mar-19 | |
| | | | | – | | | | 58,740 | | | | £37.050 | | | | – | | | | – | | | | 22-Mar-13 | | | | 22-Mar-20 | |
| | | | | – | | | | 40,005 | | | | £42.450 | | | | – | | | | – | | | | 06-May-14 | | | | 06-May-21 | |
| | | | | | – | | | | 37,339 | | | | £35.179 | | | | – | | | | – | | | | 19-Mar-15 | | | | 19-Mar-22 | |
| | Jacynthe Côté | | | 35,680 | | | | 35,680 | | | | £16.530 | | | | – | | | | – | | | | 17-Mar-12 | | | | 17-Mar-19 | |
| | | | | 69,230 | | | | 69,230 | | | | £37.050 | | | | – | | | | – | | | | 22-Mar-13 | | | | 22-Mar-20 | |
| | | | | – | | | | 47,523 | | | | £42.450 | | | | – | | | | – | | | | 06-May-14 | | | | 06-May-21 | |
| | | | | | – | | | | 45,084 | | | | £35.179 | | | | – | | | | – | | | | 19-Mar-15 | | | | 19-Mar-22 | |
| | Alan Davies | | | – | | | | – | | | | A$54.951 | | | | A$35,288.05 | | | | A$66.15 | | | | 07-Mar-09 | | | | 07-Mar-16 | |
| | | | | | – | | | | – | | | | A$33.450 | | | | A$205,323.30 | | | | A$66.15 | | | | 17-Mar-12 | | | | 17-Mar-19 | |
| | | | |
| | 105 riotinto.com/reportingcentre2013 | | |
Remuneration Report: Implementation Report continued
Table 3 – Plan interests (awards of shares and options under long-term incentive plans) continued
| | | | | | | | | | | | | | | | | | | | | | | | | | |
| | | | | | | |
| | | | Date of grant | | | | 1 Jan 13 | (a) | | | Granted | | |
| Vested
during 2013 |
| | | Exercised | | |
| Lapsed/
cancelled |
| | |
Share Option Plan | | | | | | | | | | | | | | | | | | | | | | | | | | |
Guy Elliott | | | 07-Mar-03 | | | | 70,732 | | | | – | | | | – | | | | 70,732 | | | | – | | | |
| | | 07-Mar-03 | | | | 47,154 | | | | – | | | | – | | | | 47,154 | | | | – | | | |
| | | 22-Apr-04 | | | | 69,213 | | | | – | | | | – | | | | 14,000 | | | | – | | | |
| | | 22-Apr-04 | | | | 20,000 | | | | – | | | | – | | | | 20,000 | | | | – | | | |
| | | 09-Mar-05 | | | | 88,332 | | | | – | | | | – | | | | – | | | | – | | | |
| | | 07-Mar-06 | | | | 70,330 | | | | – | | | | – | | | | – | | | | – | | | |
| | | 17-Mar-09 | | | | 53,615 | | | | – | | | | – | | | | – | | | | – | | | |
| | | 22-Mar-10 | | | | 88,749 | | | | – | | | | 88,749 | | | | – | | | | – | | | |
| | | 06-May-11 | | | | 59,708 | | | | – | | | | – | | | | – | | | | – | | | |
| | | | 19-Mar-12 | | | | 56,849 | | | | – | | | | – | | | | – | | | | – | | | |
Andrew Harding | | | 17-Mar-09 | | | | 6,268 | | | | – | | | | – | | | | – | | | | – | | | |
| | | 22-Mar-10 | | | | 46,597 | | | | – | | | | 46,597 | | | | – | | | | – | | | |
| | | 06-May-11 | | | | 34,829 | | | | – | | | | – | | | | – | | | | – | | | |
| | | | 19-Mar-12 | | | | 33,585 | | | | – | | | | – | | | | – | | | | – | | | |
Harry Kenyon-Slaney | | | 17-Mar-09 | | | | 6,938 | | | | – | | | | – | | | | – | | | | – | | | |
| | | 22-Mar-10 | | | | 47,297 | | | | – | | | | 47,297 | | | | – | | | | – | | | |
| | | | 19-Mar-12 | | | | 33,585 | | | | – | | | | – | | | | – | | | | – | | | |
Doug Ritchie | | | 07-Mar-06 | | | | 7,308 | | | | – | | | | – | | | | 7,308 | | | | – | | | |
| | | 17-Mar-09 | | | | 8,230 | | | | – | | | | – | | | | 8,230 | | | | – | | | |
| | | 22-Mar-10 | | | | 48,270 | | | | – | | | | 48,270 | | | | – | | | | 48,270 | | | |
| | | 06-May-11 | | | | 37,070 | | | | – | | | | – | | | | – | | | | 37,070 | | | |
| | | | 19-Mar-12 | | | | 38,126 | | | | – | | | | – | | | | – | | | | 38,126 | | | |
Debra Valentine | | | 17-Mar-09 | | | | 13,558 | | | | – | | | | – | | | | – | | | | – | | | |
| | | 22-Mar-10 | | | | 47,831 | | | | – | | | | 47,831 | | | | – | | | | – | | | |
| | | 06-May-11 | | | | 33,830 | | | | – | | | | – | | | | – | | | | – | | | |
| | | | 19-Mar-12 | | | | 31,886 | | | | – | | | | – | | | | – | | | | – | | | |
Sam Walsh | | | 07-Mar-06 | | | | 48,079 | | | | – | | | | – | | | | – | | | | – | | | |
| | | 17-Mar-09 | | | | 40,005 | | | | – | | | | – | | | | – | | | | – | | | |
| | | | 22-Mar-10 | | | | 83,763 | | | | – | | | | 83,763 | | | | – | | | | – | | | |
Notes to table 3
| (a) | Or date of appointment, if later. |
| (b) | Or date of retirement or at date no longer a member of the Executive Committee, if earlier. |
| (c) | Jean-Sébastien Jacques was appointed on 14 February 2013. |
| (d) | Tom Albanese and Doug Ritchie left the Company on 16 July 2013. Bret Clayton resigned as a member of the Executive Committee on 1 March 2013. |
| (e) | Awards denominated in pounds sterling were for Rio Tinto plc ordinary shares of 10 pence each and awards denominated in Australian dollars were for Rio Tinto Limited shares. All options granted over ordinary shares. Rio Tinto plc – ordinary shares of 10 pence each stated in sterling. Rio Tinto Limited ordinary shares stated in Australian dollars. Each option is granted over one share at no cost to participants. |
| (f) | The weighted fair value per share of conditional awards granted under the BDP was £28.66 for Rio Tinto plc and A$54.39 for Rio Tinto Limited and for PSP was £18.89 (four-year vesting) and £19.21 (five-year vesting) for Rio Tinto plc and A$35.89 (four-year vesting) and A$36.46 (five-year vesting) for Rio Tinto Limited. |
| (g) | Conditional awards are awarded at no cost to the recipient and no amount remains unpaid on any shares granted. |
| (h) | The 2010 PSP awards granted on 22 March with a performance period that concluded on 31 December 2013 vested at 75 per cent. |
| (i) | The closing price of Rio Tinto plc ordinary shares at 31 December 2013 was £34.095 and of Rio Tinto Limited ordinary shares at 31 December 2013 was A$68.18. The high and low prices during 2013 of Rio Tinto plc and Rio Tinto Limited shares were £37.57 and £25.82 and A$72.07 and A$50.24 respectively. |
| (j) | The exercise price represents the price payable on the options. |
| | | | |
| | 106 riotinto.com/reportingcentre2013 | | |
| | | | | | | | | | | | | | | | | | | | | | | | | | | | | | |
| | | | |
| Vested and
exercisable on 31 Dec 13 |
(b) | | | 31 Dec 13 | (b) | | | Exercise price | | |
| Value of options
exercised during 2013 |
| |
| Market price on
date of exercise |
| |
| Date from
which first exercisable |
| | | Expiry date | |
| | | Share Option Plan | | | | | | | | | | | | | | | | | | | | | | | | | | | | |
| | Guy Elliott | | | – | | | | – | | | | £10.434 | | | | £1,903,115.19 | | | | £37.34 | | | | 07-Mar-06 | | | | 07-Mar-13 | |
| | | | | – | | | | – | | | | £10.434 | | | | £1,129,149.68 | | | | £34.38 | | | | 07-Mar-06 | | | | 07-Mar-13 | |
| | | | | 55,213 | | | | 55,213 | | | | £10.979 | | | | £289,744.00 | | | | £31.68 | | | | 22-Apr-09 | | | | 22-Apr-14 | |
| | | | | – | | | | – | | | | £10.979 | | | | £441,420.00 | | | | £33.05 | | | | 22-Apr-09 | | | | 22-Apr-14 | |
| | | | | 88,332 | | | | 88,332 | | | | £15.086 | | | | – | | | | – | | | | 09-Mar-08 | | | | 09-Mar-15 | |
| | | | | 70,330 | | | | 70,330 | | | | £22.397 | | | | – | | | | – | | | | 07-Mar-09 | | | | 07-Mar-16 | |
| | | | | 53,615 | | | | 53,615 | | | | £16.530 | | | | – | | | | – | | | | 17-Mar-12 | | | | 17-Mar-19 | |
| | | | | 88,749 | | | | 88,749 | | | | £37.050 | | | | – | | | | – | | | | 22-Mar-13 | | | | 22-Mar-20 | |
| | | | | – | | | | 59,708 | | | | £42.450 | | | | – | | | | – | | | | 06-May-14 | | | | 06-May-21 | |
| | | | | | – | | | | 56,849 | | | | £35.179 | | | | – | | | | – | | | | 19-Mar-15 | | | | 19-Mar-22 | |
| | Andrew Harding | | | 6,268 | | | | 6,268 | | | | A$33.450 | | | | – | | | | – | | | | 17-Mar-12 | | | | 17-Mar-19 | |
| | | | | 46,597 | | | | 46,597 | | | | A$76.150 | | | | – | | | | – | | | | 22-Mar-13 | | | | 22-Mar-20 | |
| | | | | – | | | | 34,829 | | | | £42.450 | | | | – | | | | – | | | | 06-May-14 | | | | 06-May-21 | |
| | | | | | – | | | | 33,585 | | | | £35.179 | | | | – | | | | – | | | | 19-Mar-15 | | | | 19-Mar-22 | |
| | Harry Kenyon-Slaney | | | 6,938 | | | | 6,938 | | | | £16.530 | | | | – | | | | – | | | | 17-Mar-12 | | | | 17-Mar-19 | |
| | | | | 47,297 | | | | 47,297 | | | | £37.050 | | | | – | | | | – | | | | 22-Mar-13 | | | | 22-Mar-20 | |
| | | | | | – | | | | 33,585 | | | | £35.179 | | | | – | | | | – | | | | 19-Mar-15 | | | | 19-Mar-22 | |
| | Doug Ritchie | | | – | | | | – | | | | A$54.950 | | | | A$111,081.60 | | | | A$70.15 | | | | 07-Mar-09 | | | | 17-Jul-13 | |
| | | | | – | | | | – | | | | A$33.450 | | | | A$302,041.00 | | | | A$70.15 | | | | 17-Mar-12 | | | | 17-Jul-13 | |
| | | | | – | | | | – | | | | A$76.150 | | | | – | | | | – | | | | 22-Mar-13 | | | | 17-Jul-13 | |
| | | | | – | | | | – | | | | A$81.800 | | | | – | | | | – | | | | N/A | | | | 17-Jul-13 | |
| | | | | | – | | | | – | | | | A$64.688 | | | | – | | | | – | | | | N/A | | | | 17-Jul-13 | |
| | Debra Valentine | | | 13,558 | | | | 13,558 | | | | £16.530 | | | | – | | | | – | | | | 17-Mar-12 | | | | 17-Mar-19 | |
| | | | | 47,831 | | | | 47,831 | | | | £37.050 | | | | – | | | | – | | | | 22-Mar-13 | | | | 22-Mar-20 | |
| | | | | – | | | | 33,830 | | | | £42.450 | | | | – | | | | – | | | | 06-May-14 | | | | 06-May-21 | |
| | | | | | – | | | | 31,886 | | | | £35.179 | | | | – | | | | – | | | | 19-Mar-15 | | | | 19-Mar-22 | |
| | Sam Walsh | | | 48,079 | | | | 48,079 | | | | A$54.950 | | | | – | | | | – | | | | 07-Mar-09 | | | | 07-Mar-16 | |
| | | | | 40,005 | | | | 40,005 | | | | A$33.450 | | | | – | | | | – | | | | 17-Mar-12 | | | | 17-Mar-19 | |
| | | | | | 83,763 | | | | 83,763 | | | | A$76.150 | | | | – | | | | – | | | | 22-Mar-13 | | | | 22-Mar-20 | |
| (k) | The amount in US dollars has been converted at the rate of US$0.63915 = £1 and US$1.03258 = A$1, being the average exchange rates for 2013. |
| (l) | As of 17 February 2014, members of the Executive Committee held 1,399,125 shares awarded and not vested under long-term incentive plans and 847,611 options to acquire Rio Tinto plc and Rio Tinto Limited shares. |
| (m) | Between 31 December 2013 and 17 February 2014 no options were granted to the executives. |
| (n) | Details of performance conditions for the BDP are provided below.
50 per cent of the STIP is delivered in cash and 50 per cent delivered in deferred shares under the BDP. The BDP vests in December of the third year after the end of performance year to which they relate. |
| (o) | Details of performance conditions for the PSP are provided below.
For 2010, 2011 and 2012 awards, four-year performance period and from 2014 awards will have a five-year performance period commencing on 1 January of the year of grant. For 2013 awards only, 50 per cent of the award granted will be measured against the performance conditions after four years (at the end of 2016) and 50 per cent of the awards granted will be measured against the performance conditions after five years (at the end of 2017).
For 2011 and 2012 awards, subject to the “mix” chosen awards have a maximum face value of 292 per cent of base salary with the potential for 1.5 times of this value, ie 438 per cent of base salary, for outstanding performance. The expected value of awards is 190 per cent of base salary. Actual award levels granted in 2013 vary by executive.
In all cases, the maximum face value of awards granted to Executive Committee members in 2013 was lower than the maximum value granted to participants under the 2012 PSP of 438 per cent of base salary.
For 2010, 2011 and 2012 awards, conditional share awards vest subject to the achievement of a stretching TSR performance condition, comparing Rio Tinto’s TSR performance against:
– 50 per cent: the HSBC Global Mining Index
– 50 per cent: the Morgan Stanley Capital World Index (MSCI) |
| | | | |
| | 107 riotinto.com/reportingcentre2013 | | |
Remuneration Report: Implementation Report continued
Vesting of awards made in 2010, 2011 and 2012 is as follows:
| | |
| Out-performance of the index by 8 per cent per annum | | 1.5x award vests |
| Performance between index and 8 per cent out-performance | | Proportionate vesting for performance between index and 8 per cent out-performance of the index |
| Out-performance of the index by approximately 5 per cent per annum | | 1.0x award vests |
| Performance equal to index | | 0.35x award vests |
| Performance less than index | | Nil vesting |
For 2013 awards, for the TSR component (constituting two-thirds of the award), where TSR performance is measured against both the HSBC Global Mining Index and the broader market of large global companies as measured through the Morgan Stanley Capital World Index, the award will vest as follows:
| | |
| Out-performance of the index by 6 per cent per annum | | 1.0x award vests |
| Performance between equal to the index and 6 per cent out-performance | | Proportionate vesting between 0.225x and 1.0x vesting |
| Performance equal to the index | | 0.225x award vests |
| Performance less than index | | Nil vesting |
For the EBIT margin measure, change in the EBIT margin of Rio Tinto and each of the comparator companies (measured on a “point-to-point” basis using the last financial year in the performance period and the financial year prior to the start of the performance period) will be calculated using independent third-party data. Vesting will be subject to Rio Tinto’s interpolated ranking position using the following schedule.
| | |
| Equal to or greater than 2ndranked company | | 1.0x award vests |
| Between the 5thand 2ndranked companies | | Proportionate vesting between 0.225x and 1.0x vesting |
| Above the 6thranked company | | 0.225x award vests |
| Equal to the 6thranked company or below | | Nil vesting |
For awards granted in 2010, 2011 and 2012, if vesting is achieved, a cash payment will be paid equal to the dividends that would have been received had the number of shares which have vested at the end of the performance period been held throughout the performance period. For 2013 awards, if vesting is achieved, participants will be entitled to receive a number of additional shares whose market value reflects the aggregate cash amount of dividends that would have been received had the number of shares which have vested at the end of the performance period been held throughout the period.
| (p) | Details of performance conditions for the SOP are provided below. |
Three-year performance period.
Awards have a maximum face value of 300 per cent of base salary.
Options vest subject to the achievement of a stretching TSR performance condition, comparing Rio Tinto’s TSR performance to that of the HSBC Global Mining Index.
Vesting of awards made in 2011 and 2012 is as follows:
| | |
| Outperformance of the index by 5 per cent per annum | | Awards vest in full |
| Performance between index and 5 per cent out-performance | | Proportionate vesting of residual award for performance between index and 5 per cent out-performance of the index |
| Performance equal to index | | Awards of up to 20,000 options or one-third of the award (whichever is the higher) |
| Performance less than index | | Nil vesting |
The SOP ceased to operate from 2013. No further awards of shares options will be made.
| | | | |
| | 108 riotinto.com/reportingcentre2013 | | |
Directors’ report continued
Audited information
Under Schedule 8 of the Large and Medium-sized Companies and Groups (Accounts and Reports) Regulations 2008 (as amended), the information included in respect of: the single total figure of remuneration for each director; details of the directors’ total pension entitlements; details of scheme interests awarded to the directors during the financial year; details of payments to past directors; and the statement of the directors’ shareholdings and share interests, as set out in the Implementation Report are all auditable. The Australian Securities and Investments Commission issued an order dated 22 December 2010 (as amended on 17 February 2012) under which the Remuneration Report must be prepared and audited in accordance with the requirements of the Corporations Act 2001 applied on the basis of certain modifications set out in the order (as detailed on page 201). The information provided in the Remuneration Report has been audited as required by section 308(3C) of the Corporations Act.
Going concern
The directors, having made appropriate enquiries, have satisfied themselves that no material uncertainties that cast significant doubt about the ability of the Companies and the Group to continue as a going concern have been identified, and they have a reasonable expectation that the Group has adequate financial resources to continue in operational existence for the foreseeable future. Therefore, these financial statements have been prepared on a going concern basis.
Annual general meetings
The 2014 annual general meetings will be held on 15 April in London and 8 May in Melbourne. Separate notices of the 2014 annual general meetings are produced for the shareholders of each Company.
Directors’ approval statement
The Directors’ report is delivered in accordance with a resolution of the board.
|

|
| Jan du Plessis |
| Chairman |
| 5 March 2014 |

| | | | |
| | 109 riotinto.com/reportingcentre2013 | | |
2013 Financial statements
Contents
| | | | |
| | 110 riotinto.com/reportingcentre2013 | | |
Group income statement
Years ended 31 December
| | | | | | | | | | | | | | | | |
| | | | Note | | |
| 2013
US$m |
| |
| Restated
2012 US$m | (a)
| |
| Restated
2011 US$m | (a)
|
| Continuing operations | | | | | | | | | | | | | | | | |
| Consolidated sales revenue | | | 2 | | | | 51,171 | | | | 50,942 | | | | 60,529 | |
| Net operating costs (excluding items shown separately) | | | 4 | | | | (36,104 | ) | | | (37,534 | ) | | | (36,155 | ) |
| Net impairment charges | | | 6 | | | | (7,315 | ) | | | (14,701 | ) | | | (9,174 | ) |
Net gains on consolidation and disposal of interests in businesses | | | 2, 37 | | | | 787 | | | | 845 | | | | 185 | |
| Exploration and evaluation costs | | | 13 | | | | (948 | ) | | | (1,971 | ) | | | (1,437 | ) |
| (Loss)/profit relating to interests in undeveloped projects | | | 13 | | | | (161 | ) | | | 494 | | | | 89 | |
| Operating profit/(loss) | | | | | | | 7,430 | | | | (1,925 | ) | | | 14,037 | |
| Share of profit after tax of equity accounted units | | | 7 | | | | 698 | | | | 1,056 | | | | 696 | |
| Impairment after tax of investments in equity accounted units | | | 6 | | | | (216 | ) | | | (1,526 | ) | | | (592 | ) |
| Profit/(loss) before finance items and taxation | | | | | | | 7,912 | | | | (2,395 | ) | | | 14,141 | |
| | | | |
| Finance items | | | | | | | | | | | | | | | | |
Net exchange (losses)/gains on external debt and intragroup balances | | | 24 | | | | (3,672 | ) | | | 492 | | | | (161 | ) |
| Net gains on derivatives not qualifying for hedge accounting | | | | | | | 59 | | | | 88 | | | | 51 | |
| Finance income | | | 8 | | | | 82 | | | | 116 | | | | 106 | |
| Finance costs | | | 8 | | | | (507 | ) | | | (293 | ) | | | (496 | ) |
| Amortisation of discount | | | | | | | (369 | ) | | | (439 | ) | | | (369 | ) |
| | | | | | | | (4,407 | ) | | | (36 | ) | | | (869 | ) |
| Profit/(loss) before taxation | | | | | | | 3,505 | | | | (2,431 | ) | | | 13,272 | |
| Taxation | | | 9 | | | | (2,426 | ) | | | (589 | ) | | | (6,472 | ) |
| Profit/(loss) from continuing operations | | | | | | | 1,079 | | | | (3,020 | ) | | | 6,800 | |
| Discontinued operations | | | | | | | | | | | | | | | | |
| Loss after tax from discontinued operations | | | | | | | – | | | | (7 | ) | | | (10 | ) |
| Profit/(loss) for the year | | | | | | | 1,079 | | | | (3,027 | ) | | | 6,790 | |
| – attributable to owners of Rio Tinto (net earnings/(losses)) | | | | | | | 3,665 | | | | (3,028 | ) | | | 5,835 | |
| – attributable to non-controlling interests | | | | | | | (2,586 | ) | | | 1 | | | | 955 | |
| | | | |
| Basic earnings/(losses) per share | | | | | | | | | | | | | | | | |
| Profit/(loss) from continuing operations | | | 10 | | | | 198.4c | | | | (163.4c | ) | | | 303.9c | |
| Loss from discontinued operations | | | 10 | | | | – | | | | (0.4c | ) | | | (0.5c | ) |
| Profit/(loss) for the year | | | 10 | | | | 198.4c | | | | (163.8c | ) | | | 303.4c | |
| Diluted earnings/(losses) per share | | | | | | | | | | | | | | | | |
| Profit/(loss) from continuing operations | | | 10 | | | | 197.3c | | | | (163.4c | ) | | | 302.0c | |
| Loss from discontinued operations | | | 10 | | | | – | | | | (0.4c | ) | | | (0.5c | ) |
Profit/(loss) for the year | | | 10 | | | | 197.3c | | | | (163.8c | ) | | | 301.5c | |
| (a) | Comparative information has been restated to reflect a number of new accounting standards. See note 46 on page 191. |
The notes on pages 118 to 193 are an integral part of these consolidated financial statements.

| | | | |
| | 111 riotinto.com/reportingcentre2013 | | |
Group statement of comprehensive income
Years ended 31 December
| | | | | | | | | | | | | | | | |
| | | | Note | | |
| 2013
US$m |
| |
| Restated
2012 US$m | (a)
| |
| Restated
2011 US$m | (a)
|
| Profit/(loss) after tax for the year | | | | | | | 1,079 | | | | (3,027 | ) | | | 6,790 | |
| Other comprehensive income/(loss): | | | | | | | | | | | | | | | | |
| Items that will not be reclassified to profit or loss: | | | | | | | | | | | | | | | | |
| Actuarial gains/(losses) on post retirement benefit plans | | | 45 | | | | 2,260 | | | | (332 | ) | | | (1,843 | ) |
| Share of other comprehensive (losses)/income of equity accounted units net of tax | | | | | | | (1 | ) | | | 1 | | | | (7 | ) |
| Tax relating to components of other comprehensive income | | | 9 | | | | (641 | ) | | | 83 | | | | 532 | |
| | | | | | | | 1,618 | | | | (248 | ) | | | (1,318 | ) |
| | | | |
| Items that have been/may be reclassified subsequently to profit or loss: | | | | | | | | | | | | | | | | |
| Currency translation adjustment | | | | | | | (2,657 | ) | | | 727 | | | | (960 | ) |
| Currency translation on companies disposed of, transferred to the income statement | | | | | | | 81 | | | | (3 | ) | | | 46 | |
| Fair value movements: | | | | | | | | | | | | | | | | |
| – Cash flow hedge gains/(losses) | | | | | | | 195 | | | | (67 | ) | | | 82 | |
| – Cash flow hedge (gains)/losses transferred to the income statement | | | | | | | (92 | ) | | | 100 | | | | 141 | |
| – (Losses)/gains on revaluation of available for sale securities | | | | | | | (101 | ) | | | 34 | | | | (236 | ) |
– Losses/(gains) on revaluation of available for sale securities transferred to the income statement | | | | | | | 146 | | | | (355 | ) | | | (19 | ) |
| Share of other comprehensive (loss)/income of equity accounted units net of tax | | | | | | | (44 | ) | | | (158 | ) | | | 55 | |
| Tax relating to components of other comprehensive income | | | 9 | | | | (56 | ) | | | (26 | ) | | | (99 | ) |
| | | | | | | (2,528 | ) | | | 252 | | | | (990 | ) |
| Other comprehensive (loss)/income for the year, net of tax | | | | | | | (910 | ) | | | 4 | | | | (2,308 | ) |
| Total comprehensive income/(loss) for the year | | | | | | | 169 | | | | (3,023 | ) | | | 4,482 | |
| – attributable to owners of Rio Tinto | | | | | | | 3,261 | | | | (3,164 | ) | | | 3,605 | |
– attributable to non-controlling interests | | | | | | | (3,092 | ) | | | 141 | | | | 877 | |
| (a) | Comparative information has been restated to reflect a number of new accounting standards. See note 46 on page 191. |
The notes on pages 118 to 193 are an integral part of these consolidated financial statements.
| | | | |
| | 112 riotinto.com/reportingcentre2013 | | |
Group statement of cash flows
Years ended 31 December
| | | | | | | | | | | | | | | | |
| | | | Note | | |
| 2013
US$m |
| |
| Restated
2012 US$m | (c)
| |
| Restated
2011 US$m | (c)
|
| Cash flow from consolidated operations (a) | | | | | | | 19,531 | | | | 15,999 | | | | 26,810 | |
| Dividends from equity accounted units | | | | | | | 600 | | | | 522 | | | | 799 | |
| Cash flows from operations | | | | | | | 20,131 | | | | 16,521 | | | | 27,609 | |
| | | | |
| Net interest paid | | | | | | | (1,164 | ) | | | (824 | ) | | | (622 | ) |
Dividends paid to holders of non-controlling interests in subsidiaries | | | | | | | (191 | ) | | | (422 | ) | | | (548 | ) |
| Tax paid | | | | | | | (3,698 | ) | | | (5,845 | ) | | | (6,204 | ) |
| Net cash generated from operating activities | | | | | | | 15,078 | | | | 9,430 | | | | 20,235 | |
| | | | |
| Cash flow from investing activities | | | | | | | | | | | | | | | | |
| Acquisitions of subsidiaries, joint ventures & associates | | | 37 | | | | 4 | | | | (1,335 | ) | | | (4,156 | ) |
| Disposals of subsidiaries, joint ventures & associates | | | 37 | | | | 1,896 | | | | 251 | | | | 386 | |
Purchase of property, plant and equipment and intangible assets | | | 2 | | | | (13,001 | ) | | | (17,615 | ) | | | (12,573 | ) |
| Sales of financial assets | | | | | | | 224 | | | | 692 | | | | 104 | |
| Purchases of financial assets | | | | | | | (75 | ) | | | (50 | ) | | | (147 | ) |
| Other funding of equity accounted units | | | | | | | (88 | ) | | | (223 | ) | | | (657 | ) |
| Other investing cash flows | | | | | | | 94 | | | | 37 | | | | 53 | |
| Cash used in investing activities | | | | | | | (10,946 | ) | | | (18,243 | ) | | | (16,990 | ) |
| | | | |
| Cash flow before financing activities | | | | | | | 4,132 | | | | (8,813 | ) | | | 3,245 | |
| | | | |
| Cash flow from financing activities | | | | | | | | | | | | | | | | |
| Equity dividends paid to owners of Rio Tinto | | | 11 | | | | (3,322 | ) | | | (3,038 | ) | | | (2,236 | ) |
| Proceeds from additional borrowings | | | | | | | 3,954 | | | | 8,569 | | | | 4,705 | |
| Repayment of borrowings | | | | | | | (1,832 | ) | | | (682 | ) | | | (497 | ) |
| Proceeds from issue of equity to non-controlling interests(b) | | | | | | | 159 | | | | 2,945 | | | | 424 | |
| Own shares purchased from owners of Rio Tinto | | | | | | | – | | | | (1,471 | ) | | | (5,504 | ) |
| Purchase of non-controlling interests | | | 37 | | | | – | | | | (76 | ) | | | (2,243 | ) |
| Cash movement on equity accounted units funded balances | | | | | | | – | | | | – | | | | 1,683 | |
| Other financing cash flows | | | | | | | 107 | | | | 77 | | | | 245 | |
| Net cash flow from financing activities | | | | | | | (934 | ) | | | 6,324 | | | | (3,423 | ) |
| Effects of exchange rates on cash and cash equivalents | | | | | | | (261 | ) | | | 16 | | | | (70 | ) |
| Net increase/(decrease) in cash and cash equivalents | | | | | | | 2,937 | | | | (2,473 | ) | | | (248 | ) |
| Opening cash and cash equivalents less overdrafts | | | | | | | 7,272 | | | | 9,745 | | | | 9,993 | |
| Closing cash and cash equivalents less overdrafts | | | 21 | | | | 10,209 | | | | 7,272 | | | | 9,745 | |
| | | | |
| (a) Cash flow from consolidated operations | | | | | | | | | | | | | | | | |
| Profit/(loss) from continuing operations | | | | | | | 1,079 | | | | (3,020 | ) | | | 6,800 | |
| Adjustments for: | | | | | | | | | | | | | | | | |
| – Taxation | | | | | | | 2,426 | | | | 589 | | | | 6,472 | |
| – Finance items | | | | | | | 4,407 | | | | 36 | | | | 869 | |
| – Share of profit after tax of equity accounted units | | | | | | | (698 | ) | | | (1,056 | ) | | | (696 | ) |
| – Impairment after tax of investments in equity accounted units | | | | | | | 216 | | | | 1,526 | | | | 592 | |
– Gain on consolidation and on disposal of interests in businesses | | | 37 | | | | (787 | ) | | | (845 | ) | | | (185 | ) |
| – Impairment charges less reversals | | | 6 | | | | 7,315 | | | | 14,701 | | | | 9,174 | |
| – Depreciation and amortisation | | | | | | | 4,791 | | | | 4,624 | | | | 3,972 | |
| – Provisions (including exchange differences on provisions) | | | 26 | | | | 1,449 | | | | 886 | | | | 1,082 | |
| Utilisation of provisions | | | 26 | | | | (871 | ) | | | (840 | ) | | | (633 | ) |
| Utilisation of provision for post retirement benefits | | | 26 | | | | (635 | ) | | | (695 | ) | | | (667 | ) |
| Change in inventories | | | | | | | (330 | ) | | | (433 | ) | | | (1,051 | ) |
| Change in trade and other receivables | | | | | | | 84 | | | | 412 | | | | 104 | |
| Change in trade and other payables | | | | | | | 803 | | | | 266 | | | | 1,318 | |
| Other items | | | | | | | 282 | | | | (152 | ) | | | (341 | ) |
| | | | | | | | 19,531 | | | | 15,999 | | | | 26,810 | |
| (b) | Cash proceeds from the issue of equity to non-controlling interests in 2012 included US$1.8 billion from the transfer of a 47 per cent interest in Simfer Jersey Limited, a Rio Tinto subsidiary, to Chalco Iron Ore Holdings Limited, a consortium led by Chalco (and reimbursing Rio Tinto for historic project costs) plus subsequent cash calls to meet project costs, and US$0.9 billion of proceeds from subscription by non-controlling interests in a rights offering by Turquoise Hill. Refer to the ‘Statement of changes in equity’ on page 115, and to note 37. |
| (c) | Comparative information has been restated to reflect a number of new accounting standards. See note 46 on page 191. |
The notes on pages 118 to 193 are an integral part of these consolidated financial statements.
| | | | |
| | 113 riotinto.com/reportingcentre2013 | | |
Group statement of financial position
| | | | | | | | | | | | | | | | |
| | | | Note | | |
| At 31 December
2013 US$m |
| |
| Restated
At 31 December 2012 US$m | (a)
| |
| Restated
At 1 January 2012 US$m | (a)
|
| Non-current assets | | | | | | | | | | | | | | | | |
| Goodwill | | | 12 | | | | 1,349 | | | | 2,774 | | | | 9,558 | |
| Intangible assets | | | 13 | | | | 5,421 | | | | 6,880 | | | | 8,042 | |
| Property, plant and equipment | | | 14 | | | | 70,827 | | | | 76,985 | | | | 66,381 | |
| Investments in equity accounted units | | | 15 | | | | 3,957 | | | | 3,941 | | | | 7,548 | |
| Inventories | | | 16 | | | | 511 | | | | 423 | | | | 381 | |
| Deferred tax assets | | | 17 | | | | 3,555 | | | | 3,476 | | | | 1,864 | |
| Trade and other receivables | | | 18 | | | | 2,140 | | | | 2,265 | | | | 2,042 | |
Other financial assets (including tax recoverable and loans to equity accounted units) | | | 20 | | | | 983 | | | | 1,183 | | | | 2,012 | |
| | | | | | | 88,743 | | | | 97,927 | | | | 97,828 | |
| Current assets | | | | | | | | | | | | | | | | |
| Inventories | | | 16 | | | | 5,737 | | | | 6,375 | | | | 5,538 | |
| Trade and other receivables | | | 18 | | | | 4,667 | | | | 5,341 | | | | 6,060 | |
Other financial assets (including tax recoverable and loans to equity accounted units) | | | 20 | | | | 710 | | | | 689 | | | | 876 | |
| Cash and cash equivalents | | | 21 | | | | 10,216 | | | | 7,135 | | | | 9,762 | |
| | | | | | | 21,330 | | | | 19,540 | | | | 22,236 | |
| Assets of disposal groups held for sale | | | 19 | | | | 952 | | | | 970 | | | | 88 | |
| Total assets | | | | | | | 111,025 | | | | 118,437 | | | | 120,152 | |
| | | | |
| Current liabilities | | | | | | | | | | | | | | | | |
| Borrowings and other financial liabilities | | | 22 | | | | (3,926 | ) | | | (2,198 | ) | | | (1,415 | ) |
| Trade and other payables | | | 25 | | | | (8,400 | ) | | | (9,420 | ) | | | (9,582 | ) |
| Tax payable | | | | | | | (1,126 | ) | | | (823 | ) | | | (2,662 | ) |
| Provisions including post retirement benefits | | | 26 | | | | (1,738 | ) | | | (1,539 | ) | | | (1,503 | ) |
| | | | | | | | (15,190 | ) | | | (13,980 | ) | | | (15,162 | ) |
| Non-current liabilities | | | | | | | | | | | | | | | | |
| Borrowings and other financial liabilities | | | 22 | | | | (24,625 | ) | | | (24,706 | ) | | | (20,529 | ) |
| Trade and other payables | | | 25 | | | | (576 | ) | | | (605 | ) | | | (708 | ) |
| Tax payable | | | | | | | (468 | ) | | | (406 | ) | | | (404 | ) |
| Deferred tax liabilities | | | 17 | | | | (4,140 | ) | | | (5,145 | ) | | | (6,300 | ) |
| Provisions including post retirement benefits | | | 26 | | | | (12,343 | ) | | | (15,442 | ) | | | (18,132 | ) |
| | | | | | | (42,152 | ) | | | (46,304 | ) | | | (46,073 | ) |
| Liabilities of disposal groups held for sale | | | 19 | | | | (181 | ) | | | (413 | ) | | | (33 | ) |
| Total liabilities | | | | | | | (57,523 | ) | | | (60,697 | ) | | | (61,268 | ) |
| Net assets | | | | | | | 53,502 | | | | 57,740 | | | | 58,884 | |
| | | | |
| Capital and reserves | | | | | | | | | | | | | | | | |
| Share capital | | | | | | | | | | | | | | | | |
| – Rio Tinto plc | | | 27 | | | | 230 | | | | 230 | | | | 234 | |
| – Rio Tinto Limited | | | 28 | | | | 4,911 | | | | 5,715 | | | | 5,582 | |
| Share premium account | | | | | | | 4,269 | | | | 4,244 | | | | 4,208 | |
| Other reserves | | | 29 | | | | 12,871 | | | | 14,868 | | | | 14,745 | |
| Retained earnings | | | 29 | | | | 23,605 | | | | 21,496 | | | | 27,430 | |
| Equity attributable to owners of Rio Tinto | | | | | | | 45,886 | | | | 46,553 | | | | 52,199 | |
| Attributable to non-controlling interests | | | | | | | 7,616 | | | | 11,187 | | | | 6,685 | |
Total equity | | | | | | | 53,502 | | | | 57,740 | | | | 58,884 | |
| (a) | Comparative information has been restated to reflect a number of new accounting standards. See note 46 on page 191. |
The notes on pages 118 to 193 are an integral part of these consolidated financial statements.
The financial statements on pages 111 to 203 were approved by the directors on 5 March 2014 and signed on their behalf by
| | | | | | |
| | | |  | | |
Jan du Plessis Chairman | | Sam Walsh AO Chief executive | | Chris Lynch Chief financial officer | | |
| | | | |
| | 114 riotinto.com/reportingcentre2013 | | |
Group statement of changes in equity
| | | | | | | | | | | | | | | | | | | | | | | | | | | | |
| Year ended 31 December 2013 | | Attributable to owners of Rio Tinto | |
| | | Share capital (notes 27 and 28) US$m | | | Share premium US$m | | | Other reserves (note 29) US$m | | | Retained earnings (note 29) US$m | | | Total US$m | | | Non- controlling interests US$m | | | Total equity US$m | |
| Opening balance (as restated)(j) | | | 5,945 | | | | 4,244 | | | | 14,868 | | | | 21,496 | | | | 46,553 | | | | 11,187 | | | | 57,740 | |
| Total comprehensive income for the year(a) | | | – | | | | – | | | | (1,984 | ) | | | 5,245 | | | | 3,261 | | | | (3,092 | ) | | | 169 | |
Currency translation arising on Rio Tinto Limited’s share capital(b) | | | (804 | ) | | | – | | | | – | | | | – | | | | (804 | ) | | | – | | | | (804 | ) |
| Dividends | | | – | | | | – | | | | – | | | | (3,322 | ) | | | (3,322 | ) | | | (196 | ) | | | (3,518 | ) |
| Own shares purchased for share options | | | – | | | | – | | | | (77 | ) | | | (44 | ) | | | (121 | ) | | | – | | | | (121 | ) |
Treasury shares reissued and other movements | | | – | | | | 25 | | | | – | | | | 55 | | | | 80 | | | | – | | | | 80 | |
| Change in equity held by Rio Tinto | | | – | | | | – | | | | – | | | | 102 | | | | 102 | | | | (78 | ) | | | 24 | |
Equity issued to holders of non-controlling interests | | | – | | | | – | | | | – | | | | – | | | | – | | | | 159 | | | | 159 | |
| Companies no longer consolidated | | | – | | | | – | | | | – | | | | – | | | | – | | | | (369 | ) | | | (369 | ) |
| Employee share options | | | – | | | | – | | | | 64 | | | | 73 | | | | 137 | | | | 5 | | | | 142 | |
Closing balance | | | 5,141 | | | | 4,269 | | | | 12,871 | | | | 23,605 | | | | 45,886 | | | | 7,616 | | | | 53,502 | |
| |
| Year ended 31 December 2012 | | Attributable to owners of Rio Tinto | |
| | | Share capital (notes 27 and 28) US$m | | | Share premium US$m | | | Other reserves (note 29) US$m | | | Retained earnings (note 29) US$m | | | Total US$m | | | Non- controlling interests US$m | | | Total equity US$m | |
Opening balance (as restated)(j) | | | 5,816 | | | | 4,208 | | | | 14,745 | | | | 27,430 | | | | 52,199 | | | | 6,685 | | | | 58,884 | |
Total comprehensive loss for the year(a) | | | – | | | | – | | | | 103 | | | | (3,267 | ) | | | (3,164 | ) | | | 141 | | | | (3,023 | ) |
Currency translation arising on Rio Tinto Limited’s share capital(b) | | | 133 | | | | – | | | | – | | | | – | | | | 133 | | | | – | | | | 133 | |
Dividends | | | – | | | | – | | | | – | | | | (3,038 | ) | | | (3,038 | ) | | | (422 | ) | | | (3,460 | ) |
Share buyback schemes | | | (4 | ) | | | – | | | | 4 | | | | (764 | ) | | | (764 | ) | | | – | | | | (764 | ) |
Own shares purchased for share options | | | – | | | | – | | | | (62 | ) | | | (41 | ) | | | (103 | ) | | | – | | | | (103 | ) |
Treasury shares reissued and other movements | | | – | | | | 36 | | | | – | | | | 3 | | | | 39 | | | | – | | | | 39 | |
Newly consolidated operations(c) (d) | | | – | | | | – | | | | – | | | | – | | | | – | | | | 2,902 | | | | 2,902 | |
Change in equity held by Rio Tinto(e) | | | – | | | | – | | | | – | | | | 1,128 | | | | 1,128 | | | | 166 | | | | 1,294 | |
Equity issued to holders of non-controlling interests(f) | | | – | | | | – | | | | – | | | | – | | | | – | | | | 1,595 | | | | 1,595 | |
Employee share options and other IFRS 2 charges taken to the income statement | | | – | | | | – | | | | 78 | | | | 45 | | | | 123 | | | | 120 | | | | 243 | |
Closing balance | | | 5,945 | | | | 4,244 | | | | 14,868 | | | | 21,496 | | | | 46,553 | | | | 11,187 | | | | 57,740 | |
| | | | |
| | 115 riotinto.com/reportingcentre2013 | | |
Group statement of changes in equity continued
| | | | | | | | | | | | | | | | | | | | | | | | | | | | |
| Year ended 31 December 2011 | | Attributable to owners of Rio Tinto | |
| | | Share capital (notes 27 and 28) US$m | | | Share premium US$m | | | Other reserves (note 29) US$m | | | Retained earnings (note 29) US$m | | | Total US$m | | | Non- controlling interests US$m | | | Total equity US$m | |
Opening balance | | | 5,847 | | | | 4,258 | | | | 15,643 | | | | 32,499 | | | | 58,247 | | | | 6,265 | | | | 64,512 | |
Prior year adjustment for changes in: | | | | | | | | | | | | | | | | | | | | | | | | | | | | |
– Subsidiaries (post tax) | | | – | | | | – | | | | – | | | | (215 | ) | | | (215 | ) | | | – | | | | (215 | ) |
– Equity accounted units (post tax) | | | – | | | | – | | | | – | | | | (226 | ) | | | (226 | ) | | | – | | | | (226 | ) |
As restated(j) | | | 5,847 | | | | 4,258 | | | | 15,643 | | | | 32,058 | | | | 57,806 | | | | 6,265 | | | | 64,071 | |
Total comprehensive income for the year (a) | | | – | | | | – | | | | (910 | ) | | | 4,515 | | | | 3,605 | | | | 877 | | | | 4,482 | |
Currency translation arising on Rio Tinto Limited’s share capital(b) | | | (19 | ) | | | – | | | | – | | | | – | | | | (19 | ) | | | – | | | | (19 | ) |
Dividends | | | – | | | | – | | | | – | | | | (2,236 | ) | | | (2,236 | ) | | | (548 | ) | | | (2,784 | ) |
Share buyback schemes | | | (12 | ) | | | – | | | | 12 | | | | (6,210 | ) | | | (6,210 | ) | | | – | | | | (6,210 | ) |
Own shares purchased for share options | | | – | | | | (50 | ) | | | (71 | ) | | | 10 | | | | (111 | ) | | | – | | | | (111 | ) |
Newly consolidated operations(g) | | | – | | | | – | | | | – | | | | – | | | | – | | | | 1,555 | | | | 1,555 | |
Change in equity held by Rio Tinto (g) (h) (i) | | | – | | | | – | | | | – | | | | (793 | ) | | | (793 | ) | | | (1,882 | ) | | | (2,675 | ) |
Equity issued to holders of non-controlling interests | | | – | | | | – | | | | – | | | | – | | | | – | | | | 424 | | | | 424 | |
Company no longer consolidated | | | – | | | | – | | | | – | | | | – | | | | – | | | | (6 | ) | | | (6 | ) |
Employee share options and other IFRS 2 charges taken to the income statement | | | – | | | | – | | | | 71 | | | | 86 | | | | 157 | | | | – | | | | 157 | |
Closing balance | | | 5,816 | | | | 4,208 | | | | 14,745 | | | | 27,430 | | | | 52,199 | | | | 6,685 | | | | 58,884 | |
| (a) | Refer to Statement of comprehensive income. |
| (c) | Rio Tinto gained control of the non Oyu Tolgoi LLC (OT) assets of Turquoise Hill Resources Ltd. (Turquoise Hill, formerly Ivanhoe Mines Limited) on 24 January 2012 when its share reached 51 per cent. |
| | Within newly consolidated operations for 31 December 2012, US$2,678 million represents non-controlling interests in the non OT assets, of which US$1,439 million is the 49 per cent non-controlling interest in net loans receivable from Rio Tinto Group companies. Refer to note 37. |
| (d) | Rio Tinto acquired a controlling interest in Richards Bay Minerals (RBM) in 2012, with consolidation effective from 3 September 2012 (the acquisition date). US$224 million within newly consolidated operations relates to the fair value of non-controlling interests at the acquisition date. Refer to note 37. |
| (e) | The majority of the adjustments to equity held by Rio Tinto in 2012 arose from the acquisition by a consortium led by Chalco of shares in Simfer Jersey Limited, a Rio Tinto subsidiary, as set out in the Simandou Joint Development Agreement (SJDA). Chalco made a payment of US$1.35 billion on 24 April 2012 in exchange for an equity interest of 47 per cent in Simfer Jersey, reimbursing Rio Tinto for historic project costs. The transfer on 24 April 2012 resulted in an adjustment to retained earnings attributable to owners of Rio Tinto of US$1.05 billion, relating to the amount received over Rio Tinto’s carrying value of the interest transferred. |
| (f) | Equity issued to holders of non-controlling interests in 2012 include US$0.9 billion of proceeds from a rights offering by Turquoise Hill, and cash calls of US$480 million following the transfer described in (e), which resulted in the Chalco consortium being issued with additional equity interest in proportion to its interest. |
| (g) | The purchase of Rio Tinto Coal Mozambique (RTCM, formerly Riversdale Mining Limited) in 2011 was treated as a step acquisition. Non-controlling interests of US$1,498 million arose at the acquisition date, when Rio Tinto’s share in RTCM reached 52.6 per cent. These non-controlling interests reversed as Rio Tinto increased its interests in RTCM to 100 per cent. An amount of US$479 million was recognised directly in equity in relation to Rio Tinto’s interests purchased after the acquisition date, representing the excess of consideration paid to acquire these additional shareholdings, over non-controlling interests acquired. Refer to note 37. |
| (h) | A reduction of US$339 million in non-controlling interests arose as Rio Tinto increased its economic share in OT through the acquisition of additional interests in Turquoise Hill. Adjustments to retained earnings attributable to owners of Rio Tinto of US$129 million related to the aggregate excess of consideration paid for the additional investments in Turquoise Hill, over the value of the additional economic share acquired in OT. Refer to note 37. |
| (i) | In relation to the Group’s purchase of an additional stake in Coal & Allied, adjustments to retained earnings of US$185 million were made for the excess of consideration paid to acquire shareholdings of US$45 million from non-controlling interests. |
| (j) | Comparative information has been restated to reflect a number of new accounting standards. See note 46 on page 191. |
| | | | |
| | 116 riotinto.com/reportingcentre2013 | | |
Reconciliation with Australian Accounting Standards
The Group’s financial statements have been prepared in accordance with International Financial Reporting Standards as issued by the International Accounting Standards Board (IFRS) and conform to IFRS as adopted by the European Union (EU IFRS), which differs in certain respects from the version of IFRS that is applicable in Australia referred to as Australian Accounting Standards (AAS).
Prior to 1 January 2004, the Group’s financial statements were prepared in accordance with UK GAAP. Under IFRS goodwill on acquisitions prior to 1998, which was eliminated directly against equity in the Group’s UK GAAP financial statements, has not been reinstated. This was permitted under the rules governing the transition to IFRS set out in IFRS 1. The equivalent Australian Standard, AASB 1, does not provide for the netting of goodwill against equity. As a consequence, shareholders’ funds under AAS include the residue of such goodwill, which amounted to US$550 million at 31 December 2013 (2012: US$535 million; 2011: US$537 million).
Save for the exception described above, the Group’s financial statements drawn up in accordance with IFRS are consistent with the requirements of AAS.
Outline of dual listed companies structure and basis of financial statements
The Rio Tinto Group
These are the financial statements of the Group formed through the merger of economic interests of Rio Tinto plc and Rio Tinto Limited (‘‘Merger’’), and presented by both Rio Tinto plc and Rio Tinto Limited as their consolidated accounts in accordance with both United Kingdom and Australian legislation and regulations.
Merger terms
On 21 December 1995, Rio Tinto plc and Rio Tinto Limited, which are listed respectively on Stock Exchanges in the United Kingdom and Australia, entered into a dual listed companies (DLC) merger. This was effected by contractual arrangements between the companies and amendments to Rio Tinto plc’s Memorandum and Articles of Association and Rio Tinto Limited’s Constitution.
As a result, Rio Tinto plc and Rio Tinto Limited and their respective groups operate together as a single economic enterprise, with neither assuming a dominant role. In particular, the arrangements:
| – | confer upon the shareholders of Rio Tinto plc and Rio Tinto Limited a common economic interest in both groups; |
| – | provide for common boards of directors and a unified management structure; |
| – | provide for equalised dividends and capital distributions; and |
| – | provide for the shareholders of Rio Tinto plc and Rio Tinto Limited to take key decisions, including the election of directors, through an electoral procedure in which the public shareholders of the two companies effectively vote on a joint basis. |
The merger involved no change in the legal ownership of any assets of Rio Tinto plc or Rio Tinto Limited, nor any change in the ownership of any existing shares or securities of Rio Tinto plc or Rio Tinto Limited, nor the issue of any shares, securities or payment by way of consideration, save for the issue by each company of one special voting share to a trustee company which provides the joint electoral procedure for public shareholders. During 2002, each of the parent companies issued a DLC Dividend Share to facilitate the efficient management of funds within the DLC structure.
Accounting standards
The financial statements have been drawn up in accordance with IFRS. The Merger was accounted for as a merger under UK GAAP. As permitted under the rules governing the transition to IFRS, which are set out in IFRS 1, the Group did not restate business combinations that occurred before the transition date of 1 January 2004. As a result, the DLC merger of economic interests described above continues to be accounted for as a merger under IFRS.
The main consequence of adopting merger rather than acquisition accounting is that the statement of financial position of the merged Group includes the assets and liabilities of Rio Tinto plc and Rio Tinto Limited at their carrying values prior to the merger, subject to adjustments to achieve uniformity of accounting policies, rather than at their fair values at the date of the merger. For accounting purposes Rio Tinto plc and Rio Tinto Limited are viewed as a single public parent company (with their respective public shareholders being the shareholders in that single company). As a result the amounts attributable to both Rio Tinto plc and Rio Tinto Limited public shareholders are included in the amounts attributed to owners of Rio Tinto on the statement of financial position, income statement and statement of comprehensive income.
Australian Corporations Act
The financial statements are drawn up in accordance with an order, under section 340 of the Australian Corporations Act 2001, issued by the Australian Securities and Investments Commission (ASIC) on 22 December 2010 (as amended on 17 February 2012). The main provisions of the order are that the financial statements are prepared in accordance with IFRS and include a reconciliation from IFRS to the Australian equivalents of IFRS (see above).
For further details of the ASIC Class Order relief see page 201.
| | | | |
| | 117 riotinto.com/reportingcentre2013 | | |
Notes to the 2013 financial statements
| 1 | Principal accounting policies |
Corporate information
The financial statements of the Group (as defined in (b) Basis of consolidation below) were authorised for issue in accordance with a directors’ resolution on 5 March 2014. Rio Tinto plc and Rio Tinto Limited are listed and incorporated respectively on Stock Exchanges in the UK and Australia. Rio Tinto plc’s registered office is at 2 Eastbourne Terrace, London W2 6LG, UK. Rio Tinto Limited’s registered office is at 120 Collins Street, Melbourne, Australia, 3000.
Rio Tinto’s business is finding, mining and processing mineral resources. Major products are iron ore, aluminium, copper, diamonds, coal, uranium, gold and industrial minerals (borates, titanium dioxide and salt). Activities span the world and are strongly represented in Australia and North America with significant businesses in Asia, Europe, Africa and South America. Information on the Group’s structure is provided in notes 33 to 36. Information on other related party relationships of the Group is provided in note 40.
Basis of preparation
The basis of preparation and the accounting policies used in preparing the financial statements for the year ended 31 December 2013 are set out below.
The financial statements for the year ended 31 December 2013 have been prepared in accordance with International Financial Reporting Standards as issued by the International Accounting Standards Board (IFRS) and conform to IFRS as adopted by the European Union (EU IFRS) and interpretations issued from time to time by the IFRS Interpretations Committee (IFRIC) and adopted by the European Union that are mandatory or, in certain cases permitted to be early-adopted, for the year ended 31 December 2013, the Companies Act 2006 applicable to companies reporting under IFRS and in accordance with applicable UK law, applicable Australian law as amended by the Australian Securities and Investments Commission Order dated 22 December 2010 (as amended on 17 February 2012) and Article 4 of the European Union IAS regulation. The financial statements are prepared on a going concern basis (page 109).
The IFRS financial information has been drawn up on the basis of accounting policies consistent with those applied in the financial statements for the year to 31 December 2012, except for the changes in accounting requirements set out below. The impact of these changes in accounting requirements on the statement of financial position as at 1 January 2012, together with the impact on the income statement for the years ended 31 December 2011 and 31 December 2012, are set out on pages 191 to 192. Material impacts on the primary statements for prior periods presented are explained below. With the exception of IFRS 13 and IAS 19 (revised 2011), all of the changes were effective from 1 January 2011, the earliest period presented in these financial statements. Application of IAS 19 (revised 2011) is fully retrospective.
| – | Annual Improvements 2011. These Annual Improvements address six areas, none of which materially impacted the Group’s primary statements. |
| – | Amendment to IAS 1 “Presentation of Financial Statements – Presentation of Items of Other Comprehensive Income”. The amendment requires items presented in other comprehensive income (OCI) to be grouped on the basis of whether they can potentially be reclassified to the income statement (reclassification adjustments). Tax applicable to these items is grouped on the same basis. The Group’s statement of comprehensive income for the years ended 31 December 2011 and 31 December 2012 has been re-presented accordingly. |
| – | IAS 19 (revised 2011) “Employee Benefits” (IAS 19R). The amendment to IAS 19 requires the expected return on plan assets to assume returns in line with the discount rate applied in the calculation of the pension obligation, whereas the previous standard allowed an assumed rate based on plan assets actually held which generally gave a higher rate. The income statement impact on the expected return on assets is offset in actuarial gains and losses within the Statement of comprehensive income. The amendment also changes the timing of recognition of past service cost. |
| – | IFRS 10 “Consolidated Financial Statements”, IFRS 11 “Joint Arrangements” and IAS 28 (revised 2011) “Investments in Associates and Joint Ventures”. IFRS 10 replaces previous guidance on control and consolidation in IAS 27 “Consolidated and Separate Financial Statements” and SIC 12 “Consolidation – Special Purpose Entities”. It provides a revised definition of control to be used as the basis for determining which entities are consolidated in the financial statements. IFRS 11 replaces IAS 31 “Interests in Joint Ventures”. The classification and subsequent accounting for joint arrangements now depends on the rights and obligations of the parties to the arrangement and not just the legal form. These standards have been adopted with effect from 1 January 2011. |
| | All entities and arrangements within the Group have been reviewed to assess the impact of IFRS 10 and IFRS 11. As a result certain operations (including Queensland Alumina Limited, New Zealand Aluminium Smelters Limited, and Pechiney Reynolds Quebec Inc.) that were previously equity accounted are now accounted for as Joint Operations. These arrangements are primarily designed for the provision of output to the parties sharing joint control indicating that the parties have rights to substantially all the economic benefits of the assets. The liabilities of the arrangements are in substance satisfied by cash flows received from the parties; this dependence indicates that the parties effectively have obligations for the liabilities. It is these facts and circumstances that give rise to the classification as Joint Operations. As a result the Group no longer recognises “Investments in equity accounted units” or “Share of profit/(loss) after tax of equity accounted units” or “Impairment after tax of investments in equity accounted units” for these arrangements, but instead consolidates its share of their assets, liabilities, revenues, expenses and cash flows on a line-by-line basis. The reduction in “Investments in equity accounted units” and increase in other assets shown in the restated Statement of financial position at 1 January 2012 also results in a reallocation of the 2012 impairment charge. Under IFRS the impairment charge is allocated to goodwill before other assets; the goodwill that is recognised in the restated Statement of financial position at 1 January 2012 is therefore impaired before certain other assets in 2012. This results in an increase of US$1.4 billion in the allocation of the impairment charge to goodwill, with a corresponding decrease in the allocation to “Property, plant and equipment”, “Investments in equity accounted units” and “Intangible assets” as well as an increase in “Deferred tax liabilities”. There is no change in the total Aluminium businesses’ post-tax impairment charge for 2012 as a result of these changes. |
| – | IFRS 12 “Disclosure of Interests in Other Entities”. IFRS 12 includes the disclosure requirements for all forms of interests in other entities. This disclosure is included in notes 33 to 36. |
| – | IFRS 13 “Fair Value Measurement”. IFRS 13 is prospective in application. It establishes a single source of guidance for all fair value measurements. The standard provides guidance on how to measure fair value when fair value is required or permitted under other standards. It does not change when an entity is required to use fair value. For the year ended 31 December 2013, this has resulted in some minor changes to the method of valuation of embedded commodity derivatives. |
| | | | |
| | 118 riotinto.com/reportingcentre2013 | | |
| – | IFRIC 20 “Stripping Costs in the Production Phase of a Surface Mine”. In open pit mining operations, it is necessary to remove overburden and other waste materials in order to access ore from which minerals can be extracted economically. The process of removing overburden and waste materials is referred to as stripping. The Group capitalises pre-production stripping costs incurred during the development of a mine (or pit) as part of the investment in construction of the mine (or pit). These costs are subsequently amortised over the life of the mine (or pit) on a units of production basis. This accounting treatment is unchanged by the implementation of IFRIC 20 which specifies the accounting for production phase stripping costs only. The Group’s accounting policy for production phase stripping costs for 2012 and previous years was to defer costs where this was the most appropriate basis for matching the costs against the related economic benefits and the effect was material. Implementation of IFRIC 20 has changed the way in which the Group accounts for production phase stripping costs and resulted in a write-off to retained earnings on implementation. IFRIC 20 is not fully retrospective; the impact of adoption is calculated as at 1 January 2011 and comparatives are restated from that point. On implementation of IFRIC 20, capitalised production phase stripping costs could only be carried forward if they could be identified with a remaining component of the orebody for the relevant business unit. A net amount of US$0.7 billion was therefore written off these capitalised costs (pre-tax and non-controlling interests) which reduced retained earnings at 1 January 2011 by US$0.4 billion post tax and non-controlling interests. |
| – | Amendments to IAS 36 “Recoverable Amount Disclosures for Non-financial Assets”. The amendment clarifies the disclosures required in relation to the recoverable amount of impaired assets if that amount is based on fair value less costs of disposal. The Group has early adopted the amendment and the related disclosures are included in note 6. |
The Group has not applied the following pronouncements which are not mandatory for 2013:
Mandatory for 2014
| – | Amendments to IAS 32 “Financial Instruments: Presentation – Offsetting Financial Assets and Financial Liabilities”. |
| – | IFRIC 21 “Levies” clarifies when to recognise a liability to pay a levy. A levy is an outflow of resources embodying economic benefits that is imposed by governments on entities in accordance with legislation. IFRIC 21 does not apply to items that are within the scope of other Standards (such as income taxes that are within the scope of IAS 12 Income Taxes) or fines and penalties. |
Mandatory for 2015 and beyond
| – | IFRS 9 “Financial Instruments” addresses the classification, measurement and recognition of financial assets and financial liabilities. It replaces the parts of IAS 39 “Financial Instruments: Recognition and Measurement” that relate to the classification and measurement of financial instruments. |
The Group is currently evaluating the impact of these pronouncements which are not currently expected to materially impact the Group’s earnings or shareholders’ funds.
Judgments in applying accounting policies and key sources of estimation uncertainty
The preparation of the financial statements requires the use of judgment in applying accounting policies and in making critical accounting estimates. These judgments and estimates are based on management’s best knowledge of the relevant facts and circumstances, having regard to previous experience, but actual results may differ from the amounts included in the financial statements. Information about such significant judgments and estimation is contained in the accounting policies and/or the Notes to the financial statements, and the key areas are summarised below.
Areas of judgment that have the most significant effect on the amounts recognised in the financial statements are:
| – | Merger accounting for the 1995 merger of the economic interests of Rio Tinto plc and Rio Tinto Limited into the dual listed companies (DLC) structure (see Dual listed companies structure on page 117); |
| – | Acquisitions – note 1(b) and note 37; |
| – | Review of asset carrying values, impairment charges and reversals and the recoverability of goodwill – note 1(e) and (i), note 6, note 12 and note 13; |
| – | Estimation of asset lives – note 1(e) and (i); |
| – | Determination of ore reserve estimates – note 1(j); |
| – | Provision for onerous contracts – note 1(i) |
| – | Close-down, restoration and environmental obligations – note 1(k); |
| – | Deferral of stripping costs – note 1(h); |
| – | Recognition of deferred tax on mining rights recognised in acquisitions – note 1(m) ; |
| – | Recoverability of potential deferred tax assets – note 17 (d) and (f); |
| – | Capitalisation of exploration and evaluation costs – note 1(f); |
| – | Identification of functional currencies – note 1(d); |
| – | Basis of consolidation – note 1(b); and |
| – | Post-retirement cost assumptions – note 1(n). |
Key sources of estimation uncertainty that have a significant risk of causing a material adjustment to the carrying amounts of assets and liabilities within the next financial year are:
| – | Review of asset carrying values, impairment charges and reversals and the recoverability of goodwill – note1(e) and (i), note 6, note 12 and note 13; |
| – | Estimation of close-down, restoration and environmental costs and the timing of expenditure – note 1(k) and note 26; |
| – | Estimation of obligations for post-retirement costs – note 45; |
| – | Recoverability of potential deferred tax assets – note 17(d) and (f); |
| – | Capitalisation of exploration and evaluation costs – note 1(f); and |
| – | Contingencies – note 31. |
These areas of judgment and estimation are discussed further in critical accounting policies and estimates on page 129.
| | | | |
| | 119 riotinto.com/reportingcentre2013 | | |
Notes to the 2013 financial statements continued
| 1 | Principal accounting policies continued |
(a) Accounting convention
The financial information included in the financial statements for the year ended 31 December 2013, and for the related comparative periods, has been prepared under the historical cost convention, as modified by the revaluation of certain derivative contracts and financial assets, the impact of fair value hedge accounting on the hedged item and the accounting for post-retirement assets and obligations. The Group’s policy in respect of these items is set out in the notes below. The Group’s financial statements are presented in US dollars and all values are rounded to the nearest million (US$m) unless otherwise stated.
(b) Basis of consolidation
The financial statements comprise the consolidation of the accounts of Rio Tinto plc and Rio Tinto Limited (together “the Companies”) and their respective subsidiaries (together “the Group”) together with the Group’s share of joint arrangements and associates accounted for as described below.
All intragroup transactions and balances have been eliminated on consolidation.
Where necessary, adjustments are made to the assets, liabilities, and results of subsidiaries, joint arrangements and associates to bring their accounting policies into line with those used by the Group.
Subsidiaries: Subsidiaries are entities controlled by the Companies. Control exists where the Companies have: power over the entities, ie existing rights that give them the current ability to direct the relevant activities of the entities (those that significantly affect the Companies’ returns); exposure, or rights, to variable returns from their involvement with the entities; and the ability to use their power to affect those returns.
Joint Arrangements: A joint arrangement is an arrangement of which two or more parties have joint control. Joint control is the contractually agreed sharing of control such that decisions about the relevant activities of the arrangement (those that significantly affect the Companies’ returns) require the unanimous consent of the parties sharing control. The Group has two types of joint arrangement:
Joint Operations (JOs): A JO is a joint arrangement in which the parties that share joint control have rights to the assets, and obligations for the liabilities, relating to the arrangement. This includes situations where the parties benefit from the joint activity through a share of the output, rather than by receiving a share of the results of trading. In relation to its interest in a JO, the Group recognises: its share of assets and liabilities, revenue from the sale of its share of the output and its share of any revenue generated from the sale of the output by the JO; and its share of expenses. These are incorporated into the Group’s financial statements under the appropriate headings.
Joint Ventures (JVs): A JV is a joint arrangement in which the parties that share joint control have rights to the net assets of the arrangement. JVs are accounted for using the equity accounting method.
Associates: An associate is an entity that is neither a subsidiary nor a joint arrangement, over which the Group has significant influence. Significant influence is presumed to exist where there is neither control nor joint control and the Group has over 20 per cent of the voting rights, unless it can be clearly demonstrated that this is not the case. Significant influence can arise where the Group holds less than 20 per cent of the voting rights if it has the power to participate in the financial and operating policy decisions affecting the entity. Investments in associates are accounted for using the equity accounting method.
The Group uses the term “Equity accounted units” (EAUs) to refer to associates and JVs collectively. For all EAUs, the carrying value will include any long-term debt interests that in substance form part of the Group’s net investment.
Under the equity accounting method the investment is recorded initially at cost to the Group, including any goodwill on acquisition. In subsequent periods the carrying amount of the investment is adjusted to reflect the Group’s share of the EAUs’ retained post-acquisition profit or loss and other comprehensive income. When the Group’s share of losses in an EAU equals or exceeds its interest in the EAU, including any other unsecured receivables, the Group does not recognise further losses, unless it has incurred legal or constructive obligations or made payments on behalf of the EAU.
Acquisitions
Under the “acquisition” method of accounting for business combinations, the purchase consideration is allocated to the identifiable assets acquired and liabilities and contingent liabilities assumed (the identifiable net assets) on the basis of their fair value at the date of acquisition which is the date on which control is obtained. Provisional fair values allocated at a reporting date are finalised within 12 months of the acquisition date. The excess of the consideration transferred, the amount of any non-controlling interest in the acquiree and the acquisition-date fair value of any previous equity interest in the acquiree over the fair value of the identifiable net assets acquired is recorded as goodwill. Any shortfall is immediately recognised in the income statement.
Costs related to the acquisition of a subsidiary are expensed as incurred.
On an acquisition-by-acquisition basis, the Group recognises any non-controlling interest in the acquiree either at the non-controlling interest’s proportionate share of the acquiree’s identifiable net assets or at fair value. In some cases, non-controlling interests may be treated as equity options and valued on that basis. Goodwill (see note (e)) and amounts attributable to non-controlling interests will differ depending on the basis used.
Where the Group has a previously held non-controlling interest in the acquiree, this is remeasured to fair value at the date control is gained with any gain or loss recognised in the income statement. The cash cost of the share purchase that gives rise to control is included within “Investing activities” in the cash flow statement.
Where the Group increases its ownership interest in a subsidiary, the difference between the purchase price and the carrying value of the share of net assets acquired is recorded in equity. The cash cost of such purchases is included within “Financing activities” in the cash flow statement.
The results of businesses acquired during the year are included in the consolidated financial statements from the date on which control, joint control or significant influence commences.
| | | | |
| | 120 riotinto.com/reportingcentre2013 | | |
Disposals
Individual non-current assets or “disposal groups” (ie groups of assets and liabilities) to be disposed of, by sale or otherwise in a single transaction, are classified as “held for sale” if the following criteria are met at the period end:
| – | the carrying amount will be recovered principally through a sale transaction rather than through continuing use; and |
| – | the disposal group is available for immediate sale in its present condition subject only to terms that are usual and customary for such sales; and |
– the sale is highly probable.
Disposal groups held for sale are carried at the lower of their carrying amount and fair value less costs to sell. The comparative statement of financial position is not restated. Disposal groups acquired with a view to resale are held at the fair value determined at the acquisition date. For these assets acquired for resale no profits or losses are recognised between the acquisition date and the disposal date, unless there is a subsequent impairment.
On classification as held for sale, the assets are no longer depreciated.
The results of businesses disposed of are included in the consolidated financial statements until the date on which control, joint control or significant influence ceases. The cash proceeds of disposals are included within “Investing activities” in the cash flow statement. If control is lost, any interest in the entity retained by the Group is remeasured to its fair value and the change in carrying amount is recognised in the income statement. The retained interest may be subsequently accounted for as a joint venture, associate or financial asset depending on the facts. Any amounts previously recognised in other comprehensive income in respect of the entity disposed of, or for which control, joint control or significant influence has ceased may be recycled to the income statement in proportion to the interest disposed of.
Gains or losses on disposals to non-controlling interests where control is retained are recorded in equity. The cash proceeds of such disposals are included within “Financing activities” in the cash flow statement.
(c) Sales revenue
Sales revenue comprises sales to third parties at invoiced amounts. Most sales are priced ex works, free on board (fob) or cost, insurance and freight (cif). Amounts billed to customers in respect of shipping and handling are classified as sales revenue where the Group is responsible for carriage, insurance and freight. All shipping and handling costs incurred by the Group are recognised as operating costs. If the Group is acting solely as an agent, amounts billed to customers are offset against the relevant costs. Revenue from services is recognised as services are rendered and accepted by the customer.
Sales revenue excludes any applicable sales taxes. Mining royalties are presented as an operating cost or, where they are in substance a profit-based tax, within taxation.
Revenues from the sale of significant by-products, such as gold, are included in sales revenue. Sundry revenue, incidental to the main revenue-generating activities of the operations, and which is a consequence of producing and selling the main products, is treated as a credit to operating costs.
Third-party commodity swap arrangements for delivery and receipt of smelter grade alumina are offset within operating costs.
Sales revenue is only recognised on individual sales when all of the following criteria are met:
| – | the significant risks and rewards of ownership of the product have been transferred to the buyer; |
| – | neither continuing managerial involvement to the degree usually associated with ownership, nor effective control over the goods sold, has been retained; |
| – | the amount of revenue can be measured reliably; |
| – | it is probable that the economic benefits associated with the sale will flow to the Group; and |
| – | the costs incurred or to be incurred in respect of the sale can be measured reliably. |
These conditions are generally satisfied when title passes to the customer. In most instances, sales revenue is recognised when the product is delivered to the destination specified by the customer, which is typically the vessel on which it will be shipped, the destination port or the customer’s premises.
The majority of the Group’s products are sold to customers under contracts, which vary in tenure and pricing mechanisms, with some volumes sold in the spot market.
Pricing for iron ore is on a range of terms, the majority being either monthly or quarterly average pricing mechanisms, with a smaller proportion of iron ore volumes being sold on the spot market. Substantially all iron ore sales are reflected at final prices in the results for the period, based on the best available information at the period end.
Sales revenue is commonly subject to adjustment based on an inspection of the product by the customer. In such cases, sales revenue is initially recognised on a provisional basis using the Group’s best estimate of contained metal, and adjusted subsequently.
Certain products are “provisionally priced”, ie the selling price is subject to final adjustment at the end of a period normally ranging from 30 to 180 days after delivery to the customer. The final price is based on the market price at the relevant quotation point stipulated in the contract.
As is customary in the industry, revenue on provisionally-priced sales is recognised based on estimates of the fair value of the consideration receivable based on relevant forward market prices. At each reporting date, provisionally priced metal is marked to market based on the forward selling price for the quotational period stipulated in the contract. For this purpose, the selling price can be measured reliably for those products, such as copper, for which there exists an active and freely-traded commodity market such as the London Metals Exchange and the value of product sold by the Group is directly linked to the form in which it is traded on that market.
The marking to market of provisionally-priced sales contracts is recorded as an adjustment to sales revenue. Information on provisionally-priced sales contracts is included in note 30.
| | | | |
| | 121 riotinto.com/reportingcentre2013 | | |
Notes to the 2013 financial statements continued
| 1 | Principal accounting policies continued |
(d) Currency translation
The functional currency for each entity in the Group, and for joint arrangements and associates, is the currency of the primary economic environment in which that entity operates. For many entities, this is the currency of the country in which they are located. Transactions denominated in other currencies are converted to the functional currency at the exchange rate ruling at the date of the transaction. Monetary assets and liabilities denominated in foreign currencies are retranslated at year end exchange rates. The Group’s accounting policies for derivative financial instruments and hedge accounting are explained in more detail in note 1(p) (iii).
The Group’s financial statements are presented in US dollars, as that presentation currency most reliably reflects the global business performance of the Group as a whole. On consolidation, income statement items for each entity are translated from the functional currency into US dollars at average rates of exchange where the average is a reasonable approximation of rates prevailing on the transaction date. Statement of financial position items are translated into US dollars at period-end exchange rates.
Exchange differences arising on the translation of the net assets of entities with functional currencies other than the US dollar are recognised directly in the foreign currency translation reserve. These translation differences are shown in the statement of comprehensive income with the exception of translation adjustments relating to Rio Tinto Limited’s share capital which are shown in the statement of changes in equity.
Where an intragroup balance is, in substance, part of the Group’s net investment in an entity, exchange gains and losses on that balance are taken to the foreign currency translation reserve. Except as noted above, or in note (p) below relating to derivative contracts, all other exchange differences are charged or credited to the income statement in the year in which they arise.
(e) Goodwill and intangible assets (excluding exploration and evaluation expenditure)
Goodwill is not amortised; it is tested annually for impairment or more frequently if events or changes in circumstances indicate a potential impairment. Investments in EAUs including any goodwill are tested for impairment as a single asset when a trigger for impairment has been identified. The Group’s impairment policy is explained in note 1(i).
Purchased intangible assets are initially recorded at cost. Finite-life intangible assets are amortised over their useful economic lives on a straight line or units of production basis, as appropriate. Intangible assets that are deemed to have indefinite lives and intangible assets that are not yet ready for use are not amortised; they are reviewed annually for impairment or more frequently if events or changes in circumstances indicate a potential impairment in accordance with accounting policy note 1(i).
The Group considers that intangible assets have indefinite lives when, based on an analysis of all of the relevant factors, there is no foreseeable limit to the period over which the asset is expected to generate cash flows for the Group. The factors considered in making this determination include the existence of contractual rights for unlimited terms; or evidence that renewal of the contractual rights without significant incremental cost can be expected for indefinite future periods in view of the Group’s investment intentions. The life cycles of the products and processes that depend on the asset are also considered.
(f) Exploration and evaluation
Exploration and evaluation expenditure comprises costs that are directly attributable to:
| – | researching and analysing existing exploration data; |
| – | conducting geological studies, exploratory drilling and sampling; |
| – | examining and testing extraction and treatment methods; and/or |
| – | compiling pre-feasibility and feasibility studies. |
Exploration expenditure relates to the initial search for deposits with economic potential. Evaluation expenditure arises from a detailed assessment of deposits or other projects that have been identified as having economic potential. Expenditure on exploration activity is not capitalised.
Capitalisation of evaluation expenditure commences when there is a high degree of confidence that the Group will determine that a project is commercially viable, and therefore it is considered probable that future economic benefits will flow to the Group.
The carrying values of capitalised evaluation expenditure are reviewed for impairment twice a year by management. In the case of undeveloped mining projects (projects for which the decision to mine has not yet been approved at the appropriate authorisation level within the Group) which have arisen through acquisition, there may be only mineralised material to form a basis for that review. The review is based on a status report summarising the Group’s intentions for development.
In some cases, undeveloped projects are regarded as successors to orebodies, smelters or refineries currently in production. Where this is the case, it is intended that these will be developed and go into production when the current source of ore is exhausted or to replace the output when existing smelters and/or refineries are closed. It is often the case that technological and other improvements will allow successor smelters and/or refineries to more than replace the capacity of their predecessors.
(g) Property, plant and equipment
Property, plant and equipment is stated at cost, as defined in IAS 16, less accumulated depreciation and accumulated impairment losses. The cost of property, plant and equipment includes the estimated close-down and restoration costs associated with the asset. Once an undeveloped mining project has been established as commercially viable and approval to mine has been given, expenditure other than that on land, buildings, plant and equipment is capitalised under “Mining properties and leases” together with any amount transferred from “Exploration and evaluation”. Commercial viability is deemed to be achieved when the Group determines that the project will provide a satisfactory return relative to its perceived risks. Ore reserves may be declared for an undeveloped mining project before its commercial viability has been fully determined. Evaluation costs may continue to be capitalised during the period between declaration of ore reserves and approval to mine as further work is undertaken in order to refine the development case to maximise the project’s returns.
Costs of evaluation of an undeveloped smelter or refinery project are capitalised under “Capital works in progress”, provided that there is a high degree of confidence that the project will be deemed to be commercially viable.
| | | | |
| | 122 riotinto.com/reportingcentre2013 | | |
Costs which are necessarily incurred whilst commissioning new assets, in the period before they are capable of operating in the manner intended by management, are capitalised. Development costs incurred after the commencement of production are capitalised to the extent they are expected to give rise to a future economic benefit. Interest on borrowings related to construction or development projects is capitalised, at the rate payable on project-specific debt if applicable, or at the Group’s cost of borrowing if not, until the point when substantially all the activities that are necessary to make the asset ready for its intended use are complete.
(h) Deferred stripping
In open pit mining operations, it is necessary to remove overburden and other waste materials to access ore from which minerals can be extracted economically. The process of removing overburden and waste materials is referred to as stripping. During the development of a mine (or pit), before production commences, stripping costs are capitalised as part of the investment in construction of the mine (or pit) and are subsequently amortised over the life of the mine (or pit) on a units of production basis.
Where a mine operates several open pits that are regarded as separate operations for the purpose of mine planning, initial stripping costs are accounted for separately by reference to the ore from each separate pit. If, however, the pits are highly integrated for the purpose of mine planning, the second and subsequent pits are regarded as extensions of the first pit in accounting for stripping costs. In such cases, the initial stripping (ie overburden and other waste removal) of the second and subsequent pits is considered to be production phase stripping and accounted for by reference to the specific volume of the orebody that is made more accessible by the stripping activity.
The Group’s determination of whether multiple pit mines are considered separate or integrated operations depends on each mine’s specific circumstances. The following factors would point towards the initial stripping costs for the individual pits being accounted for separately:
| – | If mining of the second and subsequent pits is conducted consecutively with that of the first pit, rather than concurrently. |
| – | If separate investment decisions are made to develop each pit, rather than a single investment decision being made at the outset. |
| – | If the pits are operated as separate units in terms of mine planning and the sequencing of overburden removal and ore mining, rather than as an integrated unit. |
| – | If expenditures for additional infrastructure to support the second and subsequent pits are relatively large. |
| – | If the pits extract ore from separate and distinct orebodies, rather than from a single orebody. |
If the designs of the second and subsequent pits are significantly influenced by opportunities to optimise output from the several pits combined, including the co-treatment or blending of the output from the pits, then this would point to treatment as an integrated operation in accounting for stripping costs.
The relative importance of each of the above factors is considered in each case.
In order for production phase stripping costs to qualify for capitalisation as a stripping activity asset, three criteria must be met:
| – | it must be probable that economic benefit will be realised in a future accounting period as a result of improved access to the orebody created by the stripping activity; and |
| – | it must be possible to identify the “component” of the orebody for which access has been improved; and |
| – | it must be possible to reliably measure the costs that relate to the stripping activity. |
A “component” is a specific volume of the orebody that is made more accessible by the stripping activity. It will typically be a subset of the larger orebody that is distinguished by a separate useful economic life.
When the cost of stripping related to development which has a future benefit is not distinguishable from the cost of producing current inventories, ie there is a mixture of waste being removed to extract ore in the current period as well as waste being removed to allow extraction of ore in future periods, the stripping costs are allocated to each activity based on a relevant production measure. Generally, the measure would be calculated based on a ratio (Ratio) obtained by dividing the tonnage of waste mined for the component for the period either by the quantity of ore mined for the component or by the quantity of minerals contained in the ore mined for the component. In some operations, the quantity of ore is a more appropriate basis for allocating costs, particularly, where there are significant by-products. Stripping costs incurred in the period related to the component are deferred to the extent that the current period Ratio exceeds the life of component Ratio. The stripping activity asset is depreciated on a “units of production” basis based on expected production of either ore or contained minerals over the life of the component unless another method is more appropriate.
The life of component Ratios are based on proven and probable ore reserves of the mine (and for some mines, other mineralised material) and the annual mine plan; they are a function of the mine design and therefore changes to that design will generally result in changes to the Ratios. Changes in other technical or economic parameters that impact on ore reserves may also have an impact on the life of component Ratios even if they do not affect the mine design. Changes to the life of component Ratios are accounted for prospectively. It may be the case that subsequent phases of stripping will access additional ore and that these subsequent phases are only possible after the first phase has taken place. Where applicable, the Group considers this on a mine-by-mine basis. Generally, the only ore attributed to the stripping activity asset for the purposes of calculating a life of component Ratio, and for the purposes of amortisation, is the ore to be extracted from the originally identified component.
Deferred stripping costs are included in “Mining properties and leases” within “Property, plant and equipment” or within “Investments in equity accounted units”, as appropriate. Amortisation of deferred stripping costs is included in “Net operating costs” or in “Share of profit after tax of equity accounted units”, as appropriate.
| | | | |
| | 123 riotinto.com/reportingcentre2013 | | |
Notes to the 2013 financial statements continued
| 1 | Principal accounting policies continued |
(i) Depreciation and impairment
Depreciation of non-current assets
Property, plant and equipment is depreciated over its useful life, or over the remaining life of the mine if that is shorter and there is no alternative use for the asset.
The useful lives of the major assets of a cash-generating unit are often dependent on the life of the orebody to which they relate. Where this is the case, the lives of mining properties, and their associated refineries, concentrators and other long-lived processing equipment generally relate to the expected life of the orebody. The life of the orebody, in turn, is estimated on the basis of the life-of-mine plan. Where the major assets of a cash-generating unit are not dependent on the life of a related orebody, management applies judgment in estimating the remaining service potential of long-lived assets. In the case of smelters, factors affecting the remaining service potential include smelter technology and electricity purchase contracts when the power is not sourced from the company’s, or certain local government’s, electricity generating capacity.
The useful lives and residual values for material assets and categories of assets are reviewed annually and charges reflected prospectively.
Depreciation commences when an asset is available for use. The major categories of property, plant and equipment are depreciated on a units of production and/or straight-line basis as follows:
Units of production basis
For mining properties and leases and certain mining equipment, the consumption of the economic benefits of the asset is linked to the production level. Except as noted below, these assets are depreciated on a units of production basis.
In applying the units of production method, depreciation is normally calculated based on production in the period as a percentage of total expected production in current and future periods based on proven and probable ore reserves and, for some mines, other mineralised material. This other mineralised material may be included in depreciation calculations in limited circumstances and where there is a high degree of confidence in their economic extraction. This would be the case when the other mineralised material does not yet have the status of ore reserves merely because the necessary detailed evaluation work has not yet been performed and the responsible technical personnel agree that inclusion of a proportion of mineralised material is appropriate based on historic reserve conversion rates. Such inclusion would usually only occur in situations where there are very large areas of contiguous mineralisation, for which the economic viability is not sensitive to likely variations in grade, as may be the case for certain iron ore, bauxite and industrial minerals deposits. The required level of confidence is unlikely to exist for minerals that are typically found in low-grade ore, (compared with the above) such as copper or gold. In these cases, specific areas of mineralisation have to be evaluated in considerable detail before their economic status can be predicted with confidence. Where mineralised material is used in the calculation of depreciation for infrastructure, primarily rail and port, which will benefit current and future mines then the measured and indicated resources may relate to mines which are currently in production or to mines which will be brought into production in the future. The quantum of mineralised material is determined taking into account future capital costs as required by the Joint Ore Reserves Committee (JORC) code. The depreciation calculation, however, does not take into account future development costs for mines which are not yet in production. Mineralised material is currently only incorporated into depreciation calculations in the Group’s Australian iron ore business.
Straight-line basis
Assets within operations for which production is not expected to fluctuate significantly from one year to another or which have a physical life shorter than the related mine are depreciated on a straight-line basis.
Impairment of non-current assets
Property, plant and equipment and intangible assets with finite lives are reviewed for impairment if there is an indication that the carrying amount may not be recoverable. All goodwill and intangible assets that are not yet ready for use or have an indefinite life are tested annually for impairment as at 30 September, regardless of whether there has been an impairment trigger, or more frequently if events or changes in circumstances indicate a potential impairment.
Impairment is assessed at the level of cash-generating units which, in accordance with IAS 36 “Impairment of Assets”, are identified as the smallest identifiable group of assets that generate cash inflows, which are largely independent of the cash inflows from other assets. The existence of an active market for intermediate products is also monitored and separate cash-generating units are identified even if the majority of those products are further processed internally and therefore the cash flows are not independent.
In some cases, individual business units consist of several operations with independent cash-generating streams, which constitute separate cash-generating units.
Goodwill acquired through business combinations is allocated to the cash-generating unit, or groups of cash-generating units if that is the lowest level within the Group at which goodwill is monitored for internal management purposes, that are expected to benefit from the related business combination.
When an impairment review is undertaken, the recoverable amount is assessed by reference to the higher of value in use (being the net present value of expected future cash flows of the relevant cash-generating unit in its current condition) and fair value less costs of disposal (FVLCD).
When the recoverable amount of the cash-generating unit has been measured by reference to FVLCD, this amount has been further classified in accordance with the fair value hierarchy for observable market data that is consistent with the unit of account for the cash-generating unit being tested. The best evidence of FVLCD is the value obtained from an active market or binding sale agreement and the recoverable amount is classified in the fair value hierarchy as level 1. When FVLCD is based on quoted prices for equity instruments but adjusted to reflect factors such as a lack of liquidity in the market, the recoverable amount is classified as level 2 in the fair value hierarchy. No cash-generating units are currently assessed for impairment by reference to a recoverable amount based on FVLCD classified as level 2.
Where unobservable inputs are material to the measurement of the recoverable amount, FVLCD is based on the best information available to reflect the amount the Group could receive for the cash-generating unit in an orderly transaction between market participants at the measurement date. This is often estimated using discounted cash flow techniques and is classified as level 3 in the fair value hierarchy.
Where the recoverable amount is assessed using FVLCD based on discounted cash flow techniques, the resulting estimates are based on detailed “life-of-mine” and/or production plans.
| | | | |
| | 124 riotinto.com/reportingcentre2013 | | |
The cash flow forecasts for FVLCD purposes are based on management’s best estimates of expected future revenues and costs, including the future cash costs of production, capital expenditure, closure, restoration and environmental costs. For the purposes of determining FVLCD from a market participant’s perspective, the cash flows incorporate management’s price and cost assumptions in the short and medium term. In the longer term, operating margins are assumed to remain constant where appropriate; as it is considered unlikely that a market participant would prepare detailed forecasts over a longer term. The cash flow forecasts may include net cash flows expected to be realised from extraction, processing and sale of material that does not currently qualify for inclusion in proven or probable ore reserves. Such non-reserve material is only included where there is a high degree of confidence in its economic extraction. This expectation is usually based on preliminary drilling and sampling of areas of mineralisation that are contiguous with existing ore reserves. Typically, the additional evaluation to achieve ore reserve status for such material has not yet been done because this would involve incurring evaluation costs earlier than is required for the efficient planning and operation of the mine.
As noted above, cost levels incorporated in the cash flow forecasts for FVLCD purposes are based on the current life-of-mine plan or long term production plan for the cash-generating unit. This differs from value in use which requires future cash flows to be estimated for the asset in its current condition and therefore does not include future cash flows associated with improving or enhancing an asset’s performance. Anticipated enhancements to assets may be included in FVLCD calculations and therefore generally result in a higher value.
Where the recoverable amount of a cash-generating unit is dependent on the life of its associated orebody, expected future cash flows reflect long-term mine plans, which are based on detailed research, analysis and iterative modelling to optimise the level of return from investment, output and sequence of extraction. The mine plan takes account of all relevant characteristics of the orebody, including waste-to-ore ratios, ore grades, haul distances, chemical and metallurgical properties of the ore impacting on process recoveries and capacities of processing equipment that can be used. The life-of-mine plan is therefore the basis for forecasting production output and production costs in each future year.
Forecast cash flows for ore reserve estimation for JORC purposes are generally based on Rio Tinto’s commodity price forecasts, which assume short-term market prices will revert to the Group’s assessment of the long-term price, generally over a period of three to five years. For most commodities, these forecast commodity prices are derived from a combination of analyses of the marginal costs of the producers and of the incentive price of these commodities. These assessments often differ from current price levels and are updated periodically. The Group does not believe that published medium and long-term forward prices provide a good indication of future levels because they tend to be strongly influenced by spot prices. These price forecasts are also used for impairment testing unless management deems that in certain economic environments, a market participant would not assign Rio Tinto’s view on prices, in which case management estimates the assumptions that a market participant would be expected to use.
In some cases, prices applying to some part of the future sales volumes of a cash-generating unit are predetermined by existing sales contracts. The effects of such contracts are taken into account in forecasting future cash flows.
The discount rates applied to the future cash flow forecasts represent an estimate of the rate the market would apply having regard to the time value of money and the risks specific to the asset for which the future cash flow estimates have not been adjusted. The Group’s weighted average cost of capital is used as a starting point for determining the discount rates, with appropriate adjustments for the risk profile of the countries in which the individual cash-generating units operate. For final feasibility studies and ore reserve estimation, internal hurdle rates, which are generally higher than the weighted average cost of capital, are used.
For operations with a functional currency other than the US dollar, the impairment review is undertaken in the relevant functional currency. The great majority of the Group’s sales are based on prices denominated in US dollars. To the extent that the currencies of countries in which the Group produces commodities strengthen against the US dollar without commodity price offset, cash flows and, therefore, net present values are reduced.
In estimating FVLCD, a forecast of the long-term exchange rates for the Australian and Canadian dollars is made having regard to spot exchange rates, historical data and external forecasts, and is linked to price assumptions. Management considers that over the long term, there is a tendency for movements in commodity prices to compensate to some extent for movements in the value of the US dollar (and vice versa). However, such compensating changes are not synchronised and do not fully offset each other.
IAS 36 requires that value in use be based on exchange rates current at the time of the assessment.
Non-current assets (excluding goodwill) that have suffered impairment are reviewed whenever events or changes in circumstances indicate that the impairment loss may no longer exist, or may have decreased. If appropriate an impairment reversal will be recognised.
An onerous contract is defined under IAS 37 “Provisions, Contingent Liabilities and Contingent Assets” as a contract under which the unavoidable costs of meeting the obligations under the contract exceed the economic benefits expected to be received under it. However, no provision is required provided that the assets dedicated to the contract, which may be the wider cash-generating unit of which the business unit forms part, are not fully impaired.
(j) Determination of ore reserve estimates
The Group estimates its ore reserves and mineralisation based on information compiled by Competent Persons as defined in accordance with the Australasian Code for Reporting of Exploration Results, Mineral Resources and Ore Reserves of December 2012 (the JORC code). Ore reserves and, for certain mines, other mineralisation determined in this way are used in the calculation of depreciation, amortisation and impairment charges and for forecasting the timing of the payment of close-down and restoration costs and environmental costs.
The depreciation and impairment policy above notes instances in which mineralised material is taken into account for accounting purposes. In addition, value may be attributed to mineralised material in purchase price allocations undertaken for the purposes of business combination accounting.
For the purposes of disclosure with this combined Annual report on Form 20-F estimates of ore reserves have been computed in accordance with the SEC’s Industry Guide 7, rather than in accordance with the JORC code, and are shown on pages 215 to 224. Ore reserves presented in accordance with SEC Industry Guide 7 do not exceed the quantities that, it is estimated, could be extracted economically if future prices were to be in line with the average of historical prices for the three years to 30 June 2013, or contracted prices where applicable. For this purpose, contracted prices are applied only to future sales volumes for which the price is predetermined by an existing contract; and the average of historical prices is applied to expected sales volumes in excess of such amounts. Moreover, reported ore reserve estimates have not been increased above the levels expected to be economic based on Rio Tinto’s own long term price assumptions. Therefore, a reduction in commodity prices from the three year average historical price levels would not necessarily give rise to a reduction in reported ore reserves.
(k) Close-down, restoration and environmental obligations
The Group has provisions for close-down and restoration costs which include the dismantling and demolition of infrastructure and the removal of residual materials and remediation of disturbed areas for the mines and certain refineries and smelters.
Close-down and restoration costs are a normal consequence of mining or production, and the majority of close-down and restoration expenditure is incurred at the end of the life of the mine, refinery or smelter. Although the ultimate cost to be incurred is uncertain, the Group’s businesses estimate their costs based on feasibility and engineering studies using current restoration standards and techniques.
| | | | |
| | 125 riotinto.com/reportingcentre2013 | | |
Notes to the 2013 financial statements continued
| 1 | Principal accounting policies continued |
Close-down and restoration costs are provided for in the accounting period when the obligation arising from the related disturbance occurs, based on the net present value of estimated future costs with, where appropriate, probability weighting of the different remediation, closure or other activities required to achieve relinquishment. This may occur during development or during the production phase of a facility.
Provisions for close-down and restoration costs do not include any additional obligations which are expected to arise from future disturbance. The costs are estimated on the basis of a closure plan, and are updated annually during the life of the operation to reflect known developments, eg revisions to cost estimates and to the estimated lives of operations. The estimates are subject to formal review at regular intervals.
The initial close-down and restoration provision is capitalised within “Property, plant and equipment”. Subsequent movements in the close-down and restoration provisions, including those resulting from new disturbance, updated cost estimates, changes to the estimated lives of operations and revisions to discount rates are also capitalised within “Property, plant and equipment”. These costs are then depreciated over the lives of the assets to which they relate.
The amortisation or “unwinding” of the discount applied in establishing the net present value of provisions is charged to the income statement in each accounting period. The amortisation of the discount is shown within “Finance items” in the income statement.
Where rehabilitation is conducted systematically over the life of the operation, rather than at the time of closure, provision is made for the estimated outstanding continuous rehabilitation work at each statement of financial position date and the cost is charged to the income statement.
Environmental costs result from environmental damage that was not a necessary consequence of operations, and may include remediation, compensation and penalties. Provision is made for the estimated present value of such costs at the statement of financial position date. These costs are charged to “Net operating costs”, except for the unwinding of the discount which is shown within “Finance items”.
Remediation procedures may commence soon after the time the disturbance, remediation process and estimated remediation costs become known, but can continue for many years depending on the nature of the disturbance and the remediation techniques used.
(l) Inventories
Inventories are valued at the lower of cost and net realisable value, primarily on a weighted average cost basis. Average costs are calculated by reference to the cost levels experienced in the relevant month together with those in opening inventory. The cost of raw materials and consumable stores is the purchase price. The cost of partly-processed and saleable products is generally the cost of production, including:
| – | labour costs, materials and contractor expenses which are directly attributable to the extraction and processing of ore and the production of alumina and aluminium; |
| – | the depreciation of mining properties and leases and of property, plant and equipment used in the extraction and processing of ore and the production of alumina and aluminium; and |
Work in progress includes ore stockpiles and other partly processed material. Stockpiles represent ore that has been extracted and is available for further processing. If there is significant uncertainty as to when the stockpiled ore will be processed, the ore is expensed as mined. Where the future processing of this ore can be predicted with confidence, eg because it exceeds the mine’s cut-off grade, it is valued at the lower of cost and net realisable value. If the ore will not be processed within the 12 months after the statement of financial position date, it is included within non-current assets and net realisable value is calculated on a discounted cash flow basis. Quantities of stockpiled ore are assessed primarily through surveys and assays.
(m) Taxation
Current tax is the tax expected to be payable on the taxable income for the year calculated using rates that have been enacted or substantively enacted by the statement of financial position date. It includes adjustments for tax expected to be payable or recoverable in respect of previous periods.
Deferred tax is provided in respect of fair value adjustments on acquisitions. These adjustments may relate to assets such as mining rights that, in general, are not eligible for income tax allowances. Provision for deferred tax is based on the difference between the carrying value of the asset and its income tax base (which may be nil). Even where there is no income tax base, the existence of a tax base for capital gains tax purposes is not taken into account in determining the deferred tax provision for the mining rights because it is expected that the carrying amount will be recovered primarily through use of the rights and not from disposal.
(n) Post-employment benefits
The Group operates a number of defined benefit plans which provide lump sums, pensions, medical benefits and life insurance to retirees. For post-retirement defined benefit plans, the difference between the fair value of any plan assets and the present value of the plan obligations is recognised as an asset or liability in the statement of financial position.
Where appropriate, the recognition of assets may be restricted to the present value of any amounts the Group expects to recover by way of refunds from the plan or reductions in future contributions.
Actuarial gains and losses arising in the year are credited/charged to the statement of comprehensive income and comprise the effects of changes in actuarial assumptions and experience adjustments due to differences between the previous actuarial assumptions and what has actually occurred. In particular, the difference between the interest income and the actual return on plan assets is recognised in the statement of comprehensive income.
Other movements in the net surplus or deficit, which include the current service cost, any past service cost and the effect of any curtailment or settlements, are recognised in the income statement. The interest cost less interest income on assets held in the plans is also charged to the income statement. All amounts charged to the income statement in respect of these plans are included within “Net operating costs” or in “Share of profit after tax of equity accounted units” as appropriate.
The most significant assumptions used in accounting for pension plans are the discount rate, the inflation assumption and the mortality assumptions. The discount rate is used to determine the net present value of the obligations, the interest cost on the obligations and the interest income on plan assets. The discount rate used is the yield on high-quality corporate bonds with maturities and terms that match those of the post-retirement obligations as closely as possible. Where there is no developed corporate bond market in a country, the rate on government bonds is used. Each period, the resulting interest cost, net of the interest income on assets is charged to the Group’s income statement as the interest cost in each accounting period.
| | | | |
| | 126 riotinto.com/reportingcentre2013 | | |
The inflation assumption is used to project increases in future benefit payments for those plans that have benefits linked to inflation. The mortality assumption is used to project the future stream of benefit payments, which is then discounted to arrive at the net present value of the obligations.
Valuations of the obligations are carried out using the projected unit method which values benefits accrued at the valuation date with allowance where appropriate for future increases to pay and pensions.
The values of the obligations are assessed in accordance with the advice of independent qualified actuaries.
The Group’s contributions to defined contribution plans are charged to the income statement in the period to which the contributions relate.
(o) Cash and cash equivalents
For the purposes of the statement of financial position, cash and cash equivalents comprise: cash on hand, deposits held on call with banks, and short-term, highly-liquid investments that are readily convertible into known amounts of cash and which are subject to insignificant risk of changes in value. For the purposes of the cash flow statement, cash and cash equivalents are net of bank overdrafts that are repayable on demand. Bank overdrafts are shown as current liabilities in the statement of financial position.
(p) Financial instruments
(i) Financial assets
Classification
The Group classifies its financial assets in the following categories: at fair value through profit or loss, loans and receivables, available-for-sale and held to maturity investments. The classification depends on the purpose for which the financial assets were acquired. The Group’s policy with regard to financial risk management is set out in note 30. Generally, the Group does not acquire financial assets for the purpose of selling in the short term. When the Group enters into derivative contracts these transactions are designed to reduce exposures related to assets and liabilities, firm commitments or anticipated transactions.
Management determines the classification of financial assets at initial recognition.
(a) Financial assets at fair value through profit or loss
Derivatives, including embedded derivatives separated from the host contracts are included within financial assets at fair value through profit or loss unless they are designated as effective hedging instruments. Assets in this category are classified as current assets if expected to be settled within 12 months, otherwise they are classified as non-current.
(b) Loans and receivables
Loans and receivables comprise non-derivative financial assets with fixed or determinable payments that are not quoted in an active market. Trade receivables are included within this category; however, trade receivables subject to provisional pricing are valued as explained in note 1(c) Sales revenue.
(c) Held to maturity
Held-to-maturity investments are non-derivative financial assets with fixed or determinable payments and fixed maturity that the Group has the intention and ability to hold to maturity. Assets in this category are classified as Other investments and are classified as current assets or non-current assets based on their maturity.
(d) Available-for-sale financial assets
Available-for-sale financial assets are non-derivative financial assets that are either designated as available-for-sale or not classified in any of the other categories. They are included in non-current assets unless the Group intends to dispose of the assets within 12 months of the statement of financial position date or the asset matures within 12 months.
Recognition and measurement
Regular purchases and sales of financial assets are recognised on the trade-date, being the date on which the Group commits to purchase or sell the asset. All financial assets not carried at fair value through profit or loss are initially recognised at fair value plus transaction costs. Financial assets carried at fair value through profit or loss are initially recognised at fair value, and transaction costs are expensed in the income statement. Financial assets are de-recognised when the rights to receive cash flows from the assets have expired or have been transferred and the Group has transferred substantially all risks and rewards of ownership. Available-for-sale financial assets and financial assets at fair value through profit or loss are subsequently carried at fair value. Loans and receivables are subsequently carried at amortised cost using the effective interest method.
Derivatives that do not qualify for hedge accounting are marked to market at the statement of financial position date. Derivatives embedded in host contracts are treated as separate derivatives when their risks and characteristics are not closely related to their host contracts. In some cases, the embedded derivatives may be designated as hedges and accounted for as described above.
Fair value is the price that would be received to sell an asset or paid to transfer a liability in an orderly transaction between market participants at the measurement date. Where relevant market prices are available, these have been used to determine fair values, adjusted where necessary for market liquidity, bid/offer spreads and credit considerations. In other cases, fair values have been calculated using quotations from independent financial institutions, or by using valuation techniques consistent with general market practice applicable to the instrument.
The fair values of cash, short-term borrowings and loans to joint ventures and associates approximate to their carrying values, as a result of their short maturity or because they carry floating rates of interest. The fair values of the various derivative instruments used for hedging purposes are disclosed in note 30. Movements on the hedging reserve are disclosed within
note 29.
Offsetting financial instruments
Financial assets and liabilities are offset and the net amount reported in the statement of financial position when there is a legally enforceable right to offset the recognised amounts and there is an intention to settle on a net basis or realise the asset and settle the liability simultaneously.
| | | | |
| | 127 riotinto.com/reportingcentre2013 | | |
Notes to the 2013 financial statements continued
| 1 | Principal accounting policies continued |
Impairment of financial assets
The Group assesses at each statement of financial position date whether there is objective evidence that a financial asset or a group of financial assets is impaired. If impairment is identified for a financial asset carried at amortised cost the carrying amount of the asset is reduced through the use of an allowance account and the loss is recognised in the income statement.
In the case of equity securities classified as available-for-sale, an evaluation is made as to whether a decline in fair value is “significant” or “prolonged” based on an analysis of indicators such as significant adverse changes in the technological, market, economic or legal environment in which the company invested in operates. If such evidence exists for available-for-sale financial assets, the cumulative loss, measured as the difference between acquisition cost and the current fair value, less any impairment loss previously recognised in the income statement is removed from equity and recognised in the income statement.
(ii) Financial liabilities
Borrowings and other financial liabilities (including trade payables but excluding derivative liabilities) are recognised initially at fair value, net of transaction costs incurred, and are subsequently stated at amortised cost.
Any difference between the amounts originally received for borrowings and other financial liabilities (net of transaction costs) and the redemption value is recognised in the income statement over the period to maturity using the effective interest method.
The fair values of medium and long-term borrowings are calculated as the present value of the estimated future cash flows using quoted prices in active markets or an appropriate market based yield curve. The carrying value of the borrowings is amortised cost.
Where an existing financial liability is replaced by another from the same lender on substantially different terms, or the terms of an existing liability are substantially modified, such an exchange or modification is treated as a de-recognition of the original liability and the recognition of a new liability, and the difference in the respective carrying amounts is recognised in the income statement.
(iii) Derivative financial instruments and hedging activities
Derivatives are initially recognised at their fair value on the date the derivative contract is entered into and transaction costs are expensed in the income statement. They are subsequently re-measured to fair value at each statement of financial position date. The method of recognising the resulting gain or loss depends on whether or not the derivative is designated as a hedging instrument and, if so, the nature of the item being hedged. The Group designates certain derivatives as either; hedges of the fair value of recognised assets or liabilities or of firm commitments (fair value hedges) or, hedges of a particular risk associated with a recognised asset or liability or of a highly probable forecast transaction (cash flow hedges).
Fair value hedges: Changes in the fair value of derivatives that are designated and qualify as fair value hedges are recorded in the income statement, together with any changes in the fair value of the hedged asset or liability or firm commitment that is attributable to the hedged risk.
When a fair value interest rate hedging instrument expires or is sold, or when a fair value interest rate hedge no longer meets the criteria for hedge accounting, the fair value adjustments which have been made to the hedged item are amortised through the income statement over the remaining life of the hedged item or written off immediately where the hedged item is de-recognised.
Cash flow hedges: The effective portion of changes in the fair value of derivatives that are designated and qualify as cash flow hedges is recognised in other comprehensive income. The gain or loss relating to the ineffective portion is recognised immediately in the income statement. Amounts accumulated in equity are recycled in the income statement in the period when the hedged item affects profit or loss, for example when the forecast sale that is being hedged takes place. When the forecast transaction that is being hedged results in the recognition of a non-financial asset the gains and losses previously deferred in equity are transferred from equity and adjust the cost of the asset. The gains and losses are recognised subsequently in the income statement when the non-financial asset is amortised or sold.
When a cash flow hedging instrument expires or is sold, or when a cash flow hedge no longer meets the criteria for hedge accounting, although the forecast transaction is still expected to occur, any cumulative gain or loss relating to the instrument which is held in equity at that time remains in equity and is recognised when the forecast transaction is ultimately recognised in the income statement. When a forecast transaction is no longer expected to occur, the cumulative gain or loss that is held in equity is immediately transferred to the income statement.
(q) Share-based payments
The Group’s equity-settled share plans are settled either by: the issue of shares by the relevant parent company, the purchase of shares on market, or the use of shares previously acquired as part of a share buy-back. The fair value of the share plans is recognised as an expense over the expected vesting period with a corresponding entry to retained earnings for Rio Tinto plc plans and to other reserves for Rio Tinto Limited plans.
If the cost of shares acquired to satisfy the plans exceeds the expense charged, the excess is taken to retained earnings or other reserves as appropriate. The fair value of the share plans is determined at the date of grant, taking into account any market-based vesting conditions attached to the award.
The Group uses fair values provided by independent actuaries calculated using either a lattice-based option valuation model or a Monte Carlo simulation model.
Non-market-based vesting conditions (eg earnings per share targets) are taken into account in estimating the number of awards likely to vest. The estimate of the number of awards likely to vest is reviewed at each statement of financial position date up to the vesting date, at which point the estimate is adjusted to reflect the actual awards issued. No adjustment is made after the vesting date even if the awards are forfeited or not exercised.
The terms of each plan are considered at the statement of financial position date. The Group no longer operates any plans as cash-settled. However the Performance Share Plan can, at the discretion of the directors, offer employees an equivalent amount in cash. This is not standard practice. In some jurisdictions, employees are granted cash-settled awards where equity-settled awards are prohibited by local laws and regulations. The value of these awards is immaterial. Further information about the treatment of individual share-based payment plans is provided in note 44.
| | | | |
| | 128 riotinto.com/reportingcentre2013 | | |
(r) Share capital
Ordinary shares are classified as equity. Incremental costs directly attributable to the issuance of new shares are shown in equity as a deduction, net of tax, from the proceeds.
Where any Group company purchases the Group’s equity share capital (treasury shares), the consideration paid, including any directly attributable incremental costs (net of income taxes) is deducted from equity attributable to owners of Rio Tinto. Where such shares are subsequently reissued, any consideration received, net of any directly-attributable incremental transaction costs and the related income tax effects, is included in equity attributable to owners of Rio Tinto.
(s) Segment reporting
Operating segments are reported in a manner consistent with the internal reporting provided to the chief operating decision maker (CODM). The CODM, who is responsible for allocating resources and assessing performance of the operating segments, has been identified as Rio Tinto’s chief executive.
Critical accounting policies and estimates
(i) Dual listed companies reporting
As described in the “Outline of dual listed companies structure and basis of financial statements”, the consolidated financial statements of the Rio Tinto Group deal with the results, assets and liabilities of both of the dual listed companies, Rio Tinto plc and Rio Tinto Limited, and their subsidiaries. Rio Tinto plc and Rio Tinto Limited are viewed as a single parent company with their respective shareholders being the shareholders in that single company.
The 2013 Annual report satisfies the obligations of Rio Tinto Limited to prepare consolidated accounts under Australian company law, as amended by an order issued by the Australian Securities and Investments Commission on 22 December 2010 (as amended on 17 February 2012). The 2013 financial statements disclose the effect of the adjustments to the Group’s consolidated profit/(loss), consolidated total comprehensive income/(loss) and consolidated shareholders’ funds as prepared under IFRS that would be required under the version of IFRS that is applicable in Australia, referred to as Australian Accounting Standards (AAS).
The US dollar is the presentation currency used in these financial statements, as it most reliably reflects the Group’s global business performance.
(ii) Acquisitions
The determination of the fair values of net identifiable assets acquired, and of any goodwill, involves significant judgment. This is particularly the case when the acquisition involves little or no cash, for example when the Group gains control of a company in stages or for shares. The allocation of fair value between intangible assets, and the tangible assets with which they are used, is also judgmental. The Group engages third-party valuers to advise on the purchase price allocation for significant acquisitions.
(iii) Impairment review of asset carrying values
Events or changes in circumstances can give rise to significant impairment charges or reversals of impairment.
Estimates in respect of the timing of project expansions and the cost to complete asset construction are critical to determining the recoverable amounts for cash-generating units.
Where the recoverable amounts of the Group’s cash-generating units are assessed by analyses of discounted cash flows, the resulting valuations are also sensitive to changes in estimates of long-term commodity prices, exchange rates, operating costs and discount rates.
Note 6 outlines the significant judgments and assumptions made in measuring the impairments recorded and notes 12 and 13 outline judgments in relation to the testing of cash-generating units containing goodwill and indefinite-lived intangible assets respectively.
(iv) Estimation of asset lives and determination of ore reserve estimates
Intangible assets are considered to have indefinite lives when, based on an analysis of all of the relevant factors, there is no foreseeable limit to the period over which the asset is expected to generate cash flows for the Group. The factors considered in making this determination include the existence of contractual rights for unlimited terms; or evidence that renewal of the contractual rights without significant incremental cost can be expected for indefinite periods into the future in view of the Group’s investment intentions.
Rio Tinto estimates its ore reserves and mineralisation based on information compiled by Competent Persons as defined in accordance with the Australasian code for Reporting of Exploration Results, Mineral Resources and Ore Reserves of December 2012 (the ‘JORC code’). The amounts presented under IFRS and AAS are based on the ore reserves, and in some cases mineralised material, determined under the JORC code.
For the purposes of disclosure with this combined Annual report on Form 20-F estimates of ore reserves have been computed in accordance with the SEC’s Industry Guide 7, rather than in accordance with the JORC code, and are shown on pages 215 to 224. Ore reserves presented in accordance with SEC Industry Guide 7 do not exceed the quantities that, it is estimated, could be extracted economically if future prices were to be in line with the average of historical prices for the three years to 30 June 2013, or contracted prices where applicable. For this purpose, contracted prices are applied only to future sales volumes for which the price is predetermined by an existing contract; and the average of historical prices is applied to expected sales volumes in excess of such amounts. Moreover, reported ore reserve estimates have not been increased above the levels expected to be economic based on Rio Tinto’s own long term price assumptions. Therefore, a reduction in commodity prices from the three year average historical price levels would not necessarily give rise to a reduction in reported ore reserves.
The estimation of ore reserves requires judgment to interpret available geological data and then to select an appropriate mining method and establish an extraction schedule. It also requires assumptions about future commodity prices, exchange rates, production costs, recovery rates and discount rates and, in some instances, the renewal of mining licenses.
There are numerous uncertainties inherent in estimating ore reserves; consequently assumptions that are valid at the time of estimation may change significantly when new information becomes available.
New geological data, as well as changes in the above assumptions, may change the economic status of ore reserves, and may ultimately result in their restatement. Such changes in ore reserves could have an impact on: depreciation and amortisation rates; the carrying values of intangible assets and property, plant and equipment; deferred stripping calculations; and provisions for close-down and restoration costs.
(v) Close-down, restoration and environmental obligations
Provision is made for close-down, restoration and environmental costs when the obligation occurs, based on the net present value of estimated future costs with, where appropriate, probability weighting of the different remediation, closure or other activities required to achieve relinquishment. The ultimate cost of close-down and restoration is uncertain and management uses its judgment and experience to provide for these costs over the life of the operations. Cost estimates can vary in response to many factors including: changes to the relevant legal or local/national government ownership requirements or the Group’s closure and environmental policies; review of remediation and relinquishment options; the emergence of new restoration techniques; the timing of the expenditures and the effects of inflation. Experience gained at other mine or production sites is also a significant consideration.
| | | | |
| | 129 riotinto.com/reportingcentre2013 | | |
Notes to the 2013 financial statements continued
| 1 | Principal accounting policies continued |
Cost estimates are updated throughout the life of the operation. The accuracy range for operations with a remaining life of ten to 40 years is +/-30 per cent. For operations with a remaining life of five to ten years, the accuracy range is +/-20 per cent. Five years prior to the estimated date of closure, operations must produce a full decommissioning plan with an accuracy range of +/-15 per cent.
The expected timing of expenditure included in cost estimates can also change, for example in response to changes to expectations relating to ore reserves, production rates, operating licence or economic conditions. Expenditure may occur before and after closure and can continue for an extended period of time depending on the specific site requirements. Some expenditure can continue into perpetuity.
Cash flows must be discounted if this has a material effect. The selection of appropriate sources on which to base the calculation of the risk-free discount rate used for such obligations also requires judgment.
As a result of all of the above factors, there could be significant adjustments to the provision for close-down, restoration and environmental costs which would affect future financial results. Increases and decreases in environmental obligations are charged directly to the income statement. Increases and decreases in close-down obligations are capitalised for operating businesses. An increase in close-down and restoration provisions would increase the unwind of the discount and depreciation charges in the income statement in future years and increase the carrying value of property, plant and equipment potentially impacting any future impairment charges or reversals.
(vi) Deferral of stripping costs
Stripping of waste materials takes place throughout the production phase of a surface mine or pit. The identification of components within a mine and of life of component strip ratios is a function of an individual mine’s design. Changes to that design may introduce new components and/or change the life of component strip ratios. Changes in other technical or economic parameters that impact on ore reserves may also have an impact on the life of component ratios even if they do not affect the mine’s design. Changes to the life of component ratios are accounted for prospectively.
The Group’s determination of whether multiple pit mines are considered separate or integrated operations determines whether initial stripping of a pit is deemed to be pre-production or production phase stripping and therefore the accounting treatment of those costs. The determination depends on each mine’s specific circumstances and the analysis requires judgment; another mining company could make a different determination even where the fact pattern appears to be similar.
At 31 December 2013, the net book value of capitalised production phase stripping costs totalled US$1.3 billion, with US$0.9 billion within Property, plant and equipment and a further US$0.4 billion within Investments in Equity Accounted Units (2012 total of US$1.5 billion with US$1.2 billion in Property, plant and equipment and a further US$0.3 billion within Investment in Equity Accounted Units).
The main movements in capitalised production phase stripping costs during 2013 were capitalisation of US$0.5 billion primarily related to the push-backs of the pit walls at Kennecott Utah Copper (KUC) and Escondida, a transfer of US$0.2 billion to assets held for sale relating to Clermont and a US$0.4 billion write off relating to KUC as a result of the pit wall slide in April.
(vii) Recognition of deferred tax liabilities on mining rights recognised in acquisitions
Deferred tax is provided in respect of fair value adjustments on acquisitions. These adjustments may relate to assets such as mining rights that, in general, are not eligible for income tax allowances. Provision for deferred tax is based on the difference between the carrying value of the asset and its income tax base (which may be nil). Even where there is no income tax base, the existence of a tax base for capital gains tax purposes is not taken into account in determining the deferred tax liability for the mining rights because it is expected that the carrying amount will be recovered primarily through use of the rights and not from disposal. For acquisitions after 1 January 2004, such a deferred tax liability on acquisition results in a consequential increase in the amounts attributed to goodwill. For acquisitions prior to 1 January 2004, such deferred tax was recognised in equity on transition to IFRS. Amounts attributed to goodwill for business combinations in 2012 and 2013 are shown in note 37.
(viii) Capitalisation of exploration and evaluation costs and other costs prior to the decision to mine/construct
Under the Group’s accounting policy, exploration expenditure is not capitalised. Evaluation expenditure is capitalised when there is a high degree of confidence that the Group will determine that a project is commercially viable and therefore it is considered probable that future economic benefits will flow to the Group.
A project’s commercial viability is determined based on whether it will provide a satisfactory return relative to the perceived risks of the project. Once a project’s commercial viability has been established, the Group will decide, at the appropriate authorisation level, whether to approve the decision to mine. The appropriate authorisation level within the Group is the Rio Tinto Investment Committee and the board where appropriate. In determining whether to approve a project, the Investment Committee reviews the ore reserves estimate together with analyses regarding the net present value of the project and sensitivity analyses around key assumptions.
There are occasions when the Group concludes that the asset recognition criteria are met at an earlier stage than approval to mine. In these cases, evaluation expenditure is capitalised if there is a high degree of confidence that the Group will determine the project is commercially viable. The Group’s view is that a high degree of confidence is greater than “more likely than not” (that is greater than 50 per cent certainty) and less than “virtually certain” (that is less than 90 per cent certainty). Determining whether there is a high degree of confidence that the Group will determine that an evaluation project is commercially viable requires a significant degree of judgment and assessment of all relevant factors such as the nature and objective of the project; the project’s current stage; project timeline; current estimates of the project’s net present value including sensitivity analyses around key assumptions; and the main risks of the project. Development expenditure incurred prior to the decision to mine is subject to the same criteria for capitalisation, being a high degree of confidence that the Group will determine that a project is commercially viable.
In accordance with IFRS 6 “Exploration for and Evaluation of Mineral Resources”, the criteria for the capitalisation of exploration and evaluation costs is applied consistently from period to period.
Subsequent recovery of the resulting carrying value depends on successful development or sale of the undeveloped project. If a project does not prove viable, all irrecoverable costs associated with the project net of any related impairment provisions are charged to the income statement. At 31 December 2013, a total of US$2.3 billion had been capitalised comprising: evaluation costs (US$1.9 billion) and US$0.4 billion of early works expenditure within property, plant and equipment (31 December 2012: a total of US$2.1 billion).
| | | | |
| | 130 riotinto.com/reportingcentre2013 | | |
(ix) Identification of functional currencies
The functional currency for each entity in the Group, and for equity accounted units, is the currency of the primary economic environment in which it operates. Determination of functional currency involves significant judgment and other mining companies may make different judgments based on similar facts. For many of Rio Tinto’s entities, their functional currency is the currency of the country in which they operate. The Group reconsiders the functional currency of its entities if there is a change in the underlying transactions, events and conditions which determine their primary economic environment.
The determination of functional currency affects the carrying value of non-current assets included in the statement of financial position and, as a consequence, the amortisation of those assets included in the income statement. It also impacts exchange gains and losses included in the income statement and in equity.
(x) Estimation of obligations for post-employment costs
The value of the Group’s obligations for post-retirement benefits is dependent on the amount of benefits to be paid out and is discounted to the balance sheet date. This amount will vary depending on the assumptions made about the future pay increases received by members of final pay plans, the level of inflation (for those benefits that are subject to some form of inflation protection), the number of individuals and how long individuals live in retirement. Plan assets are measured at fair value, which is the price that would be received to sell an asset in an orderly transaction between market participants at the measurement date.
Most of the Group’s defined benefit pension plans are closed to new entrants and the majority of the obligations relate to former employees. As a consequence, the carrying value of the Group’s post-retirement obligations is less sensitive to assumptions about future salary increases than it is to assumptions regarding future inflation. The assumption regarding future inflation is based on market yields on inflation-linked instruments where possible, combined with consensus views on future inflation, and is derived using the same process at each reporting date. Changes to the assumption therefore reflect changes to the market and consensus views of future inflation.
The Group reviews the actual mortality rates of retirees in its major pension plans on a regular basis and uses these rates to set its current mortality assumptions. It also allows for future improvements in mortality having regard to standard improvement scales in each country.
The discount rate used to value post-retirement obligations is based upon the yields on high quality corporate bonds in the relevant currency and which have durations consistent with the nature of the obligations. The discount rate will vary from one period to another in line with movements in corporate bond yields, but at any given measurement date there is relatively little estimation uncertainty. This rate is also used to calculate the interest cost on obligations and interest income on plan assets.
Details of the key assumptions, how they have moved since the previous statement of financial position date and the sensitivity of the carrying value to changes in the assumptions, are set out in note 45.
For 2013, the charge against income for post-retirement benefits net of tax and non-controlling interests was US$558 million. This charge included both pension and post-retirement healthcare benefits. The charge is net of interest income of US$410 million after tax and non-controlling interests.
The average future increase in compensation levels was assumed to be 3.4 per cent in 2013 and will be 3.6 per cent for 2014. The average discount rate used was 3.9 per cent in 2013 and will be 4.4 per cent in 2014 reflecting the net impact of changes in corporate bond yields in the regions where the Group has pension obligations.
Based on the known changes in assumptions noted above and other expected circumstances, the expected impact of post-retirement costs on the Group’s IFRS net earnings in 2014 would be US$93 million less than in 2013. The actual charge may be impacted by other factors that cannot be predicted, such as the effect of changes in benefits, number of employees and exchange rates.
The table below sets out the potential change in the Group’s 2013 net earnings (after tax and non-controlling interests) that would result from hypothetical changes to post-retirement assumptions and estimates. The sensitivities are viewed for each assumption in isolation although a change in one assumption is likely to result in some offset elsewhere. The figures in the table only show the impact on underlying and net earnings. Changing the assumptions would also have an impact on the statement of financial position.
| | | | |
| | | US$ million | |
Sensitivity of the Group’s 2013 underlying and net earnings to changes in: | | | | |
Discount rate | | | | |
increase of 0.5 percentage points | | | 38 | |
decrease of 0.5 percentage points | | | (33 | ) |
Inflation | | | | |
increase of 0.5 percentage points | | | (34 | ) |
decrease of 0.5 percentage points | | | 32 | |
Salary increases | | | | |
increase of 0.5 percentage points | | | (10 | ) |
decrease of 0.5 percentage points | | | 10 | |
Demographic – allowance for additional future mortality improvements | | | | |
participants assumed to have the mortality rates of individuals who are one year older | | | 15 | |
participants assumed to have the mortality rates of individuals who are one year younger | | | (15 | ) |
(xi) Recoverability of potential deferred tax assets
The Group has tax losses, and other deductible temporary differences, mainly in UK, French, Canadian, US and Australian taxable entities that have the potential to reduce tax payments in future years. Deferred tax assets have been recognised to the extent that their recovery is probable, having regard to the projected future taxable income of these taxable entities and after taking account of specific risk factors that affect the recovery of these assets.
| | | | |
| | 131 riotinto.com/reportingcentre2013 | | |
Notes to the 2013 financial statements continued
| 1 | Principal accounting policies continued |
Recognised and unrecognised deferred tax assets are shown in the table below and totalled US$17,755 million at 31 December 2013 (2012: US$18,630 million). Of this total, US$3,555 million has been recognised as deferred tax assets (2012: US$3,476 million), leaving US$14,200 million (2012: US$15,154 million) unrecognised, as recovery is not considered probable.
The recognised amounts do not include deferred tax assets that have been offset against recognised deferred tax liabilities.
| | | | | | | | | | | | | | | | |
| US$ million | | Recognised | | | Unrecognised | |
| At 31 December | | 2013 | | | 2012 | | | 2013 | | | 2012 | |
UK | | | 104 | | | | 212 | | | | 215 | | | | 235 | |
France(a) | | | 444 | | | | 499 | | | | 1,339 | | | | 1,034 | |
Canada | | | 297 | | | | 49 | | | | 181 | | | | 136 | |
US | | | 560 | | | | 459 | | | | 16 | | | | 17 | |
Australia(b) | | | 1,880 | | | | 2,134 | | | | 11,000 | | | | 12,913 | |
Other | | | 270 | | | | 123 | | | | 1,449 | | | | 819 | |
Total | | | 3,555 | | | | 3,476 | | | | 14,200 | | | | 15,154 | |
| (a) | The amount recognised takes account of legislation which restricts the recovery of losses. |
| (b) | The recognised and unrecognised amounts include temporary differences that are deductible for the purposes of Mineral Resources Rent Tax (MRRT). |
(xii) Contingencies
Disclosure is made of material contingent liabilities unless the possibility of any loss arising is considered remote. Contingencies are disclosed in
note 31.
(xiii) Basis of consolidation
Judgment is sometimes required to determine whether the Group has control, joint control or significant influence over an entity. These judgments are set out in notes 33 to 36.
In some cases, the Group makes acquisitions over a period of days, weeks or months. It is a matter of judgment as to whether the payments made during this period form part of one transaction or a number of separate transactions. In the latter case, the transactions will be treated as an acquisition in stages. The effect on the financial statements of treatment as an acquisition in stages is that any excess of consideration over identifiable net assets for transactions after control has been gained will be recorded as a reduction in equity. If the transactions were treated as one acquisition then all such excess consideration would be treated as goodwill. In addition, acquisitions of shares after the date on which control is gained and which are accounted for as an acquisition in stages are shown within “Financing activities” in the cash flow statement rather than in “Investing activities”.
Factors which are considered in this judgment are the length of time between the acquisition date and completion of the transaction and whether, at the time of the initial share purchase, it was clear what percentage ownership would ultimately be obtained.
| | | | |
| | 132 riotinto.com/reportingcentre2013 | | |
| | | | | | | | | | | | |
| Sales revenue(a) | | 2013
US$m | | | Restated 2012 US$m | | | Restated 2011 US$m | |
Iron Ore | | | 25,994 | | | | 24,279 | | | | 29,475 | |
Aluminium | | | 12,463 | | | | 12,170 | | | | 14,422 | |
Copper | | | 5,916 | | | | 6,661 | | | | 7,634 | |
Energy | | | 5,454 | | | | 6,062 | | | | 7,045 | |
Diamonds & Minerals | | | 4,193 | | | | 4,056 | | | | 3,654 | |
Other operations | | | 1,761 | | | | 3,898 | | | | 5,149 | |
Reportable segments total | | | 55,781 | | | | 57,126 | | | | 67,379 | |
Inter-segment transactions | | | (1,182 | ) | | | (1,560 | ) | | | (2,025 | ) |
Product Group Total | | | 54,599 | | | | 55,566 | | | | 65,354 | |
Items excluded from Underlying earnings | | | (24 | ) | | | 31 | | | | (56 | ) |
Less share of equity accounted units’ sales revenue | | | (3,404 | ) | | | (4,655 | ) | | | (4,769 | ) |
Consolidated sales revenue | | | 51,171 | | | | 50,942 | | | | 60,529 | |
| | | |
Depreciation and amortisation(b) | | | | | | | | | | | | |
Iron Ore | | | 1,627 | | | | 1,485 | | | | 1,168 | |
Aluminium | | | 1,151 | | | | 1,287 | | | | 1,388 | |
Copper | | | 962 | | | | 794 | | | | 573 | |
Energy | | | 766 | | | | 770 | | | | 520 | |
Diamonds & Minerals | | | 513 | | | | 421 | | | | 367 | |
Other operations | | | 67 | | | | 214 | | | | 245 | |
Reportable segments total | | | 5,086 | | | | 4,971 | | | | 4,261 | |
Other items | | | 106 | | | | 113 | | | | 114 | |
Less: depreciation and amortisation of equity accounted units | | | (401 | ) | | | (460 | ) | | | (403 | ) |
Depreciation and amortisation per note 4 | | | 4,791 | | | | 4,624 | | | | 3,972 | |
| | | |
Underlying earnings(c) | | | | | | | | | | | | |
Iron Ore | | | 9,858 | | | | 9,247 | | | | 13,268 | |
Aluminium | | | 557 | | | | 54 | | | | 610 | |
Copper | | | 821 | | | | 1,059 | | | | 2,013 | |
Energy | | | 33 | | | | 309 | | | | 1,114 | |
Diamonds & Minerals | | | 350 | | | | 149 | | | | (159 | ) |
Other operations | | | (281 | ) | | | (582 | ) | | | (288 | ) |
Reportable segments total | | | 11,338 | | | | 10,236 | | | | 16,558 | |
Inter-segment transactions | | | (4 | ) | | | (8 | ) | | | 40 | |
Other items | | | (730 | ) | | | (750 | ) | | | (684 | ) |
Exploration and evaluation not attributed to product groups | | | (145 | ) | | | (97 | ) | | | (102 | ) |
Net finance costs | | | (242 | ) | | | (112 | ) | | | (240 | ) |
Underlying earnings | | | 10,217 | | | | 9,269 | | | | 15,572 | |
Items excluded from Underlying earnings(d) | | | (6,552 | ) | | | (12,297 | ) | | | (9,737 | ) |
Net earnings/(loss) attributable to owners of Rio Tinto per income statement | | | 3,665 | | | | (3,028 | ) | | | 5,835 | |
Tax charge | | | | | | | | | | | | |
Iron Ore | | | 5,290 | | | | 4,273 | | | | 5,942 | |
Aluminium | | | (18 | ) | | | (205 | ) | | | 187 | |
Copper | | | 236 | | | | (67 | ) | | | 651 | |
Energy | | | 12 | | | | 8 | | | | 531 | |
Diamonds & Minerals | | | 177 | | | | 84 | | | | 30 | |
Other Operations | | | (227 | ) | | | (235 | ) | | | (149 | ) |
Reportable segments total | | | 5,470 | | | | 3,858 | | | | 7,192 | |
Other items | | | (302 | ) | | | (266 | ) | | | (419 | ) |
Exploration and evaluation not attributed to product groups | | | (23 | ) | | | (26 | ) | | | (28 | ) |
Net finance costs | | | (77 | ) | | | (81 | ) | | | (138 | ) |
| | | 5,068 | | | | 3,485 | | | | 6,607 | |
Tax credit excluded from Underlying earnings(d) | | | (2,642 | ) | | | (2,896 | ) | | | (135 | ) |
Tax charge per income statement | | | 2,426 | | | | 589 | | | | 6,472 | |
| | | | |
| | 133 riotinto.com/reportingcentre2013 | | |
Notes to the 2013 financial statements continued
| 2 | Operating segments continued |
| | | | | | | | | | | | |
| | | 2013
US$m | | | Restated
2012
US$m | | | Restated
2011
US$m | |
Capital expenditure | | | | | | | | | | | | |
Iron Ore | | | 6,814 | | | | 7,152 | | | | 4,004 | |
Aluminium | | | 2,226 | | | | 2,755 | | | | 2,292 | |
Copper | | | 2,813 | | | | 4,455 | | | | 3,925 | |
Energy | | | 732 | | | | 1,877 | | | | 1,415 | |
Diamonds & Minerals | | | 1,009 | | | | 1,814 | | | | 1,392 | |
Other Operations | | | 278 | | | | 432 | | | | 394 | |
Reportable segments total | | | 13,872 | | | | 18,485 | | | | 13,422 | |
Other items | | | 145 | | | | 161 | | | | 260 | |
Less: capital expenditure of equity accounted units | | | (1,073 | ) | | | (1,071 | ) | | | (1,146 | ) |
Capital expenditure per Financial information by business units | | | 12,944 | | | | 17,575 | | | | 12,536 | |
Add: Proceeds from disposal of property, plant and equipment | | | 57 | | | | 40 | | | | 37 | |
Capital expenditure per statement of cash flow | | | 13,001 | | | | 17,615 | | | | 12,573 | |
Rio Tinto’s management structure is based on the principal product groups shown above together with the global functions that support the business. The chief executive of each product group reports to the chief executive of Rio Tinto. The chief executive of Rio Tinto monitors the performance of each product group based on a number of measures including capital expenditure and operating cash flows, with Underlying earnings being the key financial performance indicator. Finance costs and net debt are managed on a Group basis.
Generally, business units are allocated to product groups based on their primary product. The Energy product group includes both coal and uranium businesses. The Diamonds & Minerals product group includes businesses with products such as borates, salt and titanium dioxide feedstock together with diamond operations and the Simandou iron ore project, which is the responsibility of the Diamonds & Minerals product group chief executive. The Copper group includes certain gold operations in addition to copper.
The financial information by business unit provided on page 197 of these financial statements provide additional voluntary disclosure which the Group considers useful to the users of the financial statements.
(a) Sales revenue
Sales revenue includes the sales revenue of equity accounted units (after adjusting for sales to subsidiaries) of US$3,757 million (2012: US$5,067 million, 2011: US$5,239 million) in addition to consolidated sales revenue. Consolidated sales revenue includes subsidiary sales of US$353 million (2012: US$412 million, 2011: US$470 million) to equity accounted units which are not included in gross sales revenue.
Intersegment transactions relate to sales between the Aluminium Product Group and Constellium (formerly Alcan Engineered Products) and Other Aluminium operations whose results are reported within Other operations.
(b) Depreciation and amortisation
Product group depreciation and amortisation totals include 100 per cent of subsidiaries’ depreciation and amortisation and include Rio Tinto’s share of the depreciation and amortisation of equity accounted units. Rio Tinto’s share of the depreciation and amortisation charge of equity accounted units is deducted to arrive at depreciation and amortisation excluding equity accounted units as shown in note 4. These figures exclude impairment charges, which are excluded from Underlying earnings.
(c) Underlying earnings
Underlying earnings is reported by Rio Tinto to provide greater understanding of the underlying business performance of its operations and to enhance comparability of reporting periods.
The measure of Underlying earnings is used by the chief executive of Rio Tinto to assess the performance of the product groups. Underlying earnings and net earnings both represent amounts net of tax attributable to owners of Rio Tinto. The following items are excluded from Net earnings in arriving at Underlying earnings each period irrespective of materiality:
| – | Profits less losses on acquisitions/disposal of interests in businesses. |
| – | Impairment charges/reversals. |
| – | Profit/(loss) after tax from discontinued operations. |
| – | Exchange and derivative gains and losses. This exclusion includes Exchange gains/(losses) on US dollar net debt and intragroup balances, gains and losses on currency and interest rate derivatives not qualifying for hedge accounting and gains/(losses) on commodity derivatives not qualifying for hedge accounting. |
In addition, there is a final judgemental category which includes, where applicable, other credits and charges that, individually or in aggregate if of a similar type, are of a nature or size to require exclusion in order to provide additional insight into underlying business performance.
Product group earnings include earnings of subsidiaries and equity accounted units stated before finance items but after the amortisation of discount.
| | | | |
| | 134 riotinto.com/reportingcentre2013 | | |
Rio Tinto’s share of the Underlying earnings of equity accounted units amount to US$747 million in 2013 (2012: US$1,061 million; 2011: US$945 million). This amount is attributable as follows: US$777 million profit to the Copper group and US$30 million loss to other product groups (2012: US$799 million profit attributable to the Copper product group and US$262 million profit to other product groups; 2011: US$699 million profit attributable to the Copper product group and US$246 million profit to other product groups). These amounts are included in Underlying earnings of the relevant product groups and include the Underlying earnings of the Group’s tolling entities which process alumina. Tolling entities recharge the majority of their costs and generally have minimal earnings.
The copper product group’s underlying earnings in 2013 included US$131 million impairment after tax in relation to the group’s investment in Northern Dynasty Minerals Ltd following a strategic review of this shareholding by the group.
The Energy product group’s Underlying earnings in 2012 included US$258 million profit after tax in relation to the divestments of equity interest in Extract Resources and Kalahari Minerals.
(d) Reconciliation of net earnings/(losses) to Underlying earnings
| | | | | | | | | | | | | | | | | | | | | | | | |
| Exclusions from Underlying earnings | |
| Pre-tax
2013
US$m | (k)
| |
| Taxation
2013
US$m |
| |
| Non-
controlling
interests
2013
US$m |
| |
| Net amount
2013 US$m |
| |
| Restated
Net amount
2012
US$m |
| |
| Restated
Net amount
2011
US$m |
|
Impairment charges net of reversals (note 6) | | | (7,531 | ) | | | 1,547 | | | | 2,556 | | | | (3,428 | ) | | | (14,360 | ) | | | (9,290 | ) |
Net gains on disposal and consolidation of interests in businesses(e) | | | 787 | | | | 18 | | | | 42 | | | | 847 | | | | 827 | | | | 167 | |
Exchange and derivative (losses)/gains: | | | | | | | | | | | | | | | | | | | | | | | | |
– Exchange (losses)/gains on US dollar net debt and intragroup balances | | | (3,674 | ) | | | 795 | | | | (50 | ) | | | (2,929 | ) | | | 425 | | | | (157 | ) |
– Gains/(losses) on currency and interest rate derivatives not qualifying for hedge accounting | | | 30 | | | | (16 | ) | | | (12 | ) | | | 2 | | | | 59 | | | | (20 | ) |
– Gains on commodity derivatives not qualifying for hedge accounting | | | 282 | | | | (86 | ) | | | – | | | | 196 | | | | 66 | | | | 109 | |
Restructuring costs including global headcount reductions | | | (502 | ) | | | 126 | | | | 9 | | | | (367 | ) | | | (77 | ) | | | – | |
Kennecott Utah Copper(f) | | | (437 | ) | | | 154 | | | | – | | | | (283 | ) | | | – | | | | – | |
Clermont/Blair Athol(g) | | | (252 | ) | | | 79 | | | | – | | | | (173 | ) | | | – | | | | – | |
MRRT(h) | | | – | | | | – | | | | – | | | | – | | | | 1,130 | | | | – | |
Deferred tax asset write off(i) | | | – | | | | (114 | ) | | | – | | | | (114 | ) | | | (134 | ) | | | (342 | ) |
Other exclusions(j) | | | (443 | ) | | | 139 | | | | 1 | | | | (303 | ) | | | (233 | ) | | | (204 | ) |
Total excluded from Underlying earnings | | | (11,740 | ) | | | 2,642 | | | | 2,546 | | | | (6,552 | ) | | | (12,297 | ) | | | (9,737 | ) |
Net earnings/(losses) | | | 3,505 | | | | (2,426 | ) | | | 2,586 | | | | 3,665 | | | | (3,028 | ) | | | 5,835 | |
Underlying earnings | | | 15,245 | | | | (5,068 | ) | | | 40 | | | | 10,217 | | | | 9,269 | | | | 15,572 | |
| (e) | Net gains on disposal and consolidation of interests in businesses during 2013 mainly relate to the Group’s divestment of its remaining interest in Constellium (formerly Alcan Engineering Products), and the Northparkes mine. |
| | Net gains arising on the consolidation and disposal of interests in businesses for the year ended 31 December 2012 relate principally to consolidation of Richards Bay Minerals (RBM) and Turquoise Hill Resources Ltd (formerly Ivanhoe Mines Limited), and in 2011 principally to the divestment of the Group’s talc business. Refer to note 37 for additional information. |
| (f) | Kennecott Utah Copper, Bingham Canyon mine experienced a slide along a geological fault line of its north-eastern wall on 10 April 2013. Charges relating to the slide, which have been excluded from underlying earnings, primarily comprise the write off of certain deferred stripping assets and damaged equipment. Adjustments for settlement of insurance claims have been made to the amount excluded from underlying earnings, and will continue as insurance claims are settled. |
| (g) | Adjustments in relation to Clermont and Blair Athol arose following reclassification to disposal groups held for sale, and reflect contractual obligations for product sales and funding of closure activities, which will remain with the Group following completion of the divestments. Further adjustments in respect of these obligations will be combined with the net gain/loss on disposal expected to be recognised in 2014. |
| (h) | A deferred tax asset was recognised following the introduction of the Minerals Resource Rent Tax (MRRT) on 1 July 2012. |
| (i) | Deferred tax assets were written off as a result of restrictions on the utilisation of French losses introduced in 2011, to eliminate the increase in deferred tax assets following the impairment of French aluminium assets in 2012 and 2013. |
| (j) | Other credits and charges that, individually, or in aggregate, if of similar type, are of a nature or size to require exclusion in order to provide additional insight into underlying business performance. In 2013, other exclusions include adjustments relating to inventory sold by RBM during the period, which had been recognised at fair value on initial consolidation in 2012. |
| (k) | Exclusions from underlying earnings relating to equity accounted units, after tax, are included in the column ‘Pre-tax’. |
| | | | |
| | 135 riotinto.com/reportingcentre2013 | | |
Notes to the 2013 financial statements continued
| 3 | Operating segments – additional information |
| | | | | | | | | | | | | | | | | | | | | | | | |
| Sales revenue by destination(a) | | 2013 % | | | 2012 % | | | 2011 % | | | 2013 US$m | | | Restated 2012 US$m | | | Restated 2011 US$m | |
China | | | 35.4 | | | | 32.3 | | | | 30.9 | | | | 19,331 | | | | 17,948 | | | | 20,149 | |
Japan | | | 16.1 | | | | 15.8 | | | | 16.3 | | | | 8,770 | | | | 8,787 | | | | 10,671 | |
Other Asia | | | 15.2 | | | | 15.2 | | | | 15.8 | | | | 8,313 | | | | 8,464 | | | | 10,322 | |
United States of America | | | 13.1 | | | | 12.7 | | | | 13.8 | | | | 7,142 | | | | 7,085 | | | | 9,019 | |
Europe (excluding United Kingdom) | | | 10.2 | | | | 11.5 | | | | 11.6 | | | | 5,552 | | | | 6,380 | | | | 7,549 | |
Canada | | | 2.3 | | | | 3.3 | | | | 2.9 | | | | 1,276 | | | | 1,823 | | | | 1,926 | |
Australia | | | 2.0 | | | | 2.6 | | | | 2.5 | | | | 1,114 | | | | 1,420 | | | | 1,643 | |
United Kingdom | | | 1.1 | | | | 1.2 | | | | 1.4 | | | | 617 | | | | 678 | | | | 922 | |
Other | | | 4.6 | | | | 5.4 | | | | 4.8 | | | | 2,460 | | | | 3,012 | | | | 3,097 | |
Total | | | 100 | | | | 100 | | | | 100 | | | | 54,575 | | | | 55,597 | | | | 65,298 | |
Less share of equity accounted units’ sales revenue | | | | | | | | | | | | | | | (3,404 | ) | | | (4,655 | ) | | | (4,769 | ) |
Consolidated sales revenue | | | | | | | | | | | | | | | 51,171 | | | | 50,942 | | | | 60,529 | |
| (a) | Sales revenue by geographical destination are based on the ultimate country of destination of the product, if known. If the eventual destination of the product sold through traders is not known then revenue is allocated to the location of the product at the time when the risks and rewards of ownership are passed. Rio Tinto is domiciled in both the United Kingdom and Australia. |
| | | | | | | | | | | | |
Sales revenue by product Sales revenues of the Group are derived from the following products sold to external customers: | | 2013
US$m | | | Restated
2012
US$m | | | Restated
2011
US$m | |
Iron Ore | | | 26,235 | | | | 24,756 | | | | 29,867 | |
Aluminium | | | 12,059 | | | | 12,535 | | | | 14,327 | |
Copper | | | 4,766 | | | | 4,749 | | | | 5,144 | |
Coal | | | 4,557 | | | | 5,060 | | | | 6,026 | |
Industrial Minerals | | | 3,330 | | | | 3,460 | | | | 3,131 | |
Diamonds | | | 859 | | | | 754 | | | | 726 | |
Gold | | | 402 | | | | 614 | | | | 1,012 | |
Other | | | 2,367 | | | | 3,669 | | | | 5,065 | |
Total | | | 54,575 | | | | 55,597 | | | | 65,298 | |
Less share of equity accounted units’ sales revenue | | | (3,404 | ) | | | (4,655 | ) | | | (4,769 | ) |
Consolidated sales revenue | | | 51,171 | | | | 50,942 | | | | 60,529 | |
Non-current assets other than excluded items
The total of non-current assets other than items excluded is shown by location below. This is allocated based on the location of the business units holding the assets.
| | | | | | | | |
| Non-current assets other than excluded items(b) | | 2013
US$m | | | Restated
2012
US$m | |
Australia | | | 38,100 | | | | 40,252 | |
Canada | | | 18,567 | | | | 18,527 | |
Mongolia | | | 8,315 | | | | 14,766 | |
United States | | | 4,739 | | | | 5,162 | |
Africa | | | 3,261 | | | | 4,872 | |
South America | | | 3,146 | | | | 2,726 | |
United Kingdom | | | 1,246 | | | | 1,016 | |
Indonesia | | | 968 | | | | 816 | |
France | | | 602 | | | | 590 | |
Europe (excluding France) | | | 524 | | | | 506 | |
Other countries | | | 3,007 | | | | 2,182 | |
| | | | 82,475 | | | | 91,415 | |
Table continued on next page.
| | | | |
| | 136 riotinto.com/reportingcentre2013 | | |
| | | | | | | | |
| Non-current assets other than excluded items(b) | | 2013
US$m | | | Restated
2012
US$m | |
Non-current assets excluded from analysis above: | | | | | | | | |
Deferred tax assets | | | 3,555 | | | | 3,476 | |
Derivatives and other financial assets | | | 899 | | | | 1,084 | |
Loans to equity accounted units(c) | | | 277 | | | | 406 | |
Tax recoverable | | | 83 | | | | 86 | |
Accounts receivable | | | 1,454 | | | | 1,460 | |
Total non-current assets per statement of financial position | | | 88,743 | | | | 97,927 | |
| (b) | Allocation of non-current assets by country is based on the location of the business units holding the assets, and includes investments in equity accounted units totalling US$3,681 million (2012: US$3,548 million) which represents the Group’s share of net assets excluding quasi equity loans shown separately within Loans to equity accounted units above. |
| (c) | Loans to equity accounted units comprise quasi equity loans of US$276 million (2012: US$393 million) included in ‘Investments in equity accounted units’ on the face of the statement of financial position and non-quasi equity loans of US$1 million (2012: US$13 million) shown within “other financial assets”. |
| | | | | | | | | | | | | | | | |
| | | Note | | | 2013
US$m | | | Restated
2012
US$m | | | Restated
2011
US$m | |
Raw materials and consumables | | | | | | | 8,801 | | | | 10,124 | | | | 11,842 | |
Amortisation of intangible assets | | | 13 | | | | 255 | | | | 310 | | | | 325 | |
Depreciation of property, plant and equipment | | | 14 | | | | 4,536 | | | | 4,314 | | | | 3,647 | |
Employment costs | | | 5 | | | | 7,568 | | | | 8,671 | | | | 7,140 | |
Repairs and maintenance | | | | | | | 2,363 | | | | 2,932 | | | | 2,533 | |
Shipping costs | | | | | | | 1,894 | | | | 1,896 | | | | 1,885 | |
Other freight costs | | | | | | | 1,619 | | | | 1,628 | | | | 1,274 | |
(Increase)/decrease in finished goods and work in progress | | | | | | | 199 | | | | 100 | | | | (42 | ) |
Royalties | | | | | | | 2,883 | | | | 2,374 | | | | 2,791 | |
Amounts charged by equity accounted units(a) | | | | | | | 1,728 | | | | 2,154 | | | | 2,297 | |
Net foreign exchange (losses)/gains | | | | | | | (71 | ) | | | 2 | | | | (82 | ) |
Other external costs | | | | | | | 4,025 | | | | 3,027 | | | | 2,571 | |
Provisions (including exchange differences on provisions) | | | 26 | | | | 1,449 | | | | 886 | | | | 1,082 | |
Research and development | | | | | | | 231 | | | | 246 | | | | 150 | |
Costs included above qualifying for capitalisation | | | | | | | (582 | ) | | | (544 | ) | | | (862 | ) |
Other operating income | | | | | | | (794 | ) | | | (586 | ) | | | (396 | ) |
Net operating costs (excluding items shown separately) | | | | | | | 36,104 | | | | 37,534 | | | | 36,155 | |
| (a) | Amounts charged by equity accounted units relate to toll processing and also include purchases from equity accounted units of bauxite and aluminium which are then processed by the product group or sold to third parties. Generally, purchases are in proportion to the Group’s share of the equity accounted unit but in 2013, US$529 million (2012: US$690 million; 2011: US$849 million) related to purchases of the other investor’s share of production. |
Information on auditors’ remuneration is included in note 39.
| | | | | | | | | | | | | | | | |
| | | Note | | | 2013
US$m | | | Restated
2012
US$m | | | Restated
2011
US$m | |
Employment costs | | | | | | | | | | | | | | | | |
– Wages and salaries | | | | | | | 7,181 | | | | 8,382 | | | | 6,908 | |
– Social security costs | | | | | | | 421 | | | | 156 | | | | 128 | |
– Net post retirement cost | | | 45 | | | | 805 | | | | 823 | | | | 753 | |
– Share option charge | | | 44 | | | | 142 | | | | 240 | | | | 156 | |
| | | | | | | 8,549 | | | | 9,601 | | | | 7,945 | |
Less: charged within provisions | | | | | | | (981 | ) | | | (930 | ) | | | (805 | ) |
Total employment costs | | | 4 | | | | 7,568 | | | | 8,671 | | | | 7,140 | |
| | | | |
| | 137 riotinto.com/reportingcentre2013 | | |
Notes to the 2013 financial statements continued
| | | | | | | | | | | | | | | | | | | | | | | | |
| | | Pre-tax
2013
US$m | | | Taxation
2013
US$m | | | Non-
controlling
interests
2013
US$m | | | Net
amount
2013
US$m | | | Restated
Pre-tax
amount
2012
US$m | | | Pre-tax
amount
2011
US$m | |
Copper – Oyu Tolgoi | | | (4,716 | ) | | | 892 | | | | 2,335 | | | | (1,489 | ) | | | – | | | | – | |
Aluminium | | | (1,797 | ) | | | 504 | | | | – | | | | (1,293 | ) | | | (12,214 | ) | | | (9,182 | ) |
Energy – Rio Tinto Coal Mozambique | | | (497 | ) | | | 27 | | | | – | | | | (470 | ) | | | (3,269 | ) | | | – | |
Copper – South Gobi | | | (269 | ) | | | 67 | | | | 154 | | | | (48 | ) | | | – | | | | – | |
Diamonds(a) | | | – | | | | – | | | | – | | | | – | | | | (659 | ) | | | (467 | ) |
Other(b) | | | (252 | ) | | | 57 | | | | 67 | | | | (128 | ) | | | (85 | ) | | | (117 | ) |
Total | | | (7,531 | ) | | | 1,547 | | | | 2,556 | | | | (3,428 | ) | | | (16,227 | ) | | | (9,766 | ) |
| | | | | | | | | | | | | | | | | | | | | | | | |
Allocated as: | | | | | | | | | | | | | | | | | | | | | | | | |
Goodwill (note 12) | | | (1,149 | ) | | | | | | | | | | | | | | | (8,009 | ) | | | (7,405 | ) |
Intangible assets (note 13) | | | (1,287 | ) | | | | | | | | | | | | | | | (1,817 | ) | | | – | |
Property, plant and equipment (note 14) | | | (4,882 | ) | | | | | | | | | | | | | | | (4,686 | ) | | | (1,793 | ) |
Investment in equity accounted units | | | (216 | ) | | | | | | | | | | | | | | | (1,526 | ) | | | (592 | ) |
Other assets | | | 3 | | | | | | | | | | | | | | | | (189 | ) | | | 24 | |
Total | | | (7,531 | ) | | | | | | | | | | | | | | | (16,227 | ) | | | (9,766 | ) |
| | | | | | | | | | | | | | | | | | | | | | | | |
Comprising: | | | | | | | | | | | | | | | | | | | | | | | | |
Impairment of consolidated balances | | | | | | | | | | | | | | | (7,315 | ) | | | (14,701 | ) | | | (9,174 | ) |
Impairment of investments in equity accounted units | | | | | | | | | | | | | | | (230 | ) | | | (2,217 | ) | | | (941 | ) |
Total impairment in the financial information by business unit (page 198) | | | | | | | | | | | | | | | (7,545 | ) | | | (16,918 | ) | | | (10,115 | ) |
Taxation (including related to EAUs) | | | | | | | | | | | | | | | 1,561 | | | | 2,536 | | | | 825 | |
Non-controlling interests | | | | | | | | | | | | | | | 2,556 | | | | 22 | | | | – | |
Net impairment in the income statement | | | | | | | | | | | | | | | (3,428 | ) | | | (14,360 | ) | | | (9,290 | ) |
| (a) | On 24 June 2013, the Group announced that the strategic review had concluded with a decision to retain the Diamonds businesses. No impairment triggers relating to Diamonds were identified during 2013. |
| (b) | Other impairments include adjustments to reduce the carrying amount of the Eagle nickel-copper project to fair value less costs of disposal (“FVLCD”) prior to divestment on 17 July 2013, and is considered to be a level 1 classification under the fair value hierarchy. Other impairment include an adjustment to the carrying value of Inova Resources Limited which was sold on 1 November 2013. |
Copper – Oyu Tolgoi
The annual impairment review of the Oyu Tolgoi cash-generating unit resulted in a pre-tax impairment of US$1,149 million to goodwill and US$3,567 million to property, plant and equipment, primarily as a result of the delay in developing the underground. The recoverable amount for Oyu Tolgoi was determined to be US$8.4 billion assessed by reference to a FVLCD model, in line with the accounting policy set out in note 1(i). The impairment loss was allocated to goodwill and the accounting uplift to property, plant and equipment that were previously recognised as accounting uplifts from when Rio Tinto obtained control of Oyu Tolgoi such that individual items of property, plant and equipment were not written down below fair value.
The recoverable amount of the Oyu Tolgoi cash-generating unit is classified as level 3 under the fair value hierarchy. In arriving at FVLCD, post-tax cash flows expressed in real terms have been estimated until the end of the life of mine plan and discounted using a country specific post-tax discount rate of 8.7 per cent (2012: 8.3 percent) for Mongolia.
The most critical assumption for the FVLCD calculation is the timing of the underground project. If this is further delayed, it would have an adverse impact upon the recoverable amount due to the delay in commencing full production. A further twelve month delay in the timing of cash flows related to the underground would decrease FVLCD by US$0.8 billion.
Other key assumptions to which the calculation of FVLCD for Oyu Tolgoi is most sensitive are: long-term copper prices, discount rates and operating costs. Other assumptions include the long-term gold price, and Mongolian Tugrik and Chinese Yuan exchange rates against the US dollar. Future selling prices and operating costs have been estimated in line with the policy set out in note 1(i).
Aluminium
The annual impairment review of the Group’s Aluminium cash-generating units with indefinite-lived intangible assets resulted in a pre-tax impairment charge of US$908 million to intangible assets and US$42 million to property, plant and equipment within the Kitimat cash-generating unit, primarily as a result of a significant project cost overrun. The recoverable amount of US$2,258 million for the Kitimat cash-generating unit was determined by reference to a FVLCD model, in line with the accounting policy set out in note 1(i) and the impairment loss recorded such that individual items of property, plant and equipment were not written down below fair value.
| | | | |
| | 138 riotinto.com/reportingcentre2013 | | |
The recoverable amount of the Kitimat cash-generating unit is classified as level 3 under the fair value hierarchy. In arriving at FVLCD, post-tax cash flows expressed in real terms have been estimated over the expected useful economic life of the new smelter, being the principal asset of the cash-generating unit and discounted using a post-tax discount rate of 7.3 per cent (2012: 6.9 per cent).
Modernisation of the Kitimat aluminium smelter in British Columbia is due to be completed in the first half of 2015 (subject to any additional capital required to complete the project receiving Board approval). The most critical assumption for the FVLCD calculation is the cost to complete the project, where a cost overrun has recently been identified. A process to validate the extent of the overrun is currently underway; should the cost to complete the project be greater than currently forecast, it could result in further impairment.
Other key assumptions to which the calculation of FVLCD for Kitimat is sensitive are: the aluminium price, discount rates, the Canadian dollar exchange rate and operating cost assumptions. The price of alumina is not considered a key assumption as it is typically priced as a percentage of the aluminium price. The long-term aluminium price for impairment testing purposes decreased by 6.5 per cent (2012: three per cent) in real terms compared to the prior year, marginally above the mid-point of the range published for 2017 by market commentators of US$2,001 and US$2,570 per tonne, with an average of US$2,250 per tonne.
The remaining US$847 million pre-tax impairment loss in the Group’s Aluminium business relates to the full write-off of property, plant and equipment at the Gove alumina refinery following the decision to curtail operations and at the Shawinigan aluminium smelter following the decision to close the plant.
In previous years, the Group’s Aluminium cash-generating units were tested for impairment in aggregate as the goodwill was allocated and monitored at the segment level, this goodwill was fully written off in 2012. During 2012 impairment testing of the Group’s Aluminium business resulted in a pre-tax impairment charge of US$7,468 million to goodwill (2011: US$7,405 million), a pre-tax impairment charge of US$229 million to intangible assets (2011: US$nil), a pre-tax impairment charge of US$3,944 million to property, plant and equipment (2011: US$1,186 million), a post-tax impairment charge of $379 million to investments in equity accounted units (2011: US$579 million), and a pre-tax adjustment of US$194 million to other assets and liabilities (2011: US$nil).
Energy – Rio Tinto Coal Mozambique
An impairment trigger was identified at Rio Tinto Coal Mozambique following reassessment of the development plan, discount rate and associated country risk premium. Subsequent testing resulted in a post-tax impairment of the Benga cash-generating unit, which is classified as an investment in equity accounted unit, of US$216 million (2012: US$1,147 million) and a pre-tax impairment of the Zambeze cash-generating unit intangible assets of US$259 million (2012: US$1,581 million) and property, plant and equipment of US$22 million (2012: no impairment charge). The impairment recorded in 2012 also included the full write off of goodwill of US$541 million which was monitored and tested at the business unit level.
The recoverable amount for Benga has been determined to be US$86 million assessed by reference to a FVLCD model and the recoverable amount for Zambeze has been determined by reference to a value-in-use of nil as the property is undeveloped.
The recoverable amount for the Benga cash-generating unit is classified as level 3 under the fair value hierarchy. In arriving at FVLCD, post-tax cash flows expressed in real terms have been estimated over the assets’ life based on long term production plans, including restoration and environmental clean-up costs. The cash flows are discounted using a country specific post-tax discount rate of 10.3 per cent (2012: 7.9 per cent) for Mozambique.
The key assumptions to which the calculation of FVLCD for Benga is most sensitive are the thermal coal and hard coking coal price; operating costs; discount rates; and infrastructure assumptions. Coal prices and operating costs have been estimated in line with the policy set out in note 1(i).
Copper – SouthGobi; expansion and undeveloped properties
The expansion and undeveloped properties in SouthGobi were recognised in accordance with the requirement in IFRS to fair value assets on first consolidation and were therefore recorded as an accounting uplift when Rio Tinto obtained control of Turquoise Hill Resources on 24 January 2012. These assets were not amortised and therefore have been tested for impairment. The recoverable amount has been determined as nil by reference to a recoverable amount based on value-in-use. As a result, a pre-tax impairment charge of US$113 million has been recorded against intangible assets and a further US$156 million has been recorded against property, plant and equipment.
| 7 | Share of profit after tax of equity accounted units |
| | | | | | | | | | | | |
| | | 2013
US$m | | | Restated
2012
US$m | | | Restated
2011
US$m | |
Sales revenue: Rio Tinto share(a) | | | 4,113 | | | | 5,498 | | | | 6,098 | |
Operating costs | | | (2,871 | ) | | | (3,779 | ) | | | (4,893 | ) |
Profit before finance items and taxation | | | 1,242 | | | | 1,719 | | | | 1,205 | |
Finance items | | | (97 | ) | | | (68 | ) | | | (32 | ) |
Share of profit after tax of equity accounted units | | | 31 | | | | 47 | | | | 38 | |
Profit before taxation | | | 1,176 | | | | 1,698 | | | | 1,211 | |
Taxation | | | (478 | ) | | | (642 | ) | | | (515 | ) |
Profit for the year (Rio Tinto share) | | | 698 | | | | 1,056 | | | | 696 | |
| (a) | Sales revenue of equity accounted units excludes charges by equity accounted units to Group subsidiaries. |
Additional information relating to the Group’s interests in joint ventures and associates is given in notes 35 and 36.
| | | | |
| | 139 riotinto.com/reportingcentre2013 | | |
Notes to the 2013 financial statements continued
| 8 | Finance income and finance costs |
| | | | | | | | | | | | | | | | |
| | | Note | | | 2013 US$m | | | Restated 2012 US$m | | | Restated 2011 US$m | |
Finance income from equity accounted units | | | | | | | 14 | | | | 14 | | | | 27 | |
Other finance income (including bank deposits and other financial assets) | | | | | | | 68 | | | | 102 | | | | 79 | |
Total finance income | | | | | | | 82 | | | | 116 | | | | 106 | |
| | | | |
Interest payable and similar charges(a) | | | | | | | (1,234 | ) | | | (1,059 | ) | | | (989 | ) |
Amounts capitalised | | | 14 | | | | 727 | | | | 766 | | | | 493 | |
Total finance costs | | | | | | | (507 | ) | | | (293 | ) | | | (496 | ) |
| (a) | Interest payable and similar charges relate to interest on bank loans and other borrowings. This includes a fair value loss on interest rate swaps designated as hedges of US$266 million (2012: US$25 million loss; 2011: US$311 million gain) and a fair value gain on bonds and notes attributable to interest rate risk of US$257 million (2012: US$13 million loss; 2011: US$308 million loss). |
| | | | | | | | | | | | | | | | |
| | | Note | | | 2013
US$m | | | Restated
2012
US$m | | | Restated
2011
US$m | |
| Taxation charge | | | | | | | | | | | | | | | | |
– Current | | | | | | | 4,102 | | | | 3,887 | | | | 6,144 | |
– Deferred | | | 17 | | | | (1,676 | ) | | | (3,298 | ) | | | 328 | |
| | | | | | | | 2,426 | | | | 589 | | | | 6,472 | |
| | | | | | | | | | | | | | | | |
| Prima facie tax reconciliation | | | | | 2013
US$m | | | Restated
2012
US$m | | | Restated
2011
US$m | |
Profit/(loss) before taxation | | | | | | | 3,505 | | | | (2,431 | ) | | | 13,272 | |
Deduct: share of profit after tax of equity accounted units | | | | | | | (698 | ) | | | (1,056 | ) | | | (696 | ) |
Add: impairment after tax of investments in equity accounted units(a) | | | | | | | 216 | | | | 1,526 | | | | 592 | |
Parent companies’ and subsidiaries’ profit/(loss) before tax | | | | | | | 3,023 | | | | (1,961 | ) | | | 13,168 | |
| | | | |
Prima facie tax payable at UK rate of 23% (2012: 24%; 2011: 26%) | | | | | | | 695 | | | | (471 | ) | | | 3,424 | |
Higher rate of taxation on Australian earnings | | | | | | | 1,411 | | | | 838 | | | | 759 | |
Impact of items excluded in arriving at Underlying earnings: | | | | | | | | | | | | | | | | |
– Impairment charges | | | | | | | 135 | | | | 1,683 | | | | 1,909 | |
– Gains and losses on disposal and consolidation of businesses | | | | | | | (199 | ) | | | (185 | ) | | | (33 | ) |
– Foreign exchange on excluded finance items | | | | | | | 77 | | | | (44 | ) | | | 27 | |
– Impact of tax law changes on recognition of deferred tax assets(b) | | | | | | | – | | | | (1,205 | ) | | | 342 | |
– Other exclusions | | | | | | | (7 | ) | | | 157 | | | | (90 | ) |
Impact of changes in tax rates and laws | | | | | | | 12 | | | | (5 | ) | | | 20 | |
Other tax rates applicable outside the UK and Australia | | | | | | | (63 | ) | | | (74 | ) | | | 129 | |
Resource depletion and other depreciation allowances | | | | | | | (103 | ) | | | (121 | ) | | | (182 | ) |
Research, development and other investment allowances | | | | | | | (49 | ) | | | (57 | ) | | | (78 | ) |
Recognition of previously unrecognised deferred tax assets | | | | | | | – | | | | (84 | ) | | | – | |
Unrecognised current year operating losses | | | | | | | 339 | | | | 200 | | | | 272 | |
Other items | | | | | | | 178 | | | | (43 | ) | | | (27 | ) |
Total taxation charge(c) | | | | | | | 2,426 | | | | 589 | | | | 6,472 | |
| (a) | Impairment of investments in equity accounted units is net of tax credits of US$14 million (2012: US$691 million; 2011: US$349 million). |
| (b) | Minerals Resource Rent Tax (MRRT) is an additional tax on profits from the mining of iron ore and coal in Australia, which came into effect on 1 July 2012. In computing MRRT liabilities, a deduction is given in respect of the market value of the mining assets as at 1 May 2010. A deferred tax asset has been recognised on the temporary difference between the amount that is deductible for tax purposes and the carrying value of the assets in the accounts, to the extent that its recovery is probable. This temporary difference will reverse over the life of the mines. |
| (c) | This tax reconciliation relates to the Group’s parent companies, subsidiaries and joint operations. |
| | | | |
| | 140 riotinto.com/reportingcentre2013 | | |
The tax credit/(charge) relating to components of other comprehensive income is as follows:
| | | | | | | | | | | | |
| | | 2013 Total US$m | | | Restated 2012 Total
US$m | | | Restated 2011 Total US$m | |
Tax on exchange adjustments | | | (17 | ) | | | (1 | ) | | | 13 | |
Fair value movements: | | | | | | | | | | | | |
– Cash flow hedge fair value (gains)/losses | | | (34 | ) | | | 26 | | | | (24 | ) |
– Cash flow hedge gains/(losses) transferred to the income statement | | | 19 | | | | (50 | ) | | | (52 | ) |
– Losses on revaluation of available for sale securities | | | 2 | | | | 6 | | | | 21 | |
– (Losses)/gains on revaluation of available for sale securities transferred
to the income statement | | | (20 | ) | | | 1 | | | | 1 | |
Currency translation reclassified | | | – | | | | – | | | | (3 | ) |
Actuarial (gains)/losses on post retirement benefit plans | | | (641 | ) | | | 83 | | | | 532 | |
Deferred tax on share options | | | (6 | ) | | | (8 | ) | | | (55 | ) |
| | | (697 | ) | | | 57 | | | | 433 | |
Share of tax on other comprehensive expense of equity accounted units | | | – | | | | – | | | | (3 | ) |
Tax relating to components of other comprehensive income/(expense) for the year(a) | | | (697 | ) | | | 57 | | | | 430 | |
| (a) | This comprises deferred tax charge of US$697 million (2012: credit of US$54 million; 2011: credit of US$476 million) and current tax credits of US$nil (2012: US$3 million; 2011: charge of US$43 million), plus share of tax on other comprehensive income of equity accounted units shown separately. See note 17. |
| 10 | Earnings/(loss) per ordinary share |
| | | | | | | | | | | | | | | | | | | | | | | | |
| | | 2013
Earnings
US$m | | | 2013
Weighted
average
number of
shares
(millions) | | | 2013
Per share
amount
(cents) | | | 2012
Earnings
US$m | | | Restated
2012
Weighted
average
number of
shares
(millions) | | | Restated
2012
Per share
amount
(cents) | |
Basic earnings/(loss) per share attributable to ordinary shareholders of Rio Tinto – continuing operations | | | 3,665 | | | | 1,847.3 | | | | 198.4 | | | | (3,021 | ) | | | 1,849.1 | | | | (163.4 | ) |
Basic loss per share attributable to ordinary shareholders of Rio Tinto – discontinued operations | | | – | | | | 1,847.3 | | | | – | | | | (7 | ) | | | 1,849.1 | | | | (0.4 | ) |
Total basic earnings/(loss) per share – profit for the year(a) | | | 3,665 | | | | 1,847.3 | | | | 198.4 | | | | (3,028 | ) | | | 1,849.1 | | | | (163.8 | ) |
Diluted earnings/(loss) per share attributable to ordinary shareholders of Rio Tinto – continuing operations | | | 3,665 | | | | 1,857.7 | | | | 197.3 | | | | (3,021 | ) | | | 1,849.1 | | | | (163.4 | ) |
Diluted loss per share attributable to ordinary shareholders of Rio Tinto – discontinued operations | | | – | | | | 1,857.7 | | | | – | | | | (7 | ) | | | 1,849.1 | | | | (0.4 | ) |
Total diluted earnings/(loss) per share – profit for the year(b) | | | 3,665 | | | | 1,857.7 | | | | 197.3 | | | | (3,028 | ) | | | 1,849.1 | | | | (163.8 | ) |
| | | | | | | | | | | | |
| | | 2011
Earnings
US$m | | | Restated
2011
Weighted
average
number of
shares
(millions) | | | Restated
2011
Per share
amount
(cents) | |
Basic earnings per share attributable to ordinary shareholders of Rio Tinto – continuing operations | | | 5,845 | | | | 1,923.1 | | | | 303.9 | |
Basic loss per share attributable to ordinary shareholders of Rio Tinto – discontinued operations | | | (10 | ) | | | 1,923.1 | | | | (0.5 | ) |
Total basic earnings per share – profit for the year(a) | | | 5,835 | | | | 1,923.1 | | | | 303.4 | |
Diluted earnings per share attributable to ordinary shareholders of Rio Tinto – continuing operations | | | 5,845 | | | | 1,935.5 | | | | 302.0 | |
Diluted loss per share attributable to ordinary shareholders of Rio Tinto – discontinued operations | | | (10 | ) | | | 1,935.5 | | | | (0.5 | ) |
Total diluted earnings per share – profit for the year | | | 5,835 | | | | 1,935.5 | | | | 301.5 | |
| (a) | The weighted average number of shares is calculated as the average number of Rio Tinto plc shares outstanding not held as treasury shares of 1,411.6 million (2012: 1,413.4 million; 2011: 1,487.3 million) plus the average number of Rio Tinto Limited shares outstanding of 435.7 million (2012: 435.8 million; 2011: 435.8 million). No Rio Tinto Limited shares were held by Rio Tinto plc in any of the periods presented. |
| (b) | In accordance with IAS 33 ‘Earnings per share’, the effects of anti-dilutive potential have not been included when calculating diluted loss per share for the year ended 31 December 2012. For the purposes of calculating diluted earnings per share, the effect of dilutive securities of 12.4 million shares in 2011 is added to the weighted average number of shares described in (a) above. This effect is calculated under the treasury stock method. The Group’s only potential dilutive ordinary shares are share options for which terms and conditions are described in note 44. |
| | | | |
| | 141 riotinto.com/reportingcentre2013 | | |
Notes to the 2013 financial statements continued
| | | | | | | | | | | | |
| | | 2013 US$m | | | 2012 US$m | | | 2011 US$m | |
Rio Tinto plc previous year final dividend paid | | | 1,311 | | | | 1,295 | | | | 955 | |
Rio Tinto plc Interim dividend paid | | | 1,213 | | | | 1,054 | | | | 778 | |
Rio Tinto Limited previous year final dividend paid | | | 406 | | | | 380 | | | | 279 | |
Rio Tinto Limited Interim dividend paid | | | 392 | | | | 309 | | | | 224 | |
Dividends paid during the year | | | 3,322 | | | | 3,038 | | | | 2,236 | |
| | | | | | | | | | | | | |
Dividends per share: paid during the year | | | 178.0c | | | | 163.5c | | | | 117.0c | |
Dividends per share: proposed in the announcement of the results for the year | | | 108.5c | | | | 94.5c | | | | 91.0c | |
| | | | | | | | | | | | |
| | | Dividends
per share
2013 | | | Dividends
per share
2012 | | | Dividends
per share
2011 | |
Rio Tinto plc previous year final (pence) | | | 60.34p | | | | 57.33p | | | | 39.14p | |
Rio Tinto plc Interim (pence) | | | 54.28p | | | | 46.43p | | | | 33.14p | |
Rio Tinto Limited previous year final – fully franked at 30% (Australian cents) | | | 91.67c | | | | 84.20c | | | | 61.94c | |
Rio Tinto Limited Interim – fully franked at 30% (Australian cents) | | | 93.00c | | | | 68.51c | | | | 49.81c | |
| | | | | | | | | | | | |
| | | Number
of shares
2013
(millions) | | | Number
of shares
2012
(millions) | | | Number
of shares
2011
(millions) | |
Rio Tinto plc previous year Final | | | 1,411.9 | | | | 1,416.7 | | | | 1,522.6 | |
Rio Tinto plc Interim | | | 1,412.5 | | | | 1,410.9 | | | | 1,479.5 | |
Rio Tinto Limited previous year Final | | | 435.8 | | | | 435.8 | | | | 435.8 | |
Rio Tinto Limited Interim | | | 435.8 | | | | 435.8 | | | | 435.8 | |
The dividends paid in 2013 are based on the following US cents per share amounts: 2012 final – 94.5 cents, 2013 interim – 83.5 cents (2012 dividends paid: 2011 final – 91.0 cents, 2012 interim – 72.5 cents; 2011 dividends paid: 2010 final – 63.0 cents, 2011 interim – 54.0 cents).
The number of shares on which Rio Tinto plc dividends are based excludes those held as treasury shares. 2013, 2012 and 2011, no Rio Tinto Limited shares were held by Rio Tinto plc.
In addition, the directors of Rio Tinto announced a final dividend of 108.5 cents per share on 13 February 2014. This is expected to result in payments of US$2,005 million (Rio Tinto plc: US$1,532 million, Rio Tinto Limited US$473 million). The dividends will be paid on 10 April 2014 to Rio Tinto plc shareholders on the register at the close of business on 7 March 2014 and to Rio Tinto Limited shareholders on the register at the close of business on 12 March 2014.
The proposed Rio Tinto Limited dividends will be franked out of existing franking credits or out of franking credits arising from the payment of income tax during 2014.
The approximate amount of the Rio Tinto Limited consolidated tax group’s retained profits and reserves that could be distributed as dividends and franked out of credits, that arose from net payments of income tax in respect of periods up to 31 December 2013 (after deducting franking credits expected to be utilised on the 2013 final dividend declared), is US$14,298 million.
| | | | |
| | 142 riotinto.com/reportingcentre2013 | | |
| | | | | | | | |
| | | 2013 US$m | | | Restated 2012 US$m | |
Net book value | | | | | | | | |
At 1 January | | | 2,774 | | | | 9,558 | |
Adjustment on currency translation | | | (253 | ) | | | 246 | |
Company no longer consolidated | | | (23 | ) | | | – | |
Newly consolidated operations | | | – | | | | 979 | |
Impairment charges(a) | | | (1,149 | ) | | | (8,009 | ) |
At 31 December | | | 1,349 | | | | 2,774 | |
– cost | | | 22,678 | | | | 24,451 | |
– accumulated impairment | | | (21,329 | ) | | | (21,677 | ) |
At 1 January | | | | | | | | |
– cost | | | 24,451 | | | | 23,511 | |
– accumulated impairment | | | (21,677 | ) | | | (13,953 | ) |
| |
At 31 December, goodwill has been allocated as follows: | | | | | |
| | | | | | | | |
| | | 2013 US$m | | | 2012 US$m | |
Net book value | | | | | | | | |
Richards Bay Minerals | | | 656 | | | | 806 | |
Iron Ore – Australia | | | 445 | | | | 518 | |
Copper – Oyu Tolgoi | | | – | | | | 1,149 | |
Other | | | 248 | | | | 301 | |
| | | | 1,349 | | | | 2,774 | |
| (a) | During 2013, the goodwill impairment charge of US$1,149 million represents the full impairment of goodwill allocated to Oyu Tolgoi. During 2012, the goodwill impairment charge related mainly to Rio Tinto Alcan and Rio Tinto Coal Mozambique. Refer to note 6 for further details. |
Impairment tests for goodwill
Richards Bay Minerals
The Group consolidated Richards Bay Minerals on 3 September 2012. Goodwill of US$806 million arose in accordance with the requirement in IFRS to recognise a deferred tax asset or liability on the difference between the fair value of newly consolidated assets and liabilities and their tax base. The recognition of Richards Bay Minerals’ identifiable assets and liabilities in the statement of financial position was based on fair values at the acquisition date determined with the assistance of an independent third party valuer.
Richard Bay Minerals’ annual impairment review resulted in no impairment charge for 2013 (2012: no impairment charge). The recoverable amount has been assessed by reference to FVLCD, in line with the policy set out in note 1(i) and classified as level 3 under the fair value hierarchy. FVLCD was determined by estimating cash flows until the end of the life of mine plan. In arriving at FVLCD, a post-tax discount rate of 7.3 per cent (2012: 6.9 per cent) has been applied to the post-tax cash flows expressed in real terms.
The key assumptions to which the calculation of FVLCD for Richards Bay Minerals is most sensitive are the long-term titanium slag prices and discount rates. Other assumptions include the long-term pig iron and zircon prices, the South African Rand exchange rate against the US dollar and operating costs. Future selling prices and operating costs have been estimated in line with the policy set out in note 1(i).
A five per cent decrease in the long-term titanium slag price, in isolation, would lead to a US$482 million decrease in the FVLCD. A one per cent increase in the discount rate, in isolation, would lead to a US$388 million decrease in the FVLCD. A ten per cent strengthening of the South African Rand against the US dollar, in isolation, would lead to a US$920 million decrease in FVLCD. The recoverable amount of the cash-generating unit exceeds the carrying value as a result of each of these sensitivities applied in isolation.
Iron Ore – Australia
The recoverability of goodwill arising from the acquisition of Robe River has been assessed by reference to FVLCD using discounted cash flows, which is in line with the policy set out in note 1(i) and is classified as level 3 under the fair value hierarchy. In arriving at FVLCD, a post-tax discount rate of 7.3 per cent (2012: 6.9 per cent) has been applied to the post-tax cash flows expressed in real terms. The recoverable amounts were determined to be significantly in excess of carrying value, and there are no reasonably possible changes in key assumptions that would cause the remaining goodwill to be impaired.
Other
The recoverability of the Other goodwill has been assessed by reference to FVLCD using discounted cash flows, which is in line with the policy set out in note 1(i). The recoverable amounts were determined to be in excess of carrying value, and there are no reasonably possible changes in key assumptions that would cause the remaining goodwill to be impaired by a significant amount.
| | | | |
| | 143 riotinto.com/reportingcentre2013 | | |
Notes to the 2013 financial statements continued
| | | | | | | | | | | | | | | | | | | | |
| Year ended 31 December 2013 | |
| Exploration and
evaluation US$m |
(a) | |
| Trademarks,
patented and non patented technology US$m |
| |
| Contract
based intangible assets US$m |
(b) | |
| Other
intangible assets US$m |
| |
| Total
US$m | (d)
|
Net book value | | | | | | | | | | | | | | | | | | | | |
At 1 January 2013 | | | 2,053 | | | | 212 | | | | 4,120 | | | | 495 | | | | 6,880 | |
Adjustment on currency translation | | | (96 | ) | | | 7 | | | | (290 | ) | | | (47 | ) | | | (426 | ) |
Expenditure during the year | | | 368 | | | | – | | | | 9 | | | | 159 | | | | 536 | |
Amortisation for the year(c) | | | – | | | | (21 | ) | | | (123 | ) | | | (111 | ) | | | (255 | ) |
Impairment charges(e) | | | (379 | ) | | | – | | | | (908 | ) | | | – | | | | (1,287 | ) |
Disposals, transfers and other movements | | | (92 | ) | | | – | | | | 23 | | | | 42 | | | | (27 | ) |
At 31 December 2013 | | | 1,854 | | | | 198 | | | | 2,831 | | | | 538 | | | | 5,421 | |
– cost | | | 4,507 | | | | 334 | | | | 4,830 | | | | 1,357 | | | | 11,028 | |
– accumulated amortisation and impairment | | | (2,653 | ) | | | (136 | ) | | | (1,999 | ) | | | (819 | ) | | | (5,607 | ) |
| | | | | | | | | | | | | | | | | | | | |
| Year ended 31 December 2012 (restated) | |
| Exploration and
evaluation US$m |
(a) | |
| Trademarks,
patented and non patented technology US$m |
| |
| Contract
based intangible assets US$m |
(b) | |
| Other
intangible assets US$m |
| |
| Total
US$m | (d)
|
Net book value | | | | | | | | | | | | | | | | | | | | |
At 1 January 2012 | | | 2,857 | | | | 227 | | | | 4,400 | | | | 558 | | | | 8,042 | |
Adjustment on currency translation | | | 21 | | | | 4 | | | | 106 | | | | 13 | | | | 144 | |
Expenditure during the year | | | 924 | | | | 1 | | | | – | | | | 84 | | | | 1,009 | |
Amortisation for the year(c) | | | – | | | | (20 | ) | | | (133 | ) | | | (157 | ) | | | (310 | ) |
Impairment charges net of reversals | | | (1,581 | ) | | | 5 | | | | (234 | ) | | | (7 | ) | | | (1,817 | ) |
Disposals, transfers and other movements | | | (168 | ) | | | (5 | ) | | | (19 | ) | | | 4 | | | | (188 | ) |
At 31 December 2012 | | | 2,053 | | | | 212 | | | | 4,120 | | | | 495 | | | | 6,880 | |
– cost | | | 3,634 | | | | 322 | | | | 5,265 | | | | 1,291 | | | | 10,512 | |
– accumulated amortisation and impairment | | | (1,581 | ) | | | (110 | ) | | | (1,145 | ) | | | (796 | ) | | | (3,632 | ) |
| (a) | Exploration and evaluation assets’ useful life is not determined until transferred to property, plant & equipment. The impairment charge in 2013 of US$379 million (2012: US$1,581) mainly related to exploration and evaluation assets within Rio Tinto Coal Mozambique (RTCM) and SouthGobi Resources Limited (see note 6). |
| (b) | The Group benefits from certain intangible assets acquired with Alcan including power supply contracts, customer contracts and water rights. The water rights are expected to contribute to the efficiency and cost effectiveness of operations for the foreseeable future: accordingly, these rights are considered to have indefinite lives and are not subject to amortisation but are tested annually for impairment. These water rights constitute the majority of the amounts in ‘Contract based intangible assets’. |
| (c) | Finite life intangible assets are amortised over their useful economic lives on a straight line or units of production basis, as appropriate. Where amortisation is calculated on a straight line basis, the following useful lives have been determined: |
| | Trademark, patented and non-patented technology |
| | Trademarks: 14 to 20 years |
| | Patented and non-patented technology: 10 to 20 years |
| | Contract based intangible assets |
| | Power contracts: 2 to 39 years |
| | Other purchase and customer contracts: 5 to 15 years |
| | Internally generated intangible assets and computer software: 2 to 5 years |
| | Other intangible assets: 2 to 20 years |
| (d) | There are no intangible assets either pledged as security or held under restriction of title. |
| (e) | Impairment test for indefinite lived assets: |
| | All indefinite lived intangible assets relate to water rights, having been allocated to the Kitimat and the Quebec smelters cash-generating units within the Aluminium business on consolidation of Rio Tinto Alcan in 2007. The annual impairment test for indefinite lived intangible assets resulted in an impairment loss being recognised in the Kitimat cash-generating unit as described in note 6. The remaining carrying value of indefinite lived intangible assets wholly relate to the water rights in the Quebec smelters cash-generating unit. The carrying value of those water rights is US$2,131 million. The Quebec smelters cash-generating unit was tested for impairment and it was determined that its recoverable amount determined on a FVLCD basis is US$7,736 million and exceeds the carrying amount by US$385 million. |
| | The recoverable amount of the Quebec smelters is classified as level 3 under the fair value hierarchy. In arriving at FVLCD, post-tax cash flows expressed in real terms have been estimated over the expected useful economic lives of the underlying smelting assets and discounted using a post-tax discount rate of 7.3 per cent (2012: 6.9 per cent). |
| | | | |
| | 144 riotinto.com/reportingcentre2013 | | |
The key assumptions to which the calculation of FVLCD for the Quebec smelters is most sensitive and the corresponding decrease in FVLCD are set out below:
| | | | |
| | | US$ million | |
0.5% increase in discount rate applied to post-tax cash flows | | | 492 | |
5% decrease in aluminium and alumina prices | | | 1,282 | |
5% strengthening of the Canadian dollar | | | 556 | |
5% increase in operating costs | | | 810 | |
Each of the sensitivities has been determined by assuming that the relevant key assumption moves in isolation, except where modifying the aluminium price directly affects the price assumption for certain input costs and further assumes that there is no mitigating action by management.
In previous years, the Group’s Aluminium cash-generating units were tested for impairment in aggregate as the goodwill was allocated and monitored at the segment level. The remaining goodwill was fully impaired in 2012. Refer to note 6 for further details.
Exploration and evaluation expenditure
The charge for the year and the net amount of intangible assets capitalised during the year are as follows:
| | | | | | | | | | | | |
| | | 2013 US$m | | | Restated 2012 US$m | | | Restated 2011 US$m | |
Net expenditure in the year (net of proceeds of US$27 million (2012: US$217 million; 2011: US$52 million) on disposal of undeveloped projects) | | | (1,317 | ) | | | (2,608 | ) | | | (1,604 | ) |
Changes in accruals (including impairment of undeveloped projects of US$159 million (2012: US$nil; 2011: US$37 million) and non-cash proceeds on disposal of undeveloped projects) | | | (160 | ) | | | 207 | | | | 8 | |
Amount capitalised during the year | | | 368 | | | | 924 | | | | 248 | |
Net charge for the year | | | (1,109 | ) | | | (1,477 | ) | | | (1,348 | ) |
Reconciliation to income statement | | | | | | | | | | | | |
Exploration and evaluation costs | | | (948 | ) | | | (1,971 | ) | | | (1,437 | ) |
(Loss)/profit on disposal of interests in undeveloped projects | | | (161 | ) | | | 494 | | | | 89 | |
Net charge for the year | | | (1,109 | ) | | | (1,477 | ) | | | (1,348 | ) |
| 14 | Property, plant and equipment |
| | | | | | | | | | | | | | | | | | | | |
| Year ended 31 December 2013 | |
| Mining
properties and leases US$m |
(a) | |
| Land and
buildings US$m |
(b) | |
| Plant and
equipment US$m |
| |
| Capital
works in progress US$m |
| |
| Total
US$m |
|
Net book value | | | | | | | | | | | | | | | | | | | | |
At 1 January 2013 | | | 16,902 | | | | 7,187 | | | | 31,601 | | | | 21,295 | | | | 76,985 | |
Adjustment on currency translation | | | (1,303 | ) | | | (629 | ) | | | (3,670 | ) | | | (1,612 | ) | | | (7,214 | ) |
Adjustments to capitalised closure costs (note 26) | | | 391 | | | | – | | | | – | | | | – | | | | 391 | |
Interest capitalised(c) (note 8) | | | – | | | | – | | | | 2 | | | | 725 | | | | 727 | |
Additions | | | 397 | | | | 214 | | | | 1,444 | | | | 9,879 | | | | 11,934 | |
Depreciation for the year(a) (d) | | | (816 | ) | | | (439 | ) | | | (3,281 | ) | | | – | | | | (4,536 | ) |
Impairment charges, net of reversals(e) | | | (3,976 | ) | | | (67 | ) | | | (676 | ) | | | (163 | ) | | | (4,882 | ) |
Disposals | | | (1 | ) | | | (5 | ) | | | (89 | ) | | | (27 | ) | | | (122 | ) |
Subsidiaries no longer consolidated | | | (401 | ) | | | (62 | ) | | | (274 | ) | | | (334 | ) | | | (1,071 | ) |
Transfers and other movements(f) | | | (313 | ) | | | 1,211 | | | | 13,409 | | | | (15,692 | ) | | | (1,385 | ) |
At 31 December 2013 | | | 10,880 | | | | 7,410 | | | | 38,466 | | | | 14,071 | | | | 70,827 | |
– cost | | | 21,521 | | | | 11,328 | | | | 68,429 | | | | 14,487 | | | | 115,765 | |
– accumulated depreciation and impairment | | | (10,641 | ) | | | (3,918 | ) | | | (29,963 | ) | | | (416 | ) | | | (44,938 | ) |
Non-current assets held under finance leases (g) | | | – | | | | 14 | | | | 9 | | | | – | | | | 23 | |
Other non-current assets pledged as security (h) | | | 1,435 | | | | 175 | | | | 2,872 | | | | 97 | | | | 4,579 | |
| | | | |
| | 145 riotinto.com/reportingcentre2013 | | |
Notes to the 2013 financial statements continued
| 14 | Property, plant and equipment continued |
| | | | | | | | | | | | | | | | | | | | |
| Year ended 31 December 2012 (restated) | |
| Mining
properties and leases US$m |
(a) | |
| Land and
buildings US$m |
(b) | |
| Plant and
equipment US$m |
| |
| Capital
works in progress US$m |
| |
| Total
US$m |
|
Net book value | | | | | | | | | | | | | | | | | | | | |
At 1 January 2012 | | | 16,440 | | | | 6,261 | | | | 28,414 | | | | 15,266 | | | | 66,381 | |
Adjustment on currency translation | | | 223 | | | | 103 | | | | 598 | | | | 249 | | | | 1,173 | |
Adjustments to capitalised closure costs (note 26) | | | (3,005 | ) | | | – | | | | – | | | | – | | | | (3,005 | ) |
Interest capitalised(c) (note 8) | | | – | | | | – | | | | – | | | | 766 | | | | 766 | |
Additions | | | 280 | | | | 172 | | | | 1,136 | | | | 15,735 | | | | 17,323 | |
Depreciation for the year(a) (d) | | | (904 | ) | | | (357 | ) | | | (3,057 | ) | | | 4 | | | | (4,314 | ) |
Impairment charges, net of reversals(e) | | | (136 | ) | | | (310 | ) | | | (3,053 | ) | | | (1,187 | ) | | | (4,686 | ) |
Disposals | | | (2 | ) | | | (8 | ) | | | (91 | ) | | | (11 | ) | | | (112 | ) |
Newly consolidated operations (note 37) | | | 2,527 | | | | 277 | | | | 735 | | | | 241 | | | | 3,780 | |
Subsidiaries no longer consolidated | | | (3 | ) | | | (37 | ) | | | (44 | ) | | | (21 | ) | | | (105 | ) |
Transfers and other movements(f) | | | 1,482 | | | | 1,086 | | | | 6,963 | | | | (9,747 | ) | | | (216 | ) |
At 31 December 2012 | | | 16,902 | | | | 7,187 | | | | 31,601 | | | | 21,295 | | | | 76,985 | |
– cost | | | 23,457 | | | | 11,027 | | | | 58,827 | | | | 23,820 | | | | 117,131 | |
– accumulated depreciation and impairment | | | (6,555 | ) | | | (3,840 | ) | | | (27,226 | ) | | | (2,525 | ) | | | (40,146 | ) |
| | | | | |
Non-current assets held under finance leases(g) | | | – | | | | 16 | | | | 33 | | | | – | | | | 49 | |
Other non-current assets pledged as security(h) | | | 1,877 | | | | 226 | | | | 2,023 | | | | 158 | | | | 4,284 | |
| (a) | Mining properties include deferred stripping costs of US$855 million (2012: US$1,188 million). Amortisation of deferred stripping costs of US$70 million (2012: US$105 million; 2011: US$62 million) is included within ‘Depreciation for the year’. |
| (b) | At 31 December 2013, the net book value amount for land and buildings includes freehold US$6,847 million (2012: US$7,071 million); long leasehold US$562 million (2012: US$93 million); and short leasehold US$1 million (2012: US$23 million). |
| (c) | Interest is capitalised at a rate based on the Group’s cost of borrowing or at the rate on project specific debt, where applicable. The Group’s average borrowing rate used for capitalisation of interest is four per cent (2012: 4.6 per cent). |
| (d) | Assets within operations for which production is not expected to fluctuate significantly from one year to another or which have a physical life shorter than the related mine are depreciated on a straight line basis as follows: |
| | Other plant and equipment: 3 to 35 years |
| | Power assets: 25 to 100 years |
| | Capital work in progress: Not depreciated |
| (e) | During 2013, impairment charges primarily relate to the aluminium and copper business. During 2012, impairment charges primarily related to the aluminium businesses and Argyle. During 2011 the impairment charge primarily related to the aluminium business. Refer to note 6 for details. |
| (f) | ‘Transfers and other movements’ includes reclassifications between categories, including transfer to assets of disposal groups held for sale. |
| (g) | The finance leases under which these assets are held are disclosed in note 23. |
| (h) | Excludes assets held under finance leases. Non-current assets pledged as security represent amounts pledged as collateral against US$865 million (2012: US$996 million) of loans, which are included in note 22. |
| | | | |
| | 146 riotinto.com/reportingcentre2013 | | |
| 15 | Investments in equity accounted units |
| | | | | | | | |
| Summary statement of financial position (Rio Tinto share) | | 2013 US$m | | | Restated 2012 US$m | |
Rio Tinto’s share of assets | | | | | | | | |
– Non-current assets | | | 5,860 | | | | 6,318 | |
– Current assets | | | 1,197 | | | | 1,916 | |
| | | | 7,057 | | | | 8,234 | |
Rio Tinto’s share of liabilities | | | | | | | | |
– Current liabilities | | | (791 | ) | | | (1,342 | ) |
– Non-current liabilities | | | (2,309 | ) | | | (2,951 | ) |
| | | | (3,100 | ) | | | (4,293 | ) |
Rio Tinto’s share of net assets(a) (b) | | | 3,957 | | | | 3,941 | |
| (a) | Further details of investments in equity accounted units are set out in notes 35 and 36. |
| (b) | The impact of impairment charges on the Group’s investments in equity accounted units are summarised in note 6. |
| | At 31 December 2013 and 2012 the Group had no investment in equity accounted units with shares listed on recognised stock exchanges. |
| (c) | At 31 December 2013, net debt of equity accounted units, excluding amounts due to Rio Tinto, was US$991 million (2012: US$814 million), none of which (2012: US$15 million) was with recourse to Rio Tinto. |
| | | | | | | | |
| | | 2013
US$m | | | Restated
2012
US$m | |
Raw materials and purchased components | | | 1,116 | | | | 1,421 | |
Consumable stores | | | 1,596 | | | | 1,861 | |
Work in progress | | | 1,721 | | | | 1,982 | |
Finished goods and goods for resale | | | 1,815 | | | | 1,534 | |
| | | | 6,248 | | | | 6,798 | |
Comprising: | | | | | | | | |
Expected to be used within one year | | | 5,737 | | | | 6,375 | |
Expected to be used after more than one year | | | 511 | | | | 423 | |
| | | | 6,248 | | | | 6,798 | |
Inventory write downs, net of reversals, amounting to US$201 million (2012: US$208 million; 2011: US$184 million) were recognised during the year.
| | | | | | | | |
| | | 2013 US$m | | | Restated 2012 US$m | |
At 1 January | | | 1,669 | | | | 4,436 | |
Adjustment on currency translation | | | (201 | ) | | | 60 | |
Credited to the income statement | | | (1,676 | ) | | | (3,298 | ) |
Charged/(credited) to statement of comprehensive income(a) | | | 697 | | | | (54 | ) |
Newly consolidated operations (note 37)(b) | | | 1 | | | | 1,027 | |
Transfer to asset held for sale (note 19) | | | – | | | | (93 | ) |
Other movements(c) | | | 95 | | | | (409 | ) |
At 31 December | | | 585 | | | | 1,669 | |
| | |
Comprising: | | | | | | | | |
– deferred tax liabilities(d) (e) | | | 4,140 | | | | 5,145 | |
– deferred tax assets(d) (f) (g) | | | (3,555 | ) | | | (3,476 | ) |
Deferred tax balances for which there is a right of offset within the same jurisdiction are presented net on the face of the statement of financial position as permitted by IAS 12. The closing deferred tax liabilities and assets, prior to this offsetting of balances, are shown in the table following.
| | | | |
| | 147 riotinto.com/reportingcentre2013 | | |
Notes to the 2013 financial statements continued
| 17 | Deferred taxation continued |
| | | | | | | | |
| | | Total
2013
US$m | | | Restated
Total
2012
US$m | |
| Deferred tax liabilities arising from: | | | | | | | | |
| Capital allowances | | | 6,391 | | | | 7,777 | |
| Unremitted earnings | | | 637 | | | | 495 | |
| Capitalised interest | | | 348 | | | | 683 | |
| Unrealised exchange gains | | | 91 | | | | 738 | |
| Other temporary differences | | | 761 | | | | 954 | |
| | | | 8,228 | | | | 10,647 | |
| | |
| Deferred tax assets arising from: | | | | | | | | |
| Tax losses | | | (2,496 | ) | | | (2,101 | ) |
| Provisions | | | (2,084 | ) | | | (1,691 | ) |
| Capital allowances(h) | | | (1,289 | ) | | | (2,633 | ) |
| Post retirement benefits | | | (1,036 | ) | | | (1,781 | ) |
| Unrealised exchange losses | | | (184 | ) | | | (246 | ) |
| Other temporary differences | | | (554 | ) | | | (526 | ) |
| | | | (7,643 | ) | | | (8,978 | ) |
| | |
| (Credited)/charged to the income statement | | | | | | | | |
| Unrealised exchange losses | | | (566 | ) | | | 58 | |
| Tax losses | | | (563 | ) | | | (426 | ) |
| Provisions | | | (434 | ) | | | (4 | ) |
| Decelerated capital allowances | | | (44 | ) | | | (3,092 | ) |
| Tax on unremitted earnings | | | (3 | ) | | | (26 | ) |
| Post retirement benefits | | | 68 | | | | 72 | |
| Other temporary differences | | | (134 | ) | | | 120 | |
| | | | (1,676 | ) | | | (3,298 | ) |
| (a) | The amounts credited directly to the Statement of comprehensive income relate to tax relief on share options, provisions for tax on exchange differences on intragroup loans qualifying for reporting as part of the net investment in subsidiaries, on cash flow hedges and on actuarial gains and losses on pension schemes, and on post retirement healthcare plans. |
| (b) | Deferred tax relating to newly consolidated operations in 2012 is principally the result of deferred tax liabilities arising on the difference between the fair value and the tax base of the assets of Richards Bay Minerals and Turquoise Hill Resources Ltd. Refer to note 37. |
| (c) | ‘Other movements’ include deferred tax relating to tax payable recognised by subsidiary holding companies on the profits of the equity accounted units to which it relates. |
| (d) | The deferred tax liability of US$4,140 million (2012: US$5,145 million) includes US$4,139 million (2012: US$5,143 million) due in more than one year. The deferred tax asset of US$3,555 million (2012: US$3,476 million) includes US$3,426 million (2012: US$3,331 million) receivable in more than one year. |
| (e) | Deferred tax is not recognised on the unremitted earnings of subsidiaries and joint ventures where the Group is able to control the timing of the remittance and it is probable that there will be no remittance in the foreseeable future. If these earnings were remitted, tax of US$183 million (2012: US$198 million) would be payable. |
| (f) | US$14,200 million (2012: US$15,154 million) of potential deferred tax assets have not been recognised as assets in the financial statements. US$10,664 million (2012: $12,631 million) of the potential assets relate to temporary differences that are deductible for the purposes of Minerals Resource Rent Tax (MRRT). US$1,274 million (2012: US$1,034 million) of the potential assets relate to trading losses in France, which were acquired as part of the Alcan acquisition. US$652 million (2012: US$447 million) of the potential assets relate to realised or unrealised capital losses, recovery of which depends on the existence of capital gains in future years. There is a time limit, the shortest of which is one year, for the recovery of US$343 million of these potential assets (2012: US$116 million). |
| (g) | There is a limited time period, the shortest of which is four years, for the recovery of US$1,384 million (2012: US$1,017 million) of tax losses and other tax assets which have been recognised as deferred tax assets in the financial statements. |
| (h) | Deferred tax assets arising from capital allowances include amounts arising following the introduction of the Minerals Resource Rent Tax (MRRT) on 1 July 2012. Refer to note 9. |
| | | | |
| | 148 riotinto.com/reportingcentre2013 | | |
| 18 | Trade and other receivables |
| | | | | | | | | | | | | | | | | | | | | | | | |
| | | Non-current
2013 US$m | | | Current
2013
US$m | | | Total
2013
US$m | | | Restated
Non-current
2012 US$m | | | Restated
Current
2012
US$m | | | Restated
Total
2012
US$m | |
Trade receivables(a) | | | 5 | | | | 2,987 | | | | 2,992 | | | | – | | | | 3,292 | | | | 3,292 | |
Other receivables(b) | | | 1,150 | | | | 1,212 | | | | 2,362 | | | | 1,301 | | | | 1,475 | | | | 2,776 | |
Prepayment of tolling charges to jointly controlled entities(c) | | | 479 | | | | – | | | | 479 | | | | 484 | | | | – | | | | 484 | |
Pension surpluses (note 45) | | | 290 | | | | – | | | | 290 | | | | 154 | | | | – | | | | 154 | |
Amounts due from equity accounted units | | | – | | | | 136 | | | | 136 | | | | – | | | | 238 | | | | 238 | |
| Other prepayments | | | 216 | | | | 332 | | | | 548 | | | | 326 | | | | 336 | | | | 662 | |
| | | | 2,140 | | | | 4,667 | | | | 6,807 | | | | 2,265 | | | | 5,341 | | | | 7,606 | |
| (a) | At 31 December 2013, trade and other receivables are stated net of provisions for doubtful debts of US$12 million (2012: US$23 million). Amounts of US$10 million (2012: US$21 million) were impaired; the majority of these receivable more than 90 days overdue. |
| (b) | Non-current receivables at 31 December 2013 included a US$700 million (2012: US$700 million) prepayment for an intangible asset, as a result of signing the agreement for the Simandou iron ore project in 2012. |
| (c) | Rio Tinto Aluminium has made certain prepayments to equity accounted units for toll processing of alumina. These prepayments will be charged to Group operating costs as processing takes place. |
There is no material element of trade and other receivables that is interest bearing.
The fair value of current trade and other receivables, including the majority of amounts classified as non-current assets, approximates their carrying value.
As of 31 December 2013, trade and other receivables of US$178 million (2012: US$190 million) were past due but not impaired. The ageing of these receivables is as follows:
| | | | | | | | |
| | | 2013
US$m | | | 2012
US$m | |
| less than 30 days overdue | | | 57 | | | | 117 | |
| between 30 and 60 days overdue | | | 71 | | | | 22 | |
| between 60 and 90 days overdue | | | 47 | | | | 19 | |
| more than 90 days overdue | | | 3 | | | | 32 | |
| | | | 178 | | | | 190 | |
These relate to a number of customers for whom there is no recent history of default or other indicators of impairment.
With respect to trade and other receivables that are neither impaired nor past due, there are no indications as of the reporting date that the debtors will not meet their payment obligations.
| 19 | Assets and liabilities held for sale |
At 31 December 2013 assets and liabilities held for sale comprise the Group’s 50.1 per cent interest in the Clermont Joint Venture (Clermont), its 71.2 per cent interest in the Blair Athol Coal project (Blair Athol), and Zululand Anthracite Colliery (ZAC), which was acquired with Rio Tinto Coal Mozambique in 2011. On 25 October 2013, Rio Tinto announced that it had reached a binding agreement to sell its interest in Clermont to GS Coal Pty Ltd, a company jointly owned by Glencore Xstrata and Sumitomo Corporation, for US$1.015 billion. The sale is conditional upon certain conditions precedent, including customary regulatory approval. On 3 October, the Rio Tinto Coal Australia managed Blair Athol Coal Joint Venture signed a conditional Sale and Purchase Agreement to transfer its interests in Blair Athol to New Emerald Coal Ltd (NEC), a subsidiary of Linc Energy Ltd. The transaction is expected to complete during the first half of 2014. Rio Tinto ceased mining at Blair Athol in November 2012.
In relation to Clermont and Blair Athol, assets held for sale include: property, plant and equipment of US$807 million and other assets of US$81 million; liabilities held for sale include: provisions of US$95 million and other liabilities of US$44 million.
At 31 December 2012 assets and liabilities held for sale comprised Palabora Mining Company Limited and ZAC. The sale of Palabora to a consortium comprising South African and Chinese entities led by the Industrial Development Corporation of South Africa Limited and Hebei Iron & Steel Group completed on 31 July 2013.
At 31 December 2011 assets and liabilities held for sale comprised ZAC.
| | | | |
| | 149 riotinto.com/reportingcentre2013 | | |
Notes to the 2013 financial statements continued
| | | | | | | | | | | | | | | | | | | | | | | | |
| | | Non-current
2013 US$m | | | Current
2013
US$m | | | Total
2013
US$m | | | Restated
Non-current
2012 US$m | | | Restated
Current
2012
US$m | | | Restated
Total
2012
US$m | |
| Derivative financial instruments | | | 403 | | | | 63 | | | | 466 | | | | 414 | | | | 29 | | | | 443 | |
| Equity shares and quoted funds | | | 157 | | | | 122 | | | | 279 | | | | 298 | | | | 71 | | | | 369 | |
| Other investments, including loans | | | 339 | | | | 167 | | | | 506 | | | | 372 | | | | 167 | | | | 539 | |
| Loans to equity accounted units | | | 1 | | | | 93 | | | | 94 | | | | 13 | | | | 269 | | | | 282 | |
| Tax recoverable | | | 83 | | | | 265 | | | | 348 | | | | 86 | | | | 153 | | | | 239 | |
| | | | 983 | | | | 710 | | | | 1,693 | | | | 1,183 | | | | 689 | | | | 1,872 | |
Detailed information relating to other financial assets is given in note 30.
| 21 | Cash and cash equivalents |
| | | | | | | | | | | | |
| | | Note | | | 2013
US$m | | | Restated
2012
US$m | |
| Cash at bank and in hand | | | | | | | 1,548 | | | | 1,320 | |
| Other short term deposits | | | | | | | 8,668 | | | | 5,815 | |
| Balance per Group statement of financial position | | | | | | | 10,216 | | | | 7,135 | |
| Bank overdrafts repayable on demand (unsecured) | | | 22 | | | | (7 | ) | | | (97 | ) |
| Cash and cash equivalents included in Assets held for sale | | | | | | | – | | | | 234 | |
Balance per Group cash flow statement | | | | | | | 10,209 | | | | 7,272 | |
US$570 million (2012: US$108 million) of cash and cash equivalents is held in countries where there are restrictions on remittances. Of this balance US$402 million (2012: US$87million) could be used to repay subsidiaries’ third party borrowings.
There are also restrictions on a further US$652 million (2012: US$546 million) of cash and cash equivalents, the majority of which is held by partially owned entities and is not available for use in the wider Group due to the legal and contractual restrictions currently in place. Of this balance US$119 million (2012: US$199 million) could be used to repay subsidiaries’ third party borrowings.
| | | | |
| | 150 riotinto.com/reportingcentre2013 | | |
| 22 | Borrowings and other financial liabilities |
| | | | | | | | | | | | | | | | | | | | | | | | | | | | |
| Borrowings at 31 December | | Note | | | Non-current
2013 US$m | | | Current
2013
US$m | | | Total
2013
US$m | | | Restated
Non-current
2012 US$m | | | Restated
Current
2012
US$m | | | Restated
Total
2012
US$m | |
USD Commercial Paper | | | | | | | – | | | | 156 | | | | 156 | | | | – | | | | 200 | | | | 200 | |
Rio Tinto Finance (USA) Limited Bonds 8.95% 2014 (a) | | | | | | | – | | | | 1,907 | | | | 1,907 | | | | 1,935 | | | | – | | | | 1,935 | |
Alcan Inc. Global Notes 5.2% due 2014(a) | | | | | | | – | | | | 499 | | | | 499 | | | | 498 | | | | – | | | | 498 | |
Rio Tinto Finance (USA) Limited Bonds 1.875% 2015 | | | | | | | 500 | | | | – | | | | 500 | | | | 500 | | | | – | | | | 500 | |
Rio Tinto Finance (USA) plc Bonds 1.125% 2015 | | | | | | | 499 | | | | – | | | | 499 | | | | 498 | | | | – | | | | 498 | |
Rio Tinto Finance (USA) plc Bonds LIBOR plus 0.55% 2015 | | | | | | | 250 | | | | – | | | | 250 | | | | – | | | | – | | | | – | |
Alcan Inc. Global Notes 5.0% due 2015(a) | | | | | | | 499 | | | | – | | | | 499 | | | | 501 | | | | – | | | | 501 | |
Rio Tinto Finance (USA) Limited Bonds 2.500% 2016 | | | | | | | 698 | | | | – | | | | 698 | | | | 696 | | | | – | | | | 696 | |
Rio Tinto Finance (USA) Limited Bonds 2.250% 2016 | | | | | | | 498 | | | | – | | | | 498 | | | | 497 | | | | – | | | | 497 | |
Rio Tinto Finance (USA) plc Bonds 1.375% 2016 | | | | | | | 996 | | | | – | | | | 996 | | | | – | | | | – | | | | – | |
Rio Tinto Finance (USA) plc Bonds LIBOR plus 0.84% 2016 | | | | | | | 499 | | | | – | | | | 499 | | | | – | | | | – | | | | – | |
Rio Tinto Finance (USA) plc Bonds 2.0% 2017 | | | | | | | 499 | | | | – | | | | 499 | | | | 499 | | | | – | | | | 499 | |
Rio Tinto Finance (USA) plc Bonds 1.625% 2017 | | | | | | | 1,243 | | | | – | | | | 1,243 | | | | 1,241 | | | | – | | | | 1,241 | |
Rio Tinto Finance (USA) Limited Bonds 6.5% 2018(a) | | | | | | | 1,979 | | | | – | | | | 1,979 | | | | 2,059 | | | | – | | | | 2,059 | |
Rio Tinto Finance (USA) plc Bonds 2.250% 2018 | | | | | | | 1,238 | | | | – | | | | 1,238 | | | | – | | | | – | | | | – | |
Rio Tinto Finance (USA) Limited Bonds 9.0% 2019(a) | | | | | | | 1,467 | | | | – | | | | 1,467 | | | | 1,456 | | | | – | | | | 1,456 | |
Rio Tinto Finance (USA) Limited Bonds 3.5% 2020 | | | | | | | 995 | | | | – | | | | 995 | | | | 994 | | | | – | | | | 994 | |
Rio Tinto Finance plc Euro Bonds 2.0% due 2020 (a) (b) | | | | | | | 999 | | | | – | | | | 999 | | | | 971 | | | | – | | | | 971 | |
Rio Tinto Finance (USA) Limited Bonds 4.125% 2021 | | | | | | | 996 | | | | – | | | | 996 | | | | 997 | | | | – | | | | 997 | |
Rio Tinto Finance (USA) Limited Bonds 3.750% 2021 | | | | | | | 1,145 | | | | – | | | | 1,145 | | | | 1,143 | | | | – | | | | 1,143 | |
Rio Tinto Finance (USA) plc Bonds 3.5% 2022 | | | | | | | 992 | | | | – | | | | 992 | | | | 992 | | | | – | | | | 992 | |
Rio Tinto Finance (USA) plc Bonds 2.875% 2022 | | | | | | | 985 | | | | – | | | | 985 | | | | 984 | | | | – | | | | 984 | |
Rio Tinto Finance plc Euro Bonds 2.875% due 2024 (a) (b) | | | | | | | 639 | | | | – | | | | 639 | | | | 636 | | | | – | | | | 636 | |
Rio Tinto Finance (USA) Limited Bonds 7.125% 2028 (a) | | | | | | | 934 | | | | – | | | | 934 | | | | 1,053 | | | | – | | | | 1,053 | |
Alcan Inc. Debentures 7.25% due 2028 | | | | | | | 107 | | | | – | | | | 107 | | | | 107 | | | | – | | | | 107 | |
Rio Tinto Finance plc Sterling Bonds 4.0% due 2029 (a) (b) | | | | | | | 822 | | | | – | | | | 822 | | | | 804 | | | | – | | | | 804 | |
Alcan Inc. Debentures 7.25% due 2031 | | | | | | | 430 | | | | – | | | | 430 | | | | 432 | | | | – | | | | 432 | |
Alcan Inc. Global Notes 6.125% due 2033 | | | | | | | 739 | | | | – | | | | 739 | | | | 738 | | | | – | | | | 738 | |
Alcan Inc. Global Notes 5.75% due 2035 | | | | | | | 284 | | | | – | | | | 284 | | | | 283 | | | | – | | | | 283 | |
Rio Tinto Finance (USA) Limited Bonds 5.2% 2040 | | | | | | | 1,147 | | | | – | | | | 1,147 | | | | 1,146 | | | | – | | | | 1,146 | |
Rio Tinto Finance (USA) plc Bonds 4.75% 2042 | | | | | | | 490 | | | | – | | | | 490 | | | | 489 | | | | – | | | | 489 | |
Rio Tinto Finance (USA) plc Bonds 4.125% 2042 | | | | | | | 725 | | | | – | | | | 725 | | | | 725 | | | | – | | | | 725 | |
Alcan Inc. Global Notes 4.50% due 2013(a) | | | | | | | – | | | | – | | | | – | | | | – | | | | 498 | | | | 498 | |
Rio Tinto Finance (USA) Limited Bonds 5.875% 2013 (a) | | | | | | | – | | | | – | | | | – | | | | – | | | | 595 | | | | 595 | |
Rio Tinto Finance (USA) Limited Bonds 7.125% 2013 (a) | | | | | | | – | | | | – | | | | – | | | | – | | | | 100 | | | | 100 | |
Loans from equity accounting units | | | | | | | 9 | | | | 77 | | | | 86 | | | | 111 | | | | 5 | | | | 116 | |
Other secured loans | | | | | | | 651 | | | | 214 | | | | 865 | | | | 918 | | | | 78 | | | | 996 | |
Other unsecured loans | | | | | | | 551 | | | | 1,049 | | | | 1,600 | | | | 519 | | | | 590 | | | | 1,109 | |
Finance leases | | | 23 | | | | 39 | | | | 7 | | | | 46 | | | | 55 | | | | 12 | | | | 67 | |
| Bank overdrafts | | | 21 | | | | – | | | | 7 | | | | 7 | | | | – | | | | 97 | | | | 97 | |
Total borrowings including overdrafts(c) | | | | | | | 24,544 | | | | 3,916 | | | | 28,460 | | | | 24,477 | | | | 2,175 | | | | 26,652 | |
| (a) | These borrowings are subject to the hedging arrangements summarised below. |
| (b) | Rio Tinto has a US$10 billion (2012: US$10 billion) European Debt Issuance Programme (EDIP) against which the cumulative amount utilised was US$2.6 billion equivalent at 31 December 2013 (2012: US$2.4 billion). The carrying value of these bonds after hedge accounting adjustments amounted to US$2.5 billion (2012: US$2.4 billion) in aggregate. |
| (c) | The Group’s borrowings of US$28.5 billion (2012: US$26.7 billion) include some US$3.3 billion (2012: US$4.1 billion) which relates to subsidiary entity borrowings that are without recourse to the Group, of which US$0.7 billion (2012: US$0.8 billion) are subject to various financial and general covenants with which the respective borrowers were in compliance as at 31 December 2013. |
| | | | |
| | 151 riotinto.com/reportingcentre2013 | | |
Notes to the 2013 financial statements continued
| 22 | Borrowings and other financial liabilities continued |
Other financial liabilities
| | | | | | | | | | | | | | | | | | | | | | | | |
| | | Non-current
2013 US$m | | | Current
2013
US$m | | | Total
2013
US$m | | | Restated
Non-current
2012 US$m | | | Restated
Current
2012
US$m | | | Restated
Total
2012
US$m | |
Derivative financial instruments | | | 31 | | | | 10 | | | | 41 | | | | 171 | | | | 23 | | | | 194 | |
| Other financial liabilities | | | 50 | | | | – | | | | 50 | | | | 58 | | | | – | | | | 58 | |
| Total other financial liabilities | | | 81 | | | | 10 | | | | 91 | | | | 229 | | | | 23 | | | | 252 | |
| | | | | | | | | | | | | | | | | | | | | | | | | |
Total borrowings and other financial liabilities | | | 24,625 | | | | 3,926 | | | | 28,551 | | | | 24,706 | | | | 2,198 | | | | 26,904 | |
Detailed information relating to other financial liabilities is given in note 30.
Swap arrangements
At 31 December 2013, US$4.2 billion (2012: US$5.4 billion) US dollar notional of the fixed rate US dollar borrowings were swapped to floating US dollar rates, US$1.6 billion (2012: US$1.6 billion) US dollar notional equivalent of Euro borrowings were fully swapped to floating US dollar rates and US$0.8 billion (2012: US$0.8billion) US dollar notional equivalent of Pound Sterling borrowings were fully swapped to fixed US dollar rates. The Rio Tinto Finance plc Sterling Bond 4.0% due 2029 has been designated as a cash flow hedge.
Other borrowings have been swapped to floating rates and fair value hedge accounting has been applied except for: US$250 million (2012: US$250 million) of the Rio Tinto Finance (USA) Limited Bonds 8.95% due 2014, US$750 million (2012: US$750 million) of the Rio Tinto Finance (USA) Limited Bonds 6.5% due 2018, US$75 million (2012: US$75 million) of the Rio Tinto Finance (USA) Limited Bonds 7.125% due 2028, and US$200 million (2012: US$200 million) of the Alcan Inc. Global Notes 5.2% due 2014. In addition, at 31 December 2012, US$100 million of the Rio Tinto Finance (USA) Limited Bonds 7.125% due 2013, and US$87 million of the Rio Tinto Finance (USA) Limited Bonds 5.875% due 2013 were swapped but not in a fair value hedge.
The fair value of interest rate and cross currency interest rate swap assets and liabilities at 31 December 2013 was US$192 million (2012: US$347 million) and US$14 million (2012: US$44 million), respectively. These are included in ‘other financial assets’ and ‘other financial liabilities’ in the statement of financial position.
Details of the major interest rate and cross currency interest rate swaps are shown in note 30. US$0.7 billion (2012: US$0.8 billion) of borrowings were subject to financial covenants.
| 23 | Capitalised finance leases |
| | | | | | | | | | | | |
| | | Note | | | 2013
US$m | | | Restated
2012
US$m | |
| Present value of minimum lease payments | | | | | | | | | | | | |
Total minimum lease payments | | | | | | | 48 | | | | 69 | |
| Effect of discounting | | | | | | | (2 | ) | | | (2 | ) |
| | | | 14 | | | | 46 | | | | 67 | |
| | | |
| Payments under capitalised finance leases | | | | | | | | | | | | |
Due within one year | | | | | | | 7 | | | | 12 | |
Between 1 and 3 years | | | | | | | 13 | | | | 11 | |
Between 3 and 5 years | | | | | | | 11 | | | | 13 | |
| More than 5 years | | | | | | | 15 | | | | 31 | |
| | | | 14 | | | | 46 | | | | 67 | |
| | | | |
| | 152 riotinto.com/reportingcentre2013 | | |
| | | | | | | | |
| | | 2013
US$m | | | Restated
2012
US$m | |
Analysis of changes in consolidated net debt | | | | | | | | |
Opening balance | | | (19,192 | ) | | | (8,342 | ) |
Adjustment on currency translation | | | 2,051 | | | | (411 | ) |
Exchange (losses)/gains (charged)/credited to the income statement(a) | | | (2,120 | ) | | | 417 | |
Cash movements excluding exchange movements | | | 1,076 | | | | (10,412 | ) |
Net funds/(debt) of acquired companies | | | 14 | | | | (540 | ) |
Other movements | | | 116 | | | | 96 | |
| Closing balance | | | (18,055 | ) | | | (19,192 | ) |
| | |
Total borrowings in statement of financial position (note 22) | | | (28,460 | ) | | | (26,652 | ) |
Derivatives related to net debt (included in ‘Other financial assets/liabilities’) (note 30) | | | 173 | | | | 294 | |
EAU funded balances excluded from net debt(b) | | | 16 | | | | 31 | |
| Adjusted total borrowings | | | (28,271 | ) | | | (26,327 | ) |
Cash and cash equivalents (note 21) | | | 10,216 | | | | 7,135 | |
Consolidated net debt | | | (18,055 | ) | | | (19,192 | ) |
| | | | | | | | | | | | |
| | | 2013
US$m | | | Restated
2012 US$m | | | Restated 2011 US$m | |
Exchange (losses)/gains on US dollar net debt and intragroup balances excluded from Underlying earnings | | | | | | | | | | | | |
Exchange (losses)/gains on US dollar net debt | | | (2,098 | ) | | | 416 | | | | (186 | ) |
Exchange (losses)/gains on intragroup balances | | | (1,574 | ) | | | 54 | | | | 42 | |
Exchange gains/(losses) on loans from equity accounted units | | | – | | | | 4 | | | | (1 | ) |
Exchange gains/(losses) on settlement of dividend | | | – | | | | 18 | | | | (16 | ) |
(Charged)/credited to income statement | | | (3,672 | ) | | | 492 | | | | (161 | ) |
| (a) | Exchange gains taken to the income statement include amounts excluded from Underlying earnings. |
| (b) | EAU funded balances are defined as amounts owed by partially owned subsidiaries to EAUs, where such funding was provided to the EAU by the Group. |
Further information relating to the currency and interest rate exposures arising from net debt and related derivatives is given in note 30.
| 25 | Trade and other payables |
| | | | | | | | | | | | | | | | | | | | | | | | |
| | | Non-current 2013 US$m | | | Current 2013 US$m | | | Total 2013 US$m | | | Restated Non-current 2012 US$m | | | Restated
Current
2012
US$m | | | Restated
Total
2012
US$m | |
Trade payables | | | 2 | | | | 3,095 | | | | 3,097 | | | | – | | | | 3,317 | | | | 3,317 | |
Accruals and deferred income | | | 146 | | | | 2,481 | | | | 2,627 | | | | 190 | | | | 3,190 | | | | 3,380 | |
Other payables(a) | | | 164 | | | | 1,112 | | | | 1,276 | | | | 226 | | | | 1,129 | | | | 1,355 | |
Employee entitlements | | | – | | | | 861 | | | | 861 | | | | 55 | | | | 884 | | | | 939 | |
Royalties and mining taxes | | | 2 | | | | 682 | | | | 684 | | | | – | | | | 539 | | | | 539 | |
Amounts owed to equity accounted units | | | 135 | | | | 155 | | | | 290 | | | | – | | | | 357 | | | | 357 | |
Government grants deferred | | | 127 | | | | 14 | | | | 141 | | | | 134 | | | | 4 | | | | 138 | |
| | | | 576 | | | | 8,400 | | | | 8,976 | | | | 605 | | | | 9,420 | | | | 10,025 | |
| (a) | “Other payables” include deferred consideration of US$54 million (2012: US$82 million) relating to acquired assets. All other accounts payable and accruals are non interest bearing. |
Due to their short term maturities, the fair value of trade and other payables approximates their carrying value.
| | | | |
| | 153 riotinto.com/reportingcentre2013 | | |
Notes to the 2013 financial statements continued
| 26 | Provisions (including post retirement benefits) |
| | | | | | | | | | | | | | | | | | | | | | | | |
| | |
| Pensions
and post retirement healthcare US$m |
(a) | |
| Other
employeeentitlements US$m |
(b) | |
| Close down
and restoration/
environmental(c) (d) (e) (f) US$m |
| |
| Other
US$m |
| |
| Total
2013
US$m |
| |
| Restated
Total
2012
US$m |
|
| At 1 January | | | 6,205 | | | | 873 | | | | 9,223 | | | | 680 | | | | 16,981 | | | | 19,635 | |
| Adjustment on currency translation | | | (188 | ) | | | (102 | ) | | | (749 | ) | | | (42 | ) | | | (1,081 | ) | | | 371 | |
| Adjustments to mining properties (note 14)(f) | | | | | | | | | | | | | | | | | | | | | | | | |
– changes in estimate | | | – | | | | – | | | | 391 | | | | – | | | | 391 | | | | (1,869 | ) |
– change in discount rate | | | – | | | | – | | | | – | | | | – | | | | – | | | | (1,136 | ) |
| Charged/(credited) to profit: | | | | | | | | | | | | | | | | | | | | | | | | |
– increases to existing provisions | | | 449 | | | | 430 | | | | 117 | | | | 175 | | | | 1,171 | | | | 819 | |
– new provisions | | | – | | | | 111 | | | | 2 | | | | 342 | | | | 455 | | | | 339 | |
– change in discount rate | | | – | | | | – | | | | – | | | | – | | | | – | | | | (130 | ) |
– unused amounts reversed | | | – | | | | (7 | ) | | | (144 | ) | | | (18 | ) | | | (169 | ) | | | (137 | ) |
– exchange gains on provisions | | | – | | | | – | | | | (8 | ) | | | – | | | | (8 | ) | | | (5 | ) |
– amortisation of discount | | | – | | | | 3 | | | | 374 | | | | – | | | | 377 | | | | 451 | |
| Utilised in year | | | (635 | ) | | | (369 | ) | | | (301 | ) | | | (201 | ) | | | (1,506 | ) | | | (1,535 | ) |
| Actuarial losses recognised in equity | | | (2,204 | ) | | | – | | | | – | | | | – | | | | (2,204 | ) | | | 375 | |
| Newly consolidated operations (note 37) | | | – | | | | 1 | | | | 17 | | | | – | | | | 18 | | | | 87 | |
| Subsidiaries no longer consolidated | | | (24 | ) | | | (8 | ) | | | (247 | ) | | | 19 | | | | (260 | ) | | | (93 | ) |
Transfers to assets held for sale | | | – | | | | (4 | ) | | | (97 | ) | | | (3 | ) | | | (104 | ) | | | (135 | ) |
Transfers and other movements | | | (4 | ) | | | 13 | | | | 4 | | | | 7 | | | | 20 | | | | (56 | ) |
At 31 December | | | 3,599 | | | | 941 | | | | 8,582 | | | | 959 | | | | 14,081 | | | | 16,981 | |
Statement of financial position analysis: | | | | | | | | | | | | | | | | | | | | | | | | |
| Current | | | 130 | | | | 747 | | | | 467 | | | | 394 | | | | 1,738 | | | | 1,539 | |
Non-current | | | 3,469 | | | | 194 | | | | 8,115 | | | | 565 | | | | 12,343 | | | | 15,442 | |
Total | | | 3,599 | | | | 941 | | | | 8,582 | | | | 959 | | | | 14,081 | | | | 16,981 | |
| (a) | The main assumptions used to determine the provision for pensions and post retirement healthcare, and other information, including the expected level of future funding payments in respect of those arrangements, are given in note 45. |
| (b) | The provision for other employee entitlements includes a provision for long service leave of US$314 million (2012: US$347 million), based on the relevant entitlements in certain Group operations and includes US$193 million (2012: US$77 million) of provision for redundancy and severance payments. |
| (c) | The Group’s policy on close down and restoration costs is described in note 1(k) and in paragraph (v) under ‘critical accounting policies and estimates’ on pages 125 and 129. Close down and restoration costs are a normal consequence of mining, and the majority of close down and restoration expenditure is incurred at the end of the relevant operation. Remaining lives of mines and infrastructure range from one to over 50 years with an average, weighted by closure provision, of around 21 years (2012: 21 years). Although the ultimate cost to be incurred is uncertain, the Group’s businesses estimate their respective costs based on feasibility and engineering studies using current restoration standards and techniques. Provisions of US$8,582 million (2012: US$9,223 million) for close down and restoration costs and environmental clean up obligations include estimates of the effect of future inflation and have been adjusted to reflect risk. These estimates have been discounted to their present value at an average nominal rate of approximately four per cent per annum, based on an estimate of the long term, risk free, pre-tax cost of borrowing. Before discounting, this provision is equivalent to some US$12.9 billion (2012: US$13.7 billion). |
| (d) | Non-current provisions for close down and restoration/environmental expenditure include amounts relating to environmental clean-up of US$327 million (2012: US$507 million) expected to take place between one and five years from the statement of financial position date, and US$909 million (2012: US$793 million) expected to take place later than five years after the statement of financial position date. |
| (e) | Close down and restoration/environmental liabilities at 31 December 2013 have not been adjusted for amounts of US$142 million (2012: US$198 million) relating to insurance recoveries and other financial assets held for the purposes of meeting these obligations. |
| (f) | Close down and restoration/environmental remediation provisions decreased during 2012 following a Group wide review of estimated liabilities. The review included a re-evaluation of the estimates of risk free discount rates in light of the impact of fiscal interventions and, where appropriate, of the probability weighting for the different remediation, closure or other activities required to achieve relinquishment. |
| | | | |
| | 154 riotinto.com/reportingcentre2013 | | |
| 27 | Share capital – Rio Tinto plc |
| | | | | | | | | | | | | | | | | | | | | | | | |
| | | 2013
Number
(million) | | | 2012
Number
(million) | | | 2011
Number
(million) | | | 2013
US$m | | | 2012
US$m | | | 2011
US$m | |
Issued and fully paid up share capital of 10p each | | | | | | | | | | | | | | | | | | | | | | | | |
At 1 January | | | 1,425.376 | | | | 1,453.400 | | | | 1,529.004 | | | | 230 | | | | 234 | | | | 246 | |
Ordinary shares issued(a) (c) | | | 0.001 | | | | – | | | | – | | | | – | | | | – | | | | – | |
Ordinary shares purchased but uncancelled on 1 January(b) | | | – | | | | (1.800 | ) | | | – | | | | – | | | | – | | | | – | |
Own shares purchased and cancelled(b) | | | – | | | | (26.224 | ) | | | (75.604 | ) | | | – | | | | (4 | ) | | | (12 | ) |
At 31 December | | | 1,425.377 | | | | 1,425.376 | | | | 1,453.400 | | | | 230 | | | | 230 | | | | 234 | |
| | | | | | | | | | | | | | | | | | | | | | | | | |
| Shares held by public | | | | | | | | | | | | | | | | | | | | | | | | |
At 1 January | | | 1,411.257 | | | | 1,436.542 | | | | 1,526.305 | | | | | | | | | | | | | |
Shares reissued from treasury(a) | | | 1.437 | | | | 0.939 | | | | 0.875 | | | | | | | | | | | | | |
Shares purchased and cancelled(b) | | | – | | | | (26.224 | ) | | | (75.604 | ) | | | | | | | | | | | | |
Shares purchased and held in treasury(c) | | | – | | | | – | | | | (13.234 | ) | | | | | | | | | | | | |
Shares purchased and awaiting cancellation(b) | | | – | | | | – | | | | (1.800 | ) | | | | | | | | | | | | |
Ordinary shares issued during
2013(a) (c) | | | 0.001 | | | | – | | | | – | | | | | | | | | | | | | |
At 31 December | | | 1,412.695 | | | | 1,411.257 | | | | 1,436.542 | | | | | | | | | | | | | |
| | | | | | |
Shares repurchased and held in treasury(b) | | | 12.682 | | | | 14.119 | | | | 15.058 | | | | | | | | | | | | | |
Shares repurchased and awaiting cancellation(b) | | | – | | | | – | | | | 1.800 | | | | | | | | | | | | | |
Shares held by public | | | 1,412.695 | | | | 1,411.257 | | | | 1,436.542 | | | | | | | | | | | | | |
| Total share capital | | | 1,425.377 | | | | 1,425.376 | | | | 1,453.400 | | | | | | | | | | | | | |
| | | | | | |
Other share classes | | | | | | | | | | | | | | | | | | | | | | | | |
Special Voting Share of 10p each(d) | | | 1 only | | | | 1 only | | | | 1 only | | | | | | | | | | | | | |
DLC Dividend Share of 10p each(d) | | | 1 only | | | | 1 only | | | | 1 only | | | | | | | | | | | | | |
Equalisation Share of 10p each(d) | | | 1 only | | | | 1 only | | | | 1 only | | | | | | | | | | | | | |
| (a) | 951 Ordinary shares were issued in 2013 under the Global Employee Share Plan. 1,436,542 Ordinary shares were reissued from treasury during the year resulting from the exercise of options under Rio Tinto plc employee share based payment plans, with exercise prices between £10.43p and £35.76p per share (2012: no new ordinary shares were issued, and 939,423 Ordinary shares reissued from treasury with exercise prices between £10.43p and £39.46p per share; 2011: no new ordinary shares issued and 875,057 Ordinary shares reissued from treasury with exercise prices between £10.43p and £47.12p per share). |
| (b) | The authority for the Company to buy back its Ordinary shares was renewed at the 2013 annual general meeting. From January to March 2012 26,223,910 shares were bought back and cancelled and 1,800,000 shares purchased and awaiting cancellation at 31 December 2012 were cancelled. No shares were bought back and held in treasury in 2013. |
| (c) | The aggregate consideration for new shares issued under the Global Employee Share Plan was US$45 million (2012: US$39 million; 2011: US$48 million). The difference between the nominal value and the issue price of the shares issued was credited to the share premium account. The aggregate consideration received for treasury shares reissued was US$80 million. No new shares were issued as a result of the exercise of options under Rio Tinto plc employee share based payment plans in 2013, 2012 and 2011. |
| (d) | The ‘Special Voting Share’ was issued to facilitate the joint voting by shareholders of Rio Tinto plc and Rio Tinto Limited on Joint Decisions, following the DLC merger. Directors have the ability to issue an Equalisation Share if that is required under the terms of the DLC Merger Sharing Agreement. The ‘DLC Dividend Share’ was issued to facilitate the efficient management of funds within the DLC structure. |
During 2013, US$42 million of shares and ADRs (2012: US$41 million of shares; 2011: US$86 million of shares) were purchased by employee share ownership trusts on behalf of Rio Tinto plc to satisfy future share options and awards as they vest. At 31 December 2013 715,300 shares and 4,184 ADRs were held in the employee share ownership trusts on behalf of Rio Tinto plc.
Information relating to share options and other share based incentive schemes is given in note 44 on share based payments.
| | | | |
| | 155 riotinto.com/reportingcentre2013 | | |
Notes to the 2013 financial statements continued
| 28 | Share capital – Rio Tinto Limited |
| | | | | | | | | | | | | | | | | | | | | | | | |
| | | 2013
Number
(million) | | | 2012
Number
(million) | | | 2011
Number
(million) | | | 2013
US$m | | | 2012
US$m | | | 2011
US$m | |
Issued and fully paid up share capital | | | | | | | | | | | | | | | | | | | | | | | | |
| At 1 January | | | 435.76 | | | | 435.76 | | | | 435.76 | | | | 5,715 | | | | 5,582 | | | | 5,601 | |
Adjustment on currency translation | | | – | | | | – | | | | – | | | | (804 | ) | | | 133 | | | | (19 | ) |
At 31 December | | | 435.76 | | | | 435.76 | | | | 435.76 | | | | 4,911 | | | | 5,715 | | | | 5,582 | |
– Special Voting Share(a) | | | 1 only | | | | 1 only | | | | 1 only | | | | | | | | | | | | | |
– DLC Dividend Share(a) | | | 1 only | | | | 1 only | | | | 1 only | | | | | | | | | | | | | |
Total share capital(a) | | | 435.76 | | | | 435.76 | | | | 435.76 | | | | | | | | | | | | | |
| (a) | The ‘Special Voting Share’ was issued to facilitate the joint voting by shareholders of Rio Tinto Limited and Rio Tinto plc on Joint Decisions following the DLC merger. Directors have the ability to issue an Equalisation Share if that is required under the terms of the DLC Merger Sharing Agreement. The ‘DLC Dividend Share’ was issued to facilitate the efficient management of funds within the DLC structure. |
Share options exercised during the year to 31 December 2013 under various Rio Tinto Limited employee share option schemes were satisfied by the on-market purchase of Rio Tinto Limited shares by a third party on the Group’s behalf.
Information relating to share options and other share based incentive schemes is given in note 44 on share based payments.
| 29 | Other reserves and retained earnings |
| | | | | | | | | | | | |
| | | 2013 US$m | | | Restated 2012 US$m | | | Restated 2011 US$m | |
Capital redemption reserve(a) | | | | | | | | | | | | |
At 1 January | | | 28 | | | | 24 | | | | 12 | |
Own shares purchased and cancelled | | | – | | | | 4 | | | | 12 | |
At 31 December | | | 28 | | | | 28 | | | | 24 | |
| | | |
Hedging reserves(b) | | | | | | | | | | | | |
At 1 January | | | (68 | ) | | | (44 | ) | | | (155 | ) |
Parent and subsidiaries’ net cash flow hedge fair value gains/(losses) | | | 149 | | | | (60 | ) | | | 84 | |
Parent and subsidiaries’ net cash flow hedge (gains)/losses transferred to the income statement | | | (69 | ) | | | 47 | | | | 81 | |
Net movement on equity accounted units cash flow hedges | | | – | | | | – | | | | 2 | |
Tax on the above | | | (9 | ) | | | (11 | ) | | | (56 | ) |
At 31 December | | | 3 | | | | (68 | ) | | | (44 | ) |
| | | |
Available for sale revaluation reserves(c) | | | | | | | | | | | | |
At 1 January | | | (179 | ) | | | 193 | | | | 427 | |
Losses on available for sale securities | | | (67 | ) | | | (25 | ) | | | (238 | ) |
Losses/(gains) on available for sale securities transferred to the income statement | | | 146 | | | | (355 | ) | | | (19 | ) |
Tax on the above | | | (17 | ) | | | 8 | | | | 23 | |
At 31 December | | | (117 | ) | | | (179 | ) | | | 193 | |
| | | |
Other reserves(d) | | | | | | | | | | | | |
At 1 January | | | 11,778 | | | | 11,765 | | | | 11,785 | |
Own shares purchased from Rio Tinto Limited shareholders to satisfy share options | | | (77 | ) | | | (62 | ) | | | (71 | ) |
Employee share options: value of services | | | 64 | | | | 78 | | | | 71 | |
Deferred tax on share options | | | 1 | | | | (3 | ) | | | (20 | ) |
At 31 December | | | 11,766 | | | | 11,778 | | | | 11,765 | |
| | | |
Foreign currency translation reserve(e) | | | | | | | | | | | | |
At 1 January | | | 3,309 | | | | 2,807 | | | | 3,574 | |
Parent and subsidiaries currency translation and exchange adjustments | | | (2,138 | ) | | | 664 | | | | (878 | ) |
Equity accounted units currency translation adjustments | | | (44 | ) | | | (158 | ) | | | 55 | |
Currency translation reclassified on disposal | | | 81 | | | | (3 | ) | | | 46 | |
Tax on the above | | | (17 | ) | | | (1 | ) | | | 10 | |
At 31 December | | | 1,191 | | | | 3,309 | | | | 2,807 | |
| | | | | | | | | | | | | |
Total other reserves per statement of financial position | | | 12,871 | | | | 14,868 | | | | 14,745 | |
| | | | |
| | 156 riotinto.com/reportingcentre2013 | | |
| | | | | | | | | | | | |
| | | 2013 US$m | | | 2012
US$m | | | 2011
US$m | |
Retained earnings(f) | | | | | | | | | | | | |
At 1 January | | | 21,496 | | | | 27,430 | | | | 32,499 | |
Adjustment in relation to IFRS restatements | | | – | | | | – | | | | (441 | ) |
Parent and subsidiaries’ profit/(loss) for the year | | | 2,796 | | | | (3,859 | ) | | | 4,923 | |
Equity accounted units’ profit after tax for the year | | | 869 | | | | 831 | | | | 912 | |
Actuarial gains/(losses)(g) | | | 2,211 | | | | (311 | ) | | | (1,799 | ) |
Tax relating to components of other comprehensive income | | | (631 | ) | | | 72 | | | | 479 | |
Total comprehensive income/(loss) for the year | | | 5,245 | | | | (3,267 | ) | | | 4,515 | |
Share buyback scheme | | | – | | | | (764 | ) | | | (6,210 | ) |
Dividends paid | | | (3,322 | ) | | | (3,038 | ) | | | (2,236 | ) |
Change in equity interest held by Rio Tinto | | | 102 | | | | 1,128 | | | | (793 | ) |
Own shares purchased/treasury shares reissued for share options and other items(h) | | | 11 | | | | (38 | ) | | | 10 | |
Employee share options and other IFRS 2 charges taken to the income statement | | | 73 | | | | 45 | | | | 86 | |
At 31 December | | | 23,605 | | | | 21,496 | | | | 27,430 | |
| (a) | The capital redemption reserve was set up to comply with section 733 of the Companies Act 2006 (previously 170 of the Companies Act 1985) when shares of a company are redeemed or purchased wholly out of the company’s profits. Balances reflect the amount by which the Company’s issued share capital is diminished in accordance with this section. |
| (b) | The hedging reserve records gains or losses on cash flow hedges that are recognised initially in equity, as described in note 1 (p) (iii). |
| (c) | The available for sale revaluation reserves record fair value gains or losses relating to available for sale securities, as described in note 1 (p) (i) (d). |
| (d) | Other reserves include the cumulative amount recognised under IFRS 2 in respect of options granted but not exercised to acquire shares in Rio Tinto Limited, less, where applicable, the cost of shares purchased to satisfy share options exercised. The cumulative amount recognised under IFRS 2 in respect of options granted but not exercised to acquire shares in Rio Tinto plc is recorded in retained earnings. |
| | Other reserves also include US$11,936 million which represents the difference between the nominal value and issue price of the shares issued arising from Rio Tinto plc’s rights issue completed in July 2009. No share premium was recorded in the Rio Tinto plc financial statements through the operation of the merger relief provisions of the Companies Act 1985. |
| (e) | Exchange differences arising on the translation of the Group’s net investment in foreign controlled companies are taken to the foreign currency translation reserve, as described in note 1(d). The cumulative differences relating to an investment are transferred to the income statement when the investment is disposed of. |
| (f) | Retained earnings and movements in reserves of subsidiaries include those arising from the Group’s share of joint operations. |
| (g) | In 2013, there were no actuarial losses relating to equity accounted units (2012: US$nil; 2011: US$5 million). |
| (h) | In 2011, this is stated net of a US$95 million reclassification between share premium and retained earnings, relating to the weighted average cost of shares held that was applied to the sale of shares in Rio Tinto plc to Rio Tinto Limited, and for the satisfaction of share options, in prior periods. |
| | | | |
| | 157 riotinto.com/reportingcentre2013 | | |
Notes to the 2013 financial statements continued
| 30 | Financial instruments and risk management |
Except where stated, the information given below relates to the financial instruments of the parent companies and their subsidiaries and joint operations, and excludes those of equity accounted units. The information is grouped in the following sections:
A – Financial assets and liabilities by categories
B – Derivative financial instruments
C – Fair values
A (a) Financial assets and liabilities by categories
| | | | | | | | | | | | | | | | | | | | | | | | |
| At 31 December 2013 | | Note | | | Total US$m | | | Loans and receivables US$m | | | Available for sale securities US$m | | | Held at fair value US$m | | | Held to maturity assets/other financial liabilities US$m | |
| Financial assets | | | | | | | | | | | | | | | | | | | | | | | | |
Cash and cash equivalents | | | 21 | | | | 10,216 | | | | 10,216 | | | | – | | | | – | | | | – | |
Trade and other receivables(a) | | | | | | | 5,412 | | | | 5,412 | | | | – | | | | – | | | | – | |
Equity shares and quoted funds | | | 20 | | | | 279 | | | | – | | | | 279 | | | | – | | | | – | |
Other investments, including loans | | | 20 | | | | 506 | | | | 179 | | | | – | | | | 322 | | | | 5 | |
Currency and commodity contracts: designated as hedges(b) | | | 20 | | | | 21 | | | | – | | | | – | | | | 21 | | | | – | |
Derivatives and embedded derivatives not related to net debt: not designated as hedges(b) | | | 20 | | | | 253 | | | | – | | | | – | | | | 253 | | | | – | |
Derivatives related to net debt(b) | | | 20,22,24 | | | | 192 | | | | – | | | | – | | | | 192 | | | | – | |
Loans to equity accounted units including quasi equity loans | | | | | | | 370 | | | | 370 | | | | – | | | | – | | | | – | |
| Total financial assets | | | | | | | 17,249 | | | | 16,177 | | | | 279 | | | | 788 | | | | 5 | |
| | | | | | |
| Financial liabilities | | | | | | | | | | | | | | | | | | | | | | | | |
Trade and other payables(c) | | | | | | | (6,899 | ) | | | | | | | | | | | – | | | | (6,899 | ) |
Short term borrowings and bank overdrafts | | | 22 | | | | (3,916 | ) | | | | | | | | | | | – | | | | (3,916 | ) |
Medium and long term borrowings | | | 22 | | | | (24,544 | ) | | | | | | | | | | | – | | | | (24,544 | ) |
Derivatives related to net debt(b) | | | 22,24 | | | | (19 | ) | | | | | | | | | | | (19 | ) | | | – | |
Other derivatives and embedded derivatives not designated as hedges(b) | | | 22 | | | | (22 | ) | | | | | | | | | | | (22 | ) | | | – | |
| Other financial liabilities | | | 22 | | | | (50 | ) | | | | | | | | | | | – | | | | (50 | ) |
Total financial liabilities | | | | | | | (35,450 | ) | | | | | | | | | | | (41 | ) | | | (35,409 | ) |
| | | | |
| | 158 riotinto.com/reportingcentre2013 | | |
| | | | | | | | | | | | | | | | | | | | | | | | |
| At 31 December 2012 (restated) | | Note | | | Total US$m | | | Loans and receivables US$m | | | Available for sale securities US$m | | | Held at fair value US$m | | | Held to
maturity
assets/other
financial
liabilities
US$m | |
Financial assets | | | | | | | | | | | | | | | | | | | | | | | | |
Cash and cash equivalents | | | 21 | | | | 7,135 | | | | 7,135 | | | | – | | | | – | | | | – | |
Trade and other receivables(a) | | | | | | | 6,201 | | | | 6,201 | | | | – | | | | – | | | | – | |
Equity shares and quoted funds | | | 20 | | | | 369 | | | | – | | | | 369 | | | | – | | | | – | |
Other investments, including loans | | | 20 | | | | 539 | | | | 172 | | | | – | | | | 367 | | | | – | |
Currency and commodity contracts: designated as hedges(b) | | | 20 | | | | 10 | | | | – | | | | – | | | | 10 | | | | – | |
Derivatives and embedded derivatives not related to net debt: not designated as hedges(b) | | | 20 | | | | 86 | | | | – | | | | – | | | | 86 | | | | – | |
Derivatives related to net debt(b) | | | 20,22,24 | | | | 347 | | | | – | | | | – | | | | 347 | | | | – | |
Loans to equity accounted units including quasi equity loans | | | | | | | 675 | | | | 675 | | | | – | | | | – | | | | – | |
Total financial assets | | | | | | | 15,362 | | | | 14,183 | | | | 369 | | | | 810 | | | | – | |
| | | | | | |
Financial liabilities | | | | | | | | | | | | | | | | | | | | | | | | |
Trade and other payables(c) | | | | | | | (7,944 | ) | | | | | | | | | | | – | | | | (7,944 | ) |
Short term borrowings and bank overdrafts | | | 22 | | | | (2,175 | ) | | | | | | | | | | | – | | | | (2,175 | ) |
Medium and long term borrowings | | | 22 | | | | (24,477 | ) | | | | | | | | | | | – | | | | (24,477 | ) |
Derivatives related to net debt(b) | | | 22,24 | | | | (53 | ) | | | | | | | | | | | (53 | ) | | | – | |
Other derivatives and embedded derivatives not designated as hedges(b) | | | 22 | | | | (141 | ) | | | | | | | | | | | (141 | ) | | | – | |
Other financial liabilities | | | 22 | | | | (58 | ) | | | | | | | | | | | – | | | | (58 | ) |
Total financial liabilities | | | | | | | (34,848 | ) | | | | | | | | | | | (194 | ) | | | (34,654 | ) |
| (a) | This excludes pension surpluses, prepayment of tolling charges to joint operations, other prepayments and specific items within other receivables and will therefore not agree to note 18 (Trade and other receivables). |
| (b) | These financial assets and liabilities in aggregate agree to total derivative financial instruments disclosed in notes 20 (Other financial assets) and 22 (Borrowings and other financial liabilities). |
| (c) | Trade and other payables excludes deferred income, Government grants, royalties, mining taxes and employee entitlements and will therefore not agree to note 25 (Trade and other payables). |
A (b) Financial risk management
Funding and exposure management
The Group’s policies on financial risk management are clearly defined and consistently applied. They are a fundamental part of the Group’s long term strategy covering areas such as foreign exchange risk, interest rate risk, commodity price risk, credit risk, liquidity risk and capital management.
The Group mainly sells commodities it has produced and also enters into third party transactions and physical swaps on alumina to balance the regional positions and to balance the loading on production facilities.
The Group has a diverse portfolio of commodities and operates in a number of markets, which have varying responses to the economic cycle. The relationship between commodity prices and the currencies of most of the countries in which the Group operates provides a further natural hedge in the long term. Production of minerals, aluminium and alumina is an important contributor to the Gross Domestic Products of Australia and Canada, countries in which the Group has a large presence. As a consequence, the Australian and Canadian currencies have historically tended to strengthen when commodity prices are high. In addition, US dollar floating interest rates have historically also tended to be high when commodity prices are high, and vice versa, and hence the Group’s interest rate policy is to generally borrow and invest, after the impact of hedging, at floating interest rates. However, in some circumstances, the Group elects to maintain a higher proportion of fixed rate funding. These natural hedges significantly reduce the necessity for using derivatives or other forms of synthetic hedging. Such hedging is therefore undertaken to a strictly limited degree, as described below.
Treasury operations
Treasury operates as a service to the businesses of the Group and not as a profit centre. Strict limits on the size and type of transactions permitted are laid down by the Board and are subject to rigorous internal controls. Senior management is advised of corporate cash and debt positions, as well as commodity, currency interest rate and interest rate derivatives through a monthly reporting framework.
| | | | |
| | 159 riotinto.com/reportingcentre2013 | | |
Notes to the 2013 financial statements continued
| 30 | Financial instruments and risk management continued |
Treasury policy
Rio Tinto does not acquire or issue derivative financial instruments for trading or speculative purposes; nor does it believe that it has material exposure to such trading or speculative holdings through its investments in joint arrangements and associates. Derivatives are used to separate funding and cash management decisions from currency exposure and interest rate management. Bank counterparty exposures are managed within allocated credit limits. Investment, funding and cash management activities are managed and co-ordinated by Treasury.
(i) Foreign exchange risk
Management policy
The Group’s shareholders’ equity, earnings and cash flows are influenced by a wide variety of currencies due to the geographic diversity of the Group’s sales and the countries in which it operates. The US dollar, however, is the currency in which the majority of the Group’s sales are denominated. Operating costs are influenced by the currencies of those countries where the Group’s mines and processing plants are located and also by those currencies in which the costs of imported equipment and services are determined. The Australian and Canadian dollars are the most important currencies (apart from the US dollar) influencing costs. In any particular year, currency fluctuations may have a significant impact on Rio Tinto’s financial results. A strengthening of the US dollar against the currencies in which the Group’s costs are partly determined has a positive effect on Rio Tinto’s Underlying earnings.
Given the dominant role of the US currency in the Group’s affairs, the US dollar is the currency in which financial results are presented both internally and externally. It is also the most appropriate currency for financing the Group’s operations. Borrowings and cash are predominantly denominated in US dollars, either directly or through the use of derivatives.
Certain US dollar debt and other financial assets and liabilities, including intragroup balances, are not held in the functional currency of the relevant subsidiary.
This results in an accounting exposure to exchange gains and losses as the financial assets and liabilities are translated into the functional currency of the subsidiary that holds those assets and liabilities. These exchange gains and losses are recorded in the Group’s income statement except to the extent that they can be taken to equity under the Group’s accounting policy which is explained in note 1(d). Gains and losses on US dollar net debt and on intragroup balances are excluded from Underlying earnings. Other exchange gains and losses are included in Underlying earnings.
See section B for the details of cross currency interest rate and interest rate swaps relating to borrowings.
After taking into account relevant swap instruments, almost all of the Group’s net debt is denominated in US dollars. The table below summarises, by currency, the net debt, after taking into account relevant currency swaps:
| | | | | | | | | | | | | | | | | | | | | | | | |
| Net (debt)/funds by currency | | Cash and cash
equivalents
US$m | | | Total
borrowings
in note 22
US$m | | | Derivatives
related to
net debt
US$m | | | EAU funded
balances
excluded from
net debt
US$m | | | Net debt
2013
US$m | | | Restated
Net debt
2012
US$m | |
United States dollar | | | 9,110 | | | | (26,642 | ) | | | 173 | | | | – | | | | (17,359 | ) | | | (18,629 | ) |
Australian dollar | | | 561 | | | | (953 | ) | | | – | | | | 16 | | | | (376 | ) | | | (217 | ) |
Euro | | | 64 | | | | (282 | ) | | | – | | | | – | | | | (218 | ) | | | (177 | ) |
South African rand | | | 193 | | | | (394 | ) | | | – | | | | – | | | | (201 | ) | | | (258 | ) |
Canadian dollar | | | 70 | | | | (185 | ) | | | – | | | | – | | | | (115 | ) | | | (153 | ) |
Pound sterling | | | 96 | | | | (1 | ) | | | – | | | | – | | | | 95 | | | | 100 | |
Other | | | 122 | | | | (3 | ) | | | – | | | | – | | | | 119 | | | | 142 | |
Total | | | 10,216 | | | | (28,460 | ) | | | 173 | | | | 16 | | | | (18,055 | ) | | | (19,192 | ) |
Hedging strategy
Under normal market conditions, the Group does not generally believe that active currency hedging of transactions would provide long term benefits to shareholders. The Group reviews its exposure on a regular basis and reserves the right to enter into hedges to maintain financial stability. Currency protection measures may be deemed appropriate in specific commercial circumstances, typically hedging of significant financial items such as acquisitions, disposals, tax and dividends, and are subject to strict limits laid down by the Board. A monthly treasury report is provided to senior management which summarises corporate debt exposed to currency risks after the impact of derivatives. Refer to section B for the details of currency forward, cross currency interest rate and option contracts used to manage the currency risk exposures of the Group at 31 December 2013.
Sensitivities
The table below gives the estimated retranslation effect on financial assets and financial liabilities of a ten per cent strengthening in the closing exchange rate of the US dollar against significant currencies. The sensitivity associated with a ten per cent weakening of a particular currency would be equal and opposite to the figures presented. The impact is expressed in terms of the effect on net earnings, Underlying earnings and equity, assuming that each exchange rate moves in isolation. The sensitivities are based on financial assets and financial liabilities held at 31 December 2013, where balances are not denominated in the functional currency of the subsidiary or joint operation, and exclude financial assets and liabilities held by equity accounted units. These balances will not remain constant throughout 2014, and therefore the following information should be used with care.
| | | | |
| | 160 riotinto.com/reportingcentre2013 | | |
At 31 December 2013
Gains/(losses) associated with 10% strengthening of the US dollar
| | | | | | | | | | | | | | | | |
| Currency Exposure | | Closing
exchange rate
US cents | | | Effect on
net earnings
US$m | | | Of which
amount
impacting
underlying
earnings US$m | | | Impact
directly
on equity
US$m | |
Australian dollar | | | 89 | | | | (1,442 | ) | | | 21 | | | | 20 | |
Canadian dollar | | | 94 | | | | (3,077 | ) | | | 30 | | | | – | |
South African rand | | | 12 | | | | (4 | ) | | | 1 | | | | 2 | |
Euro | | | 138 | | | | 372 | | | | (22 | ) | | | 6 | |
New Zealand dollar | | | 82 | | | | 51 | | | | – | | | | – | |
At 31 December 2012 restated | | | | | | | | | | | | | | | | |
Gains/(losses) associated with 10% strengthening of the US dollar | | | | | | | | | | | | | | | | |
| Currency Exposure | | Closing
exchange rate
US cents | | | Effect on net earnings
US$m | | | Of which
amount
impacting
underlying
earnings
US$m | | | Impact
directly
on equity
US$m | |
Australian dollar | | | 104 | | | | (799 | ) | | | 90 | | | | 1 | |
Canadian dollar | | | 100 | | | | (1,436 | ) | | | 32 | | | | 1 | |
South African rand | | | 12 | | | | 3 | | | | 1 | | | | – | |
Euro | | | 132 | | | | 28 | | | | (31 | ) | | | – | |
New Zealand dollar | | | 82 | | | | 54 | | | | – | | | | – | |
Ten per cent is the maximum annual exchange rate movement that management deems to be reasonably probable (on an annual basis over the long run) for one of the Group’s significant currencies and as such provides an appropriate representation.
(ii) Interest rate risk
Management policy
Interest rate risk refers to the risk that the value of a financial instrument or cash flows associated with the instruments will fluctuate due to changes in market interest rates. The Group’s interest rate management policy is generally to borrow and invest at floating interest rates. This approach is based on historical correlation between interest rates and commodity prices. In some circumstances, the Group may consider a higher proportion of fixed rate funding to be appropriate.
Hedging strategy
As noted above, the Group may hedge its interest rate risk by entering into interest rate derivatives to achieve its policies. The market value of such instruments moves in alignment with the market and at times can act as an alternative source of funding. The Group reviews the positions on a regular basis and may act to monetise in-the-money instruments either to take advantage of favourable market conditions or manage counterparty credit risk. During 2013, no interest rate swaps were closed out. During 2012, the Group closed out interest rate swaps with a notional principal of US$200 million giving rise to a net cash inflow of US$3 million including accrued interest of US$3 million. The interest rate swaps closed out in 2012 were in fair value hedge relationships prior to close out. See section B for the details of currency and interest rate swaps relating to borrowings.
At the end of 2013, US$20.4 billion (2012: US$17.7 billion) of the Group’s adjusted total borrowings was at fixed rates after taking into account interest and currency interest rate swaps, resulting in a fixed to floating debt ratio of 72 per cent fixed to 28 per cent floating (2012: 67 per cent fixed to 33 per cent floating). On a net debt basis, the fixed to floating debt ratio was 111 per cent fixed liability to (11) per cent floating asset (2012: 91 per cent fixed liability to 9 per cent floating liability). The weighted average interest rate on total adjusted borrowings as at 31 December 2013 was 3.8 per cent (2012: 4 per cent) and the weighted average maturity was 8 years (2012: 9 years). Weighted average effective interest rate is based on interest rates and carrying value of gross borrowings at the year end. Current interest rates are applied for debt at floating rates.
The net debt ratio at the end of 2013 and 2012 reflects the high level of cash, cash equivalents and other liquid resources held by the Group and the impact of borrowings held at fixed rates.
See note 22 (Borrowings and other financial liabilities) for the details of debt outstanding at 31 December 2013.
Sensitivities
Based on the Group’s net debt (refer to note 24) and other floating rate financial instruments outstanding as at 31 December 2013, the effect on net earnings of a half percentage point increase in US dollar LIBOR interest rates, with all other variables held constant, would be an increase of US$9 million (2012: decrease of US$9 million) reflecting the high level of cash at the period end. The Group has an exposure to interest rate volatility within shareholders’ equity arising from fair value movements on derivatives in the cash flow reserve. The derivatives have an underlying exposure to Pound sterling and US dollar rates. With all factors remaining constant and based on the composition of derivatives impacting the cash flow reserve at 31 December 2013, the sensitivity of a 100 basis point increase in interest rates in each of the currencies in isolation would impact equity, before tax, by US$106 million charge (2012: US$126 million charge) for Pound sterling and US$101 million credit (2012: US$125 million credit) for US dollar. A 100 basis point decrease would have broadly the same impact in the opposite direction. These balances will not remain constant throughout 2014, and therefore this information should be used with care.
| | | | |
| | 161 riotinto.com/reportingcentre2013 | | |
Notes to the 2013 financial statements continued
| 30 | Financial instruments and risk management continued |
(iii) Commodity price risk
Management policy
The Group’s normal policy is to sell its products at prevailing market prices. Exceptions to this rule are subject to strict limits laid down by the board and to rigid internal controls.
Metals such as copper and aluminium are generally sold under contracts which vary in tenure and pricing mechanisms, with some volumes sold in the spot market. The prices are determined by reference to prevailing market prices on terminal markets, such as the London Metal Exchange (LME) and COMEX in New York. Prices fluctuate widely in response to changing levels of supply and demand but, in the long run, prices are related to the marginal cost of supply. Gold is also priced in an active market in which prices respond to daily changes in quantities offered and sought. Newly mined gold is only one source of supply; investment and disinvestment can be important elements of supply and demand. Contract prices for many other natural resource products including coal are generally agreed quarterly or for longer periods with customers, although volume commitments vary by product.
Certain products, predominantly copper concentrate, are ‘provisionally priced’, that is the selling price is determined normally 30 to 180 days after delivery to the customer, based on the market price at the relevant quotation point stipulated in the contract. Revenue is recognised on provisionally priced sales based on estimates of fair value of the consideration receivable which is based on forward market prices. At each reporting date provisionally priced metal sales are marked to market based on the forward selling price for the period stipulated in the contract. For this purpose the selling price can be measured reliably for those products such as copper concentrate for which the price is directly related to the price of copper for which an active and freely traded commodity market exists, such as the LME, and the value of product sold by the Group is directly linked to the form in which it is traded on that market.
The marking to market of provisionally priced sales contracts is recorded as an adjustment to sales revenue.
At the end of 2013, the Group had 254 million pounds of copper sales (2012: 249 million pounds) that were provisionally priced at US 333 cents per pound (2012: US 360 cents per pound). The final price of these sales will be determined during the first half of 2014. A ten per cent change in the price of copper realised on the provisionally priced sales would increase or reduce net earnings by US$49 million (2012: US$56 million).
Hedging strategy
Rio Tinto’s exposure to commodity prices is diversified by virtue of its broad commodity base and the Group does not generally believe commodity price hedging would provide a long term benefit to shareholders. The Group may hedge certain commitments with some of its customers or suppliers. Details of commodity derivatives held at 31 December 2013 are set out in section B.
Sensitivities
The Group’s commodity derivatives are impacted by changes in market prices and include those aluminium forward and option contracts embedded in electricity purchase contracts outstanding at 31 December 2013. A ten per cent increase in market prices would reduce net earnings by US$164 million (2012: US$144 million) and a ten per cent decrease in prices would increase net earnings by US$93 million (2012: US$125 million). A ten per cent change in prices would impact equity, before tax, by US$8 million (2012: US$13 million).
The Group’s “own use contracts” are excluded from the sensitivity analysis as they are outside the scope of IAS 39. Such contracts to buy or sell non financial items can be net settled but were entered into and continue to be held for the purpose of the receipt or delivery of the non financial item in accordance with the business unit’s expected purchase, sale or usage requirements. The sensitivity does not include the impact arising from derivatives held by equity accounted units. Including equity accounted units primarily impacts the sensitivity to a 10 per cent increase in aluminium prices and would result in a US$59 million reduction in net earnings (2012: US$59 million).
(iv) Credit risk
Treasury management policy
Credit risk is the risk that a counterparty will not meet its obligations under a financial instrument or customer contract, leading to a financial loss. The Group is exposed to credit risk from its operating activities (primarily from customer receivables) and from its financing activities, including investments in government securities, deposits with banks and financial institutions, other short term investments, interest rate and currency derivative contracts and other financial instruments.
Credit risks related to receivables
Customer credit risk is managed by each business unit subject to the Group’s established policy, procedures and controls relating to customer credit risk management. Credit limits are established for all customers based on internal or external rating criteria. Where customers are rated by an independent credit rating agency, these ratings are used to set credit limits. In circumstances where no independent credit rating exists, the credit quality of the customer is assessed based on an extensive credit rating scorecard. Outstanding customer receivables are regularly monitored and any credit concerns highlighted to senior management. High risk shipments to major customers are generally covered by letters of credit or other forms of credit insurance.
At 31 December 2013, the Group had approximately 120 customers (2012: 80 customers) that owed the Group more than US$5 million each and these balances accounted for approximately 93 per cent (2012: 68 per cent) of all receivables owing. There were 46 customers (2012: 25 customers) with balances greater than US$20 million accounting for just over 65 per cent (2012: just over 48 per cent) of total amounts receivable. Details of trade and other receivables past due but not impaired are provided in Note 18.
The maximum exposure to credit risk at the reporting date is the carrying value of each class of financial assets (refer to table of financial assets and liabilities reported above). The Group does not hold collateral as security for any trade receivables.
| | | | |
| | 162 riotinto.com/reportingcentre2013 | | |
Credit risk related to financial instruments and cash deposits
Credit risk from investments in government securities (primarily US Government treasuries and funds) or AAA rated money market funds and balances with banks and financial institutions is managed by Group Treasury in accordance with a board approved policy. Investments of surplus funds are made only with approved counterparties and within credit limits assigned to each counterparty mainly based upon specific assessment criteria. Counterparty credit limits are reviewed by the Rio Tinto board at least annually. The limits are set to minimise the concentration of credit risk and therefore mitigate the potential for financial loss through counterparty failure.
The maximum credit risk exposure of the Group’s financial assets at the balance sheet date is as follows:
| | | | | | | | | | | | |
| | | Note | | | 2013
US$m | | | Restated
2012
US$m | |
Cash and cash equivalents | | | 21 | | | | 10,216 | | | | 7,135 | |
Trade and other receivables | | | | | | | 5,412 | | | | 6,201 | |
Investments | | | 20 | | | | 506 | | | | 539 | |
Derivative assets | | | 20 | | | | 466 | | | | 443 | |
Total | | | | | | | 16,600 | | | | 14,318 | |
(v) Liquidity and Capital risk management
Management policy
The Group’s overriding objective when managing capital is to safeguard the business as a going concern whilst maximising returns for shareholders. In practice, this involves regular reviews by the board and senior management. These reviews take into account the Group’s strategic priorities, economic and business conditions and opportunities that are identified to invest across all points of the commodities cycle, and the focus on the progressive dividend policy, whilst also striving to maintain the Group’s current credit rating. The resulting capital structure provides the Group with a high degree of financial flexibility at a low cost of capital.
To maintain its current credit rating, the Group considers various financial metrics including the overall level of borrowings and their maturity profile, liquidity levels, total capital, cash flow, EBITDA and interest cover ratios either on a statutory reported basis or as expected to be adjusted by the credit rating agencies.
The Group’s total capital, which is defined as equity attributable to owners of Rio Tinto plus equity attributable to non-controlling interests plus net debt, amounted to US$71.6 billion at 31 December 2013 (2012: US$76.9 billion).
| | | | | | | | |
| Total capital | | 2013
US$m | | | Restated
2012
US$m | |
Equity attributable to owners of Rio Tinto (see Group statement of financial position) | | | 45,886 | | | | 46,553 | |
Equity attributable to non-controlling interests (see Group statement of financial position) | | | 7,616 | | | | 11,187 | |
Net debt (note 24) | | | 18,055 | | | | 19,192 | |
Total capital | | | 71,557 | | | | 76,932 | |
Net debt is a measure used by management and the board of directors to manage the Group’s capital structure and therefore is linked to the Group’s financial and operational excellence strategic driver. Net debt is disclosed and defined in note 24. Net debt decreased from US$19.2 billion at 31 December 2012 to US$18.1 billion at 31 December 2013 as operating cash inflows and divestment proceeds were partly offset by outflows relating to capital expenditure and the increase in the dividend. Net debt to total capital was 25 per cent at 31 December 2013 (2012: 25 per cent) and interest cover was 13 times (2012: 13 times).
The unified credit status of the Group is maintained through cross guarantees whereby contractual obligations of Rio Tinto plc and Rio Tinto Limited are automatically guaranteed by the other.
| | | | |
| | 163 riotinto.com/reportingcentre2013 | | |
Notes to the 2013 financial statements continued
| 30 | Financial instruments and risk management continued |
The Group has access to various forms of financing including but not limited to, Capital markets as well as the bank market. In June 2013, under its US Shelf Programme, the Group issued four Rio Tinto Finance (USA) plc bonds: US$1,000 million 1.375% bond due 2016, US$1,250 million 2.250% bond due 2018, US$250 million LIBOR plus 0.55% bond due 2015 and US$500 million LIBOR plus 0.840% bond due 2016. In March 2012, under its US Shelf Programme, the Group issued four Rio Tinto Finance (USA) plc bonds: US$500 million 1.125% bond due 2015, US$500 million 2.000% bond due 2017, US$1,000 million 3.500% bond due 2022 and US$500 million 4.750% bond due 2042. In August 2012, the Group issued three Rio Tinto Finance (USA) plc bonds: US$1,250 million 1.625% bond due 2017, US$1,000 million 2.875% bond due 2022 and US$750 million 4.125% bond due 2042. In December 2012, under its European Debt Issuance Programme, the Group issued three Rio Tinto Finance plc bonds: EUR750 million 2.00% bond due 2020, EUR500 million 2.875% bond due 2024 and GBP500 million 4.00% bond due 2029. The Euro denominated bonds were swapped using cross currency interest rate swaps to US dollar floating rate bonds and the GBP bond was swapped to a US dollar fixed rate bond.
Rio Tinto Finance plc and Rio Tinto Finance Limited entered into new facility agreements for the aggregate amount of US$7.5 billion on 15 November 2013 as borrowers with a syndicate of banks. The facilities are guaranteed by Rio Tinto plc and Rio Tinto Limited. The facilities comprise a US$1,875 million three-year multi-currency revolving credit facility and a US$5,625 million five-year multi-currency revolving credit facility (including a US$ denominated same day access swingline facility). Both facilities could be extended for one year on the first anniversary and for a further year on the second anniversary of the date of the facility agreements by mutual agreement of the parties to the agreement. The funds made available under the facility agreements may be used for general corporate purposes of the Group. The new facilities replace the US$6 billion multi-currency revolving credit facility dated 12 November 2010 and the US$2 billion bilateral bank facility agreements entered in the last quarter of 2012 which were closed out on 15 November 2013.
Advances under the revolving facilities bear an interest rate per annum equal to the margin (which is dependent on the Group’s long-term credit rating as determined by Moody’s and Standard & Poor’s and the level of drawdown) plus LIBOR or EURIBOR, CDOR or BBSW (in relation to any Euro, Canadian dollar or Australian dollar loans) plus a margin. The facility agreements contain no financial covenants. At 31 December 2013, the facilities were undrawn.
During the last quarter of 2012, the Group entered into bilateral bank facility agreements amounting to US$2 billion in aggregate. The facilities were denominated in US dollars and had a term of one year that was extendable, at the Group’s option, by a further 364 days. Any borrowings under each facility were at prevailing LIBOR rates plus an agreed margin dependent on the amount of drawdown and the credit rating of the Group. The facilities were not subject to financial covenants. At 31 December 2012, the facilities were undrawn and subsequently closed out on 15 November 2013.
In November 2010, the Group entered into a US$6 billion multi-currency committed revolving credit facility maturing in November 2015 with its relationship banks. Any borrowings under this facility were at prevailing LIBOR rates plus an agreed margin dependent on the amount of drawdown and the credit rating of the Group. The facility was not subject to any financial covenants. The overall agreement also enabled same day access to a US$ swing-line facility. The funds available under the facility agreement could have been used for general corporate purposes of the Group. At 31 December 2012, the facility was undrawn and subsequently closed out on 15 November 2013.
Further details of the Group’s credit facilities are set out in note 22 of the 2013 financial statements.
In February 2011, the Group commenced a US$5 billion share buy-back programme. During 2012, 26 million Rio Tinto plc shares were bought back at a total cost of US$1.5 billion which completed the programme in March 2012.
A (c) Financial liability analysis
The table below analyses the Group’s financial liabilities by relevant maturity groupings based on the remaining period from the statement of financial position date to the contractual maturity date. As the amounts disclosed in the table are the contractual undiscounted cash flows, these balances will not necessarily agree with the amounts disclosed in the statement of financial position.
At 31 December 2013
| | | | | | | | | | | | | | | | | | | | | | | | | | | | |
| (Outflows)/Inflows | | Within 1
year or on
demand
US$m | | | Between
1 and 2
years
US$m | | | Between
2 and 3
years
US$m | | | Between
3 and 4
years
US$m | | | Between
4 and 5
years
US$m | | | After 5 years
US$m | | | Total
US$m | |
Non-derivative financial liabilities | | | | | | | | | | | | | | | | | | | | | | | | | | | | |
Trade and other payables | | | (6,585 | ) | | | (314 | ) | | | – | | | | – | | | | – | | | | – | | | | (6,899 | ) |
Borrowings before swaps | | | (4,011 | ) | | | (1,926 | ) | | | (2,844 | ) | | | (1,984 | ) | | | (3,022 | ) | | | (14,684 | ) | | | (28,471 | ) |
Expected future interest payments(a) | | | (1,007 | ) | | | (928 | ) | | | (889 | ) | | | (857 | ) | | | (804 | ) | | | (6,164 | ) | | | (10,649 | ) |
Other financial liabilities | | | (39 | ) | | | (67 | ) | | | (18 | ) | | | – | | | | (1 | ) | | | (1 | ) | | | (126 | ) |
Derivative financial liabilities(b) | | | | | | | | | | | | | | | | | | | | | | | | | | | | |
Derivatives related to net debt – net settled(a) | | | – | | | | – | | | | – | | | | – | | | | – | | | | (5 | ) | | | (5 | ) |
Derivatives related to net debt – gross settled(a): | | | | | | | | | | | | | | | | | | | | | | | | | | | | |
– gross inflows | | | 516 | | | | 20 | | | | 20 | | | | 20 | | | | 20 | | | | 797 | | | | 1,393 | |
– gross outflows | | | (510 | ) | | | (12 | ) | | | (12 | ) | | | (12 | ) | | | (12 | ) | | | (720 | ) | | | (1,278 | ) |
Total | | | (11,636 | ) | | | (3,227 | ) | | | (3,743 | ) | | | (2,833 | ) | | | (3,819 | ) | | | (20,777 | ) | | | (46,035 | ) |
| | | | |
| | 164 riotinto.com/reportingcentre2013 | | |
At 31 December 2012
| | | | | | | | | | | | | | | | | | | | | | | | | | | | |
| (Outflows)/Inflows | | Within 1
year or on
demand
US$m | | | Between
1 and 2
years
US$m | | | Between
2 and 3
years
US$m | | | Between
3 and 4
years
US$m | | | Between
4 and 5
years
US$m | | | After
5 years
US$m | | | Total
US$m | |
Non-derivative financial liabilities | | | | | | | | | | | | | | | | | | | | | | | | | | | | |
Trade and other payables | | | (7,737 | ) | | | (207 | ) | | | – | | | | – | | | | – | | | | – | | | | (7,944 | ) |
Borrowings before swaps | | | (2,169 | ) | | | (2,628 | ) | | | (1,799 | ) | | | (1,343 | ) | | | (2,055 | ) | | | (16,340 | ) | | | (26,334 | ) |
Expected future interest payments(a) | | | (1,075 | ) | | | (972 | ) | | | (880 | ) | | | (848 | ) | | | (823 | ) | | | (6,919 | ) | | | (11,517 | ) |
Other financial liabilities | | | (49 | ) | | | (73 | ) | | | (21 | ) | | | – | | | | (9 | ) | | | (129 | ) | | | (281 | ) |
Derivative financial liabilities(b) | | | | | | | | | | | | | | | | | | | | | | | | | | | | |
Derivatives related to net debt – net settled(a) (b) | | | – | | | | – | | | | – | | | | – | | | | – | | | | – | | | | – | |
Derivatives related to net debt – gross settled(a): | | | | | | | | | | | | | | | | | | | | | | | | | | | | |
– gross inflows | | | 80 | | | | 80 | | | | 80 | | | | 80 | | | | 80 | | | | 1,359 | | | | 1,759 | |
– gross outflows | | | (71 | ) | | | (71 | ) | | | (71 | ) | | | (71 | ) | | | (71 | ) | | | (1,297 | ) | | | (1,652 | ) |
Total | | | (11,021 | ) | | | (3,871 | ) | | | (2,691 | ) | | | (2,182 | ) | | | (2,878 | ) | | | (23,326 | ) | | | (45,969 | ) |
| (a) | Interest payments have been projected using interest rates applicable at 31 December 2013. Where debt is subject to variable interest rates, future interest payments are subject to change in line with market rates. |
| (b) | The maturity grouping is based on the earliest payment date. |
| (c) | The maximum carrying value of borrowings repayable, after the impact of swaps, maturing in any financial year is US$3.2 billion (2012: US$2.7 billion). |
Offsetting and enforceable master netting agreements
Financial assets and liabilities are offset and the net amount reported in the consolidated statement of financial position when there is a legally enforceable right to offset the recognised amounts and there is an intention to settle on a net basis or realise the asset and settle the liability simultaneously. There were no material amounts offset in the statement of financial position and no material enforceable master netting agreements.
B Derivative financial instruments
The Group’s derivatives, including embedded derivatives, as at 31 December 2013, are summarised below:
| | | | | | | | | | | | | | | | |
| | | Total fair Value | |
| Derivatives designated as hedges | | 2013
Asset
US$m | | | 2013
Liability
US$m | | | Restated
2012
Asset
US$m | | | Restated
2012
Liability
US$m | |
Aluminium forward contracts embedded in electricity purchase contracts(a) | | | 21 | | | | – | | | | 10 | | | | – | |
Interest rate swaps(b) | | | 138 | | | | – | | | | 346 | | | | – | |
Cross currency interest rate swaps(c) | | | 54 | | | | (14 | ) | | | – | | | | (44 | ) |
Total derivatives designated as hedges | | | 213 | | | | (14 | ) | | | 356 | | | | (44 | ) |
| | | | |
| | | | | | | | | | | | | | | | |
| Derivatives not designated as hedges | | US$m | | | US$m | | | US$m | | | US$m | |
Currency forward contracts and swaps | | | 4 | | | | (1 | ) | | | 4 | | | | (4 | ) |
Aluminium forward contracts(d) | | | 6 | | | | (19 | ) | | | 29 | | | | (57 | ) |
Aluminium options embedded in electricity purchase contracts(a) | | | 85 | | | | (2 | ) | | | 52 | | | | (69 | ) |
Aluminium forward contracts embedded in electricity purchase contracts(a) | | | 128 | | | | – | | | | – | | | | – | |
Other commodity contracts | | | – | | | | – | | | | 1 | | | | – | |
Other embedded derivatives | | | 30 | | | | – | | | | – | | | | (11 | ) |
Interest rate swaps(b) | | | – | | | | – | | | | 1 | | | | – | |
Currency options embedded in borrowing contracts | | | – | | | | (5 | ) | | | – | | | | (9 | ) |
Total derivatives not designated as hedges | | | 253 | | | | (27 | ) | | | 87 | | | | (150 | ) |
| | | | | | | | | | | | | | | | | |
| Total derivative instruments | | | 466 | | | | (41 | ) | | | 443 | | | | (194 | ) |
| | | | |
Analysed by maturity: | | | | | | | | | | | | | | | | |
Less than 1 year | | | 63 | | | | (10 | ) | | | 29 | | | | (23 | ) |
Between 1 and 5 years | | | 109 | | | | (11 | ) | | | 80 | | | | 11 | |
More than 5 years | | | 294 | | | | (20 | ) | | | 334 | | | | (182 | ) |
Total | | | 466 | | | | (41 | ) | | | 443 | | | | (194 | ) |
Total net derivative instruments | | | 425 | | | | | | | | 249 | | | | | |
| | | | |
| | 165 riotinto.com/reportingcentre2013 | | |
Notes to the 2013 financial statements continued
| 30 | Financial instruments and risk managementcontinued |
| | | | | | | | |
| Reconciliation to statement of financial position | | 2013
US$m | | | 2012
US$m | |
– non-current assets (note 20) | | | 403 | | | | 414 | |
– current assets (note 20) | | | 63 | | | | 29 | |
– current liabilities (note 22) | | | (10 | ) | | | (23 | ) |
– non-current liabilities (note 22) | | | (31 | ) | | | (171 | ) |
Total net derivatives instruments, detailed above | | | 425 | | | | 249 | |
| (a) | Aluminium embedded derivatives (forward contracts and options) are contained within certain aluminium smelter electricity purchase contracts. These contracts reduce the Group’s exposure to movements in the aluminium price. |
| (b) | The interest rate swaps are used to convert certain fixed rate borrowings to a floating rate. For further details, see note 22 ‘Borrowings and other financial liabilities’. |
| (c) | The cross currency interest rate swaps are used to convert non US dollar denominated borrowings to either fixed or floating US dollar borrowings. For further details see note 22 ‘Borrowings and other financial liabilities’. |
| (d) | The aluminium forward contracts are entered into to convert aluminium sales made at a fixed price to LME cash and to hedge the sales from high cost smelters. No ineffective portion arising from cash flow hedges was recognised in the income statement in 2013 (2012: gain of US$6 million pre tax). |
The aluminium forward contracts which were taken out to convert aluminium sales made as a fixed price to LME cash are not designated as hedges as they largely offset.
C Fair values
The carrying amounts and fair values of all of the Group’s financial instruments which are not carried at an amount which approximates their fair value at 31 December are shown in the following table. The fair values of the Group’s cash, short term borrowings and loans to equity accounted units approximate their carrying values as a result of their short maturity or because they carry floating rates of interest (see note 1(p)).
| | | | | | | | | | | | | | | | |
| | | 31 December 2013 | | | Restated 31 December 2012 | |
| | | Carrying
value
US$m | | | Fair
value
US$m | | | Carrying
value
US$m | | | Fair
value
US$m | |
Short term borrowings (note 22) | | | (3,916 | ) | | | (3,924 | ) | | | (2,175 | ) | | | (2,194 | ) |
Medium and long term borrowings (note 22) | | | (24,544 | ) | | | (25,746 | ) | | | (24,477 | ) | | | (27,274 | ) |
Borrowings with a carrying value of US$25.2 billion (2012: US$24.3 billion) relate to listed bonds with a fair value of US$26.2 billion (2012: US$26.8 billion) and are categorised as level 1 in the fair value hierarchy. The remaining borrowings have a fair value measured by discounting estimated cash flows with an applicable market quoted yield and are categorised as level 2 in the fair value hierarchy.
C (a) Valuation hierarchy
The table below shows the financial instruments carried at fair value by valuation method at 31 December 2013:
| | | | | | | | | | | | | | | | | | | | |
| | | | Total | | | | Level 1 | (a) | | | Level 2 | (b) | | | Level 3 | (c) | |
| Not held at
fair value |
|
| | | | | |
Assets | | | | | | | | | | | | | | | | | | | | |
Equity shares and quoted funds (note 20) | | | 279 | | | | 139 | | | | 79 | | | | 15 | | | | 46 | |
Other investments, including loans(d) (note 20) | | | 506 | | | | 106 | | | | 1 | | | | 215 | | | | 184 | |
| | | 785 | | | | 245 | | | | 80 | | | | 230 | | | | 230 | |
Derivatives(e) | | | | | | | | | | | | | | | | | | | | |
Forward contracts: designated as hedges (Section B) | | | 21 | | | | – | | | | – | | | | 21 | | | | – | |
Forward contracts and option contracts, not designated as hedges (Section B) | | | 231 | | | | 2 | | | | 19 | | | | 210 | | | | – | |
Derivatives related to net debt (Section B) | | | 173 | | | | – | | | | 173 | | | | – | | | | – | |
| | | | 1,210 | | | | 247 | | | | 272 | | | | 461 | | | | 230 | |
| | | | |
| | 166 riotinto.com/reportingcentre2013 | | |
The table below shows the financial instruments carried at fair value by valuation method at 31 December 2012 (restated):
| | | | | | | | | | | | | | | | | | | | |
| | | | Total | | | | Level 1 | (a) | | | Level 2 | (b) | | | Level 3 | (c) | |
| Not held at
fair value |
|
Assets | | | | | | | | | | | | | | | | | | | | |
Equity shares and quoted funds (note 20) | | | 369 | | | | 289 | | | | 27 | | | | 12 | | | | 41 | |
Other investments, including loans (note 20) | | | 539 | | | | 136 | | | | 6 | | | | 225 | | | | 172 | |
| | | 908 | | | | 425 | | | | 33 | | | | 237 | | | | 213 | |
Derivatives(e) | | | | | | | | | | | | | | | | | | | | |
Forward contracts: designated as hedges (Section B) | | | 10 | | | | – | | | | – | | | | 10 | | | | – | |
Forward contracts and option contracts, not designated as hedges (Section B) | | | (55 | ) | | | – | | | | 3 | | | | (58 | ) | | | – | |
Derivatives related to net debt (Section B) | | | 294 | | | | – | | | | 294 | | | | – | | | | – | |
| | | | 1,157 | | | | 425 | | | | 330 | | | | 189 | | | | 213 | |
| (a) | Valuation is based on unadjusted quoted prices in active markets for identical financial instruments. This category includes listed equity shares and other quoted funds. |
| (b) | Valuation is based on inputs that are observable for the financial instruments which includes quoted prices for similar instruments or identical instruments in markets which are not considered to be active or either directly or indirectly based on observable market data. |
| (c) | Valuation is based on inputs for the asset or liability that are not based on observable market data (unobservable inputs). |
| (d) | Other Investments, including loans comprise cash deposits in rehabilitation funds, government bonds, contingent consideration receivable from divested businesses and royalty amounts receivable. The royalty receivables are valued based on an estimate of future production subject to the royalty agreement. |
| (e) | The net asset or liability derivative balance for the three different categories reconcile to the net asset and liability balances presented in section B. |
| (f) | Interest rate and currency interest rate swaps are valued using applicable market quoted swap yield curves adjusted for relevant basis and credit default spreads. Currency interest rate swap valuations also use market quoted foreign exchange rates. A discounted cash flow approach is applied to the cash flows derived from the inputs to determine fair value. |
| (g) | Level 3 derivatives consist of embedded derivatives in electricity purchase contracts linked to the LME with terms expiring between 2014 and 2040. The embedded derivatives are measured using discounted cash flows and option model valuation techniques. Long-term embedded derivatives with a fair value of US$196 million at 31 December 2013 is valued using significant unobservable inputs as the term of the derivatives extends beyond the forward curve for aluminium. |
| | Aluminium prices are flatlined beyond the market forward curve and increased by projected inflation up to the date of expiry of the contract. The range of market prices are US$2,413 per metric tonne in 2024 to US$3,157 in 2040. The other contracts with a fair value of US$35 million at 31 December 2013 are categorised as level 3 as the market premium assumptions used represent material unobservable inputs. |
| (h) | There were no transfers between Level 1 and Level 2 and between Level 2 and Level 3 in 2013. |
C (b) Level 3 Financial assets and Financial liabilities
The table below shows the summary of changes in the fair value of the Group’s level 3 financial assets and financial liabilities for the year ended 31 December 2013 and 31 December 2012.
| | | | | | | | |
| | | 31 December 2013
Level 3 financial
assets and financial
liabilities | | | Restated 31 December 2012
Level 3 financial
assets and financial
liabilities | |
Opening balance | | | 189 | | | | 95 | |
Currency translation adjustments | | | (8 | ) | | | (2 | ) |
Total realised gains or (losses) included in: | | | | | | | | |
– Consolidated sales revenue | | | (20 | ) | | | – | |
– Net operating costs | | | 150 | | | | 46 | |
Total unrealised gains or (losses) included in: | | | | | | | | |
– Consolidated sales revenue | | | 2 | | | | – | |
– Net operating costs | | | 127 | | | | 36 | |
Total unrealised gains or (losses) transferred into other comprehensive income | | | 21 | | | | (18 | ) |
Additions | | | – | | | | 107 | |
Disposals | | | – | | | | (75 | ) |
Closing balance | | | 461 | | | | 189 | |
Total gains for the year included in the income statement for assets and liabilities held at year end | | | 130 | | | | 46 | |
Sensitivity analysis in respect of level 3 derivatives
The carrying value of forward contracts valued using unobservable inputs is calculated using appropriate discounted cash flow and option model valuation techniques. The most significant assumptions relate to internal long term aluminium prices beyond 10 years. A 10 per cent increase in long term aluminium prices would result in a US$165 million (2012: US$205 million) decrease in carrying value. A 10 per cent decrease in long term aluminium prices would result in a US$94 million (2012: US$181 million) increase in carrying value.
| | | | |
| | 167 riotinto.com/reportingcentre2013 | | |
Notes to the 2013 financial statements continued
| 31 | Contingencies and commitments |
| | | | | | | | |
| | | 2013
US$m | | | Restated 2012 US$m | |
Capital commitments excluding the Group’s share of Joint Venture Capital Commitments | | | | | | | | |
Within 1 year | | | 5,098 | | | | 10,671 | |
Between 1 and 3 years | | | 364 | | | | 829 | |
Between 3 and 5 years | | | 6 | | | | 108 | |
After 5 years | | | 31 | | | | 31 | |
Total | | | 5,499 | | | | 11,639 | |
| | |
Group’s share of Joint Venture Capital Commitments | | | | | | | | |
Within 1 year | | | 831 | | | | 796 | |
Between 1 and 3 years | | | 789 | | | | 444 | |
Between 3 and 5 years | | | 127 | | | | 19 | |
After 5 years | | | – | | | | – | |
Total | | | 1,747 | | | | 1,259 | |
Unrecognised commitments to contribute funding or resources to joint ventures
For Minera Escondida Limitada, Sohar Aluminium Company L.L.C. and Rio Tinto Benga (Mauritius) Limited the Group, along with the other joint venturers, has made various commitments to provide shareholder funding as required, subject to approved thresholds. In particular, Minera Escondida Limitada holds a shareholder line of credit for US$225 million (Rio Tinto share) which is currently undrawn. This line of credit was also available in 2012.
The Group has a commitment to purchase and market a portion (which may be different to the Group’s ownership interest) of the output of both Sohar Aluminium Company LLC and Sor-Norge Aluminium A.S., aluminium smelters in which the Group is a joint venturer. Purchases are at market prices and the Group subsequently sells the purchased products to third parties.
Operating leases
The aggregate amount of minimum lease payments under non cancellable operating leases are as follows:
| | | | | | | | |
| | | 2013
US$m | | | Restated
2012
US$m | |
Within 1 year | | | 439 | | | | 417 | |
Between 1 and 3 years | | | 667 | | | | 691 | |
Between 3 and 5 years | | | 540 | | | | 555 | |
After 5 years | | | 832 | | | | 855 | |
| | | | 2,478 | | | | 2,518 | |
| | | | |
| | 168 riotinto.com/reportingcentre2013 | | |
Purchase obligations
The aggregate amount of future payment commitments for the next five years under purchase obligations outstanding at 31 December was:
| | | | | | | | |
| | |
| 2013
US$m |
| |
| Restated
2012
US$m | (a)
|
Within 1 year | | | 3,178 | | | | 2,908 | |
Between 1 and 2 years | | | 2,434 | | | | 2,694 | |
Between 2 and 3 years | | | 2,202 | | | | 2,758 | |
Between 3 and 4 years | | | 1,865 | | | | 2,529 | |
Between 4 and 5 years | | | 1,743 | | | | 2,234 | |
After 5 years | | | 14,359 | | | | 13,931 | |
| | | | 25,781 | | | | 27,054 | |
| (a) | Purchase obligations are agreements to purchase goods or services that are enforceable and legally binding and specify all significant terms, including: fixed or minimum quantities to be purchased; fixed, minimum or variable price provisions; and the approximate timing of the transactions. The definition of purchase obligations has been further clarified for 2013 and comparatives restated accordingly. In particular, purchase obligations between subsidiaries and joint arrangements are now included to the extent that they relate to other venturers. |
| | | | | | | | |
| | |
| 2013
US$m |
| |
| Restated
2012 US$m | (a)
|
Contingent liabilities (subsidiaries and joint operations) | | | | | | | | |
Indemnities and other performance guarantees(a)(b) | | | 489 | | | | 728 | |
| (a) | Indemnities and other performance guarantees represent the potential outflow of funds from the Group for the satisfaction of obligations including those under contractual arrangements (for example undertakings related to rehabilitation activities and supplier agreements) not provided for in the statement of financial position, where the likelihood of the guarantees or indemnities being called is assessed as possible rather than probable or remote. The comparative for indemnities and other performance guarantees for 2012 has been restated for consistency. |
| (b) | There were no contingent liabilities arising in relation to the Group’s joint ventures and associates. |
There are a number of legal claims currently outstanding against the Group. No material loss to the Group is expected to result from these claims.
Contingent assets
The Group has various insurance claims outstanding with reinsurers including claims relating to the Manefay slide at Kennecott Utah Copper in April 2013. An interim progress payment was received on this claim in 2013. Further receipts are considered probable but the amount cannot currently be reliably estimated.
Guarantees by parent companies
Rio Tinto plc and Rio Tinto Limited have, jointly and severally, fully and unconditionally guaranteed the following securities issued by wholly owned finance subsidiaries: US$20.5 billion (2012: US$18.1 billion) Rio Tinto Finance (USA) Limited and Rio Tinto Finance (USA) plc Bonds with maturity dates ranging from 2014 to 2042; US$157 million (2012: US$nil) RT America Inc Commercial Paper; and US$2.5 billion (2012: US$2.5 billion) on the European Debt Issuance Programme.
| 32 | Average number of employees |
| | | | | | | | | | | | | | | | | | | | | | | | | | | | | | | | | | | | |
| | | Subsidiaries and joint operations | | | Equity accounted units (Rio Tinto share)(a) | | | Group Total | |
| | | 2013 | | | 2012 | | | 2011 | | | 2013 | | | 2012 | | | 2011 | | | 2013 | | | 2012 | | | 2011 | |
The principal locations of employment were: | | | | | | | | | | | | | | | | | | | | | | | | | | | | | | | | | | | | |
Australia and New Zealand | | | 24,740 | | | | 25,301 | | | | 22,454 | | | | 749 | | | | 808 | | | | 965 | | | | 25,489 | | | | 26,109 | | | | 23,419 | |
Canada | | | 12,830 | | | | 13,688 | | | | 13,958 | | | | – | | | | – | | | | 26 | | | | 12,830 | | | | 13,688 | | | | 13,984 | |
Europe | | | 4,210 | | | | 5,760 | | | | 6,601 | | | | 2,427 | | | | 3,184 | | | | 3,377 | | | | 6,637 | | | | 8,944 | | | | 9,978 | |
Africa | | | 6,787 | | | | 7,055 | | | | 6,107 | | | | 1,505 | | | | 2,226 | | | | 2,328 | | | | 8,292 | | | | 9,281 | | | | 8,435 | |
United States | | | 4,039 | | | | 4,564 | | | | 4,995 | | | | 285 | | | | 375 | | | | 406 | | | | 4,324 | | | | 4,939 | | | | 5,401 | |
Mongolia | | | 3,289 | | | | 2,904 | | | | 1,131 | | | | – | | | | – | | | | 358 | | | | 3,289 | | | | 2,904 | | | | 1,489 | |
Indonesia | | | 2,467 | | | | 2,467 | | | | 2,325 | | | | – | | | | – | | | | – | | | | 2,467 | | | | 2,467 | | | | 2,325 | |
South America | | | 511 | | | | 235 | | | | 347 | | | | 1,409 | | | | 1,307 | | | | 1,221 | | | | 1,920 | | | | 1,542 | | | | 1,568 | |
Other countries | | | 980 | | | | 1,143 | | | | 895 | | | | 103 | | | | 202 | | | | 436 | | | | 1,083 | | | | 1,345 | | | | 1,331 | |
| | | | 59,853 | | | | 63,117 | | | | 58,813 | | | | 6,478 | | | | 8,102 | | | | 9,117 | | | | 66,331 | | | | 71,219 | | | | 67,930 | |
| (a) | Employee numbers, which represent the average for the year, include 100 per cent of employees of subsidiary companies. Employee numbers for joint operations and equity accounted units are proportional to the Group’s interest. Average employee numbers include a part year effect for companies acquired or disposed of during the year. |
| | Part time employees are included on a full time equivalent basis. Temporary employees are included in employee numbers. |
| | People employed by contractors are not included. |
| | Discontinued operations’ employees of 782 (2012: 787; 2011: 790), all of whom are located in Africa, are not included in the above numbers. |
| | | | |
| | 169 riotinto.com/reportingcentre2013 | | |
Notes to the 2013 financial statements continued
At 31 December 2013
| | | | | | | | | | | | | | | | | | |
Company and country of incorporation/operation | | Principal activities | | Class of shares held | | Proportion of
class held (%) | | | | | Group interest (%) | | | Non-
controlling
interest (%) | |
Australia | | | | | | | | | | | | | | | | | | |
Argyle Diamond Limited | | Mining and processing of diamonds | | Ordinary | | | 100 | | | | | | 100 | | | | – | |
Coal & Allied Industries Limited(a) | | Coal mining | | Ordinary | | | 80 | | | | | | 80 | | | | 20 | |
Dampier Salt Limited | | Salt production | | Ordinary | | | 68.36 | | | | | | 68.36 | | | | 31.64 | |
Energy Resources of Australia Limited | | Uranium mining | | Class A | | | 68.39 | | | | | | 68.39 | | | | 31.61 | |
Hamersley Iron Pty Limited | | Iron ore mining | | Ordinary | | | 100 | | | | | | 100 | | | | – | |
Queensland Coal Pty Limited(b) | | Coal mining | | Ordinary | | | 100 | | | | | | 100 | | | | – | |
Rio Tinto Aluminium (Holdings) Limited | | Bauxite mining; alumina production; primary aluminium smelting | | Ordinary | | | 100 | | | | | | 100 | | | | – | |
Robe River Mining Co Pty Ltd(c) | | Iron ore mining | | Class A Class B | |
| 40
76.36 |
| | } | |
| 60
|
| |
| 40
|
|
North Mining Limited(c) | | Iron ore mining | | Ordinary | | | 100 | | | | | | 100 | | | | – | |
Brazil | | | | | | | | | | | | | | | | | | |
Alcan Alumina Ltda.(d) | | Alumina production | | Quota | | | 100 | | | | | | 100 | | | | – | |
Canada | | | | | | | | | | | | | | | | | | |
Rio Tinto Canada Uranium Corporation | | Uranium projects | | Common shares | | | 100 | | | | | | 100 | | | | – | |
Iron Ore Company of Canada Inc.(e) | | Iron ore mining; iron ore pellets | | Common shares | | | 58.72 | | | | | | 58.72 | | | | 41.28 | |
Rio Tinto Fer et Titane Inc. | | Titanium dioxide feedstock; | | Common shares | | | 100 | | | | | | 100 | | | | – | |
| | high purity iron and steel | | Class B preference shares | | | 100 | | | | | | 100 | | | | – | |
| | | | CAD 0.01 preferred shares | | | 100 | | | | | | 100 | | | | – | |
Rio Tinto Alcan Inc. | | Bauxite mining; alumina refining; production of specialty alumina; aluminium smelting | | Common shares | | | 100 | | | | | | 100 | | | | – | |
Diavik Diamond Mines Inc(f) | | Diamond mining and processing | | Class A, B, C | | | 100 | | | | | | 100 | | | | – | |
| | | | | Class P1 preferred | | | 100 | | | | | | 100 | | | | – | |
Guinea | | | | | | | | | | | | | | | | | | |
Simfer Jersey Limited(g) | | Iron ore project | | Ordinary | | | 53 | | | | | | 53 | | | | 47 | |
Madagascar | | | | | | | | | | | | | | | | | | |
QIT Madagascar Minerals SA(h) | | Ilmenite mining | | Common shares | | | 80 | | | | | | 80 | | | | 15 | |
| | | | | Investment certificates | | | n/a | | | | | | 5 | | | | | |
Mongolia | | | | | | | | | | | | | | | | | | |
Turquoise Hill Resources Ltd (including Oyu Tolgoi LLC and SouthGobi Resources Ltd)(i) | | Copper and gold mining | | Common shares | | | 50.79 | | | | | | 50.79 | | | | 49.21 | |
Mozambique | | | | | | | | | | | | | | | | | | |
Riversdale Mining Limited(j) | | Coal mining and exploration | | Common shares | | | 100 | | | | | | 100 | | | | – | |
Namibia | | | | | | | | | | | | | | | | | | |
Rössing Uranium Limited(k) | | Uranium mining | | B N$1 C N10c | |
| 71.16
70.59 |
| | } | | | 68.58 | | | | 31.42 | |
South Africa Richards Bay Titanium (Proprietary) Limited(l) | | Titanium dioxide/high purity iron production | | B Ordinary B preference BHP Billiton preference | | | 100 100 100 | | | } | | | 74 | | | | 26 | |
Richards Bay Mining (Proprietary) Limited | | Ilmenite, rutile and zircon mining | | B Ordinary B Preference BHP Billiton preference | | | 100 100 100 | | | } | | | 74 | | | | 26 | |
United States of America | | | | | | | | | | | | | | | | | | |
Kennecott Holdings Corporation (including Kennecott Utah Copper, Kennecott Land and Kennecott Exploration) | | Copper and gold mining, smelting and refining, land development and exploration activities | | Common US$0.01 | | | 100 | | | | | | 100 | | | | – | |
U.S. Borax Inc. | | Mining, refining and marketing of borates | | Common US$0.10 | | | 100 | | | | | | 100 | | | | – | |
| | | | |
| | 170 riotinto.com/reportingcentre2013 | | |
The Group comprises a large number of companies and it is not practical to include all of them in this list. The list therefore only includes those companies that have a more significant impact on the profit or assets of the Group.
The Group’s principal subsidiaries are mostly held by intermediate holding companies and not directly by Rio Tinto plc or Rio Tinto Limited.
| (a) | Of the Group’s 80 per cent interest in Coal & Allied Industries Limited, an indirect share of 4.29 per cent is held through its investment in an equity accounted unit. Coal & Allied forms part of the Rio Tinto Coal Australia business unit. |
| | Through a series of intermediate companies Coal & Allied holds interests in Bengalla (40 per cent), Mount Thorley (80 per cent) and Warkworth (55.6 per cent). The Group’s beneficial interests are therefore: Bengalla: 32 per cent; Mount Thorley: 64 per cent; Warkworth: 44.5 per cent. These are unincorporated arrangements that are not entities; the Group recognises its share of assets, liabilities, revenues and expenses relating to these arrangements. Coal & Allied also owns 100 per cent of Hunter Valley Operations. |
| (b) | Queensland Coal Pty Limited is the main legal entity that holds the Group’s interests in Hail Creek (82 per cent), Blair Athol (71.2 per cent), Clermont (50.1 per cent) and Kestrel (80 per cent). These are unincorporated arrangements that are not entities; the Group recognises its share of assets, liabilities, revenues and expenses relating to these arrangements. Queensland Coal forms part of the Rio Tinto Coal Australia business unit. |
| (c) | Robe River Mining Company Pty Limited (which is 60 per cent owned by the Group) holds a 30 per cent interest in Robe River Iron Associates (Robe River). North Mining Ltd (which is wholly owned by the Group) holds a 35 per cent interest in Robe River. Through these companies the Group recognises a 65 per cent share of the assets, liabilities, revenues and expenses of Robe River, with a 12 per cent non-controlling interest. The Group therefore has a 53 per cent beneficial interest in Robe River. |
| (d) | Alcan Alumina Ltda holds the Group’s 10 per cent interest in Consórcio De Alumínio Do Maranhão, a joint operation in which Group participates but is not a joint operator. The Group recognises its share of assets, liabilities, revenues and expenses relating to this arrangement. |
| (e) | This entity is incorporated in the United States of America but operates in Canada. |
| (f) | Diavik Diamond Mines Inc. is the legal entity that owns the Group’s 60 per cent interest in the Diavik diamond mine (Diavik), an unincorporated arrangement that is not an entity. The Group recognises its share of assets, liabilities, revenue and expenses relating to this arrangement. |
| (g) | Simfer Jersey, a company incorporated in Jersey in which the Group has a 53 per cent interest, has a 95 per cent interest in Simfer S.A. the company that operates the Simandou mining project in Guinea. The Group therefore has a 50.4 per cent indirect interest in Simfer S.A. These entities are consolidated as subsidiaries and together referred to as the Simandou iron ore project. |
| (h) | The Group’s shareholding in QIT Madagascar Minerals SA carries an 80 per cent economic interest and 80 per cent of the total voting rights, a further 5 per cent economic interest is held through non-voting investment certificates to give an economic interest of 85 per cent. The non-controlling interests have a 15 per cent economic interest and 20 per cent of the total voting rights. |
| (i) | The Group obtained a controlling interest in Turquoise Hill Resources Ltd. (formerly Ivanhoe Mines Limited) on 24 January 2012. Ivanhoe was renamed Turquoise Hill Resources Ltd. (Turquoise Hill) on 2 August 2012. Refer to note 37 for further details relating to the consolidation of Turquoise Hill. The Group has a 50.79 per cent interest in Turquoise Hill which holds a 66 per cent interest in Oyu Tolgoi (OT) and a 55.95 per cent interest in SouthGobi Resources Ltd (SouthGobi); these companies are subsidiaries of Turquoise Hill. The Group therefore has a 33.5 per cent indirect interest in OT and a 28.4 per cent indirect interest in SouthGobi. |
| | This entity is incorporated in Canada but operates in Mongolia. |
| (j) | This entity is incorporated in Australia but operates in Mozambique. |
| (k) | The Group’s shareholding in Rössing Uranium Limited carries 35.54 per cent of the total voting rights; the non-controlling interests hold 64.46 per cent of the total voting rights. Rössing is consolidated by virtue of board control. The Government of Namibia has the ability to veto matters that are considered not to be in the interest of Namibia, this is considered to be a protective right. Rio Tinto therefore has control of Rössing and consolidates it as a subsidiary. |
| (l) | Additional classes of shares issued by Richards Bay Titanium Proprietary Limited and Richards Bay Mining (Proprietary) Limited representing non-controlling interests are not shown. The Group’s total legal and beneficial interest in Richards Bay Titanium (Proprietary) Limited and Richards Bay Mining (Proprietary) Limited is 74 per cent. |
| | | | |
| | 171 riotinto.com/reportingcentre2013 | | |
Notes to the 2013 financial statements continued
| 33 | Principal subsidiaries continued |
Summary financial information for subsidiaries that have non-controlling interests that are material to the Group
This summarised financial information is shown on a 100 per cent basis. It represents the amounts shown in the subsidiaries’ financial statements prepared in accordance with IFRS under Group accounting policies, including fair value adjustments, and before intercompany eliminations.
| | | | | | | | | | | | | | | | | | | | | | | | | | | | | | | | |
| | |
| Iron Ore
Company of
Canada
2013 |
| |
| Iron Ore
Company of
Canada
2012 |
| |
| Energy
Resources of
Australia
2013 |
| |
| Energy
Resources of
Australia
2012 |
| |
| Simfer
Jersey 2013 |
(a) | |
| Simfer
Jersey 2012 |
(a) | |
| Turquoise
Hill 2013 |
(b) | |
| Turquoise
Hill 2012 |
(b) |
| Revenue | | | 2,258 | | | | 1,972 | | | | 339 | | | | 416 | | | | – | | | | – | | | | 237 | | | | 138 | |
| Profit/(loss) after tax | | | 485 | | | | 380 | | | | (132 | ) | | | (250 | ) | | | (87 | ) | | | (327 | ) | | | (5,080 | ) | | | (604 | ) |
– attributable to non-controlling interests | | | 200 | | | | 157 | | | | (41 | ) | | | (79 | ) | | | (44 | ) | | | (62 | ) | | | (3,203 | ) | | | (500 | ) |
– attributable to Rio Tinto | | | 285 | | | | 223 | | | | (91 | ) | | | (171 | ) | | | (43 | ) | | | (265 | ) | | | (1,877 | ) | | | (104 | ) |
Other comprehensive (loss)/income | | | (61 | ) | | | 17 | | | | (114 | ) | | | 26 | | | | – | | | | – | | | | (96 | ) | | | 118 | |
Total comprehensive income/(loss) | | | 424 | | | | 397 | | | | (246 | ) | | | (224 | ) | | | (87 | ) | | | (327 | ) | | | (5,176 | ) | | | (486 | ) |
| Non-current assets | | | 3,209 | | | | 3,272 | | | | 793 | | | | 1,036 | | | | 1,702 | | | | 1,489 | | | | 8,536 | | | | 13,855 | |
| Current assets | | | 501 | | | | 607 | | | | 563 | | | | 749 | | | | 107 | | | | 293 | | | | 1,192 | | | | 1,925 | |
| Current liabilities | | | (414 | ) | | | (571 | ) | | | (141 | ) | | | (176 | ) | | | (45 | ) | | | (113 | ) | | | (2,771 | ) | | | (2,746 | ) |
| Non-current liabilities | | | (904 | ) | | | (1,081 | ) | | | (573 | ) | | | (721 | ) | | | (34 | ) | | | (31 | ) | | | (425 | ) | | | (1,220 | ) |
| Net assets | | | 2,392 | | | | 2,227 | | | | 642 | | | | 888 | | | | 1,730 | | | | 1,638 | | | | 6,532 | | | | 11,814 | |
– attributable to non-controlling interests | | | 988 | | | | 921 | | | | 203 | | | | 282 | | | | 862 | | | | 817 | | | | 3,052 | | | | 6,483 | |
– attributable to Rio Tinto | | | 1,404 | | | | 1,306 | | | | 439 | | | | 606 | | | | 868 | | | | 821 | | | | 3,480 | | | | 5,331 | |
Cashflow from operations | | | 924 | | | | 755 | | | | (4 | ) | | | (22 | ) | | | (93 | ) | | | (342 | ) | | | (807 | ) | | | (727 | ) |
Dividends paid to non-controlling interests | | | (106 | ) | | | – | | | | – | | | | – | | | | – | | | | – | | | | – | | | | – | |
| (a) | On 24 April 2012 the Chalco consortium acquired a 47 per cent equity interest in Simfer Jersey Limited. This reduced Rio Tinto’s interest from 95 per cent to 50.35 per cent. During 2013 Chalco sold its interest to Chinalco, its parent company. These figures represent the consolidated position of both Simfer Jersey and Simfer S.A. which together form the Simandou Iron Ore project. |
| (b) | Turquoise Hill holds controlling interests in a number of companies, including OT and SouthGobi. |
| | | | |
| | 172 riotinto.com/reportingcentre2013 | | |
| | | | | | | | | | | | | | | | | | | | | | | | |
| | |
| Robe River
Mining Co
Pty
2013 |
| |
| Robe River
Mining Co
Pty 2012 |
| |
| Other
Companies and eliminations 2013 |
(c) | |
| Other
Companies and eliminations 2012 |
(c) | |
| Robe River
2013 |
| |
| Robe River
2012 |
|
| Revenue | | | 2,074 | | | | 2,009 | | | | 2,417 | | | | 2,344 | | | | 4,491 | | | | 4,353 | |
Profit after tax | | | 1,021 | | | | 1,063 | | | | 1,093 | | | | 1,000 | | | | 2,114 | | | | 2,063 | |
– attributable to non-controlling interests | | | 398 | | | | 420 | | | | – | | | | – | | | | 398 | | | | 420 | |
– attributable to Rio Tinto | | | 623 | | | | 643 | | | | 1,093 | | | | 1,000 | | | | 1,716 | | | | 1,643 | |
| | | | | | |
Other comprehensive (loss)/income | | | (620 | ) | | | 93 | | | | (348 | ) | | | 30 | | | | (968 | ) | | | 123 | |
| Total comprehensive income | | | 401 | | | | 1,156 | | | | 745 | | | | 1,030 | | | | 1,146 | | | | 2,186 | |
| | | | | | |
| Non-current assets | | | 4,545 | | | | 4,090 | | | | 5,329 | | | | 4,524 | | | | 9,874 | | | | 8,614 | |
| Current assets | | | 149 | | | | 179 | | | | 176 | | | | 204 | | | | 325 | | | | 383 | |
| Current liabilities | | | (213 | ) | | | (187 | ) | | | (396 | ) | | | (323 | ) | | | (609 | ) | | | (510 | ) |
| Non-current liabilities | | | (314 | ) | | | (120 | ) | | | (2,436 | ) | | | (2,595 | ) | | | (2,750 | ) | | | (2,715 | ) |
| Net assets | | | 4,167 | | | | 3,962 | | | | 2,673 | | | | 1,810 | | | | 6,840 | | | | 5,772 | |
| | | | | | |
– attributable to non-controlling interests | | | 1,645 | | | | 1,570 | | | | – | | | | – | | | | 1,645 | | | | 1,570 | |
– attributable to Rio Tinto | | | 2,522 | | | | 2,392 | | | | 2,673 | | | | 1,810 | | | | 5,195 | | | | 4,202 | |
| | | | | | |
| Cashflow from operations | | | 1,570 | | | | 1,475 | | | | 1,801 | | | | 1,692 | | | | 3,371 | | | | 3,167 | |
Dividends paid to non-controlling interests | | | (78 | ) | | | (414 | ) | | | – | | | | – | | | | (78 | ) | | | (414 | ) |
| (c) | ‘Other companies and eliminations’ includes North Mining Limited, a wholly owned subsidiary of the Group, and goodwill of US$445 million (2012: US$518 million) that arose on acquisition of the Group’s interest in Robe River. |
| | | | |
| | 173 riotinto.com/reportingcentre2013 | | |
Notes to the 2013 financial statements continued
| 34 | Principal joint operations |
At 31 December 2013
| | | | | | |
| Name and country of operation | | Principal activities | | Group interest (%) | |
Australia | | | | | | |
Tomago Aluminium Joint Venture | | Aluminium smelting | | | 51.6 | |
Clermont Coal | | Coal mining | | | 50.1 | |
Kestrel | | Coal mining | | | 80 | |
Gladstone Power Station | | Power generation | | | 42.1 | |
Hope Downs Joint Venture | | Iron ore mining | | | 50 | |
Queensland Alumina Limited(a) (b) | | Alumina production | | | 80 | |
New Zealand | | | | | | |
New Zealand Aluminium Smelters Limited(a) (b) | | Aluminium smelting | | | 79.4 | |
Canada | | | | | | |
Alouette | | Aluminium production | | | 40 | |
Indonesia | | | | | | |
Grasberg expansion | | Copper and gold mining | | | 40 | |
United States of America | | | | | | |
Pechiney Reynolds Quebec Inc(b) (c) | | Aluminium smelting | | | 50.3 | |
The Group comprises a large number of operations, and it is not practical to include all of them in this list. The list therefore only includes those joint operations that have a more significant impact on the profit or operating assets of the Group.
The Group’s joint operations are held by intermediate holding companies and not directly by Rio Tinto plc or Rio Tinto Limited.
| (a) | Although the Group has a 79.4 per cent interest in New Zealand Aluminium Smelters and an 80 per cent interest in Queensland Alumina Limited, decisions about activities that significantly affect the returns that are generated require agreement of both parties to the arrangements, giving rise to joint control. |
| (b) | Queensland Alumina Limited, New Zealand Aluminium Smelters and Pechiney Reynolds Quebec Inc. are joint arrangements that are primarily designed for the provision of output to the parties sharing joint control; this indicates that the parties have rights to substantially all the economic benefits of the assets. The liabilities of the arrangements are in substance satisfied by cash flows received from the parties; this dependence indicates that the parties effectively have obligations for the liabilities. It is these facts and circumstances that give rise to the classification for these entities as Joint Operations. |
| (c) | Pechiney Reynolds Quebec has a 50.1 per cent interest in the Aluminerie de Becancour aluminium smelter, which is located in Canada. |
| 35 | Principal joint ventures |
At 31 December 2013
| | | | | | | | | | | | | | | | | | |
| Company and country of incorporation/operation | | Principal activities | | Number of shares held | | | Class of shares held | | Proportion of class held (%) | | | | | Group interest (%) | |
Chile | | | | | | | | | | | | | | | | | | |
Minera Escondida Limitada(a) | | Copper mining and refining | | | | | | | | | 30 | | | | | | 30 | |
Mozambique | | | | | | | | | | | | | | | | | | |
Rio Tinto Benga (Mauritius) Limited(b) | | Coal mining and exploration | | | 474,591,847 | | | Class A | | | 65 | | | | | | 65 | |
| | | | | | 65 | | | Management | | | 65 | | | | | | 65 | |
Norway | | | | | | | | | | | | | | | | | | |
Sor-Norge Aluminium A.S. | | Aluminium smelting | |
| –
500,000 |
| | Ordinary A shares Ordinary B shares | |
| –
100 |
| | } | | | 50 | |
Oman | | | | | | | | | | | | | | | | | | |
Sohar Aluminium Company L.L.C.(c) | | Aluminium smelting/power generation | | | 37,500 | | | Ordinary | | | 20 | | | | | | 20 | |
The Group comprises a large number of operations and it is not practical to include all of them in this list. The list therefore only includes those joint ventures that have a more significant impact on the profit or operating assets of the Group.
The Group’s principal joint ventures are held by intermediate holding companies and not directly by Rio Tinto plc or Rio Tinto Limited.
| (a) | Although the Group has a 30 per cent interest in this entity, participant and management agreements allow for an Owners’ Council whereby significant commercial and operational decisions about the relevant activities that significantly affect the returns that are generated require the joint approval of both Rio Tinto and BHP Billiton (holders of a 57.5 per cent interest). It is therefore determined that Rio Tinto participates in joint control. |
The year end of Minera Escondida Limitada is 30 June. The amounts included in the consolidated financial statements of Rio Tinto are however based on accounts of Minera Escondida Limitada that are coterminous with those of the Group.
| (b) | Although the Group holds a 65 per cent interest in this entity, decisions about the relevant activities that significantly affect the returns that are generated require agreement of both parties to the arrangement. It is therefore determined that Rio Tinto participates in joint control. |
This entity is incorporated in Mauritius but operates mainly in Mozambique, where it has a 100 per cent interest in Riversdale Mozambique Limitada, a coal mine located in Tete, Mozambique.
| (c) | Although the Group holds a 20 per cent interest in this entity, decisions about relevant activities that significantly affect the returns that are generated require agreement of all parties to the arrangement. It is therefore determined that Rio Tinto participates in joint control. |
| | | | |
| | 174 riotinto.com/reportingcentre2013 | | |
Summary information for joint ventures that are material to the Group
This summarised financial information is shown on a 100 per cent basis. It represents the amounts shown in the joint ventures’ financial statements prepared in accordance with IFRS under Group accounting policies, including fair value adjustments and amounts due to and from Rio Tinto.
| | | | | | | | | | | | | | | | |
| | |
| Minera
Escondida Limitada 2013 |
(d) | |
| Minera
Escondida Limitada 2012 |
(d) | |
| Rio Tinto
Benga (Mauritius) Limited 2013 |
(e) | |
| Rio Tinto
Benga (Mauritius) Limited 2012 |
(e) |
Revenue | | | 8,553 | | | | 8,553 | | | | 135 | | | | 15 | |
| | | | |
Depreciation and amortisation | | | (720 | ) | | | (830 | ) | | | (43 | ) | | | (45 | ) |
Impairment charges(e) | | | – | | | | – | | | | (354 | ) | | | (2,592 | ) |
Other operating costs | | | (3,697 | ) | | | (3,230 | ) | | | (289 | ) | | | (123 | ) |
Operating profit/(loss) | | | 4,136 | | | | 4,493 | | | | (551 | ) | | | (2,745 | ) |
| | | | |
Interest expense | | | 17 | | | | (30 | ) | | | (3 | ) | | | – | |
Income tax | | | (1,543 | ) | | | (1,697 | ) | | | 22 | | | | 828 | |
Profit/(loss) after tax | | | 2,610 | | | | 2,766 | | | | (532 | ) | | | (1,917 | ) |
| | | | |
Total comprehensive income/(loss) | | | 2,610 | | | | 2,766 | | | | (532 | ) | | | (1,917 | ) |
| | | | |
Non-current assets | | | 9,823 | | | | 7,387 | | | | 389 | | | | 623 | |
Current assets | | | 2,653 | | | | 2,987 | | | | 166 | | | | 102 | |
Current liabilities | | | (1,031 | ) | | | (1,417 | ) | | | (136 | ) | | | (78 | ) |
Non-current liabilities | | | (2,152 | ) | | | (1,410 | ) | | | (328 | ) | | | (100 | ) |
Net assets | | | 9,293 | | | | 7,547 | | | | 91 | | | | 547 | |
| | | | |
Assets and liabilities above include: | | | | | | | | | | | | | | | | |
Cash and cash equivalents | | | 319 | | | | 457 | | | | – | | | | – | |
Current financial liabilities | | | (56 | ) | | | (183 | ) | | | (54 | ) | | | (11 | ) |
Non-current financial liabilities | | | (1,084 | ) | | | (460 | ) | | | (223 | ) | | | (28 | ) |
| | | | |
Dividends received from Joint Venture (Rio Tinto share) | | | 432 | | | | 270 | | | | – | | | | – | |
|
| Reconciliation of the above amounts to the Investment recognised in the Consolidated Statement of Financial Position | |
Group interest | | | 30% | | | | 30% | | | | 65% | | | | 65% | |
| | | | |
Net assets | | | 9,293 | | | | 7,547 | | | | 91 | | | | 547 | |
Group’s ownership interest | | | 2,788 | | | | 2,264 | | | | 59 | | | | 356 | |
Other adjustments | | | 2 | | | | 4 | | | | – | | | | (26 | ) |
| | | | |
Carrying value of Group’s interest | | | 2,790 | | | | 2,268 | | | | 59 | | | | 330 | |
| (d) | In addition to its ‘Investment in Equity Accounted Unit’, the Group recognises deferred tax liabilities of US$511 million (2012: US$421 million) relating to tax on unremitted earnings. |
| (e) | The Group has recognised a US$216 million (2012: US$1,147 million) post tax impairment of its investment in Rio Tinto Benga (Mauritius) Limited. The investment was recognised at fair value on acquisition and it is this investment that has been impaired. |
| | | | |
| | 175 riotinto.com/reportingcentre2013 | | |
Notes to the 2013 financial statements continued
At 31 December 2013
| | | | | | | | | | | | | | | | | | | | | | |
| Company and country of incorporation/operation | | Principal activities | | Number of
shares held | | | Class of
shares held | | | | | Proportion of class held (%) | | | | | Group interest (%) | |
Australia | | | | | | | | | | | | | | | | | | | | | | |
Boyne Smelters Limited(a) | | Aluminium smelting | | | 153,679,560 | | | | Ordinary | | | | | | 59.4 | | | | | | 59.4 | |
Brazil | | | | | | | | | | | | | | | | | | | | | | |
Mineração Rio do Norte S.A.(b) | | Bauxite mining | |
| 25,000,000
47,000,000 |
| |
| Ordinary
Preferred |
| | } | |
| 12.5
11.8 |
| | } | | | 12 | |
Cameroon | | | | | | | | | | | | | | | | | | | | | | |
Compagnie Camerounaise de l’Aluminum | | Aluminium smelting | | | 1,623,127 | | | | Ordinary | | | | | | 46.7 | | | | | | 46.7 | |
United States of America | | | | | | | | | | | | | | | | | | | | | | |
Halco (Mining) Inc | | (c) | | | 4,500 | | | | Common | | | | | | 45 | | | | | | 45 | |
The Group’s principal associates are held by intermediate holding companies and not directly by Rio Tinto plc or Rio Tinto Limited.
The Group comprises a large number of operations and it is not practical to include all of them in this list. The list therefore only includes those associates that have a more significant impact on the profit or operating assets of the Group.
| (a) | The parties that collectively control this entity do so through decisions that are determined on an aggregate voting interest that can be achieved by several combinations of the parties; although each combination requires Rio Tinto’s approval, this is not joint control as defined under IFRS 11. Rio Tinto is therefore determined to have significant influence over this company. |
| (b) | Although the Group holds only 12 per cent of this entity, it has representation on its board of directors and a consequent ability to participate in the financial and operating policy decisions. It is therefore determined that Rio Tinto has significant influence. |
| (c) | Halco has a 51 per cent indirect interest in Compagnie des Bauxites de Guinée, a bauxite mine, the core assets of which are located in Guinea. |
Summary information for associates that are material to the Group
This summarised financial information is shown on a 100 per cent basis. It represents the amounts shown in the associate’s financial statements prepared in accordance with IFRS under Group accounting policies, including amounts due to and from Rio Tinto.
| | | | | | | | |
| | |
| Boyne
Smelters Limited 2013 |
(d) | |
| Boyne
Smelters Limited 2012 |
(d) |
Revenue | | | – | | | | – | |
Loss after tax | | | (47 | ) | | | (564 | ) |
| | |
Other comprehensive loss(e) | | | – | | | | (12 | ) |
Total comprehensive loss | | | (47 | ) | | | (576 | ) |
| | |
Non-current assets | | | 1,086 | | | | 1,234 | |
Current assets | | | 111 | | | | 162 | |
Current liabilities | | | (101 | ) | | | (108 | ) |
Non-current liabilities | | | (1,697 | ) | | | (1,939 | ) |
Net assets | | | (601 | ) | | | (651 | ) |
|
(d) Boyne Smelters Limited is a tolling operation; as such it is dependent on its participants for funding which is provided through cash calls. Rio Tinto Aluminium has made certain prepayments to Boyne for toll processing of alumina; these are charged to Group operating costs as processing takes place. (e) ‘Other comprehensive loss’ is net of amounts recognised by subsidiaries in relation to quasi equity loans. | |
Group interest | | | 59% | | | | 59% | |
Net assets | | | (601 | ) | | | (651 | ) |
Group’s ownership interest | | | (357 | ) | | | (387 | ) |
Loans to equity accounted units | | | 276 | | | | 393 | |
Carrying value of Group’s interest | | | (81 | ) | | | 6 | |
| | | | |
| | 176 riotinto.com/reportingcentre2013 | | |
Summary information for joint ventures and associates that are not individually material to the Group
| | | | | | | | | | | | | | | | |
| | | Joint
Ventures
2013 | | | Joint
Ventures
2012 | | | Associates
2013 | | | Associates
2012 | |
Carrying value of Group’s interest | | | 405 | | | | 422 | | | | 784 | | | | 915 | |
| | | | |
Profit after tax | | | (29 | ) | | | 182 | | | | 102 | | | | 99 | |
| | | | |
Other comprehensive (loss)/ income | | | (7 | ) | | | (33 | ) | | | (38 | ) | | | (117 | ) |
Total comprehensive (loss)/ income | | | (36 | ) | | | 149 | | | | 64 | | | | (18 | ) |
| 37 | Purchases and sales of subsidiaries, joint ventures, associates and other interests in businesses |
2013 Acquisitions
There were no material acquisitions during the year ended 31 December 2013.
2012 Acquisitions
Consolidation of Turquoise Hill Resources Ltd.
On 24 January 2012, Rio Tinto increased its ownership of shares in Turquoise Hill to a controlling 51.01 per cent interest. The acquisition gave Rio Tinto control of the assets in Turquoise Hill other than those relating to Oyu Tolgoi (OT), control of which the Group had previously gained in 2010.
Total consideration to acquire the controlling interest in Turquoise Hill amounted to US$839 million, comprising US$678 million relating to the fair value of the Group’s interest in Turquoise Hill prior to the acquisition date, and US$161 million of cash price paid to acquire the controlling interest after adjusting for amounts attributable to OT and net intragroup balances between Rio Tinto and Turquoise Hill. Fair values on acquisition of Turquoise Hill were determined and finalised during 2012.
Consolidation of Richards Bay Minerals
On 7 September 2012, Rio Tinto increased its holding in Richards Bay Minerals (RBM) to 74 per cent with consolidation effective from 3 September 2012, following the completion of its acquisition of BHP Billiton’s entire interests including BHP Billiton’s 37 per cent indirect equity voting interests in the RBM operating companies.
The acquisition price was US$1.9 billion before contractual adjustments for cash payments made by RBM to BHP Billiton since the acquisition trigger date of 1 February 2012. This price included US$0.6 billion for BHP Billiton’s 37 per cent equity interest in RBM, US$1.0 billion for a 50 per cent interest in outstanding RBM shareholder financing arrangements and US$0.3 billion for a royalty stream.
Provisional fair values recognised on acquisition were finalised by 3 September 2013, 12 months after the consolidation date. No adjustments were made to provisional fair values as a result of finalisation.
2011 Acquisitions
Rio Tinto Mozambique (formerly Riversdale Mining Limited)
During 2011, between January and July, Rio Tinto acquired a 100 per cent interest in Riversdale Mining Limited. The purchase was accounted for as an acquisition taking place in two stages; first the acquisition of a 52.6 per cent controlling interest on 8 April 2011 (the acquisition date) for US$1,713 million net of cash acquired, and record the purchase of additional interest for US$1,977 million after the acquisition date.
Rio Tinto Canada Uranium Corporation (formerly Hathor Exploration Limited)
During 2011, between April and December, Rio Tinto acquired an 88 per cent controlling interest in Hathor Exploration Limited (Hathor). By 12 January 2012 the remaining 12 per cent was acquired and Hathor was subsequently delisted from the Toronto Stock Exchange and renamed Rio Tinto Canada Uranium Corporation.
Goodwill arising on acquisition comprised US$150 million, being Rio Tinto’s 88 per cent share of the amount calculated in accordance with IFRS to recognise a deferred tax liability on the difference between the provisional fair value of newly consolidated assets and liabilities with their tax base.
Turquoise Hill Resources Ltd. (formerly Ivanhoe Mines Limited)
During the year ended 31 December 2011, Rio Tinto increased its ownership of shares in Ivanhoe Mines Limited by 132.7 million, for aggregate consideration of US$1,860 million, increasing its ownership from 40.3 per cent to 49.0 per cent.
| | | | |
| | 177 riotinto.com/reportingcentre2013 | | |
Notes to the 2013 financial statements continued
| 37 | Purchases and sales of subsidiaries, joint ventures, associates and other interests in businesses continued |
2013 Disposals
Significant divestments and disposals of interests in businesses during the year ended 31 December 2013 are summarised below.
| | | | | | | | | | | | | | | | | | | | | | | | |
| | | Northparkes Mine | | | Constellium | | | Palabora Mining Company | | | Eagle nickel-copper project | | | Altynalmas Gold | | | Inova Resources Limited | |
Rio Tinto ownership per cent(a) | | | 80 | | | | 36.6 | | | | 57.7 | | | | 100 | | | | 50 | | | | 57 | |
| | | | | | |
Buyer | |
| China Molybdenum
Co. Ltd |
| | | (b) | | | | (c) | | |
| Lundin Mining
Corporation |
| | | Sumeru Gold B.V. | | |
| Shanxi Donghui
Coal Coking &
Chemicals
Group Co. |
|
| | | | | | |
Date completed | | | 1 December | | |
| Three tranche
sell down |
| | | 31 July | | | | 17 July | | | | 29 November | | | | 1 November | |
Consideration (US$m)(d) | | | 820 | | | | 671 | | | | 373 | | | | 315 | | | | 235 | | | | 81 | |
| (a) | For Altynalmas Gold and Inova Resources Limited, ownership percentages represent interests divested by Turquoise Hill Resources Ltd, a 50.8 per cent owned subsidiary of Rio Tinto. All other amounts reflect Rio Tinto’s effective interest divested. |
| (b) | On 23 May, the initial public offering of Constellium (formerly Alcan Engineered Products) was launched, resulting in Rio Tinto reducing its holding from 36.6 per cent to 27.5 per cent. Rio Tinto subsequently divested the remainder of its holding in two further tranches. Total consideration from these transactions was US$671 million, inclusive of a special dividend and proceeds from sale of Rio Tinto’s equity shareholding, which are included within dividends from equity accounted units and sales of financial assets respectively in the Group’s statement of cash flows. |
| (c) | The purchaser of Palabora was a consortium comprising South African and Chinese entities led by the Industrial Development Corporation of South Africa and Hebei Iron & Steel Group. |
| (d) | Consideration represents total cash proceeds. Disposals in the statement of cash flows are presented net of cash on disposal of US$338 million, and after adjusting for working capital and other items as specified under the sale agreements. |
2012 Disposals
Chalco Joint Venture and Settlement Agreement with Government of Guinea (GoG) for the Simandou Iron Ore Project
On 24 April 2012, Rio Tinto and Chalco, a listed subsidiary of The Aluminium Corporation of China (Chinalco), completed the formation of their joint venture to develop and operate the Simandou iron ore project in Guinea, following the completion of all Chinese regulatory approvals. To complete earn in to a 44.65 per cent net economic interest in the Simandou project, a consortium led by Chalco made a payment to Rio Tinto of US$1.35 billion, in line with an agreement reached with Rio Tinto on 29 July 2010. In late 2013 Chalco completed the transfer of 65 per cent of their interest in Simandou to their holding company, Chinalco, who now holds the Simandou interest directly.
Under the Settlement Agreement signed by Rio Tinto and the Government of Guinea on 22 April 2011, GoG has an option to take an interest of up to 35 per cent in Simfer S.A. (Simfer), the Rio Tinto subsidiary that will undertake the mining portion of the Simandou project.
The Settlement Agreement provides for the transfer of ownership of railway and port infrastructure from Simfer to a newly formed Infrastructure entity (InfraCo) in which GoG had indicated its intention to fund a 51 per cent interest.
Amendment to Simfer’s mining convention and the terms of a new infrastructure convention, required to give effect to the Settlement Agreement (including the GoG participation in the Project), need to be finalised and will require legislative ratification.
The eventual basis of accounting for InfraCo remains to be determined pending finalisation of the detailed infrastructure agreements.
Other disposals
During 2012, Rio Tinto completed the sale of Alcan Cable, the Specialty Alumina businesses, and the Lynemouth Power Station. Finalisation of working capital adjustments took place where applicable and did not result in a material impact on the Group.
2011 Disposals
Constellium (formerly Alcan Engineered Products)
On 4 January 2011, Rio Tinto completed the divestment of 61 per cent of Alcan Engineered Products (AEP) to certain investment funds affiliated with Apollo Global Management, LLC (Apollo) and the Fonds Stratégique d´investissement (FSI). The terms of the transaction are confidential. AEP was rebranded as Constellium on 3 May 2011.
Divestment of the talc business
On 1 August 2011, Rio Tinto completed the divestment of its talc business to Imerys for gross consideration based on an enterprise value of US$340 million before any deductions or tax.
| | | | |
| | 178 riotinto.com/reportingcentre2013 | | |
| 38 | Directors’ and key management remuneration |
Aggregate remuneration, calculated in accordance with the Companies Act 2006, of the directors of the parent companies was as follows:
| | | | | | | | | | | | |
| | | 2013 US$000 | | | 2012 US$000 | | | 2011 US$000 | |
Emoluments | | | 14,061 | | | | 11,165 | | | | 10,145 | |
Long term incentive plans | | | 3,719 | | | | – | | | | 3,215 | |
| | | | 17,780 | | | | 11,165 | | | | 13,360 | |
Pension contributions: defined contribution plans | | | 108 | | | | 66 | | | | 61 | |
Gains made on exercise of share options | | | 5,888 | | | | 1,668 | | | | – | |
The Group defines key management personnel as the directors and members of the Executive committee. The Executive committee comprises the executive directors, product group chief executive officers (PGCEOs) and Group executives.
The aggregate remuneration incurred by Rio Tinto plc in respect of its directors was US$11,451,000 (2012: US$7,357,000; 2011: US$9,059,000). The aggregate pension contribution to defined contribution plans was US$44,000 (2012: US$nil, 2011: US$nil). The aggregate remuneration, including pension contributions and other retirement benefits, incurred by Rio Tinto Limited in respect of its directors was US$6,437,000 (2012: US$3,874,000; 2011: US$4,362,000). The aggregate pension contribution to defined contribution plans was US$64,000 (2012: US$66,000; 2011: US$61,000).
During 2013, three directors (2012: three; 2011 three) accrued retirement benefits under defined benefit arrangements, and two directors (2012: one; 2011: one) accrued retirement benefits under defined contribution arrangements.
Emoluments included in the table above have been translated from local currency at the average rate for the year with the exception of bonus payments which, together with amounts payable under long term incentive plans, have been translated at the year end rate.
Detailed information concerning directors’ remuneration, shareholdings and options is shown in the Remuneration Report, including tables 1 to 3, on pages 98 to 108 of the 2013 Annual report.
Aggregate compensation, representing the expense recognised under IFRS, of the Group’s key management, including directors, was as follows:
| | | | | | | | | | | | |
| | | 2013 US$000 | | | 2012 US$000 | | | 2011 US$000 | |
Short term employee benefits and costs | | | 30,696 | | | | 27,164 | | | | 25,122 | |
Post employment benefits | | | 2,741 | | | | 5,121 | | | | 4,542 | |
Share based payments | | | 26,392 | | | | 32,435 | | | | 28,190 | |
| | | | 59,829 | | | | 64,720 | | | | 57,854 | |
The figures shown above include employment costs which comprise social security and accident premiums in the UK and US and payroll taxes in Australia paid by the employer as a direct additional cost of hire. In total, they amount to US$2,897,000 (2012: US$2,863,000; 2011: US$2,010,000) and although disclosed here, are not included in table 1 of the Remuneration Report.
In 2012, Alan Davies received an interest free advance of A$55,600 (net) for home sale assistance in accordance with the terms and conditions of his international secondment, prior to his appointment to the Executive Committee. The advance was reimbursable to Rio Tinto if Mr Davies had not sold his home by 30 August 2014. Mr Davies met the conditions associated with the advance during 2013 and has no further obligation in respect of this matter.
More detailed information concerning the remuneration of key management is shown in the Remuneration Report, including tables 1 to 3 on pages 98 to 108 of the 2013 Annual report.
| | | | |
| | 179 riotinto.com/reportingcentre2013 | | |
Notes to the 2013 financial statements continued
| | | | | | | | | | | | |
| | | 2013 US$m | | | 2012 US$m | | | 2011 US$m | |
Group Auditors’ remuneration(a) | | | | | | | | | | | | |
Audit of the company | | | 3.8 | | | | 3.1 | | | | 2.8 | |
Audit of subsidiaries | | | 11.5 | | | | 14.1 | | | | 11.6 | |
Total audit | | | 15.3 | | | | 17.2 | | | | 14.4 | |
Audit related assurance services | | | 1.2 | | | | 1.5 | | | | 1.1 | |
Other assurance services(b) | | | 3.0 | | | | 3.8 | | | | 3.3 | |
Total assurance services | | | 4.2 | | | | 5.3 | | | | 4.4 | |
Tax compliance(c) | | | 0.5 | | | | 0.3 | | | | 0.3 | |
Tax advisory services(c) | | | 0.4 | | | | 0.4 | | | | 1.2 | |
Services related to corporate finance transactions not covered above | | | | | | | | | | | | |
– services in connection with bond issues/capital raising | | | 0.4 | | | | 0.6 | | | | 0.5 | |
– services in connection with divestment programme | | | 0.5 | | | | 0.3 | | | | 2.0 | |
Other non-audit services not covered above | | | 0.4 | | | | 0.5 | | | | 1.1 | |
Total non-audit services | | | 2.2 | | | | 2.1 | | | | 5.1 | |
| | | | 21.7 | | | | 24.6 | | | | 23.9 | |
Audit fees payable to other accounting firms | | | | | | | | | | | | |
Audit of the accounts of the Group’s subsidiaries | | | 3.0 | | | | 2.9 | | | | 2.6 | |
Fees in respect of pension scheme audits | | | 0.3 | | | | 0.1 | | | | 0.1 | |
| | | | 3.3 | | | | 3.0 | | | | 2.7 | |
| (a) | The remuneration payable to PwC, the Group Auditors, is approved by the Audit committee. The committee sets the policy for the award of non audit work to the auditors and approves the nature and extent of such work, and the amount of the related fees, to ensure that independence is maintained. The fees disclosed above consolidate all payments made to member firms of PwC by the Companies and their subsidiaries, together with the Group’s share of the payments made by joint operations. Non-audit services arise largely from assurance and/or regulation related work. |
| (b) | Other assurance services are mainly related to carve-out financial statements, sustainability assurance and limited assurance over the “Taxes paid” report. |
| (c) | “Taxation services” includes tax compliance and advisory services. Tax compliance involves the preparation or review of returns for corporation, income, sales and excise taxes. Tax advisory services includes advice on non recurring acquisitions and disposals, advice on transfer pricing and advice on employee global mobility. |
| 40 | Related party transactions |
Information about material related party transactions of the Rio Tinto Group is set out below:
Subsidiary companies and joint operations
Details of investments in principal subsidiary companies are disclosed in note 33. Information relating to joint operations can be found in note 34.
Equity accounted units
Transactions and balances with equity accounted units are summarised below. Purchases, trade and other receivables, and trade and other payables relate largely to amounts charged by equity accounted units for toll processing of alumina and purchases of bauxite and aluminium. Sales relate largely to charges for supply of coal to jointly controlled marketing entities for onward sale to third party customers.
| | | | | | | | | | | | |
| Income statement items | | 2013 US$m | | | Restated 2012 US$m | | | Restated 2011 US$m | |
Purchases from equity accounted units | | | (1,953 | ) | | | (2,283 | ) | | | (2,781 | ) |
Sales to equity accounted units | | | 1,569 | | | | 1,742 | | | | 2,075 | |
| | | | | | | | | | | | |
| Statement of cash flow items | | US$m | | | US$m | | | US$m | |
Cash movement on equity accounted units funded balances (note 24) | | | – | | | | – | | | | 1,683 | |
Net funding of equity accounted units | | | (88 | ) | | | (223 | ) | | | (657 | ) |
| | | | | | | | | | | | |
| Statement of financial position items | | US$m | | | US$m | | | US$m | |
Investments in equity accounted units (note 15)(a) | | | 3,957 | | | | 3,941 | | | | 7,548 | |
Loans to equity accounted units | | | 94 | | | | 282 | | | | 584 | |
Loans from equity accounted units | | | (86 | ) | | | (116 | ) | | | (3,405 | ) |
Trade and other receivables: amounts due from equity accounted units (note 18) | | | 615 | | | | 722 | | | | 801 | |
Trade and other payables: amounts due to equity accounted units (note 25) | | | (290 | ) | | | (357 | ) | | | (550 | ) |
| (a) | Further information about investments in equity accounted units is set out in notes 35 and 36. |
| | | | |
| | 180 riotinto.com/reportingcentre2013 | | |
Pension funds
Information relating to pension fund arrangements is disclosed in note 45.
Directors and key management
Details of directors’ and key management remuneration are set out in note 38 and in the Remuneration Report on pages 68 to 108.
The principal exchange rates used in the preparation of the 2013 financial statements are:
| | | | | | | | | | | | | | | | | | | | | | | | |
| | | Annual average | | | Year end | |
| | | 2013 | | | 2012 | | | 2011 | | | 2013 | | | 2012 | | | 2011 | |
Sterling | | | 1.56 | | | | 1.58 | | | | 1.60 | | | | 1.65 | | | | 1.62 | | | | 1.54 | |
Australian dollar | | | 0.97 | | | | 1.04 | | | | 1.03 | | | | 0.89 | | | | 1.04 | | | | 1.01 | |
Canadian dollar | | | 0.97 | | | | 1.00 | | | | 1.01 | | | | 0.94 | | | | 1.00 | | | | 0.98 | |
South African rand | | | 0.104 | | | | 0.122 | | | | 0.138 | | | | 0.096 | | | | 0.122 | | | | 0.122 | |
Euro | | | 1.33 | | | | 1.29 | | | | 1.39 | | | | 1.38 | | | | 1.32 | | | | 1.30 | |
| 42 | Bougainville Copper Limited (BCL) |
The Group owns 53.8 per cent of the issued share capital of BCL. Mining has been suspended at the Panguna mine since 1989. Safe access by company employees has not been possible since that time and an accurate assessment of the condition of the assets cannot therefore be made. Considerable funding would be required to recommence operations to the level which applied at the time of the mines closure in 1989. An Order of Magnitude Study completed by BCL in 2013 indicated an estimated capital requirement of US$5.2 billion to reopen the mine assuming all site infrastructure is replaced. Rio Tinto does not have control over BCL under IFRS as it does not have the current ability to direct the activities that affect its returns, being the mining and sale of ore from the Panguna mine; it is therefore not a subsidiary.
| 43 | Events after the statement of financial position date |
On 13 January 2014, Rio Tinto’s 50.8 per cent subsidiary Turquoise Hill Resources Ltd closed its rights offering. Rio Tinto exercised all of its rights under the basic subscription, with holders of the non-controlling interest subscribing for 495,133,382 shares at a price of C$2.53 per share. Rio Tinto’s share in Turquoise Hill remained unchanged at 50.8 per cent of common shares as a result of the offering.
On 12 February 2014, the Group announced that it had entered into an option agreement for LNG Canada to acquire or lease a wharf and associated land at Rio Tinto’s port facility at Kitimat, British Columbia, Canada.
Other than the items above, no events were identified after the statement of financial position date which could be expected to have a material impact on the consolidated financial statements.
Rio Tinto plc and Rio Tinto Limited (the Companies) have a number of share based payment plans, which are described in detail in the Remuneration Report. These plans have been accounted for in accordance with the fair value recognition provisions of ‘IFRS 2 Share-based Payment’.
The charge/(credit) that has been recognised in the income statement for Rio Tinto’s share-based compensation plans, and the related liability (for cash-settled plans), is set out in the table below.
| | | | | | | | | | | | | | | | | | | | |
| | | Charge/(credit) recognised for the year | | | Liability at the end of the year | |
| | | 2013 US$m | | | 2012 US$m | | | 2011 US$m | | | 2013 US$m | | | 2012 US$m | |
Equity-settled plans | | | 142 | | | | 243 | | | | 157 | | | | – | | | | – | |
Cash-settled plans | | | – | | | | (3 | ) | | | (1 | ) | | | 1 | | | | 2 | |
Total | | | 142 | | | | 240 | | | | 156 | | | | 1 | | | | 2 | |
The 2012 share based payment charge included one off costs associated with management changes at Turquoise Hill Resources Ltd. (TRQ) of US$76 million. These costs were incurred on TRQ’s own share based payment plans. These charges did not recur in 2013 and are not expected to recur in future years.
The main Rio Tinto plc and Rio Tinto Limited plans are as follows:
Share Savings Plans
Awards under these plans are settled in equity and accounted for accordingly. The fair value of each award on the day of grant was estimated using a lattice-based option valuation model, including allowance for the exercise price being at a discount to market price.
Awards are no longer granted under the Share Savings Plans as these plans were replaced by the Global Employee Share Plan in 2012. Charges will continue to be incurred until prior period awards have vested.
| | | | |
| | 181 riotinto.com/reportingcentre2013 | | |
Notes to the 2013 financial statements continued
| 44 | Share based payments continued |
Share Option Plan
The Group has a policy of settling awards made under the Share Option Plan in equity, although the directors at their discretion can offer a cash alternative. The awards are accounted for in accordance with the requirements applying to equity-settled, share-based payment transactions. The performance conditions in relation to Total Shareholder Return (TSR) have been incorporated in the measurement of fair value for these awards by modelling the correlation between Rio Tinto’s TSR and that of the HSBC Global Mining Index. The relationship between Rio Tinto’s TSR and the index was simulated many thousands of times to derive a distribution which, in conjunction with the lattice-based option valuation model, was used to determine the fair value of the options.
No awards were granted under the Share Option Plans in 2013 as the LTIP arrangements have been simplified and awards are now only made under the Performance Share Plan. Charges will continue to be incurred until prior period awards have vested.
UK Share Plan (formerly the Share Ownership Plan)
The fair values of awards of Matching and Free Shares made by Rio Tinto are taken to be the market value of the shares on the date of purchase. These awards are settled in equity. The total fair value of shares awarded during the year was US$2 million (2012: US$3 million).
Performance Share Plan
Participants are generally assigned shares in settlement of their awards and therefore the Plan is accounted for in accordance with the requirements applying to equity-settled share-based payment transactions.
For the awards or parts of awards with TSR performance conditions, the fair value (FV) of the awards was calculated using a Monte Carlo simulation model taking into account the TSR performance conditions. In each case fair values were adjusted for non receipt of dividends between grant date and date of vesting (excluding awards for executive directors and product group CEOs). One-third of the 2013 awards must satisfy an earnings target relative to ten global mining comparators for vesting. As this is a non-market related performance condition, under IFRS 2, the fair value recognised is reviewed at each accounting date based on the directors’ expectations for the proportion vesting. As at 31 December 2013 it was assumed 100 per cent of awards subject to the condition would vest. Forfeitures are assumed prior to vesting at three per cent per annum of outstanding awards (except for the 2009 awards which applied to senior executives only with no allowance for forfeitures).
Management Share Plan
The Management Share Plan was introduced during 2007 to provide conditional share-based awards to management. The vesting of these awards is dependent on service and/or performance based conditions being met. In general, the awards will be settled in equity including the dividends accumulated from date of award to vesting. The awards are accounted for in accordance with the requirements applying to equity-settled share-based payment transactions.
The fair value of each award on the day of grant is equal to share price on the day of grant less a small adjustment for the timing of dividends. Forfeitures are assumed prior to vesting at five per cent per annum of outstanding awards.
Bonus Deferral Plan
The Bonus Deferral Plan was originally introduced during 2009 for the mandatory deferral of the 2008 bonuses for executive directors, product group executives and for other executives. Additional Bonus Deferral Awards were made in 2010, 2011 and 2012 for the mandatory deferral of 50 per cent of the bonuses for executive directors and product group executives and 10 per cent of the bonuses for other executives.
The vesting of these awards is dependent only on service conditions being met. In general, the awards will be settled in equity including the dividends accumulated from date of award to vesting. The awards are accounted for in accordance with the requirements applying to equity-settled share-based payment transactions. The fair value of each award on the day of grant is equal to share price on the day of grant less a small adjustment for the timing of dividends vesting. Forfeitures are assumed prior to vesting at three per cent per annum of outstanding awards.
Global Employee Share Plan
The Global Employee Share Plan was introduced during 2012. The company provides matching shares for each share purchased. The vesting of these matching awards is dependent on service conditions being met. These awards are settled in equity. The fair value of each matching share on the day of grant is equal to share price on the date of purchase. Forfeitures are assumed prior to vesting at five per cent per annum of outstanding awards.
| | | | |
| | 182 riotinto.com/reportingcentre2013 | | |
Summary of options outstanding
A summary of the status of the Companies’ equity-settled share option plans at 31 December 2013 is presented below.
| | | | | | | | | | | | | | | | |
| Options outstanding at 31 December 2013 | | Number | | | Weighted
average
exercise price
per option £/A$ | | | Weighted
average
remaining
contractual life
Years | | | Aggregate
intrinsic
value
2013
US$m | |
Rio Tinto plc Share Savings Plan (FV £21 – £29) | | | 699,504 | | | | 27.07 | | | | 1.2 | | | | 8 | |
Rio Tinto Limited Share Savings Plan (FV A$48 – A$67) | | | 984,551 | | | | 54.77 | | | | 1.7 | | | | 12 | |
Rio Tinto plc Share Option Plan (FV £10 – £43) | | | 1,962,541 | | | | 28.12 | | | | 5.3 | | | | 26 | |
Rio Tinto Limited Share Option Plan (FV A$18 – A$77) | | | 569,935 | | | | 48.32 | | | | 4.1 | | | | 11 | |
| | | | 4,216,531 | | | | | | | | | | | | 57 | |
As at 31 December 2012 there were 7,042,815 options outstanding with an aggregate intrinsic value of US$122 million. | |
| Options exercisable at 31 December 2013 | | | | | | | | | | | | |
Rio Tinto plc Share Option Plan (FV £10 – £38) | | | 1,360,884 | | | | 23.44 | | | | 4.2 | | | | 26 | |
Rio Tinto Limited Share Option Plan (FV A$18 – A$77) | | | 569,935 | | | | 48.32 | | | | 4.1 | | | | 11 | |
| | | | 1,930,819 | | | | | | | | | | | | 37 | |
As at 31 December 2013, there were no options (2012: no options) exercisable under either the Rio Tinto plc or the Rio Tinto Limited Share Savings Plans.
The Performance Share Plan, Management Share Plan, Bonus Deferral Plan, Global Employee Share Plan and UK Share Plan together represent 91 per cent (2012: 83 per cent) of the total IFRS 2 charge for Rio Tinto plc and Rio Tinto Limited plans in 2013.
Performance Share Plan
| | | | | | | | | | | | | | | | | | | | | | | | | | | | | | | | |
| | | Rio Tinto plc Awards | | | Rio Tinto Ltd Awards | |
| | | 2013
Number | | | Weighted
average
fair value at
grant date
2013 £ | | | 2012
Number | | | Weighted
average
fair value at
grant date
2012 £ | | | 2013
Number | | | Weighted
average
fair value at
grant date
2013 A$ | | | 2012
Number | | | Weighted
average
fair value at
grant date
2012 A$ | |
Non-vested shares at 1 January | | | 2,705,545 | | | | 30.40 | | | | 2,473,203 | | | | 33.67 | | | | 1,541,776 | | | | 60.46 | | | | 1,204,561 | | | | 71.24 | |
Awarded | | | 949,588 | | | | 19.06 | | | | 711,701 | | | | 24.67 | | | | 651,435 | | | | 36.17 | | | | 531,937 | | | | 44.79 | |
Forfeited | | | (303,008 | ) | | | 31.20 | | | | (44,625 | ) | | | 29.88 | | | | (137,408 | ) | | | 57.40 | | | | (24,794 | ) | | | 60.49 | |
Failed performance conditions | | | (14,070 | ) | | | 13.61 | | | | (358,026 | ) | | | 40.69 | | | | (2,423 | ) | | | 32.74 | | | | (126,498 | ) | | | 89.65 | |
Vested | | | (176,103 | ) | | | 13.91 | | | | (76,708 | ) | | | 35.08 | | | | (29,861 | ) | | | 32.74 | | | | (43,430 | ) | | | 82.61 | |
Non-vested shares at 31 December | | | 3,161,952 | | | | 27.91 | | | | 2,705,545 | | | | 30.40 | | | | 2,023,519 | | | | 53.29 | | | | 1,541,776 | | | | 60.46 | |
| | | | | | | | | | | | | | | | | | | | | | | | | | | | | | | | |
| | | 2013
Number | | | Weighted
average
share price
2013 £ | | | 2012
Number | | | Weighted
average
share price
2012 £ | | | 2013
Number | | | Weighted
average
share price
2013 A$ | | | 2012
Number | | | Weighted
average
share price
2012 A$ | |
Shares issued in respect of vested awards during the year | | | 176,103 | | | | 34.69 | | | | 76,708 | | | | 36.40 | | | | 29,861 | | | | 69.03 | | | | 43,430 | | | | 67.01 | |
In addition to the equity-settled awards shown above, there were 2,811 Rio Tinto plc cash-settled awards outstanding at 31 December 2013. The total liability for these awards at 31 December 2013 was less than US$1 million (2012: less than US$1 million).
| | | | |
| | 183 riotinto.com/reportingcentre2013 | | |
Notes to the 2013 financial statements continued
| 44 | Share based payments continued |
Management Share Plan, Bonus Deferral Plan, Global Employee Share Plan and UK Share Plan (combined)
| | | | | | | | | | | | | | | | | | | | | | | | | | | | | | | | |
| | | Rio Tinto Plc Awards | | | Rio Tinto Ltd Awards | |
| | | 2013 Number | | | Weighted average fair value at grant date 2013 £ | | | 2012 Number | | | Weighted average fair value at grant date 2012 £ | | | 2013 Number | | | Weighted average fair value at grant date 2013 A$ | | | 2012 Number | | | Weighted average fair value at grant date 2012 A$ | |
Non-vested awards at 1 January | | | 2,073,129 | | | | 37.21 | | | | 2,565,372 | | | | 30.05 | | | | 1,574,153 | | | | 71.73 | | | | 1,574,088 | | | | 65.23 | |
Awarded | | | 1,420,445 | | | | 29.09 | | | | 819,564 | | | | 35.48 | | | | 1,301,055 | | | | 55.36 | | | | 749,616 | | | | 64.16 | |
Forfeited | | | (237,265 | ) | | | 34.13 | | | | (135,133 | ) | | | 37.68 | | | | (165,591 | ) | | | 62.36 | | | | (62,583 | ) | | | 71.73 | |
Expired | | | (5,172 | ) | | | 36.97 | | | | (3,411 | ) | | | 17.32 | | | | (219 | ) | | | 76.02 | | | | (4,032 | ) | | | 48.32 | |
Vested | | | (973,918 | ) | | | 36.61 | | | | (1,173,263 | ) | | | 20.34 | | | | (650,496 | ) | | | 73.17 | | | | (682,936 | ) | | | 48.60 | |
Non-vested awards at 31 December | | | 2,277,219 | | | | 32.72 | | | | 2,073,129 | | | | 37.21 | | | | 2,058,902 | | | | 61.64 | | | | 1,574,153 | | | | 71.73 | |
Comprising of | | | | | | | | | | | | | | | | | | | | | | | | | | | | | | | | |
– Management Share Plan | | | 1,708,472 | | | | 33.38 | | | | 1,838,633 | | | | 37.12 | | | | 1,505,507 | | | | 62.93 | | | | 1,409,513 | | | | 71.96 | |
– Bonus Deferral Plan | | | 206,336 | | | | 32.20 | | | | 234,496 | | | | 37.90 | | | | 205,242 | | | | 59.10 | | | | 164,640 | | | | 69.74 | |
– Global Employee Share Plan | | | 353,049 | | | | 29.93 | | | | – | | | | – | | | | 348,153 | | | | 57.57 | | | | – | | | | – | |
– UK Share Plan | | | 9,362 | | | | 29.11 | | | | – | | | | – | | | | – | | | | – | | | | – | | | | – | |
| | | | | | | | | | | | | | | | | | | | | | | | | | | | | | | | |
| | | 2013
Number | | | Weighted
average
share price 2013 £ | | | 2012
Number | | | Weighted
average
share price
2012 £ | | | 2013
Number | | | Weighted
average
share price 2013 A$ | | | 2012
Number | | | Weighted
average
share price 2012 A$ | |
Shares issued in respect of vested awards during the year (including dividend shares applied on vesting) | |
– Management Share Plan | | | 843,009 | | | | 33.82 | | | | 1,251,063 | | | | 35.63 | | | | 582,493 | | | | 65.09 | | | | 697,695 | | | | 65.30 | |
– Bonus Deferral Plan | | | 106,335 | | | | 32.23 | | | | 7,533 | | | | 33.87 | | | | 65,297 | | | | 64.77 | | | | 372 | | | | 69.74 | |
– Global Employee Share Plan | | | 12,335 | | | | 30.92 | | | | – | | | | – | | | | 10,324 | | | | 60.34 | | | | – | | | | – | |
– UK Share Plan | | | 35,250 | | | | 29.72 | | | | – | | | | – | | | | – | | | | – | | | | – | | | | – | |
In addition to the equity-settled awards shown above, there were 10,506 Rio Tinto plc cash-settled awards outstanding at 31 December 2013. The total liability for these awards at 31 December 2013 was less than US$1 million (2012: less than US$1 million).
| 45 | Post retirement benefits |
Description of plans
The Group operates a number of pension and post retirement healthcare plans around the world. Some of these plans are defined contribution and some are defined benefit, with assets held in separate trusts, foundations and similar entities.
Defined benefit pension and post retirement healthcare plans expose the Group to a number of risks:
| | |
| Uncertainty in benefit payments | | The value of the Group’s liabilities for post retirement benefits will ultimately depend on the amount of benefits paid out. This in turn will depend on the future pay increases, the level of inflation (for those benefits that are subject to some form of inflation protection) and how long individuals live. |
| Volatility in asset values | | The Group is exposed to future movements in the values of assets held in pension plans to meet future benefit payments. |
| Uncertainty in cash funding | | Movements in the values of the obligations or assets may result in the Group being required to provide higher levels of cash funding, although changes in the level of cash required can often be spread over a number of years. In some countries control over the rate of cash funding or over the investment policy for pension assets might rest to some extent with a trustee body or other body that is not under the Group’s direct control. In addition the Group is also exposed to adverse changes in pension regulation. |
For these reasons the Group has a policy of moving away from defined benefit pension provision and towards defined contribution arrangements instead. The defined benefit pension plans for salaried employees are closed to new entrants in almost all countries. For unionised employees some plans remain open but others are closed.
The Group does not usually participate in multiemployer plans in which the risks are shared with other companies using those plans. The Group’s participation in such plans is immaterial and consequently no detailed disclosures are provided in this note.
| | | | |
| | 184 riotinto.com/reportingcentre2013 | | |
Pension plans
The majority of the Group’s defined benefit pension obligations are in Canada, the UK, the US, Switzerland and the Eurozone.
In Canada the benefits for salaried staff are generally linked to final average pay and are closed to new entrants. Benefits for bargaining employees are reviewed in negotiation with unions and are typically either linked to final average pay or to a flat monetary amount per year of service. Some of these plans have been closed to new entrants but some remain open at present. The plans are subject to the regulatory requirements that apply to Canadian pension plans in the relevant provinces and territories (predominantly Quebec). Pension Committees are responsible for ensuring that the plans operate in a manner that is compliant with the relevant regulations. The Pension Committees generally have a number of members appointed by the sponsor and a number appointed by the plan participants. In some cases there is also an independent Committee member.
The defined benefit sections of the UK arrangements are linked to final pay and are closed to new members. New employees are admitted to defined contribution sections. The plans are subject to the regulatory requirements that apply to UK pension plans. Trustees are responsible for ensuring that the plans operate in a manner that is compliant with UK regulations. Trustee boards have a number of directors appointed by the sponsor and a number appointed by the plan participants. In some cases there is also an independent trustee director.
A number of defined benefit pension plans are sponsored by the US entities. Benefits for salaried staff are generally linked to final average pay and closed to new entrants, while benefits for bargaining employees are reviewed in negotiation with unions and are typically a flat monetary amount per year of service. A Benefits Governance Committee is responsible for ensuring that the plans are compliant with US regulations. Members of that Committee are appointed by the sponsor.
In Europe, there are defined benefit plans in Switzerland, the Netherlands, Germany and France. The largest single plan is in Switzerland and provides benefits linked to final average pay. The Swiss plan is overseen by a Foundation Board which is responsible for ensuring that the plan complies with Swiss regulations. Foundation Board members are appointed by the plan sponsor, by employees and by retirees.
In Australia, the main arrangements are principally defined contribution in nature but there are sections providing defined benefits linked to final pay, typically paid in lump sum form. The defined benefit sections are closed to new entrants.
The Group also operates a number of unfunded defined benefit plans, which are included in the figures below.
Post retirement healthcare plans
Certain subsidiaries of the Group, mainly in the US and Canada, provide health and life insurance benefits to retired employees and in some cases to their beneficiaries and covered dependants. Eligibility for cover is dependent upon certain age and service criteria. These arrangements are generally unfunded, and are included in the figures below.
Plan assets
The assets of the pension plans are invested predominantly in a diversified range of equities, bonds and property. Consequently the funding level of the pension plans is affected by movements in the level of equity markets and also by movements in interest rates. The Group monitors its exposure to changes in interest rates and equity markets and also measures its statement of financial position pension risk using a Value at Risk approach. These measures are considered when deciding whether significant changes in investment strategy are required. Asset-liability studies are conducted on a periodic basis for the main pension plans to determine the optimal investment mix bearing in mind the Group’s tolerance for risk, the risk tolerance of the local sponsor companies and the views of the Pension Committees and Trustee boards who are legally responsible for the investments of the plans. In Canada, the UK and Switzerland the Group works with the trustees to ensure that the investment policy adopted is consistent with the Group’s tolerance for risk. In the US the Group has direct control over the investment policy, subject to the local investment regulations.
The proportions of the total fair value of assets in the pension plans for each asset class at the statement of financial position date were:
| | | | | | | | | | | | | | | | |
| | | 2013 | | | | | | | | | Restated
2012 | |
Equities | | | 45.3% | | | | | | | | 49.2% | | | | | |
– Quoted | | | | | | | 42.1% | | | | | | | | 46.4% | |
– Private | | | | | | | 3.2% | | | | | | | | 2.8% | |
Bonds | | | 40.4% | | | | | | | | 37.8% | | | | | |
– Government fixed income | | | | | | | 10.7% | | | | | | | | 10.7% | |
– Government inflation-linked | | | | | | | 10.3% | | | | | | | | 9.6% | |
– Corporate and other publicly quoted | | | | | | | 18.5% | | | | | | | | 16.2% | |
– Private | | | | | | | 0.9% | | | | | | | | 1.3% | |
Property | | | 8.7% | | | | | | | | 8.0% | | | | | |
– Quoted property funds | | | | | | | 4.6% | | | | | | | | 2.4% | |
– Unquoted property funds | | | | | | | 4.0% | | | | | | | | 3.6% | |
– Directly held property | | | | | | | 0.1% | | | | | | | | 2.0% | |
Qualifying Insurance Policies | | | 1.7% | | | | | | | | 1.8% | | | | | |
Cash & Other | | | 3.9% | | | | | | | | 3.2% | | | | | |
| | | | 100.0% | | | | | | | | 100.0% | | | | | |
The assets of the plans are managed on a day-to-day basis by external specialist fund managers. These managers may invest in the Group’s securities subject to limits imposed by the relevant fiduciary committees and local legislation. The approximate total holding of Group securities within the plans is US$40 million (2012: US$47 million).
The holdings of quoted equities are invested either in pooled funds or segregated accounts held in the name of the relevant pension funds. These equity portfolios are well diversified in terms of the geographic distribution and market sectors.
| | | | |
| | 185 riotinto.com/reportingcentre2013 | | |
Notes to the 2013 financial statements continued
| 45 | Post retirement benefits continued |
The holdings of government bonds are generally invested in the debt of the country in which a pension plan is situated. Corporate and other quoted bonds are usually of investment grade. Private debt is mainly in North America.
The quoted property funds are invested in a diversified range of properties. The directly held property is owned by the Swiss pension fund and is predominantly invested in properties in and around Zurich.
The holdings of Cash and Other are predominantly cash and short-term money market instruments.
Investments in private equity, private debt, unquoted property funds and directly held property are less liquid than the other investment classes listed above and therefore the Group’s investment in those asset classes is restricted to a level that does not endanger the liquidity of the pension plans.
The Group does not currently utilise derivatives to manage risk in its pension plans. However, fund managers may use derivatives to hedge currency movements within their portfolios and, in the case of bond managers, to take positions that could be taken using direct holdings of bonds but more efficiently.
Maturity of defined benefit obligations
An approximate analysis of the maturity of the obligations is given in the table below:
| | | | | | | | | | | | | | | | | | | | |
| | | Pension
benefits | | | Other
benefits | | | 2013
Total
% | | | Restated
2012
Total % | | | Restated
2011
Total % | |
Proportion relating to current employees | | | 25% | | | | 22% | | | | 25% | | | | 29% | | | | 30% | |
Proportion relating to former employees not yet retired | | | 12% | | | | 4% | | | | 11% | | | | 11% | | | | 10% | |
Proportion relating to retirees | | | 63% | | | | 74% | | | | 64% | | | | 60% | | | | 60% | |
Total | | | 100% | | | | 100% | | | | 100% | | | | 100% | | | | 100% | |
| | | | | | | | | | | | | | | | | | | | | |
Duration of obligations (years) | | | 13.4 | | | | 12.3 | | | | 13.3 | | | | 14.1 | | | | 13.3 | |
Geographical distribution of defined benefit obligations
An approximate analysis of the geographic distribution of the obligations is given in the table below:
| | | | | | | | | | | | | | | | | | | | |
| | | Pension
benefits | | | Other
benefits | | | 2013
Total
% | | | Restated
2012
Total % | | | Restated
2011
Total % | |
Canada | | | 46% | | | | 41% | | | | 45% | | | | 49% | | | | 46% | |
UK | | | 28% | | | | 2% | | | | 27% | | | | 23% | | | | 24% | |
US | | | 12% | | | | 55% | | | | 14% | | | | 15% | | | | 16% | |
Switzerland | | | 6% | | | | 0% | | | | 6% | | | | 5% | | | | 5% | |
Eurozone | | | 5% | | | | 0% | | | | 5% | | | | 5% | | | | 5% | |
Australia | | | 2% | | | | 0% | | | | 2% | | | | 2% | | | | 3% | |
Other | | | 1% | | | | 2% | | | | 1% | | | | 1% | | | | 1% | |
Total | | | 100% | | | | 100% | | | | 100% | | | | 100% | | | | 100% | |
Total expense recognised in the income statement
| | | | | | | | | | | | | | | | | | | | |
| | | Pension
benefits | | | Other
benefits | | | 2013
Total
US$m | | | Restated
2012
Total
US$m | | | Restated
2011
Total
US$m | |
Current employer service cost for defined benefit plans | | | (267 | ) | | | (17 | ) | | | (284 | ) | | | (270 | ) | | | (251 | ) |
Past service cost | | | 1 | | | | – | | | | 1 | | | | (4 | ) | | | 12 | |
Curtailment gains | | | 27 | | | | 17 | | | | 44 | | | | 59 | | | | 20 | |
Settlement gains | | | 2 | | | | – | | | | 2 | | | | – | | | | – | |
Net interest cost on defined benefit liability | | | (161 | ) | | | (48 | ) | | | (209 | ) | | | (240 | ) | | | (226 | ) |
Non-investment expenses paid from the plans | | | (22 | ) | | | – | | | | (22 | ) | | | (20 | ) | | | (20 | ) |
Total defined benefit expense | | | (420 | ) | | | (48 | ) | | | (468 | ) | | | (475 | ) | | | (465 | ) |
Current employer service cost for defined contribution and industry-wide plans | | | (335 | ) | | | (2 | ) | | | (337 | ) | | | (348 | ) | | | (288 | ) |
Total expense recognised in the income statement | | | (755 | ) | | | (50 | ) | | | (805 | ) | | | (823 | ) | | | (753 | ) |
The above expense amounts are included as an employee cost within net operating costs. In 2013, US$21 million (pre-tax) of curtailment and settlement gains relating to the sale of businesses have been excluded from Underlying earnings (2012: US$34 million, 2011: US$20 million).
The curtailments shown in the table above relate primarily to headcount reductions at various operations during 2013 and divestments. The settlements in 2013 relate mainly to an exercise in the US in which deferred vested participants were offered a one-time lump sum payment in place of their future pension payments. The settlements also include amounts paid to insurance companies to take on the obligations for two relatively small pension plans which were then wound-up.
| | | | |
| | 186 riotinto.com/reportingcentre2013 | | |
Total amount recognised in other comprehensive income before tax
| | | | | | | | | | | | |
| | | 2013
US$m | | | Restated
2012
US$m | | | Restated
2011
US$m | |
Actuarial gains/(losses) | | | 1,092 | | | | (1,235 | ) | | | (1,627 | ) |
Return on assets (net of interest on assets) | | | 1,212 | | | | 903 | | | | (216 | ) |
Loss on application of asset ceiling | | | (44 | ) | | | – | | | | – | |
Total gain/(loss) recognised in other comprehensive income | | | 2,260 | | | | (332 | ) | | | (1,843 | ) |
Amounts recognised in the Statement of financial position
The following amounts were measured in accordance with IAS 19 at 31 December:
| | | | | | | | | | | | | | | | |
| | | Pension
benefits | | | Other
benefits | | | 2013
Total
US$m | | | Restated
2012
Total
US$m | |
Total fair value of plan assets | | | 15,527 | | | | – | | | | 15,527 | | | | 14,671 | |
Present value of obligations – funded | | | (16,699 | ) | | | – | | | | (16,699 | ) | | | (18,415 | ) |
Present value of obligations – unfunded | | | (999 | ) | | | (1,094 | ) | | | (2,093 | ) | | | (2,307 | ) |
Present value of obligations – total | | | (17,698 | ) | | | (1,094 | ) | | | (18,792 | ) | | | (20,722 | ) |
Effect of asset ceiling | | | (44 | ) | | | – | | | | (44 | ) | | | – | |
Aggregate deficit to be shown in the statement of financial position | | | (2,215 | ) | | | (1,094 | ) | | | (3,309 | ) | | | (6,051 | ) |
Comprising: | | | | | | | | | | | | | | | | |
– Deficits | | | (2,505 | ) | | | (1,094 | ) | | | (3,599 | ) | | | (6,205 | ) |
– Surpluses | | | 290 | | | | – | | | | 290 | | | | 154 | |
Net deficits on pension plans | | | (2,215 | ) | | | – | | | | (2,215 | ) | | | (4,801 | ) |
Unfunded post retirement healthcare obligation | | | – | | | | (1,094 | ) | | | (1,094 | ) | | | (1,250 | ) |
The surplus amounts shown above are included in the statement of financial position as Trade and other receivables. See
note 18.
Deficits are shown in the statement of financial position within Provisions (including post retirement benefits). See note 26.
Funding policy and contributions to plans
The Group reviews the funding position of its major pension plans on a regular basis and considers whether to provide funding above the minimum level required in each country. In Canada and the US the minimum level is prescribed by legislation. In the UK and Switzerland the minimum is negotiated with the local Trustee or Foundation in accordance with the funding guidance issued by the local regulators. In deciding whether to provide funding above the minimum level the Group takes into account other possible uses of cash within the Group, the tax situation of the local sponsoring entity and any strategic advantage that the Group might obtain by accelerating contributions. The Group does not generally pre-fund post-retirement healthcare arrangements.
| | | | | | | | | | | | | | | | | | | | |
| | | Pension
benefits | | | Other
benefits | | | 2013
Total
US$m | | | Restated
2012
Total
US$m | | | Restated
2011
Total
US$m | |
Contributions | | | | | | | | | | | | | | | | | | | | |
Contributions to defined benefit plans | | | 667 | | | | 67 | | | | 734 | | | | 727 | | | | 681 | |
Contributions to defined contribution plans | | | 315 | | | | 2 | | | | 317 | | | | 328 | | | | 272 | |
Contributions to industry-wide plans | | | 20 | | | | – | | | | 20 | | | | 20 | | | | 16 | |
Total | | | 1,002 | | | | 69 | | | | 1,071 | | | | 1,075 | | | | 969 | |
Contributions to defined benefit pension plans for 2014 are estimated to be around US$400 million. This is kept under regular review and actual contributions will be determined in line with the Group’s wider financing strategy. Healthcare plans are generally unfunded and contributions for future years will be equal to benefit payments, which are expected to be similar to the amounts paid in 2013.
| | | | |
| | 187 riotinto.com/reportingcentre2013 | | |
Notes to the 2013 financial statements continued
| 45 | Post retirement benefits continued |
Movements in the net defined benefit liability
A summary of the movement in the net defined benefit liability is shown in the first table below. The subsequent tables provide a more detailed analysis of the movements in the present value of the obligations, the fair value of assets and the effect of the asset ceiling.
The amounts shown below include, where appropriate, 100 per cent of the costs, contributions, gains and losses in respect of employees who participate in the plans and who are employed in associates and joint arrangements. Consequently, the costs, contributions, gains and losses may not correspond directly to the amounts disclosed above in respect of the Group. Defined contribution plans and industry-wide plans are excluded from the movements below.
| | | | | | | | | | | | | | | | |
| | | Pension
benefits | | | Other
benefits | | | 2013 Total US$m | | | Restated 2012 Total US$m | |
Change in the net defined benefit liability: | | | | | | | | | | | | | | | | |
Net defined benefit liability at start of the year | | | (4,801 | ) | | | (1,250 | ) | | | (6,051 | ) | | | (5,890 | ) |
Amounts recognised in Income | | | (420 | ) | | | (48 | ) | | | (468 | ) | | | (475 | ) |
Amounts recognised in Other Comprehensive Income | | | 2,164 | | | | 96 | | | | 2,260 | | | | (332 | ) |
Employer contributions | | | 667 | | | | 67 | | | | 734 | | | | 732 | |
Divestments/newly included arrangements | | | 20 | | | | (1 | ) | | | 19 | | | | 41 | |
Currency exchange rate movements | | | 155 | | | | 42 | | | | 197 | | | | (127 | ) |
Net defined benefit liability at end of the year | | | (2,215 | ) | | | (1,094 | ) | | | (3,309 | ) | | | (6,051 | ) |
| | | | |
| | | | | | | | | | | | | | | | |
| | | Pension
benefits | | | Other
benefits | | | 2013 Total US$m | | | Restated 2012 Total US$m | |
Change in present value of obligation: | | | | | | | | | | | | | | | | |
Present value of obligation at start of the year | | | (19,472 | ) | | | (1,250 | ) | | | (20,722 | ) | | | (19,024 | ) |
Current employer service cost | | | (267 | ) | | | (17 | ) | | | (284 | ) | | | (270 | ) |
Past service cost | | | 1 | | | | – | | | | 1 | | | | (4 | ) |
Curtailments | | | 27 | | | | 17 | | | | 44 | | | | 59 | |
Settlements | | | 131 | | | | – | | | | 131 | | | | 6 | |
Interest on obligations | | | (728 | ) | | | (48 | ) | | | (776 | ) | | | (827 | ) |
Contributions by plan participants | | | (37 | ) | | | (4 | ) | | | (41 | ) | | | (44 | ) |
Benefits paid | | | 1,015 | | | | 71 | | | | 1,086 | | | | 1,085 | |
Experience gain | | | 54 | | | | 36 | | | | 90 | | | | 91 | |
Changes in financial assumptions gain/(loss) | | | 892 | | | | 73 | | | | 965 | | | | (1,233 | ) |
Changes in demographic assumptions gain/(loss) | | | 50 | | | | (13 | ) | | | 37 | | | | (93 | ) |
Arrangements divested | | | 95 | | | | (1 | ) | | | 94 | | | | 70 | |
Inclusion of arrangements | | | – | | | | – | | | | – | | | | (16 | ) |
Currency exchange rate gain/(loss) | | | 541 | | | | 42 | | | | 583 | | | | (522 | ) |
Present value of obligation at end of the year | | | (17,698 | ) | | | (1,094 | ) | | | (18,792 | ) | | | (20,722 | ) |
| | | | |
| | | | | | | | | | | | | | | | |
| | | Pension
benefits | | | Other
benefits | | | 2013
Total
US$m | | | Restated
2012
Total
US$m | |
Change in plan assets: | | | | | | | | | | | | | | | | |
Fair value of plan assets at the start of the year | | | 14,671 | | | | – | | | | 14,671 | | | | 13,134 | |
Settlements | | | (129 | ) | | | – | | | | (129 | ) | | | (6 | ) |
Interest on assets | | | 567 | | | | – | | | | 567 | | | | 587 | |
Contributions by plan participants | | | 37 | | | | 4 | | | | 41 | | | | 44 | |
Contributions by employer | | | 667 | | | | 67 | | | | 734 | | | | 732 | |
Benefits paid | | | (1,015 | ) | | | (71 | ) | | | (1,086 | ) | | | (1,085 | ) |
Non-investment expenses | | | (22 | ) | | | – | | | | (22 | ) | | | (20 | ) |
Return on plan assets (net of interest on assets) | | | 1,212 | | | | – | | | | 1,212 | | | | 903 | |
Arrangements divested | | | (75 | ) | | | – | | | | (75 | ) | | | (13 | ) |
Currency exchange rate (loss)/gain | | | (386 | ) | | | – | | | | (386 | ) | | | 395 | |
Fair value of plan assets at the end of the year | | | 15,527 | | | | – | | | | 15,527 | | | | 14,671 | |
| | | | |
| | 188 riotinto.com/reportingcentre2013 | | |
| | | | | | | | | | | | | | | | |
| | | Pension
benefits | | | Other
benefits | | | 2013
Total
US$m | | | Restated
2012
Total
US$m | |
Change in the effect of the asset ceiling: | | | | | | | | | | | | | | | | |
Effect of the asset ceiling at the start of the year | | | – | | | | – | | | | – | | | | – | |
Movement in the effect of the asset ceiling | | | (44 | ) | | | – | | | | (44 | ) | | | – | |
Effect of the asset ceiling at the end of the year | | | (44 | ) | | | – | | | | (44 | ) | | | – | |
In determining the extent to which the asset ceiling has an effect, the Group considers the funding legislation in each country and the rules specific to each pension plan. Where the plan rules and legislation both permit the employer to take a refund of surplus the asset ceiling may have no effect, although it may be the case that a refund will only be available many years in the future. In situations where no refund would be available the effect of the asset ceiling is calculated taking into account the availability of a reduction in the employer’s future contributions.
Main assumptions (rates per annum)
The main assumptions for the valuations of the plans under IAS 19 are set out below.
| | | | | | | | | | | | | | | | | | | | | | | | | | | | |
| | | | Canada | | | | UK | | | | US | | | | Switzerland | | | | Eurozone | | | | Australia | (a) | |
| Other
(mainly
Africa) |
(b) |
At 31 December 2013 | | | | | | | | | | | | | | | | | | | | | | | | | | | | |
Rate of increase in salaries | | | 3.3% | | | | 5.0% | | | | 3.8% | | | | 2.3% | | | | 2.6% | | | | 4.4% | | | | 9.0% | |
Rate of increase in pensions | | | 0.8% | | | | 3.0% | | | | – | | | | 0.2% | | | | 1.5% | | | | 2.7% | | | | 7.0% | |
Discount rate | | | 4.6% | | | | 4.4% | | | | 4.6% | | | | 2.2% | | | | 3.4% | | | | 4.1% | | | | 9.1% | |
Inflation(c) | | | 2.0% | | | | 3.4% | | | | 2.3% | | | | 1.3% | | | | 1.9% | | | | 2.7% | | | | 7.0% | |
| | | | | | | |
At 31 December 2012 | | | | | | | | | | | | | | | | | | | | | | | | | | | | |
Rate of increase in salaries | | | 3.3% | | | | 4.5% | | | | 3.9% | | | | 2.3% | | | | 2.7% | | | | 3.9% | | | | 8.7% | |
Rate of increase in pensions | | | 0.8% | | | | 2.4% | | | | – | | | | – | | | | 1.5% | | | | 2.2% | | | | 6.7% | |
Discount rate | | | 3.9% | | | | 4.3% | | | | 4.0% | | | | 1.7% | | | | 3.1% | | | | 2.9% | | | | 8.3% | |
Inflation(c) | | | 2.0% | | | | 2.9% | | | | 2.4% | | | | 1.3% | | | | 2.1% | | | | 2.2% | | | | 6.7% | |
| (a) | The discount rate shown for Australia is before tax for 2013 and after tax for 2012. |
| (b) | The assumptions vary by location for the ‘Other’ plans. Assumptions shown are for Southern Africa. |
| (c) | The inflation assumption shown for the UK is for the Retail Price Index. The assumption for the Consumer Price Index at 31 December 2013 was 2.4 per cent (2012: 2.2 per cent). |
The main financial assumptions used for the healthcare plans, which are predominantly in the US and Canada, were: discount rate: 4.6 per cent (2012: 4.0 per cent), medical trend rate: 6.8 per cent reducing to 5.1 per cent by the year 2022 broadly on a straight line basis (2012: 6.7 per cent, reducing to 5.1 per cent by the year 2018), claims costs based on individual company experience.
For both the pension and healthcare arrangements the post retirement mortality assumptions allow for future improvements in longevity. The mortality tables used imply that a man aged 60 at the statement of financial position date has a weighted average expected future lifetime of 25 years (2012: 25 years) and that a man aged 60 in 2033 would have a weighted average expected future lifetime of 27 years (2012: 27 years).
| | | | |
| | 189 riotinto.com/reportingcentre2013 | | |
Notes to the 2013 financial statements continued
| 45 | Post retirement benefits continued |
Sensitivity
The values reported for the defined benefit obligations are sensitive to the actuarial assumptions used for projecting future benefit payments and discounting those payments. In order to estimate the sensitivity of the obligations to changes in assumptions we calculate what the obligations would be if we were to make small changes to each of the key assumptions in isolation. The difference between this figure and the figure calculated using our stated assumptions is an indication of the sensitivity to changes in each assumption. The results of this sensitivity analysis are summarised in the table below. Note that this approach is valid for small changes in the assumptions but will be less accurate for larger changes in the assumptions.
| | | | | | | | | | | | | | | | | | |
| | | | | 2013 | | | 2012 restated | |
| | | | | Approximate (increase)/ decrease in obligations | | | Approximate (increase)/ decrease in obligations | |
| Assumption | | Change in assumption | | Pensions
US$m | | | Other
US$m | | | Pensions
US$m | | | Other
US$m | |
Discount rate | | increase of 0.5 percentage points | | | 1,095 | | | | 62 | | | | 1,283 | | | | 79 | |
| | decrease of 0.5 percentage points | | | (1,169 | ) | | | (66 | ) | | | (1,375 | ) | | | (85 | ) |
| | | | | |
Inflation | | increase of 0.5 percentage points | | | (626 | ) | | | (32 | ) | | | (683 | ) | | | (38 | ) |
| | decrease of 0.5 percentage points | | | 594 | | | | 29 | | | | 652 | | | | 35 | |
| | | | | |
Salary increases | | increase of 0.5 percentage points | | | (100 | ) | | | (3 | ) | | | (140 | ) | | | (4 | ) |
| | decrease of 0.5 percentage points | | | 97 | | | | 2 | | | | 136 | | | | 4 | |
| | | | | |
Demographic – allowance for future improvements in longevity | | participants assumed to have the mortality rates of individuals who are one year older | | | 437 | | | | 16 | | | | 506 | | | | 25 | |
| | participants assumed to have the mortality rates of individuals who are one year younger | | | (437 | ) | | | (16 | ) | | | (506 | ) | | | (25 | ) |
| | | | | |
Medical cost trend rates | | increase of 1.0 percentage points | | | – | | | | (59 | ) | | | – | | | | (74 | ) |
| | | decrease of 1.0 percentage points | | | – | | | | 54 | | | | – | | | | 67 | |
Information on the sensitivity of the Group’s earnings to the main assumptions is set out in the sensitivity section on page 131.
| | | | |
| | 190 riotinto.com/reportingcentre2013 | | |
| 46 | Impact of new accounting standards |
As explained in note 1 Principal Accounting Policies on pages 118 to 119, there have been a number of significant changes to accounting requirements for 2013. The impact of these changes in accounting requirements on the Group’s statement of financial position as at 1 January 2012 together with the impact on the Group’s income statement for the years ended 31 December 2011 and 31 December 2012 are set out below.
Group statement of financial position
| | | | | | | | | | | | | | | | | | | | |
| | | As reported at
1 January 2012
US$m | | | IFRIC 20
restatement
US$m | | | IFRS 11
restatement
US$m | | | IAS 19R
restatement
US$m | | | As restated at
1 January 2012
US$m | |
Non-current assets | | | | | | | | | | | | | | | | | | | | |
Goodwill | | | 8,187 | | | | – | | | | 1,371 | | | | – | | | | 9,558 | |
Intangible assets | | | 7,955 | | | | – | | | | 87 | | | | – | | | | 8,042 | |
Property, plant and equipment | | | 64,967 | | | | (224 | ) | | | 1,638 | | | | – | | | | 66,381 | |
Investments in equity accounted units | | | 9,833 | | | | (176 | ) | | | (2,109 | ) | | | – | | | | 7,548 | |
Inventories | | | 381 | | | | – | | | | – | | | | – | | | | 381 | |
Deferred tax assets | | | 1,875 | | | | 60 | | | | (74 | ) | | | 3 | | | | 1,864 | |
Trade and other receivables | | | 2,365 | | | | – | | | | (323 | ) | | | – | | | | 2,042 | |
Other financial assets (including tax recoverable and loans to equity accounted units) | | | 1,996 | �� | | | – | | | | 16 | | | | – | | | | 2,012 | |
| | | 97,559 | | | | (340 | ) | | | 606 | | | | 3 | | | | 97,828 | |
| | | | | |
Current assets | | | | | | | | | | | | | | | | | | | | |
Inventories | | | 5,307 | | | | (2 | ) | | | 233 | | | | – | | | | 5,538 | |
Trade and other receivables | | | 6,058 | | | | – | | | | 2 | | | | – | | | | 6,060 | |
Other financial assets (including tax recoverable and loans to equity accounted units) | | | 863 | | | | – | | | | 13 | | | | – | | | | 876 | |
Cash and cash equivalents | | | 9,670 | | | | – | | | | 92 | | | | – | | | | 9,762 | |
| | | 21,898 | | | | (2 | ) | | | 340 | | | | – | | | | 22,236 | |
Assets of disposal groups held for sale | | | 88 | | | | – | | | | – | | | | – | | | | 88 | |
Total assets | | | 119,545 | | | | (342 | ) | | | 946 | | | | 3 | | | | 120,152 | |
| | | | | |
Current liabilities | | | | | | | | | | | | | | | | | | | | |
Borrowings and other financial liabilities | | | (1,447 | ) | | | – | | | | 32 | | | | – | | | | (1,415 | ) |
Trade and other payables | | | (9,381 | ) | | | – | | | | (201 | ) | | | – | | | | (9,582 | ) |
Tax payable | | | (2,651 | ) | | | – | | | | (11 | ) | | | – | | | | (2,662 | ) |
Provisions including post retirement benefits | | | (1,487 | ) | | | – | | | | (10 | ) | | | (6 | ) | | | (1,503 | ) |
| | | | (14,966 | ) | | | – | | | | (190 | ) | | | (6 | ) | | | (15,162 | ) |
| | | | | |
Non-current liabilities | | | | | | | | | | | | | | | | | | | | |
Borrowings and other financial liabilities | | | (20,357 | ) | | | – | | | | (172 | ) | | | – | | | | (20,529 | ) |
Trade and other payables | | | (719 | ) | | | – | | | | 11 | | | | – | | | | (708 | ) |
Tax payable | | | (382 | ) | | | – | | | | (22 | ) | | | – | | | | (404 | ) |
Deferred tax liabilities | | | (6,210 | ) | | | 33 | | | | (123 | ) | | | – | | | | (6,300 | ) |
Provisions including post retirement benefits | | | (17,670 | ) | | | – | | | | (450 | ) | | | (12 | ) | | | (18,132 | ) |
| | | (45,338 | ) | | | 33 | | | | (756 | ) | | | (12 | ) | | | (46,073 | ) |
Liabilities of disposal groups held for sale | | | (33 | ) | | | – | | | | – | | | | – | | | | (33 | ) |
Total liabilities | | | (60,337 | ) | | | 33 | | | | (946 | ) | | | (18 | ) | | | (61,268 | ) |
Net assets | | | 59,208 | | | | (309 | ) | | | – | | | | (15 | ) | | | 58,884 | |
Capital and reserves | | | | | | | | | | | | | | | | | | | | |
Share capital | | | | | | | | | | | | | | | | | | | | |
– Rio Tinto plc | | | 234 | | | | – | | | | – | | | | – | | | | 234 | |
– Rio Tinto Limited | | | 5,582 | | | | – | | | | – | | | | – | | | | 5,582 | |
Share premium account | | | 4,208 | | | | – | | | | – | | | | – | | | | 4,208 | |
Other reserves | | | 14,731 | | | | – | | | | – | | | | 14 | | | | 14,745 | |
Retained earnings | | | 27,784 | | | | (325 | ) | | | – | | | | (29 | ) | | | 27,430 | |
Equity attributable to owners of Rio Tinto | | | 52,539 | | | | (325 | ) | | | – | | | | (15 | ) | | | 52,199 | |
Attributable to non-controlling interests | | | 6,669 | | | | 16 | | | | – | | | | – | | | | 6,685 | |
Total equity | | | 59,208 | | | | (309 | ) | | | – | | | | (15 | ) | | | 58,884 | |
| | | | |
| | 191 riotinto.com/reportingcentre2013 | | |
Notes to the 2013 financial statements continued
| 46 | Impact of new accounting standards continued |
Group Income Statement – restatement of full year 2012 and 2011
| | | | | | | | | | | | | | | | | | | | |
| | |
| As reported
Year ended 31 December 2012 US$m |
| |
| IFRIC 20
restatement
US$m | (a)
| |
| IFRS 11
restatement US$m |
| |
| IAS 19R
restatement
US$m | (b)
| |
| As restated
Year ended
31 December
2012
US$m |
|
(Loss)/profit before taxation | | | (2,568 | ) | | | 33 | | | | 176 | | | | (72 | ) | | | (2,431 | ) |
Taxation | | | (429 | ) | | | (6 | ) | | | (179 | ) | | | 25 | | | | (589 | ) |
(Loss)/profit from continuing operations | | | (2,997 | ) | | | 27 | | | | (3 | ) | | | (47 | ) | | | (3,020 | ) |
Loss after tax from discontinued operations | | | (7 | ) | | | – | | | | – | | | | – | | | | (7 | ) |
(Loss)/profit for the year | | | (3,004 | ) | | | 27 | | | | (3 | ) | | | (47 | ) | | | (3,027 | ) |
– attributable to non-controlling interests | | | (14 | ) | | | 16 | | | | – | | | | (1 | ) | | | 1 | |
– attributable to owners of Rio Tinto (Net earnings/(losses)) | | | (2,990 | ) | | | 11 | | | | (3 | ) | | | (46 | ) | | | (3,028 | ) |
| | | | | |
| | |
| As reported
Year ended 31 December 2011 US$m |
| |
| IFRIC 20
restatement
US$m | (a)
| |
| IFRS 11
restatement
US$m |
| |
| IAS 19R
restatement
US$m | (b)
| |
| As restated
Year ended
31 December
2011
US$m |
|
Profit/(loss) before taxation | | | 13,214 | | | | 187 | | | | 15 | | | | (144 | ) | | | 13,272 | |
Taxation | | | (6,439 | ) | | | (63 | ) | | | (15 | ) | | | 45 | | | | (6,472 | ) |
Profit/(loss) from continuing operations | | | 6,775 | | | | 124 | | | | – | | | | (99 | ) | | | 6,800 | |
Loss after tax from discontinued operations | | | (10 | ) | | | – | | | | – | | | | – | | | | (10 | ) |
Profit/(loss) for the year | | | 6,765 | | | | 124 | | | | – | | | | (99 | ) | | | 6,790 | |
– attributable to non-controlling interests | | | 939 | | | | 17 | | | | – | | | | (1 | ) | | | 955 | |
– attributable to owners of Rio Tinto (Net earnings) | | | 5,826 | | | | 107 | | | | – | | | | (98 | ) | | | 5,835 | |
| (a) | The IFRIC 20 restatement impact to net earnings reflects additional capitalisation partly offset by additional depreciation. |
| (b) | There was a post tax credit within Other comprehensive income of US$61 million in the year ended 31 December 2012 (31 December 2011: US$77 million) for actuarial gains and losses offsetting the reduced return on assets. The net impact to Rio Tinto equity of US$15 million in the year ended 31 December 2012 (31 December 2011: US$21 million loss) relates to changes in timing of recognition of past service cost under IAS 19R. |
Interim information
In the interim Financial Statements for the six months ended 30 June 2013, a balance of US$1,080 million was included in Trade and other receivables which should have been offset against an amount of US$1,080 million included in Trade and other payables to comply with the Group’s accounting policies. Comparative figures for the six months ended 30 June 2014 will be revised accordingly.
| | | | |
| | 192 riotinto.com/reportingcentre2013 | | |
Rio Tinto financial information by business unit
| | | | | | | | | | | | | | | | | | | | | | | | | | | | | | | | | | | | | | | | |
| | | | | | Revenue(a) | | | EBITDA(b) | | | Net earnings(c) | |
| | | | | | for the year ended 31 December | | | for the year ended 31 December | | | for the year ended 31 December | |
| | |
| Rio Tinto
interest % |
| |
| 2013
US$m |
| |
| Restated
2012 US$m | (q)
| |
| Restated
2011 US$m | (q)
| |
| 2013
US$m |
| |
| Restated
2012 US$m | (q)
| |
| Restated
2011 US$m | (q)
| |
| 2013
US$m |
| |
| Restated
2012 US$m | (q)
| |
| Restated
2011 US$m | (q)
|
Iron Ore | | | | | | | | | | | | | | | | | | | | | | | | | | | | | | | | | | | | | | | | |
Hamersley | | | 100.0 | | | | 19,142 | | | | 17,832 | | | | 21,626 | | | | 13,131 | | | | 11,993 | | | | 15,942 | | | | 7,968 | | | | 7,593 | | | | 10,622 | |
Robe River(d) | | | 53.0 | | | | 4,491 | | | | 4,353 | | | | 5,229 | | | | 3,380 | | | | 3,150 | | | | 4,084 | | | | 1,600 | | | | 1,549 | | | | 2,172 | |
Iron Ore Company of Canada | | | 58.7 | | | | 2,258 | | | | 1,972 | | | | 2,471 | | | | 927 | | | | 665 | | | | 1,329 | | | | 305 | | | | 230 | | | | 491 | |
Product group operations | | | | | | | 25,891 | | | | 24,157 | | | | 29,326 | | | | 17,438 | | | | 15,808 | | | | 21,355 | | | | 9,873 | | | | 9,372 | | | | 13,285 | |
Evaluation projects/other | | | | | | | 103 | | | | 122 | | | | 149 | | | | 4 | | | | (129 | ) | | | (22 | ) | | | (15 | ) | | | (125 | ) | | | (17 | ) |
| | | | | | | | 25,994 | | | | 24,279 | | | | 29,475 | | | | 17,442 | | | | 15,679 | | | | 21,333 | | | | 9,858 | | | | 9,247 | | | | 13,268 | |
Aluminium | | | (e) | | | | | | | | | | | | | | | | | | | | | | | | | | | | | | | | | | | | | |
Bauxite & Alumina | | | | | | | 3,363 | | | | 3,297 | | | | 3,072 | | | | 448 | | | | 361 | | | | 548 | | | | 41 | | | | (57 | ) | | | 107 | |
Primary Metal – North America | | | | | | | 3,921 | | | | 3,665 | | | | 4,701 | | | | 788 | | | | 593 | | | | 1,096 | | | | 161 | | | | 43 | | | | 415 | |
Primary Metal – EMEA | | | | | | | 1,667 | | | | 1,787 | | | | 2,081 | | | | 162 | | | | 210 | | | | 269 | | | | 62 | | | | 53 | | | | 52 | |
Primary Metal – Pacific | | | | | | | 2,348 | | | | 2,447 | | | | 2,903 | | | | 252 | | | | 66 | | | | 328 | | | | 126 | | | | (92 | ) | | | 41 | |
Other Integrated Operations | | | | | | | 869 | | | | 878 | | | | 841 | | | | 54 | | | | (38 | ) | | | (92 | ) | | | 5 | | | | (40 | ) | | | (122 | ) |
Intersegment | | | | | | | (2,773 | ) | | | (2,713 | ) | | | (3,256 | ) | | | (20 | ) | | | (12 | ) | | | (28 | ) | | | (13 | ) | | | (9 | ) | | | (20 | ) |
Integrated Operations | | | | | | | 9,395 | | | | 9,361 | | | | 10,342 | | | | 1,684 | | | | 1,180 | | | | 2,121 | | | | 382 | | | | (102 | ) | | | 473 | |
Other Product Group Items | | | | | | | 2,866 | | | | 2,650 | | | | 3,923 | | | | 123 | | | | 124 | | | | 127 | | | | 99 | | | | 92 | | | | 95 | |
Product group operations | | | | | | | 12,261 | | | | 12,011 | | | | 14,265 | | | | 1,807 | | | | 1,304 | | | | 2,248 | | | | 481 | | | | (10 | ) | | | 568 | |
Evaluation projects/other | | | | | | | 202 | | | | 159 | | | | 157 | | | | 87 | | | | 66 | | | | 39 | | | | 76 | | | | 64 | | | | 42 | |
| | | | | | | | 12,463 | | | | 12,170 | | | | 14,422 | | | | 1,894 | | | | 1,370 | | | | 2,287 | | | | 557 | | | | 54 | | | | 610 | |
Copper | | | | | | | | | | | | | | | | | | | | | | | | | | | | | | | | | | | | | | | | |
Kennecott Utah Copper | | | 100.0 | | | | 2,194 | | | | 2,412 | | | | 3,470 | | | | 840 | | | | 977 | | | | 2,026 | | | | 428 | | | | 511 | | | | 1,266 | |
Escondida | | | 30.0 | | | | 2,566 | | | | 2,566 | | | | 2,167 | | | | 1,453 | | | | 1,597 | | | | 1,287 | | | | 777 | | | | 835 | | | | 698 | |
Grasberg joint venture | | | (f) | | | | 39 | | | | 17 | | | | 406 | | | | 2 | | | | 2 | | | | 262 | | | | (21 | ) | | | (17 | ) | | | 129 | |
Oyu Tolgoi | | | (g) | | | | 55 | | | | – | | | | – | | | | (225 | ) | | | – | | | | – | | | | (90 | ) | | | – | | | | – | |
Palabora | | | (h) | | | | 526 | | | | 1,072 | | | | 1,110 | | | | 105 | | | | 64 | | | | 346 | | | | 42 | | | | 3 | | | | 100 | |
Northparkes | | | (h) | | | | 351 | | | | 453 | | | | 402 | | | | 227 | | | | 247 | | | | 212 | | | | 141 | | | | 144 | | | | 127 | |
Product group operations | | | | | | | 5,731 | | | | 6,520 | | | | 7,555 | | | | 2,402 | | | | 2,887 | | | | 4,133 | | | | 1,277 | | | | 1,476 | | | | 2,320 | |
Evaluation projects/other | | | | | | | 185 | | | | 141 | | | | 79 | | | | (652 | ) | | | (1,040 | ) | | | (573 | ) | | | (456 | ) | | | (417 | ) | | | (307 | ) |
| | | | | | | | 5,916 | | | | 6,661 | | | | 7,634 | | | | 1,750 | | | | 1,847 | | | | 3,560 | | | | 821 | | | | 1,059 | | | | 2,013 | |
Energy | | | | | | | | | | | | | | | | | | | | | | | | | | | | | | | | | | | | | | | | |
Rio Tinto Coal Australia | | | (i) | | | | 4,413 | | | | 4,998 | | | | 5,872 | | | | 1,041 | | | | 1,030 | | | | 2,318 | | | | 367 | | | | 402 | | | | 1,240 | |
Rio Tinto Coal Mozambique | | | (j) | | | | 88 | | | | 10 | | | | – | | | | (114 | ) | | | (64 | ) | | | (8 | ) | | | (142 | ) | | | (92 | ) | | | (7 | ) |
Rössing | | | 68.6 | | | | 309 | | | | 352 | | | | 450 | | | | 44 | | | | 3 | | | | 7 | | | | 4 | | | | (21 | ) | | | (8 | ) |
Energy Resources of Australia | | | 68.4 | | | | 339 | | | | 416 | | | | 675 | | | | 67 | | | | 65 | | | | 77 | | | | (95 | ) | | | (131 | ) | | | (53 | ) |
Product group operations | | | | | | | 5,149 | | | | 5,776 | | | | 6,997 | | | | 1,038 | | | | 1,034 | | | | 2,394 | | | | 134 | | | | 158 | | | | 1,172 | |
Evaluation projects/other | | | | | | | 305 | | | | 286 | | | | 48 | | | | (132 | ) | | | 218 | | | | (72 | ) | | | (101 | ) | | | 151 | | | | (58 | ) |
| | | | | | | | 5,454 | | | | 6,062 | | | | 7,045 | | | | 906 | | | | 1,252 | | | | 2,322 | | | | 33 | | | | 309 | | | | 1,114 | |
Diamonds & Minerals | | | | | | | | | | | | | | | | | | | | | | | | | | | | | | | | | | | | | | | | |
Diamonds | | | (k) | | | | 852 | | | | 741 | | | | 727 | | | | 257 | | | | 106 | | | | 180 | | | | 53 | | | | (25 | ) | | | 13 | |
RTIT | | | (l) | | | | 2,251 | | | | 2,232 | | | | 1,580 | | | | 728 | | | | 793 | | | | 345 | | | | 264 | | | | 409 | | | | 151 | |
Rio Tinto Minerals | | | | | | | 657 | | | | 656 | | | | 901 | | | | 205 | | | | 215 | | | | 239 | | | | 131 | | | | 140 | | | | 144 | |
Dampier Salt | | | 68.4 | | | | 404 | | | | 416 | | | | 434 | | | | 43 | | | | 23 | | | | 23 | | | | 7 | | | | (4 | ) | | | (1 | ) |
Product group operations | | | | | | | 4,164 | | | | 4,045 | | | | 3,642 | | | | 1,233 | | | | 1,137 | | | | 787 | | | | 455 | | | | 520 | | | | 307 | |
Simandou iron ore project | | | | | | | – | | | | – | | | | – | | | | (71 | ) | | | (328 | ) | | | (426 | ) | | | (43 | ) | | | (262 | ) | | | (413 | ) |
Evaluation projects/other | | | | | | | 29 | | | | 11 | | | | 12 | | | | (77 | ) | | | (129 | ) | | | (61 | ) | | | (62 | ) | | | (109 | ) | | | (53 | ) |
| | | | | | | | 4,193 | | | | 4,056 | | | | 3,654 | | | | 1,085 | | | | 680 | | | | 300 | | | | 350 | | | | 149 | | | | (159 | ) |
Refer to notes (a) to (q) on page 200.
| | | | |
| | 197 riotinto.com/reportingcentre2013 | | |
Rio Tinto financial information by business unit continued
| | | | | | | | | | | | | | | | | | | | | | | | | | | | | | | | | | | | | | | | |
| | | | | | Revenue(a) | | | EBITDA(b) | | | Net earnings(c) | |
| | | | | | for the year ended 31 December | | | for the year ended 31 December | | | for the year ended 31 December | |
| | |
| Rio Tinto
interest % |
| |
| 2013
US$m |
| |
| Restated
2012 US$m | (q)
| |
| Restated
2011 US$m | (q)
| |
| 2013
US$m |
| |
| Restated
2012 US$m | (q)
| |
| Restated
2011 US$m | (q)
| |
| 2013
US$m |
| |
| Restated
2012 US$m | (q)
| |
| Restated
2011 US$m | (q)
|
Other Operations | | | (m) | | | | 1,761 | | | | 3,898 | | | | 5,149 | | | | (401 | ) | | | (527 | ) | | | (113 | ) | | | (281 | ) | | | (582 | ) | | | (288 | ) |
Intersegment transactions | | | | | | | (1,182 | ) | | | (1,560 | ) | | | (2,025 | ) | | | (4 | ) | | | (10 | ) | | | 58 | | | | (4 | ) | | | (8 | ) | | | 40 | |
Product Group Total | | | | | | | 54,599 | | | | 55,566 | | | | 65,354 | | | | 22,672 | | | | 20,291 | | | | 29,747 | | | | 11,334 | | | | 10,228 | | | | 16,598 | |
Other items | | | | | | | | | | | | | | | | | | | (995 | ) | | | (928 | ) | | | (980 | ) | | | (730 | ) | | | (750 | ) | | | (684 | ) |
Exploration and evaluation | | | | | | | | | | | | | | | | | | | (168 | ) | | | (118 | ) | | | (127 | ) | | | (145 | ) | | | (97 | ) | | | (102 | ) |
Net interest | | | | | | | | | | | | | | | | | | | | | | | | | | | | | | | (242 | ) | | | (112 | ) | | | (240 | ) |
Underlying earnings | | | | | | | | | | | | | | | | | | | 21,509 | | | | 19,245 | | | | 28,640 | | | | 10,217 | | | | 9,269 | | | | 15,572 | |
Items excluded from underlying earnings | | | | | | | (24 | ) | | | 31 | | | | (56 | ) | | | (556 | ) | | | 350 | | | | 285 | | | | (6,552 | ) | | | (12,297 | ) | | | (9,737 | ) |
EBITDA/net earnings | | | | | | | | | | | | | | | | | | | 20,953 | | | | 19,595 | | | | 28,925 | | | | 3,665 | | | | (3,028 | ) | | | 5,835 | |
| | | | | | | | | | |
Share of equity accounted unit sales and intra-subsidiary/equity accounted units sales | | | | | | | (3,404 | ) | | | (4,655 | ) | | | (4,769 | ) | | | | | | | | | | | | | | | | | | | | | | | | |
Depreciation & amortisation in subsidiaries excluding capitalised depreciation | | | | | | | | | | | | | | | | | | | (4,470 | ) | | | (4,563 | ) | | | (3,972 | ) | | | | | | | | | | | | |
Impairment charges | | | | | | | | | | | | | | | | | | | (7,545 | ) | | | (16,918 | ) | | | (10,115 | ) | | | | | | | | | | | | |
Depreciation & amortisation in equity accounted units | | | | | | | | | | | | | | | | | | | (401 | ) | | | (460 | ) | | | (403 | ) | | | | | | | | | | | | |
Taxation and finance items in equity accounted units | | | | | | | | | | | | | | | | | | | (625 | ) | | | (49 | ) | | | (294 | ) | | | | | | | | | | | | |
Consolidated sales revenue/Profit/(Loss) on ordinary activities before finance items and tax | | | | | | | 51,171 | | | | 50,942 | | | | 60,529 | | | | 7,912 | | | | (2,395 | ) | | | 14,141 | | | | | | | | | | | | | |
Refer to notes (a) to (q) on page 200.
| | | | |
| | 198 riotinto.com/reportingcentre2013 | | |
| | | | | | | | | | | | | | | | | | | | | | | | | | | | | | | | | | | | | | | | | | | | | | | | | | | | |
| | | | | | Capital expenditure(n) | | | Depreciation & amortisation | | | Operating assets(o) | | | Employees | |
| | | | | | for the year to 31 December | | | for the year to 31 December | | | as at 31 December | | | as at 31 December | |
| | |
| Rio Tinto
interest % |
| |
| 2013
US$m |
| |
| Restated
2012 US$m | (q)
| |
| Restated
2011 US$m | (q)
| |
| 2013
US$m |
| |
| Restated
2012 US$m | (q)
| |
| Restated
2011 US$m | (q)
| |
| 2013
US$m |
| |
| Restated
2012 US$m | (q)
| |
| Restated
2011 US$m | (q)
| |
| 2013
Number |
| |
| Restated
2012 Number | (q)
| |
| Restated
2011 Number | (q)
|
Iron Ore | | | | | | | | | | | | | | | | | | | | | | | | | | | | | | | | | | | | | | | | | | | | | | | | | | | | |
Hamersley | | | 100.0 | | | | 4,296 | | | | 4,831 | | | | 2,328 | | | | 1,097 | | | | 1,048 | | | | 809 | | | | 14,256 | | | | 14,636 | | | | 8,408 | | | | 10,221 | | | | 9,129 | | | | 8,010 | |
Robe River(d) | | | 53.0 | | | | 2,184 | | | | 1,579 | | | | 1,023 | | | | 364 | | | | 308 | | | | 249 | | | | 5,242 | | | | 4,731 | | | | 2,935 | | | | 1,922 | | | | 1,784 | | | | 1,557 | |
Iron Ore Company of Canada | | | 58.7 | | | | 334 | | | | 742 | | | | 653 | | | | 166 | | | | 129 | | | | 110 | | | | 1,553 | | | | 1,674 | | | | 1,177 | | | | 2,620 | | | | 2,591 | | | | 2,361 | |
Other | | | | | | | – | | | | – | | | | – | | | | – | | | | – | | | | – | | | | 11 | | | | 16 | | | | (3 | ) | | | 18 | | | | 18 | | | | 19 | |
| | | | | | | | 6,814 | | | | 7,152 | | | | 4,004 | | | | 1,627 | | | | 1,485 | | | | 1,168 | | | | 21,062 | | | | 21,057 | | | | 12,517 | | | | 14,781 | | | | 13,522 | | | | 11,947 | |
Aluminium | | | (e) | | | | | | | | | | | | | | | | | | | | | | | | | | | | | | | | | | | | | | | | | | | | | | | | | |
Bauxite & Alumina | | | | | | | 310 | | | | 559 | | | | 670 | | | | 362 | | | | 367 | | | | 357 | | | | 5,063 | | | | 5,975 | | | | 9,720 | | | | 4,688 | | | | 4,691 | | | | 4,779 | |
Primary Metal – North America | | | | | | | 1,565 | | | | 1,706 | | | | 837 | | | | 539 | | | | 517 | | | | 506 | | | | 10,084 | | | | 10,524 | | | | 13,015 | | | | 6,179 | | | | 6,197 | | | | 6,728 | |
Primary Metal – EMEA | | | | | | | 163 | | | | 304 | | | | 310 | | | | 68 | | | | 140 | | | | 165 | | | | 1,818 | | | | 1,644 | | | | 2,119 | | | | 2,174 | | | | 2,345 | | | | 2,343 | |
Primary Metal – Pacific | | | | | | | 134 | | | | 196 | | | | 330 | | | | 109 | | | | 183 | | | | 284 | | | | 405 | | | | 690 | | | | 1,761 | | | | 2,377 | | | | 2,444 | | | | 2,613 | |
Other Integrated Operations | | | | | | | 54 | | | | (10 | ) | | | 145 | | | | 73 | | | | 80 | | | | 76 | | | | 1,444 | | | | 1,628 | | | | 1,526 | | | | 2,379 | | | | 2,937 | | | | 3,132 | |
Integrated Operations | | | | | | | 2,226 | | | | 2,755 | | | | 2,292 | | | | 1,151 | | | | 1,287 | | | | 1,388 | | | | 18,814 | | | | 20,461 | | | | 28,141 | | | | 17,797 | | | | 18,614 | | | | 19,595 | |
Copper | | | | | | | | | | | | | | | | | | | | | | | | | | | | | | | | | | | | | | | | | | | | | | | | | | | | |
Kennecott Utah Copper | | | 100.0 | | | | 783 | | | | 896 | | | | 618 | | | | 296 | | | | 300 | | | | 241 | | | | 2,634 | | | | 2,490 | | | | 1,894 | | | | 2,093 | | | | 2,438 | | | | 2,291 | |
Escondida | | | 30.0 | | | | 947 | | | | 765 | | | | 565 | | | | 216 | | | | 249 | | | | 156 | | | | 2,524 | | | | 1,913 | | | | 1,412 | | | | 1,248 | | | | 1,151 | | | | 1,077 | |
Grasberg joint venture | | | (f) | | | | 176 | | | | 136 | | | | 161 | | | | 38 | | | | 31 | | | | 37 | | | | 761 | | | | 618 | | | | 535 | | | | 2,441 | | | | 2,463 | | | | 2,312 | |
Oyu Tolgoi | | | (g) | | | | 749 | | | | 2,271 | | | | 2,225 | | | | 272 | | | | 67 | | | | 3 | | | | 8,387 | | | | 8,025 | | | | 5,049 | | | | 2,831 | | | | 2,431 | | | | 1,131 | |
Palabora | | | (h) | | | | 18 | | | | 45 | | | | 64 | | | | – | | | | 71 | | | | 86 | | | | – | | | | – | | | | 3 | | | | 1,145 | | | | 2,290 | | | | 2,292 | |
Northparkes | | | (h) | | | | 18 | | | | 61 | | | | 56 | | | | 25 | | | | 44 | | | | 32 | | | | – | | | | 405 | | | | 406 | | | | 269 | | | | 373 | | | | 257 | |
Other | | | | | | | 122 | | | | 281 | | | | 236 | | | | 115 | | | | 32 | | | | 18 | | | | (2,236 | ) | | | (1,130 | ) | | | 2,467 | | | | 1,146 | | | | 1,230 | | | | 852 | |
| | | | | | | | 2,813 | | | | 4,455 | | | | 3,925 | | | | 962 | | | | 794 | | | | 573 | | | | 12,070 | | | | 12,321 | | | | 11,766 | | | | 11,173 | | | | 12,376 | | | | 10,212 | |
Energy | | | | | | | | | | | | | | | | | | | | | | | | | | | | | | | | | | | | | | | | | | | | | | | | | | | | |
Rio Tinto Coal Australia | | | (i) | | | | 547 | | | | 1,527 | | | | 1,016 | | | | 486 | | | | 432 | | | | 349 | | | | 3,945 | | | | 5,628 | | | | 3,941 | | | | 3,826 | | | | 3,954 | | | | 3,874 | |
Rio Tinto Coal Mozambique | | | (j) | | | | 32 | | | | 109 | | | | 172 | | | | 28 | | | | 29 | | | | – | | | | 119 | | | | 556 | | | | 3,363 | | | | 263 | | | | 312 | | | | 137 | |
Rössing | | | 68.6 | | | | 47 | | | | 75 | | | | 127 | | | | 23 | | | | 30 | | | | 28 | | | | 99 | | | | 141 | | | | 186 | | | | 1,141 | | | | 1,528 | | | | 1,637 | |
Energy Resources of Australia | | | 68.4 | | | | 106 | | | | 166 | | | | 100 | | | | 229 | | | | 279 | | | | 143 | | | | 120 | | | | 129 | | | | 137 | | | | 513 | | | | 624 | | | | 547 | |
Other | | | | | | | – | | | | – | | | | – | | | | – | | | | – | | | | – | | | | 589 | | | | 715 | | | | 537 | | | | 27 | | | | 19 | | | | 14 | |
| | | | | | | | 732 | | | | 1,877 | | | | 1,415 | | | | 766 | | | | 770 | | | | 520 | | | | 4,872 | | | | 7,169 | | | | 8,164 | | | | 5,770 | | | | 6,437 | | | | 6,209 | |
Diamonds & Minerals | | | | | | | | | | | | | | | | | | | | | | | | | | | | | | | | | | | | | | | | | | | | | | | | | | | | |
Diamonds | | | (k) | | | | 319 | | | | 680 | | | | 445 | | | | 168 | | | | 144 | | | | 142 | | | | 1,279 | | | | 1,307 | | | | 1,153 | | | | 1,255 | | | | 1,622 | | | | 1,218 | |
RTIT | | | (l) | | | | 274 | | | | 274 | | | | 144 | | | | 264 | | | | 205 | | | | 155 | | | | 4,859 | | | | 5,300 | | | | 2,930 | | | | 4,955 | | | | 4,426 | | | | 3,804 | |
Rio Tinto Minerals | | | | | | | 115 | | | | 97 | | | | 50 | | | | 36 | | | | 31 | | | | 36 | | | | 669 | | | | 593 | | | | 465 | | | | 1,110 | | | | 1,246 | | | | 1,796 | |
Dampier Salt | | | 68.4 | | | | 28 | | | | 46 | | | | 53 | | | | 29 | | | | 30 | | | | 25 | | | | 228 | | | | 291 | | | | 249 | | | | 512 | | | | 497 | | | | 510 | |
Simandou iron ore project | | | | | | | 273 | | | | 717 | | | | 700 | | | | 14 | | | | 10 | | | | 9 | | | | 808 | | | | 567 | | | | 588 | | | | 1,011 | | | | 977 | | | | 1,172 | |
Other | | | | | | | – | | | | – | | | | – | | | | 2 | | | | 1 | | | | – | | | | 57 | | | | 3 | | | | 5 | | | | 92 | | | | 88 | | | | 73 | |
| | | | | | | | 1,009 | | | | 1,814 | | | | 1,392 | | | | 513 | | | | 421 | | | | 367 | | | | 7,900 | | | | 8,061 | | | | 5,390 | | | | 8,935 | | | | 8,856 | | | | 8,573 | |
Other Operations | | | (m) | | | | 278 | | | | 432 | | | | 394 | | | | 67 | | | | 214 | | | | 245 | | | | 544 | | | | 979 | | | | 1,926 | | | | 3,891 | | | | 7,359 | | | | 7,210 | |
Product Group Total | | | | | | | 13,872 | | | | 18,485 | | | | 13,422 | | | | 5,086 | | | | 4,971 | | | | 4,261 | | | | 65,262 | | | | 70,048 | | | | 67,904 | | | | 62,347 | | | | 67,164 | | | | 63,746 | |
Intersegment transactions | | | | | | | | | | | | | | | | | | | | | | | | | | | | | | | 276 | | | | 213 | | | | 79 | | | | | | | | | | | | | |
Net assets of disposal groups held for sale | | | (p) | | | | – | | | | – | | | | – | | | | – | | | | – | | | | – | | | | 771 | | | | 351 | | | | 55 | | | | – | | | | – | | | | – | |
Other items | | | | | | | 145 | | | | 161 | | | | 260 | | | | 106 | | | | 113 | | | | 114 | | | | (2,352 | ) | | | (4,836 | ) | | | (4,515 | ) | | | 3,984 | | | | 4,055 | | | | 4,184 | |
Less: equity accounted units | | | | | | | (1,073 | ) | | | (1,071 | ) | | | (1,146 | ) | | | (401 | ) | | | (460 | ) | | | (403 | ) | | | | | | | | | | | | | | | | | | | | | | | | |
Total | | | | | | | 12,944 | | | | 17,575 | | | | 12,536 | | | | 4,791 | | | | 4,624 | | | | 3,972 | | | | 63,957 | | | | 65,776 | | | | 63,523 | | | | 66,331 | | | | 71,219 | | | | 67,930 | |
Add back: Proceeds from sale of fixed assets | | | | | | | 57 | | | | 40 | | | | 37 | | | | | | | | | | | | | | | | | | | | | | | | | | | | | | | | | | | | | |
Total capital expenditure (excluding proceeds) | | | | | | | 13,001 | | | | 17,615 | | | | 12,573 | | | | | | | | | | | | | | | | | | | | | | | | | | | | | | | | | | | | | |
Less: Net debt | | | | | | | | | | | | | | | | | | | | | | | | | | | | | | | (18,055 | ) | | | (19,192 | ) | | | (8,342 | ) | | | | | | | | | | | | |
Less: EAU funded balances excluded from net debt | | | | | | | | | | | | | | | | | | | | | | | | | | | | | | | (16 | ) | | | (31 | ) | | | (2,982 | ) | | | | | | | | | | | | |
Equity attributable to owners of Rio Tinto | | | | | | | | | | | | | | | | | | | | | | | | | | | | | | | 45,886 | | | | 46,553 | | | | 52,199 | | | | | | | | | | | | | |
Refer to notes (a) to (q) on page 200.
| | | | |
| | 199 riotinto.com/reportingcentre2013 | | |
Rio Tinto financial information by business unit continued
Business units have been classified according to the Group’s management structure.
| (a) | Includes 100 per cent of subsidiaries’ sales revenue and the Group’s share of the sales revenue of equity accounted units (after adjusting for sales to subsidiaries). |
| (b) | EBITDA of subsidiaries and the Group’s share of EBITDA relating to equity accounted units represents profit before: tax, net finance items, depreciation and amortisation charged to the income statement in the year. Underlying EBITDA excludes the same items that are excluded from Underlying earnings. |
| (c) | Represents profit after tax attributable to the owners of Rio Tinto. Business unit earnings are stated before finance items but after the amortisation of discount related to provisions. Earnings attributed to business units do not include amounts that are excluded in arriving at Underlying earnings. |
| (d) | The Group holds 65 per cent of Robe River Iron Associates, of which 30 per cent is held through a 60 per cent owned subsidiary. The Group’s net beneficial interest is, therefore, 53 per cent. |
| (e) | Reflects the results of the integrated production of aluminium, splitting activities between Bauxite and Alumina, Primary Metal (by region) and Other integrated operations. Following reintegration into Rio Tinto Alcan in 2013, the four aluminium smelters and the Gove bauxite mine, previously grouped within Pacific Aluminium in Other Operations, are now included within the Aluminium product group. The Gove alumina refinery continues to be reported within Other Operations. Other integrated operations relate to internal sales of technology, smelter equipment and engineering services as well as sales of carbon products. Other product group items relate to alumina and aluminium trading in excess of production, and external sales of technology, smelter equipment and engineering services. |
| (f) | Under the terms of a joint venture agreement, Rio Tinto is entitled to 40 per cent of additional material mined as a consequence of expansions and developments of the Grasberg facilities since 1998. |
| (g) | Rio Tinto’s interest in Oyu Tolgoi LLC is held indirectly through its 50.8 per cent investment in Turquoise Hill Resources Ltd which in turn owns 66 per cent of Oyu Tolgoi. |
| (h) | Rio Tinto completed the divestments of its 57.7 per cent interest in Palabora on 31 July 2013 and of its 80 per cent interest in Northparkes on 1 December 2013. |
| (i) | Includes Rio Tinto’s 80 per cent interest in Coal & Allied through which Rio Tinto holds its beneficial interests in Bengalla, Mount Thorley and Warkworth of 32 per cent, 64 per cent and 44.5 per cent respectively. |
| (j) | Principal interests are the Benga mine, a 65:35 joint venture with Tata Steel Limited, which is equity accounted, and the wholly owned Zambeze coal project. |
| (k) | Includes Rio Tinto’s interests in Argyle (100 per cent), Diavik (60 per cent) and Murowa (77.8 per cent). |
| (l) | Includes Rio Tinto’s interests in Rio Tinto Fer et Titane (RTFT) (100 per cent), QMM (80 per cent) and Richards Bay Minerals (RBM, attributable interest of 74 per cent). |
| (m) | Other Operations include Rio Tinto’s 100 per cent interest in the Gove alumina refinery (refer to note e) and Rio Tinto Marine. During 2013, Rio Tinto completed the sale of its interests in Constellium and the Sebree aluminium smelter. |
| (n) | Comprises the net cash outflow on purchases less disposals of property, plant and equipment, capitalised evaluation costs and purchases less disposals of other intangible assets. Includes 100 per cent of subsidiaries’ capital expenditure and Rio Tinto’s share of the capital expenditure of equity accounted units. |
| (o) | Comprises net assets excluding post retirement assets and liabilities, net of tax, before deducting net debt. Operating assets are stated after deduction of non-controlling interests, which are calculated by reference to the net assets of the relevant companies (i.e. inclusive of such companies’ debt and amounts due to or from Rio Tinto Group companies). |
| (p) | Comprising Rio Tinto’s interests in the Clermont and Blair Athol thermal coal mines and the Zululand Anthracite Colliery (ZAC). Net assets held for sale at 31 December 2012 comprised Palabora and ZAC. Amounts are presented after deducting non-controlling interests, including the non-controlling interests’ share of third party net debt and balances owed with Rio Tinto Group subsidiaries. |
| (q) | Comparative information for the years ended 31 December 2012 and 2011 has been restated to reflect a number of new accounting policies. Please see note 46 on page 191. |
| | | | |
| | 200 riotinto.com/reportingcentre2013 | | |
Australian Corporations Act – summary of ASIC relief
Pursuant to section 340 of the Corporations Act 2001 (Corporations Act), the Australian Securities and Investments Commission issued an order dated 22 December 2010 (as amended on 17 February 2012) that granted relief to Rio Tinto Limited from certain requirements of the Corporations Act in relation to the Company’s financial statements and associated reports. The order essentially continues the relief that has applied to Rio Tinto Limited since the formation of the Group’s Dual Listed Companies (DLC) structure in 1995. The order applies to Rio Tinto Limited’s financial reporting obligations for financial years and half-years ending between 31 December 2010 and 30 June 2014 (inclusive).
In essence, instead of being required under the Corporations Act to prepare consolidated financial statements covering only itself and its controlled entities, the order allows Rio Tinto Limited to prepare consolidated financial statements in which it, Rio Tinto plc and their respective controlled entities are treated as a single economic entity. In addition, those consolidated financial statements are to be prepared:
| – | in accordance with the principles and requirements of International Financial Reporting Standards as issued by the International Accounting Standards Board (IFRS) and conforming to IFRS as adopted by the European Union (EU IFRS) rather than the Australian Accounting Standards (AAS) (except for one limited instance in the case of any concise report), and in accordance with United Kingdom financial reporting obligations generally; |
| – | on the basis that the transitional provisions of International Financial Reporting Standard 1 First-time Adoption of International Financial Reporting Standards should be applied using the combined financial statements previously prepared for Rio Tinto Limited, Rio Tinto plc and their respective controlled entities under Generally Accepted Accounting Principles in the United Kingdom, under which the DLC merger between Rio Tinto Limited and Rio Tinto plc was accounted for using ‘merger’, rather than ‘acquisition’, accounting (reflecting that neither Rio Tinto Limited nor Rio Tinto plc was acquired by, or is controlled by, the other, and meaning that the existing carrying amounts, rather than fair values, of assets and liabilities at the time of the DLC merger were used to measure those assets and liabilities at formation); |
| – | on the basis that Rio Tinto Limited and Rio Tinto plc are a single company (with their respective shareholders being the shareholders in that single company); and |
| – | with a reconciliation, from EU IFRS to AAS, of the following amounts: consolidated profit for the financial year, total consolidated income for the financial year and total consolidated equity at the end of the financial year (see page 117). |
Those consolidated financial statements must also be audited in accordance with relevant Australian and United Kingdom requirements. Rio Tinto Limited must also prepare a Directors’ report which satisfies the content requirements of the Corporations Act (applied on the basis that for these purposes the consolidated entity is the Group, and the consolidated financial statements cover the Group). This includes a Remuneration Report (see pages 68 to 108) prepared in accordance with requirements of the Corporations Act.
Rio Tinto Limited is also required to comply generally with the lodgement and distribution requirements of the Corporations Act (including timing requirements) in relation to those consolidated financial statements (including any concise financial statements), the Auditor’s report and the Directors’ report. The Corporations Act also requires that a non-binding resolution to adopt the Remuneration Report be voted on by shareholders at the Company’s annual general meeting.
Rio Tinto Limited is not required to prepare separate consolidated financial statements solely for it and its controlled entities. Rio Tinto Limited is also not required to prepare and lodge parent entity financial statements for itself in respect of each relevant financial year.
However, Rio Tinto Limited must in accordance with the Corporations Act include in the consolidated financial statements for the Group, as a note, various parent entity information regarding Rio Tinto Limited (including in relation to assets, liabilities, shareholders’ equity, profit and loss, income, guarantees, contingent liabilities, and contractual commitments) prepared in accordance with AAS (see page 193).
| | | | |
| | 201 riotinto.com/reportingcentre2013 | | |
Report of Independent Registered Public Accounting Firm
To the Boards of Directors and Shareholders of Rio Tinto plc and Rio Tinto Limited
In our opinion, the accompanying Group statement of financial position and the related Group income statement, the Group statement of comprehensive income, the Group cash flow statement, the Group statement of changes in equity, present fairly, in all material respects, the financial position of the Rio Tinto Group at 31 December 2013 and 2012, and the results of their operations and their cash flows for each of the three years in the period ended 31 December 2013 in conformity with International Financial Reporting Standards as issued by the International Accounting Standards Board. Also in our opinion, the Rio Tinto Group maintained, in all material respects, effective internal control over financial reporting as of 31 December 2013 based on criteria established inInternal Control – Integrated Framework 1992 issued by the Committee of Sponsoring Organizations of the Treadway Commission (COSO). The Rio Tinto Group’s management is responsible for these financial statements, for maintaining effective internal control over financial reporting and for its assessment of the effectiveness of internal control over financial reporting, included in Management’s report on internal control over financial reporting. Our responsibility is to express opinions on these financial statements and on the Rio Tinto Group’s internal control over financial reporting based on our integrated audits. We conducted our audits in accordance with the standards of the Public Company Accounting Oversight Board (United States). Those standards require that we plan and perform the audits to obtain reasonable assurance about whether the financial statements are free of material misstatement and whether effective internal control over financial reporting was maintained in all material respects. Our audits of the financial statements included examining, on a test basis, evidence supporting the amounts and disclosures in the financial statements, assessing the accounting principles used and significant estimates made by management, and evaluating the overall financial statement presentation. Our audit of internal control over financial reporting included obtaining an understanding of internal control over financial reporting, assessing the risk that a material weakness exists, and testing and evaluating the design and operating effectiveness of internal control based on the assessed risk. Our audits also included performing such other procedures as we considered necessary in the circumstances. We believe that our audits provide a reasonable basis for our opinions.
A company’s internal control over financial reporting is a process designed to provide reasonable assurance regarding the reliability of financial reporting and the preparation of financial statements for external purposes in accordance with generally accepted accounting principles. A company’s internal control over financial reporting includes those policies and procedures that (i) pertain to the maintenance of records that, in reasonable detail, accurately and fairly reflect the transactions and dispositions of the assets of the company; (ii) provide reasonable assurance that transactions are recorded as necessary to permit preparation of financial statements in accordance with generally accepted accounting principles, and that receipts and expenditures of the company are being made only in accordance with authorisations of management and directors of the company; and (iii) provide reasonable assurance regarding prevention or timely detection of unauthorised acquisition, use, or disposition of the company’s assets that could have a material effect on the financial statements.
As discussed in Note 1 to the Group financial statements, the Rio Tinto Group changed the manner in which it accounts for stripping costs, for joint arrangements and for post retirement benefits in 2013, which resulted in the inclusion of the 1 January 2012 Group statement of financial position.
Because of its inherent limitations, internal control over financial reporting may not prevent or detect misstatements. Also, projections of any evaluation of effectiveness to future periods are subject to the risk that controls may become inadequate because of changes in conditions, or that the degree of compliance with the policies or procedures may deteriorate.
| | | | |
| /s/ PricewaterhouseCoopers LLP | | /s/ PricewaterhouseCoopers | | |
PricewaterhouseCoopers LLP | | PricewaterhouseCoopers | | |
| London, United Kingdom | | Melbourne, Australia | | |
| 13 March 2014 | | 13 March 2014 | | |
| | |
| In respect of the Board of Directors and | | In respect of the Board of Directors and | | |
| Shareholders of Rio Tinto plc | | Shareholders of Rio Tinto Limited | | |
| | | | |
| | 204 riotinto.com/reportingcentre2013 | | |
Metals and minerals production
| | | | | | | | | | | | | | | | | | | | | | | | | | | | | | | | |
| | | | | | 2013 Production | | | | | 2012 Production | | | | | 2011 Production | |
| | |
| Rio Tinto
% share |
(a) | | | Total | | |
| Rio Tinto
share |
| | | | | Total | | |
| Rio Tinto
share |
| | | | | Total | | |
| Rio Tinto
share |
|
ALUMINA (‘000 tonnes) | | | | | | | | | | | | | | | | | | | | | | | | | | | | | | | | |
Rio Tinto Alcan | | | | | | | | | | | | | | | | | | | | | | | | | | | | | | | | |
Jonquière (Vaudreuil) (Canada) (b) | | | 100.0 | | | | 1,439 | | | | 1,439 | | | | | | 1,397 | | | | 1,397 | | | | | | 1,363 | | | | 1,363 | |
Queensland Alumina (Australia) | | | 80.0 | | | | 3,384 | | | | 2,707 | | | | | | 3,693 | | | | 2,954 | | | | | | 3,360 | | | | 2,688 | |
São Luis (Alumar) (Brazil) | | | 10.0 | | | | 3,425 | | | | 343 | | | | | | 3,409 | | | | 341 | | | | | | 3,385 | | | | 339 | |
Yarwun (Australia) | | | 100.0 | | | | 2,446 | | | | 2,446 | | | | | | 2,175 | | | | 2,175 | | | | | | 1,349 | | | | 1,349 | |
Jonquière (Vaudreuil) specialty plant (Canada) | | | 100.0 | | | | 103 | | | | 103 | | | | | | 101 | | | | 101 | | | | | | 108 | | | | 108 | |
| | | | | | | | | | | 7,037 | | | | | | | | | | 6,968 | | | | | | | | | | 5,846 | |
Other Aluminium | | | | | | | | | | | | | | | | | | | | | | | | | | | | | | | | |
Gove refinery (Australia) (c) | | | 100.0 | | | | 2,270 | | | | 2,270 | | | | | | 2,742 | | | | 2,742 | | | | | | 2,549 | | | | 2,549 | |
Specialty plants (France/Germany) (d) | | | – | | | | – | | | | – | | | | | | 331 | | | | 331 | | | | | | 552 | | | | 552 | |
| | | | | | | | | | | | 2,270 | | | | | | | | | | 3,073 | | | | | | | | | | 3,101 | |
Rio Tinto total | | | | | | | | | | | 9,307 | | | | | | | | | | 10,041 | | | | | | | | | | 8,947 | |
ALUMINIUM (‘000 tonnes) | | | | | | | | | | | | | | | | | | | | | | | | | | | | | | | | |
Rio Tinto Alcan | | | | | | | | | | | | | | | | | | | | | | | | | | | | | | | | |
Alma (Canada) | | | 100.0 | | | | 440 | | | | 440 | | | | | | 208 | | | | 208 | | | | | | 434 | | | | 434 | |
Alouette (Sept-Îles) (Canada) | | | 40.0 | | | | 582 | | | | 233 | | | | | | 593 | | | | 237 | | | | | | 582 | | | | 233 | |
Alucam (Edéa) (Cameroon) | | | 46.7 | | | | 75 | | | | 35 | | | | | | 52 | | | | 24 | | | | | | 69 | | | | 32 | |
Arvida (Canada) | | | 100.0 | | | | 175 | | | | 175 | | | | | | 177 | | | | 177 | | | | | | 176 | | | | 176 | |
Arvida AP60 (Canada) (e) | | | 100.0 | | | | 9 | | | | 9 | | | | | | – | | | | – | | | | | | – | | | | – | |
Bécancour (Canada) | | | 25.1 | | | | 435 | | | | 109 | | | | | | 429 | | | | 107 | | | | | | 414 | | | | 104 | |
Bell Bay (Australia) (f) | | | 100.0 | | | | 187 | | | | 187 | | | | | | 185 | | | | 185 | | | | | | 181 | | | | 181 | |
Boyne Island (Australia) (f) | | | 59.4 | | | | 561 | | | | 333 | | | | | | 569 | | | | 338 | | | | | | 558 | | | | 331 | |
Dunkerque (France) | | | 100.0 | | | | 258 | | | | 258 | | | | | | 256 | | | | 256 | | | | | | 235 | | | | 235 | |
Grande-Baie (Canada) | | | 100.0 | | | | 224 | | | | 224 | | | | | | 223 | | | | 223 | | | | | | 223 | | | | 223 | |
ISAL (Reykjavik) (Iceland) | | | 100.0 | | | | 197 | | | | 197 | | | | | | 190 | | | | 190 | | | | | | 185 | | | | 185 | |
Kitimat (Canada) | | | 100.0 | | | | 172 | | | | 172 | | | | | | 182 | | | | 182 | | | | | | 168 | | | | 168 | |
Laterrière (Canada) | | | 100.0 | | | | 239 | | | | 239 | | | | | | 233 | | | | 233 | | | | | | 234 | | | | 234 | |
Lochaber (UK) | | | 100.0 | | | | 44 | | | | 44 | | | | | | 45 | | | | 45 | | | | | | 45 | | | | 45 | |
Saint-Jean-de-Maurienne (France) (g) | | | – | | | | 85 | | | | 85 | | | | | | 93 | | | | 93 | | | | | | 99 | | | | 99 | |
Shawinigan (Canada) (h) | | | 100.0 | | | | 74 | | | | 74 | | | | | | 81 | | | | 81 | | | | | | 97 | | | | 97 | |
Sohar (Oman) | | | 20.0 | | | | 354 | | | | 71 | | | | | | 360 | | | | 72 | | | | | | 373 | | | | 75 | |
SØRAL (Husnes) (Norway) | | | 50.0 | | | | 89 | | | | 45 | | | | | | 92 | | | | 46 | | | | | | 89 | | | | 45 | |
Tiwai Point (New Zealand) (f) | | | 79.4 | | | | 324 | | | | 257 | | | | | | 325 | | | | 258 | | | | | | 357 | | | | 283 | |
Tomago (Australia) (f) | | | 51.6 | | | | 545 | | | | 281 | | | | | | 546 | | | | 281 | | | | | | 539 | | | | 278 | |
| | | | | | | | | | | 3,468 | | | | | | | | | | 3,236 | | | | | | | | | | 3,459 | |
Other Aluminium | | | | | | | | | | | | | | | | | | | | | | | | | | | | | | | | |
Lynemouth (UK) (i) | | | 100.0 | | | | – | | | | – | | | | | | 15 | | | | 15 | | | | | | 168 | | | | 168 | |
Sebree (US) (j) | | | – | | | | 87 | | | | 87 | | | | | | 205 | | | | 205 | | | | | | 197 | | | | 197 | |
| | | | | | | | | | | | 87 | | | | | | | | | | 220 | | | | | | | | | | 365 | |
Rio Tinto total | | | | | | | | | | | 3,555 | | | | | | | | | | 3,456 | | | | | | | | | | 3,824 | |
See notes on page 214

| | | | |
| | 211 riotinto.com/reportingcentre2013 | | |
Metals and minerals production continued
| | | | | | | | | | | | | | | | | | | | | | | | | | | | |
| | | | | | 2013 Production | | | 2012 Production | | | 2011 Production | |
| | |
| Rio Tinto
% share |
(a) | | | Total | | |
| Rio Tinto
share |
| | | Total | | |
| Rio Tinto
share |
| | | Total | | |
| Rio Tinto
share |
|
BAUXITE (‘000 tonnes) | | | | | | | | | | | | | | | | | | | | | | | | | | | | |
Rio Tinto Alcan | | | | | | | | | | | | | | | | | | | | | | | | | | | | |
Gove (Australia) (f) | | | 100.0 | | | | 8,029 | | | | 8,029 | | | | 7,944 | | | | 7,944 | | | | 7,246 | | | | 7,246 | |
Porto Trombetas (MRN) (Brazil) | | | 12.0 | | | | 15,729 | | | | 1,887 | | | | 15,512 | | | | 1,861 | | | | 15,224 | | | | 1,827 | |
Sangaredi (Guinea) | | | (k) | | | | 15,437 | | | | 6,947 | | | | 14,001 | | | | 6,301 | | | | 12,517 | | | | 5,633 | |
Weipa (Australia) | | | 100.0 | | | | 26,341 | | | | 26,341 | | | | 23,257 | | | | 23,257 | | | | 20,732 | | | | 20,732 | |
Rio Tinto total | | | | | | | | | | | 43,204 | | | | | | | | 39,363 | | | | | | | | 35,437 | |
BORATES (‘000 tonnes) (l) | | | | | | | | | | | | | | | | | | | | | | | | | | | | |
Rio Tinto Minerals – Boron (US) | | | 100.0 | | | | 495 | | | | 495 | | | | 453 | | | | 453 | | | | 486 | | | | 486 | |
Rio Tinto Minerals – Tincalayu (Argentina) (m) | | | – | | | | – | | | | – | | | | 9 | | | | 9 | | | | 18 | | | | 18 | |
Rio Tinto total | | | | | | | | | | | 495 | | | | | | | | 463 | | | | | | | | 504 | |
COAL (hard coking) (‘000 tonnes) | | | | | | | | | | | | | | | | | | | | | | | | | | | | |
Rio Tinto Coal Australia | | | | | | | | | | | | | | | | | | | | | | | | | | | | |
Hail Creek Coal (Australia) | | | 82.0 | | | | 6,839 | | | | 5,608 | | | | 7,174 | | | | 5,882 | | | | 7,291 | | | | 5,979 | |
Kestrel Coal (Australia) | | | 80.0 | | | | 2,553 | | | | 2,043 | | | | 2,468 | | | | 1,974 | | | | 3,545 | | | | 2,836 | |
Total Australian hard coking coal | | | | | | | | | | | 7,651 | | | | | | | | 7,857 | | | | | | | | 8,815 | |
Rio Tinto Coal Mozambique | | | | | | | | | | | | | | | | | | | | | | | | | | | | |
Benga (n) | | | 65.0 | | | | 867 | | | | 564 | | | | 289 | | | | 188 | | | | – | | | | – | |
Rio Tinto total hard coking coal | | | | | | | | | | | 8,214 | | | | | | | | 8,044 | | | | | | | | 8,815 | |
COAL (semi-soft coking) (‘000 tonnes) | | | | | | | | | | | | | | | | | | | | | | | | | | | | |
Rio Tinto Coal Australia | | | | | | | | | | | | | | | | | | | | | | | | | | | | |
Hunter Valley (Australia) (o) | | | 80.0 | | | | 2,634 | | | | 2,107 | | | | 2,119 | | | | 1,695 | | | | 1,906 | | | | 1,450 | |
Mount Thorley (Australia) (o) | | | 64.0 | | | | 1,846 | | | | 1,182 | | | | 1,584 | | | | 1,014 | | | | 1,922 | | | | 1,159 | |
Warkworth (Australia) (o) | | | 44.5 | | | | 1,281 | | | | 569 | | | | 1,296 | | | | 576 | | | | 594 | | | | 250 | |
Rio Tinto total semi-soft coking coal | | | | | | | | | | | 3,859 | | | | | | | | 3,286 | | | | | | | | 2,859 | |
COAL (thermal) (‘000 tonnes) | | | | | | | | | | | | | | | | | | | | | | | | | | | | |
Rio Tinto Coal Australia | | | | | | | | | | | | | | | | | | | | | | | | | | | | |
Bengalla (Australia) (o) | | | 32.0 | | | | 8,232 | | | | 2,634 | | | | 7,026 | | | | 2,248 | | | | 5,368 | | | | 1,629 | |
Blair Athol (Australia) (p) | | | 71.2 | | | | – | | | | – | | | | 2,587 | | | | 1,843 | | | | 2,885 | | | | 2,055 | |
Clermont (Australia) (q) | | | 50.1 | | | | 11,782 | | | | 5,903 | | | | 8,189 | | | | 4,103 | | | | 5,790 | | | | 2,901 | |
Hail Creek Coal (Australia) (r) | | | 82.0 | | | | 191 | | | | 157 | | | | – | | | | – | | | | – | | | | – | |
Hunter Valley (Australia) (o) | | | 80.0 | | | | 11,002 | | | | 8,802 | | | | 9,836 | | | | 7,869 | | | | 10,332 | | | | 7,839 | |
Kestrel Coal (Australia) | | | 80.0 | | | | 463 | | | | 371 | | | | 350 | | | | 280 | | | | 326 | | | | 261 | |
Mount Thorley (Australia) (o) | | | 64.0 | | | | 2,357 | | | | 1,508 | | | | 2,497 | | | | 1,598 | | | | 1,319 | | | | 801 | |
Warkworth (Australia) (o) | | | 44.5 | | | | 6,995 | | | | 3,110 | | | | 5,477 | | | | 2,435 | | | | 5,454 | | | | 2,304 | |
Total Australian thermal coal | | | | | | | | | | | 22,485 | | | | | | | | 20,376 | | | | | | | | 17,791 | |
Rio Tinto Coal Mozambique | | | | | | | | | | | | | | | | | | | | | | | | | | | | |
Benga (n) | | | 65.0 | | | | 754 | | | | 490 | | | | 419 | | | | 272 | | | | – | | | | – | |
US Coal | | | | | | | | | | | | | | | | | | | | | | | | | | | | |
Colowyo (US) (s) | | | – | | | | – | | | | – | | | | – | | | | – | | | | 1,939 | | | | 1,939 | |
Rio Tinto total thermal coal | | | | | | | | | | | 22,975 | | | | | | | | 20,648 | | | | | | | | 19,729 | |
See notes on page 214
| | | | |
| | 212 riotinto.com/reportingcentre2013 | | |
| | | | | | | | | | | | | | | | | | | | | | | | | | | | |
| | | | | | 2013 Production | | | 2012 Production | | | 2011 Production | |
| | |
| Rio Tinto
% share |
(a) | | | Total | | |
| Rio Tinto
share |
| | | Total | | |
| Rio Tinto
share |
| | | Total | | |
| Rio Tinto
share |
|
COPPER (mined) (‘000 tonnes) | | | | | | | | | | | | | | | | | | | | | | | | | | | | |
Bingham Canyon (US) | | | 100.0 | | | | 211.0 | | | | 211.0 | | | | 163.2 | | | | 163.2 | | | | 195.0 | | | | 195.0 | |
Escondida (Chile) | | | 30.0 | | | | 1,121.5 | | | | 336.5 | | | | 1,047.4 | | | | 314.2 | | | | 759.1 | | | | 227.7 | |
Grasberg – Joint Venture (Indonesia) | | | 40.0 | | | | 15.7 | | | | 6.3 | | | | 0.0 | | | | 0.0 | | | | 42.1 | | | | 16.9 | |
Northparkes (Australia) (u) | | | – | | | | 50.6 | | | | 40.4 | | | | 53.8 | | | | 43.1 | | | | 50.4 | | | | 40.3 | |
Oyu Tolgoi (Mongolia) (v) | | | 33.5 | | | | 76.7 | | | | 25.7 | | | | – | | | | – | | | | – | | | | – | |
Palabora (South Africa) (w) | | | – | | | | 22.2 | | | | 11.6 | | | | 49.1 | | | | 28.3 | | | | 69.1 | | | | 39.9 | |
Rio Tinto total | | | | | | | | | | | 631.5 | | | | | | | | 548.8 | | | | | | | | 519.7 | |
COPPER (refined) (‘000 tonnes) | | | | | | | | | | | | | | | | | | | | | | | | | | | | |
Escondida (Chile) | | | 30.0 | | | | 305.3 | | | | 91.6 | | | | 310.3 | | | | 93.1 | | | | 283.5 | | | | 85.0 | |
Kennecott Utah Copper (US) | | | 100.0 | | | | 193.6 | | | | 193.6 | | | | 162.7 | | | | 162.7 | | | | 215.3 | | | | 215.3 | |
Palabora (South Africa) (w) | | | – | | | | 25.8 | | | | 14.9 | | | | 40.9 | | | | 23.6 | | | | 59.0 | | | | 34.0 | |
Rio Tinto total | | | | | | | | | | | 300.1 | | | | | | | | 279.4 | | | | | | | | 334.4 | |
DIAMONDS (‘000 carats) | | | | | | | | | | | | | | | | | | | | | | | | | | | | |
Argyle (Australia) | | | 100.0 | | | | 11,359 | | | | 11,359 | | | | 8,471 | | | | 8,471 | | | | 7,441 | | | | 7,441 | |
Diavik (Canada) | | | 60.0 | | | | 7,243 | | | | 4,346 | | | | 7,230 | | | | 4,338 | | | | 6,677 | | | | 4,006 | |
Murowa (Zimbabwe) | | | 77.8 | | | | 414 | | | | 322 | | | | 403 | | | | 313 | | | | 367 | | | | 285 | |
Rio Tinto total | | | | | | | | | | | 16,027 | | | | | | | | 13,122 | | | | | | | | 11,733 | |
GOLD (mined) (‘000 ounces) | | | | | | | | | | | | | | | | | | | | | | | | | | | | |
Barneys Canyon (US) | | | 100.0 | | | | 0 | | | | 0 | | | | 1 | | | | 1 | | | | 2 | | | | 2 | |
Bingham Canyon (US) | | | 100.0 | | | | 207 | | | | 207 | | | | 200 | | | | 200 | | | | 384 | | | | 384 | |
Escondida (Chile) | | | 30.0 | | | | 94 | | | | 28 | | | | 98 | | | | 29 | | | | 122 | | | | 37 | |
Grasberg – Joint Venture (Indonesia) (t) | | | 40.0 | | | | 0 | | | | 0 | | | | 0 | | | | 0 | | | | 444 | | | | 178 | |
Northparkes (Australia) (u) | | | – | | | | 62 | | | | 49 | | | | 72 | | | | 58 | | | | 76 | | | | 61 | |
Oyu Tolgoi (Mongolia) (v) | | | 33.5 | | | | 157 | | | | 53 | | | | – | | | | – | | | | – | | | | – | |
Palabora (South Africa) (w) | | | – | | | | 5 | | | | 3 | | | | 11 | | | | 6 | | | | 13 | | | | 8 | |
Rio Tinto total | | | | | | | | | | | 340 | | | | | | | | 294 | | | | | | | | 669 | |
GOLD (refined) (‘000 ounces) | | | | | | | | | | | | | | | | | | | | | | | | | | | | |
Kennecott Utah Copper (US) | | | 100.0 | | | | 192 | | | | 192 | | | | 279 | | | | 279 | | | | 379 | | | | 379 | |
IRON ORE (‘000 tonnes) | | | | | | | | | | | | | | | | | | | | | | | | | | | | |
Hamersley Iron – six wholly owned mines (Australia) | | | 100.0 | | | | 133,295 | | | | 133,295 | | | | 126,630 | | | | 126,630 | | | | 121,525 | | | | 121,525 | |
Hamersley – Channar (Australia) | | | 60.0 | | | | 11,047 | | | | 6,628 | | | | 10,947 | | | | 6,568 | | | | 11,015 | | | | 6,609 | |
Hamersley – Eastern Range (Australia) | | | (x) | | | | 10,052 | | | | 10,052 | | | | 9,303 | | | | 9,303 | | | | 9,385 | | | | 9,385 | |
Hope Downs (Australia) | | | 50.0 | | | | 33,788 | | | | 16,894 | | | | 30,793 | | | | 15,396 | | | | 31,740 | | | | 15,870 | |
Iron Ore Company of Canada (Canada) | | | 58.7 | | | | 15,368 | | | | 9,024 | | | | 14,079 | | | | 8,267 | | | | 13,457 | | | | 7,902 | |
Robe River (Australia) | | | 53.0 | | | | 62,401 | | | | 33,073 | | | | 61,707 | | | | 32,705 | | | | 57,502 | | | | 30,476 | |
Rio Tinto total | | | | | | | | | | | 208,966 | | | | | | | | 198,869 | | | | | | | | 191,767 | |
MOLYBDENUM (‘000 tonnes) | | | | | | | | | | | | | | | | | | | | | | | | | | | | |
Bingham Canyon (US) | | | 100.0 | | | | 5.7 | | | | 5.7 | | | | 9.4 | | | | 9.4 | | | | 13.6 | | | | 13.6 | |
SALT (‘000 tonnes) | | | | | | | | | | | | | | | | | | | | | | | | | | | | |
Dampier Salt (Australia) | | | 68.4 | | | | 9,841 | | | | 6,728 | | | | 9,996 | | | | 6,833 | | | | 9,666 | | | | 6,608 | |
SILVER (mined) (‘000 ounces) | | | | | | | | | | | | | | | | | | | | | | | | | | | | |
Bingham Canyon (US) | | | 100.0 | | | | 2,876 | | | | 2,876 | | | | 2,086 | | | | 2,086 | | | | 2,976 | | | | 2,976 | |
Escondida (Chile) | | | 30.0 | | | | 4,032 | | | | 1,210 | | | | 3,501 | | | | 1,050 | | | | 4,327 | | | | 1,298 | |
Grasberg – Joint Venture (Indonesia) (t) | | | 40.0 | | | | 0 | | | | 0 | | | | 0 | | | | 0 | | | | 208 | | | | 83 | |
Oyu Tolgoi (Mongolia) (v) | | | 33.5 | | | | 489 | | | | 164 | | | | – | | | | – | | | | – | | | | – | |
Others | | | – | | | | 687 | | | | 515 | | | | 685 | | | | 521 | | | | 766 | | | | 566 | |
Rio Tinto total | | | | | | | | | | | 4,765 | | | | | | | | 3,657 | | | | | | | | 4,924 | |
See notes on page 214

| | | | |
| | 213 riotinto.com/reportingcentre2013 | | |
Metals and minerals production continued
| | | | | | | | | | | | | | | | | | | | | | | | | | | | |
| | | | | | 2013 Production | | | 2012 Production | | | 2011 Production | |
| | |
| Rio Tinto
% share |
(a) | | | Total | | |
| Rio Tinto
share |
| | | Total | | |
| Rio Tinto
share |
| | | Total | | |
| Rio Tinto
share |
|
SILVER (refined) (‘000 ounces) | | | | | | | | | | | | | | | | | | | | | | | | | | | | |
Kennecott Utah Copper (US) | | | 100.0 | | | | 2,158 | | | | 2,158 | | | | 2,451 | | | | 2,451 | | | | 3,189 | | | | 3,189 | |
TALC (‘000 tonnes) | | | | | | | | | | | | | | | | | | | | | | | | | | | | |
Rio Tinto Minerals | | | | | | | | | | | | | | | | | | | | | | | | | | | | |
– talc (Australia/Europe/North America) (y) | | | – | | | | – | | | | – | | | | – | | | | – | | | | 592 | | | | 592 | |
TITANIUM DIOXIDE FEEDSTOCK (‘000 tonnes) | | | | | | | | | | | | | | | | | | | | | | | | | | | | |
Rio Tinto Iron & Titanium | | | | | | | | | | | | | | | | | | | | | | | | | | | | |
(Canada/South Africa) (z) (aa) | | | 100.0 | | | | 1,622 | | | | 1,622 | | | | 1,594 | | | | 1,594 | | | | 1,443 | | | | 1,443 | |
URANIUM (‘000 lbs U3O8) | | | | | | | | | | | | | | | | | | | | | | | | | | | | |
Energy Resources of Australia (Australia) | | | 68.4 | | | | 6,361 | | | | 4,351 | | | | 8,304 | | | | 5,679 | | | | 5,571 | | | | 3,810 | |
Rössing (Namibia) | | | 68.6 | | | | 5,312 | | | | 3,643 | | | | 5,950 | | | | 4,081 | | | | 4,736 | | | | 3,248 | |
Rio Tinto total | | | | | | | | | | | 7,993 | | | | | | | | 9,760 | | | | | | | | 7,058 | |
Production data notes:
Mine production figures for metals refer to the total quantity of metal produced in concentrates, leach liquor or doré bullion irrespective of whether these products are then refined onsite, except for the data for bauxite and iron ore which represent production of marketable quantities of ore plus concentrates and pellets.
| (a) | Rio Tinto percentage share, shown above, is as at the end of 2013. The footnotes below include all ownership changes over the three years. The Rio Tinto share varies at individual mines and refineries in the “others” category and thus no value is shown. |
| (b) | Jonquière’s (Vaudreuil’s) production shows smelter grade alumina only and excludes hydrate produced and used for specialty alumina. |
| (c) | On 29 November 2013, Rio Tinto announced plans to suspend production at the Gove refinery in 2014; the Gove refinery has been transferred from “Pacific Aluminium” to “Other Aluminium”. |
| (d) | Rio Tinto sold its interest in these specialty alumina assets with an effective date of 1 August 2012. Production is shown up to that date. |
| (e) | Rio Tinto started production at the Arvida AP60 Technology Centre in the fourth quarter of 2013. |
| (f) | On 8 August 2013, Rio Tinto announced that Pacific Aluminium, including the Gove mine, Bell Bay, Boyne Island, Tomago and Tiwai Point smelters, would be reintegrated in Rio Tinto Alcan. |
| (g) | Rio Tinto sold its 100 per cent interest in the Saint-Jean-de-Maurienne smelter with an effective date of 16 December 2013. Production is shown up to that date. |
| (h) | The Shawinigan smelter ceased production on 29 November 2013. |
| (i) | Rio Tinto closed the Lynemouth aluminium smelter on 29 March 2012. |
| (j) | Rio Tinto sold its 100 per cent interest in the Sebree aluminium smelter with an effective date of 1 June 2013. Production is shown up to that date. |
| (k) | Rio Tinto has a 22.95 per cent shareholding in the Sangaredi mine but benefits from 45.0 per cent of production. |
| (l) | Borate quantities are expressed as B2O3. |
| (m) | Rio Tinto sold its interest in Borax Argentina with an effective date of 21 Aug 2012. Production is included up to that date. |
| (n) | Benga moved to commercial production during the third quarter of 2012. |
| (o) | Rio Tinto’s interest in these mines is held through Coal & Allied Industries Ltd; Rio Tinto increased its interest in Coal & Allied from 75.7 per cent to 80.0 per cent with effect from 16 December 2011. Production data reflect the increased shareholding from that date. |
| (p) | Blair Athol closed in the last quarter of 2012. Rio Tinto agreed to sell its 71.2 per cent interest in Blair Athol in October 2013. |
| (q) | In October 2013, Rio Tinto reached a binding agreement for the sale of its 50.1 per cent interest in the Clermont Joint Venture. |
| (r) | Hail Creek started a trial of thermal coal production, reprocessed from coking coal reject, in the third quarter of 2013. |
| (s) | Rio Tinto sold its 100 per cent interest in Colowyo with an effective date of 1 December 2011. Production data are shown up to that date. |
| (t) | Through a joint venture agreement with Freeport-McMoRan Copper & Gold (FCX), Rio Tinto is entitled to 40 per cent of additional material mined as a consequence of expansions and developments of the Grasberg facilities since 1998. Total production reflects the quantities attributable to the joint venture. The 2013 gold and silver production from Grasberg did not exceed the metal attributable to PT Freeport Indonesia per the joint venture agreement for the year. Accordingly, Rio Tinto’s share of joint venture gold and silver production was zero for the year 2013. |
| (u) | Rio Tinto sold its 80 per cent interest in Northparkes with an effective date of 1 December 2013. Production is shown up to that date. |
| (v) | Rio Tinto owns a 33.52 per cent indirect interest in Oyu Tolgoi through its 50.79 per cent interest in Turquoise Hill Resources Ltd. Production included in the table is from 1 May 2013. |
| (w) | The sale of Rio Tinto’s 57.7 per cent interest in Palabora Mining Company was completed on 31 July 2013. Production data have been reported up to 30 June 2013. |
| (x) | Rio Tinto’s share of production includes 100 per cent of the production from the Eastern Range mine. Under the terms of the joint venture agreement (Rio Tinto 54 per cent interest), Hamersley Iron manages the operation and is obliged to purchase all mine production from the joint venture. |
| (y) | Rio Tinto sold its 100 per cent interest in the talc business with an effective date of 1 August 2011. Production data are shown up to that date. |
| (z) | On 7 September 2012, Rio Tinto increased its stake in Richards Bay Minerals (RBM) from 37 per cent to 74 per cent through the acquisition of BHP Billiton’s interest in RBM. |
| (aa) | Quantities comprise 100 per cent of Rio Tinto Fer et Titane and Rio Tinto’s share of Richards Bay Minerals’ production. Ilmenite mined in Madagascar is being processed in Canada. |
Production figures are sometimes more precise than the rounded numbers shown, hence an apparent small difference may result where the Rio Tinto share is totalled.
| | | | |
| | 214 riotinto.com/reportingcentre2013 | | |
Ore reserves (under industry guide 7)
For the purposes of this combined Annual report on Form 20-F estimates of Ore Reserves have been prepared in accordance with the SEC’s Industry Guide 7 under the United States Securities Act of 1933 and the following definitions:
| – | An ‘Ore Reserve’ means that part of a mineral deposit that can be economically and legally extracted or produced at the time of the reserves determination. To establish this, studies appropriate to the type of mineral deposit involved have been carried out to estimate the quantity, grade and value of the ore mineral(s) present. In addition, technical studies have been completed to determine realistic assumptions for the extraction of the minerals including estimates of mining, processing, economic, marketing, legal, environmental, social and governmental factors. The degree of these studies is sufficient to demonstrate the technical and economic feasibility of the project and depends on whether or not the project is an extension of an existing project or operation. The estimates of minerals to be produced include allowances for ore losses and the treatment of unmineralised materials which may occur as part of the mining and processing activities. Ore Reserves are sub-divided in order of increasing confidence into Probable Ore Reserves and Proven Ore Reserves as defined below. |
| – | The term ‘‘economically’’, as used in the definition of reserves, implies that profitable extraction or production under defined investment assumptions has been established through the creation of a mining plan, processing plan and cash flow model. The assumptions made must be reasonable, including costs and operating conditions that will prevail during the life of the project. |
| – | Ore Reserves presented in accordance with SEC Industry Guide 7 do not exceed the quantities that, it is estimated, could be extracted economically if future prices were to be in line with the average of historical prices for the three years to 30 June 2013, or contracted prices where applicable. For this purpose, contracted prices are applied only to future sales volumes for which the price is predetermined by an existing contract; and the average of historical prices is applied to expected sales volumes in excess of such amounts. Moreover, reported Ore Reserve estimates have not been increased above the levels expected to be economic based on Rio Tinto’s own long term price assumptions. |
| – | The term ‘‘legally’’, as used in the definition of Ore Reserves, does not imply that all permits needed for mining and processing have been obtained or that other legal issues have been completely resolved. However, for Ore Reserves to exist, there is reasonable assurance of the issuance of these permits or resolution of legal issues. Reasonable assurance means that, based on applicable laws and regulations, the issuance of permits or resolution of legal issues necessary for mining and processing at a particular deposit will be accomplished in the ordinary course and in a timeframe consistent with the Company’s current mine plans. |
| – | The term ‘‘Proven Ore Reserves’’ means reserves for which (a) quantity is computed from dimensions revealed in outcrops, trenches, workings or drill holes; grade and/or quality are computed from the results of detailed sampling; and (b) the sites for inspection, sampling and measurement are spaced so closely and the geologic character is so well defined that size, shape, depth and mineral content of reserves are well established. Proven Ore Reserves represent that part of an orebody for which there exists the highest level of confidence in data regarding its geology, physical characteristics, chemical composition and probable processing requirements. |
| – | The term ‘‘Probable Ore Reserves’’ means reserves for which quantity and grade and/or quality are computed from information similar to that used for Proven Ore Reserves, but the sites for inspection, sampling and measurement are farther apart or are otherwise less adequately spaced. The degree of assurance, although lower than that for Proven Ore Reserves, is high enough to assume continuity between points of observation. This means that Probable Ore Reserves generally have a wider drill hole spacing than for Proven Ore Reserves. |
| – | The amount of Proven and Probable Ore Reserves shown below does not necessarily represent the amount of material currently scheduled for extraction, because the amount scheduled for extraction may be derived from a life of mine plan predicated on prices and other assumptions which are different to those used in the life of mine plan prepared in accordance with Industry Guide 7. |
The estimated Ore Reserve figures in the following tables are as of 31 December 2013. Metric units are used throughout. The figures used to calculate Rio Tinto’s share of Ore Reserves are often more precise than the rounded numbers shown in the tables, hence small differences might result if the calculations are repeated using the tabulated figures. Commodity price information is given in footnote (a).
Where operations are not managed by Rio Tinto the reserves are published as received from the managing company.
| | | | |
| | 215 riotinto.com/reportingcentre2013 | | |
Ore reserves (under industry guide 7) continued
| | | | | | | | | | | | | | | | | | | | | | | | | | | | |
| | | Type of | | | | | | Total ore reserves at end 2013 | | | | | | | | | | |
| | | mine | | | | | | | | | | | | | | | | | | | |
| | | (b) | | | | | | Tonnage | | | Grade | | | | | | | | | Rio Tinto share | |
| | | | | | | | | | | | | | | | | | Interest % | | | Recoverable mineral | |
| BAUXITE (c) | | | | | | | | millions of tonnes | | | % Al2O3 | | | | | | | | | millions of tonnes | |
| Reserves at operating mines | | | | | | | | | | | | | | | | | | | | | | | | | | | | |
| Rio Tinto Alcan | | | | | | | | | | | | | | | | | | | | | | | | | | | | |
| Gove (Australia) (d) | | | O/P | | | | | | | | 150 | | | | 49.3 | | | | | | | | 100.0 | | | | 150 | |
| Porto Trombetas (MRN) (Brazil) (e) | | | O/P | | | | | | | | 104 | | | | 49.5 | | | | | | | | 12.0 | | | | 12 | |
| Sangaredi (Guinea) | | | O/P | | | | | | | | 303 | | | | 49.6 | | | | | | | | 23.0 | | | | 70 | |
| Weipa (Australia) | | | O/P | | | | | | | | 1,511 | | | | 52.5 | | | | | | | | 100.0 | | | | 1,511 | |
| Rio Tinto total | | | | | | | | | | | | | | | | | | | | | | | | | | | 1,743 | |
| | | | | | | | | | | | | | | | | | | | | Recoverable mineral | |
| BORATES (f) | | | | | | | | millions of tonnes | | | | | | | | | | | | millions of tonnes | |
| Reserves at operating mine | | | | | | | | | | | | | | | | | | | | | | | | | | | | |
| Rio Tinto Minerals – Boron (US) | | | | | | | | | | | | | | | | | | | | | | | | | | | | |
| – mine | | | O/P | | | | | | | | 20 | | | | | | | | | | | | 100.0 | | | | 20 | |
| – stockpiles | | | | | | | | | | | 3.0 | | | | | | | | | | | | 100.0 | | | | 3 | |
| Rio Tinto total | | | | | | | | | | | | | | | | | | | | | | | | | | | 23 | |
| | | | | | Coal type (h) | | | Marketable reserves | | | Marketable coal quality | | | | | | | | | | |
| | | | | | | | | millions of tonnes | | | Calorific value (i) | | | Sulphur content (i) | | | Interest % | | | Marketable
reserves | |
| COAL (g) | | | | | | | | | | | MJ/kg | | | % | | | | | | millions of tonnes | |
| Reserves at operating mines | | | | | | | | | | | | | | | | | | | | | | | | | | | | |
| Rio Tinto Coal Australia | | | | | | | | | | | | | | | | | | | | | | | | | | | | |
| Bengalla | | | O/C | | | | SC | | | | 120 | | | | 27.86 | | | | 0.48 | | | | 32.0 | | | | 38 | |
| Clermont | | | O/C | | | | SC | | | | 153 | | | | 27.90 | | | | 0.33 | | | | 50.1 | | | | 77 | |
| Hail Creek | | | O/C | | | | MC | | | | 60 | | | | 32.20 | | | | 0.35 | | | | 82.0 | | | | 49 | |
| Hunter Valley Operations (j) | | | O/C | | | | SC + MC | | | | 277 | | | | 29.12 | | | | 0.59 | | | | 80.0 | | | | 221 | |
| Kestrel Coal | | | U/G | | | | MC | | | | 112 | | | | 31.60 | | | | 0.59 | | | | 80.0 | | | | 90 | |
| Mouth Thorley Operations (k) | | | O/C | | | | SC + MC | | | | 21 | | | | 29.80 | | | | 0.45 | | | | 64.0 | | | | 14 | |
| Warkworth (l) | | | O/C | | | | SC + MC | | | | 233 | | | | 29.80 | | | | 0.45 | | | | 44.5 | | | | 104 | |
| Rio Tinto total reserves at Australian operating mines | | | | | | | | | | | | | | | | | | | | | | | | | | | 593 | |
| Rio Tinto Coal Mozambique | | | | | | | | | | | | | | | | | | | | | | | | | | | | |
| Benga | | | O/C | | | | SC + MC | | | | 112 | | | | 26.40 | | | | 0.89 | | | | 65.0 | | | | 73 | |
| Rio Tinto total reserves at operating mines | | | | | | | | | | | | | | | | | | | | | | | | | | | 665 | |
| Undeveloped reserves (m) | | | | | | | | | | | | | | | | | | | | | | | | | | | | |
| Rio Tinto Coal Australia | | | | | | | | | | | | | | | | | | | | | | | | | | | | |
| Mount Pleasant | | | O/C | | | | SC | | | | 326 | | | | 26.92 | | | | 0.48 | | | | 80.0 | | | | 261 | |
| | | | |
| | 216 riotinto.com/reportingcentre2013 | | |
| | | | | | | | | | | | | | | | | | | | | | | | | | | | | | | | |
| | | Type of | | | | | Total ore reserves at end 2013 | | | | | | | | | | | | | | | | |
| | | mine | | | | | | | | | | | | | | | | | | | | | | | | | | | | | |
| | | (b) | | | | | Tonnage | | | Grade | | | | | | | | | | | | | | | Rio Tinto share | |
| | | | | | | | | | | | | | | | Average mill recovery % | | | | | Interest % | | | | | Recoverable metal | |
| COPPER | | | | | | | millions of tonnes | | | % Cu | | | | | | | | | | | | | | | millions of tonnes | |
| Reserves at operating mines | | | | | | | | | | | | | | | | | | | | | | | | | | | | | | | | |
| Bingham Canyon (US) | | | | | | | | | | | | | | | | | | | | | | | | | | | | | | | | |
| – mine and stockpiles (n) | | | O/P | | | | | | 748 | | | | 0.47 | | | | | | 86 | | | | | | 100.0 | | | | | | 3.035 | |
| Escondida (Chile) | | | | | | | | | | | | | | | | | | | | | | | | | | | | | | | | |
| – sulphide mine | | | O/P | | | | | | 5,061 | | | | 0.71 | | | | | | 85 | | | | | | 30.0 | | | | | | 9.238 | |
| – sulphide leach mine | | | O/P | | | | | | 1,986 | | | | 0.44 | | | | | | 36 | | | | | | 30.0 | | | | | | 0.942 | |
| – oxide mine (o) | | | O/P | | | | | | 109 | | | | 0.84 | | | | | | 68 | | | | | | 30.0 | | | | | | 0.188 | |
| – sulphide stockpiles (o) | | | | | | | | | 1.9 | | | | 1.06 | | | | | | 79 | | | | | | 30.0 | | | | | | 0.005 | |
| – sulphide leach stockpiles (o) | | | | | | | | | 19 | | | | 0.76 | | | | | | 29 | | | | | | 30.0 | | | | | | 0.012 | |
| – oxide stockpiles (o) | | | | | | | | | 42 | | | | 0.65 | | | | | | 65 | | | | | | 30.0 | | | | | | 0.054 | |
| Grasberg (Indonesia) | | | O/P + U/G | | | | | | 2,358 | | | | 1.01 | | | | | | 88 | | | | | | (p) | | | | | | 6.877 | |
| Oyu Tolgoi (Mongolia) | | | | | | | | | | | | | | | | | | | | | | | | | | | | | | | | |
| – South Oyu mine | | | O/P | | | | | | 1,014 | | | | 0.46 | | | | | | 82 | | | | | | 33.5 | | | | | | 1.276 | |
| – South Oyu stockpiles (q) | | | | | | | | | 18 | | | | 0.37 | | | | | | 83 | | | | | | 33.5 | | | | | | 0.019 | |
| Rio Tinto total reserves at operating mines | | | | | | | | | | | | | | | | | | | | | | | | | | | | | | | 21.644 | |
| Undeveloped reserves | | | | | | | | | | | | | | | | | | | | | | | | | | | | | | | | |
| Oyu Tolgoi (Mongolia) | | | | | | | | | | | | | | | | | | | | | | | | | | | | | | | | |
| – Hugo Dummett North | | | U/G | | | | | | 460 | | | | 1.80 | | | | | | 92 | | | | | | 33.5 | | | | | | 2.549 | |
| – Hugo Dummett North Extension | | | U/G | | | | | | 31 | | | | 1.73 | | | | | | 92 | | | | | | 30.0 | | | | | | 0.149 | |
| Rio Tinto total undeveloped reserves | | | | | | | | | | | | | | | | | | | | | | | | | | | | | | | 2.697 | |
| | | | | | | | | | | | | | | | | | | | | | | | | | Recoverable diamonds | |
| DIAMONDS (c) | | | | | | | millions of tonnes | | | carats per tonne | | | | | | | | | | | | | | | millions of carats | |
| Reserves at operating mines | | | | | | | | | | | | | | | | | | | | | | | | | | | | | | | | |
| Argyle (Australia) | | | | | | | | | | | | | | | | | | | | | | | | | | | | | | | | |
| – AK1 pipe mine (r) | | | U/G | | | | | | 49 | | | | 2.4 | | | | | | | | | | | | 100.0 | | | | | | 117.9 | |
| Diavik (Canada) | | | | | | | | | | | | | | | | | | | | | | | | | | | | | | | | |
| – mine (s) | | | U/G | | | | | | 16 | | | | 2.9 | | | | | | | | | | | | 60.0 | | | | | | 27.8 | |
| – stockpiles (s) | | | | | | | | | 0.2 | | | | 2.7 | | | | | | | | | | | | 60.0 | | | | | | 0.3 | |
| Rio Tinto total | | | | | | | | | | | | | | | | | | | | | | | | | | | | | | | 146.0 | |
| | | | | | | | | | | | | | | | | | | | | | | | | | Recoverable metal | |
| GOLD | | | | | | | millions of tonnes | | | grammes per tonne | | | | | | | | | | | | | | | millions of ounces | |
| Reserves at operating mines | | | | | | | | | | | | | | | | | | | | | | | | | | | | | | | | |
| Bingham Canyon (US) | | | | | | | | | | | | | | | | | | | | | | | | | | | | | | | | |
| – mine and stockpiles (n) | | | O/P | | | | | | 748 | | | | 0.19 | | | | | | 67 | | | | | | 100.0 | | | | | | 3.042 | |
| Grasberg (Indonesia) | | | O/P + U/G | | | | | | 2,358 | | | | 0.84 | | | | | | 68 | | | | | | (p) | | | | | | 12.220 | |
| Oyu Tolgoi (Mongolia) | | | | | | | | | | | | | | | | | | | | | | | | | | | | | | | | |
| – South Oyu mine | | | O/P | | | | | | 1,014 | | | | 0.31 | | | | | | 74 | | | | | | 33.5 | | | | | | 2.520 | |
| – South Oyu stockpiles (q) | | | | | | | | | 18 | | | | 0.21 | | | | | | 76 | | | | | | 33.5 | | | | | | 0.031 | |
| Rio Tinto total reserves at operating mines | | | | | | | | | | | | | | | | | | | | | | | | | | | | | | | 17.814 | |
| Undeveloped reserves (m) | | | | | | | | | | | | | | | | | | | | | | | | | | | | | | | | |
| Oyu Tolgoi (Mongolia) | | | | | | | | | | | | | | | | | | | | | | | | | | | | | | | | |
| – Hugo Dummett North | | | U/G | | | | | | 460 | | | | 0.37 | | | | | | 83 | | | | | | 33.5 | | | | | | 1.543 | |
| – Hugo Dummett North Extension | | | U/G | | | | | | 31 | | | | 0.62 | | | | | | 83 | | | | | | 30.0 | | | | | | 0.156 | |
| Rio Tinto total undeveloped reserves | | | | | | | | | | | | | | | | | | | | | | | | | | | | | | | 1.700 | |
| | | | |
| | 217 riotinto.com/reportingcentre2013 | | |
Ore reserves (under industry guide 7) continued
| | | | | | | | | | | | | | | | | | | | | | | | | | | | | | |
| | | Type of | | | | | Total ore reserves at end 2013 | | | | | | | | | | | | | | |
| | | mine | | | | | | | | | | | | | | | | | | | | | | | | | | | |
| | | (b) | | | | | Tonnage | | | Grade | | | | | | | | | | | | | Rio Tinto share | |
| | | | | | | | | | | | | | | | Average mill recovery % | | | | | Interest % | | | Marketable product | |
| IRON ORE (c) (t) | | | | | | | millions of tonnes | | | % Fe | | | | | | | | | | | | | millions of tonnes | |
| Reserves at operating mines | | | | | | | | | | | | | | | | | | | | | | | | | | | | | | |
| Hamersley Iron (Australia) | | | | | | | | | | | | | | | | | | | | | | | | | | | | | | |
| – Brockman 2 (Brockman ore) | | | | | | | | | | | | | | | | | | | | | | | | | | | | | | |
– mine (u) | | | O/P | | | | | | 40 | | | | 62.0 | | | | | | | | | | | | 100.0 | | | | 40 | |
– stockpiles | | | | | | | | | 2 | | | | 59.4 | | | | | | | | | | | | 100.0 | | | | 2 | |
| – Brockman 4 (Brockman ore) | | | O/P | | | | | | 516 | | | | 62.0 | | | | | | | | | | | | 100.0 | | | | 516 | |
| – Marandoo (Marra Mamba ore) | | | O/P | | | | | | 205 | | | | 63.2 | | | | | | | | | | | | 100.0 | | | | 205 | |
| – Mt Tom Price (Brockman ore) | | | | | | | | | | | | | | | | | | | | | | | | | | | | | | |
– mine | | | O/P | | | | | | 51 | | | | 63.7 | | | | | | | | | | | | 100.0 | | | | 51 | |
– stockpiles (v) | | | | | | | | | 2 | | | | 61.5 | | | | | | | | | | | | 100.0 | | | | 2 | |
| – Mt Tom Price (Marra Mamba ore) (w) | | | O/P | | | | | | 9 | | | | 60.8 | | | | | | | | | | | | 100.0 | | | | 9 | |
| – Nammuldi (Marra Mamba ore) | | | O/P | | | | | | 165 | | | | 62.6 | | | | | | | | | | | | 100.0 | | | | 165 | |
| – Paraburdoo (Brockman ore) | | | O/P | | | | | | 14 | | | | 63.5 | | | | | | | | | | | | 100.0 | | | | 14 | |
| – Western Turner Syncline (Brockman ore) | | | | | | | | | | | | | | | | | | | | | | | | | | | | | | |
– mine | | | O/P | | | | | | 323 | | | | 62.1 | | | | | | | | | | | | 100.0 | | | | 323 | |
– stockpiles (x) | | | | | | | | | 7 | | | | 59.3 | | | | | | | | | | | | 100.0 | | | | 7 | |
| – Yandicoogina (Pisolite ore HG) | | | | | | | | | | | | | | | | | | | | | | | | | | | | | | |
– mine | | | O/P | | | | | | 297 | | | | 58.7 | | | | | | | | | | | | 100.0 | | | | 297 | |
– stockpiles (y) | | | | | | | | | 1 | | | | 58.6 | | | | | | | | | | | | 100.0 | | | | 1 | |
| Channar JV (Australia) | | | | | | | | | | | | | | | | | | | | | | | | | | | | | | |
| – Brockman ore | | | O/P | | | | | | 40 | | | | 62.9 | | | | | | | | | | | | 60.0 | | | | 24 | |
| Eastern Range JV (Australia) | | | | | | | | | | | | | | | | | | | | | | | | | | | | | | |
| – Brockman ore | | | O/P | | | | | | 47 | | | | 62.7 | | | | | | | | | | | | 54.0 | | | | 26 | |
| Hope Downs JV (Australia) | | | | | | | | | | | | | | | | | | | | | | | | | | | | | | |
| – Hope Downs 1 (Marra Mamba ore) | | | | | | | | | | | | | | | | | | | | | | | | | | | | | | |
– mine (z) | | | O/P | | | | | | 223 | | | | 61.6 | | | | | | | | | | | | 50.0 | | | | 112 | |
– stockpiles | | | | | | | | | 1 | | | | 60.8 | | | | | | | | | | | | 50.0 | | | | 1 | |
| – Hope Downs 4 (Brockman ore) | | | | | | | | | | | | | | | | | | | | | | | | | | | | | | |
– mine | | | O/P | | | | | | 137 | | | | 63.1 | | | | | | | | | | | | 50.0 | | | | 68 | |
– stockpiles | | | | | | | | | 1 | | | | 61.5 | | | | | | | | | | | | 50.0 | | | | 1 | |
| Robe River JV (Australia) | | | | | | | | | | | | | | | | | | | | | | | | | | | | | | |
| – Pannawonica (Pisolite ore) | | | | | | | | | | | | | | | | | | | | | | | | | | | | | | |
– mine | | | O/P | | | | | | 254 | | | | 56.9 | | | | | | | | | | | | 53.0 | | | | 135 | |
– stockpiles (aa) | | | | | | | | | 6 | | | | 56.0 | | | | | | | | | | | | 53.0 | | | | 3 | |
| – West Angelas (Marra Mamba ore) | | | | | | | | | | | | | | | | | | | | | | | | | | | | | | |
– mine (bb) | | | O/P | | | | | | 196 | | | | 61.5 | | | | | | | | | | | | 53.0 | | | | 104 | |
– stockpiles (cc) | | | | | | | | | 1 | | | | 61.0 | | | | | | | | | | | | 53.0 | | | | 0.4 | |
| Iron Ore Company of Canada (Canada) (dd) | | | O/P | | | | | | 592 | | | | 65.0 | | | | | | | | | | | | 58.7 | | | | 348 | |
| Rio Tinto total reserves at operating mines | | | | | | | | | | | | | | | | | | | | | | | | | | | | | 2,452 | |
| Undeveloped reserves (m) | | | | | | | | | | | | | | | | | | | | | | | | | | | | | | |
| Hamersley Iron (Australia) | | | | | | | | | | | | | | | | | | | | | | | | | | | | | | |
| – Koodaideri (Brockman ore) (ee) | | | O/P | | | | | | 418 | | | | 61.8 | | | | | | | | | | | | 100.0 | | | | 418 | |
| – Silvergrass East (Marra Mamba ore) (ff) | | | O/P | | | | | | 144 | | | | 62.2 | | | | | | | | | | | | 100.0 | | | | 144 | |
| – Turee Central (Brockman ore) | | | O/P | | | | | | 78 | | | | 61.9 | | | | | | | | | | | | 100.0 | | | | 78 | |
| Simandou (Guinea) | | | O/P | | | | | | 1,844 | | | | 65.5 | | | | | | | | | | | | 50.4 | | | | 928 | |
| Rio Tinto total undeveloped reserves | | | | | | | | | | | | | | | | | | | | | | | | | | | | | 1,569 | |
| | | | | | | | | | | | | | | | | | | | | | | | Recoverable metal | |
| MOLYBDENUM | | | | | | | millions of tonnes | | | % Mo | | | | | | | | | | | | | millions of tonnes | |
| Reserves at operating mines | | | | | | | | | | | | | | | | | | | | | | | | | | | | | | |
| Bingham Canyon (US) | | | | | | | | | | | | | | | | | | | | | | | | | | | | | | |
| – mine and stockpiles (n) (gg) | | | O/P | | | | | | 748 | | | | 0.043 | | | | | | 70 | | | | | | 100.0 | | | | 0.225 | |
| | | | |
| | 218 riotinto.com/reportingcentre2013 | | |
| | | | | | | | | | | | | | | | | | | | | | | | | | |
| | | Type of | | | | | Total ore reserves at end 2013 | | | | | | | | | | |
| | | mine | | | | | | | | | | | | | | | | | | |
| | | (b) | | | | | Tonnage | | | | | | | | | | | | Rio Tinto share | |
| | | | | | | | | | | | | | Average
mill
recovery
% | | | Interest
% | | | Marketable
product | |
| | | | | | | | | | | | | | | | | | | | Recoverable
metal | |
| SILVER | | | | | | | millions of tonnes | | | grammes per tonne | | | | | | | | | millions of ounces | |
| Reserves at operating mines | | | | | | | | | | | | | | | | | | | | | | | | | | |
| Bingham Canyon (US) | | | | | | | | | | | | | | | | | | | | | | | | | | |
| – mine and stockpiles (n) | | | O/P | | | | | | 748 | | | | 2.08 | | | | 67 | | | | 100.0 | | | | 33.426 | |
| Grasberg (Indonesia) | | | O/P + U/G | | | | | | 2,358 | | | | 4.26 | | | | 70 | | | | (p | ) | | | 78.552 | |
| Rio Tinto total | | | | | | | | | | | | | | | | | | | | | | | | | 111.978 | |
| TITANIUM DIOXIDE FEEDSTOCK (hh) | | | | | | | millions of tonnes | | | | | | | | | | | | millions of tonnes | |
| Reserves at operating mines | | | | | | | | | | | | | | | | | | | | | | | | | | |
| RBM (South Africa) | | | | | | | | | | | | | | | | | | | | | | | | | | |
| – mine (ii) | | | D/O | | | | | | 19 | | | | | | | | | | | | 74.0 | | | | 14.1 | |
| – stockpiles (jj) | | | | | | | | | 0.5 | | | | | | | | | | | | 74.0 | | | | 0.3 | |
| RTFT (Canada) (kk) | | | O/P | | | | | | 53 | | | | | | | | | | | | 100.0 | | | | 52.6 | |
| Rio Tinto Total | | | | | | | | | | | | | | | | | | | | | | | | | 67.0 | |
| | | | | | | | Tonnage | | | Grade | | | | | | | | | Rio Tinto share | |
| | | | | | | | | | | | | | | | | | | | Recoverable metal | |
| URANIUM | | | | | | | millions of tonnes | | | % U3O8 | | | | | | | | | millions of tonnes | |
| Reserves at operating mines | | | | | | | | | | | | | | | | | | | | | | | | | | |
| Energy Resources of Australia (Australia) | | | | | | | | | | | | | | | | | | | | | | | | | | |
| – Ranger #3 stockpiles (ll) | | | | | | | | | 5.5 | | | | 0.123 | | | | 84 | | | | 68.4 | | | | 0.004 | |
| Rössing SJ (Namibia) | | | | | | | | | | | | | | | | | | | | | | | | | | |
| – mine | | | O/P | | | | | | 134 | | | | 0.034 | | | | 86 | | | | 68.6 | | | | 0.027 | |
| – stockpiles (mm) | | | | | | | | | 14 | | | | 0.017 | | | | 82 | | | | 68.6 | | | | 0.001 | |
| Rio Tinto total | | | | | | | | | | | | | | | | | | | | | | | | | 0.032 | |
| | | | |
| | 219 riotinto.com/reportingcentre2013 | | |
Ore reserves (under industry guide 7) continued
| | | | | | | | | | | | | | | | | | | | | | | | | | | | |
| | | | | | Proven ore reserves at end 2013 | | | Probable ore reserves at end 2013 | |
| | | Type of mine (b) | | | Tonnage | | | Grade | | | Drill hole spacing (nn) | | | Tonnage | | | Grade | | | Drill hole spacing (nn) | |
| BAUXITE (c) | | | | | millions of tonnes | | | % Al2O3 | | | | | | millions of tonnes | | | % Al2O3 | | | | |
| Reserves at operating mines | | | | | | | | | | | | | | | | | | | | | | | | | | | | |
| Rio Tinto Alcan | | | | | | | | | | | | | | | | | | | | | | | | | | | | |
| Gove (Australia) (d) | | | O/P | | | | 141 | | | | 49.3 | | | | 50-100m x 50-100m | | | | 8.7 | | | | 49.0 | | | | 200-400m x 200-400m | |
| Porto Trombetas (MRN) (Brazil) (e) | | | O/P | | | | 85 | | | | 49.4 | | | | 200m x 200m | | | | 19 | | | | 49.9 | | | | 400m x 400m | |
| Sangaredi (Guinea) | | | O/P | | | | 99 | | | | 49.8 | | | | 38m x 38m | | | | 204 | | | | 49.5 | | | | 75m x 75m | |
| Weipa (Australia) | | | O/P | | | | 521 | | | | 52.1 | | | | 150m x 150m | | | | 989 | | | | 52.7 | | | | 300m x 300m | |
| BORATES (f) | | | | | millions of tonnes | | | | | | | | | millions of tonnes | | | | | | | |
| Reserves at operating mine | | | | | | | | | | | | | | | | | | | | | | | | | | | | |
| Rio Tinto Minerals – Boron (US) | | | | | | | | | | | | | | | | | | | | | | | | | | | | |
| – mine | | | O/P | | | | 12 | | | | | | | | 0-130m x 0-130m | | | | 8.0 | | | | | | | | 130-488m x 130-488m | |
| – stockpiles | | | | | | | | | | | | | | | | | | | 3.0 | | | | | | | | | |
| | | | | | | | | | | | | | | | | | | | | Marketable Reserves | |
| COAL (g) | | | | | Recoverable reserves total | | | % Yield to give marketable reserves | | | Proven | | | Drill hole spacing (nn) | | | Probable | | | Drill hole spacing (nn) | |
| | | | | | millions of tonnes | | | | | | millions of tonnes | | | | | | millions of tonnes | | | | |
| Reserves at operating mines | | | | | | | | | | | | | | | | | | | | | | | | | | | | |
| Rio Tinto Coal Australia | | | | | | | | | | | | | | | | | | | | | | | | | | | | |
| Bengalla | | | O/C | | | | 161 | | | | 74 | | | | 113 | | | | 100-450m x 100-450m | | | | 7.1 | | | | 300-1000m x 300-1000m | |
| Clermont | | | O/C | | | | 160 | | | | 96 | | | | 149 | | | | 300m x 300m | | | | 4.2 | | | | 600m x 600m | |
| Hail Creek | | | O/C | | | | 118 | | | | 51 | | | | 38 | | | | 100-500m x 100-500m | | | | 23 | | | | 200-1000m x 200-1000m | |
| Hunter Valley Operations (j) | | | O/C | | | | 381 | | | | 73 | | | | 242 | | | | 125-500m x 125-500m | | | | 35 | | | | 400-1000m x 400-1000m | |
| Kestrel Coal | | | U/G | | | | 135 | | | | 83 | | | | 34 | | | | 500m x 500m | | | | 79 | | | | 1000m x 1000m | |
| Mouth Thorley Operations (k) | | | O/C | | | | 32 | | | | 67 | | | | 17 | | | | 125-500m x 125-500m | | | | 4.7 | | | | 400-1000m x 400-1000m | |
| Warkworth (l) | | | O/C | | | | 358 | | | | 65 | | | | 132 | | | | 125-500m x 125-500m | | | | 101 | | | | 400-1000m x 400-1000m | |
| Rio Tinto Coal Mozambique | | | | | | | | | | | | | | | | | | | | | | | | | | | | |
| Benga | | | O/C | | | | 236 | | | | 47 | | | | 67 | | | | 100-500m x 100-500m | | | | 45 | | | | 500-1000m x 500-1000m | |
| Undeveloped reserves (m) | | | | | | | | | | | | | | | | | | | | | | | | | | | | |
| Rio Tinto Coal Australia | | | | | | | | | | | | | | | | | | | | | | | | | | | | |
| Mount Pleasant | | | O/C | | | | 399 | | | | 82 | | | | | | | | | | | | 326 | | | | 350-1000m x 350-1000m | |
| | | | |
| | 220 riotinto.com/reportingcentre2013 | | |
| | | | | | | | | | | | | | | | | | | | | | | | | | | | |
| | | | | | Proven ore reserves at end 2013 | | | Probable ore reserves at end 2013 | |
| | | Type of mine (b) | | | Tonnage | | | Grade | | | Drill hole spacing (nn) | | | Tonnage | | | Grade | | | Drill hole spacing (nn) | |
| COPPER | | | | | millions of tonnes | | | % Cu | | | | | | millions of tonnes | | | % Cu | | | | |
| Reserves at operating mines | | | | | | | | | | | | | | | | | | | | | | | | | | | | |
| Bingham Canyon (US) | | | | | | | | | | | | | | | | | | | | | | | | | | | | |
| – mine and stockpiles (n) | | | O/P | | | | 289 | | | | 0.43 | | | | 85m x 85m | | | | 459 | | | | 0.49 | | | | 131m x 131m | |
| Escondida (Chile) | | | | | | | | | | | | | | | | | | | | | | | | | | | | |
| – sulphide mine | | | O/P | | | | 3,720 | | | | 0.76 | | | | 50m x 50m | | | | 1,341 | | | | 0.60 | | | | 90m x 90m | |
| – sulphide leach mine | | | O/P | | | | 1,443 | | | | 0.45 | | | | 60m x 60m | | | | 543 | | | | 0.42 | | | | 115m x 115m | |
| – oxide mine (o) | | | O/P | | | | 50 | | | | 1.01 | | | | 35m x 35m | | | | 60 | | | | 0.71 | | | | 45m x 45m | |
| – sulphide stockpiles (o) | | | | | | | 1.9 | | | | 1.06 | | | | | | | | | | | | | | | | | |
| – sulphide leach stockpiles (o) | | | | | | | 19 | | | | 0.76 | | | | | | | | | | | | | | | | | |
| – oxide stockpiles (o) | | | | | | | 42 | | | | 0.65 | | | | | | | | | | | | | | | | | |
| Grasberg (Indonesia) | | | O/P + U/G | | | | 770 | | | | 1.16 | | | | 1-60m x 1-60m | | | | 1,588 | | | | 0.93 | | | | 7-316m x 7-316m | |
| Oyu Tolgoi (Mongolia) | | | | | | | | | | | | | | | | | | | | | | | | | | | | |
| – South Oyu mine | | | O/P | | | | 410 | | | | 0.54 | | | | 30m x 50m | | | | 604 | | | | 0.41 | | | | 70m x 70m | |
| – South Oyu stockpiles (q) | | | | | | | 18 | | | | 0.37 | | | | | | | | | | | | | | | | | |
| Undeveloped reserves (m) | | | | | | | | | | | | | | | | | | | | | | | | | | | | |
| Oyu Tolgoi (Mongolia) | | | | | | | | | | | | | | | | | | | | | | | | | | | | |
| – Hugo Dummett North | | | U/G | | | | | | | | | | | | | | | | 460 | | | | 1.80 | | | | 50-70m x 100-125m | |
| – Hugo Dummett North Extension | | | U/G | | | | | | | | | | | | | | | | 31 | | | | 1.73 | | | | 50-70m x 100-125m | |
| DIAMONDS (c) | | | | | millions of tonnes | | | carats per tonne | | | | | | millions of tonnes | | | carats per tonne | | | | |
| Reserves at operating mines | | | | | | | | | | | | | | | | | | | | | | | | | | | | |
| Argyle (Australia) | | | | | | | | | | | | | | | | | | | | | | | | | | | | |
| – AK1 pipe mine (r) | | | U/G | | | | | | | | | | | | | | | | 49 | | | | 2.4 | | | | 50m x 50m | |
| Diavik (Canada) | | | | | | | | | | | | | | | | | | | | | | | | | | | | |
| – mine (s) | | | U/G | | | | 11 | | | | 2.9 | | | | 2-39m x 2-62m | | | | 5.3 | | | | 2.8 | | | | 8-63m x 5-74m | |
| – stockpiles (s) | | | | | | | 0.2 | | | | 2.7 | | | | | | | | | | | | | | | | | |
| GOLD | | | | | millions of tonnes | | | grammes per tonne | | | | | | millions of tonnes | | | grammes per tonne | | | | |
| Reserves at operating mines | | | | | | | | | | | | | | | | | | | | | | | | | | | | |
| Bingham Canyon (US) | | | | | | | | | | | | | | | | | | | | | | | | | | | | |
| – mine and stockpiles (n) | | | O/P | | | | 289 | | | | 0.17 | | | | 85m x 85m | | | | 459 | | | | 0.20 | | | | 131m x 131m | |
| Grasberg (Indonesia) | | | O/P + U/G | | | | 770 | | | | 1.02 | | | | 1-60m x 1-60m | | | | 1,588 | | | | 0.75 | | | | 7-316m x 7-316m | |
| Oyu Tolgoi (Mongolia) | | | | | | | | | | | | | | | | | | | | | | | | | | | | |
| – South Oyu mine | | | O/P | | | | 410 | | | | 0.42 | | | | 30m x 50m | | | | 604 | | | | 0.24 | | | | 70m x 70m | |
| – South Oyu stockpiles (q) | | | | | | | 18 | | | | 0.21 | | | | | | | | | | | | | | | | | |
| Undeveloped reserves (m) | | | | | | | | | | | | | | | | | | | | | | | | | | | | |
| Oyu Tolgoi (Mongolia) | | | | | | | | | | | | | | | | | | | | | | | | | | | | |
| – Hugo Dummett North | | | U/G | | | | | | | | | | | | | | | | 460 | | | | 0.37 | | | | 50-70m x 100-125m | |
| – Hugo Dummett North Extension | | | U/G | | | | | | | | | | | | | | | | 31 | | | | 0.62 | | | | 50-70m x 100-125m | |
| | | | |
| | 221 riotinto.com/reportingcentre2013 | | |
Ore reserves (under industry guide 7) continued
| | | | | | | | | | | | | | | | | | | | | | | | | | | | |
| | | Type of | | | Proven ore reserves at end 2013 | | | | | | Probable ore reserves at end 2013 | |
| | | mine | | | | | | | | | Drill hole spacing | | | | | | | | | Drill hole spacing | |
| | | (b) | | | Tonnage | | | Grade | | | (nn) | | | Tonnage | | | Grade | | | (nn) | |
| IRON ORE (c) (t) | | | | | millions of tonnes | | | % Fe | | | | | | millions of tonnes | | | % Fe | | | | |
| Reserves at operating mines | | | | | | | | | | | | | | | | | | | | | | | | | | | | |
| Hamersley Iron (Australia) | | | | | | | | | | | | | | | | | | | | | | | | | | | | |
| – Brockman 2 (Brockman ore) | | | | | | | | | | | | | | | | | | | | | | | | | | | | |
– mine (u) | | | O/P | | | | 15 | | | | 62.9 | | | | 50m x 50m | | | | 24 | | | | 61.4 | | | | 50m x 50m | |
– stockpiles | | | | | | | | | | | | | | | | | | | 2 | | | | 59.4 | | | | | |
| – Brockman 4 (Brockman ore) | | | O/P | | | | 381 | | | | 62.3 | | | | 50m x 50m | | | | 136 | | | | 61.3 | | | | 50-100m x 50m | |
| – Marandoo (Marra Mamba ore) | | | O/P | | | | 181 | | | | 63.5 | | | | 75m x 75m | | | | 24 | | | | 61.3 | | | | 75m x 75m | |
| – Mt Tom Price (Brockman ore) | | | | | | | | | | | | | | | | | | | | | | | | | | | | |
– mine | | | O/P | | | | 15 | | | | 63.6 | | | | 30-60m x 30-60m | | | | 36 | | | | 63.7 | | | | 30-60m x 30-60m | |
– stockpiles (v) | | | | | | | | | | | | | | | | | | | 2 | | | | 61.5 | | | | | |
| – Mt Tom Price (Marra Mamba ore) (w) | | | O/P | | | | 8 | | | | 61.0 | | | | 60m x 30m | | | | 1 | | | | 58.8 | | | | 60m x 30m | |
| – Nammuldi (Marra Mamba ore) | | | O/P | | | | 73 | | | | 62.9 | | | | 25-50m x 25-50m | | | | 92 | | | | 62.4 | | | | 25-200m x 25-50m | |
| – Paraburdoo (Brockman ore) | | | O/P | | | | 6 | | | | 62.9 | | | | 30-60m x 30-60m | | | | 8 | | | | 63.9 | | | | 30-60m x 30-60m | |
| – Western Turner Syncline (Brockman ore) | | | | | | | | | | | | | | | | | | | | | | | | | | | | |
– mine | | | O/P | | | | 257 | | | | 62.3 | | | | 60m x 60m | | | | 66 | | | | 61.2 | | | | 60m x 60m | |
– stockpiles (x) | | | | | | | | | | | | | | | | | | | 7 | | | | 59.3 | | | | | |
| – Yandicoogina (Pisolite ore HG) | | | | | | | | | | | | | | | | | | | | | | | | | | | | |
– mine | | | O/P | | | | 297 | | | | 58.7 | | | | 100m x 50m | | | | | | | | | | | | | |
– stockpiles (y) | | | | | | | | | | | | | | | | | | | 1 | | | | 58.6 | | | | | |
| Channar JV (Australia) | | | | | | | | | | | | | | | | | | | | | | | | | | | | |
| – Brockman ore | | | O/P | | | | 24 | | | | 63.1 | | | | 30-60m x 30-60m | | | | 16 | | | | 62.7 | | | | 30-120m x 30-120m | |
| Eastern Range JV (Australia) | | | | | | | | | | | | | | | | | | | | | | | | | | | | |
| – Brockman ore | | | O/P | | | | 40 | | | | 62.7 | | | | 30-60m x 30-60m | | | | 7 | | | | 62.4 | | | | 30-120m x 30-120m | |
| Hope Downs JV (Australia) | | | | | | | | | | | | | | | | | | | | | | | | | | | | |
| – Hope Downs 1 (Marra Mamba ore) | | | | | | | | | | | | | | | | | | | | | | | | | | | | |
– mine (z) | | | O/P | | | | 6 | | | | 61.4 | | | | 25-50m x 50m | | | | 218 | | | | 61.6 | | | | 25-100m x 50m | |
– stockpiles | | | | | | | | | | | | | | | | | | | 1 | | | | 60.8 | | | | | |
| – Hope Downs 4 (Brockman ore) | | | | | | | | | | | | | | | | | | | | | | | | | | | | |
– mine | | | O/P | | | | 71 | | | | 62.9 | | | | 63-125m x 50-100m | | | | 66 | | | | 63.2 | | | | 63-125m x 50-100m | |
– stockpiles | | | | | | | | | | | | | | | | | | | 1 | | | | 61.5 | | | | | |
| Robe River JV (Australia) | | | | | | | | | | | | | | | | | | | | | | | | | | | | |
| – Pannawonica (Pisolite ore) | | | | | | | | | | | | | | | | | | | | | | | | | | | | |
– mine | | | O/P | | | | 155 | | | | 57.2 | | | | 50-70m x 50-70m | | | | 99 | | | | 56.4 | | | | 50-100m x 50-100m | |
– stockpiles (aa) | | | | | | | 1 | | | | 56.4 | | | | | | | | 6 | | | | 55.9 | | | | | |
| – West Angelas (Marra Mamba ore) | | | | | | | | | | | | | | | | | | | | | | | | | | | | |
– mine (bb) | | | O/P | | | | 150 | | | | 61.9 | | | | 25-50m x 25-50m | | | | 46 | | | | 60.2 | | | | 50-200m x 25-50m | |
– stockpiles (cc) | | | | | | | 1 | | | | 62.3 | | | | | | | | 0.3 | | | | 58.5 | | | | | |
| Iron Ore Company of Canada (Canada) (dd) | | | O/P | | | | 358 | | | | 65.0 | | | | 61-122m x 30-61m | | | | 234 | | | | 65.0 | | | | 122m x 61-122m | |
| Undeveloped reserves (m) | | | | | | | | | | | | | | | | | | | | | | | | | | | | |
| Hamersley Iron (Australia) | | | | | | | | | | | | | | | | | | | | | | | | | | | | |
| – Koodaideri (Brockman ore) (ee) | | | O/P | | | | 167 | | | | 62.1 | | | | 50m x 50m | | | | 251 | | | | 61.7 | | | | 50-100m x 50m | |
| – Silvergrass East (Marra Mamba ore) (ff) | | | O/P | | | | 112 | | | | 62.7 | | | | 50m x 50m | | | | 33 | | | | 60.5 | | | | 50-100m x 50m | |
| – Turee Central (Brockman ore) | | | O/P | | | | 72 | | | | 62.0 | | | | 60-120m x 60-120m | | | | 6 | | | | 61.4 | | | | 60-120m x 60-120m | |
| Simandou (Guinea) | | | O/P | | | | | | | | | | | | | | | | 1,844 | | | | 65.5 | | | | 30-125m x 30-125m | |
| | | | |
| | 222 riotinto.com/reportingcentre2013 | | |
| | | | | | | | | | | | | | | | | | | | | | | | | | | | |
| | | | | | Proven ore reserves at end 2013 | | | Probable ore reserves at end 2013 | |
| | | Type of mine (b) | | | Tonnage | | | Grade | | | Drill hole spacing (nn) | | | Tonnage | | | Grade | | | Drill hole spacing (nn) | |
| MOLYBDENUM | | | | | millions
of tonnes | | | % Mo | | | | | | millions
of tonnes | | | % Mo | | | | |
| Reserves at operating mine | | | | | | | | | | | | | | | | | | | | | | | | | | | | |
| Bingham Canyon (US) | | | | | | | | | | | | | | | | | | | | | | | | | | | | |
| – mine and stockpiles (n) (gg) | | | O/P | | | | 289 | | | | 0.045 | | | | 85m x 85m | | | | 459 | | | | 0.042 | | | | 131m x 131m | |
| SILVER | | | | | millions
of tonnes | | | grammes
per tonne | | | | | | millions
of tonnes | | | grammes
per tonne | | | | |
| Reserves at operating mines | | | | | | | | | | | | | | | | | | | | | | | | | | | | |
| Bingham Canyon (US) | | | | | | | | | | | | | | | | | | | | | | | | | | | | |
| – mine and stockpiles (n) | | | O/P | | | | 289 | | | | 1.95 | | | | 85m x 85m | | | | 459 | | | | 2.16 | | | | 131m x 131m | |
| Grasberg (Indonesia) | | | O/P + U/G | | | | 770 | | | | 4.67 | | | | 1-60m x 1-60m | | | | 1,588 | | | | 4.07 | | | | 7-316m x 7-316m | |
TITANIUM DIOXIDE
FEEDSTOCK (hh) | | | | | millions
of tonnes | | | | | | | | | millions
of tonnes | | | | | | | |
| Reserves at operating mines | | | | | | | | | | | | | | | | | | | | | | | | | | | | |
| RBM (South Africa) | | | | | | | | | | | | | | | | | | | | | | | | | | | | |
| – mine (ii) | | | D/O | | | | 7.5 | | | | | | | | 100m x 200m | | | | 12 | | | | | | | | 200m x 200-400m | |
| – stockpiles (jj) | | | | | | | 0.5 | | | | | | | | | | | | | | | | | | | | | |
| RTFT (Canada) (kk) | | | O/P | | | | | | | | | | | | | | | | 53 | | | | | | | | 100m x 100m | |
| URANIUM | | | | | millions
of tonnes | | | % U308 | | | | | | millions
of tonnes | | | % U308 | | | | |
| Reserves at operating mines | | | | | | | | | | | | | | | | | | | | | | | | | | | | |
| Energy Resources of Australia (Australia) | | | | | | | | | | | | | | | | | | | | | | | | | | | | |
| – Ranger #3 stockpiles (ll) | | | | | | | | | | | | | | | | | | | 5.5 | | | | 0.123 | | | | | |
| Rössing SJ (Namibia) | | | | | | | | | | | | | | | | | | | | | | | | | | | | |
| – mine | | | O/P | | | | 17 | | | | 0.032 | | | | 4-7m x 4-9m | | | | 117 | | | | 0.034 | | | | 20-120m x 20-120m | |
| – stockpiles (mm) | | | | | | | 1.9 | | | | 0.023 | | | | | | | | 12 | | | | 0.016 | | | | | |
| | | | |
| | 223 riotinto.com/reportingcentre2013 | | |
Ore reserves (under industry guide 7) continued
Notes
| (a) | Commodity prices (based on a three year average historical price to 30 June, 2013) used to test whether the reported Ore Reserve estimates could be economically extracted, include the following benchmark prices: Aluminium – 0.98 US$/lb, Copper – 3.71 US$/lb, Gold – 1549 US$/oz, spot price (fines fob WA) – 2.18 US$/dmtu**, Molybdenum – 13.80 US$/lb, Silver – 30.21 US$/oz (** dry metric tonne unit) |
| (b) | Type of mine: O/P = open pit, O/C = open cut, U/G = underground, D/O = dredge operation. |
| (c) | Reserves of iron ore, bauxite and diamonds are shown as recoverable Reserves of marketable product after accounting for all mining and processing losses. Mill recoveries are therefore not shown. |
| (d) | On 8 August 2013, Rio Tinto announced that Pacific Aluminium, including the Gove mine, Bell Bay, Boyne Island, Tomago and Tiwai Point smelters, would be reintegrated in Rio Tinto Alcan. Gove Reserves are not dependent on continued refinery operations. |
| (e) | Reserves at Porto Trombetas (MRN) increased after conversion of mineralisation to Reserves. |
| (f) | Reserves of borates are expressed in terms of marketable product (B2O3) after all mining and processing losses. |
| (g) | For coal, the yield factors shown reflect the impact of further processing, where necessary, to provide marketable coal. |
| (h) | Coal type: SC: steam/thermal coal, MC: metallurgical/coking coal. |
| (i) | Coals have been analysed on an ‘‘Air Dried’’ moisture basis in accordance with Australian Standards and gross calorific value and sulphur content are reported here on that basis. Marketable Reserves tonnages are reported on a product moisture basis. |
| (j) | Reserves at Hunter Valley Operations increased following technical and economic studies. |
| (k) | Mount Thorley Operations Reserves decreased as a result of production. |
| (l) | An appeal of the Project Approval for Reserves west of Wallaby Scrub Road was upheld (disapproved) by the NSW Land and Environment Court in April 2013. RTCA management are working through a process that should result in further approval in 2014. Should this not occur, a reduction in Reserves of approximately 126 million tonnes ROM, consisting of 41 million tonnes ROM (Proven) and 85 million tonnes ROM (Probable), could occur. |
| (m) | The term ‘‘undeveloped reserves’’ is used here to describe material that is economically viable on the basis of technical and economic studies but for which mining and processing permits may have yet to be requested or obtained. There is a reasonable, but not absolute, certainty that the necessary permits will be issued and that mining can proceed when required. |
| (n) | Bingham Canyon open pit Reserves decreased after production. Current stockpiles are 17 million tonnes or 2.2 per cent of the listed Reserve. Pending further geotechnical review some 2012 Proven material has been reclassified as Probable. |
| (o) | The variations in Escondida oxide – mine and stockpile Reserves are due to mine production. |
| (p) | Under the terms of a joint venture agreement between Rio Tinto and FCX, Rio Tinto is entitled to a direct 40 per cent share in Reserves discovered after 31 December 1994 and it is this entitlement that is shown. |
| (q) | The South Oyu stockpile Reserve tonnes increase and grade decrease is a result of economic re-evaluation. |
| (r) | Reserve tonnes decreased and grade increased at Argyle as a result of an economic re-assessment. |
| (s) | Diavik Reserves decreased consistent with production. |
| (t) | Australian and Guinean iron ore Reserve tonnes are reported on a dry weight basis. |
| (u) | Brockman 2 (Brockman ore) – mine Reserve tonnes decreased and grade increased following production and pit design changes. |
| (v) | Mt Tom Price (Brockman ore) – stockpiles Reserve changes follow production. |
| (w) | Changes in Mt Tom Price (Marra Mamba ore) Reserve tonnes and grade are due to production and updated technical and economic studies. |
| (x) | Western Turner Syncline (Brockman ore) – stockpiles Reserve adjustments are due to production. |
| (y) | Changes to Yandicoogina (Pisolite ore HG) – stockpiles Reserves are due to the reporting of Yandicoogina Junction Central mine wet plant stockpiles for the first time. |
| (z) | Hope Downs 1 (Marra Mamba ore) – mine Reserve depletions are consistent with production. |
| (aa) | Pannawonica (Pisolite ore) – stockpiles Reserve adjustments are due to production. |
| (bb) | The decrease in West Angelas (Marra Mamba ore) Reserve tonnage is due to production and updated technical and economic studies. |
| (cc) | West Angelas (Marra Mamba ore) – stockpiles Reserves variations are due to production. |
| (dd) | Reserves at Iron Ore Company of Canada are reported as marketable product (43 per cent pellets and 57 per cent concentrate for sale), at a natural moisture content of three per cent using process upgrade factors derived from current IOC concentrating and pellet operations. The marketable product is obtained from mined material comprising 851 million dry tonnes at 38.1 per cent iron (Proven) and 560 million dry tonnes at 37.6 per cent iron (Probable). |
| (ee) | Koodaideri (Brockman ore) is being reported for the first time following completion of a pre-feasibility study. |
| (ff) | Reserve additions at Silvergrass East (Marra Mamba ore) are due to changes in pit designs following technical and economic studies. |
| (gg) | Molybdenum grades interpolated from exploration drilling assays have been factored based on a long reconciliation history to blast hole and mill samples. |
| (hh) | Reserves of titanium dioxide products are expressed in terms of marketable product (TiO2 slag), after all mining and processing losses. |
| (ii) | RBM – mine Reserves are reported as titanium slag equivalent derived from 1,854 million tonnes of material at a grade of 2.3 per cent ilmenite and a co-product grade of 0.2 per cent rutile and 0.3 per cent zircon. |
| (jj) | RBM – stockpiles Reserves are reported for the first time following production. |
| (kk) | RTFT Reserves are derived from 143 million tonnes of ore at an ilmenite grade of 83.1 per cent. |
| (ll) | Ranger #3 stockpile Reserves were depleted concurrent with production. |
| (mm) | Rössing – stockpile Reserve additions are due to an economic re-evaluation. |
| (nn) | Drill hole spacings are either average distances, a specified grid distance (a regular pattern of drill holes – the distance between the drill holes along the two axes of the grid will be aligned to test the size, shape and continuity of the mineral deposit; as such there may be different distances between the drill holes along the two axes of a grid) or the maximum drill hole spacing that is sufficient to determine the Reserve category for a particular deposit. As the continuity of mineralisation varies from deposit to deposit, the drill hole spacing required to categorise a Reserve varies between and within deposit types. |
| | | | |
| | 224 riotinto.com/reportingcentre2013 | | |
Mines and production facilities
Group mines as at 31 December 2013
(Rio Tinto’s interest 100 per cent unless otherwise shown)
| | | | | | | | |
| Mine | | Location | | Access | | Title/lease | | |
| Bauxite | | | | | | | | |
| | | | |
| CBG Sangaredi(22.95%) | | Sangaredi, Guinea | | Road, air and port | | Mining concession expires in 2040. | | |
| Gove | | Gove, Northern Territory, Australia | | Road, air and port | | All leases were renewed in 2011 for a further period of 42 years. The residue disposal area is leased from the Arnhem Land Aboriginal Land Trust. The Northern Territory government is the lessor of the balance of the leases; however, on expiry of the 42-year renewed term, the land subject of the balances of the leases will all vest to the Arnhem Land Aboriginal Land Trust. | | |
MRN Porto Trombetas (12%) | | Porto Trombetas, Para, Brazil | | Air or port | | Mining concession granted under the Brazilian mining code with no expiration date. | | |
| Weipa/Ely | | Weipa, Queensland, Australia | | Road, air and port | | The Queensland Government Comalco (ML7024) lease expires in 2041 with an option of a 21-year extension, then two years’ notice of termination; the Ely Alcan Queensland Pty. Limited Agreement Act 1965 (ML7031) expires in 2048 with a 21-year right of renewal with a two-year notice period. | | |
| Copper | | | | | | | | |
| | | | |
| Escondida (30%) | | Atacama Desert, Chile | | Pipeline and road to deep sea port at Coloso; road and rail | | Rights conferred by Government under Chilean Mining Code. | | |
Grasberg joint venture (40% of production) | | Papua, Indonesia | | Pipeline, road and port | | Indonesian Government Contracts of Work expire in 2021 with option of twoten-year extensions. | | |
Kennecott Utah Copper Bingham Canyon | | Near Salt Lake City, Utah, US | | Pipeline, road and rail | | Owned | | |
| Oyu Tolgoi (51% of Turquoise Hill Resources Ltd. which owns 66% of Oyu Tolgoi LLC) | | Gobi Desert, Mongolia | | Air and road | | Three mining licences are held by Oyu Tolgoi LLC and two further licences are held in joint venture with Entrée Gold LLC. The licence term under the Minerals Law of Mongolia is 30 years with two 20-year extensions. First renewals are due in 2033 and 2039 for the Oyu Tolgoi and Entrée Gold licences respectively. | | |
| Diamonds & Minerals | | |
| | | | |
| Diamonds | | | | | | | | |
| Argyle Diamonds | | Kimberley Ranges, Western Australia | | Road and air | | Mining tenement held under Diamond (Argyle Diamond Mines Joint Venture) Agreement Act 1981; lease extended for 21 years from 2004 with option to renew. | | |
| Diavik (60%) | | Northwest Territories, Canada | | Air, ice road in winter | | Mining leases from Canadian Federal Government expiring in 2017 and 2018 with options to renew. | | |
| Murowa (77.8%) | | Zvishavane, Zimbabwe | | Road and air | | Mining leases under Zimbabwe Mines and Minerals Act; issued in 2001 and valid for 25 years. | | |
| Industrial minerals | | | | | | | | |
| Dampier Salt(68.4%) | | Dampier, Lake MacLeod and Port Hedland, Western Australia | | Road and port | | State agreements (mining leases) expiring in 2034 at Dampier, 2018 at Port Hedland and 2021 at Lake MacLeod with options to renew at the latter two sites. | | |
| Rio Tinto Minerals – Boron | | California, US | | Road and rail | | Owned | | |
Rio Tinto Fer et Titane Lac Tio | | Havre-Saint-Pierre, Quebec, Canada | | Rail and port (St Lawrence River) | | Mining covered by two concessions granted by State in 1949 and 1951 which, subject to certain Mining Act restrictions, confer rights and obligations of an owner. | | |
| | | | |
| | 226 riotinto.com/reportingcentre2013 | | |
| | | | | | |
| | | History | | Type of mine | | Power source |
| | | |
| | | Bauxite mining commenced in 1973. Shareholders are 51% Halco and 49% Government of Guinea. Rio Tinto Alcan has held 45%of Halco since 2004. Current annual capacity is 14 million tonnes. Rio Tinto Alcan has a 45 per cent interest in the mine’s production. | | Open cut | | On-site generation (fuel oil) |
| | | Bauxite mining commenced in 1970 feeding both the Gove refinery and export market capped at two million tonnes per annum. Bauxite export ceased in 2006 with feed intended for the expanded Gove refinery. Bauxite exports recommenced in 2008 and will continue in the coming years as the refinery production is suspended in 2014. | | Open cut | | Central power station located at the Gove refinery |
| | | Mineral extraction commenced in April 1979. Initial production capacity 3.4 million tonnes annually. From October 2003, production capacity up to 16.3 million tonnes per year on a day basis. Capital structure currently: Vale (40%), BHP Billiton (14.8%), Rio Tinto Alcan (12%), CBA (10%), Alcoa/Abalco (18.2%), and Norsk Hydro (5%). | | Open cut | | On-site generation (heavy oil, diesel) |
| | | Bauxite mining commenced in 1961 at Weipa. Major upgrade completed at Weipa in 1998. Rio Tinto interest increased from 72.4% to 100% in 2000. In 1997, Ely Bauxite Mining Project Agreement signed with local Aboriginal land owners. Bauxite Mining and Exchange Agreement signed in 1998 with Comalco to allow for extraction of ore at Ely. The Western Cape Communities Co-Existence Agreement, an Indigenous Land Use Agreement, was signed in 2001. In 2004 a mine expansion was completed at Weipa that lifted annual capacity to 21.5 million tonnes. Mining commenced on the adjacent Ely mining lease in 2006, in accordance with the 1998 agreement with Alcan (first ore extracted at Ely in 2007). A second shiploader that increases the shipping capability was commissioned in 2006 at Weipa. Annual production capacity has now reached 26 million tonnes. | | Open cut | | On-site generation; new power station commissioned in 2006 |
| | | |
| | | Production started in 1990 and expanded in phases to 2002 when the new concentrator was completed; production from Norte started in 2005 and the sulphide leach produced the first cathode during 2006. | | Open pit | | Supplied from SING grid under various contracts with local generating companies |
| | | Joint venture interest acquired 1995. Capacity expanded to over 200,000 tonnes of ore per day in 1998. Addition of underground production of more than 35,000 tonnes per day in 2003. Expansion to 50,000 tonnes per day in mid-2007 and to 80,000 tonnes in 2010. | | Open pit and underground | | Long-term contract with US-Indonesian consortium operated purpose-built coal- fired generating station |
| | | Interest acquired in 1989. In 2012, the pushback of the south wall commenced, extending the mine life from 2018 to 2030. | | Open pit | | On-site generation supplemented by long-term contracts with Rocky Mountain Power |
| | | Oyu Tolgoi was first discovered in 1996. Construction began in late 2009 after signing of an Investment Agreement with the Government of Mongolia, and first concentrate was produced in December 2012. First sales of concentrate were made to Chinese customers on 9 July 2013. | | Open pit and underground | | Grid power from China and supplementary diesel power generation site |
| | | |
| | | Interest increased from 59.7% following purchase of Ashton Mining in 2000. Underground mine project approved in 2005 to extend mine life to 2020. | | Underground (previously open pit) | | Long-term contract with Ord Hydro Consortium and on-site generation |
| | | Deposits discovered 1994-1995. Construction approved 2000. Diamond production started 2003. Second dike closed off in 2005 for mining of additional orebody. The underground mine started production in 2010, ramping up to full production in 2013. | | Underground (previously open pit) | | On-site diesel generators; installed capacity 44MW and 9.2MW of wind capacity |
| | | Discovered in 1997. Small-scale production started in 2004. | | Open pit | | Supplied by ZESA with diesel generator back-up |
| | | |
| | | Construction of the Dampier field started in 1969; first shipment in 1972. Lake MacLeod was acquired in 1978 as an operating field. Port Hedland was acquired in 2001 as an operating field. | | Solar evaporation of seawater (Dampier and Port Hedland) and underground brine (Lake MacLeod); dredging of gypsum from surface of Lake MacLeod | | Dampier supply from Hamersley Iron Pty Ltd; Lake MacLeod from Western Power and on-site generation units; Port Hedland from Western Power |
| | | Deposit discovered in 1925 and acquired by Rio Tinto in 1967. | | Open pit | | On-site co-generation units and local power grid |
| | | Production started 1950; interest acquired in 1989. | | Open pit | | Long-term contract with Hydro-Québec |
| | | | |
| | 227 riotinto.com/reportingcentre2013 | | |
Mines and production facilities continued
Group mines as at 31 December 2013 continued
(Rio Tinto’s interest 100 per cent unless otherwise shown)
| | | | | | | | |
| Mine | | Location | | Access | | Title/lease | | |
| Industrial minerals continued | | | | | | | | |
| QIT Madagascar Minerals (80%) | | Fort-Dauphin, Madagascar | | Road and port | | Mining lease granted by central government. | | |
| Richards Bay Minerals(74%) | | Richards Bay, KwaZulu-Natal, South Africa | | Rail, road and port | | Mineral rights for Reserve 4 and Reserve 10 issued by state and converted to new order mining rights from 9 May 2012. Mining rights run until 8 May 2041 for both lease areas. | | |
| Energy | | | | | | | | |
| | | | |
Energy Resources of Australia (68.4%) Ranger | | Northern Territory, Australia | | Road | | Mining tenure granted by Federal Government. | | |
Rio Tinto Coal Australia Bengalla (32%) Clermont Mine (50.1%) Hail Creek (82%) Hunter Valley Operations (80%) Kestrel (80%) Mount Thorley Operations (64%) Warkworth (44.46%) | | New South Wales and Queensland, Australia | | Road, rail, conveyor and port | | Leases granted by state. | | |
Rio Tinto Coal Mozambique Benga (65%) | | Tete, Mozambique | | Road and rail | | Mining concession granted by state. | | |
| Rössing Uranium(68.6%) | | Namib Desert, Namibia | | Rail, road and port | | National government grant. | | |
| Iron Ore | | | | | | | | |
| | | | |
Hamersley Iron Brockman 2 Brockman 4 Marandoo Mount Tom Price Nammuldi Paraburdoo Western Turner Syncline Yandicoogina Channar (60%) Eastern Range (54%) | | Hamersley Ranges, Western Australia | | Railway and port (owned by Hamersley Iron and operated by Pilbara Iron) | | Agreements for life of mine with Government of Western Australia. | | |
Hope Downs 1 (50% mine, 100% infrastructure) | | Pilbara region, Western Australia | | Railway owned and operated by Rio Tinto | | Agreements for life of mine with Government of Western Australia. | | |
Hope Downs 4 (50% mine, 100% infrastructure) | | Pilbara region, Western Australia | | Railway owned and operated by Rio Tinto | | Agreements for life of mine with Government of Western Australia | | |
Iron Ore Company of Canada (IOC) (58.7%) | | Labrador City, Province of Labrador and Newfoundland | | Railway and port facilities in Sept-Îles, Quebec (owned and operated by IOC) | | Sublease with the Labrador Iron Ore Royalty Corporation which has lease agreements with the Government of Newfoundland and Labrador that are due to be renewed in 2020 and 2022. | | |
Robe River Iron Associates (53%) Mesa J Mesa A West Angelas | | Pilbara region, Western Australia | | Railway and port (owned by Robe River and operated by Pilbara Iron) | | Agreements for life of mine with Government of Western Australia. | | |
| | | | |
| | 228 riotinto.com/reportingcentre2013 | | |
| | | | | | |
| | | History | | Type of mine | | Power source |
| | | |
| | | Exploration project started in 1986; construction approved 2005. Ilmenite and zirsil production started at the end of 2008. QMM intends to extract ilmenite and zirsil from heavy mineral sands over an area of about 6,000 hectares along the coast over the next 40 years. | | Mineral sand dredging | | On-site diesel generators |
| | | Production started 1977; initial interest acquired 1989. Fifth mining plant commissioned in 2000. One mining plant decommissioned in 2008. In September 2012, Rio Tinto doubled its holding in Richards Bay Minerals to 74 per cent following the acquisition of BHP Billiton’s entire interests. | | Dune sand dredging | | Contract with ESKOM |
| | | |
| | | Mining commenced 1981. Interest acquired through acquisition of North 2000. Open pit mining ended December 2012. | | Stockpile | | On-site diesel/steam power generation |
| | | Kestrel was acquired and recommissioned in 1999. Hail Creek started in 2003. Clermont Mine commenced production in 2010 and a binding sale agreement was signed in respect of this mine in October 2013. Rio Tinto completed the privatisation of Coal & Allied during 2011, which is now owned 80/20 with Mitsubishi Development, and which Rio Tinto continues to manage. Successive acquisitions of surrounding assets results in the current portfolio. Blair Athol Mine ceased operations in 2012 and a conditional sale and purchase agreement for the mine was signed in October 2013. | | Open cut and underground (Kestrel) | | State-owned grid |
| | | Interest acquired in 2011. Production began in 2012. | | Open pit | | Mozambican national grid and diesel generators |
| | | Production began in 1976. | | Open pit | | Supplied by NamPower via grid network |
| | | |
| | | Annual capacity increased to 68 million tonnes during 1990s. Yandicoogina first ore shipped in 1999 and port capacity increased. Eastern Range started 2004. | | Open pit | | Supplied through the integrated Hamersley and Robe power network operated by Pilbara Iron |
| | | Joint venture between Rio Tinto and Hancock Prospecting. Construction of Stage 1 to 22 million tonnes per annum commenced April 2006 and first production occurred November 2007. Stage 2 to 30 million tonnes per annum completed 2009. | | Open pit | | Supplied through the integrated Hamersley and Robe power network operated by Pilbara Iron |
| | | Joint venture between Rio Tinto and Hancock Prospecting. Construction of wet plant processing to 15 million tonnes per annum commenced April 2011 and first production occurred April 2013. | | Open pit | | Supplied through the integrated Hamersley and Robe power network operated by Pilbara Iron |
| | | Interest acquired in 2000 through North. Current operation began in 1962 and has processed over one billion tonnes of crude ore since. Annual capacity 22.7 million tonnes of concentrate of which 12.5 million tonnes can be pelletised. | | Open pit | | Supplied by Newfoundland Hydro |
| | | First shipment in 1972. Annual sales reached 30 million tonnes in late 1990s. Interest acquired in 2000 through North. West Angelas first ore shipped in 2002 and mine expanded in 2005. Current capacity approximately 50 million tonnes per year. | | Open pit | | Supplied through the integrated Hamersley and Robe power network operated by Pilbara Iron |
| | | | |
| | 229 riotinto.com/reportingcentre2013 | | |
Mines and production facilities continued
Group smelters and refineries
(Rio Tinto’s interest 100 per cent unless otherwise shown)
| | | | | | | | |
| Smelter/refinery | | Location | | Title/lease | | Plant type/product | | Capacity as of 31 December 2013 (based on 100% ownership) |
| Aluminium |
| | | | |
| Alma | | Alma, Quebec, Canada | | 100% freehold | | Aluminium smelter producing aluminium rod, t-foundry, molten metal, high purity, remelt | | 448,000 tonnes per year aluminium |
| Alouette(40%) | | Sept-Îles, Quebec, Canada | | 100% freehold | | Aluminium smelter producing aluminium high purity, remelt | | 597,000 tonnes per year aluminium |
| Alucam(46.7%) | | Edéa, Cameroon | | 100% freehold | | Aluminium smelter producing aluminium slab, remelt | | 100,000 tonnes per year aluminium |
| Arvida | | Saguenay, Quebec, Canada | | 100% freehold | | Aluminium smelter producing aluminium billet, molten metal, remelt | | 176,000 tonnes per year aluminium |
| Arvida AP60 | | Saguenay, Quebec, Canada | | 100% freehold | | Aluminium smelter producing aluminium high purity, remelt | | 60,000 tonnes per year aluminium |
| Bécancour(25.1%) | | Bécancour, Quebec, Canada | | 100% freehold | | Aluminium smelter producing aluminium slab, billet, t-foundry, remelt, molten metal | | 439,000 tonnes per year aluminium |
| Bell Bay | | Bell Bay, Northern Tasmania, Australia | | 100% freehold | | Aluminium smelter producing aluminium slab, molten metal, small form and t-foundry, remelt | | 187,000 tonnes per year aluminium |
| Boyne Smelters(59.4%) | | Boyne Island, Queensland, Australia | | 100% freehold | | Aluminium smelter producing aluminium billet, EC grade, small form and t-foundry, remelt | | 563,000 tonnes per year aluminium |
| Dunkerque | | Dunkerque, France | | 100% freehold | | Aluminium smelter producing aluminium slab, small form foundry, remelt | | 264,000 tonnes per year aluminium |
| Grande-Baie | | Saguenay, Quebec, Canada | | 100% freehold | | Aluminium smelter producing aluminium slab, molten metal, high purity, remelt | | 225,000 tonnes per year aluminium |
| ISAL | | Reykjavik, Iceland | | 100% freehold | | Aluminium smelter producing aluminium slab, remelt, billet | | 200,000 tonnes per year aluminium |
| Jonquière (Vaudreuil) | | Jonquière, Quebec, Canada | | 100% freehold | | Refinery producing specialty aluminas and smelter grade aluminas | | 1,555,000 tonnes per year alumina |
| Kitimat(a) | | Kitimat, British Columbia, Canada | | 100% freehold | | Aluminium smelter producing aluminium, slab, remelt | | 187,000 tonnes per year aluminium |
| Laterrière | | Saguenay, Quebec, Canada | | 100% freehold | | Aluminium smelter producing aluminium slab, remelt, molten metal | | 245,000 tonnes per year aluminium |
| Lochaber | | Fort William, Scotland, UK | | 100% freehold | | Aluminium smelter producing aluminium slab, remelt | | 47,000 tonnes per year aluminium |
Queensland Alumina (80%) | | Gladstone, Queensland, Australia | | 73.3% freehold; 26.7% leasehold (of which more than 80% expires in 2026 and after) | | Refinery producing alumina | | 3,950,000 tonnes per year alumina |
| São Luis (Alumar) (10%) | | São Luis, Maranhão, Brazil | | 100% freehold | | Refinery producing alumina | | 3,500,000 tonnes per year alumina |
| Sohar(20%) | | Sohar, Oman | | 100% leasehold (expiring 2039) | | Aluminium smelter producing aluminium, high purity, remelt | | 372,000 tonnes per year aluminium |
| SØRAL(50%) | | Husnes, Norway | | 100% freehold | | Aluminium smelter producing aluminium billet, remelt | | 186,000 tonnes per year aluminium |
Tiwai Point (New Zealand Aluminium Smelters) (79.4%) | | Invercargill, Southland, New Zealand | | 19.6% freehold; 80.4% leasehold (expiring in 2029 and use of certain Crown land) | | Aluminium smelter producing aluminium billet, slab, small form foundry, high purity, remelt | | 350,000 tonnes per year aluminium |
| Tomago(51.6%) | | Tomago, New South Wales, Australia | | 100% freehold | | Aluminium smelter producing aluminium billet, slab, remelt | | 546,000 tonnes per year aluminium |
| Yarwun | | Gladstone, Queensland, Australia | | 97% freehold. 3% leasehold (expiring 2101 and after) | | Refinery producing alumina | | 3,400,000 tonnes per year alumina |
| | | | |
| | 230 riotinto.com/reportingcentre2013 | | |
| | | | | | | | |
| Smelter/refinery | | Location | | Title/lease | | Plant type/product | | Capacity as of 31 December 2013 (based on 100% ownership) |
| Other Aluminium |
| Gove | | Gove, Northern Territory, Australia | | 100% leasehold. All leases were renewed in 2011 for a further period of 42 years. The residue disposal area is leased from the Arnhem Land Aboriginal Land Trust. The Northern Territory government is the lessor of the balance of the leases; however, on expiry of the 42-year renewed term, the land subject of the balances of the leases will all vest to the Arnhem Land Aboriginal Land Trust. | | Refinery producing alumina | | 2,650,000 tonnes per year alumina. The Group is curtailing production at Gove during the first half of 2014 |
| Copper |
| | | | |
| Kennecott Utah Copper | | Magna, Salt Lake City, Utah, US | | 100% freehold | | Flash smelting furnace/Flash convertor furnace copper refinery | | 335,000 tonnes per year refined copper |
| Diamonds & Minerals |
| | | | |
| Boron | | California, US | | 100% freehold | | Borates refinery | | 576,000 tonnes per year boric oxide |
Rio Tinto Fer et Titane Sorel Plant | | Sorel-Tracy, Quebec, Canada | | 100% freehold | | Ilmenite smelter | | 1,300,000 tonnes per year titanium dioxide slag, 1,000,000 tonnes per year iron |
Richards Bay Minerals (74%) | | Richards Bay, South Africa | | 100% freehold | | Ilmenite smelter | | 1,050,000 tonnes per year titanium dioxide slag, 565,000 tonnes per year iron |
| Iron Ore |
| | | | |
IOC Pellet Plant (58.7%) | | Labrador City, Newfoundland and Labrador, Canada | | 100% leaseholds (expiring in 2020, 2022 and 2025 with rights of renewal for further terms of 30 years) | | Pellet induration furnaces producing multiple iron ore pellet types | | 12.5 million tonnes per year pellet |
Notes:
| (a) | Capacity as at 31 December 2013 reflects the closures of two potlines in preparation for the Kitimat modernisation project. The nameplate capacity of the Kitimat smelter remains at 282,000 tonnes per year. |
| | | | |
| | 231 riotinto.com/reportingcentre2013 | | |
Mines and production facilities continued
Information on Group power plants
(Rio Tinto’s interest 100 per cent unless otherwise shown)
| | | | | | | | |
| Power plant | | Location | | Title/lease | | Plant type/product | | Capacity as of 31 December 2013 (based on 100% ownership) |
| Aluminium |
| | | | |
Gladstone power station (42%) | | Gladstone, Queensland, Australia | | 100% freehold | | Thermal power station | | 1,680MW |
| Gove power station | | Nhulunbuy, Northern Territory, Australia | | 100% leasehold | | Heavy oil fired thermal power station | | 180MW |
| Highlands power stations | | Lochaber, Kinlochleven, UK | | 100% freehold | | Hydroelectric power | | 109MW |
| Kemano power station | | Kemano, British Columbia, Canada | | 100% freehold | | Hydroelectric power | | 896MW |
| Quebec power stations | | Saguenay, Quebec, Canada (Chute-à-Caron, Chute-à-la-Savane, Chute-des-Passes, Chute-du-Diable, Isle-Maligne, Shipshaw) | | 100% freehold (except Péribonka lease to 2058) | | Hydroelectric power | | 3,147MW |
| Yarwun alumina refinery co-generation plant | | Gladstone, Queensland, Australia | | 100% freehold | | Gas turbine and heat recovery steam generator | | 160MW |
| Weipa power stations | | Lorim Point, Andoom, Queensland, Australia | | 100% leasehold | | On-site generation (diesel) | | 36MW |
| Copper |
| | | | |
Puncakjaya Power (22.12%) | | Grasberg, Papua, Indonesia | | Lease | | Diesel power plant Thermal power plant | | 193MW |
| Kennecott Utah Copper Power Stations | | Salt Lake City, Utah, US | | 100% freehold | | Thermal power station Steam turbine running off waste heat boilers at the copper smelter Combined heat and power plant supplying steam to the copper refinery | | 175MW 31.8MW 6.2MW |
| | | | |
| | 232 riotinto.com/reportingcentre2013 | | |
| | | | | | | | |
| Power plant | | Location | | Title/lease | | Plant type/product | | Capacity as of 31 December 2013 (based on 100% ownership) |
| Diamonds & Minerals |
| | | | |
| Boron co-generation plant | | Boron, California, US | | 100% freehold | | Co-generation uses natural gas to generate steam and electricity, used to run Boron’s refining operations | | 48MW |
| Energy |
| | | | |
Energy Resources of Australia (Rio Tinto: 68.4%) | | Ranger Mine, Jabiru, Northern Territory, Australia | | Lease | | Five diesel generator sets rated at 5.1MW; 1 diesel generator rated at 1.9MW | | 27.4MW |
| Iron Ore |
| | | | |
| IOC power station | | Sept Îles, Quebec, Canada | | Statutory grant | | Hydroelectric power | | 22MW |
| Paraburdoo power station | | Paraburdoo, Western Australia, Australia | | Lease | | LM6000 PC gas fired turbines | | 153MW |
Yurralyi Maya power station (Rio Tinto: 58%)* | | Dampier, Western Australia, Australia | | Miscellaneous licence | | LM6000 PD gas fired turbines | | 220MW |
| * | Rio Tinto has a 100% share in the additional purchase of a 40MW open cycle gas turbine |
| | | | |
| | 233 riotinto.com/reportingcentre2013 | | |
Shareholder information
Organisational structure
The Rio Tinto Group consists of Rio Tinto plc, which is registered in England and Wales under company number 719885, and is listed on the London Stock Exchange, and Rio Tinto Limited, which is registered in Australia under ABN 96 004 458 404, and is listed on the Australian Securities Exchange. Rio Tinto is headquartered in London and has executive offices in Melbourne.
Rio Tinto plc has a sponsored ADR facility and the underlying shares are registered with the US Securities and Exchange Commission and are listed on the New York Stock Exchange.
Nomenclature and financial data
Rio Tinto plc and Rio Tinto Limited operate together and are referred to in this report as Rio Tinto, the Rio Tinto Group or, more simply, the Group. These collective expressions are used for convenience only, since both Companies, and the individual companies in which they directly or indirectly own investments, are separate and distinct legal entities.
“Limited”, “plc”, “Pty”, “Inc.”, “Limitada”, “L.L.C.”, “A.S.” or “SA” have generally been omitted from Group company names, except to distinguish between Rio Tinto plc and Rio Tinto Limited. Financial data in US dollars (US$) is derived from, and should be read in conjunction with, the 2013 financial statements. In general, financial data in pounds sterling (£) and Australian dollars (A$) have been translated from the consolidated financial statements and have been provided solely for convenience; exceptions arise where data can be extracted directly from source records. Certain key information has been provided in all three currencies in the 2013 financial statements.
History
Rio Tinto plc was incorporated on 30 March 1962 (then called The Rio Tinto-Zinc Corporation Limited (RTZ)) and was formed by the merger of The Rio Tinto Company and The Consolidated Zinc Corporation. The Rio Tinto Company was incorporated in 1873 to reopen ancient copper workings in Spain. The Consolidated Zinc Corporation’s origins trace back to the Australian mining industry in the early twentieth century. Operating out of Broken Hill in New South Wales, it came to prominence with the mining of silver, lead and zinc deposits and later expanded into lead and zinc smelting.
Rio Tinto Limited was incorporated on 17 December 1959 (then called The Rio Tinto Mining Company of Australia Limited) and in 1962 the Australian interests of Consolidated Zinc Corporation and the Rio Tinto Company Limited of the United Kingdom were merged to form Conzinc Riotinto of Australia Limited as a limited liability company under the laws of the State of Victoria, Australia. In 1980, Conzinc Riotinto of Australia Limited changed its name to CRA Limited.
Between 1962 and 1995, both RTZ and CRA discovered important mineral deposits, developed major mining projects and also grew through acquisition.
RTZ and CRA began operating in 1995 through a dual listed companies structure. In 1997, the RTZ Corporation became Rio Tinto plc and CRA Limited became Rio Tinto Limited, together known as the Rio Tinto Group.
In 2007, Rio Tinto completed an agreed takeover of the Canadian aluminium producer Alcan Inc.
Dual listed companies structure
In 1995, Rio Tinto shareholders approved the terms of the dual listed companies merger (the DLC structure) which was designed to place the shareholders of both Companies in substantially the same position as if they held shares in a single entity owning all of the assets of both Companies.
Following the approval of the DLC structure, both Companies entered into a DLC Merger Sharing Agreement (the Sharing Agreement) through which each Company agreed to ensure that the businesses of Rio Tinto plc and Rio Tinto Limited are managed together, to ensure that the boards of directors of each Company are the same, and to give effect to certain arrangements designed
to provide shareholders of each Company with a common economic interest in the DLC structure.
In order to achieve this third objective, the Sharing Agreement provided for the ratio of dividend, voting and capital distribution rights attached to each Rio Tinto plc share and to each Rio Tinto Limited share to be fixed in an Equalisation Ratio which has remained unchanged at 1:1. The Sharing Agreement has provided for this ratio to be revised in special circumstances where, for example, certain modifications are made to the share capital of one Company, such as rights issues, bonus issues, share splits and share consolidations, but not to the share capital of the other. Outside these specified circumstances, the Equalisation Ratio can only be altered with the approval of shareholders under the Class Rights Action approval procedure described under Voting rights. In addition, any adjustments are required to be confirmed by the Group’s external auditors.
Consistent with the creation of the DLC structure, directors of each Company seek to act in the best interests of Rio Tinto as a whole. The Class Rights Action approval procedure is intended to deal with instances where there may be a conflict of interest between the shareholders of each Company.
To ensure that the boards of both Companies are identical, resolutions to appoint or remove directors must be put to shareholders of both Companies as a joint electorate (as Joint Decisions as described under Voting rights). It is a requirement that a person can only be a director of one Company if that person is also a director of the other Company. So, for example, if a person was removed as a director of Rio Tinto plc, he or she would also cease to be a director of Rio Tinto Limited.
One consequence of the DLC merger is that Rio Tinto is subject to a wide range of laws, rules and regulatory review across multiple jurisdictions. Where these rules differ, Rio Tinto, as a Group, aims to comply with the strictest applicable level.
Dividend rights
The Sharing Agreement provides for dividends paid on Rio Tinto plc and Rio Tinto Limited shares to be equalised on a net cash basis, that is without taking into account any associated tax credits. Dividends are determined in US dollars and are then, except for ADR holders, translated and paid in sterling and Australian dollars. The Companies are also required to announce and pay their dividends and other distributions as close in time to each other as possible.
In the unlikely event that one Company did not have sufficient distributable reserves to pay the equalised dividend or the equalised capital distribution, it would be entitled to receive a top-up payment from the other Company. The top-up payment could be made as a dividend on the DLC Dividend Share, or by way of a contractual payment.
If the payment of an equalised dividend would contravene the law applicable to one of the Companies, then they may depart from the Equalisation Ratio. However, should such a departure occur, then the relevant Company will put aside reserves to be held for payment on the relevant shares at a later date.
Rio Tinto shareholders have no direct rights to enforce the dividend equalisation provisions of the Sharing Agreement.
The DLC Dividend Shares can also be utilised to provide the Group with flexibility for internal funds management by allowing dividends to be paid between the two parts of the Group. Such dividend payments are of no economic significance to the shareholders of either Company, as they will have no effect on the Group’s overall resources.
Voting rights
In principle, the Sharing Agreement provides for the shareholders of Rio Tinto plc and Rio Tinto Limited to vote as a joint electorate on all matters which affect shareholders of both Companies in similar ways. These are referred to as Joint Decisions. Such Joint Decisions include the creation of new classes of share capital, the appointment or removal of directors and auditors and the receiving of the annual financial statements. All shareholder resolutions including Joint Decisions are voted on a poll.
| | | | |
| | 234 riotinto.com/reportingcentre2013 | | |
The Sharing Agreement also provides for the protection of shareholders of each Company by requiring their separate approval for decisions that do not affect the shareholders of both Companies equally. Matters requiring this approval procedure are referred to as Class Rights Actions and are voted on a poll. For example, fundamental elements of the DLC merger cannot be changed unless approved separately by shareholders of both Companies under the Class Rights Action approval procedure.
Exceptions to these principles can arise in situations such as where legislation requires the separate approval of a decision by the appropriate majority of shareholders in one Company, and approval of the matter by shareholders of the other Company is not required.
Where a matter has been expressly categorised as either a Joint Decision or a Class Rights Action, the directors do not have the power to change that categorisation. If a matter falls within both categories, it is treated as a Class Rights Action. In addition, the directors can determine that matters not expressly listed in either category should be put to shareholders for their approval under either procedure.
To facilitate the joint voting arrangements, each Company has entered into shareholder voting agreements. Each Company has issued a Special Voting Share to a special purpose company held in trust by a common Trustee.
Rio Tinto plc has issued its Special Voting Share (RTP Special Voting Share) to RTL Shareholder SVC and Rio Tinto Limited has issued its Special Voting Share (RTL Special Voting Share) to RTP Shareholder SVC. The total number of votes cast on Joint Decisions by the shareholders of one Company are voted at the parallel meeting of the other Company. The role of these special purpose companies in achieving this is described below.
In exceptional circumstances, certain shareholders of the Companies can be excluded from voting at the respective Company’s general meetings because they have acquired shares in one Company in excess of a given threshold without making an offer for all the shares in the other Company. If this should occur, the votes cast by these excluded shareholders will be disregarded.
Following the Companies’ general meetings the overall results of the voting are announced to the stock exchanges, to the media in the UK and Australia, and published on the Rio Tinto website.
At a Rio Tinto plc shareholders’ meeting at which a Joint Decision is considered, each Rio Tinto plc share carries one vote and the holder of its Special Voting Share has one vote for each vote cast by the public shareholders of Rio Tinto Limited. The holder of the Special Voting Share is required to vote strictly, and only, in accordance with the votes cast by public shareholders for and against the equivalent resolution at the parallel Rio Tinto Limited shareholders’ meeting.
The holders of Rio Tinto Limited ordinary shares do not actually hold any voting shares in Rio Tinto plc by virtue of their holding in Rio Tinto Limited and cannot enforce the voting arrangements relating to the Special Voting Share.
At a Rio Tinto Limited shareholders’ meeting at which a Joint Decision is considered, each Rio Tinto Limited share carries one vote and the holder of its Special Voting Share will have one vote for each vote cast by the public shareholders of Rio Tinto plc in their parallel meeting. The holder of the Special Voting Share is required to vote strictly, and only, in accordance with the votes cast for and against the equivalent resolution at the parallel Rio Tinto plc shareholders’ meeting.
The holders of Rio Tinto plc ordinary shares do not actually hold any voting shares in Rio Tinto Limited by virtue of their holding in Rio Tinto plc and cannot enforce the voting arrangements relating to the Special Voting Share.
Capital distribution rights
If either of the Companies goes into liquidation, the Sharing Agreement provides for a valuation to be made of the surplus assets of both Companies. If the surplus assets available for distribution by one Company on each of the shares held by its shareholders exceed the surplus assets available for
distribution by the other Company on each of the shares held by its shareholders, then an equalising payment between the two Companies shall be made, to the extent permitted by applicable law, such that the amount available for distribution on each share held by shareholders of each Company conforms to the Equalisation Ratio. The objective is to ensure that the shareholders of both Companies have equivalent rights to the assets of the combined Group on a per share basis, taking account of the Equalisation Ratio.
The Sharing Agreement does not grant any enforceable rights to the shareholders of either Company upon liquidation of a Company.
Limitations on ownership of shares and merger obligations
The laws and regulations of the UK and Australia impose restrictions and obligations on persons who control interests in publicly listed companies in excess of defined thresholds that, under certain circumstances, include obligations to make a public offer for all of the outstanding issued shares of the relevant company. The threshold applicable to Rio Tinto plc under UK law and regulations is 30 per cent and to Rio Tinto Limited under Australian law and regulations is 20 per cent (on a standalone basis or, taking into account only Rio Tinto plc interests, on a Joint Decision basis).
As part of the DLC merger, the Articles of Association of Rio Tinto plc and the Constitution of Rio Tinto Limited were amended with the intention of extending these laws and regulations to the combined enterprise and, in particular, to ensure that a person cannot exercise control over one Company without having made offers to the public shareholders of both Companies. It is consistent with the creation of the single economic enterprise, and the equal treatment of the two sets of shareholders, that these laws and regulations should operate in this way. The Articles of Association of Rio Tinto plc and the Constitution of Rio Tinto Limited impose restrictions on any person who controls, directly or indirectly, 20 per cent or more of the votes on a Joint Decision. If, however, such a person only has an interest in either Rio Tinto Limited or Rio Tinto plc, then the restrictions will only apply if they control, directly or indirectly, 30 per cent or more of the votes at that Company’s general meetings.
If one of the thresholds specified above is breached then, subject to certain limited exceptions and notification by the relevant Company, such persons may not attend or vote at general meetings of the relevant Company, may not receive dividends or other distributions from the relevant Company, and may be divested of their interest by the directors of the relevant Company. These restrictions continue to apply until such persons have either made a public offer for all of the publicly held shares of the other Company, or have reduced their controlling interest below the thresholds specified, or have acquired through a permitted means at least 50 per cent of the publicly held shares of each Company.
These provisions are designed to ensure that offers for the publicly held shares of both Companies would be required to avoid the restrictions set out above, even if the interests which breach the thresholds are only held in one of the Companies. The directors do not have the discretion to exempt a person from the operation of these rules.
Under the Sharing Agreement, the Companies agree to co-operate to enforce the restrictions contained in their Articles of Association and Constitution.
Guarantees
In 1995, each Company entered into a Deed Poll Guarantee in favour of creditors of the other Company. Pursuant to the Deed Poll Guarantees, each Company guaranteed the contractual obligations of the other Company and the obligations of other persons which are guaranteed by the other Company, subject to certain limited exceptions. Beneficiaries under the Deed Poll Guarantees may make demands upon the guarantor thereunder without first having recourse to the Company or persons whose obligations are being guaranteed. The obligations of the guarantor under each Deed Poll Guarantee expire upon termination of the Sharing Agreement and under other limited circumstances, but only in respect of obligations arising after such termination and, in the case of other limited circumstances, the publication and expiry of

| | | | |
| | 235 riotinto.com/reportingcentre2013 | | |
Shareholder information continued
due notice. The shareholders of the Companies cannot enforce the provisions of the Deed Poll Guarantees.
Markets
Rio Tinto plc
The principal market for Rio Tinto plc shares is the London Stock Exchange with the shares trading through the Stock Exchange Electronic Trading Service (SETS) system.
Rio Tinto plc shares are also listed on NYSE Euronext Brussels and its American depositary receipts are listed on the New York Stock Exchange. As at 17 February 2014, there were 45,231 holders of record of Rio Tinto plc’s shares. Of these holders, 396 had registered addresses in the US and held a total of 479,526 Rio Tinto plc shares, representing 0.03 per cent of the total number of Rio Tinto plc shares issued and outstanding as at such date. In addition, 106,501,038 Rio Tinto plc shares were registered in the name of a custodian
account in London which represented 7.47 per cent of Rio Tinto plc shares issued and outstanding. These shares were represented by 106,501,038 Rio Tinto plc ADRs held of record by 400 ADR holders. In addition, certain accounts of record with registered addresses other than in the US hold shares, in whole or in part, beneficially for US persons.
Rio Tinto Limited
Rio Tinto Limited shares are listed on the Australian Securities Exchange (ASX). The ASX is the principal trading market for Rio Tinto Limited shares. The ASX is a national stock exchange with an automated trading system.
As at 17 February 2014, there were 206,768 holders of record of Rio Tinto Limited shares. Of these holders, 314 had registered addresses in the US, representing approximately 0.043 per cent of the total number of Rio Tinto Limited shares issued and outstanding as of such date. In addition, nominee accounts of record with registered addresses other than in the US may hold Rio Tinto Limited shares, in whole or in part, beneficially for US persons.
Fees and charges payable by a holder of American Depositary Shares (ADSs)
| | | | |
| Category | | Depositary actions | | Associated fee |
Depositing or substituting the underlying shares | | Issuance of ADSs against the deposit of shares, including deposits and issuance in respect of: – Share distributions, stock split, rights, merger – Exchange of securities or other transactions – Other events or distributions affecting the ADSs or the deposited securities | | US$5.00 per 100 ADSs (or portion thereof) evidenced by the new ADSs delivered |
| Selling or exercising rights | | Distribution or sale of securities, the fee being in an amount equal to the fee for the execution and delivery of ADSs which would have been charged as a result of the deposit of such securities | | US$5.00 for each 100 ADSs (or portion thereof) |
| Withdrawing an underlying share | | Acceptance of ADSs surrendered for withdrawal of deposited securities | | US$5.00 for each 100 ADSs (or portion thereof) evidenced by the ADSs surrendered |
Transferring, splitting or grouping receipts | | Transfers, combining or grouping of depositary receipts | | US$2.50 per ADS |
General depositary services, particularly those charged on an annual basis | | – Other services performed by the depositary in administering the ADRs – Provide information about the depositary’s right, if any, to collect fees and charges by offsetting them against dividends received and deposited securities | | US$0.02 per ADS (or portion thereof) not more than once each calendar year and payable at the sole discretion of the depositary by billing holders or deducting such charge from one or more cash dividends or other cash distributions |
| Expenses of the depositary | | Expenses incurred on behalf of holders in connection with: – Compliance with foreign exchange control regulations or any law or regulation relating to foreign investment – The depositary’s or its custodian’s compliance with applicable law, rule or regulation – Stock transfer or other taxes and other governmental charges – Cable, telex, facsimile and electronic transmission/delivery – Expenses of the depositary in connection with the conversion of foreign currency into US dollars (which are paid out of such foreign currency) – Any other charge payable by the depositary or its agents | | Expenses payable at the sole discretion of the depositary by billing holders or by deducting charges from one or more cash dividends or other cash distributions |
| | | | |
| | 236 riotinto.com/reportingcentre2013 | | |
American depositary receipts (ADRs)
Rio Tinto plc has a sponsored ADR facility with JPMorgan Chase Bank NA (JPMorgan) under a Deposit Agreement, dated 13 July 1988, as amended on 11 June 1990, as further amended and restated on 15 February 1999, 18 February 2005 (when JPMorgan became Rio Tinto plc’s depositary) and on 29 April 2010. The ADRs evidence Rio Tinto plc American Depositary Shares (ADSs), each representing one ordinary share. The shares are registered with the US Securities and Exchange Commission (SEC), are listed on the NYSE and are traded under the symbol RIO.
Fees and charges payable by a holder of ADSs
In accordance with the terms of the Deposit Agreement, JPMorgan may charge holders of Rio Tinto ADSs, either directly or indirectly, fees or charges up to the amounts described in the table on the previous page.
Fees and payments made by the depositary to the issuer
JPMorgan has agreed to reimburse certain company expenses related to the Rio Tinto plc ADR programme and incurred by the Group in connection with the programme. The Group received US$1.05 million in respect of expenses incurred by the Group in connection with the ADR programme for the year ended 31 December 2013. JPMorgan did not pay any amount on the Group’s behalf to third parties. JPMorgan also waived certain of its standard fees and expenses associated with the administration of the programme relating to routine programme maintenance, reporting, distribution of cash dividends, annual meeting services and report mailing services.
Under certain circumstances, including removal of JPMorgan as depositary or termination of the ADR programme by the Company, the Company is required to repay JPMorgan any amounts of administrative fees and expenses waived during the 12-month period prior to notice of removal or termination.
Share ownership
Substantial shareholders
Under the UK Disclosure and Transparency Rules and the Australian Corporations Act, any shareholder of Rio Tinto plc with voting rights of three per cent or more, or any person with voting power of five per cent or more in Rio Tinto Limited, is required to provide the Companies with notice.
The shareholders who have provided such, or an equivalent, notice are:
As of 17 February 2014
| | | | | | | | | | | | |
| Rio Tinto plc | | Date of notice | | | Number of shares | | | Percentage of issued share capital | |
| AXA S.A. | | | 29 Jan 2008 | | | | 48,493,873 | | | | 4.86 | |
| BlackRock Inc. | | | 4 Dec 2009 | | | | 127,744,871 | | | | 8.38 | |
| Shining Prospect Pte. Ltd | | | 13 Mar 2012 | | | | 182,550,329 | | | | 12.7 | �� |
| The Capital Group Companies, Inc. | | | 21 Jan 2014 | | | | 57,950,440 | | | | 4.10 | |
| | | |
| Rio Tinto Limited | | | | | | | | | |
| Shining Prospect Pte. Ltd (a) | | | 4 Feb 2008 | | | | – | | | | – | |
| (a) | Shining Prospect Pte. Ltd, a Singapore-based entity owned by Chinalco (Aluminium Corporation of China) holds 182,550,329 Rio Tinto plc shares. Through the operation of the Australian Corporations Act as modified, this interest gives these entities and their associates voting power of 9.8 per cent in the Rio Tinto Group on a Joint Decision matter, making them substantial shareholders of Rio Tinto Limited, as well as of Rio Tinto plc. |
As of 19 February 2013
| | | | | | | | | | | | |
| Rio Tinto plc | | Date of notice | | | Number of shares | | | Percentage of
issued share capital | |
| The Capital Group Companies, Inc | | | 13 Jun 2006 | | | | 41,031,494 | | | | 3.90 | |
| AXA S.A. | | | 29 Jan 2008 | | | | 48,493,873 | | | | 4.86 | |
| Capital Research and Management Company | | | 2 Jul 2009 | | | | 75,461,183 | | | | 4.95 | |
| BlackRock Inc. | | | 4 Dec 2009 | | | | 127,744,871 | | | | 8.38 | |
| Shining Prospect Pte. Ltd | | | 13 Mar 2012 | | | | 182,550,329 | | | | 12.7 | |
| | | |
| Rio Tinto Limited | | | | | | | | | |
| BlackRock Group | | | 1 Feb 2013 | | | | 21,861,589 | | | | 5.02 | |
| Shining Prospect Pte. Ltd(a) | | | 4 Feb 2008 | | | | – | | | | – | |
| (a) | Shining Prospect Pte. Ltd, a Singapore-based entity owned by Chinalco (Aluminum Corporation of China) held 182,550,329 Rio Tinto plc shares. Through the operation of Australian Corporations Act as modified, this interest gives these entities and their associates voting power of 9.8 per cent in the Rio Tinto Group on a Joint Decision matter, making them substantial shareholders of Rio Tinto Limited, as well as of Rio Tinto plc. |
As of 20 February 2012
| | | | | | | | | | | | |
| Rio Tinto plc | | | Date of notice | | |
| Number
of shares |
| |
| Percentage of
issued share
capital |
|
| The Capital Group Companies, Inc | | | 13 Jun 2006 | | | | 41,031,494 | | | | 3.90 | |
| Capital Research and Management Company | | | 16 Jul 2009 | | | | 75,461,183 | | | | 4.95 | |
| AXA S.A. | | | 29 Jan 2008 | | | | 48,493,873 | | | | 4.86 | |
| Shining Prospect Pte. Ltd | | | 2 Feb 2008 | | | | 119,705,134 | | | | 12.00 | |
| BlackRock Inc. | | | 1 Dec 2009 | | | | 127,744,871 | | | | 8.38 | |
| Legal & General plc | | | 1 Oct 2010 | | | | 60,698,133 | | | | 3.97 | |
| | | |
| Rio Tinto Limited | | | | | | | | | |
| Shining Prospect Pte. Ltd (a) | | | 4 Feb 2008 | | | | – | | | | – | |
| BlackRock Investment Management (Australia) Limited | | | 8 Nov 2010 | | | | 25,357,003 | | | | 5.81 | |
| (a) | Shining Prospect Pte. Ltd, a Singapore based entity owned by Chinalco (Aluminum Corporation of China) acquired 119,705,134 Rio Tinto plc shares on 1 February 2008. Through the operation of Australian Corporations Act as modified, this gave these entities and their associates voting power of 9.3 per cent in the Rio Tinto Group on a joint decision matter, making them substantial shareholders of Rio Tinto Limited, as well as of Rio Tinto plc. Further to the Rio Tinto plc rights issue in 2009, Shining Prospect Pte. Ltd increased its holding to 182,550,329 shares. |
As far as is known, Rio Tinto plc and Rio Tinto Limited are not directly or indirectly owned or controlled by another corporation or by any government or natural person. Rio Tinto is not aware of any arrangement which may result in a change in control. No shareholder possesses voting rights that differ from those attaching to Rio Tinto plc’s and Rio Tinto Limited’s securities.
As of 17 February 2014, the total amount of the Group’s voting securities owned by the directors in Rio Tinto plc was 94,081 ordinary shares of 10p each or ADRs and in Rio Tinto Limited was 107,586 ordinary shares, in aggregate representing less than one per cent of the Group’s total number of shares in issue.
Analysis of ordinary shareholders
| | | | | | | | | | | | | | | | | | | | | | | | | | | | | | | | | | |
| | | Rio Tinto plc | | | | | Rio Tinto Limited | |
| As at 17 February 2014 | | No. of accounts | | | % | | | Shares | | | % | | | | | No. of accounts | | | % | | | Shares | | | % | |
1 to 1,000 shares | | | 34,307 | | | | 75.85 | | | | 11,121,342 | | | | 0.79 | | | | | | 173,818 | | | | 84.06 | | | | 51,625,736 | | | | 11.85 | |
1,001 to 5,000 shares | | | 8,515 | | | | 18.83 | | | | 16,893,956 | | | | 1.2 0 | | | | | | 29,538 | | | | 14.29 | | | | 58,484,856 | | | | 13.42 | |
5,001 to 10,000 shares | | | 790 | | | | 1.75 | | | | 5,473,944 | | | | 0.39 | | | | | | 2,288 | | | | 1.11 | | | | 15,844,505 | | | | 3.64 | |
10,001 to 25,000 shares | | | 450 | | | | 0.99 | | | | 6,988,461 | | | | 0.49 | | | | | | 851 | | | | 0.41 | | | | 12,414,627 | | | | 2.85 | |
25,001 to 125,000 shares | | | 563 | | | | 1.24 | | | | 33,848,104 | | | | 2.39 | | | | | | 216 | | | | 0.10 | | | | 9,951,677 | | | | 2.28 | |
125,001 to 250,000 shares | | | 195 | | | | 0.43 | | | | 35,398,021 | | | | 2.50 | | | | | | 15 | | | | 0.01 | | | | 2,639,435 | | | | 0.61 | |
250,001 to 1,250,000 shares | | | 279 | | | | 0.62 | | | | 160,443,609 | | | | 11.35 | | | | | | 29 | | | | 0.01 | | | | 13,659,893 | | | | 3.13 | |
1,250,001 to 2,500,000 shares | | | 54 | | | | 0.12 | | | | 94,126,086 | | | | 6.67 | | | | | | 1 | | | | 0.00 | | | | 1,661,239 | | | | 0.38 | |
2,500,001 shares and over(a) | | | 77 | | | | 0.17 | | | | 1,048,572,919 | (b) | | | 74.22 | | | | | | 12 | | | | 0.01 | | | | 269,476,752 | | | | 61.84 | |
| | | | | | | | | | | | 1,425,376,675 | (c) | | | 100.00 | | | | | | | | | | | | | | 435,758,720 | (d) | | | 100.00 | |
| | | | | | | | | | | | | | | | | | | | | | | | | | | | | | | | | | | |
Number of holdings less than marketable | | | | | | | | | | | | | | | | | | | | | 3,716 | | | | | | | | | | | | | |
parcel of A$500 | | | | | | | | | | | | | | | | | | | | | | | | | | | | | | | | | | |
| (a) | Excludes shares held in Treasury |
| (b) | This includes 106,501,038 shares held in the name of a nominee on the share register. The shares are listed on the NYSE in the form of American Depositary Receipts (ADRs). |
| (c) | The total issued share capital is made up of 1,412,866,442 publicly held shares; 12,510,233 shares held in Treasury. |
| (d) | Publicly held shares in Rio Tinto Limited. |
| | | | |
| | 237 riotinto.com/reportingcentre2013 | | |
Shareholder information continued
Twenty largest registered shareholders
In accordance with the ASX Listing Rules, below are the names of the 20 largest registered holders of Rio Tinto Limited shares and the number of shares and the percentage of issued capital each holds as at 17 February 2014:
| | | | | | | | |
| Rio Tinto Limited | | Number of
shares | | | Percentage of
issued share capital | |
HSBC Custody Nominees (Australia) Limited | | | 90,282,676 | | | | 20.72 | |
J. P. Morgan Nominees Australia Limited | | | 61,272,310 | | | | 14.06 | |
National Nominees Limited | | | 51,486,464 | | | | 11.82 | |
Citicorp Nominees Pty Limited | | | 22,456,989 | | | | 5.15 | |
BNP Paribas Noms Pty Ltd (DRP) | | | 11,589,957 | | | | 2.66 | |
J.P. Morgan Nominees Australia Limited (Cash Income A/C) | | | 10,701,504 | | | | 2.46 | |
Citicorp Nominees Pty Limited (Colonial First State Inv A/C) | | | 6,462,290 | | | | 1.48 | |
Australian Foundation Investment Company Limited | | | 3,651,753 | | | | 0.84 | |
AMP Life Limited | | | 3,238,223 | | | | 0.74 | |
HSBC Custody Nominees (Australia) Limited (NT-Comnwlth Super Corp A/C) | | | 2,955,099 | | | | 0.68 | |
UBS Wealth Management Australia Nominees Pty Ltd | | | 2,868,748 | | | | 0.66 | |
Argo Investments Limited | | | 2,510,739 | | | | 0.58 | |
BNP Paribas Nominees Pty Ltd (Agency Lending DRP A/C) | | | 1,661,239 | | | | 0.38 | |
RBC Investor Services Australia Nominees Pty Limited (PI Pooled A/C) | | | 1,115,949 | | | | 0.26 | |
Navigator Australia Ltd (MLC Investment Sett A/C) | | | 932,896 | | | | 0.21 | |
Australian United Investment Company Limited | | | 849,918 | | | | 0.20 | |
RBC Investor Services Australia Nominees Pty Limited (MBA A/C) | | | 629,439 | | | | 0.14 | |
UBS Nominees Pty Ltd | | | 617,500 | | | | 0.14 | |
Custodial Services Limited (Beneficiaries Holding A/C) | | | 609,094 | | | | 0.14 | |
Nulis Nominees (Australia) Limited (Navigator Mast Plan Sett A/C) | | | 570,333 | | | | 0.13 | |
| | | | 276,463,120 | | | | 63.44 | |
Large registered shareholders are nominees who hold securities on behalf of beneficial shareholders.
Share price information
The following table shows share prices for the period indicated, the reported high and low middle market quotations, which represent an average of bid and asked prices, for Rio Tinto plc’s shares on the London Stock Exchange based on the Daily Official List, the highest and lowest sale prices of the Rio Tinto plc ADRs as reported on the NYSE composite tape and the high and low closing sale prices of Rio Tinto Limited shares based upon information provided by the ASX. There is no established trading market in the US for Rio Tinto Limited’s shares.
| | | | | | | | | | | | | | | | | | | | | | | | | | | | | | |
| | | Pence per Rio Tinto plc share | | | | | | US$ per Rio Tinto plc ADS(a) | | | | | | A$ per Rio Tinto Limited share | |
| | | High | | | Low | | | | | High | | | Low | | | | | High | | | Low | |
2009(b) | | | 3,420 | | | | 1,140 | | | | | | 55.93 | | | | 19.63 | | | | | | 74.89 | | | | 29.38 | |
2010 | | | 4,584 | | | | 2,812 | | | | | | 72.65 | | | | 39.30 | | | | | | 87.94 | | | | 61.70 | |
2011 | | | 4,712 | | | | 2,713 | | | | | | 76.67 | | | | 40.50 | | | | | | 88.68 | | | | 59.00 | |
2012 | | | 3,988 | | | | 2,716 | | | | | | 62.70 | | | | 42.32 | | | | | | 72.30 | | | | 48.63 | |
2013 | | | 3,757 | | | | 2,583 | | | | | | 59.92 | | | | 39.90 | | | | | | 72.07 | | | | 50.24 | |
Aug 2013 | | | 3,263 | | | | 2,913 | | | | | | 50.14 | | | | 45.11 | | | | | | 62.62 | | | | 57.94 | |
Sep 2013 | | | 3,218 | | | | 3,023 | | | | | | 51.89 | | | | 45.11 | | | | | | 64.2 | | | | 59.22 | |
Oct 2013 | | | 3,262 | | | | 2,958 | | | | | | 52.87 | | | | 47.49 | | | | | | 64.38 | | | | 60.00 | |
Nov 2013 | | | 3,331 | | | | 3,110 | | | | | | 53.52 | | | | 50.18 | | | | | | 66.06 | | | | 63.54 | |
Dec 2013 | | | 3,410 | | | | 3,180 | | | | | | 56.43 | | | | 51.78 | | | | | | 68.18 | | | | 64.91 | |
Jan 2014 | | | 3,410 | | | | 3,115 | | | | | | 56.43 | | | | 51.18 | | | | | | 68.71 | | | | 63.35 | |
2012 | | – First quarter | | | 3,988 | | | | 3,331 | | | | | | 62.70 | | | | 51.24 | | | | | | 72.30 | | | | 61.40 | |
| | – Second quarter | | | 3,556 | | | | 2,772 | | | | | | 57.25 | | | | 42.32 | | | | | | 66.79 | | | | 52.90 | |
| | – Third quarter | | | 3,282 | | | | 2,716 | | | | | | 53.18 | | | | 43.00 | | | | | | 58.97 | | | | 48.63 | |
| | – Fourth quarter | | | 3,568 | | | | 2,915 | | | | | | 58.22 | | | | 46.81 | | | | | | 66.53 | | | | 53.36 | |
2013 | | – First quarter | | | 3,757 | | | | 3,070 | | | | | | 59.92 | | | | 46.68 | | | | | | 72.07 | | | | 46.68 | |
| | – Second quarter | | | 3,140 | | | | 2,582 | | | | | | 48.60 | | | | 40.34 | | | | | | 58.90 | | | | 50.24 | |
| | – Third quarter | | | 3,263 | | | | 2,636 | | | | | | 51.89 | | | | 39.90 | | | | | | 64.20 | | | | 51.50 | |
| | | – Fourth quarter | | | 3,410 | | | | 2,958 | | | | | | 56.43 | | | | 47.49 | | | | | | 68.18 | | | | 60.00 | |
| (a) | On 12 April 2010, Rio Tinto announced a ratio change for the Rio Tinto plc ADR programme. With effect from 30 April 2010, one ADR represents one ordinary share of 10p in Rio Tinto plc. Prior to this date one ADR represented four ordinary shares of 10p. To effect this change ADR holders received three additional ADRs for every one ADR held as of 22 April 2010, the ADR record date. |
| (b) | None of these prices have been restated to take account of the rights issues undertaken in 2009. |
| | | | |
| | 238 riotinto.com/reportingcentre2013 | | |
Dividends
Both Companies have paid dividends on their ordinary shares every year since incorporation in 1962. The rights of Rio Tinto shareholders to receive dividends are explained under the description of the Dual listed companies structure on page 234.
Dividend policy
The aim of Rio Tinto’s progressive dividend policy is to increase the US dollar value of ordinary dividends over time. The rate of the total annual dividend, in US dollars, is determined taking into account the results for the past year and the outlook. Under Rio Tinto’s dividend policy, the interim dividend is set at one half of the total ordinary dividend for the previous year and the final ordinary dividend is expected to be at least equal to the previous interim dividend.
Dividend determination
The majority of the Group’s sales are transacted in US dollars, making this the most reliable measure of the Group’s global business performance. It is Rio Tinto’s main reporting currency and consequently the natural currency for dividend determination. Dividends determined in US dollars are translated at exchange rates prevailing two days prior to the announcement and are then declared payable in sterling by Rio Tinto plc and in Australian dollars by Rio Tinto Limited. On request, shareholders of Rio Tinto plc can elect to receive dividends in Australian dollars and shareholders of Rio Tinto Limited can elect to receive dividends in sterling. These dividend amounts are calculated by converting the declared dividend using currency exchange rates applicable five business days prior to the dividend payment date.
Shareholders who wish to receive their dividends in any other currencies should contact the Companies’ share registrars, who also offer payment services in other currencies, subject to a fee.
2013 dividends
The 2013 interim and final dividends were determined at 83.50 US cents and at 108.50 US cents per share respectively and the applicable conversion rates for the interim and final dividend were US$1.5384 and US$1.6484 to the pound sterling and US$0.89785 and US$0.90315 to the Australian dollar respectively. For those Rio Tinto plc shareholders who elected to receive their interim dividend in Australian dollars the applicable conversion rate was A$1.70816 and for Rio Tinto Limited shareholders who elected to receive their dividend in sterling the applicable conversion rate was £0.58543.
Final dividends of 65.82 pence or 120.14 Australian cents per share will be paid on 10 April 2014. For those Rio Tinto plc shareholders requesting the 2013 final dividend be paid in Australian dollars, those holders of Rio Tinto plc ADRs (each representing one share) and those Rio Tinto Limited shareholders requesting the 2013 final dividend be paid in pounds sterling, the applicable conversion rates will be announced on 3 April 2014.
The following chart sets out the amounts of interim and final dividends paid or payable on each share or ADR in respect of each financial year, but before deduction of any withholding tax.
These have been restated for the impact of the 2009 rights issues and the ADR ratio change.
| | | | | | | | | | | | | | | | | | | | |
| | | 2013 | | | 2012 | | | 2011 | | | 2010 | | | 2009 | |
Rio Tinto Group – US cents per share | |
Interim | | | 83.50 | | | | 72.50 | | | | 54.00 | | | | 45.00 | | | | – | |
Final | | | 108.50 | | | | 94.50 | | | | 91.00 | | | | 63.00 | | | | 45.00 | |
Total | | | 192.00 | | | | 167.00 | | | | 145.00 | | | | 108.00 | | | | 45.00 | |
Rio Tinto plc – UK pence per share | |
Interim | | | 54.28 | | | | 46.43 | | | | 33.14 | | | | 28.21 | | | | – | |
Final | | | 65.82 | | | | 60.34 | | | | 57.33 | | | | 39.14 | | | | 28.84 | |
Total | | | 120.10 | | | | 106.77 | | | | 90.47 | | | | 67.35 | | | | 28.84 | |
Rio Tinto Limited – Australian cents per share | |
Interim | | | 93.00 | | | | 68.51 | | | | 49.81 | | | | 49.27 | | | | – | |
Final | | | 120.14 | | | | 91.67 | | | | 84.20 | | | | 61.94 | | | | 51.56 | |
Total | | | 213.14 | | | | 160.18 | | | | 134.01 | | | | 111.21 | | | | 51.56 | |
Rio Tinto plc – US cents per ADR | |
Interim | | | 84.62 | | | | 73.99 | | | | 53.55 | | | | 43.45 | | | | – | |
Final(a) | | | – | | | | 91.60 | | | | 91.56 | | | | 63.25 | | | | 45.00 | |
Total(a) | | | – | | | | 165.59 | | | | 145.11 | | | | 106.70 | | | | 45.00 | |
| (a) | The final dividend payable to holders of ADRs for the 2013 financial year will be announced on 3 April 2014 when the GBP:USD currency conversion rate is determined. The ADR dividend for 2010 is restated from the 2010 Annual report and reflects the dividend after currency conversion. |
Dividend reinvestment plan (DRP)
Rio Tinto offers a DRP to registered shareholders, which provides the opportunity to use cash dividends to purchase Rio Tinto shares in the market. Due to local legislation the DRP cannot be extended to shareholders in the US, Canada and certain other countries.
Exchange rates
The following tables (below and on page 240) show, for the periods and dates indicated, certain information regarding the exchange rates for the pound sterling and Australian dollar, based on the Noon Buying Rates for pounds sterling and Australian dollars expressed in US dollars per £1.00 and per A$1.00.
Pounds sterling
| | | | | | | | | | | | | | | | |
Year ended 31
December(a) | | Period end | | | Average
rate | | | High | | | Low | |
Jan 2014 | | | 1.65 | | | | 1.64 | | | | 1.65 | | | | 1.64 | |
Dec 2013 | | | 1.63 | | | | 1.62 | | | | 1.63 | | | | 1.61 | |
Nov 2013 | | | 1.61 | | | | 1.61 | | | | 1.61 | | | | 1.61 | |
Oct 2013 | | | 1.61 | | | | 1.60 | | | | 1.61 | | | | 1.58 | |
Sep 2013 | | | 1.58 | | | | 1.56 | | | | 1.58 | | | | 1.55 | |
Aug 2013 | | | 1.55 | | | | 1.53 | | | | 1.55 | | | | 1.52 | |
2013 | | | 1.63 | | | | 1.56 | | | | 1.63 | | | | 1.51 | |
2012 | | | 1.63 | | | | 1.59 | | | | 1.63 | | | | 1.53 | |
2011 | | | 1.55 | | | | 1.60 | | | | 1.67 | | | | 1.67 | |
2010 | | | 1.56 | | | | 1.55 | | | | 1.64 | | | | 1.43 | |
2009 | | | 1.62 | | | | 1.57 | | | | 1.70 | | | | 1.35 | |
| (a) | The Noon Buying Rate on such dates differed slightly from the rates used in the preparation of Rio Tinto’s financial statements as of such date. No representation is made that pound sterling and Australian dollar amounts have been, could have been or could be converted into dollars at the Noon Buying Rate on such dates or at any other dates. |
| | | | |
| | 239 riotinto.com/reportingcentre2013 | | |
Shareholder information continued
Australian dollars
| | | | | | | | | | | | | | | | |
| Year ended 31 December(a) | | Period
end | | | Average
rate | | | High | | | Low | |
Jan 2014 | | | 0.89 | | | | 0.89 | | | | 0.90 | | | | 0.89 | |
Dec 2013 | | | 0.90 | | | | 0.92 | | | | 0.94 | | | | 0.90 | |
Nov 2013 | | | 0.94 | | | | 0.95 | | | | 0.95 | | | | 0.94 | |
Oct 2013 | | | 0.95 | | | | 0.94 | | | | 0.95 | | | | 0.92 | |
Sep 2013 | | | 0.92 | | | | 0.91 | | | | 0.92 | | | | 0.91 | |
Aug 2013 | | | 0.91 | | | | 0.91 | | | | 0.92 | | | | 0.91 | |
2013 | | | 0.90 | | | | 0.98 | | | | 1.05 | | | | 0.90 | |
2012 | | | 1.04 | | | | 1.04 | | | | 1.08 | | | | 0.97 | |
2011 | | | 1.02 | | | | 1.03 | | | | 1.10 | | | | 0.94 | |
2010 | | | 1.02 | | | | 0.92 | | | | 1.02 | | | | 0.81 | |
2009 | | | 0.89 | | | | 0.79 | | | | 0.94 | | | | 0.62 | |
| (a) | The Noon Buying Rate on such dates differed slightly from the rates used in the preparation of Rio Tinto’s financial statements as of such date. No representation is made that pound sterling and Australian dollar amounts have been, could have been or could be converted into dollars at the Noon Buying Rate on such dates or at any other dates. |
Material contracts
Articles of Association and Constitution, and DLC Merger Sharing Agreement
As explained on pages 234 to 235, under the terms of the DLC structure the shareholders of Rio Tinto plc and of Rio Tinto Limited entered into certain contractual arrangements which are designed to place the shareholders of both Companies in substantially the same position as if they held shares in a single entity which owned all of the assets of both Companies. Please refer to the section on Guarantees on page 235 for further information. Generally, and as far as is permitted by the UK Companies Act and the Australian Corporations Act and ASX Listing Rules, this principle is reflected in the Articles of Association of Rio Tinto plc and in the Constitution of Rio Tinto Limited. The summaries below include descriptions of material rights of the shareholders of both Rio Tinto plc and Rio Tinto Limited.
Objects
At the 2009 annual general meetings, shareholders of Rio Tinto plc and Rio Tinto Limited approved amendments to the constitutional documents whereby the object clauses were removed to allow the Companies to have the widest possible scope of activities.
Directors
Under Rio Tinto plc’s Articles of Association, a director may not vote in respect of any proposal in which he, or any other person connected with him, has any material interest, other than by virtue of his interests in shares or debentures or other securities of, or otherwise in or through, the Company, except where resolutions:
| – | indemnify him or a third party in respect of obligations incurred by the director on behalf of, or for the benefit of, the Company, or in respect of obligations of the Company, for which the director has assumed responsibility under an indemnity, security or guarantee; |
| – | relate to an offer of securities in which he may be interested as a holder of securities or as an underwriter; |
| – | concern another body corporate in which the director is beneficially interested in less than one per cent of the issued shares of any class of shares of such a body corporate; |
| – | relate to an employee benefit in which the director will share equally with other employees; and |
| – | relate to liability insurance that the Company is empowered to purchase for the benefit of directors of the Company in respect of actions undertaken as directors (or officers) of the Company. |
Under Rio Tinto Limited’s Constitution, except where a director is constrained by Australian law, a director may be present at a meeting of the board while a matter in which the director has a material personal interest is being considered and may vote in respect of that matter.
The directors are empowered to exercise all the powers of the Companies to borrow money, to charge any property or business of the Companies or all, or any, of their uncalled capital and to issue debentures or give any other security for a debt, liability or obligation of the Companies or of any other person. The directors shall restrict the borrowings of Rio Tinto plc to the limitation that the aggregate amount of all moneys borrowed by the Company and its subsidiaries shall not exceed an amount equal to one and one half times the Company’s share capital plus aggregate reserves unless sanctioned by an ordinary resolution of the Company.
Directors are not required to hold any shares of either Company by way of qualification. The Remuneration Report on pages 80 and 89 provides information on shareholding policies relating to executive and non-executive directors. Please refer to the Corporate governance section (page 58) for information on appointment of directors.
Rights attaching to shares
Under English law, dividends on shares may only be paid out of profits available for distribution, as determined in accordance with generally accepted accounting principles and by the relevant law. Shareholders are entitled to receive such dividends as may be declared by the directors. The directors may also pay shareholders such interim dividends as appear to them to be justified by the financial position of the Group.
Any Rio Tinto plc dividend unclaimed after 12 years from the date the dividend was declared, or became due for payment, will be forfeited and returned to the Company. Any Rio Tinto Limited dividend unclaimed may be invested or otherwise used by the board for the benefit of the Company until claimed or otherwise disposed of according to Australian law.
Voting rights
Voting at any general meeting of shareholders on a resolution on which the holder of the Special Voting Share is entitled to vote shall be decided by a poll, and any other resolution shall be decided by a show of hands unless a poll has been duly demanded. On a show of hands, every shareholder who is present in person or by proxy or other duly authorised representative and is entitled to vote has one vote regardless of the number of shares held. The holder of the Special Voting Share is not entitled to vote on a show of hands. On a poll, every shareholder who is present in person or by proxy or other duly authorised representative and is entitled to vote has one vote for every ordinary share for which he or she is the holder and, in the case of Joint Decisions, the holder of the Special Voting Share has one vote for each vote cast by the shareholders at the parallel meeting of the other Company’s shareholders.
A poll may be demanded by any of the following:
| – | the chairman of the meeting; |
| – | at least five shareholders entitled to vote on the resolution; |
| – | any shareholder or shareholders representing in the aggregate not less than one tenth (Rio Tinto plc) or one 20th (Rio Tinto Limited) of the total voting rights of all shareholders entitled to vote on the resolution; |
| – | any shareholder or shareholders holding shares conferring a right to vote at the meeting on which there have been paid-up sums in the aggregate equal to not less than one tenth of the total sum paid up on all the shares conferring that right (Rio Tinto plc); or |
| – | the holder of the Special Voting Share. |
A proxy form will be treated as giving the proxy the authority to demand a poll, or to join others in demanding one.
The necessary quorum for a Rio Tinto plc general meeting is three members present (in person or by proxy or other duly authorised representative) and entitled to vote, and for a Rio Tinto Limited general meeting is two members present in person or by proxy or other duly authorised representative.
| | | | |
| | 240 riotinto.com/reportingcentre2013 | | |
Matters are transacted at general meetings by the proposing and passing of resolutions:
| – | ordinary resolutions, which require the affirmative vote of a majority of the votes of those persons voting at a meeting at which there is a quorum, for example the election of directors; and |
| – | special resolutions, which require the affirmative vote of not less than three-fourths of the persons voting at a meeting at which there is a quorum, for example amending the Articles of Association of Rio Tinto plc or the Constitution of Rio Tinto Limited. |
The DLC Merger Sharing Agreement further classifies resolutions as “Joint Decisions” and “Class Rights Actions” as explained under Voting rights on pages 234 and 235.
Annual general meetings must be convened with 21 days’ written notice for Rio Tinto plc and with 28 days’ notice for Rio Tinto Limited. Other meetings of Rio Tinto plc must be convened with 21 days’ written notice for the passing of a special resolution and with 14 days’ notice for any other resolution, depending on the nature of the business to be transacted. All meetings of Rio Tinto Limited require 28 days’ notice. In calculating the period of notice the days of delivery or receipt of the notice and the date of the meeting are not included. Among other things, the notice must specify the nature of the business to be transacted.
Variation of rights
If, at any time, the share capital is divided into different classes of shares, the rights attached to any class may be varied, subject to the provisions of the relevant legislation, with the consent in writing of holders of three-fourths in value of the shares of that class or upon the adoption of an extraordinary resolution passed at a separate meeting of the holders of the shares of that class. At every such separate meeting, all of the provisions of the Articles of Association and Constitution relating to proceedings at a general meeting apply, except that the quorum for Rio Tinto plc should be two or more persons who hold or represent by proxy not less than one-third in nominal value of the issued shares of the class.
Rights in a winding-up
Except as the shareholders have agreed or may otherwise agree, upon a winding-up, the balance of assets available for distribution:
| – | after the payment of all creditors including certain preferential creditors, whether statutorily preferred creditors or normal creditors; and |
| – | subject to any special rights attaching to any class of shares |
is to be distributed among the holders of ordinary shares according to the amounts paid-up on the shares held by them. This distribution is generally to be made in cash. A liquidator may, however, upon the adoption of a special resolution of the shareholders, divide among the shareholders the whole or any part of the assets in kind.
The DLC Merger Sharing Agreement further sets out the rights of ordinary shareholders in a liquidation as explained on page 235.
Facility agreement
Details of the Group’s US$7.5 billion multi-currency committed revolving credit facilities are set out in note 30 to the 2013 financial statements.
Exchange controls and foreign investment
Rio Tinto plc
There are no UK foreign exchange controls or other UK restrictions on the import or export of capital or on the payment of dividends to non-resident holders of Rio Tinto plc shares or that materially affect the conduct of Rio Tinto plc’s operations. It should be noted, however, that various sanctions, laws, regulations or conventions may restrict the import or export of capital by, or the payment of dividends to, non-resident holders of Rio Tinto plc shares. There are no restrictions under Rio Tinto plc’s Articles of Association or under UK law that limit the right of non-resident owners to hold or vote Rio Tinto plc shares.
Rio Tinto Limited
Under current Australian legislation, no permission is required for the movement of funds into or out of Australia, except that there is a prohibition on, or in some cases the specific prior approval of the Department of Foreign Affairs and Trade or Minister for Foreign Affairs must be obtained for, certain payments or other dealings connected with parties identified with terrorism, or to whom United Nations or autonomous Australian sanctions apply.
Rio Tinto Limited may be required to deduct withholding tax from foreign remittances of dividends, to the extent that they are unfranked, and from payments of interest.
Acquisitions of interests in shares, voting power or certain other equity instruments in Australian companies by foreign interests are subject to review and approval by the Treasurer of the Commonwealth of Australia under the Foreign Acquisitions and Takeovers Act 1975 (the Takeovers Act). The Takeovers Act applies to acquisitions of 15 per cent or more, by several foreign persons (and any associates) of 40 per cent or more of the actual or potential shares of, or voting power in, an Australian company, and to other transaction that results in such persons controlling such interests. The Takeovers Act also applies to direct investments by foreign government investors, including acquisition of interests of ten per cent or more. Persons who are proposing such acquisitions or transactions are required to notify the Treasurer of their intention. The Treasurer has the power to order divestment in cases where such acquisitions or transactions have already occurred. The Takeovers Act does not affect the rights of owners whose interests are held in compliance with the legislation.
Limitations on voting and shareholding
Except for the provisions of the Takeovers Act 1975 there are no limitations imposed by law, Rio Tinto plc’s Articles of Association or Rio Tinto Limited’s Constitution, on the rights of non-residents or foreign persons to hold or vote the Group’s ordinary shares or ADSs that would not apply generally to all shareholders.
Taxation
The following information is provided to meet the reporting obligations of the Annual report on Form 20-F. This is not tax advice and you should not rely on it as such. Rio Tinto accepts no liability for any such reliance.
UK resident individuals’ shareholdings in Rio Tinto plc
Taxation of dividends
Dividends carry a tax credit equal to one-ninth of the dividend. Individuals who are liable to income tax at the basic rate will have no further tax to pay. Higher rate tax payers are liable to tax on UK dividends at 32.5 per cent, which after taking account of the tax credit produces an effective tax liability of 25 per cent of the dividend received. Additional rate tax payers are liable to tax on UK dividends at 42.5 per cent until 5 April 2013 and 37.5 per cent thereafter, which after taking account of the tax credit produces an effective tax liability of 36.1 per cent of any dividend received up to 5 April 2013 and 30.5 per cent thereafter.
Dividend reinvestment plan (DRP)
The taxation effect of participation in the DRP will depend on individual circumstances. Shareholders will generally be liable to tax on dividends reinvested in the DRP on the same basis as if they had received the cash and arranged the investment. The dividend should, therefore, be included in the annual tax return.
The shares acquired should be added to shareholdings at the date and at the net cost shown on the share purchase advice. The actual cost of the shares for Rio Tinto plc shareholders, including the stamp duty/stamp duty reserve tax and broker’s commission, will form the base cost for capital gains tax purposes.
Capital gains tax
Shareholders who have any queries on capital gains tax issues are advised to consult their financial adviser.
| | | | |
| | 241 riotinto.com/reportingcentre2013 | | |
Shareholder information continued
Details of relevant events since 31 March 1982 and adjusted values for Rio Tinto plc securities as at that date are available on the Group’s website.
Australian resident individuals’ shareholdings in Rio Tinto Limited
Taxation of dividends
The basis of the Australian dividend imputation system is that when Australian resident shareholders receive dividends from Rio Tinto Limited they may be entitled to a credit for the Australian tax paid by the Group in respect of that income, depending on the tax status of the shareholder.
The application of the system results in the Australian tax paid by the Group being allocated to shareholders by way of franking credits attaching to the dividends they receive. Such dividends are known as franked dividends. A dividend may be partly or fully franked. The current Rio Tinto Limited dividend is fully franked and the franking credits attached to the dividend are shown in the distribution statement provided to shareholders.
The extent to which a company can frank a dividend depends on the credit balance in its franking account. Credits to this account can arise in a number of ways, including when a company pays company tax or receives a franked dividend from another company. The dividend is required to be included in a resident individual shareholder’s assessable income. In addition, an amount equal to the franking credit attached to the franked dividend is also included in the assessable income of the resident individual, who may then be entitled to a rebate of tax equal to the franking credit amount included in their income. Should the franking credits exceed the tax due, the excess is refunded to the resident individual.
The effect of the dividend imputation system on non-resident shareholders is that, to the extent that the dividend is franked, no Australian tax will be payable and there is an exemption from dividend withholding tax.
A withholding tax is normally levied at the rate of 15 per cent when unfranked dividends are paid to non-resident shareholders residing in a country with which Australia has a taxation treaty. Most Western countries have a taxation treaty with Australia. A rate of 30 per cent applies to countries where there is no taxation treaty.
Since 1988, all dividends paid by Rio Tinto Limited have been fully franked. It is the Group’s policy to pay fully franked dividends whenever possible. The boards expect Rio Tinto Limited to be able to pay fully franked dividends for the foreseeable future.
Dividend reinvestment plan
Shareholders will generally be liable for tax on dividends reinvested in the DRP on the same basis as if they had received the cash and arranged the investment. The dividend should therefore be included in the annual tax return as assessable income.
The shares acquired should be added to the shareholding at the date of acquisition at the actual cost of the shares, which is the amount of the dividend applied by the shareholder to acquire shares and any incidental costs associated with the acquisition will form part of the cost base or reduced cost base of the shares for capital gains tax purposes.
Capital gains tax
The Australian capital gains tax legislation is complex. If shareholders have acquired shares after 19 September 1985 they may be subject to capital gains tax on the disposal of those shares.
Generally, disposal of shares held on capital account would give rise to a capital gain or loss. A capital gain arises when the proceeds on disposal are greater than the cost base of shares. A capital loss arises when the proceeds on sale are less than the cost base or reduced cost base. Where a capital gain arises on shares held for at least 12 months, individual, trust and superannuation fund shareholders may be eligible for a capital gains tax discount.
Shareholders are advised to seek the advice of an independent taxation consultant on any possible capital gains tax exposure.
US residents
The following is a summary of the principal UK tax, Australian tax and US Federal income tax consequences of the ownership of Rio Tinto plc ADSs, Rio Tinto plc shares and Rio Tinto Limited shares, “the Group’s ADSs and shares”, by a US holder as defined below. It is not intended to be a comprehensive description of all the tax considerations that are relevant to all classes of taxpayer. Future changes in legislation may affect the tax consequences of the ownership of the Group’s ADSs and shares.
It is based in part on representations by the Group’s depositary bank as depositary for the ADRs evidencing the ADSs and assumes that each obligation in the deposit agreements will be performed in accordance with its terms.
You are a US holder if you are a beneficial owner of the Group’s ADSs and shares and you are: a citizen or resident of the US; a domestic corporation; an estate whose income is subject to US federal income tax regardless of its source; or a trust if a US court can exercise primary supervision over the trust’s administration and one or more US persons are authorised to control all substantial decisions of the trust.
This section applies to US holders only if shares or ADSs are held as capital assets for tax purposes. This section does not apply to shareholders who are members of a special class of holders subject to special rules, including a dealer in securities, a trader in securities who elects to use a mark-to-market method of accounting for securities holdings, a tax exempt organisation, a life insurance company, a person liable for alternative minimum tax, a person that actually or constructively owns ten per cent or more of Rio Tinto’s voting stock, a person that holds shares or ADSs as part of a straddle or a hedging or conversion transaction, or a person whose functional currency is not the US dollar.
This section is based on the US Internal Revenue Code of 1986, as amended (the Code), its legislative history, existing and proposed regulations, published rulings and court decisions, and on the convention between the US and UK, and the convention between the US and Australia which may affect the tax consequences of the ownership of the Group’s ADSs and shares. These laws and conventions are subject to change, possibly on a retroactive basis.
For the purposes of the Conventions and of the Code, US holders of ADSs are treated as the owners of the underlying shares.
The summary describes the treatment applicable under the conventions in force at the date of this report.
UK taxation of shareholdings in Rio Tinto plc
Taxation of dividends
US holders are not liable to UK withholding tax on dividends paid by Rio Tinto plc. Dividends carry a tax credit equal to one-ninth of the net dividend, or ten per cent of the net dividend plus the tax credit. The tax credit is not repayable to US holders.
Capital gains
A US holder will not normally be liable to UK tax on capital gains realised on the disposition of Rio Tinto plc ADSs or shares unless the holder carries on a trade, profession or vocation in the UK through a permanent establishment in the UK and the ADSs or shares have been used for the purposes of the trade, profession or vocation or are acquired, held or used for the purposes of such a permanent establishment.
Inheritance tax
Under the UK/US Estate Tax Treaty, a US holder, who is domiciled in the US and is not a national of the UK, will not be subject to UK inheritance tax upon the holder’s death or on a transfer during the holder’s lifetime, unless the ADSs and shares form part of the business property of a permanent establishment in the UK or pertain to a fixed base situated in the UK used in the performance of independent personal services. In the exceptional case where ADSs or shares are subject both to UK inheritance tax and to US Federal gift or estate tax, the UK Estate Tax Treaty generally provides for tax payments to be relieved in accordance with the priority rules set out in the Treaty.
| | | | |
| | 242 riotinto.com/reportingcentre2013 | | |
Stamp duty and stamp duty reserve tax
Transfers of Rio Tinto plc ADSs will not be subject to UK stamp duty provided that the transfer instrument is not executed in, and at all times remains outside, the UK. Electronic “paperless” purchases of Rio Tinto plc shares are subject to stamp duty reserve tax (SDRT) at a rate of 0.5 per cent (rounded to the nearest penny). Purchases of Rio Tinto plc shares using a stock transfer form are subject to Stamp Duty at a rate of 0.5 per cent on transactions over £1,000 (rounded up to the nearest £5). Conversions of Rio Tinto plc shares into Rio Tinto plc ADSs will be subject to additional Stamp Duty or SDRT at a rate of 1.5 per cent (rounded to the nearest penny) on all transfers to the depositary or its nominee.
Australian taxation of shareholdings in Rio Tinto Limited
Taxation of dividends
US holders are not normally liable to Australian withholding tax on dividends paid by Rio Tinto Limited because such dividends are normally fully franked under the Australian dividend imputation system, meaning that they are paid out of income that has borne Australian income tax. Any unfranked dividends would suffer Australian withholding tax which under the Australian income tax convention is limited to 15 per cent of the gross dividend.
Capital gains
US holders are not normally subject to any Australian tax on the disposal of Rio Tinto Limited ADSs or shares unless they have been used in carrying on a trade or business wholly or partly through a permanent establishment in Australia, or the gain is in the nature of income sourced in Australia.
Gift, estate and inheritance tax
Australia does not impose any gift, estate or inheritance taxes in relation to gifts of shares or upon the death of a shareholder.
Stamp duty
An issue or transfer of Rio Tinto Limited shares does not require the payment of Australian stamp duty.
US federal income tax
In general, taking into account the earlier assumptions that each obligation of the Deposit Agreement and any related agreement will be performed according to its terms, for US federal income tax purposes, if you hold ADRs evidencing ADSs, you will be treated as the owner of the shares represented by those ADRs. Exchanges of shares for ADRs, and ADRs for shares, generally will not be subject to US federal income tax.
Taxation of dividends
Under the US federal income tax laws, and subject to the Passive Foreign Investment Company (PFIC) Rules discussed below, if you are a US holder, the gross amount of any dividend the Group pays out of its current or accumulated earnings and profits (as determined for US federal income tax purposes) is subject to US federal income taxation.
If you are a non-corporate US holder, dividends paid to you in taxable years beginning after 31 December 2012 will be taxed at ordinary income rates on dividends.
You must include any Australian tax withheld from the dividend payment in this gross amount even though you do not in fact receive it. The dividend is taxable to you when you, in the case of shares, or the depositary, in the case of ADSs, receive the dividend, actually or constructively. The dividend will not be eligible for the dividends-received deduction generally allowed to US corporations in respect of dividends received from other US corporations. The amount of the dividend distribution that you must include in your income as a US holder will be the US dollar value of the non-US dollar payments made, determined at the spot UK pound/US dollar rate (in the case of Rio Tinto plc) or the spot Australian dollar/US dollar rate (in the case of Rio Tinto Limited) on the date the dividend distribution is includible in your income, regardless of whether the payment is in fact converted into US dollars. Generally, any gain or loss resulting from currency exchange fluctuations during the period from the date you include the dividend payment in income to the date you convert the payment into US dollars will be treated as ordinary income or loss and will not
be eligible for the special tax rate applicable to qualified dividend income. The gain or loss generally will be income or loss from sources within the US for foreign tax credit limitation purposes. Distributions in excess of current and accumulated earnings and profits, as determined for US federal income tax purposes, will be treated as a non-taxable return of capital to the extent of your basis in the shares or ADSs and thereafter as capital gain.
Subject to certain limitations, any Australian tax withheld in accordance with the Australia/United States Tax Treaty and paid over to Australia will be creditable or deductible against your US federal income tax liability. Special rules apply in determining the foreign tax credit limitation with respect to dividends that are subject to the maximum 20 per cent tax rate beginning after 31 December 2012.
For foreign tax credit purposes, dividends will generally be income from sources outside the US and will, depending on your circumstances, generally be either “passive” or “general” income which, in either case, is treated separately from other types of income for purposes of computing the foreign tax credit allowable to you.
Taxation of capital gains
Subject to the PFIC Rules discussed below, if you are a US holder and you sell or otherwise dispose of the Group’s ADSs or shares, you will recognise capital gain or loss for US federal income tax purposes equal to the difference between the US dollar value of the amount that you realise and your tax basis, determined in US dollars, in your shares or ADSs. Capital gain of a non-corporate US holder is generally taxed at preferential rates where the holder has a holding period greater than one year. The gain or loss will generally be income or loss from sources within the US for foreign tax credit limitation purposes.
Passive Foreign Investment Company Rules
We believe that the Group’s shares or ADSs should not be treated as stock of PFIC for US federal income tax purposes, but this conclusion is a factual determination that is made annually and thus may be subject to change. If we were to be treated as a PFIC, unless the shares or ADSs are “marketable stock” and a US holder elects to be taxed annually on a mark-to-market basis with respect to the shares or ADSs, gain realised on the sale or other disposition of the shares or ADSs would in general not be treated as capital gain. Instead, if you are a US holder, you would be treated as if you had realised such gain and certain “excess distributions” rateably over your holding period for the shares or ADSs and would be taxed at the highest tax rate in effect for each such year to which the gain was allocated, together with an interest charge in respect of the tax attributable to each such year. In addition, dividends that you receive from us will not be eligible for the special tax rates applicable to qualified dividend income if we are a PFIC either in the taxable year of the distribution or the preceding taxable year, but instead will be taxable at rates applicable to ordinary income.
Documents on display
Rio Tinto is subject to the Securities and Exchange Commission reporting requirements for foreign companies. A Form 20-F, which corresponds with the Form 10-K for US public companies, was filed with the SEC on 14 March 2014. Rio Tinto’s Form 20-F and other filings can be viewed on the Rio Tinto website as well as the SEC website at www.sec.gov. ADR holders may also read without charge and copy at prescribed rates any document filed at the public reference facilities of the SEC’s principal office at 100 F Street NE, Washington, DC 20549, US. Please call the SEC at 1-800-SEC-0330 for further information on the operation of the public reference facilities.
| | | | |
| | 243 riotinto.com/reportingcentre2013 | | |
Financial calendar
| | | | |
| 2014 | | |
| 16 | | January | | Fourth quarter 2013 operations review |
| 13 | | February | | Announcement of results for 2013 |
| 5 | | March | | Rio Tinto plc and Rio Tinto Limited shares and Rio Tinto plc ADRs quoted “ex-dividend” for 2013 final dividend |
| 7 | | March | | Record date for 2013 final dividend for Rio Tinto plc shares and ADRs |
| 12 | | March | | Record date for 2013 final dividend for Rio Tinto Limited shares |
| 14 | | March | | Publication of 2013 Annual report, 20-F and Notices of annual general meetings |
| 20 | | March | | Plan notice date for election under the dividend reinvestment plan and date for electing dividends paid in alternate currency for the 2013 final dividend |
| 3 | | April | | Dividend currency conversion date (Rio Tinto plc holders electing to receive Australian dollars and Rio Tinto Limited holders electing to receive pounds sterling) |
| 10 | | April | | Payment date for 2013 final dividend to holders of ordinary shares and ADRs |
| 15 | | April | | First quarter 2014 operations review |
| 15 | | April | | Annual general meeting for Rio Tinto plc, London |
| 8 | | May | | Annual general meeting for Rio Tinto Limited, Melbourne |
| 16 | | July | | Second quarter 2014 operations review |
| 7 | | August | | Announcement of half year results for 2014 |
| 13 | | August | | Rio Tinto plc and Rio Tinto Limited shares and Rio Tinto plc ADRs quoted “ex-dividend” for 2014 interim dividend |
| 15 | | August | | Record date for 2014 interim dividend for Rio Tinto plc and Rio Tinto Limited shares and Rio Tinto plc ADRs |
| 20 | | August | | Plan notice date for election under the dividend reinvestment plan and date for electing dividends paid in alternate currency for the 2014 interim dividend for Rio Tinto plc |
| 21 | | August | | Plan notice date for election under the dividend reinvestment plan and date for electing dividends paid in alternate currency for the 2014 interim dividend for Rio Tinto Limited |
| 4 | | September | | Dividend currency conversion date (Rio Tinto plc holders electing to receive Australian dollars and Rio Tinto Limited holders electing to receive pounds sterling) |
| 11 | | September | | Payment date for 2014 interim dividend to holders of ordinary shares and ADRs |
| 15 | | October | | Third quarter 2014 operations review |
| |
| 2015 | | |
| January | | Fourth quarter 2014 operations review |
| February | | Announcement of results for 2014 |
| April | | Annual general meeting for Rio Tinto plc, London |
| April | | First quarter 2015 operations review |
| May | | Annual general meeting for Rio Tinto Limited, Perth |
| July | | Second quarter 2015 operations review |
| August | | Announcement of half year results for 2015 |
| October | | Third quarter 2015 operations review |
| | | | |
| | 244 riotinto.com/reportingcentre2013 | | |
Contact details
Registered offices
Rio Tinto plc
2 Eastbourne Terrace
London
W2 6LG
Registered in England No. 719885
Telephone: +44 (0) 20 7781 2000
Fax: +44 (0) 20 7781 1800
Website: riotinto.com
Rio Tinto Limited
Level 33
120 Collins Street
Melbourne
Victoria 3000
ABN 96 004 458 404
Telephone: +61 (0) 3 9283 3333
Fax: +61 (0) 3 9283 3707
Website: riotinto.com
Rio Tinto’s agent in the US is Cheree Finan, who may be contacted at
Rio Tinto Services Inc.
80 State Street
Albany, NY 12207-2543
Shareholders
Please refer to the Investor Centre of the respective registrar if you have any queries about your shareholding.
Rio Tinto plc
Computershare Investor
Services PLC
The Pavilions
Bridgwater Road
Bristol
BS99 6ZY
Telephone: +44 (0) 870 703 6364
Fax: +44 (0) 870 703 6119
UK residents only,
freephone: 0800 435021
Website: computershare.com
Holders of Rio Tinto American Depositary
Receipts (ADRs)
Please contact the ADR administrator if you have any queries about your ADRs.
ADR administrator
JPMorgan Chase & Co
PO Box 64504
St. Paul, MN 55164-0504
Telephone: +1 (651) 453 2128
US residents only, toll free general:
(800) 990 1135
US residents only, toll free Global invest direct: (800) 428 4237
Website: adr.com
Email: jpmorgan.adr@wellsfargo.com
Rio Tinto Limited
Computershare Investor Services
Pty Limited
GPO Box 2975
Melbourne
Victoria 3001
Telephone: +61 (0) 3 9415 4030
Fax: +61 (0) 3 9473 2500
Australian residents only, toll free:
1800 813 292
New Zealand residents only, toll free:
0800 450 740
Website: computershare.com
Former Alcan Inc. shareholders
Computershare Investor Services Inc.
9th Floor
100 University Avenue
Toronto, ON M5J 2Y1
Ontario
Telephone: +1 416 263 9200
North American residents only,
toll free: +1 (888) 453 0330
Website: computershare.com
Investor Centre
Investor Centre is Computershare’s free, secure, self service website, where shareholders can manage their holdings online. The website enables shareholders to:
– View share balances
– Change address details
– View payment and tax information
– Update payment instructions
In addition, shareholders who register their email address on Investor Centre can be notified electronically of events such as annual general meetings, and can receive shareholder communications such as the Annual report or Notice of meeting electronically online.
Rio Tinto plc shareholders
www.investorcentre.co.uk/riotinto
Rio Tinto Limited shareholders
www.investorcentre.com/rio

Printed by Park Communications on FSC® certified paper.
Park is EMAS certified company and its Environmental Management System is certified to ISO 14001.
100% of the inks used are vegetable oil based, 95% of press chemicals are recycled for further use and, on average 99% of any waste associated with this production will be recycled.
This document is printed on Explorer Offset, a paper containing 100% virgin fibre sourced from well managed, responsible, FSC® certified forests. The pulp used in this product is bleached using an elemental chlorine free (ECF) process.
Design and production by Black Sun Plc www.blacksunplc.com
| | | | |
| | 245 riotinto.com/reportingcentre2013 | | |
| | |
| | | |
riotinto.com/reportingcentre2013 | | |
Get more information online
Visit our reporting centre at riotinto.com/reportingcentre2013
| Ÿ | | Find out more about our business and performance |
| Ÿ | | View our full 2013 Annual report |
| Ÿ | | View our full 2013 Sustainable development report |
Item 19. Exhibits
Exhibits marked “*” have been filed as exhibits to this Annual report on Form 20-F and other exhibits have been incorporated by reference as indicated.
INDEX
| | |
Exhibit Number | | Description |
| 1.1 | | Articles of Association of Rio Tinto plc (adopted by special resolution passed on 20 April 2009 and amended on 1 October 2009) (incorporated by reference to Exhibit 1.1 of Rio Tinto plc Annual report on Form 20-F for the fiscal year ended 31 December 2009, File No. 1-10533) |
| |
| 1.2 | | Constitution of Rio Tinto Limited (ACN 004 458 404) (as adopted by special resolution passed on 24 May 2000 and amended by special resolution on 18 April 2002, 29 April 2005, 27 April 2007, 24 April 2008 and 20 April 2009) (incorporated by reference to Exhibit 1.2 of Rio Tinto plc Annual report on Form 20-F for the fiscal year ended 31 December 2009, File No. 1-10533) |
| |
| 3.1 | | DLC Merger Implementation Agreement, dated 3 November 1995 between CRA Limited and The RTZ Corporation PLC relating to the implementation of the DLC merger (incorporated by reference to Exhibit 2.1 of Rio Tinto plc’s Annual report on Form 20-F for the financial year ended 31 December 1995, File No.
1-10533) |
| |
| 3.2 | | DLC Merger Sharing Agreement, dated 21 December 1995 and amended on 14 April 2005, 29 April 2005 and 18 December 2009 between CRA Limited and The RTZ Corporation PLC relating to the ongoing relationship between CRA and RTZ following the DLC merger (incorporated by reference to Exhibit 3.2 of Rio Tinto plc Annual report on Form 20-F for the fiscal year ended 31 December 2009, File No. 1-10533) |
| |
| 3.3 | | RTZ Shareholder Voting Agreement, dated 21 December 1995 and amended on 18 January 2010 between The RTZ Corporation PLC, RTZ Shareholder SVC Pty. Limited, CRA Limited, R.T.Z. Australian Holdings Limited and The Law Debenture Trust Corporation p.l.c (incorporated by reference to Exhibit 3.3 of Rio Tinto plc Annual report on Form 20-F for the fiscal year ended 31 December 2009, File No. 1-10533) |
| |
| 3.4 | | CRA Shareholder Voting Agreement, dated 21 December 1995 and amended 18 January 2010 between CRA Limited, CRA Shareholder SVC Limited, The RTZ Corporation PLC and The Law Debenture Trust Corporation p.l.c., relating to the RTZ Special Voting Share (incorporated by reference to Exhibit 3.4 of Rio Tinto plc Annual report on Form 20-F for the fiscal year ended 31 December 2009, File No. 1-10533) |
| |
| 4.01 | | Rio Tinto plc - Share Option Plan 2004 (incorporated by reference to Exhibit 4.3 of Rio Tinto’s Registration statement on Form S-8, File No. 333-147914) |
| |
| 4.02 | | Rio Tinto Limited - Share Option Plan 2004 (incorporated by reference to Exhibit 4.6 of Rio Tinto’s Registration statement on Form S-8, File No. 333-147914) |
| |
| 4.03 | | Rules of the Rio Tinto plc Performance Share Plan 2004 (formerly known as the Rio Tinto plc - Mining Companies Comparative Plan 2004) (incorporated by reference to Exhibit 4.03 of Rio Tinto plc Annual report on Form 20-F for the fiscal year ended 31 December 2011, File No. 1-10533) |
| |
| 4.04 | | Rules of the Rio Tinto Limited Performance Share Plan 2004 (formerly known as the Rio Tinto
Limited - Mining Companies Comparative Plan 2004) (incorporated by reference to Exhibit 4.04 of Rio Tinto plc Annual report on Form 20-F for the fiscal year ended 31 December 2011, File No. 1-10533) |
| |
| 4.05* | | Rules of the Rio Tinto plc Performance Share Plan 2013 |
| |
| 4.06* | | Rules of the Rio Tinto Limited Performance Share Plan 2013 |
| |
| 8.1* | | List of subsidiary companies. |
| |
| 12.1* | | Certifications pursuant to Rule 13a-14(a) of the Exchange Act. |
| |
| 13.1* | | Certifications furnished pursuant to Rule 13a-14(b) of the Exchange Act (such certifications are not deemed filed for purpose of Section 18 of the Exchange Act and not incorporated by reference in any filing under the Securities Act). |
| |
| 15.1* | | Consent of Independent Accountants to the incorporation of the audit report relating to the Rio Tinto Group and effectiveness of internal control over financial reporting of the Rio Tinto Group by reference in registration statements on Form F-3 and Form S-8. |
| |
| 99.1* | | Mine safety and health administration safety data. |
Signature
The Registrants hereby certify that they meet all of the requirements for filing on Form 20-F and that they have duly caused and authorised the undersigned to sign this Annual Report on their behalf.
| | |
| Rio Tinto plc | | Rio Tinto Limited |
| (Registrant) | | (Registrant) |
| |
| /s/ Eleanor Evans | | /s/ Eleanor Evans |
| Name: Eleanor Evans | | Name: Eleanor Evans |
| Title: Company Secretary | | Title: Joint Company Secretary |
| |
| Date: 13 March 2014 | | Date: 13 March 2014 |