Exhibit 99.1

Link to searchable text of slide shown above

Link to searchable text of slide shown above

Link to searchable text of slide shown above
Link to searchable text of slide shown above
Link to searchable text of slide shown above

Link to searchable text of slide shown above

Link to searchable text of slide shown above
Link to searchable text of slide shown above

Link to searchable text of slide shown above

Link to searchable text of slide shown above

Link to searchable text of slide shown above

Link to searchable text of slide shown above
Link to searchable text of slide shown above
Link to searchable text of slide shown above
Link to searchable text of slide shown above
Link to searchable text of slide shown above

Link to searchable text of slide shown above

Link to searchable text of slide shown above
Link to searchable text of slide shown above

Link to searchable text of slide shown above
Link to searchable text of slide shown above
Link to searchable text of slide shown above

Link to searchable text of slide shown above

Link to searchable text of slide shown above
Link to searchable text of slide shown above
Link to searchable text of slide shown above
Link to searchable text of slide shown above
Link to searchable text of slide shown above
Link to searchable text of slide shown above
Link to searchable text of slide shown above
Link to searchable text of slide shown above

Link to searchable text of slide shown above
Searchable text section of graphics shown above
[LOGO]
Second Quarter 2004
A Strong Foundation
August 11, 2004
Forward-Looking Statements |
| [LOGO] |
This presentation may contain certain "forward-looking statements" within the meaning of the Private Securities Litigation Reform Act of 1995. All statements, other than statements of historical facts, may be forward-looking statements. Specifically, we may make forward-looking statements about our results of operations, financial condition and liquidity, the sufficiency of our asbestos and other reserves and the post-merger integration. Such statements are subject to certain risks and uncertainties, many of which are difficult to predict and generally beyond our control, that could cause actual results to differ materially from those expressed in, or implied or projected by, the forward-looking information and statements.
Some of the factors that could cause actual results to differ include, but are not limited to, the following: adverse developments involving asbestos claims and related litigation; the impact of aggregate policy coverage limits for asbestos claims; the impact of bankruptcies of various asbestos producers and related businesses; the willingness of parties, including us, to settle asbestos-related litigation; our ability to fully integrate the former St. Paul and Travelers businesses in the manner or in the timeframe currently anticipated; our inability to obtain price increases due to competition or otherwise; the performance of our investment portfolios, which could be adversely impacted by adverse developments in U.S. and global financial markets, interest rates and rates of inflation; weakening U.S. and global economic conditions; insufficiency of, or changes in, loss reserves; the occurrence of catastrophic events, both natural and man-made, including terrorist acts, with a severity or frequency exceeding our expectations; exposure to, and adverse developments involving, environmental claims and related litigation; the impact of claims related to exposure to potentially harmful products or substances, including, but not limited to, lead paint, silica and other potentially harmful substances; adverse changes in loss cost trends, including inflationary pressures in medical costs and auto and home repair costs; developments relating to coverage and liability for mold claims; the effects of corporate bankruptcies on surety bond claims; adverse developments in the cost, availability and/or ability to collect reinsurance; the ability of our subsidiaries to pay dividends to us; adverse outcomes in legal proceedings; judicial expansion of policy coverage and the impact of new theories of liability; the impact of legislative actions, including federal and state legislation related to asbestos liability reform; larger than expected assessments for guaranty funds and mandatory pooling arrangements; a downgrade in our claims-paying and financial strength ratings; the loss or significant restriction on our ability to use credit scoring in the pricing and underwriting of Personal policies; and amendments to, and changes to the risk-based capital requirements.
Our forward-looking statements speak only as of the date made, and we undertake no obligation to update these forward-looking statements.
0
A Strong Foundation |
| [LOGO] |
• Progress on integrating operations
• Evaluation of second quarter results
• Focus on business retention and agency relationships
• Analysis of current market conditions
• Analysis of investment portfolio
• Balance sheet and capital strength
• Outlook for second half of 2004
• Optimistic about cost saving opportunities beyond initial expectations
• Revenue synergies over the long-term
1
Progress on Integrating Operations
2
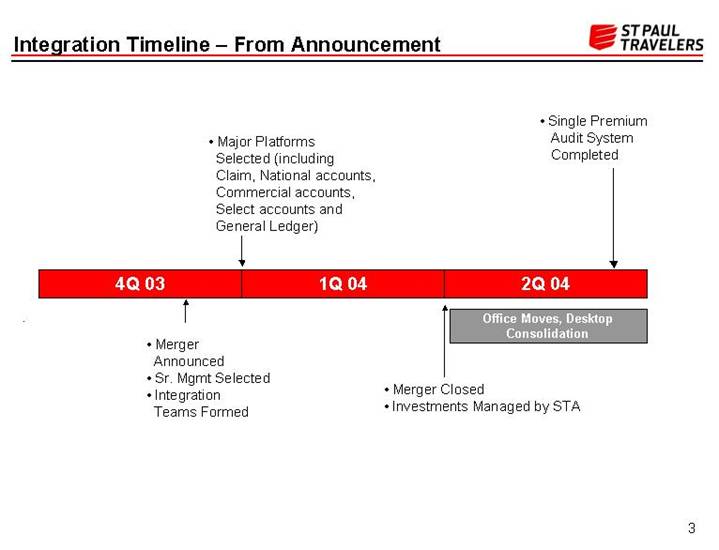
Integration Timeline – From Announcement
|
|
|
| • Single Premium | |||
|
| • Major Platforms Selected (including Claim, National accounts, Commercial accounts, Select accounts and General Ledger) |
|
| |||
|
|
|
|
| |||
4Q 03 |
| 1Q 04 |
| 2Q 04 | |||
|
|
|
|
| |||
|
|
|
| Office Moves, Desktop | |||
|
|
|
|
| |||
• Merger Announced |
|
|
|
| |||
• Sr. Mgmt Selected |
| • Merger Closed | |||||
• Integration Teams Formed |
| • Investments Managed by STA | |||||
3
Integration Timeline – Future Projects
• Benefits Structure Merged |
| ||||||||||||||
|
| • Bond System |
| • Financial Systems Consolidated • Payroll Systems Consolidated • Investments Systems Consolidated • Agent Compensation Systems Consolidated |
| • Claim System |
| ||||||||
|
|
|
|
|
|
|
|
|
|
|
| ||||
3Q 04 |
| 4Q 04 |
| 1Q 05 | 2Q 05 |
| 3Q 05 | 4Q 05 |
| ||||||
|
|
|
|
|
|
|
|
|
|
|
| ||||
|
| • Data Center Consolidation | • Commercial | • Consolidated |
|
|
|
|
| ||||||
|
|
| accounts |
|
| • Select accounts |
| • Specialty System |
| ||||||
|
|
|
|
|
|
|
|
|
|
|
| ||||
Office Moves, Desktop Consolidation |
| ||||||||||||||
4
Evaluation of Second Quarter Results
Focus on Business Retention and
Agency Relationships
5
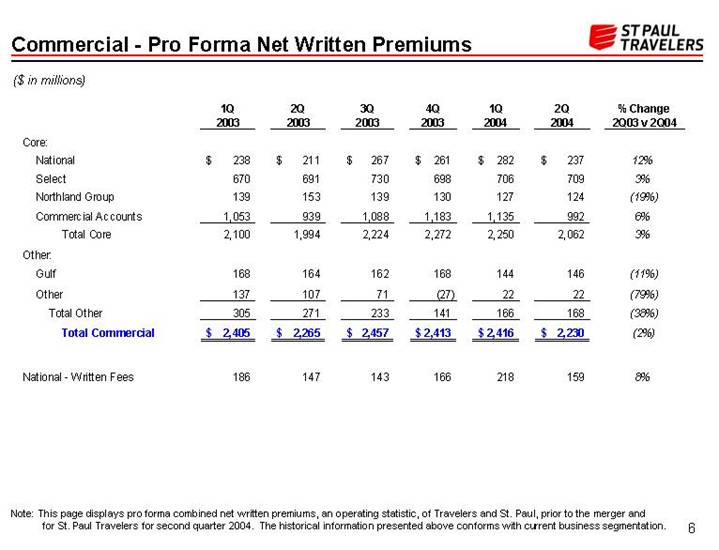
Commercial - Pro Forma Net Written Premiums
($ in millions)
|
| 1Q |
| 2Q |
| 3Q |
| 4Q |
| 1Q |
| 2Q |
| % Change |
| ||||||
Core: |
|
|
|
|
|
|
|
|
|
|
|
|
|
|
| ||||||
National |
| $ | 238 |
| $ | 211 |
| $ | 267 |
| $ | 261 |
| $ | 282 |
| $ | 237 |
| 12 | % |
Select |
| 670 |
| 691 |
| 730 |
| 698 |
| 706 |
| 709 |
| 3 | % | ||||||
Northland Group |
| 139 |
| 153 |
| 139 |
| 130 |
| 127 |
| 124 |
| (19 | )% | ||||||
Commercial Accounts |
| 1,053 |
| 939 |
| 1,088 |
| 1,183 |
| 1,135 |
| 992 |
| 6 | % | ||||||
Total Core |
| 2,100 |
| 1,994 |
| 2,224 |
| 2,272 |
| 2,250 |
| 2,062 |
| 3 | % | ||||||
Other: |
|
|
|
|
|
|
|
|
|
|
|
|
|
|
| ||||||
Gulf |
| 168 |
| 164 |
| 162 |
| 168 |
| 144 |
| 146 |
| (11 | )% | ||||||
Other |
| 137 |
| 107 |
| 71 |
| (27 | ) | 22 |
| 22 |
| (79 | )% | ||||||
Total Other |
| 305 |
| 271 |
| 233 |
| 141 |
| 166 |
| 168 |
| (38 | )% | ||||||
Total Commercial |
| $ | 2,405 |
| $ | 2,265 |
| $ | 2,457 |
| $ | 2,413 |
| $ | 2,416 |
| $ | 2,230 |
| (2 | )% |
|
|
|
|
|
|
|
|
|
|
|
|
|
|
|
| ||||||
National - Written Fees |
| 186 |
| 147 |
| 143 |
| 166 |
| 218 |
| 159 |
| 8 | % | ||||||
Note: This page displays pro forma combined net written premiums, an operating statistic, of Travelers and St. Paul, prior to the merger and for St. Paul Travelers for second quarter 2004. The historical information presented above conforms with current business segmentation.
6
Illustrative Business Statistics – Commercial
($ in millions)
|
| 1Q |
| 2Q |
| 3Q |
| 4Q |
| 1Q |
| 2Q |
|
|
|
|
|
|
|
|
|
|
|
|
|
|
|
Travelers Commercial Accounts Group - Field |
|
|
|
|
|
|
|
|
|
|
|
|
|
Retention |
| 84 | % | 84 | % | 83 | % | 82 | % | 83 | % | 82 | % |
Renewal price change (1) |
| 16 | % | 11 | % | 9 | % | 8 | % | 6 | % | 6 | % |
|
|
|
|
|
|
|
|
|
|
|
|
|
|
St. Paul Commercial Accounts Group - Field |
|
|
|
|
|
|
|
|
|
|
|
|
|
Retention |
| 85 | % | 81 | % | 80 | % | 82 | % | 80 | % | 79 | % |
Renewal price change (2) |
| 16 | % | 12 | % | 10 | % | 8 | % | 6 | % | 4 | % |
|
|
|
|
|
|
|
|
|
|
|
|
|
|
Travelers Select |
|
|
|
|
|
|
|
|
|
|
|
|
|
Retention |
| 84 | % | 83 | % | 83 | % | 82 | % | 81 | % | 80 | % |
Renewal price change (1) |
| 14 | % | 14 | % | 14 | % | 13 | % | 11 | % | 9 | % |
|
|
|
|
|
|
|
|
|
|
|
|
|
|
St. Paul Select |
|
|
|
|
|
|
|
|
|
|
|
|
|
Retention |
| 63 | % | 66 | % | 73 | % | 71 | % | 74 | % | 77 | % |
Renewal price change (2) |
| 12 | % | 10 | % | 8 | % | 6 | % | 4 | % | 4 | % |
(1) Represents historical Travelers Property Casualty Corp. information. Each percentage represents the estimated average change in premium on policies that renew, including rate and exposure changes, vs. the average premium on those same policies for their prior term.
(2) Represents historical St. Paul Companies information. Each percentage represents the estimated average change in premium on policies that renew, including rate and changes in exposure due solelyto inflation, vs. the average premium on those same policies for their prior term.
7
Specialty – Pro Forma Net Written Premiums
($ in millions)
|
| 1Q |
| 2Q |
| 3Q |
| 4Q |
| 1Q |
| 2Q |
| % Change |
| ||||||
Domestic Specialty: |
|
|
|
|
|
|
|
|
|
|
|
|
|
|
| ||||||
Financial and Professional Services |
| $ | 124 |
| $ | 154 |
| $ | 177 |
| $ | 169 |
| $ | 157 |
| $ | 198 |
| 29 | % |
Technology |
| 93 |
| 103 |
| 107 |
| 123 |
| 106 |
| 117 |
| 14 | % | ||||||
Excess and Surplus |
| 47 |
| 49 |
| 49 |
| 58 |
| 64 |
| 73 |
| 49 | % | ||||||
Oil and Gas |
| 42 |
| 49 |
| 53 |
| 52 |
| 50 |
| 58 |
| 18 | % | ||||||
Public Sector |
| 71 |
| 49 |
| 91 |
| 69 |
| 70 |
| 42 |
| (14 | )% | ||||||
Ocean Marine |
| 26 |
| 27 |
| 33 |
| 30 |
| 35 |
| 38 |
| 41 | % | ||||||
Other |
| 70 |
| 142 |
| 121 |
| 118 |
| 95 |
| 82 |
| (42 | )% | ||||||
Total ex Bond and Construction |
| 473 |
| 573 |
| 631 |
| 619 |
| 577 |
| 608 |
| 6 | % | ||||||
|
|
|
|
|
|
|
|
|
|
|
|
|
|
|
| ||||||
Bond |
| 256 |
| 354 |
| 350 |
| 299 |
| 286 |
| 249 |
| (30 | )% | ||||||
Construction |
| 390 |
| 320 |
| 241 |
| 281 |
| 324 |
| 275 |
| (14 | )% | ||||||
Total Bond and Construction |
| 646 |
| 674 |
| 591 |
| 580 |
| 610 |
| 524 |
| (22 | )% | ||||||
Total Domestic Specialty |
| 1,119 |
| 1,247 |
| 1,222 |
| 1,199 |
| 1,187 |
| 1,132 |
| (9 | )% | ||||||
International Specialty: |
|
|
|
|
|
|
|
|
|
|
|
|
|
|
| ||||||
International Operations |
| 102 |
| 159 |
| 152 |
| 211 |
| 139 |
| 196 |
| 23 | % | ||||||
Lloyd’s |
| 366 |
| 81 |
| 137 |
| 122 |
| 171 |
| 145 |
| 79 | % | ||||||
Total International Specialty |
| 468 |
| 240 |
| 289 |
| 333 |
| 310 |
| 341 |
| 42 | % | ||||||
Total Specialty |
| $ | 1,587 |
| $ | 1,487 |
| $ | 1,511 |
| $ | 1,532 |
| $ | 1,497 |
| $ | 1,473 |
| (1 | )% |
Note: This page displays pro forma combined net written premiums, an operating statistic, of Travelers and St. Paul, prior to the merger and for St. Paul Travelers for second quarter 2004. The historical information presented above conforms with current business segmentation.
8
Specialty – Adjusted(1) Pro Forma Net Written Premiums
($ in millions)
|
| 1Q |
| 2Q |
| 3Q |
| 4Q |
| 1Q |
| 2Q |
| % Change |
| ||||||
Domestic Specialty: |
|
|
|
|
|
|
|
|
|
|
|
|
|
|
| ||||||
Financial and Professional Services |
| $ | 124 |
| $ | 154 |
| $ | 177 |
| $ | 169 |
| $ | 157 |
| $ | 169 |
| 10 | % |
Technology |
| 93 |
| 103 |
| 107 |
| 123 |
| 106 |
| 112 |
| 9 | % | ||||||
Excess and Surplus |
| 47 |
| 49 |
| 49 |
| 58 |
| 64 |
| 59 |
| 20 | % | ||||||
Oil and Gas |
| 42 |
| 49 |
| 53 |
| 52 |
| 50 |
| 56 |
| 14 | % | ||||||
Public Sector |
| 71 |
| 49 |
| 91 |
| 69 |
| 70 |
| 42 |
| (14 | )% | ||||||
Ocean Marine |
| 26 |
| 27 |
| 33 |
| 30 |
| 35 |
| 38 |
| 41 | % | ||||||
Other |
| 69 |
| 120 |
| 120 |
| 118 |
| 95 |
| 81 |
| (33 | )% | ||||||
Total ex Bond and Construction |
| 472 |
| 551 |
| 630 |
| 619 |
| 577 |
| 557 |
| 1 | % | ||||||
|
|
|
|
|
|
|
|
|
|
|
|
|
|
|
| ||||||
Bond |
| 256 |
| 354 |
| 350 |
| 299 |
| 286 |
| 324 |
| (8 | )% | ||||||
Construction |
| 390 |
| 320 |
| 242 |
| 281 |
| 324 |
| 272 |
| (15 | )% | ||||||
Total Bond and Construction |
| 646 |
| 674 |
| 592 |
| 580 |
| 610 |
| 596 |
| (12 | )% | ||||||
Total Domestic Specialty |
| 1,118 |
| 1,225 |
| 1,222 |
| 1,199 |
| 1,187 |
| 1,153 |
| (6 | )% | ||||||
International Specialty: |
|
|
|
|
|
|
|
|
|
|
|
|
|
|
| ||||||
International Operations |
| 102 |
| 160 |
| 152 |
| 212 |
| 139 |
| 193 |
| 21 | % | ||||||
Lloyd’s |
| 130 |
| 124 |
| 137 |
| 121 |
| 171 |
| 145 |
| 17 | % | ||||||
Total International Specialty |
| 232 |
| 284 |
| 289 |
| 333 |
| 310 |
| 338 |
| 19 | % | ||||||
Total Adjusted Specialty |
| 1,350 |
| 1,509 |
| 1,511 |
| 1,532 |
| 1,497 |
| 1,491 |
| (1 | )% | ||||||
Aggregate Adjustments (1) |
| 237 |
| (22 | ) | — |
| — |
| — |
| (18 | ) | NM |
| ||||||
Total Specialty |
| $ | 1,587 |
| $ | 1,487 |
| $ | 1,511 |
| $ | 1,532 |
| $ | 1,497 |
| $ | 1,473 |
| (1 | )% |
(1) Adjusted to better reflect ongoing trends in new written premiums by eliminating the following: a reinsurance reinstatement premium related to Bond in 2Q04, the impact of the reinsurance commutation onpremiums in a number of lines in 2Q04, earned premium revision at Lloyds in 2Q03, ceded returned premium related to Cat Risk in 2Q03, a change in policy inception related to a certain Lloyds business in 2Q03and the elimination of a quarter lag at Lloyds in 1Q03
Note: This page displays pro forma combined net written premiums, an operating statistic, of Travelers and St. Paul, prior to the merger and for St. Paul Travelers for second quarter 2004. The historical information presented above conforms with current business segmentation.
9
Illustrative Business Statistics – Specialty
($ in millions)
|
| 1Q |
| 2Q |
| 3Q |
| 4Q |
| 1Q |
| 2Q |
|
Domestic Specialty (3) |
|
|
|
|
|
|
|
|
|
|
|
|
|
|
|
|
|
|
|
|
|
|
|
|
|
|
|
Renewal Retention |
| 74 | % | 74 | % | 71 | % | 71 | % | 72 | % | 73 | % |
|
|
|
|
|
|
|
|
|
|
|
|
|
|
Renewal Price Change (2) |
| 23 | % | 23 | % | 18 | % | 16 | % | 12 | % | 7 | % |
|
|
|
|
|
|
|
|
|
|
|
|
|
|
Construction |
|
|
|
|
|
|
|
|
|
|
|
|
|
|
|
|
|
|
|
|
|
|
|
|
|
|
|
Travelers |
|
|
|
|
|
|
|
|
|
|
|
|
|
|
|
|
|
|
|
|
|
|
|
|
|
|
|
Renewal Retention |
| 75 | % | 78 | % | 82 | % | 76 | % | 64 | % | 67 | % |
|
|
|
|
|
|
|
|
|
|
|
|
|
|
Renewal Price Change (1) |
| 19 | % | 13 | % | 8 | % | 9 | % | 4 | % | 7 | % |
|
|
|
|
|
|
|
|
|
|
|
|
|
|
St Paul (excludes Wrap ups) |
|
|
|
|
|
|
|
|
|
|
|
|
|
|
|
|
|
|
|
|
|
|
|
|
|
|
|
Renewal Retention |
| 80 | % | 81 | % | 69 | % | 66 | % | 68 | % | 68 | % |
|
|
|
|
|
|
|
|
|
|
|
|
|
|
Renewal Price Change (2) |
| 22 | % | 20 | % | 19 | % | 19 | % | 19 | % | 16 | % |
(1) Represents historical Travelers Property Casualty Corp. information. Each percentage represents the estimated average change in premium on policies that renew, including rate and exposure changes, vs. the average premium on those same policies for their prior term.
(2) Represents historical St. Paul Companies information. Each percentage represents the estimated average change in premium on policies that renew, including rate and changes in exposure due solelyto inflation, vs. the average premium on those same policies for their prior term.
(3) Excludes Cat Risk, SPC Construction Wrap-up, TPC Construction, and Combined Companies Bond.
10
Personal - Net Written Premiums |
|
($ in millions)
|
| 2Q |
| 2Q |
| % Change |
|
|
| ||
By product line: |
|
|
|
|
|
|
|
|
| ||
|
|
|
|
|
|
|
|
|
| ||
Automobile |
| $ | 778 |
| $ | 892 |
| 15 | % |
|
|
|
|
|
|
|
|
|
|
|
|
|
|
Homeowners and Other |
| 533 |
| 666 |
| 25 | % |
|
| ||
Total Personal |
| $ | 1,311 |
| $ | 1,558 |
| 19 | % | 7% increase |
|
|
|
|
|
|
|
|
|
|
| ||
By distribution channel: |
|
|
|
|
|
|
|
|
| ||
|
|
|
|
|
|
|
|
|
| ||
Independent agents |
| $ | 1,075 |
| $ | 1,287 |
| 20 | % |
|
|
|
|
|
|
|
|
|
|
|
|
|
|
Other channels(1) |
| 236 |
| 271 |
| 15 | % |
|
| ||
|
|
|
|
|
|
|
|
|
| ||
Total Personal |
| $ | 1,311 |
| $ | 1,558 |
| 19 | % |
|
|
(1) Other channels includes GEICO, Affinity Programs, involuntary and runoff business
11
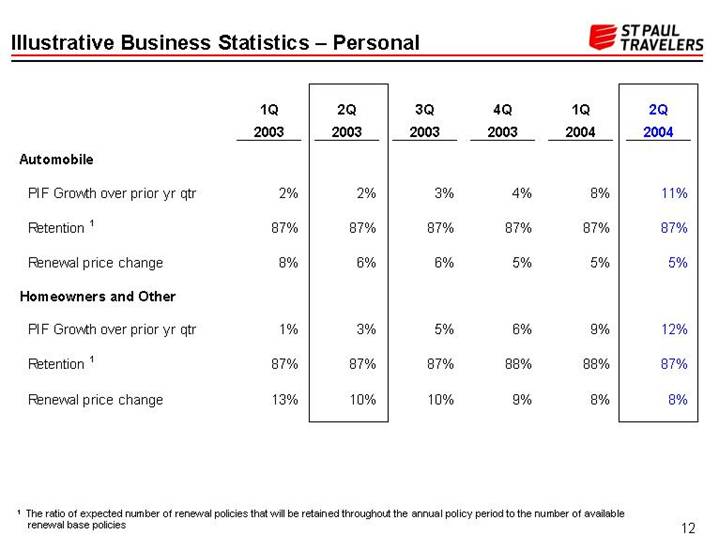
Illustrative Business Statistics – Personal |
|
|
| 1Q |
| 2Q |
| 3Q |
| 4Q |
| 1Q |
| 2Q |
|
Automobile |
|
|
|
|
|
|
|
|
|
|
|
|
|
|
|
|
|
|
|
|
|
|
|
|
|
|
|
PIF Growth over prior yr qtr |
| 2 | % | 2 | % | 3 | % | 4 | % | 8 | % | 11 | % |
|
|
|
|
|
|
|
|
|
|
|
|
|
|
Retention (1) |
| 87 | % | 87 | % | 87 | % | 87 | % | 87 | % | 87 | % |
|
|
|
|
|
|
|
|
|
|
|
|
|
|
Renewal price change |
| 8 | % | 6 | % | 6 | % | 5 | % | 5 | % | 5 | % |
|
|
|
|
|
|
|
|
|
|
|
|
|
|
Homeowners and Other |
|
|
|
|
|
|
|
|
|
|
|
|
|
|
|
|
|
|
|
|
|
|
|
|
|
|
|
PIF Growth over prior yr qtr |
| 1 | % | 3 | % | 5 | % | 6 | % | 9 | % | 12 | % |
|
|
|
|
|
|
|
|
|
|
|
|
|
|
Retention (1) |
| 87 | % | 87 | % | 87 | % | 88 | % | 88 | % | 87 | % |
|
|
|
|
|
|
|
|
|
|
|
|
|
|
Renewal price change |
| 13 | % | 10 | % | 10 | % | 9 | % | 8 | % | 8 | % |
(1) The ratio of expected number of renewal policies that will be retained throughout the annual policy period to the number of available renewal base policies
12
Premium Dynamics |
|
Second Quarter
• Substantial focus on account retention
• Reports from our field units suggest that pricing required to obtain significant new business became more competitive
• Focus on bottom line profitability of entire book of business drives pricing strategy
13
Evaluation of Second Quarter Results
Analysis of Current Market Conditions
14
Current Market Conditions
Illustrative Statistics - Travelers Liability Lines
(Direct Guaranteed Cost)
[CHART]
• If current trends continue, estimated loss trend curve may cross earned price change curve in 2005
• St. Paul Travelers is well-positioned to operate within challenging market conditions
• Our competitive advantage is our size, scope and operational efficiency opportunity
15
Evaluation of Second Quarter Results
Analysis of Investment Portfolio
16
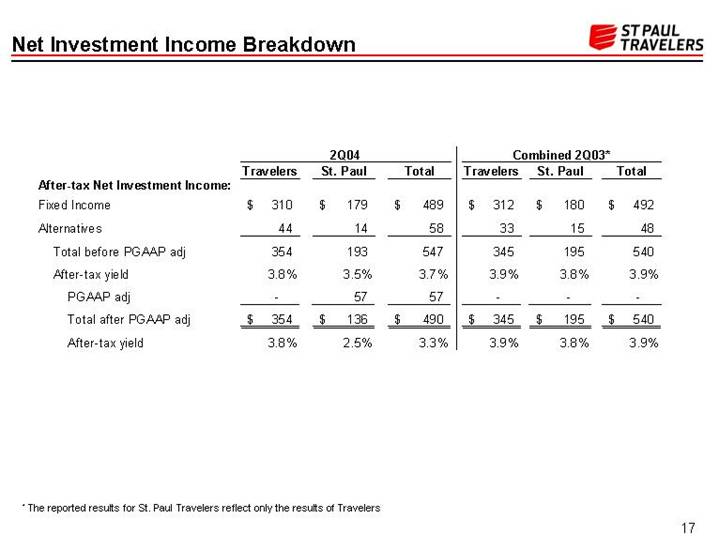
Net Investment Income Breakdown
|
| 2Q04 |
| Combined 2Q03* |
| ||||||||||||||
|
| Travelers |
| St. Paul |
| Total |
| Travelers |
| St. Paul |
| Total |
| ||||||
After-tax Net Investment Income: |
|
|
|
|
|
|
|
|
|
|
|
|
| ||||||
Fixed Income |
| $ | 310 |
| $ | 179 |
| $ | 489 |
| $ | 312 |
| $ | 180 |
| $ | 492 |
|
Alternatives |
| 44 |
| 14 |
| 58 |
| 33 |
| 15 |
| 48 |
| ||||||
Total before PGAAP adj |
| 354 |
| 193 |
| 547 |
| 345 |
| 195 |
| 540 |
| ||||||
After-tax yield |
| 3.8 | % | 3.5 | % | 3.7 | % | 3.9 | % | 3.8 | % | 3.9 | % | ||||||
PGAAP adj |
| — |
| 57 |
| 57 |
| — |
| — |
| — |
| ||||||
Total after PGAAP adj |
| $ | 354 |
| $ | 136 |
| $ | 490 |
| $ | 345 |
| $ | 195 |
| $ | 540 |
|
After-tax yield |
| 3.8 | % | 2.5 | % | 3.3 | % | 3.9 | % | 3.8 | % | 3.9 | % | ||||||
* The reported results for St. Paul Travelers reflect only the results of Travelers
17
Evaluation of Second Quarter Results
Balance Sheet and Capital Strength
18
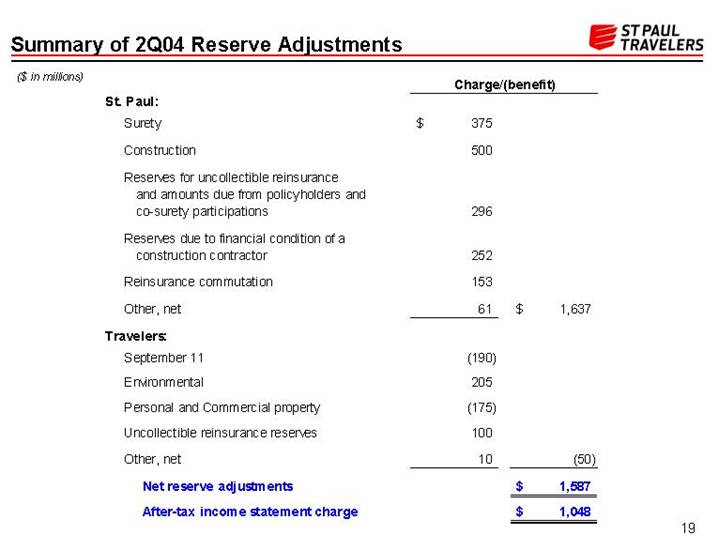
Summary of 2Q04 Reserve Adjustments
($ in millions)
|
| Charge/(benefit) |
| ||||
St. Paul: |
|
|
|
|
| ||
|
|
|
|
|
| ||
Surety |
| $ | 375 |
|
|
| |
|
|
|
|
|
| ||
Construction |
| 500 |
|
|
| ||
|
|
|
|
|
| ||
Reserves for uncollectible reinsurance and amounts due from policyholders and co-surety participations |
| 296 |
|
|
| ||
|
|
|
|
|
| ||
Reserves due to financial condition of a construction contractor |
| 252 |
|
|
| ||
|
|
|
|
|
| ||
Reinsurance commutation |
| 153 |
|
|
| ||
|
|
|
|
|
| ||
Other, net |
| 61 |
| $ | 1,637 |
| |
|
|
|
|
|
| ||
Travelers: |
|
|
|
|
| ||
|
|
|
|
|
| ||
September 11 |
| (190 | ) |
|
| ||
|
|
|
|
|
| ||
Environmental |
| 205 |
|
|
| ||
|
|
|
|
|
| ||
Personal and Commercial property |
| (175 | ) |
|
| ||
|
|
|
|
|
| ||
Uncollectible reinsurance reserves |
| 100 |
|
|
| ||
|
|
|
|
|
| ||
Other, net |
| 10 |
| (50 | ) | ||
|
|
|
|
|
| ||
Net reserve adjustments |
|
|
| $ | 1,587 |
| |
|
|
|
|
|
| ||
After-tax income statement charge |
|
|
| $ | 1,048 |
| |
19
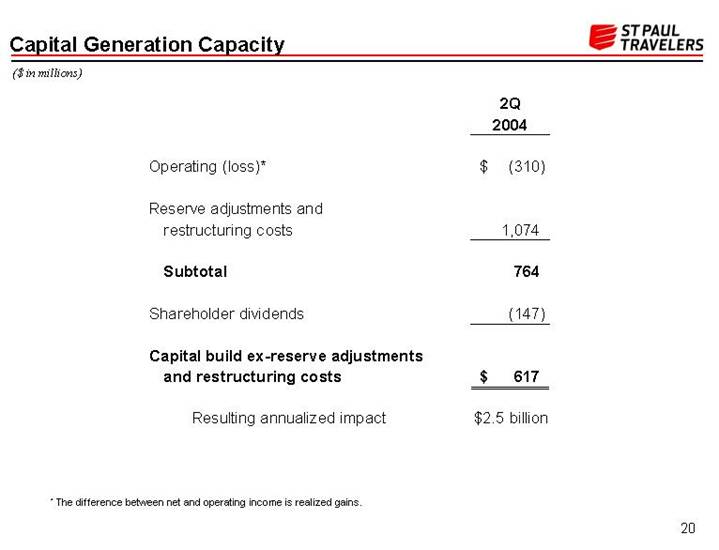
Capital Generation Capacity
($ in millions)
|
| 2Q |
| |
|
|
|
| |
Operating (loss)* |
| $ | (310 | ) |
|
|
|
| |
Reserve adjustments and restructuring costs |
| 1,074 |
| |
|
|
|
| |
Subtotal |
| 764 |
| |
|
|
|
| |
Shareholder dividends |
| (147 | ) | |
|
|
|
| |
Capital build ex-reserve adjustments and restructuring costs |
| $ | 617 |
|
|
|
|
| |
Resulting annualized impact |
| $ | 2.5 billion |
|
* The difference between net and operating income is realized gains.
20
Capital Strength
($ in millions)
|
| Jun 30, |
| |
Total debt |
| $ | 6,358 |
|
|
|
|
| |
Minority interest |
| 111 |
| |
|
|
|
| |
Shareholders’ equity (ex SFAS 115) |
| 19,789 |
| |
|
|
|
| |
Total capital |
| $ | 26,258 |
|
|
|
|
| |
Total debt to capital ratio |
| 24.2 | % | |
|
|
|
| |
Leverage Ratios |
|
|
| |
|
|
|
| |
NWP: Surplus |
| 1.51 |
| |
|
|
|
| |
Reserves: Surplus |
| 2.87 |
| |
|
|
|
| |
Second Half 2004 |
|
|
| |
|
|
|
| |
Available Liquidity |
| $ | 1 billion | + |
21
Evaluation of Second Quarter Results
Outlook for Second Half of 2004
22
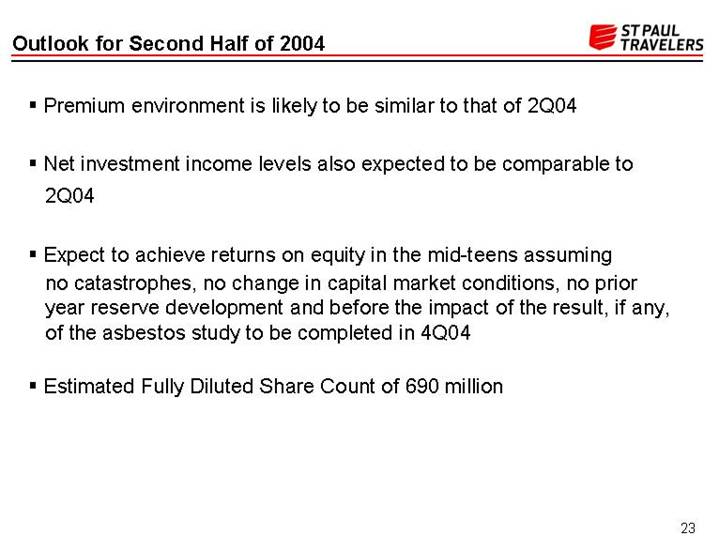
Outlook for Second Half of 2004
• Premium environment is likely to be similar to that of 2Q04
• Net investment income levels also expected to be comparable to 2Q04
• Expect to achieve returns on equity in the mid-teens assuming no catastrophes, no change in capital market conditions, no prior year reserve development and before the impact of the result, if any, of the asbestos study to be completed in 4Q04
• Estimated Fully Diluted Share Count of 690 million
23
Opportunistic About
Cost Saving Opportunities
Beyond Initial Expectations
24
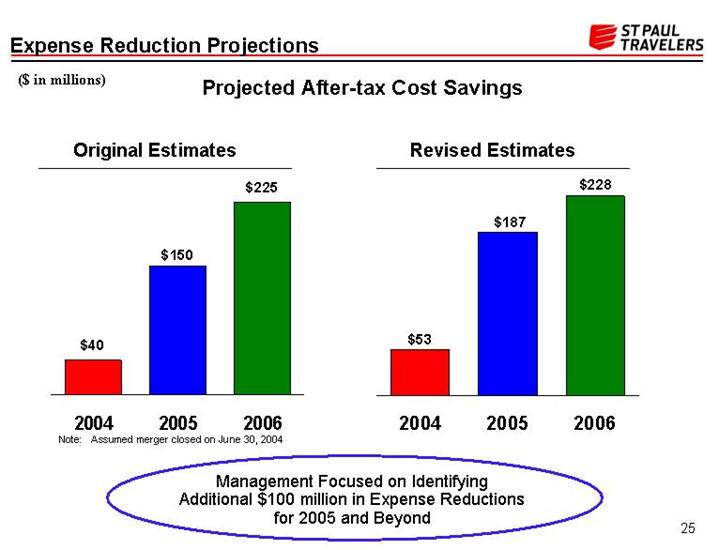
Expense Reduction Projections
($ in millions)
Projected After-tax Cost Savings
Original Estimates |
| Revised Estimates |
|
|
|
[CHART] |
| [CHART] |
Note: Assumed merger closed on June 30, 2004
Management Focused on Identifying
Additional $100 million in Expense Reductions
for 2005 and Beyond
25
Revenue Synergies Over the Long Term
26
Long-term Distribution Strategy
Leveraging the Partnership
• 6,400 agents have premium volume greater than $200,000 with St. Paul Travelers
• Of these agents, 60% generate premium volume with only one of our major business units
• Meaningful opportunity to grow premiums over the long-term by increasing market penetration with agents by just one additional business unit
27
Long-term Distribution Strategy
Personal Lines
• Travelers today - Approximately 7,000 Commercial Lines agents
• 42% do business with Travelers Personal Lines
• Agents with combined Personal & Commercial Lines relationships provide more opportunity than Personal Lines relationships only
• Twice the average Personal Lines net written premiums
• 4 point loss ratio advantage
• St Paul today – Approximately 5,400 Commercial Lines agents
• Only 24% do business with Travelers Personal Lines
Increase of St. Paul Commercial Agency
Penetration to that of Travelers Could Generate $500+
Million of New Personal Lines Business Over Time
28
A Strong Foundation
• Progress on integrating operations
• Evaluation of second quarter results
• Focus on business retention and agency relationships
• Analysis of current market conditions
• Analysis of investment portfolio
• Balance sheet and capital strength
• Outlook for second half of 2004
• Optimistic about cost saving opportunities beyond initial expectations
• Revenue synergies over the long-term
29
[LOGO]